Análisis del portátil Predator Helios Neo 16: Acer ha creado una quimera para juegos

En principio, el Predator Helios Neo 16 de Acer, un portátil para juegos de gama media, es una versión adelgazada delPredator Helios 16(no Neo). Se han mantenido algunas de las características del modelo Helio clásico, lo que significa que puede diferenciarse de la serie básica Nitro de Acer.
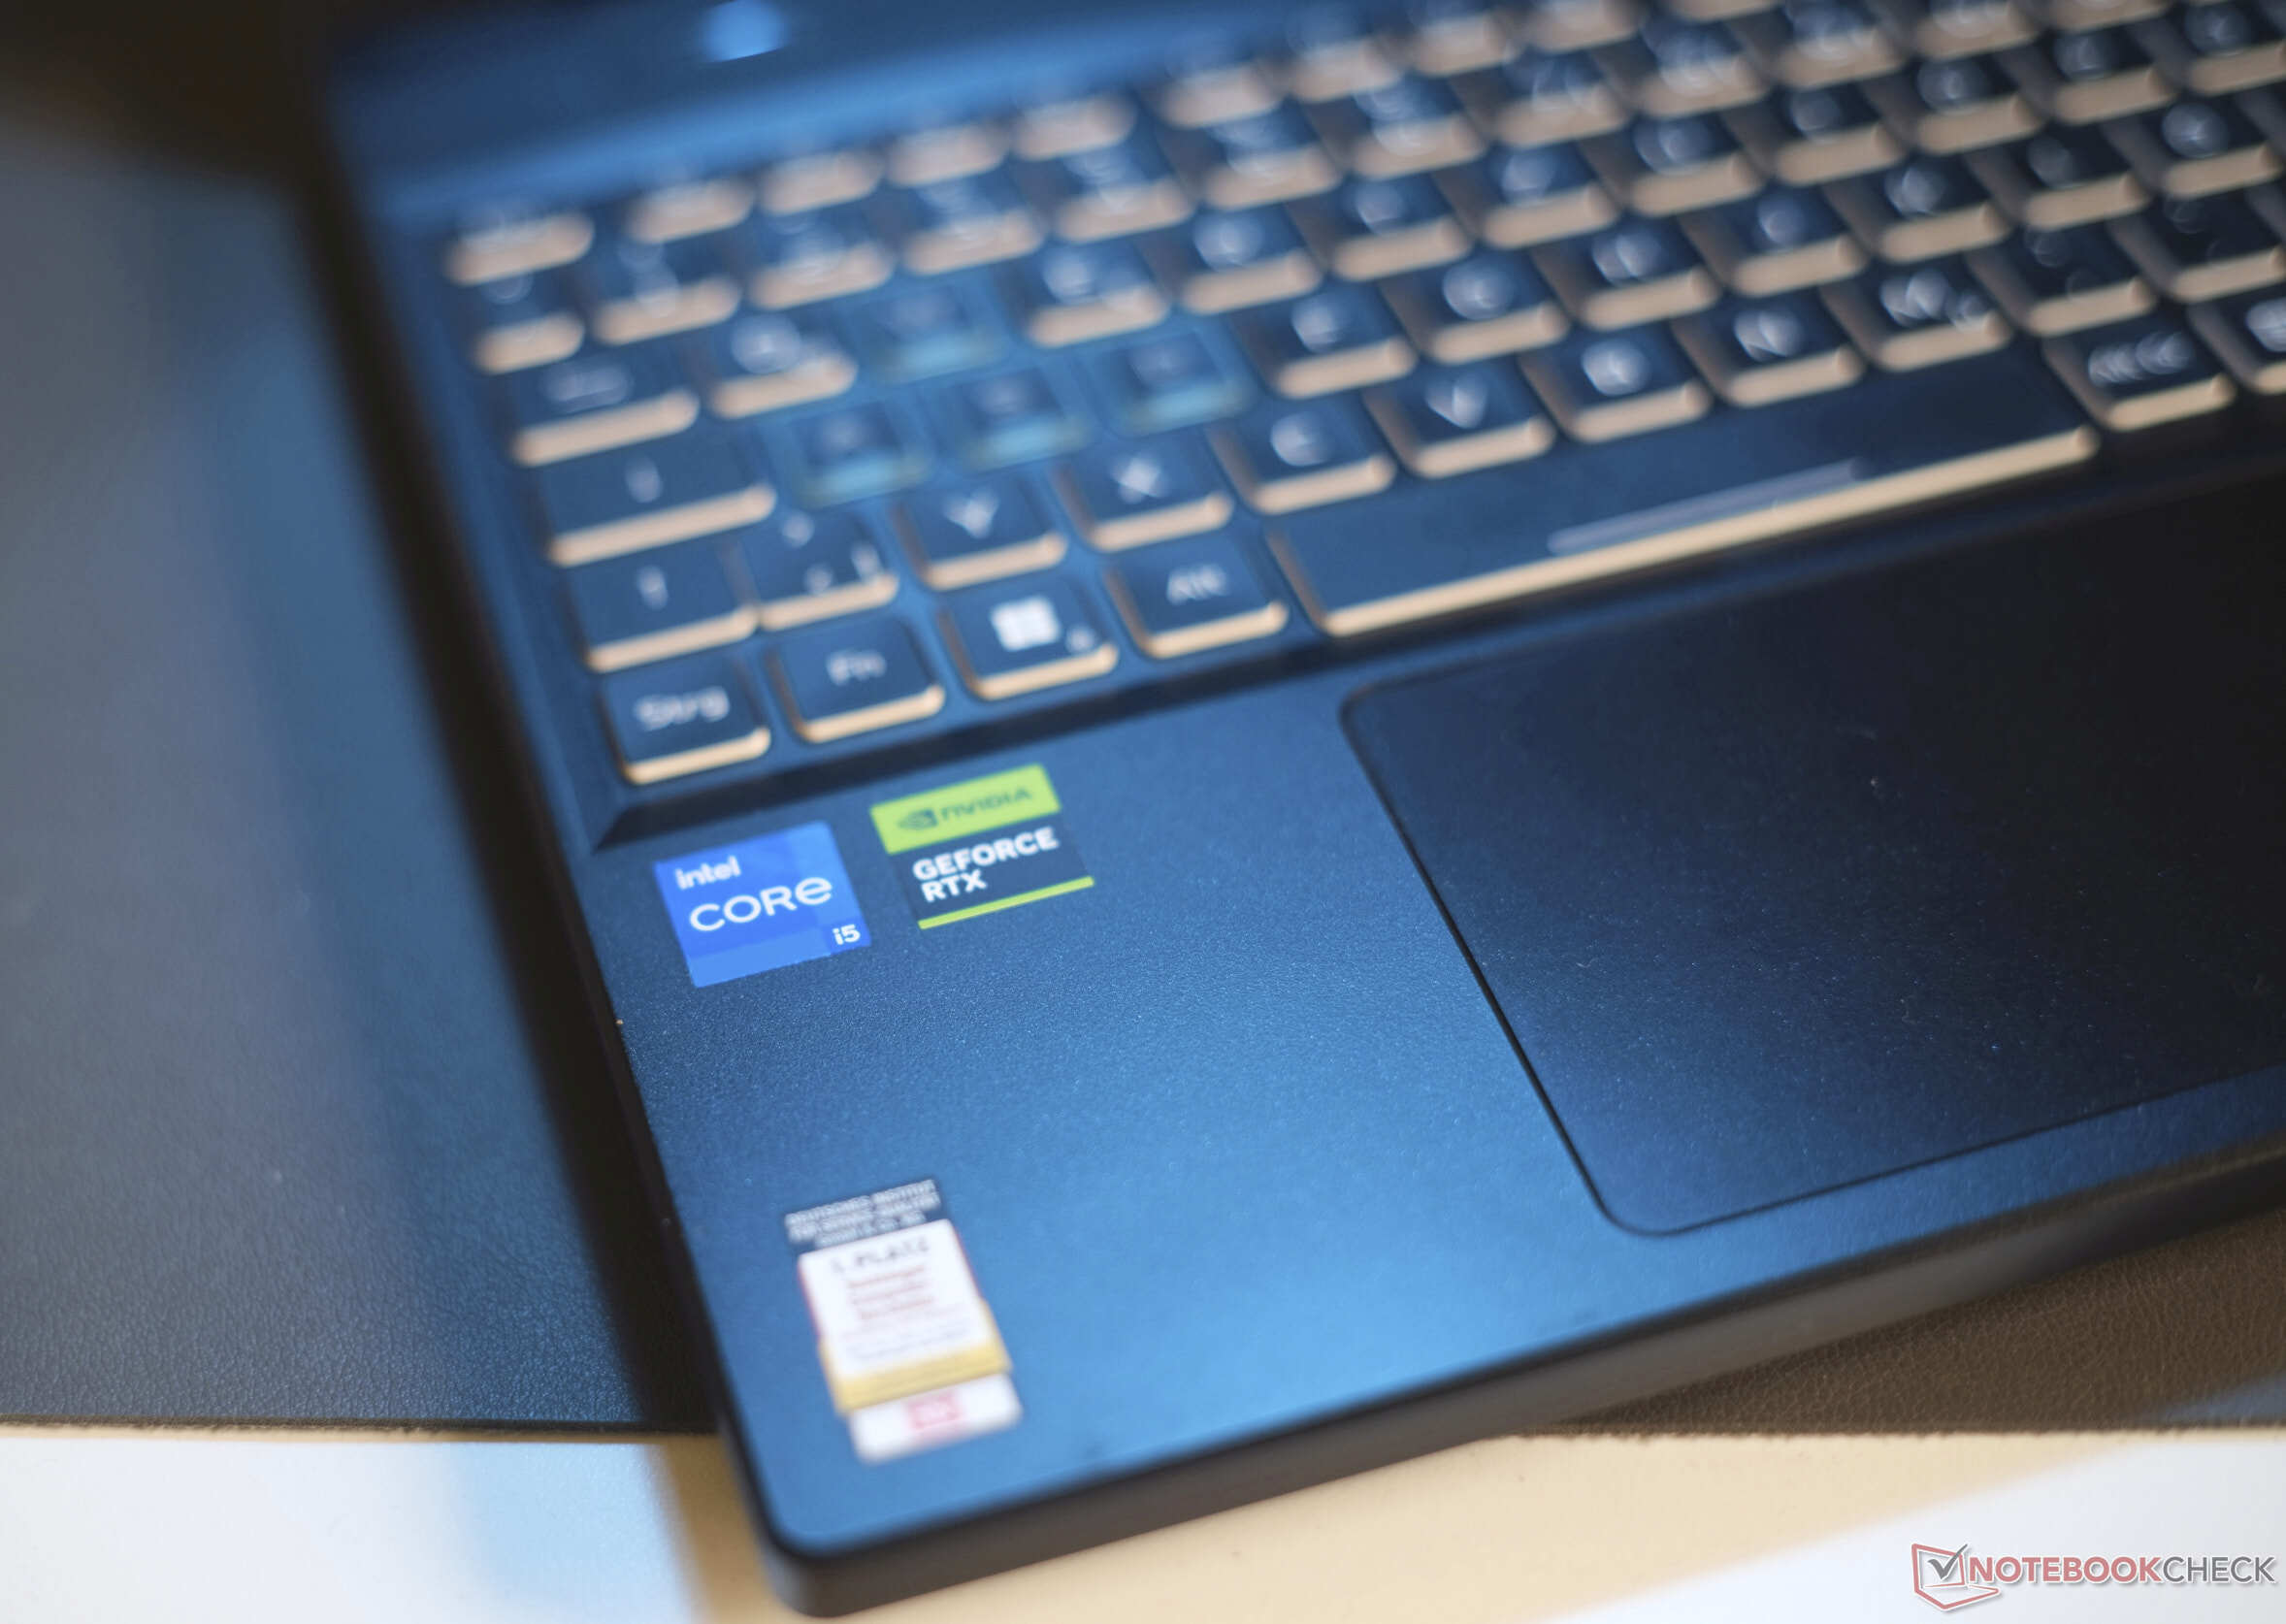
Aun así, algunos de sus aspectos se pueden clasificar como características de nivel de entrada, como su RTX 4050 instalada - a un precio de 1.069 dólares, esto es un poco cuestionable. Sin embargo, el Intel Core i5-13500HX del portátil es una potente CPU de clase sobremesa que consume 55 vatios. Esta y algunas de sus otras características no se encontrarían normalmente en auténticos portátiles económicos. Además, existen variantes con una RTX 4060 o una RTX 4070.
A lo largo de este análisis, analizaremos si todo esto es suficiente para hacer que el portátil merezca la pena por su precio. Su principal competidor es el Legion Pro 5 de Lenovo, pero otros competidores son el HP Victus 16, el XMG Apex 15 y el Dell G15.
Possible competitors compared
Valoración | Fecha | Modelo | Peso | Altura | Tamaño | Resolución | Precio |
|---|---|---|---|---|---|---|---|
| 86.6 % v7 (old) | 11/2023 | Acer Predator Helios Neo 16 NH.QLTEG.002 i5-13500HX, GeForce RTX 4050 Laptop GPU | 2.6 kg | 28.25 mm | 16.00" | 1920x1200 | |
| 89 % v7 (old) | 08/2023 | Lenovo Legion Pro 5 16ARX8 (R5 7645HX, RTX 4050) R5 7645HX, GeForce RTX 4050 Laptop GPU | 2.5 kg | 27.3 mm | 16.00" | 2560x1600 | |
| 87.3 % v7 (old) | 09/2023 | Lenovo LOQ 16IRH8 i7-13620H, GeForce RTX 4060 Laptop GPU | 2.7 kg | 25.9 mm | 16.00" | 2560x1600 | |
| 86.2 % v7 (old) | 10/2023 | Schenker XMG Apex 15 (Late 23) R7 7840HS, GeForce RTX 4050 Laptop GPU | 2.2 kg | 26.7 mm | 15.60" | 2560x1440 | |
| 85.6 % v7 (old) | 09/2023 | HP Victus 16-r0076TX i5-13500HX, GeForce RTX 4050 Laptop GPU | 2.3 kg | 22.9 mm | 16.10" | 1920x1080 | |
| 84.2 % v7 (old) | 06/2023 | Dell G15 5530 i7-13650HX, GeForce RTX 4060 Laptop GPU | 3 kg | 26.95 mm | 15.60" | 1920x1080 |
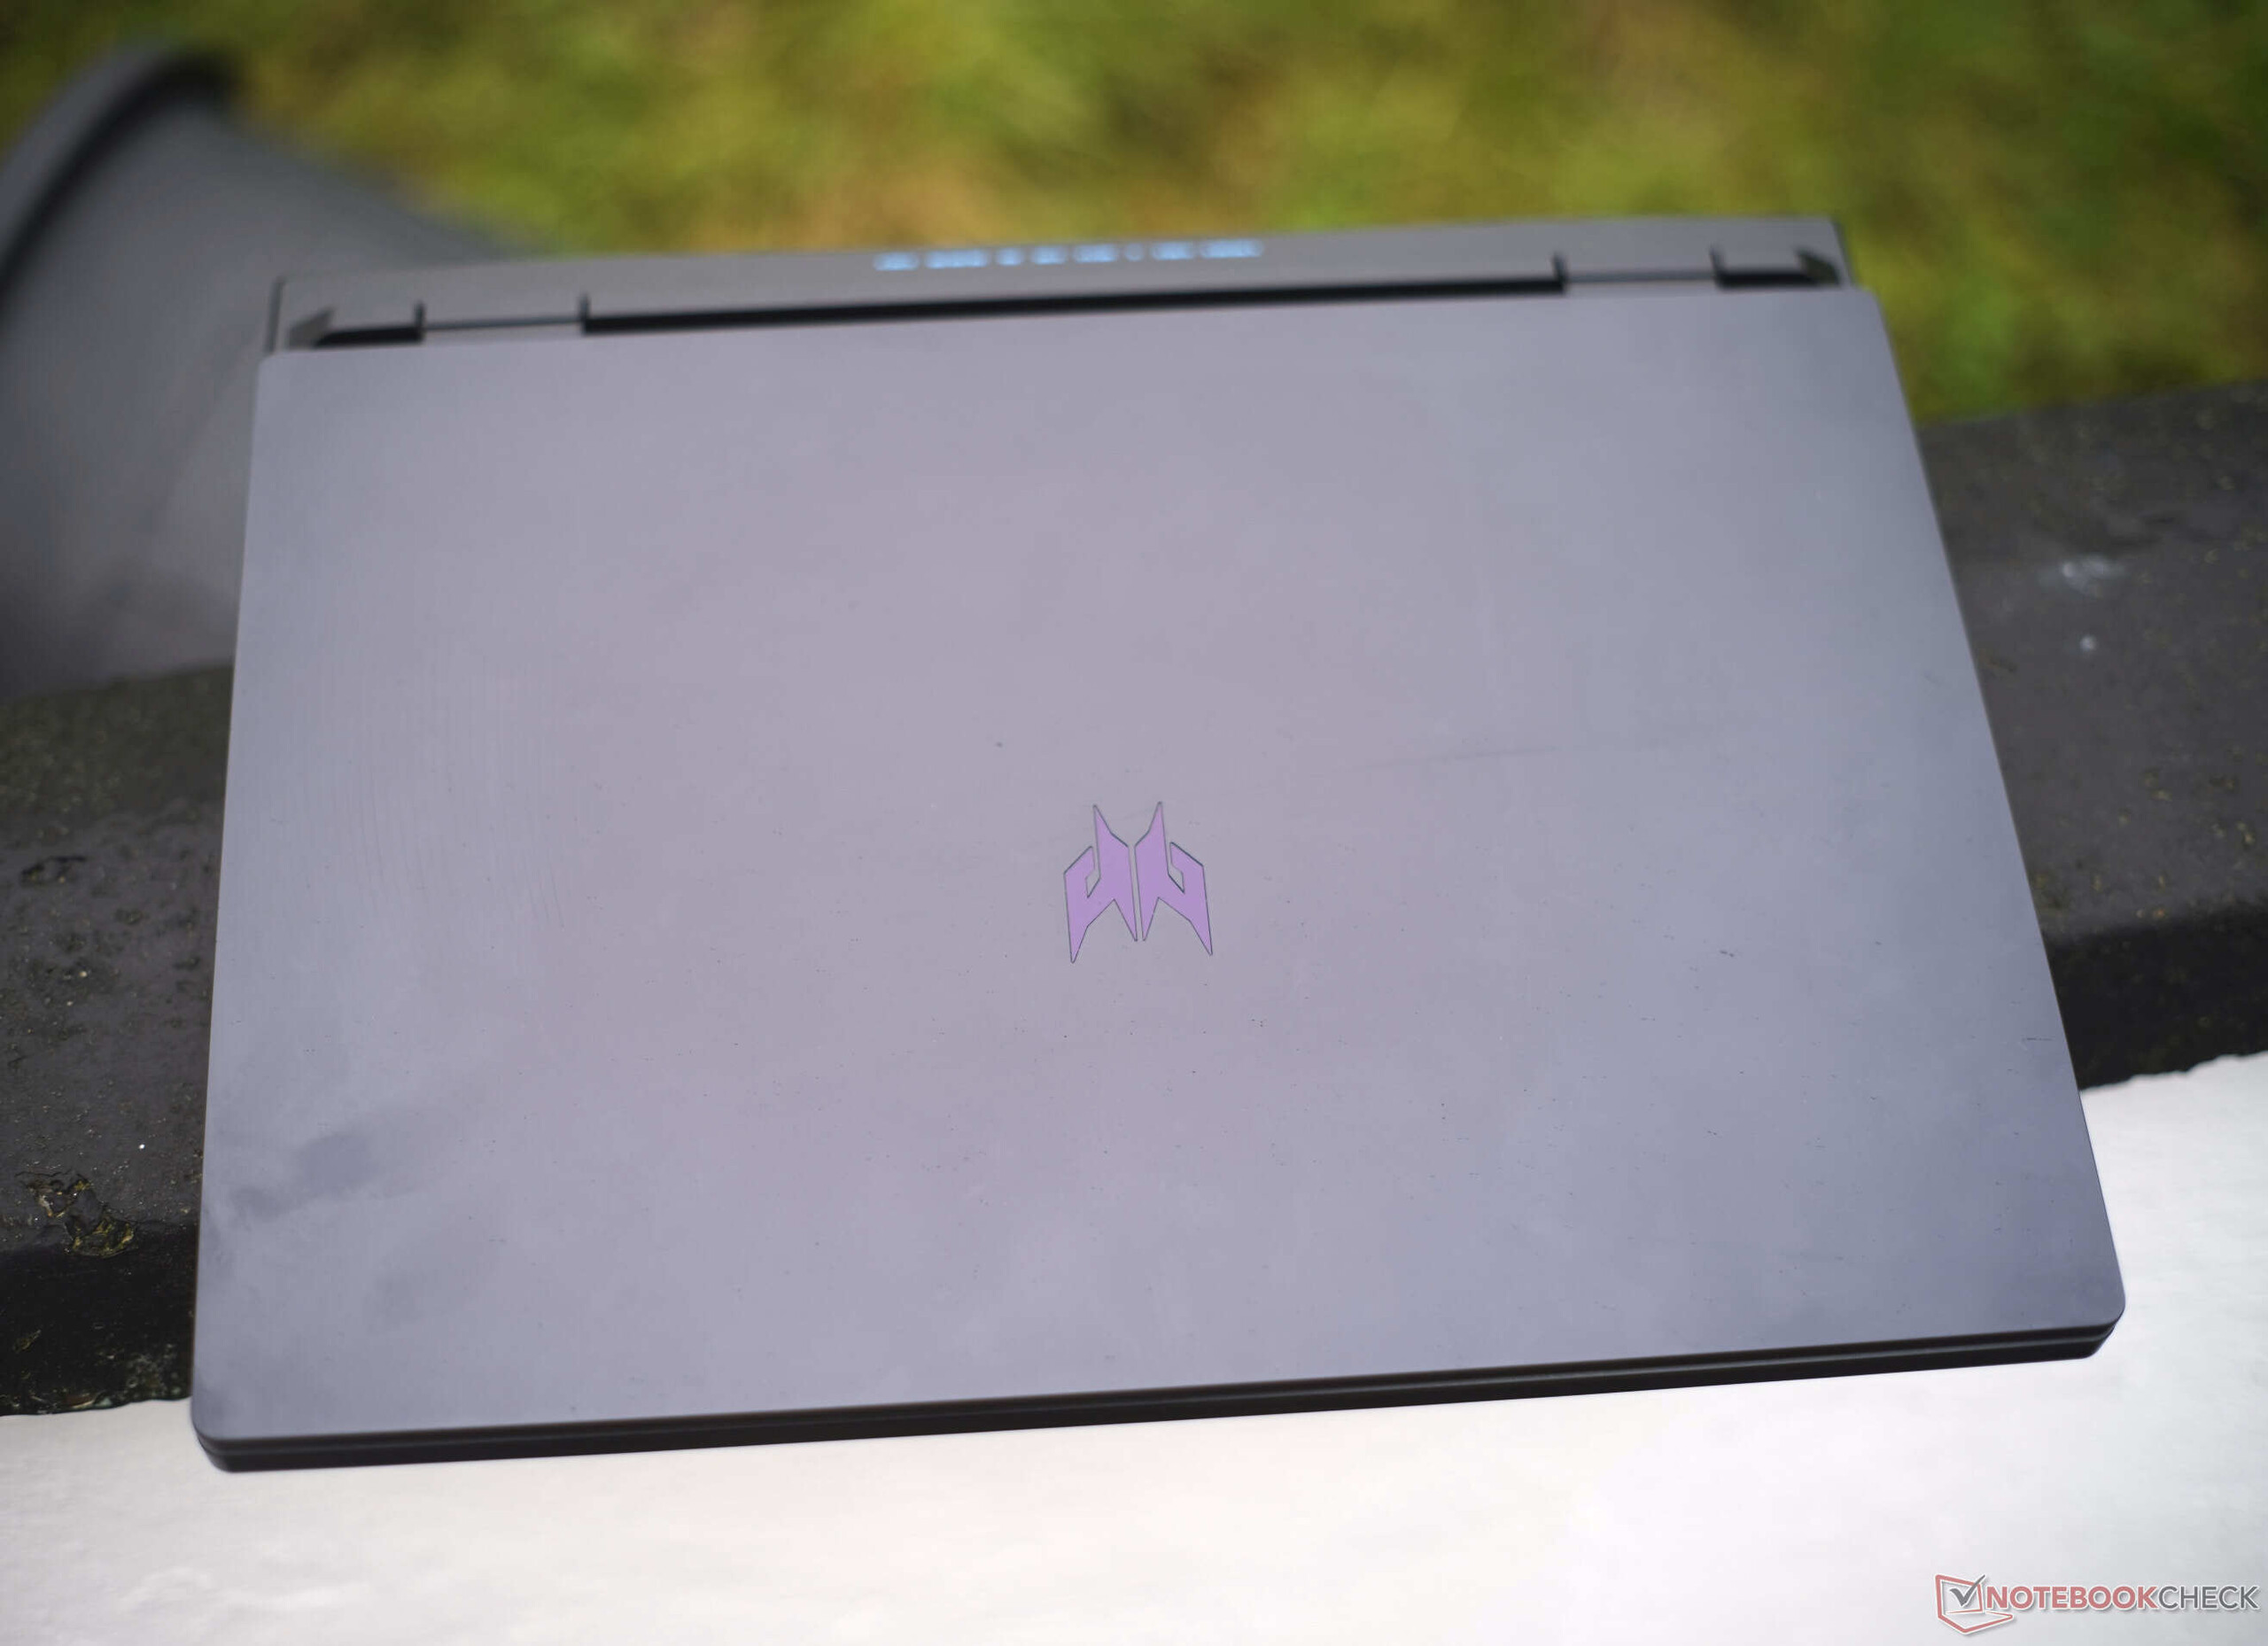
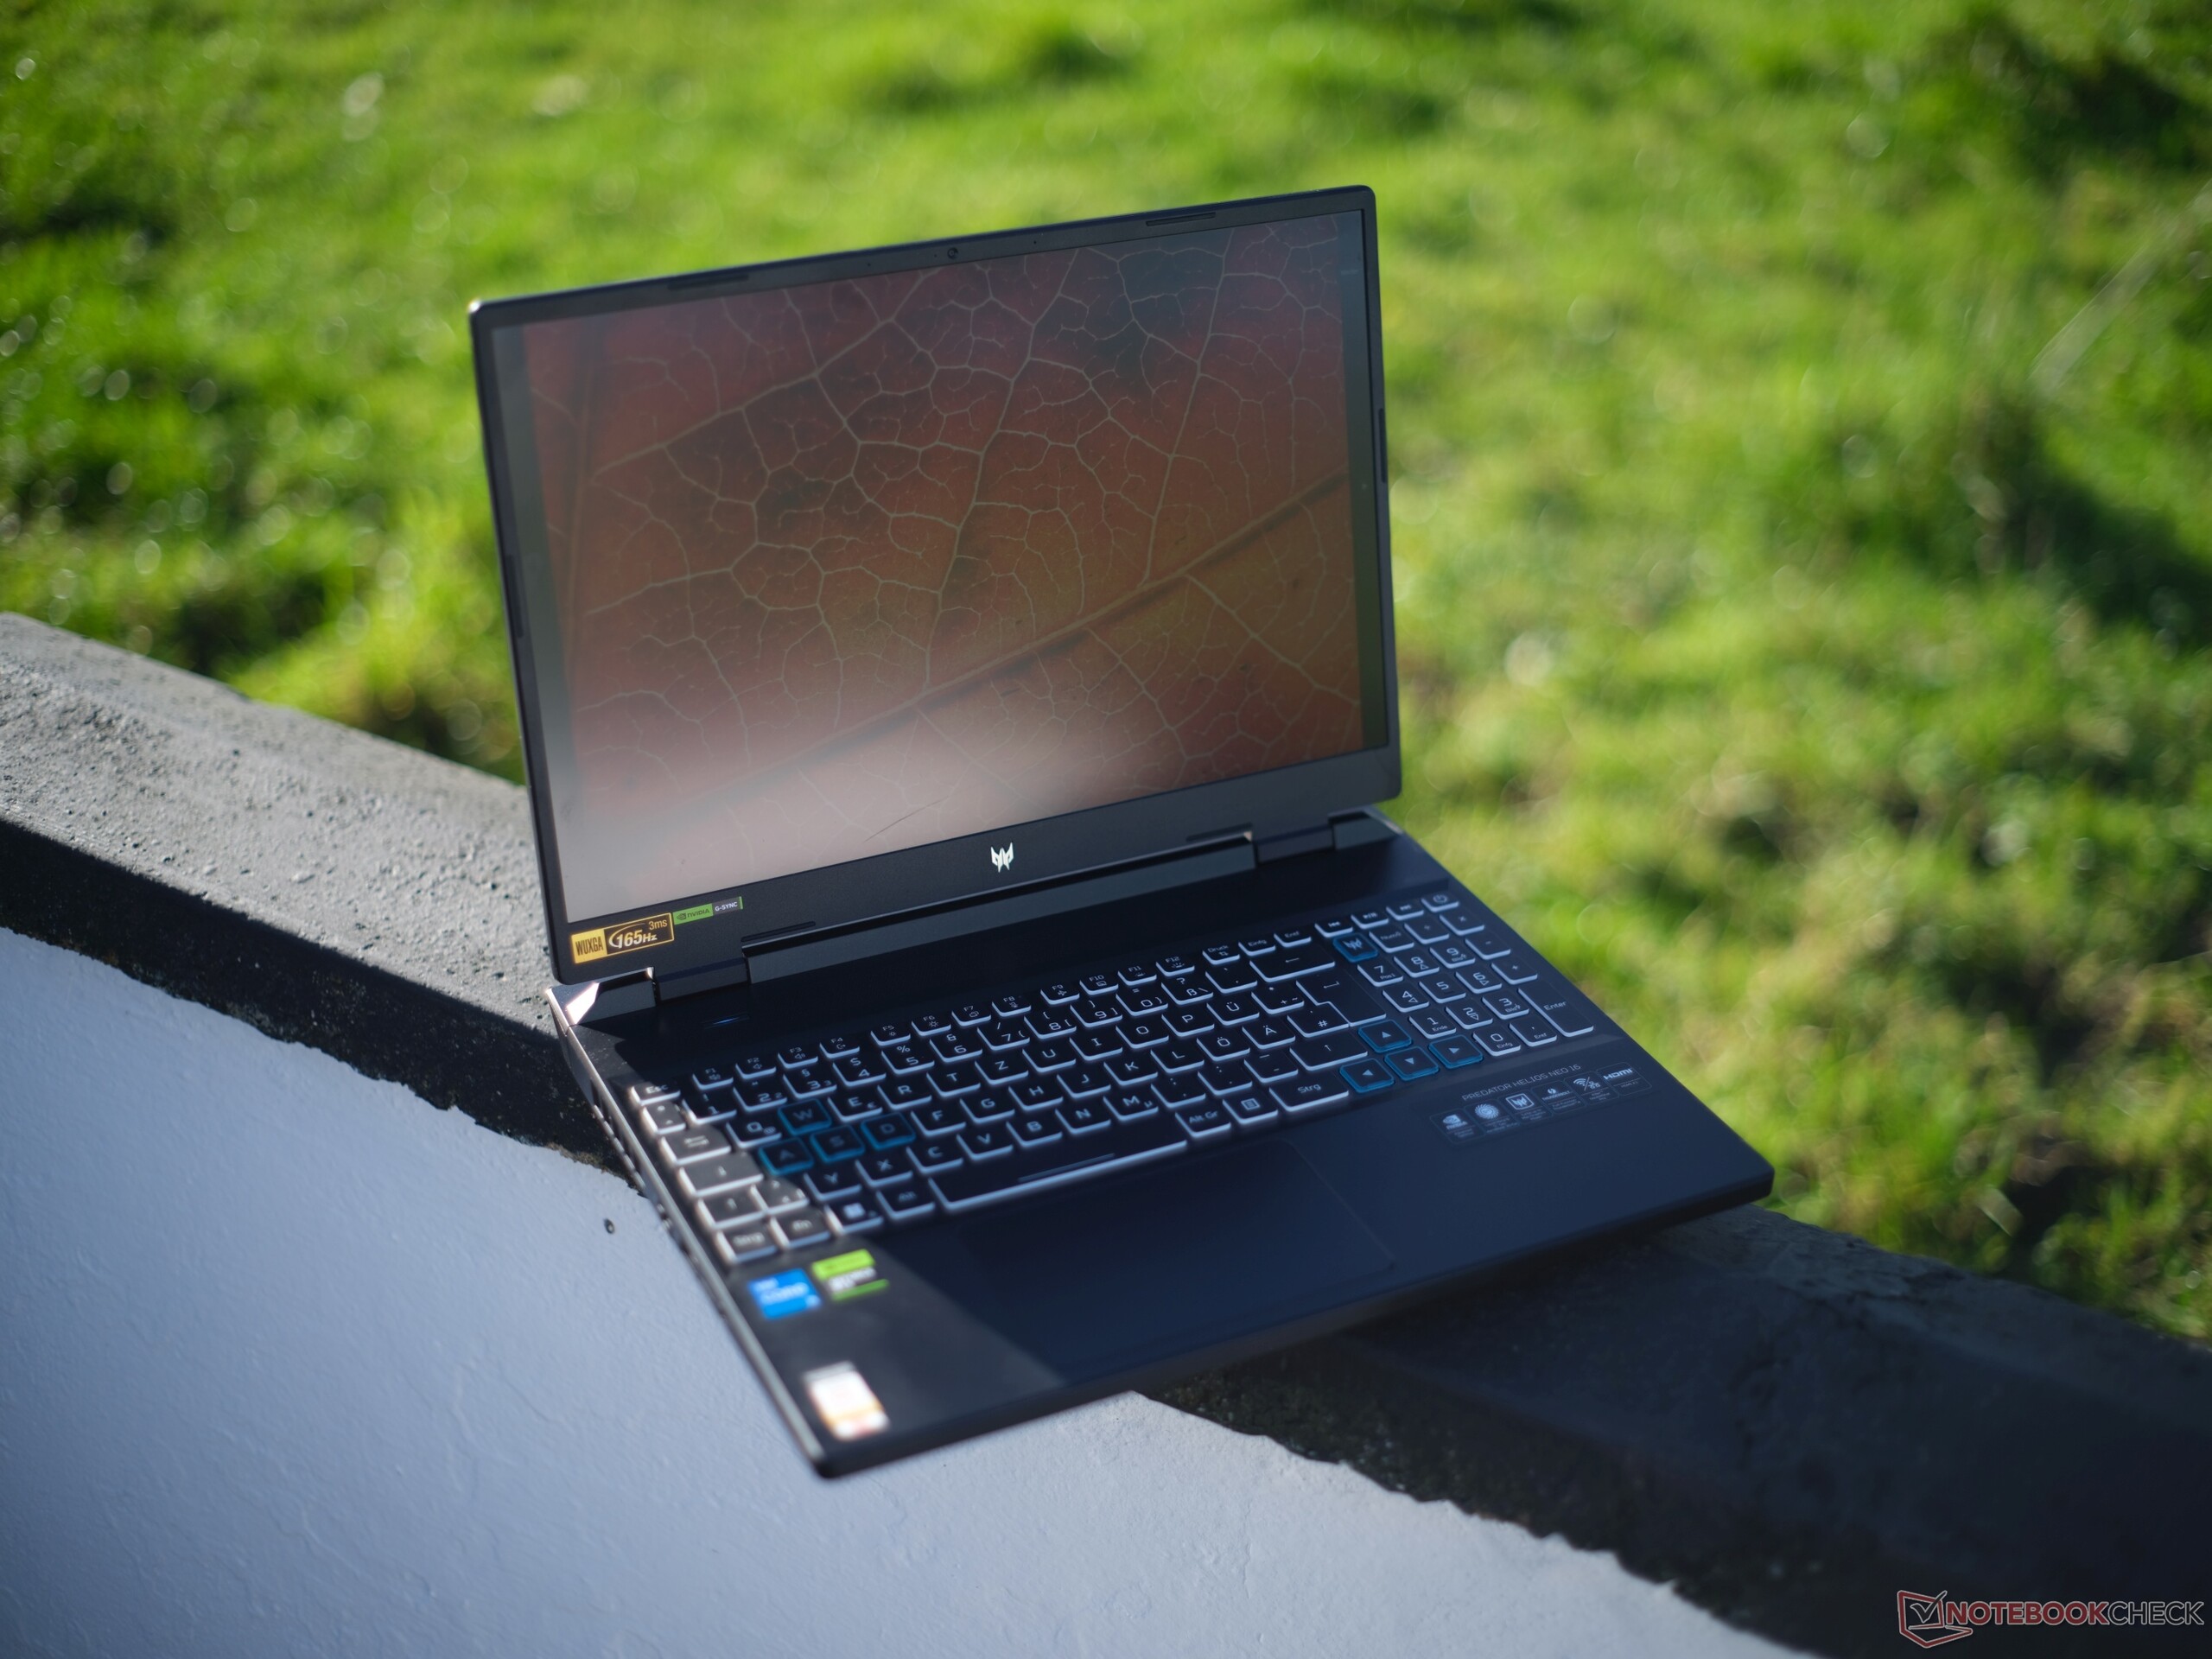
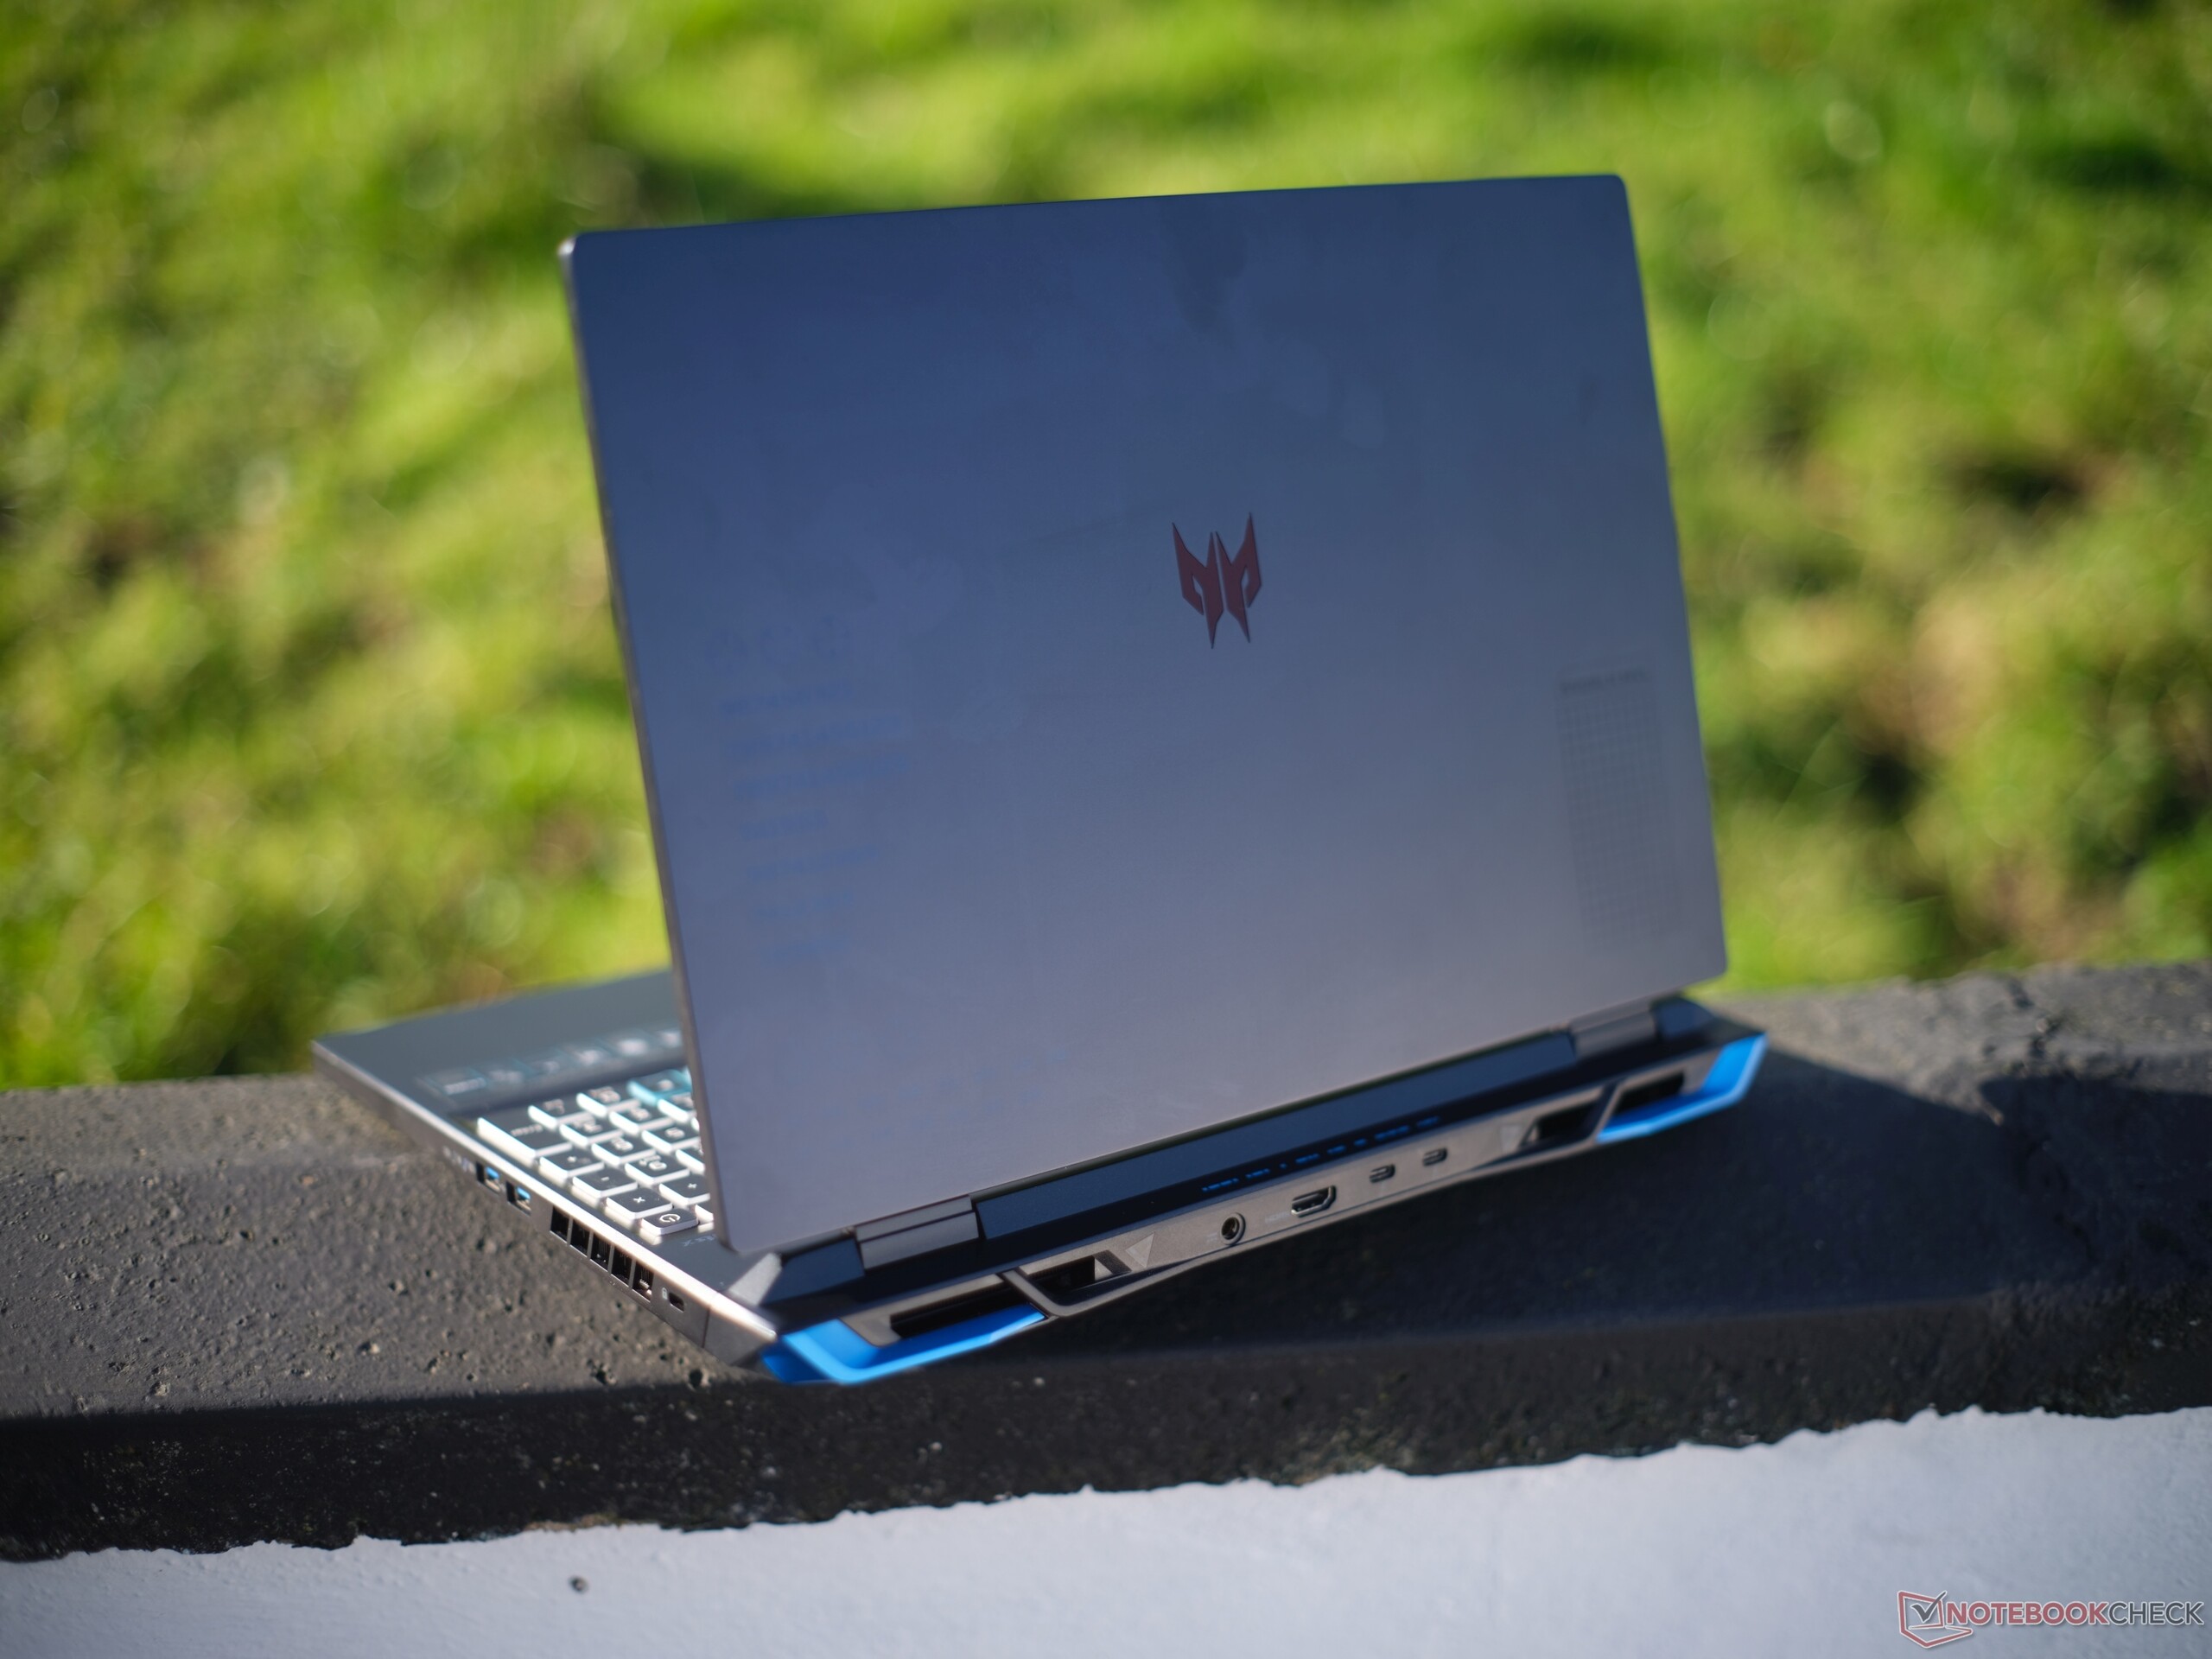
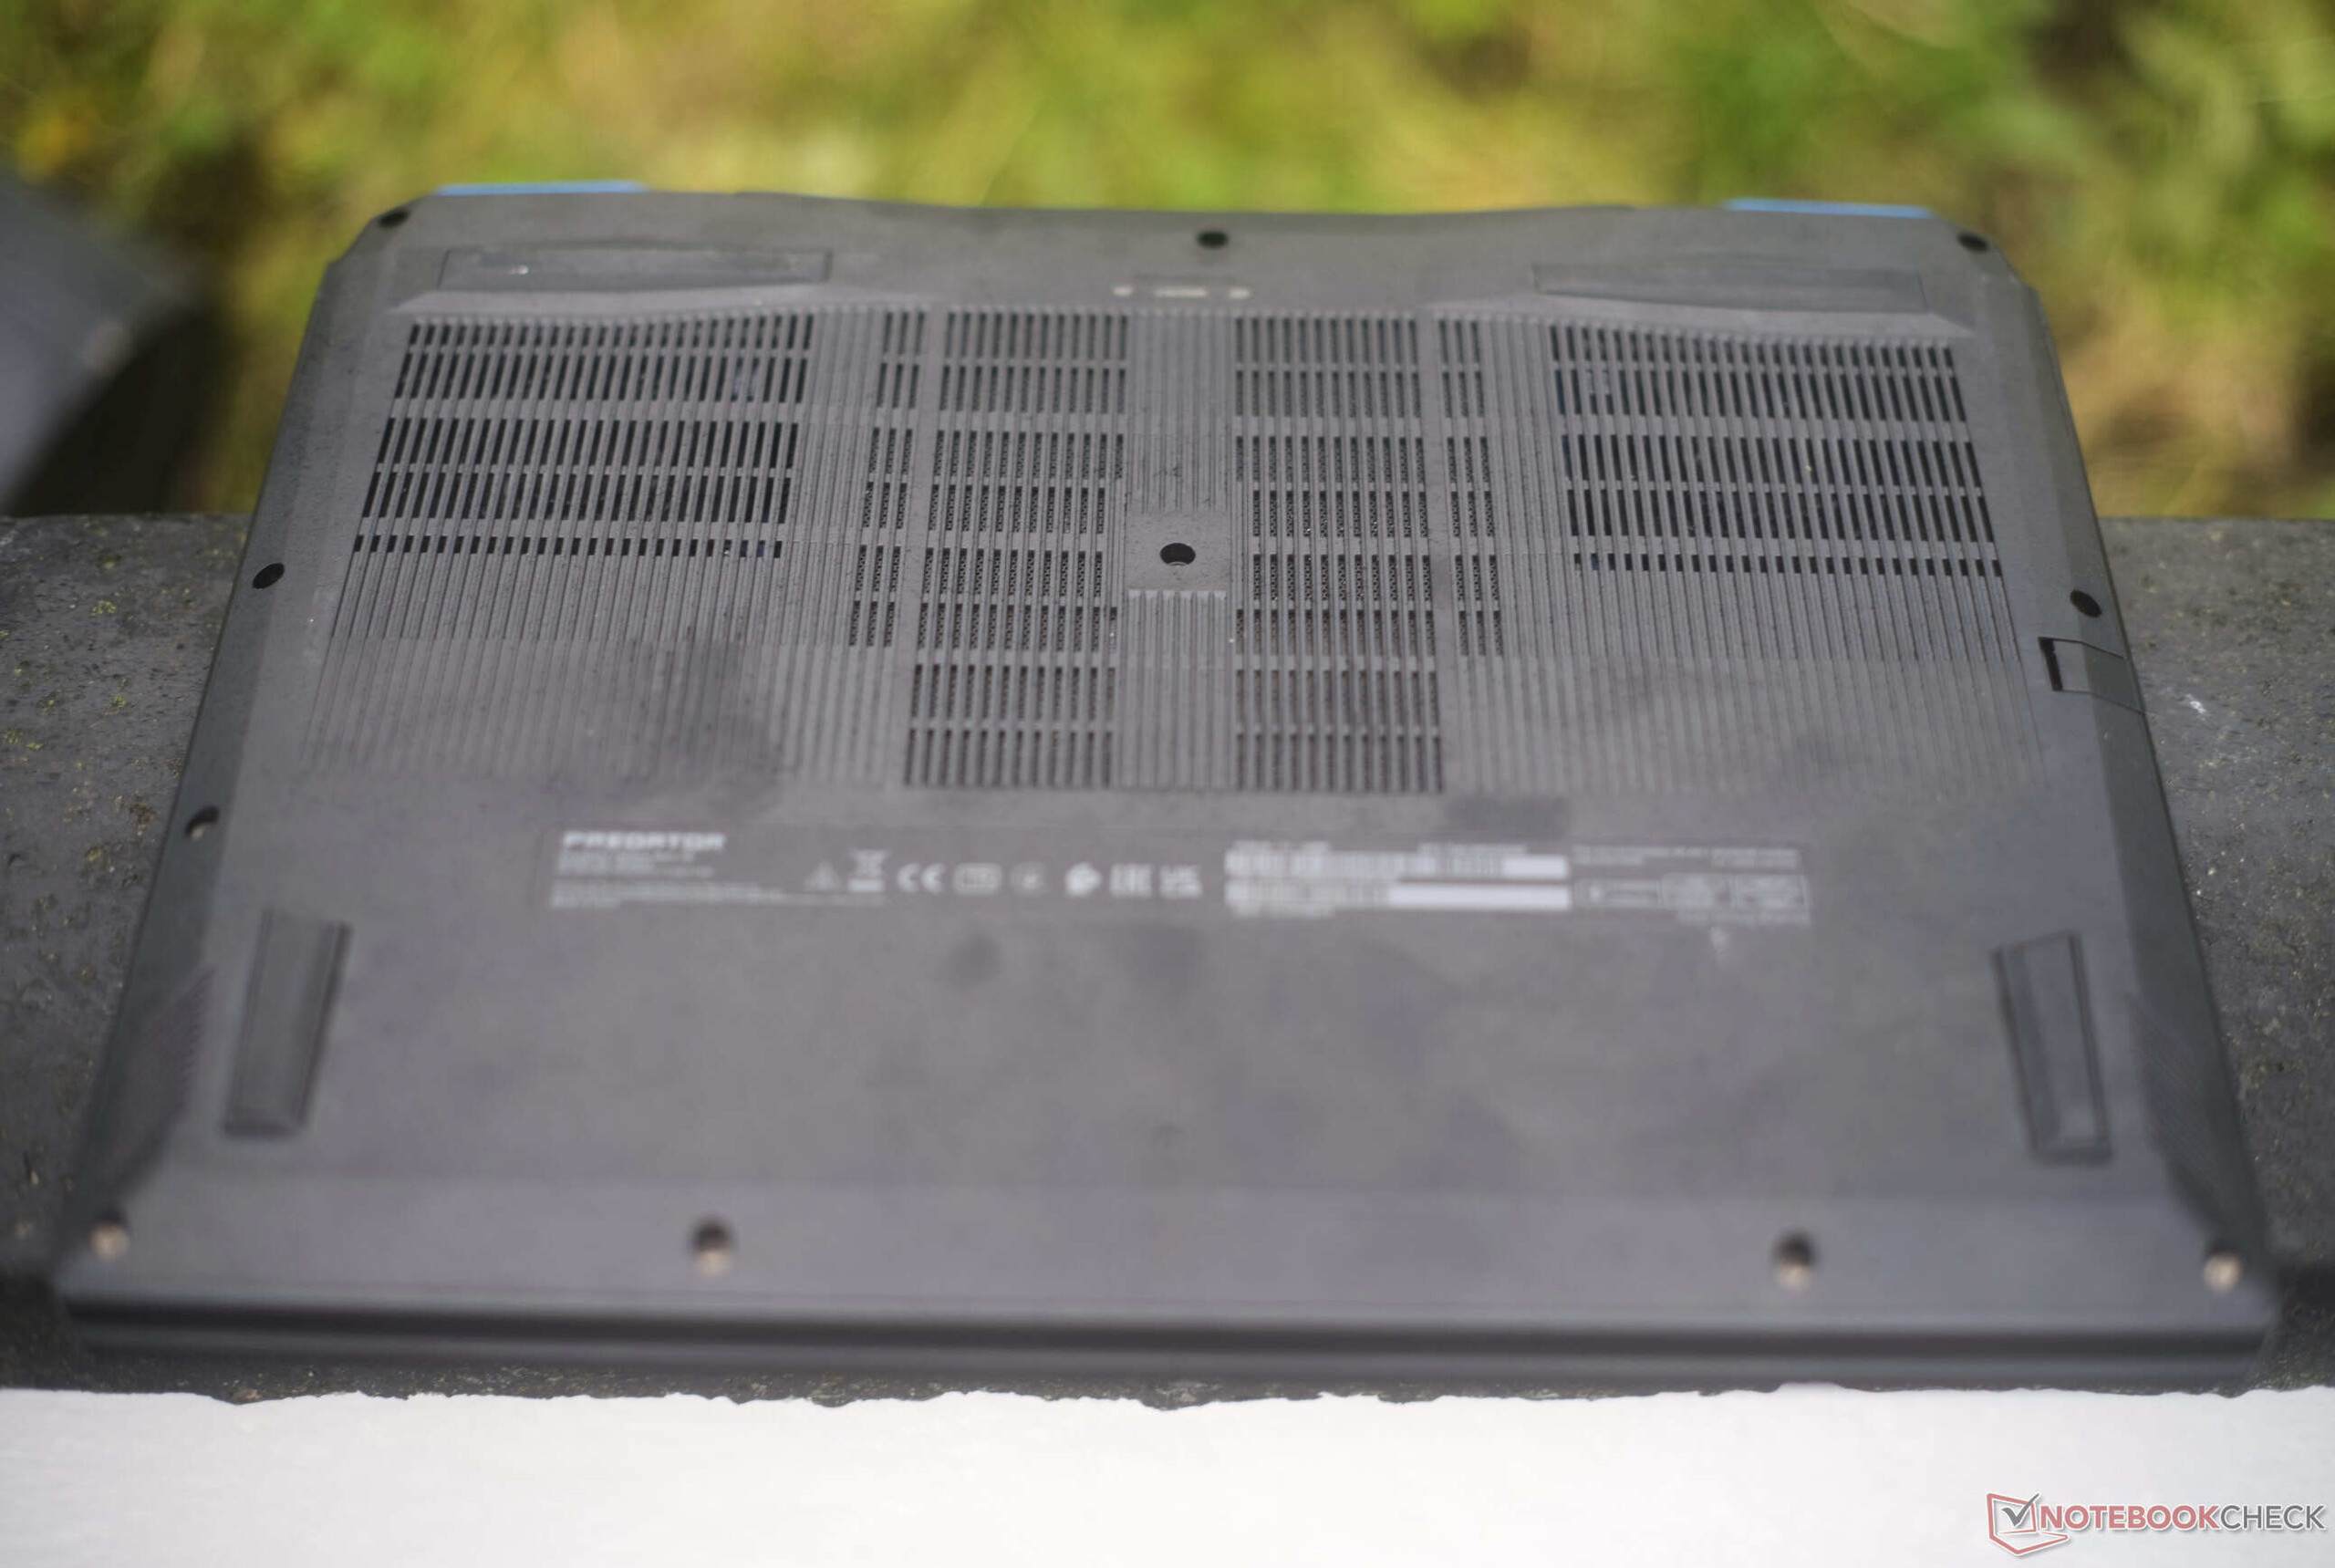
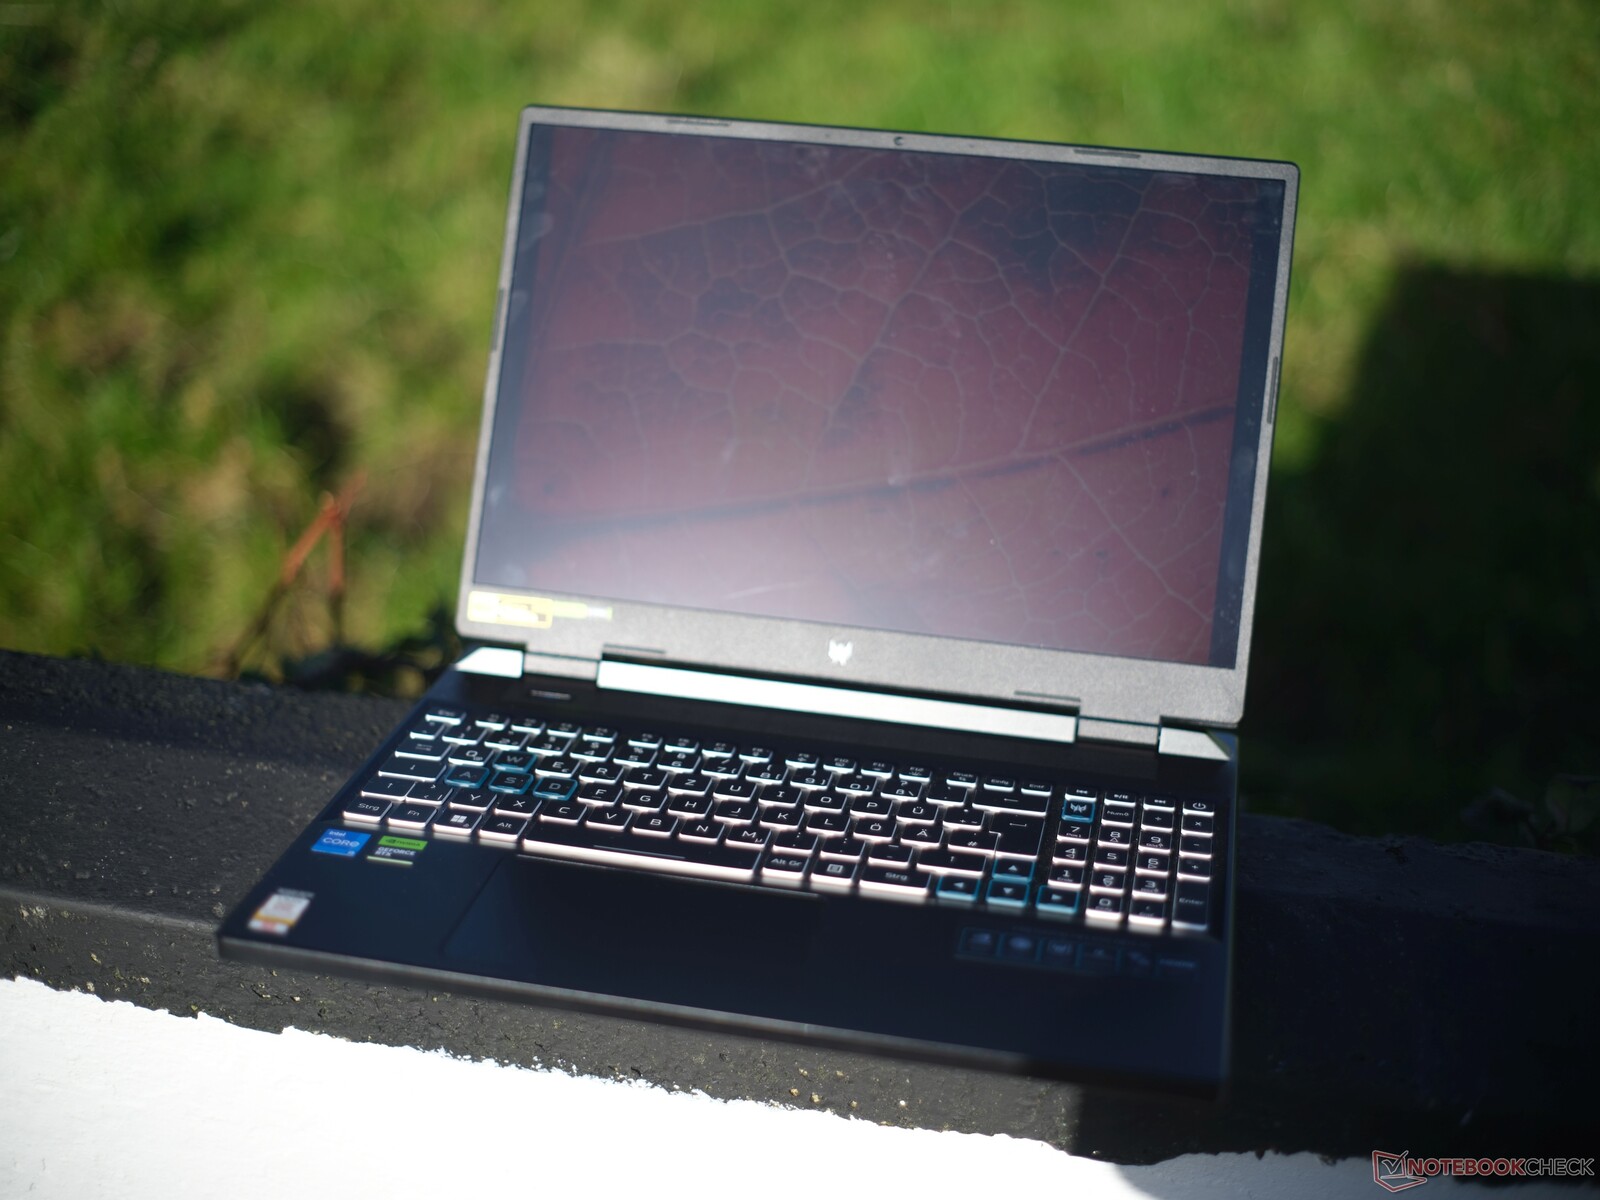
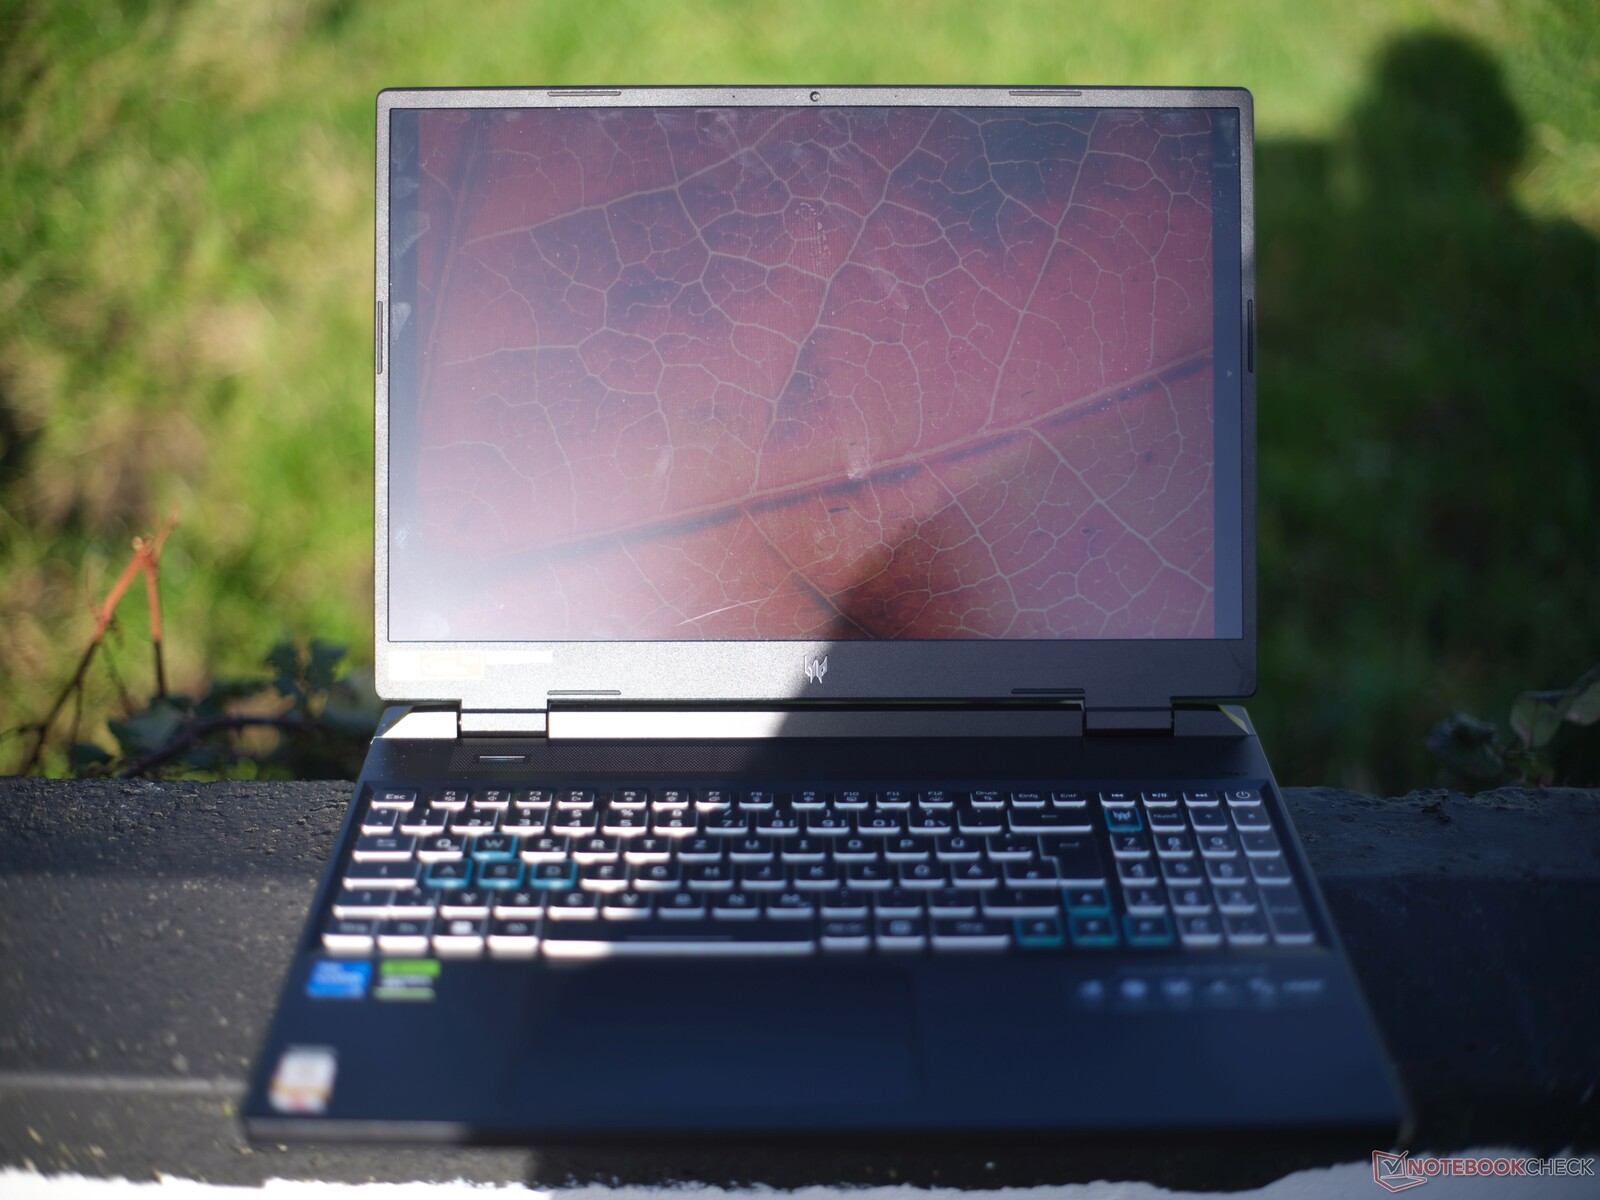
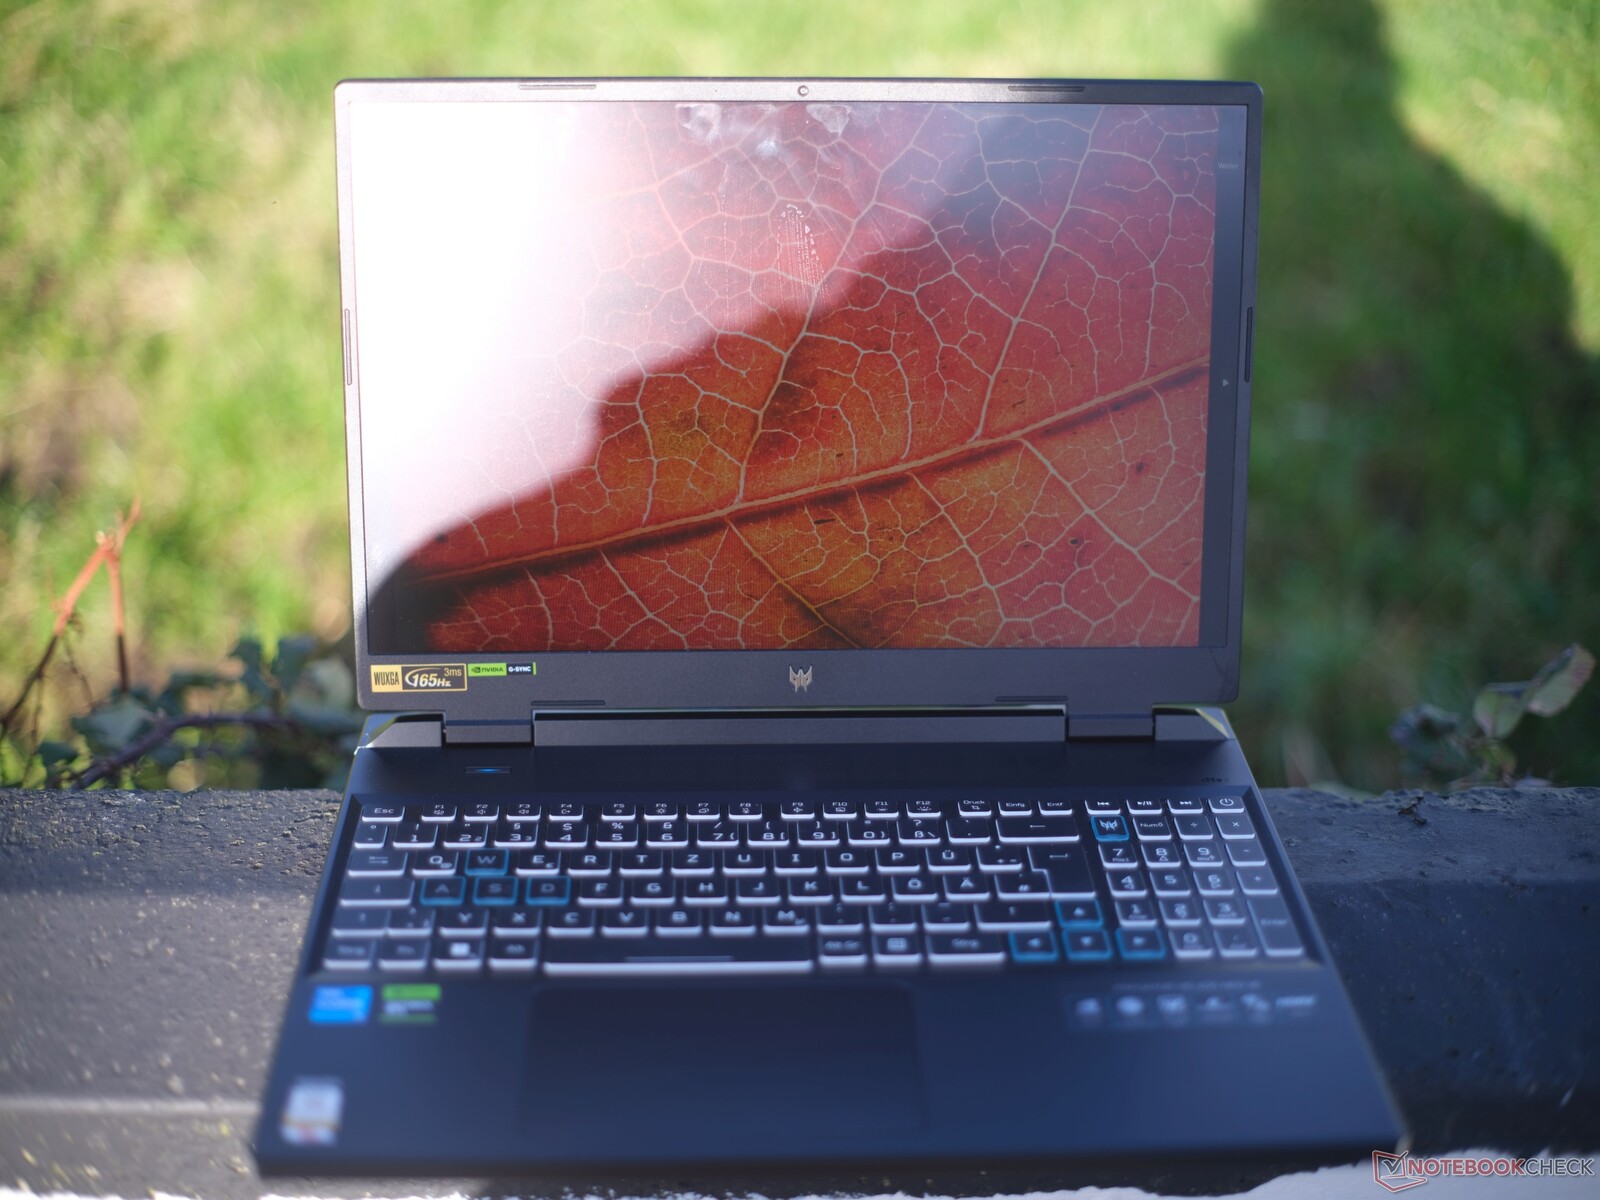
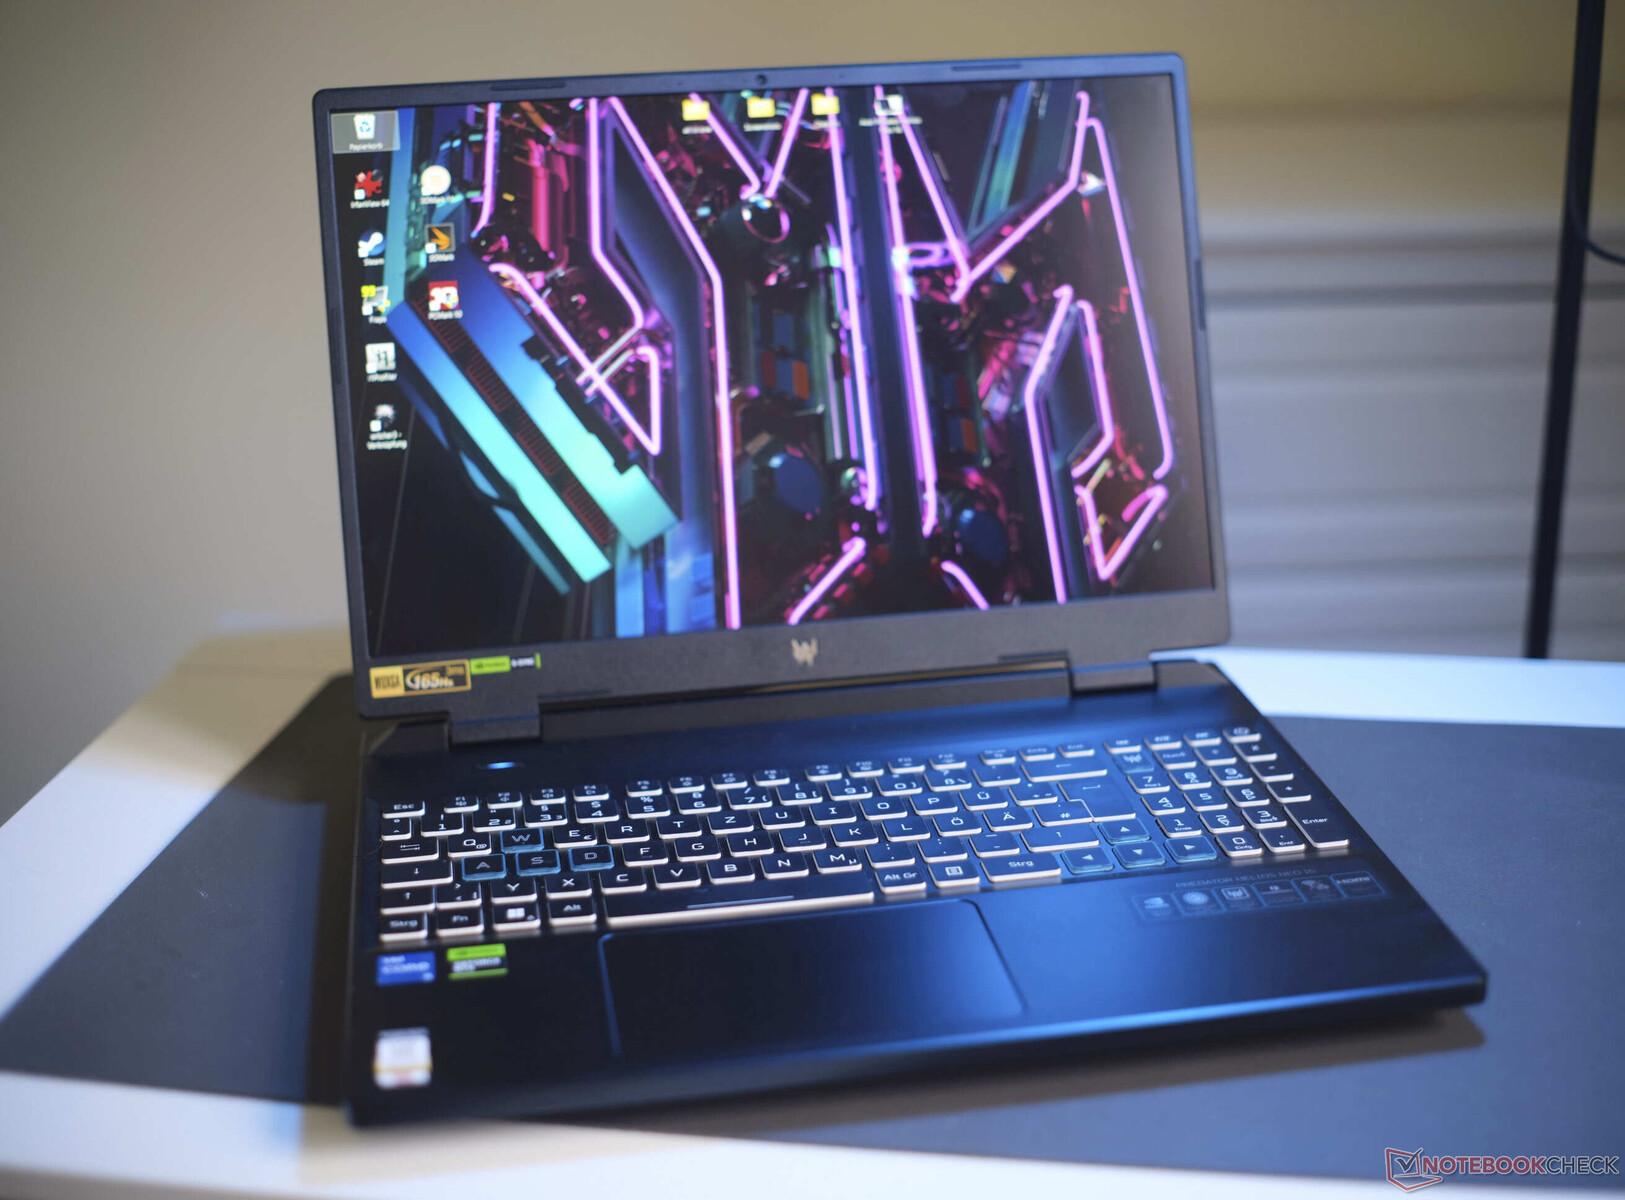
Estuche: El Helios Neo 16 destaca por su robustez y apariencia
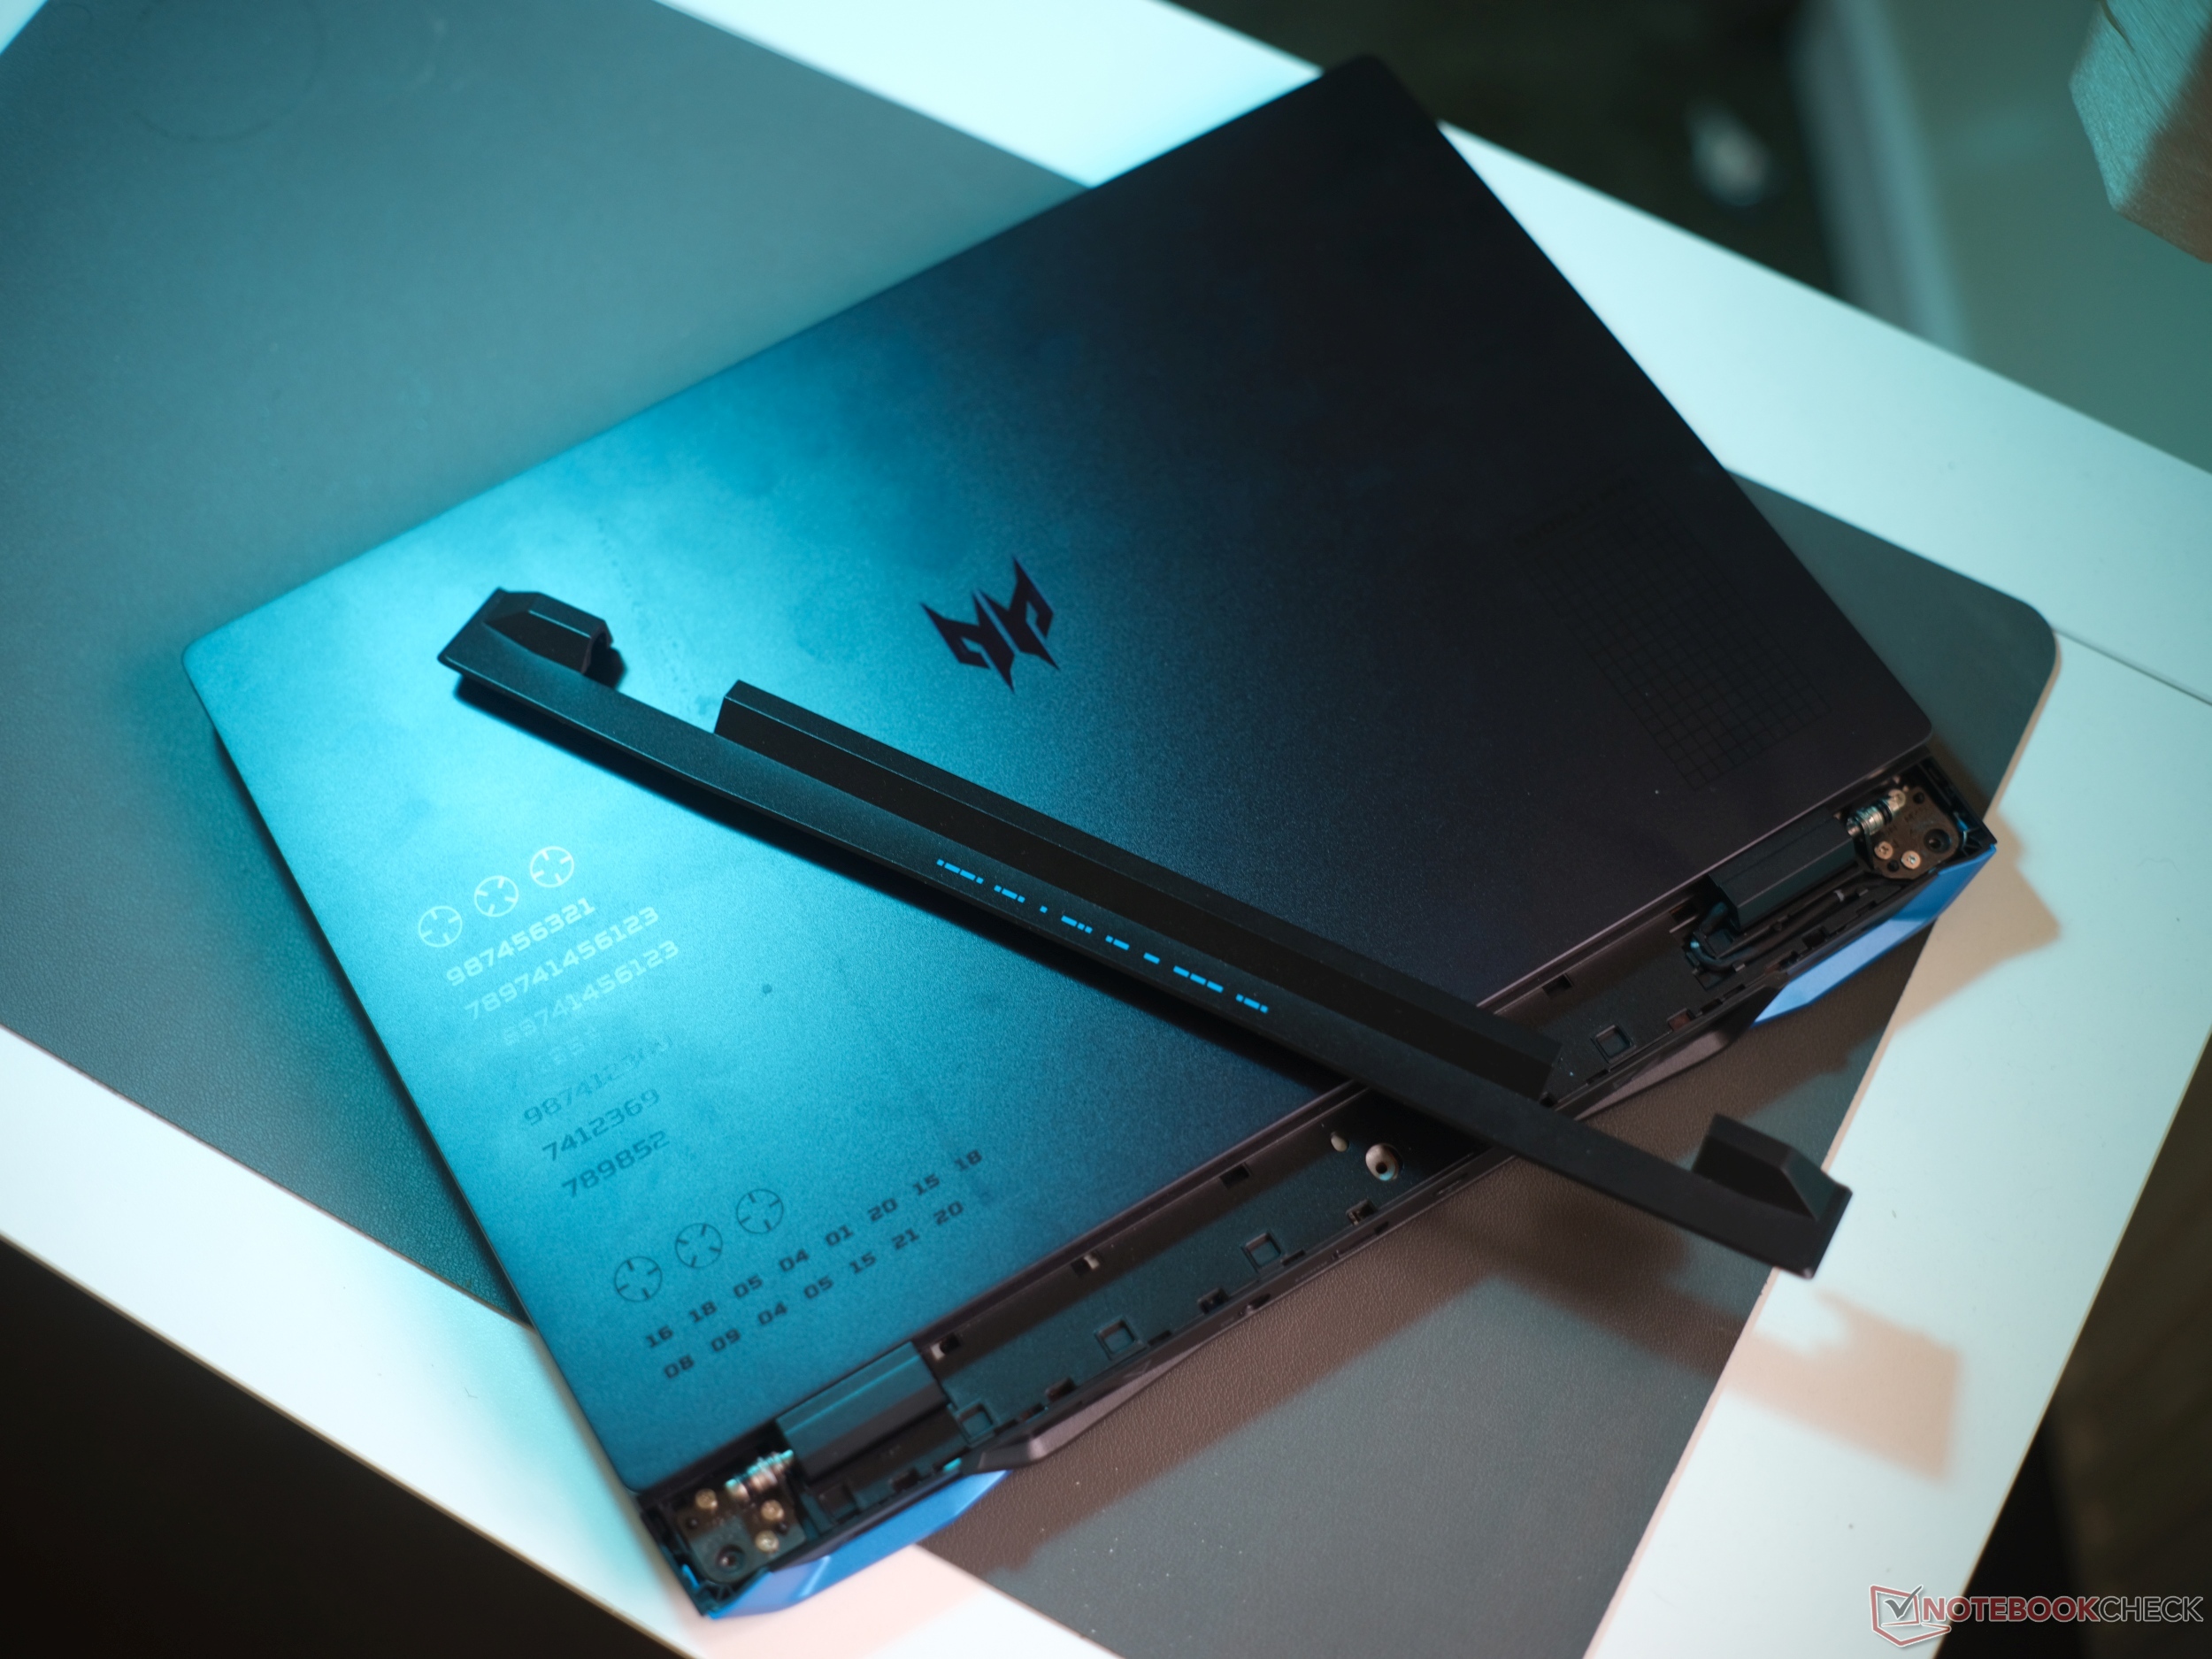
La estabilidad de la carcasa de la Predator Helios Neo es estupenda, lo que la diferencia de muchas carcasas económicas. La tapa de almuninio y la unidad base de plástico son de un negro intenso (Obsidian Black) con un sutil brillo azul oscuro.
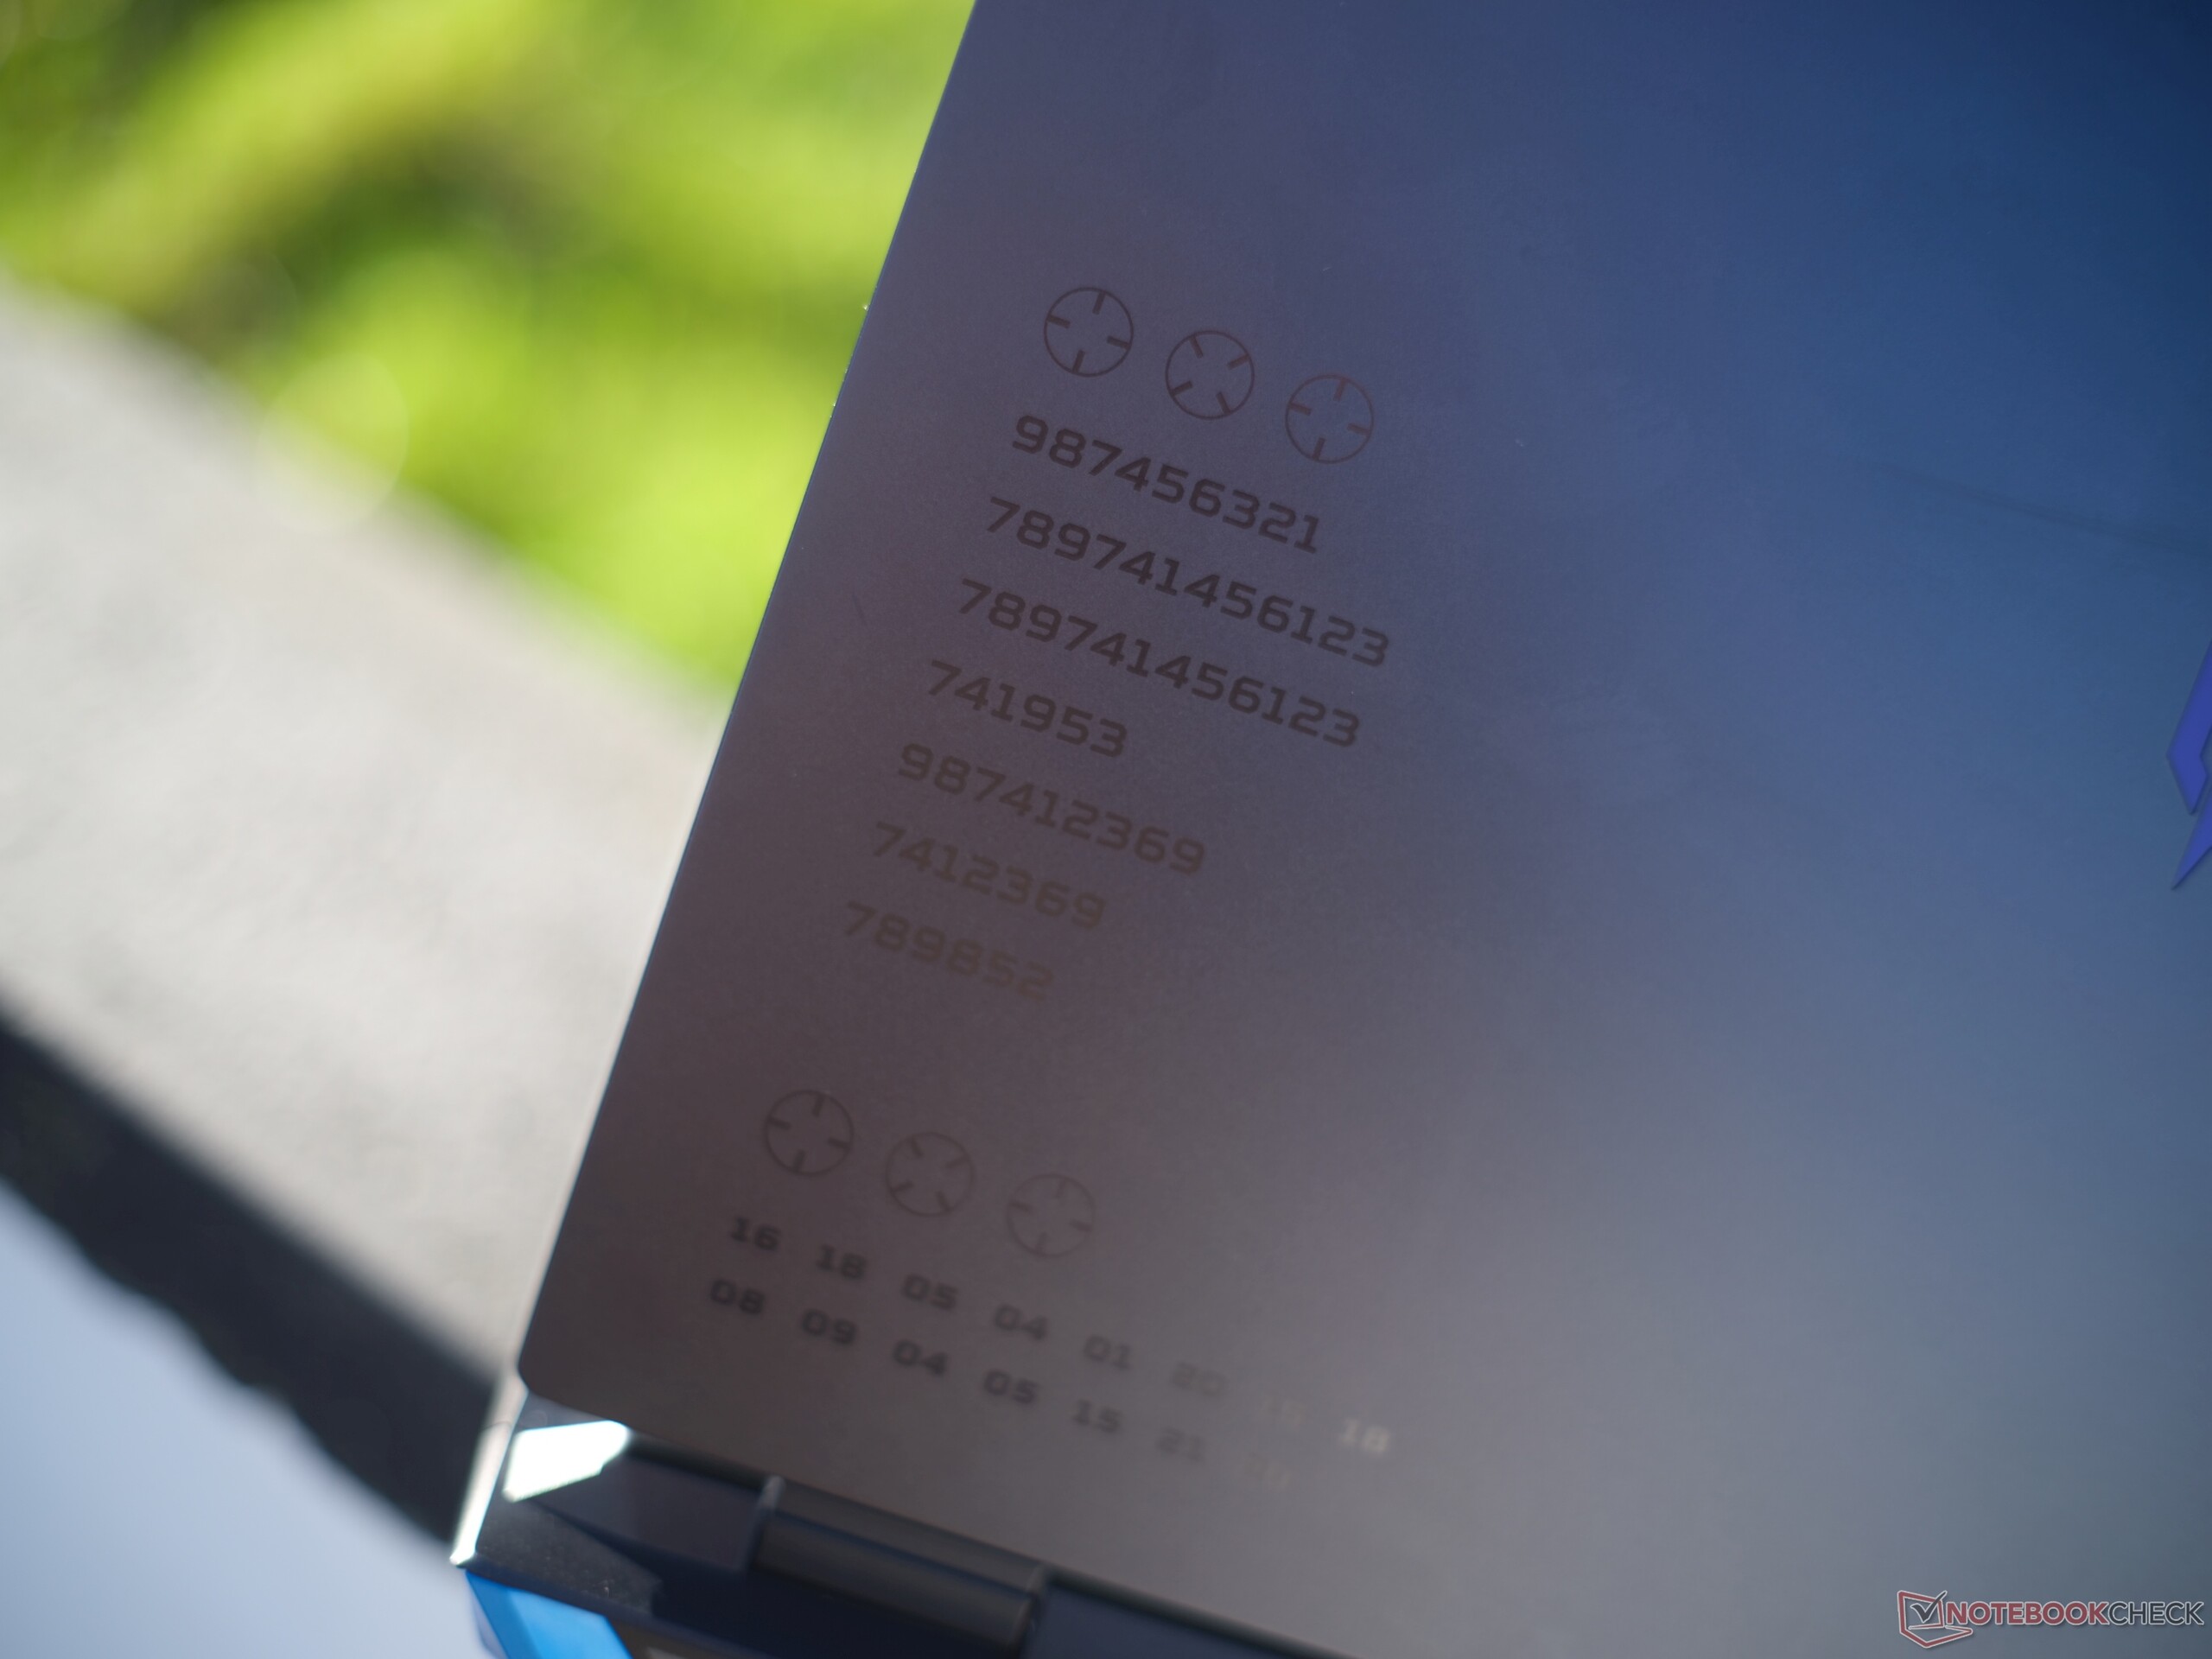
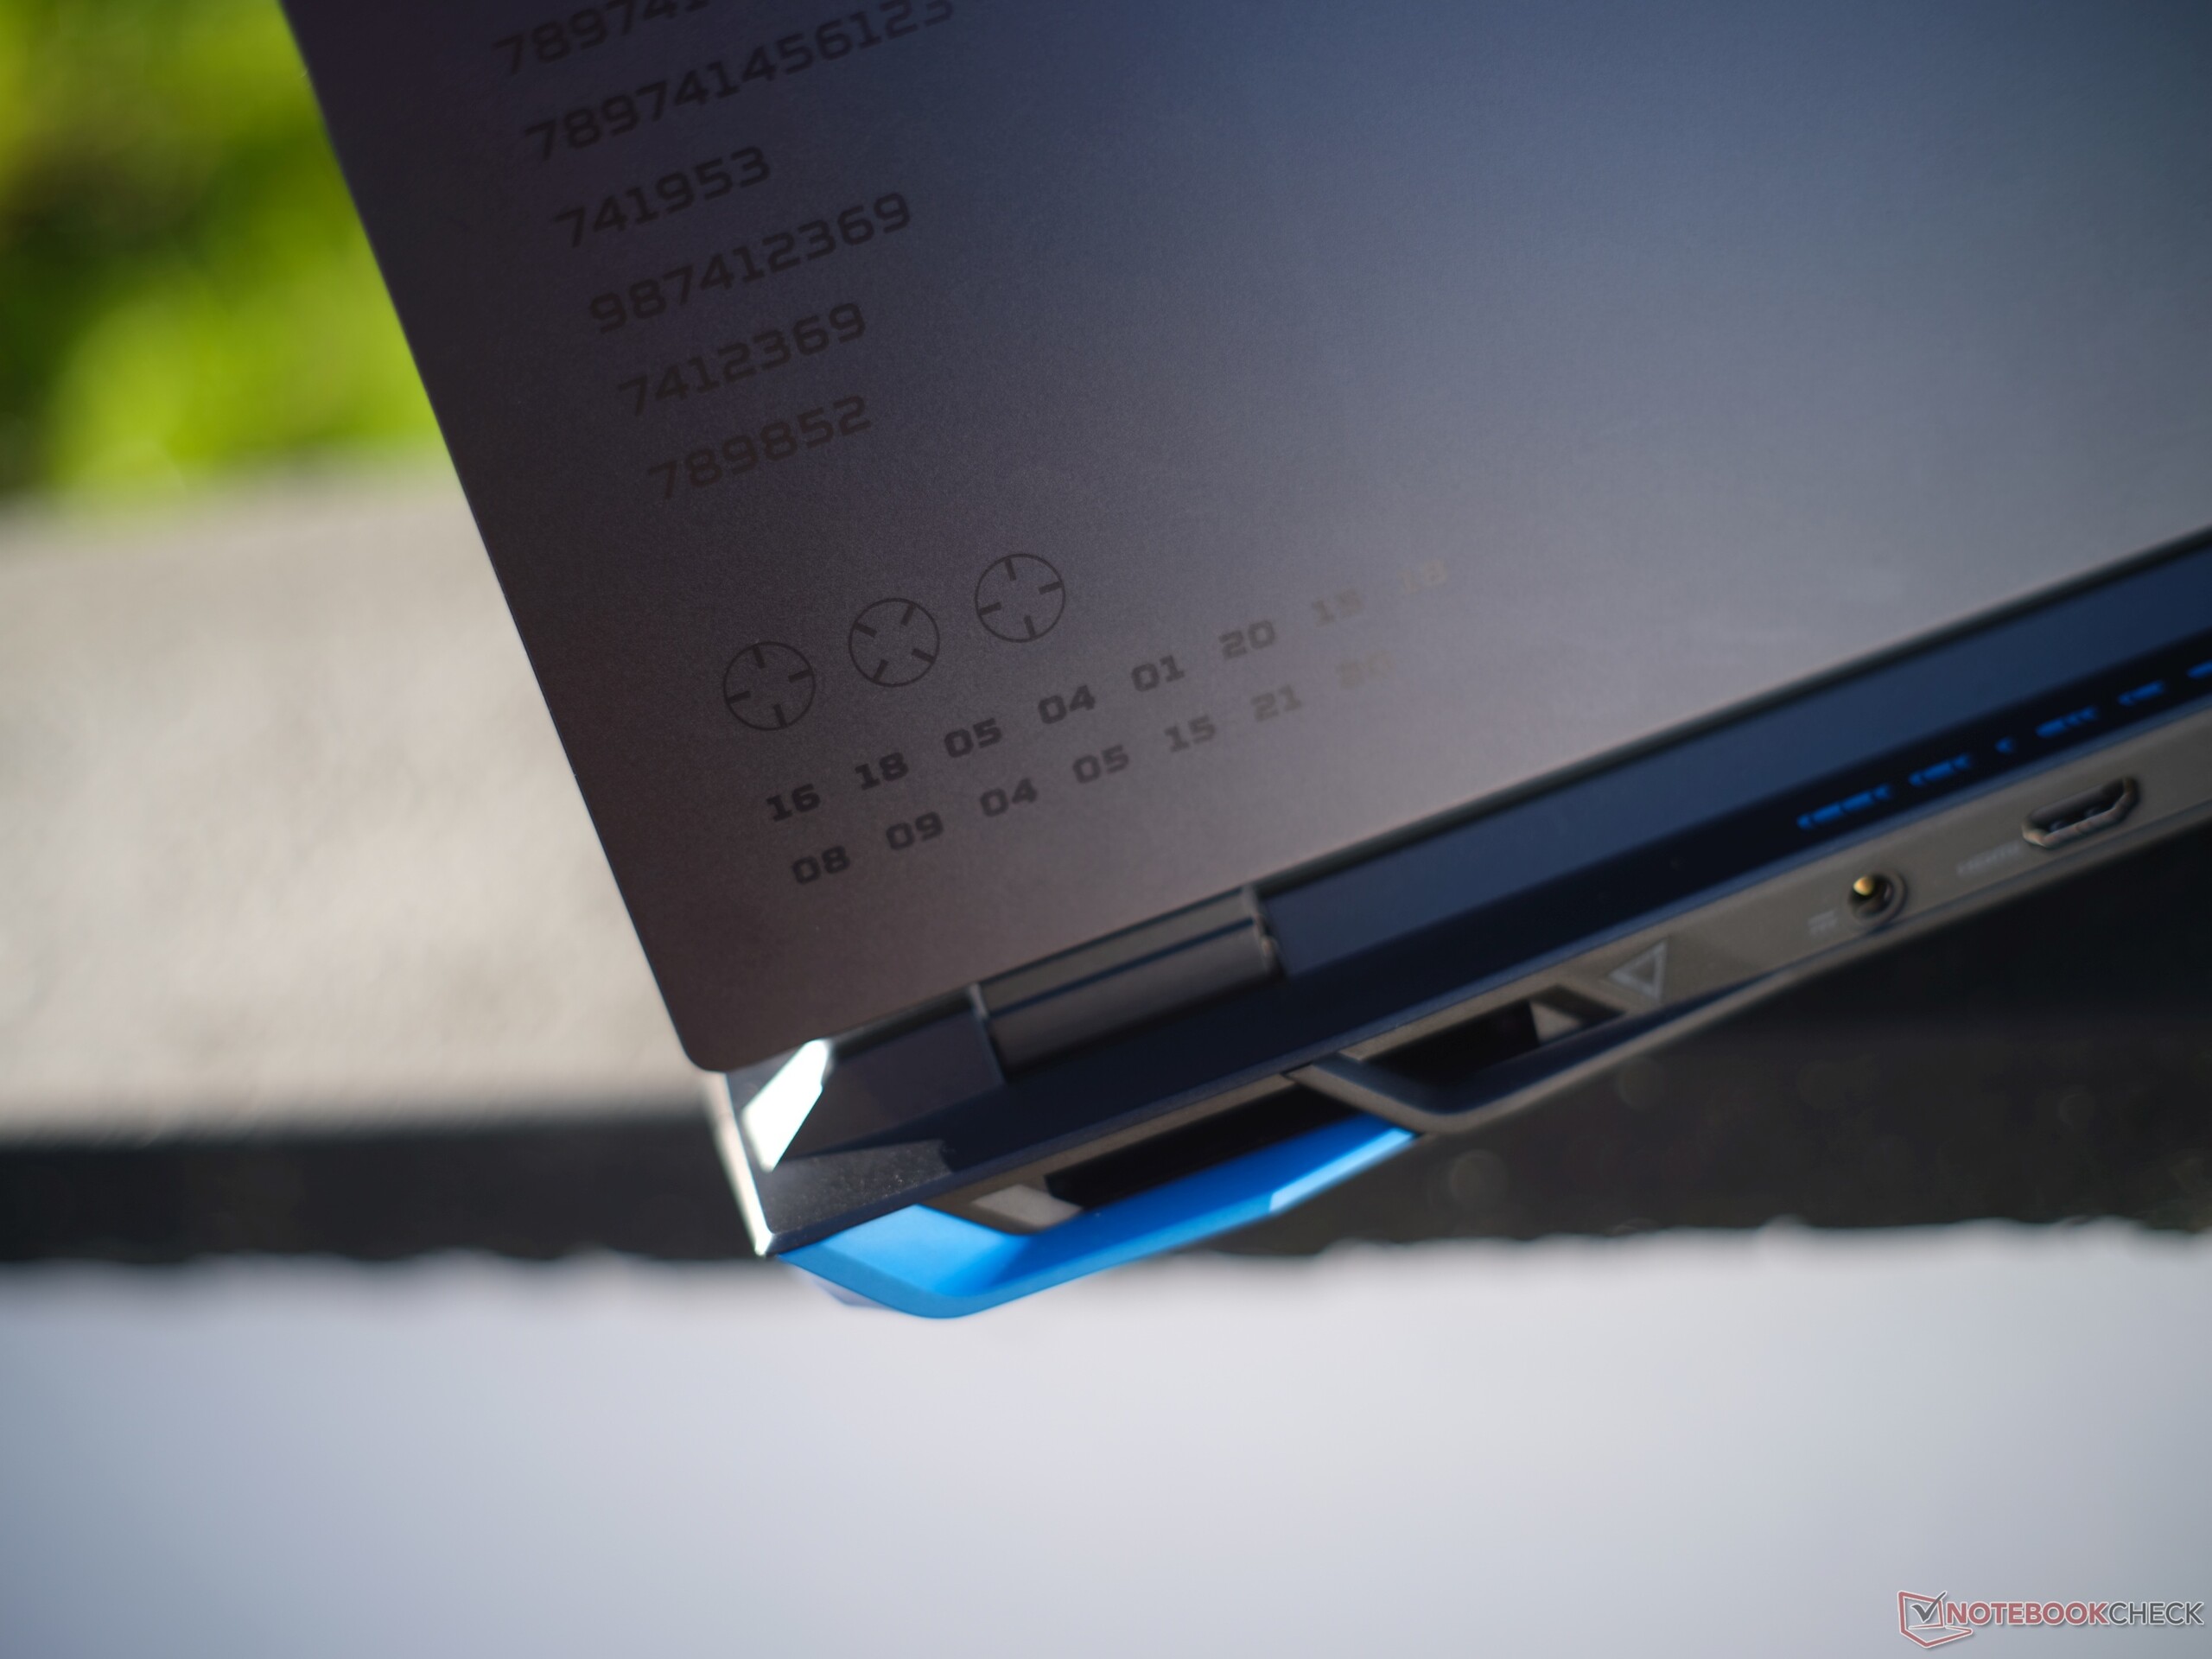
Hay algunos elementos grabados en la tapa que, junto con las rejillas azules de los ventiladores en la parte trasera, dan al aparato un aspecto interesante, pero también un menor "efecto sigilo". Una clara desventaja es lo mucho que sus superficies atraen las huellas dactilares.
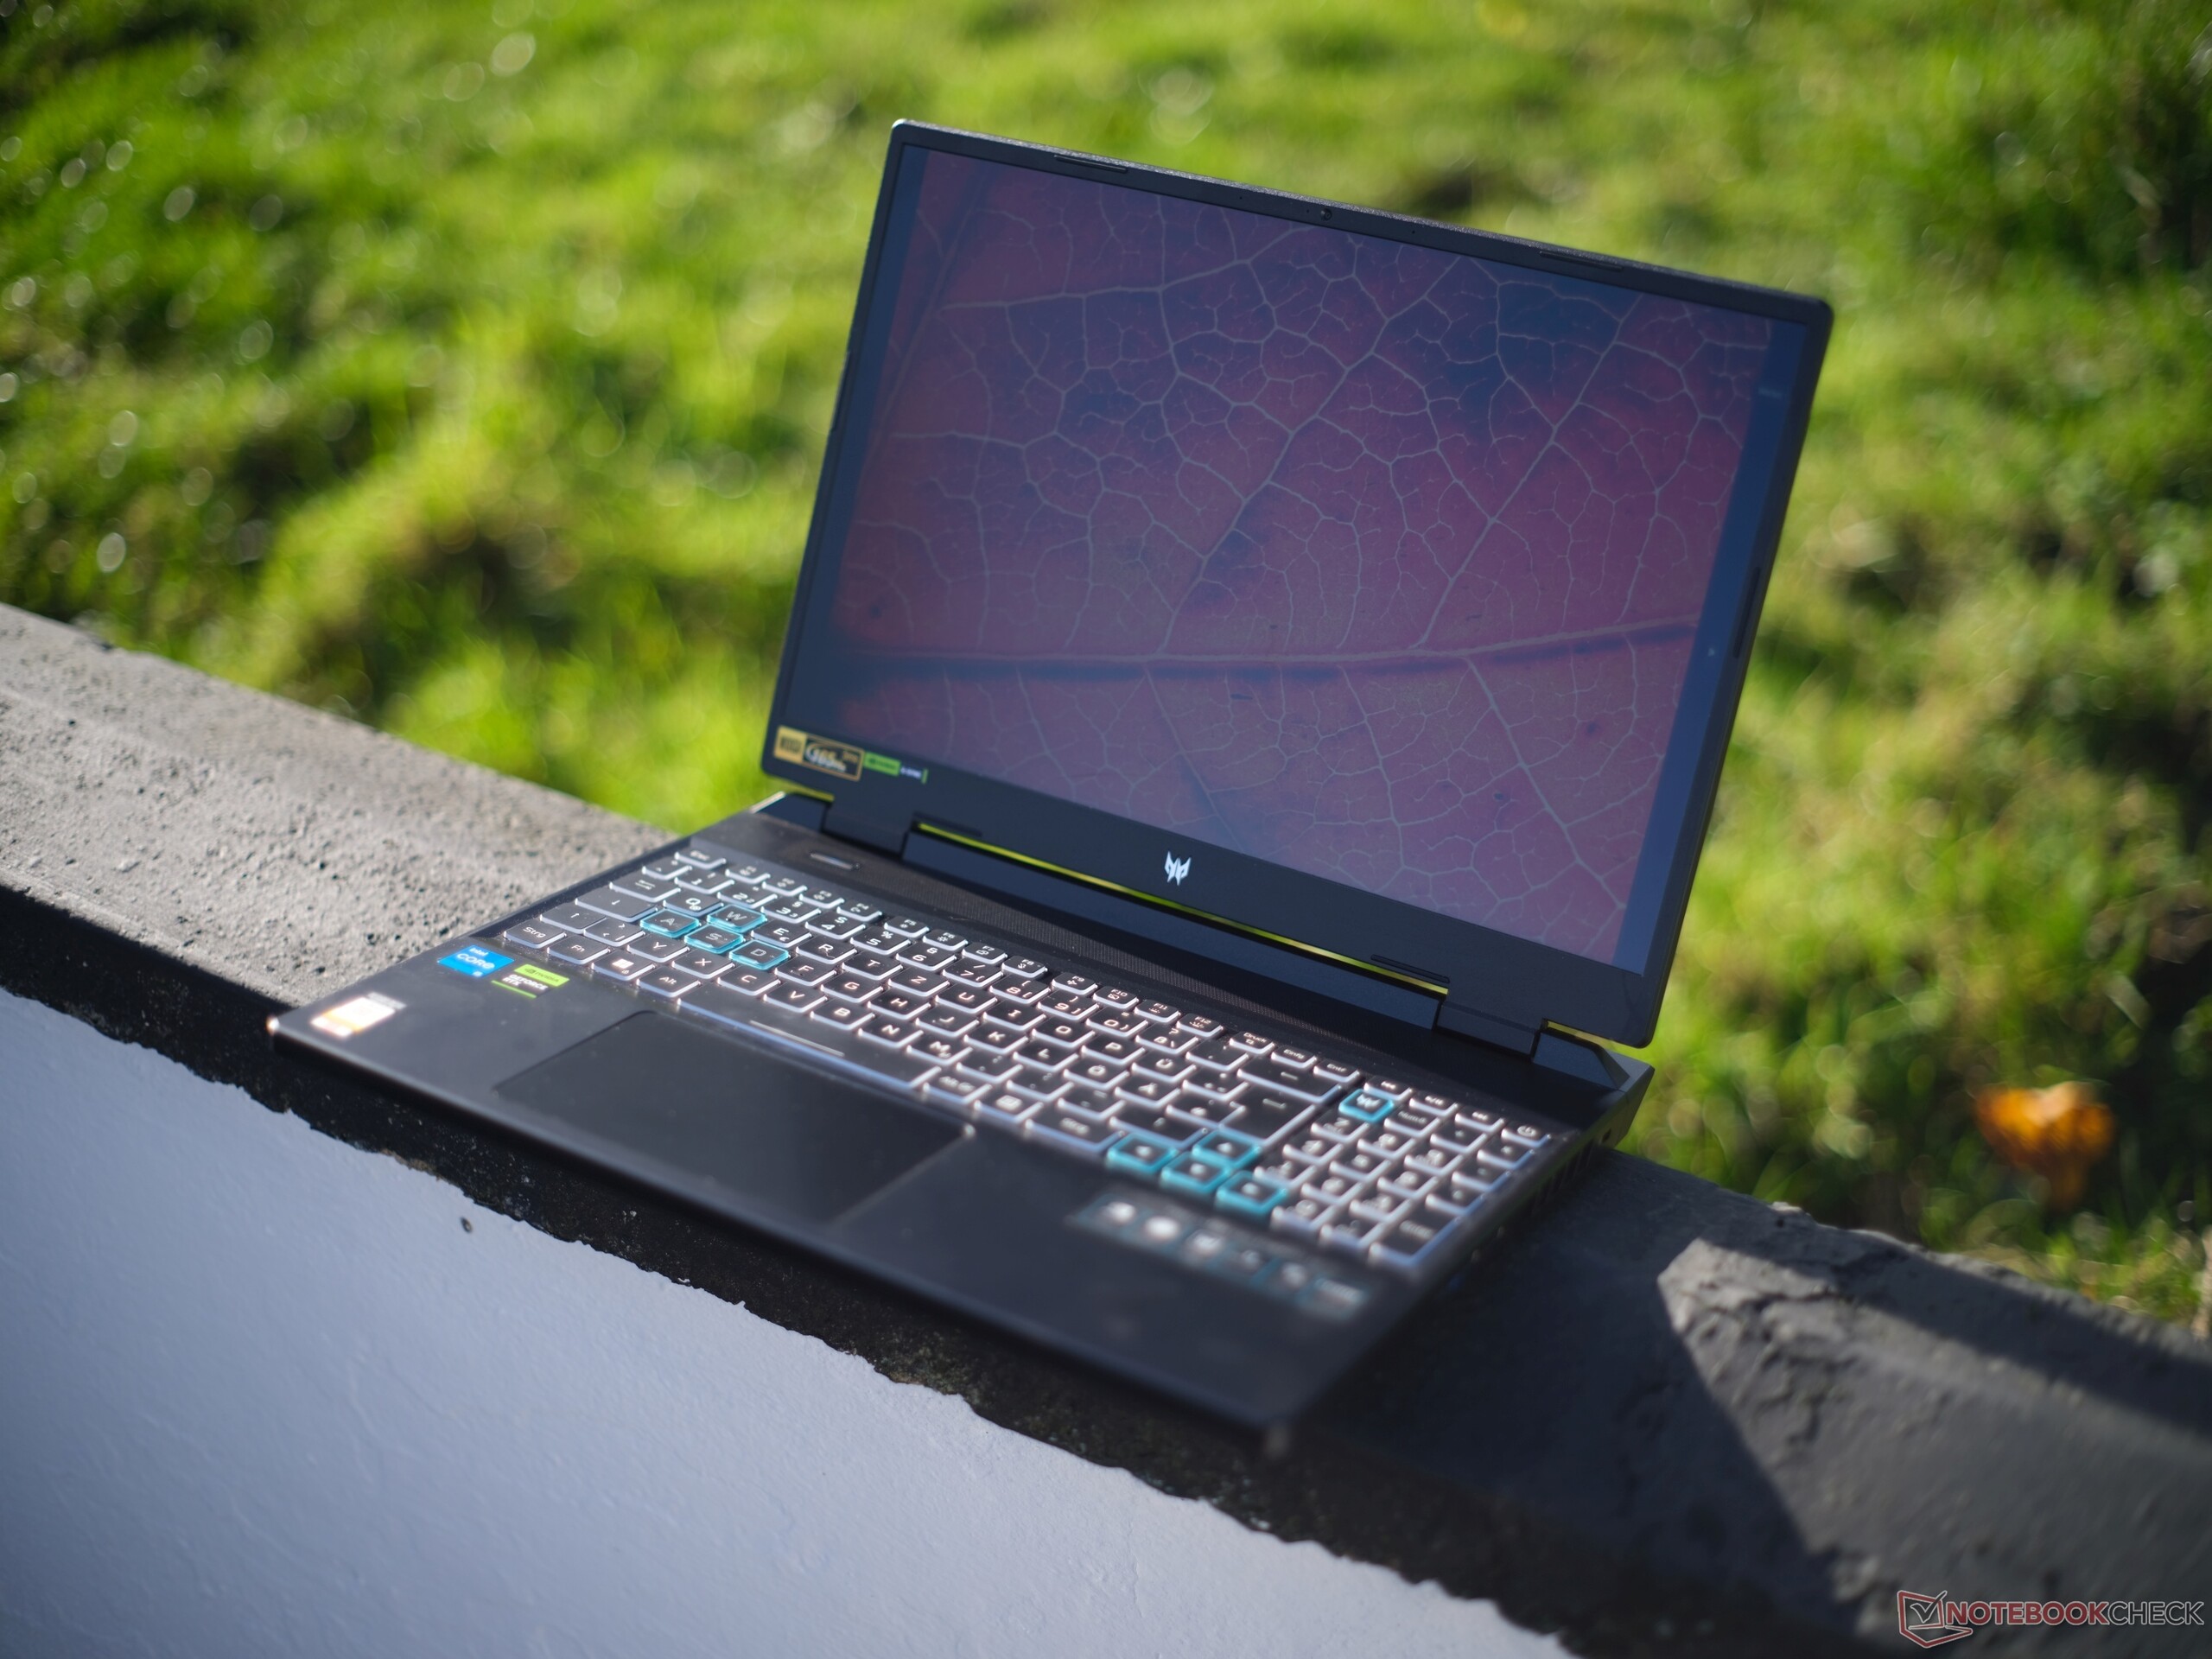
La tapa se puede abrir con una sola mano y hasta un máximo de ~150° - al mismo tiempo, las bisagras son bastante rígidas, lo que significa que apenas se tambalea al colocarla. Por desgracia, puede torcerse con bastante facilidad (aunque esto no provoque errores de imagen) pero, a cambio, la unidad base es muy estable. En conjunto, el Helios Neo 16 nos ha dejado una impresión entre buena y muy buena, al igual que la variante no Neo. La única diferencia es que este modelo no cuenta con una parte trasera iluminada ni con una rejilla de refrigeración intercambiable.
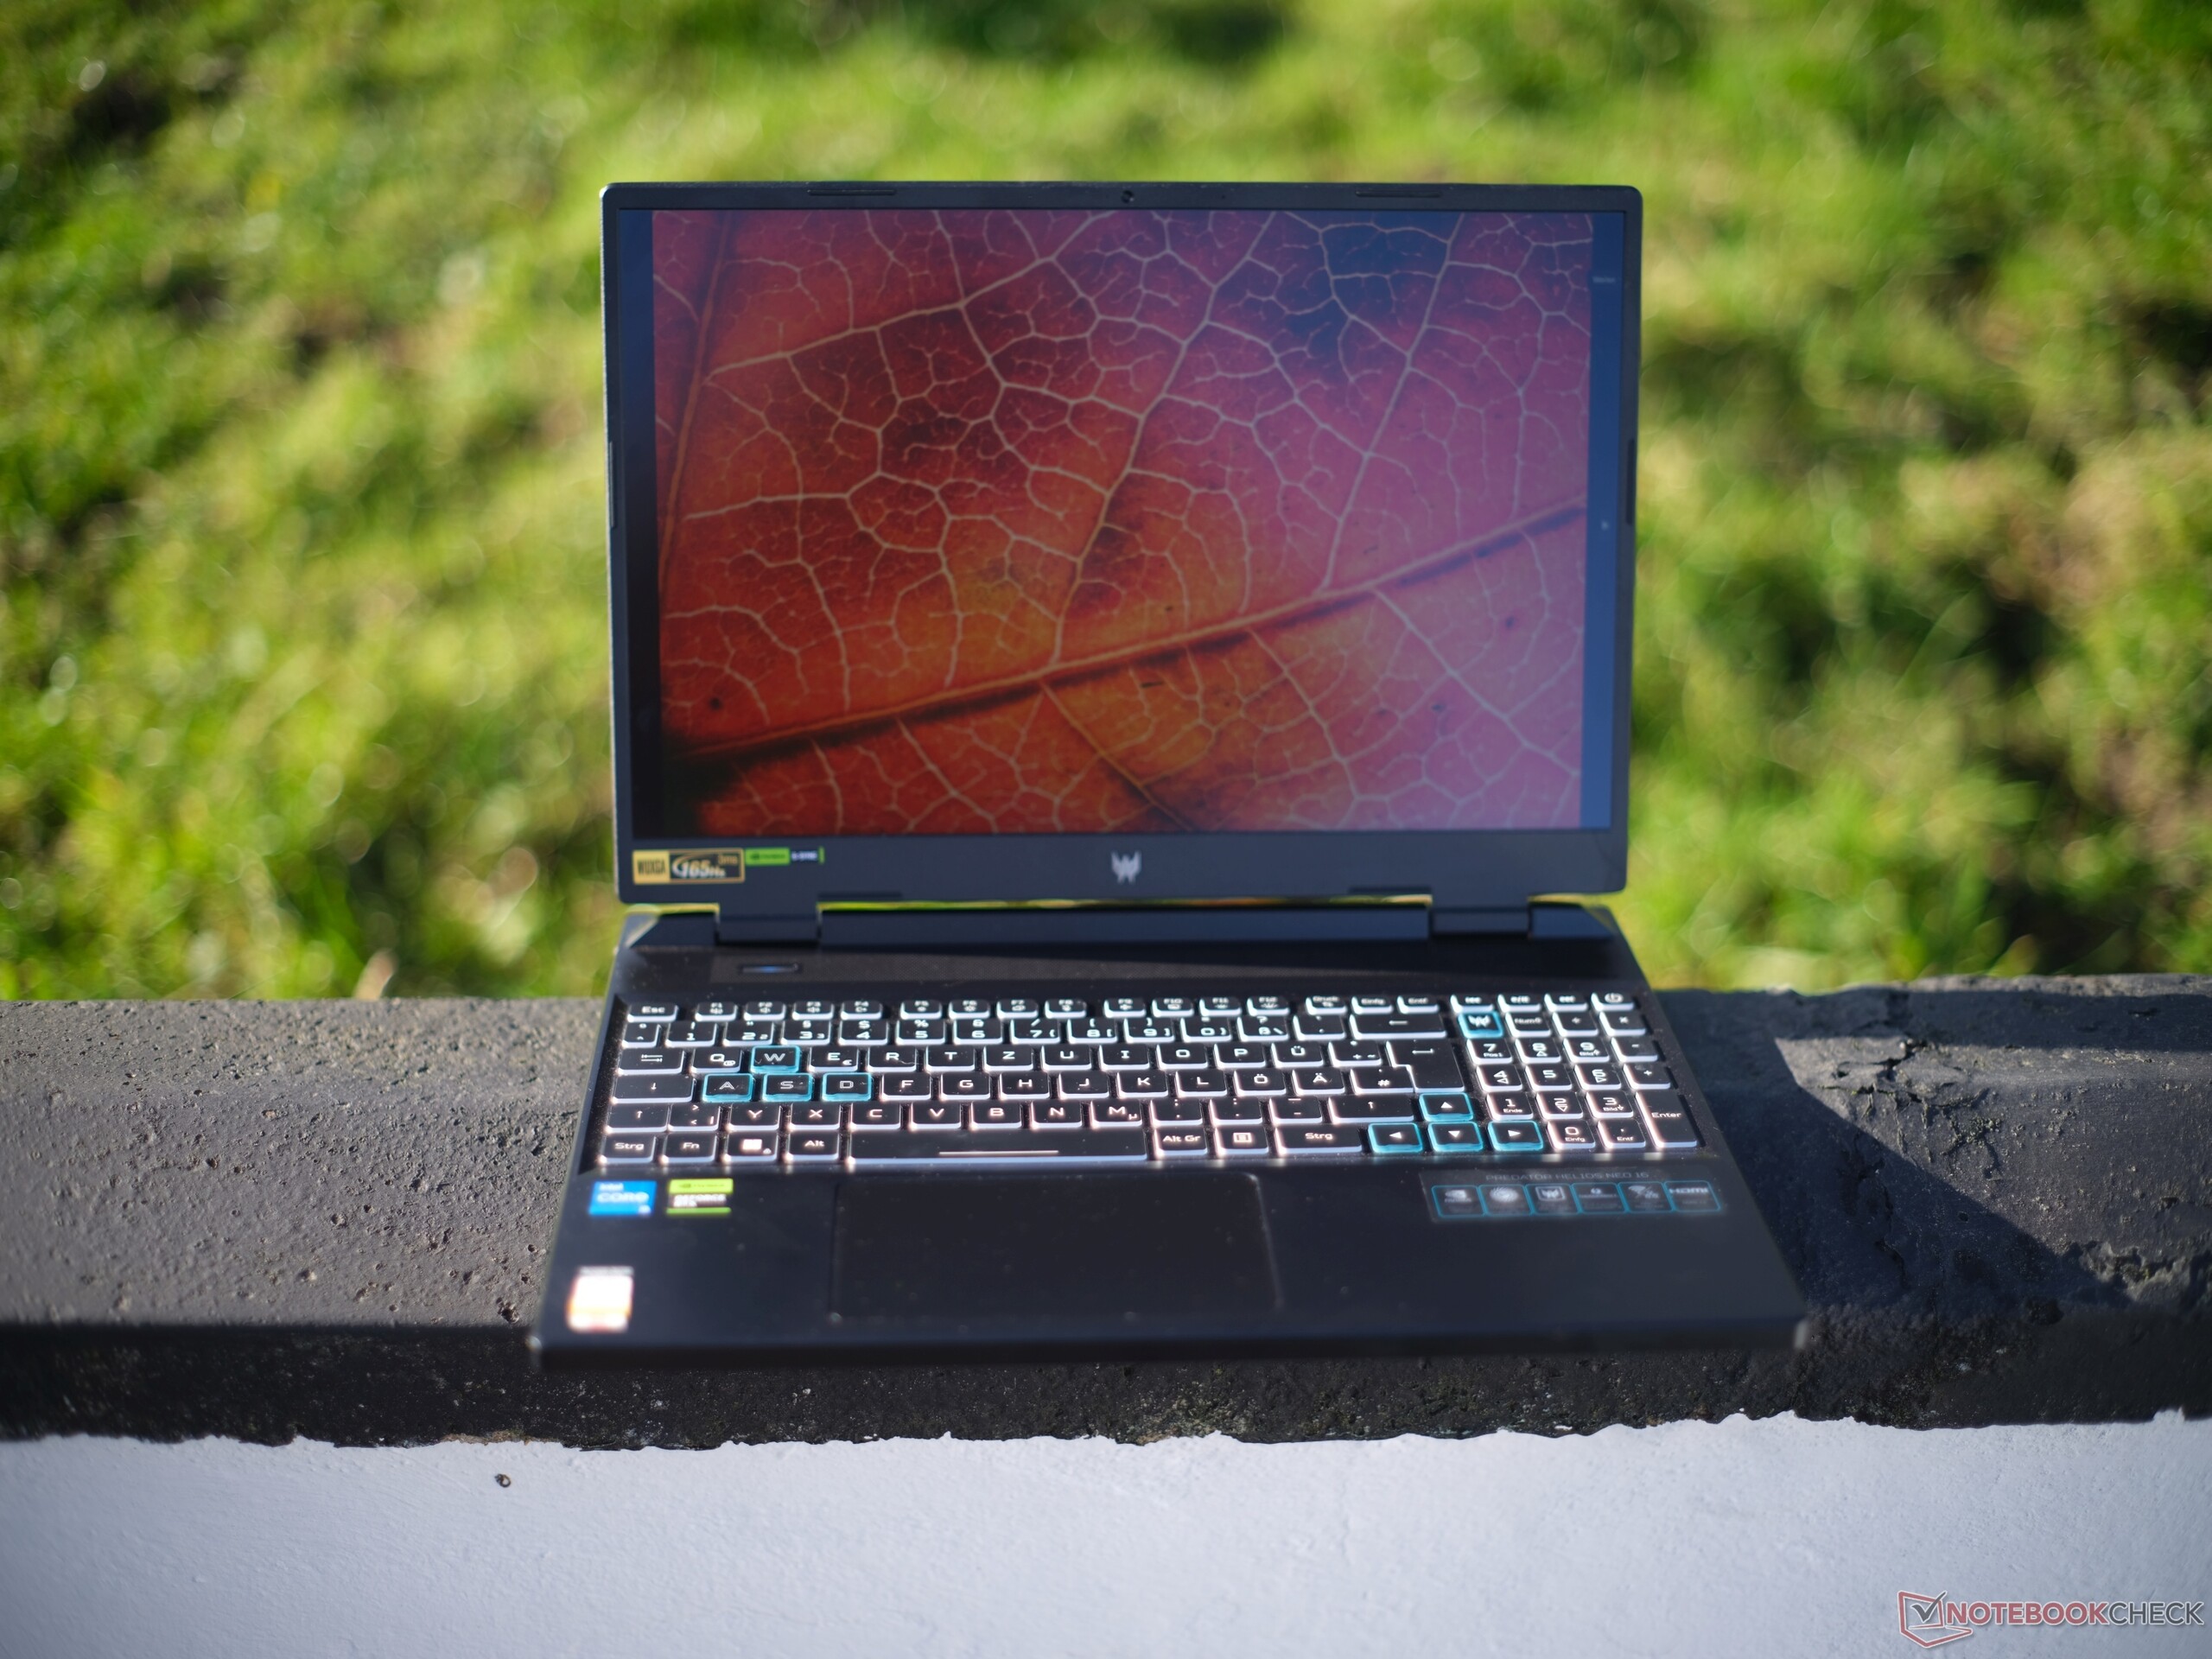
Con un peso de 2,6 kg y un grosor de 28,25 mm, el Helios Neo se sitúa en la media para un portátil para juegos de 16 pulgadas. En nuestro campo de comparación, sólo elHP Victus 16presenta valores inferiores, con un peso de 2,3 kg y un grosor de 22,9 mm. El XMG Apex 15 de 15,6 pulgadas también es un poco más ligero.
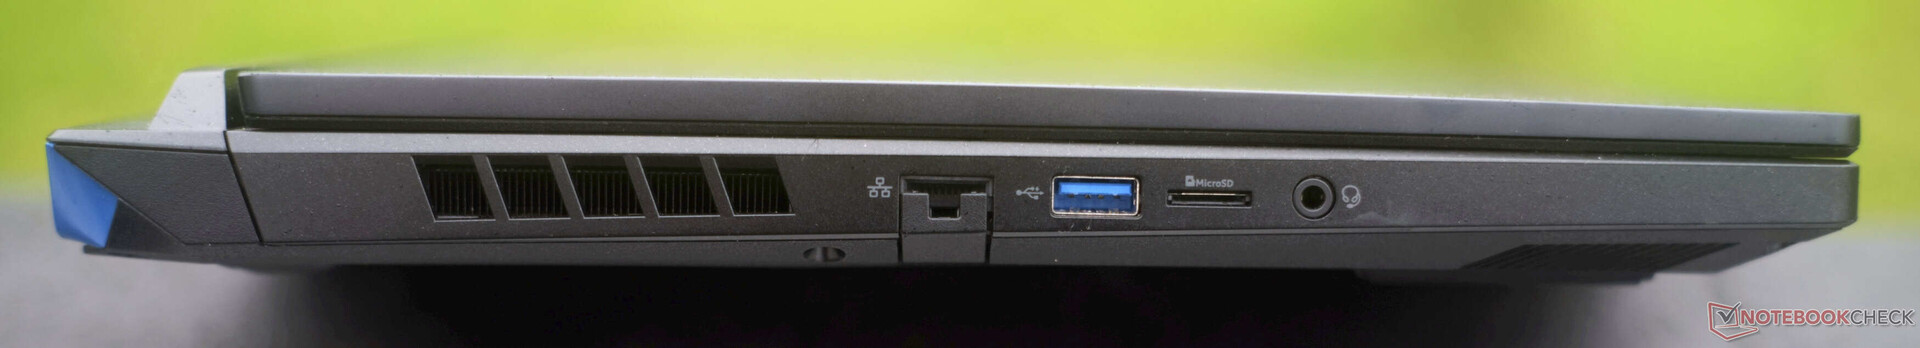
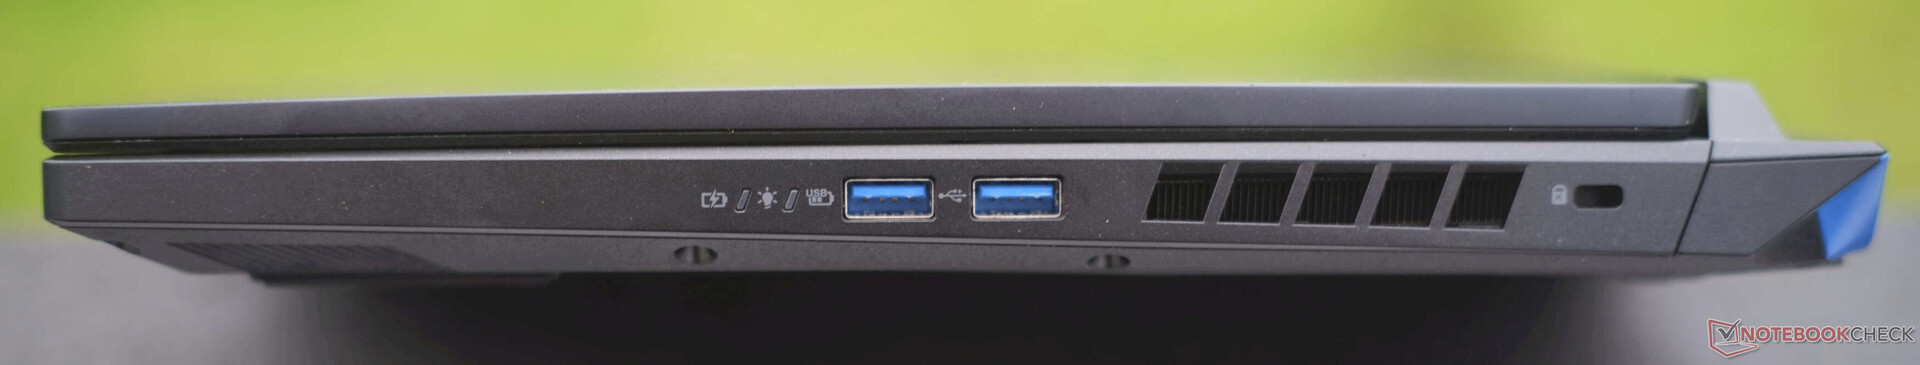
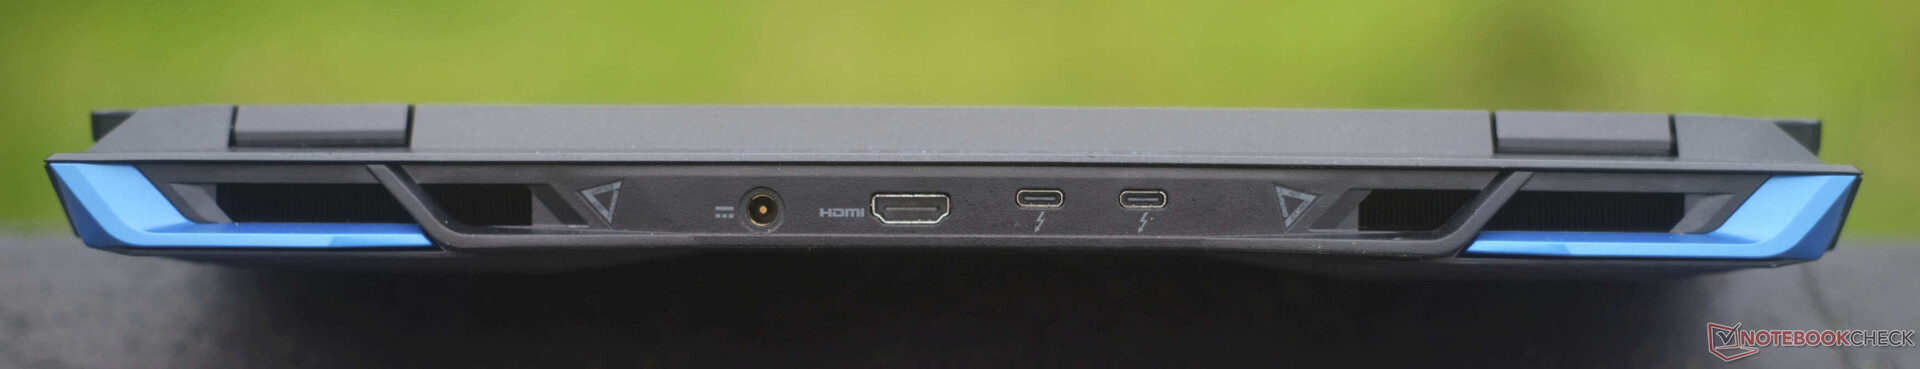
Conectividad: Muchas conexiones, pero WiFi y Power Delivery lentos
El portátil para juegos de Acer cuenta con 1x USB-A 3.1 (5 GBit/s), 2x USB-A 3.2 (10 GBit/s), así como 2x Thunderbolt 4 incl. DisplayPort 1.4 y Power Delivery (65 vatios) en la parte trasera. En la parte trasera hay un Gigabit-RJ45, un lector de tarjetas microSD, una toma de audio de 3,5 mm, un cierre Kensington, una conexión de alimentación, así como un puerto HDMI 2.1 que se conecta directamente a la dGPU y que admite 4K a 120 Hz con G-Sync simultáneo.
A fin de cuentas, el Predator Helios Neo no tiene ninguna desventaja frente a su hermano más caro, con la excepción de su menor rendimiento de DP.
Lector de tarjetas SD
Las velocidades de transferencia del lector de tarjetas microSD son medias cuando se utiliza con nuestra tarjeta de referencia AV PRO microSD 128 GB V60. ElLegion Slim 5,Acer Nitro 16,XMG Focus 15yGigabyte G5todos leen y copian datos con velocidades de transferencia similares. Sin embargoEl Apex 15 de XMG es más del doble de lento, mientras queM16 R1 de Alienware es el doble de rápido.
| SD Card Reader | |
| average JPG Copy Test (av. of 3 runs) | |
| Alienware m16 R1 Intel (AV PRO microSD 128 GB V60) | |
| Media de la clase Gaming (20.9 - 210, n=54, últimos 2 años) | |
| Lenovo Legion Slim 5 14APH8 (Toshiba Exceria Pro SDXC 64 GB UHS-II) | |
| Acer Nitro 16 AN16-41-R7YE (AV PRO microSD 128 GB V60) | |
| Acer Predator Helios Neo 16 NH.QLTEG.002 | |
| Gigabyte G5 KF | |
| Schenker XMG Apex 15 (Late 23) (AV PRO microSD 128 GB V60) | |
| maximum AS SSD Seq Read Test (1GB) | |
| Alienware m16 R1 Intel (AV PRO microSD 128 GB V60) | |
| Media de la clase Gaming (25.5 - 261, n=51, últimos 2 años) | |
| Schenker XMG Focus 15 (E23) | |
| Gigabyte G5 KF | |
| Acer Predator Helios Neo 16 NH.QLTEG.002 | |
| Acer Nitro 16 AN16-41-R7YE (AV PRO microSD 128 GB V60) | |
| Lenovo Legion Slim 5 14APH8 (Toshiba Exceria Pro SDXC 64 GB UHS-II) | |
| Schenker XMG Apex 15 (Late 23) (AV PRO microSD 128 GB V60) | |
Comunicación
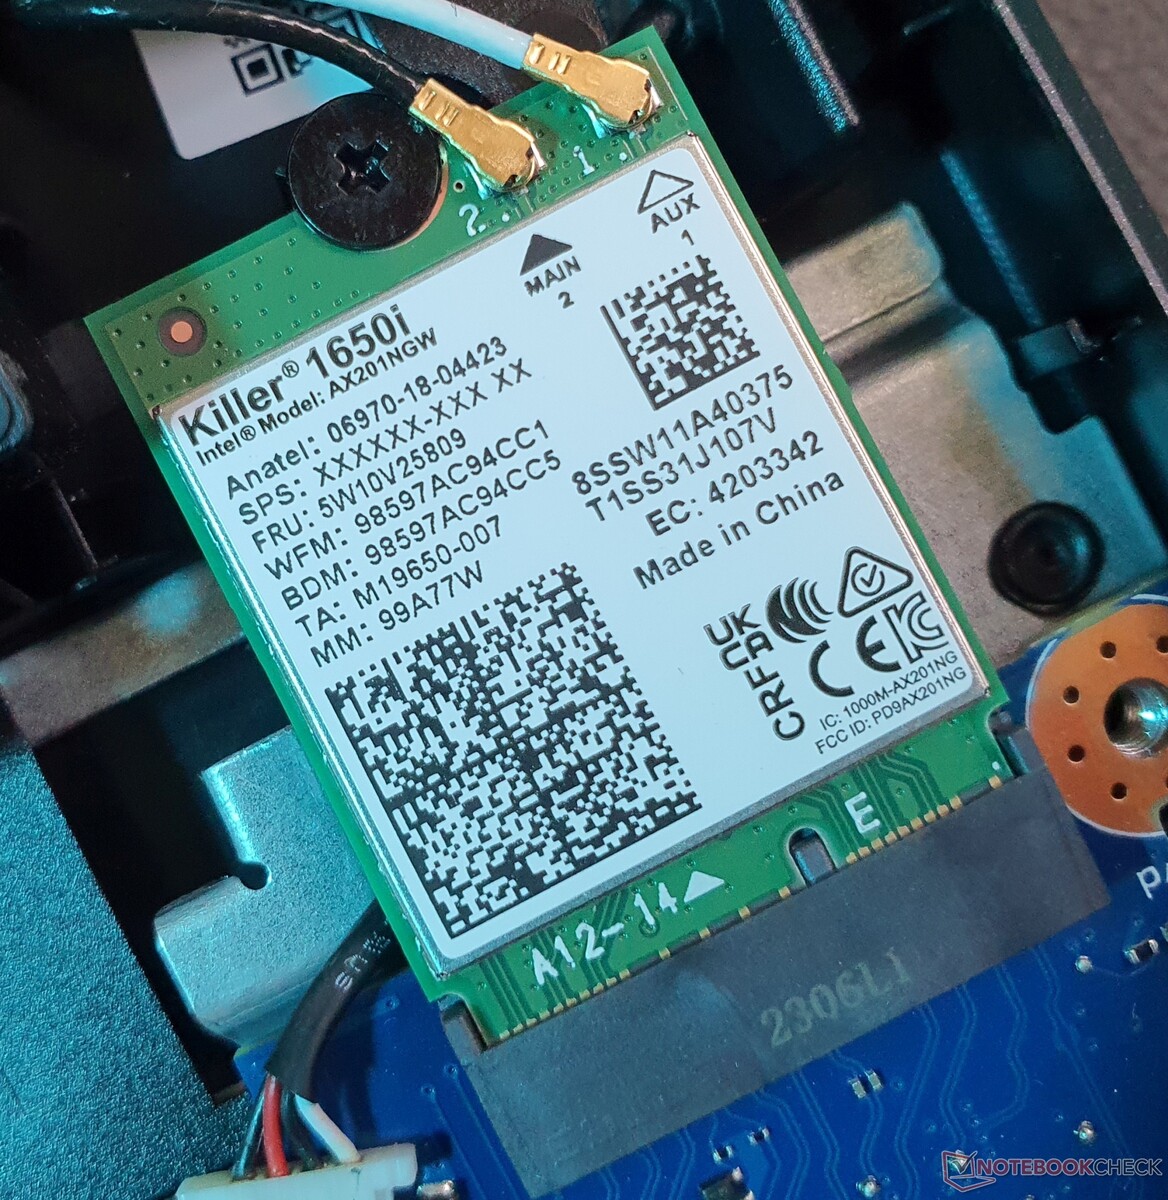
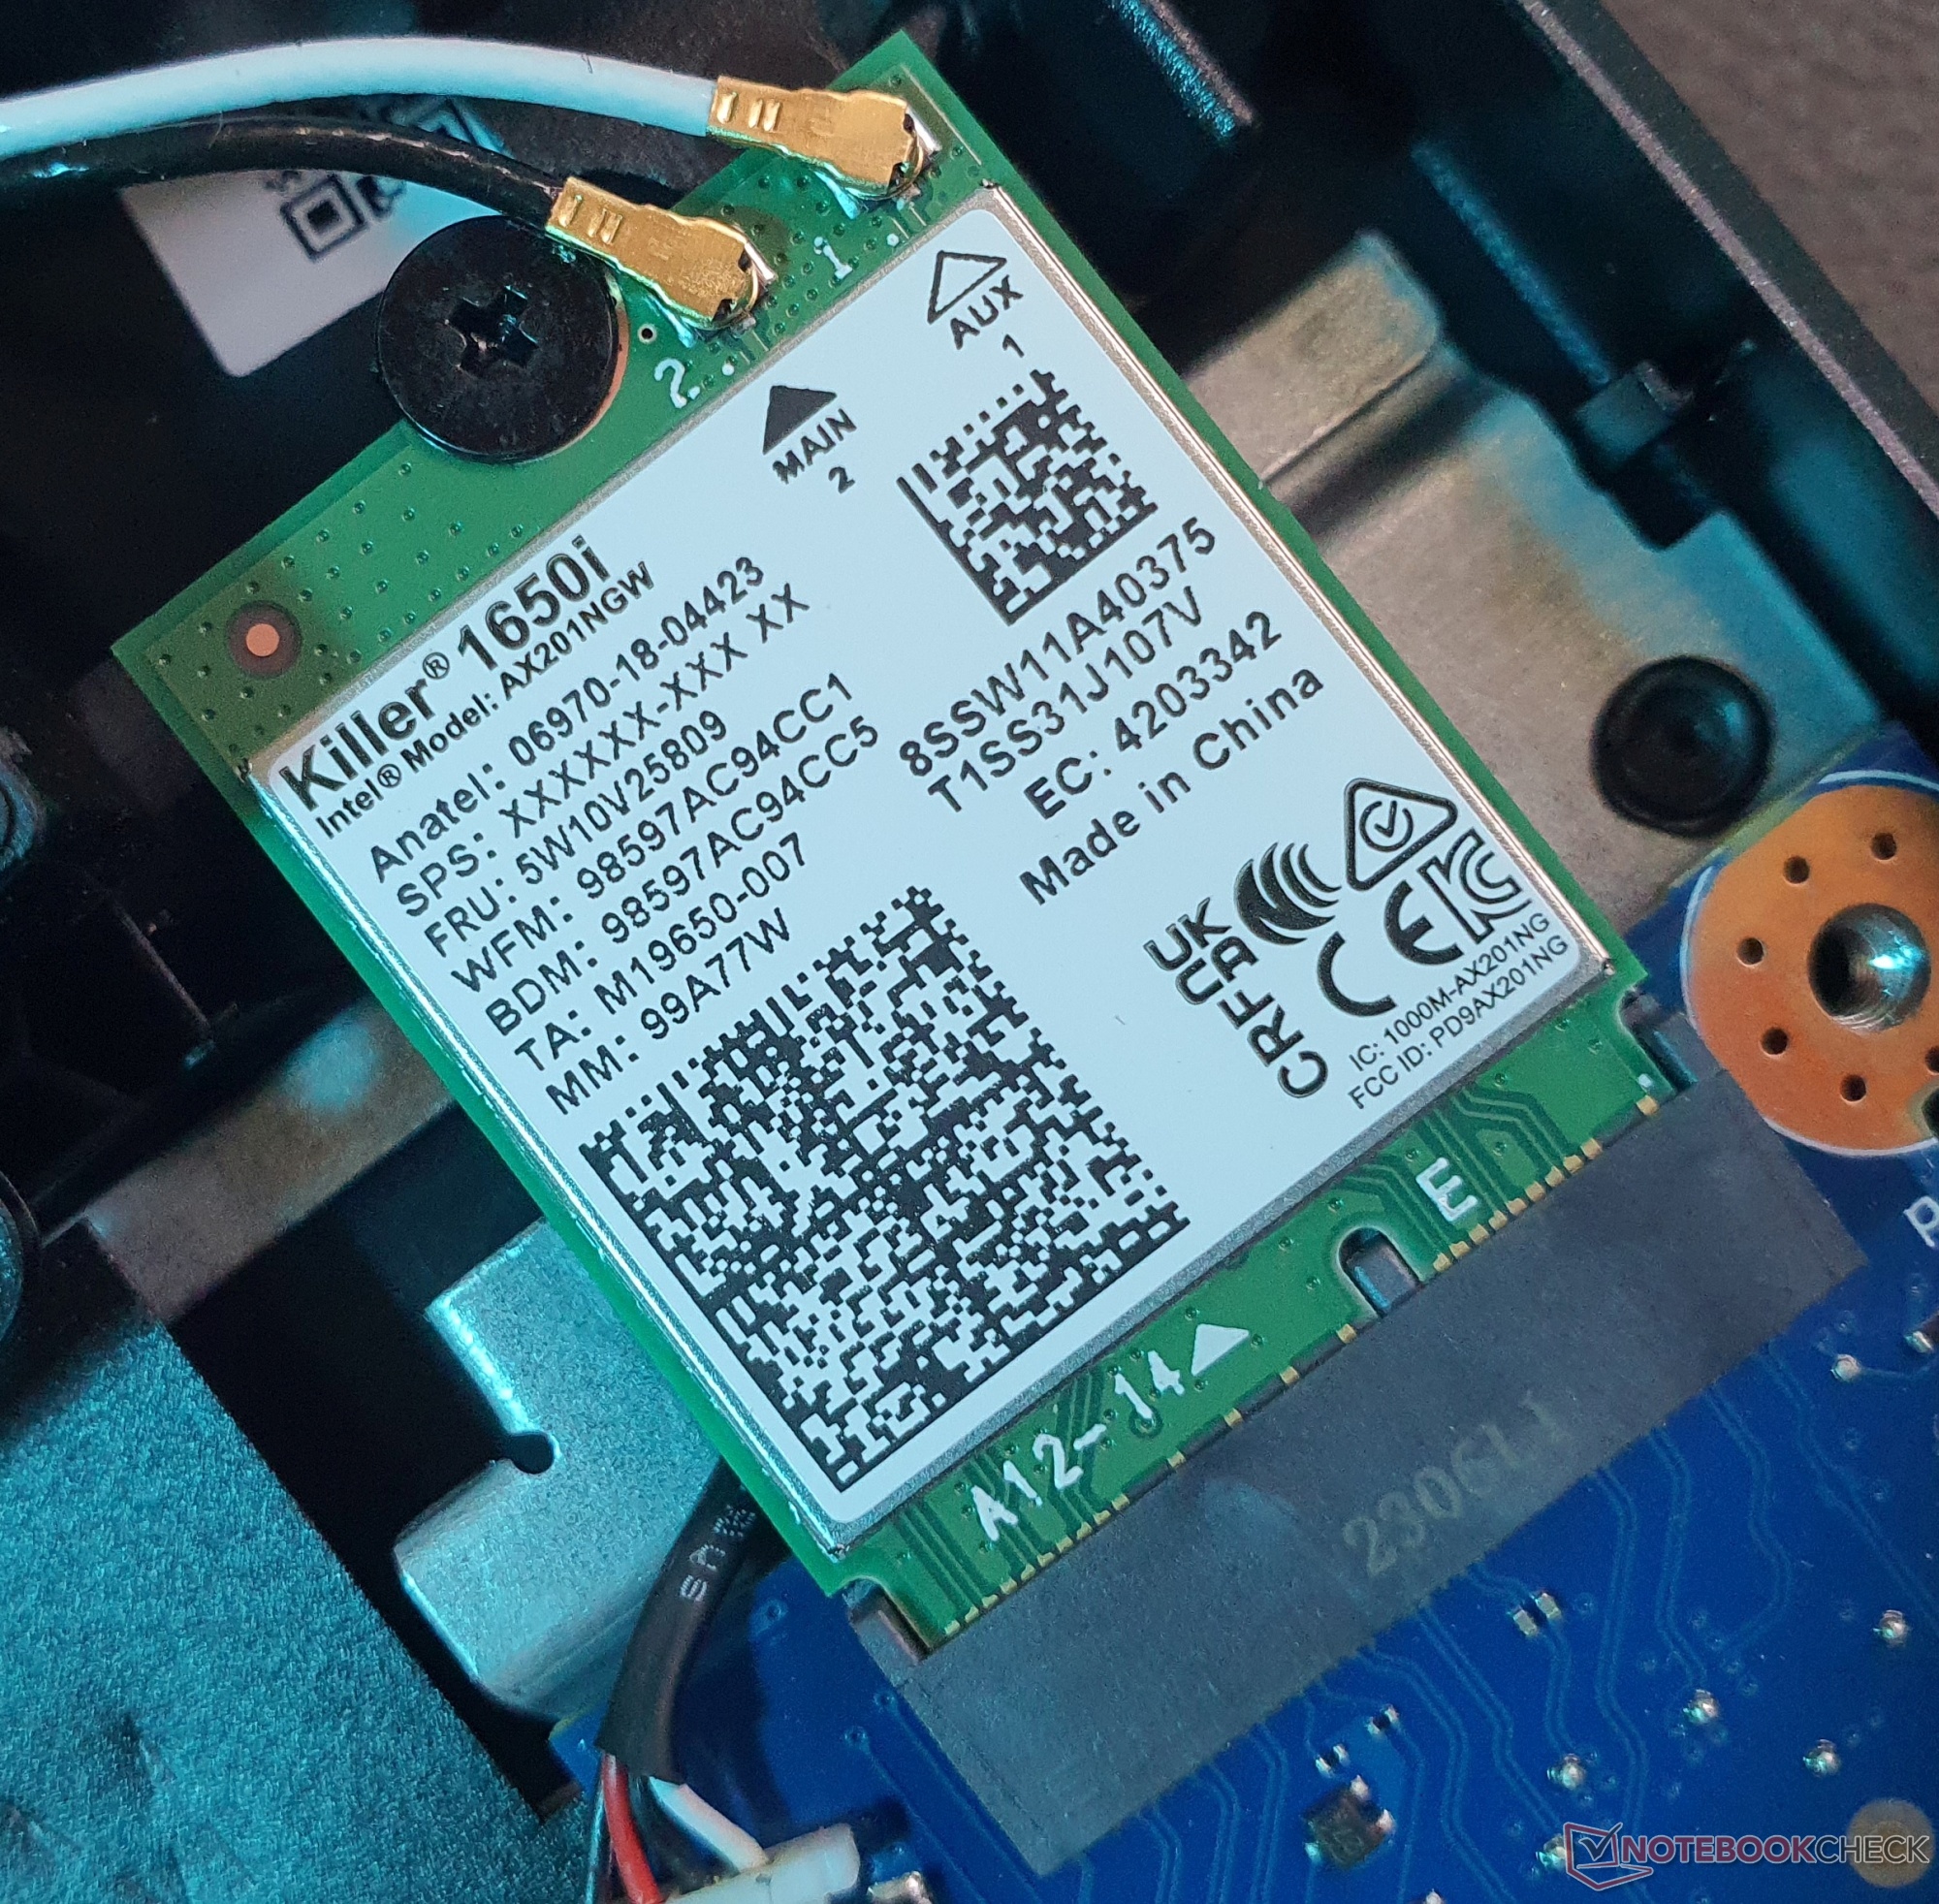
El módulo WLAN Intel Killer AX1650i instalado en el portátil se corresponde con el estándar WiFi 6 más antiguo y, con unas tasas de transferencia de ~900 MBit/s, se sitúa en un nivel de lentitud similar al del chip Realtek integrado en el Lenovo LOQ 16.
El Helios 16, por otro lado, alcanza hasta 1,6 GBit/s utilizando el Intel Killer AX1675i (WiFi 6E), mientras que elLegion Pro 5 16 se sitúa por poco a la cabeza de nuestra comparativa. El controlador Gigabit Killer E2600 de Intel se encarga de las conexiones por cable, mientras que Bluetooth 5.2 también está a bordo.
Cámara web


A diferencia del Predator Helios 16acer sólo ha instalado una cámara web de 720p en el Neo, lo que nos parece una verdadera lástima teniendo en cuenta su precio. En consecuencia, la calidad de imagen deja mucho que desear incluso en condiciones óptimas. Windows Hello tampoco está incluido. Sin embargo, los micrófonos de doble matriz ofrecen una calidad de sonido decente.


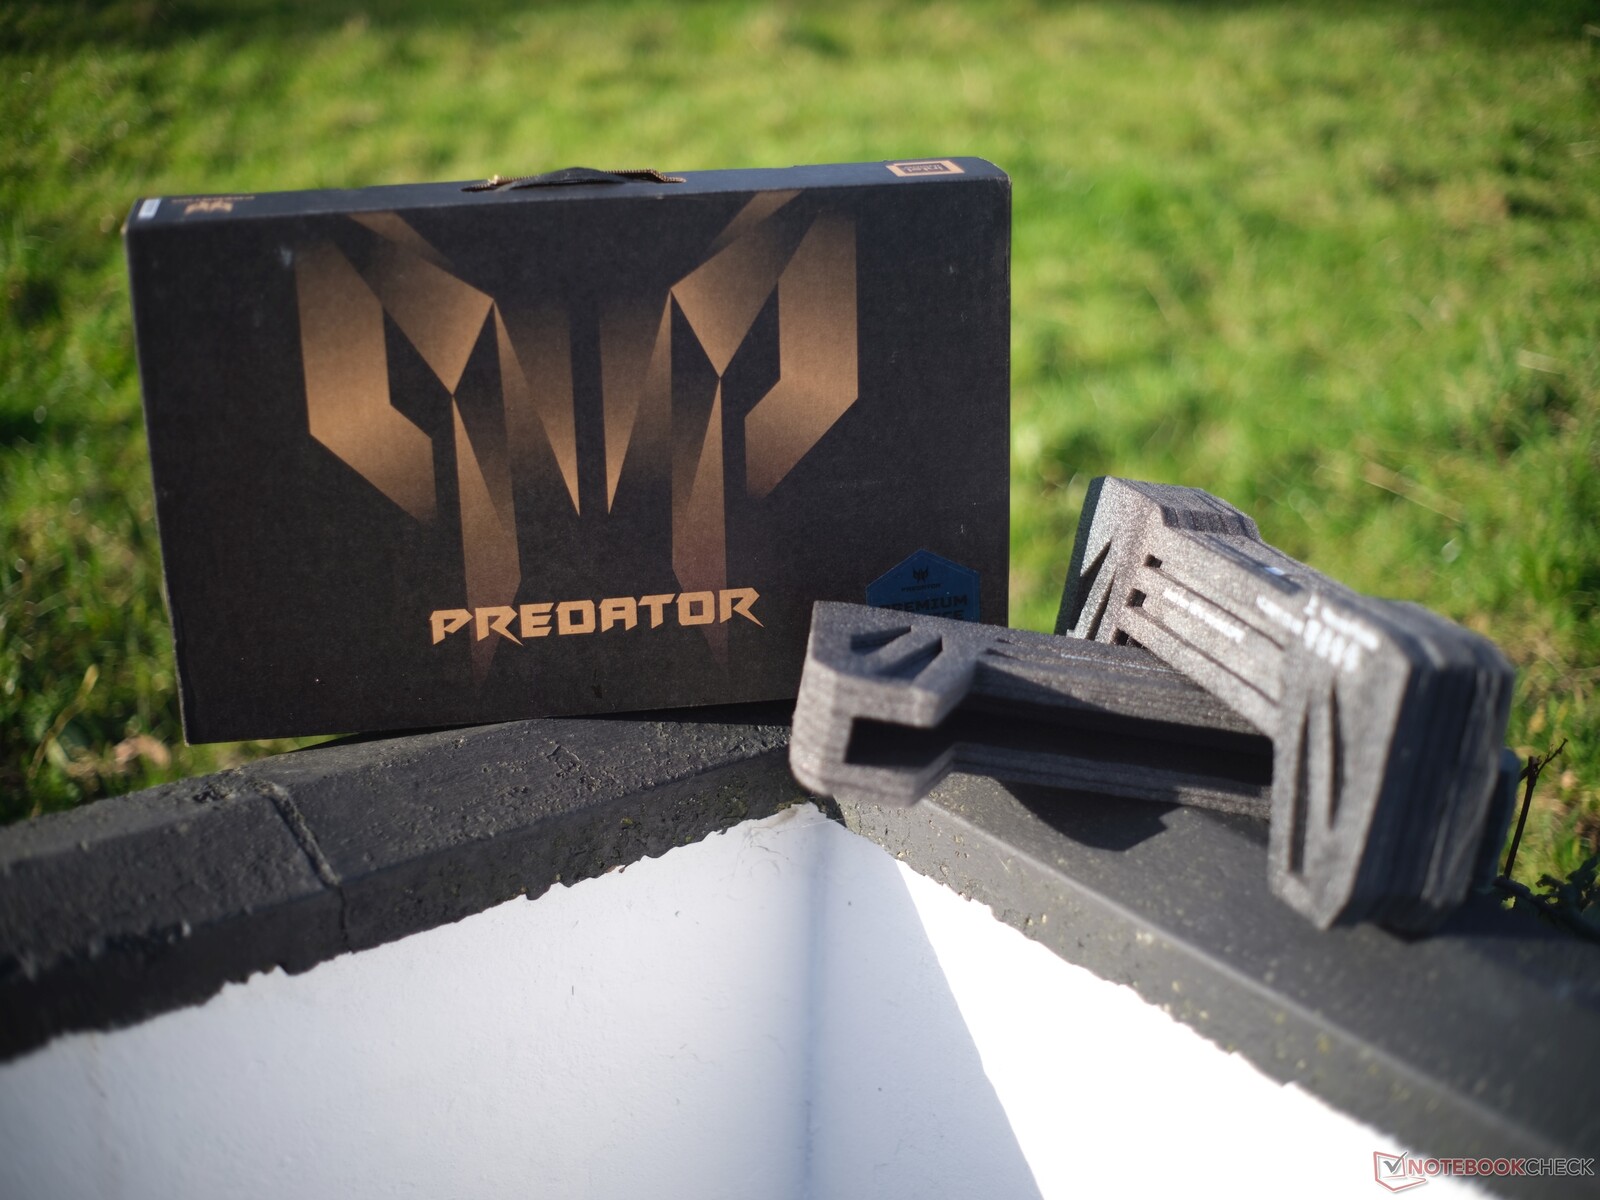
Accesorios
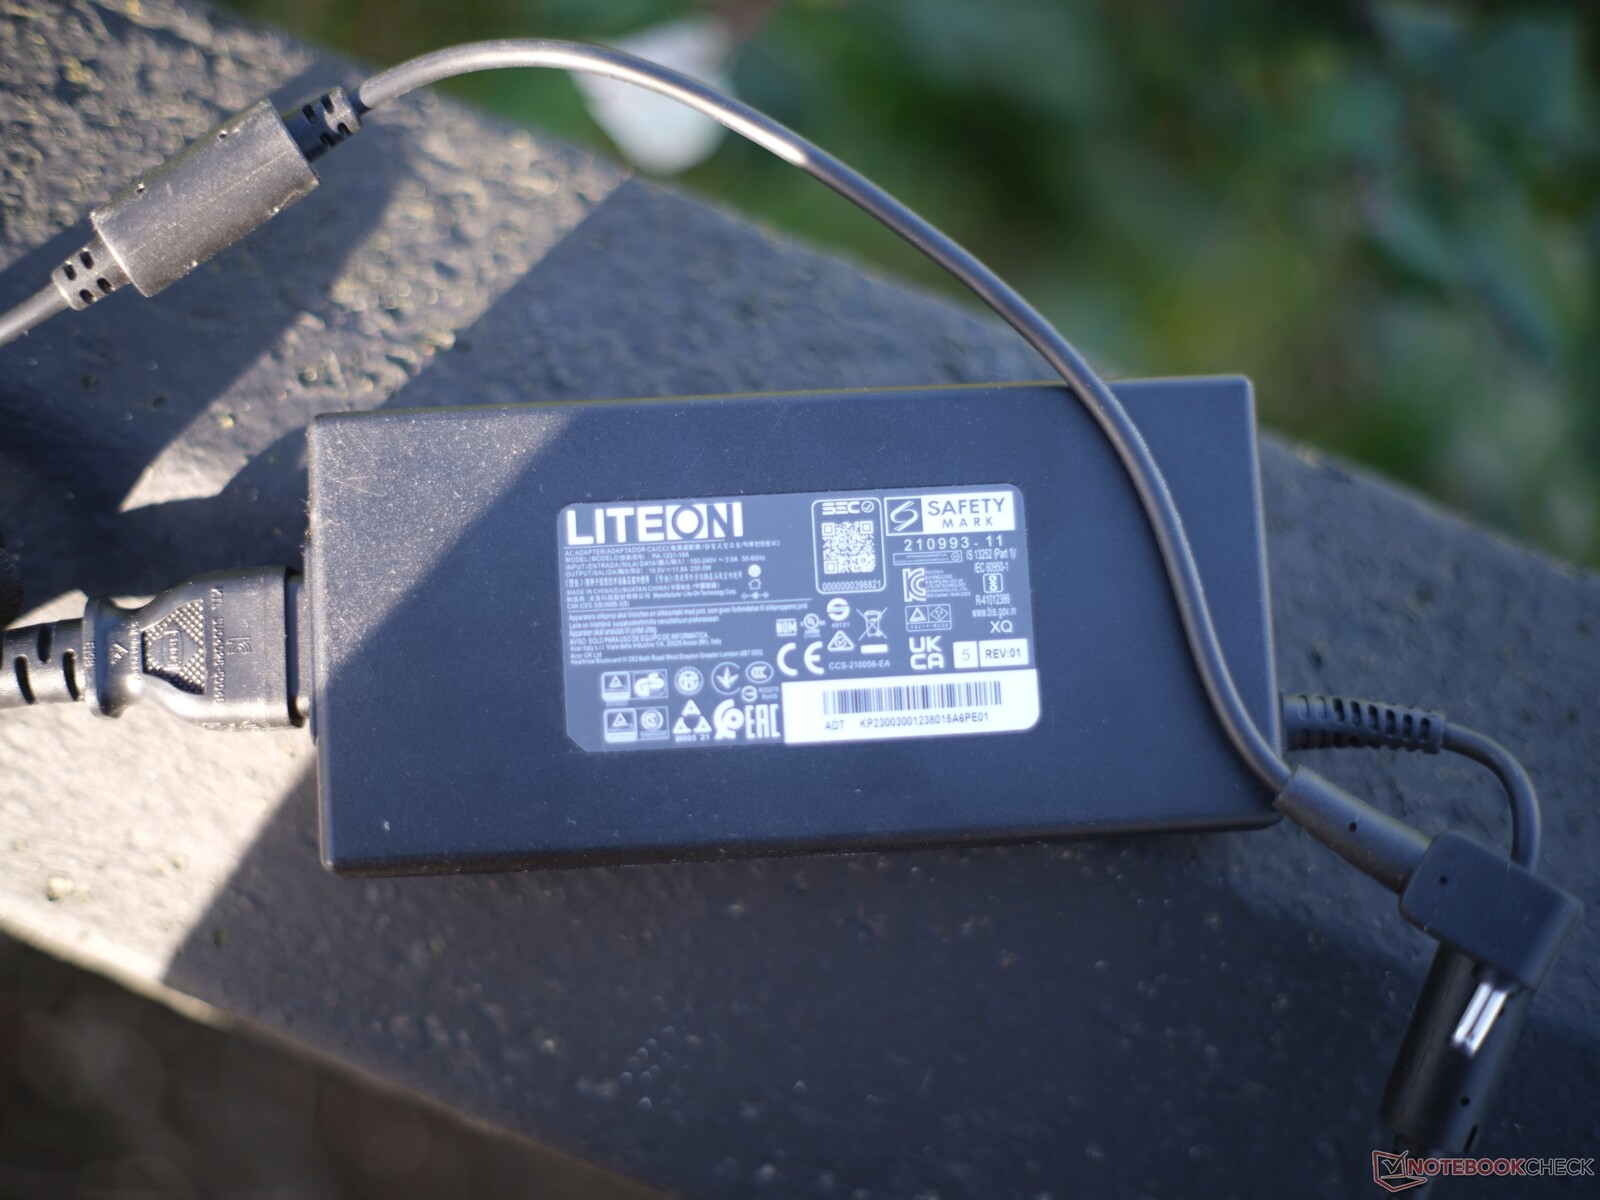
Aparte del propio aparato, el volumen de suministro del portátil sólo incluye una fuente de alimentación de 230 vatios. En general, nos hubiera gustado que se utilizara un embalaje más respetuoso con el medio ambiente, sin nada de plástico, aunque, al menos, los materiales utilizados son reciclados.
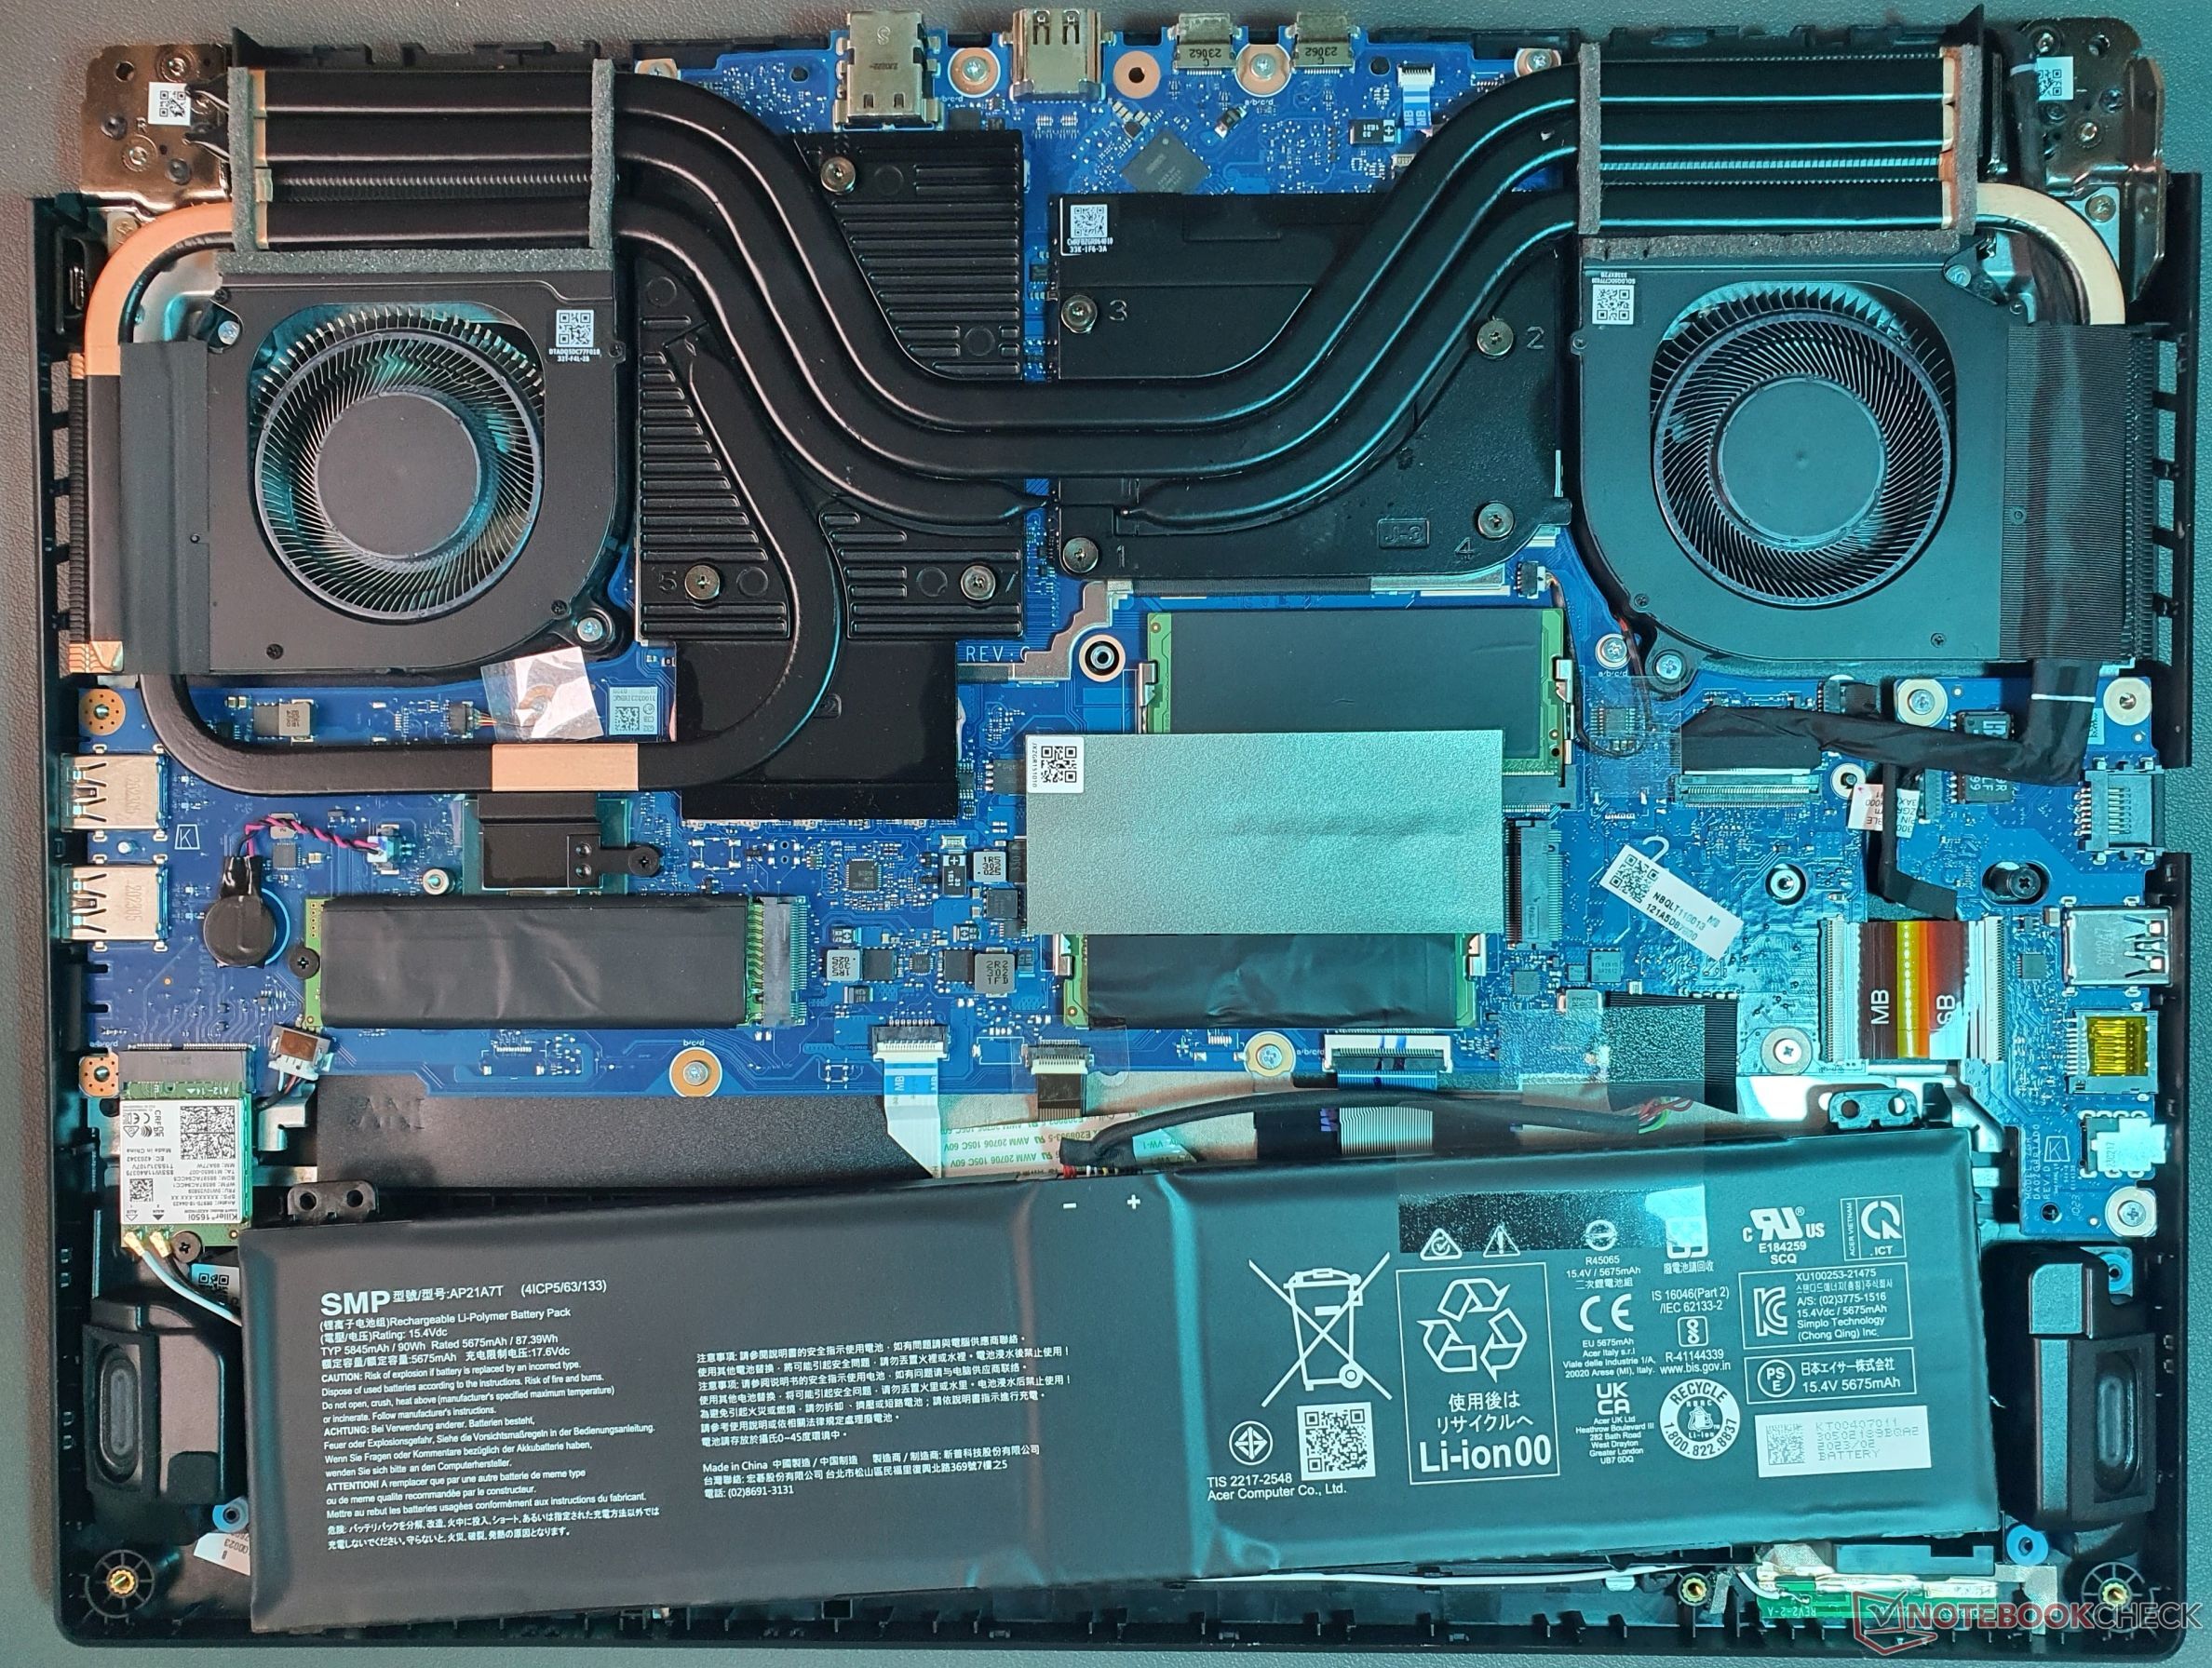
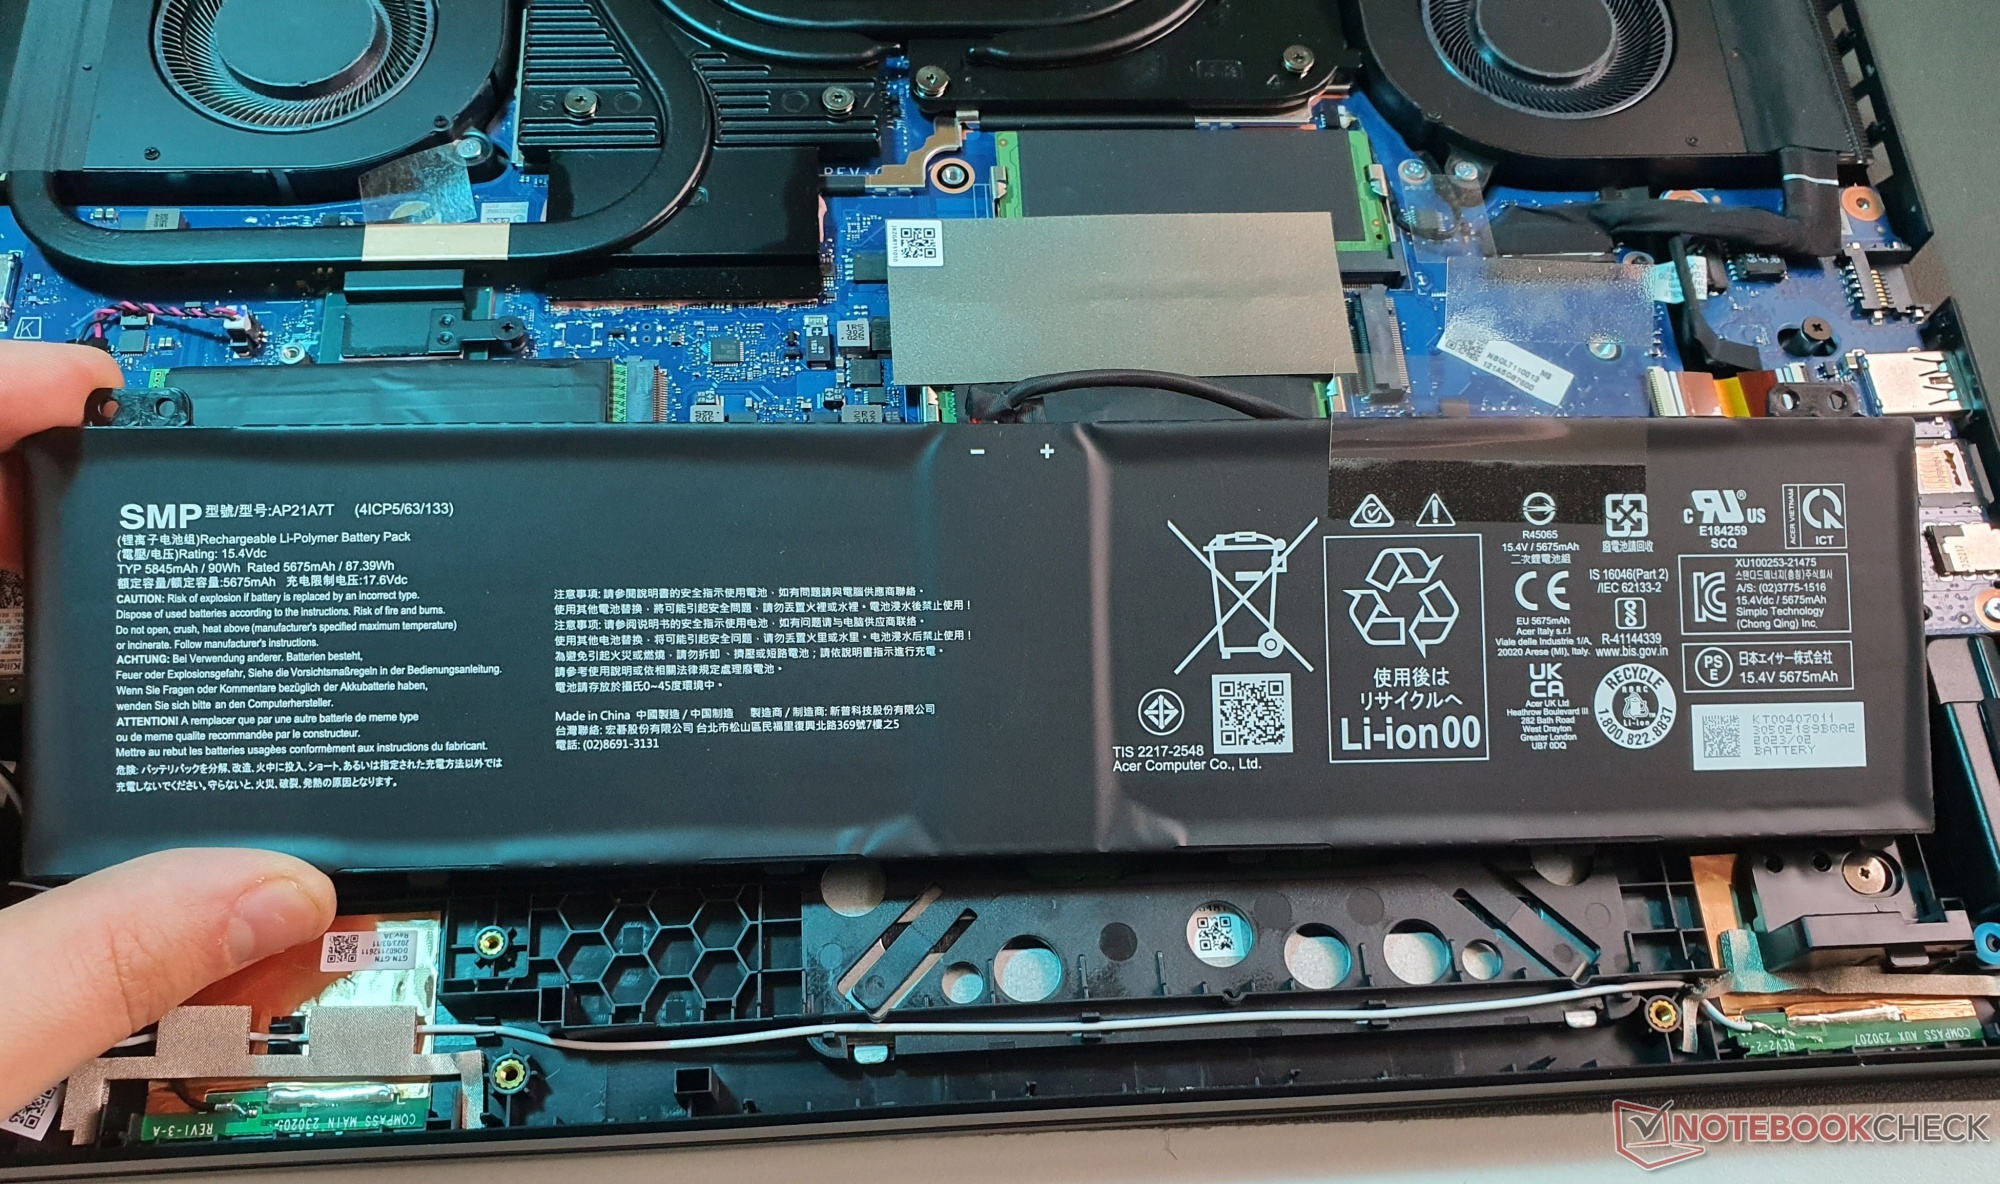
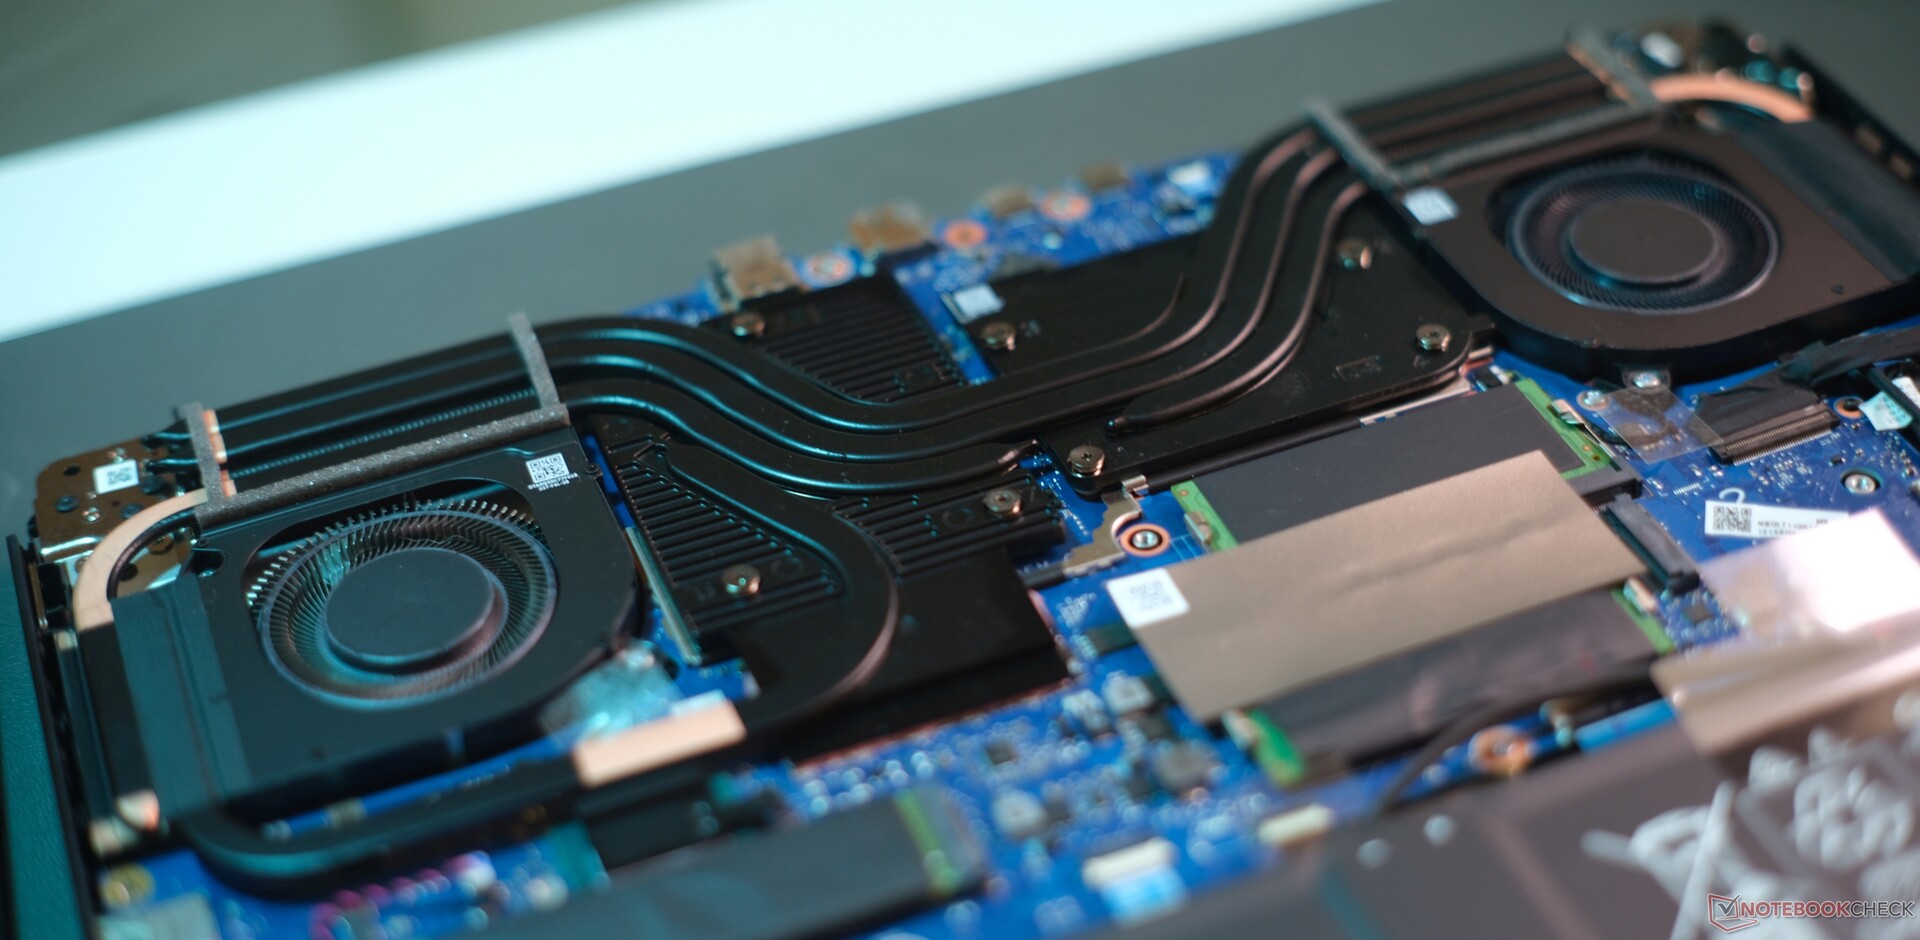
Mantenimiento
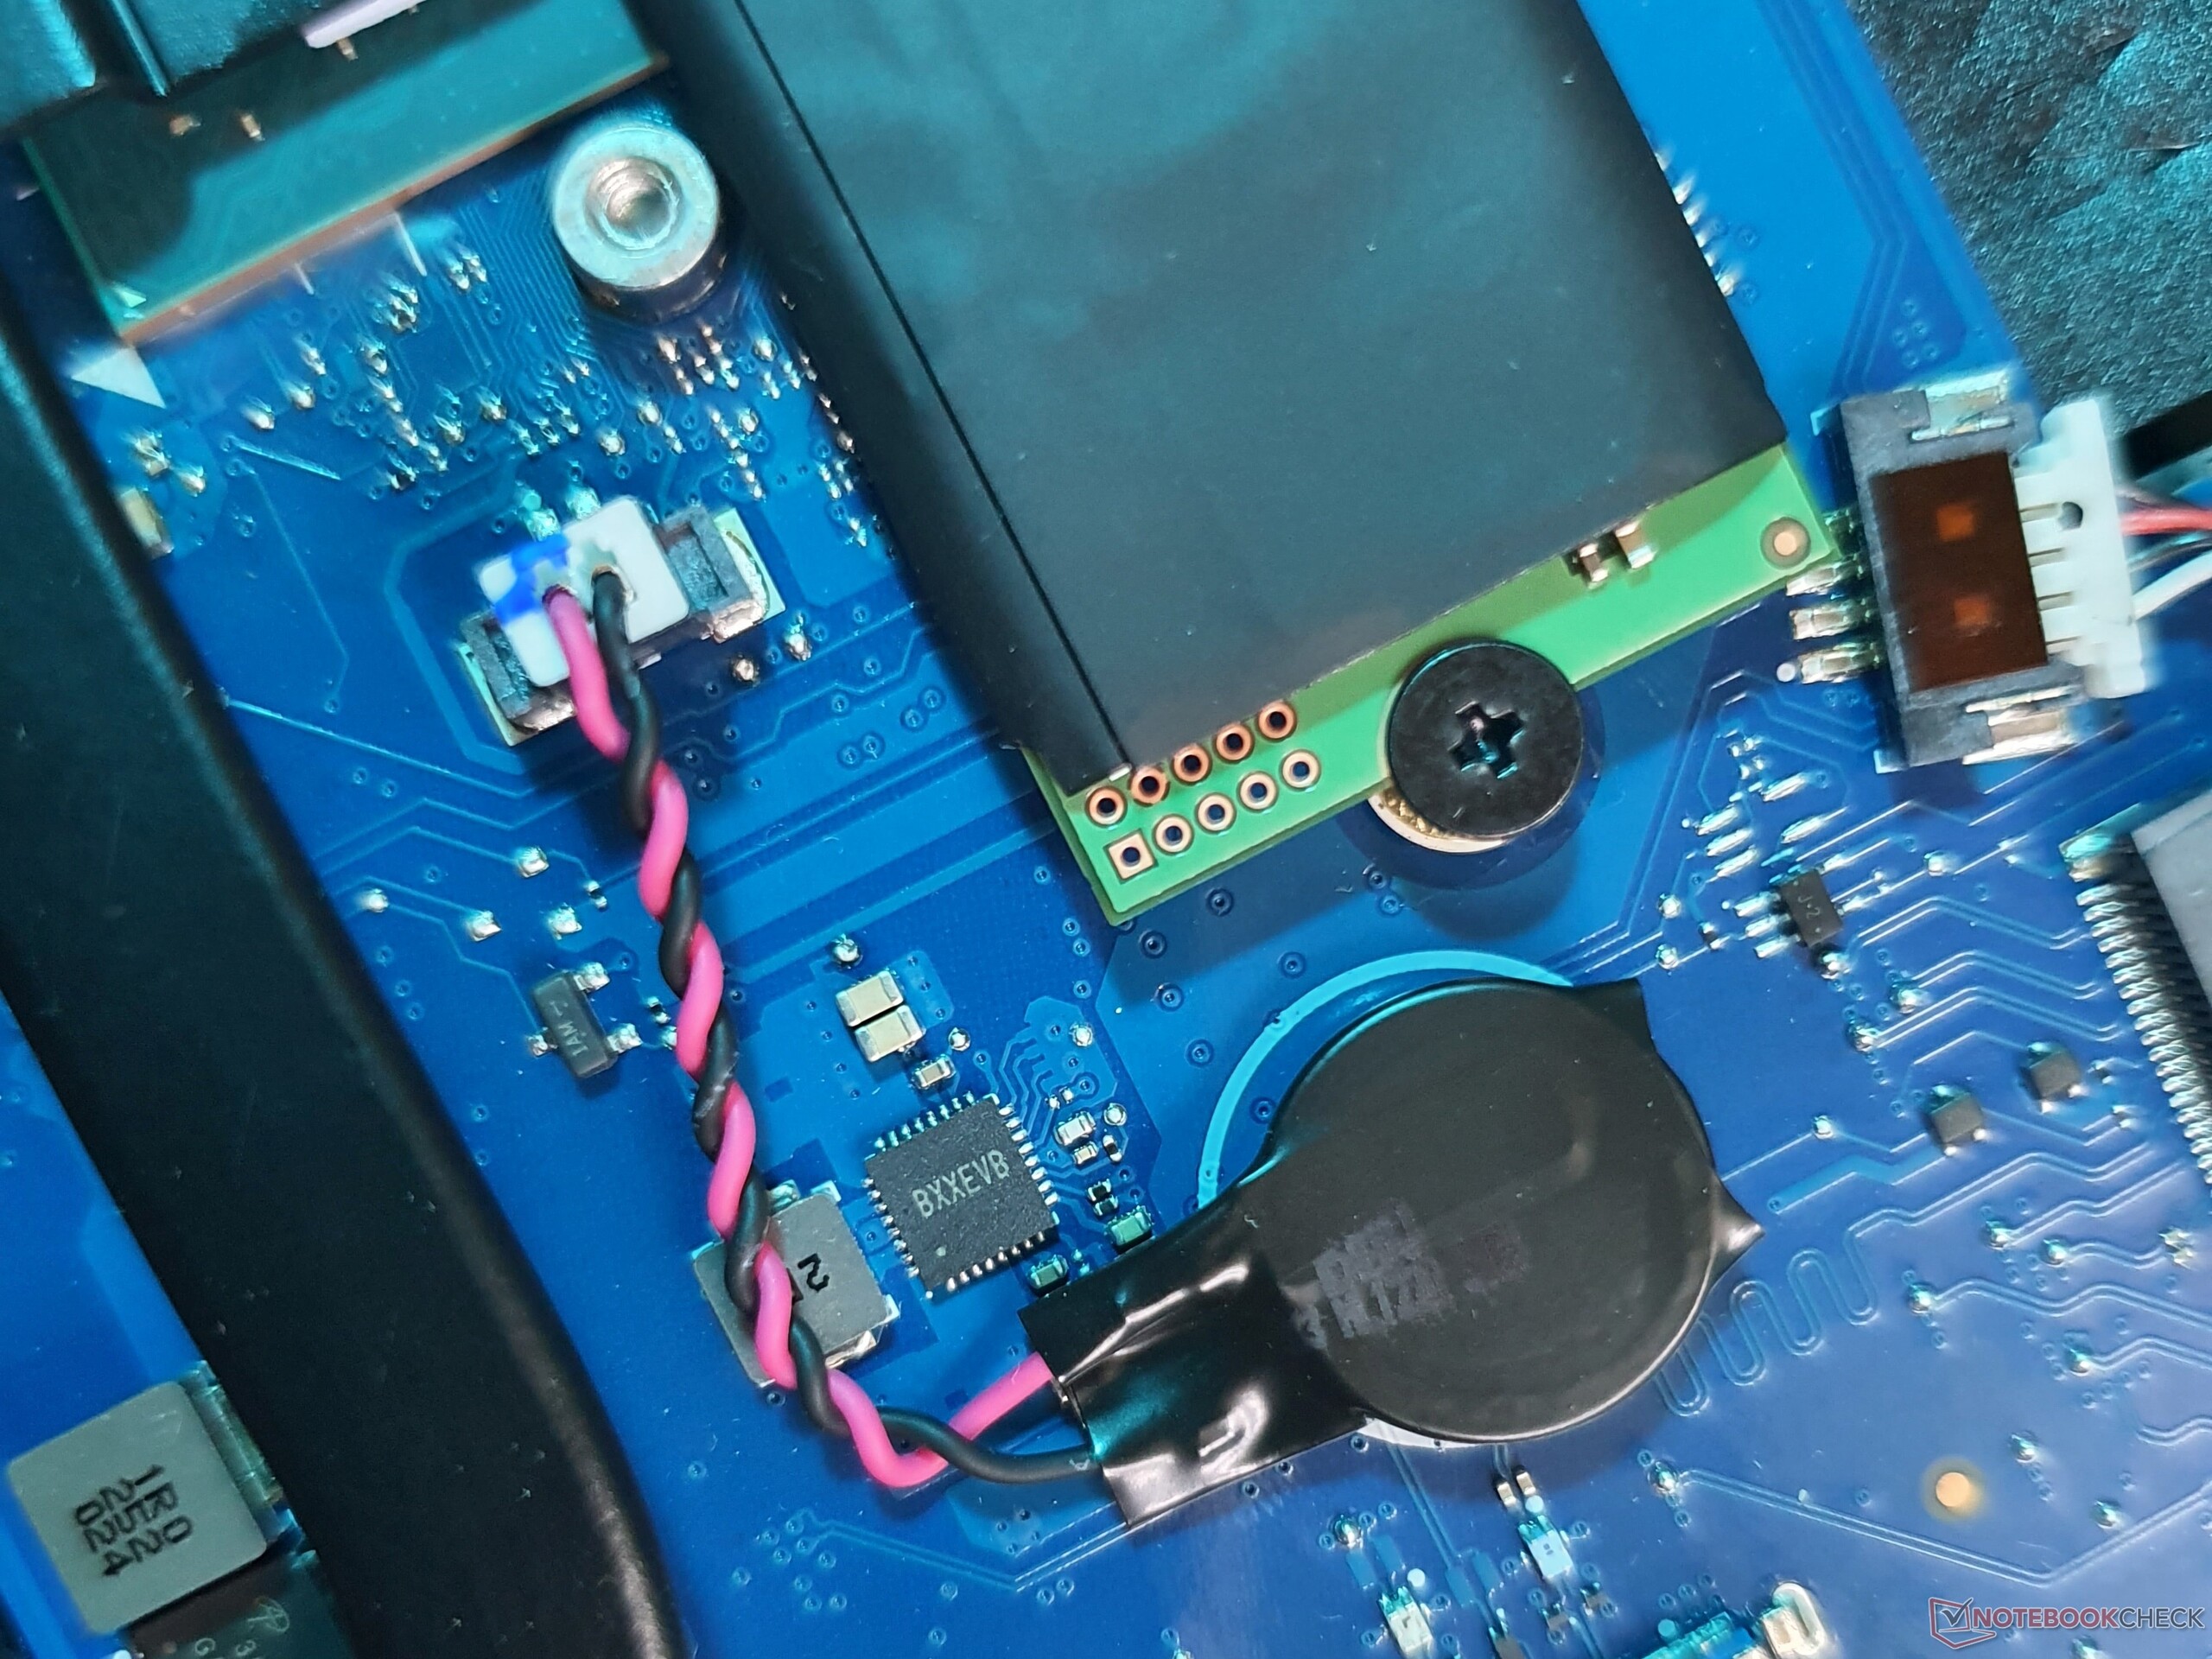
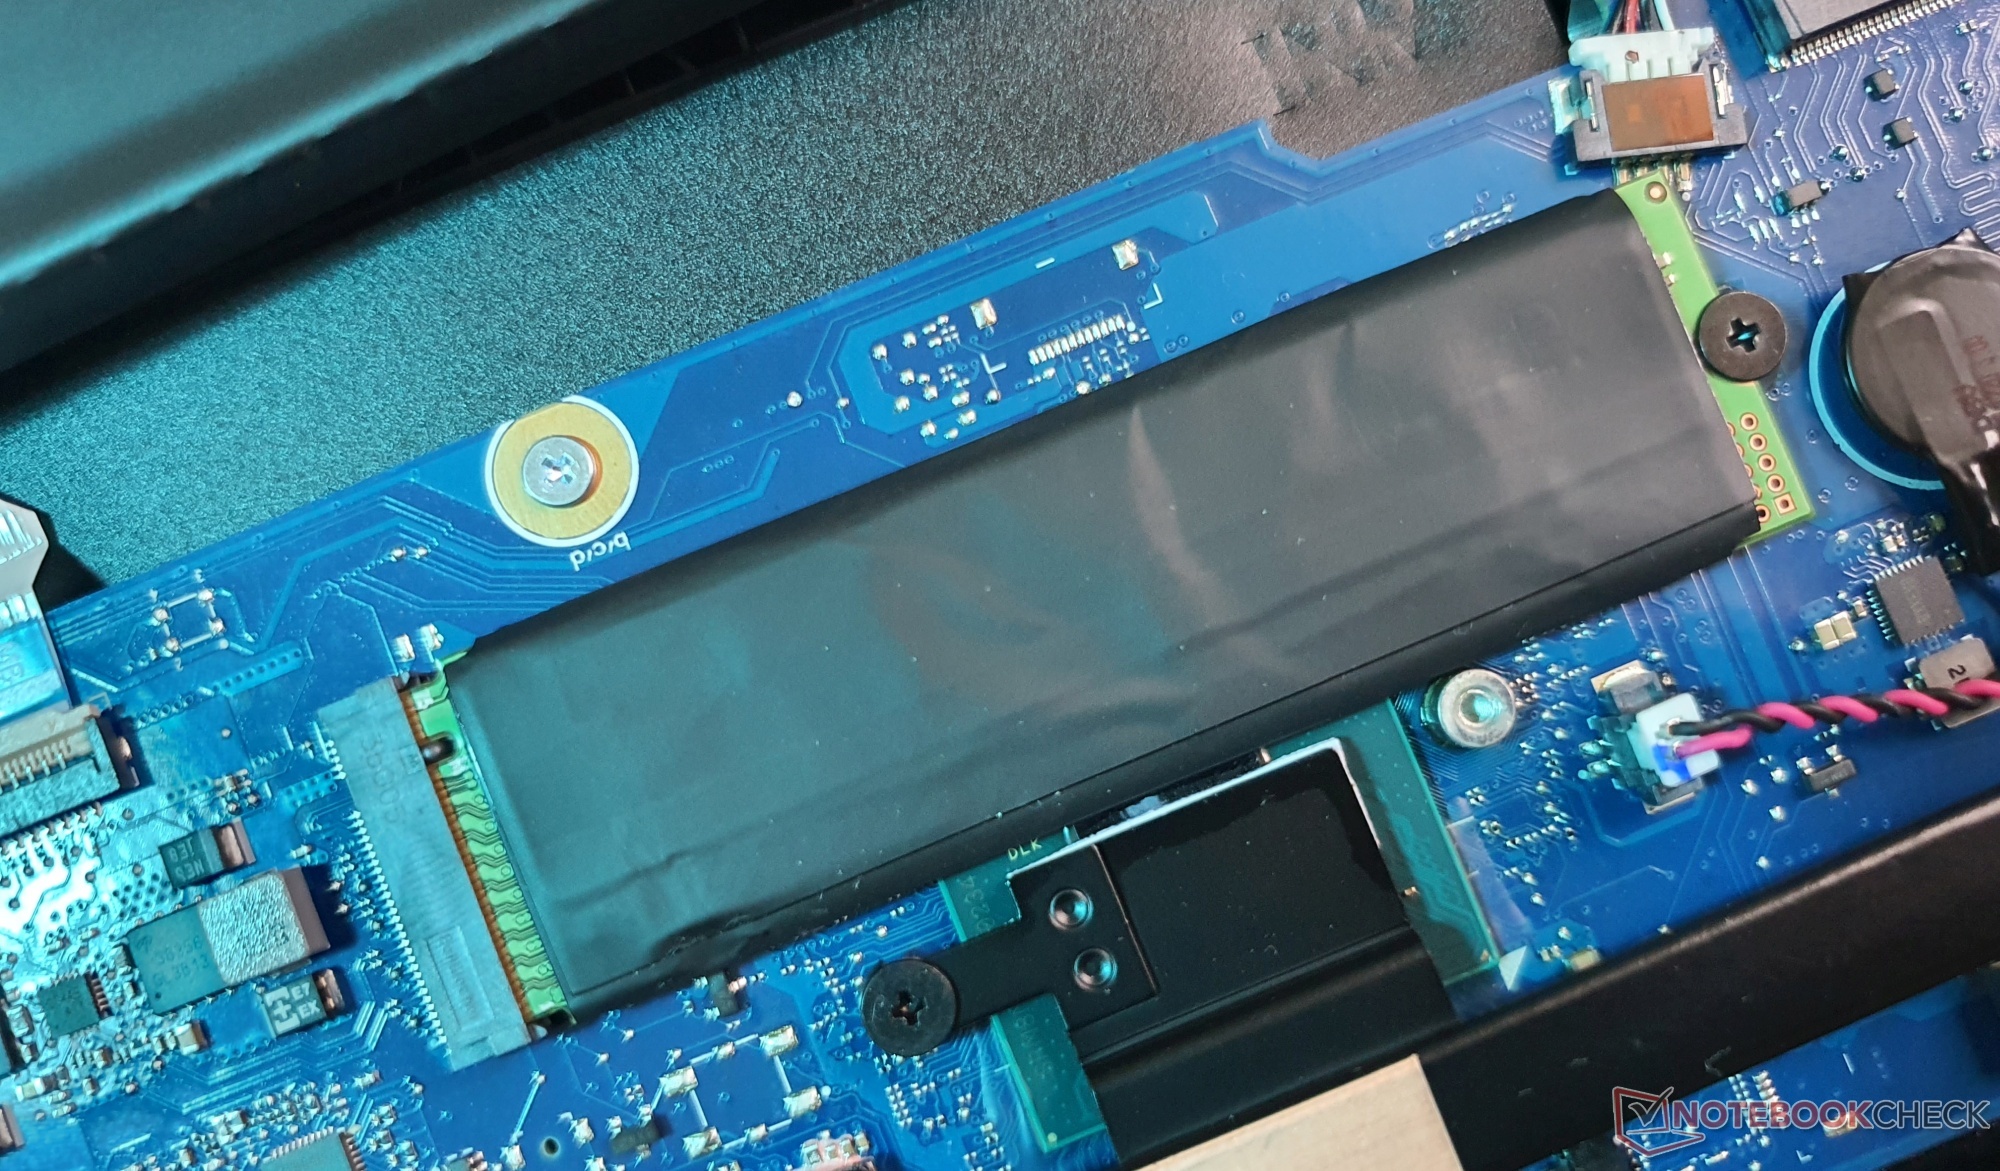
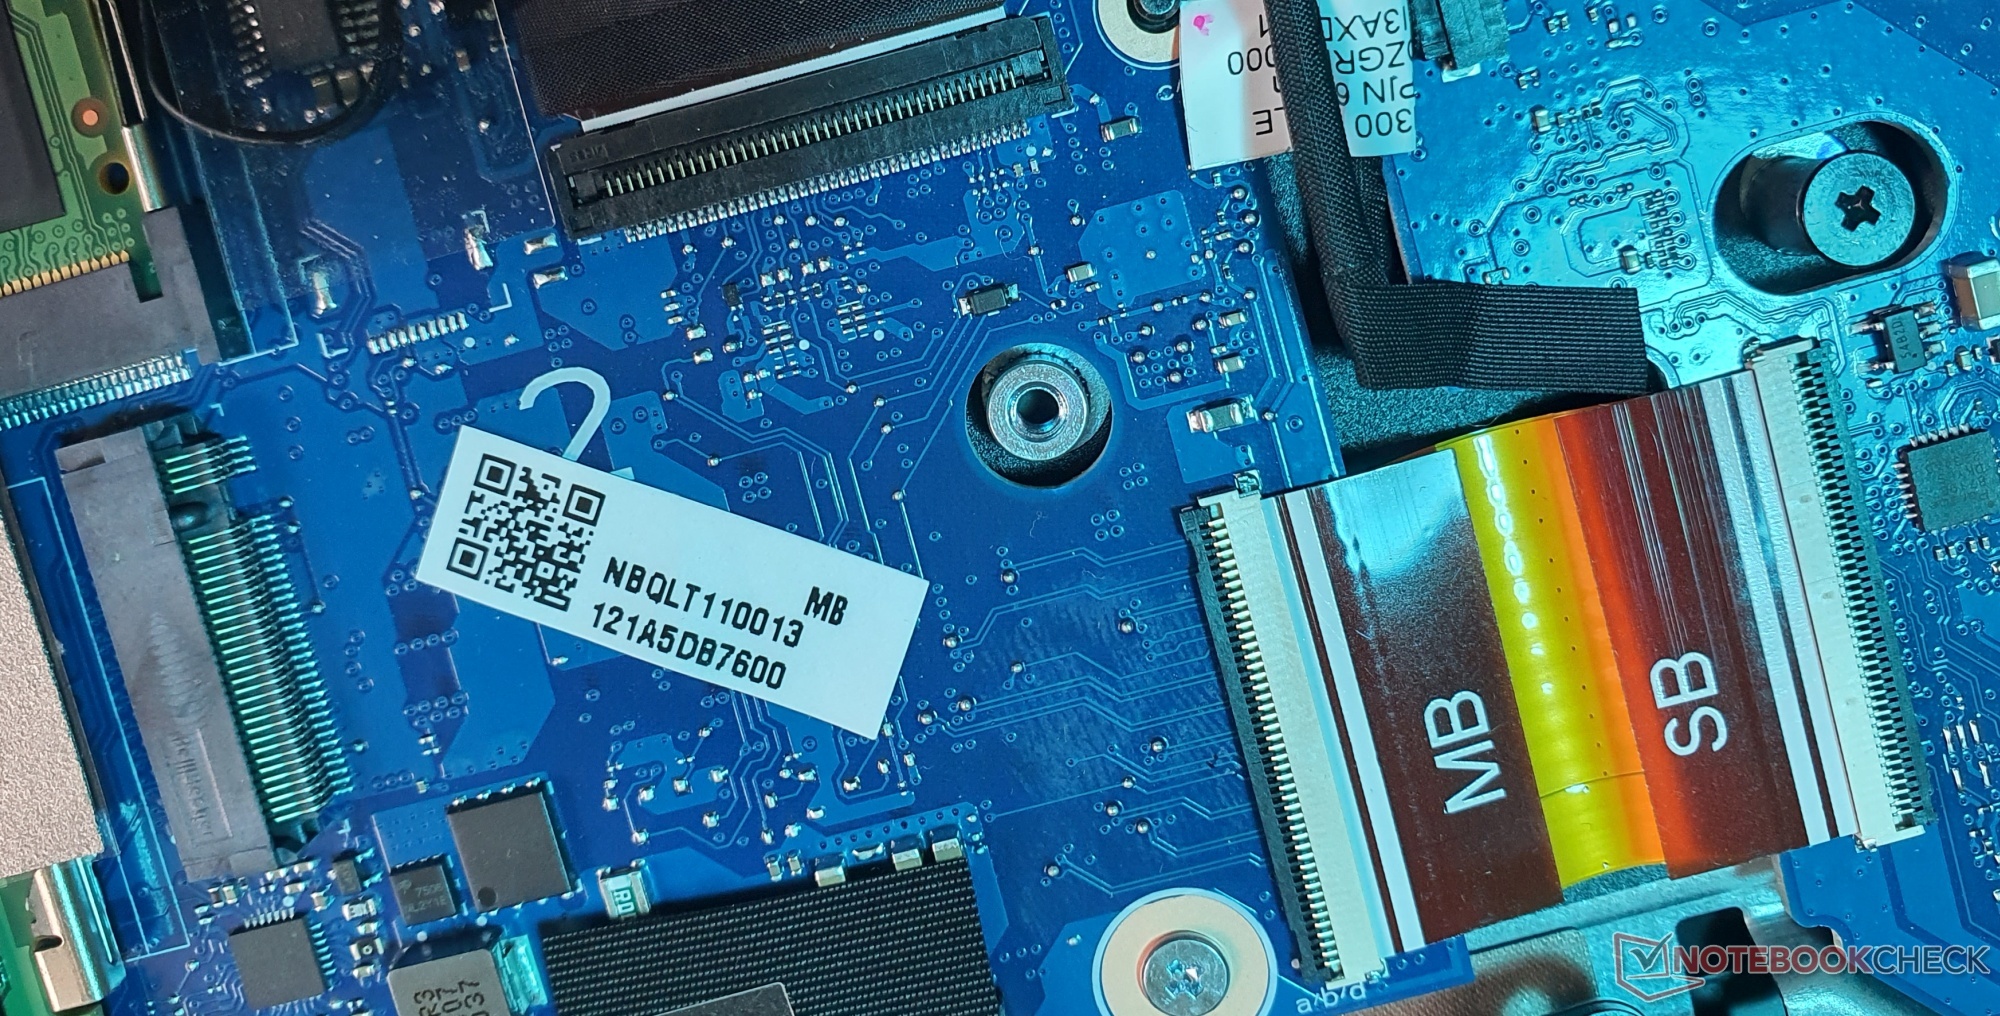
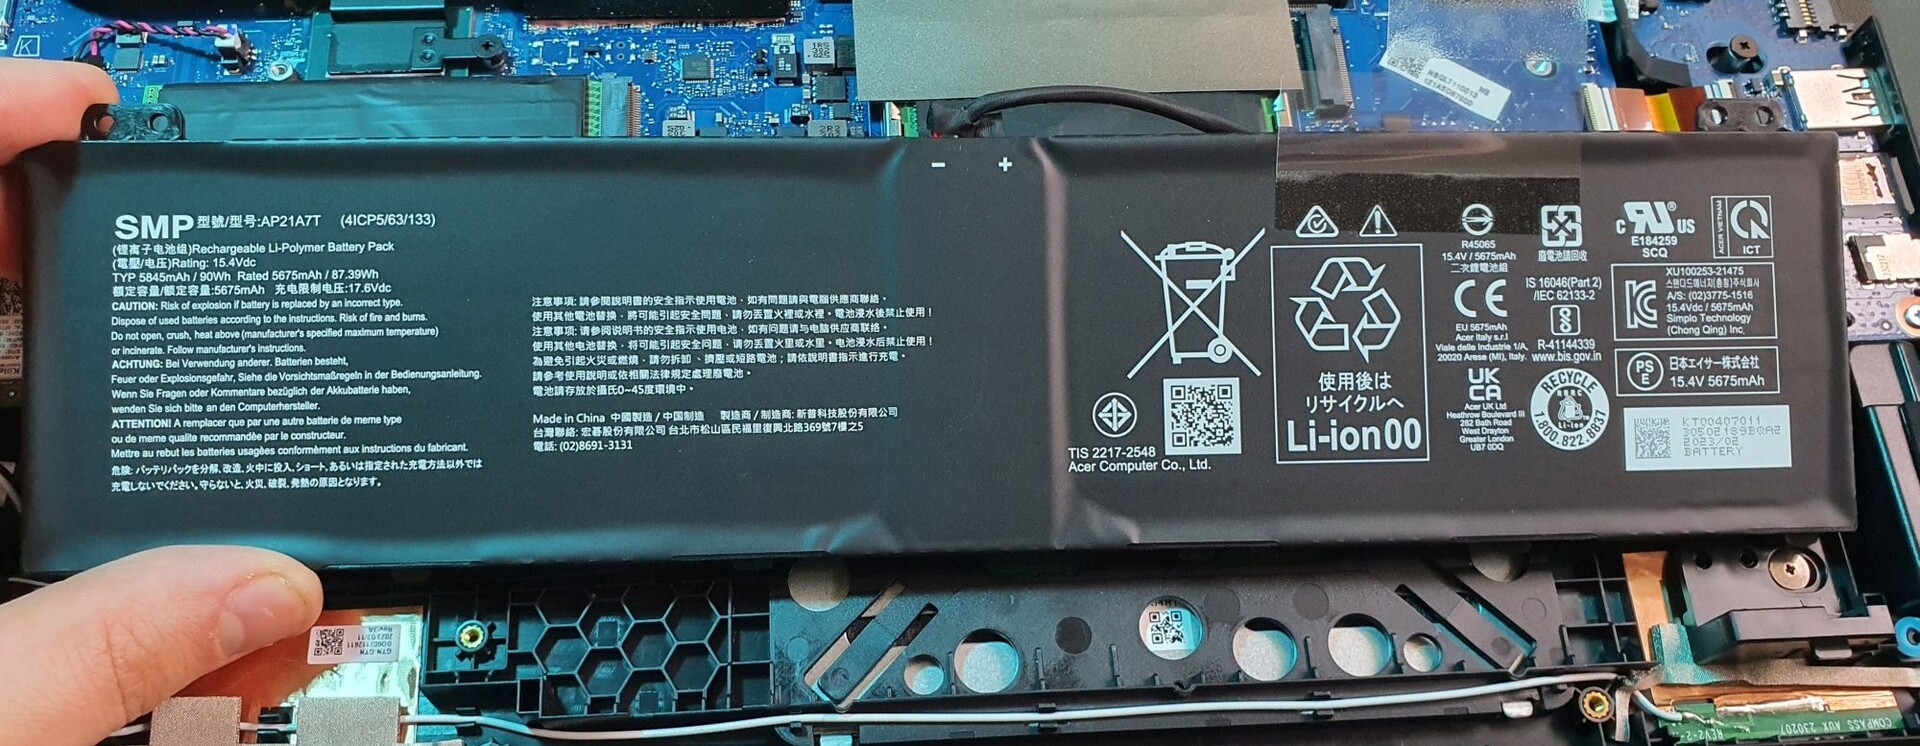
Tras retirar once tornillos Phillips, podrá acceder fácilmente al interior de la carcasa. Hay dos bancos de memoria y dos ranuras M.2-2280, que también admiten SSD instaladas en ambos lados. También se pueden sustituir el chip WiFi y la batería de la BIOS. La batería se mantiene en su sitio gracias a los tornillos de la caja y a la carcasa inferior, por lo que inicialmente parece que está suelta en la caja.
Garantía
Acer ofrece al portátil una garantía limitada de un año, con planes de servicio ampliados disponibles a través de Acer Care Plus.
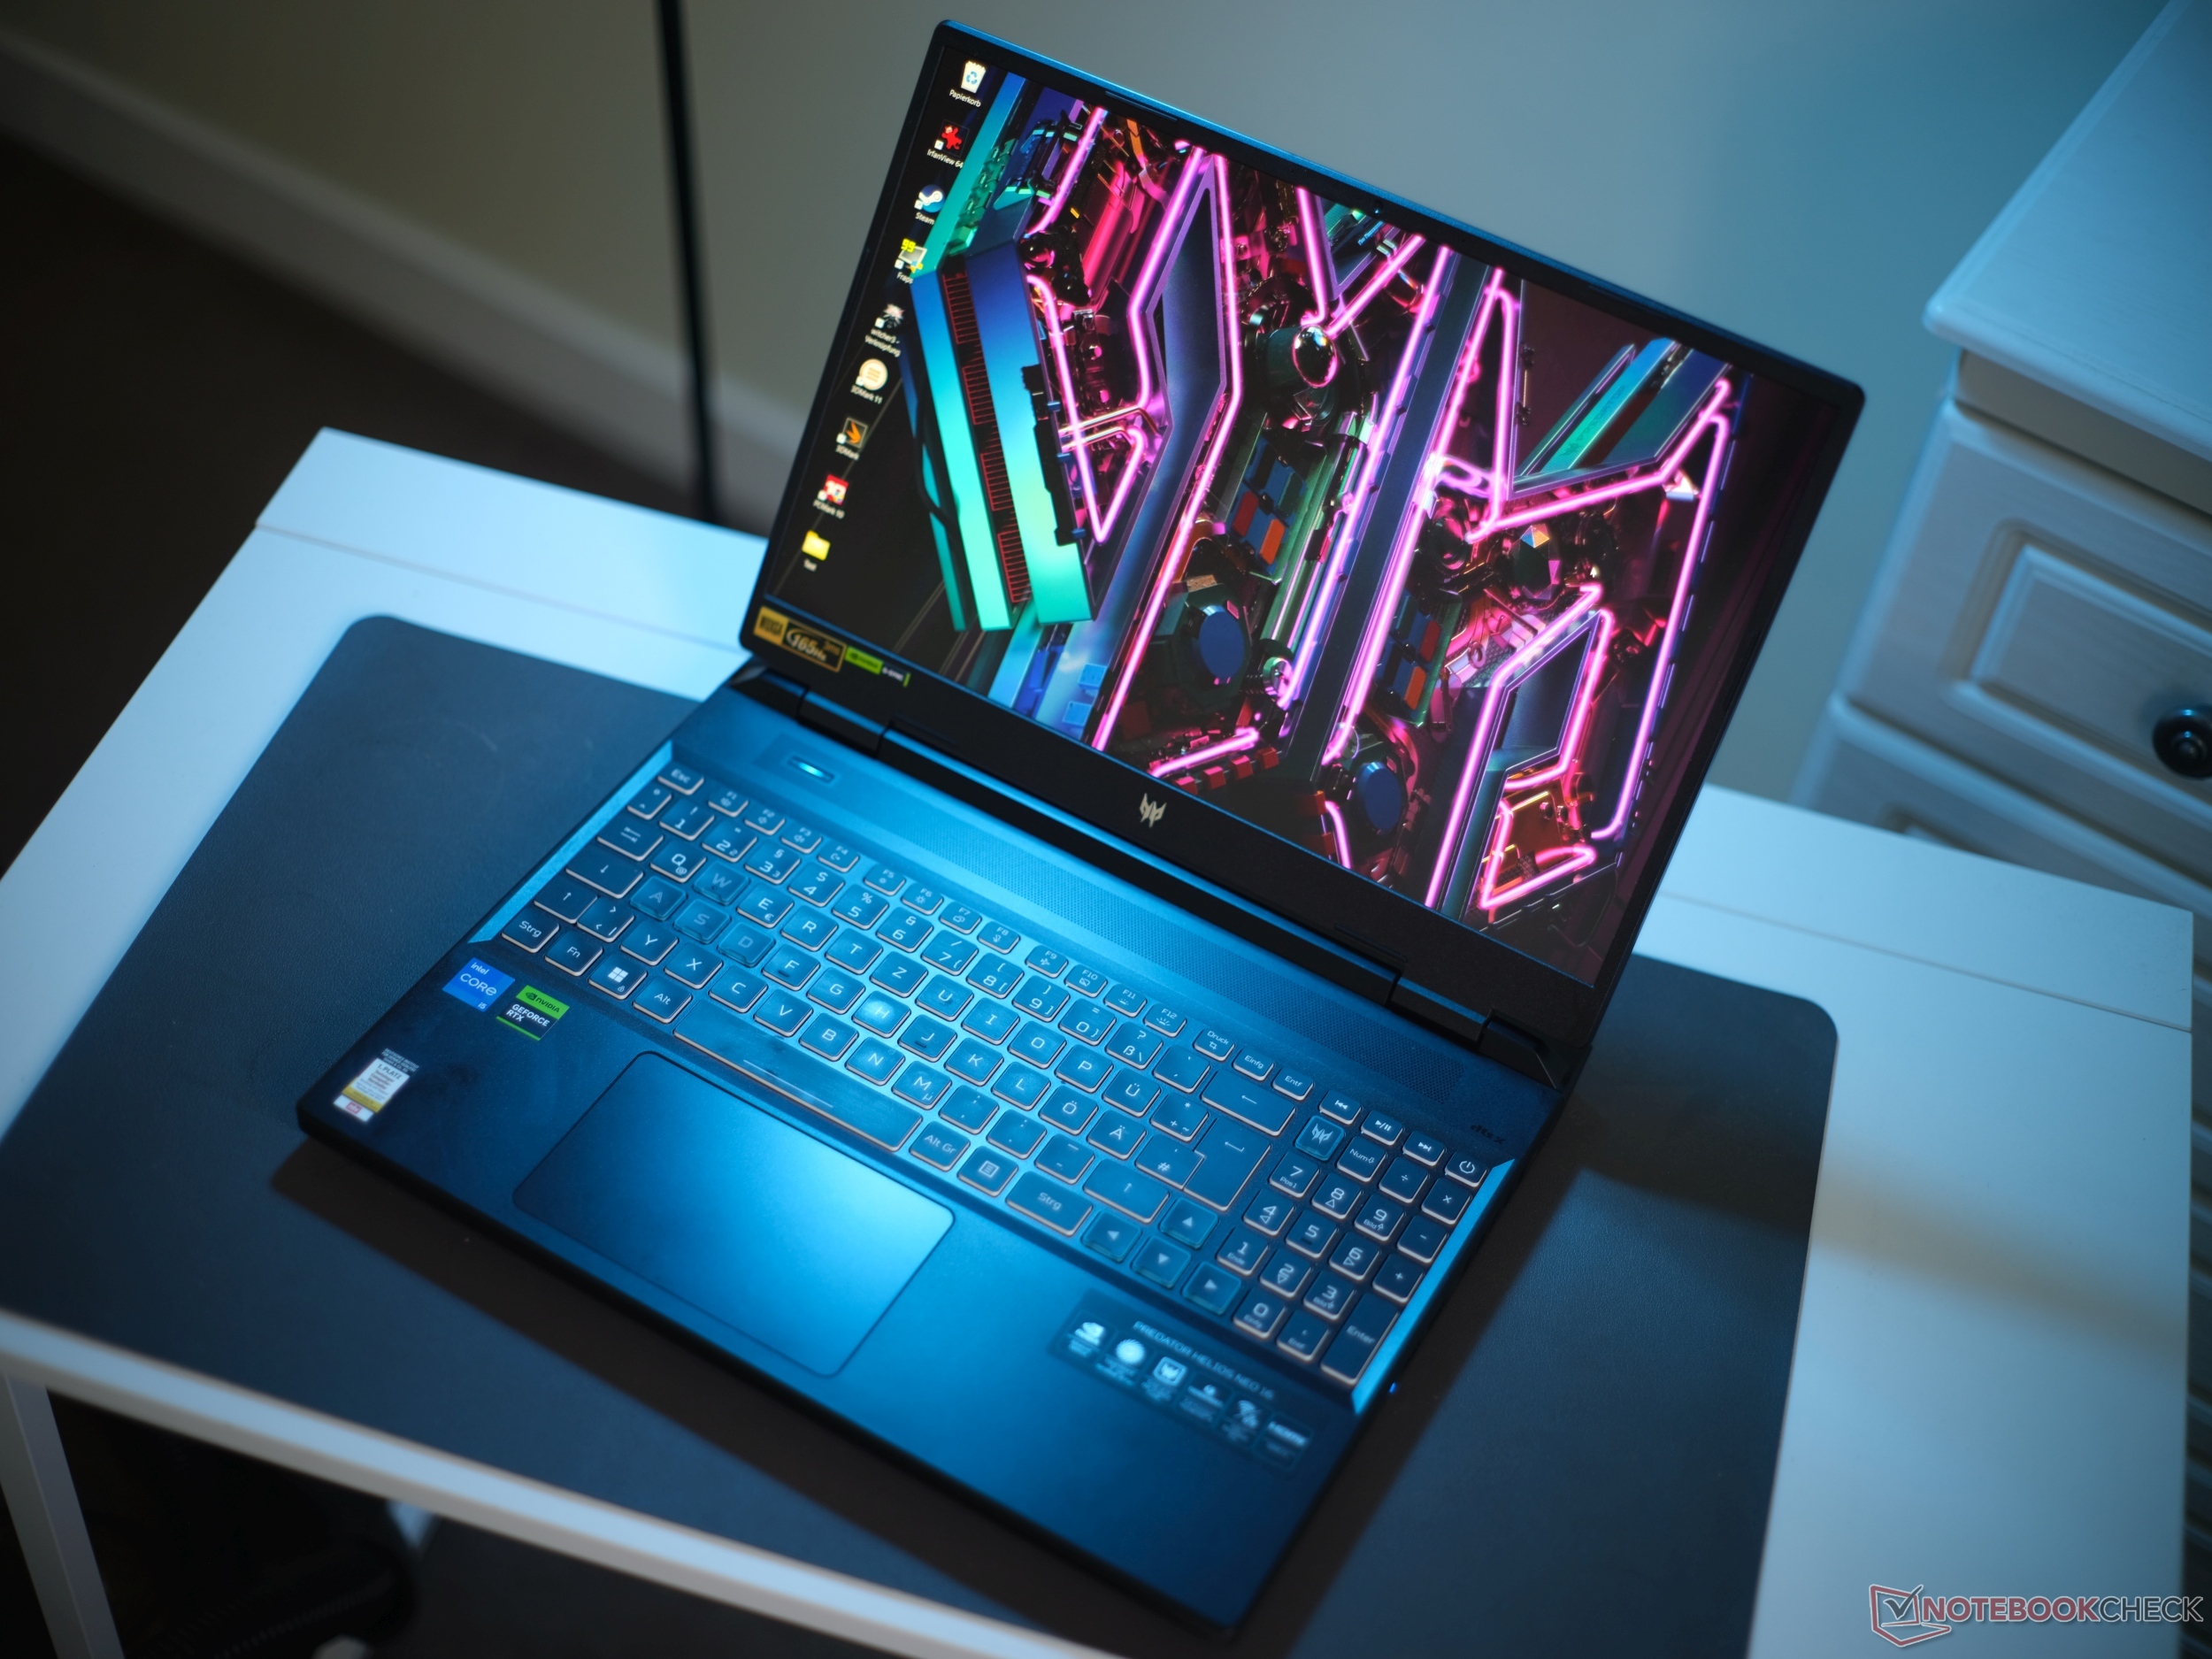
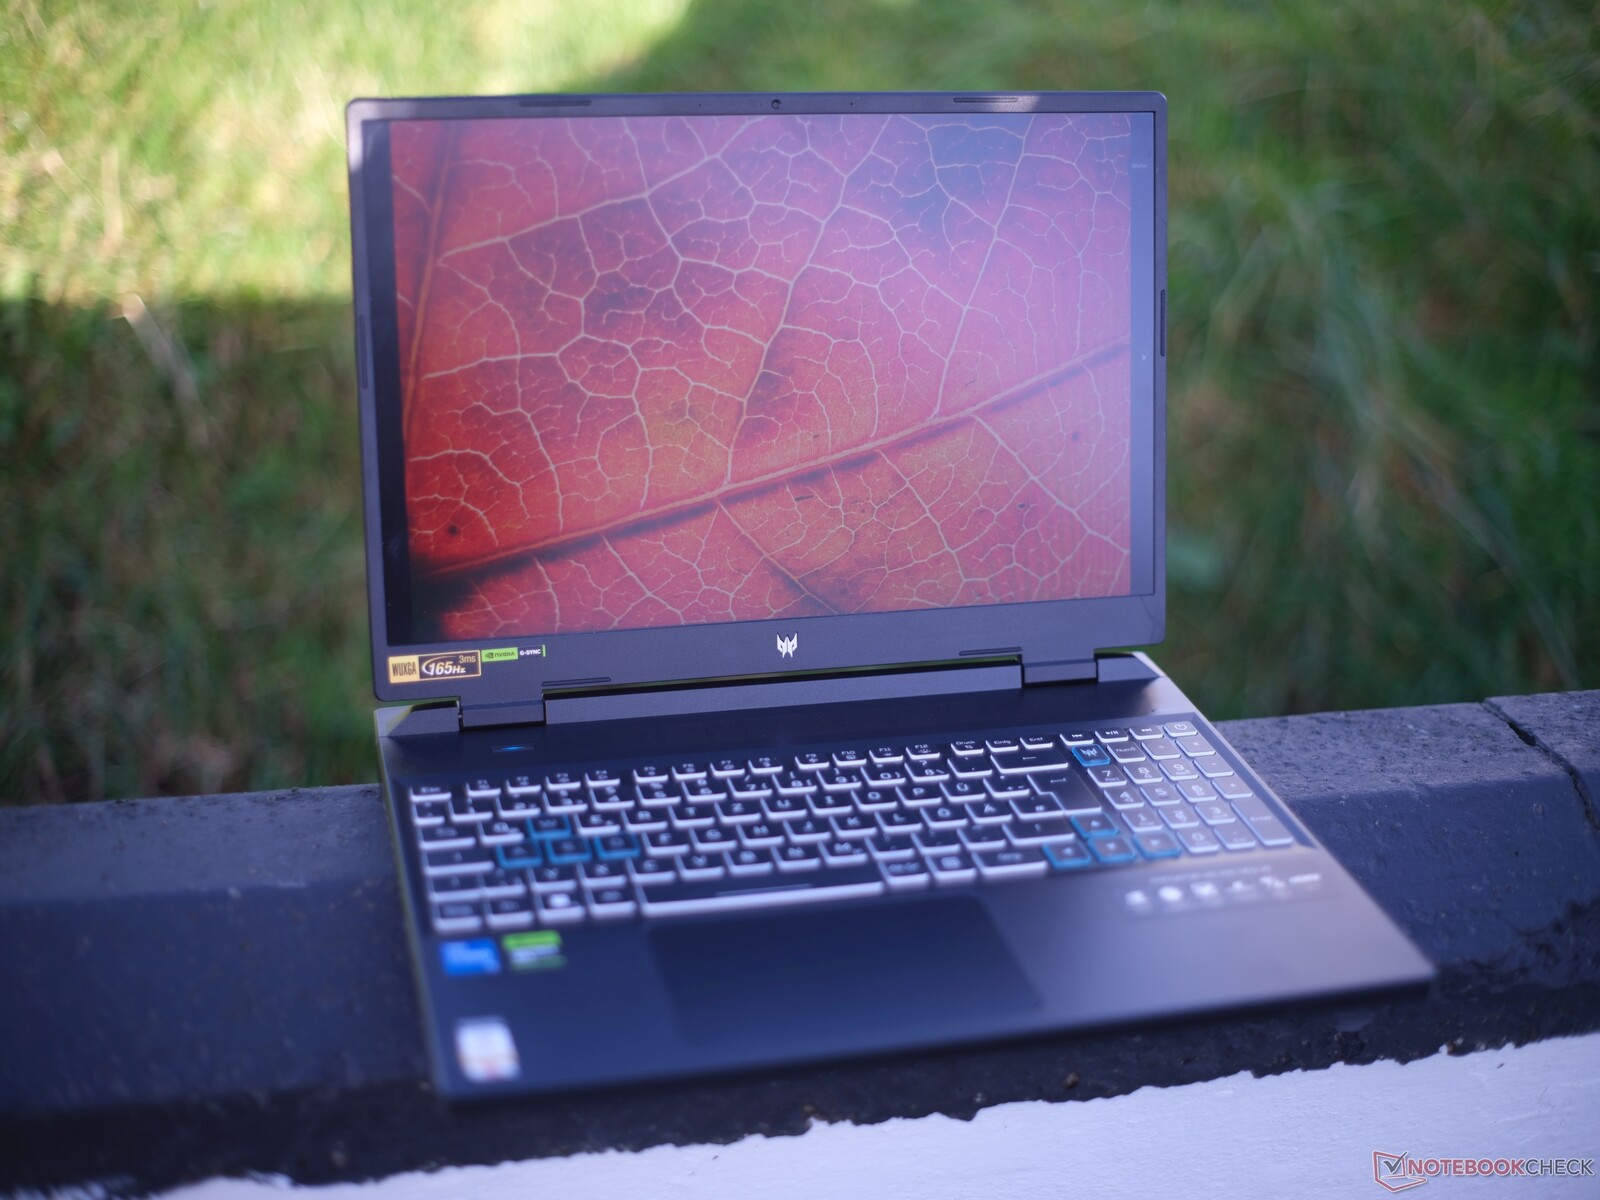
Input devices: Solid standard features with four-zone RGB lighting
Teclado
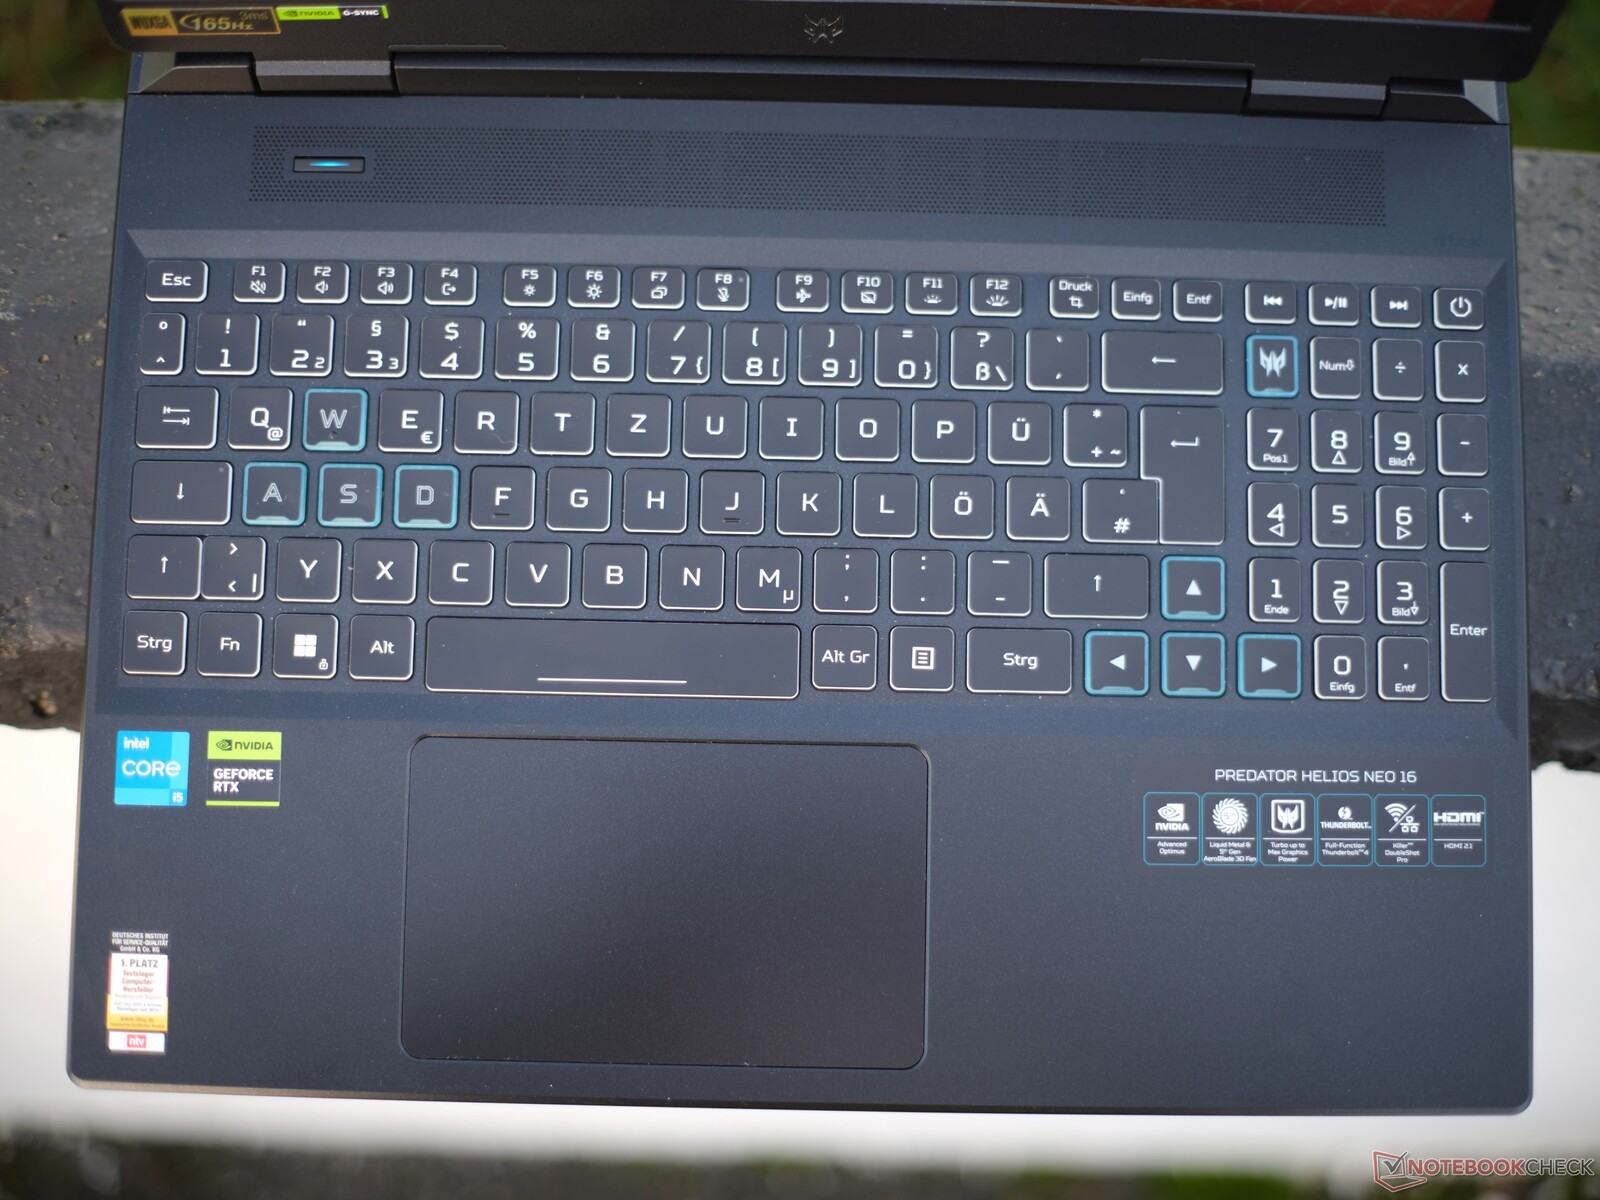
Acer ha instalado en este dispositivo un teclado chiclet de 6 filas con teclas suficientemente grandes y espaciadas. No tiene casi nada en común con el teclado del Helios 16, pero es similar en mecánica y aspecto a los teclados de muchos portátiles de juego económicos, como elXMG Apex 15,Gigabyte G5oPortátiles para juegos Captiva Advanced. Es exactamente igual que en el Acer Nitro 16.
Su generosa elevación de tecla de 1,5 mm va acompañada de un punto de presión claramente perceptible. Sin embargo, la resistencia de las teclas podría haber sido un poco más clara. El teclado se deforma ligeramente al escribir (lo que, por cierto, es muy silencioso), pero esto no es un problema en el uso diario. La distribución es realmente bastante agradable, pero la tecla de mayúsculas derecha es un poco demasiado pequeña debido a que las teclas de dirección son de tamaño normal, mientras que la tecla de mayúsculas izquierda es aún más pequeña.
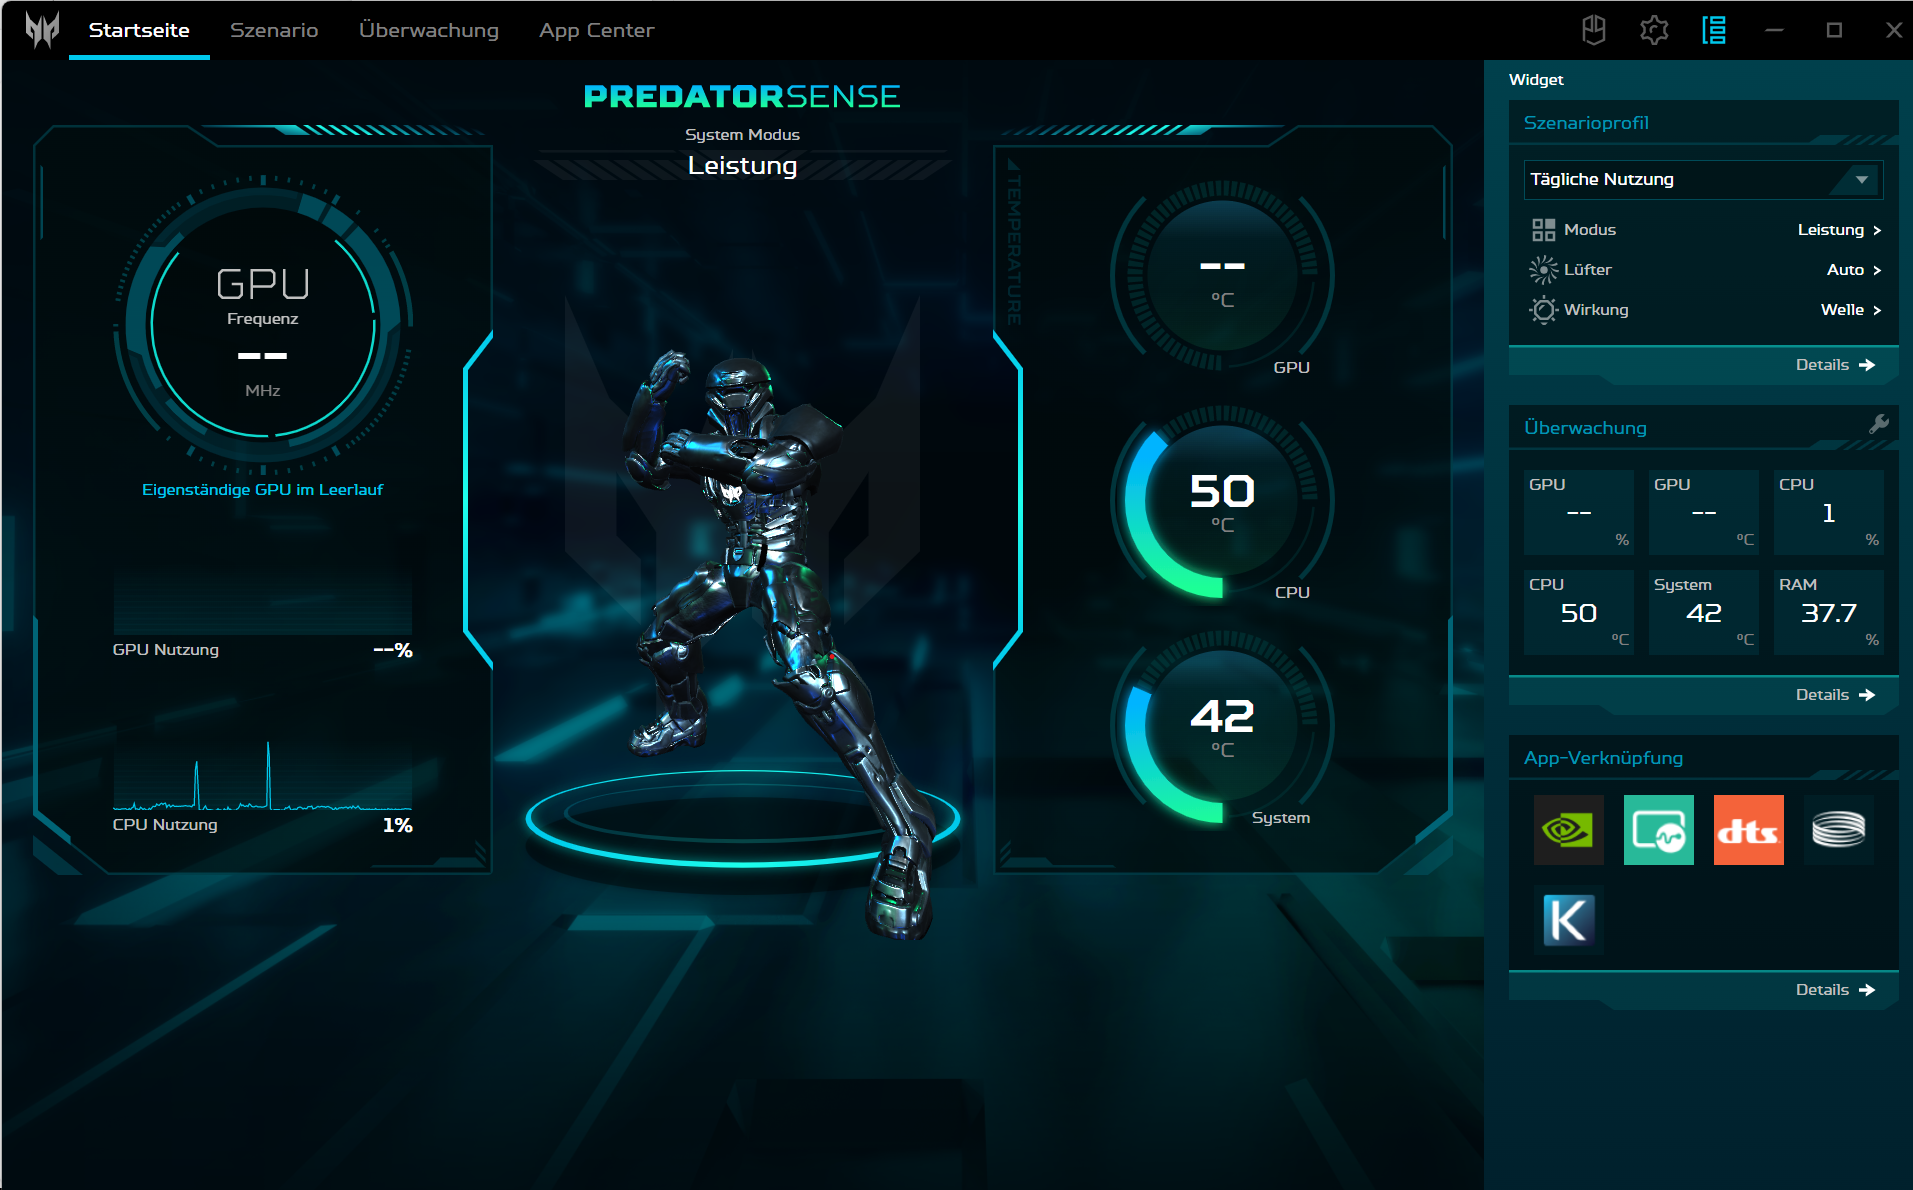
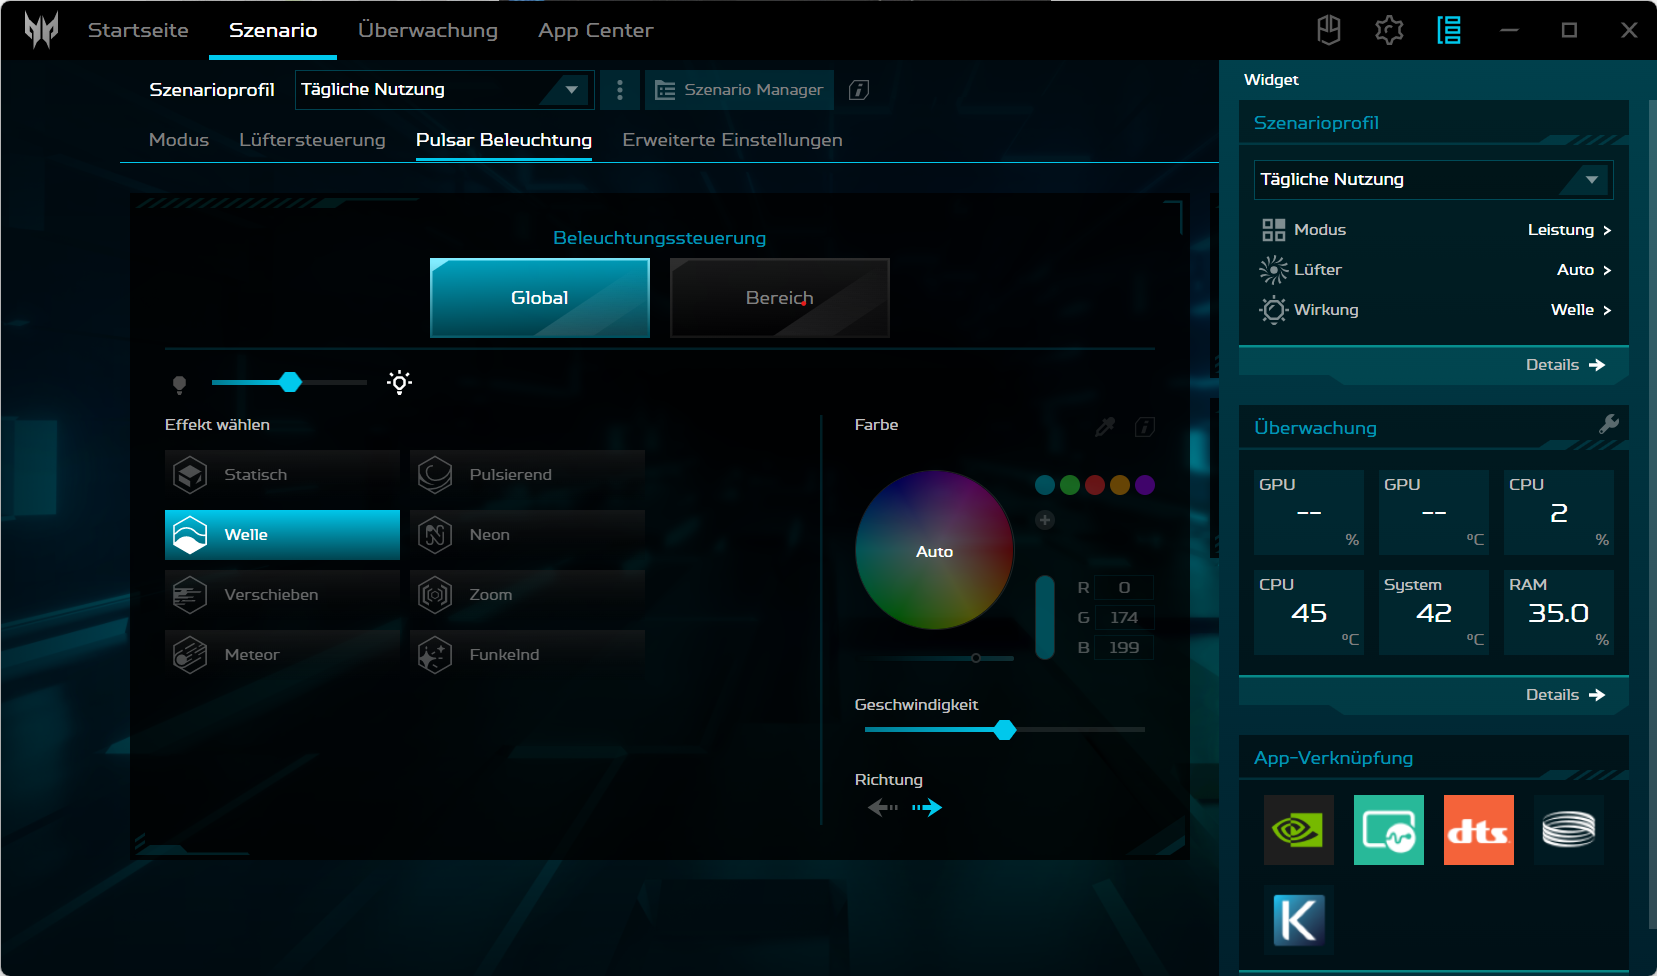
Acer ha dotado a este teclado de una iluminación RGB de cuatro zonas con cuatro niveles de intensidad, mientras que la versión no Neo tiene una iluminación micro-LED especialmente uniforme. Mientras que el botón del logotipo en el teclado numérico inicia la aplicación Predator Sense, el botón permanentemente iluminado en la parte superior izquierda se utiliza para cambiar entre los modos de rendimiento.
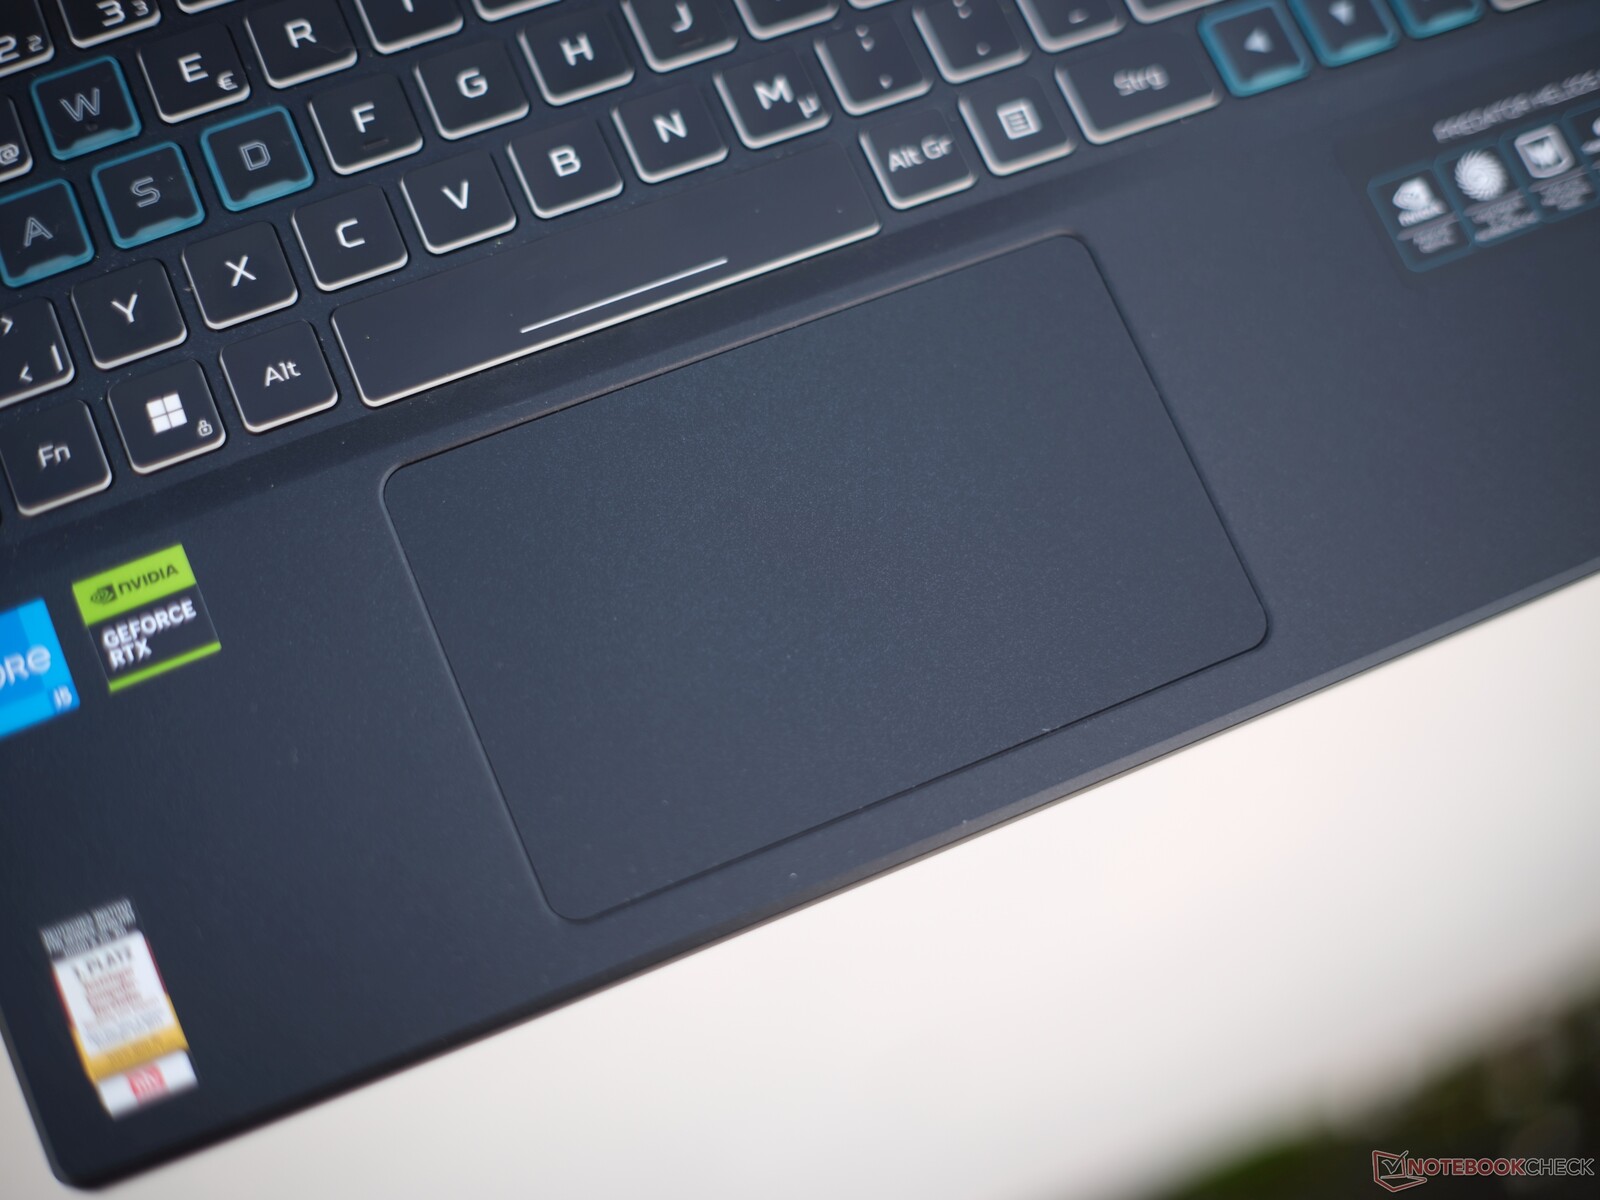
Panel táctil
El touchpad de 12,6 x 8,3 mm funciona con mucha precisión y es agradable y suave, aunque está hecho de plástico y no de cristal como elHelios 16. Es fácil desplazarse y realizar gestos multitáctiles. Los botones de clic integrados tienen una elevación corta y un clic satisfactorio.
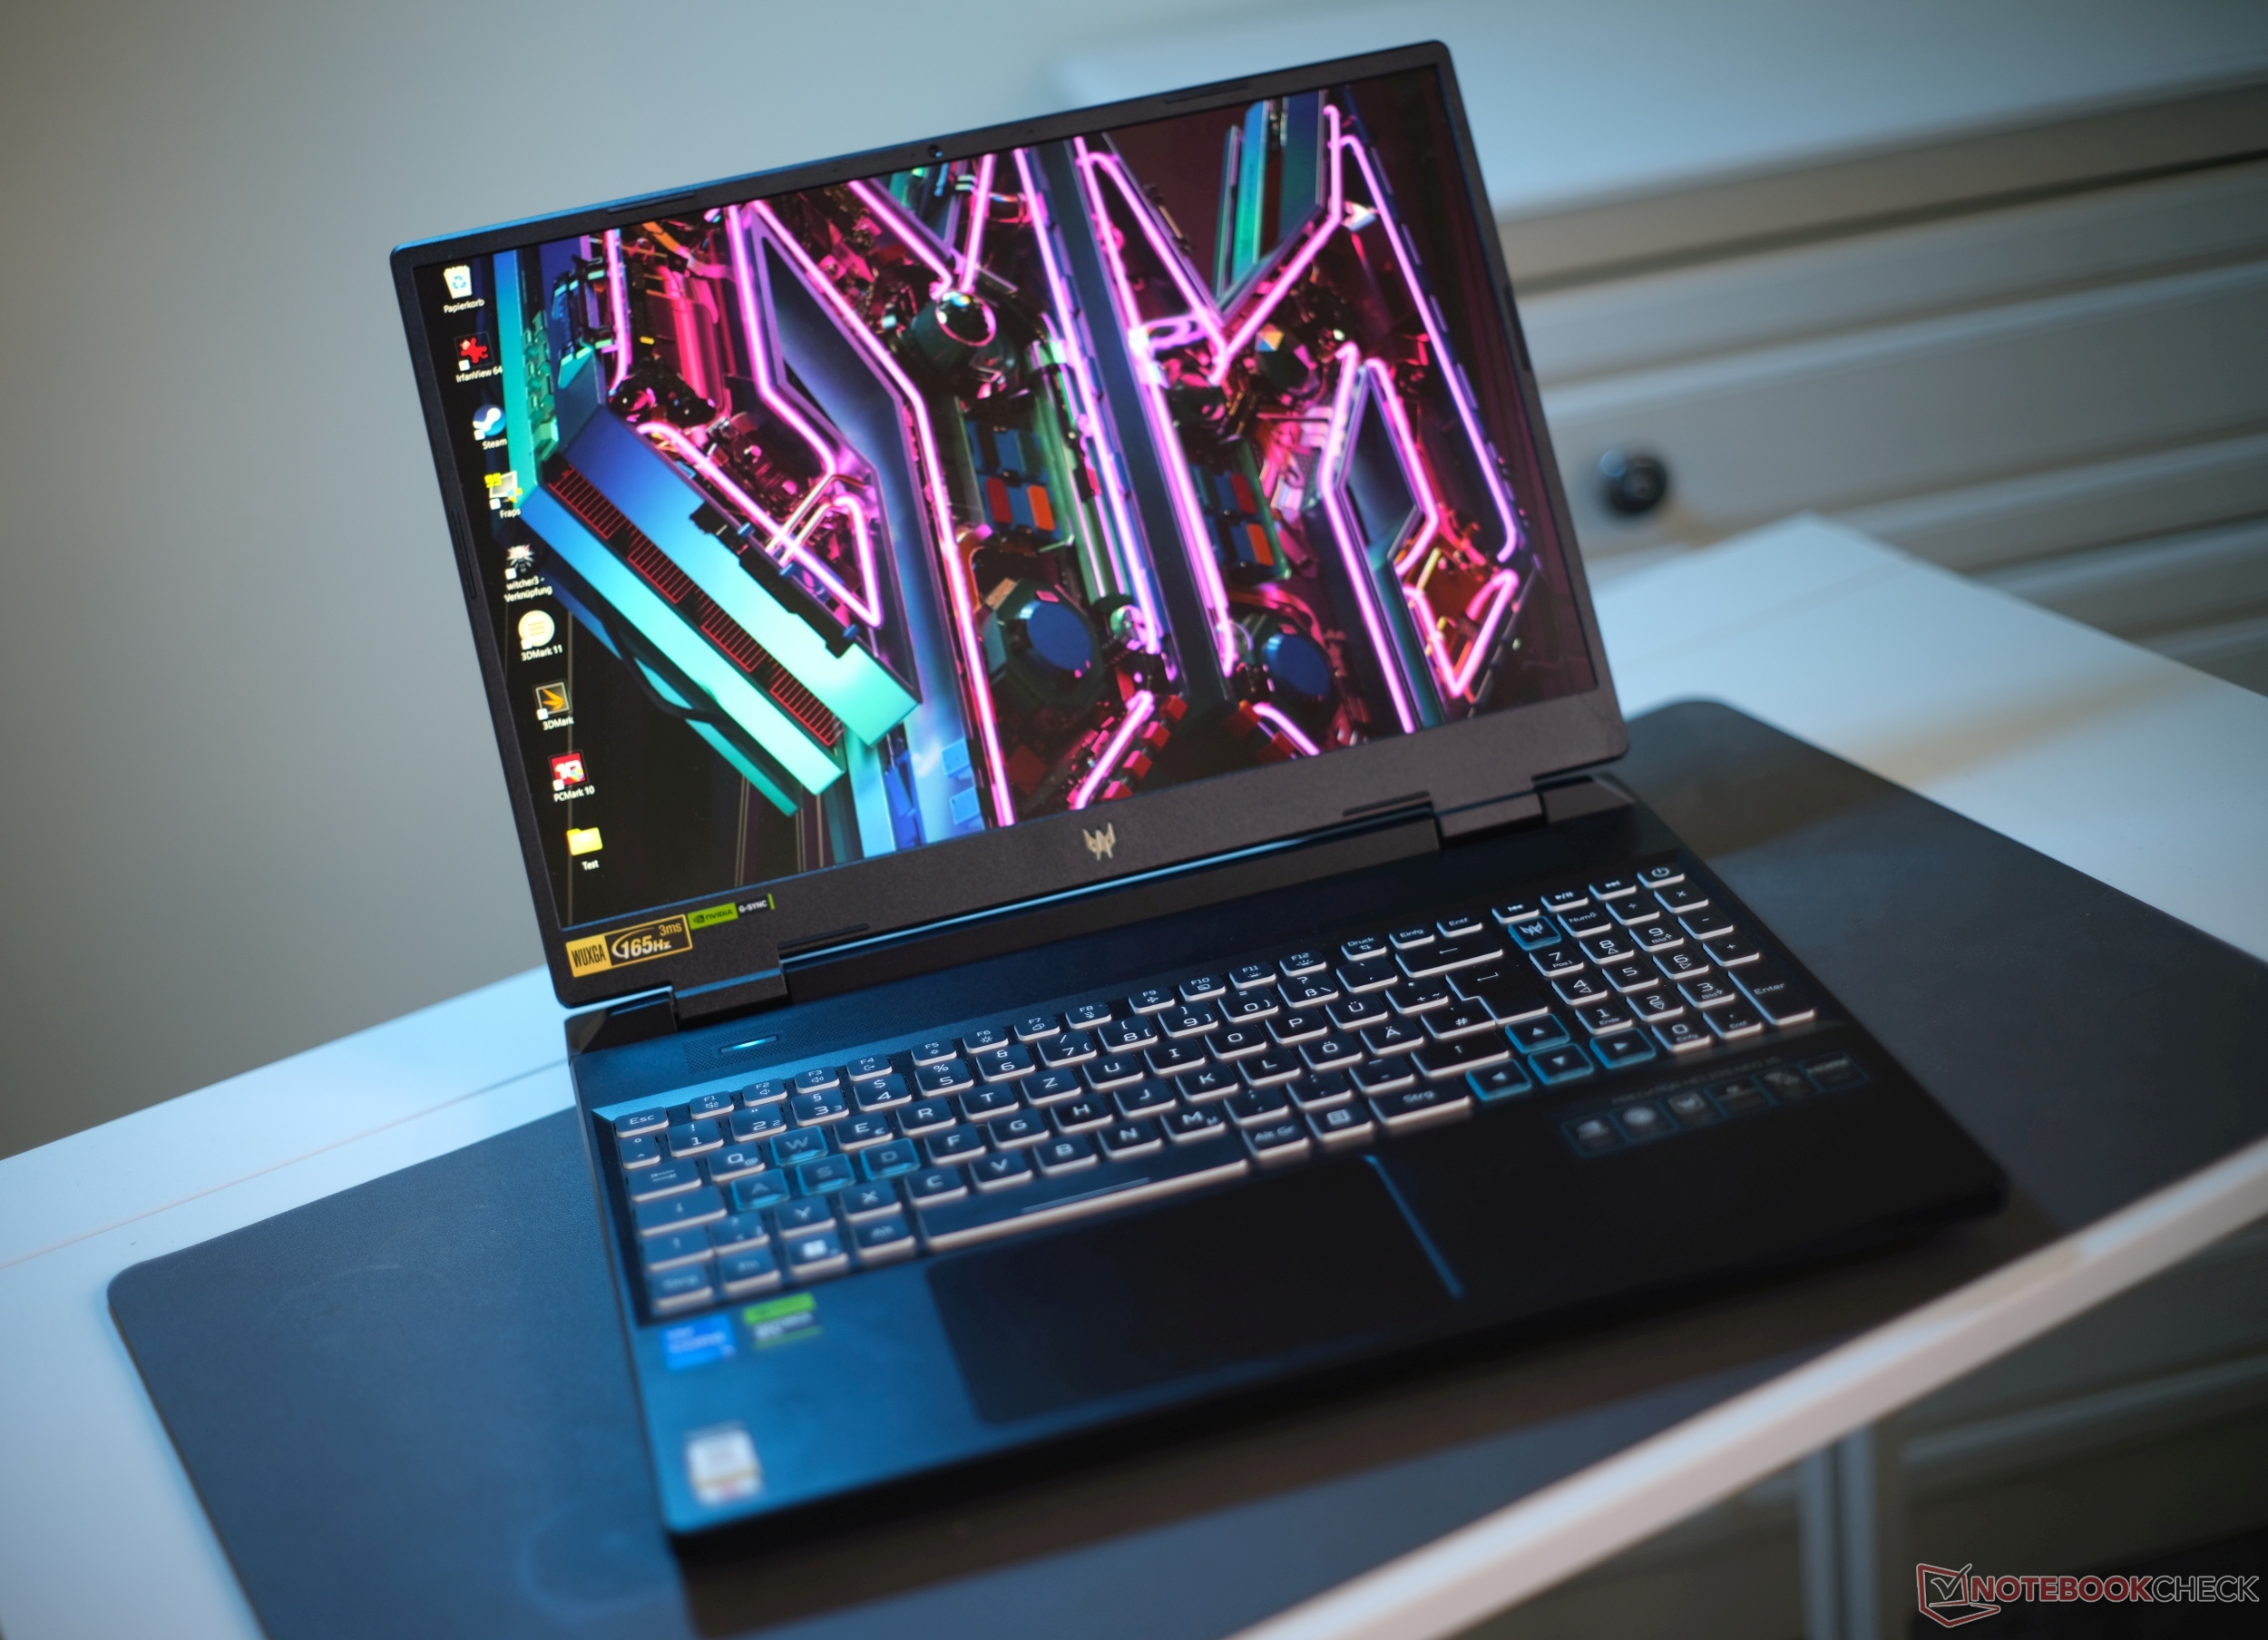
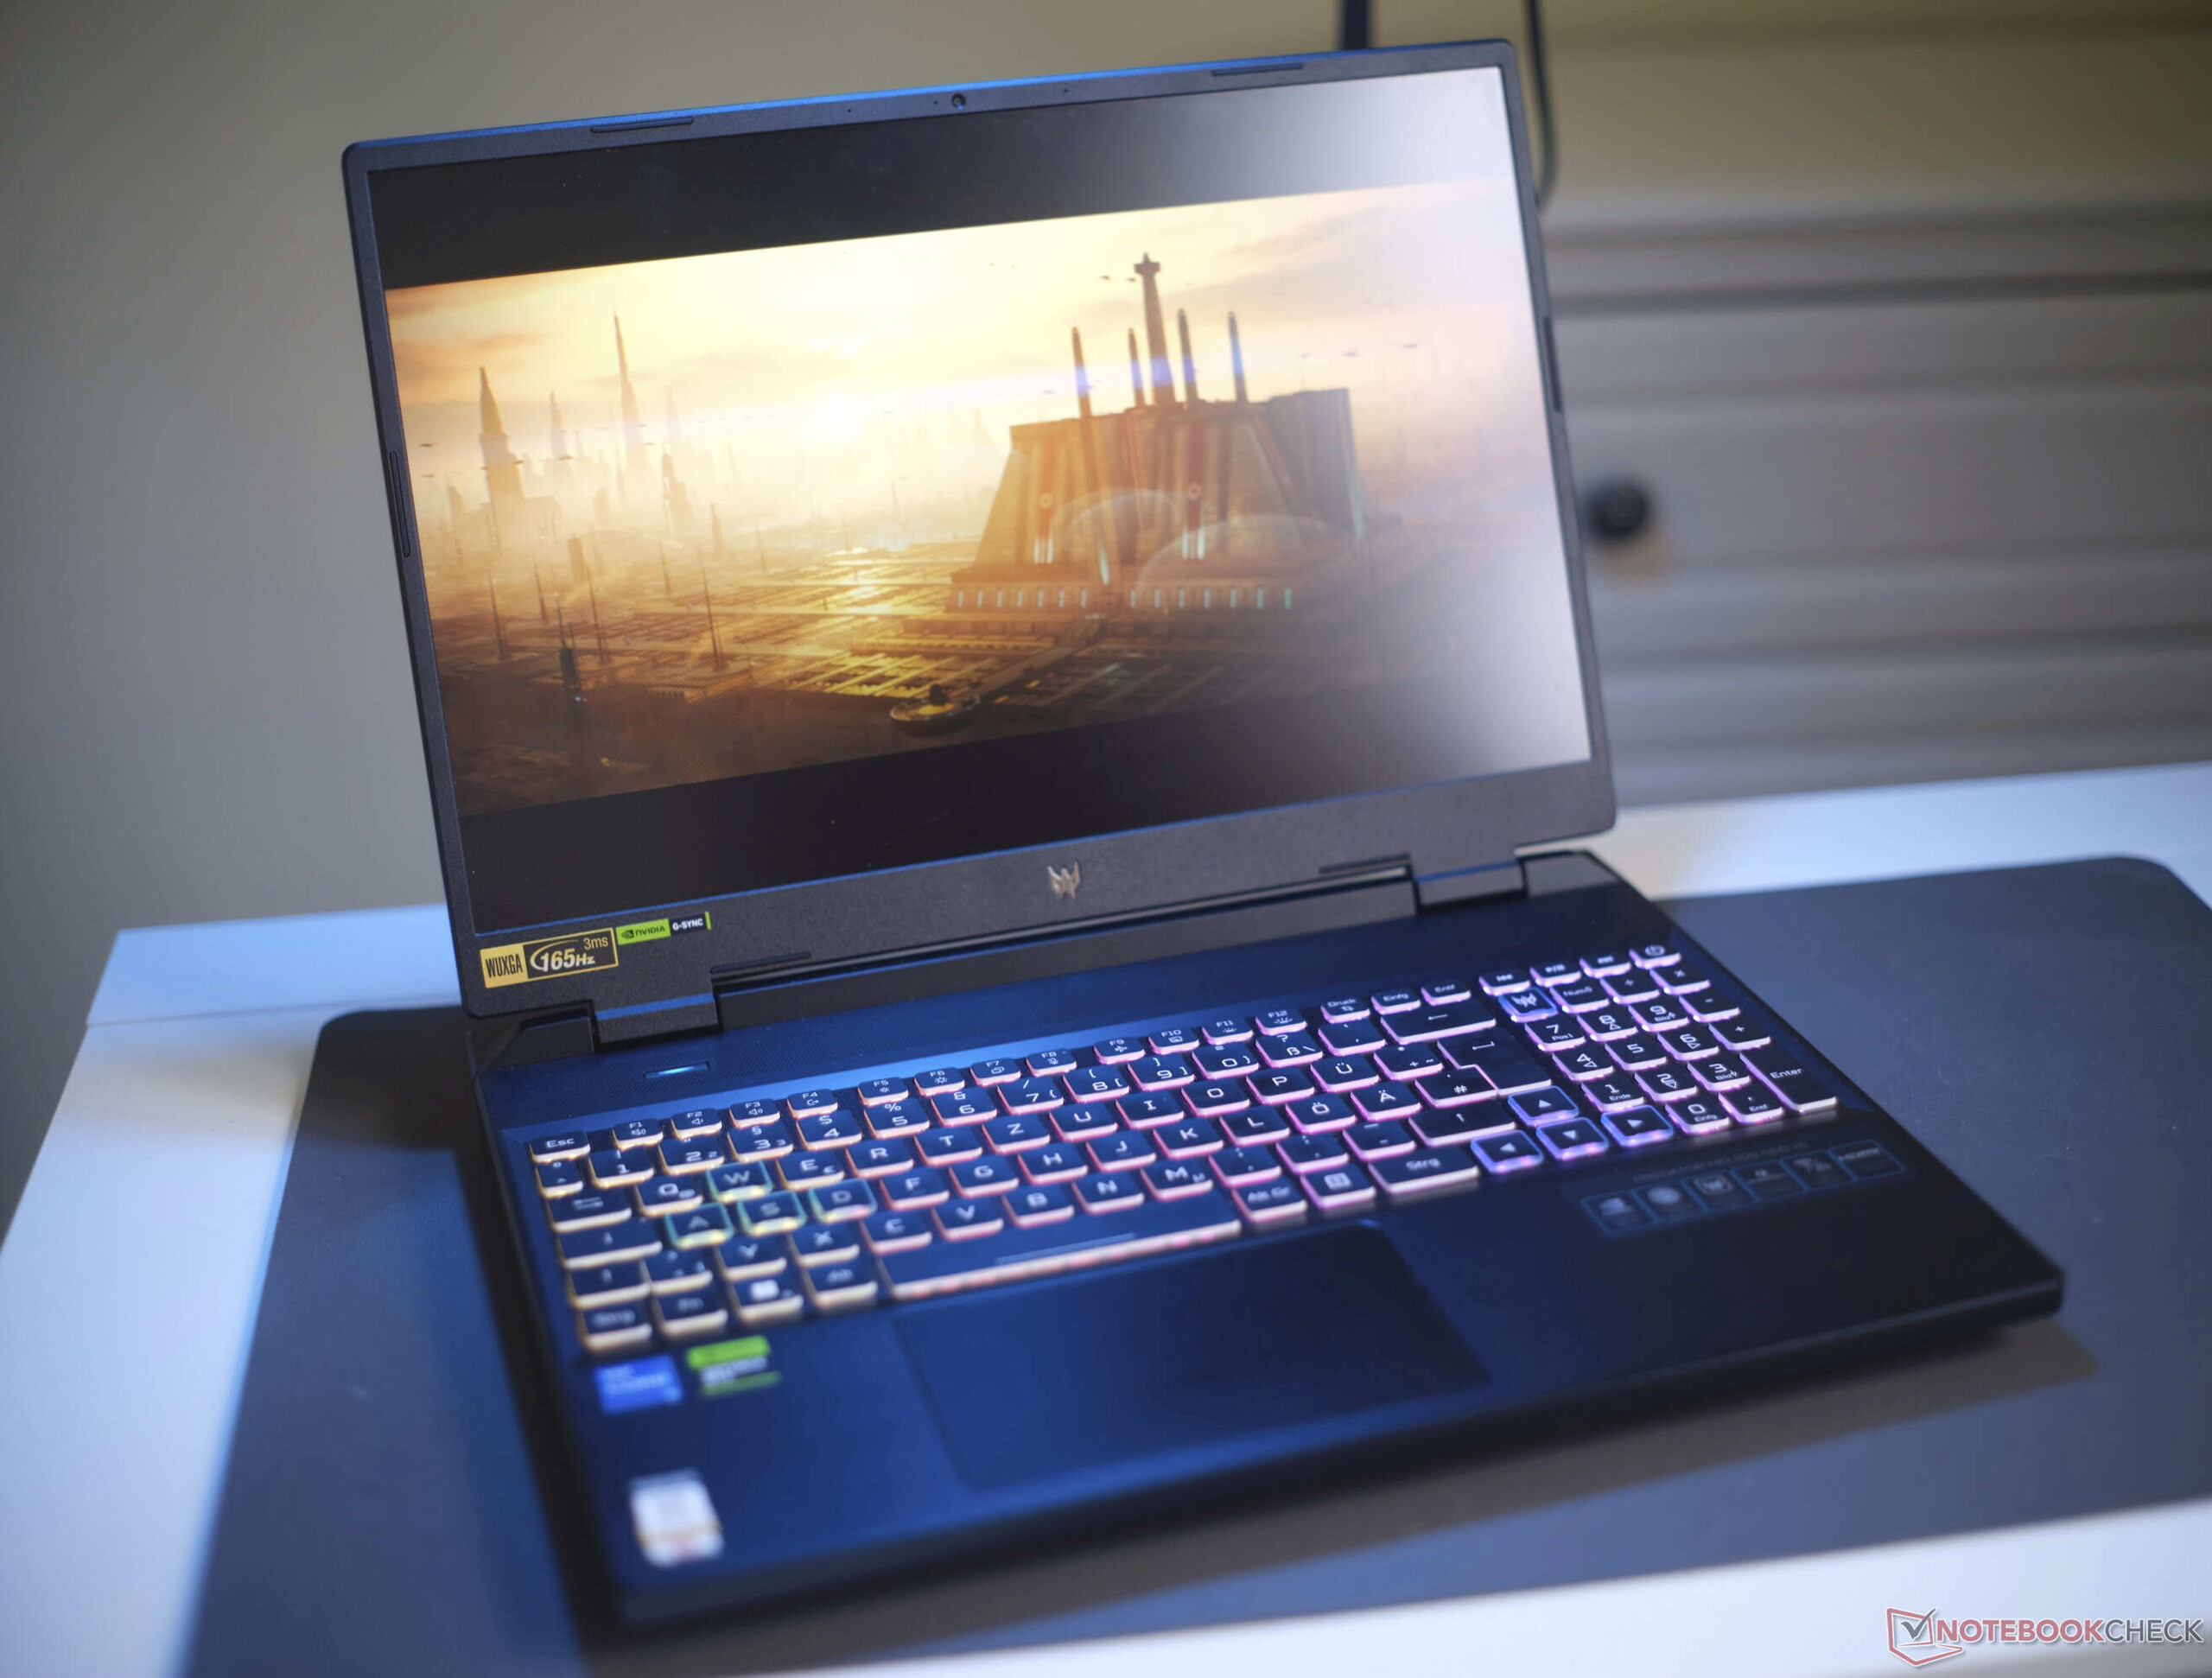
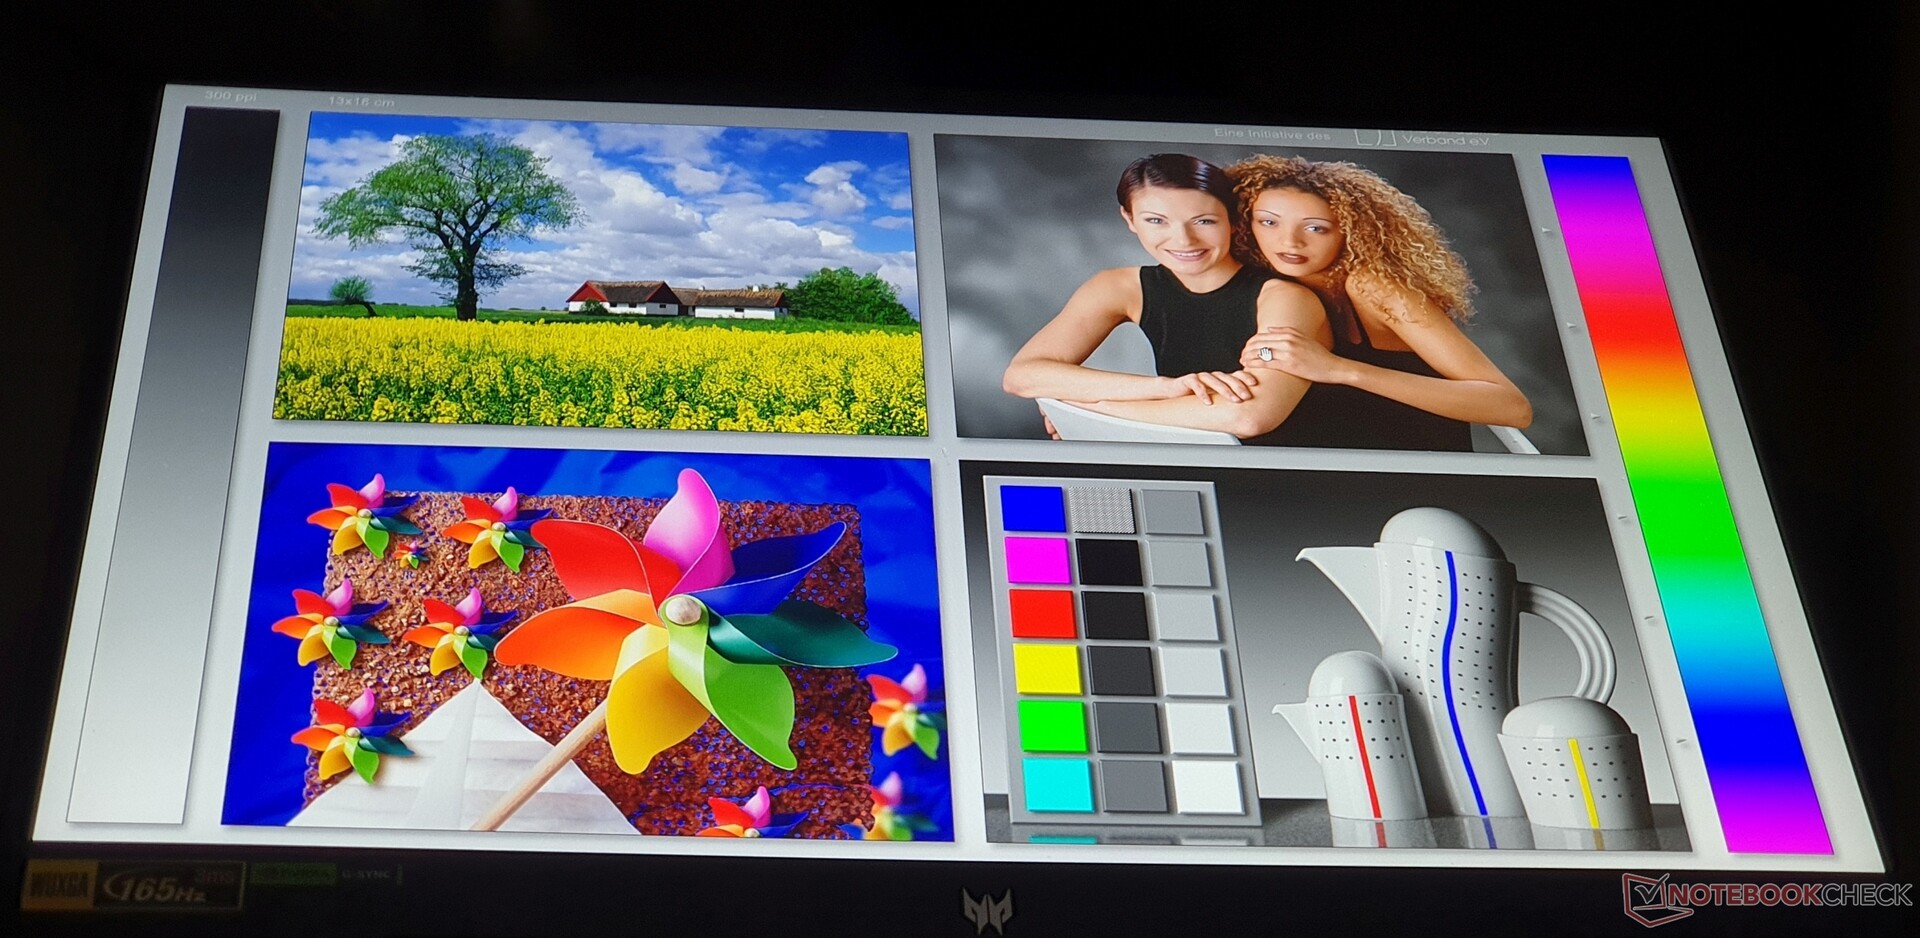
Pantalla: El Helios Neo 16 está bien equipado para juegos Full HD
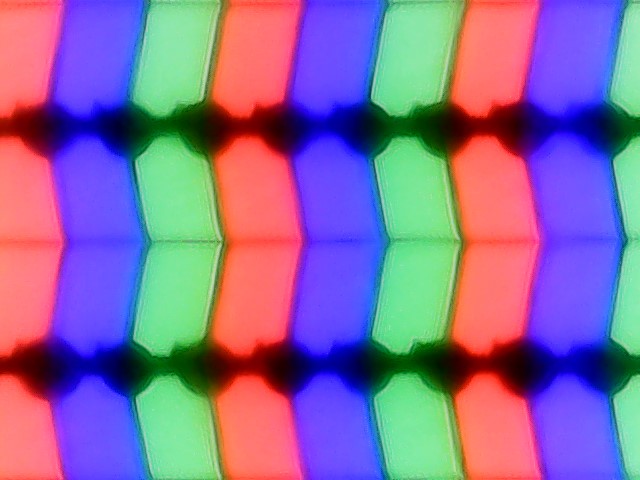
Nuestro dispositivo de pruebas está equipado con una pantalla IPS WUXGA mate (FHD+) con una relación de aspecto de 16:10, mientras que otras variantes ofrecen una opción QHD. Ambos paneles tienen una frecuencia de actualización de 165 Hz.
A diferencia del Predator Helios 16, la opción QHD no cubre el espacio de color DCI-P3, sino que se limita al 100% sRGB como la variante FHD+ que probamos. 373 cd/m² es suficientemente brillante - en nuestro campo de comparación, sólo elLegion Pro 5 brilla más con 516 cd/m², además, también ofrece una mayor resolución a un precio similar (al igual que elLOQ 16 y el XMG Apex 15).
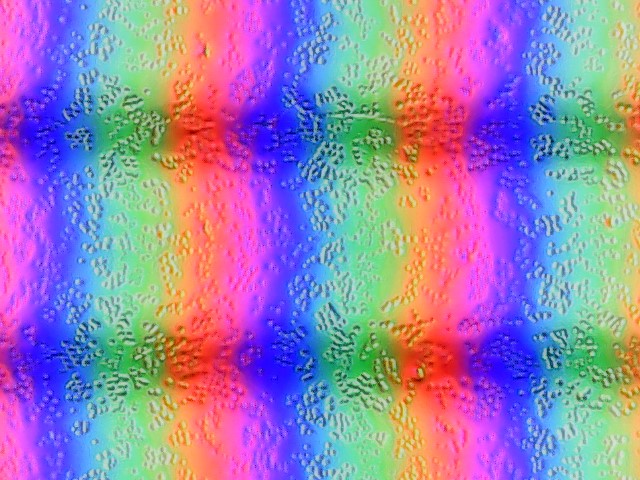
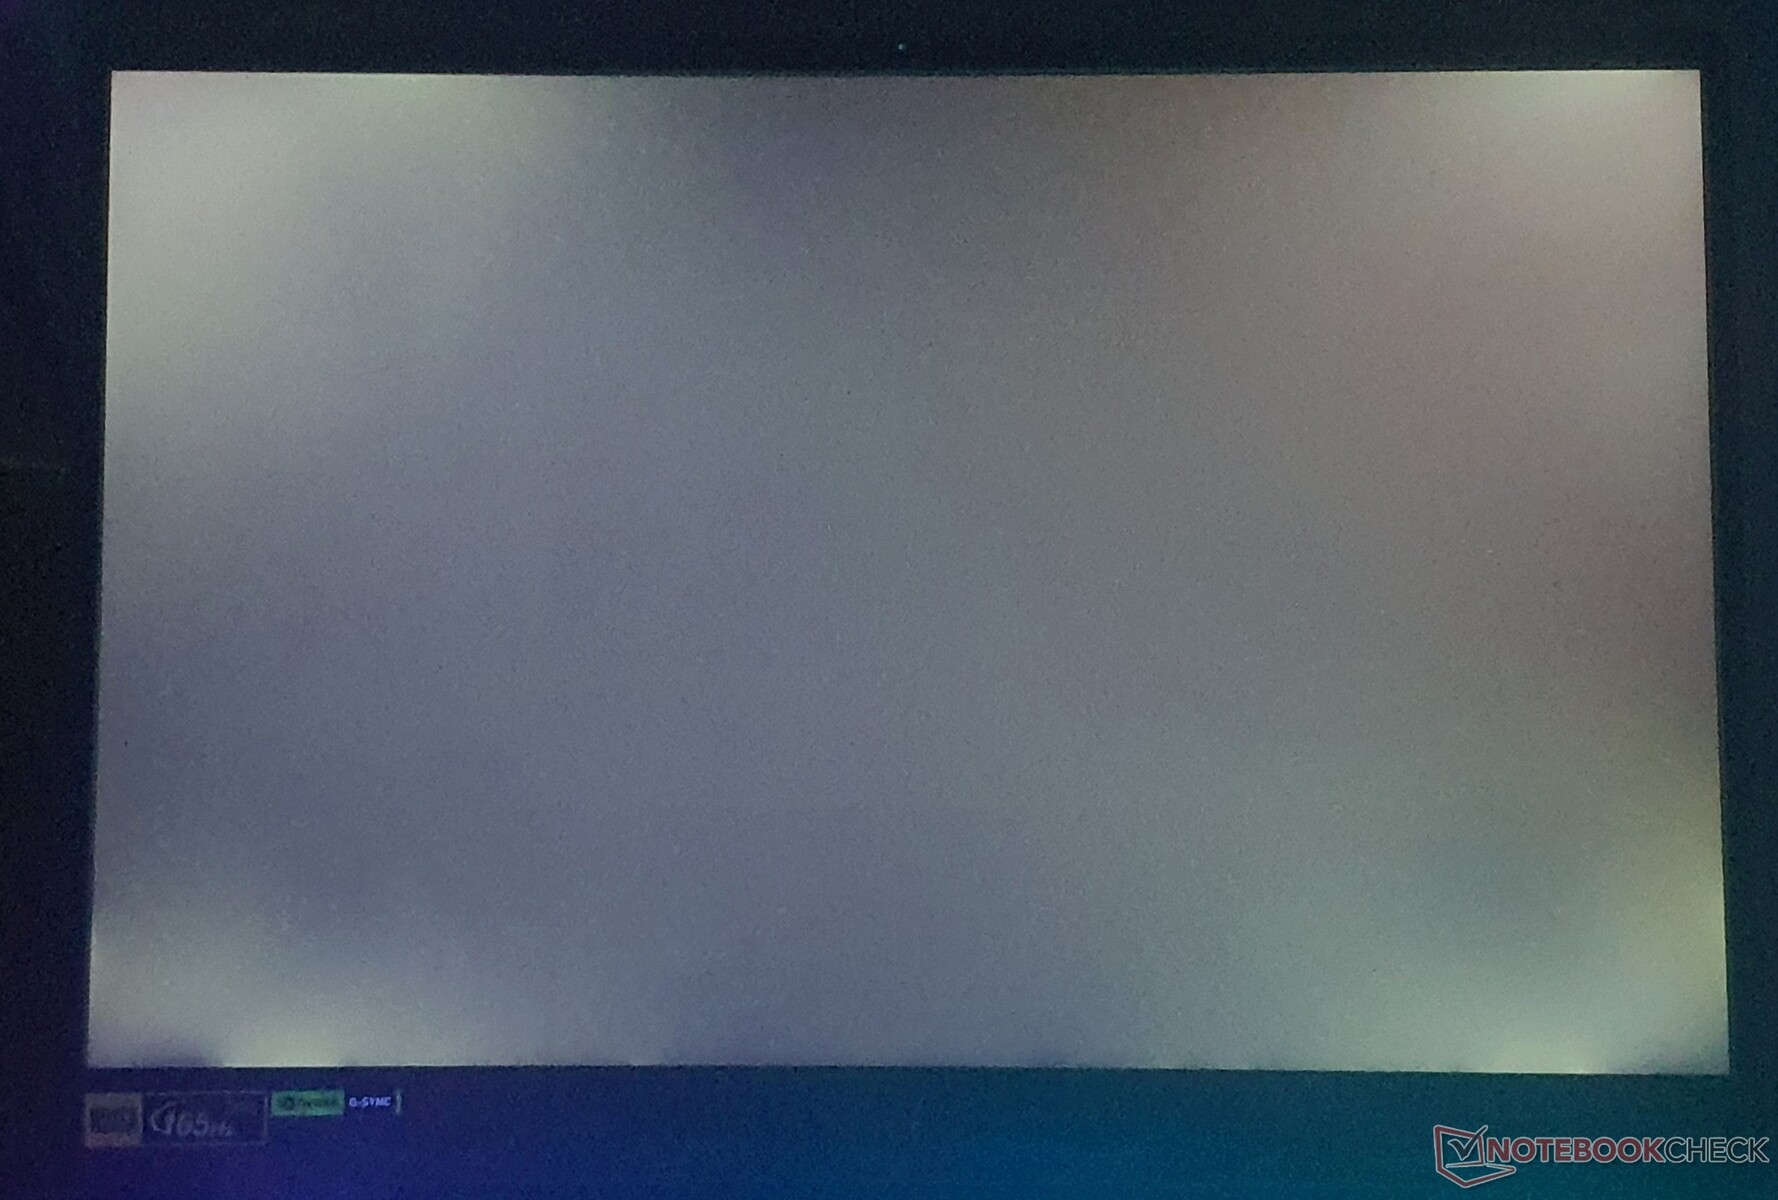
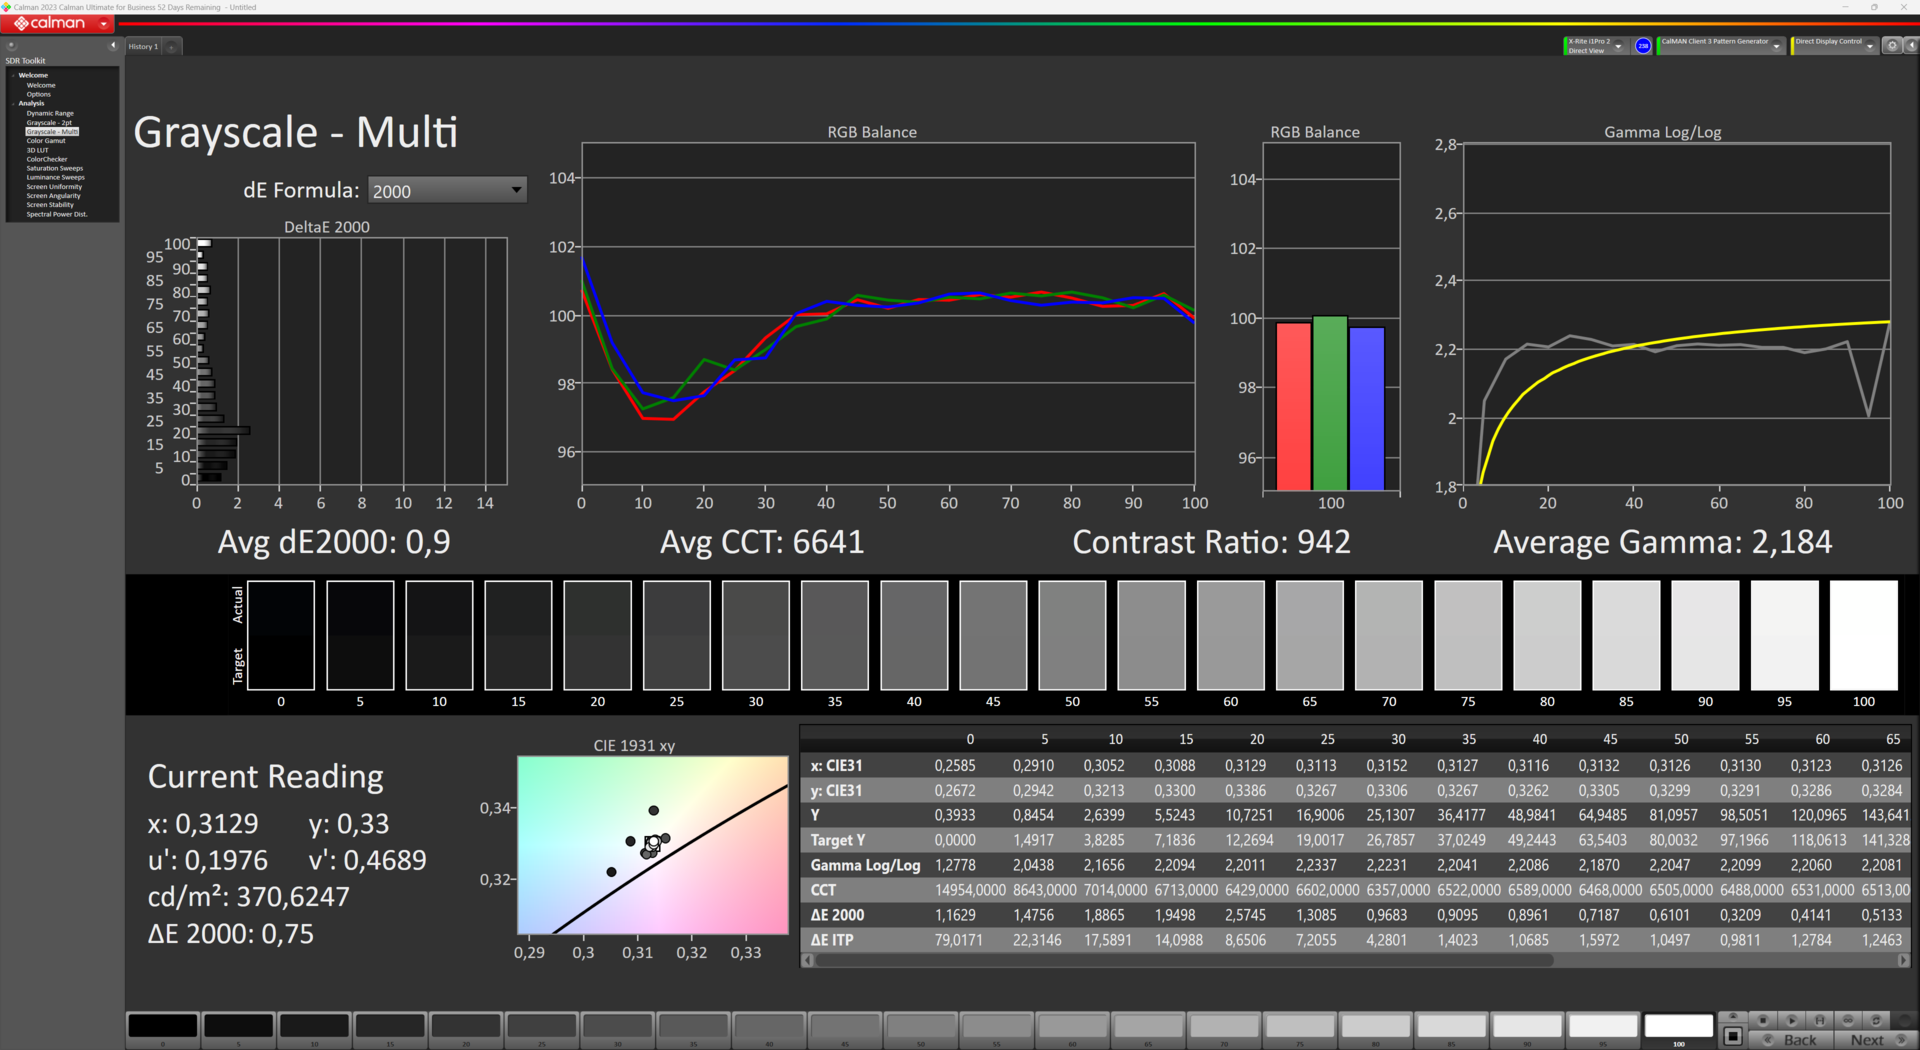
Alcanzó unos niveles de contraste medios de 1.025:1, mientras que su iluminación del 86% no es terriblemente uniforme y observamos algunos halos claramente visibles. El PWM, que puede provocar molestias oculares o dolores de cabeza, al menos no se utiliza en este dispositivo.
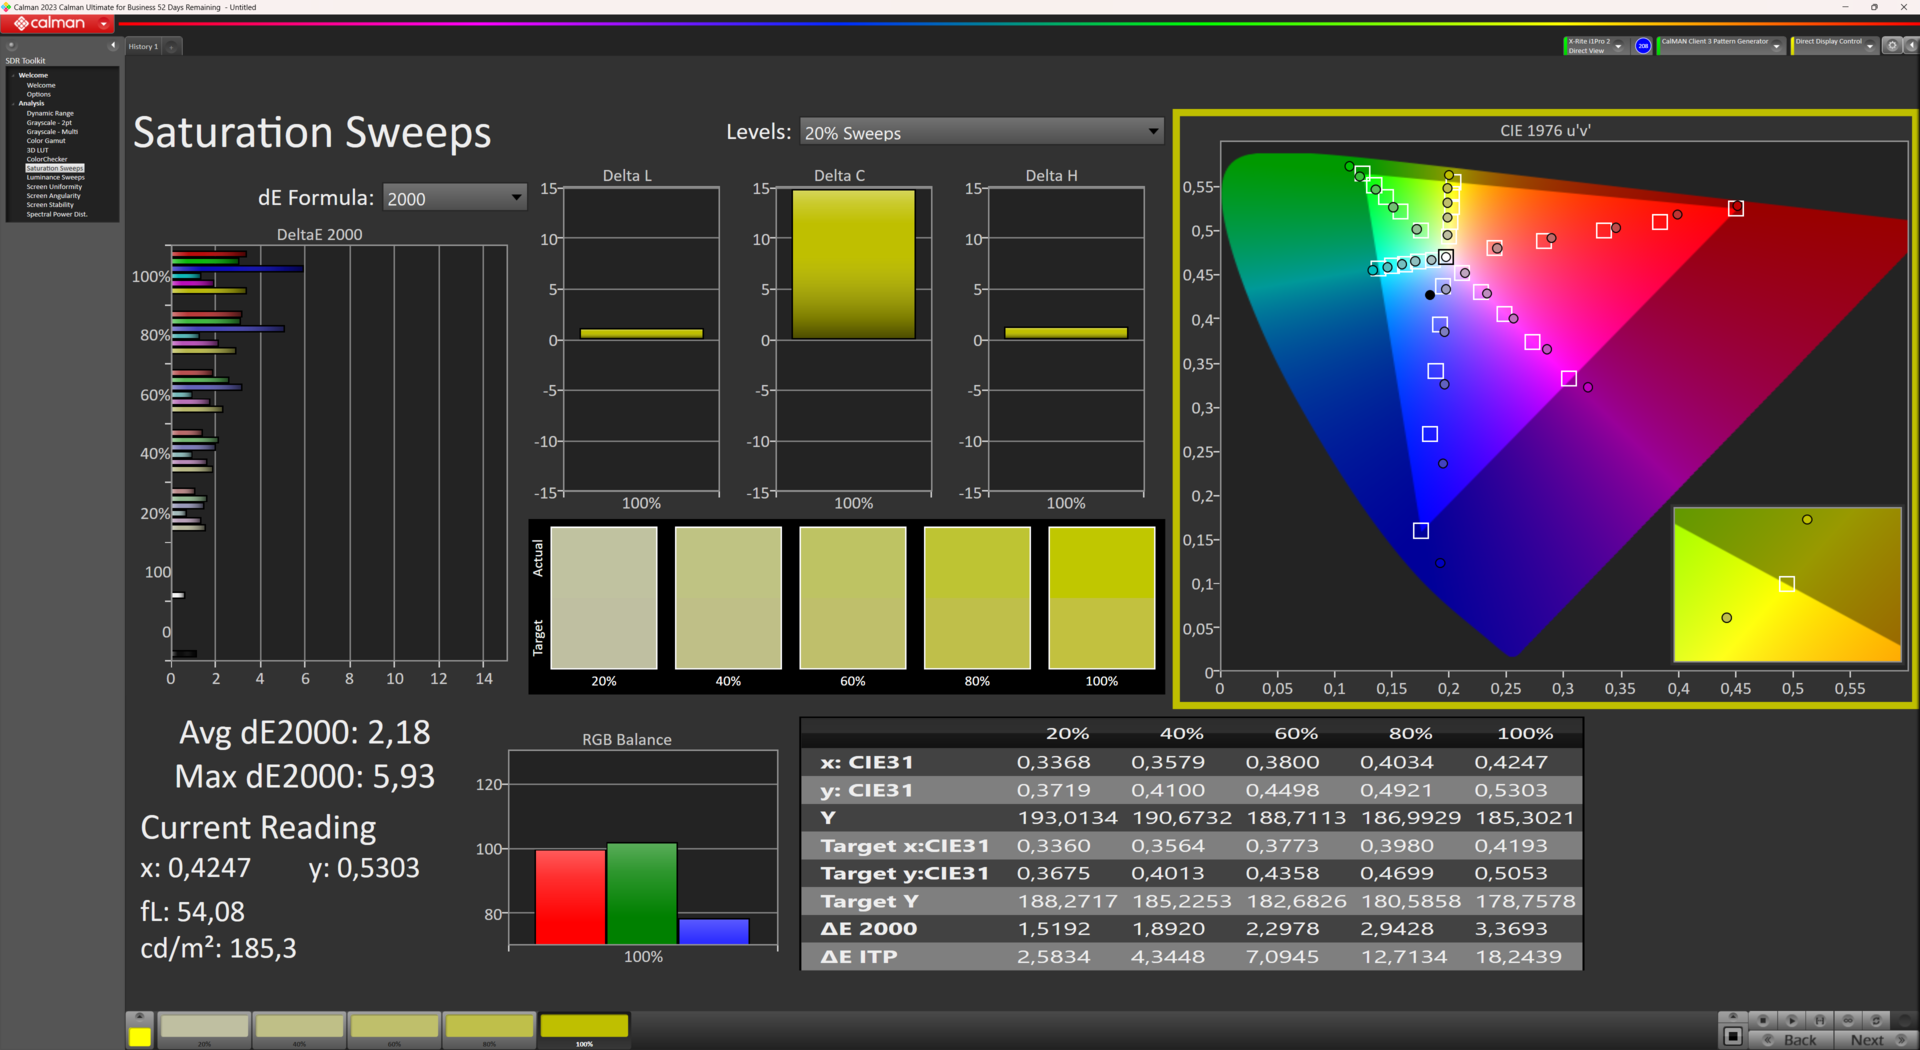
Los tiempos de respuesta de la pantalla de 8 ms (gris a gris) y 8 ms (negro a blanco) son cortos - sólo elDell G15 5530 destaca con tiempos de respuesta de sólo 3,4 ms (gris a gris). También es compatible con Nvidia G-Sync. En general, la pantalla tiene un aspecto agradable y colorido, lo que probablemente se deba a su cobertura del espacio de color DCI-P3 de al menos el 80%.
| |||||||||||||||||||||||||
iluminación: 86 %
Brillo con batería: 422.2 cd/m²
Contraste: 1025:1 (Negro: 0.41 cd/m²)
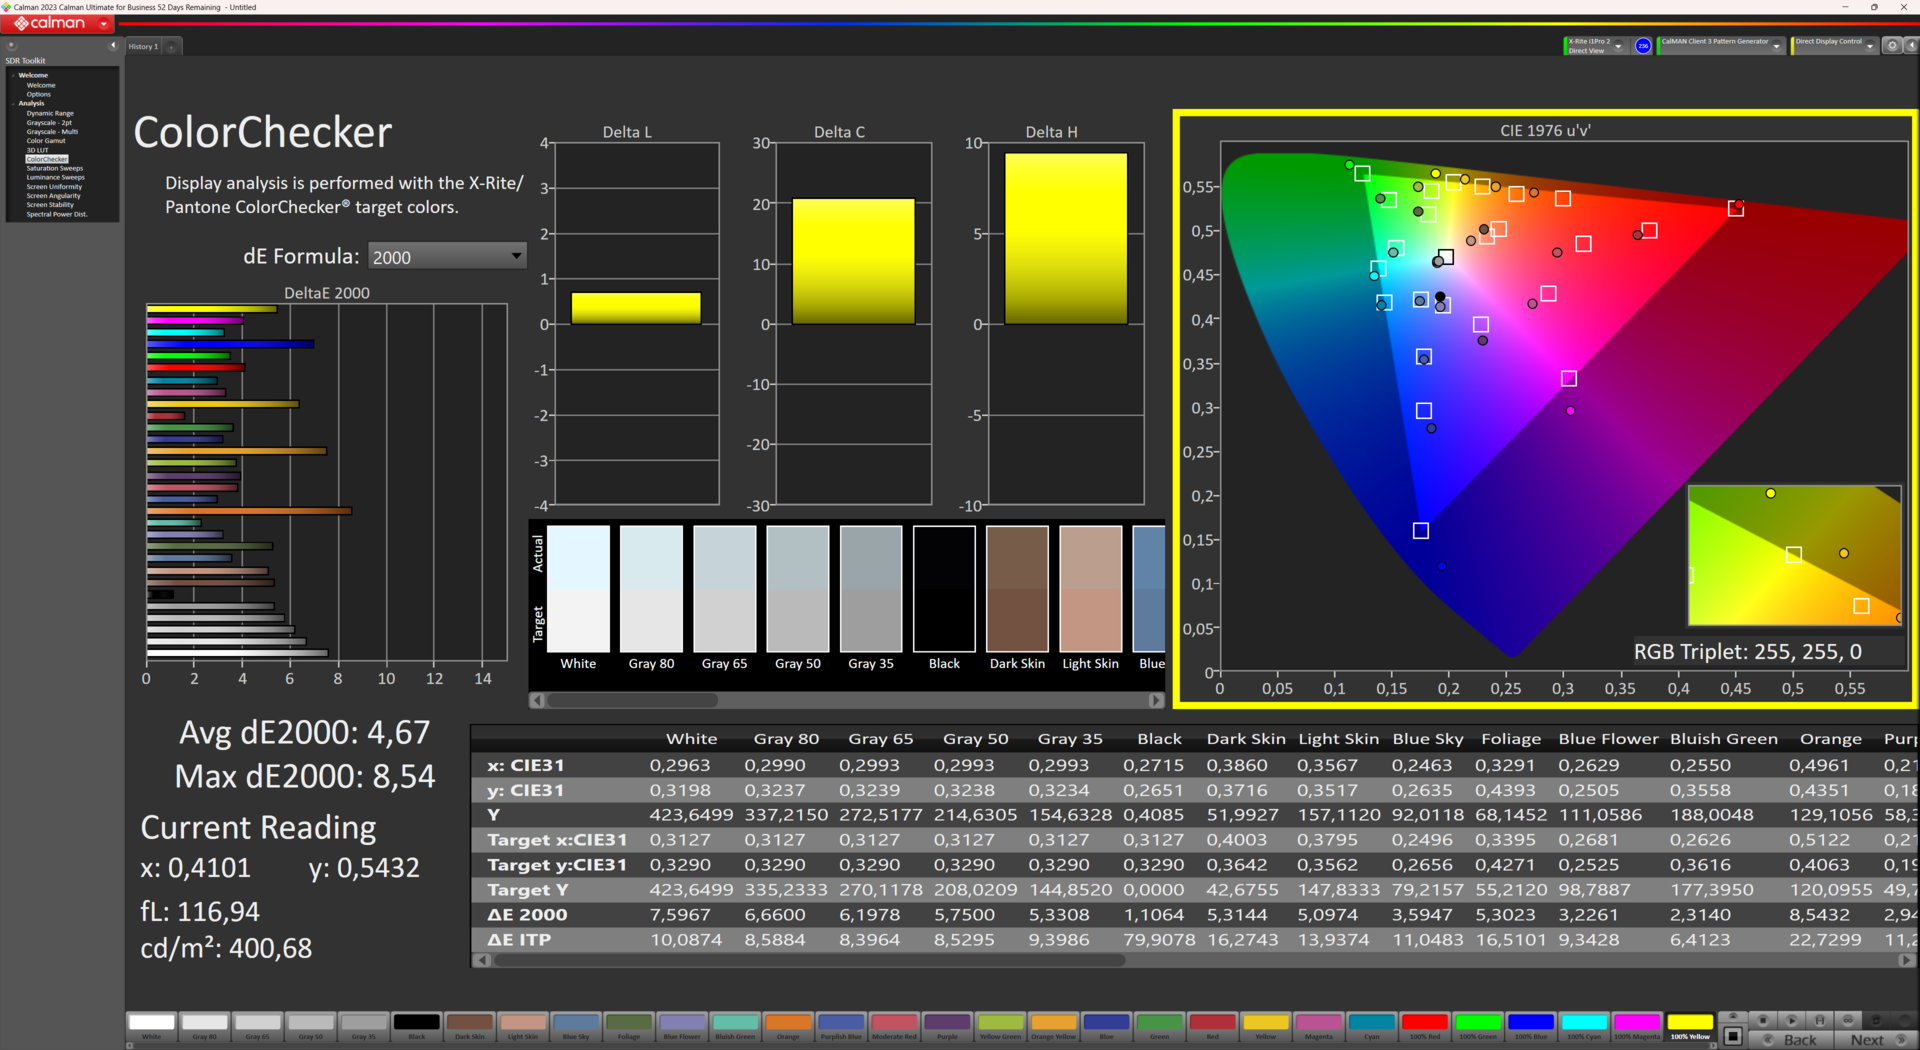
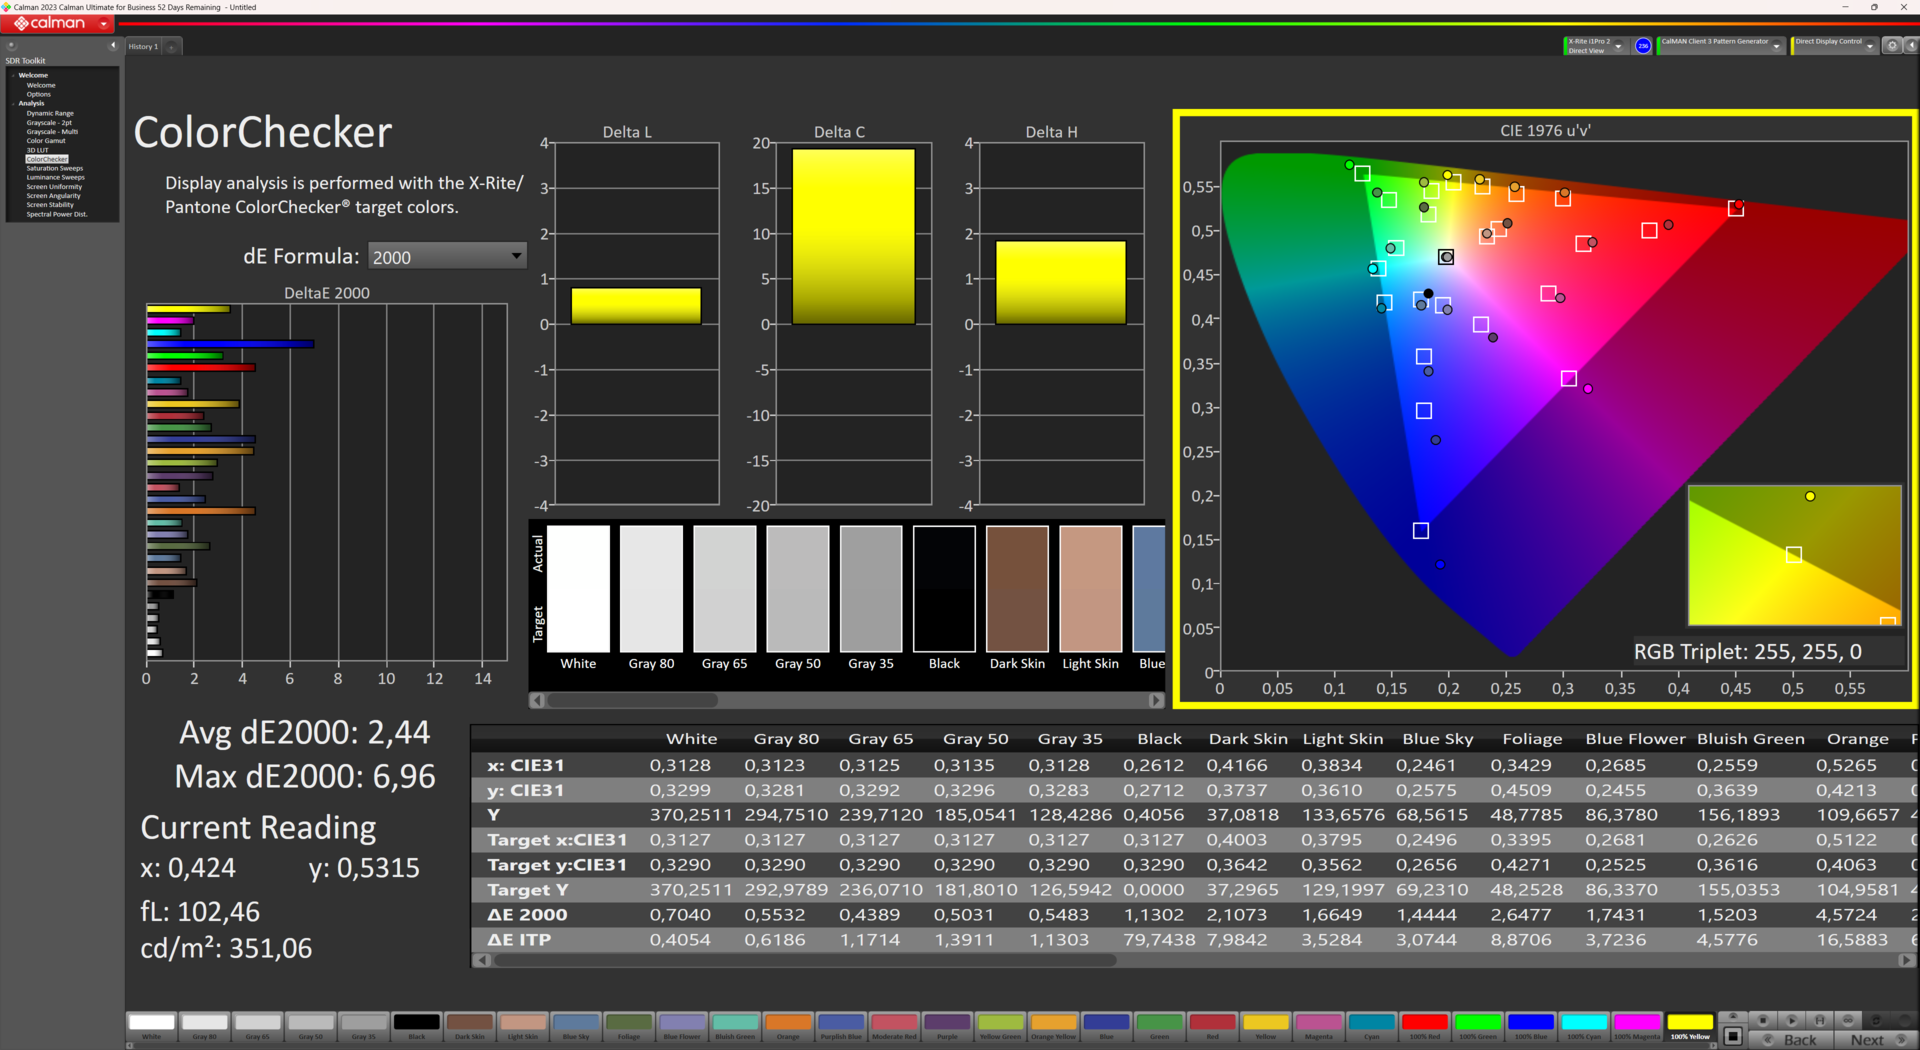
ΔE ColorChecker Calman: 4.67 | ∀{0.5-29.43 Ø4.71}
calibrated: 2.44
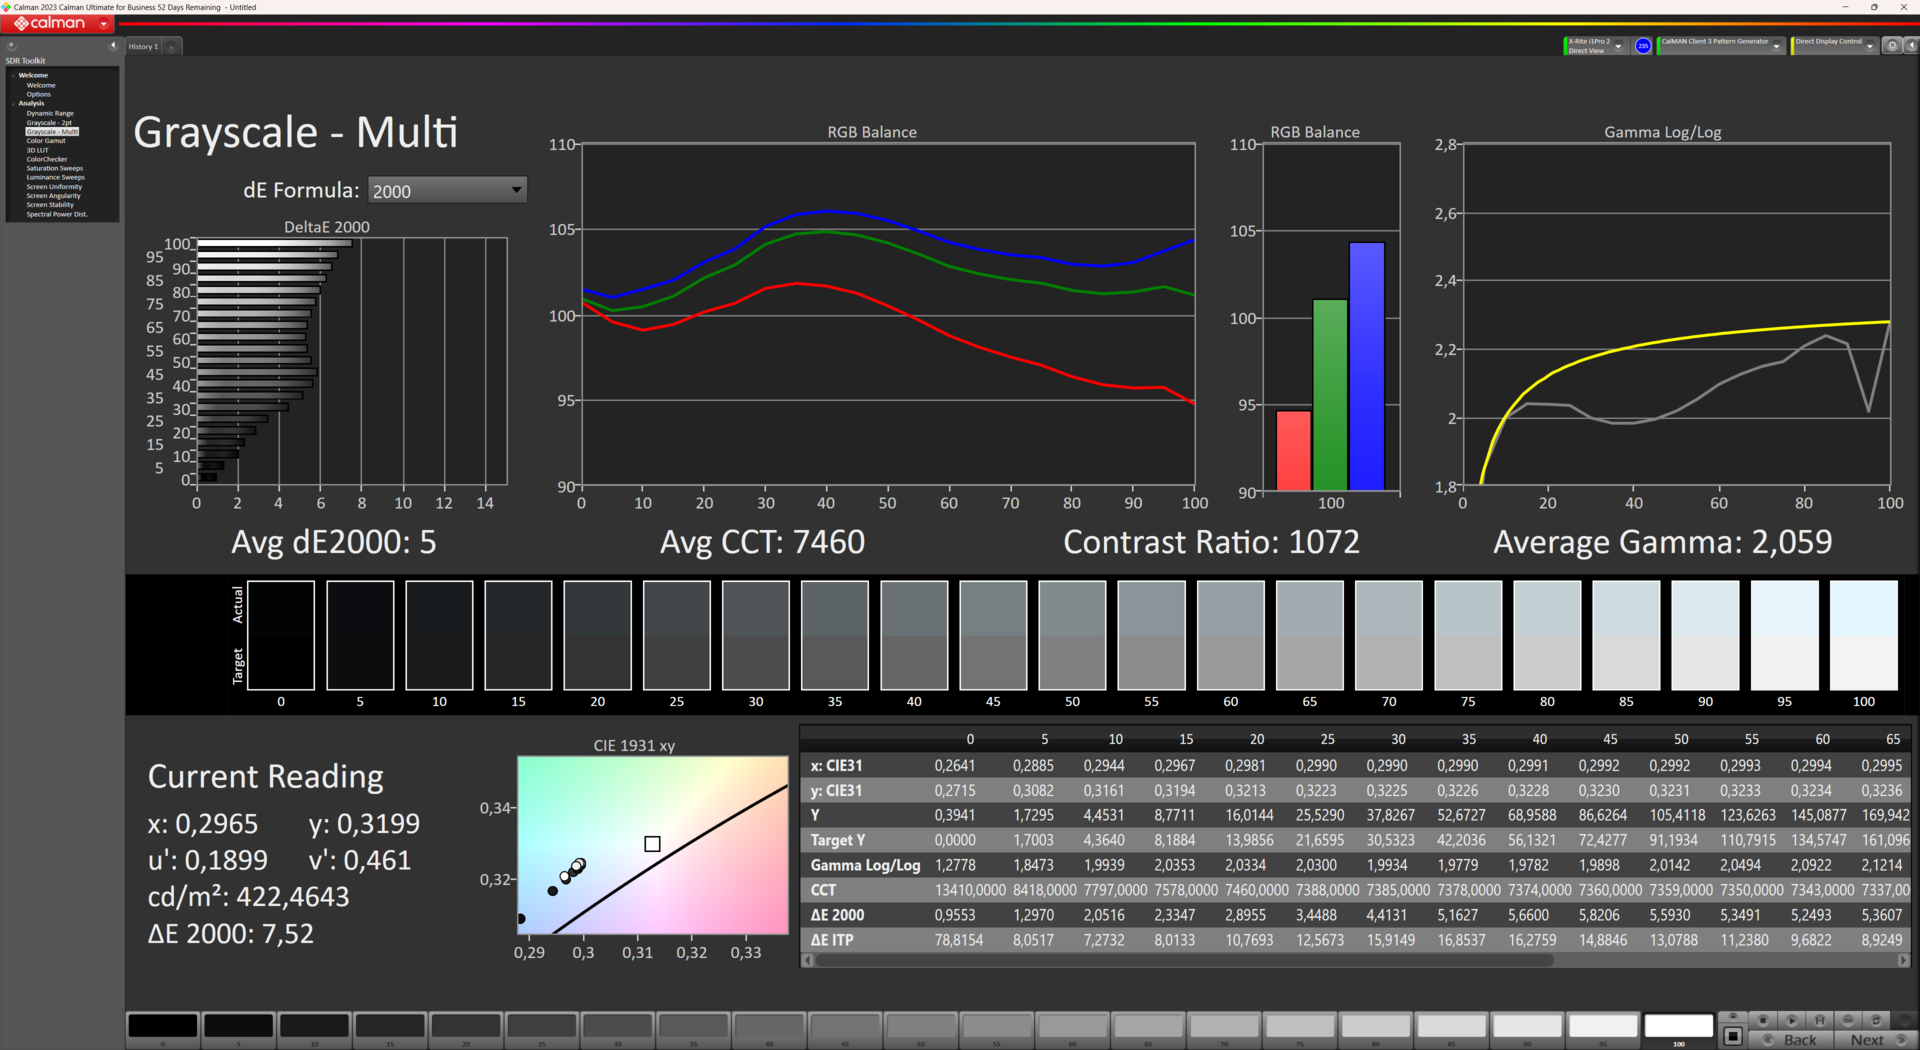
ΔE Greyscale Calman: 7.52 | ∀{0.09-98 Ø4.96}
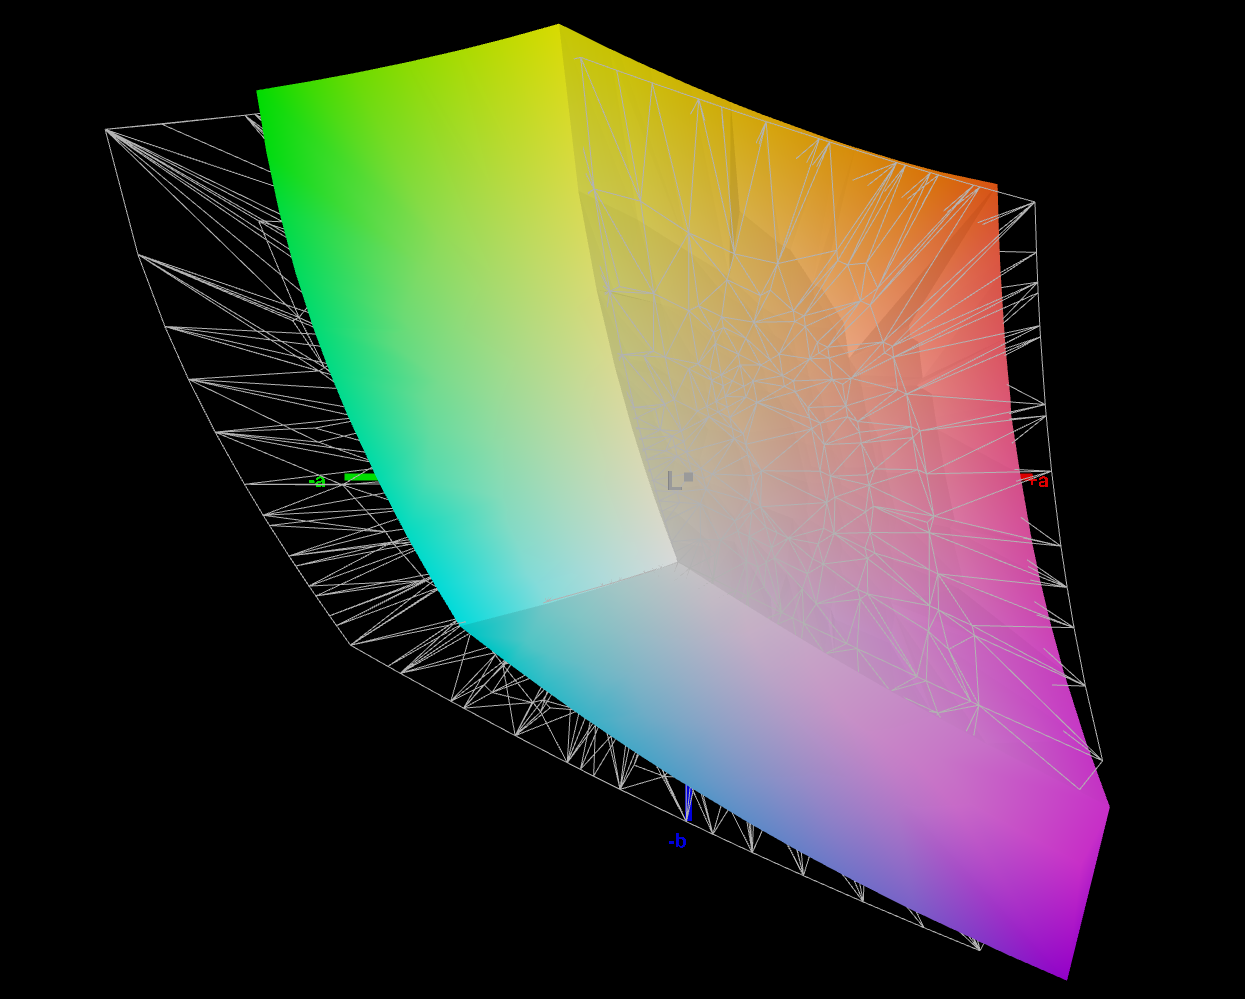
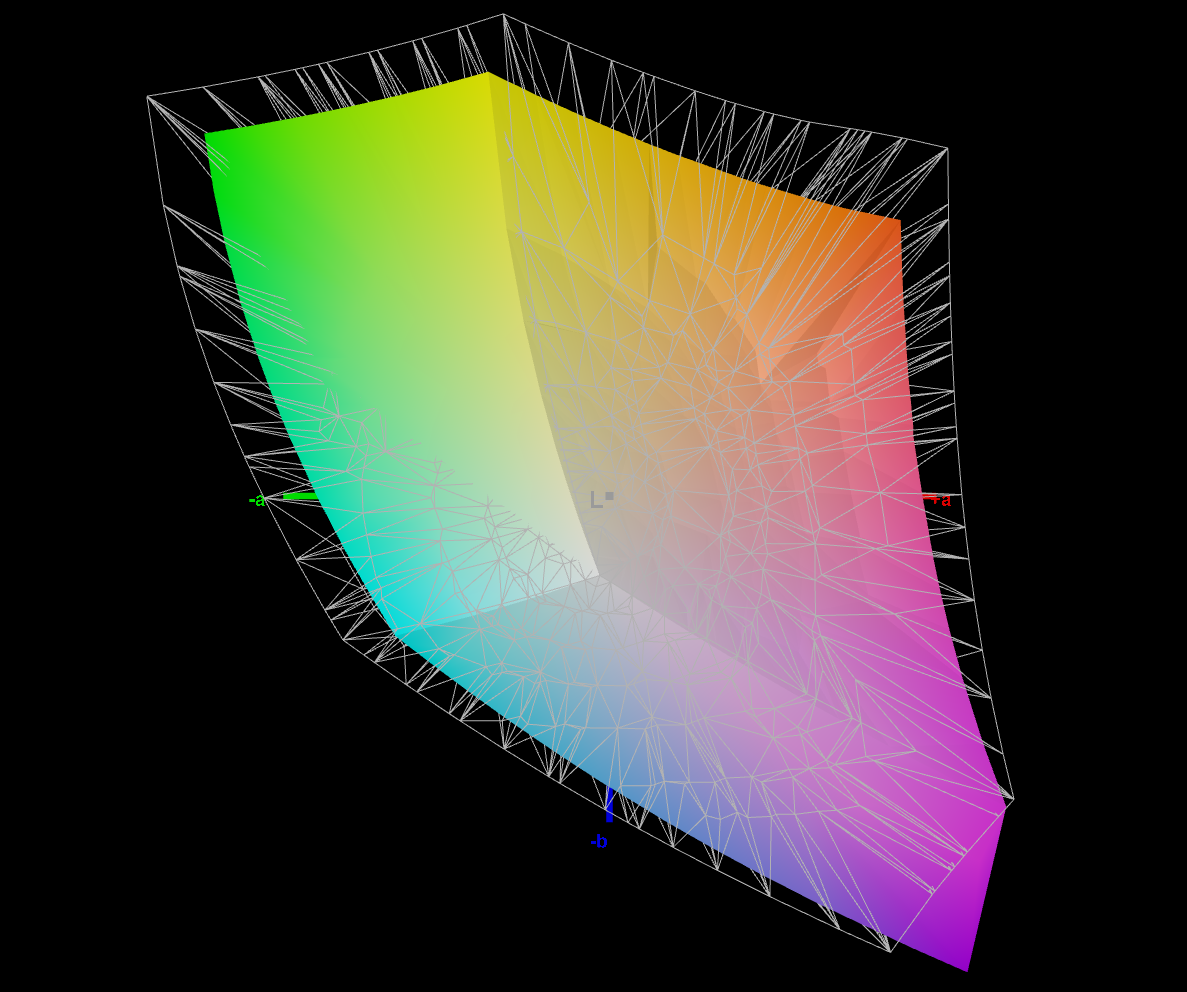
71.36% AdobeRGB 1998 (Argyll 3D)
99.16% sRGB (Argyll 3D)
79.56% Display P3 (Argyll 3D)
Gamma: 2.184
CCT: 6641 K
| Acer Predator Helios Neo 16 NH.QLTEG.002 B160UAN01.Q, IPS, 1920x1200, 16" | Lenovo Legion Pro 5 16ARX8 (R5 7645HX, RTX 4050) CSOT T3 MNG007DA2-2, IPS, 2560x1600, 16" | Lenovo LOQ 16IRH8 AUOC1A5 (B160QAN03.L), IPS, 2560x1600, 16" | Schenker XMG Apex 15 (Late 23) BOE CQ NE156QHM-NY2, IPS, 2560x1440, 15.6" | HP Victus 16-r0076TX Chi Mei CMN1629, IPS, 1920x1080, 16.1" | Dell G15 5530 AUO B156HAN, IPS, 1920x1080, 15.6" | |
|---|---|---|---|---|---|---|
| Display | -2% | -3% | -7% | -6% | -2% | |
| Display P3 Coverage (%) | 79.56 | 71.6 -10% | 70.5 -11% | 67.5 -15% | 67.5 -15% | 73.1 -8% |
| sRGB Coverage (%) | 99.16 | 99.8 1% | 98.9 0% | 97.6 -2% | 97.5 -2% | 98.4 -1% |
| AdobeRGB 1998 Coverage (%) | 71.36 | 72.9 2% | 72.6 2% | 68.9 -3% | 69.7 -2% | 74.4 4% |
| Response Times | -8% | 9% | -38% | 14% | 46% | |
| Response Time Grey 50% / Grey 80% * (ms) | 8 ? | 12 ? -50% | 7.2 ? 10% | 13.2 ? -65% | 6.18 ? 23% | 3.39 ? 58% |
| Response Time Black / White * (ms) | 8 ? | 5.2 ? 35% | 7.4 ? 7% | 8.8 ? -10% | 7.62 ? 5% | 5.35 ? 33% |
| PWM Frequency (Hz) | 21620 ? | |||||
| Screen | 31% | 27% | 18% | 32% | 12% | |
| Brightness middle (cd/m²) | 420.2 | 543 29% | 407 -3% | 336 -20% | 290 -31% | 320 -24% |
| Brightness (cd/m²) | 373 | 516 38% | 369 -1% | 307 -18% | 275 -26% | 316 -15% |
| Brightness Distribution (%) | 86 | 87 1% | 85 -1% | 77 -10% | 82 -5% | 94 9% |
| Black Level * (cd/m²) | 0.41 | 0.58 -41% | 0.45 -10% | 0.38 7% | 0.21 49% | 0.21 49% |
| Contrast (:1) | 1025 | 936 -9% | 904 -12% | 884 -14% | 1381 35% | 1524 49% |
| Colorchecker dE 2000 * | 4.67 | 1.35 71% | 1.43 69% | 1.96 58% | 1.7 64% | 4.55 3% |
| Colorchecker dE 2000 max. * | 8.54 | 3.22 62% | 3.58 58% | 5.07 41% | 3.57 58% | 9.83 -15% |
| Colorchecker dE 2000 calibrated * | 2.44 | 1.31 46% | 1.07 56% | 1.27 48% | 0.93 62% | 1.51 38% |
| Greyscale dE 2000 * | 7.52 | 1.03 86% | 1.13 85% | 2.3 69% | 1.5 80% | 6.2 18% |
| Gamma | 2.184 101% | 2.38 92% | 2.5 88% | 2.017 109% | 2.1 105% | 2.07 106% |
| CCT | 6641 98% | 6452 101% | 6526 100% | 6644 98% | 6538 99% | 6479 100% |
| Media total (Programa/Opciones) | 7% /
19% | 11% /
18% | -9% /
5% | 13% /
21% | 19% /
14% |
* ... más pequeño es mejor
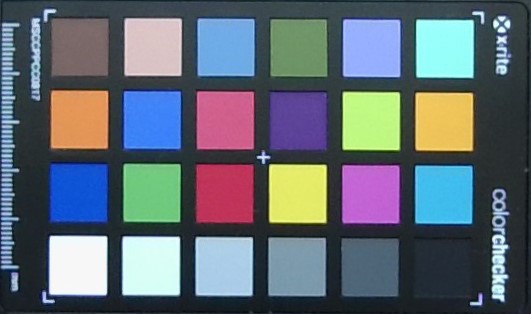
Dado que el espacio de color sRGB está totalmente cubierto, la edición profesional de imagen y vídeo que depende de colores precisos es ciertamente posible - siempre que su resolución FHD+ más bien baja no interfiera con estos usos.
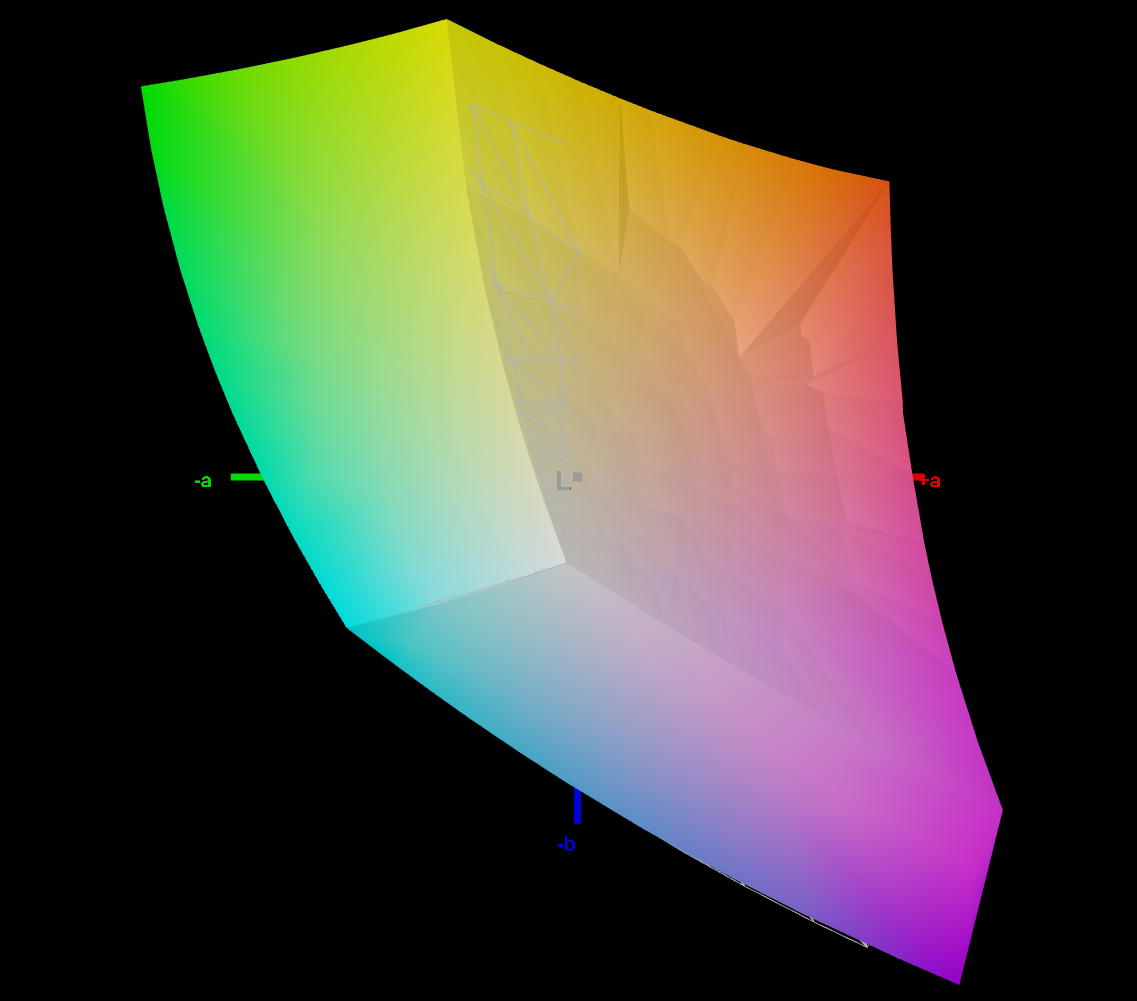
Dentro de nuestro campo de comparación, el Helios Neo 16 es el único portátil junto al Dell G15 5530 que supera el límite crítico DeltaE 3 (hasta el cual el ojo humano puede percibir desviaciones de color) con un valor de 4,67 nada más sacarlo de la caja.
Afortunadamente, su valor DeltaE se redujo a sólo 2,44 después de nuestra calibración, aunque los tonos azules todavía se desvían significativamente con un valor de 7. El tinte cian también se podría corregir. Nuestro perfil de color calibrado puede descargarse aquí.

Tiempos de respuesta del display
| ↔ Tiempo de respuesta de Negro a Blanco | ||
|---|---|---|
| 8 ms ... subida ↗ y bajada ↘ combinada | ↗ 4.5 ms subida |  |
| ↘ 3.5 ms bajada | ||
| La pantalla mostró tiempos de respuesta rápidos en nuestros tests y debería ser adecuada para juegos. En comparación, todos los dispositivos de prueba van de ##min### (mínimo) a 240 (máximo) ms. » 22 % de todos los dispositivos son mejores. Esto quiere decir que el tiempo de respuesta medido es mejor que la media (19.8 ms) de todos los dispositivos testados. | ||
| ↔ Tiempo de respuesta 50% Gris a 80% Gris | ||
| 8 ms ... subida ↗ y bajada ↘ combinada | ↗ 4.5 ms subida |  |
| ↘ 3.5 ms bajada | ||
| La pantalla mostró tiempos de respuesta rápidos en nuestros tests y debería ser adecuada para juegos. En comparación, todos los dispositivos de prueba van de ##min### (mínimo) a 636 (máximo) ms. » 21 % de todos los dispositivos son mejores. Esto quiere decir que el tiempo de respuesta medido es mejor que la media (31 ms) de todos los dispositivos testados. | ||
Parpadeo de Pantalla / PWM (Pulse-Width Modulation)
| Parpadeo de Pantalla / PWM no detectado |  | ||
Comparación: 52 % de todos los dispositivos testados no usaron PWM para atenuar el display. Si se usó, medimos una media de 7754 (mínimo: 5 - máxmo: 343500) Hz. | |||
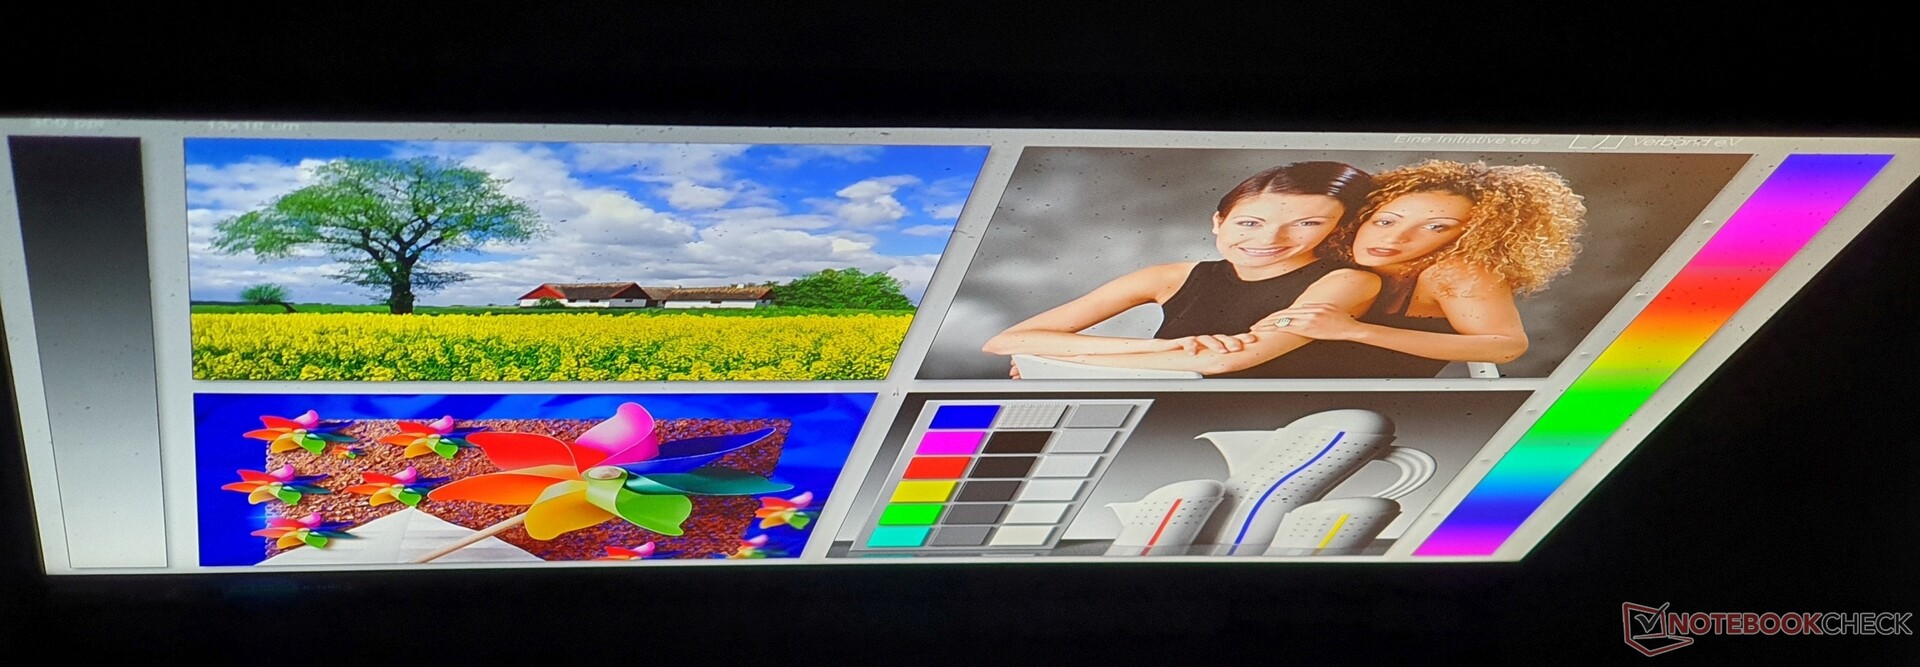
Gracias a la superficie mate de la pantalla del dispositivo y a su brillo de 373 cd/m², la pantalla sigue siendo legible en exteriores, siempre que no le dé la luz directa del sol.
Como es típico en las pantallas IPS, sigue siendo legible incluso desde ángulos de visión extremos.


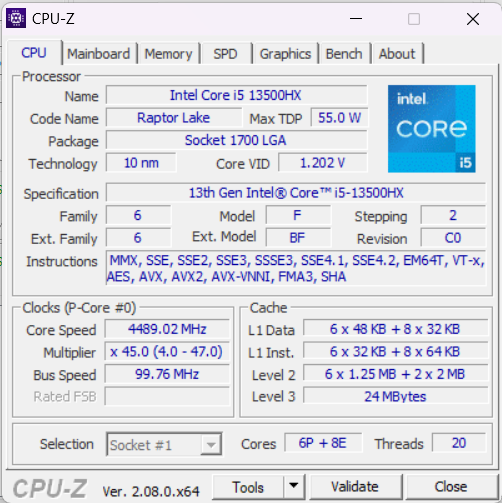
Rendimiento: CPU de clase sobremesa en un portátil para juegos de gama media
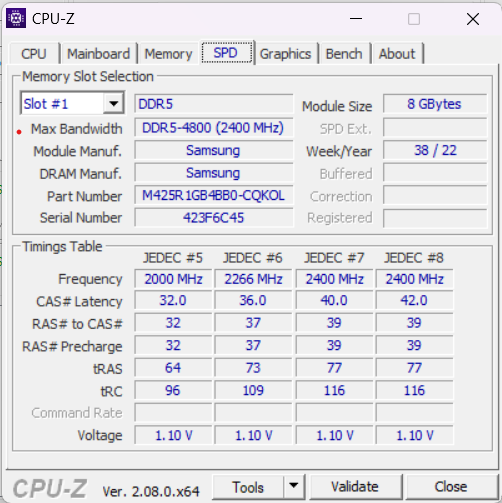
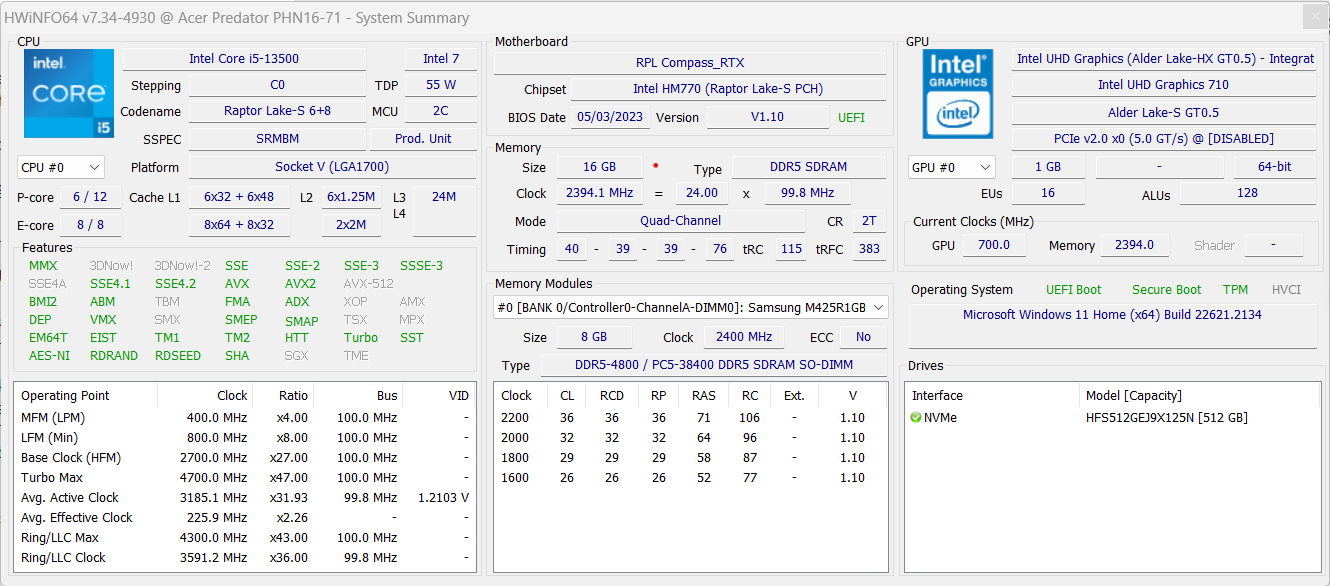
Estamos probando el Acer Predator Helios Neo 16 con un IntelCore i5-13500HX(6 núcleos P + 8 núcleos E), 16 GB de RAM DDR5-4800, una SSD de 512 GB y una Nvidia GeForce RTX 4050con un TGP de 130 vatios. Se pueden encontrar otras variantes, que tienen hasta unCore i9-13900HX(8 núcleos P + 16 núcleos E) y hasta una Nvidia GeForce RTX 4070.
El mercado objetivo de la versión que probamos incluye jugadores que desean jugar a nuevos juegos en resolución FHD+ nativa, pero que también estarán contentos con tasas de FPS de dos dígitos. Otras tareas gráficas también son posibles con este modelo básico del Helios Neo 16, aunque 8 en lugar de 6 GB de VRAM serían ideales para la edición de vídeo 4K en particular.
Condiciones de prueba
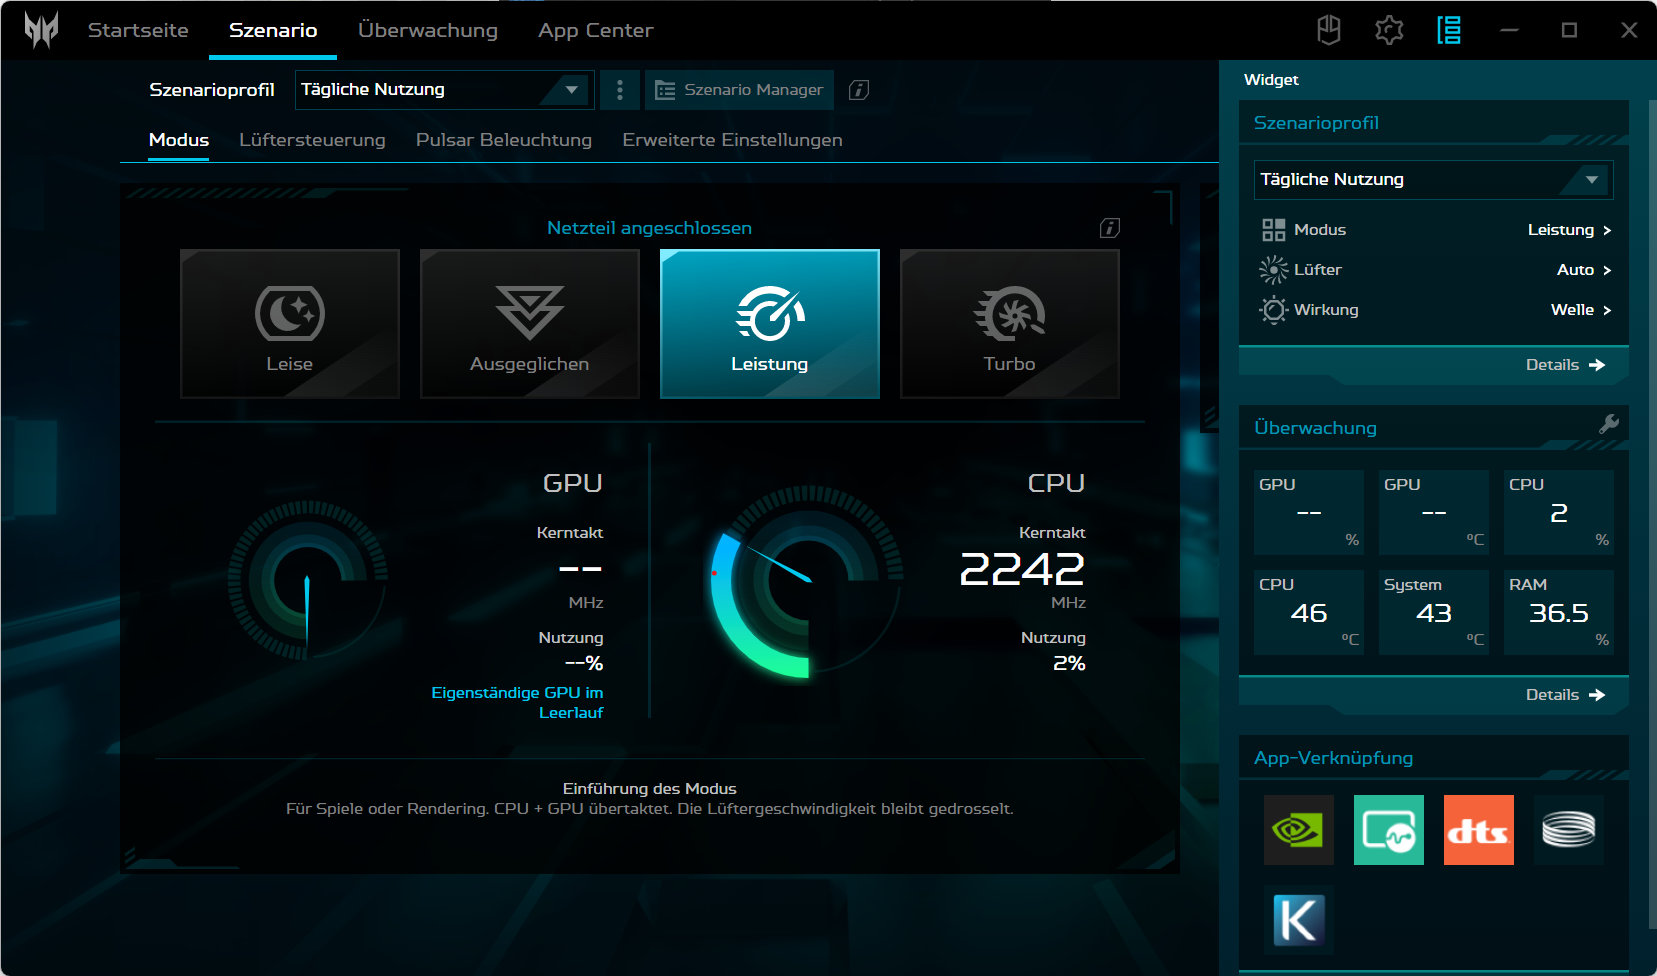
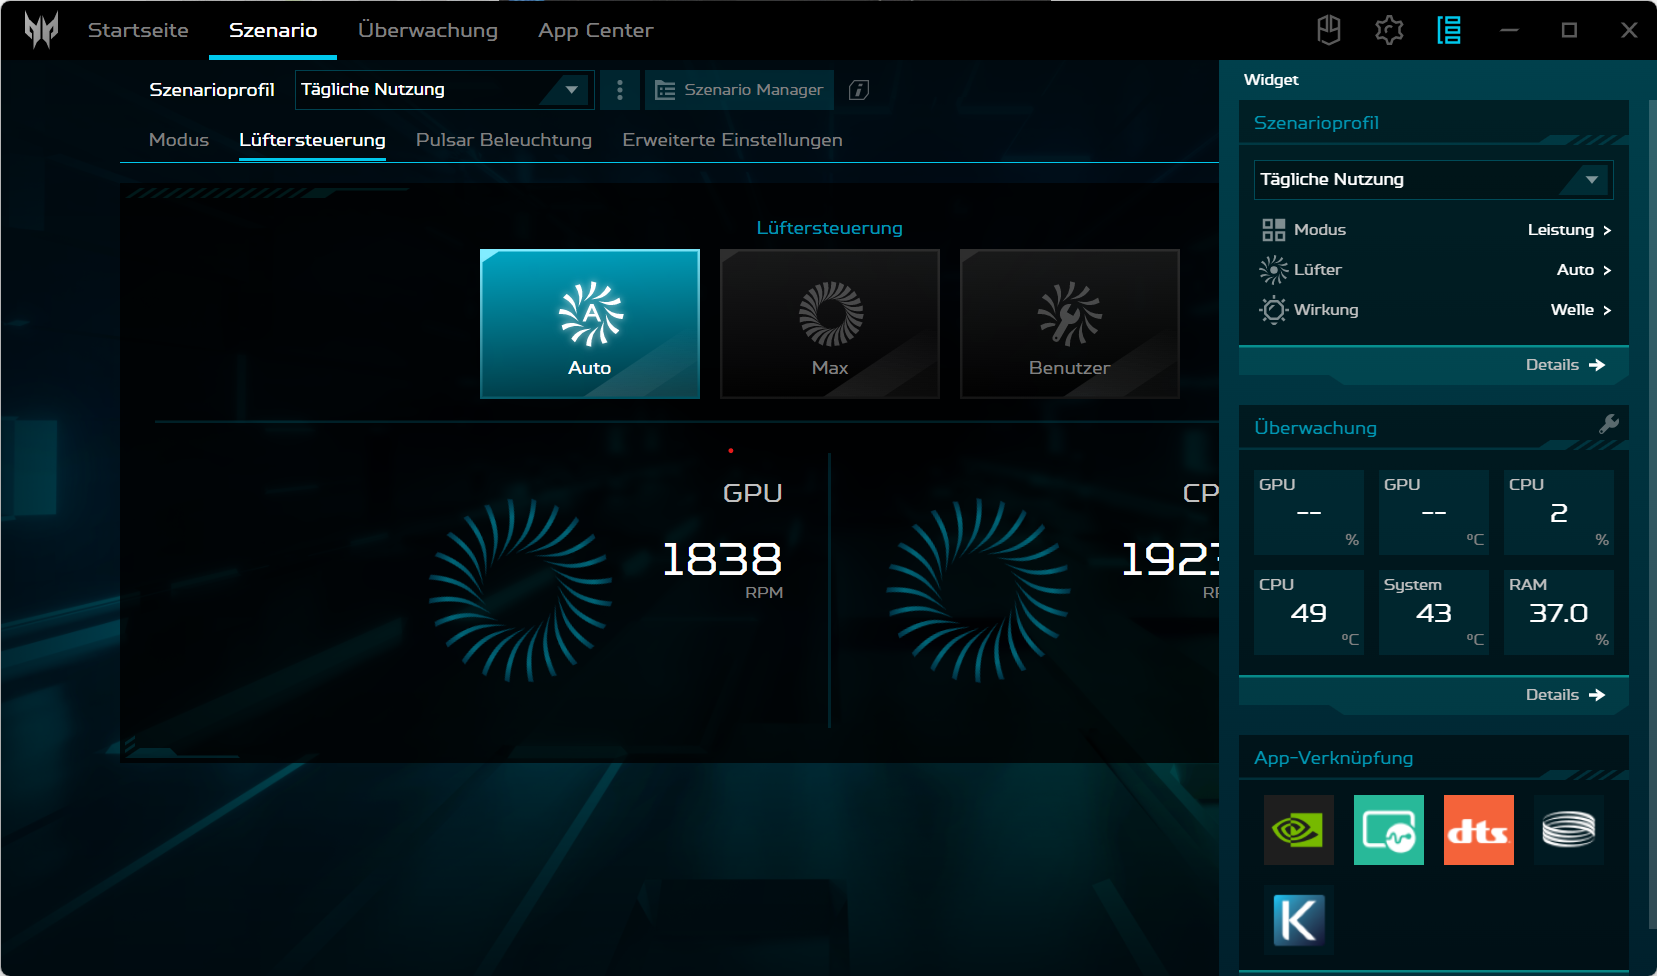
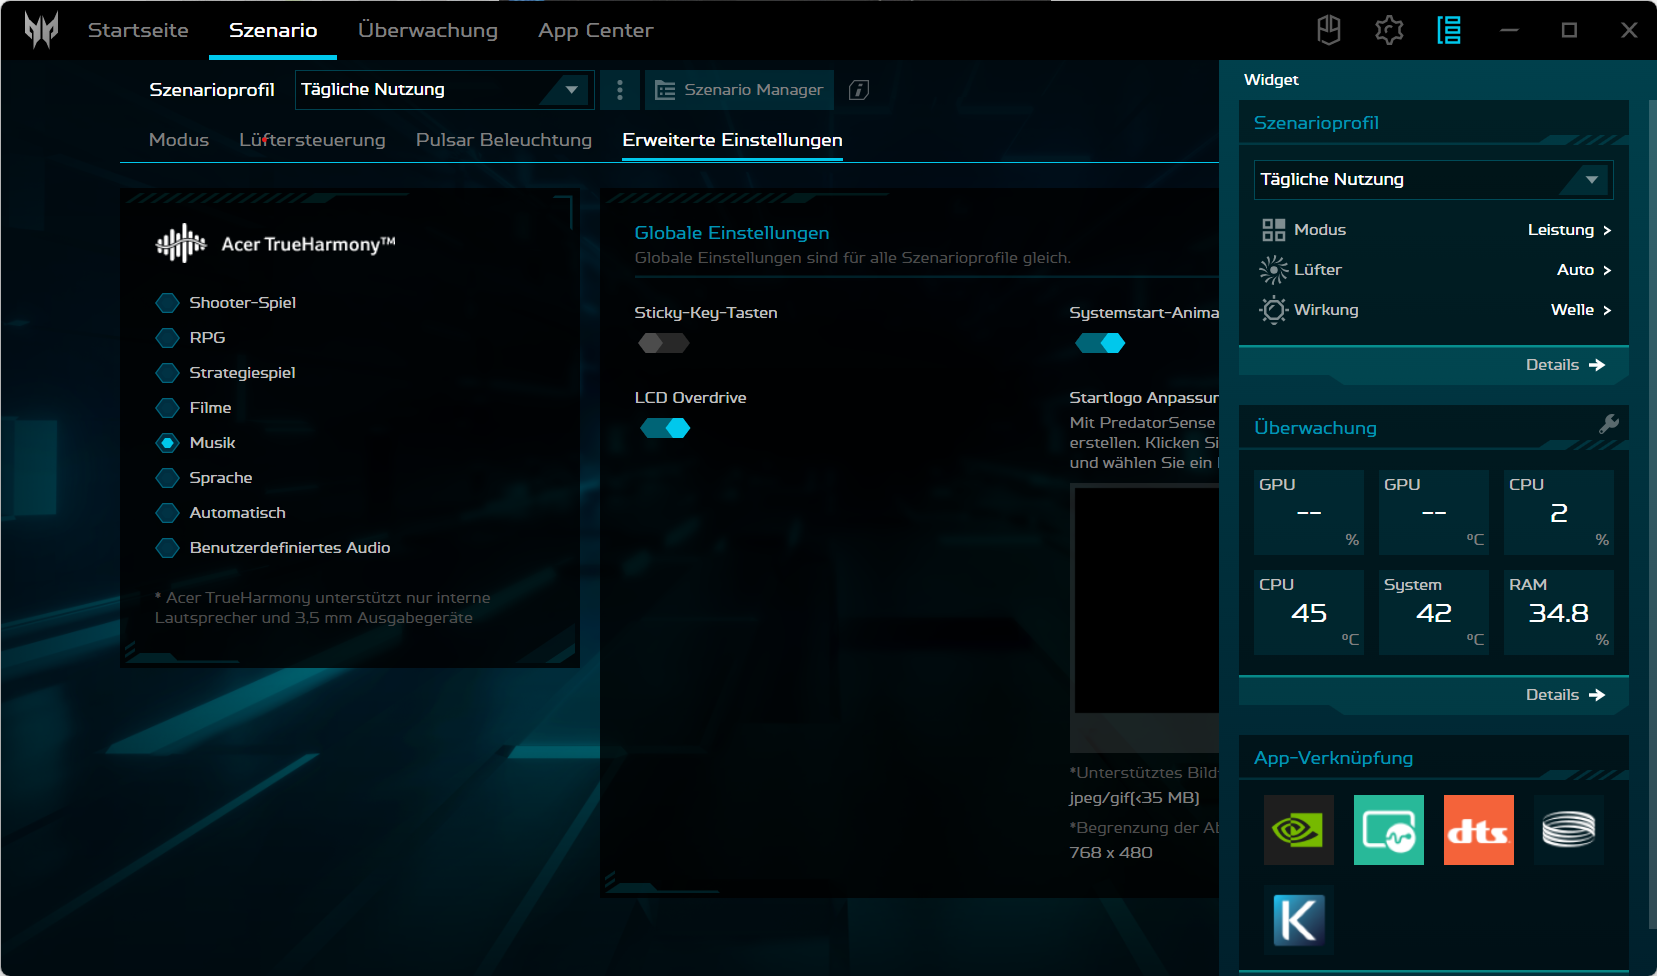
Hay cuatro modos de rendimiento disponibles dentro del software del centro de control de Acer "Predator Sense", entre los que se puede cambiar alternativamente mediante el botón situado a la izquierda encima del teclado. Realizamos nuestras pruebas comparativas relacionadas con el rendimiento en el modo "rendimiento", mientras que el sistema cambió automáticamente al modo "equilibrado" en el modo de batería. El Predator Helios Neo 16 también debe tener un nivel de carga de al menos el 40% para que se puedan controlar los modos de rendimiento.
La siguiente tabla muestra que se pierde muy poco rendimiento de la GPU en el modo equilibrado, mientras que los ventiladores permanecen casi agradablemente silenciosos. El modo turbo, por otro lado, es insoportablemente ruidoso y, por tanto, sólo es útil para largas sesiones de renderizado de vídeo o similares.
| Escenario | Turbo | Rendimiento | Equilibrado | Silencioso | Batería |
|---|---|---|---|---|---|
| CPUPL2 | 147 W | 147 W | 147 W | 147 W | 27 W |
| CPUPL1 | 100 W | 80 W | 70 W | 45 W | 27 W |
| GPU@The Witcher 3 | 88 W | 86 W | 86 W | 56 W | 43 W |
| GPU@FurMark | 130 W | 130 W | 105 W | 80 W | 13 W |
| Rendimiento (El Witcher 3 @FHD/Ultra) | 81 FPS | 79 FPS | 79 FPS | 46 FPS | 30 FPS |
Procesador
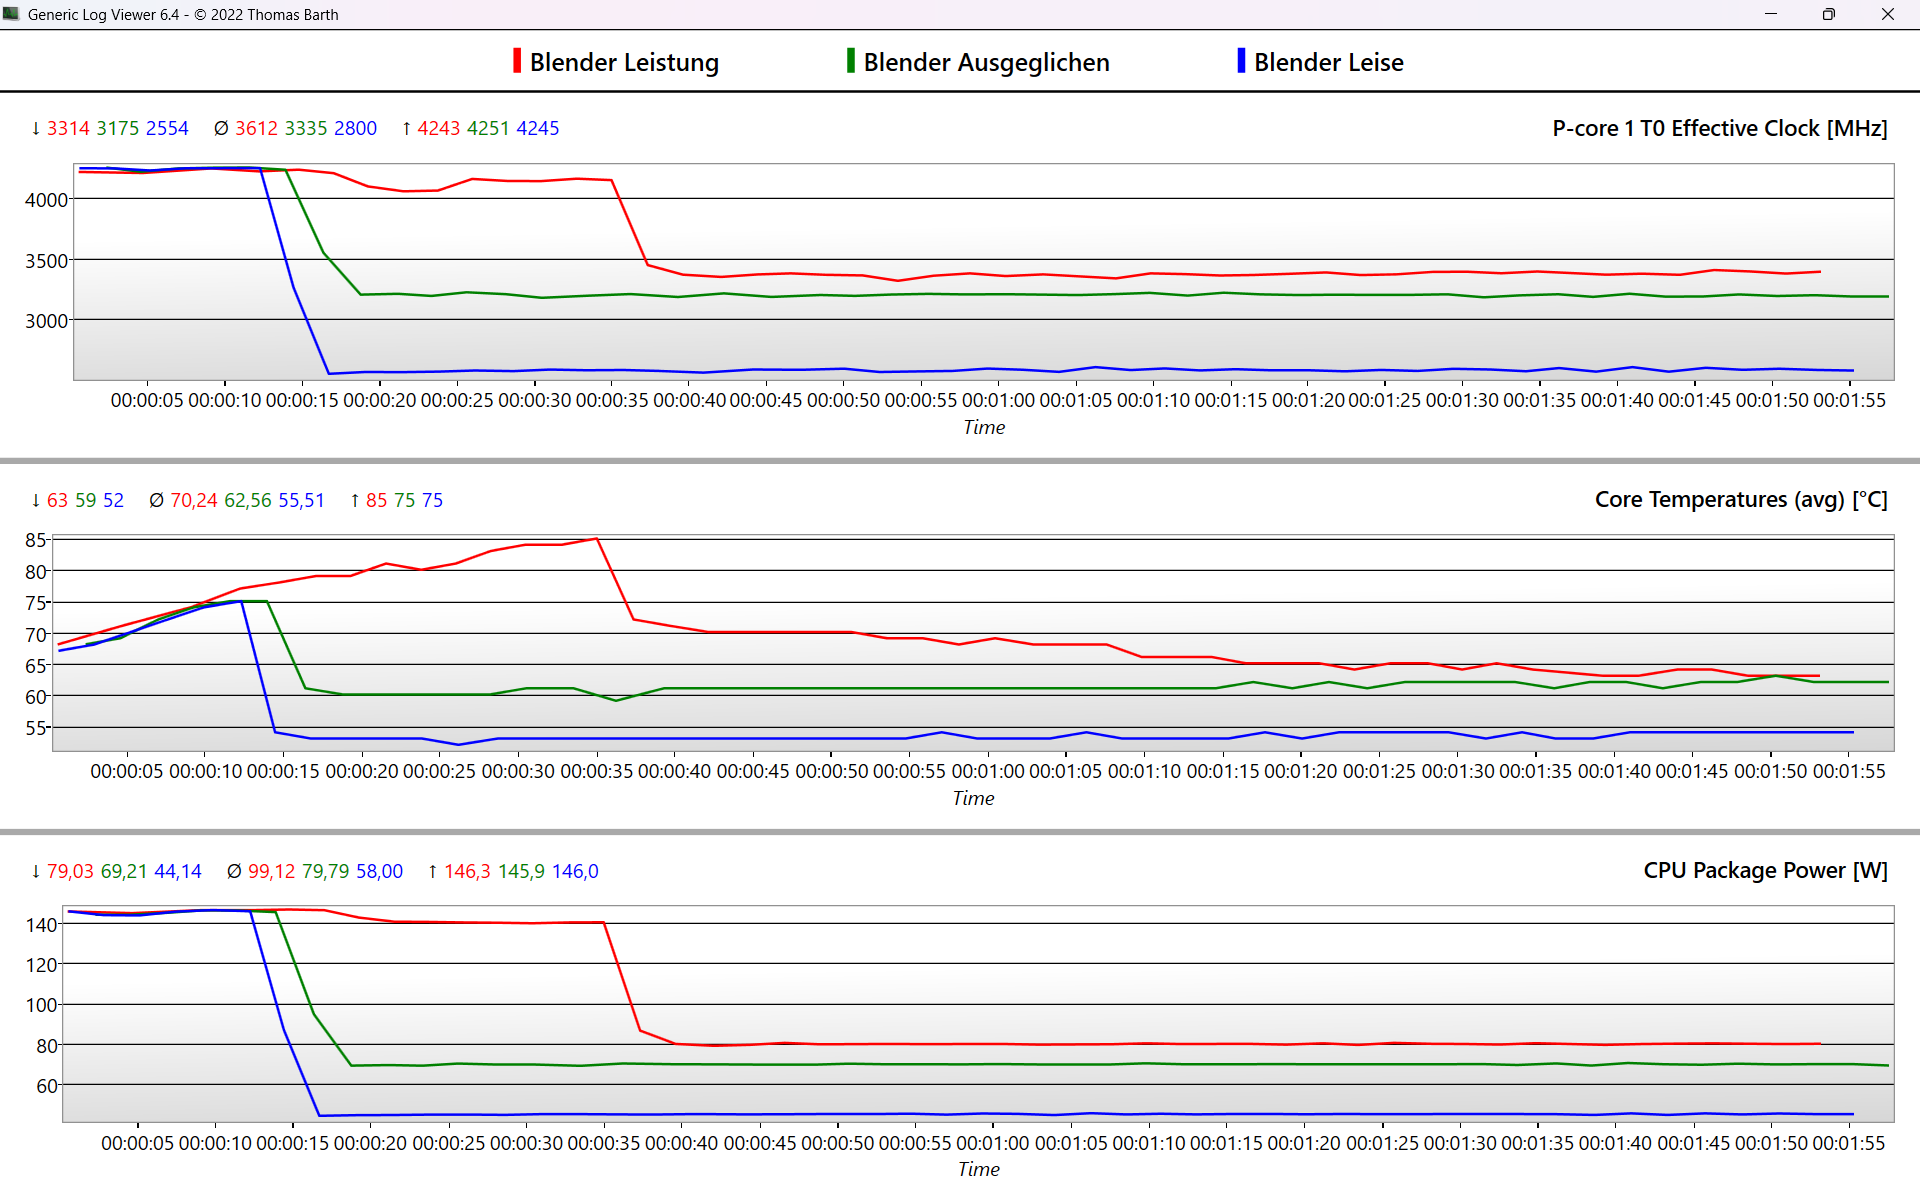
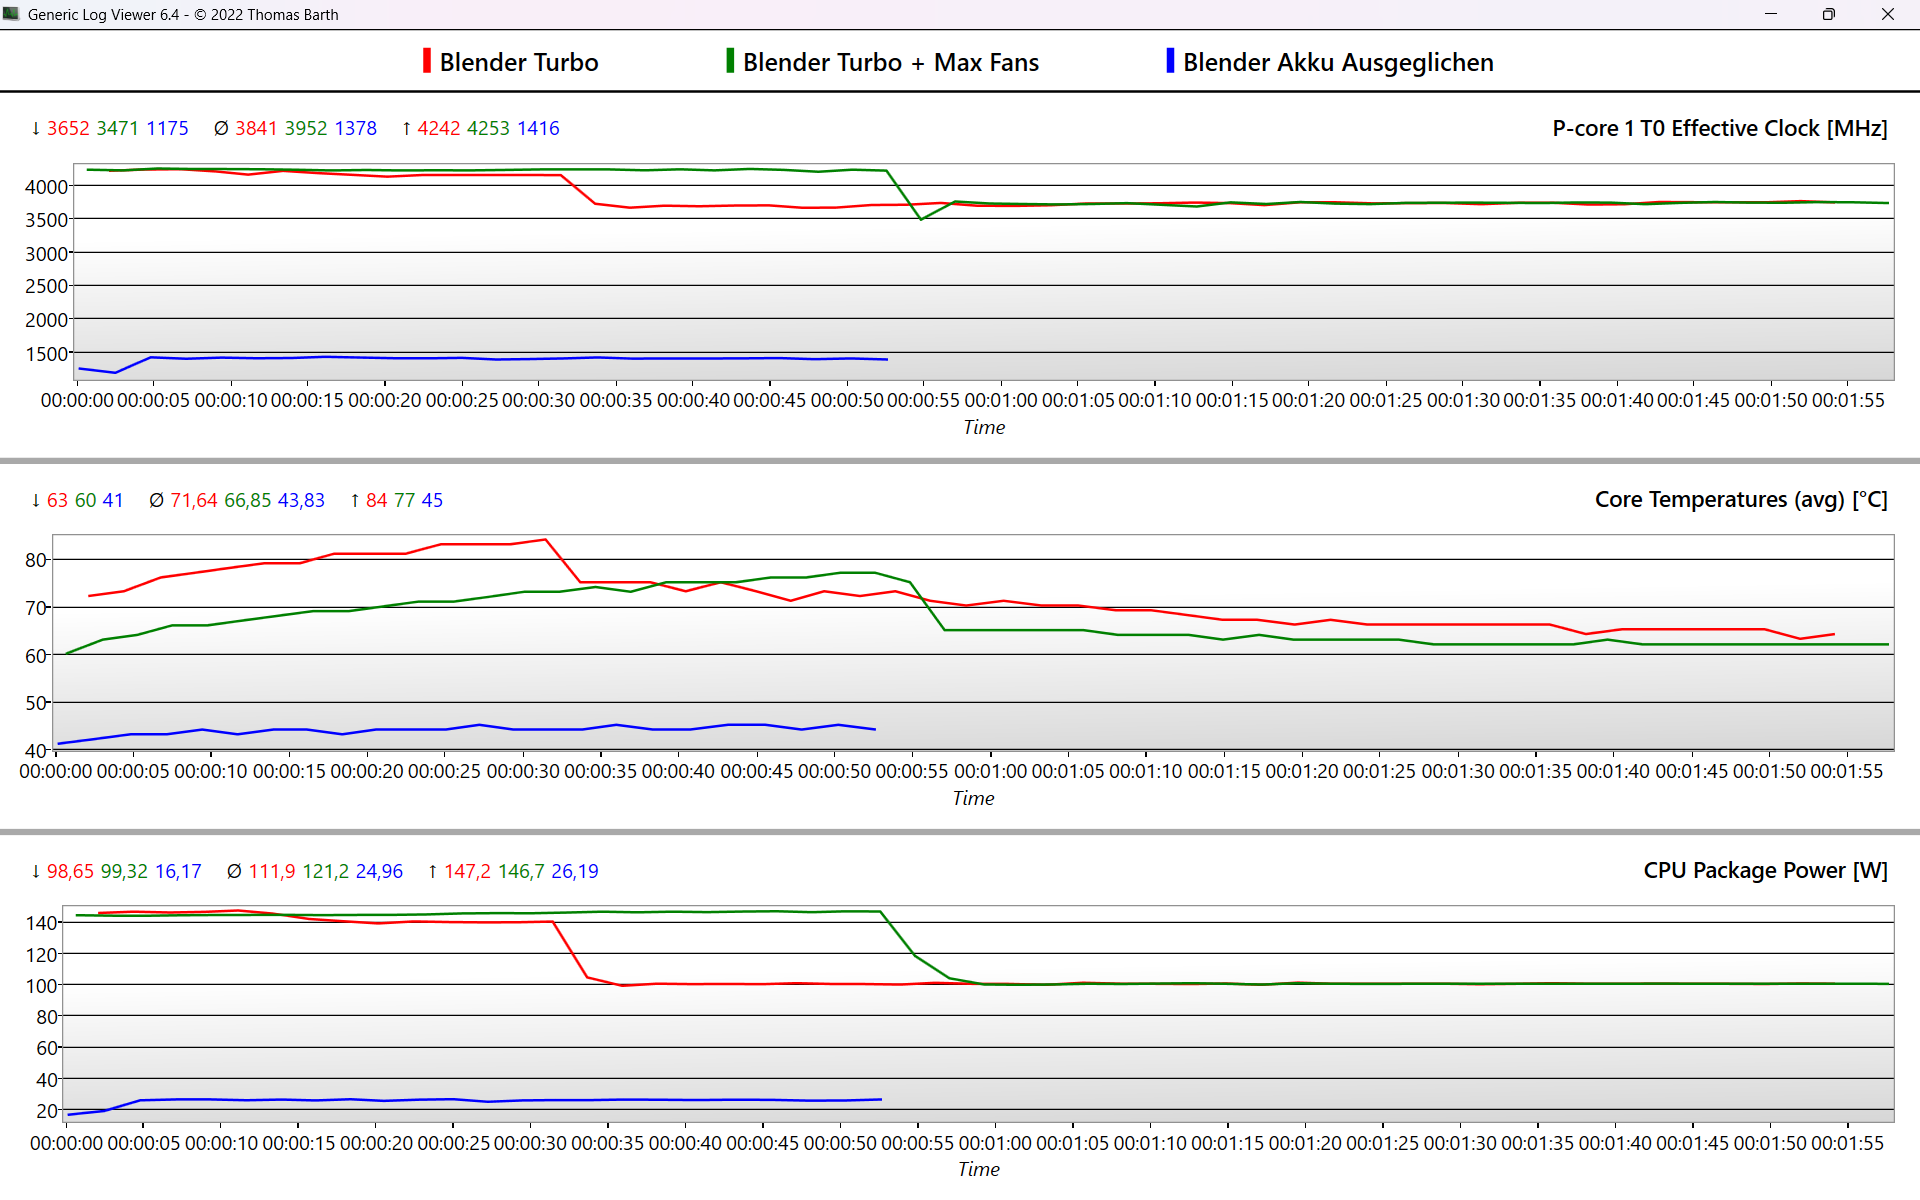
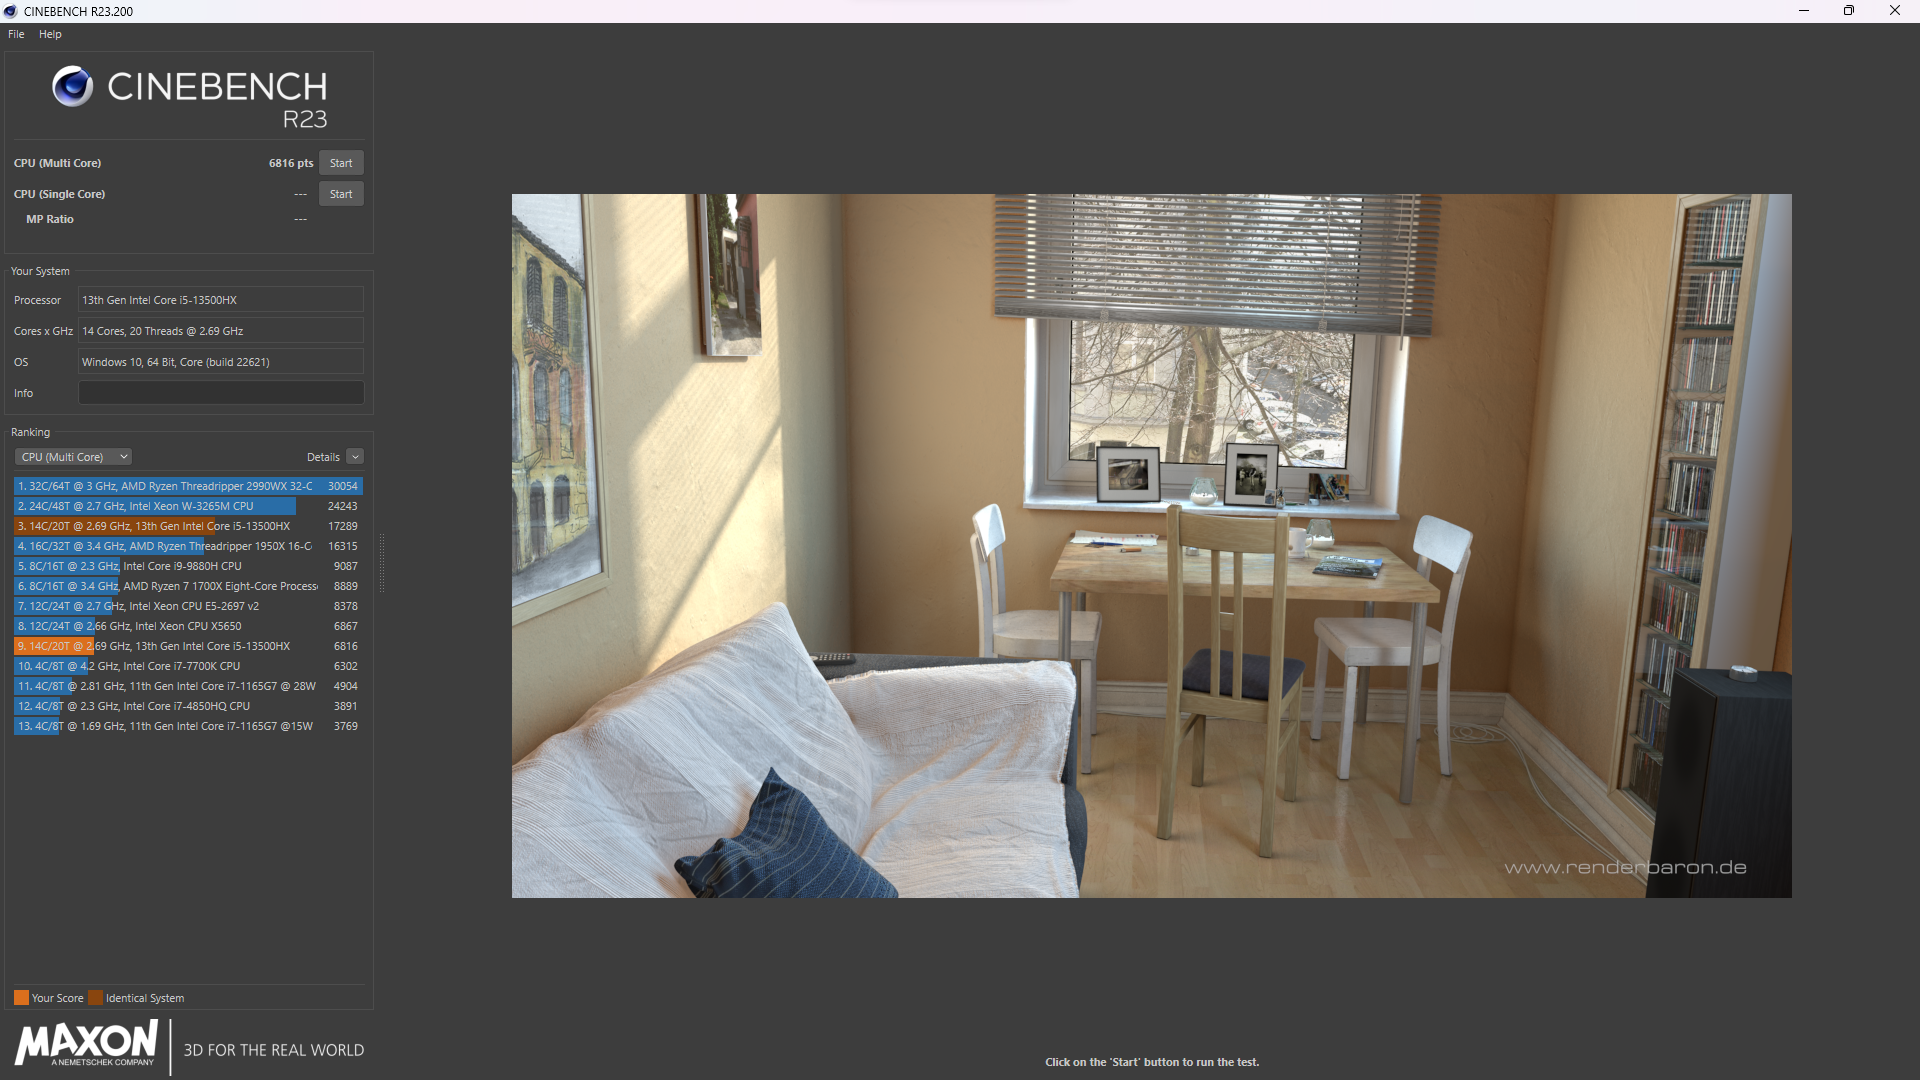
El IntelCore i5-13500HX es un procesador de clase sobremesa con 14 núcleos, 20 hilos (6 núcleos P + 8 núcleos E) y un TDP de 55 vatios. Los núcleos P registran inicialmente una velocidad de reloj de unos 4,2 GHz y, como resultado, apenas alcanzan su Turbo máximo posible de 4,5 GHz. Después de unos 30 segundos, las velocidades de reloj caen ligeramente a 3,8 GHz (modo Turbo) o 3,4 GHz (modo de rendimiento).
En lo que respecta al rendimiento multinúcleo, el Helios Neo quedó un 10% por detrás delDell G15 5530 con un Corei7-13650HX y un 15 % por detrás delHelios 16 con un Core i7-13700HX. El Corei7-12700H de su predecesor directo, el Predator Helios 300fue superado en un 12 % y el AMD de ocho núcleosRyzen 7 7840HS en el SchenkerXMG Apex 15 fue superado en un 20 %.
A partir de la quinta ejecución de Cinebench R15, su rendimiento se ralentizó en torno a un 17 %, pero esto casi se puede evitar activando el modo Turbo ruidoso. El Corei9-13900HX tiene 24 núcleos completos y funciona un 60 % más rápido en tareas multinúcleo dentro del Helios 18. En modo batería, su TDP se limita a unos decepcionantes 27 vatios, lo que se traduce en una caída del rendimiento de casi el 60 %.


Cinebench R15 Multi continuous test
Cinebench R23: Multi Core | Single Core
Cinebench R20: CPU (Multi Core) | CPU (Single Core)
Cinebench R15: CPU Multi 64Bit | CPU Single 64Bit
Blender: v2.79 BMW27 CPU
7-Zip 18.03: 7z b 4 | 7z b 4 -mmt1
Geekbench 5.5: Multi-Core | Single-Core
HWBOT x265 Benchmark v2.2: 4k Preset
LibreOffice : 20 Documents To PDF
R Benchmark 2.5: Overall mean
| CPU Performance rating | |
| Acer Predator Helios 18 N23Q2 | |
| Media de la clase Gaming | |
| Acer Predator Helios 16 PH16-71-731Q | |
| Dell G15 5530 | |
| Acer Predator Helios Neo 16 NH.QLTEG.002 | |
| Schenker XMG Apex 15 (Late 23) | |
| Medio Intel Core i5-13500HX | |
| Lenovo Legion Pro 5 16ARX8 (R5 7645HX, RTX 4050) | |
| Lenovo LOQ 16IRH8 | |
| Acer Predator Helios 300 (i7-12700H, RTX 3070 Ti) | |
| Acer Nitro 16 AN16-41-R7YE | |
| Cinebench R23 / Single Core | |
| Acer Predator Helios 18 N23Q2 | |
| Media de la clase Gaming (1166 - 2415, n=107, últimos 2 años) | |
| Acer Predator Helios 16 PH16-71-731Q | |
| Lenovo LOQ 16IRH8 | |
| Dell G15 5530 | |
| Lenovo Legion Pro 5 16ARX8 (R5 7645HX, RTX 4050) | |
| Acer Predator Helios Neo 16 NH.QLTEG.002 | |
| Schenker XMG Apex 15 (Late 23) | |
| Acer Predator Helios 300 (i7-12700H, RTX 3070 Ti) | |
| Medio Intel Core i5-13500HX (1689 - 1772, n=2) | |
| Acer Nitro 16 AN16-41-R7YE | |
| Cinebench R20 / CPU (Multi Core) | |
| Acer Predator Helios 18 N23Q2 | |
| Media de la clase Gaming (4029 - 16433, n=106, últimos 2 años) | |
| Acer Predator Helios 16 PH16-71-731Q | |
| Dell G15 5530 | |
| Acer Predator Helios Neo 16 NH.QLTEG.002 | |
| Medio Intel Core i5-13500HX (6978 - 7371, n=3) | |
| Schenker XMG Apex 15 (Late 23) | |
| Acer Predator Helios 300 (i7-12700H, RTX 3070 Ti) | |
| Lenovo LOQ 16IRH8 | |
| Lenovo Legion Pro 5 16ARX8 (R5 7645HX, RTX 4050) | |
| Acer Nitro 16 AN16-41-R7YE | |
| Cinebench R20 / CPU (Single Core) | |
| Acer Predator Helios 18 N23Q2 | |
| Media de la clase Gaming (442 - 913, n=106, últimos 2 años) | |
| Acer Predator Helios 16 PH16-71-731Q | |
| Dell G15 5530 | |
| Lenovo LOQ 16IRH8 | |
| Lenovo Legion Pro 5 16ARX8 (R5 7645HX, RTX 4050) | |
| Acer Predator Helios 300 (i7-12700H, RTX 3070 Ti) | |
| Schenker XMG Apex 15 (Late 23) | |
| Acer Predator Helios Neo 16 NH.QLTEG.002 | |
| Medio Intel Core i5-13500HX (648 - 695, n=3) | |
| Acer Nitro 16 AN16-41-R7YE | |
| Cinebench R15 / CPU Single 64Bit | |
| Media de la clase Gaming (188.8 - 350, n=106, últimos 2 años) | |
| Acer Predator Helios 18 N23Q2 | |
| Lenovo Legion Pro 5 16ARX8 (R5 7645HX, RTX 4050) | |
| Schenker XMG Apex 15 (Late 23) | |
| Dell G15 5530 | |
| Acer Predator Helios 16 PH16-71-731Q | |
| Lenovo LOQ 16IRH8 | |
| Acer Predator Helios 300 (i7-12700H, RTX 3070 Ti) | |
| Acer Predator Helios Neo 16 NH.QLTEG.002 | |
| Medio Intel Core i5-13500HX (242 - 263, n=3) | |
| Acer Nitro 16 AN16-41-R7YE | |
| Geekbench 5.5 / Single-Core | |
| Media de la clase Gaming (986 - 2474, n=105, últimos 2 años) | |
| Acer Predator Helios 18 N23Q2 | |
| Lenovo Legion Pro 5 16ARX8 (R5 7645HX, RTX 4050) | |
| Schenker XMG Apex 15 (Late 23) | |
| Acer Predator Helios 16 PH16-71-731Q | |
| Dell G15 5530 | |
| Lenovo LOQ 16IRH8 | |
| Medio Intel Core i5-13500HX (1688 - 1779, n=3) | |
| Acer Predator Helios Neo 16 NH.QLTEG.002 | |
| Acer Predator Helios 300 (i7-12700H, RTX 3070 Ti) | |
| Acer Nitro 16 AN16-41-R7YE | |
| HWBOT x265 Benchmark v2.2 / 4k Preset | |
| Acer Predator Helios 18 N23Q2 | |
| Media de la clase Gaming (11.5 - 44.4, n=105, últimos 2 años) | |
| Acer Predator Helios 16 PH16-71-731Q | |
| Dell G15 5530 | |
| Medio Intel Core i5-13500HX (20.3 - 20.9, n=3) | |
| Acer Predator Helios Neo 16 NH.QLTEG.002 | |
| Schenker XMG Apex 15 (Late 23) | |
| Lenovo Legion Pro 5 16ARX8 (R5 7645HX, RTX 4050) | |
| Lenovo LOQ 16IRH8 | |
| Acer Predator Helios 300 (i7-12700H, RTX 3070 Ti) | |
| Acer Nitro 16 AN16-41-R7YE | |
| LibreOffice / 20 Documents To PDF | |
| Acer Predator Helios 300 (i7-12700H, RTX 3070 Ti) | |
| Lenovo Legion Pro 5 16ARX8 (R5 7645HX, RTX 4050) | |
| Media de la clase Gaming (33.2 - 88.8, n=105, últimos 2 años) | |
| Acer Predator Helios 18 N23Q2 | |
| Dell G15 5530 | |
| Acer Nitro 16 AN16-41-R7YE | |
| Lenovo LOQ 16IRH8 | |
| Acer Predator Helios Neo 16 NH.QLTEG.002 | |
| Schenker XMG Apex 15 (Late 23) | |
| Medio Intel Core i5-13500HX (42.5 - 45, n=2) | |
| Acer Predator Helios 16 PH16-71-731Q | |
| R Benchmark 2.5 / Overall mean | |
| Acer Nitro 16 AN16-41-R7YE | |
| Medio Intel Core i5-13500HX (0.4512 - 0.4891, n=3) | |
| Acer Predator Helios Neo 16 NH.QLTEG.002 | |
| Acer Predator Helios 300 (i7-12700H, RTX 3070 Ti) | |
| Lenovo LOQ 16IRH8 | |
| Schenker XMG Apex 15 (Late 23) | |
| Lenovo Legion Pro 5 16ARX8 (R5 7645HX, RTX 4050) | |
| Media de la clase Gaming (0.3439 - 0.759, n=106, últimos 2 años) | |
| Acer Predator Helios 16 PH16-71-731Q | |
| Dell G15 5530 | |
| Acer Predator Helios 18 N23Q2 | |
* ... más pequeño es mejor
AIDA64: FP32 Ray-Trace | FPU Julia | CPU SHA3 | CPU Queen | FPU SinJulia | FPU Mandel | CPU AES | CPU ZLib | FP64 Ray-Trace | CPU PhotoWorxx
| Performance rating | |
| Media de la clase Gaming | |
| Schenker XMG Apex 15 (Late 23) | |
| Dell G15 5530 | |
| Acer Predator Helios Neo 16 NH.QLTEG.002 | |
| Medio Intel Core i5-13500HX | |
| Lenovo Legion Pro 5 16ARX8 (R5 7645HX, RTX 4050) | |
| HP Victus 16-r0076TX | |
| Lenovo LOQ 16IRH8 | |
| AIDA64 / FP32 Ray-Trace | |
| Media de la clase Gaming (10227 - 85542, n=105, últimos 2 años) | |
| Schenker XMG Apex 15 (Late 23) | |
| Lenovo Legion Pro 5 16ARX8 (R5 7645HX, RTX 4050) | |
| Dell G15 5530 | |
| Medio Intel Core i5-13500HX (15888 - 16544, n=3) | |
| Acer Predator Helios Neo 16 NH.QLTEG.002 | |
| HP Victus 16-r0076TX | |
| Lenovo LOQ 16IRH8 | |
| AIDA64 / FPU Julia | |
| Media de la clase Gaming (51376 - 238426, n=105, últimos 2 años) | |
| Schenker XMG Apex 15 (Late 23) | |
| Lenovo Legion Pro 5 16ARX8 (R5 7645HX, RTX 4050) | |
| Dell G15 5530 | |
| HP Victus 16-r0076TX | |
| Medio Intel Core i5-13500HX (80761 - 85623, n=3) | |
| Acer Predator Helios Neo 16 NH.QLTEG.002 | |
| Lenovo LOQ 16IRH8 | |
| AIDA64 / CPU SHA3 | |
| Media de la clase Gaming (2180 - 10115, n=105, últimos 2 años) | |
| Dell G15 5530 | |
| Schenker XMG Apex 15 (Late 23) | |
| Medio Intel Core i5-13500HX (3868 - 4017, n=3) | |
| HP Victus 16-r0076TX | |
| Acer Predator Helios Neo 16 NH.QLTEG.002 | |
| Lenovo Legion Pro 5 16ARX8 (R5 7645HX, RTX 4050) | |
| Lenovo LOQ 16IRH8 | |
| AIDA64 / CPU Queen | |
| Media de la clase Gaming (49785 - 173351, n=90, últimos 2 años) | |
| Dell G15 5530 | |
| Acer Predator Helios Neo 16 NH.QLTEG.002 | |
| Medio Intel Core i5-13500HX (105168 - 107075, n=3) | |
| Schenker XMG Apex 15 (Late 23) | |
| HP Victus 16-r0076TX | |
| Lenovo Legion Pro 5 16ARX8 (R5 7645HX, RTX 4050) | |
| Lenovo LOQ 16IRH8 | |
| AIDA64 / FPU SinJulia | |
| Schenker XMG Apex 15 (Late 23) | |
| Media de la clase Gaming (4424 - 33636, n=105, últimos 2 años) | |
| Lenovo Legion Pro 5 16ARX8 (R5 7645HX, RTX 4050) | |
| Dell G15 5530 | |
| Medio Intel Core i5-13500HX (10334 - 10793, n=3) | |
| Acer Predator Helios Neo 16 NH.QLTEG.002 | |
| HP Victus 16-r0076TX | |
| Lenovo LOQ 16IRH8 | |
| AIDA64 / FPU Mandel | |
| Media de la clase Gaming (25115 - 128721, n=105, últimos 2 años) | |
| Schenker XMG Apex 15 (Late 23) | |
| Lenovo Legion Pro 5 16ARX8 (R5 7645HX, RTX 4050) | |
| Dell G15 5530 | |
| Medio Intel Core i5-13500HX (39805 - 41418, n=3) | |
| Acer Predator Helios Neo 16 NH.QLTEG.002 | |
| HP Victus 16-r0076TX | |
| Lenovo LOQ 16IRH8 | |
| AIDA64 / CPU AES | |
| Schenker XMG Apex 15 (Late 23) | |
| Acer Predator Helios Neo 16 NH.QLTEG.002 | |
| Media de la clase Gaming (39258 - 247074, n=105, últimos 2 años) | |
| Medio Intel Core i5-13500HX (79903 - 154368, n=3) | |
| Dell G15 5530 | |
| HP Victus 16-r0076TX | |
| Lenovo LOQ 16IRH8 | |
| Lenovo Legion Pro 5 16ARX8 (R5 7645HX, RTX 4050) | |
| AIDA64 / CPU ZLib | |
| Media de la clase Gaming (574 - 2531, n=105, últimos 2 años) | |
| Dell G15 5530 | |
| Acer Predator Helios Neo 16 NH.QLTEG.002 | |
| Medio Intel Core i5-13500HX (1104 - 1233, n=3) | |
| HP Victus 16-r0076TX | |
| Schenker XMG Apex 15 (Late 23) | |
| Lenovo Legion Pro 5 16ARX8 (R5 7645HX, RTX 4050) | |
| Lenovo LOQ 16IRH8 | |
| AIDA64 / FP64 Ray-Trace | |
| Media de la clase Gaming (5509 - 45446, n=105, últimos 2 años) | |
| Schenker XMG Apex 15 (Late 23) | |
| Lenovo Legion Pro 5 16ARX8 (R5 7645HX, RTX 4050) | |
| Dell G15 5530 | |
| Medio Intel Core i5-13500HX (8587 - 9008, n=3) | |
| Acer Predator Helios Neo 16 NH.QLTEG.002 | |
| HP Victus 16-r0076TX | |
| Lenovo LOQ 16IRH8 | |
| AIDA64 / CPU PhotoWorxx | |
| Media de la clase Gaming (12271 - 89891, n=105, últimos 2 años) | |
| Medio Intel Core i5-13500HX (36861 - 42683, n=3) | |
| Dell G15 5530 | |
| HP Victus 16-r0076TX | |
| Acer Predator Helios Neo 16 NH.QLTEG.002 | |
| Schenker XMG Apex 15 (Late 23) | |
| Lenovo LOQ 16IRH8 | |
| Lenovo Legion Pro 5 16ARX8 (R5 7645HX, RTX 4050) | |
Rendimiento del sistema
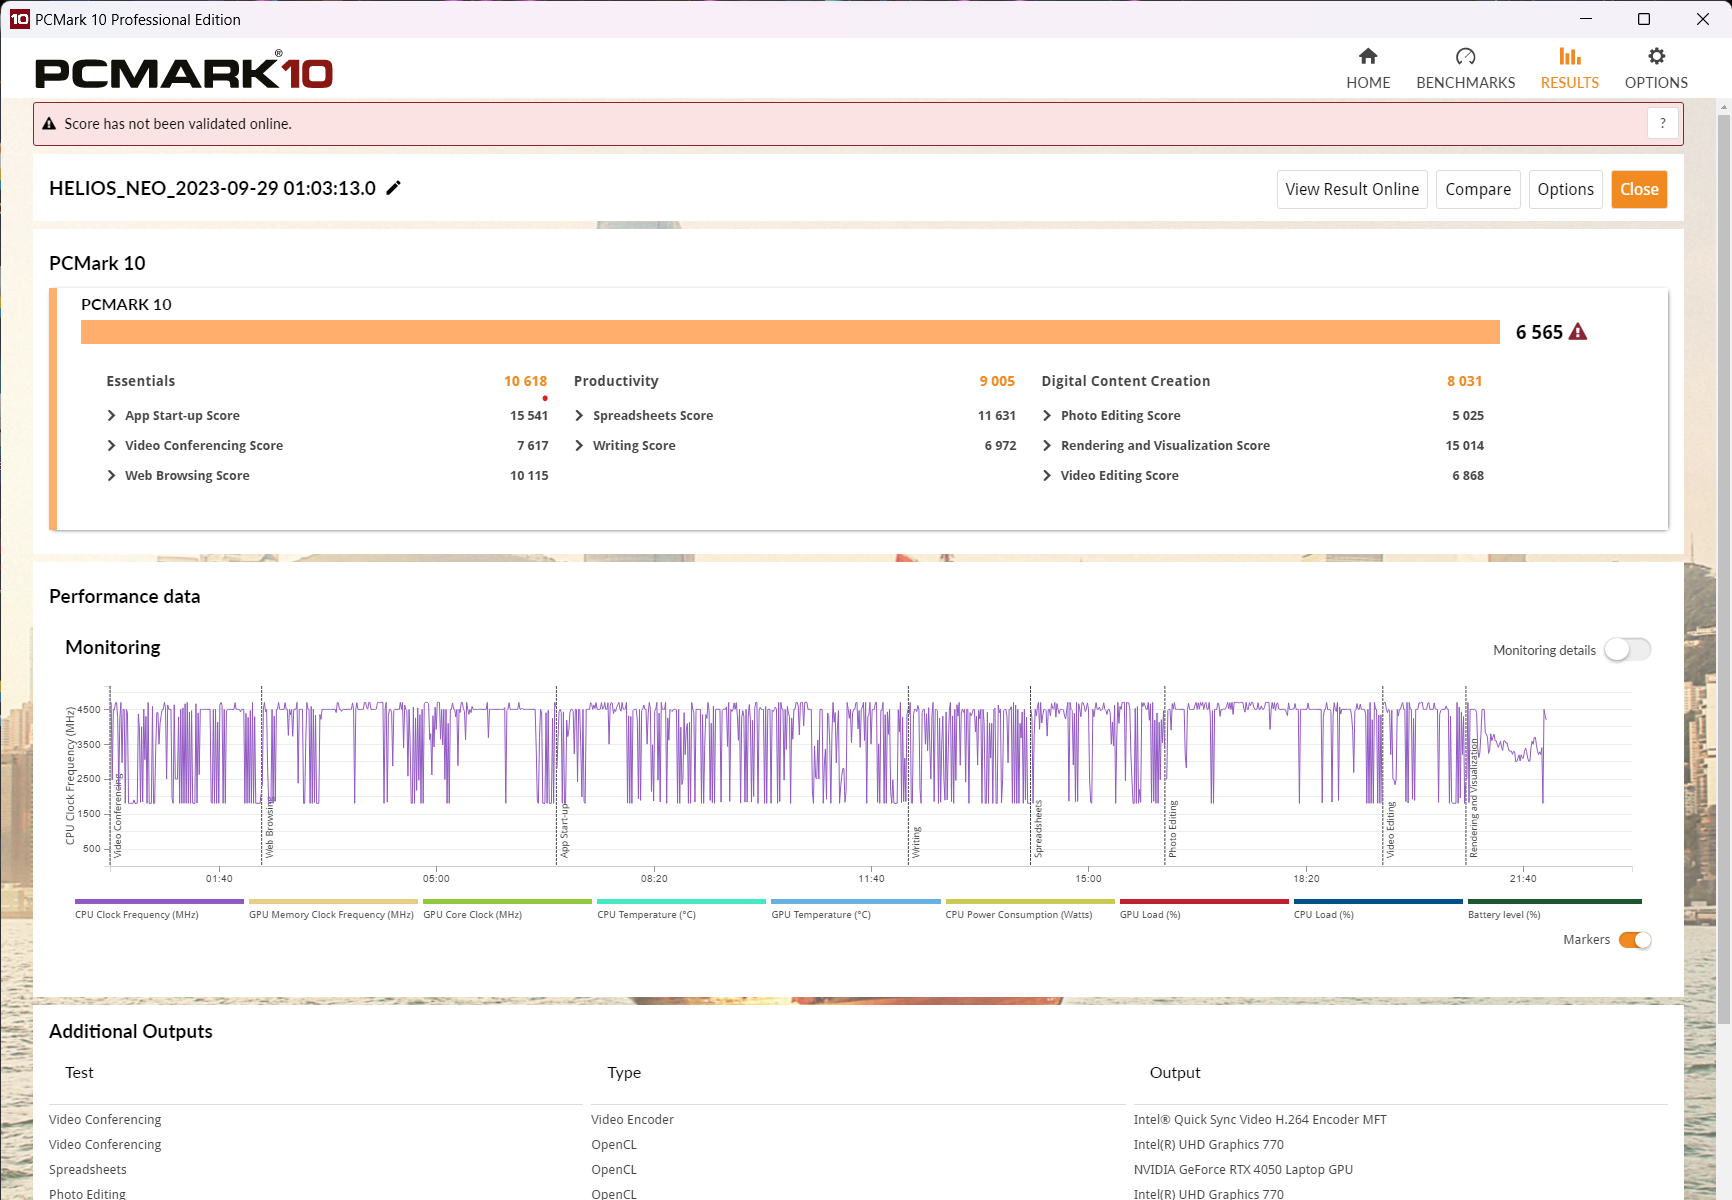
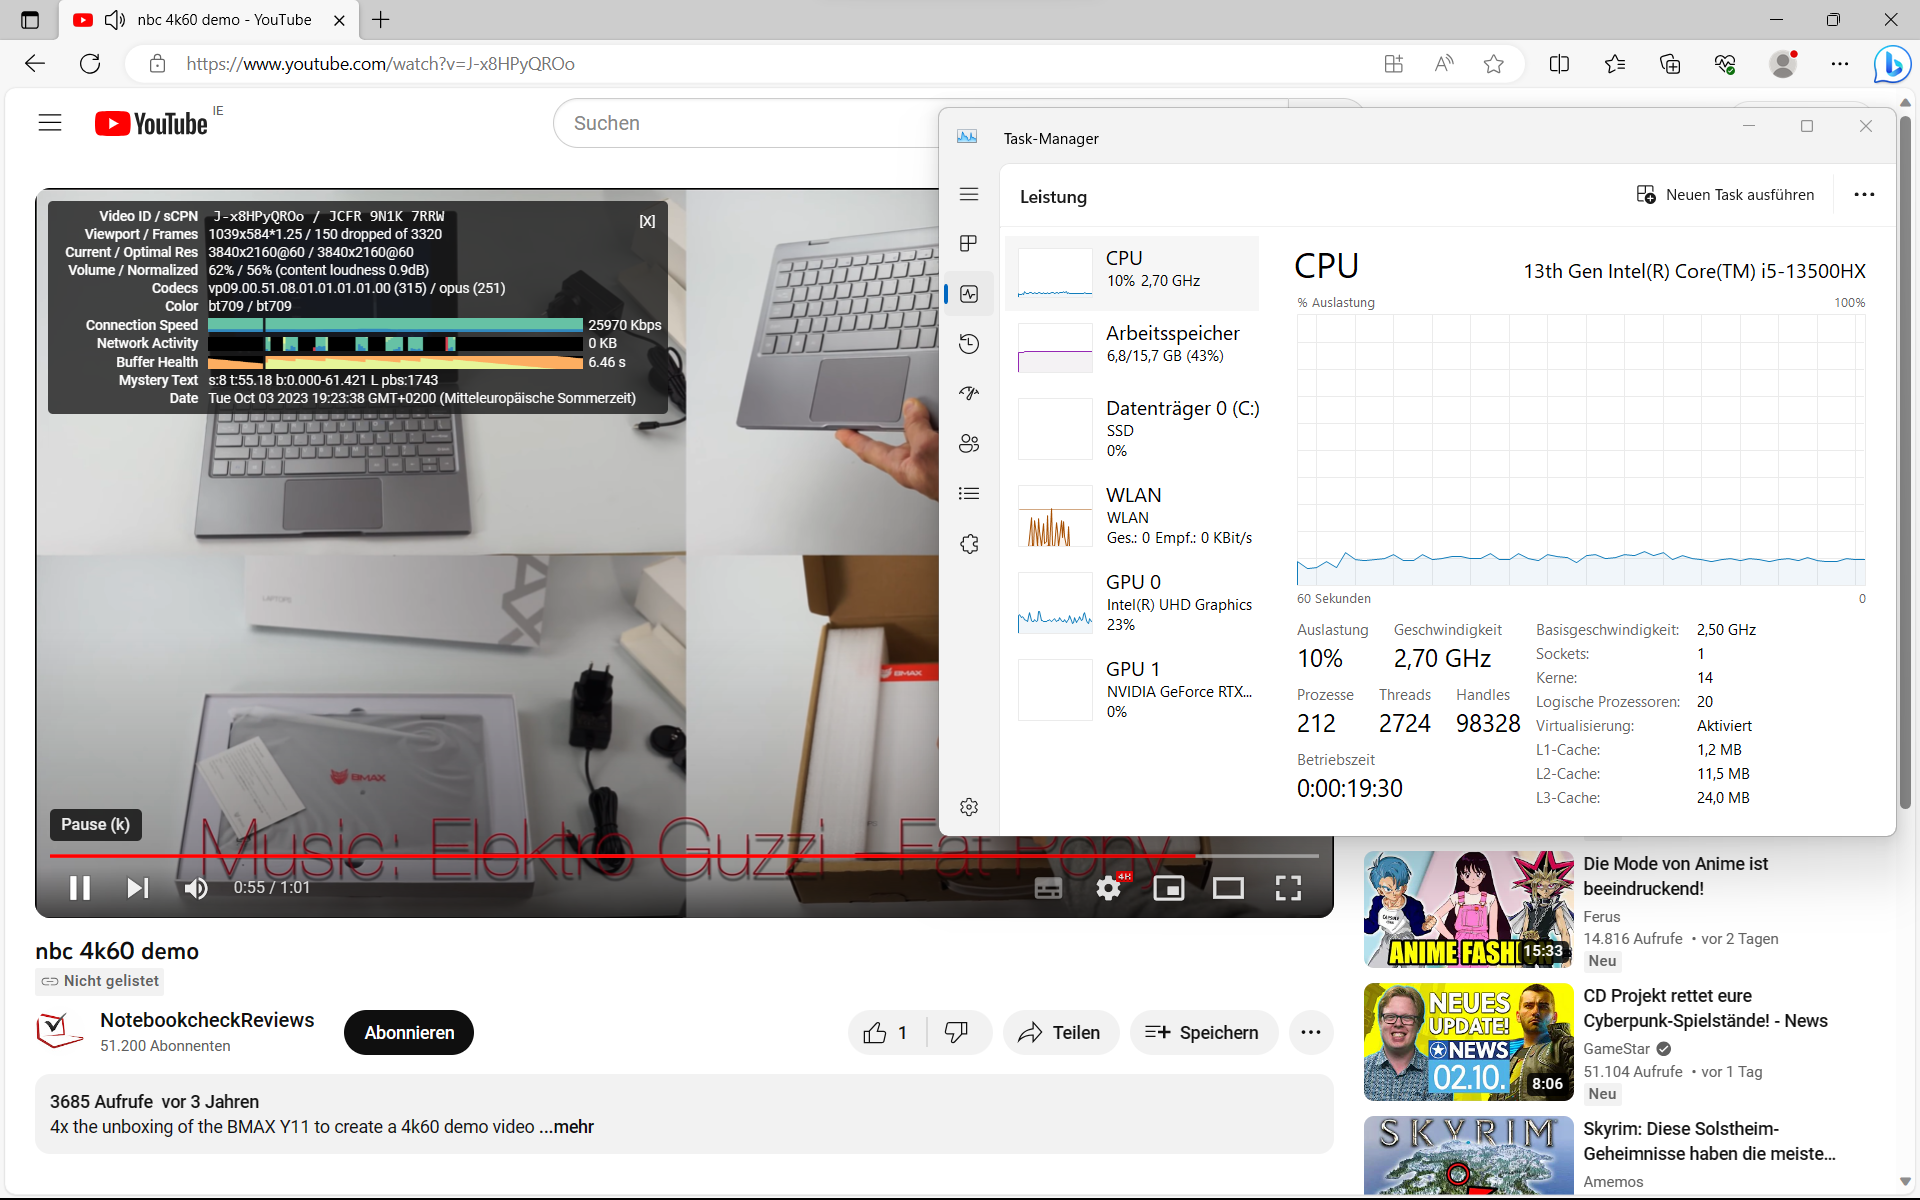
El portátil para juegos de Acer tiene una gran capacidad de respuesta durante las tareas cotidianas. Navegar por Internet mientras se reproduce YouTube en 4K parece un día de fiesta para el sistema Intel HX. Durante el benchmark PCMark 10, el Predator Helios Neo quedó por detrás de los sistemas AMD LenovoLegion Pro 5 y SchenkerXMG Apex 15 en alrededor de un 30 %, especialmente en lo que se refiere a la creación de contenidos. Sin embargo, el Neo casi alcanzó la primera posición durante la prueba Crossmark.
Su rendimiento en navegación web, por ejemplo utilizando Mozilla Kraken 1.1 y WebXPRT, es muy bueno gracias al fuerte rendimiento de un solo núcleo del portátil - pero no tan bueno como el Legion Pro 5.
CrossMark: Overall | Productivity | Creativity | Responsiveness
Mozilla Kraken 1.1: Total
Octane V2: Total Score
Speedometer 2.0: Result 2.0
Jetstream 2: 2.0 Total
WebXPRT 3: Overall
WebXPRT 4: Overall
| PCMark 10 / Score | |
| Media de la clase Gaming (5828 - 12414, n=93, últimos 2 años) | |
| Lenovo Legion Pro 5 16ARX8 (R5 7645HX, RTX 4050) | |
| Schenker XMG Apex 15 (Late 23) | |
| Dell G15 5530 | |
| Lenovo LOQ 16IRH8 | |
| Acer Predator Helios Neo 16 NH.QLTEG.002 | |
| Medio Intel Core i5-13500HX, NVIDIA GeForce RTX 4050 Laptop GPU (6125 - 6565, n=2) | |
| HP Victus 16-r0076TX | |
| PCMark 10 / Essentials | |
| Lenovo Legion Pro 5 16ARX8 (R5 7645HX, RTX 4050) | |
| Dell G15 5530 | |
| Schenker XMG Apex 15 (Late 23) | |
| Media de la clase Gaming (8810 - 11935, n=97, últimos 2 años) | |
| Acer Predator Helios Neo 16 NH.QLTEG.002 | |
| Medio Intel Core i5-13500HX, NVIDIA GeForce RTX 4050 Laptop GPU (9625 - 10618, n=2) | |
| Lenovo LOQ 16IRH8 | |
| HP Victus 16-r0076TX | |
| PCMark 10 / Productivity | |
| Media de la clase Gaming (6845 - 25323, n=95, últimos 2 años) | |
| Lenovo Legion Pro 5 16ARX8 (R5 7645HX, RTX 4050) | |
| Schenker XMG Apex 15 (Late 23) | |
| Dell G15 5530 | |
| Acer Predator Helios Neo 16 NH.QLTEG.002 | |
| Medio Intel Core i5-13500HX, NVIDIA GeForce RTX 4050 Laptop GPU (8471 - 9005, n=2) | |
| Lenovo LOQ 16IRH8 | |
| HP Victus 16-r0076TX | |
| PCMark 10 / Digital Content Creation | |
| Media de la clase Gaming (7602 - 19954, n=95, últimos 2 años) | |
| Schenker XMG Apex 15 (Late 23) | |
| Lenovo Legion Pro 5 16ARX8 (R5 7645HX, RTX 4050) | |
| Lenovo LOQ 16IRH8 | |
| Dell G15 5530 | |
| Acer Predator Helios Neo 16 NH.QLTEG.002 | |
| Medio Intel Core i5-13500HX, NVIDIA GeForce RTX 4050 Laptop GPU (7649 - 8031, n=2) | |
| HP Victus 16-r0076TX | |
| CrossMark / Overall | |
| Media de la clase Gaming (1366 - 2409, n=94, últimos 2 años) | |
| Acer Predator Helios Neo 16 NH.QLTEG.002 | |
| Lenovo LOQ 16IRH8 | |
| Lenovo Legion Pro 5 16ARX8 (R5 7645HX, RTX 4050) | |
| Dell G15 5530 | |
| Medio Intel Core i5-13500HX, NVIDIA GeForce RTX 4050 Laptop GPU (1701 - 1964, n=2) | |
| Schenker XMG Apex 15 (Late 23) | |
| HP Victus 16-r0076TX | |
| CrossMark / Productivity | |
| Lenovo Legion Pro 5 16ARX8 (R5 7645HX, RTX 4050) | |
| Acer Predator Helios Neo 16 NH.QLTEG.002 | |
| Lenovo LOQ 16IRH8 | |
| Media de la clase Gaming (1386 - 2254, n=94, últimos 2 años) | |
| Dell G15 5530 | |
| Medio Intel Core i5-13500HX, NVIDIA GeForce RTX 4050 Laptop GPU (1585 - 1878, n=2) | |
| Schenker XMG Apex 15 (Late 23) | |
| HP Victus 16-r0076TX | |
| CrossMark / Creativity | |
| Media de la clase Gaming (1343 - 2786, n=94, últimos 2 años) | |
| Dell G15 5530 | |
| Lenovo LOQ 16IRH8 | |
| Lenovo Legion Pro 5 16ARX8 (R5 7645HX, RTX 4050) | |
| Acer Predator Helios Neo 16 NH.QLTEG.002 | |
| Medio Intel Core i5-13500HX, NVIDIA GeForce RTX 4050 Laptop GPU (1912 - 2022, n=2) | |
| Schenker XMG Apex 15 (Late 23) | |
| HP Victus 16-r0076TX | |
| CrossMark / Responsiveness | |
| Acer Predator Helios Neo 16 NH.QLTEG.002 | |
| Lenovo LOQ 16IRH8 | |
| Lenovo Legion Pro 5 16ARX8 (R5 7645HX, RTX 4050) | |
| Medio Intel Core i5-13500HX, NVIDIA GeForce RTX 4050 Laptop GPU (1478 - 2053, n=2) | |
| Media de la clase Gaming (1226 - 2334, n=94, últimos 2 años) | |
| Dell G15 5530 | |
| Schenker XMG Apex 15 (Late 23) | |
| HP Victus 16-r0076TX | |
| Mozilla Kraken 1.1 / Total | |
| HP Victus 16-r0076TX | |
| Medio Intel Core i5-13500HX, NVIDIA GeForce RTX 4050 Laptop GPU (521 - 550, n=3) | |
| Acer Predator Helios Neo 16 NH.QLTEG.002 | |
| Schenker XMG Apex 15 (Late 23) | |
| Dell G15 5530 | |
| Lenovo LOQ 16IRH8 | |
| Lenovo LOQ 16IRH8 | |
| Lenovo Legion Pro 5 16ARX8 (R5 7645HX, RTX 4050) | |
| Media de la clase Gaming (391 - 590, n=100, últimos 2 años) | |
| Octane V2 / Total Score | |
| Media de la clase Gaming (93292 - 139447, n=27, últimos 2 años) | |
| Schenker XMG Apex 15 (Late 23) | |
| Acer Predator Helios Neo 16 NH.QLTEG.002 | |
| Medio Intel Core i5-13500HX, NVIDIA GeForce RTX 4050 Laptop GPU (n=1) | |
| Lenovo Legion Pro 5 16ARX8 (R5 7645HX, RTX 4050) | |
| Speedometer 2.0 / Result 2.0 | |
| Media de la clase Gaming (29 - 736, n=27, últimos 2 años) | |
| Medio Intel Core i5-13500HX, NVIDIA GeForce RTX 4050 Laptop GPU (n=1) | |
| Acer Predator Helios Neo 16 NH.QLTEG.002 | |
| Schenker XMG Apex 15 (Late 23) | |
| Jetstream 2 / 2.0 Total | |
| Media de la clase Gaming (334 - 516, n=27, últimos 2 años) | |
| Acer Predator Helios Neo 16 NH.QLTEG.002 | |
| Medio Intel Core i5-13500HX, NVIDIA GeForce RTX 4050 Laptop GPU (n=1) | |
| Schenker XMG Apex 15 (Late 23) | |
| Lenovo Legion Pro 5 16ARX8 (R5 7645HX, RTX 4050) | |
| WebXPRT 3 / Overall | |
| Lenovo Legion Pro 5 16ARX8 (R5 7645HX, RTX 4050) | |
| Lenovo LOQ 16IRH8 | |
| Lenovo LOQ 16IRH8 | |
| Media de la clase Gaming (220 - 532, n=98, últimos 2 años) | |
| Schenker XMG Apex 15 (Late 23) | |
| Acer Predator Helios Neo 16 NH.QLTEG.002 | |
| Dell G15 5530 | |
| Medio Intel Core i5-13500HX, NVIDIA GeForce RTX 4050 Laptop GPU (255 - 294, n=3) | |
| HP Victus 16-r0076TX | |
| WebXPRT 4 / Overall | |
| Media de la clase Gaming (165 - 354, n=98, últimos 2 años) | |
| Dell G15 5530 | |
| Lenovo Legion Pro 5 16ARX8 (R5 7645HX, RTX 4050) | |
| Medio Intel Core i5-13500HX, NVIDIA GeForce RTX 4050 Laptop GPU (240 - 257, n=3) | |
| HP Victus 16-r0076TX | |
| Acer Predator Helios Neo 16 NH.QLTEG.002 | |
* ... más pequeño es mejor
| PCMark 10 Score | 6565 puntos | |
ayuda | ||
* ... más pequeño es mejor
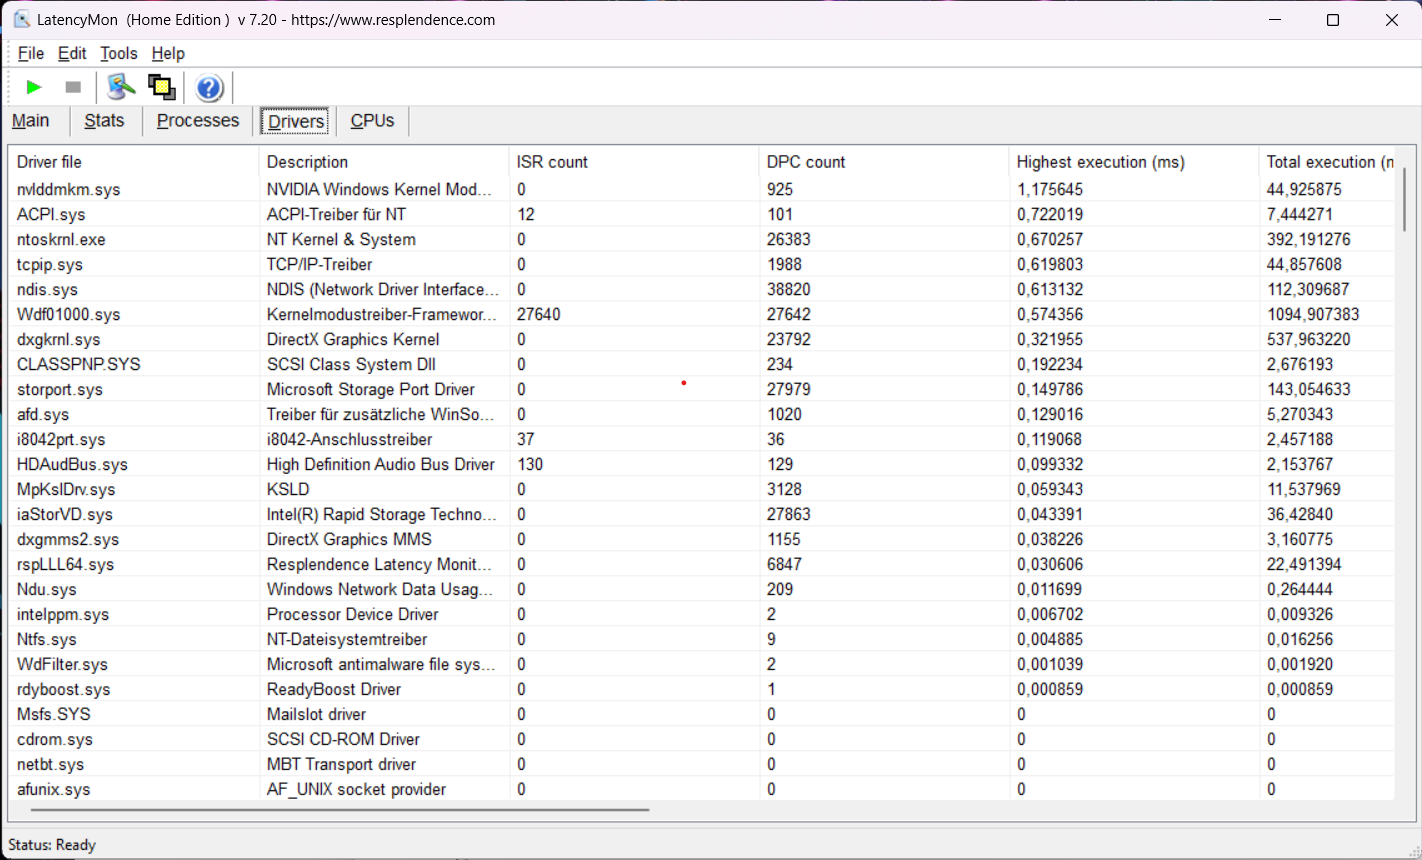
Latencia del CPD
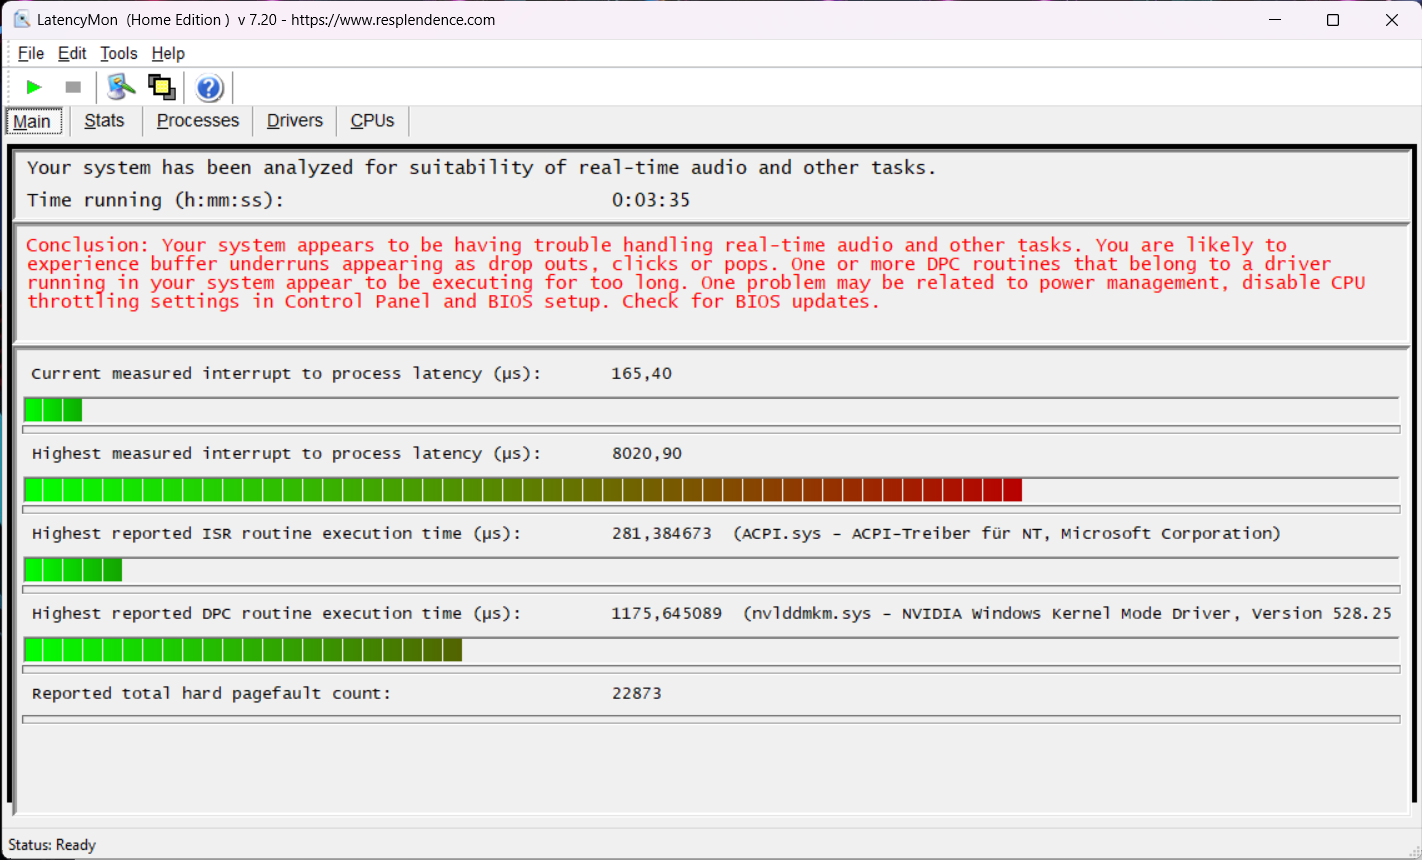
Las altísimas latencias DPC del dispositivo Acer, de 8.021 µs (probadas varias veces), impiden el uso de software multimedia en tiempo real. La razón principal es el controlador gráfico Nvidia. Las actualizaciones del controlador y de la BIOS pueden mejorar o empeorar el resultado.
| DPC Latencies / LatencyMon - interrupt to process latency (max), Web, Youtube, Prime95 | |
| Acer Predator Helios Neo 16 NH.QLTEG.002 | |
| Dell G15 5530 | |
| HP Victus 16-r0076TX | |
| Lenovo LOQ 16IRH8 | |
| Lenovo Legion Pro 5 16ARX8 (R5 7645HX, RTX 4050) | |
| Schenker XMG Apex 15 (Late 23) | |
* ... más pequeño es mejor
Dispositivos de almacenamiento
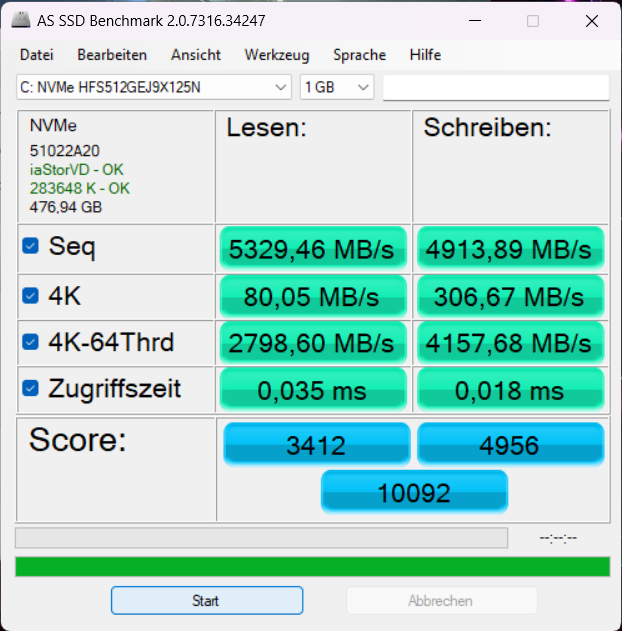
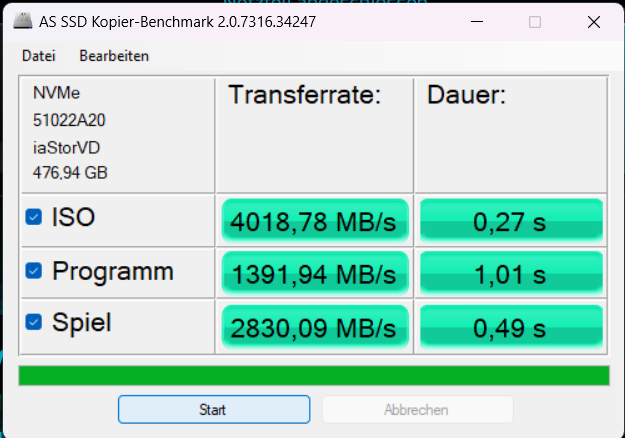
La unidad SSD PCIe 4.0 de SK Hynix instalada tiene una capacidad de 512 GB. Sus velocidades de transferencia de hasta 5.330 MB/s (lecturas secuenciales) son altas, al igual que sus velocidades de escritura y valores 4K. Esto sitúa al Helios Neo 16 en el primer puesto entre los dispositivos de la comparación en nuestra clasificación de rendimiento.
Sin embargo, al cabo de un tiempo se produce un estrangulamiento cíclico inducido térmicamente, como puede verse en el gráfico "DiskSpd Read Loop" a continuación. Admite hasta dos unidades SSD M.2 internas (también de doble cara).
| Acer Predator Helios Neo 16 NH.QLTEG.002 SK hynix HFS512GEJ9X125N | Lenovo Legion Pro 5 16ARX8 (R5 7645HX, RTX 4050) SK hynix PC801 HFS512GEJ9X115N | Lenovo LOQ 16IRH8 Solidigm SSDPFINW512GZL | Schenker XMG Apex 15 (Late 23) Samsung 990 Pro 1 TB | HP Victus 16-r0076TX SK hynix PC801 HFS512GEJ9X101N BF | Dell G15 5530 SSTC CL4-3D512-Q11 | |
|---|---|---|---|---|---|---|
| AS SSD | -11% | -59% | -18% | -27% | -142% | |
| Seq Read (MB/s) | 5329.5 | 5872 10% | 2603 -51% | 5586.1 5% | 5149.98 -3% | 2603.73 -51% |
| Seq Write (MB/s) | 4913.9 | 4253 -13% | 1427 -71% | 5512.25 12% | 3064.93 -38% | 494.63 -90% |
| 4K Read (MB/s) | 80.05 | 70.52 -12% | 64.4 -20% | 65.32 -18% | 62.73 -22% | 36.37 -55% |
| 4K Write (MB/s) | 306.67 | 251.8 -18% | 237 -23% | 193.71 -37% | 219.1 -29% | 188.64 -38% |
| 4K-64 Read (MB/s) | 2798.6 | 2755 -2% | 451 -84% | 2970.82 6% | 902.17 -68% | 932.26 -67% |
| 4K-64 Write (MB/s) | 4157.7 | 2647 -36% | 1265 -70% | 3872.46 -7% | 2901.89 -30% | 276.64 -93% |
| Access Time Read * (ms) | 0.035 | 0.039 -11% | 0.055 -57% | 0.038 -9% | 0.036 -3% | 0.103 -194% |
| Access Time Write * (ms) | 0.018 | 0.017 6% | 0.036 -100% | 0.02 -11% | 0.018 -0% | 0.182 -911% |
| Score Read (Points) | 3412 | 3413 0% | 776 -77% | 3595 5% | 1480 -57% | 1229 -64% |
| Score Write (Points) | 4956 | 3324 -33% | 1645 -67% | 4617 -7% | 3427 -31% | 515 -90% |
| Score Total (Points) | 10092 | 8397 -17% | 2782 -72% | 10039 -1% | 5574 -45% | 2271 -77% |
| Copy ISO MB/s (MB/s) | 4018.8 | 2397.08 -40% | 1100.94 -73% | 3765 -6% | 488.98 -88% | |
| Copy Program MB/s (MB/s) | 1391.9 | 751.31 -46% | 579.88 -58% | 1030 -26% | 296.26 -79% | |
| Copy Game MB/s (MB/s) | 2830.1 | 1329.99 -53% | 1006.61 -64% | 2124 -25% | 452.22 -84% | |
| DiskSpd | -1% | -48% | 5% | -29% | -64% | |
| seq read (MB/s) | 3283 | 4770 45% | 2171 -34% | 3181 -3% | 4378 33% | 2726 -17% |
| seq write (MB/s) | 4923 | 4938 0% | 1640 -67% | 5612 14% | 3325 -32% | 535 -89% |
| seq q8 t1 read (MB/s) | 6309 | 7328 16% | 3507 -44% | 7148 13% | 7109 13% | 2985 -53% |
| seq q8 t1 write (MB/s) | 4968 | 4936 -1% | 1645 -67% | 6887 39% | 5027 1% | 539 -89% |
| 4k q1 t1 read (MB/s) | 78.3 | 75.5 -4% | 82.1 5% | 68 -13% | 61.5 -21% | 34 -57% |
| 4k q1 t1 write (MB/s) | 393 | 296 -25% | 288 -27% | 231 -41% | 157.3 -60% | 224 -43% |
| 4k q32 t16 read (MB/s) | 4255 | 3794 -11% | 478 -89% | 4920 16% | 954 -78% | 1054 -75% |
| 4k q32 t16 write (MB/s) | 3869 | 2679 -31% | 1631 -58% | 4336 12% | 527 -86% | 507 -87% |
| Media total (Programa/Opciones) | -6% /
-7% | -54% /
-55% | -7% /
-10% | -28% /
-28% | -103% /
-113% |
* ... más pequeño es mejor
* ... más pequeño es mejor
Reading continuous performance: DiskSpd Read Loop, Queue Depth 8
Tarjeta gráfica
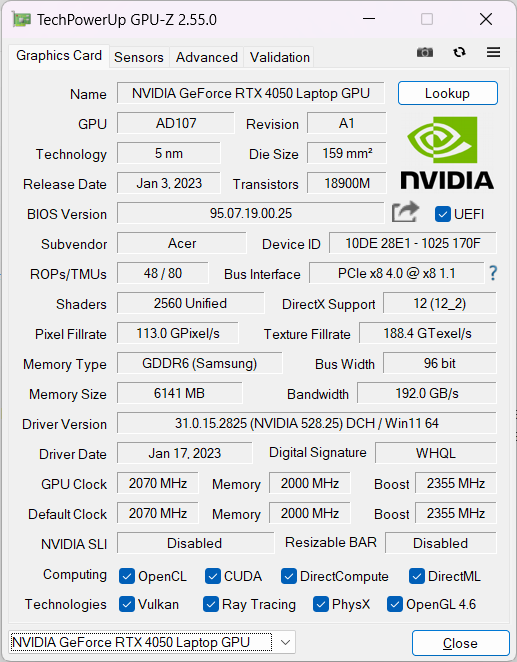
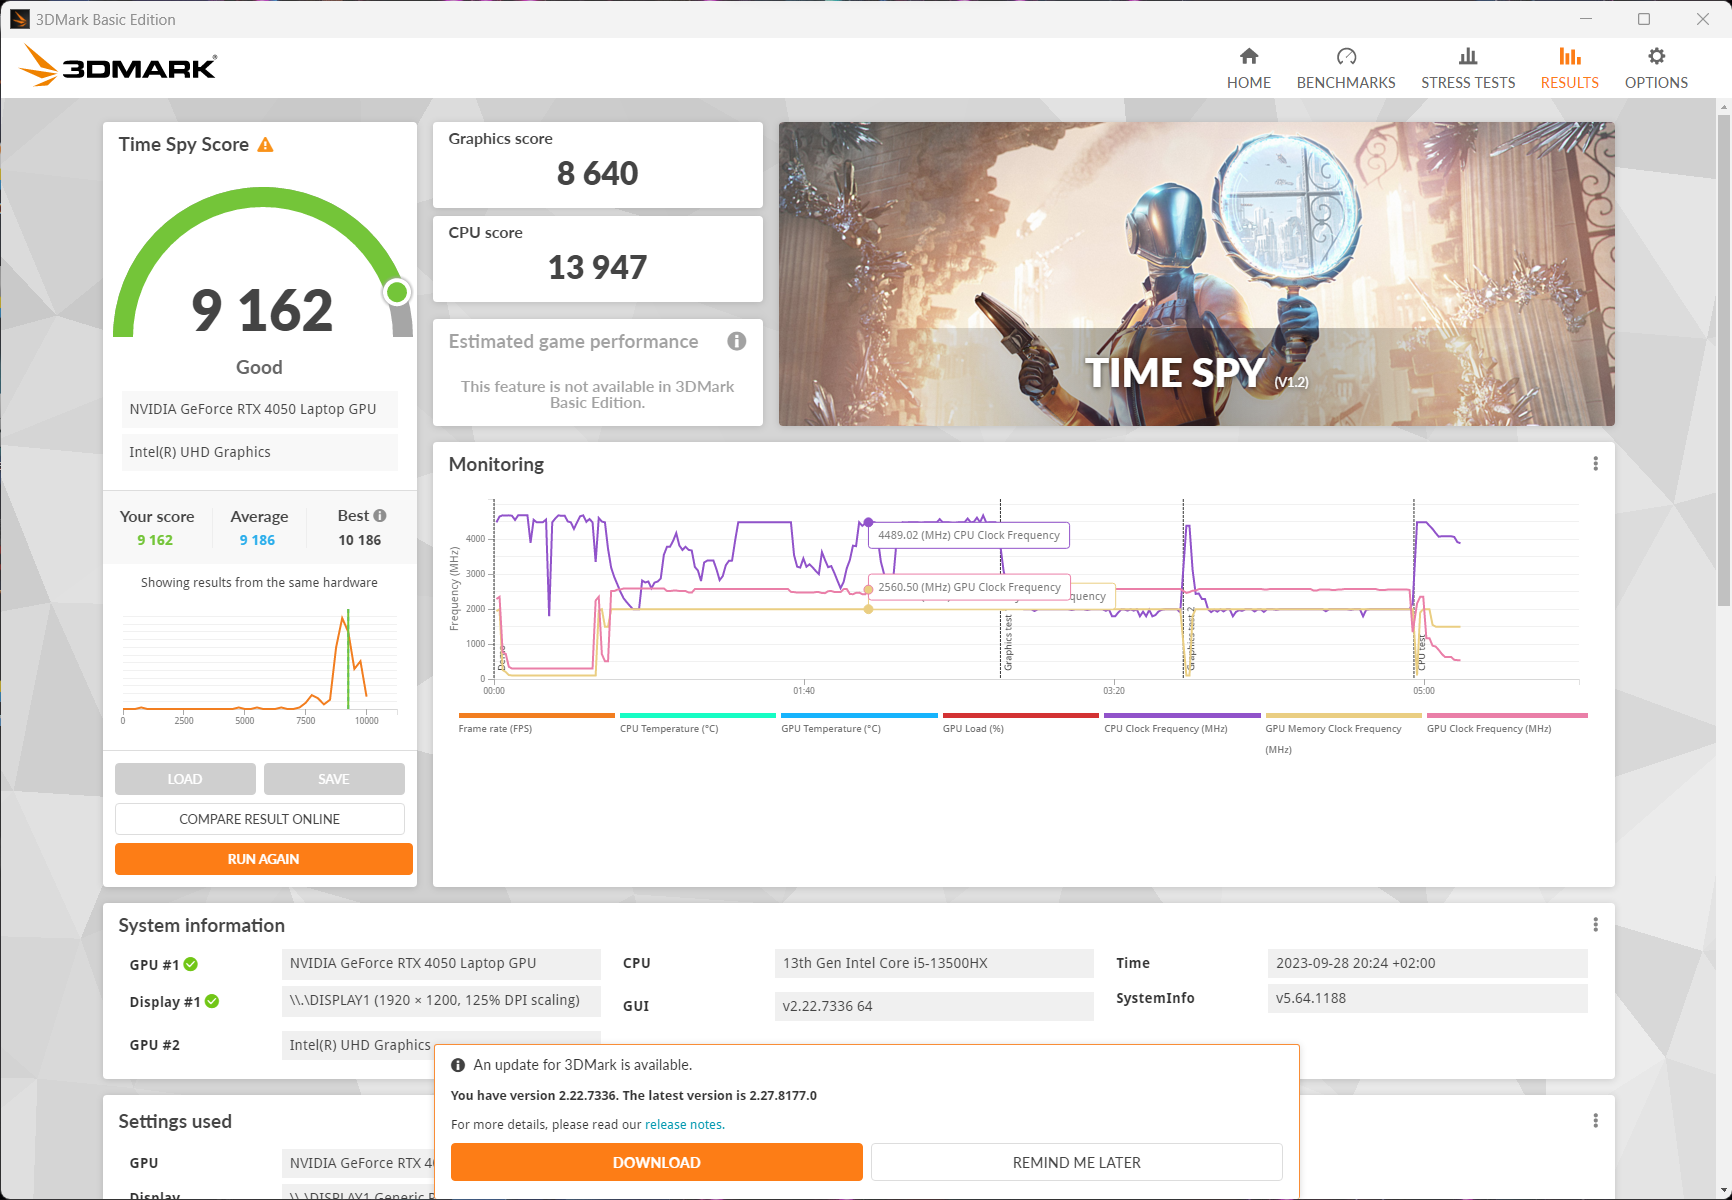
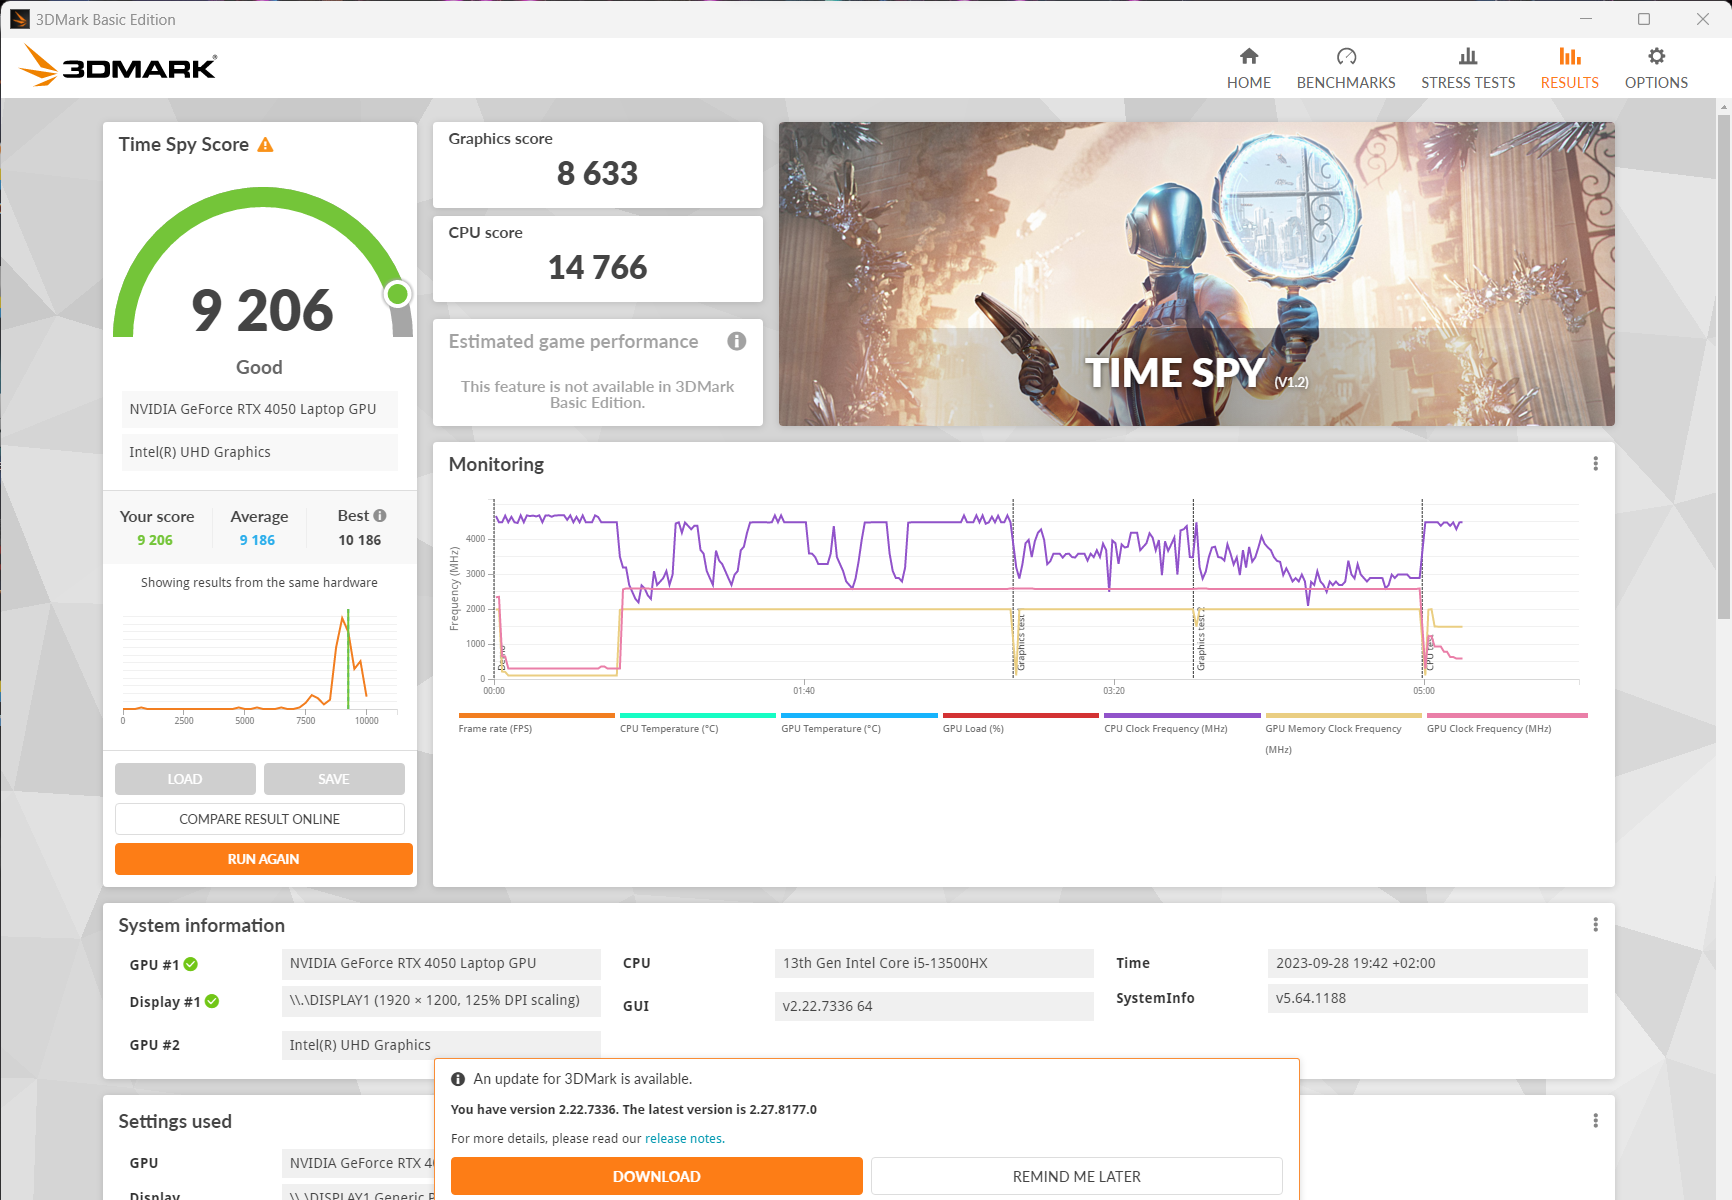
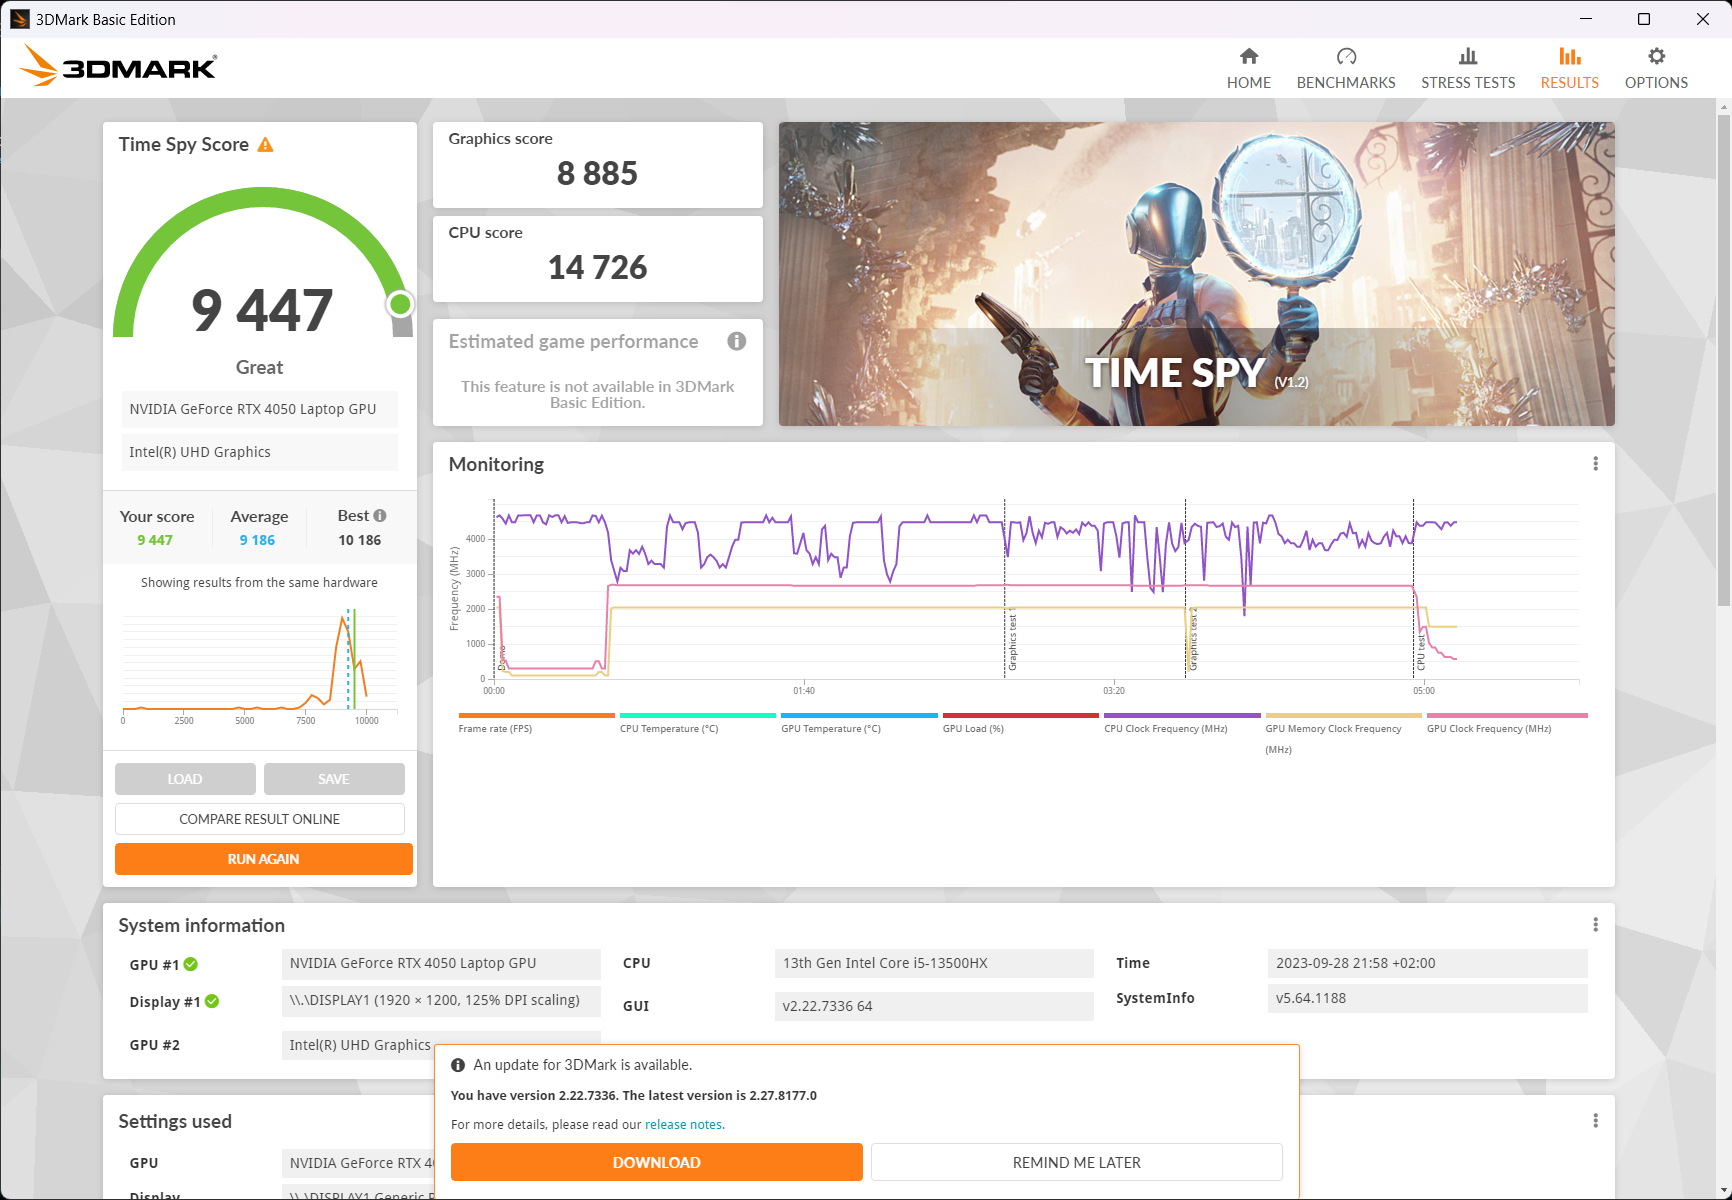
LaGeForce RTX 4050 es una GPU básica con 6 GB de VRAM, que consume un máximo de 130 vatios (115 vatios + 15 vatios de Dynamic Boost) en el Helios Neo 16. Sin embargo, su velocidad de reloj máxima de 2.570 MHz ya se alcanza entre 85 vatios y 90 vatios. Sólo la prueba de estrés FurMark puede hacer uso de los 130 vatios completos, mientras que la GPU del portátil nunca necesita más de ~88 vatios cuando ejecuta juegos.
Esto sitúa el rendimiento del dispositivo a la altura de otros portátiles para juegos con la misma GPU, como elLegion Pro 5 16schenkerXMG Apex 15yHP Victus 16. En las pruebas comparativas sintéticas, unaRTX 4060también obtuvo resultados similares (10 % de ventaja), como en elLenovo LOQ 16 y elHelios 16 (no Neo). Sus resultados sintéticos de referencia fueron la mitad de buenos en modo batería.
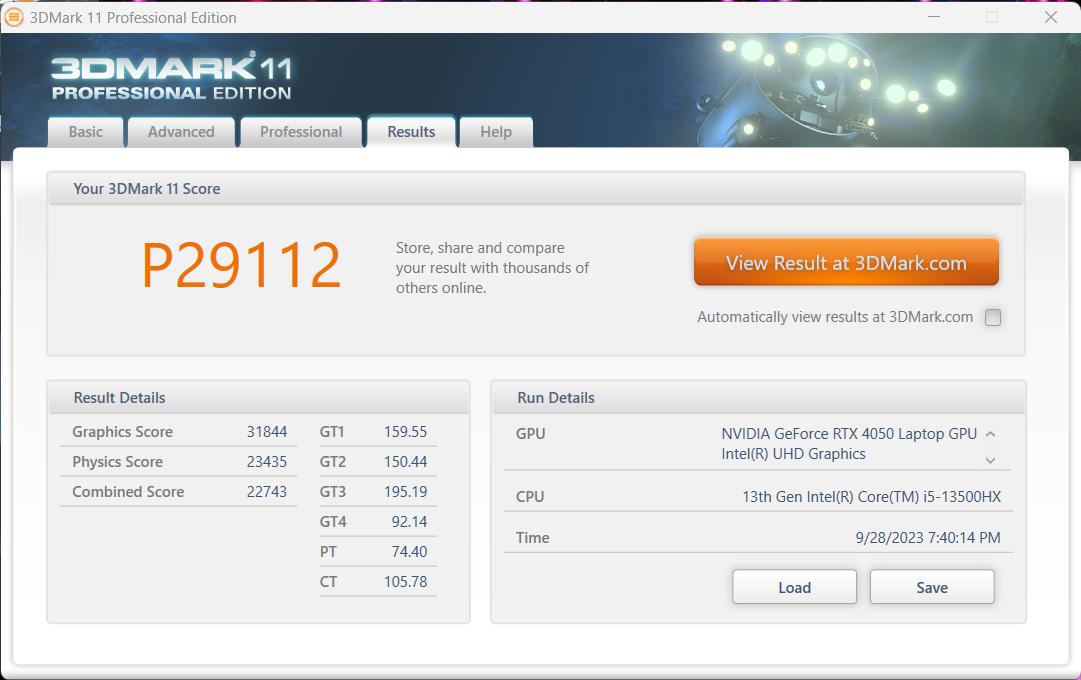
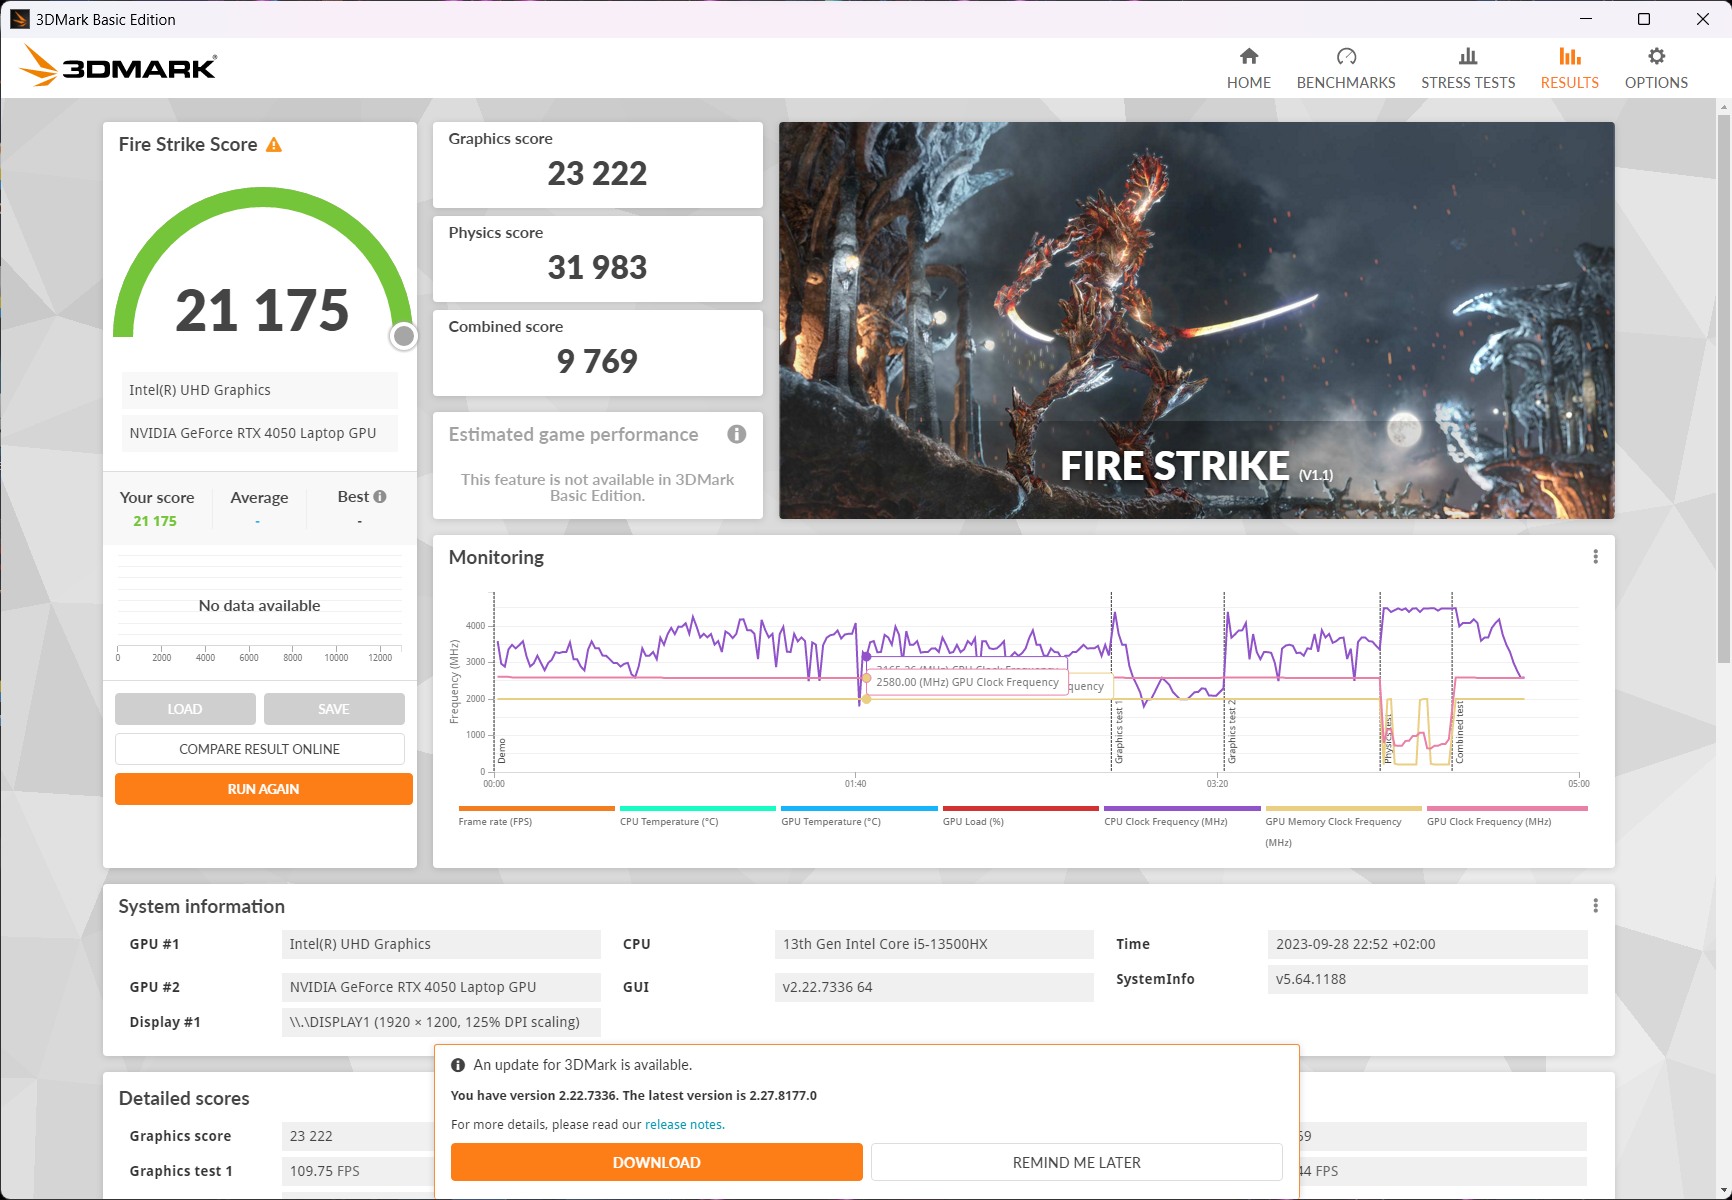
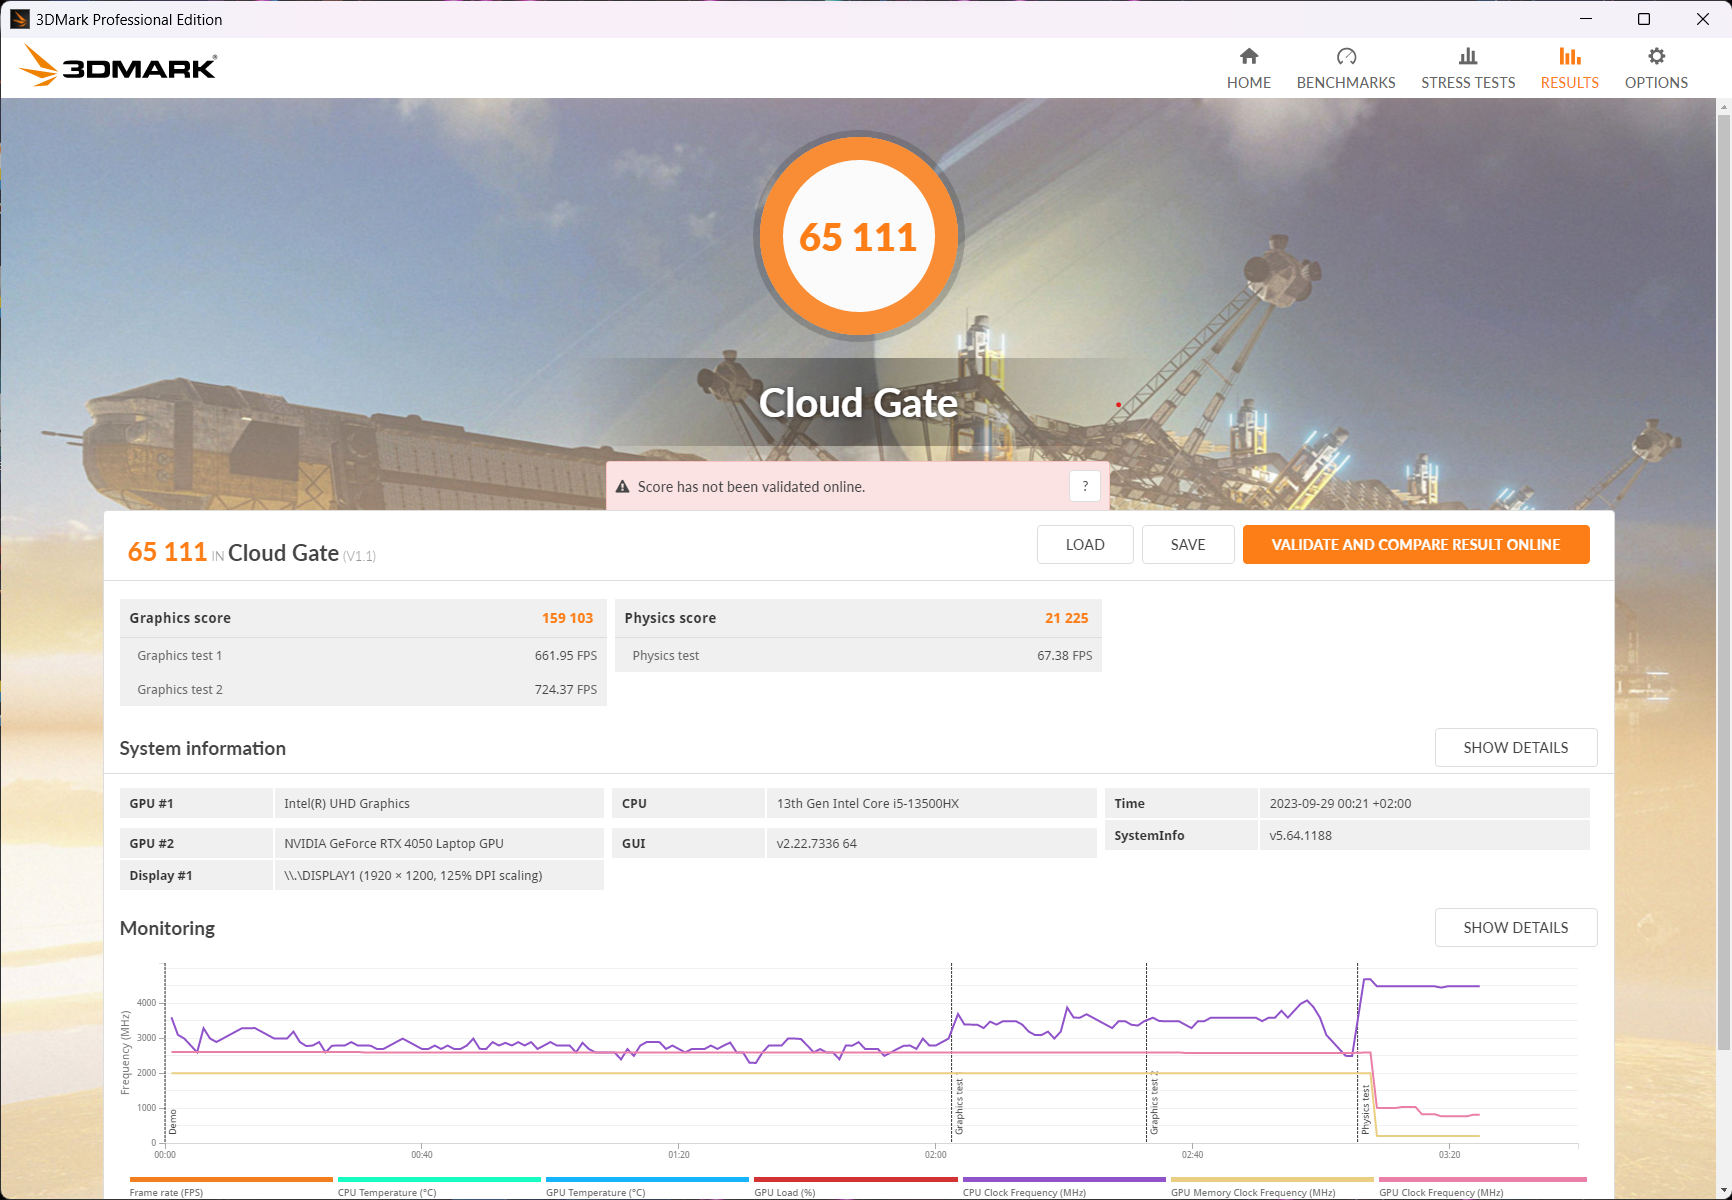
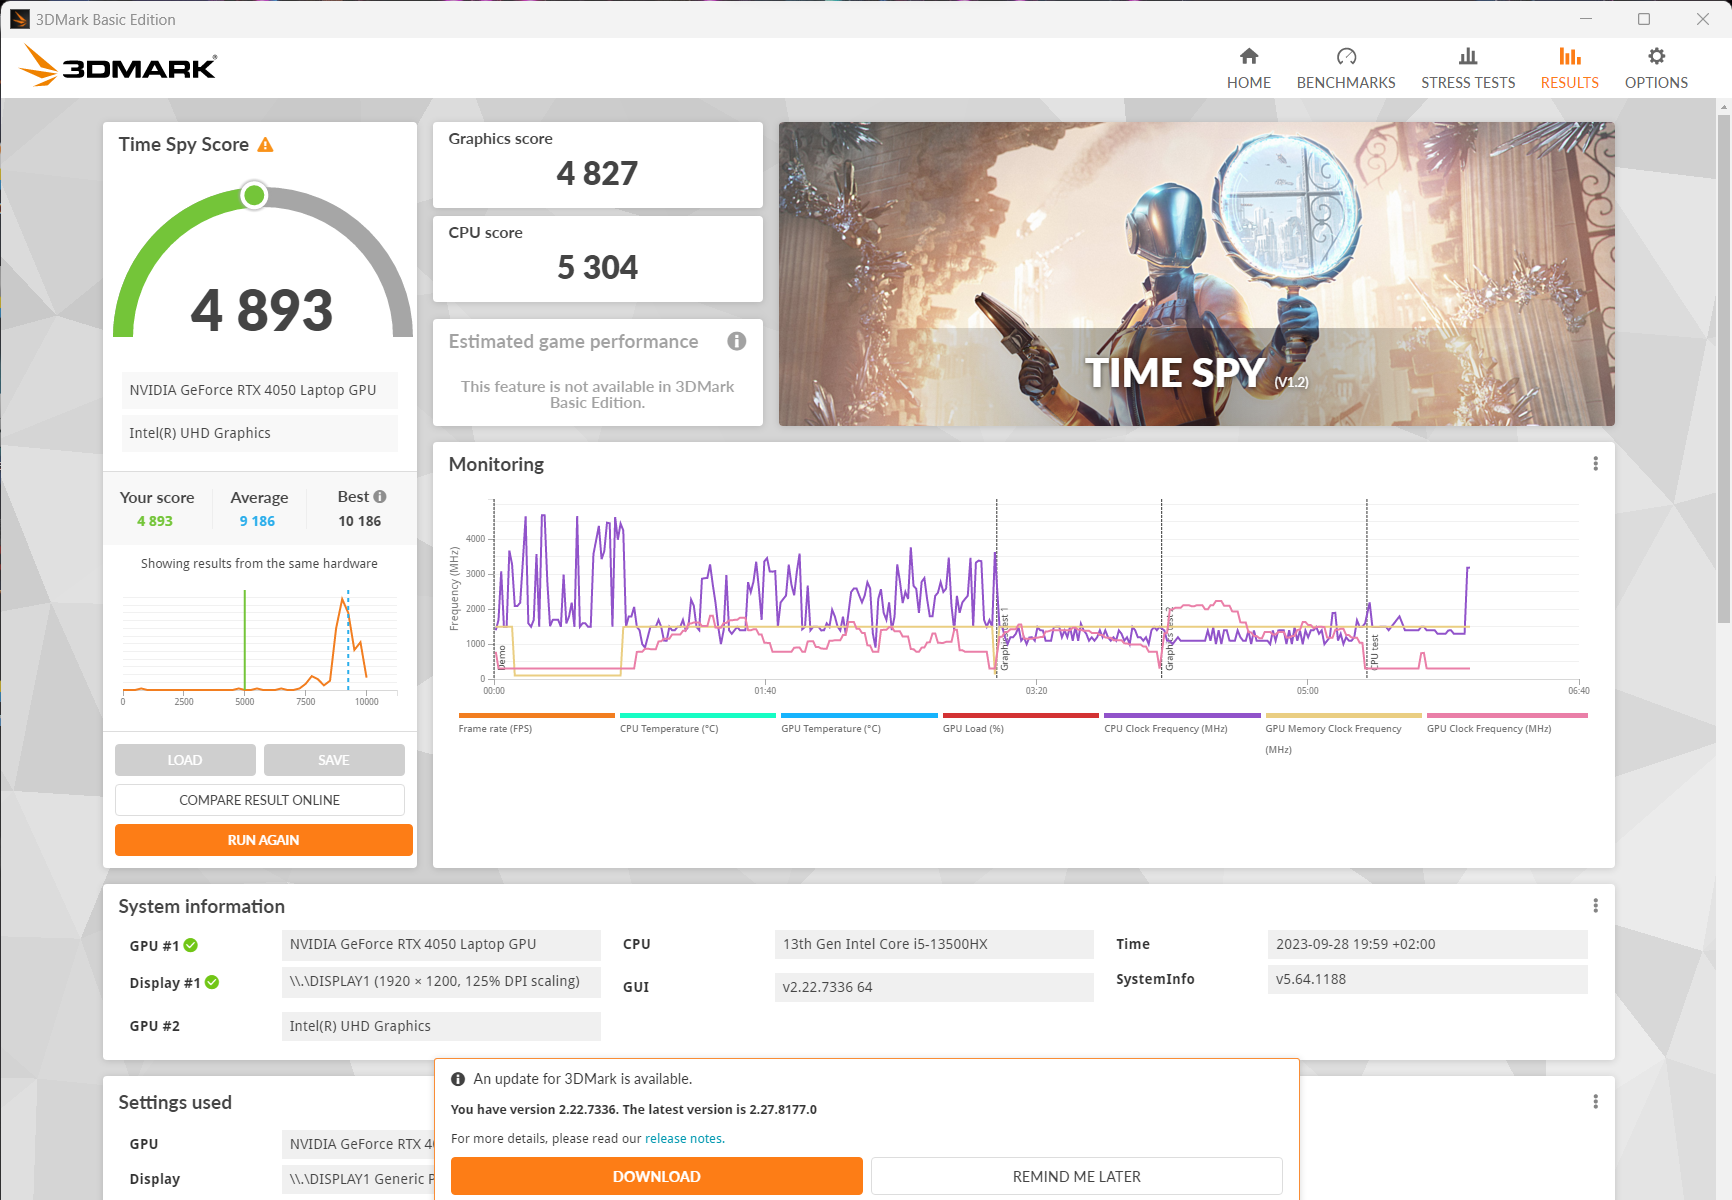
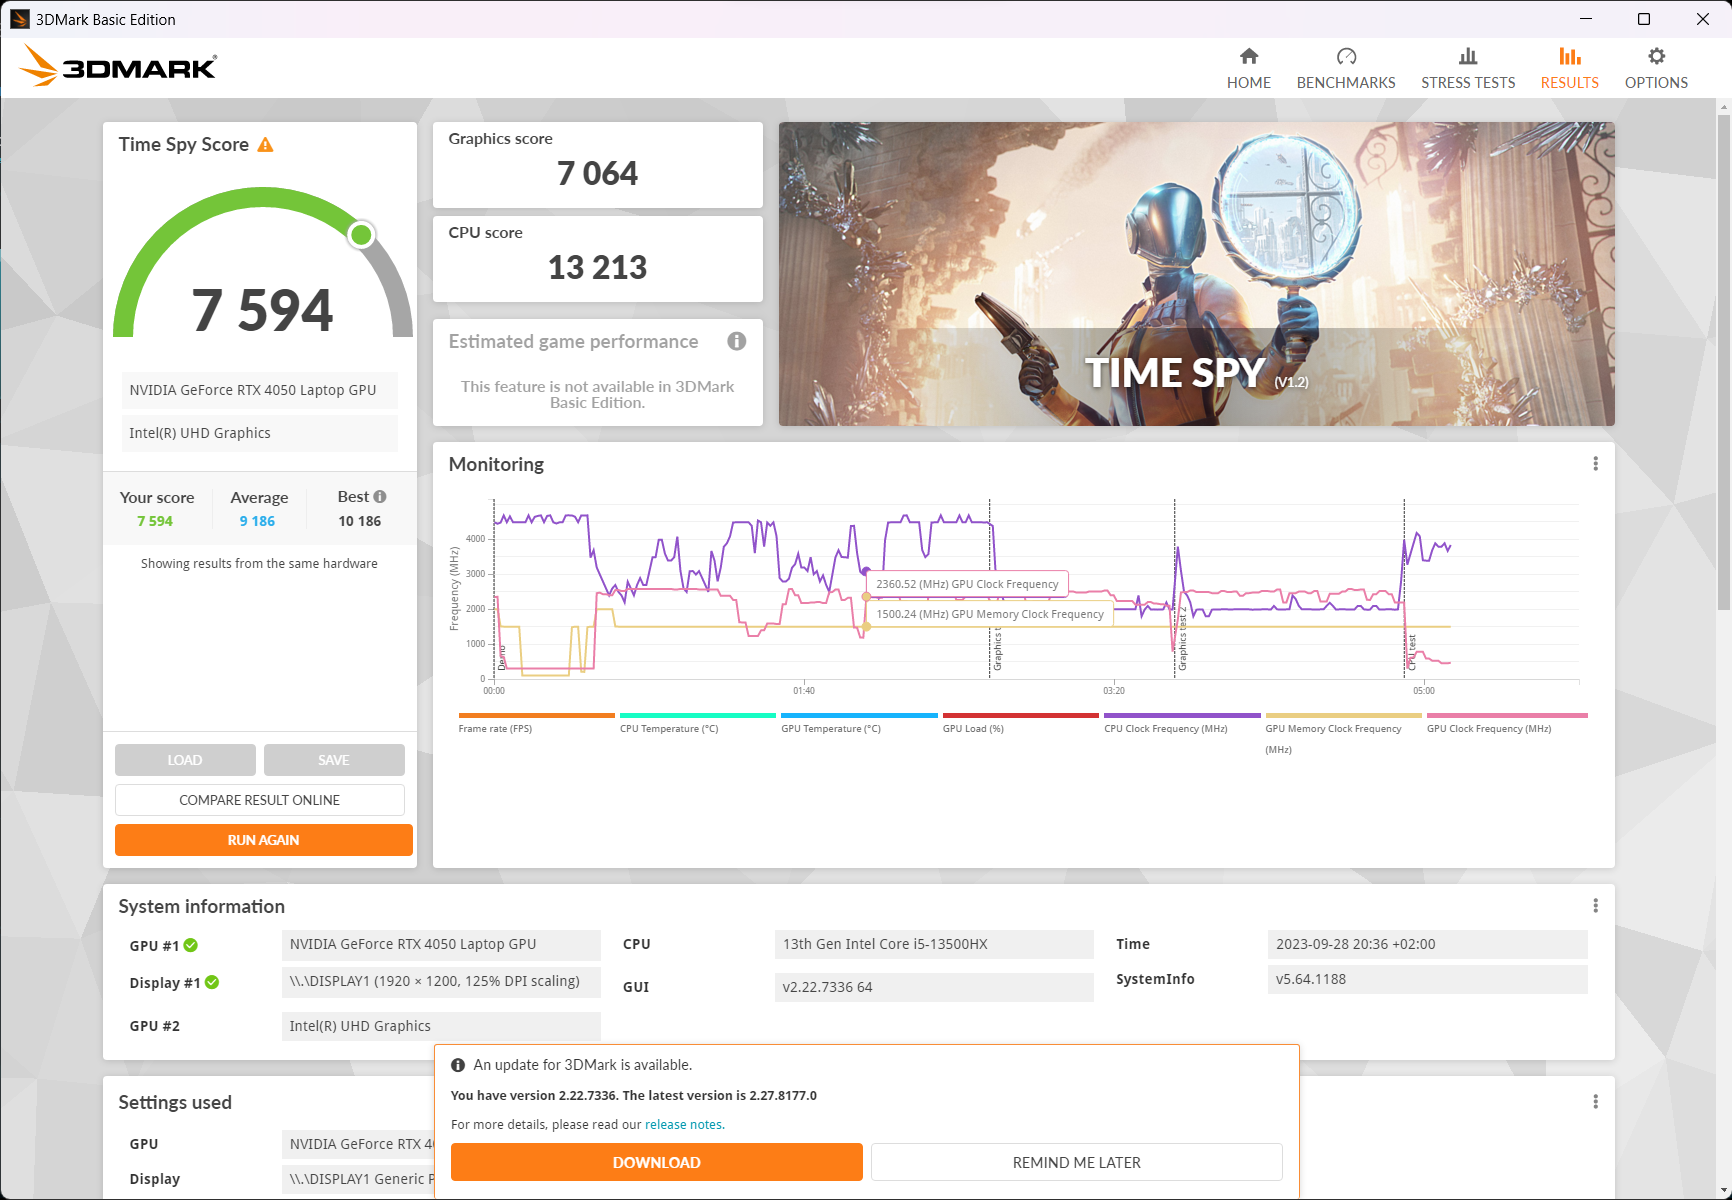
| 3DMark 11 Performance | 29112 puntos | |
| 3DMark Cloud Gate Standard Score | 65111 puntos | |
| 3DMark Fire Strike Score | 21175 puntos | |
| 3DMark Time Spy Score | 9206 puntos | |
ayuda | ||
* ... más pequeño es mejor
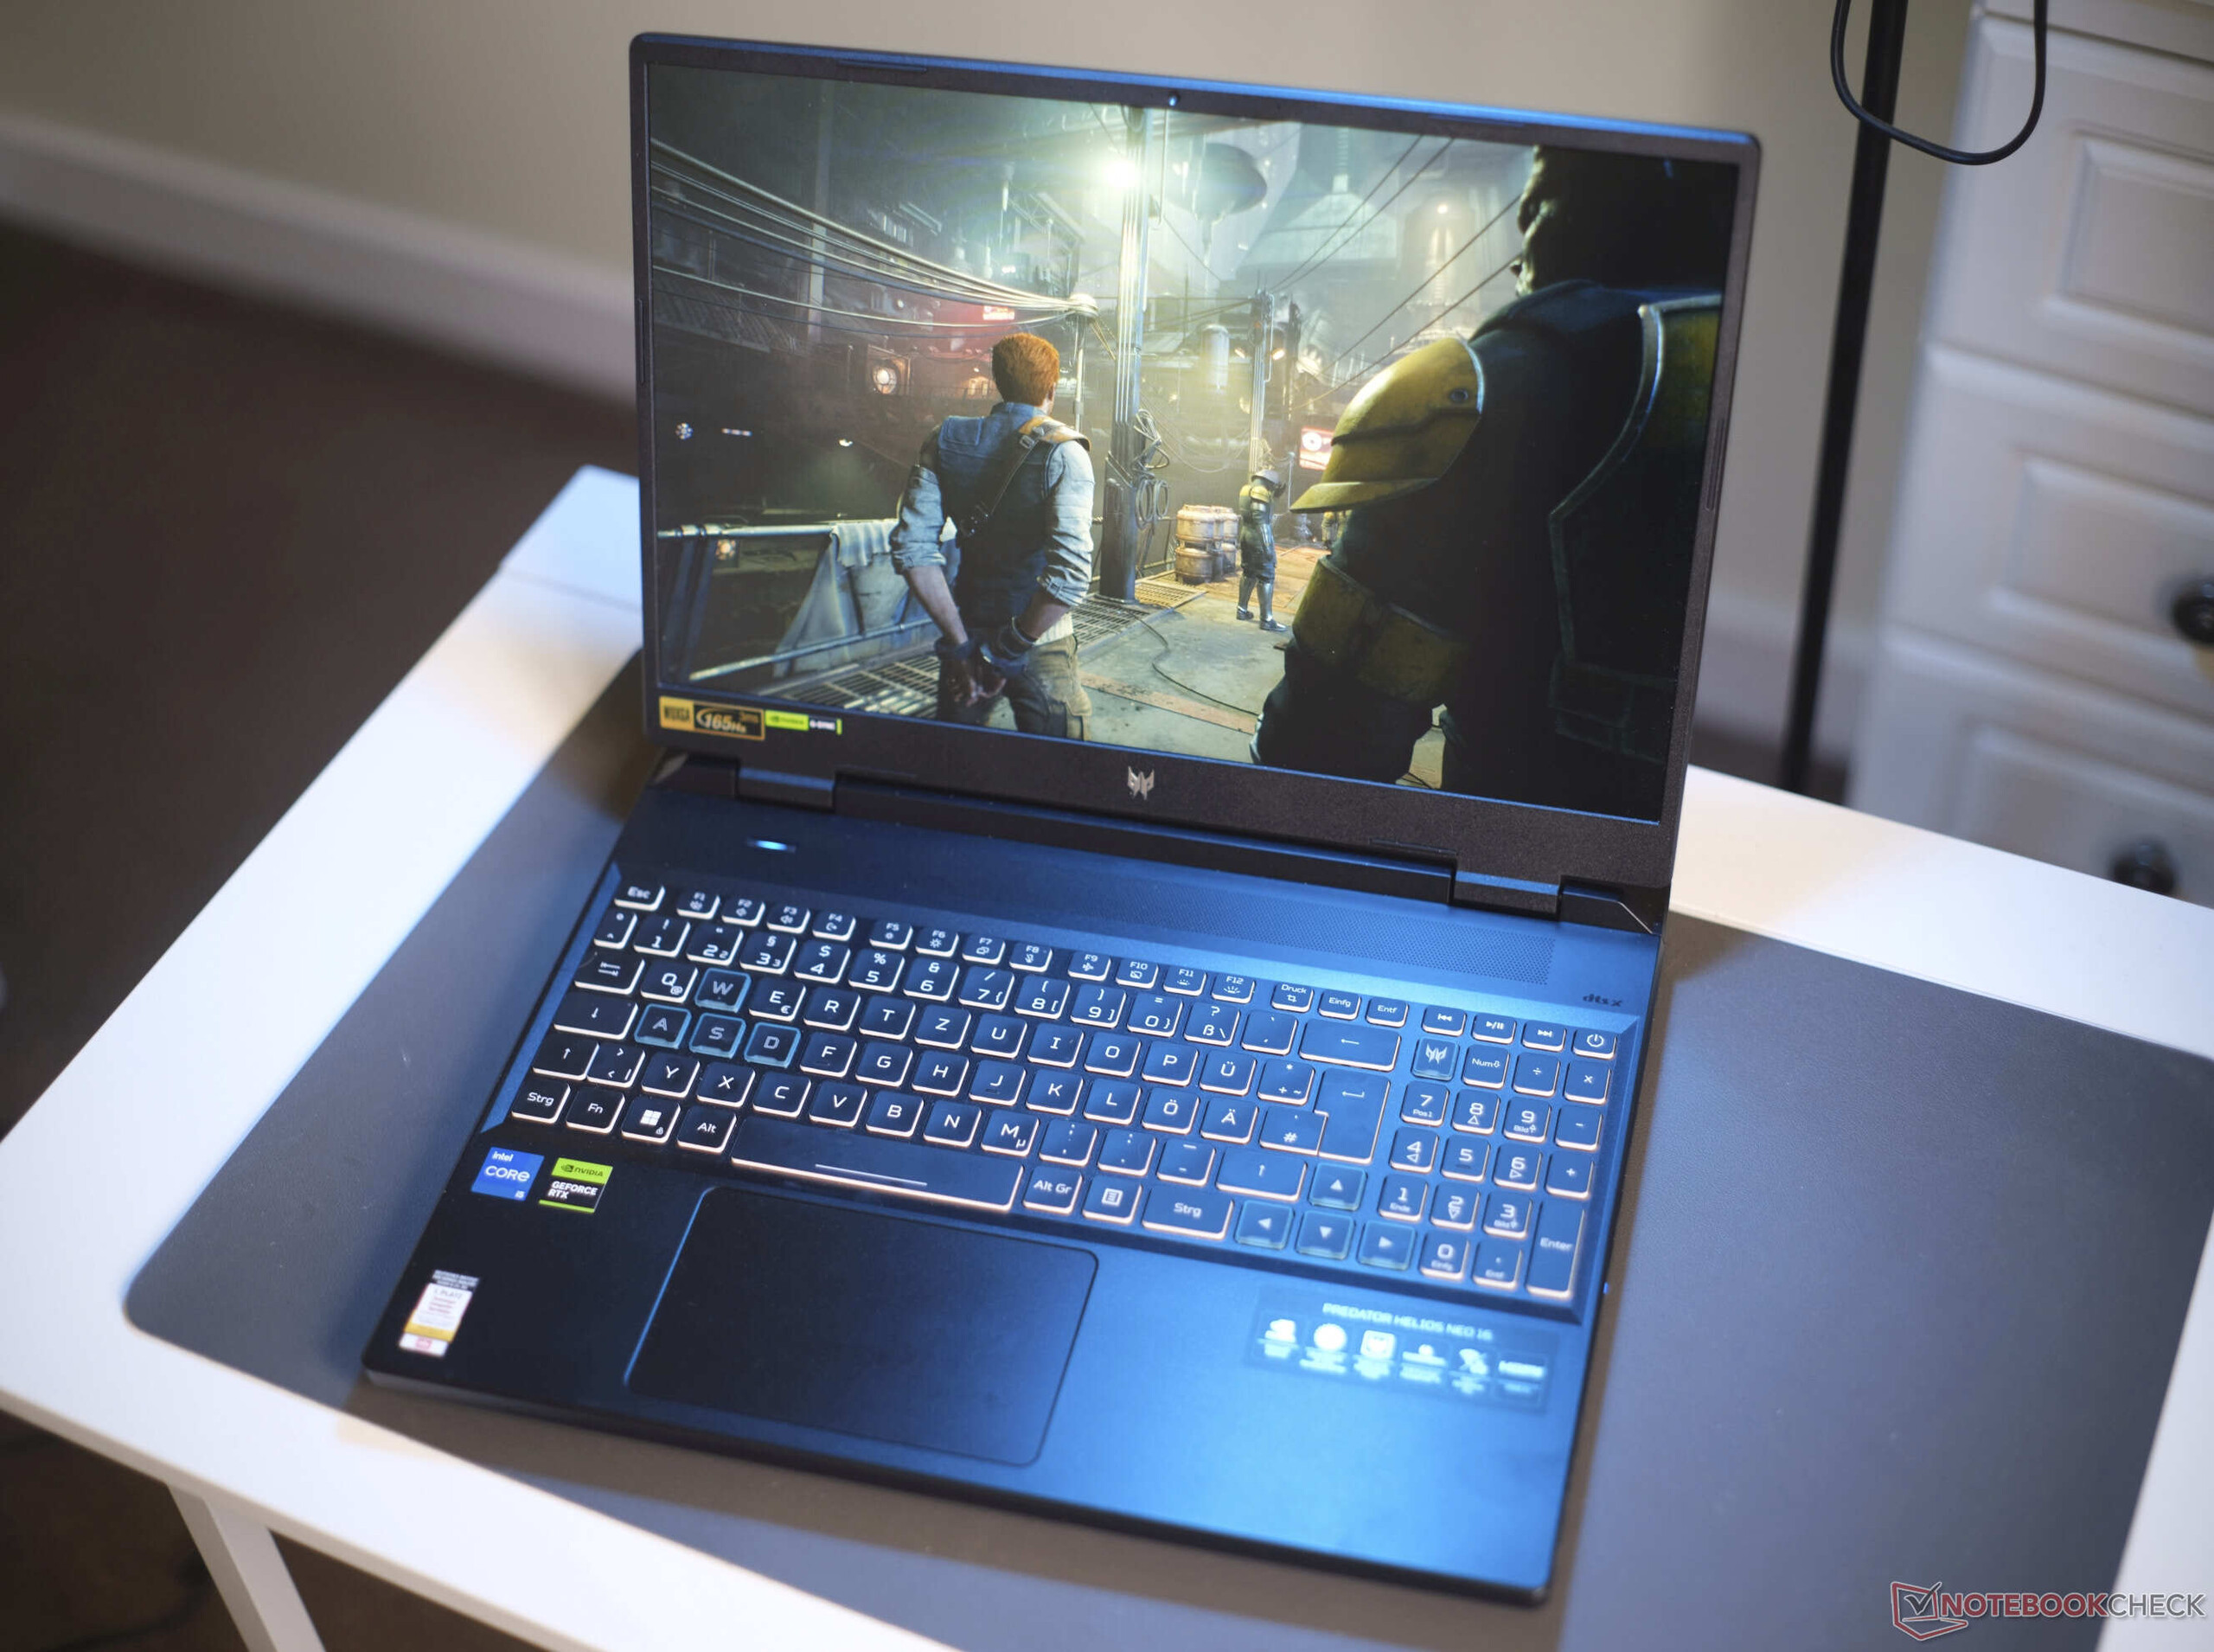
Rendimiento en juegos
En nuestra clasificación de rendimiento, elLegion Pro 5 16 se situó en torno a un 7 % por encima del Helios Neo 16, mientras que elDell G15 5530 y el LenovoLOQ 16 ofrecieron cada uno alrededor de un 15 % más de rendimiento con unaRTX 4060. Dependiendo del juego, la diferencia con la RTX 4060 aumentó: hasta un 30 % para God of War y un 20 % para Hogwarts Legacy.
Recomendamos utilizar el modo equilibrado, ya que solo se pierde un 2-3 % de rendimiento 3D con un ruido del ventilador significativamente menor. En modo batería, su rendimiento fue sólo un tercio tan bueno.
| Sons of the Forest | |
| 1920x1080 Ultra Preset AA:T | |
| Lenovo Legion Pro 5 16ARX8 (R5 7645HX, RTX 4050) | |
| Medio NVIDIA GeForce RTX 4050 Laptop GPU (61.9 - 76, n=4) | |
| Acer Predator Helios Neo 16 NH.QLTEG.002 | |
| 1920x1080 High Preset AA:T | |
| Lenovo Legion Pro 5 16ARX8 (R5 7645HX, RTX 4050) | |
| Acer Predator Helios Neo 16 NH.QLTEG.002 | |
| Medio NVIDIA GeForce RTX 4050 Laptop GPU (63.5 - 76, n=4) | |
Witcher 3 FPS diagram
| bajo | medio | alto | ultra | |
|---|---|---|---|---|
| GTA V (2015) | 186.7 | 185.1 | 176.3 | 96.5 |
| The Witcher 3 (2015) | 286 | 154.4 | 81 | |
| Dota 2 Reborn (2015) | 180.9 | 167.9 | 156.4 | 147 |
| Final Fantasy XV Benchmark (2018) | 215 | 118.6 | 84.6 | |
| X-Plane 11.11 (2018) | 152.4 | 134.7 | 106.1 | |
| Strange Brigade (2018) | 476 | 211 | 171.9 | 149.4 |
| F1 2021 (2021) | 291 | 222 | 119.5 | |
| God of War (2022) | 86.8 | 71.1 | 50.1 | |
| Hogwarts Legacy (2023) | 64 | 53.1 | 51.1 | |
| Sons of the Forest (2023) | 78.8 | 74.5 | 70 | |
| Star Wars Jedi Survivor (2023) | 58 | 53.6 | 50.7 | |
| F1 23 (2023) | 262 | 208 | 150.7 | 44.5 |
Emisiones: Metal líquido en el interior del Helios Neo 16 de gama media
Emisiones sonoras
El Acer Predator Helios Neo 16 permanece casi silencioso en todos los modos de rendimiento, no sólo en modo inactivo, sino también al navegar por Internet y realizar tareas ofimáticas sencillas, aunque el ventilador siempre emite un zumbido silencioso.
Bajo carga pura de la CPU, los niveles de ruido se elevan a 37,7 dB(A), lo que sigue sin ser excesivamente molesto. El modo equilibrado se recomienda para los juegos: cuando se utiliza este modo, las emisiones de ruido del portátil son casi agradables. El Legion Pro 5 16, por otro lado, sólo alcanza los 43,8 dB(A) de fábrica cuando se juega. El Dell G15 5530 también es bastante silencioso, especialmente bajo carga media. No pudimos detectar ningún ruido electrónico en nuestro modelo.
Ruido
| Ocioso |
| 25.9 / 25.9 / 29.3 dB(A) |
| Carga |
| 37.7 / 62.7 dB(A) |
 | ||
30 dB silencioso 40 dB(A) audible 50 dB(A) ruidosamente alto |
||
min: | ||
| Acer Predator Helios Neo 16 NH.QLTEG.002 GeForce RTX 4050 Laptop GPU, i5-13500HX, SK hynix HFS512GEJ9X125N | Lenovo Legion Pro 5 16ARX8 (R5 7645HX, RTX 4050) GeForce RTX 4050 Laptop GPU, R5 7645HX, SK hynix PC801 HFS512GEJ9X115N | Lenovo LOQ 16IRH8 GeForce RTX 4060 Laptop GPU, i7-13620H, Solidigm SSDPFINW512GZL | HP Victus 16-r0076TX GeForce RTX 4050 Laptop GPU, i5-13500HX, SK hynix PC801 HFS512GEJ9X101N BF | Dell G15 5530 GeForce RTX 4060 Laptop GPU, i7-13650HX, SSTC CL4-3D512-Q11 | Schenker XMG Apex 15 (Late 23) GeForce RTX 4050 Laptop GPU, R7 7840HS, Samsung 990 Pro 1 TB | |
|---|---|---|---|---|---|---|
| Noise | 13% | 2% | 10% | 12% | 1% | |
| apagado / medio ambiente * (dB) | 25.9 | 23 11% | 23 11% | 21.57 17% | 20.41 21% | 24 7% |
| Idle Minimum * (dB) | 25.9 | 23 11% | 23 11% | 23.68 9% | 26.85 -4% | 25 3% |
| Idle Average * (dB) | 25.9 | 23 11% | 23 11% | 23.68 9% | 26.85 -4% | 29 -12% |
| Idle Maximum * (dB) | 29.3 | 24.42 17% | 27.66 6% | 23.68 19% | 26.85 8% | 33 -13% |
| Load Average * (dB) | 37.7 | 34.94 7% | 53.62 -42% | 39.44 -5% | 27.65 27% | 36 5% |
| Load Maximum * (dB) | 62.7 | 50 20% | 53.5 15% | 55.37 12% | 47.86 24% | 53 15% |
| Witcher 3 ultra * (dB) | 43.79 | 53.5 | 55.4 | 47.9 | 48 |
* ... más pequeño es mejor
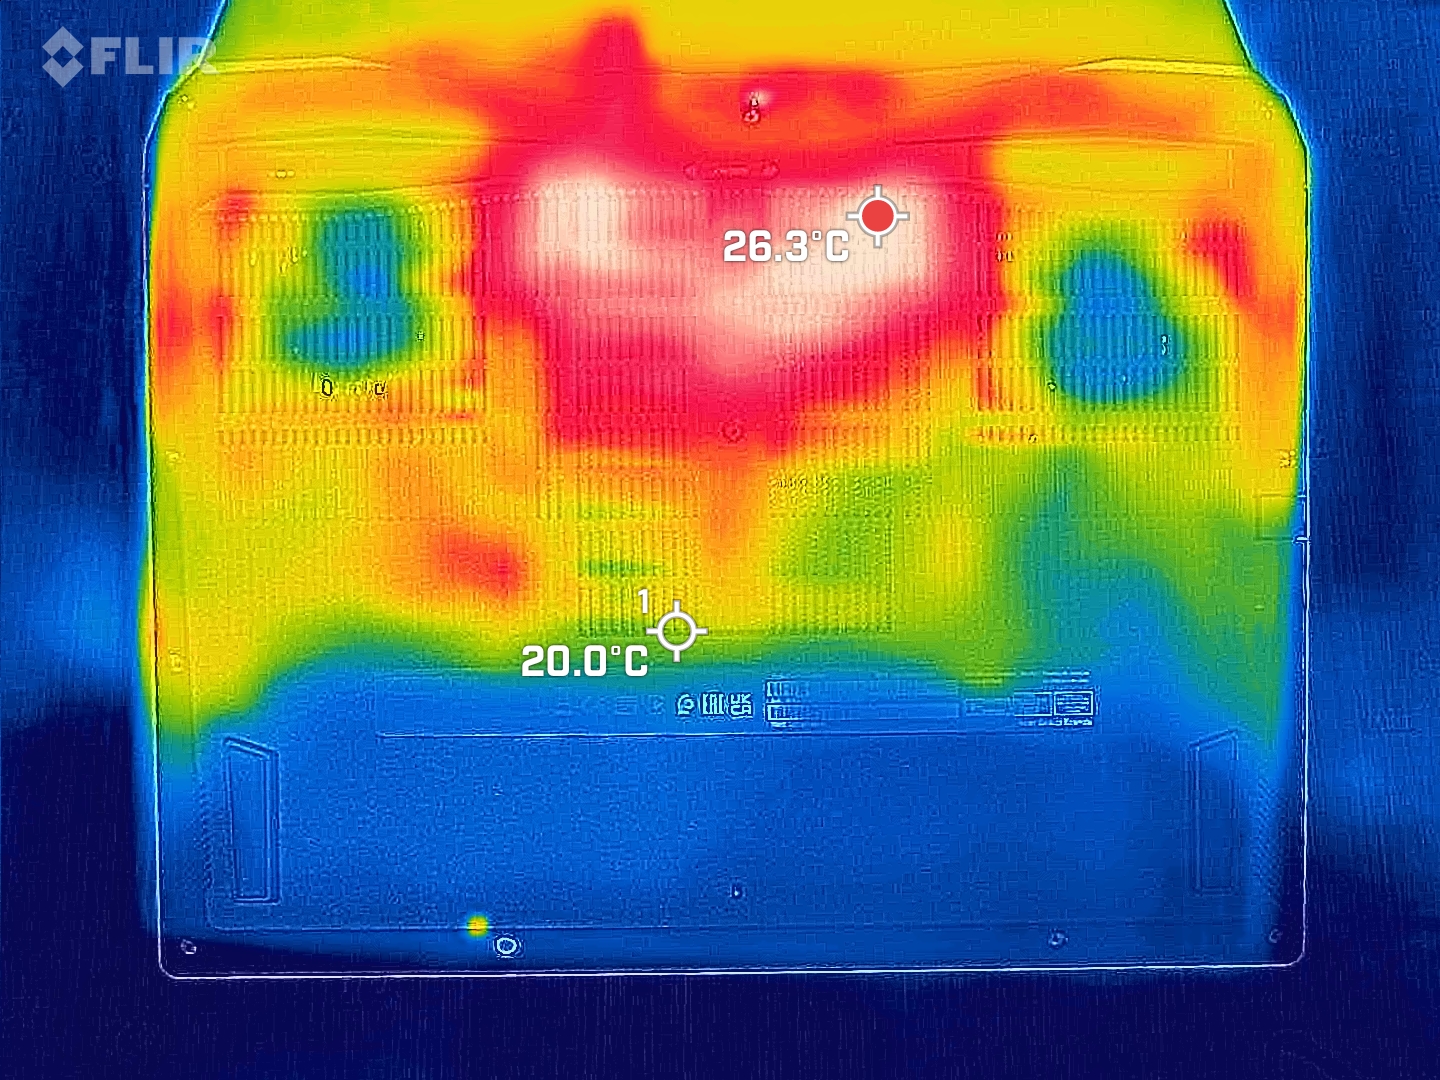
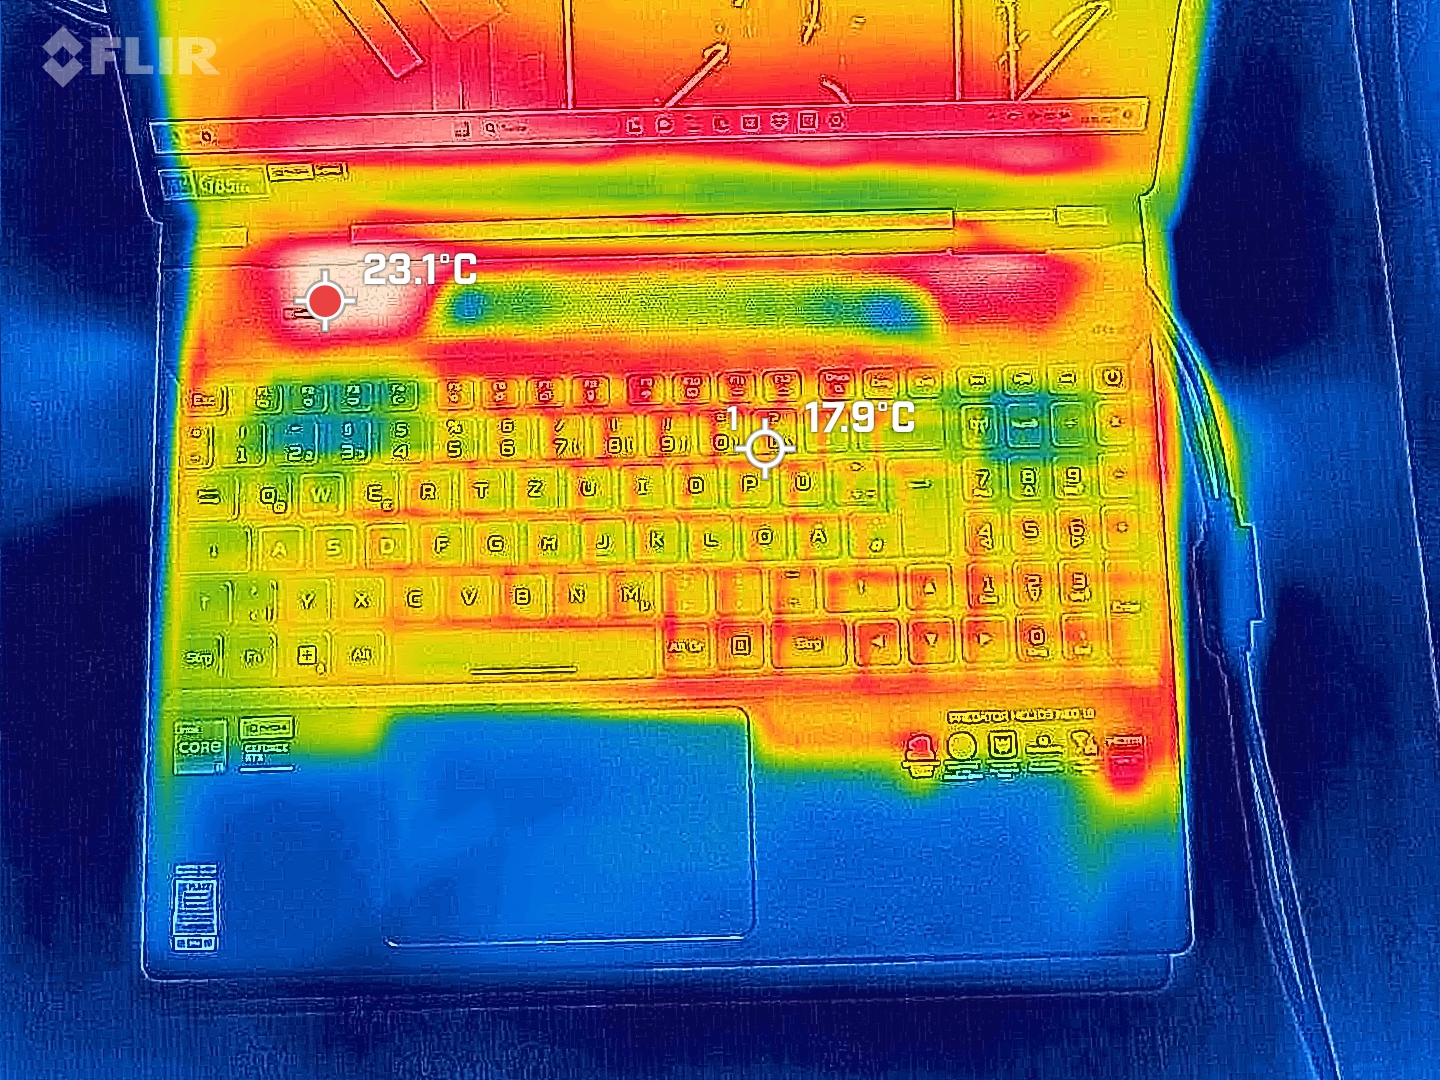
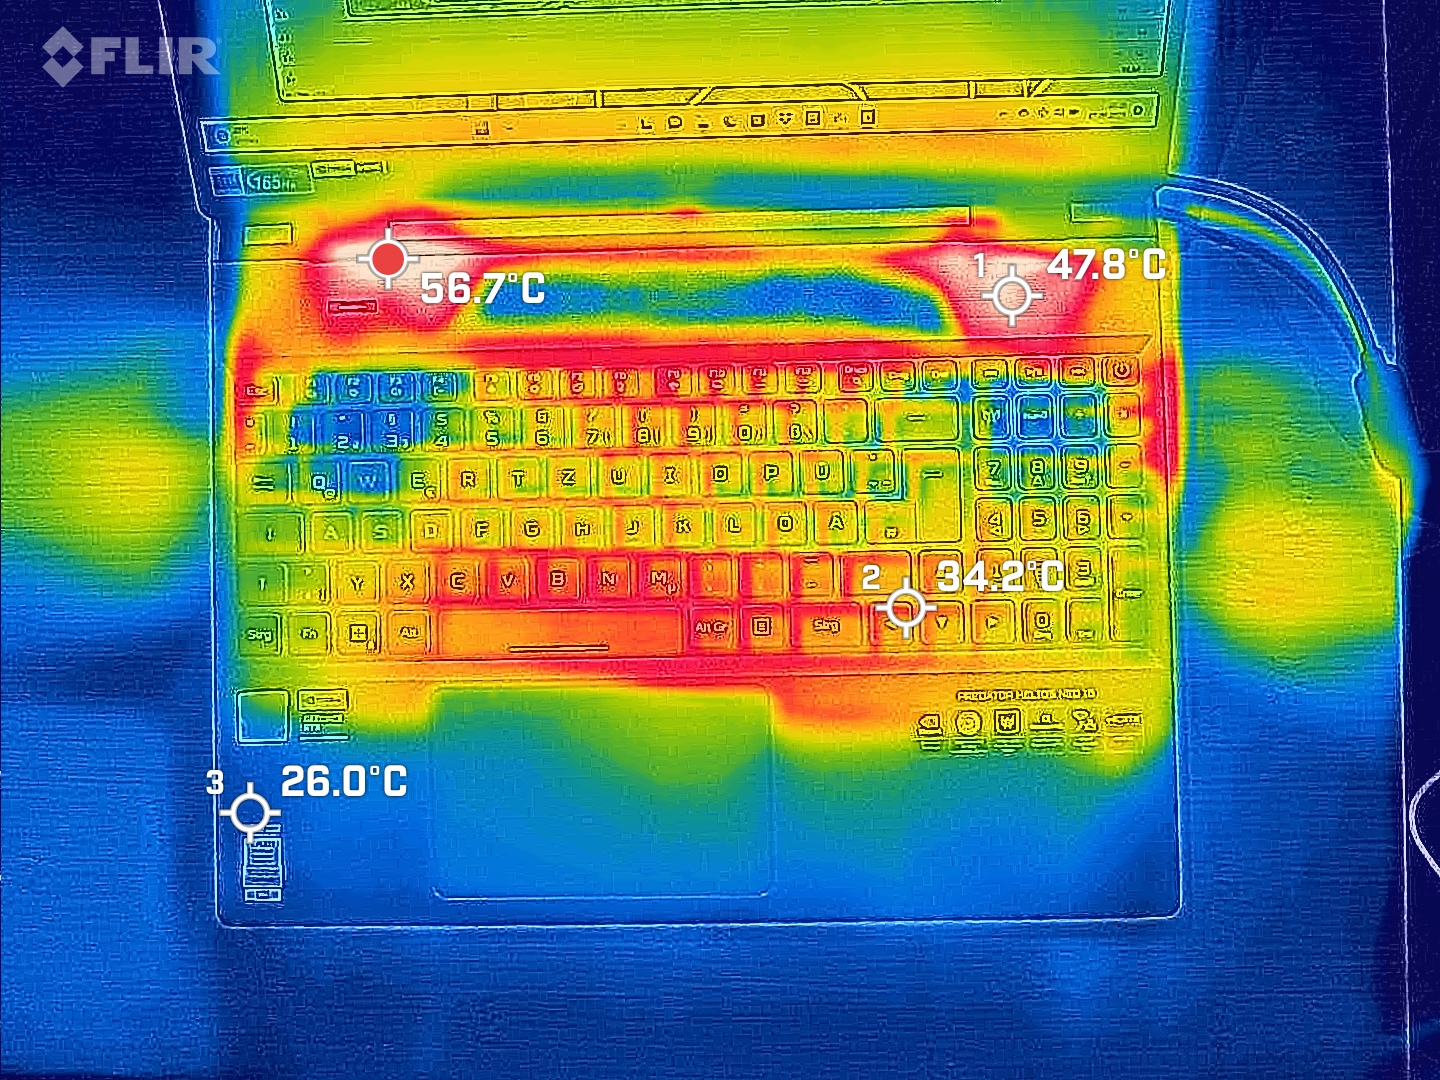
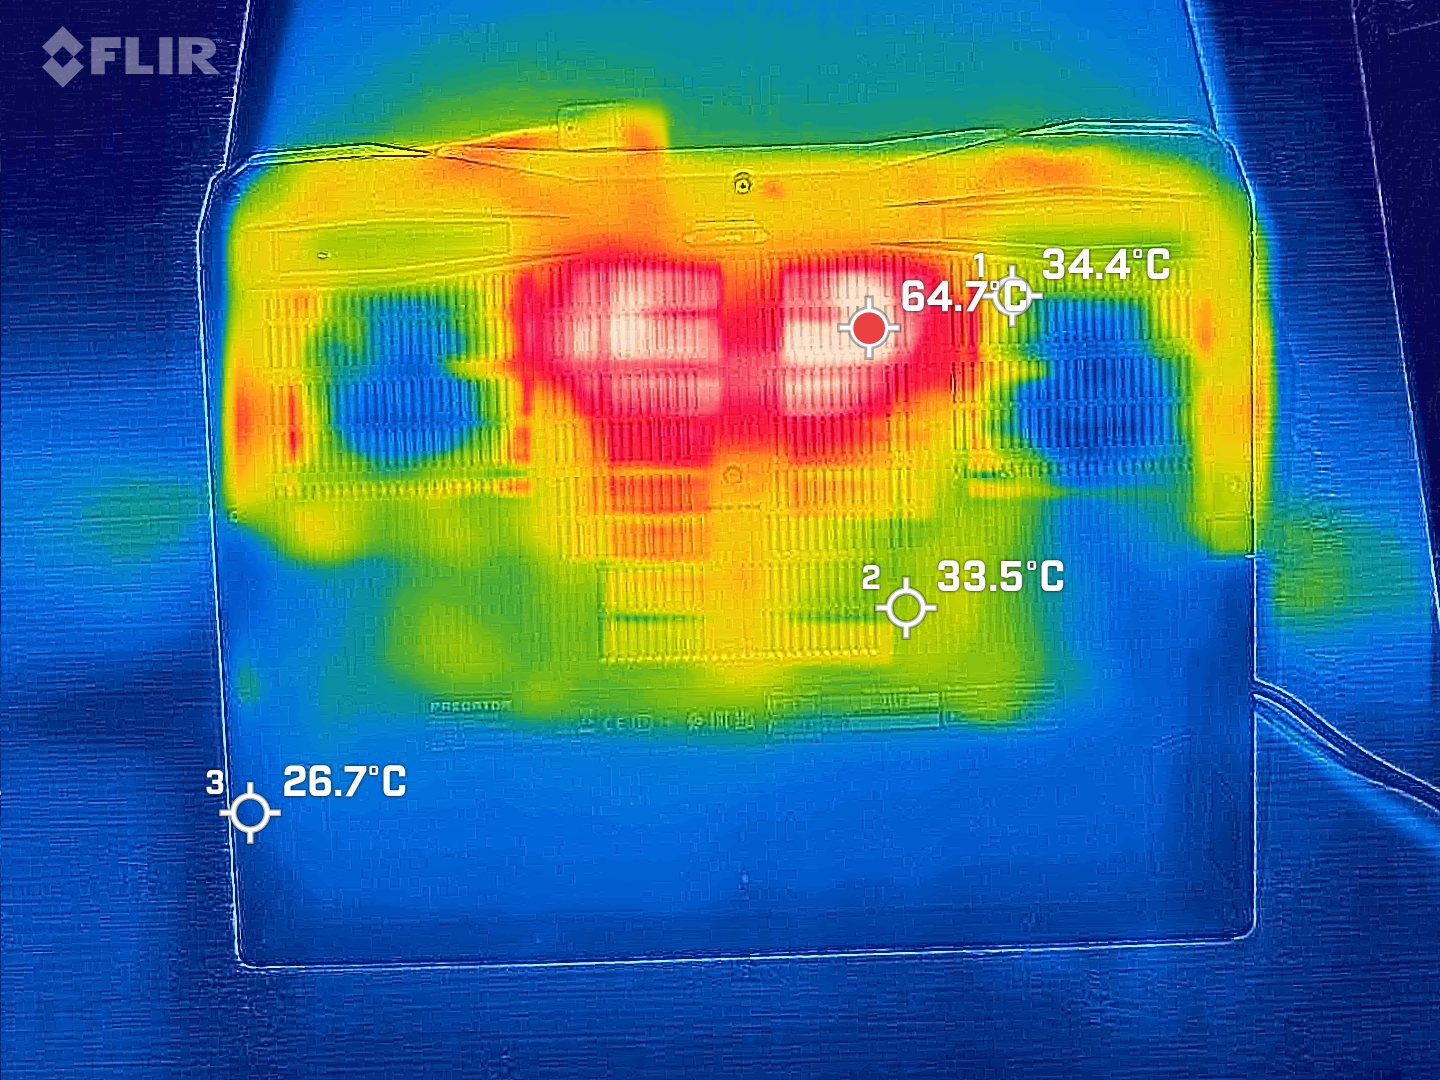
Temperatura
En general, el portátil para juegos de Acer se mantiene bastante fresco, con sus superficies alcanzando en la mayoría de los casos sólo entre 25 y 35 °C a plena carga. Sin embargo, observamos algunos puntos calientes con temperaturas de hasta 56 °C: a la izquierda, encima del teclado, y en la parte posterior, en la parte superior central. Este último podría resultar incómodo cuando se juega con el portátil colocado sobre el regazo, por ejemplo.
(-) La temperatura máxima en la parte superior es de 55.7 °C / 132 F, frente a la media de 40.4 °C / 105 F, que oscila entre 21.2 y 68.8 °C para la clase Gaming.
(-) El fondo se calienta hasta un máximo de 55 °C / 131 F, frente a la media de 43.2 °C / 110 F
(+) En reposo, la temperatura media de la parte superior es de 24.1 °C / 75# F, frente a la media del dispositivo de 33.9 °C / 93 F.
(+) El reposamanos y el panel táctil están a una temperatura inferior a la de la piel, con un máximo de 26.1 °C / 79 F y, por tanto, son fríos al tacto.
(+) La temperatura media de la zona del reposamanos de dispositivos similares fue de 28.8 °C / 83.8 F (+2.7 °C / 4.8 F).
| Acer Predator Helios Neo 16 NH.QLTEG.002 Intel Core i5-13500HX, NVIDIA GeForce RTX 4050 Laptop GPU | Lenovo Legion Pro 5 16ARX8 (R5 7645HX, RTX 4050) AMD Ryzen 5 7645HX, NVIDIA GeForce RTX 4050 Laptop GPU | Lenovo LOQ 16IRH8 Intel Core i7-13620H, NVIDIA GeForce RTX 4060 Laptop GPU | Schenker XMG Apex 15 (Late 23) AMD Ryzen 7 7840HS, NVIDIA GeForce RTX 4050 Laptop GPU | HP Victus 16-r0076TX Intel Core i5-13500HX, NVIDIA GeForce RTX 4050 Laptop GPU | Dell G15 5530 Intel Core i7-13650HX, NVIDIA GeForce RTX 4060 Laptop GPU | |
|---|---|---|---|---|---|---|
| Heat | -15% | -2% | -7% | -0% | -16% | |
| Maximum Upper Side * (°C) | 55.7 | 45 19% | 48 14% | 52 7% | 48 14% | 54 3% |
| Maximum Bottom * (°C) | 55 | 54 2% | 59 -7% | 47 15% | 48 13% | 62.2 -13% |
| Idle Upper Side * (°C) | 26 | 36 -38% | 28 -8% | 33 -27% | 29.6 -14% | 33.4 -28% |
| Idle Bottom * (°C) | 26.6 | 38 -43% | 28 -5% | 33 -24% | 30.2 -14% | 33.4 -26% |
* ... más pequeño es mejor
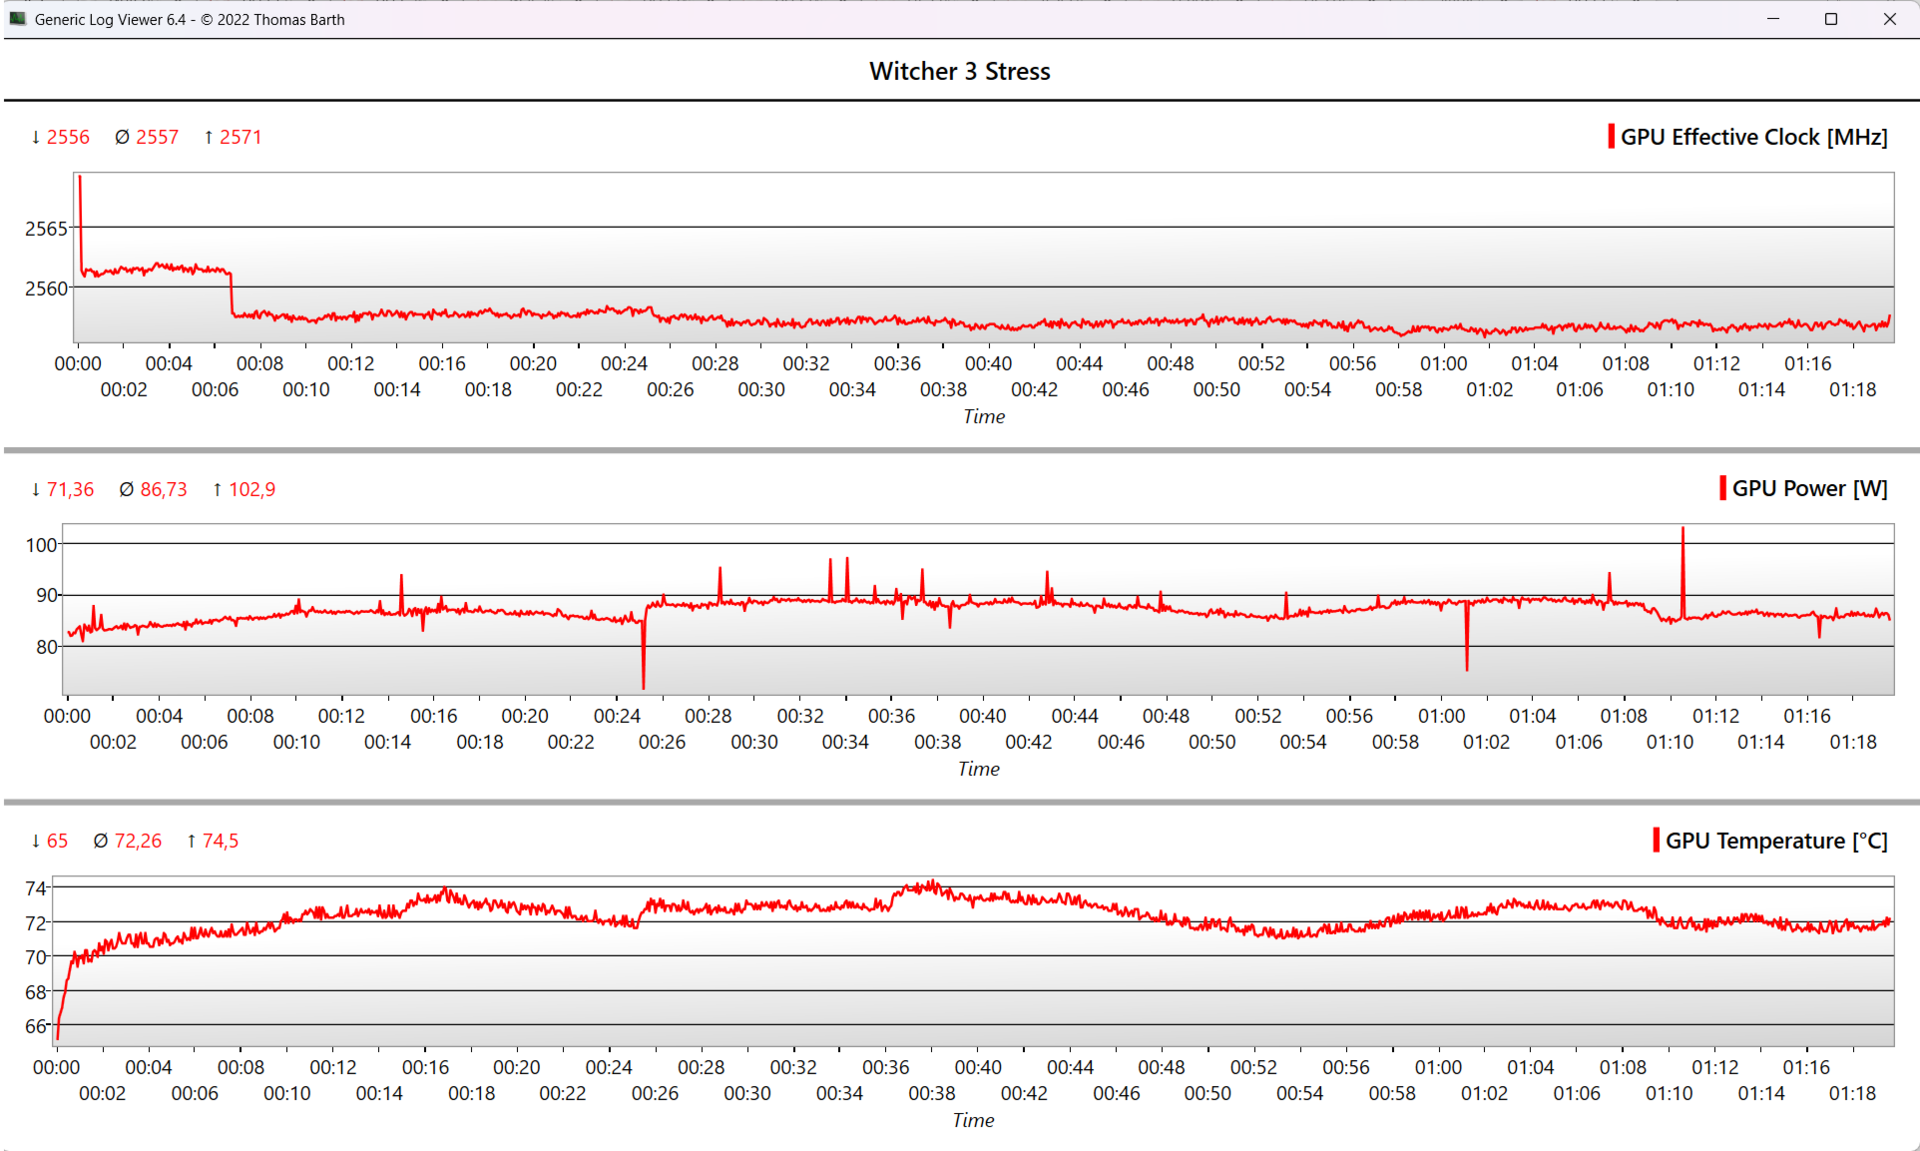
Prueba de esfuerzo
Durante nuestra prueba de estrés combinada (FurMark + Prime95), la velocidad de reloj de los núcleos P cayó de 4 GHz a sólo 2 GHz al cabo de un minuto y empezó a fluctuar en torno a los 2,25 GHz a partir del minuto 5, lo que está por encima del reloj base de 1,8 GHz.
La CPU alcanzó hasta 92 °C, pero fluctuó tanto que incluso después de una hora todavía caía ocasionalmente por debajo de la marca de los 80 °C. Su consumo medio de energía es de 58 vatios, mientras que elHelios 16 (no Neo) con uni7-13700HX consume 100 vatios a pesar de tener (casi) el mismo sistema de refrigeración. La velocidad de reloj de la GPU pasó rápidamente de 2.560 MHz (reloj máximo) a unos 2.350 MHz y alcanzó temperaturas de hasta 87 °C.
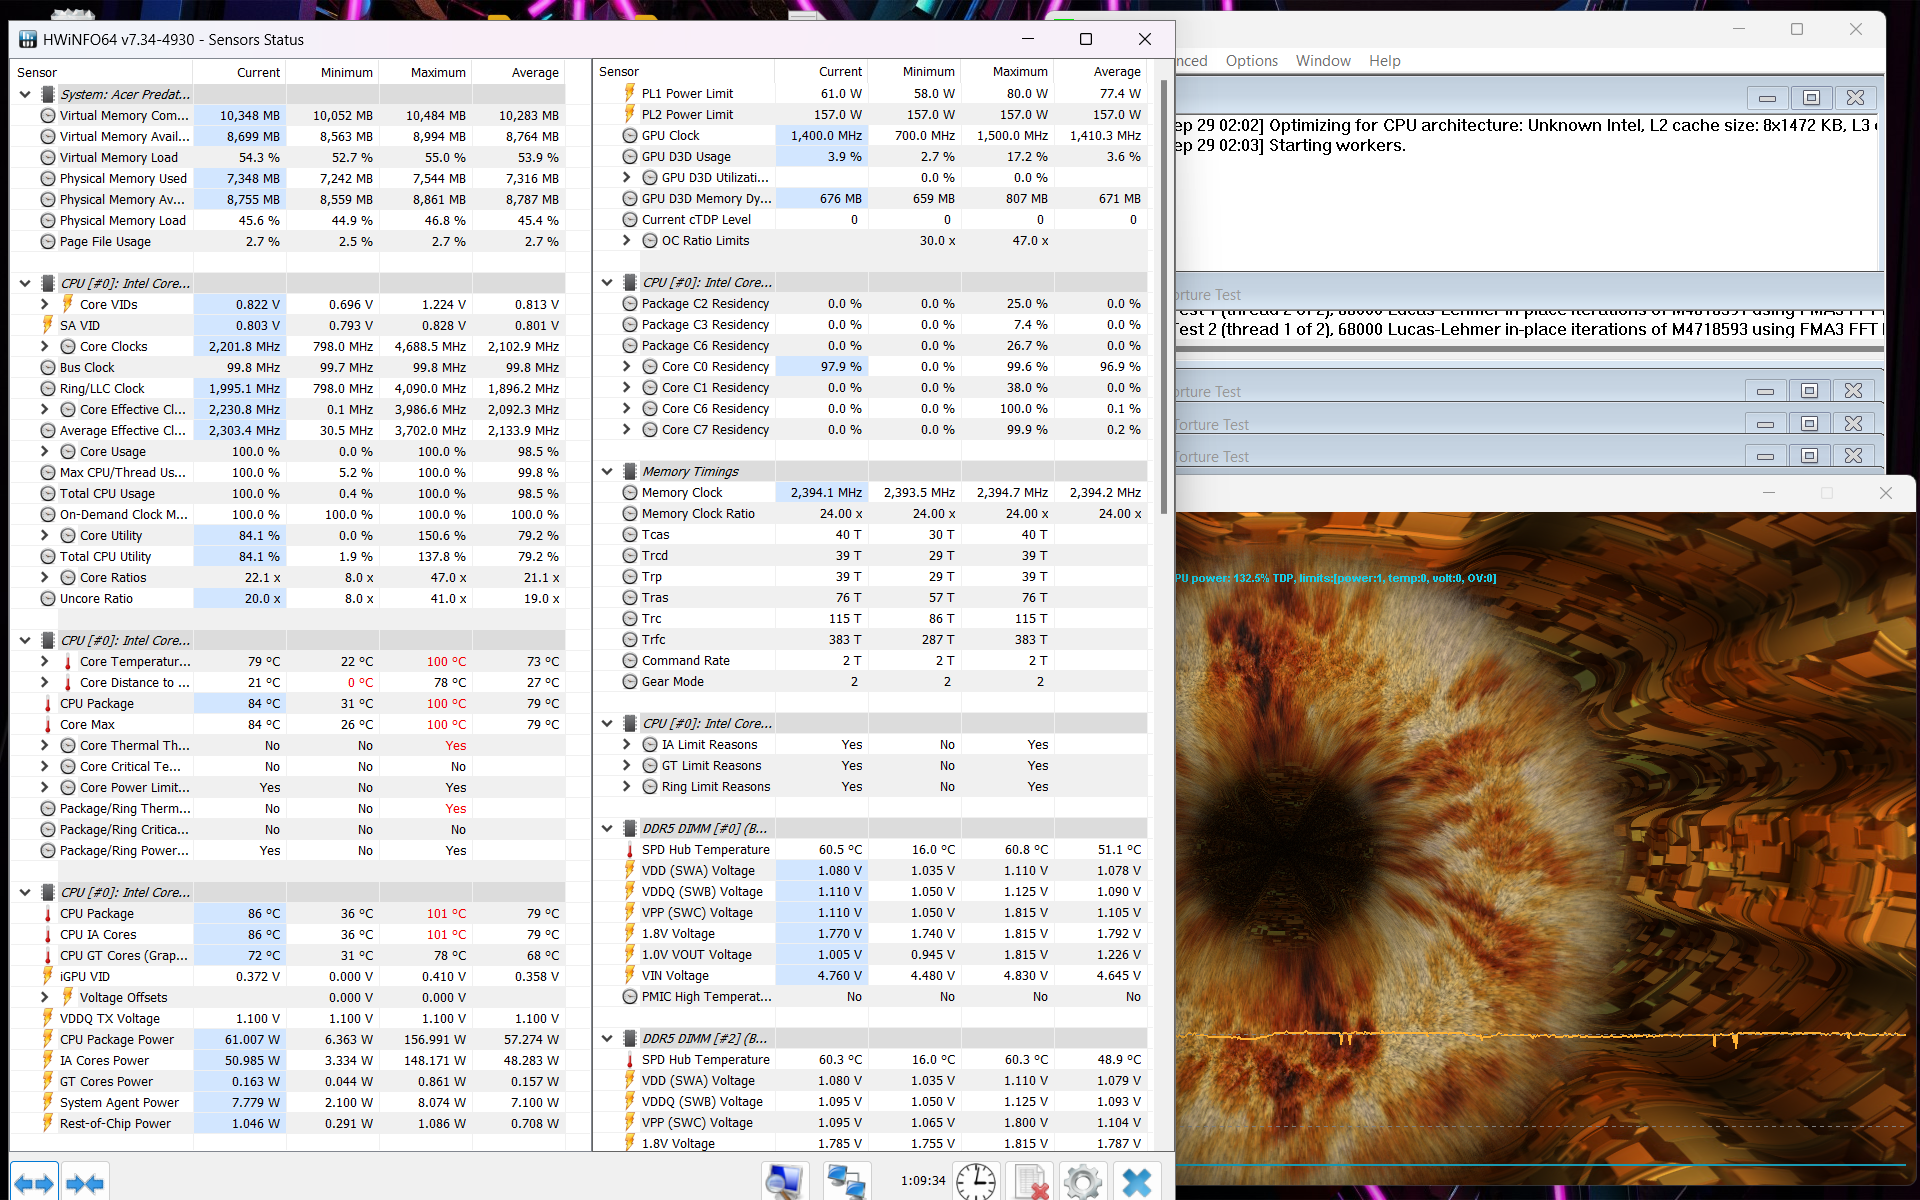
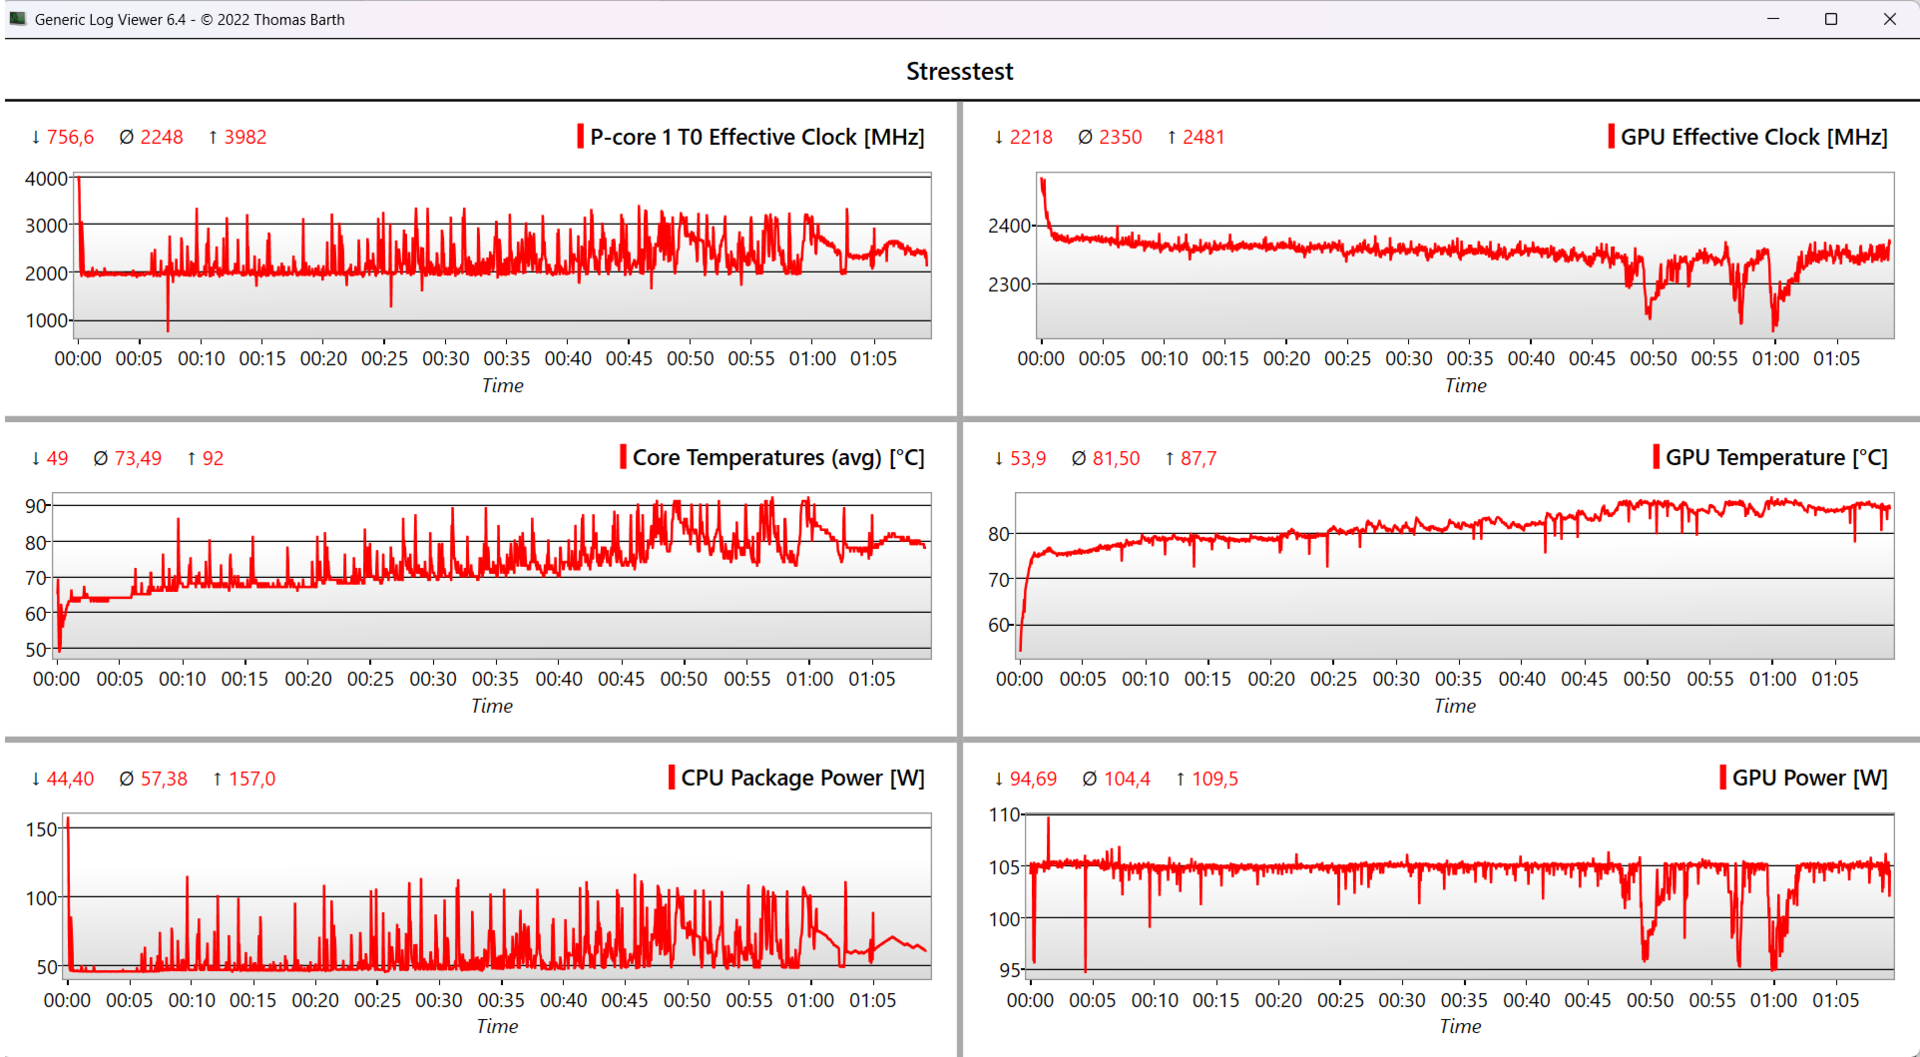
| Reloj de la CPU (GHz) | Reloj de la GPU (MHz) | Temperatura media dela CPU (°C) | Temperatura media de la GPU (°C) | |
| Prime95+FurMark | 2,25 | 2.350 | 74 | 82 |
Altavoces
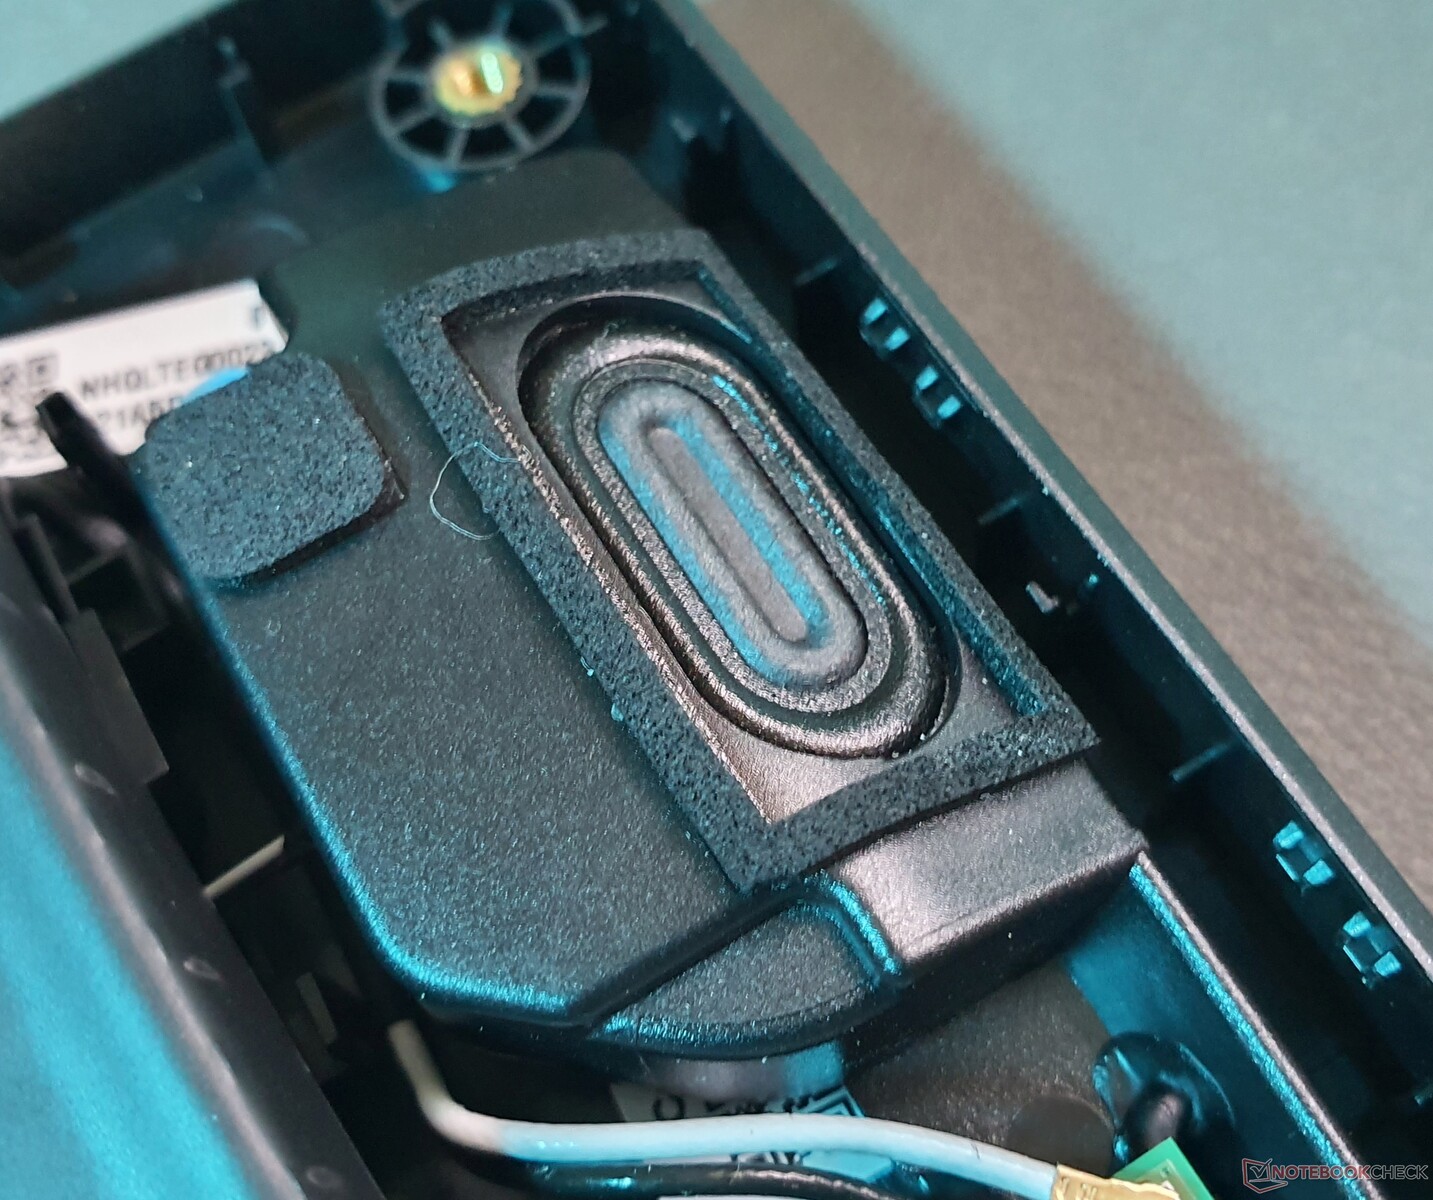
Los altavoces estéreo de 2 vatios orientados hacia abajo del dispositivo producen medios y agudos equilibrados, pero los graves están casi completamente ausentes. Su volumen máximo de 78,5 dB(A) también está en la media. Los portátiles para juegos de nuestra comparativa tampoco ofrecen un sonido mejor.
Por tanto, se recomienda utilizar unos auriculares o un sistema de sonido conectado a través del conector de audio o Bluetooth para disfrutar de una experiencia de sonido envolvente.
Acer Predator Helios Neo 16 NH.QLTEG.002 análisis de audio
(±) | la sonoridad del altavoz es media pero buena (78.5 dB)
Graves 100 - 315 Hz
(-) | casi sin bajos - de media 24.6% inferior a la mediana
(±) | la linealidad de los graves es media (12.3% delta a frecuencia anterior)
Medios 400 - 2000 Hz
(+) | medios equilibrados - a sólo 2.4% de la mediana
(+) | los medios son lineales (5.7% delta a la frecuencia anterior)
Altos 2 - 16 kHz
(+) | máximos equilibrados - a sólo 1.9% de la mediana
(+) | los máximos son lineales (3.3% delta a la frecuencia anterior)
Total 100 - 16.000 Hz
(±) | la linealidad del sonido global es media (17.4% de diferencia con la mediana)
En comparación con la misma clase
» 48% de todos los dispositivos probados de esta clase eran mejores, 12% similares, 40% peores
» El mejor tuvo un delta de 6%, la media fue 18%, el peor fue ###max##%
En comparación con todos los dispositivos probados
» 33% de todos los dispositivos probados eran mejores, 8% similares, 58% peores
» El mejor tuvo un delta de 4%, la media fue 23%, el peor fue ###max##%
Lenovo Legion Pro 5 16ARX8 (R5 7645HX, RTX 4050) análisis de audio
(±) | la sonoridad del altavoz es media pero buena (78.06 dB)
Graves 100 - 315 Hz
(-) | casi sin bajos - de media 20.9% inferior a la mediana
(±) | la linealidad de los graves es media (11.7% delta a frecuencia anterior)
Medios 400 - 2000 Hz
(±) | medias más altas - de media 6.8% más altas que la mediana
(+) | los medios son lineales (5.7% delta a la frecuencia anterior)
Altos 2 - 16 kHz
(+) | máximos equilibrados - a sólo 2.8% de la mediana
(±) | la linealidad de los máximos es media (7.5% delta a frecuencia anterior)
Total 100 - 16.000 Hz
(±) | la linealidad del sonido global es media (21.5% de diferencia con la mediana)
En comparación con la misma clase
» 77% de todos los dispositivos probados de esta clase eran mejores, 5% similares, 18% peores
» El mejor tuvo un delta de 6%, la media fue 18%, el peor fue ###max##%
En comparación con todos los dispositivos probados
» 61% de todos los dispositivos probados eran mejores, 7% similares, 32% peores
» El mejor tuvo un delta de 4%, la media fue 23%, el peor fue ###max##%
Gestión de la energía: La CPU de clase sobremesa pasa factura al portátil para juegos
Consumo de energía
El consumo de energía en reposo del portátil para juegos, de 15,5 vatios, no es sorprendente dada la CPU de clase de sobremesa que lleva instalada. Otros sistemas HX (55 vatios TDP), ya sean Intel o AMD, suelen consumir hasta 20 vatios. Los sistemas AMD HS (TDP de 35 vatios) como elXMG Apex 15 (que sólo consume 10 vatios en modo inactivo) suelen tener una ventaja equivalente.
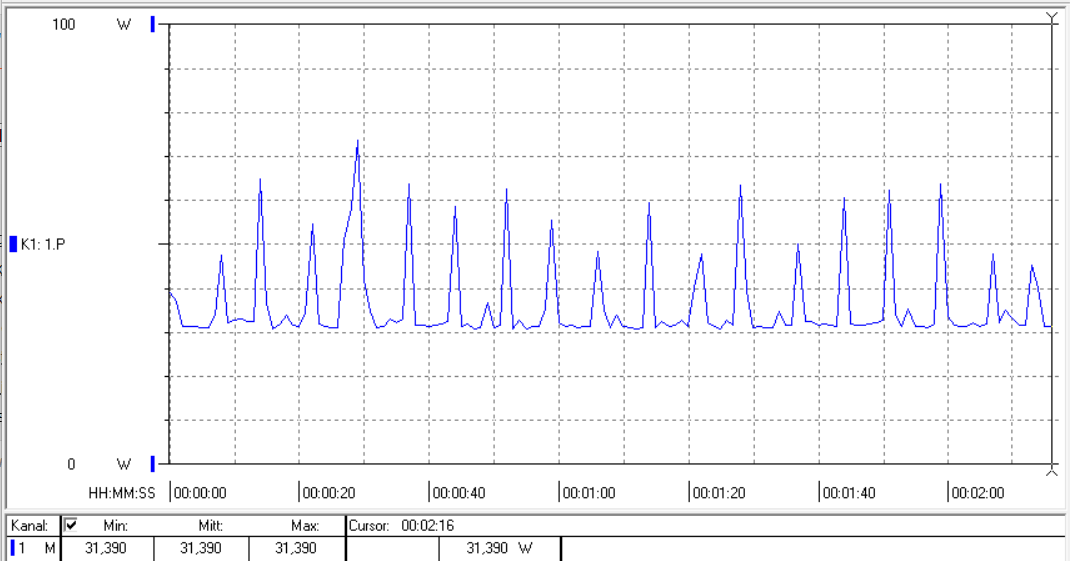
Un consumo de 145 vatios mientras se juega es relativamente bajo, pero no si se tiene en cuenta que laRTX 4050 ya alcanza su reloj máximo a ~87 vatios. Sólo en la prueba de estrés no cotidiana alcanzó un pico de hasta 239 vatios, que la fuente de alimentación de 230 vatios aún puede gestionar.
| Off / Standby | |
| Ocioso | |
| Carga |
|
Clave:
min: | |
| Acer Predator Helios Neo 16 NH.QLTEG.002 i5-13500HX, GeForce RTX 4050 Laptop GPU, SK hynix HFS512GEJ9X125N, IPS, 1920x1200, 16" | Lenovo Legion Pro 5 16ARX8 (R5 7645HX, RTX 4050) R5 7645HX, GeForce RTX 4050 Laptop GPU, SK hynix PC801 HFS512GEJ9X115N, IPS, 2560x1600, 16" | Lenovo LOQ 16IRH8 i7-13620H, GeForce RTX 4060 Laptop GPU, Solidigm SSDPFINW512GZL, IPS, 2560x1600, 16" | Schenker XMG Apex 15 (Late 23) R7 7840HS, GeForce RTX 4050 Laptop GPU, Samsung 990 Pro 1 TB, IPS, 2560x1440, 15.6" | HP Victus 16-r0076TX i5-13500HX, GeForce RTX 4050 Laptop GPU, SK hynix PC801 HFS512GEJ9X101N BF, IPS, 1920x1080, 16.1" | Dell G15 5530 i7-13650HX, GeForce RTX 4060 Laptop GPU, SSTC CL4-3D512-Q11, IPS, 1920x1080, 15.6" | Medio NVIDIA GeForce RTX 4050 Laptop GPU | Media de la clase Gaming | |
|---|---|---|---|---|---|---|---|---|
| Power Consumption | 4% | -6% | 31% | -9% | 7% | 15% | -10% | |
| Idle Minimum * (Watt) | 11.95 | 13 -9% | 17.2 -44% | 6 50% | 16.12 -35% | 8.4 30% | 9.95 ? 17% | 13 ? -9% |
| Idle Average * (Watt) | 32 | 17.4 46% | 19.3 40% | 11 66% | 20.47 36% | 14.98 53% | 15.8 ? 51% | 19 ? 41% |
| Idle Maximum * (Watt) | 15.5 | 21.8 -41% | 21.2 -37% | 14 10% | 22.11 -43% | 15.56 -0% | 20.1 ? -30% | 24.6 ? -59% |
| Load Average * (Watt) | 97.5 | 96.4 1% | 90 8% | 65 33% | 94.8 3% | 96.8 1% | 88 ? 10% | 110.7 ? -14% |
| Witcher 3 ultra * (Watt) | 144.9 | 125 14% | 168 -16% | 136.5 6% | 166.9 -15% | 186 -28% | ||
| Load Maximum * (Watt) | 239 | 204 15% | 211 12% | 195 18% | 237 1% | 271.42 -14% | 176.3 ? 26% | 259 ? -8% |
* ... más pequeño es mejor
Power consumption Witcher 3 / stress test
Power consumption with external monitor
Tiempos de ejecución
Con una autonomía de 4 horas y 16 minutos, el Helios Neo 16 no tiene demasiada resistencia, ni siquiera en el contexto de los dispositivos para juegos. Su frecuencia de refresco se ajusta automáticamente de forma variable entre 83 Hz y 120 Hz.
ElHP Victus 16 (9 horas) y el AMDXMG Apex 15 (7 horas) ofrecen duraciones de batería significativamente más largas a pesar de que este último tiene una batería más pequeña de 63 Wh.
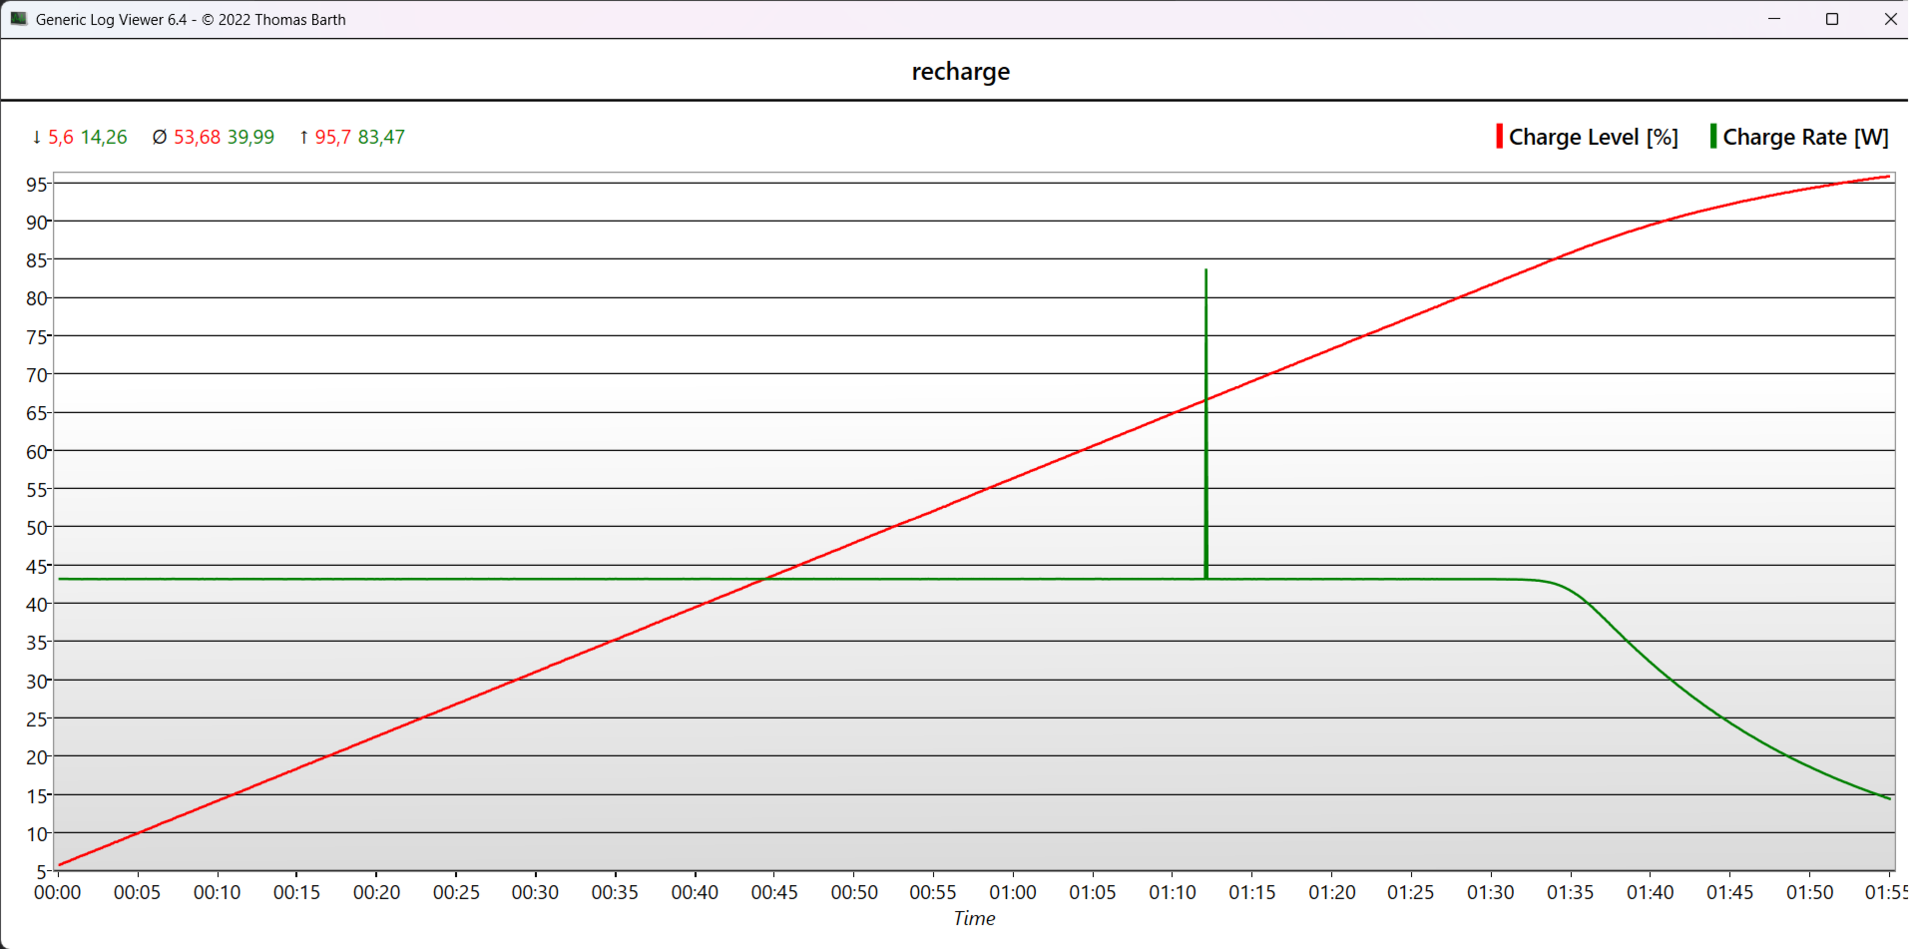
Se necesita una hora completa para cargar la batería al 50 % y una carga completa tarda dos horas. La carga a través de USB-C tarda aún más.
| Acer Predator Helios Neo 16 NH.QLTEG.002 i5-13500HX, GeForce RTX 4050 Laptop GPU, 90 Wh | Lenovo Legion Pro 5 16ARX8 (R5 7645HX, RTX 4050) R5 7645HX, GeForce RTX 4050 Laptop GPU, 80 Wh | Acer Predator Helios 16 PH16-71-731Q i7-13700HX, GeForce RTX 4060 Laptop GPU, 90 Wh | Lenovo LOQ 16IRH8 i7-13620H, GeForce RTX 4060 Laptop GPU, 80 Wh | Schenker XMG Apex 15 (Late 23) R7 7840HS, GeForce RTX 4050 Laptop GPU, 62.32 Wh | HP Victus 16-r0076TX i5-13500HX, GeForce RTX 4050 Laptop GPU, 83 Wh | Dell G15 5530 i7-13650HX, GeForce RTX 4060 Laptop GPU, 86 Wh | Media de la clase Gaming | |
|---|---|---|---|---|---|---|---|---|
| Duración de Batería | 3% | -7% | 6% | 23% | 27% | -4% | 21% | |
| H.264 (h) | 7.2 | 5.4 -25% | 4.8 -33% | 6.4 -11% | 8.3 15% | 7.7 7% | 6.8 -6% | 8.32 ? 16% |
| WiFi v1.3 (h) | 4.3 | 5.6 30% | 5.6 30% | 6.3 47% | 7.1 65% | 8.9 107% | 6.5 51% | 7.11 ? 65% |
| Load (h) | 1.8 | 1.5 -17% | 1.5 -17% | 1.6 -11% | 1.2 -33% | 0.8 -56% | 1.502 ? -17% | |
| Witcher 3 ultra (h) | 0.8 | 1.5 | 1.5 | 0.8 |
Pro
Contra
Veredicto: El jugador de gama media con una RTX 4050 no es muy prometedor
El Predator Helios Neo 16 de Acer es una quimera que consiste en un sólido portátil para juegos de gama media y bastantes características de nivel básico. En particular, estas últimas incluyen laRTX 4050instalada en nuestro dispositivo de pruebas - pero su panel Full HD, que puede ofrecer valores decentes, es bastante estándar. Lo mismo puede decirse de su teclado, que también puede encontrarse en muchos otros portátiles de juegos económicos.
Acer ha emparejado todo esto con un potente Intel Corei5-13500HXque incluye una solución de refrigeración de metal líquido, una carcasa elegante y robusta, bien construida, así como un montón de opciones de conectividad, que incluyen HDMI 2.1 real que se conecta a la dGPU y dos puertos Thunderbolt 4. Completan la configuración Advanced Optimus y G-Sync.
Por desgracia, no estamos del todo seguros de que esta combinación (en relación con su MRSP de 1.069 dólares) pueda encontrar su mercado objetivo. Más bien requeriría unaRTX 4060o unaRTX 4070para que merezca la pena, que a menudo sólo pueden encontrarse en la Neo 16 por un sobreprecio. También a diferencia delHelios 16este modelo no tiene la opción de optar por un i9-13900HX, un panel QHD con una cobertura sRGB del 100 % o una opción Mini LED. Su webcam de 720p supone además una gran diferencia y, a la vista del precio del portátil, es un verdadero motivo de crítica. Su corta autonomía de 4 horas y media tampoco es la mejor.
El Acer Predator Helios Neo 16 es una versión adelgazada del sólido Helios 16. En teoría, es una buena idea, pero sólo funcionaría si la diferencia de precio entre ambos no fuera tan pequeña.
Su potente sistema de refrigeración ha sido adoptado casi 1:1 del Helios 16, lo que se traduce en bajas temperaturas internas y bajas emisiones de ruido (a más tardar cuando se utiliza el modo equilibrado) - y no a costa de ningún rendimiento. En el lado opuesto, sus grandes restricciones de potencia de GPU y CPU en modo batería son un poco exageradas.
Nos parece totalmente extraño que pueda conseguir el Helios 16 normal con la misma configuración pero con más prestaciones por el mismo precio. Como alternativa, podría valer la pena echar un vistazo alLegion Pro 5 16(Intel), que cuesta un poco más pero se beneficia de un panel QHD de 240 Hz, una RTX 4060 más potente, un teclado cómodo, así como una refrigeración más silenciosa al jugar. Por otro lado, si lo que busca es un verdadero presupuesto gamer, entonces tal vez sea mejor que eche un vistazo alLenovo LOQ 16que cuenta con un frugal AMDRyzen 9 7940HSun panel QHD y una RTX 4050 (1.200 dólares) o una RTX 4060 (1.400 dólares).
Precio y disponibilidad
La versión del Acer Predator Helios 16 que probamos, con un Intel Core i5-13500HX, RTX 4050 y una pantalla FHD+, se puede encontrar en Amazon por 1.069 dólares.
Acer Predator Helios Neo 16 NH.QLTEG.002
- 11/02/2023 v7 (old)
Marvin Gollor
Transparencia
La selección de los dispositivos que se van a reseñar corre a cargo de nuestro equipo editorial. La muestra de prueba fue proporcionada al autor en calidad de préstamo por el fabricante o el minorista a los efectos de esta reseña. El prestamista no tuvo ninguna influencia en esta reseña, ni el fabricante recibió una copia de la misma antes de su publicación. No había ninguna obligación de publicar esta reseña. Como empresa de medios independiente, Notebookcheck no está sujeta a la autoridad de fabricantes, minoristas o editores.
Así es como prueba Notebookcheck
Cada año, Notebookcheck revisa de forma independiente cientos de portátiles y smartphones utilizando procedimientos estandarizados para asegurar que todos los resultados son comparables. Hemos desarrollado continuamente nuestros métodos de prueba durante unos 20 años y hemos establecido los estándares de la industria en el proceso. En nuestros laboratorios de pruebas, técnicos y editores experimentados utilizan equipos de medición de alta calidad. Estas pruebas implican un proceso de validación en varias fases. Nuestro complejo sistema de clasificación se basa en cientos de mediciones y puntos de referencia bien fundamentados, lo que mantiene la objetividad.Price comparison

