Breve análisis del Chromebook Google Pixelbook
| Networking | |
| iperf3 transmit AX12 | |
| Microsoft Surface Laptop i5 | |
| Samsung Notebook 9 NP900X3N-K01US | |
| Google Pixelbook | |
| iperf3 receive AX12 | |
| Samsung Notebook 9 NP900X3N-K01US | |
| Google Pixelbook | |
| Microsoft Surface Laptop i5 | |
| |||||||||||||||||||||||||
iluminación: 80 %
Brillo con batería: 473.9 cd/m²
Contraste: 1354:1 (Negro: 0.35 cd/m²)
ΔE ColorChecker Calman: 3.9 | ∀{0.5-29.43 Ø4.73}
ΔE Greyscale Calman: 5.4 | ∀{0.09-98 Ø4.97}
Gamma: 2.13
CCT: 7643 K
| Google Pixelbook IPS, 12.3", 2400x1600 | Microsoft Surface Pro (2017) i7 LG Display LP123WQ112604, IPS, 12.3", 2736x1824 | Microsoft Surface Laptop i5 ID: MEI96A2, Name: Panasonic VVX14T092N00, IPS, 13.5", 2256x1504 | Apple MacBook Pro 13 2017 APPA033, IPS, 13.3", 2560x1600 | Apple MacBook 12 (Early 2016) 1.1 GHz APPA027, IPS, 12", 2304x1440 | |
|---|---|---|---|---|---|
| Display | |||||
| Display P3 Coverage (%) | 66.6 | 67.8 | 99.2 | 66.8 | |
| sRGB Coverage (%) | 96.5 | 94.3 | 99.9 | 95.4 | |
| AdobeRGB 1998 Coverage (%) | 67.8 | 69.5 | 87.1 | 68 | |
| Response Times | 34% | 6% | 24% | 23% | |
| Response Time Grey 50% / Grey 80% * (ms) | 59.2 ? | 37 ? 37% | 50.8 ? 14% | 42.8 ? 28% | 41.2 ? 30% |
| Response Time Black / White * (ms) | 36 ? | 25 ? 31% | 37.2 ? -3% | 28.8 ? 20% | 30.4 ? 16% |
| PWM Frequency (Hz) | 820 ? | 22130 ? | |||
| Screen | -1% | 17% | 26% | 11% | |
| Brightness middle (cd/m²) | 473.9 | 482 2% | 384.2 -19% | 588 24% | 387 -18% |
| Brightness (cd/m²) | 443 | 466 5% | 378 -15% | 561 27% | 358 -19% |
| Brightness Distribution (%) | 80 | 92 15% | 90 13% | 92 15% | 88 10% |
| Black Level * (cd/m²) | 0.35 | 0.395 -13% | 0.36 -3% | 0.45 -29% | 0.47 -34% |
| Contrast (:1) | 1354 | 1220 -10% | 1067 -21% | 1307 -3% | 823 -39% |
| Colorchecker dE 2000 * | 3.9 | 4 -3% | 1.8 54% | 1.7 56% | 1.6 59% |
| Colorchecker dE 2000 max. * | 7.7 | 7.2 6% | 4.2 45% | 3.5 55% | 4 48% |
| Greyscale dE 2000 * | 5.4 | 5.7 -6% | 1.2 78% | 1.9 65% | 1 81% |
| Gamma | 2.13 103% | 2.28 96% | 2.21 100% | 2.33 94% | 2.26 97% |
| CCT | 7643 85% | 7950 82% | 6708 97% | 6738 96% | 6680 97% |
| Color Space (Percent of AdobeRGB 1998) (%) | 62 | 63.7 | 77.92 | 61.6 | |
| Color Space (Percent of sRGB) (%) | 96 | 94.2 | 99.94 | 82.2 | |
| Media total (Programa/Opciones) | 17% /
6% | 12% /
14% | 25% /
26% | 17% /
13% |
* ... más pequeño es mejor
Tiempos de respuesta del display
| ↔ Tiempo de respuesta de Negro a Blanco | ||
|---|---|---|
| 36 ms ... subida ↗ y bajada ↘ combinada | ↗ 20 ms subida | 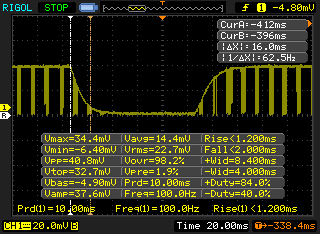 |
| ↘ 16 ms bajada | ||
| La pantalla mostró tiempos de respuesta lentos en nuestros tests y podría ser demasiado lenta para los jugones. En comparación, todos los dispositivos de prueba van de ##min### (mínimo) a 240 (máximo) ms. » 94 % de todos los dispositivos son mejores. Eso quiere decir que el tiempo de respuesta es peor que la media (19.9 ms) de todos los dispositivos testados. | ||
| ↔ Tiempo de respuesta 50% Gris a 80% Gris | ||
| 59.2 ms ... subida ↗ y bajada ↘ combinada | ↗ 29.6 ms subida | 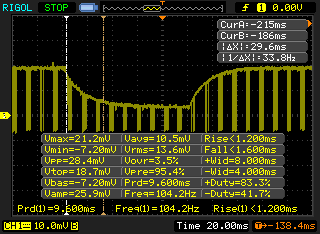 |
| ↘ 29.6 ms bajada | ||
| La pantalla mostró tiempos de respuesta lentos en nuestros tests y podría ser demasiado lenta para los jugones. En comparación, todos los dispositivos de prueba van de ##min### (mínimo) a 636 (máximo) ms. » 95 % de todos los dispositivos son mejores. Eso quiere decir que el tiempo de respuesta es peor que la media (31.1 ms) de todos los dispositivos testados. | ||
Parpadeo de Pantalla / PWM (Pulse-Width Modulation)
| Parpadeo de Pantalla / PWM detectado | 820 Hz | ≤ 100 % de brillo | 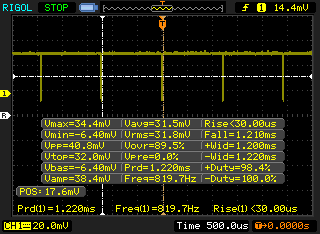 |
La retroiluminación del display parpadea a 820 Hz (seguramente usa PWM - Pulse-Width Modulation) a un brillo del 100 % e inferior. Sobre este nivel de brillo no debería darse parpadeo / PWM. La frecuencia de 820 Hz es bastante alta, por lo que la mayoría de gente sensible al parpadeo no debería ver parpadeo o tener fatiga visual. Comparación: 52 % de todos los dispositivos testados no usaron PWM para atenuar el display. Si se usó, medimos una media de 7798 (mínimo: 5 - máxmo: 343500) Hz. | |||
| Sunspider | |
| 1.0 Total Score | |
| Acer Chromebook 14 CP5-471-53QV | |
| Google Pixelbook | |
| HP Chromebook 13 G1 Core m5 | |
| Lenovo ThinkPad 13 Chromebook | |
| Microsoft Surface Laptop i5 | |
| 0.9.1 Total Score | |
| Google Chromebook Pixel | |
| Mozilla Kraken 1.1 - Total | |
| Huawei Mate 10 Pro | |
| Google Pixel XL 2016 | |
| Samsung Galaxy Note 8 | |
| Microsoft Surface Pro (2017) m3 | |
| Acer Chromebook 14 CP5-471-53QV | |
| Google Pixelbook | |
| HP Chromebook 13 G1 Core m5 | |
| Lenovo ThinkPad 13 Chromebook | |
| Apple iPhone 8 Plus | |
| WebXPRT 2015 - Overall | |
| Google Pixelbook | |
| Acer Chromebook 14 CP5-471-53QV | |
| Apple iPhone 8 Plus | |
| Lenovo ThinkPad 13 Chromebook | |
| HP Chromebook 13 G1 Core m5 | |
| Samsung Galaxy Note 8 | |
| Huawei Mate 10 Pro | |
| Google Pixel XL 2016 | |
* ... más pequeño es mejor
| AnTuTu v6 - Total Score | |
| Google Pixelbook | |
| Huawei Mate 10 Pro | |
| OnePlus 5 | |
| Samsung Galaxy Note 8 | |
| Sony Xperia XZ Premium | |
| Samsung Galaxy S8 | |
| Honor 8 Pro | |
| HTC U Ultra | |
| PCMark for Android | |
| Work 2.0 battery life | |
| Huawei Mate 10 Pro | |
| Samsung Galaxy S8 | |
| Samsung Galaxy Note 8 | |
| Computer Vision score | |
| Google Pixelbook | |
| Huawei Mate 10 Pro | |
| Samsung Galaxy S8 | |
| Samsung Galaxy Note 8 | |
| Storage score | |
| Google Pixelbook | |
| Huawei Mate 10 Pro | |
| Samsung Galaxy Note 8 | |
| Samsung Galaxy S8 | |
| Work 2.0 performance score | |
| Google Pixelbook | |
| Huawei Mate 10 Pro | |
| OnePlus 5 | |
| Sony Xperia XZ Premium | |
| Honor 8 Pro | |
| Samsung Galaxy S8 | |
| HTC U Ultra | |
| Samsung Galaxy Note 8 | |
| Work performance score | |
| Huawei Mate 10 Pro | |
| OnePlus 5 | |
| Sony Xperia XZ Premium | |
| Honor 8 Pro | |
| Samsung Galaxy Note 8 | |
| Samsung Galaxy S8 | |
| HTC U Ultra | |
| Geekbench 4.4 | |
| Compute RenderScript Score | |
| Huawei Mate 10 Pro | |
| Samsung Galaxy S8 | |
| Samsung Galaxy Note 8 | |
| OnePlus 5 | |
| Sony Xperia XZ Premium | |
| 64 Bit Multi-Core Score | |
| Google Pixelbook | |
| OnePlus 5 | |
| Huawei Mate 10 Pro | |
| Samsung Galaxy Note 8 | |
| Samsung Galaxy S8 | |
| Sony Xperia XZ Premium | |
| Honor 8 Pro | |
| 64 Bit Single-Core Score | |
| Google Pixelbook | |
| Samsung Galaxy Note 8 | |
| Samsung Galaxy S8 | |
| OnePlus 5 | |
| Sony Xperia XZ Premium | |
| Huawei Mate 10 Pro | |
| Honor 8 Pro | |
| Lightmark - 1920x1080 1080p | |
| Samsung Galaxy Note 8 | |
| Samsung Galaxy S8 | |
| Huawei Mate 10 Pro | |
| Google Pixelbook | |
| Basemark X 1.1 | |
| High Quality | |
| Samsung Galaxy S8 | |
| Samsung Galaxy Note 8 | |
| Google Pixelbook | |
| Huawei Mate 10 Pro | |
| Medium Quality | |
| Samsung Galaxy S8 | |
| Samsung Galaxy Note 8 | |
| Google Pixelbook | |
| Huawei Mate 10 Pro | |
| Cinebench R15 | |
| Cinebench R15 CPU Single 64 Bit | |
| Cinebench R15 CPU Multi 64 Bit |
| Cinebench R11.5 | |
| Cinebench R11.5 CPU Multi 64 Bit | |
| Cinebench R11.5 CPU Single 64 Bit |
| Cinebench R10 | |
| Cinebench R10 Rend. Single (32bit) | |
| Cinebench R10 Rend. Multi (32bit) |
| wPrime 2.10 - 1024m wPrime 2.0 1024m |
* ... más pequeño es mejor
| Google Pixelbook | Samsung Galaxy Note 8 64 GB UFS 2.1 Flash | Huawei Mate 10 Pro 128 GB UFS 2.1 Flash | Google Pixel XL 2016 32 GB eMMC Flash | OnePlus 5 64 GB UFS 2.1 Flash | |
|---|---|---|---|---|---|
| AndroBench 3-5 | 247% | 539% | 77% | 261% | |
| Sequential Write 256KB SDCard (MB/s) | 59.3 | ||||
| Sequential Read 256KB SDCard (MB/s) | 67.9 | ||||
| Random Write 4KB (MB/s) | 12.6 | 14.55 15% | 164.4 1205% | 14.56 16% | 19.3 53% |
| Random Read 4KB (MB/s) | 28.87 | 122.5 324% | 132.3 358% | 87.7 204% | 141 388% |
| Sequential Write 256KB (MB/s) | 112.1 | 205.9 84% | 208.7 86% | 83.4 -26% | 201.5 80% |
| Sequential Read 256KB (MB/s) | 120.3 | 797 563% | 732 508% | 258.2 115% | 748 522% |
Ruido
| Ocioso |
| / / dB(A) |
| Carga |
| / dB(A) |
 | ||
30 dB silencioso 40 dB(A) audible 50 dB(A) ruidosamente alto |
||
min: | ||
| Google Pixelbook HD Graphics 615, i5-7Y57 | Microsoft Surface Pro (2017) i7 Iris Plus Graphics 640, i7-7660U, Samsung PM971 KUS040202M | Microsoft Surface Laptop i5 HD Graphics 620, i5-7200U, Toshiba THNSN0128GTYA | Apple MacBook Pro 13 2017 Iris Plus Graphics 640, i5-7360U, Apple SSD AP0128 | Huawei MateBook X HD Graphics 620, i5-7200U, LITEON CB1-SD256 | Samsung Notebook 9 NP900X3N-K01US HD Graphics 620, i5-7200U, Samsung CM871a MZNTY256HDHP | |
|---|---|---|---|---|---|---|
| Noise | ||||||
| apagado / medio ambiente * (dB) | 29.6 | 28.2 | 30.2 | 28.4 | ||
| Idle Minimum * (dB) | 29.6 | 28.2 | 30.2 | 28.4 | ||
| Idle Average * (dB) | 29.6 | 28.2 | 30.2 | 28.4 | ||
| Idle Maximum * (dB) | 29.6 | 29 | 30.2 | 28.4 | ||
| Load Average * (dB) | 33.4 | 30.3 | 32.9 | 33.2 | ||
| Witcher 3 ultra * (dB) | 33.4 | |||||
| Load Maximum * (dB) | 34.1 | 39.3 | 39.3 | 35.2 |
* ... más pequeño es mejor
(+) La temperatura máxima en la parte superior es de 38.8 °C / 102 F, frente a la media de 35.4 °C / 96 F, que oscila entre 19.6 y 60 °C para la clase Convertible.
(+) El fondo se calienta hasta un máximo de 38 °C / 100 F, frente a la media de 36.9 °C / 98 F
(+) En reposo, la temperatura media de la parte superior es de 25.6 °C / 78# F, frente a la media del dispositivo de 30.3 °C / 87 F.
(+) El reposamanos y el panel táctil están a una temperatura inferior a la de la piel, con un máximo de 28.8 °C / 83.8 F y, por tanto, son fríos al tacto.
(±) La temperatura media de la zona del reposamanos de dispositivos similares fue de 28 °C / 82.4 F (-0.8 °C / -1.4 F).
Google Pixelbook análisis de audio
(-) | altavoces no muy altos (#70.7 dB)
Graves 100 - 315 Hz
(-) | casi sin bajos - de media 17.1% inferior a la mediana
(±) | la linealidad de los graves es media (10.2% delta a frecuencia anterior)
Medios 400 - 2000 Hz
(±) | medias más altas - de media 5.4% más altas que la mediana
(±) | la linealidad de los medios es media (8.4% delta respecto a la frecuencia anterior)
Altos 2 - 16 kHz
(±) | máximos más altos - de media 5.7% más altos que la mediana
(+) | los máximos son lineales (5.8% delta a la frecuencia anterior)
Total 100 - 16.000 Hz
(±) | la linealidad del sonido global es media (24.8% de diferencia con la mediana)
En comparación con la misma clase
» 75% de todos los dispositivos probados de esta clase eran mejores, 6% similares, 19% peores
» El mejor tuvo un delta de 6%, la media fue 20%, el peor fue ###max##%
En comparación con todos los dispositivos probados
» 76% de todos los dispositivos probados eran mejores, 5% similares, 19% peores
» El mejor tuvo un delta de 4%, la media fue 24%, el peor fue ###max##%
Apple MacBook 12 (Early 2016) 1.1 GHz análisis de audio
(+) | los altavoces pueden reproducir a un volumen relativamente alto (#83.6 dB)
Graves 100 - 315 Hz
(±) | lubina reducida - en promedio 11.3% inferior a la mediana
(±) | la linealidad de los graves es media (14.2% delta a frecuencia anterior)
Medios 400 - 2000 Hz
(+) | medios equilibrados - a sólo 2.4% de la mediana
(+) | los medios son lineales (5.5% delta a la frecuencia anterior)
Altos 2 - 16 kHz
(+) | máximos equilibrados - a sólo 2% de la mediana
(+) | los máximos son lineales (4.5% delta a la frecuencia anterior)
Total 100 - 16.000 Hz
(+) | el sonido global es lineal (10.2% de diferencia con la mediana)
En comparación con la misma clase
» 7% de todos los dispositivos probados de esta clase eran mejores, 2% similares, 91% peores
» El mejor tuvo un delta de 5%, la media fue 18%, el peor fue ###max##%
En comparación con todos los dispositivos probados
» 5% de todos los dispositivos probados eran mejores, 1% similares, 94% peores
» El mejor tuvo un delta de 4%, la media fue 24%, el peor fue ###max##%
| Off / Standby | |
| Ocioso | |
| Carga |
|
Clave:
min: | |
| Google Pixelbook i5-7Y57, HD Graphics 615, , IPS, 2400x1600, 12.3" | Microsoft Surface Pro (2017) i7 i7-7660U, Iris Plus Graphics 640, Samsung PM971 KUS040202M, IPS, 2736x1824, 12.3" | Microsoft Surface Laptop i5 i5-7200U, HD Graphics 620, Toshiba THNSN0128GTYA, IPS, 2256x1504, 13.5" | Apple MacBook Pro 13 2017 i5-7360U, Iris Plus Graphics 640, Apple SSD AP0128, IPS, 2560x1600, 13.3" | Apple MacBook 12 2017 m3-7Y32, HD Graphics 615, Apple SSD AP0256, LED IPS, 2304x1440, 12" | Samsung Notebook 9 NP900X3N-K01US i5-7200U, HD Graphics 620, Samsung CM871a MZNTY256HDHP, IPS, 1920x1080, 13.3" | |
|---|---|---|---|---|---|---|
| Power Consumption | ||||||
| Idle Minimum * (Watt) | 4.2 | 3.2 | 3.7 | 2 | 3.8 | |
| Idle Average * (Watt) | 10.1 | 6.5 | 5.2 | 5.4 | 11 | |
| Idle Maximum * (Watt) | 14 | 6.8 | 7.6 | 6.6 | 11.3 | |
| Load Average * (Watt) | 37.4 | 28.2 | 41.6 | 22 | 35.6 | |
| Load Maximum * (Watt) | 34 | 36 | 50.5 | 20 | 37.2 | |
| Witcher 3 ultra * (Watt) | 38.1 |
* ... más pequeño es mejor
| Google Pixelbook i5-7Y57, HD Graphics 615, 41 Wh | Microsoft Surface Pro (2017) i7 i7-7660U, Iris Plus Graphics 640, 45 Wh | Microsoft Surface Laptop i5 i5-7200U, HD Graphics 620, 45 Wh | Apple MacBook Pro 13 2017 i5-7360U, Iris Plus Graphics 640, 54.5 Wh | Samsung Notebook 9 NP900X3N-K01US i5-7200U, HD Graphics 620, 30 Wh | Apple MacBook 12 2017 m3-7Y32, HD Graphics 615, 41.4 Wh | |
|---|---|---|---|---|---|---|
| Duración de Batería | -39% | -21% | -38% | -61% | -35% | |
| Reader / Idle (h) | 23.8 | 22.5 -5% | 11.6 -51% | |||
| WiFi v1.3 (h) | 13.9 | 8.2 -41% | 10 -28% | 11.4 -18% | 4.7 -66% | 9 -35% |
| Load (h) | 3 | 1.9 -37% | 2.1 -30% | 1.3 -57% | 1 -67% | |
| Witcher 3 ultra (h) | 1.9 |
Pro
Contra
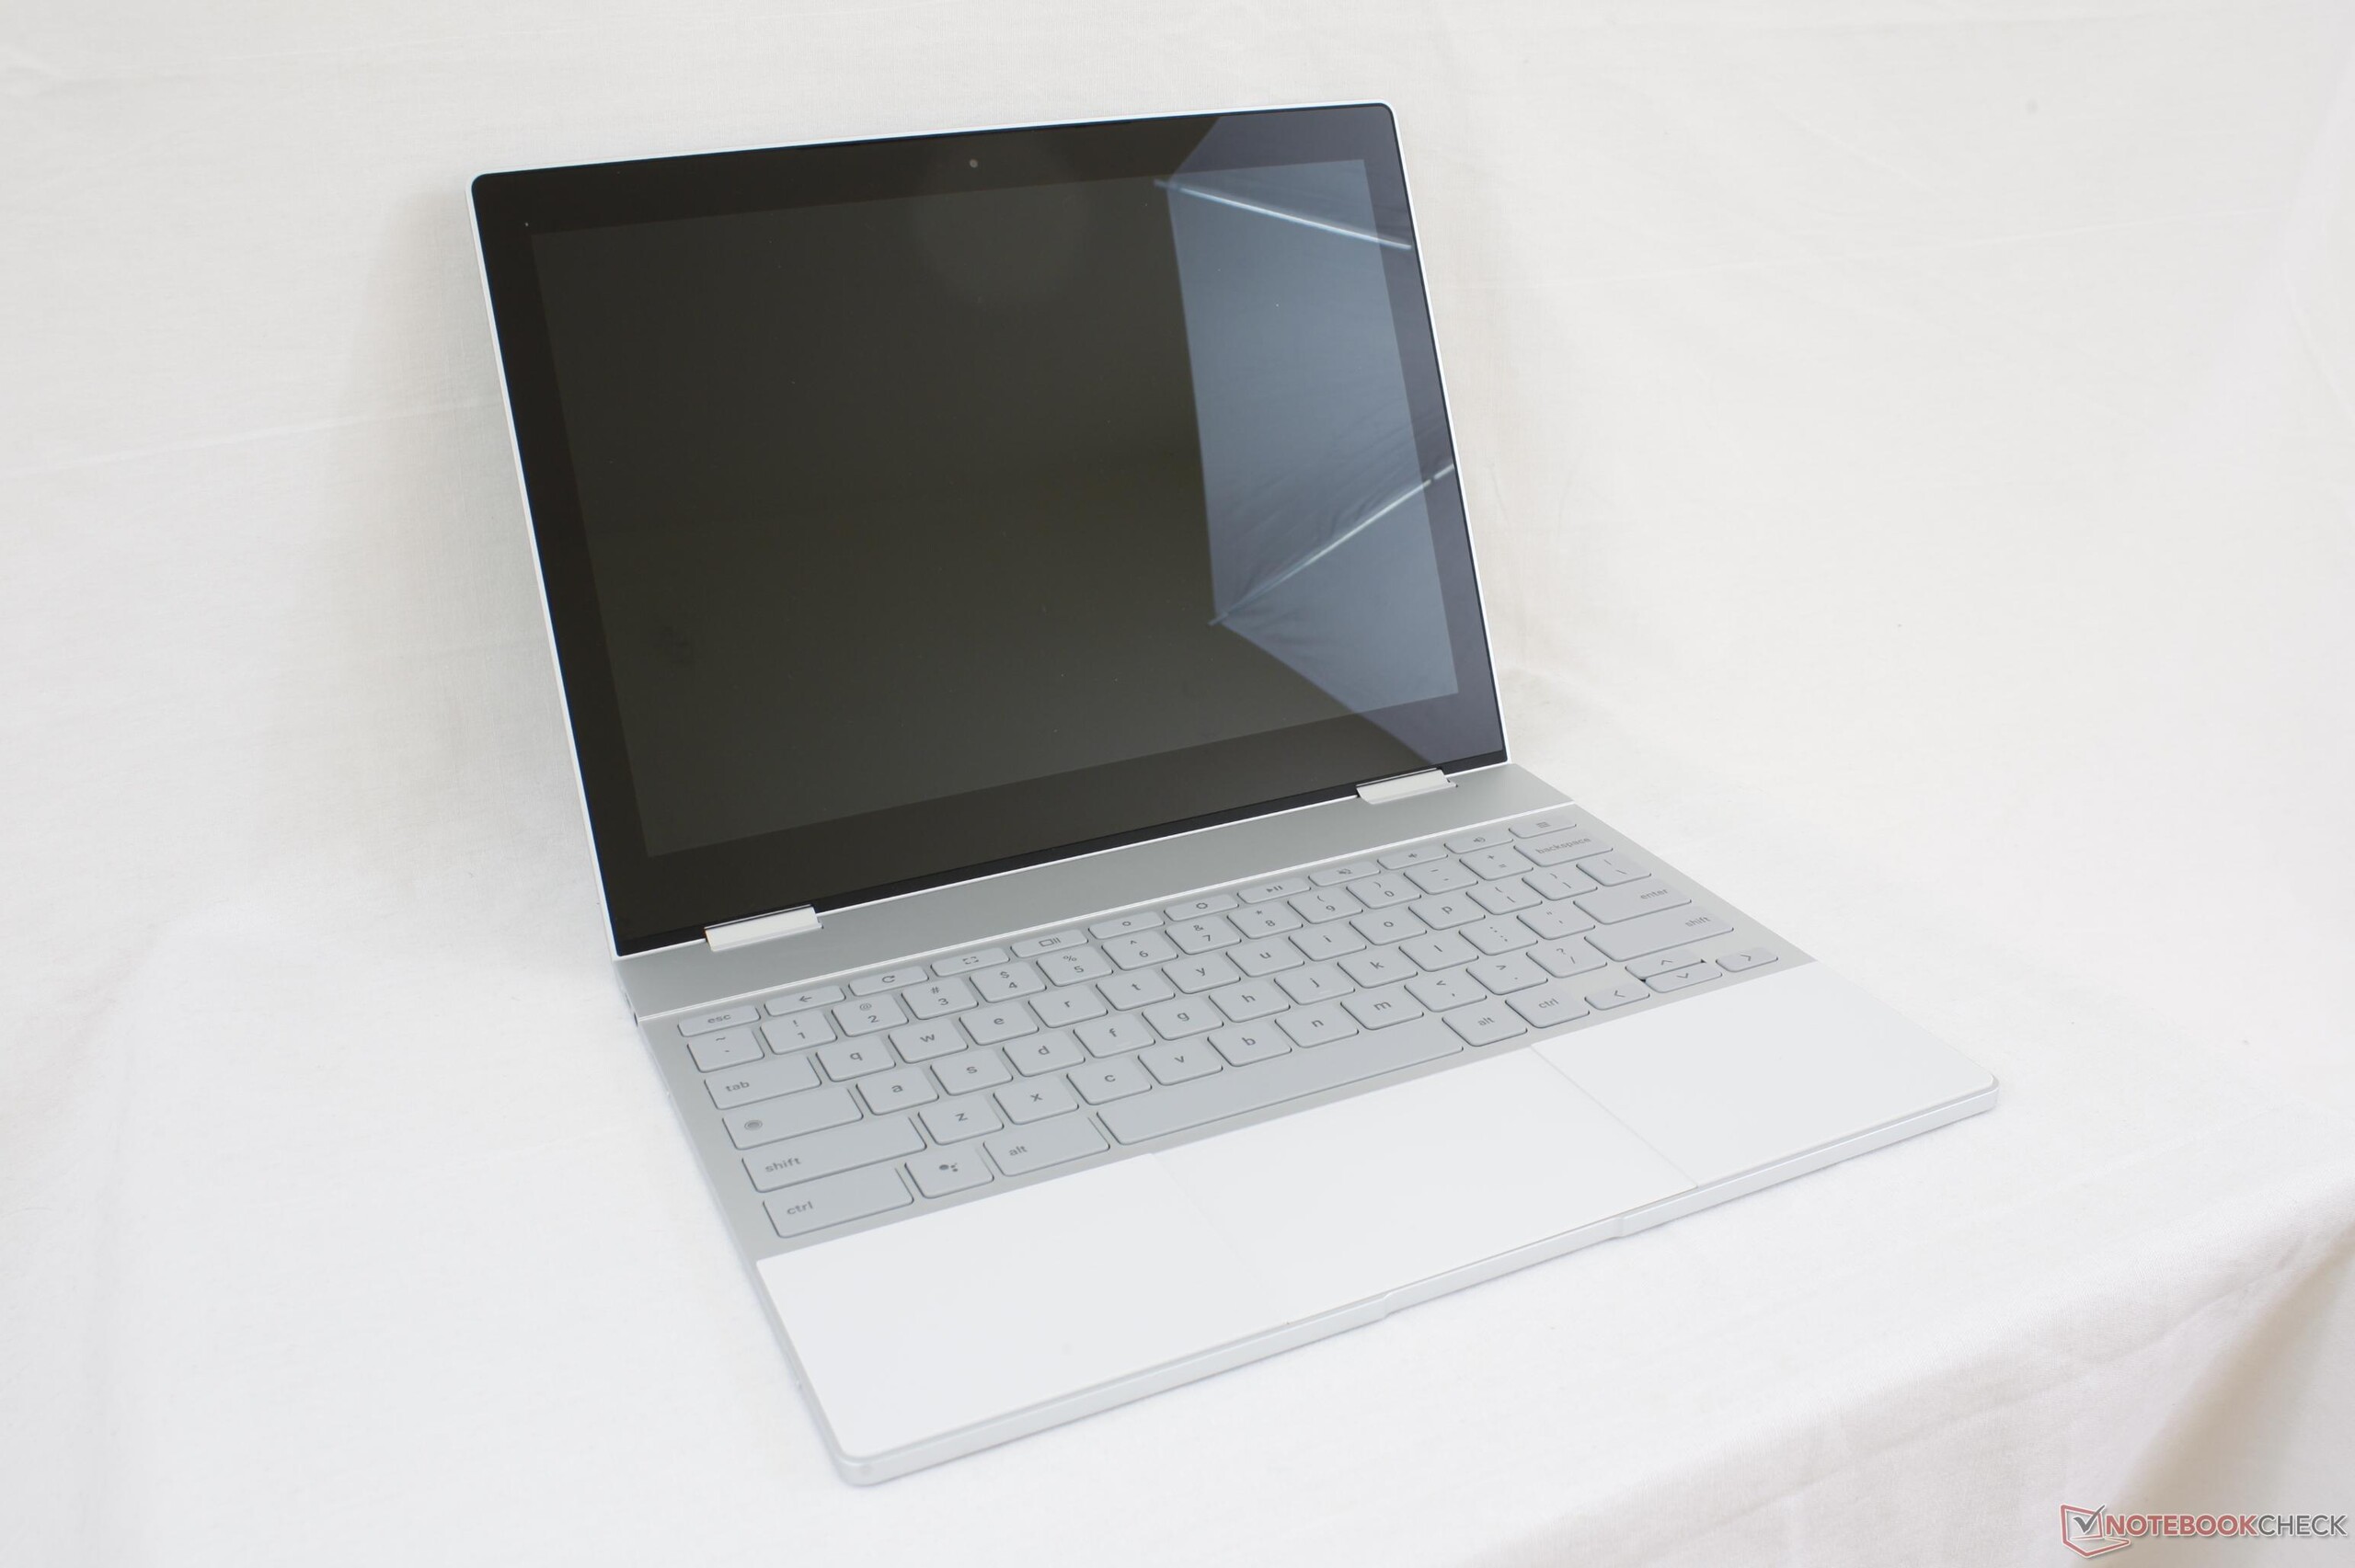
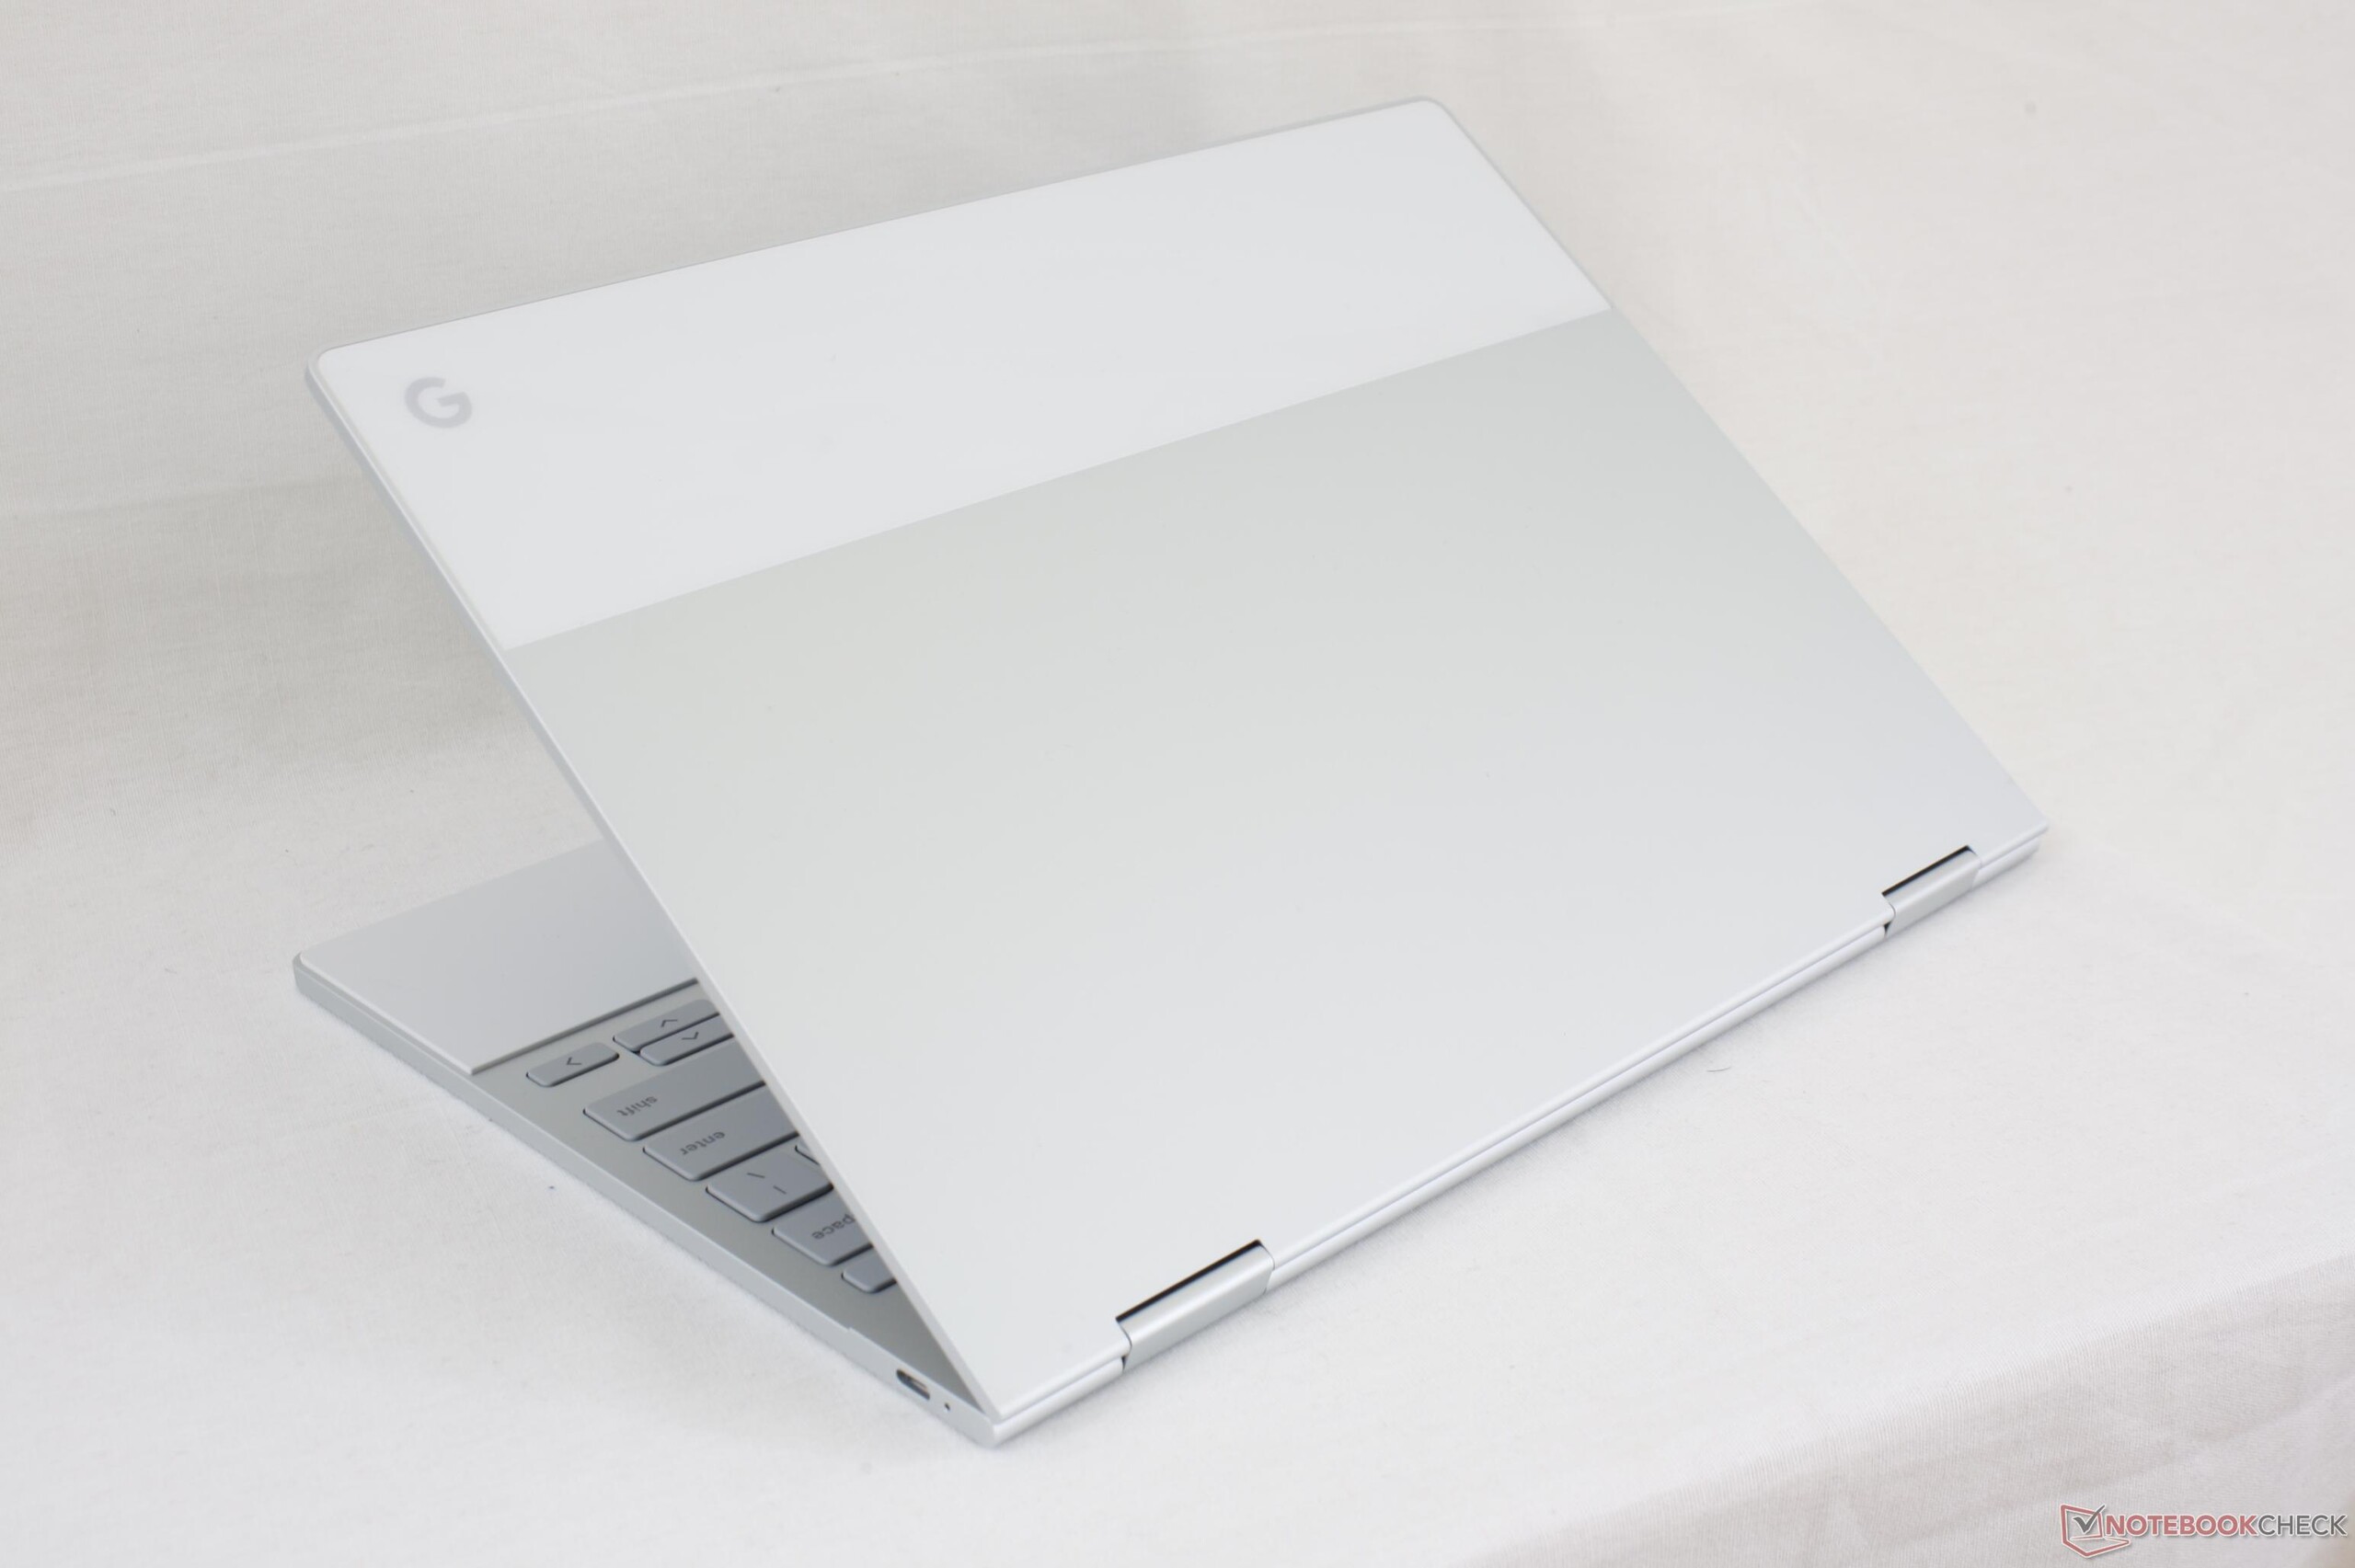
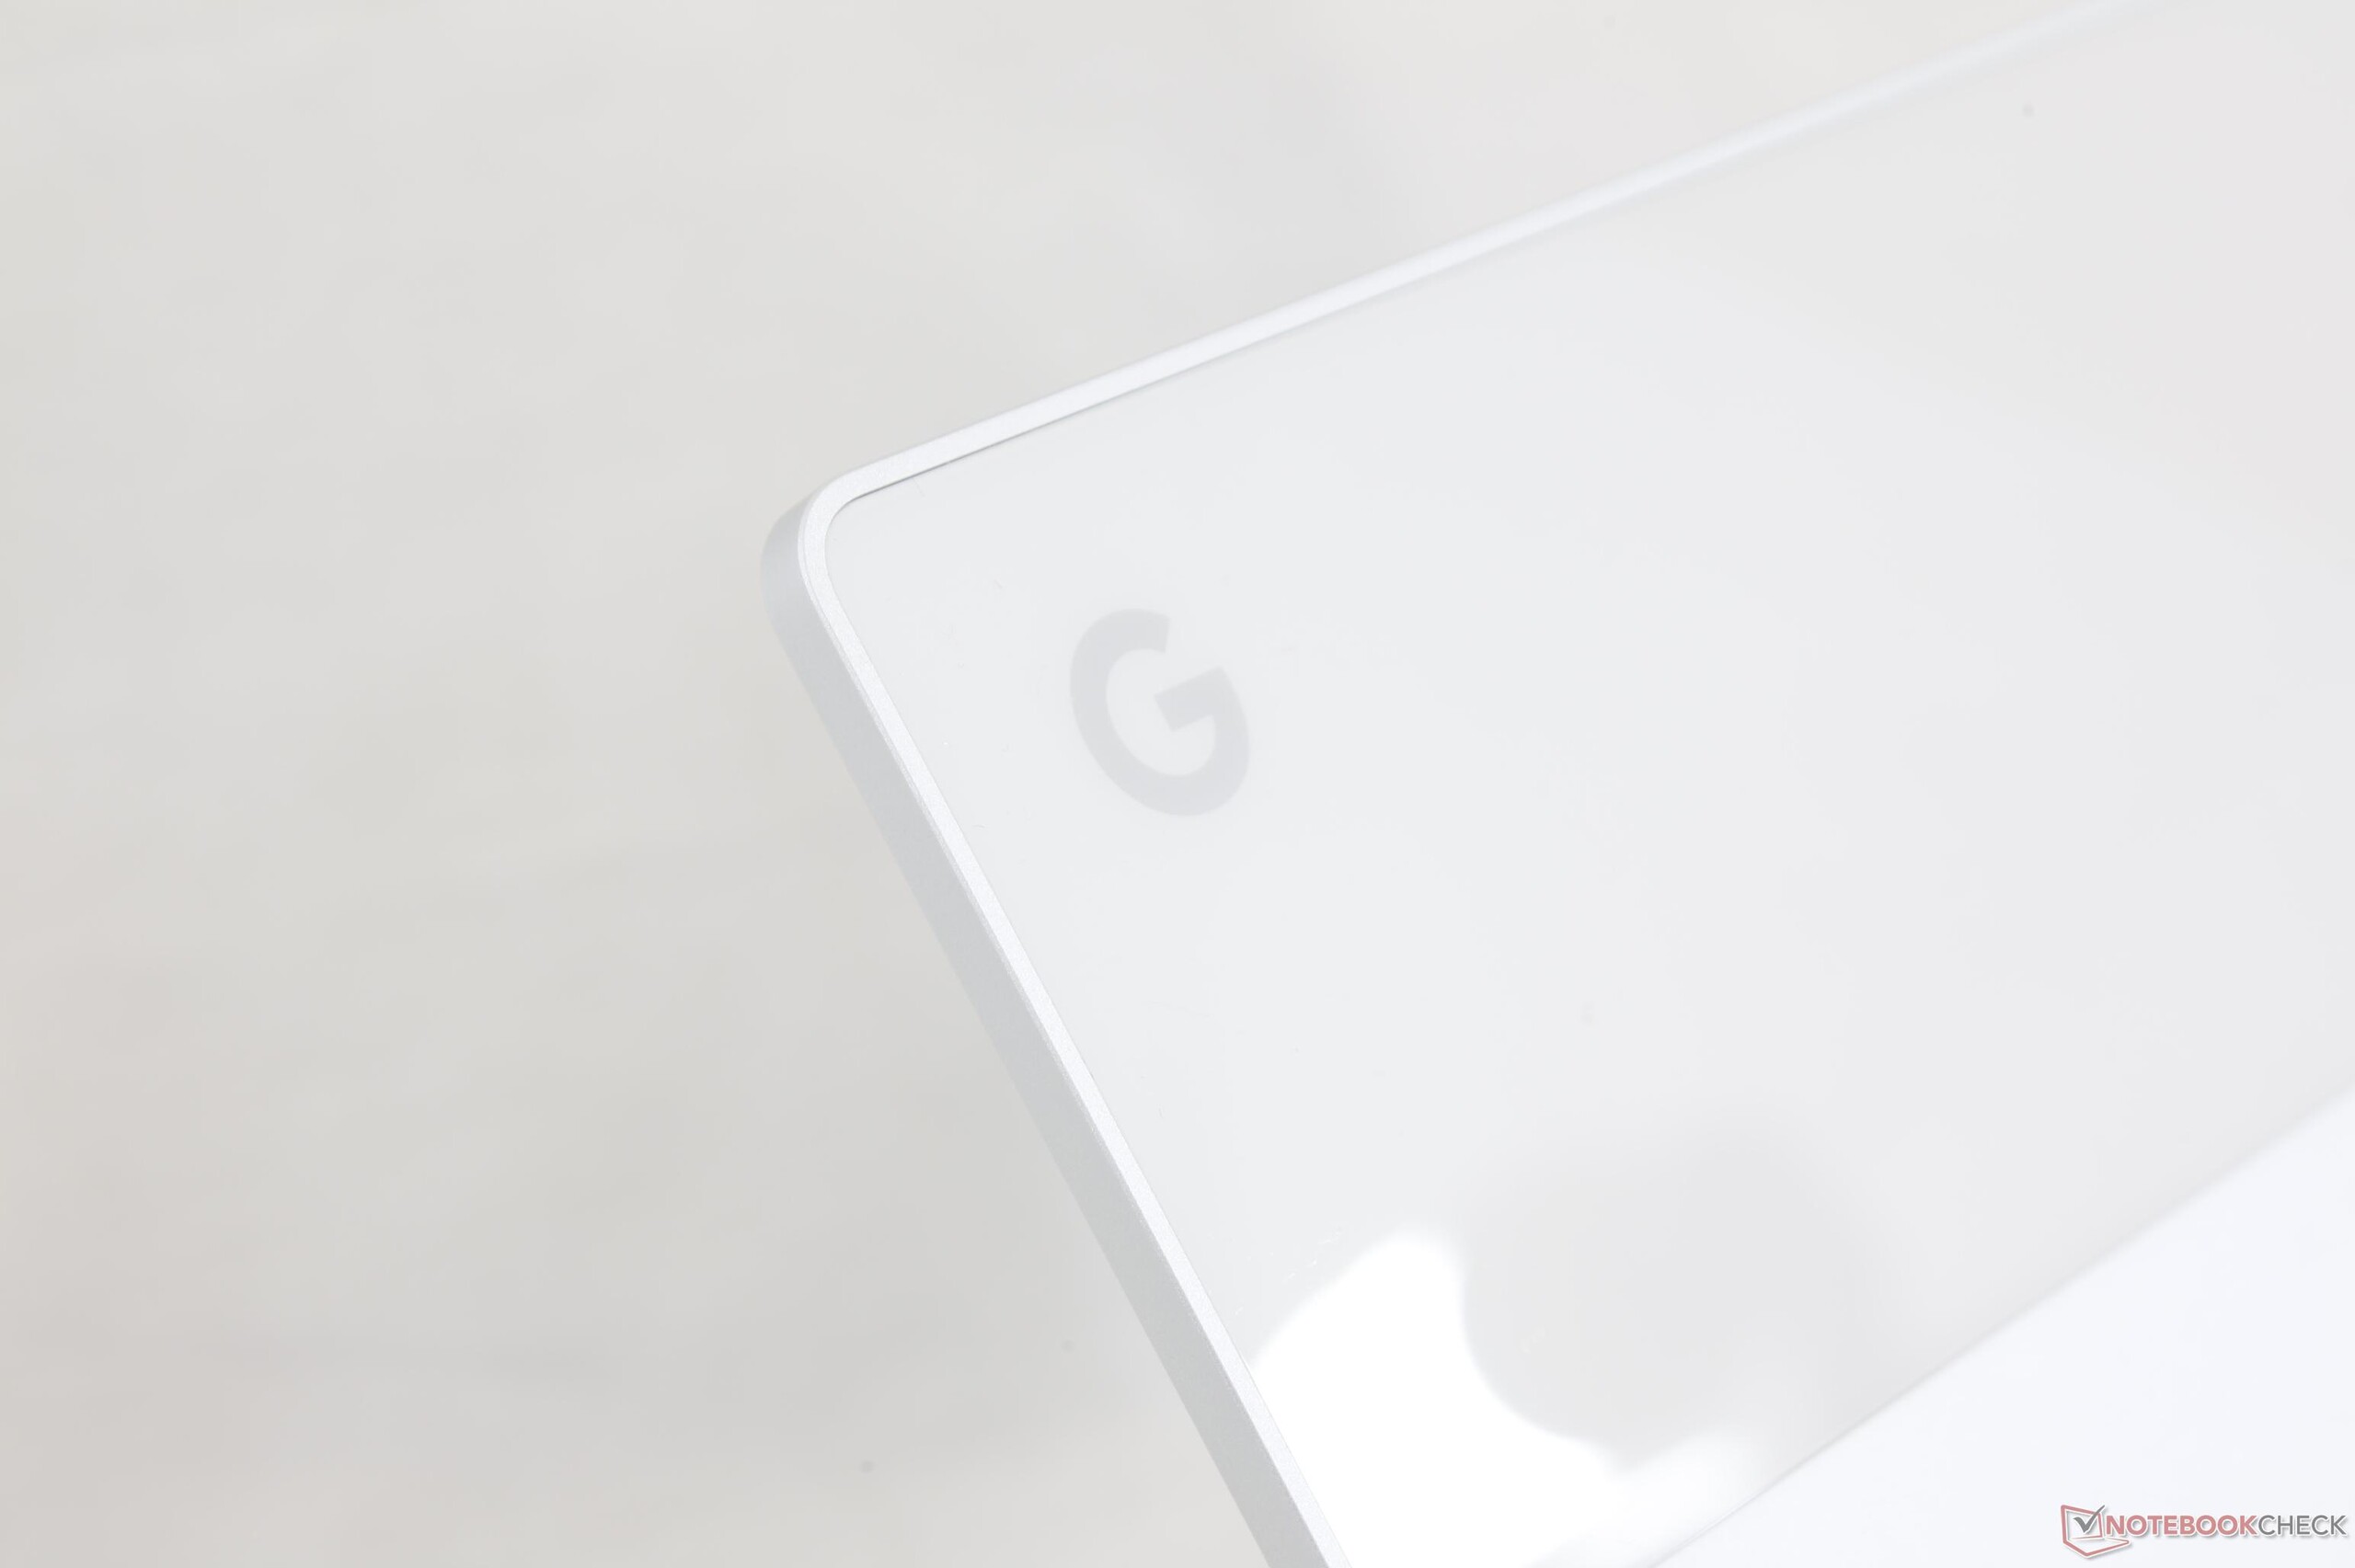
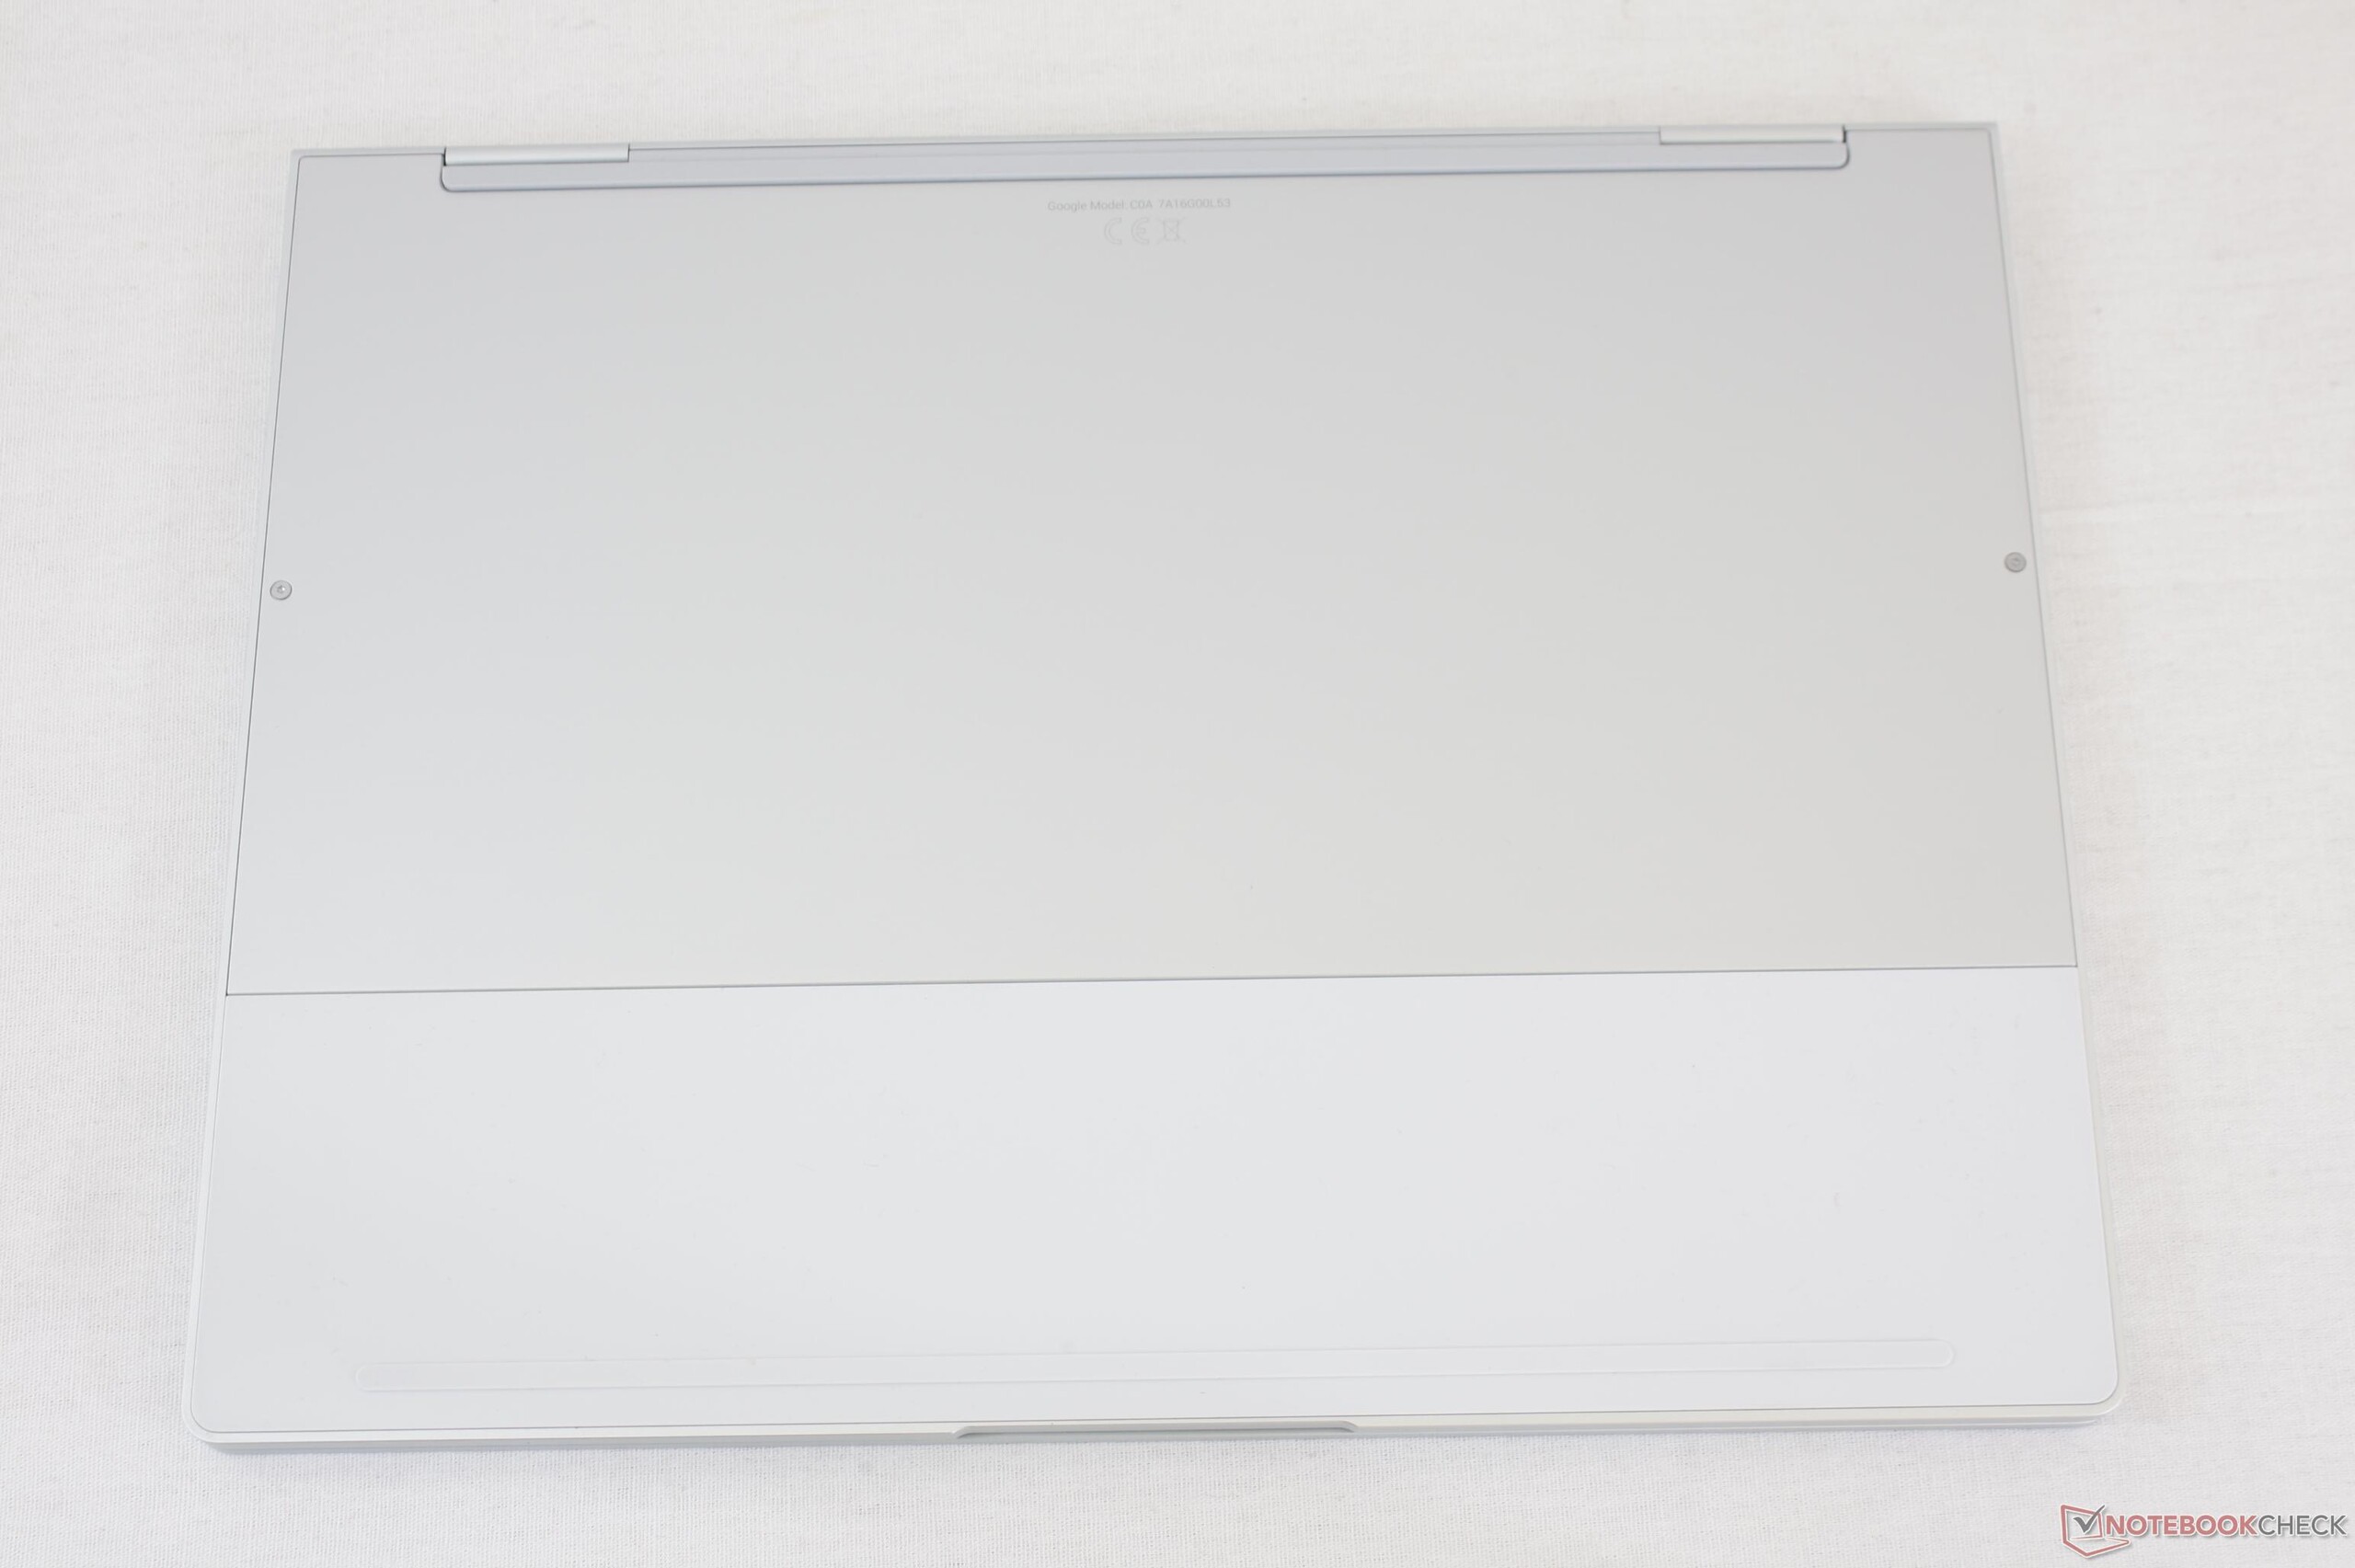
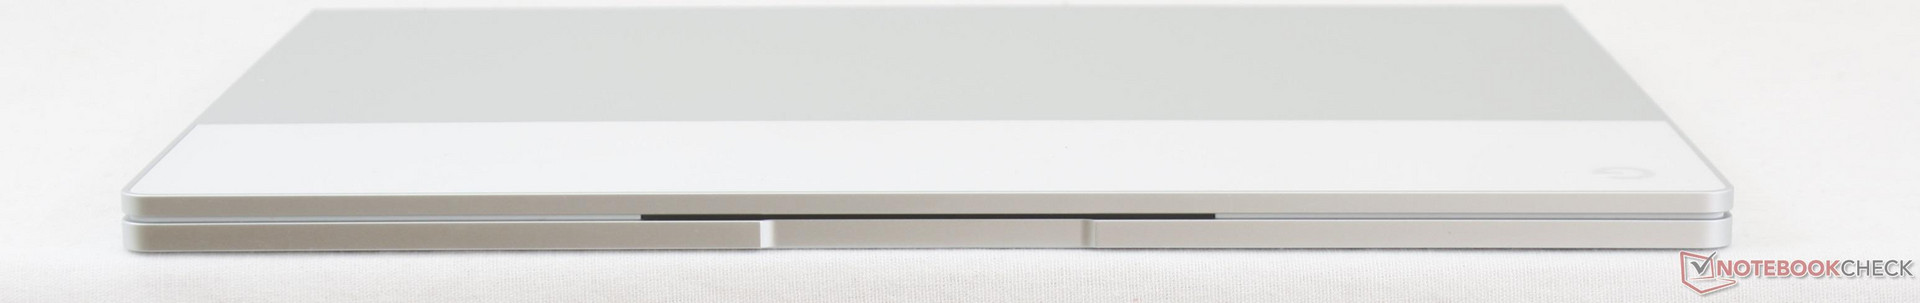
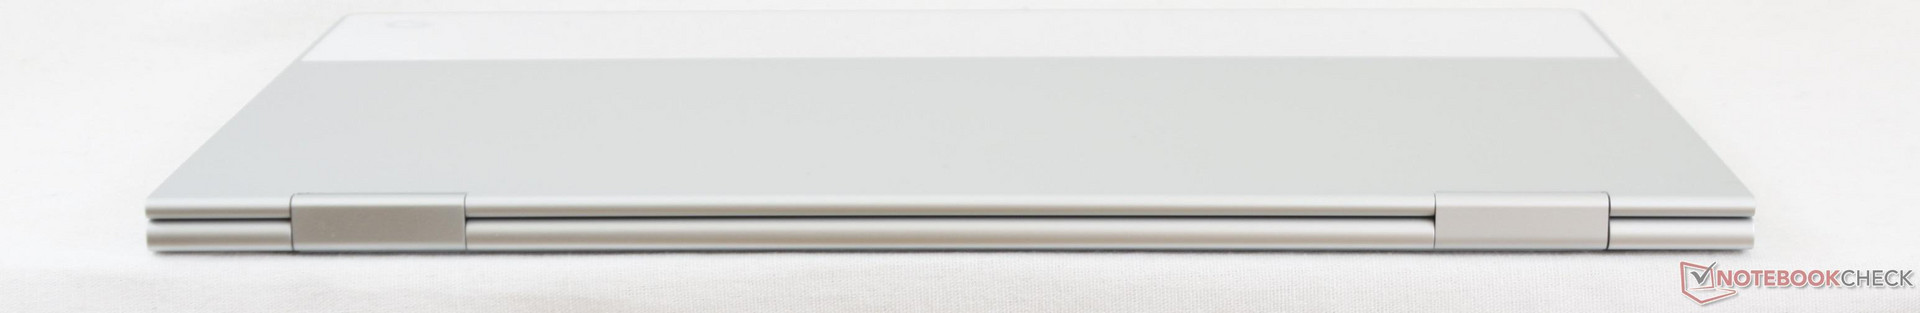
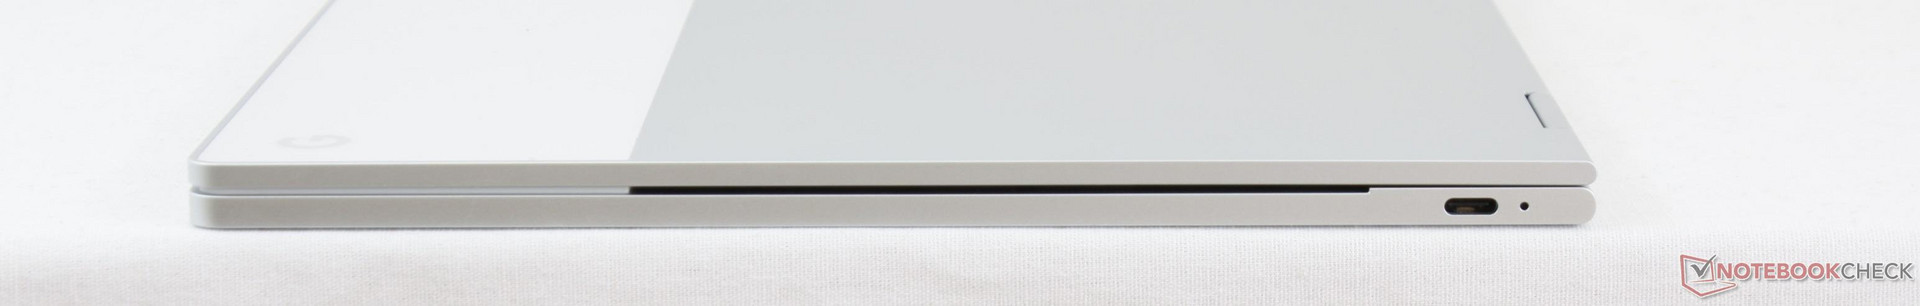
No se puede negar que el Pixelbook queda genial al agarrarlo y al usarlo. El chasis en sí está entre los mejores de Lenovo, HP, y Dell en la categoría de subportátiles convertibles ligeros, sin dejar de ser firme. Sería un buen competidor del espacio Ultrabook mainstream en el improbable caso en que viéramos un Pixelbook Windows.
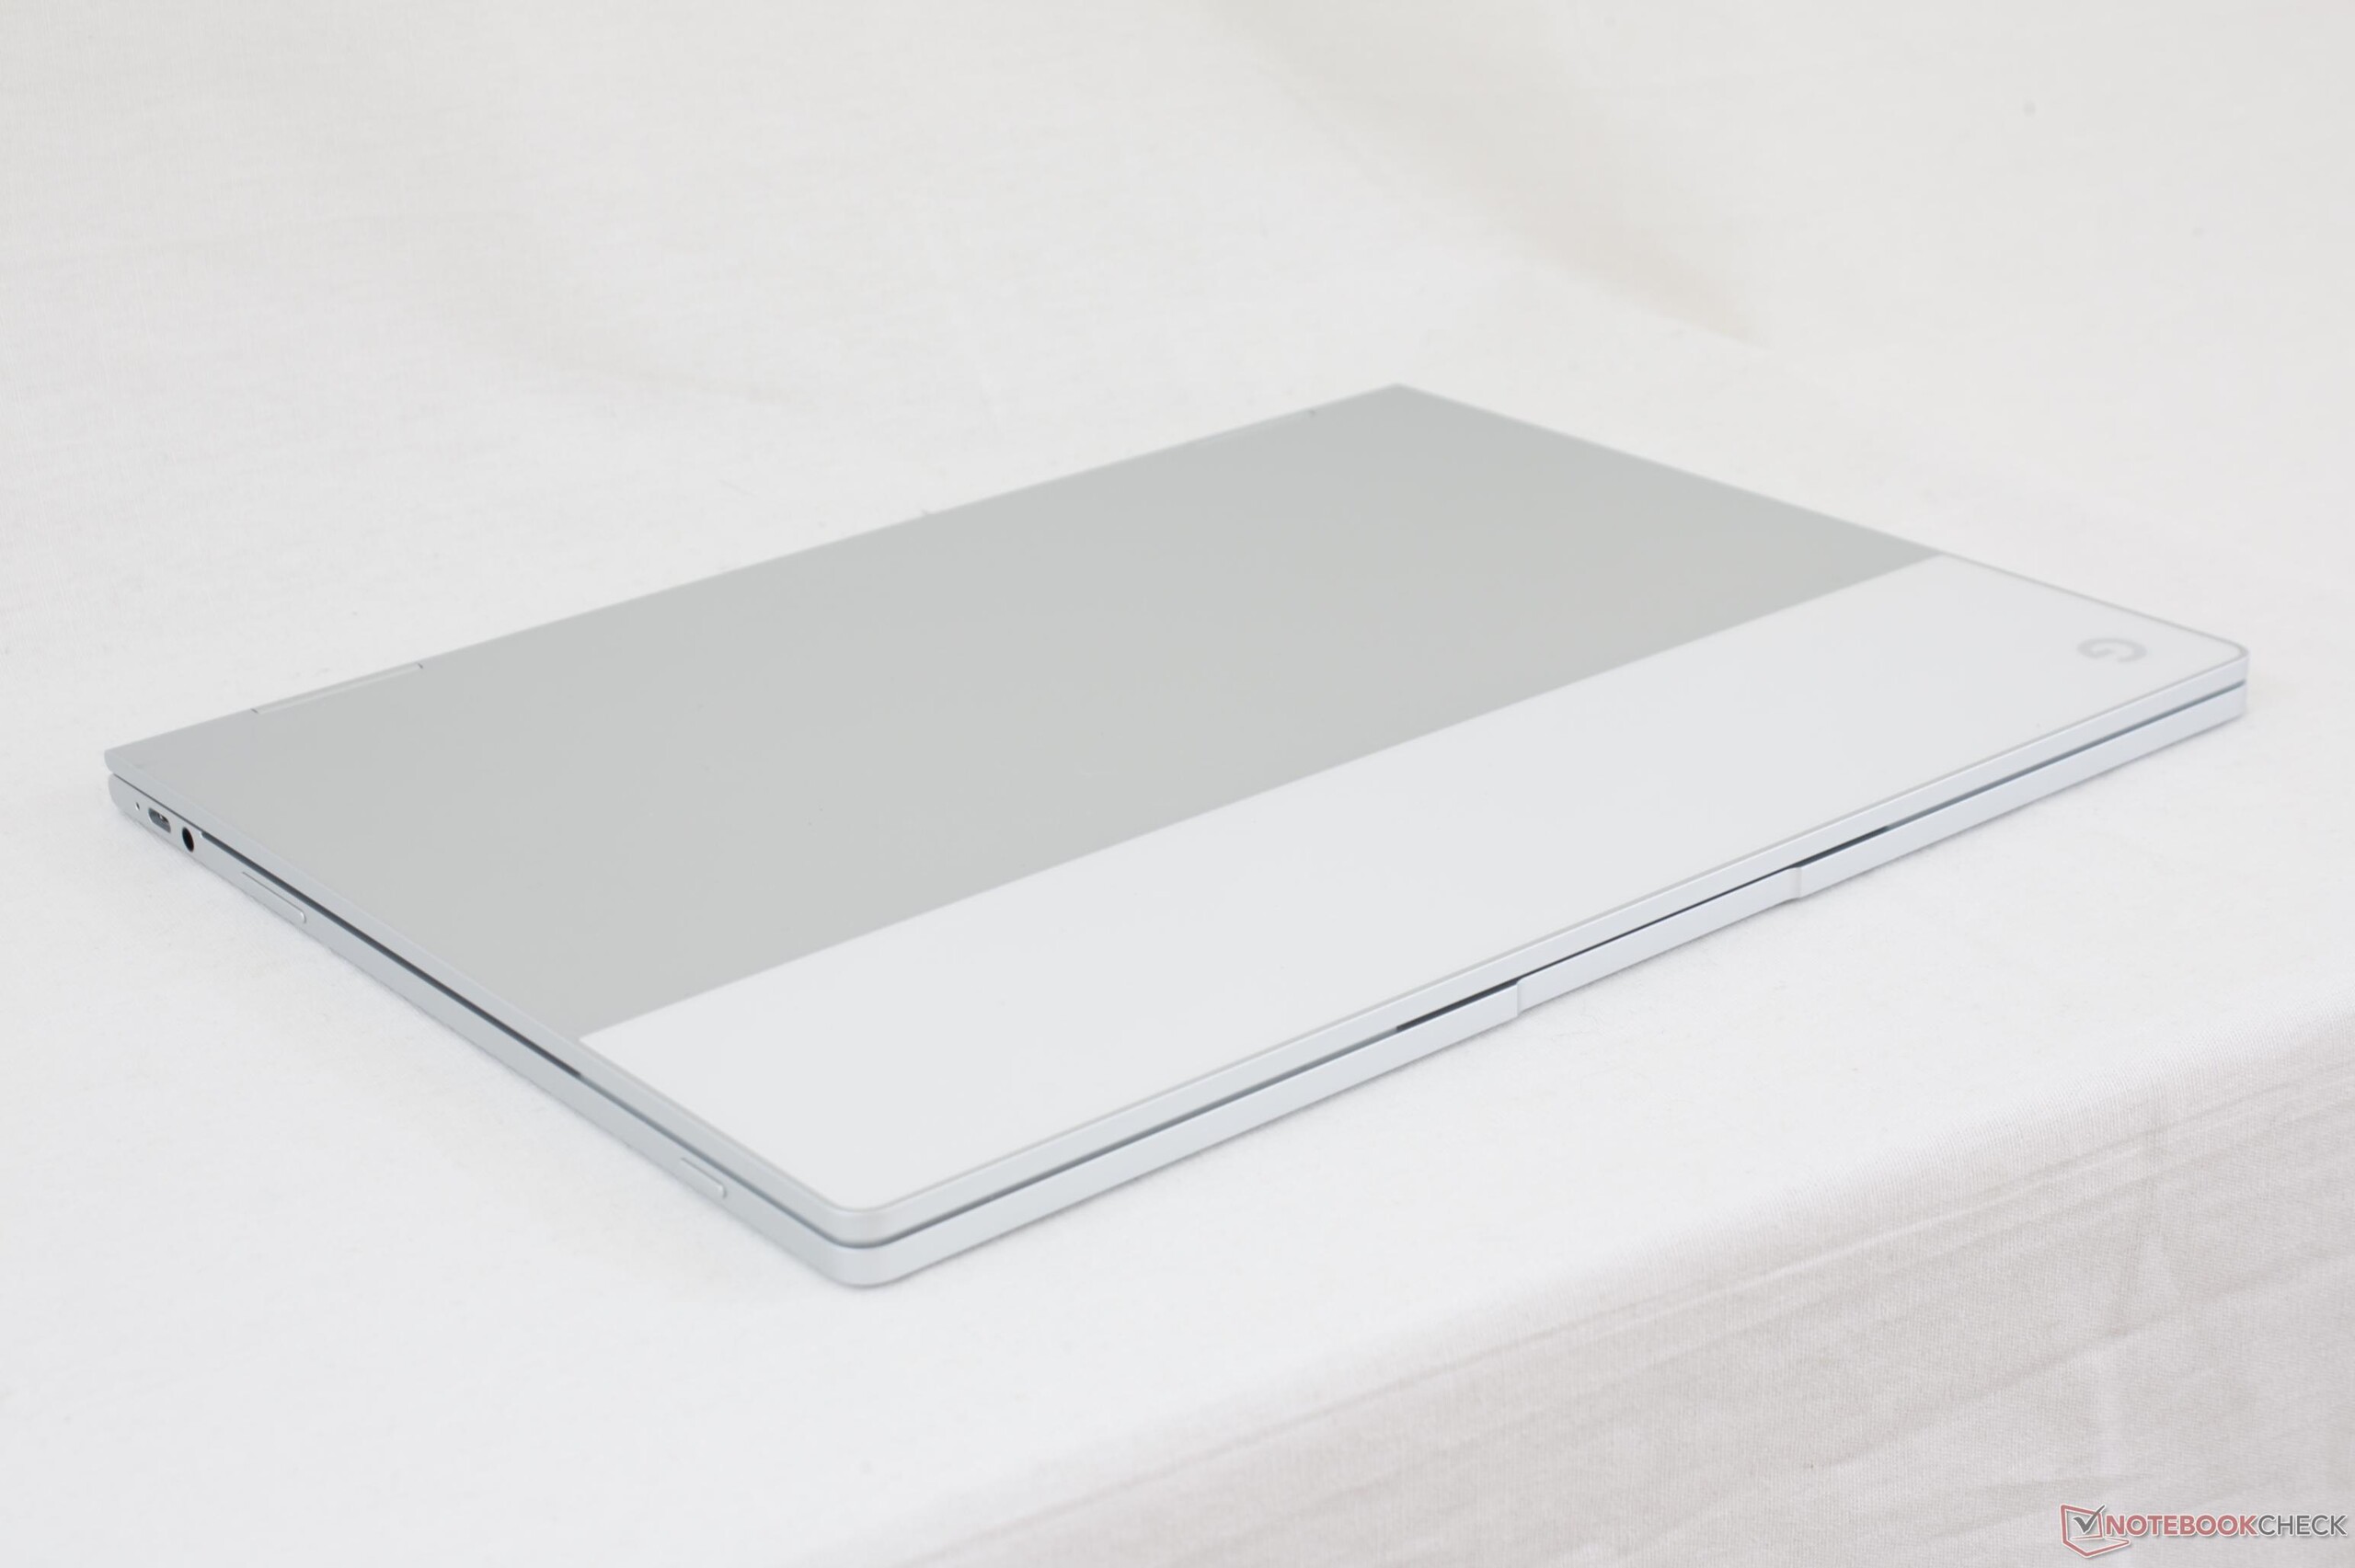
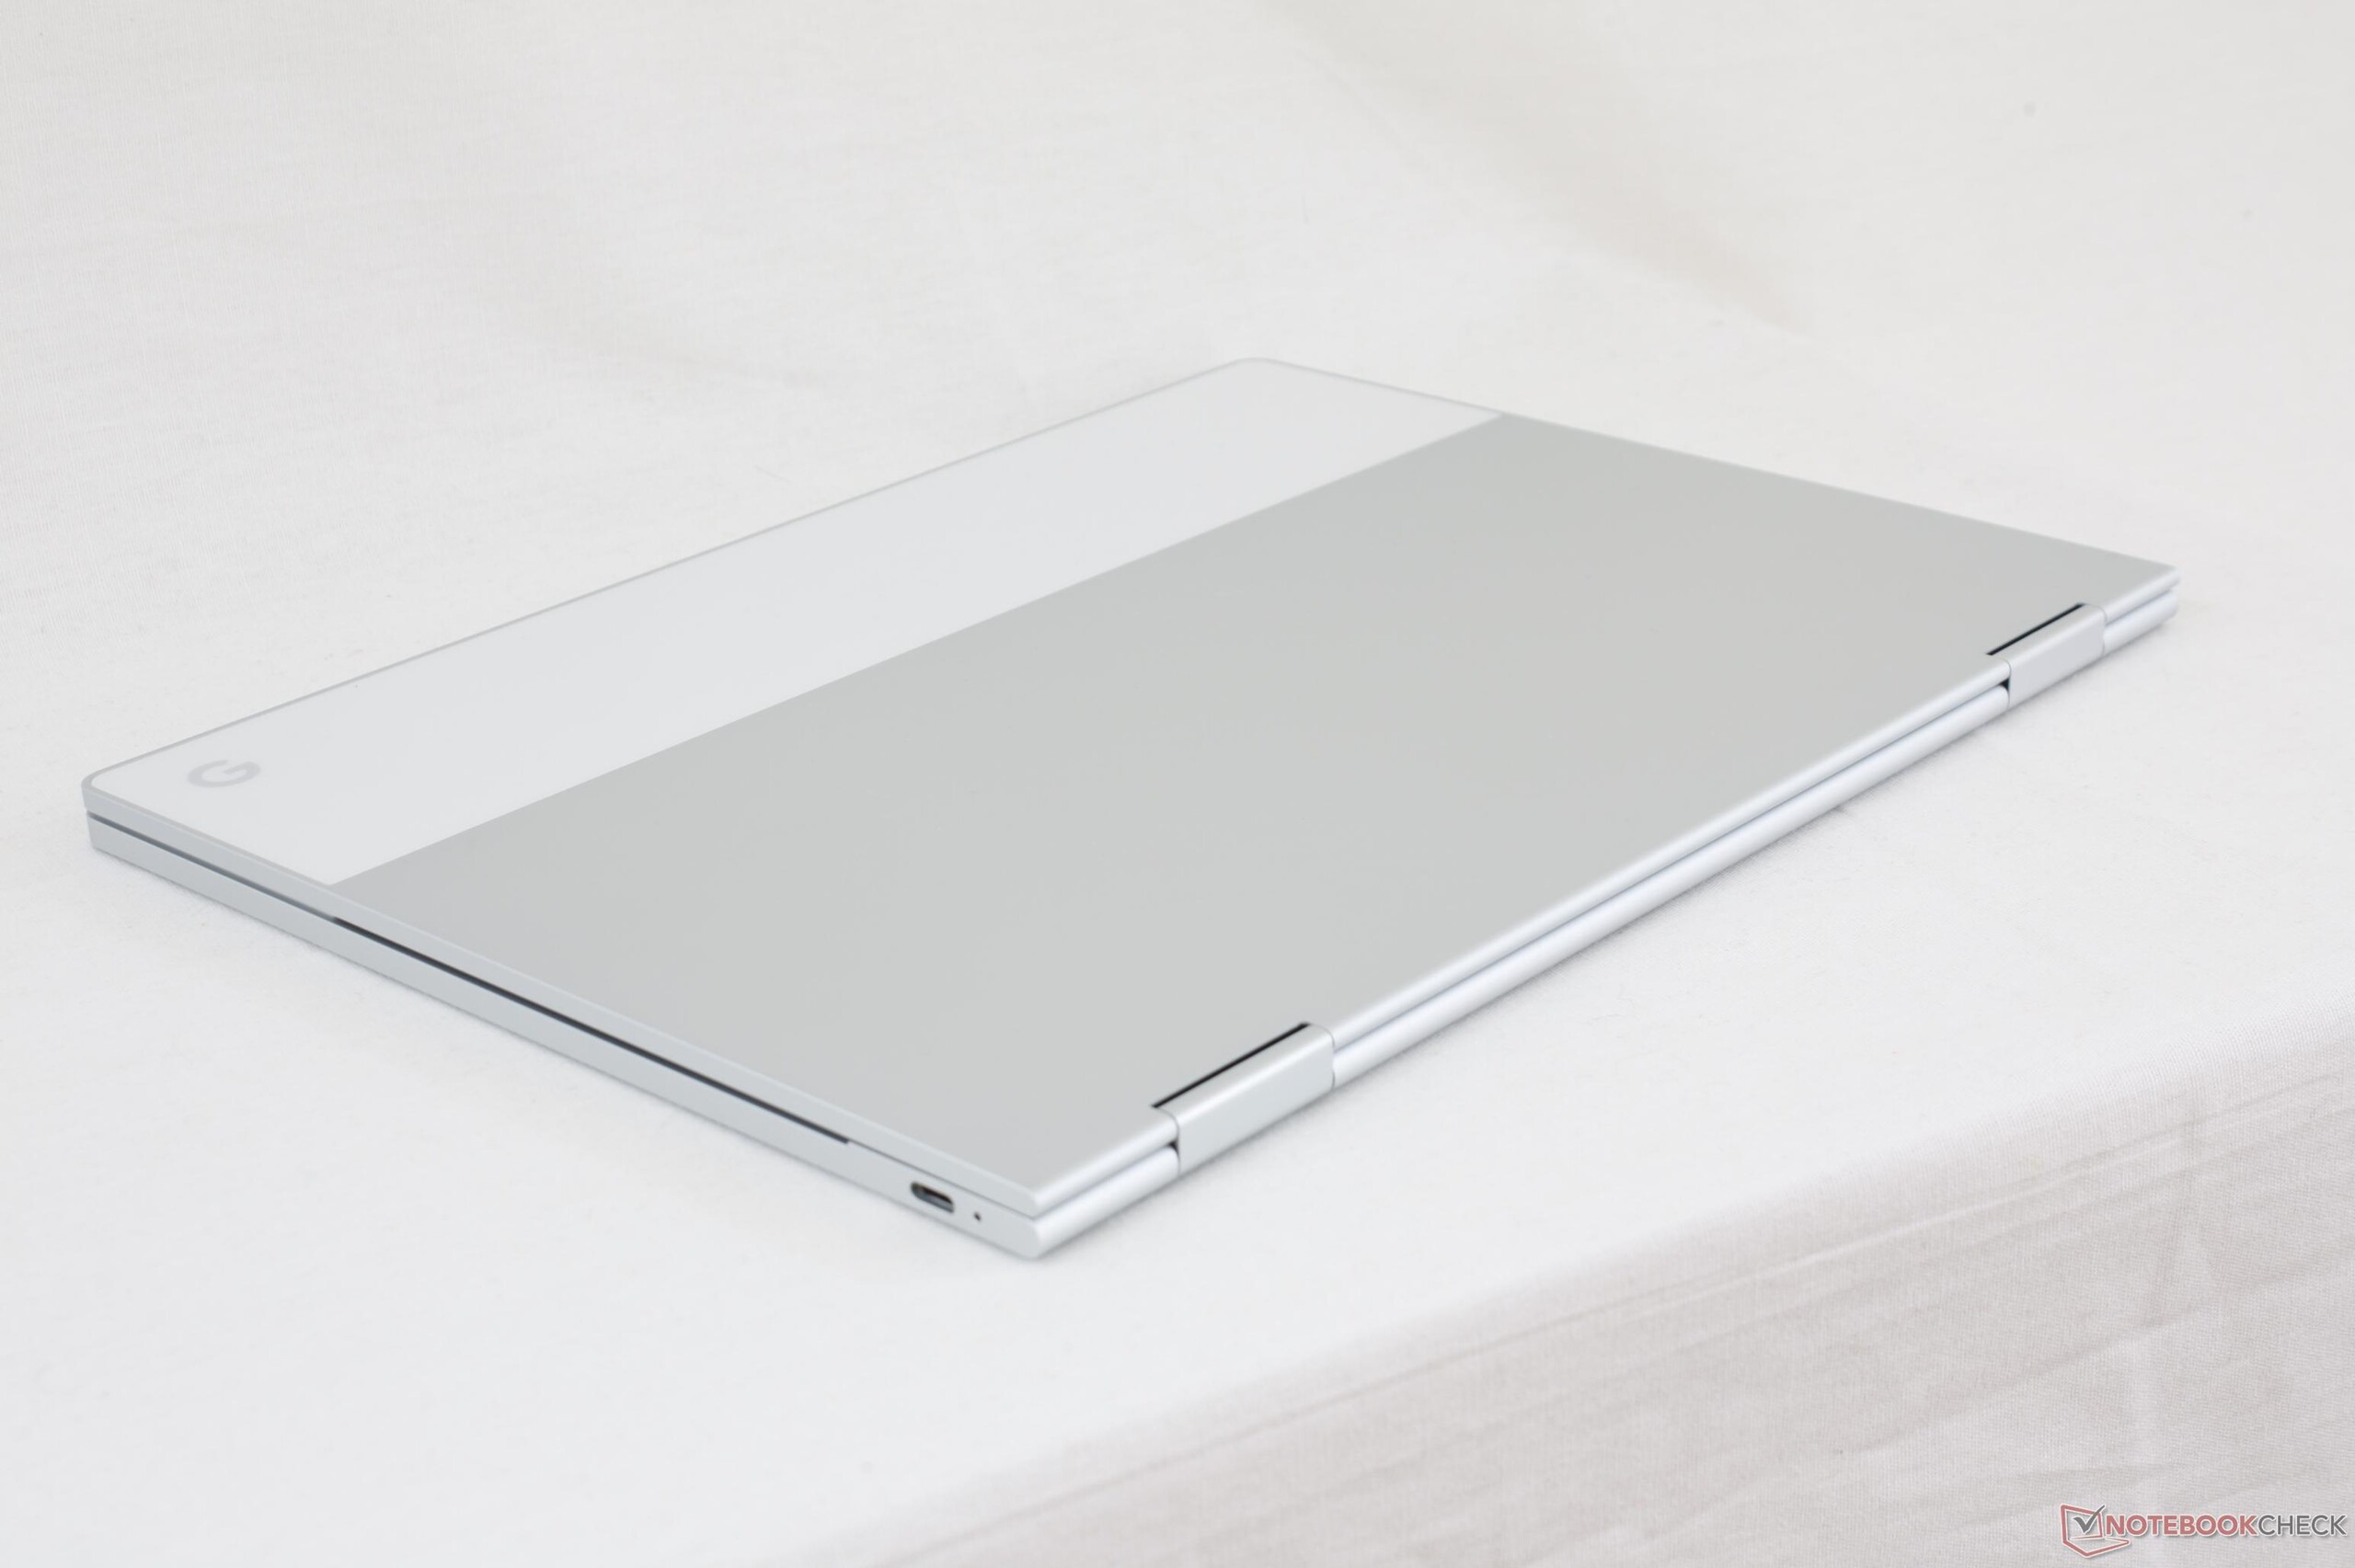
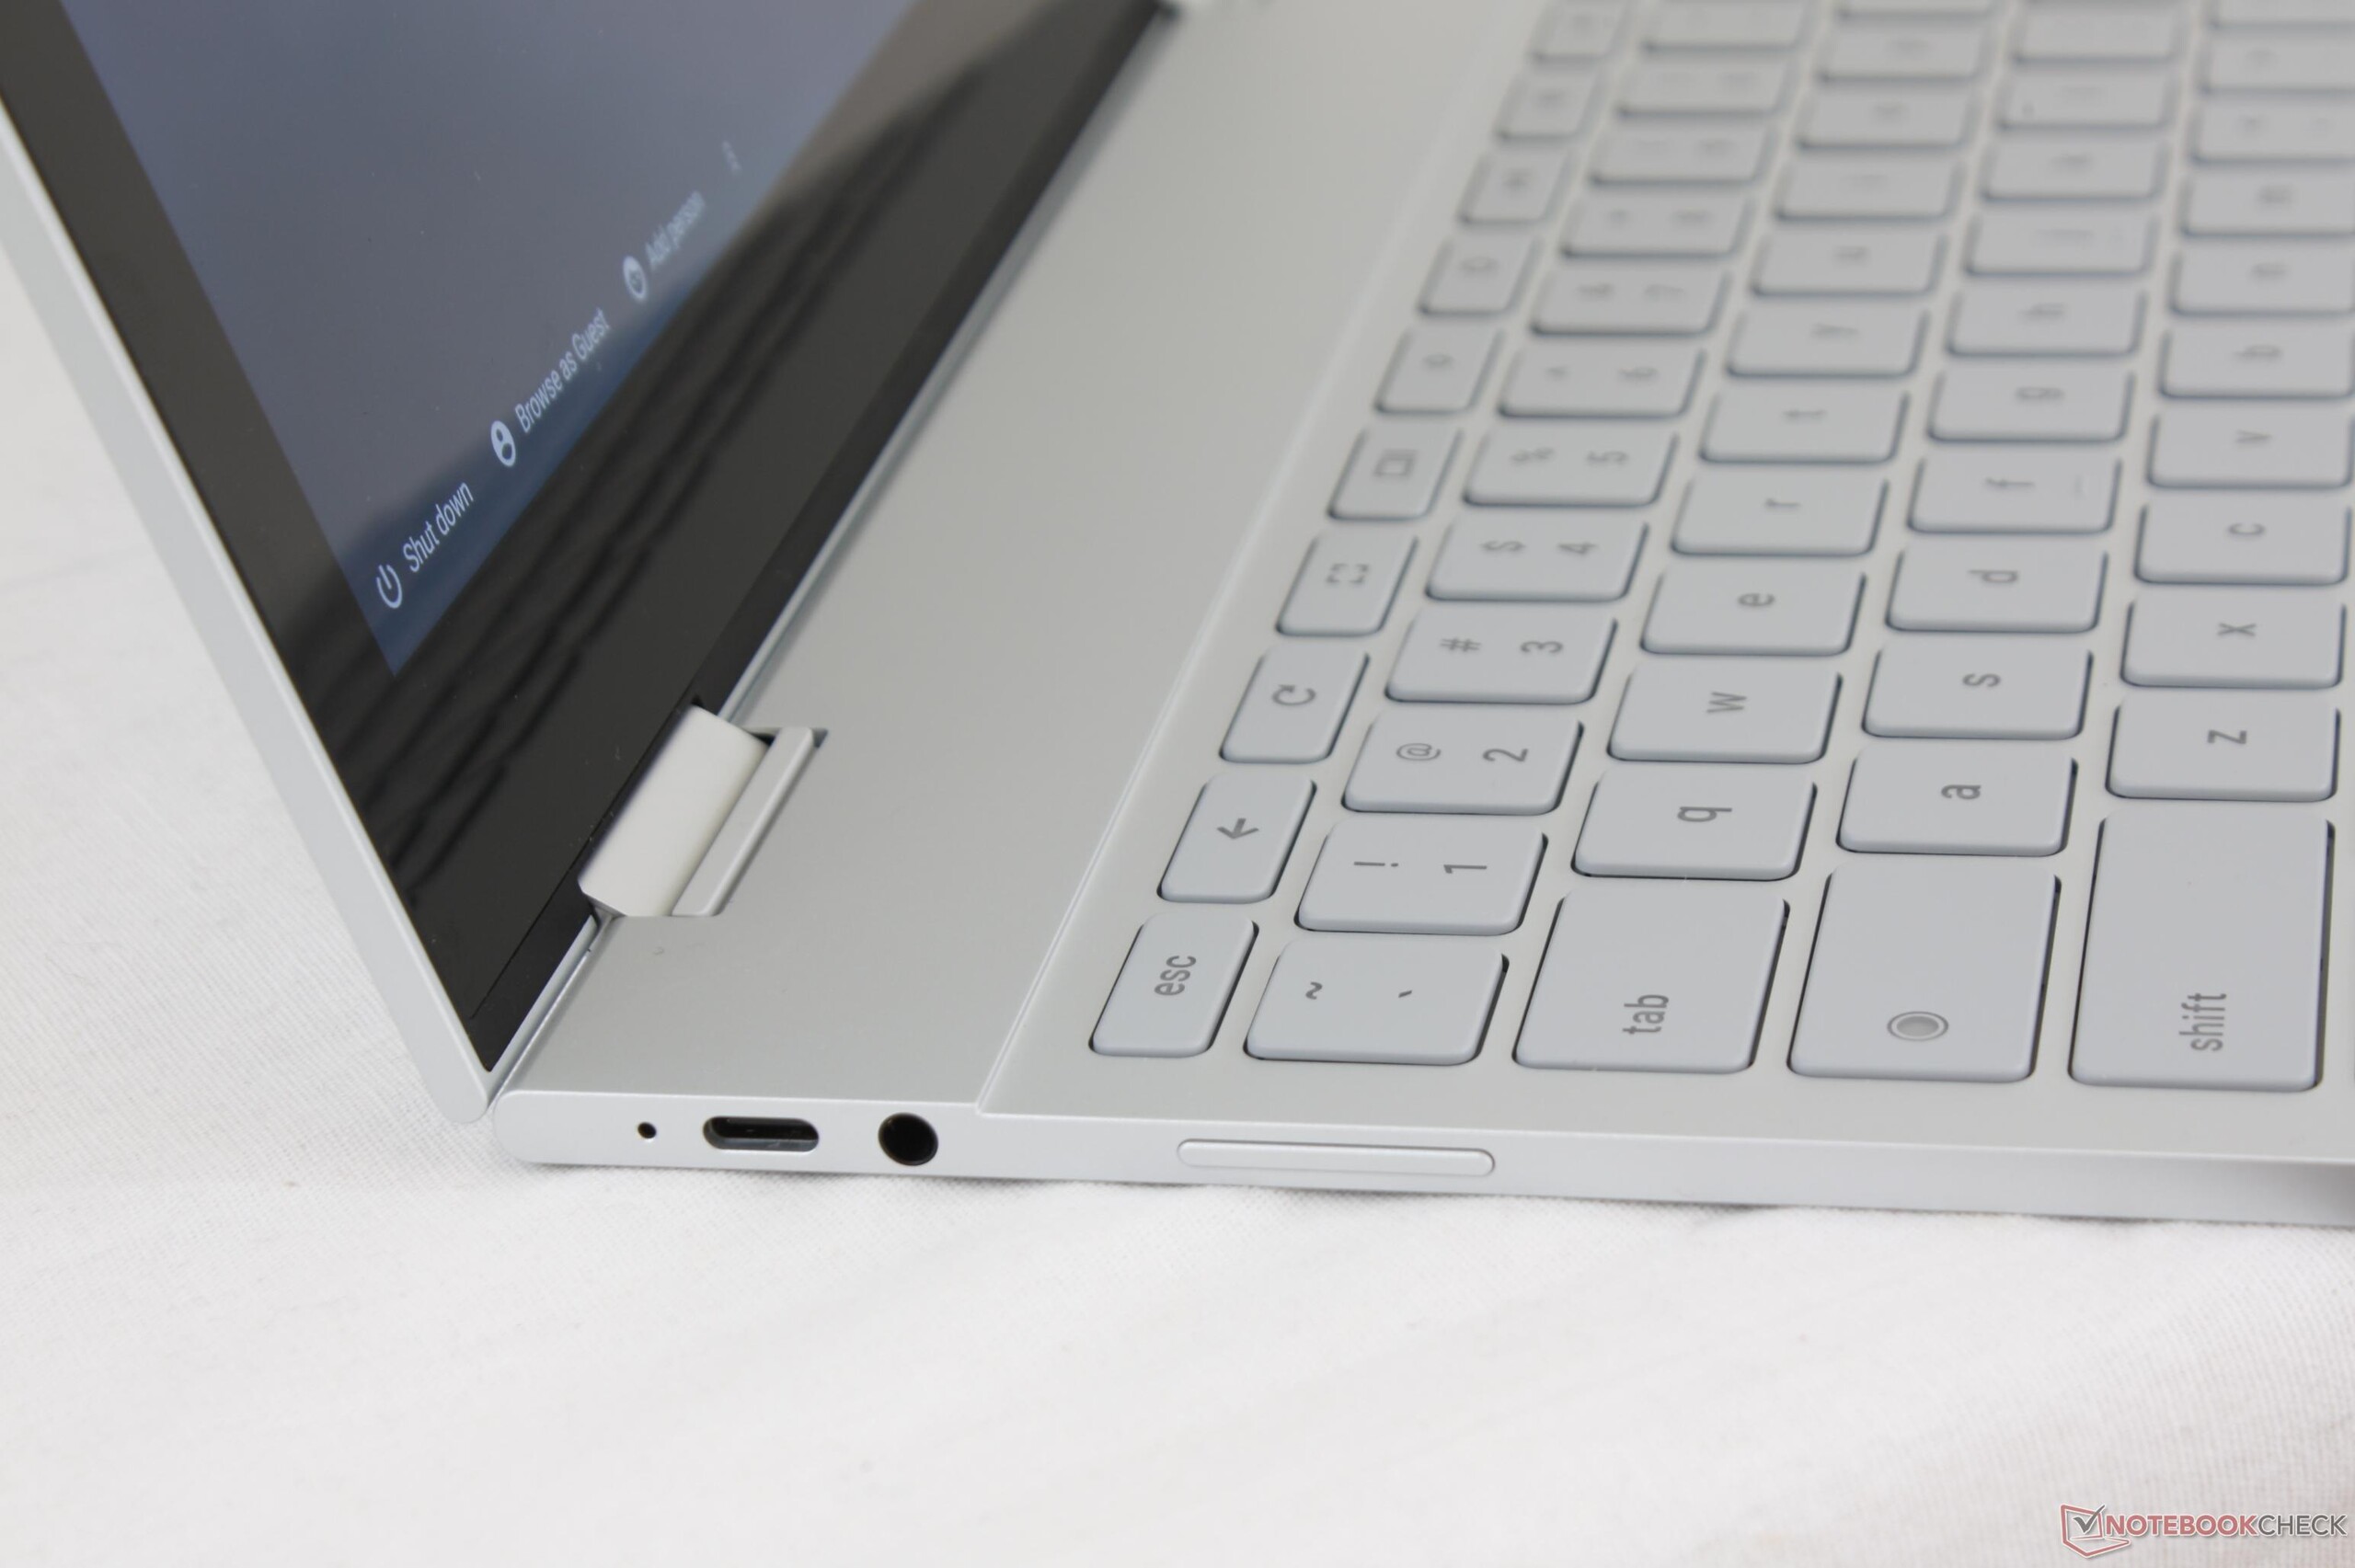
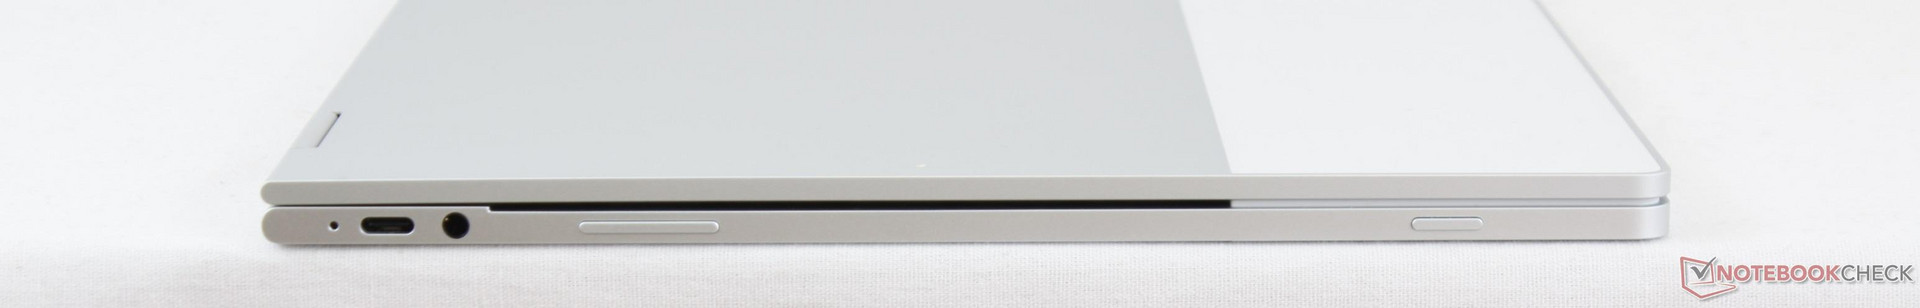
¿Podemos decir definitivamente que el Pixelbook es el mejor Chromebook que hay? Si bien es ciertamente rápido y el más caro, el Pixelbook sacrifica características claves comparado con los Chromebooks de $300 para satisfacer sus dimensiones. Por un lado, la falta de USB Type-A y lector SD inevitablemente resultará una molestia, especialmente en una máquina tan portable dónde la conectividad debería ser inmediata. El HP Chromebook 13 G1 incluye sendas opciones faltantes con un procesador más rápido y los mismos dos puertos USB Type-C por unos $300 menos. Además, el HP y la mayoría de Chromebooks básicos dan más facilidad para el mantenimiento comparados con la naturaleza cerrada del Pixelbook que los entusiastas y los departamentos técnicos agradecerán.
Otros detalles menores hundirán la que es por demás una excelente experiencia Chromebook. El display no está tan calibrado como los de las series Surface Pro o MacBook Pro y las lentas respuestas negro-blanco y gris-gris se notan mucho al navegar en modo tablet. Los 128 GB de SSD rinden menos que SSDs SATA III estándar y el agudo repiqueteo del teclado también llama la atención en un aula o biblioteca.
El Pixelbook es ideal para lso que quieran un Chromebook duradero, autosuficiente, y de fácil desplazamiento que también tenga un modo tablet lustroso para las apps de Android Play Store. Si esos puntos fuertes no son tentadores, un Chromebook más barato como el Lenovo ThinkPad 13 o el Asus Chromebook Flip con soporte Play Store pueden lograr lo mismo y con más variedad de puertos integrados.
El Pixelbook es delgado y resistente al gran coste de tener menos características integradas. Su poco peso, fuerte atractivo visual, y versátiles modos 2-en-1 quedan lastrados por sus limitadas opciones de conectividad y un display queq no es tan preciso como el mejor de Microsoft o Apple con ghosting y parpadeo más notables.
Ésta es una versión acortada del análisis original. Puedes leer el análisis completo en inglés aquí.
Google Pixelbook
- 11/10/2017 v6 (old)
Allen Ngo
Price comparison
