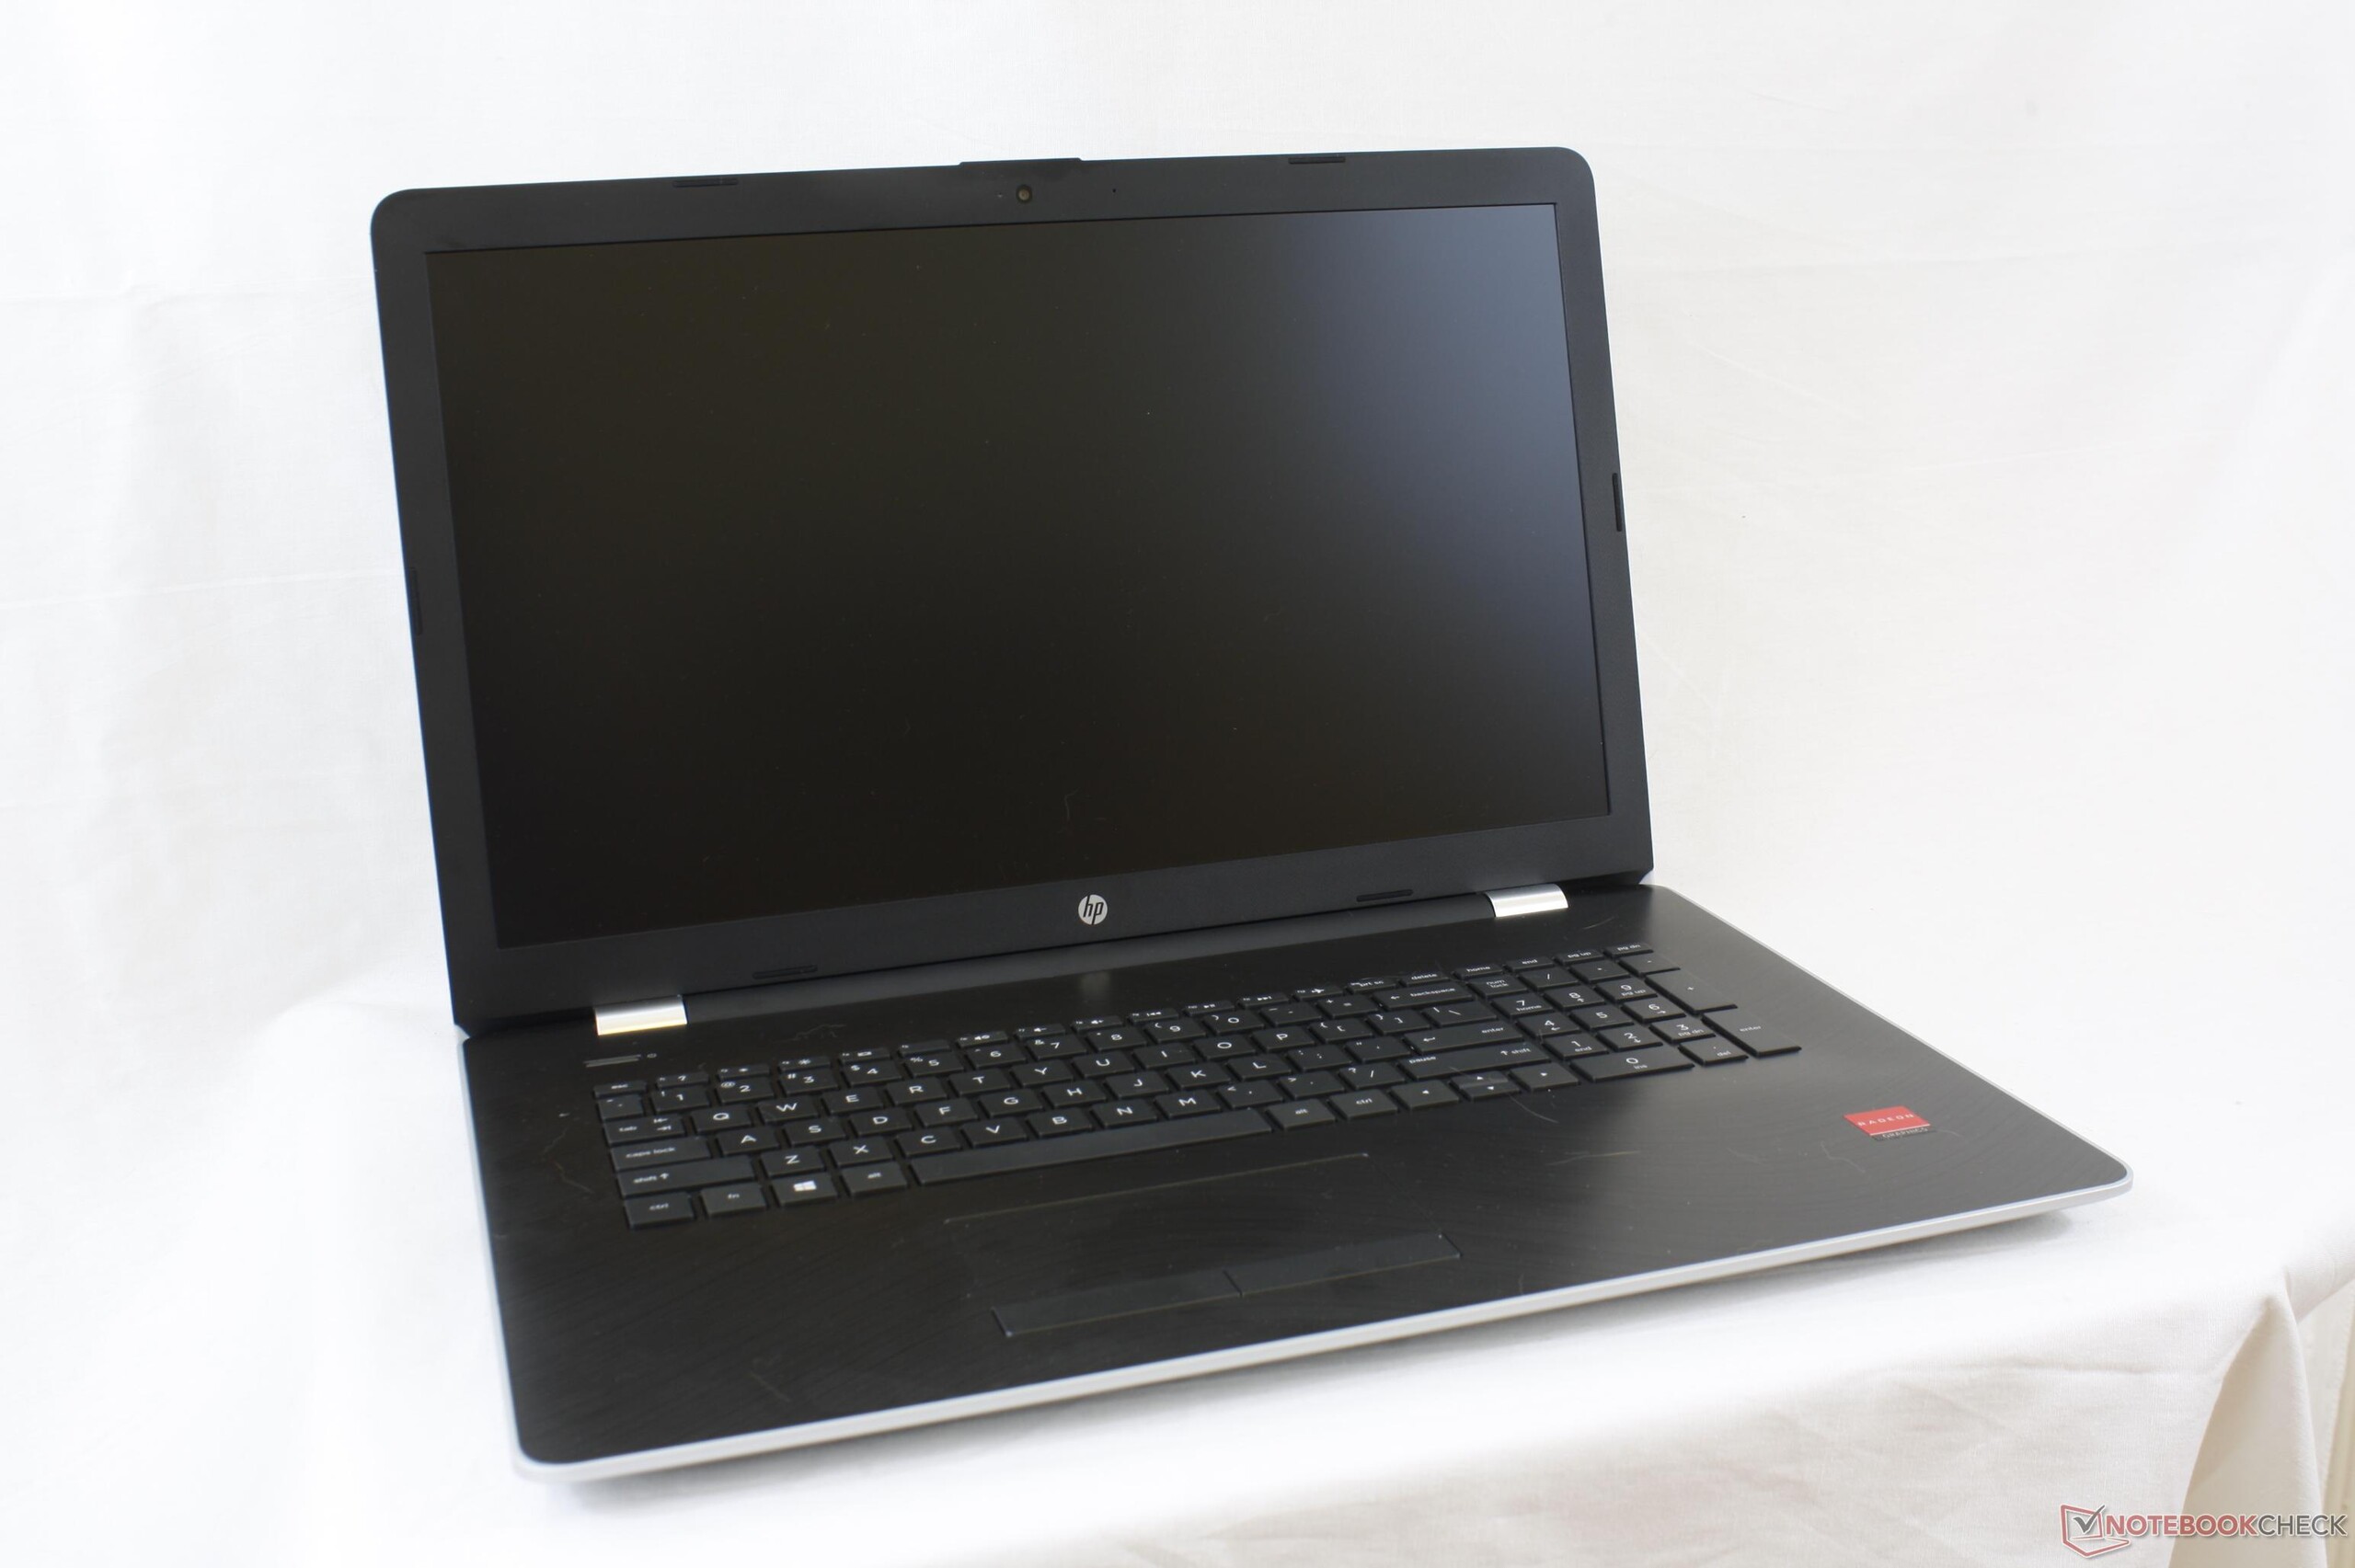
Breve análisis del portátil HP Pavilion 17z (A12-9720P, Radeon R7 M340)
| SD Card Reader | |
| average JPG Copy Test (av. of 3 runs) | |
| Dell XPS 15 9560 (i7-7700HQ, UHD) | |
| HP Pavilion 17z 1EX13AV | |
| Dell Inspiron 17 5759-5118 | |
| maximum AS SSD Seq Read Test (1GB) | |
| Dell XPS 15 9560 (i7-7700HQ, UHD) | |
| HP Pavilion 17z 1EX13AV | |
| Dell Inspiron 17 5759-5118 | |
| Networking | |
| iperf3 transmit AX12 | |
| Lenovo Ideapad 110-17IKB 80VK0001GE | |
| HP Pavilion 17-x110ng | |
| HP Pavilion 17z 1EX13AV | |
| iperf3 receive AX12 | |
| Lenovo Ideapad 110-17IKB 80VK0001GE | |
| HP Pavilion 17z 1EX13AV | |
| HP Pavilion 17-x110ng | |
| |||||||||||||||||||||||||
iluminación: 91 %
Brillo con batería: 333.5 cd/m²
Contraste: 1042:1 (Negro: 0.32 cd/m²)
ΔE ColorChecker Calman: 4 | ∀{0.5-29.43 Ø4.71}
ΔE Greyscale Calman: 4.5 | ∀{0.09-98 Ø4.96}
88.1% sRGB (Argyll 1.6.3 3D)
57.5% AdobeRGB 1998 (Argyll 1.6.3 3D)
64.6% AdobeRGB 1998 (Argyll 3D)
88.5% sRGB (Argyll 3D)
64.3% Display P3 (Argyll 3D)
Gamma: 2.19
CCT: 6386 K
| HP Pavilion 17z 1EX13AV ID: AUO109D, Name: AU Optronics B173HW01 V0, IPS, 17.3", 1920x1080 | HP Pavilion 17-x110ng Chi Mei CMN1738, IPS, WLED, 17.3", 1920x1080 | Lenovo Ideapad 110-17IKB 80VK0001GE AU Optronics B173RTN02.2, TN LED, 17.3", 1600x900 | Asus F756UX-T7013T Chi Mei CMN1735 / N173HGE-E11, TN LED, 17.3", 1920x1080 | Dell Inspiron 17 5759-5118 AU Optronics B173HTN, TN LED, 17.3", 1920x1080 | MSI GL72 7RDX-602 Chi Mei CMN1735 N173HGE-E11, TN LED, 17.3", 1920x1080 | |
|---|---|---|---|---|---|---|
| Display | -2% | -19% | 2% | 4% | 3% | |
| Display P3 Coverage (%) | 64.3 | 63.6 -1% | 51.1 -21% | 63.9 -1% | 69.3 8% | 65.2 1% |
| sRGB Coverage (%) | 88.5 | 86.5 -2% | 73.4 -17% | 93.7 6% | 90.6 2% | 94.3 7% |
| AdobeRGB 1998 Coverage (%) | 64.6 | 63.3 -2% | 52.6 -19% | 64.6 0% | 66.3 3% | 65.6 2% |
| Response Times | -7% | -3% | 9% | -51% | 16% | |
| Response Time Grey 50% / Grey 80% * (ms) | 40.8 ? | 41 ? -0% | 50 ? -23% | 42 ? -3% | 86 ? -111% | 29 ? 29% |
| Response Time Black / White * (ms) | 26.4 ? | 30 ? -14% | 22 ? 17% | 21 ? 20% | 24 ? 9% | 26 ? 2% |
| PWM Frequency (Hz) | 200 ? | 50 ? | 1000 ? | 200 ? | 961 | |
| Screen | -23% | -65% | -17% | -43% | -59% | |
| Brightness middle (cd/m²) | 333.5 | 288 -14% | 231 -31% | 268 -20% | 304 -9% | 299 -10% |
| Brightness (cd/m²) | 323 | 285 -12% | 210 -35% | 255 -21% | 292 -10% | 274 -15% |
| Brightness Distribution (%) | 91 | 88 -3% | 83 -9% | 83 -9% | 84 -8% | 80 -12% |
| Black Level * (cd/m²) | 0.32 | 0.61 -91% | 0.37 -16% | 0.17 47% | 0.37 -16% | 0.25 22% |
| Contrast (:1) | 1042 | 472 -55% | 624 -40% | 1576 51% | 822 -21% | 1196 15% |
| Colorchecker dE 2000 * | 4 | 4.56 -14% | 9.83 -146% | 7.18 -80% | 10.62 -166% | 12.92 -223% |
| Colorchecker dE 2000 max. * | 6.9 | 7.76 -12% | 18.35 -166% | 11.67 -69% | 19.91 -189% | |
| Greyscale dE 2000 * | 4.5 | 4.95 -10% | 12.46 -177% | 7.97 -77% | 11.78 -162% | 13.16 -192% |
| Gamma | 2.19 100% | 2.48 89% | 2.43 91% | 2.34 94% | 2.39 92% | 2.36 93% |
| CCT | 6386 102% | 7669 85% | 13115 50% | 8541 76% | 12997 50% | 15046 43% |
| Color Space (Percent of AdobeRGB 1998) (%) | 57.5 | 48 -17% | 59 3% | 59 3% | 60 4% | |
| Color Space (Percent of sRGB) (%) | 88.1 | 93 6% | 73 -17% | 94 7% | 90 2% | 94 7% |
| Media total (Programa/Opciones) | -11% /
-16% | -29% /
-48% | -2% /
-10% | -30% /
-34% | -13% /
-37% |
* ... más pequeño es mejor
Tiempos de respuesta del display
| ↔ Tiempo de respuesta de Negro a Blanco | ||
|---|---|---|
| 26.4 ms ... subida ↗ y bajada ↘ combinada | ↗ 14 ms subida | 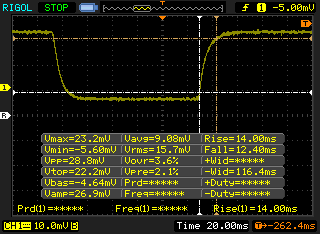 |
| ↘ 12.4 ms bajada | ||
| La pantalla mostró tiempos de respuesta relativamente lentos en nuestros tests pero podría ser demasiado lenta para los jugones. En comparación, todos los dispositivos de prueba van de ##min### (mínimo) a 240 (máximo) ms. » 66 % de todos los dispositivos son mejores. Eso quiere decir que el tiempo de respuesta es peor que la media (19.8 ms) de todos los dispositivos testados. | ||
| ↔ Tiempo de respuesta 50% Gris a 80% Gris | ||
| 40.8 ms ... subida ↗ y bajada ↘ combinada | ↗ 22 ms subida | 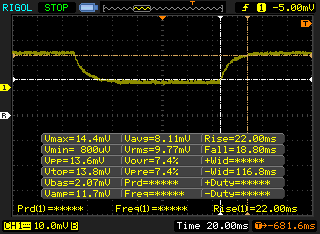 |
| ↘ 18.8 ms bajada | ||
| La pantalla mostró tiempos de respuesta lentos en nuestros tests y podría ser demasiado lenta para los jugones. En comparación, todos los dispositivos de prueba van de ##min### (mínimo) a 636 (máximo) ms. » 64 % de todos los dispositivos son mejores. Eso quiere decir que el tiempo de respuesta es peor que la media (31 ms) de todos los dispositivos testados. | ||
Parpadeo de Pantalla / PWM (Pulse-Width Modulation)
| Parpadeo de Pantalla / PWM no detectado | 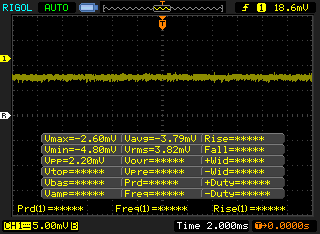 | ||
Comparación: 52 % de todos los dispositivos testados no usaron PWM para atenuar el display. Si se usó, medimos una media de 7754 (mínimo: 5 - máxmo: 343500) Hz. | |||
| wPrime 2.10 - 1024m | |
| Lenovo ThinkPad X1 Tablet Gen 2 | |
| HP Pavilion 14t-ab000 K9E07AV | |
| Asus X555DA-BB11 | |
| HP Pavilion 17z 1EX13AV | |
* ... más pequeño es mejor
| PCMark 8 - Home Score Accelerated v2 | |
| Asus ASUSPRO B9440UA-GV0101T | |
| Lenovo Ideapad 110-17IKB 80VK0001GE | |
| Dell Inspiron 17 5759-5118 | |
| HP Pavilion 17-x110ng | |
| HP Pavilion 17z 1EX13AV | |
| Lenovo Yoga 510-14AST | |
| HP EliteBook 725 G4 | |
| Lenovo Yoga 3 Pro 13 80HE004LGE | |
| PCMark 8 Home Score Accelerated v2 | 2783 puntos | |
| PCMark 8 Creative Score Accelerated v2 | 3219 puntos | |
| PCMark 8 Work Score Accelerated v2 | 3518 puntos | |
| PCMark 10 Score | 2235 puntos | |
ayuda | ||
| HP Pavilion 17z 1EX13AV WDC Scorpio Blue WD10JPVX-60JC3T1 | HP Pavilion 17-x110ng SanDisk Z400s SD8SNAT-256G | Lenovo Ideapad 110-17IKB 80VK0001GE WDC Scorpio Blue WD10JPCX-24UE4T0 | Asus F756UX-T7013T HGST Travelstar 5K1000 HTS541010A9E680 | Dell Inspiron 17 5759-5118 Seagate Momentus SpinPoint M8 ST1000LM024 HN-M101MBB | |
|---|---|---|---|---|---|
| CrystalDiskMark 3.0 | 8313% | 45% | 22% | -9% | |
| Read Seq (MB/s) | 90 | 500 456% | 110.3 23% | 105.8 18% | 91.8 2% |
| Write Seq (MB/s) | 90.3 | 325.1 260% | 109 21% | 105 16% | 84.7 -6% |
| Read 512 (MB/s) | 28.47 | 290.2 919% | 39.19 38% | 33.33 17% | 26.59 -7% |
| Write 512 (MB/s) | 47.07 | 300.3 538% | 52.9 12% | 39.12 -17% | 32.7 -31% |
| Read 4k (MB/s) | 0.31 | 11.24 3526% | 0.45 45% | 0.413 33% | 0.288 -7% |
| Write 4k (MB/s) | 0.3997 | 86 21416% | 1.201 200% | 0.947 137% | 0.638 60% |
| Read 4k QD32 (MB/s) | 1.021 | 145.4 14141% | 1.079 6% | 0.812 -20% | 0.59 -42% |
| Write 4k QD32 (MB/s) | 1.076 | 272.7 25244% | 1.234 15% | 0.968 -10% | 0.642 -40% |

| 3DMark 11 | |
| 1280x720 Performance GPU | |
| Acer Aspire E5-575G-549D | |
| HP Pavilion 17z 1EX13AV | |
| Intel Skull Canyon NUC6i7KYK | |
| Apple MacBook Pro 13 2017 Touchbar i5 | |
| Lenovo Flex 2 Pro-15 | |
| Samsung Notebook 9 NP900X5N-X01US | |
| HP EliteBook 755 G4 | |
| Lenovo IdeaPad 305-15IBD | |
| Lenovo ThinkPad L570 20J80020PB | |
| Acer TravelMate P249-M-5452 | |
| HP 15-bw077ax | |
| Lenovo Ideapad 110-15ACL 80TJ00H0GE | |
| Toshiba Portege Z20t-B-10C | |
| 1280x720 Performance Combined | |
| Acer Aspire E5-575G-549D | |
| Intel Skull Canyon NUC6i7KYK | |
| Apple MacBook Pro 13 2017 Touchbar i5 | |
| Samsung Notebook 9 NP900X5N-X01US | |
| Lenovo Flex 2 Pro-15 | |
| Lenovo ThinkPad L570 20J80020PB | |
| Acer TravelMate P249-M-5452 | |
| Lenovo IdeaPad 305-15IBD | |
| HP Pavilion 17z 1EX13AV | |
| HP EliteBook 755 G4 | |
| Lenovo Ideapad 110-15ACL 80TJ00H0GE | |
| HP 15-bw077ax | |
| Toshiba Portege Z20t-B-10C | |
| 3DMark | |
| 1280x720 Cloud Gate Standard Graphics | |
| Acer Aspire E5-575G-549D | |
| Intel Skull Canyon NUC6i7KYK | |
| Apple MacBook Pro 13 2017 Touchbar i5 | |
| HP Pavilion 17z 1EX13AV | |
| Lenovo ThinkPad L570 20J80020PB | |
| Lenovo Flex 2 Pro-15 | |
| Samsung Notebook 9 NP900X5N-X01US | |
| Acer TravelMate P249-M-5452 | |
| HP EliteBook 755 G4 | |
| Lenovo IdeaPad 305-15IBD | |
| Toshiba Portege Z20t-B-10C | |
| HP 15-bw077ax | |
| 1920x1080 Fire Strike Graphics | |
| Acer Aspire E5-575G-549D | |
| HP Pavilion 17z 1EX13AV | |
| Intel Skull Canyon NUC6i7KYK | |
| Apple MacBook Pro 13 2017 Touchbar i5 | |
| Samsung Notebook 9 NP900X5N-X01US | |
| Lenovo Flex 2 Pro-15 | |
| Lenovo ThinkPad L570 20J80020PB | |
| HP EliteBook 755 G4 | |
| Lenovo IdeaPad 305-15IBD | |
| Acer TravelMate P249-M-5452 | |
| HP 15-bw077ax | |
| Toshiba Portege Z20t-B-10C | |
| 3DMark 11 Performance | 2961 puntos | |
| 3DMark Ice Storm Standard Score | 41857 puntos | |
| 3DMark Cloud Gate Standard Score | 5704 puntos | |
| 3DMark Fire Strike Score | 1407 puntos | |
ayuda | ||
| Rise of the Tomb Raider - 1024x768 Lowest Preset | |
| Acer Aspire E5-575G-549D | |
| Samsung Notebook 9 NP900X5N-X01US | |
| HP Pavilion 17z 1EX13AV | |
| Microsoft Surface Pro (2017) i7 | |
| Asus X302UV-FN016T | |
| Dell Latitude 5280 | |
| bajo | medio | alto | ultra | |
|---|---|---|---|---|
| StarCraft II: Heart of the Swarm (2013) | 61 | 35.5 | 21.5 | |
| BioShock Infinite (2013) | 74.5 | 43.5 | 34.1 | 11.8 |
| Metro: Last Light (2013) | 32.6 | 26 | 18.9 | |
| Thief (2014) | 20.3 | |||
| The Witcher 3 (2015) | 19 | |||
| Batman: Arkham Knight (2015) | 19 | |||
| Metal Gear Solid V (2015) | 57 | 40 | 14 | |
| Dota 2 Reborn (2015) | 46 | 38 | 21 | 18 |
| Fallout 4 (2015) | 25.6 | |||
| Rise of the Tomb Raider (2016) | 28.2 | 15 | ||
| Doom (2016) | 20.2 | |||
| Overwatch (2016) | 54.8 | 44.9 | ||
| Prey (2017) | 38.4 | 14.7 |
Ruido
| Ocioso |
| 30.4 / 30.5 / 30.5 dB(A) |
| Carga |
| 41.5 / 48.2 dB(A) |
 | ||
30 dB silencioso 40 dB(A) audible 50 dB(A) ruidosamente alto |
||
min: | ||
| HP Pavilion 17z 1EX13AV Radeon R7 M340, A12-9720P, WDC Scorpio Blue WD10JPVX-60JC3T1 | HP Pavilion 17-x110ng Radeon R7 M440, i5-7200U, SanDisk Z400s SD8SNAT-256G | Lenovo Ideapad 110-17IKB 80VK0001GE Radeon R5 M430, i5-7200U, WDC Scorpio Blue WD10JPCX-24UE4T0 | Asus F756UX-T7013T GeForce GTX 950M, 6200U, HGST Travelstar 5K1000 HTS541010A9E680 | Dell Inspiron 17 5759-5118 Radeon R5 M335, 6200U, Seagate Momentus SpinPoint M8 ST1000LM024 HN-M101MBB | MSI GL72 7RDX-602 GeForce GTX 1050 Mobile, i7-7700HQ, HGST Travelstar 7K1000 HTS721010A9E630 | |
|---|---|---|---|---|---|---|
| Noise | 3% | 1% | -5% | -6% | -3% | |
| apagado / medio ambiente * (dB) | 28 | 29 -4% | 30.5 -9% | 31.2 -11% | 30.8 -10% | |
| Idle Minimum * (dB) | 30.4 | 31 -2% | 32.5 -7% | 32.4 -7% | 33.9 -12% | 32.4 -7% |
| Idle Average * (dB) | 30.5 | 31 -2% | 32.5 -7% | 32.6 -7% | 33.9 -11% | 32.4 -6% |
| Idle Maximum * (dB) | 30.5 | 31 -2% | 32.5 -7% | 32.6 -7% | 33.9 -11% | 32.8 -8% |
| Load Average * (dB) | 41.5 | 33.8 19% | 34.6 17% | 42 -1% | 43.8 -6% | 40.9 1% |
| Witcher 3 ultra * (dB) | 41.8 | |||||
| Load Maximum * (dB) | 48.2 | 44.8 7% | 38.3 21% | 45.2 6% | 44.2 8% | 43.6 10% |
* ... más pequeño es mejor
(±) La temperatura máxima en la parte superior es de 40.8 °C / 105 F, frente a la media de 36.8 °C / 98 F, que oscila entre 21 y 71 °C para la clase Multimedia.
(±) El fondo se calienta hasta un máximo de 41.6 °C / 107 F, frente a la media de 39.1 °C / 102 F
(+) En reposo, la temperatura media de la parte superior es de 23.3 °C / 74# F, frente a la media del dispositivo de 31.3 °C / 88 F.
(±) Jugando a The Witcher 3, la temperatura media de la parte superior es de 33.2 °C / 92 F, frente a la media del dispositivo de 31.3 °C / 88 F.
(+) Los reposamanos y el panel táctil alcanzan como máximo la temperatura de la piel (32.8 °C / 91 F) y, por tanto, no están calientes.
(-) La temperatura media de la zona del reposamanos de dispositivos similares fue de 28.7 °C / 83.7 F (-4.1 °C / -7.3 F).
HP Pavilion 17z 1EX13AV análisis de audio
(-) | altavoces no muy altos (#64.1 dB)
Graves 100 - 315 Hz
(±) | lubina reducida - en promedio 13.7% inferior a la mediana
(-) | los graves no son lineales (16.5% delta a la frecuencia anterior)
Medios 400 - 2000 Hz
(+) | medios equilibrados - a sólo 3.5% de la mediana
(-) | los medios no son lineales (17.3% delta respecto a la frecuencia anterior)
Altos 2 - 16 kHz
(+) | máximos equilibrados - a sólo 4.6% de la mediana
(-) | los máximos no son lineales (18.5% delta a la frecuencia anterior)
Total 100 - 16.000 Hz
(±) | la linealidad del sonido global es media (27.5% de diferencia con la mediana)
En comparación con la misma clase
» 93% de todos los dispositivos probados de esta clase eran mejores, 2% similares, 5% peores
» El mejor tuvo un delta de 5%, la media fue 17%, el peor fue ###max##%
En comparación con todos los dispositivos probados
» 84% de todos los dispositivos probados eran mejores, 3% similares, 13% peores
» El mejor tuvo un delta de 4%, la media fue 23%, el peor fue ###max##%
Apple MacBook 12 (Early 2016) 1.1 GHz análisis de audio
(+) | los altavoces pueden reproducir a un volumen relativamente alto (#83.6 dB)
Graves 100 - 315 Hz
(±) | lubina reducida - en promedio 11.3% inferior a la mediana
(±) | la linealidad de los graves es media (14.2% delta a frecuencia anterior)
Medios 400 - 2000 Hz
(+) | medios equilibrados - a sólo 2.4% de la mediana
(+) | los medios son lineales (5.5% delta a la frecuencia anterior)
Altos 2 - 16 kHz
(+) | máximos equilibrados - a sólo 2% de la mediana
(+) | los máximos son lineales (4.5% delta a la frecuencia anterior)
Total 100 - 16.000 Hz
(+) | el sonido global es lineal (10.2% de diferencia con la mediana)
En comparación con la misma clase
» 7% de todos los dispositivos probados de esta clase eran mejores, 2% similares, 90% peores
» El mejor tuvo un delta de 5%, la media fue 18%, el peor fue ###max##%
En comparación con todos los dispositivos probados
» 5% de todos los dispositivos probados eran mejores, 1% similares, 94% peores
» El mejor tuvo un delta de 4%, la media fue 23%, el peor fue ###max##%
| Off / Standby | |
| Ocioso | |
| Carga |
|
Clave:
min: | |
| HP Pavilion 17z 1EX13AV A12-9720P, Radeon R7 M340, WDC Scorpio Blue WD10JPVX-60JC3T1, IPS, 1920x1080, 17.3" | HP Pavilion 17-x110ng i5-7200U, Radeon R7 M440, SanDisk Z400s SD8SNAT-256G, IPS, WLED, 1920x1080, 17.3" | Lenovo Ideapad 110-17IKB 80VK0001GE i5-7200U, Radeon R5 M430, WDC Scorpio Blue WD10JPCX-24UE4T0, TN LED, 1600x900, 17.3" | Asus F756UX-T7013T 6200U, GeForce GTX 950M, HGST Travelstar 5K1000 HTS541010A9E680, TN LED, 1920x1080, 17.3" | Dell Inspiron 17 5759-5118 6200U, Radeon R5 M335, Seagate Momentus SpinPoint M8 ST1000LM024 HN-M101MBB, TN LED, 1920x1080, 17.3" | MSI GL72 7RDX-602 i7-7700HQ, GeForce GTX 1050 Mobile, HGST Travelstar 7K1000 HTS721010A9E630, TN LED, 1920x1080, 17.3" | |
|---|---|---|---|---|---|---|
| Power Consumption | 8% | 26% | 5% | 19% | -49% | |
| Idle Minimum * (Watt) | 7.8 | 7.7 1% | 6.9 12% | 5.8 26% | 6.2 21% | 9.6 -23% |
| Idle Average * (Watt) | 11.7 | 14 -20% | 9.6 18% | 11.2 4% | 11.6 1% | 15 -28% |
| Idle Maximum * (Watt) | 15.7 | 15.1 4% | 11.7 25% | 11.9 24% | 12.3 22% | 16.5 -5% |
| Load Average * (Watt) | 57.4 | 33 43% | 29 49% | 54 6% | 36 37% | 104 -81% |
| Witcher 3 ultra * (Watt) | 53.3 | |||||
| Load Maximum * (Watt) | 62.3 | 54.6 12% | 45.4 27% | 84 -35% | 55 12% | 129 -107% |
* ... más pequeño es mejor
| HP Pavilion 17z 1EX13AV A12-9720P, Radeon R7 M340, 41.6 Wh | HP Pavilion 17-x110ng i5-7200U, Radeon R7 M440, 41 Wh | Lenovo Ideapad 110-17IKB 80VK0001GE i5-7200U, Radeon R5 M430, 32 Wh | Asus F756UX-T7013T 6200U, GeForce GTX 950M, 38 Wh | Dell Inspiron 17 5759-5118 6200U, Radeon R5 M335, 40 Wh | MSI GL72 7RDX-602 i7-7700HQ, GeForce GTX 1050 Mobile, 43.2 Wh | |
|---|---|---|---|---|---|---|
| Duración de Batería | 34% | 5% | 7% | 23% | -25% | |
| Reader / Idle (h) | 6.8 | 8.8 29% | 8.2 21% | 9.6 41% | 5.5 -19% | |
| WiFi v1.3 (h) | 3.9 | 5.8 49% | 4.1 5% | 3.6 -8% | 5 28% | 3.4 -13% |
| Load (h) | 1.2 | 1.5 25% | 1.3 8% | 1.2 0% | 0.7 -42% |
Pro
Contra

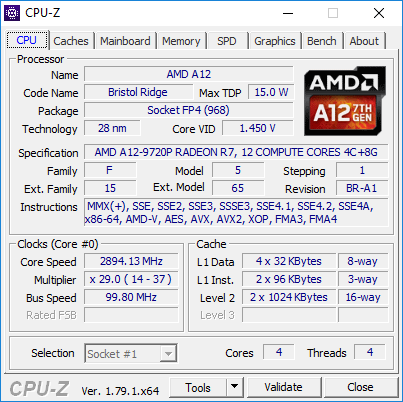
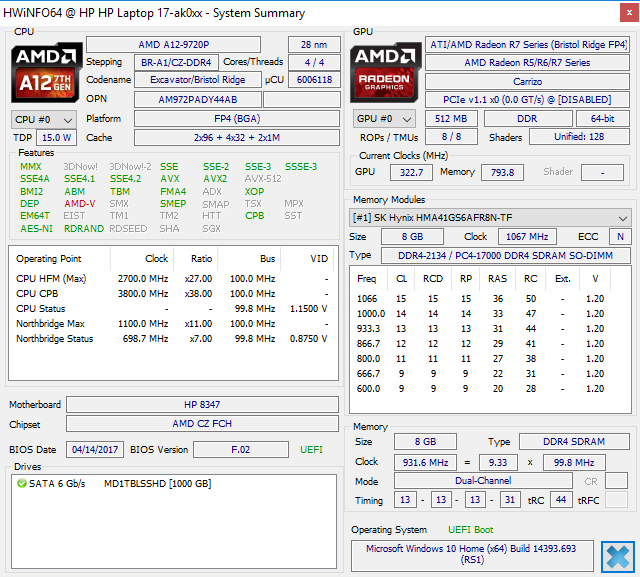
El A12-9720P APU es un buen ejemplo de lo lejos que ha estado AMD en la carrera de CPU antes del advenimiento de Ryzen y la arquitectura Zen. Normalmente, cuando un procesador se recalienta y suena más fuerte que una alternativa suya, esperarías que rindiera más rápido. Esto no es así para el A12-9720P, ya que trabaja más caliente,con más ruido y más lento que las dos generaciones antiguas de Core i3-5010U. Los programas tardan en lanzarse e instalarse incluso para un sistema basado en HDD.
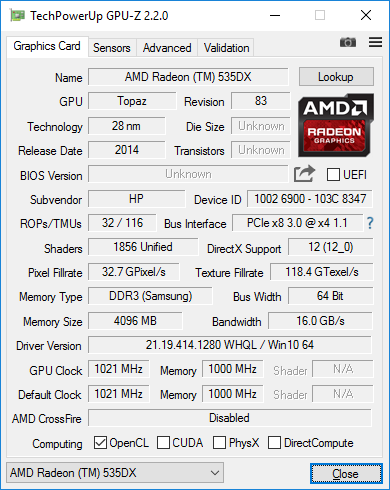
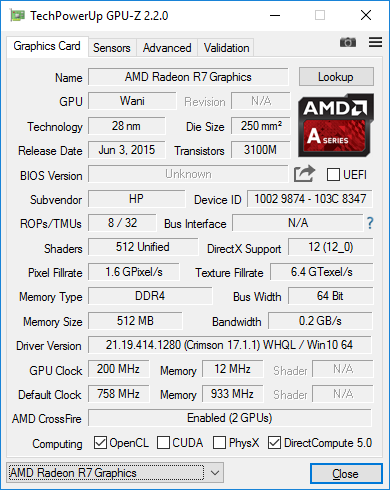
En cuanto a la parte de la GPU, la Radeon R7 M340 no es realmente mala ya que es casi equiparable con la GTX 950M en potencia gráfica cruda. El principal problema es que está encadenada a una CPU muy lenta hasta el punto de que el rendimiento del juego en el mundo real es significativamente más lento que un portátil GTX 950M adecuado. Este embotellamiento impide que el Pavilion 17z sea un portátil gaming de bajo presupuesto y nos hace cuestionar la inclusión del R7 M340 para empezar. La GPU simplemente consume más energía, añadiendo más calor y reduciendo la duración de la batería sin beneficiar realmente al usuario a su máximo potencial. Sencillamente, los portátiles Ryzen no pueden venir lo bastante pronto.
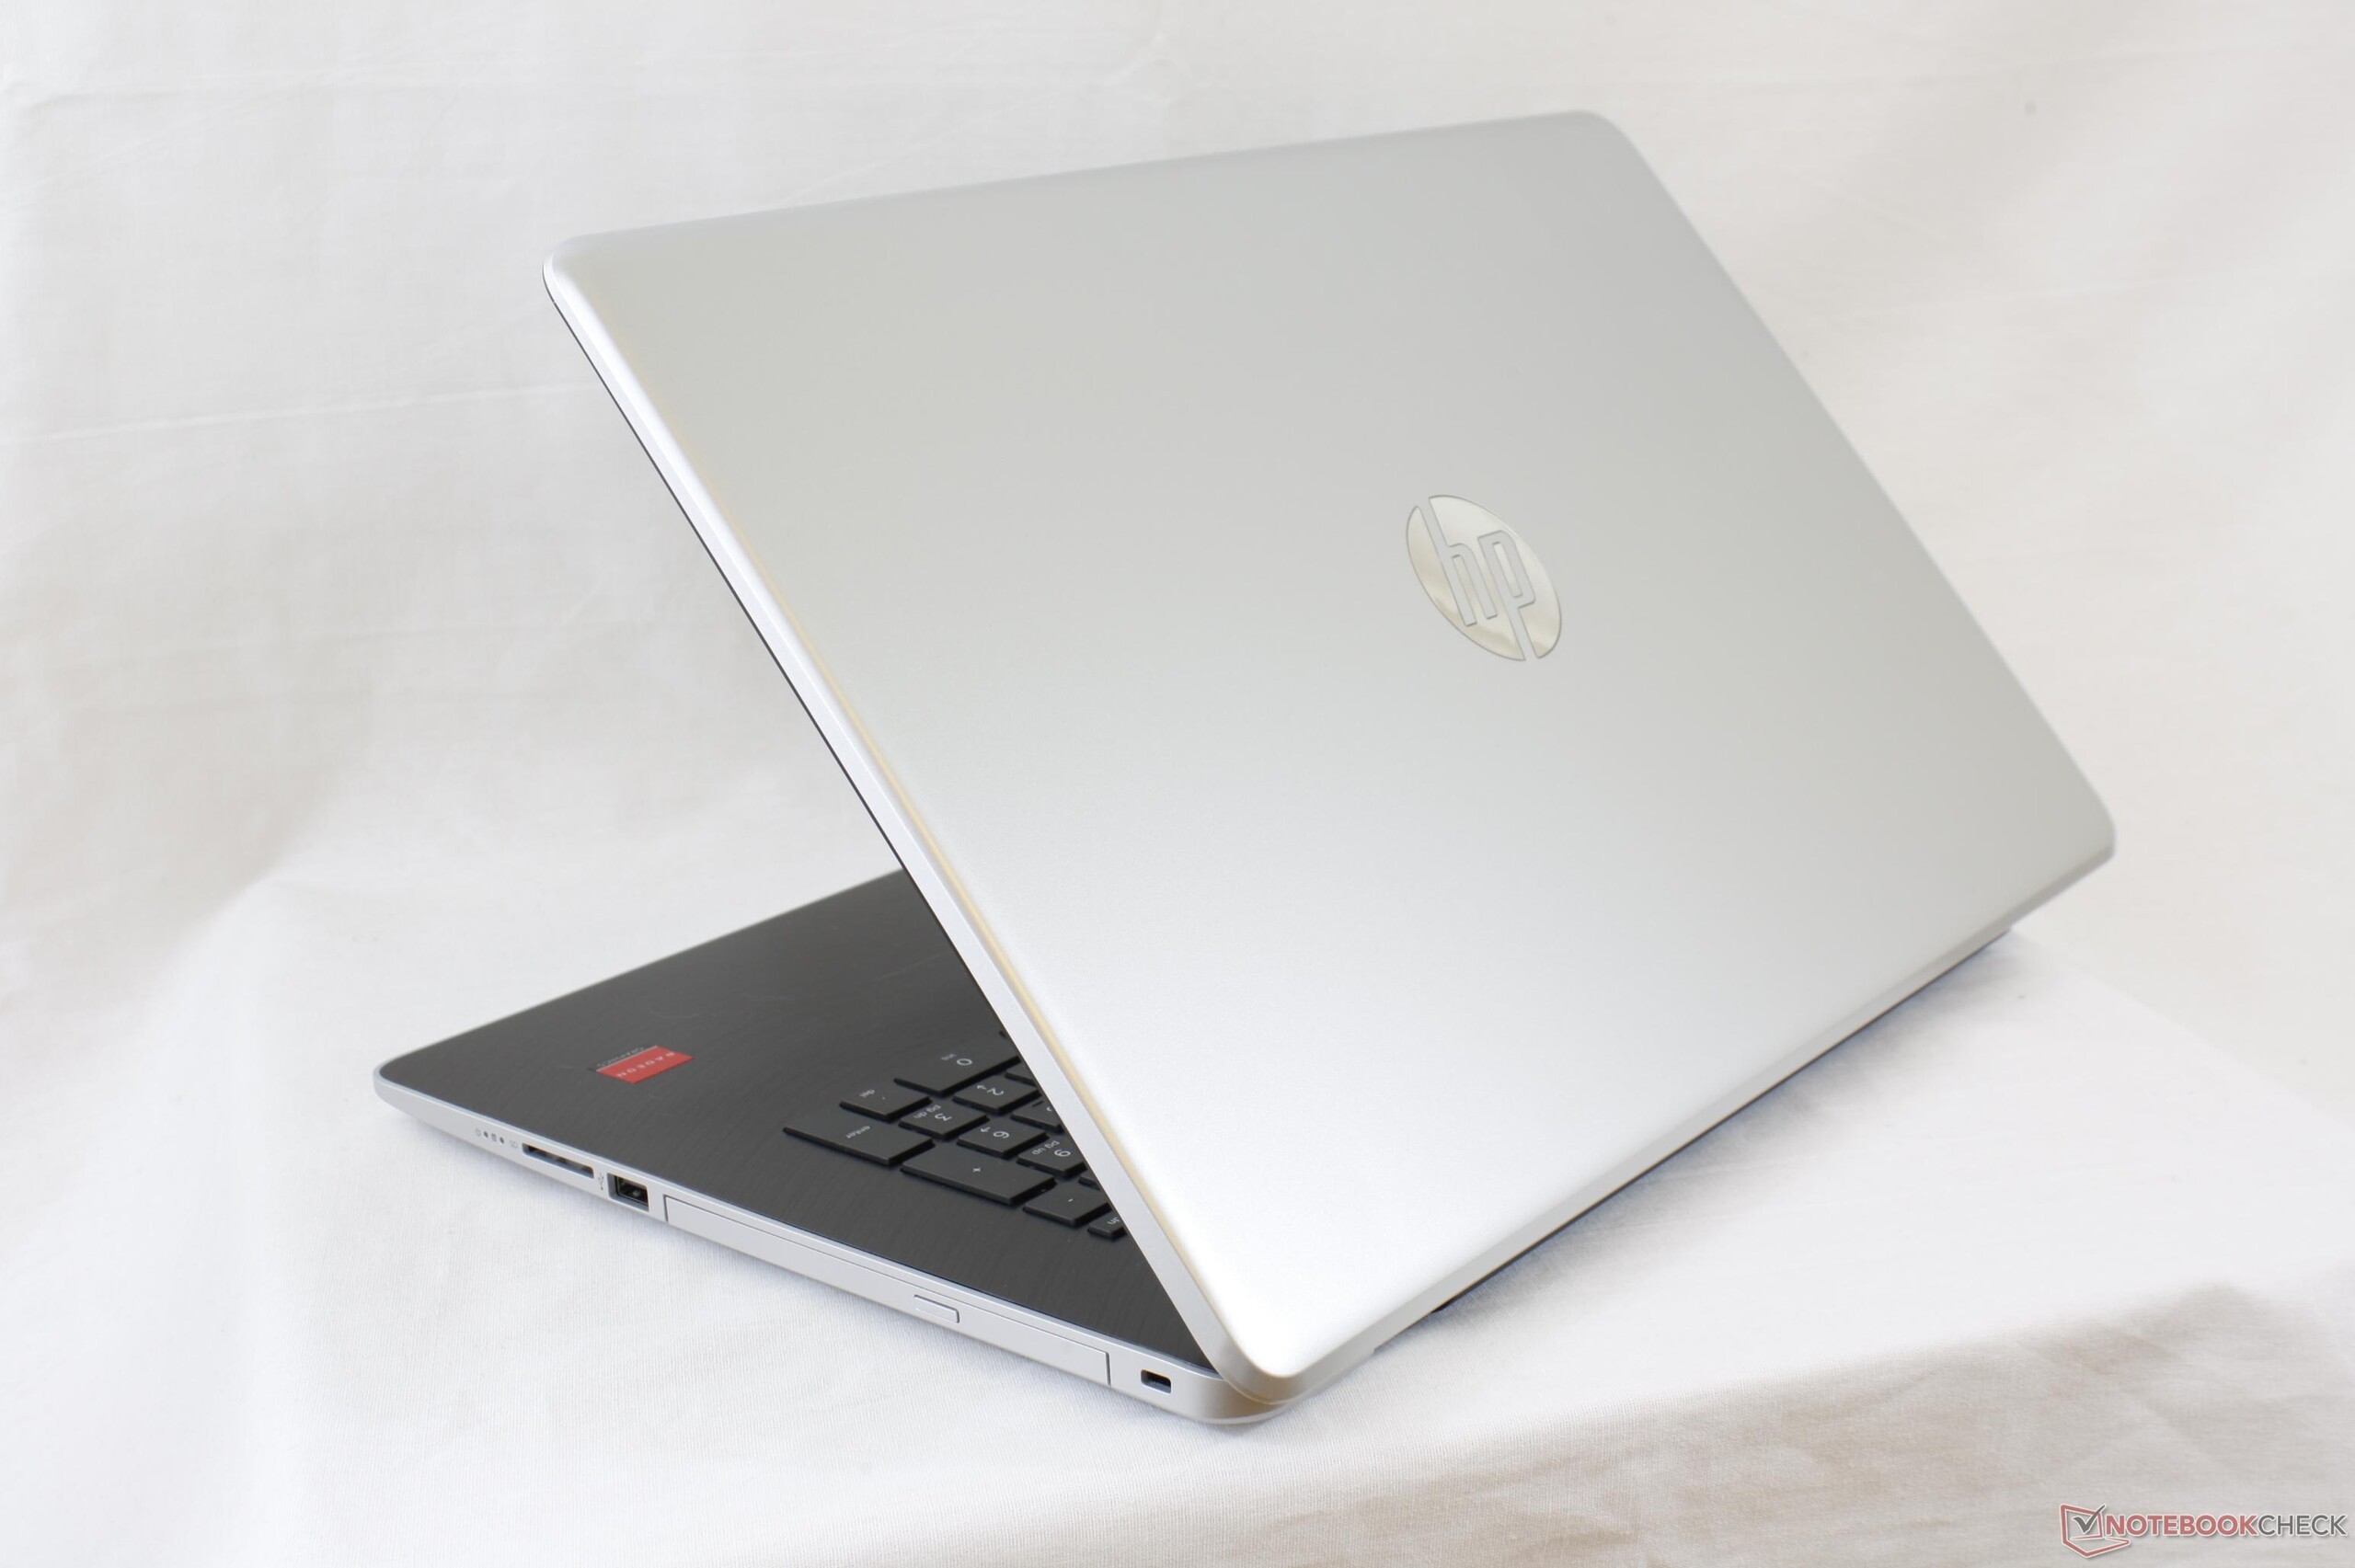
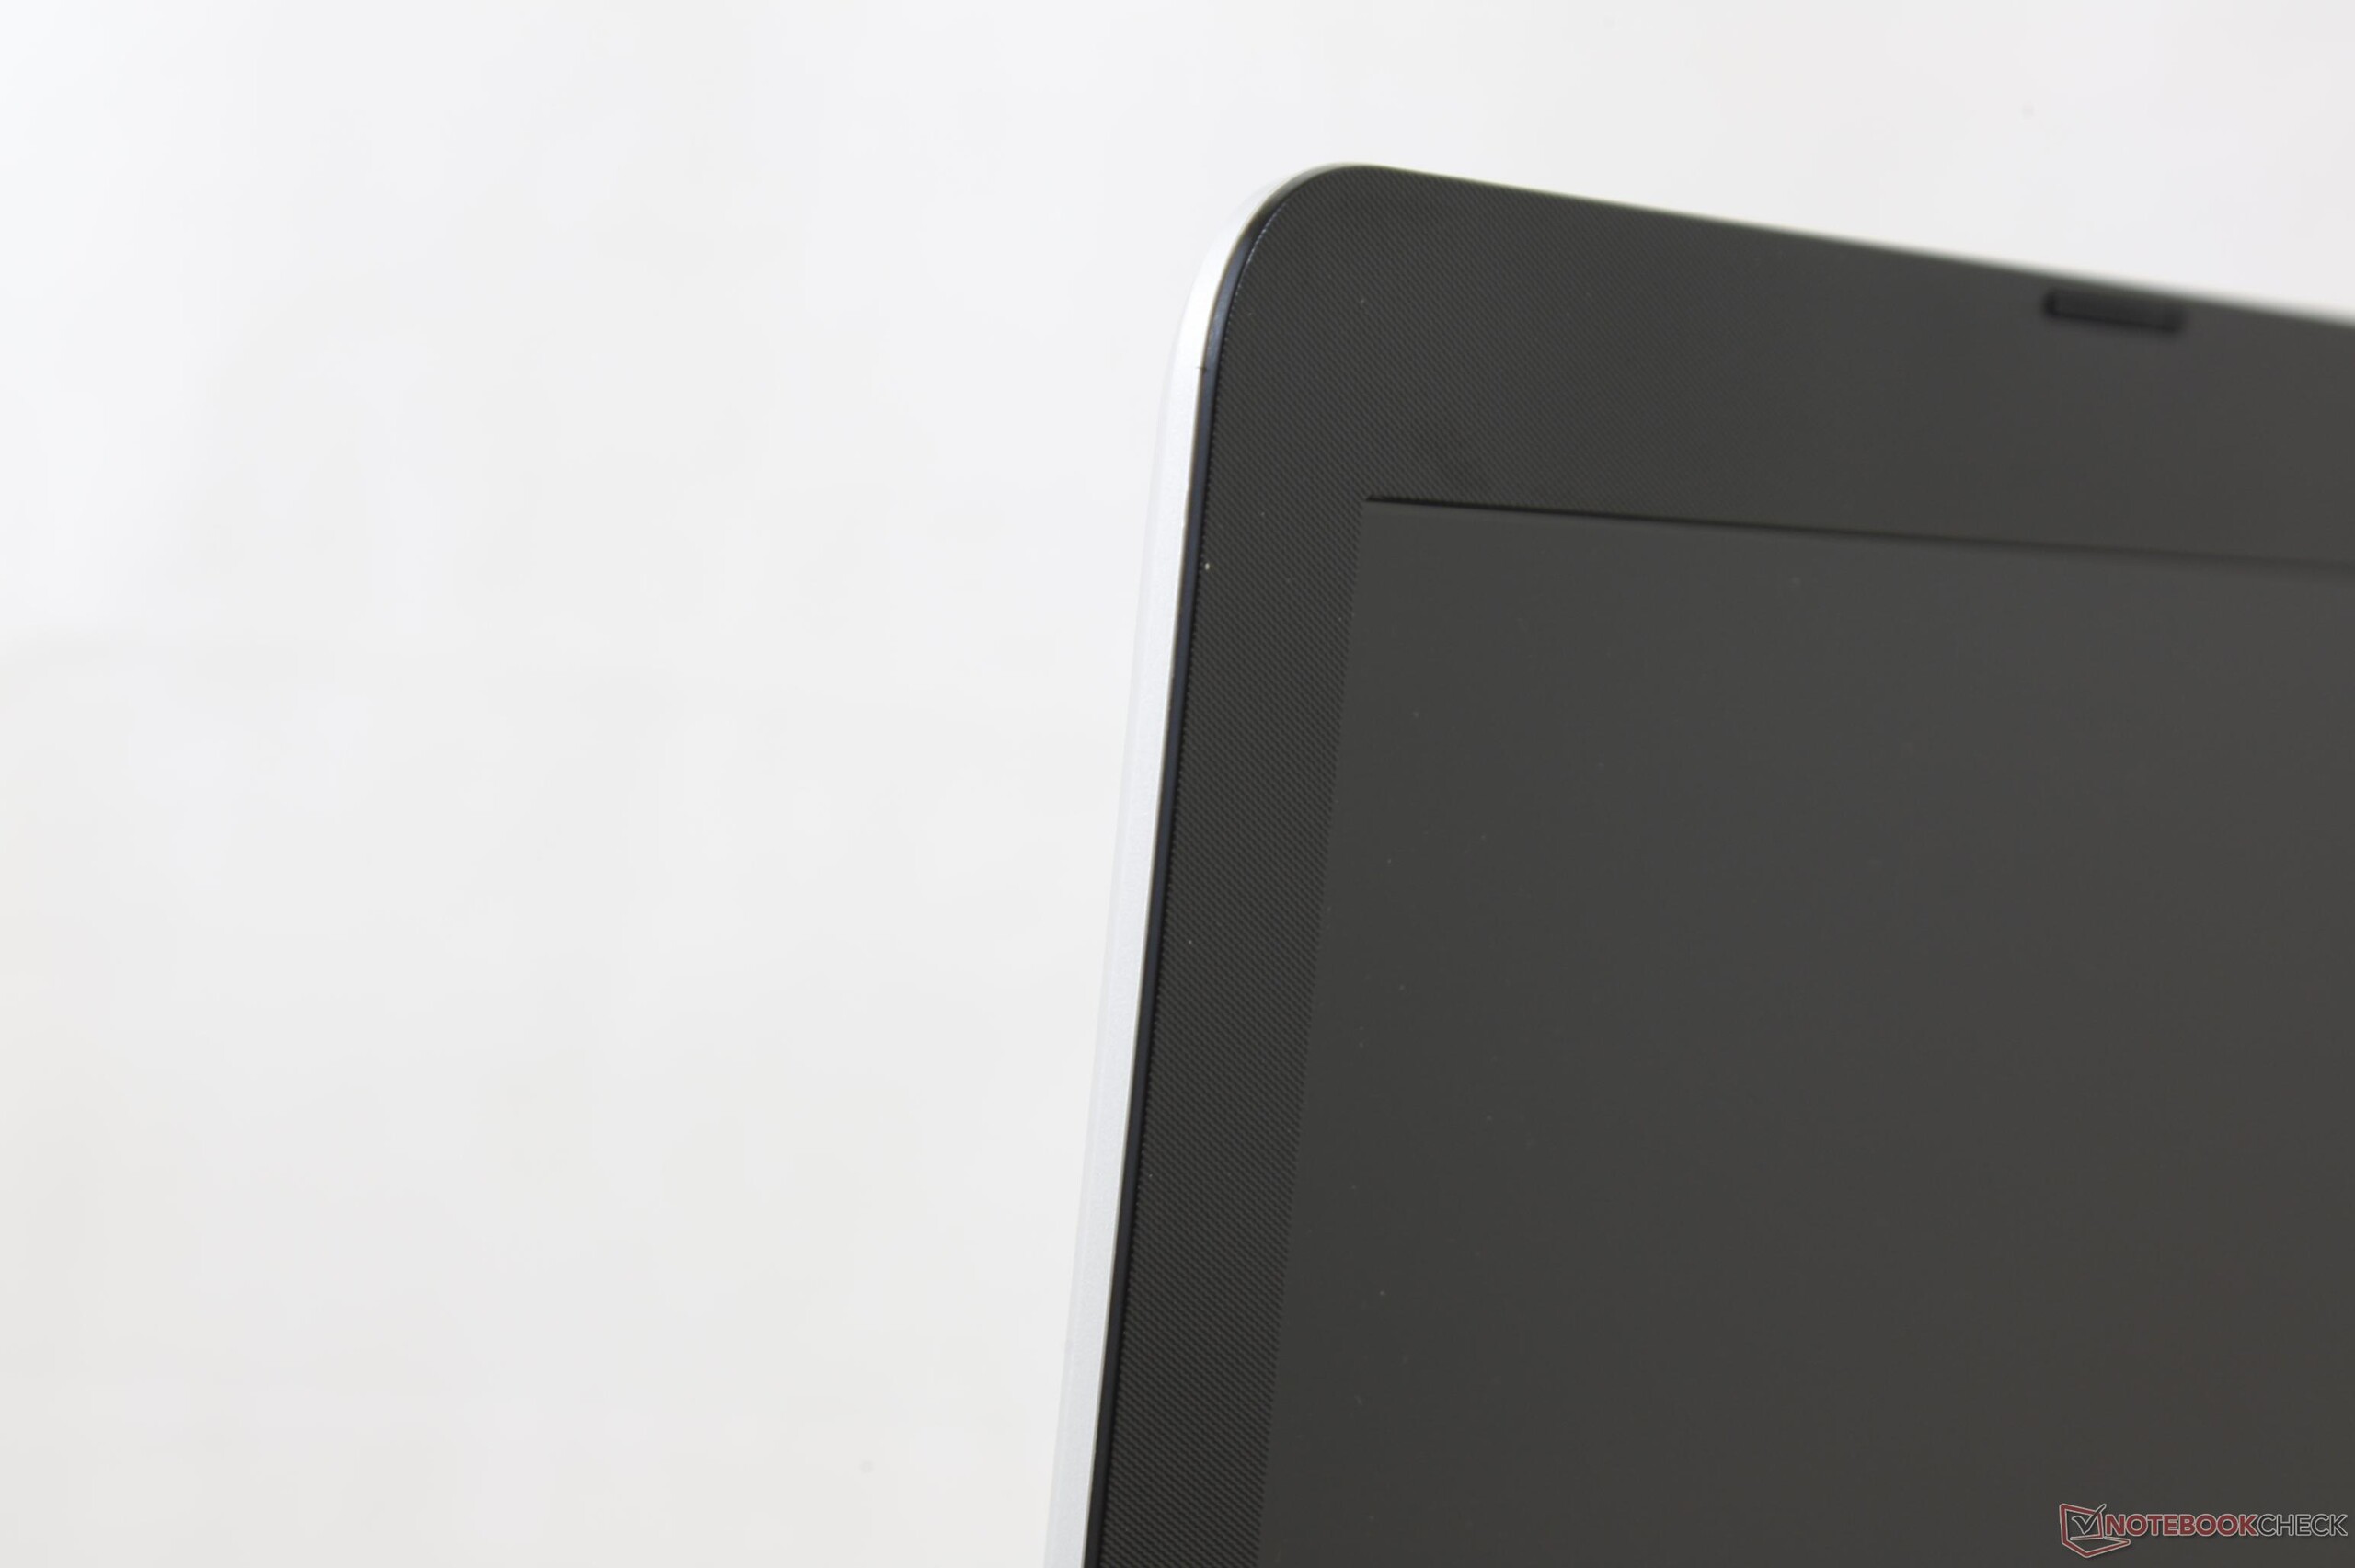
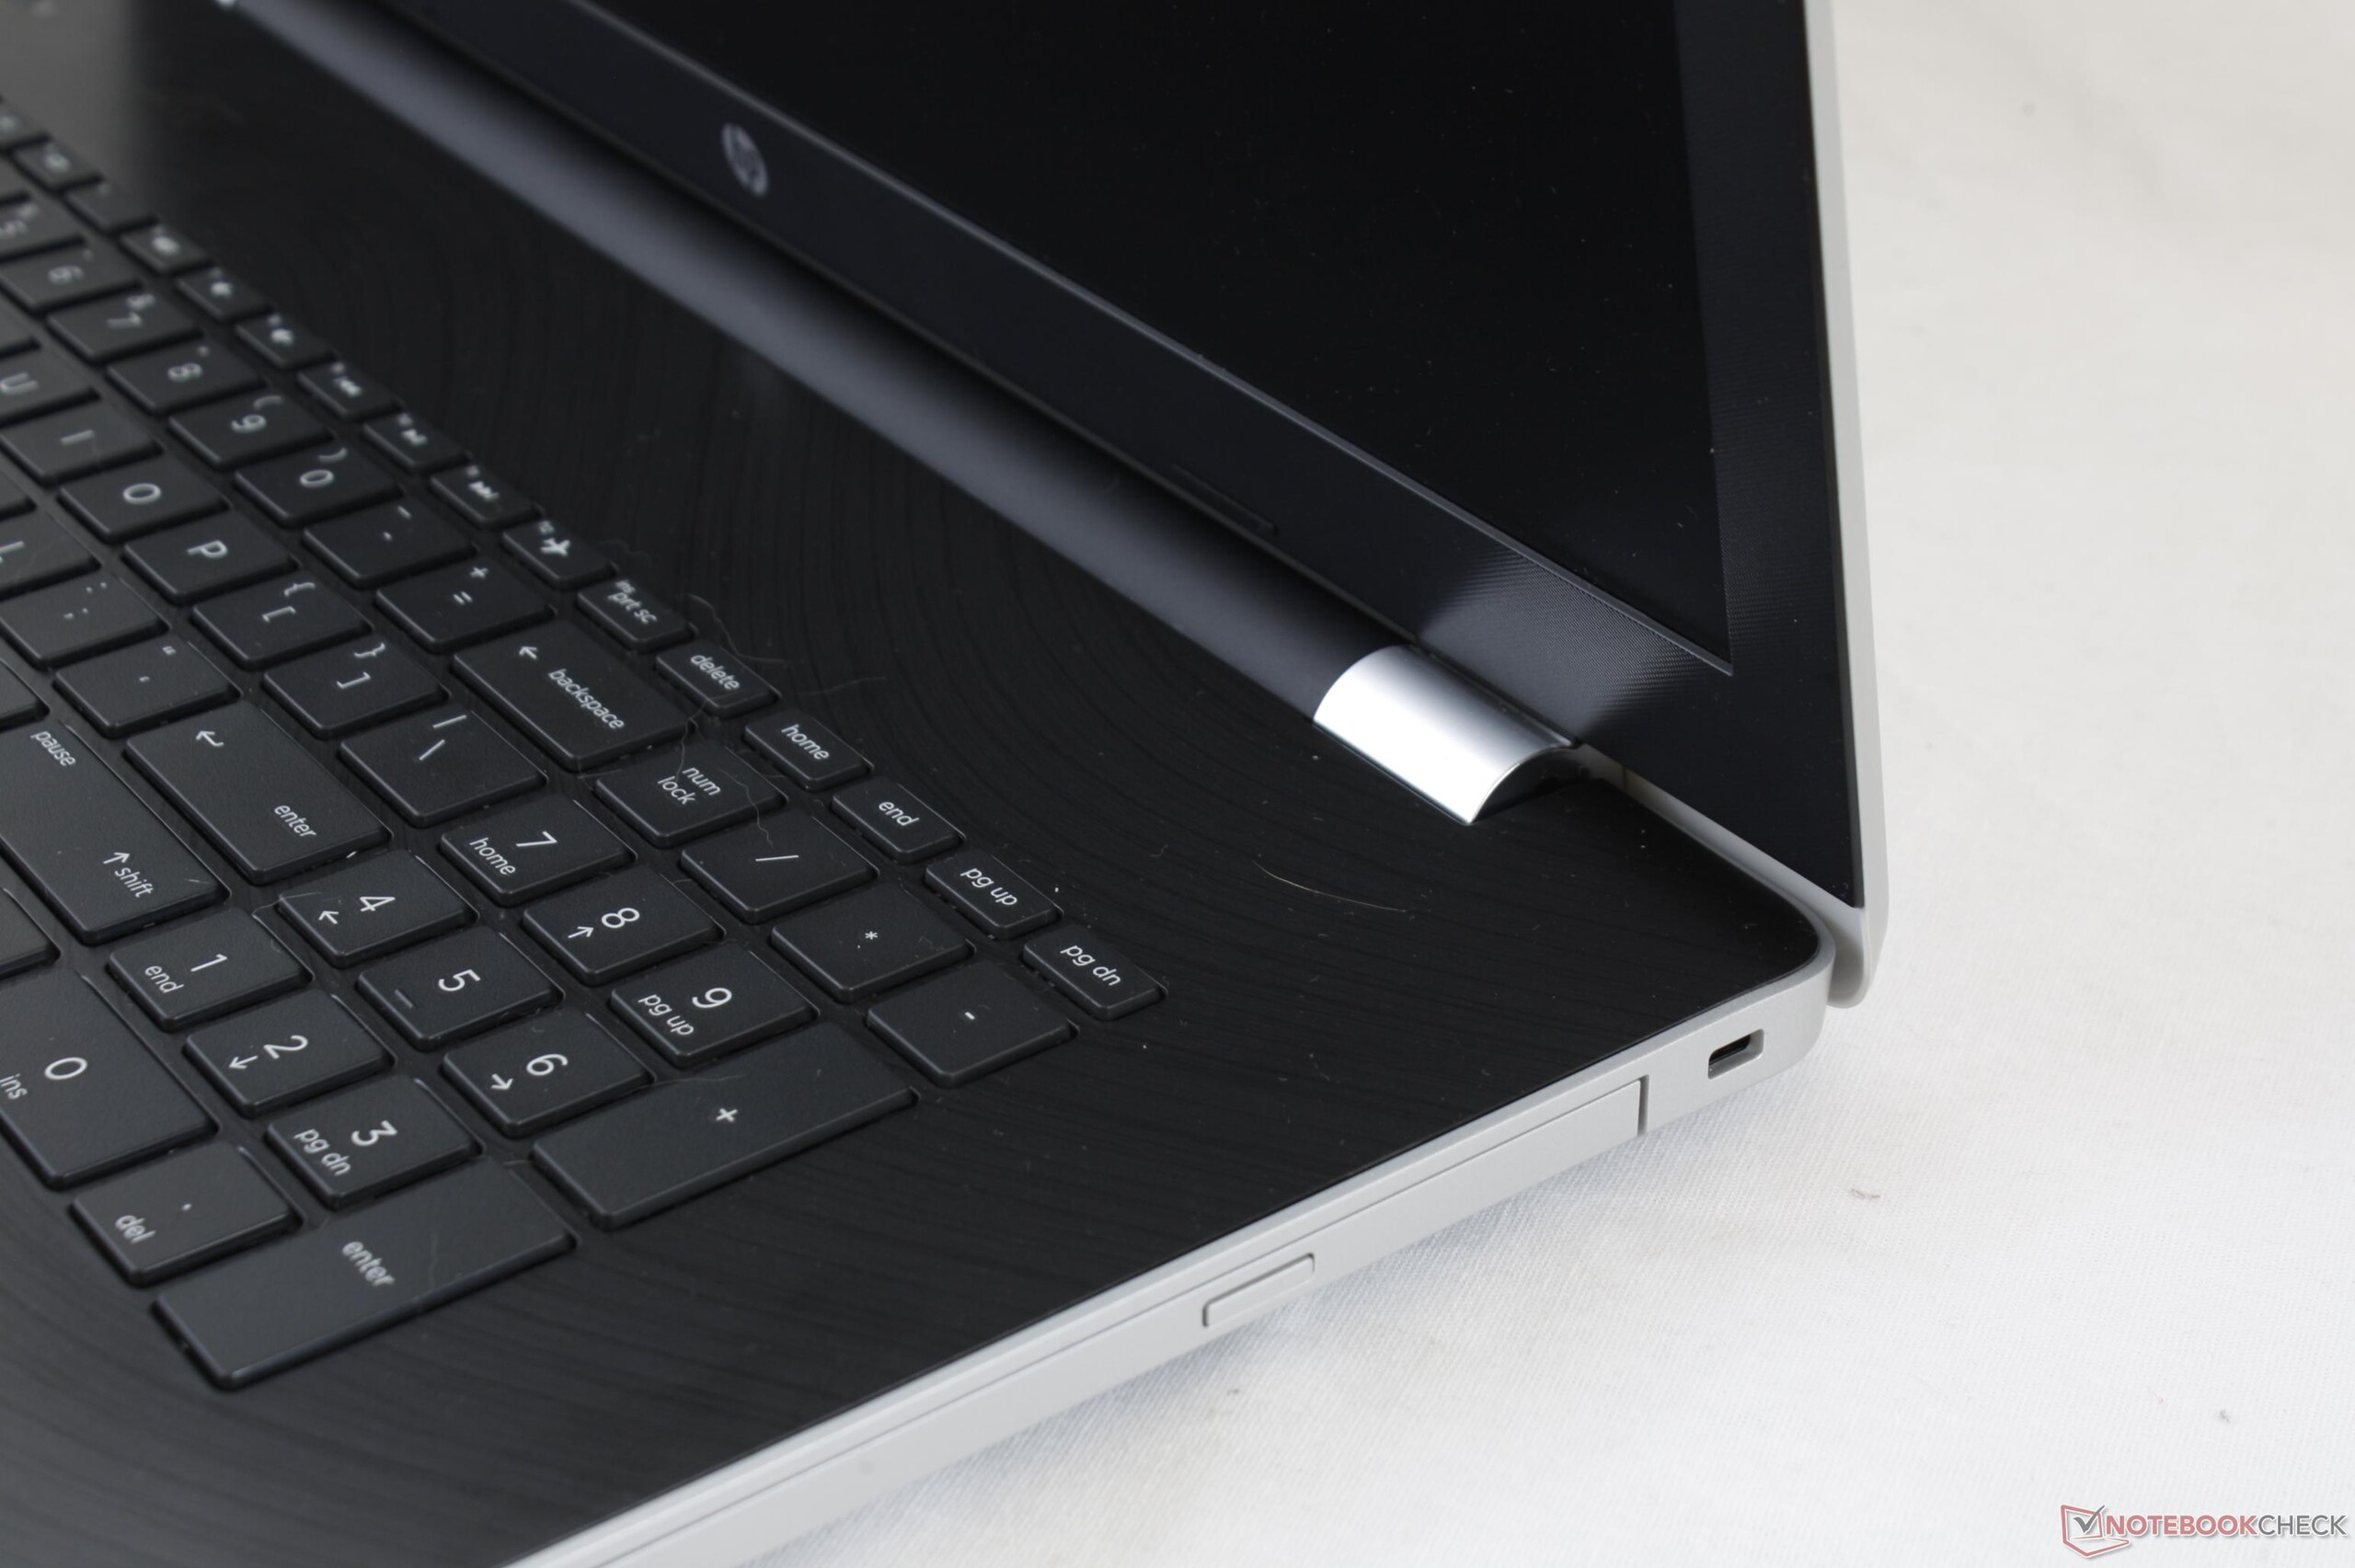
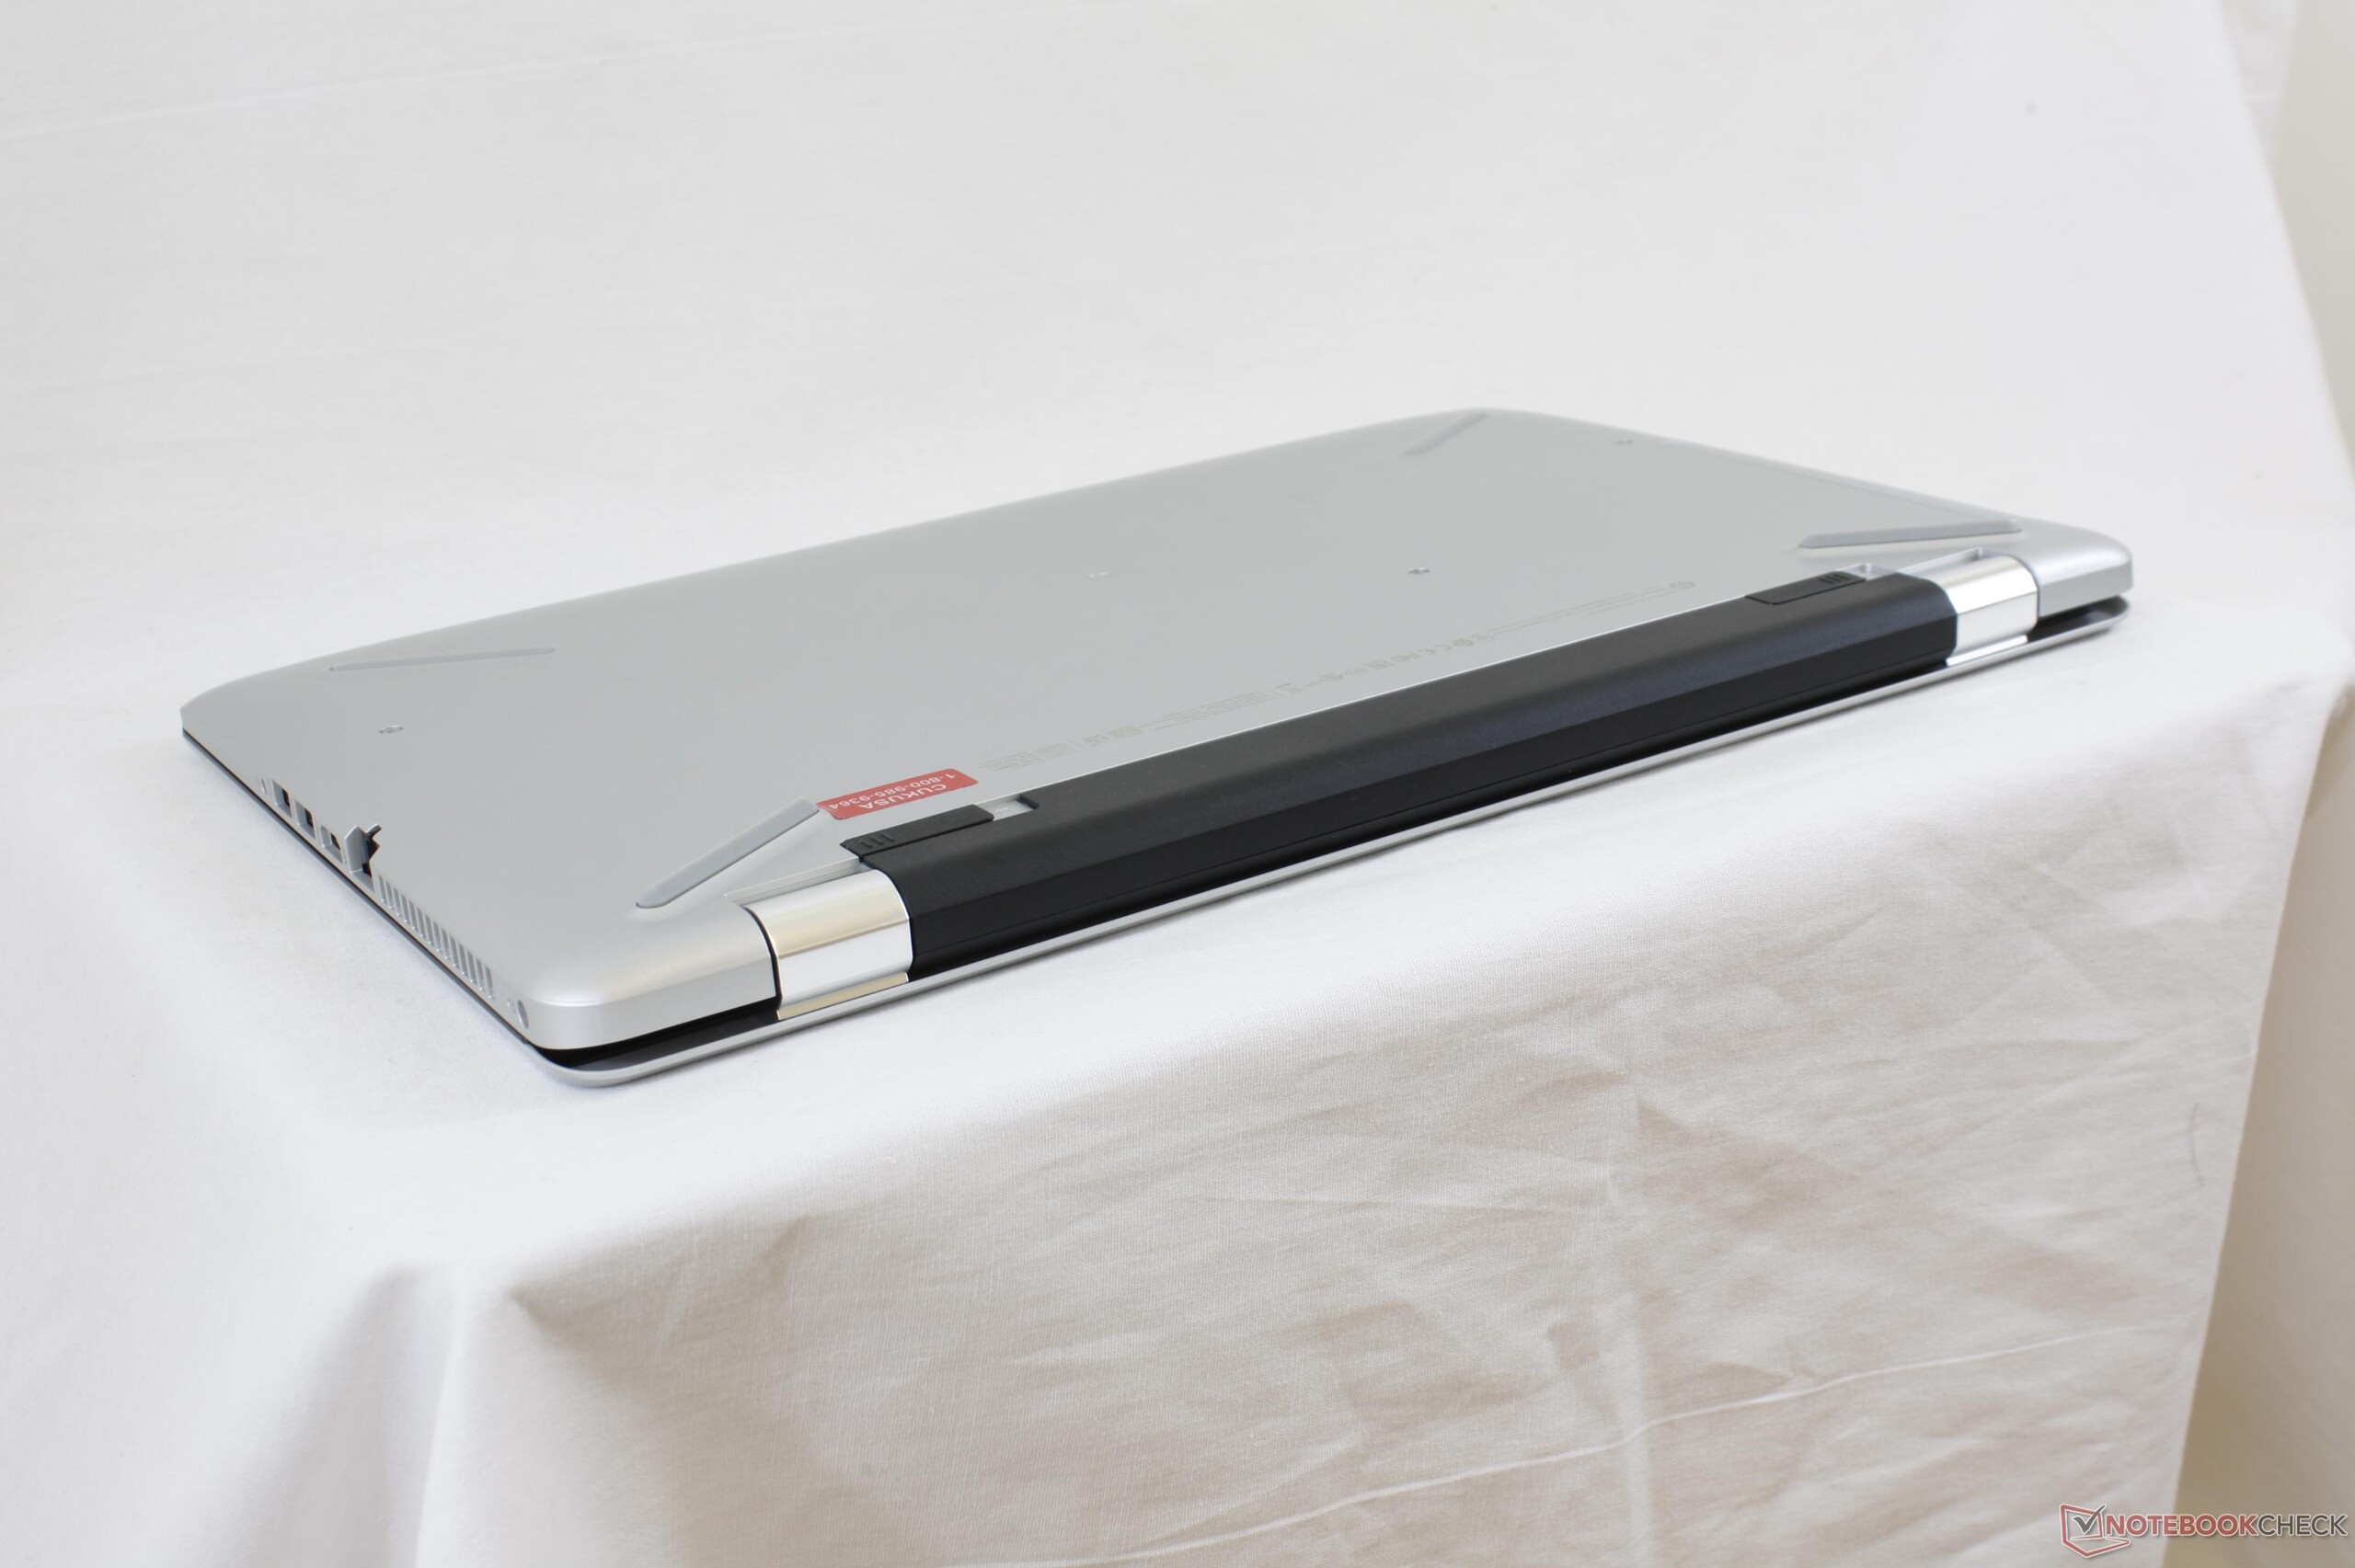
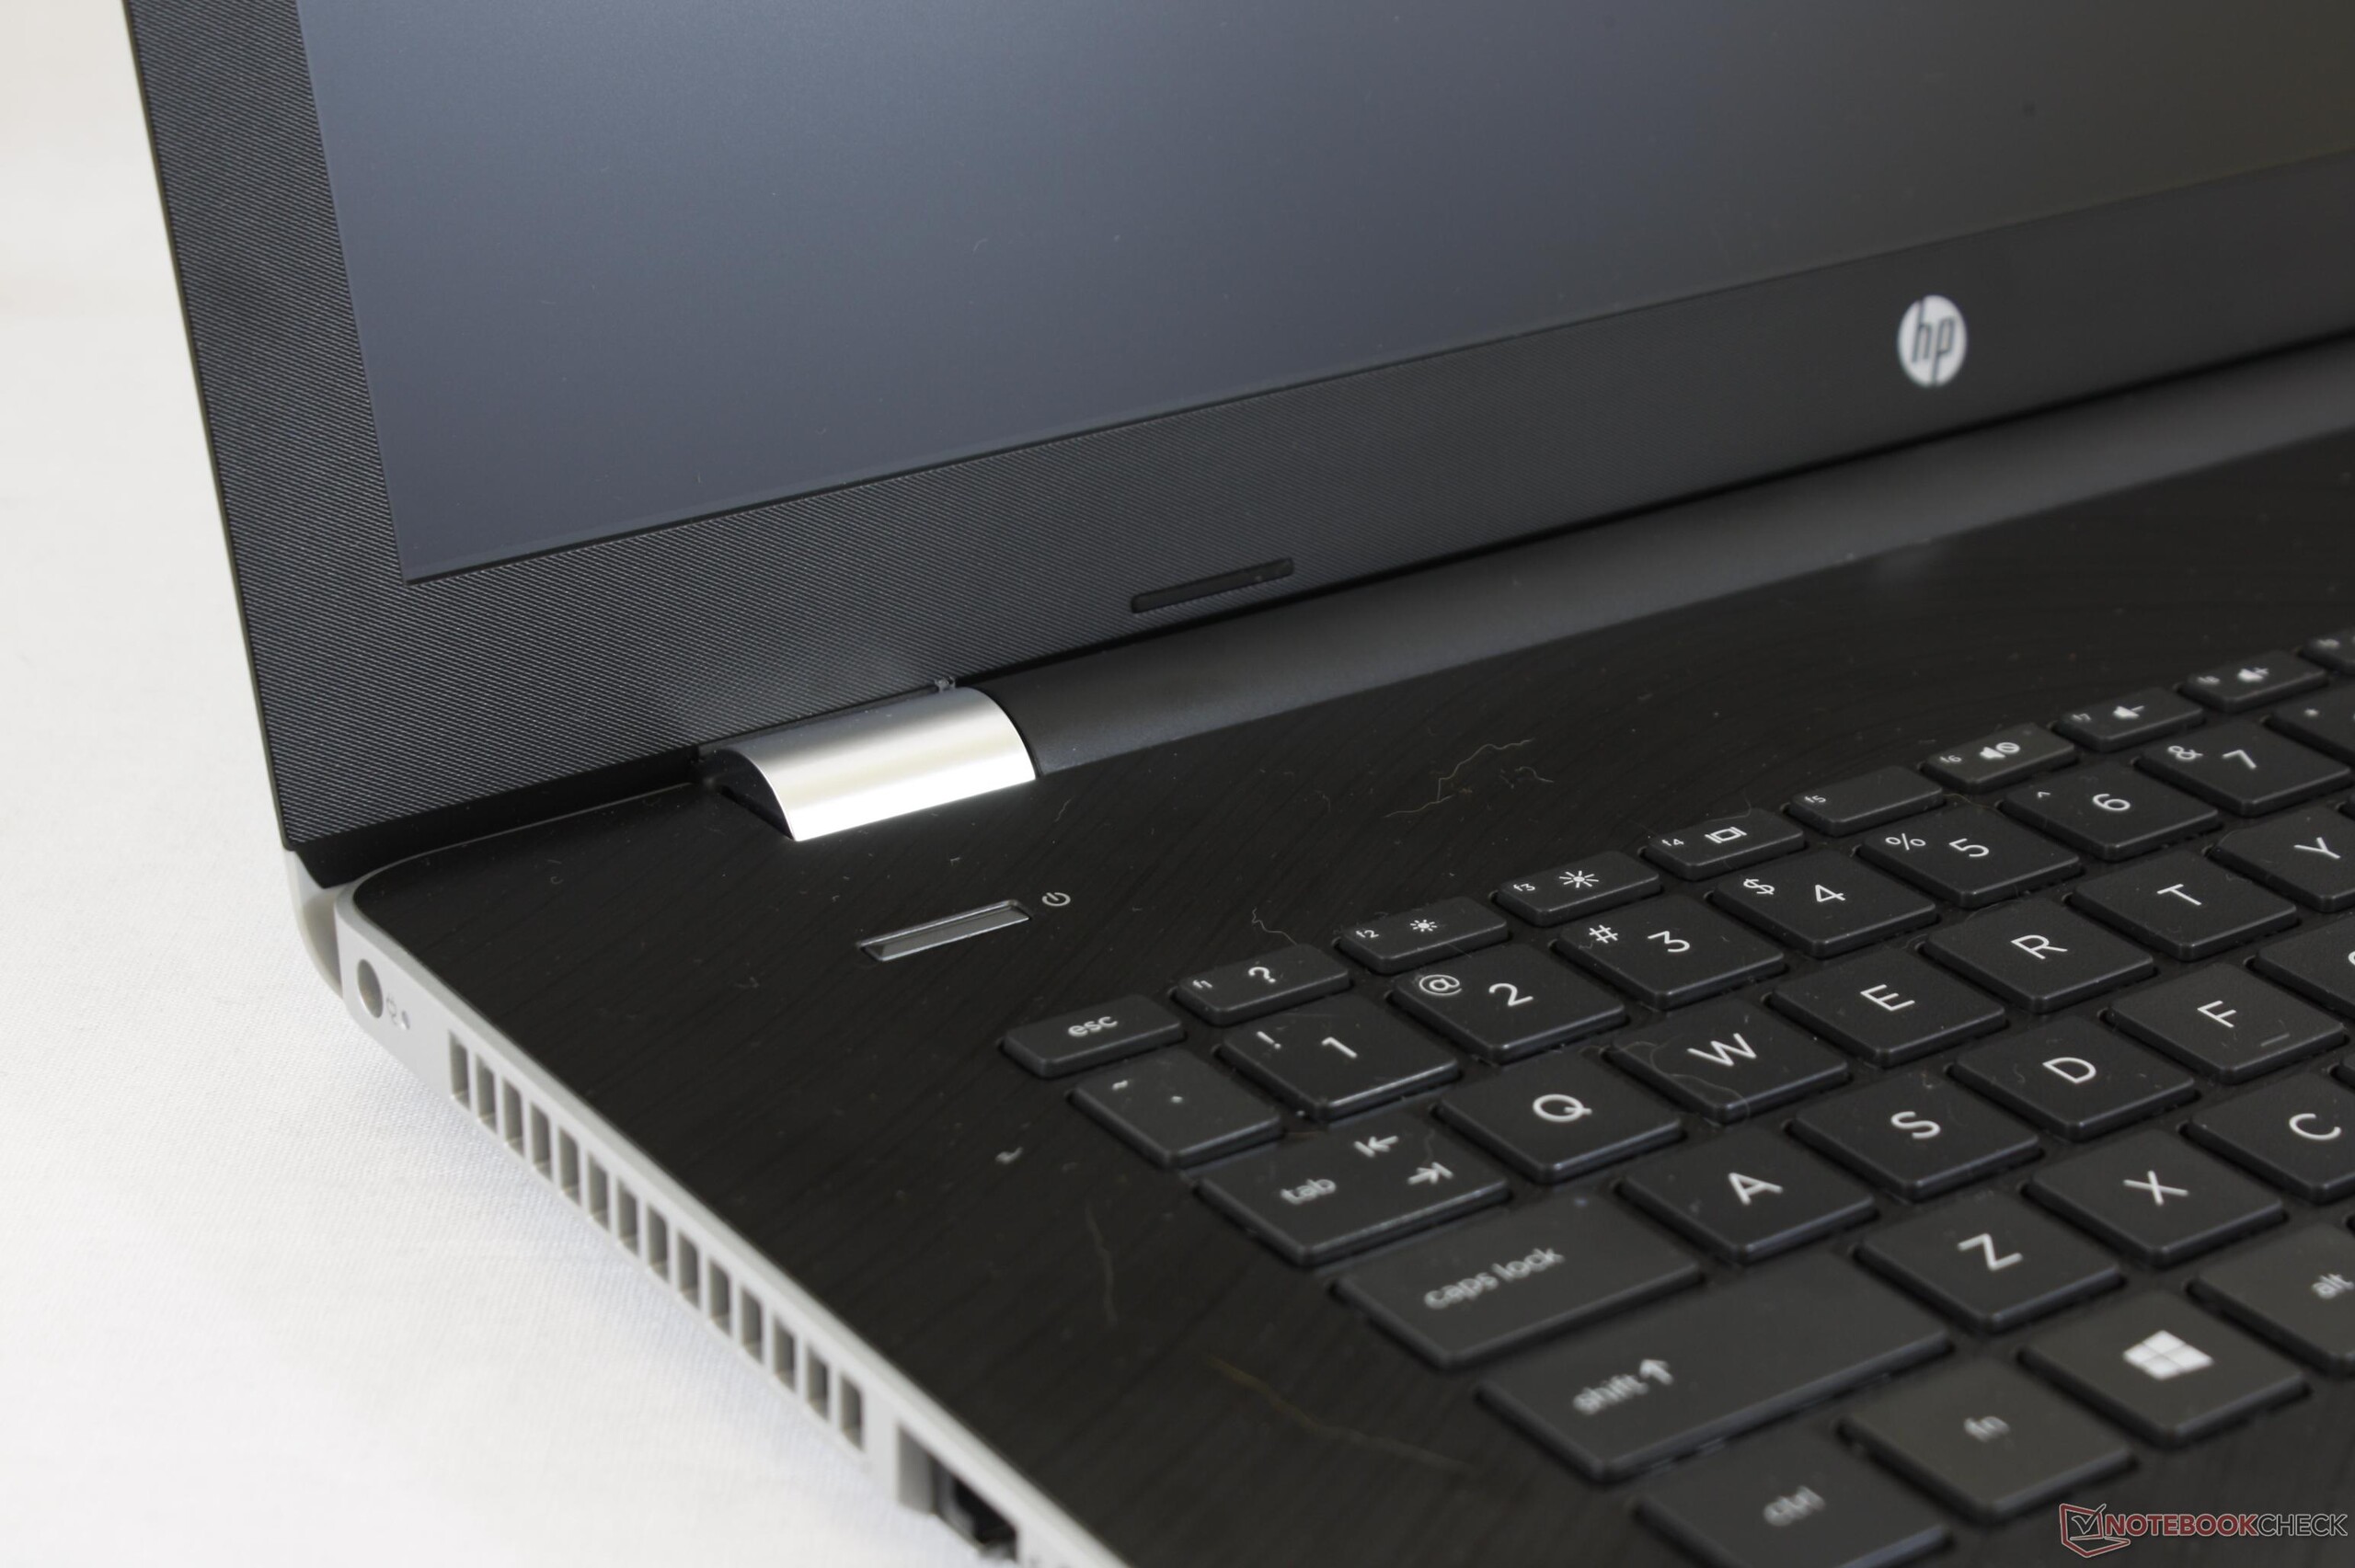
Fuera de nuestras quejas de AMD, el hardware del Pavilion 17z es decente, si no, menos, teniendo en cuenta el bajo precio. Los colores y el contraste son muy buenos para una oferta de bajo presupuesto, pero el resto de cosas sobre el portátil desde el panel granulado a la sensación de las superficies de plástico es un paso por debajo de lo actual.
Te llevas lo que pagas. El Pavilion 17z AMD ciertamente cuesta menos que un equivalente de Intel, pero el golpe al rendimiento y la duración de la batería es demasiado grande para aceptarlo.
Ésta es una versión acortada del análisis original. Puedes leer el análisis completo en inglés aquí.
HP Pavilion 17z 1EX13AV
- 07/14/2017 v6 (old)
Allen Ngo
Price comparison
