Dell Latitude 15 9520 2-en-1 vs. Latitude 9510 2-en-1: Lo nuevo no siempre es mejor
El Latitude 9520 2-en-1 cambia la CPU Intel de 10ª generación del Latitude 9510 2-en-1 por las nuevas opciones de 11ª generación, manteniendo el chasis idéntico. Por lo tanto, recomendamos consultar nuestro análisis existente sobre el Latitude 9510 2-en-1 para saber más sobre nuestras opiniones sobre el chasis, el teclado y otras características físicas del sistema. Este análisis se centrará en las diferencias entre los dos modelos, incluyendo lo que los usuarios pueden esperar en términos de rendimiento.
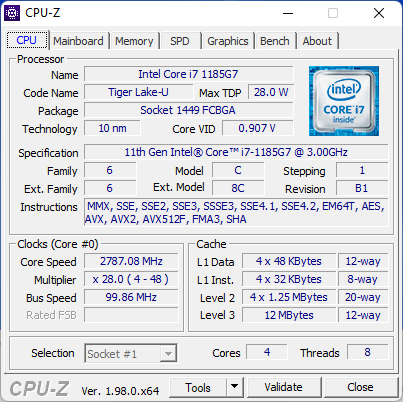
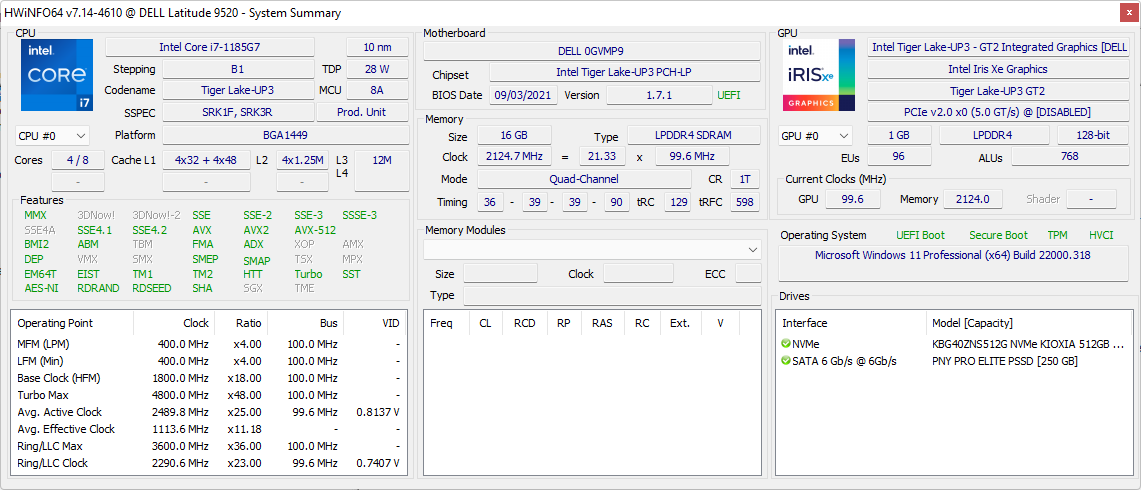
Nuestra unidad de prueba es una configuración de gama alta con la CPU Core i7-1185G7 habilitada para vPro, GPU Iris Xe 96 EUs, 16 GB de RAM y 512 GB de SSD NVMe por unos 2800 dólares. Los SKUs más pequeños con la CPU Core i5-1145G7 y la mitad de la capacidad de almacenamiento están disponibles por unos 2300 dólares. Hay que tener en cuenta que todas las SKUs 2 en 1 vienen con el mismo panel FHD de 15 pulgadas con sensor de proximidad y obturador electrónico. Como alternativa, los usuarios también pueden comprar el Latitude 9520 clamshell si el factor de forma 2 en 1 no es deseable.
El Latitude 9520 2-en-1 compite con otros convertibles empresariales de gama alta como el MSI Summit E13 Flip, Microsoft Surface Book, HP EliteBook x360 1040 G7, o el Lenovo ThinkPad x13 Yoga.
Más opiniones de Dell:
Potential Competitors in Comparison
Valoración | Fecha | Modelo | Peso | Altura | Tamaño | Resolución | Precio |
|---|---|---|---|---|---|---|---|
| 89.2 % v7 (old) | 11/2021 | Dell Latitude 15 9520 2-in-1 i7-1185G7, Iris Xe G7 96EUs | 1.7 kg | 13.99 mm | 15.00" | 1920x1080 | |
| 88.6 % v7 (old) | 07/2020 | Dell Latitude 9510 2-in-1 i7-10810U, UHD Graphics 620 | 1.7 kg | 13.99 mm | 15.00" | 1920x1080 | |
| 86.1 % v7 (old) | 08/2021 | HP EliteBook 850 G8 3C7Z8EA i7-1165G7, Iris Xe G7 96EUs | 1.8 kg | 19 mm | 15.60" | 1920x1080 | |
| 85.1 % v7 (old) | 07/2021 | Lenovo ThinkPad L15 G2 AMD R5 5600U, Vega 7 | 1.9 kg | 21 mm | 15.60" | 1920x1080 | |
| 81.2 % v7 (old) | 05/2021 | MSI Summit B15 A11M i7-1165G7, Iris Xe G7 96EUs | 1.5 kg | 16.9 mm | 15.60" | 1920x1080 | |
| 84.9 % v7 (old) | 04/2021 | Microsoft Surface Laptop 4 15 AMD TFF_00028 R7 4980U, Vega 8 | 1.6 kg | 14.7 mm | 15.00" | 2496x1664 |
Caso
Aunque el chasis es idéntico al del modelo del año pasado, las bisagras de nuestra unidad de prueba Latitude 9520 2-en-1 se sienten más débiles en los ángulos entre 60 y 90 grados. Lo ideal es que la rigidez de las bisagras sea uniforme en todos los ángulos. Recomendamos comprobar las bisagras después de la compra para ver si hay alguna anomalía.
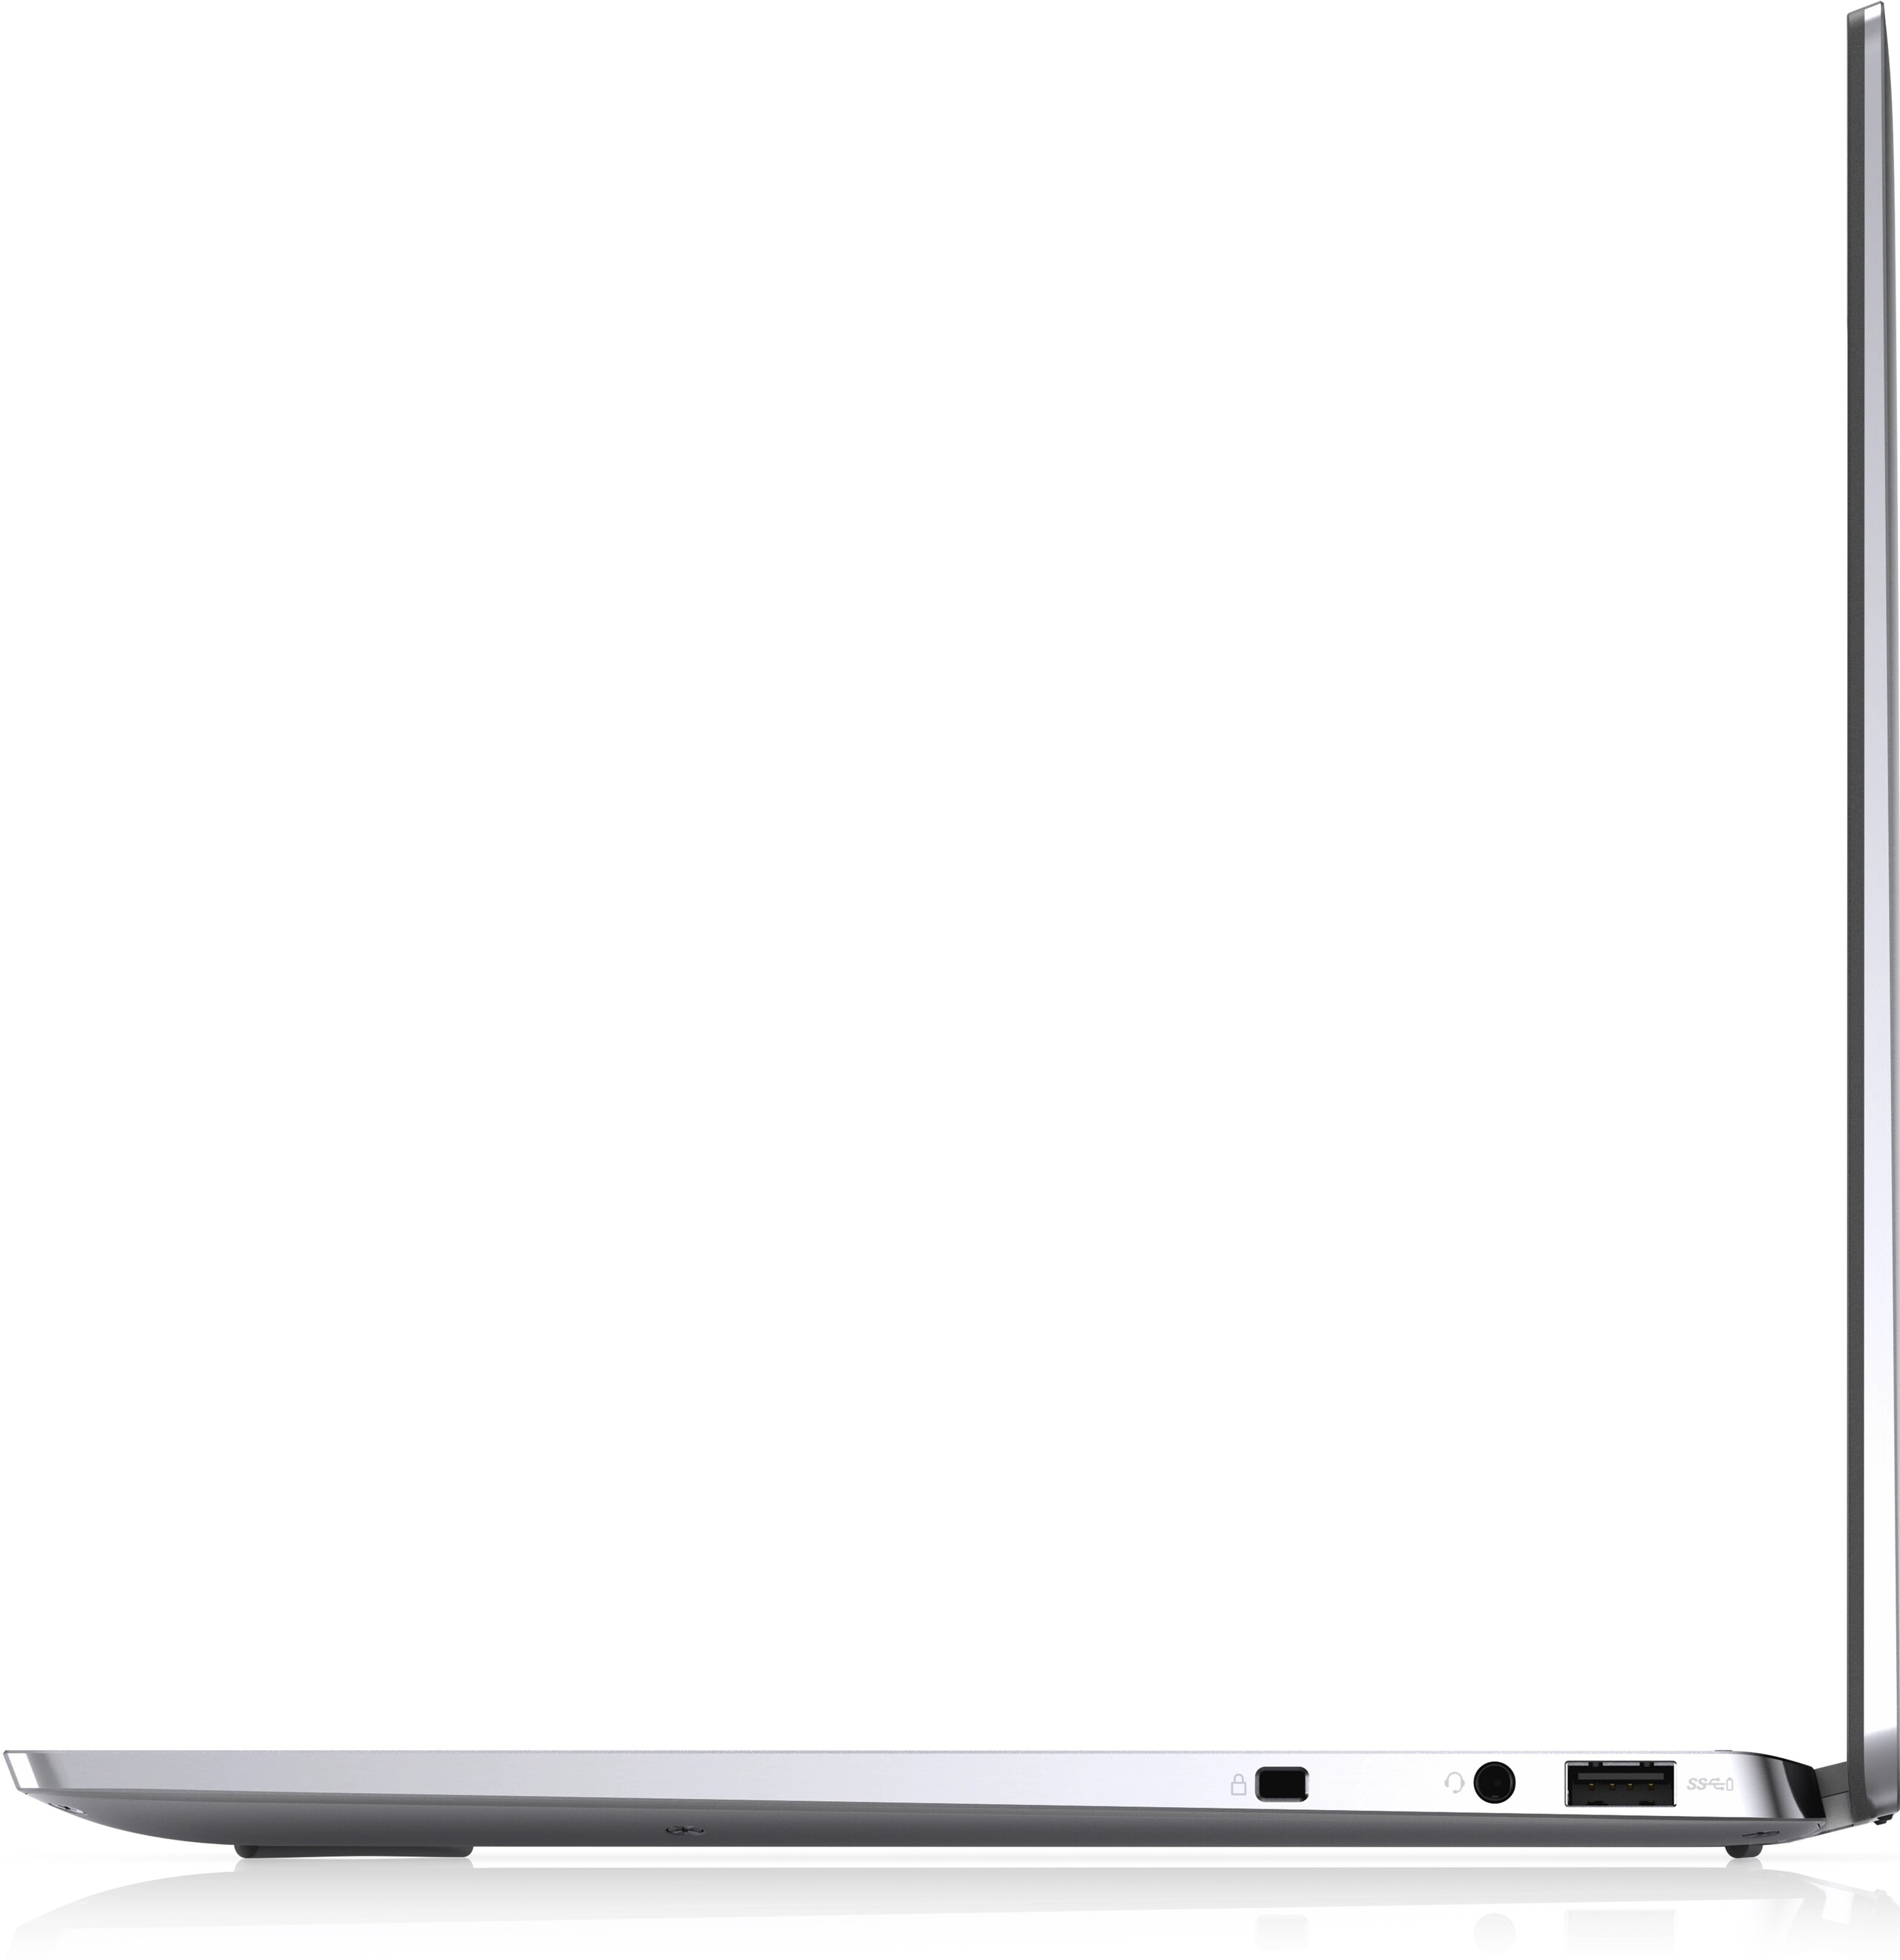
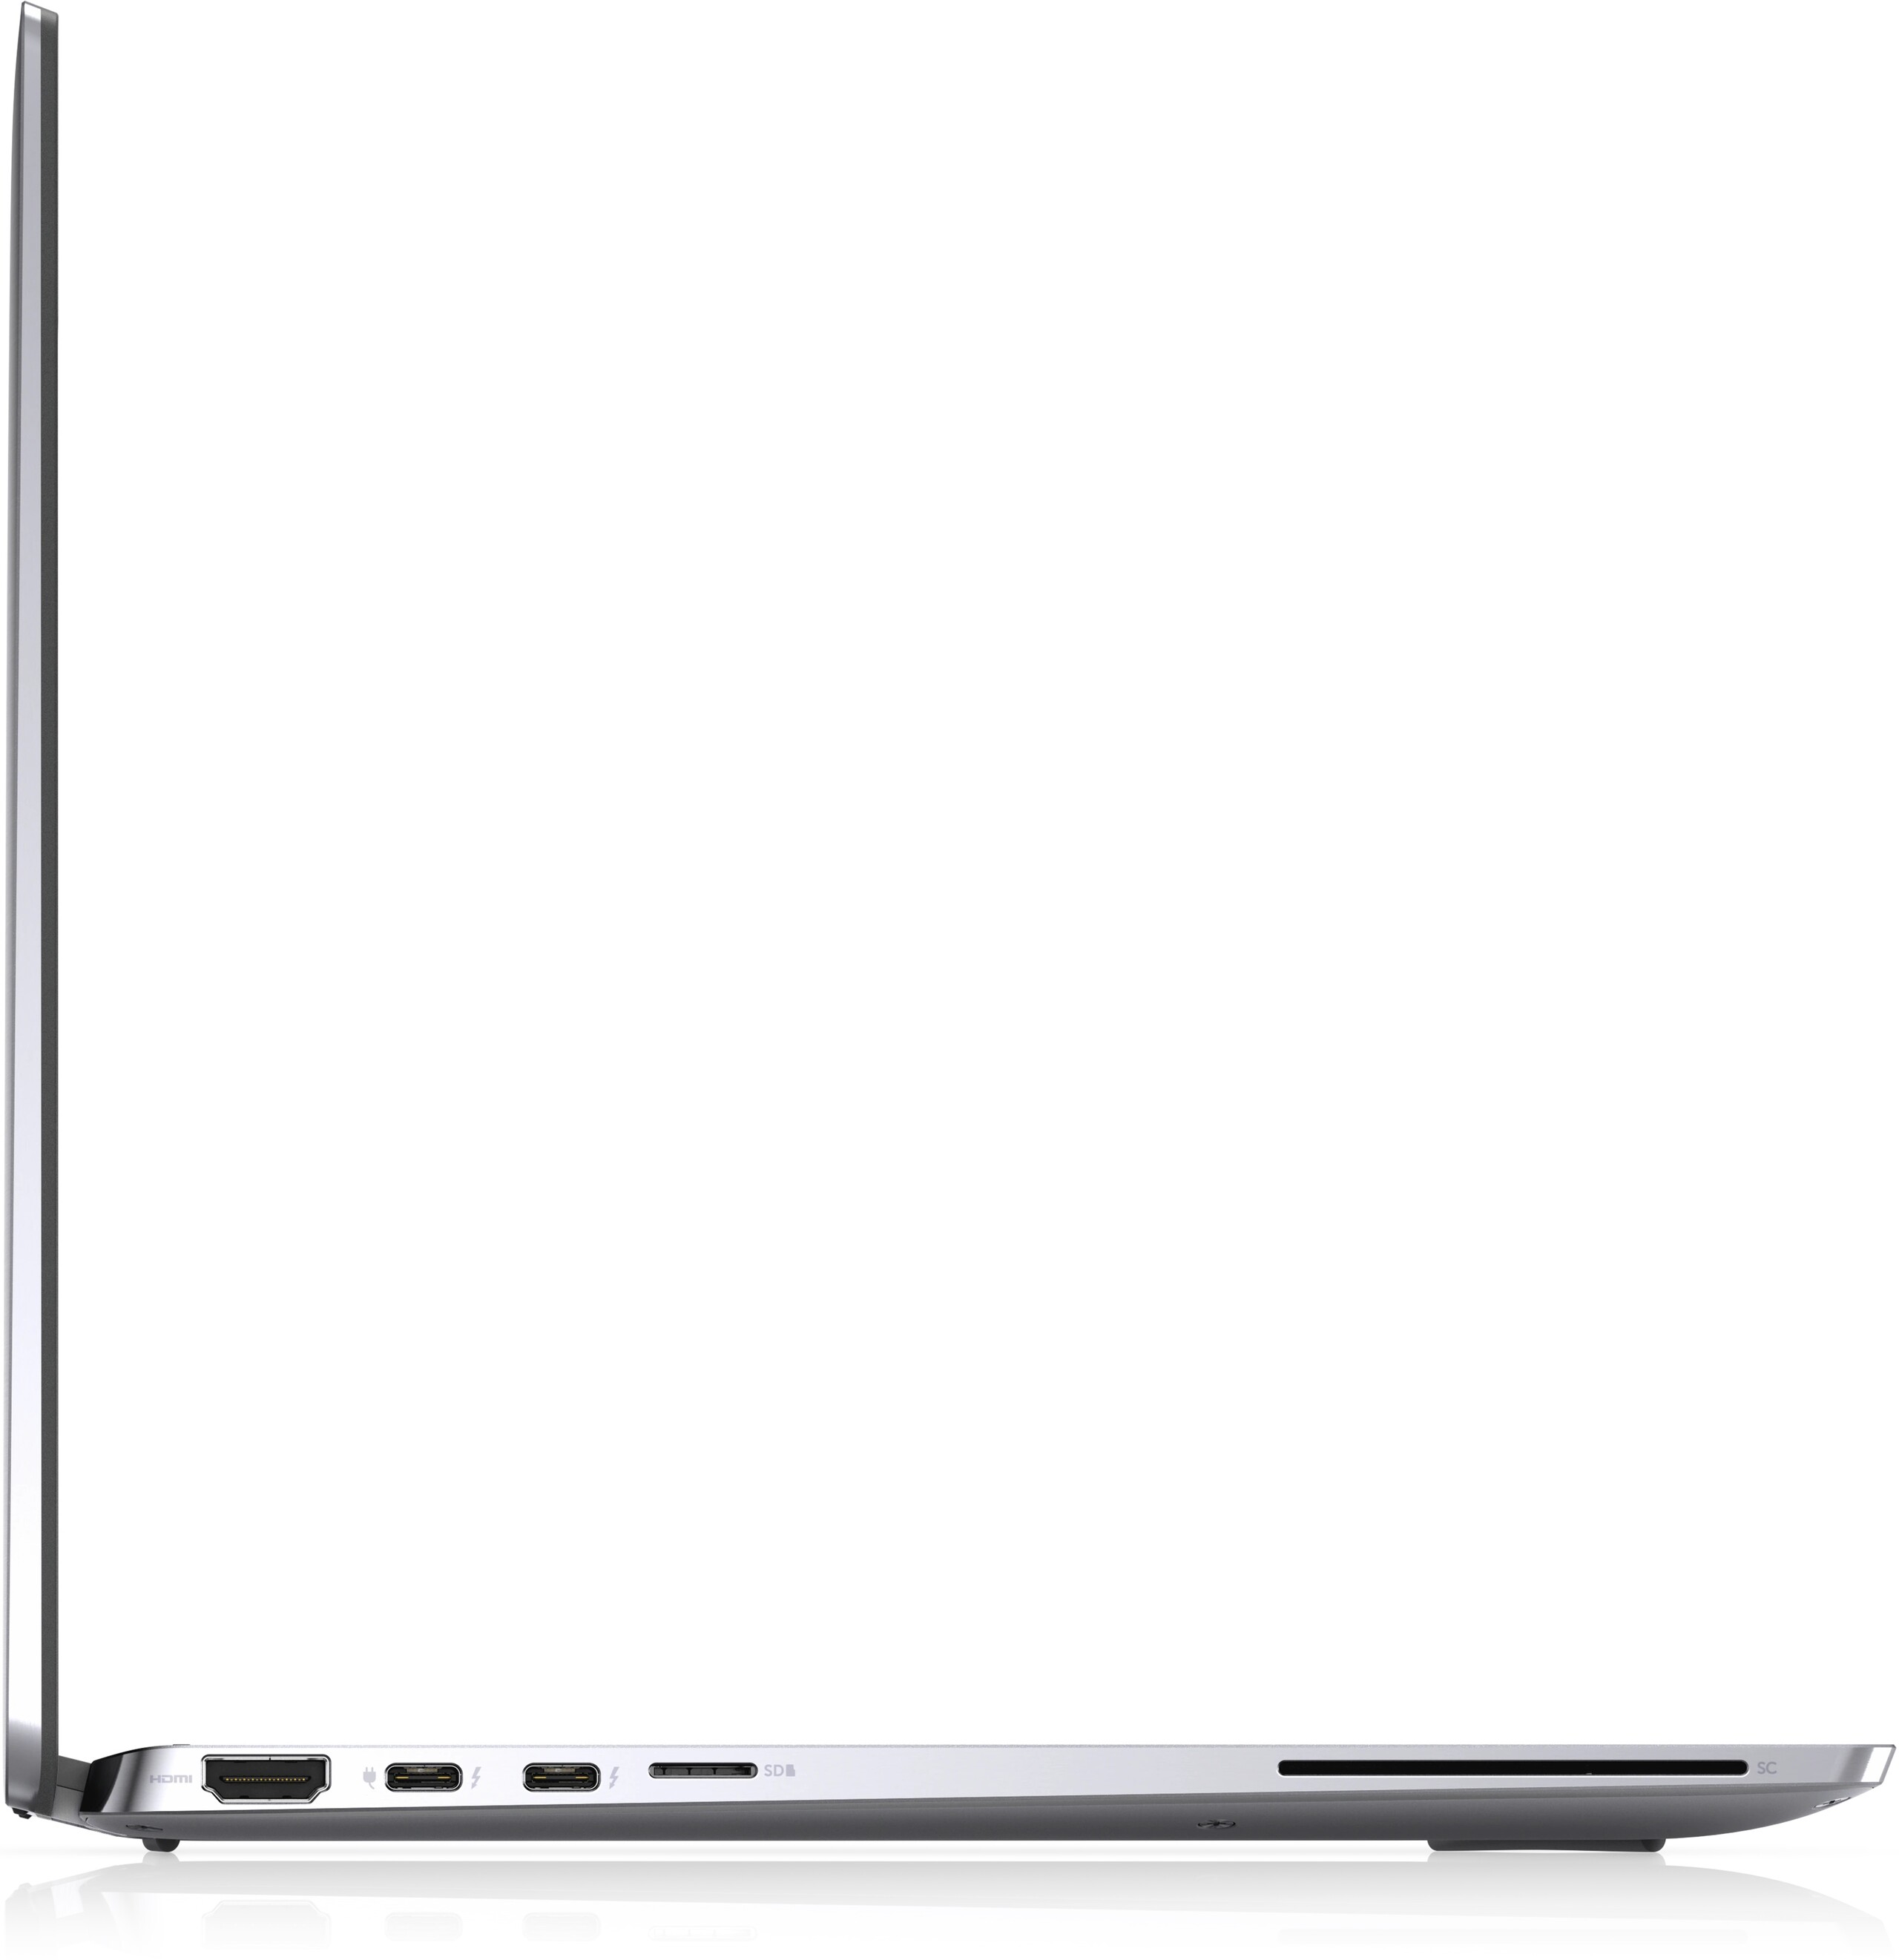
Conectividad
Los puertos Thunderbolt 3 del Latitude 9510 se han actualizado a Thunderbolt 4 en nuestro Latitude 9520. Para la mayoría de los usuarios, sin embargo, la actualización no tendrá prácticamente ninguna importancia, a menos que planees usar GPUs externas. Todos los demás puertos son idénticos entre los dos modelos.
Lector de tarjetas SD
| SD Card Reader | |
| average JPG Copy Test (av. of 3 runs) | |
| Dell Latitude 9510 2-in-1 (Toshiba Exceria Pro M501 64 GB UHS-II) | |
| Dell Latitude 15 9520 2-in-1 (AV Pro V60) | |
| MSI Summit B15 A11M (AV PRO microSD 128 GB V60) | |
| Lenovo ThinkPad L15 G2 AMD (AV Pro V60) | |
| maximum AS SSD Seq Read Test (1GB) | |
| MSI Summit B15 A11M (AV PRO microSD 128 GB V60) | |
| Dell Latitude 9510 2-in-1 (Toshiba Exceria Pro M501 64 GB UHS-II) | |
| Dell Latitude 15 9520 2-in-1 (AV Pro V60) | |
| Lenovo ThinkPad L15 G2 AMD (AV Pro V60) | |
Comunicación
Cámara web


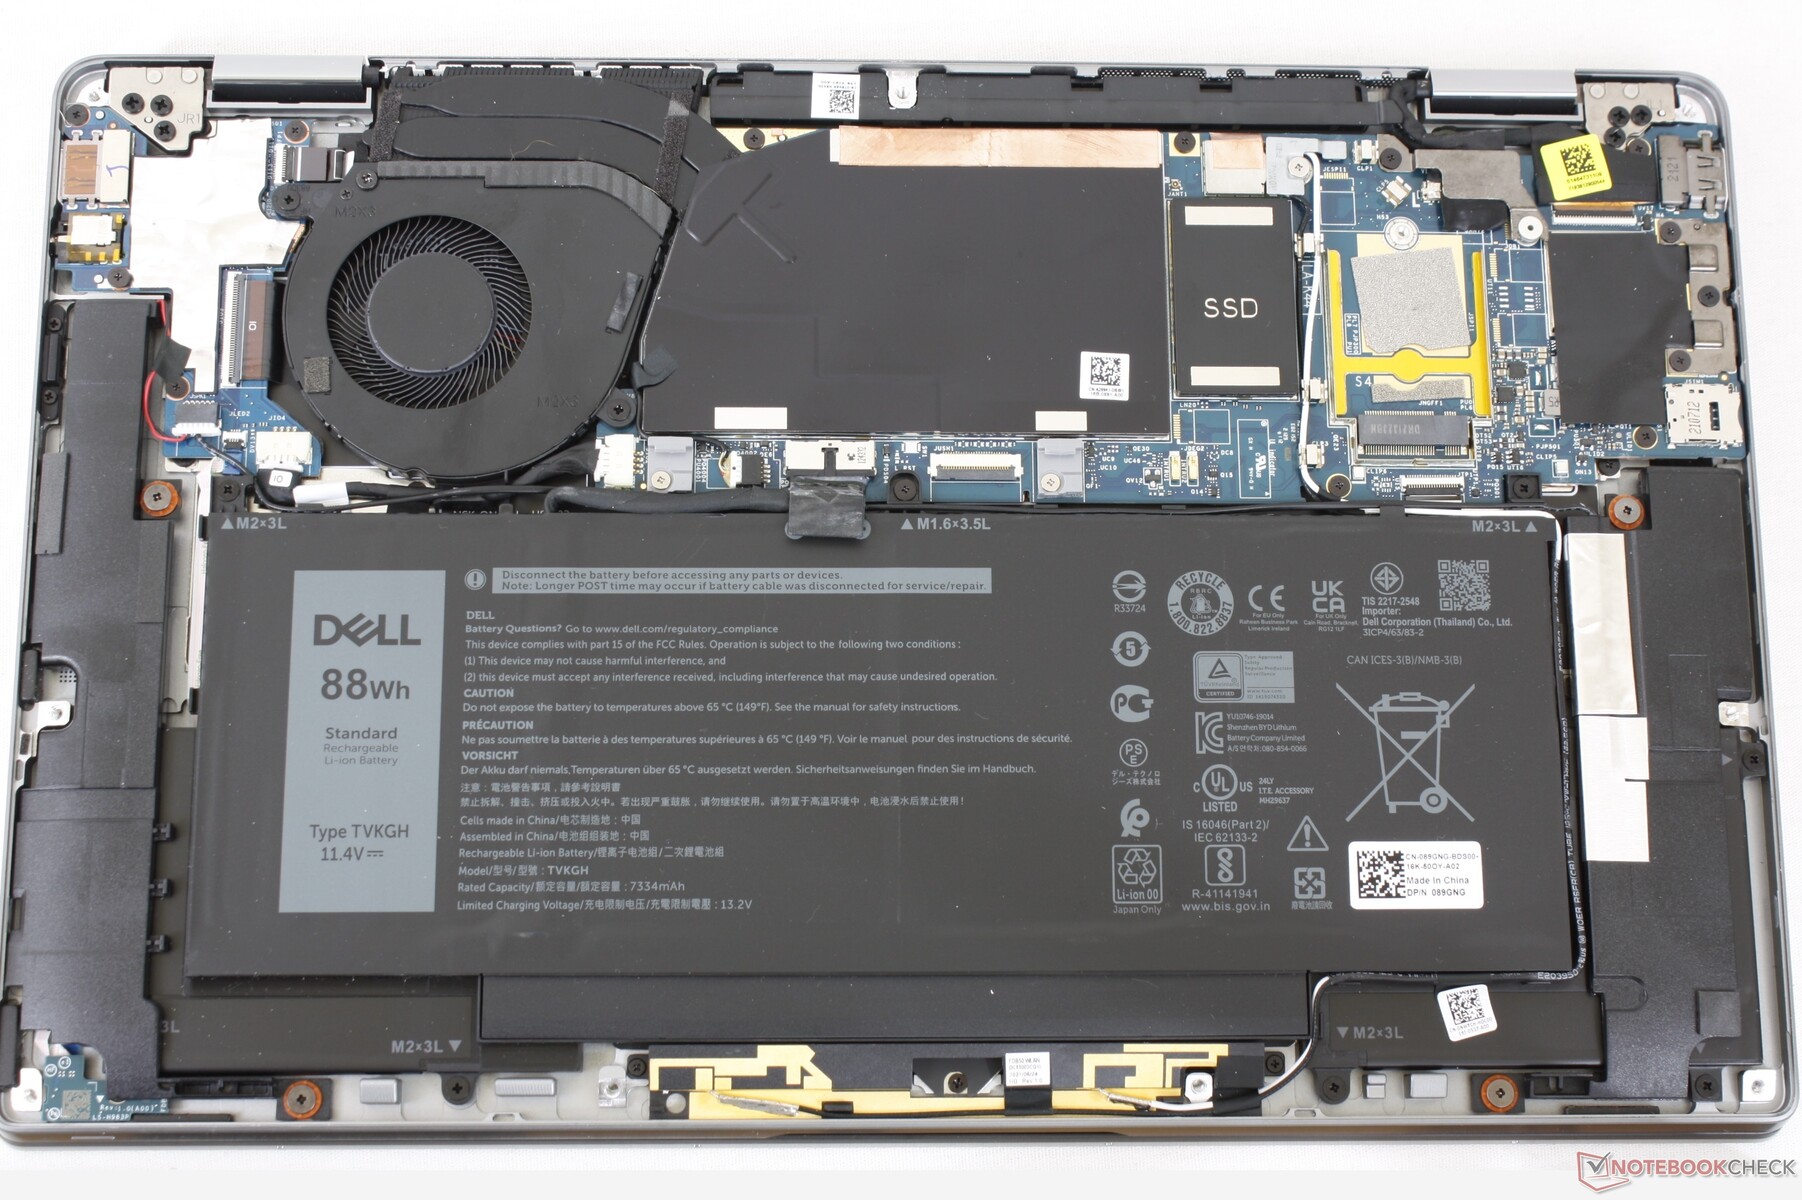
Mantenimiento
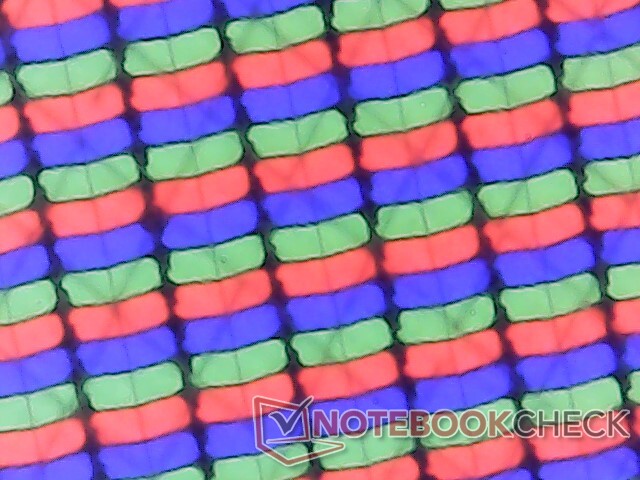
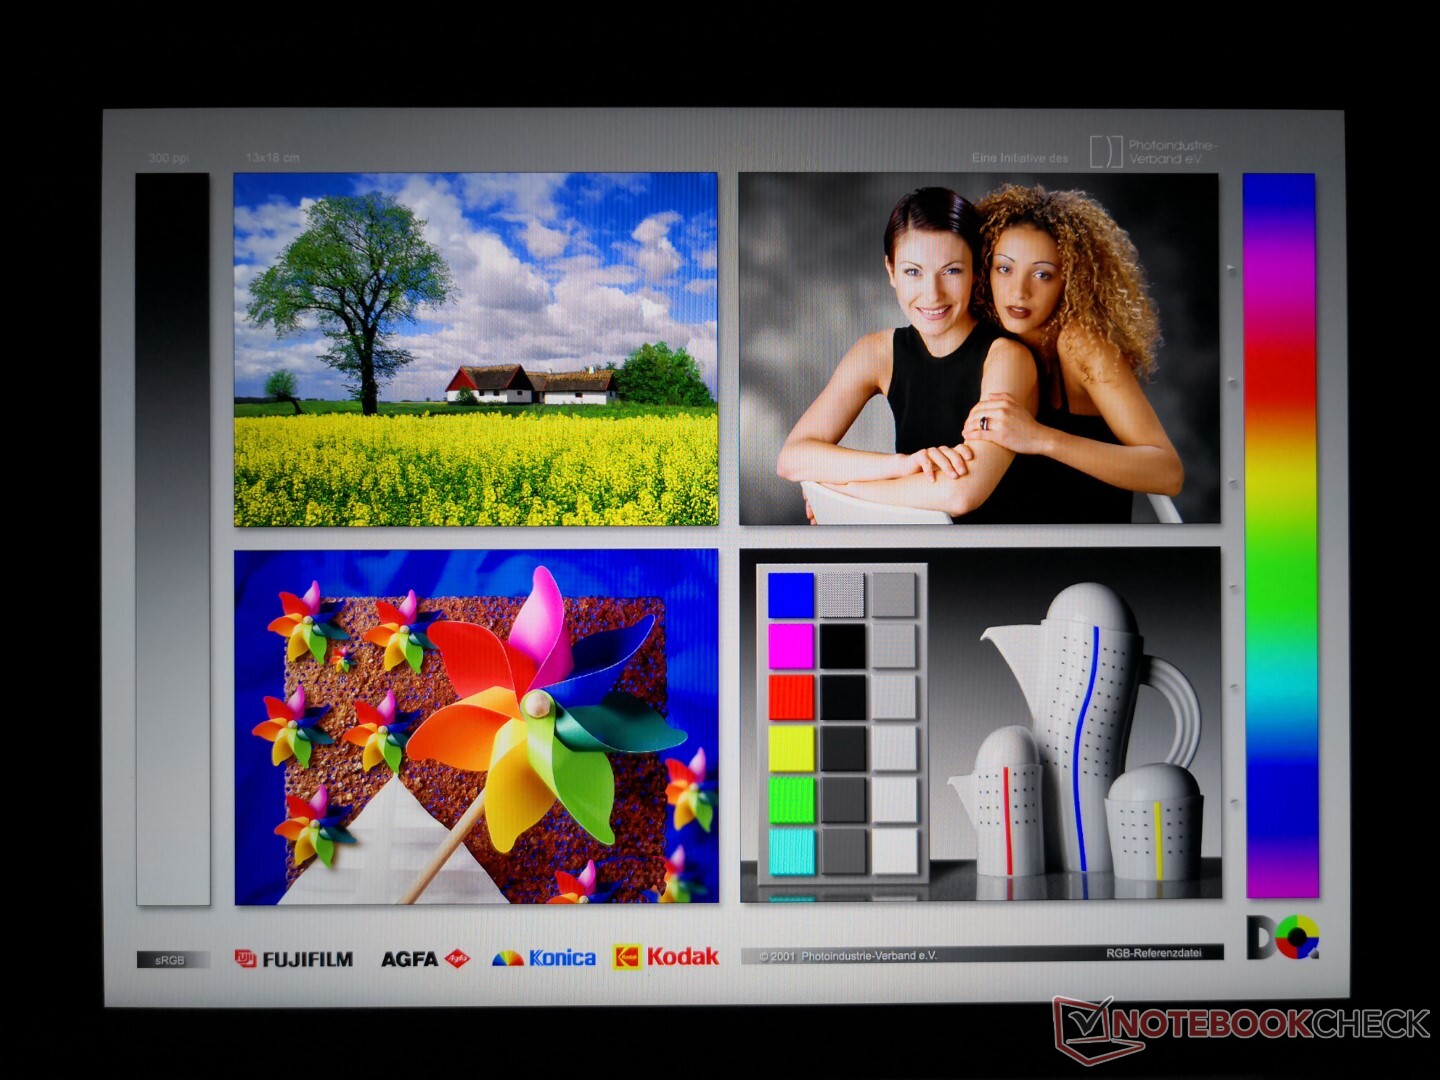
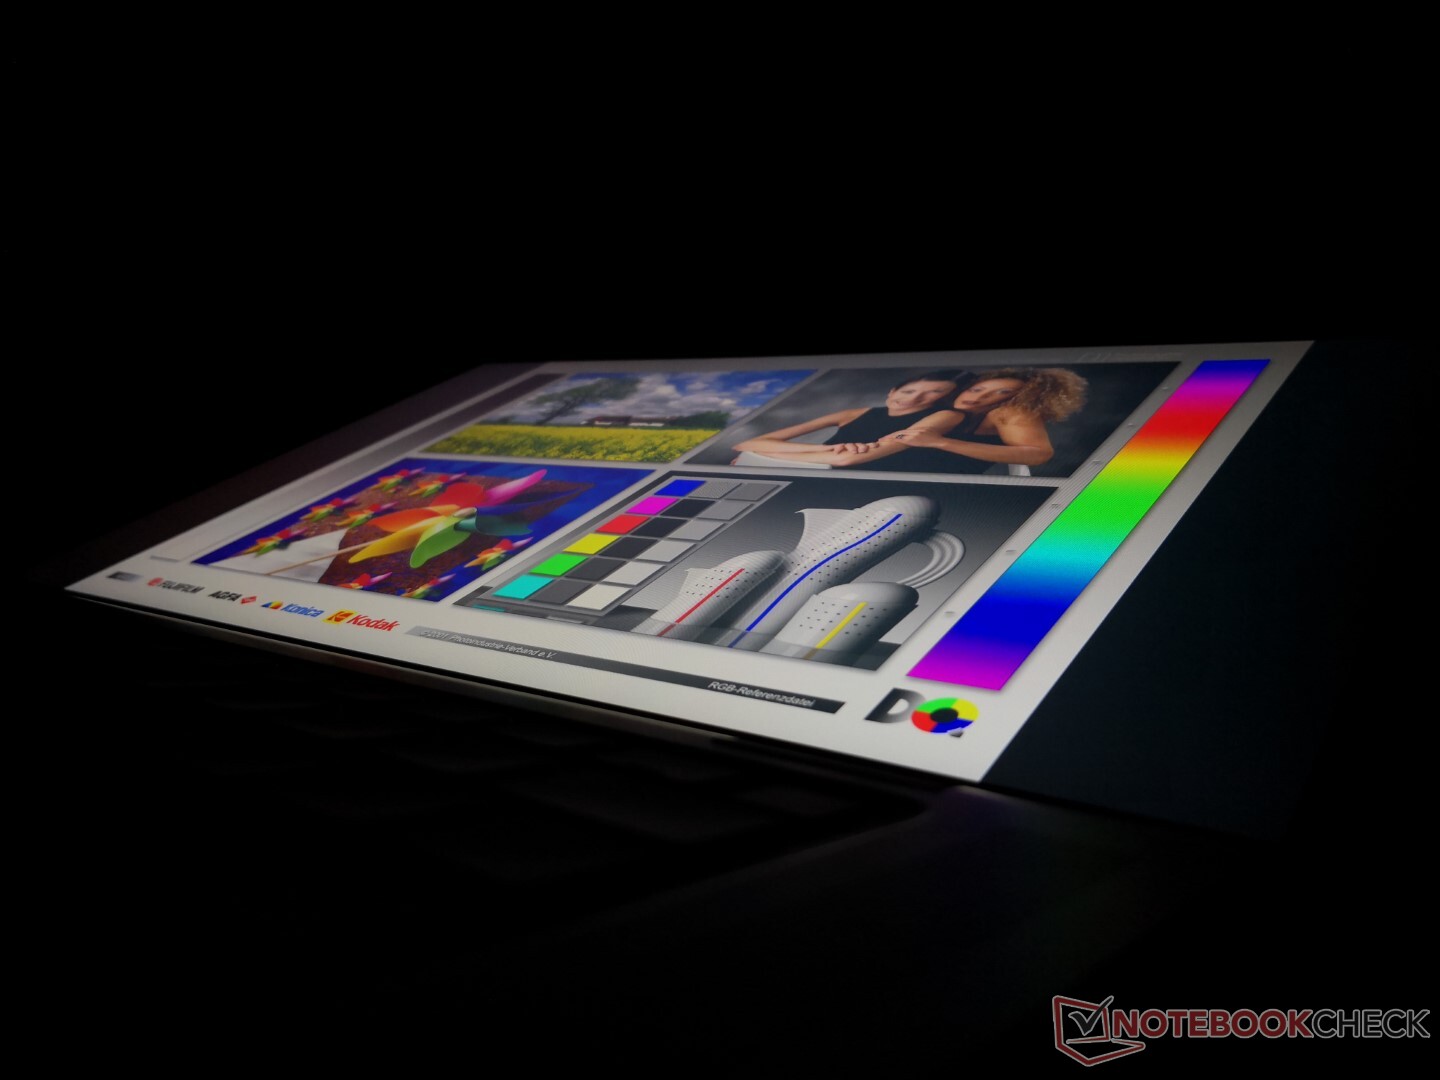
Mostrar
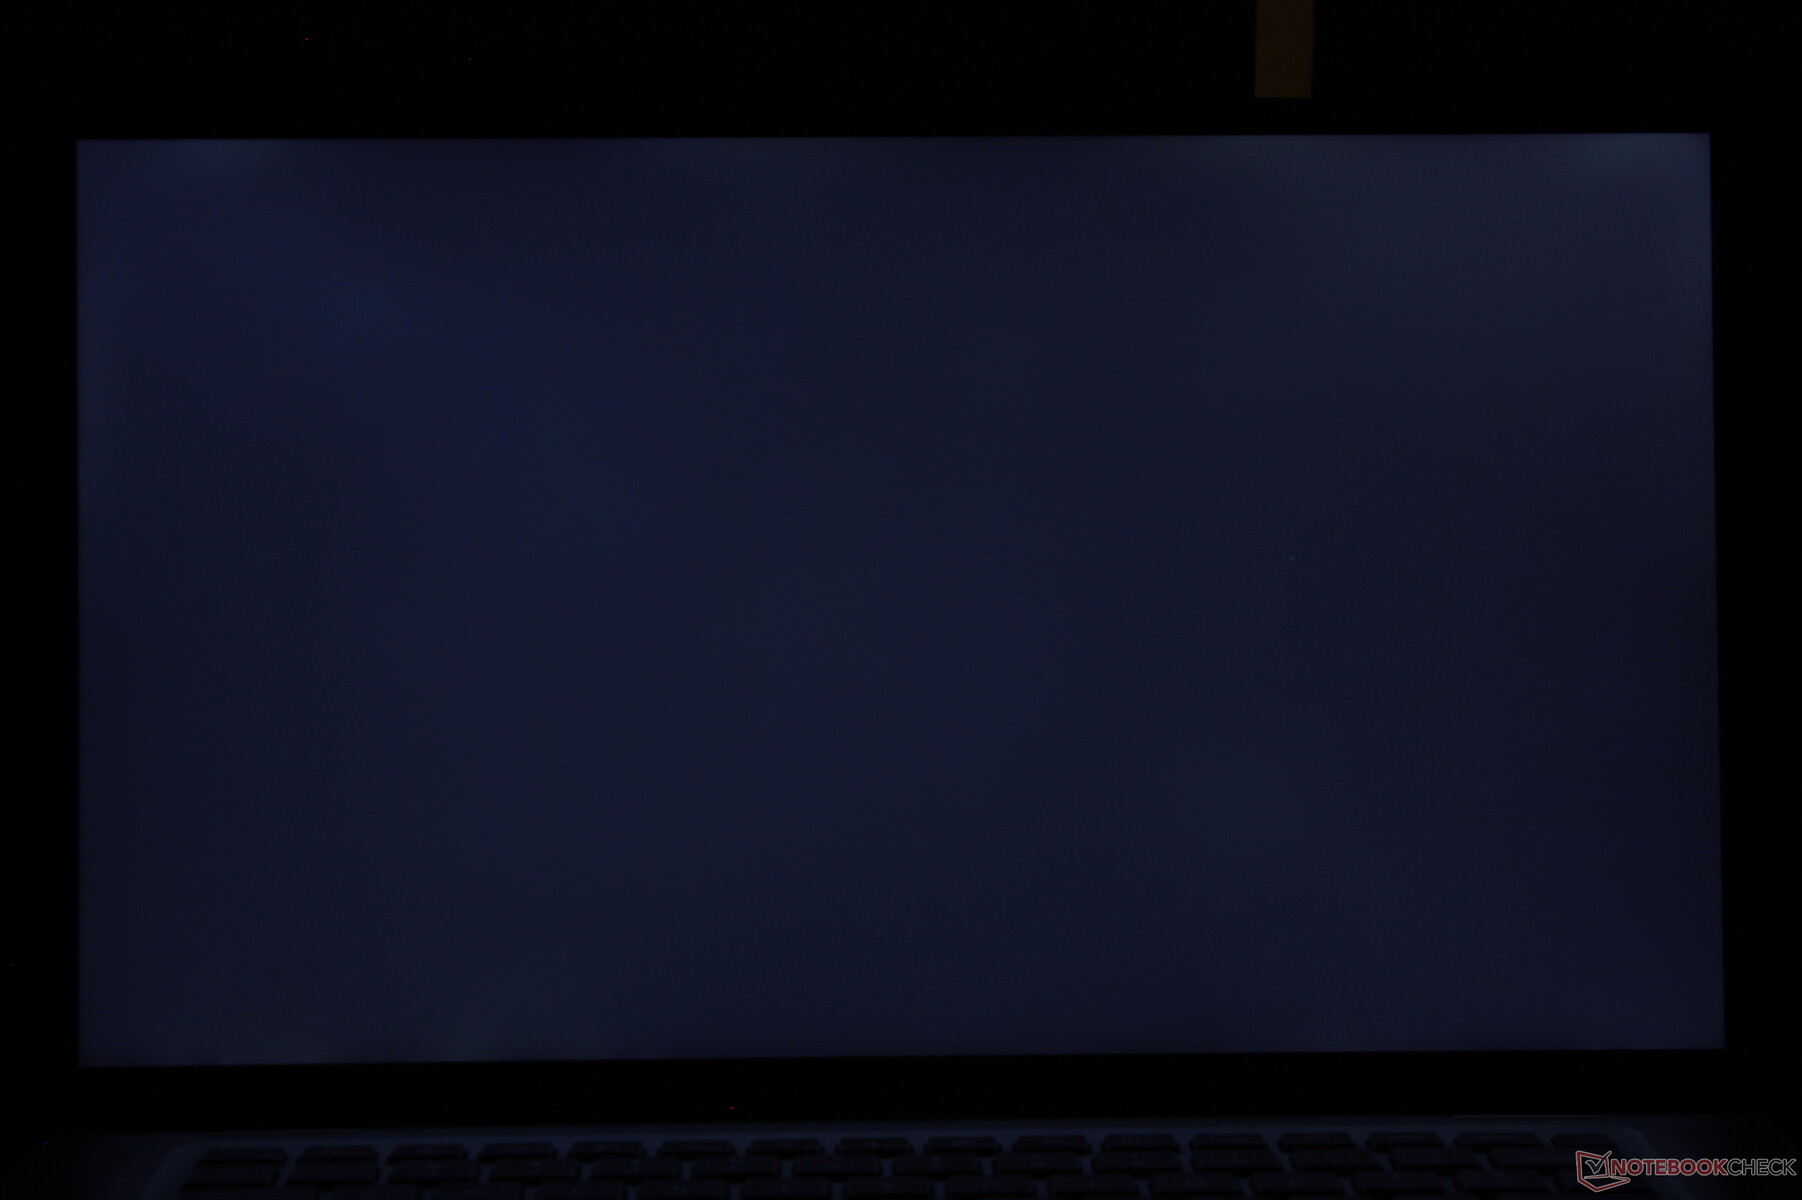
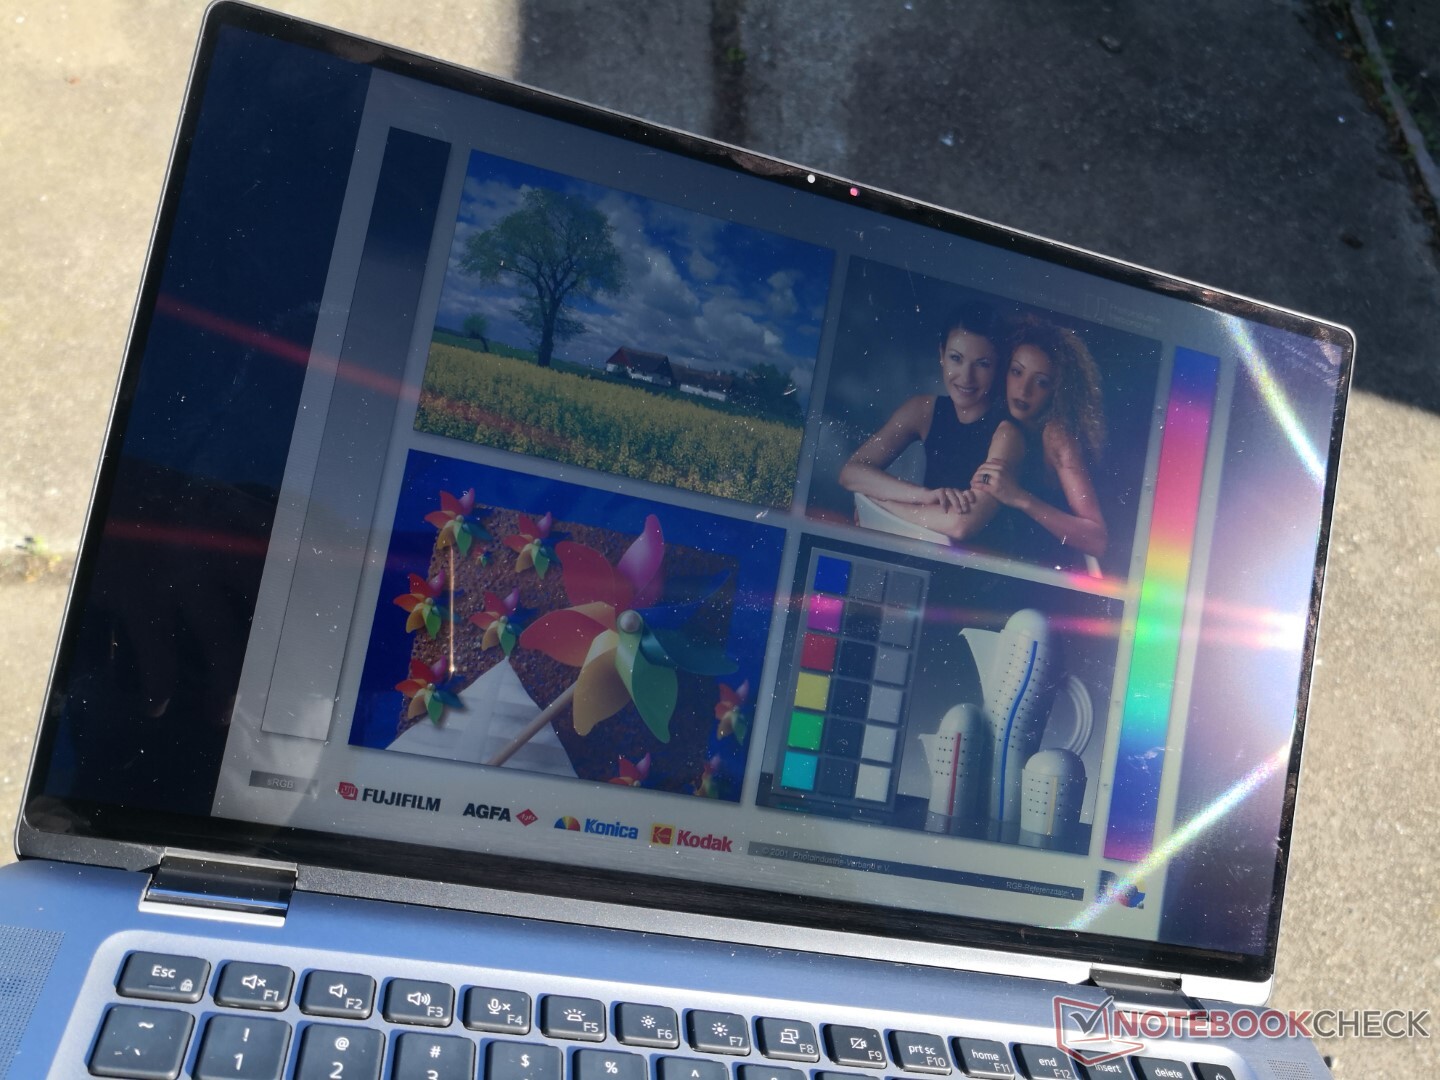
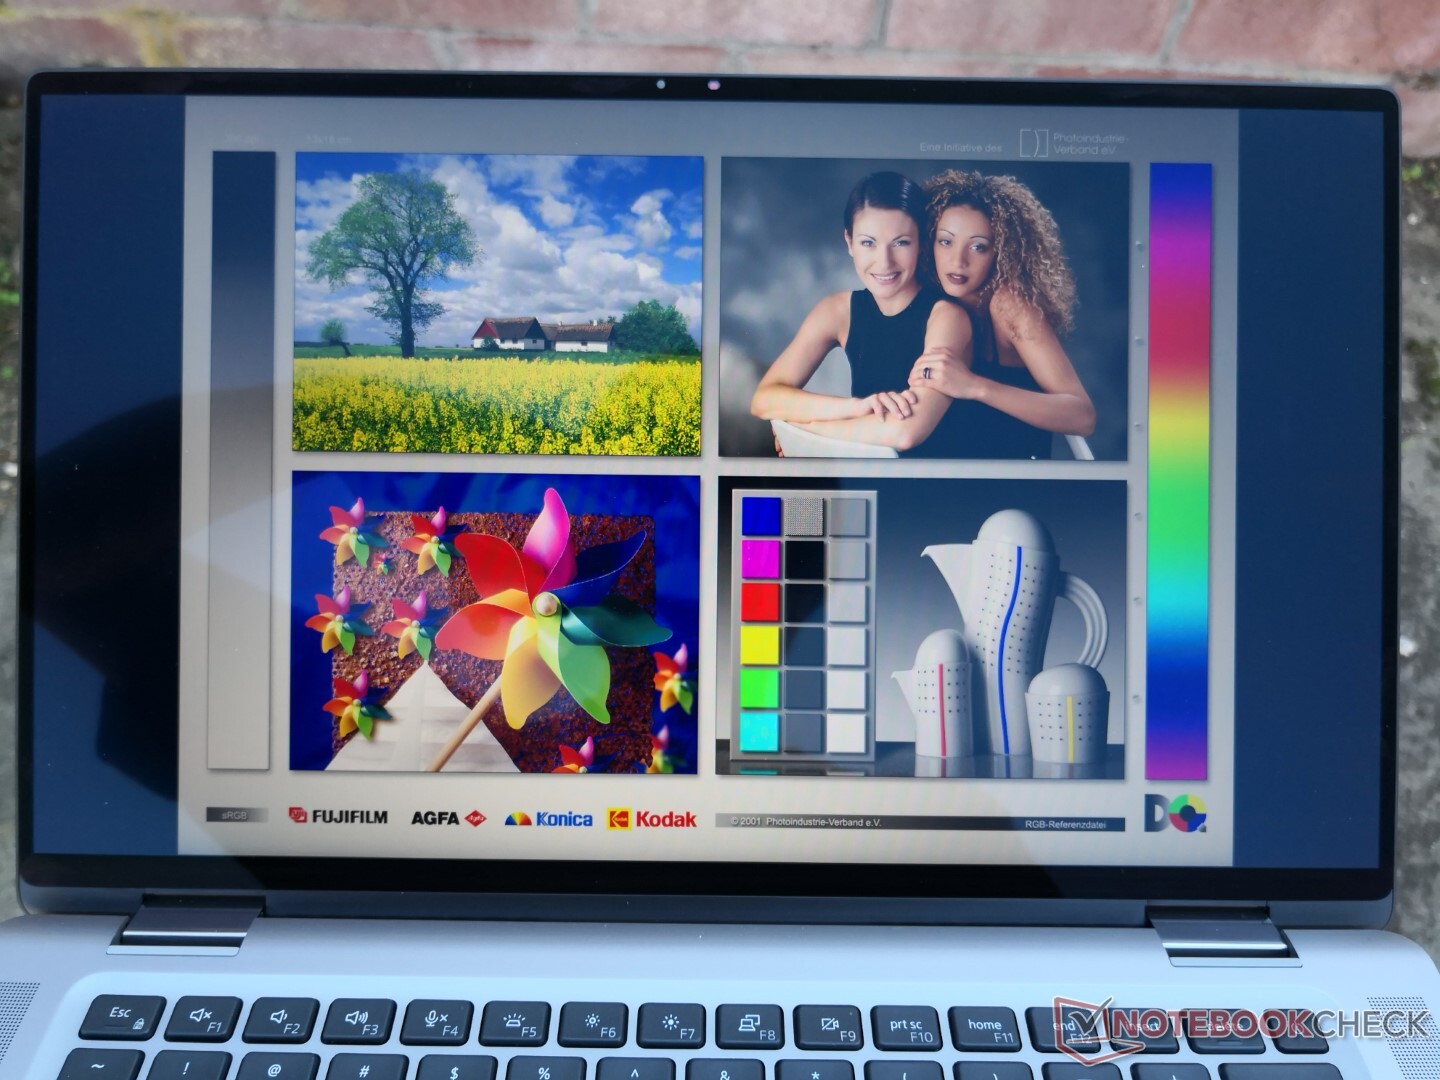
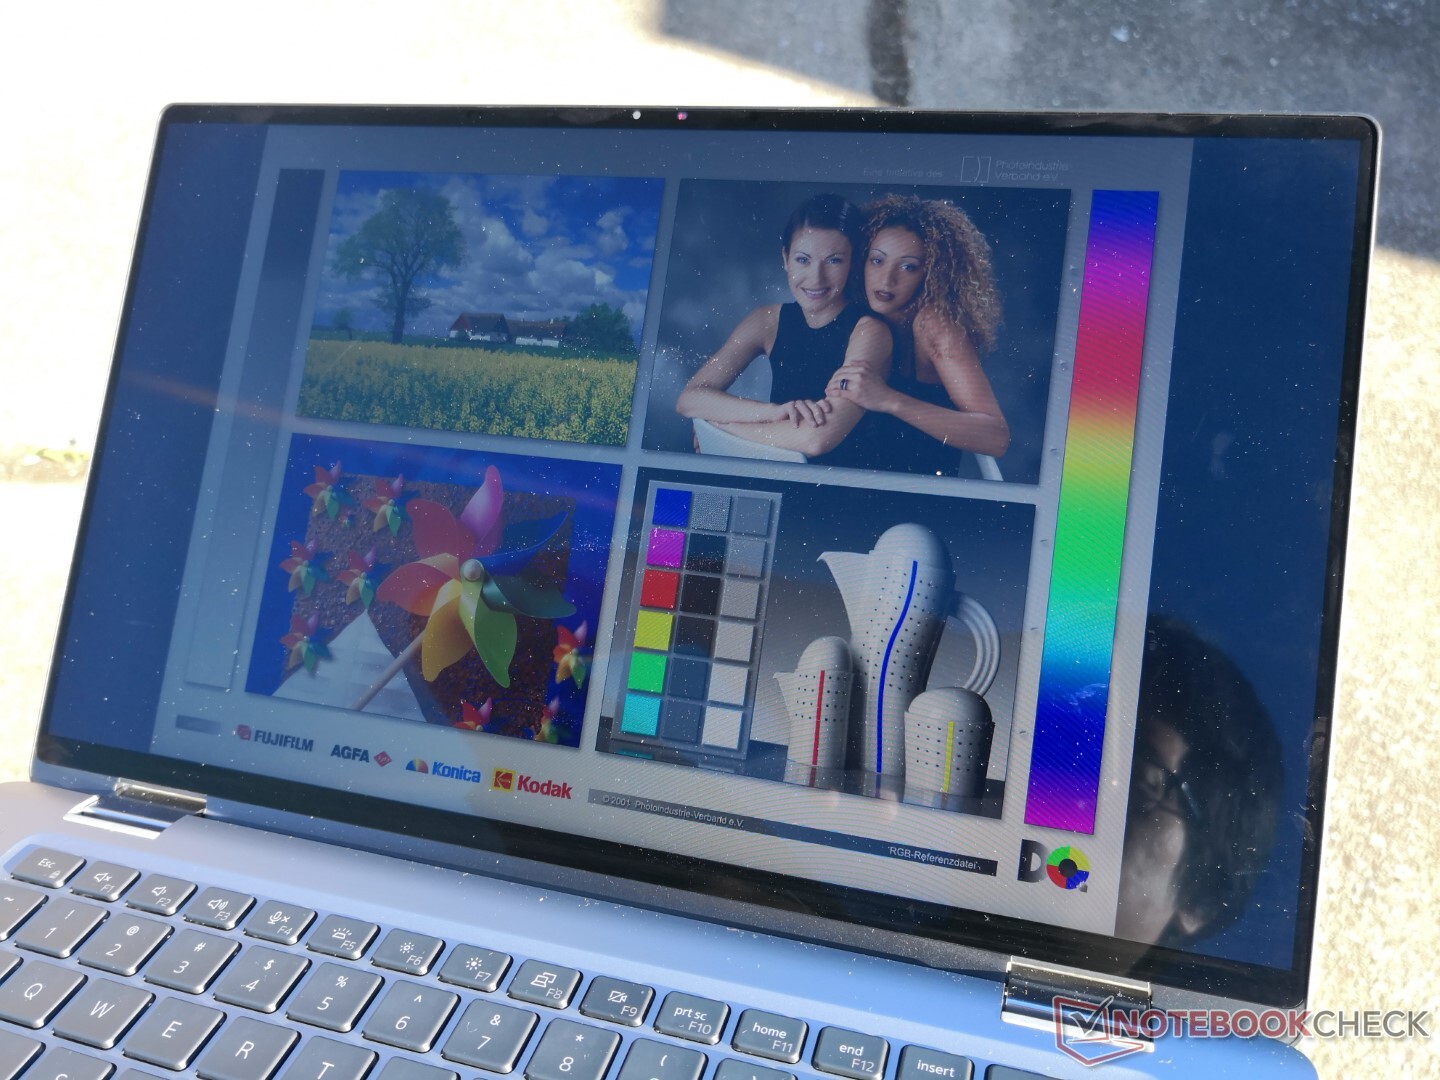
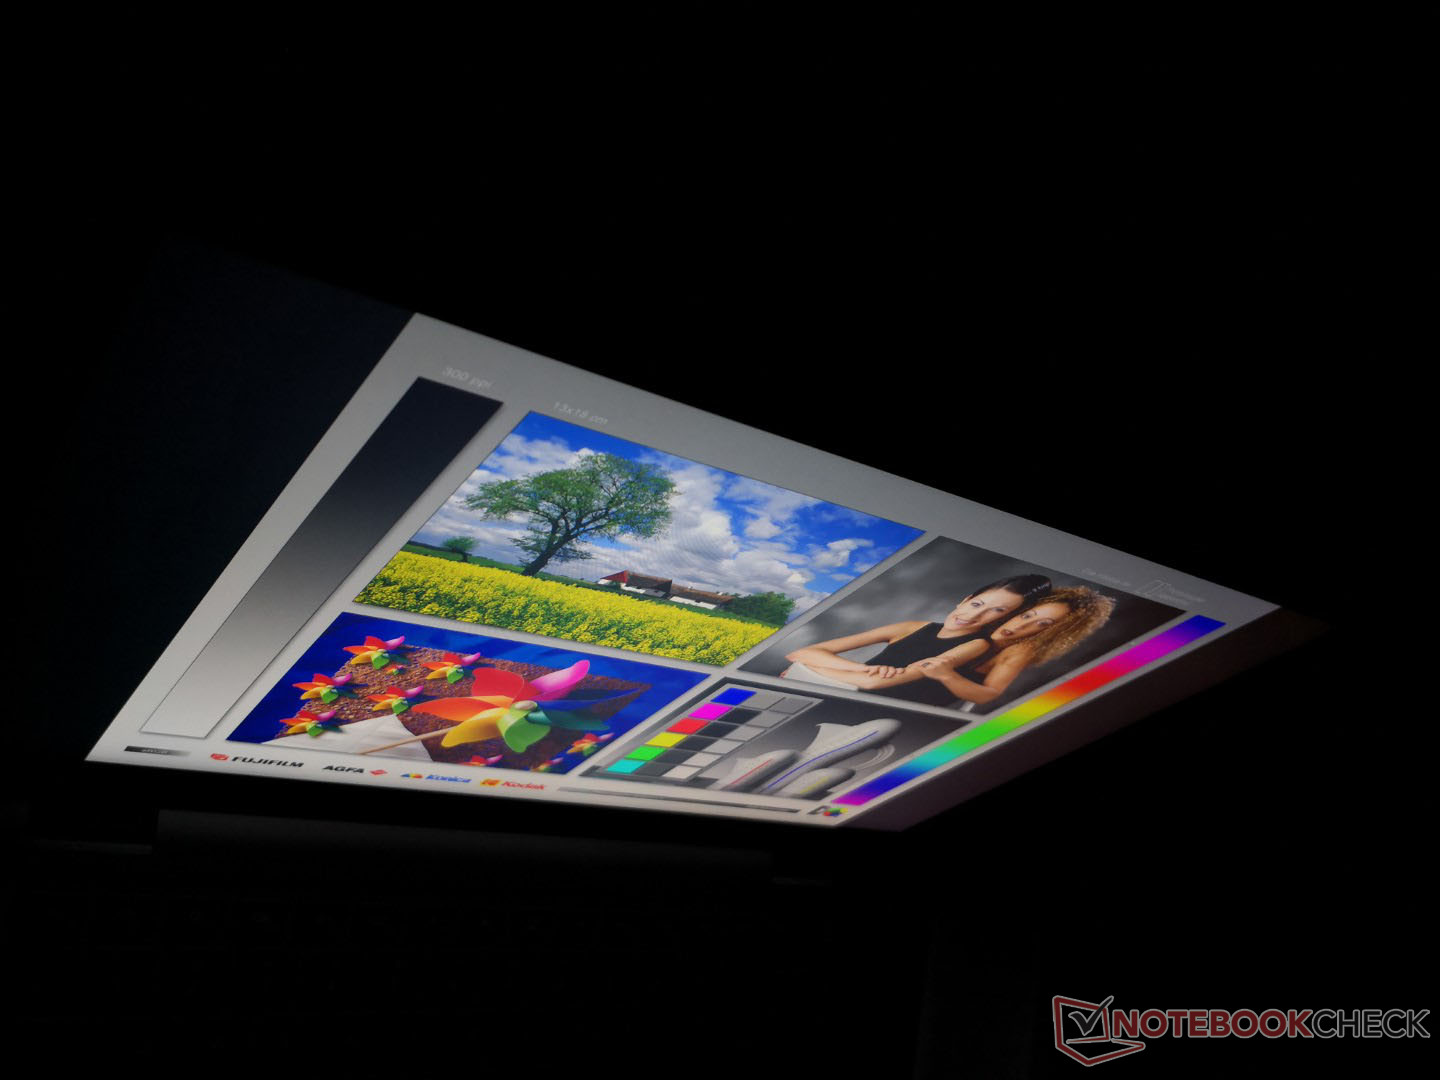
Dell utiliza el mismo panel IPS AU Optronics B150HAN entre el Latitude 9510 2-en-1 y el 9520 2-en-1 para una experiencia visual similar entre ellos. Por desgracia, no hay nuevas opciones de panel para el 9520 2-en-1. Sería estupendo ver opciones 4K u OLED en futuras revisiones de Latitude 2-en-1.
| |||||||||||||||||||||||||
iluminación: 84 %
Brillo con batería: 403.6 cd/m²
Contraste: 1835:1 (Negro: 0.22 cd/m²)
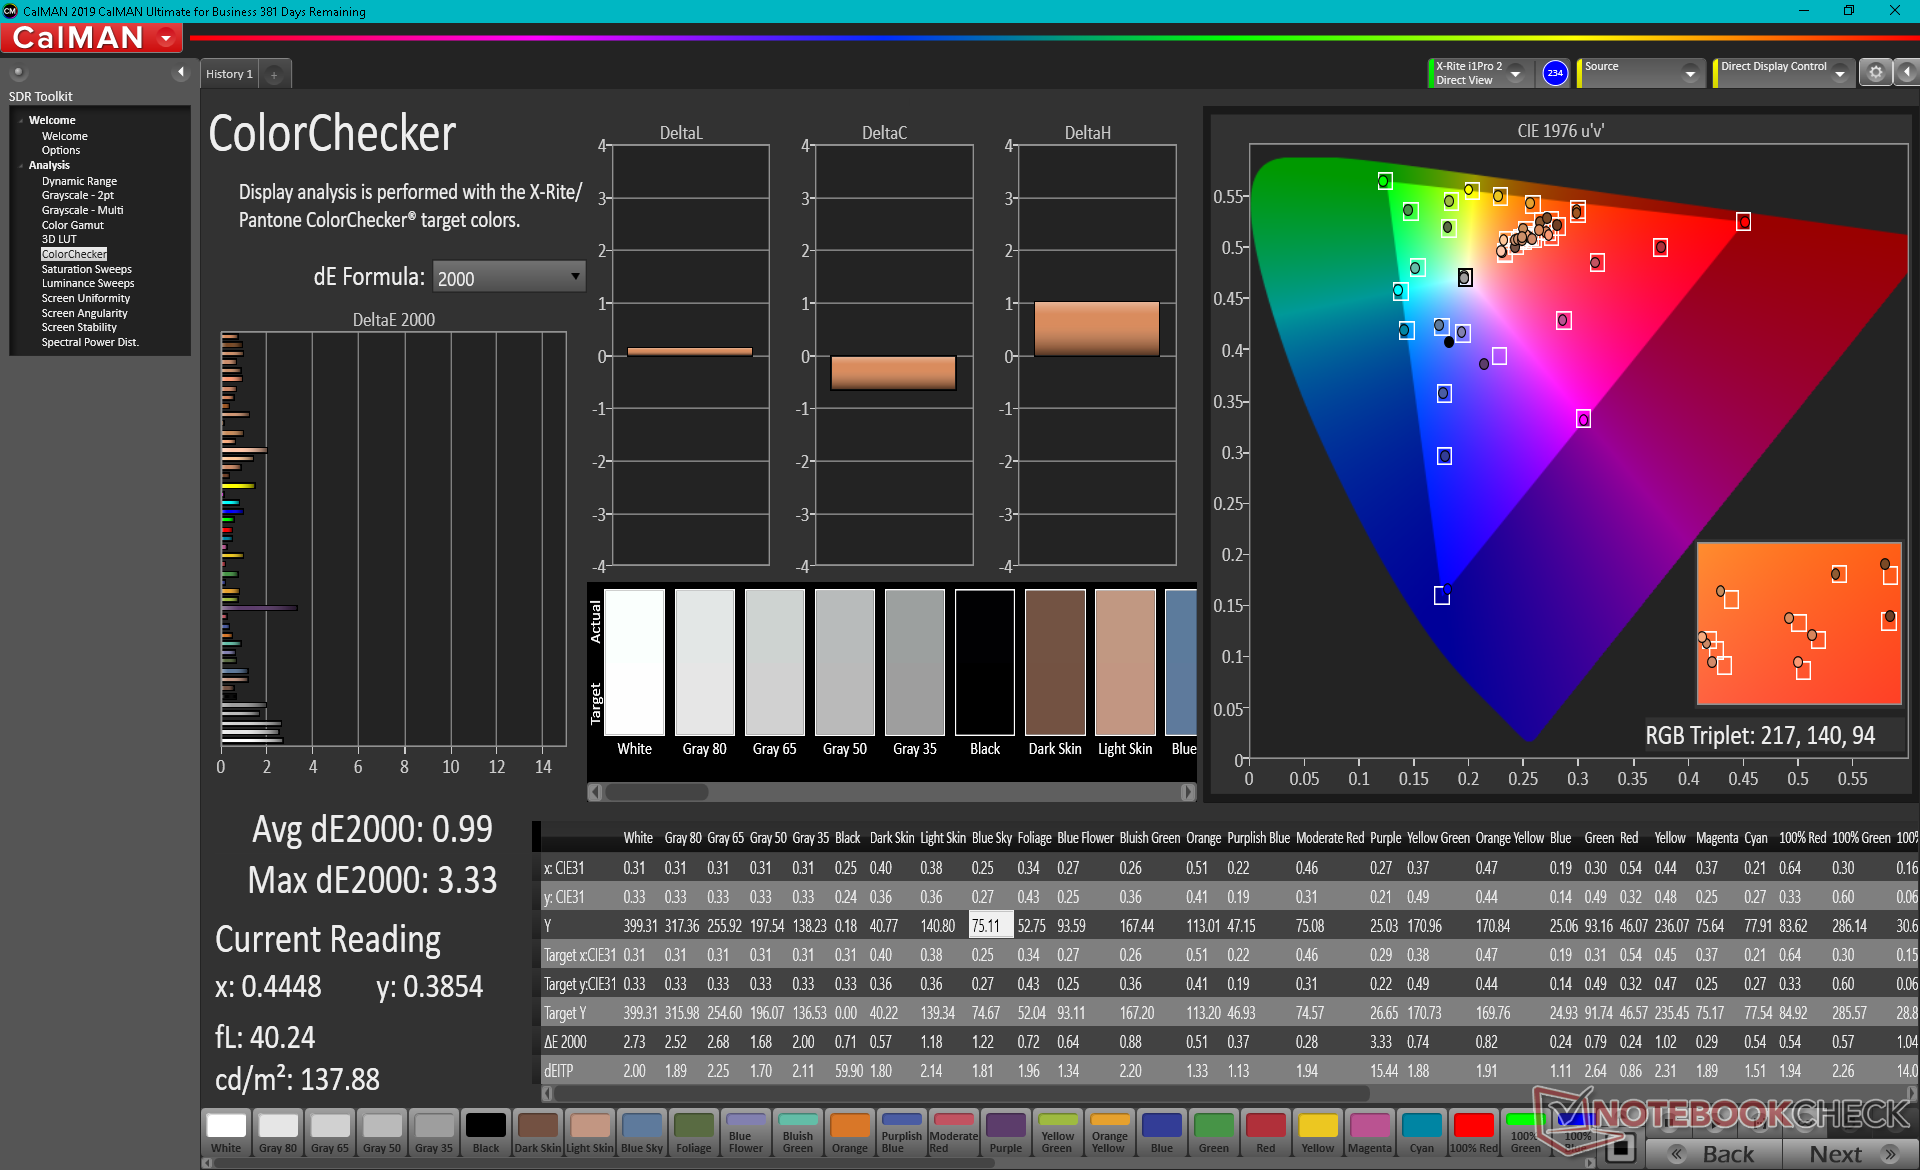
ΔE ColorChecker Calman: 3.34 | ∀{0.5-29.43 Ø4.71}
calibrated: 0.99
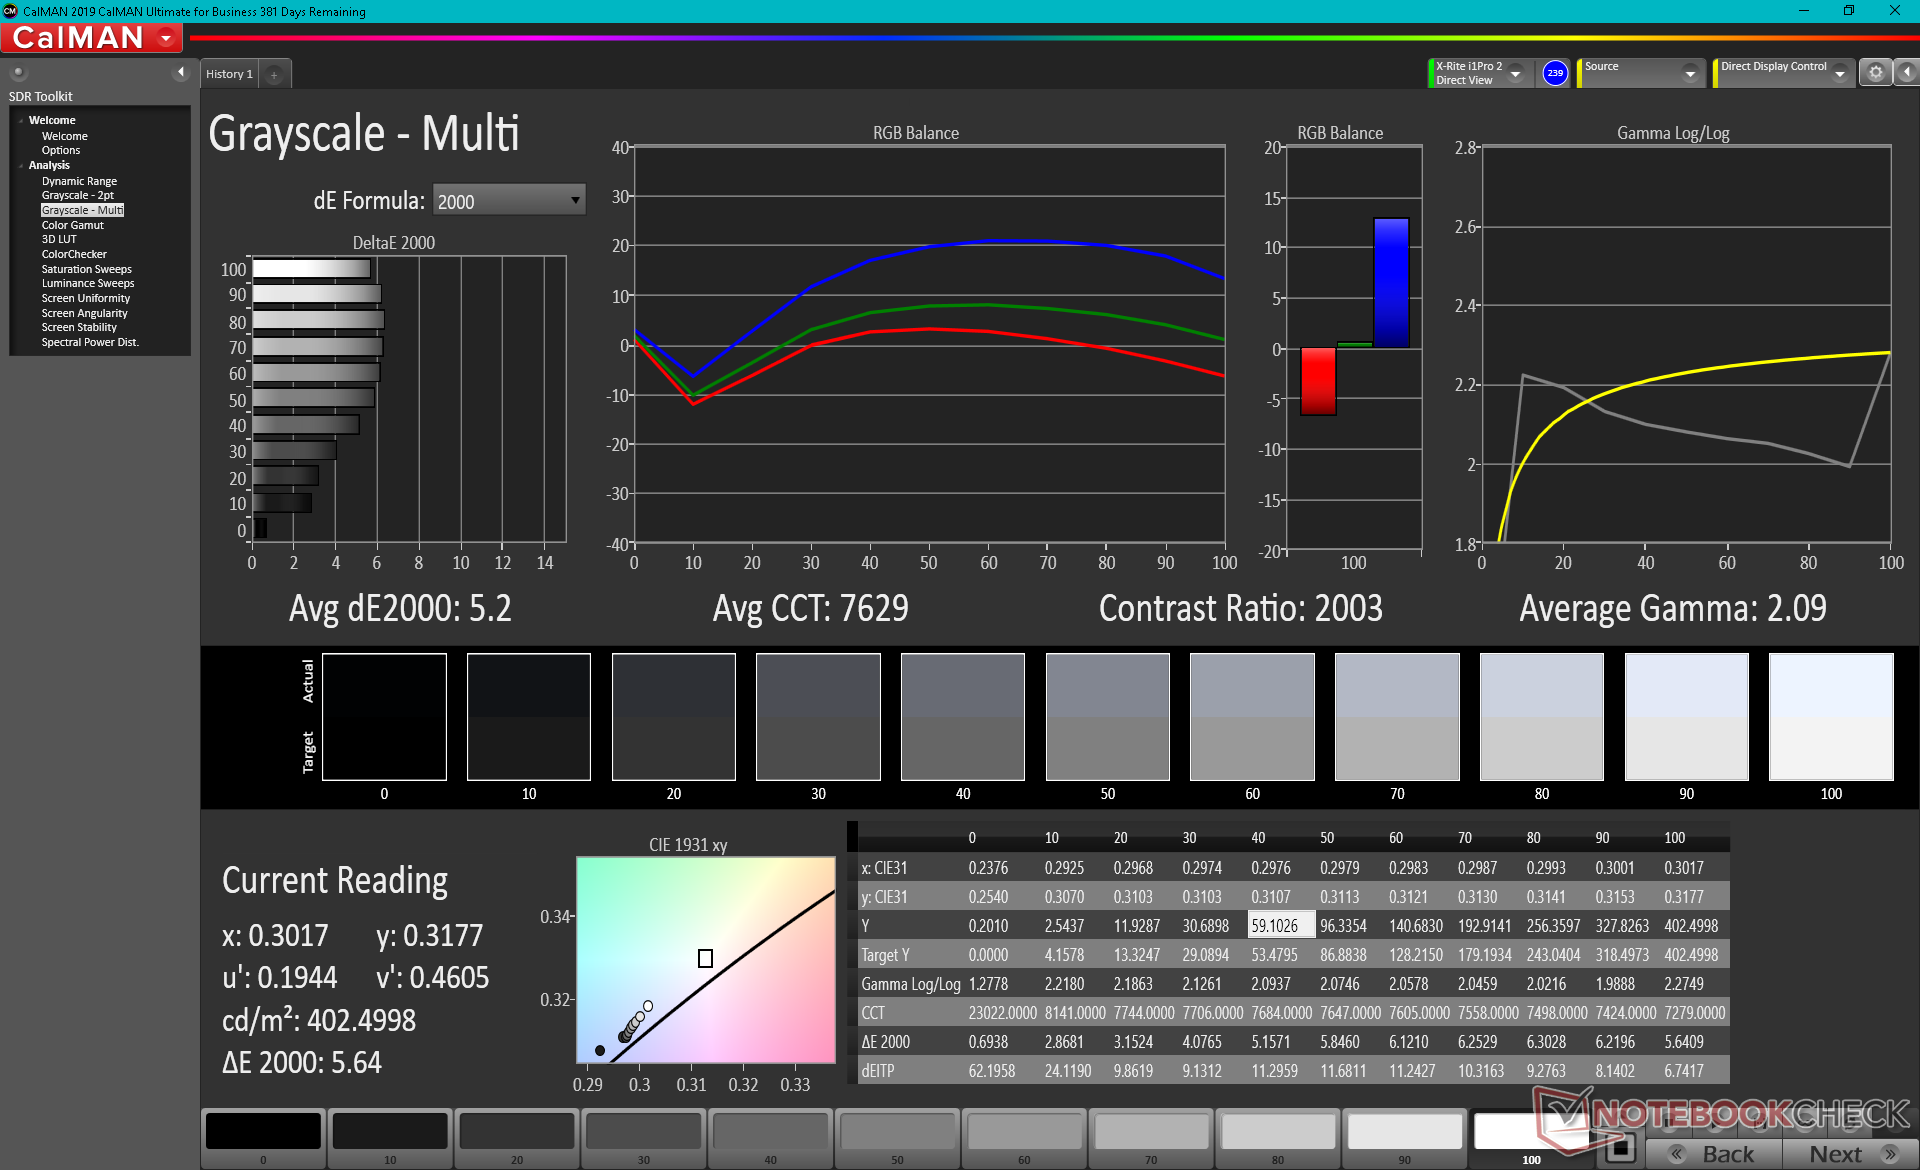
ΔE Greyscale Calman: 5.2 | ∀{0.09-98 Ø4.96}
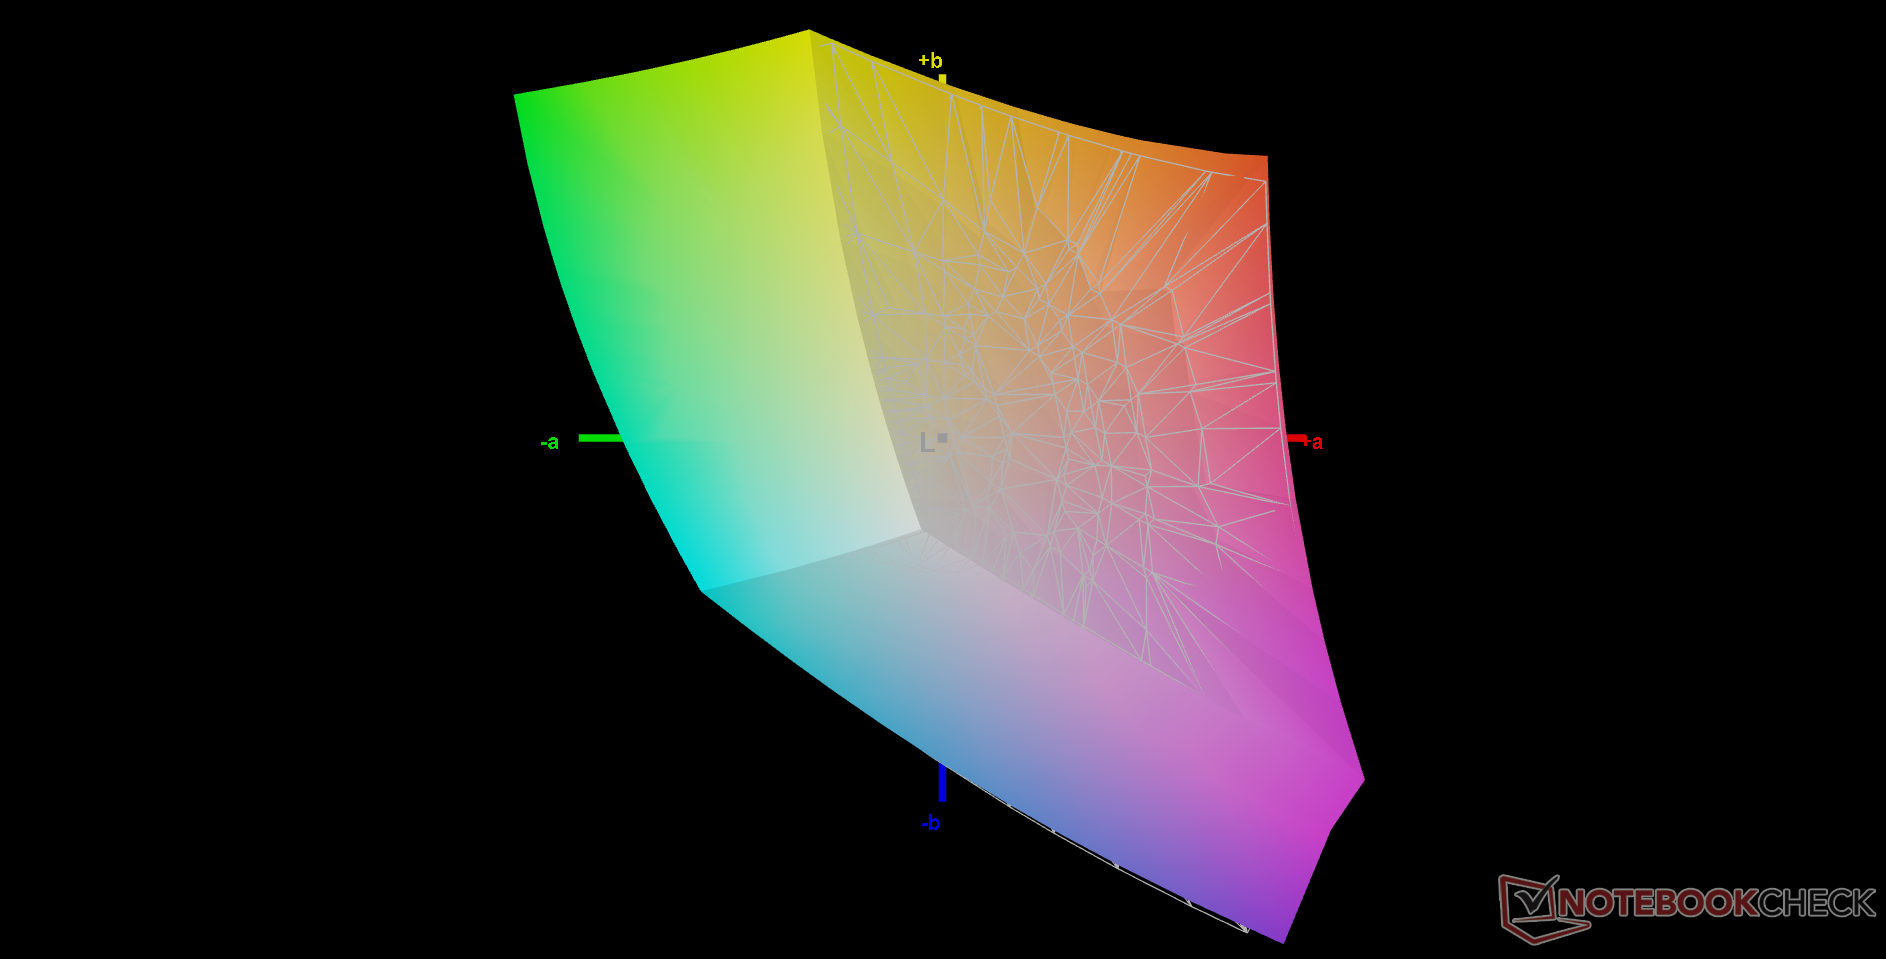
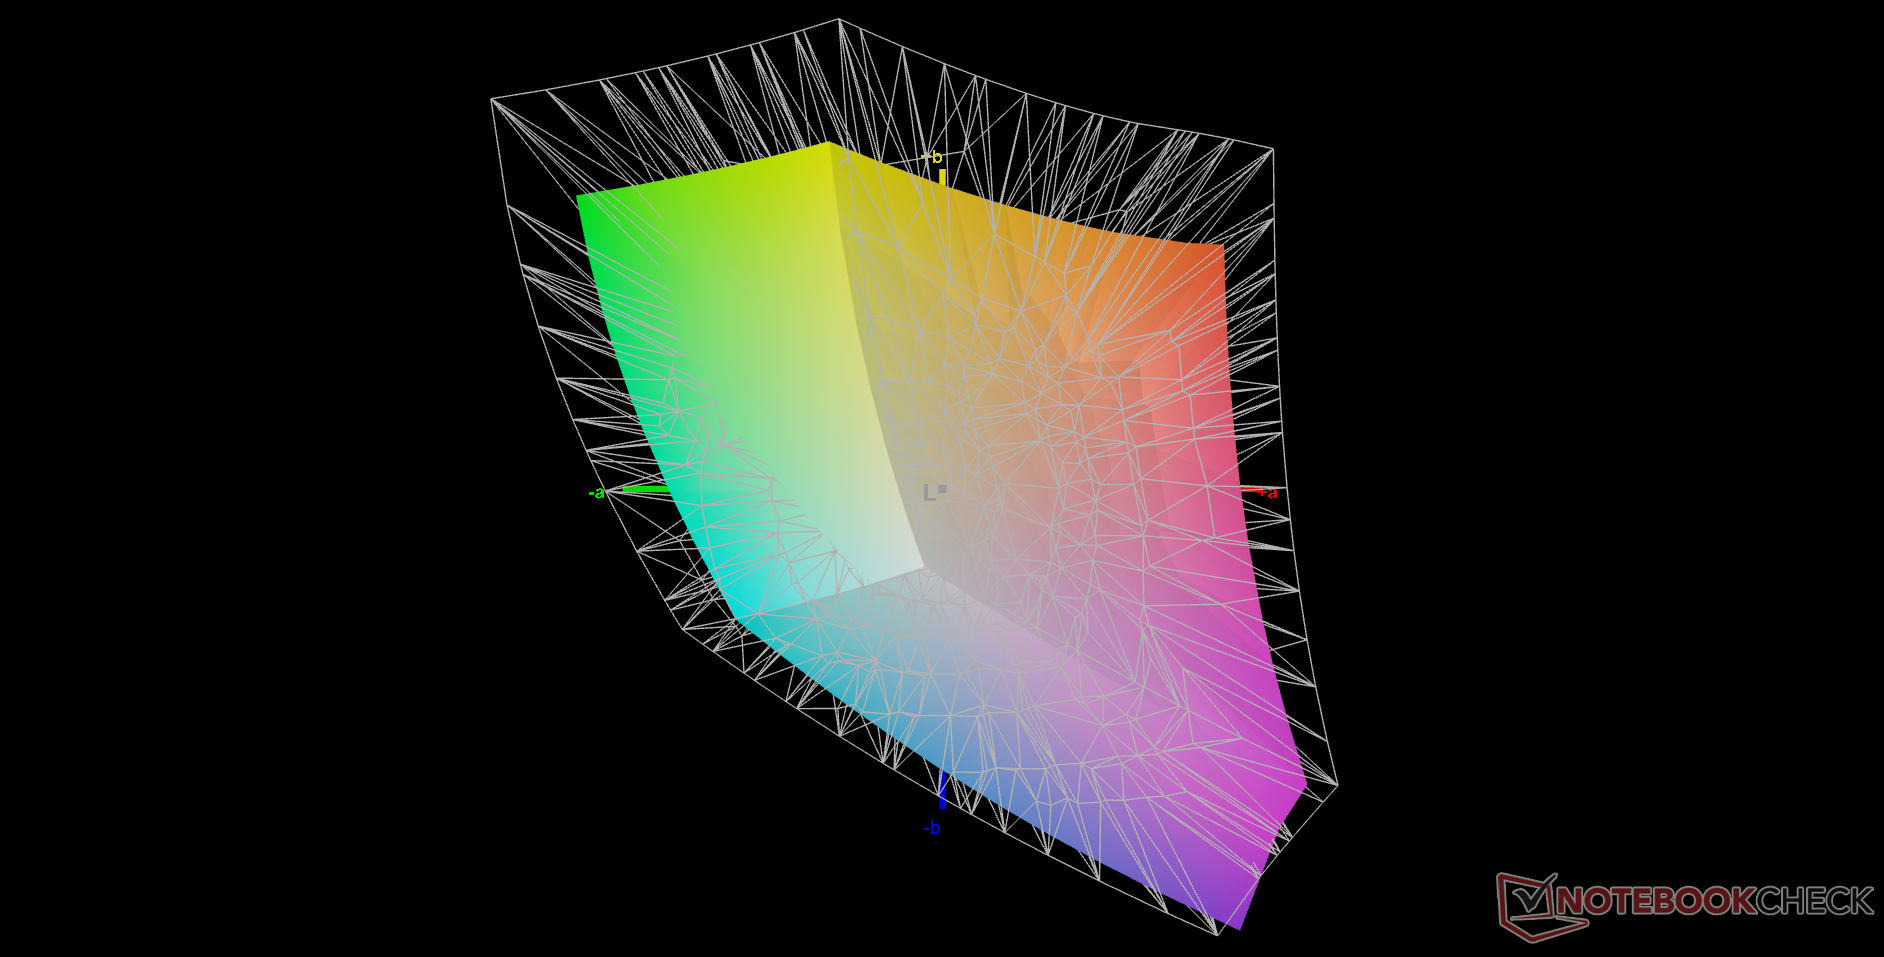
70.4% AdobeRGB 1998 (Argyll 3D)
98.7% sRGB (Argyll 3D)
69.9% Display P3 (Argyll 3D)
Gamma: 2.09
CCT: 7629 K
| Dell Latitude 15 9520 2-in-1 AU Optronics B150HAN, IPS, 1920x1080, 15" | Dell Latitude 9510 2-in-1 AU Optronics B150HAN, IPS, 1920x1080, 15" | HP EliteBook 850 G8 3C7Z8EA InfoVision X156NVF8 R1, I, 1920x1080, 15.6" | Lenovo ThinkPad L15 G2 AMD N156HCA-EAB, IPS LED, 1920x1080, 15.6" | MSI Summit B15 A11M Chi Mei N156HCE-EN1, IPS, 1920x1080, 15.6" | Microsoft Surface Laptop 4 15 AMD TFF_00028 SHP14B4, IPS, 2496x1664, 15" | |
|---|---|---|---|---|---|---|
| Display | 1% | -6% | -35% | -7% | -4% | |
| Display P3 Coverage (%) | 69.9 | 71.2 2% | 43.8 -37% | 65.7 -6% | 65.2 -7% | |
| sRGB Coverage (%) | 98.7 | 99.3 1% | 95 -4% | 65.7 -33% | 90.6 -8% | 97.7 -1% |
| AdobeRGB 1998 Coverage (%) | 70.4 | 71.3 1% | 65 -8% | 45.3 -36% | 66 -6% | 67.3 -4% |
| Response Times | -27% | -19% | -6% | -11% | -32% | |
| Response Time Grey 50% / Grey 80% * (ms) | 39.2 ? | 52.8 ? -35% | 47 ? -20% | 40 -2% | 40.4 ? -3% | 58.4 ? -49% |
| Response Time Black / White * (ms) | 27.2 ? | 32 ? -18% | 32 ? -18% | 30 -10% | 32.4 ? -19% | 31.2 ? -15% |
| PWM Frequency (Hz) | 312 ? | 25510 ? | 21550 ? | |||
| Screen | -27% | 7% | -49% | -71% | 6% | |
| Brightness middle (cd/m²) | 403.6 | 426.7 6% | 802 99% | 298 -26% | 341.3 -15% | 405 0% |
| Brightness (cd/m²) | 368 | 394 7% | 702 91% | 276 -25% | 310 -16% | 379 3% |
| Brightness Distribution (%) | 84 | 87 4% | 77 -8% | 86 2% | 81 -4% | 79 -6% |
| Black Level * (cd/m²) | 0.22 | 0.3 -36% | 0.245 -11% | 0.26 -18% | 0.45 -105% | 0.26 -18% |
| Contrast (:1) | 1835 | 1422 -23% | 3273 78% | 1146 -38% | 758 -59% | 1558 -15% |
| Colorchecker dE 2000 * | 3.34 | 4.28 -28% | 6.22 -86% | 3.7 -11% | 6.17 -85% | 2.6 22% |
| Colorchecker dE 2000 max. * | 6.29 | 10.43 -66% | 9.92 -58% | 15 -138% | 11.75 -87% | 6.6 -5% |
| Colorchecker dE 2000 calibrated * | 0.99 | 1.46 -47% | 3.5 -254% | 3.3 -233% | 0.9 9% | |
| Greyscale dE 2000 * | 5.2 | 8.1 -56% | 7.69 -48% | 1.7 67% | 7.1 -37% | 1.9 63% |
| Gamma | 2.09 105% | 2.26 97% | 2.75 80% | 2.21 100% | 2.2 100% | 2.11 104% |
| CCT | 7629 85% | 7993 81% | 6135 106% | 6588 99% | 6842 95% | 6825 95% |
| Color Space (Percent of AdobeRGB 1998) (%) | 65.2 | 65 | 58.7 | 62 | ||
| Color Space (Percent of sRGB) (%) | 99.2 | 95 | 90.1 | 97.7 | ||
| Media total (Programa/Opciones) | -18% /
-21% | -6% /
1% | -30% /
-40% | -30% /
-49% | -10% /
-2% |
* ... más pequeño es mejor
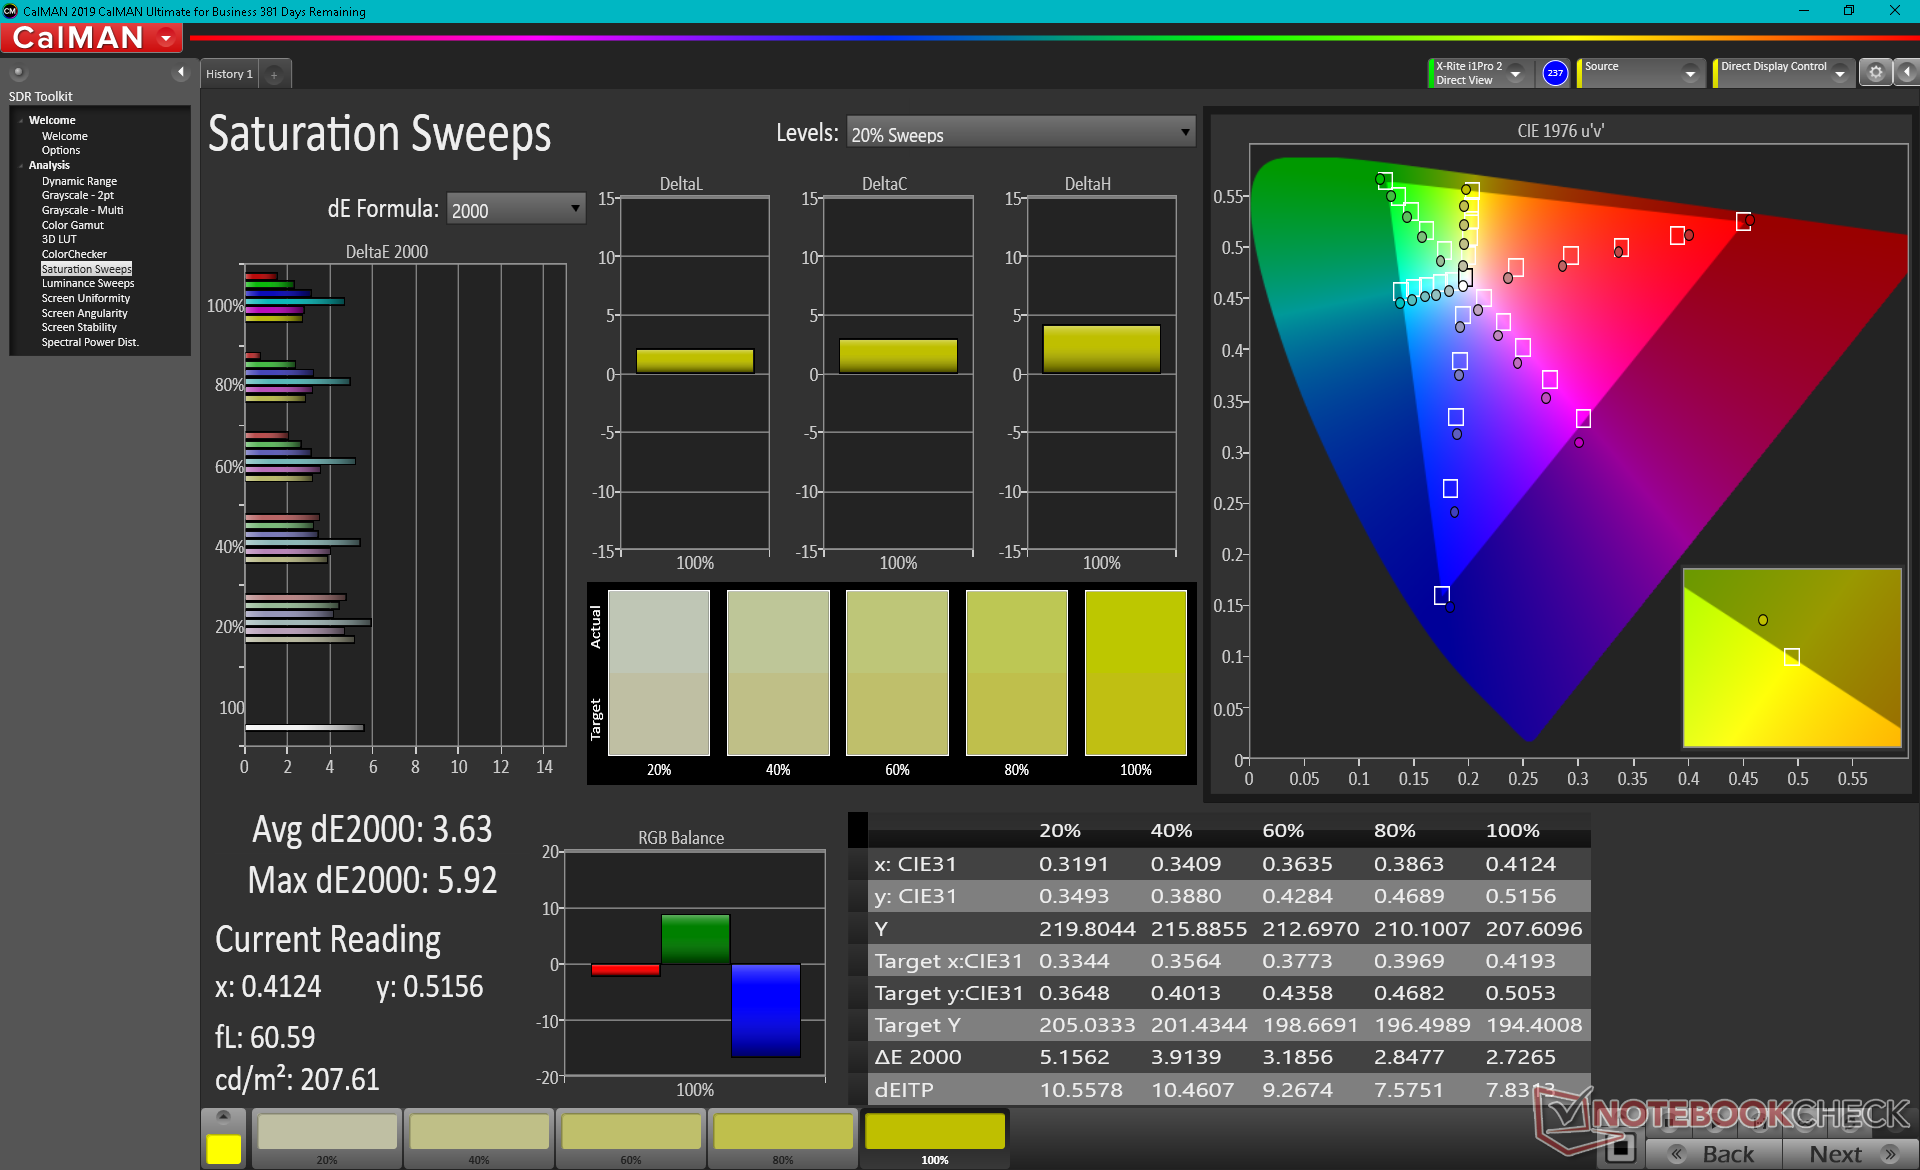
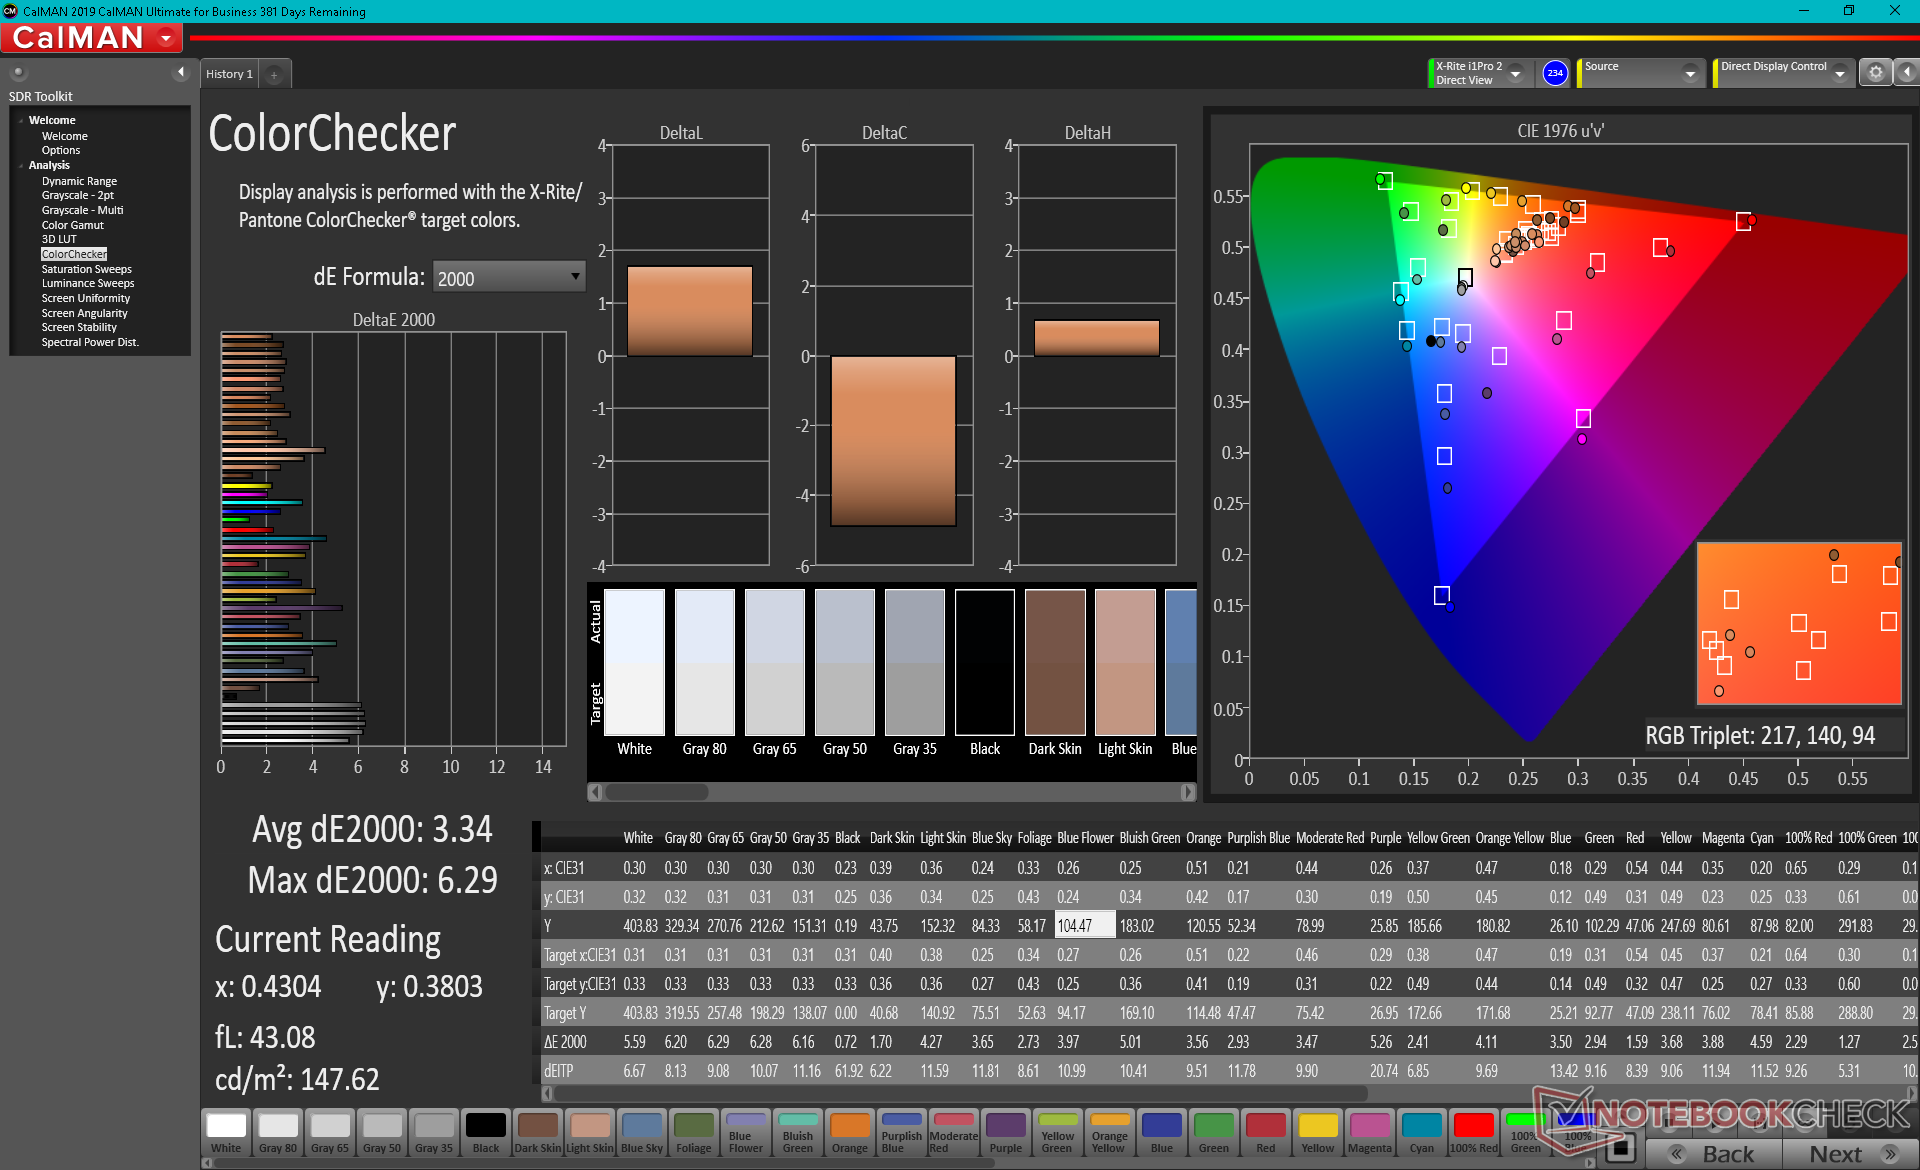
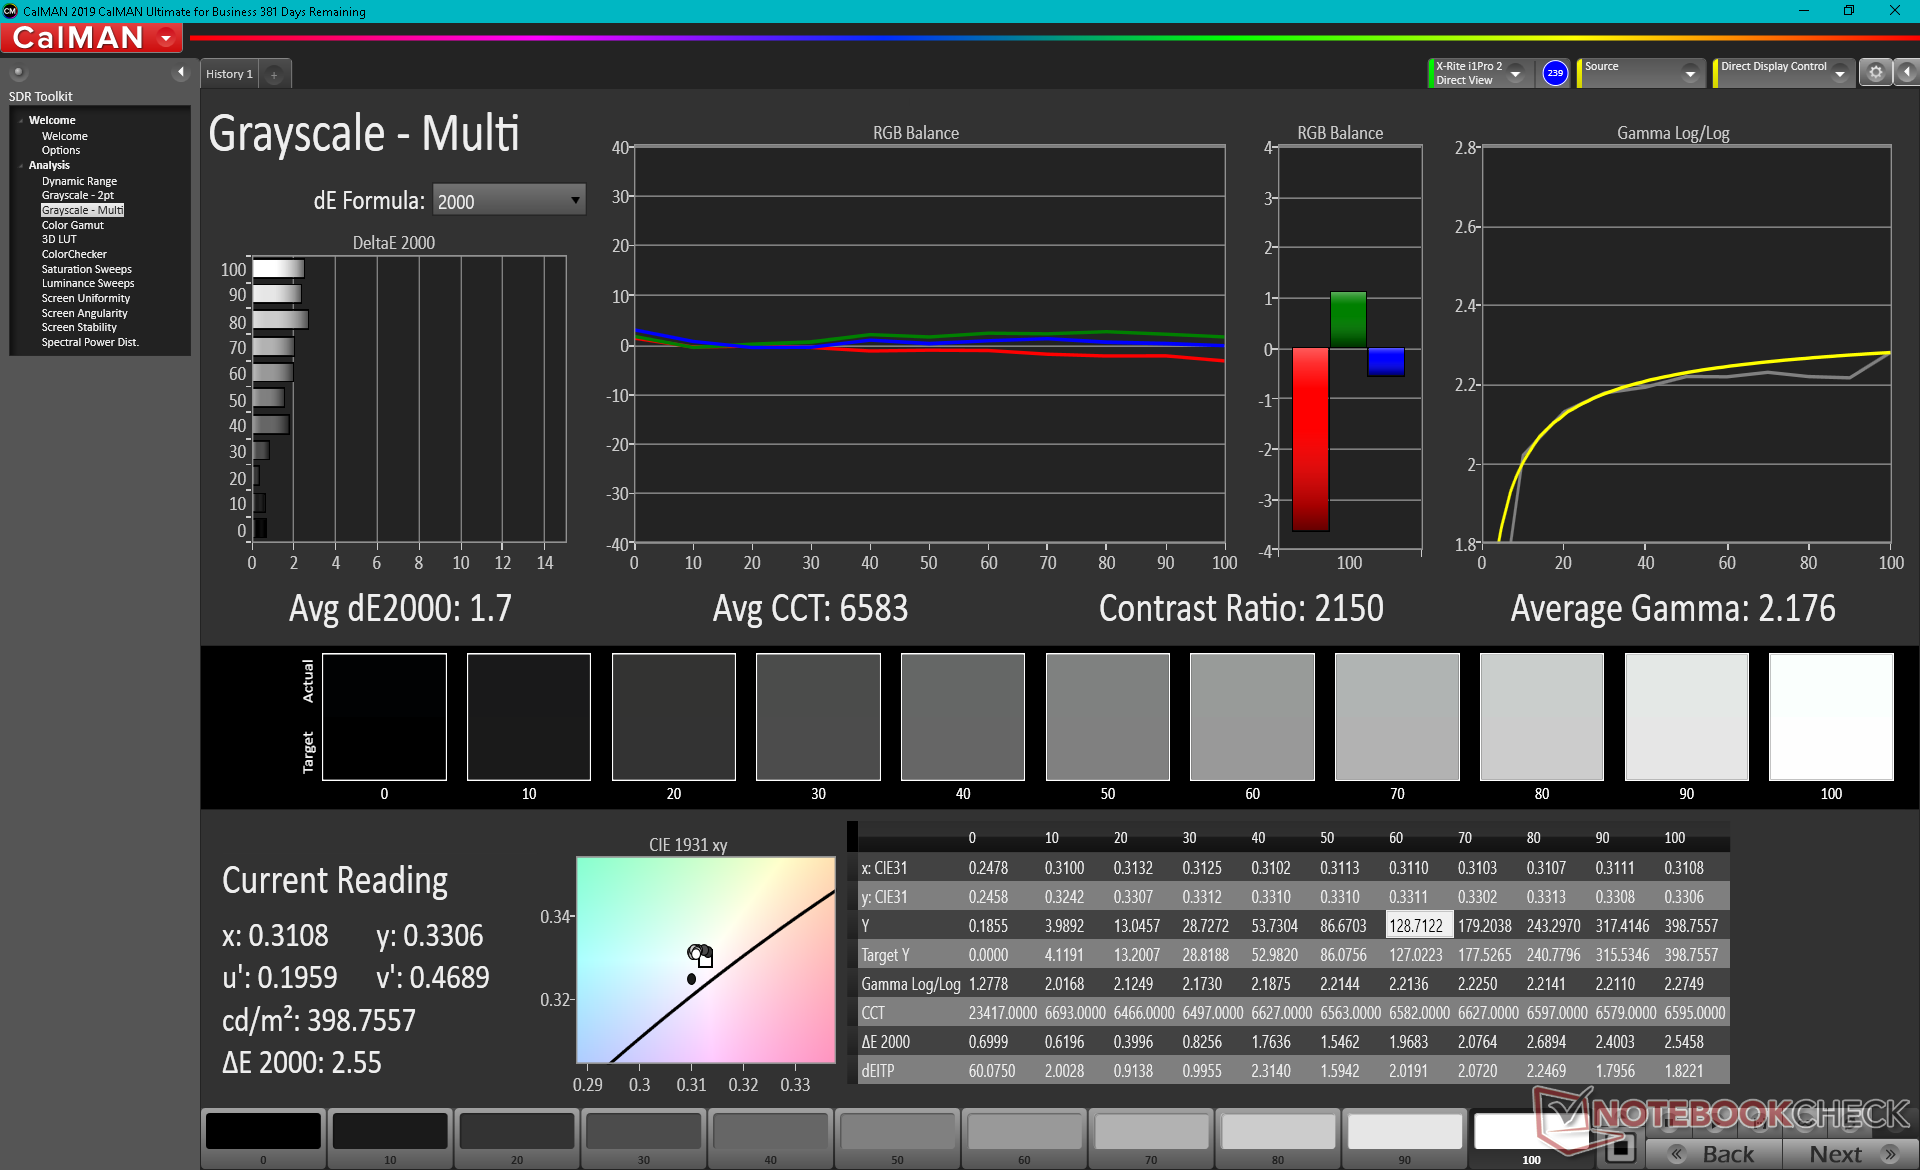
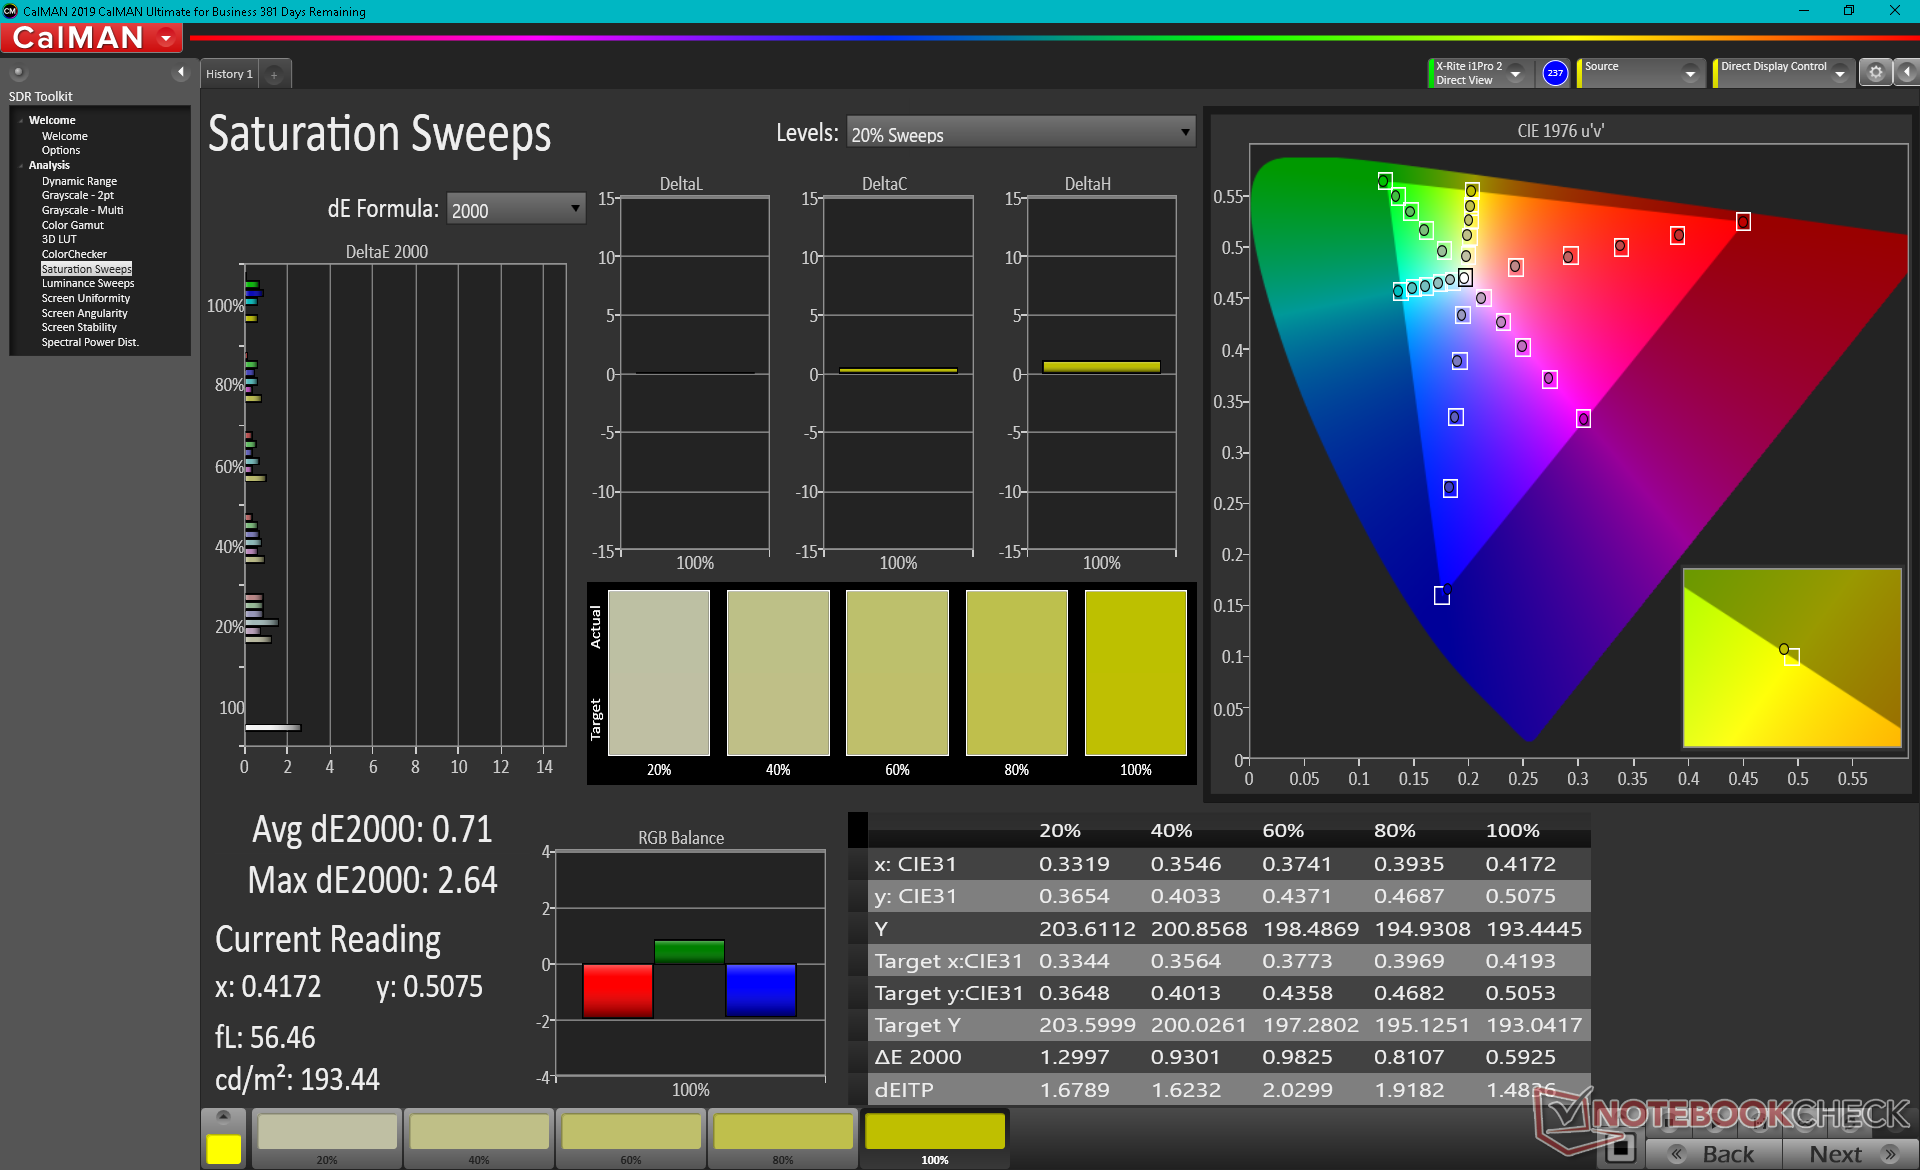
La pantalla está decentemente calibrada desde el principio, con valores medios de escala de grises y color deltaE de sólo 5,2 y 3,34, respectivamente. Una calibración adecuada por parte del usuario final puede reducir estos valores a bastante menos de <2 cada uno, como muestran nuestras capturas de pantalla de CalMAN a continuación.
Tiempos de respuesta del display
| ↔ Tiempo de respuesta de Negro a Blanco | ||
|---|---|---|
| 27.2 ms ... subida ↗ y bajada ↘ combinada | ↗ 14 ms subida | 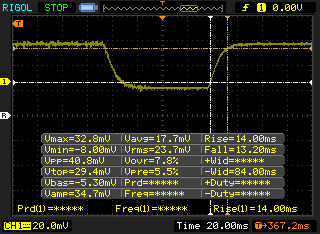 |
| ↘ 13.2 ms bajada | ||
| La pantalla mostró tiempos de respuesta relativamente lentos en nuestros tests pero podría ser demasiado lenta para los jugones. En comparación, todos los dispositivos de prueba van de ##min### (mínimo) a 240 (máximo) ms. » 69 % de todos los dispositivos son mejores. Eso quiere decir que el tiempo de respuesta es peor que la media (19.8 ms) de todos los dispositivos testados. | ||
| ↔ Tiempo de respuesta 50% Gris a 80% Gris | ||
| 39.2 ms ... subida ↗ y bajada ↘ combinada | ↗ 19.2 ms subida | 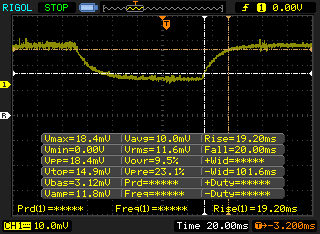 |
| ↘ 20 ms bajada | ||
| La pantalla mostró tiempos de respuesta lentos en nuestros tests y podría ser demasiado lenta para los jugones. En comparación, todos los dispositivos de prueba van de ##min### (mínimo) a 636 (máximo) ms. » 60 % de todos los dispositivos son mejores. Eso quiere decir que el tiempo de respuesta es peor que la media (30.9 ms) de todos los dispositivos testados. | ||
Parpadeo de Pantalla / PWM (Pulse-Width Modulation)
| Parpadeo de Pantalla / PWM no detectado | 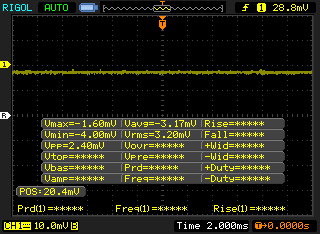 | ||
Comparación: 52 % de todos los dispositivos testados no usaron PWM para atenuar el display. Si se usó, medimos una media de 7748 (mínimo: 5 - máxmo: 343500) Hz. | |||
Rendimiento
Condiciones de la prueba
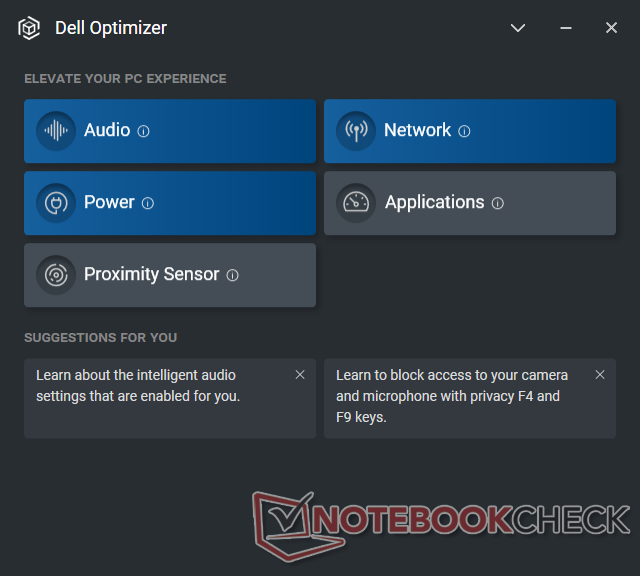
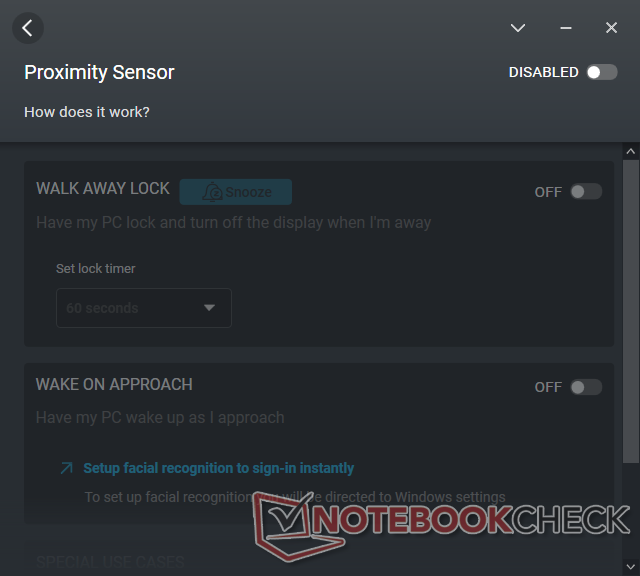
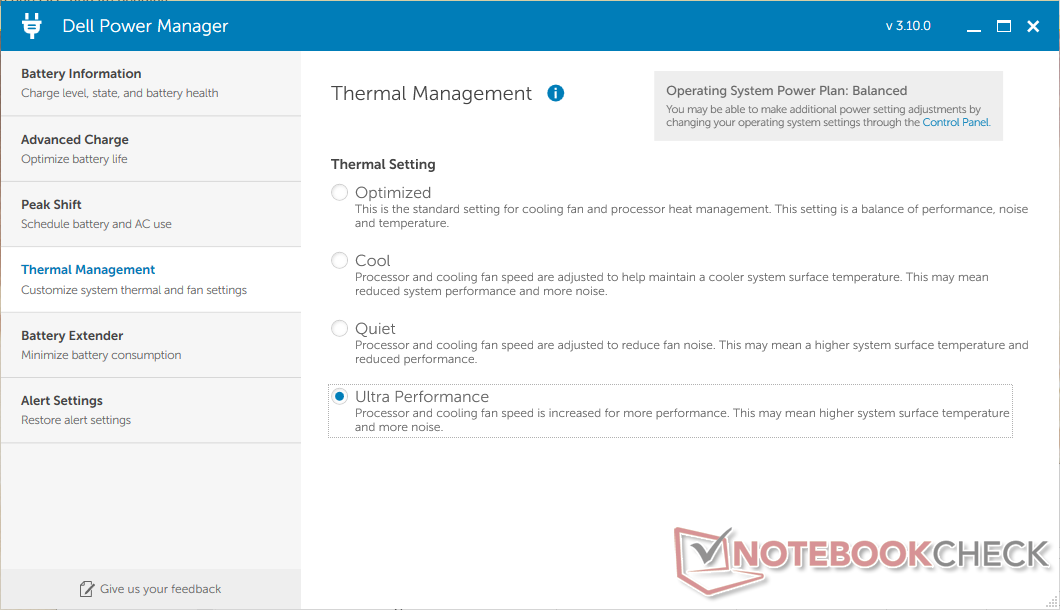
Nuestro sistema se configuró en el modo 'Mejor Rendimiento' de Windows y con el Administrador de Energía de Dell configurado en Ultra Rendimiento antes de ejecutar cualquier prueba de rendimiento a continuación para obtener las puntuaciones más altas posibles. Los usuarios también deberían familiarizarse con el software Dell Optimizer preinstalado, que incluye ajustes adicionales para el audio, la red y el sensor de proximidad para el inicio de sesión con manos libres.
Procesador
El rendimiento de la CPU multihilo es una mezcla de ambos, ya que el Core i7-1185G7 tiene dos núcleos menos que el Core i7-10810U lo que supone un descenso de entre el 25 y el 35 por ciento. La diferencia es mayor de lo esperado, ya que el i7-1185G7 de nuestro Latitude 9520 2-en-1 rinde al menos entre un 15 y un 20 por ciento menos que la mayoría de los portátiles que utilizan exactamente la misma CPU. La CPU Core i7-1185G7 del MSI Stealth 15Mpor ejemplo, puede ofrecer un rendimiento multihilo hasta un 50 por ciento más rápido que nuestro Dell
El rendimiento monohilo está, afortunadamente, donde debería estar en relación con el Core i7-1185G7 medio. Los usuarios pueden esperar un rendimiento un 30 por ciento más rápido que el Core i7-10810U en este aspecto.
Cinebench R15 Multi Loop
Cinebench R23: Multi Core | Single Core
Cinebench R20: CPU (Multi Core) | CPU (Single Core)
Cinebench R15: CPU Multi 64Bit | CPU Single 64Bit
Blender: v2.79 BMW27 CPU
7-Zip 18.03: 7z b 4 | 7z b 4 -mmt1
Geekbench 5.5: Multi-Core | Single-Core
HWBOT x265 Benchmark v2.2: 4k Preset
LibreOffice : 20 Documents To PDF
R Benchmark 2.5: Overall mean
* ... más pequeño es mejor
AIDA64: FP32 Ray-Trace | FPU Julia | CPU SHA3 | CPU Queen | FPU SinJulia | FPU Mandel | CPU AES | CPU ZLib | FP64 Ray-Trace | CPU PhotoWorxx
| Performance rating | |
| Microsoft Surface Laptop 4 15 AMD TFF_00028 | |
| Lenovo ThinkPad L15 G2 AMD | |
| MSI Summit B15 A11M | |
| Medio Intel Core i7-1185G7 | |
| HP EliteBook 850 G8 3C7Z8EA | |
| Dell Latitude 15 9520 2-in-1 | |
| Dell Latitude 9510 2-in-1 | |
| AIDA64 / FP32 Ray-Trace | |
| Microsoft Surface Laptop 4 15 AMD TFF_00028 | |
| Lenovo ThinkPad L15 G2 AMD | |
| MSI Summit B15 A11M | |
| Medio Intel Core i7-1185G7 (5621 - 7453, n=20) | |
| HP EliteBook 850 G8 3C7Z8EA | |
| Dell Latitude 15 9520 2-in-1 | |
| Dell Latitude 9510 2-in-1 | |
| AIDA64 / FPU Julia | |
| Microsoft Surface Laptop 4 15 AMD TFF_00028 | |
| Lenovo ThinkPad L15 G2 AMD | |
| Dell Latitude 9510 2-in-1 | |
| MSI Summit B15 A11M | |
| Medio Intel Core i7-1185G7 (23248 - 32614, n=20) | |
| HP EliteBook 850 G8 3C7Z8EA | |
| Dell Latitude 15 9520 2-in-1 | |
| AIDA64 / CPU SHA3 | |
| Microsoft Surface Laptop 4 15 AMD TFF_00028 | |
| MSI Summit B15 A11M | |
| Lenovo ThinkPad L15 G2 AMD | |
| Medio Intel Core i7-1185G7 (1530 - 2209, n=20) | |
| HP EliteBook 850 G8 3C7Z8EA | |
| Dell Latitude 15 9520 2-in-1 | |
| Dell Latitude 9510 2-in-1 | |
| AIDA64 / CPU Queen | |
| Microsoft Surface Laptop 4 15 AMD TFF_00028 | |
| Lenovo ThinkPad L15 G2 AMD | |
| Dell Latitude 9510 2-in-1 | |
| HP EliteBook 850 G8 3C7Z8EA | |
| Medio Intel Core i7-1185G7 (44677 - 52815, n=20) | |
| Dell Latitude 15 9520 2-in-1 | |
| MSI Summit B15 A11M | |
| AIDA64 / FPU SinJulia | |
| Microsoft Surface Laptop 4 15 AMD TFF_00028 | |
| Lenovo ThinkPad L15 G2 AMD | |
| Dell Latitude 9510 2-in-1 | |
| MSI Summit B15 A11M | |
| Medio Intel Core i7-1185G7 (3870 - 5027, n=20) | |
| HP EliteBook 850 G8 3C7Z8EA | |
| Dell Latitude 15 9520 2-in-1 | |
| AIDA64 / FPU Mandel | |
| Microsoft Surface Laptop 4 15 AMD TFF_00028 | |
| Lenovo ThinkPad L15 G2 AMD | |
| MSI Summit B15 A11M | |
| Medio Intel Core i7-1185G7 (14584 - 19594, n=20) | |
| HP EliteBook 850 G8 3C7Z8EA | |
| Dell Latitude 15 9520 2-in-1 | |
| Dell Latitude 9510 2-in-1 | |
| AIDA64 / CPU ZLib | |
| Microsoft Surface Laptop 4 15 AMD TFF_00028 | |
| Lenovo ThinkPad L15 G2 AMD | |
| Dell Latitude 9510 2-in-1 | |
| MSI Summit B15 A11M | |
| HP EliteBook 850 G8 3C7Z8EA | |
| Medio Intel Core i7-1185G7 (258 - 412, n=22) | |
| Dell Latitude 15 9520 2-in-1 | |
| AIDA64 / FP64 Ray-Trace | |
| Microsoft Surface Laptop 4 15 AMD TFF_00028 | |
| Lenovo ThinkPad L15 G2 AMD | |
| MSI Summit B15 A11M | |
| Medio Intel Core i7-1185G7 (2821 - 4094, n=20) | |
| HP EliteBook 850 G8 3C7Z8EA | |
| Dell Latitude 15 9520 2-in-1 | |
| Dell Latitude 9510 2-in-1 | |
| AIDA64 / CPU PhotoWorxx | |
| Dell Latitude 15 9520 2-in-1 | |
| Medio Intel Core i7-1185G7 (22349 - 43701, n=20) | |
| MSI Summit B15 A11M | |
| HP EliteBook 850 G8 3C7Z8EA | |
| Microsoft Surface Laptop 4 15 AMD TFF_00028 | |
| Dell Latitude 9510 2-in-1 | |
| Lenovo ThinkPad L15 G2 AMD | |
Rendimiento del sistema
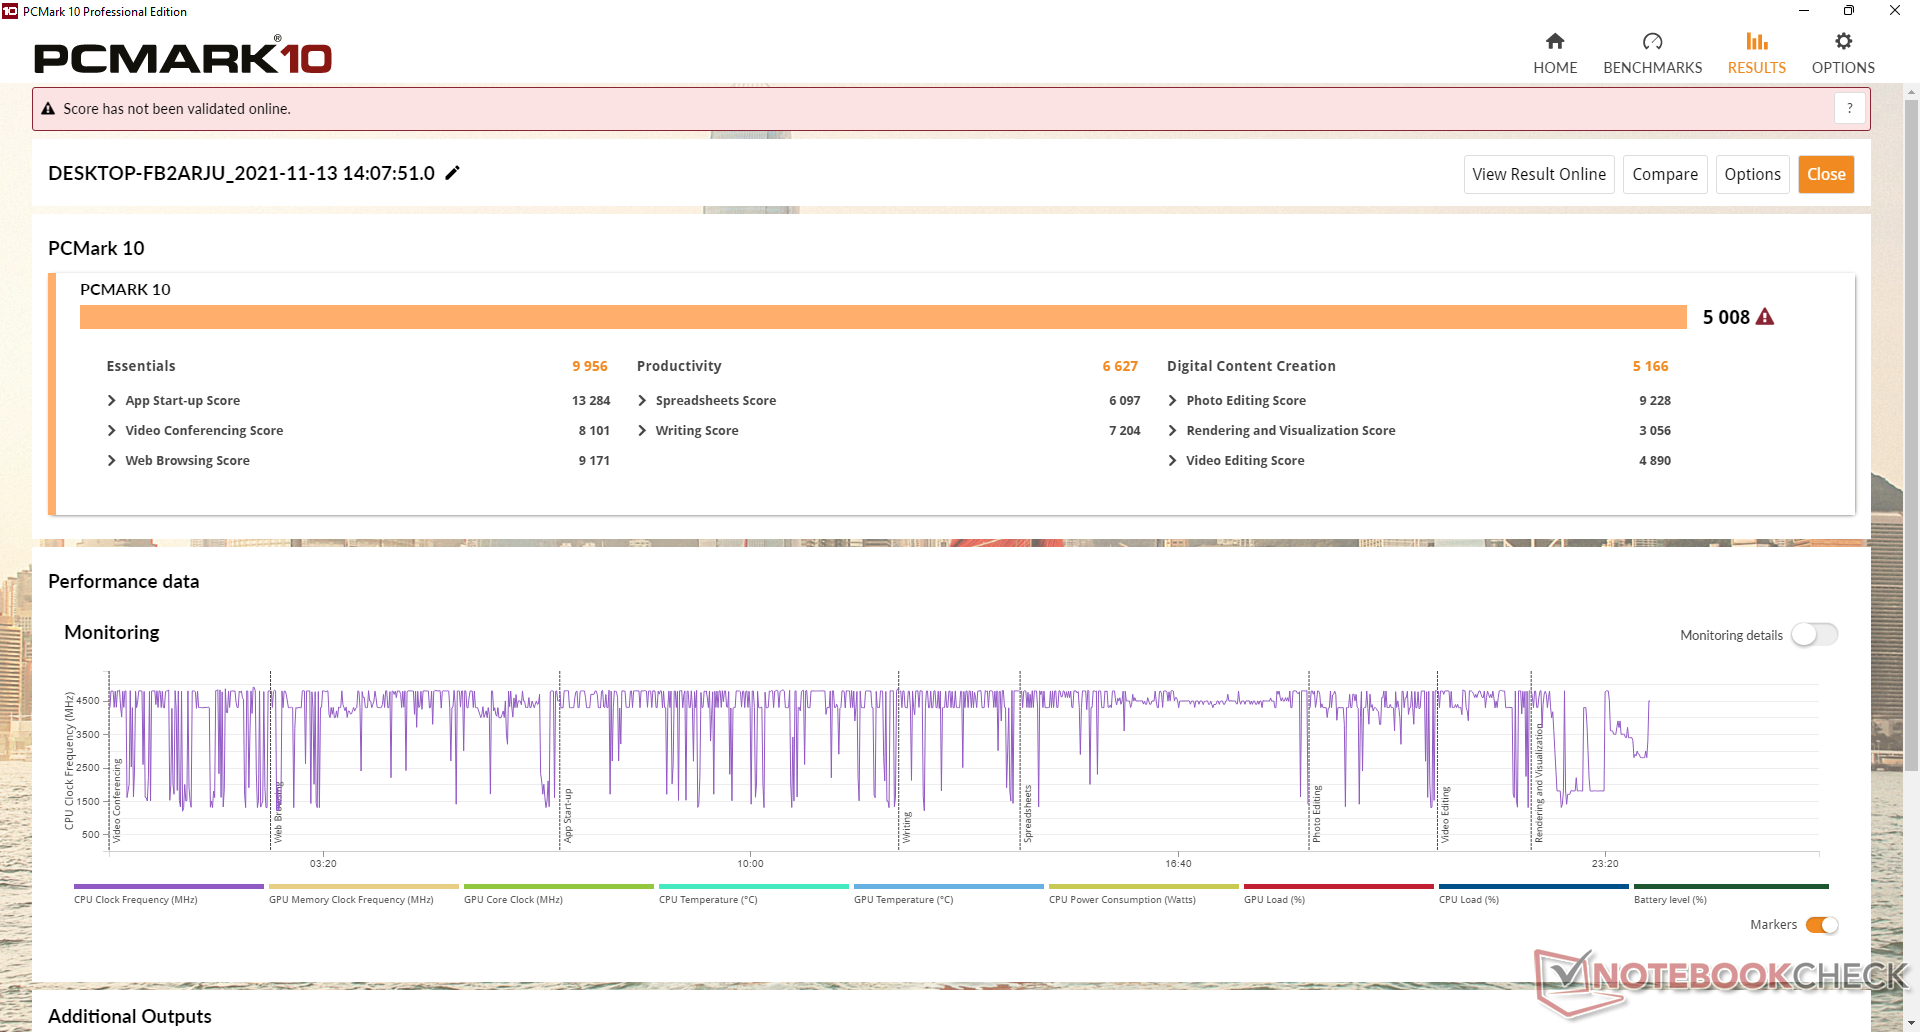
Las puntuaciones de PCMark 10 son generalmente más altas que las que registramos en el Latitude 9510 2-en-1, especialmente en Creación de Contenidos Digitales, donde los gráficos son lo más importante. El modelo más antiguo tiene una puntuación más alta en Productividad, probablemente debido a su mayor rendimiento multihilo.
| PCMark 10 / Score | |
| Lenovo ThinkPad L15 G2 AMD | |
| Microsoft Surface Laptop 4 15 AMD TFF_00028 | |
| Dell Latitude 15 9520 2-in-1 | |
| Medio Intel Core i7-1185G7, Intel Iris Xe Graphics G7 96EUs (4746 - 5561, n=20) | |
| HP EliteBook 850 G8 3C7Z8EA | |
| MSI Summit B15 A11M | |
| Dell Latitude 9510 2-in-1 | |
| PCMark 10 / Essentials | |
| Lenovo ThinkPad L15 G2 AMD | |
| Dell Latitude 15 9520 2-in-1 | |
| Medio Intel Core i7-1185G7, Intel Iris Xe Graphics G7 96EUs (8279 - 10664, n=20) | |
| Dell Latitude 9510 2-in-1 | |
| MSI Summit B15 A11M | |
| HP EliteBook 850 G8 3C7Z8EA | |
| Microsoft Surface Laptop 4 15 AMD TFF_00028 | |
| PCMark 10 / Productivity | |
| Lenovo ThinkPad L15 G2 AMD | |
| Microsoft Surface Laptop 4 15 AMD TFF_00028 | |
| Dell Latitude 9510 2-in-1 | |
| HP EliteBook 850 G8 3C7Z8EA | |
| Medio Intel Core i7-1185G7, Intel Iris Xe Graphics G7 96EUs (5799 - 8770, n=20) | |
| Dell Latitude 15 9520 2-in-1 | |
| MSI Summit B15 A11M | |
| PCMark 10 / Digital Content Creation | |
| Microsoft Surface Laptop 4 15 AMD TFF_00028 | |
| Dell Latitude 15 9520 2-in-1 | |
| Medio Intel Core i7-1185G7, Intel Iris Xe Graphics G7 96EUs (4424 - 5684, n=20) | |
| HP EliteBook 850 G8 3C7Z8EA | |
| Lenovo ThinkPad L15 G2 AMD | |
| MSI Summit B15 A11M | |
| Dell Latitude 9510 2-in-1 | |
| PCMark 10 Score | 5008 puntos | |
ayuda | ||
| AIDA64 / Memory Copy | |
| Dell Latitude 15 9520 2-in-1 | |
| Medio Intel Core i7-1185G7 (36515 - 68450, n=20) | |
| HP EliteBook 850 G8 3C7Z8EA | |
| Microsoft Surface Laptop 4 15 AMD TFF_00028 | |
| MSI Summit B15 A11M | |
| Dell Latitude 9510 2-in-1 | |
| Lenovo ThinkPad L15 G2 AMD | |
| AIDA64 / Memory Read | |
| Dell Latitude 15 9520 2-in-1 | |
| Medio Intel Core i7-1185G7 (38394 - 64291, n=20) | |
| HP EliteBook 850 G8 3C7Z8EA | |
| Microsoft Surface Laptop 4 15 AMD TFF_00028 | |
| MSI Summit B15 A11M | |
| Dell Latitude 9510 2-in-1 | |
| Lenovo ThinkPad L15 G2 AMD | |
| AIDA64 / Memory Write | |
| Dell Latitude 15 9520 2-in-1 | |
| Medio Intel Core i7-1185G7 (37684 - 66873, n=20) | |
| HP EliteBook 850 G8 3C7Z8EA | |
| MSI Summit B15 A11M | |
| Microsoft Surface Laptop 4 15 AMD TFF_00028 | |
| Dell Latitude 9510 2-in-1 | |
| Lenovo ThinkPad L15 G2 AMD | |
| AIDA64 / Memory Latency | |
| Microsoft Surface Laptop 4 15 AMD TFF_00028 | |
| Dell Latitude 15 9520 2-in-1 | |
| Dell Latitude 9510 2-in-1 | |
| Lenovo ThinkPad L15 G2 AMD | |
| Medio Intel Core i7-1185G7 (78.3 - 117, n=22) | |
| MSI Summit B15 A11M | |
| HP EliteBook 850 G8 3C7Z8EA | |
* ... más pequeño es mejor
Latencia del CPD
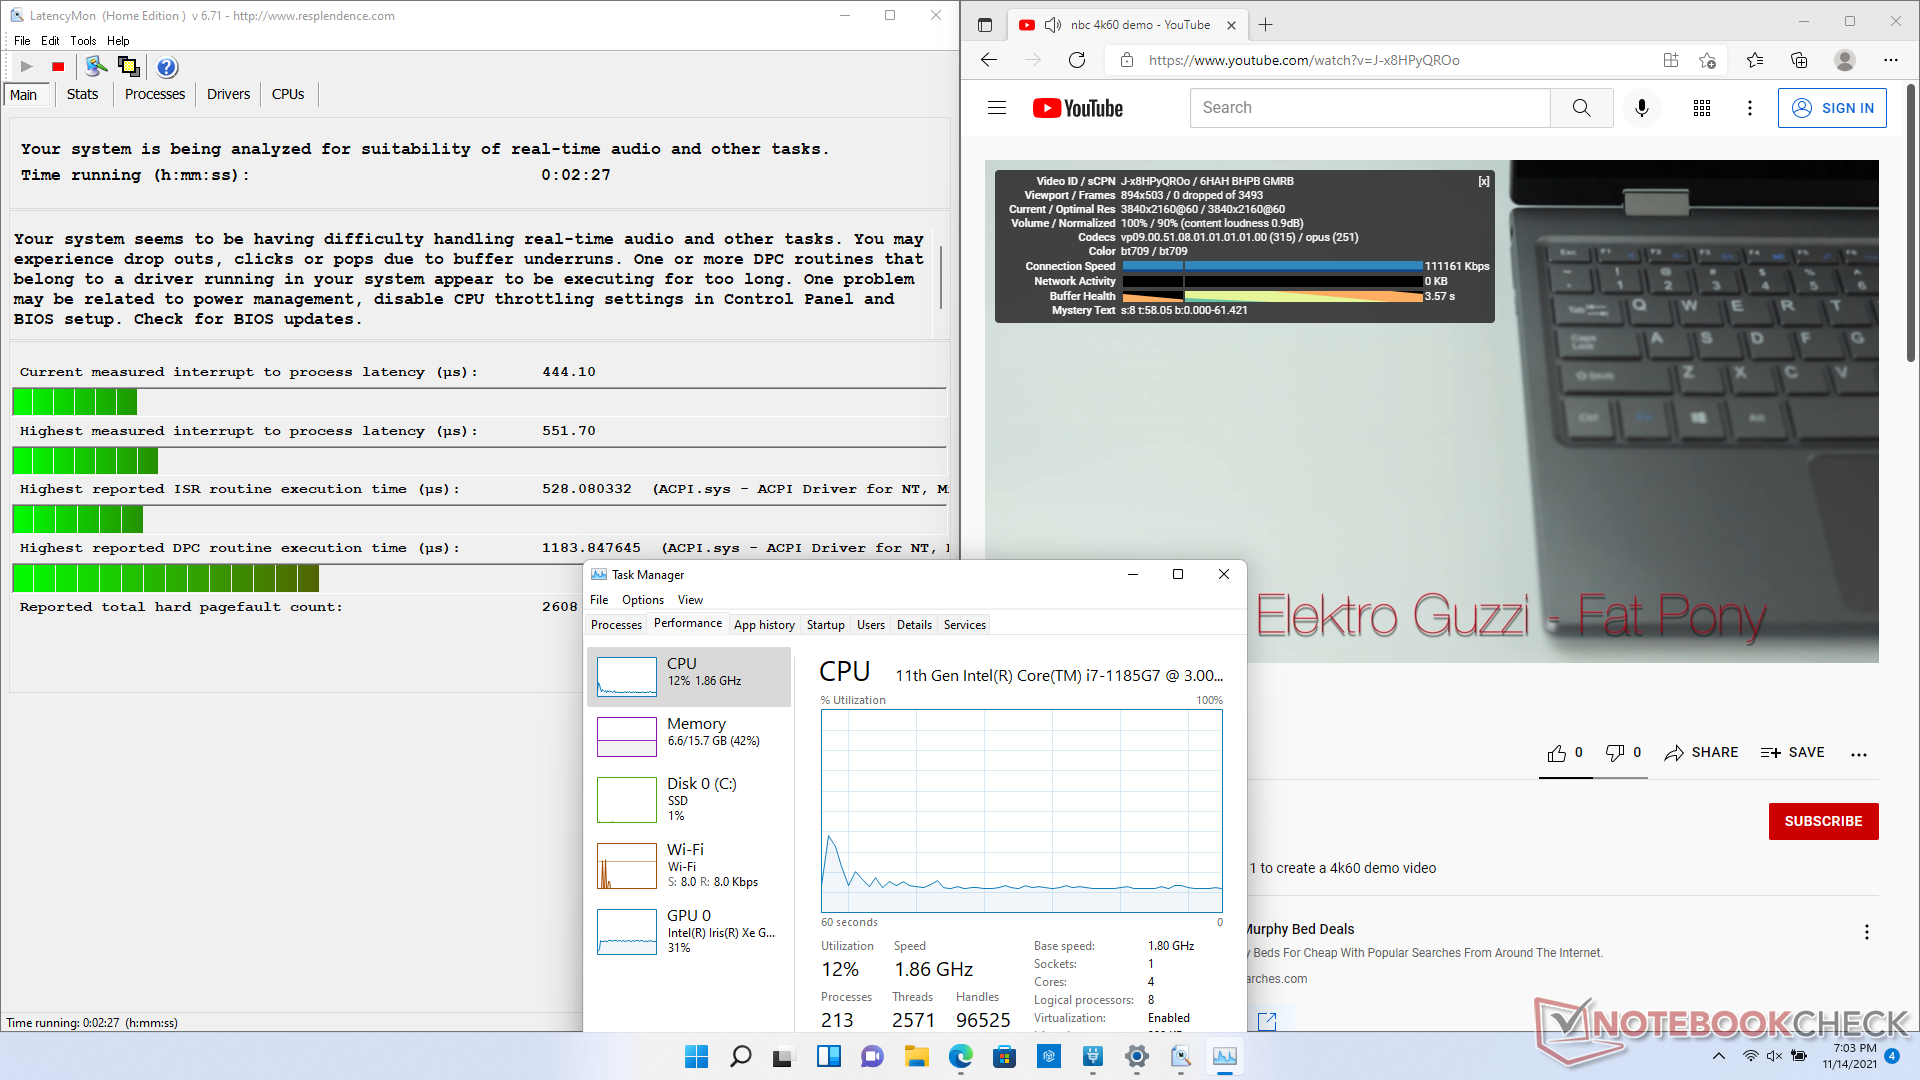
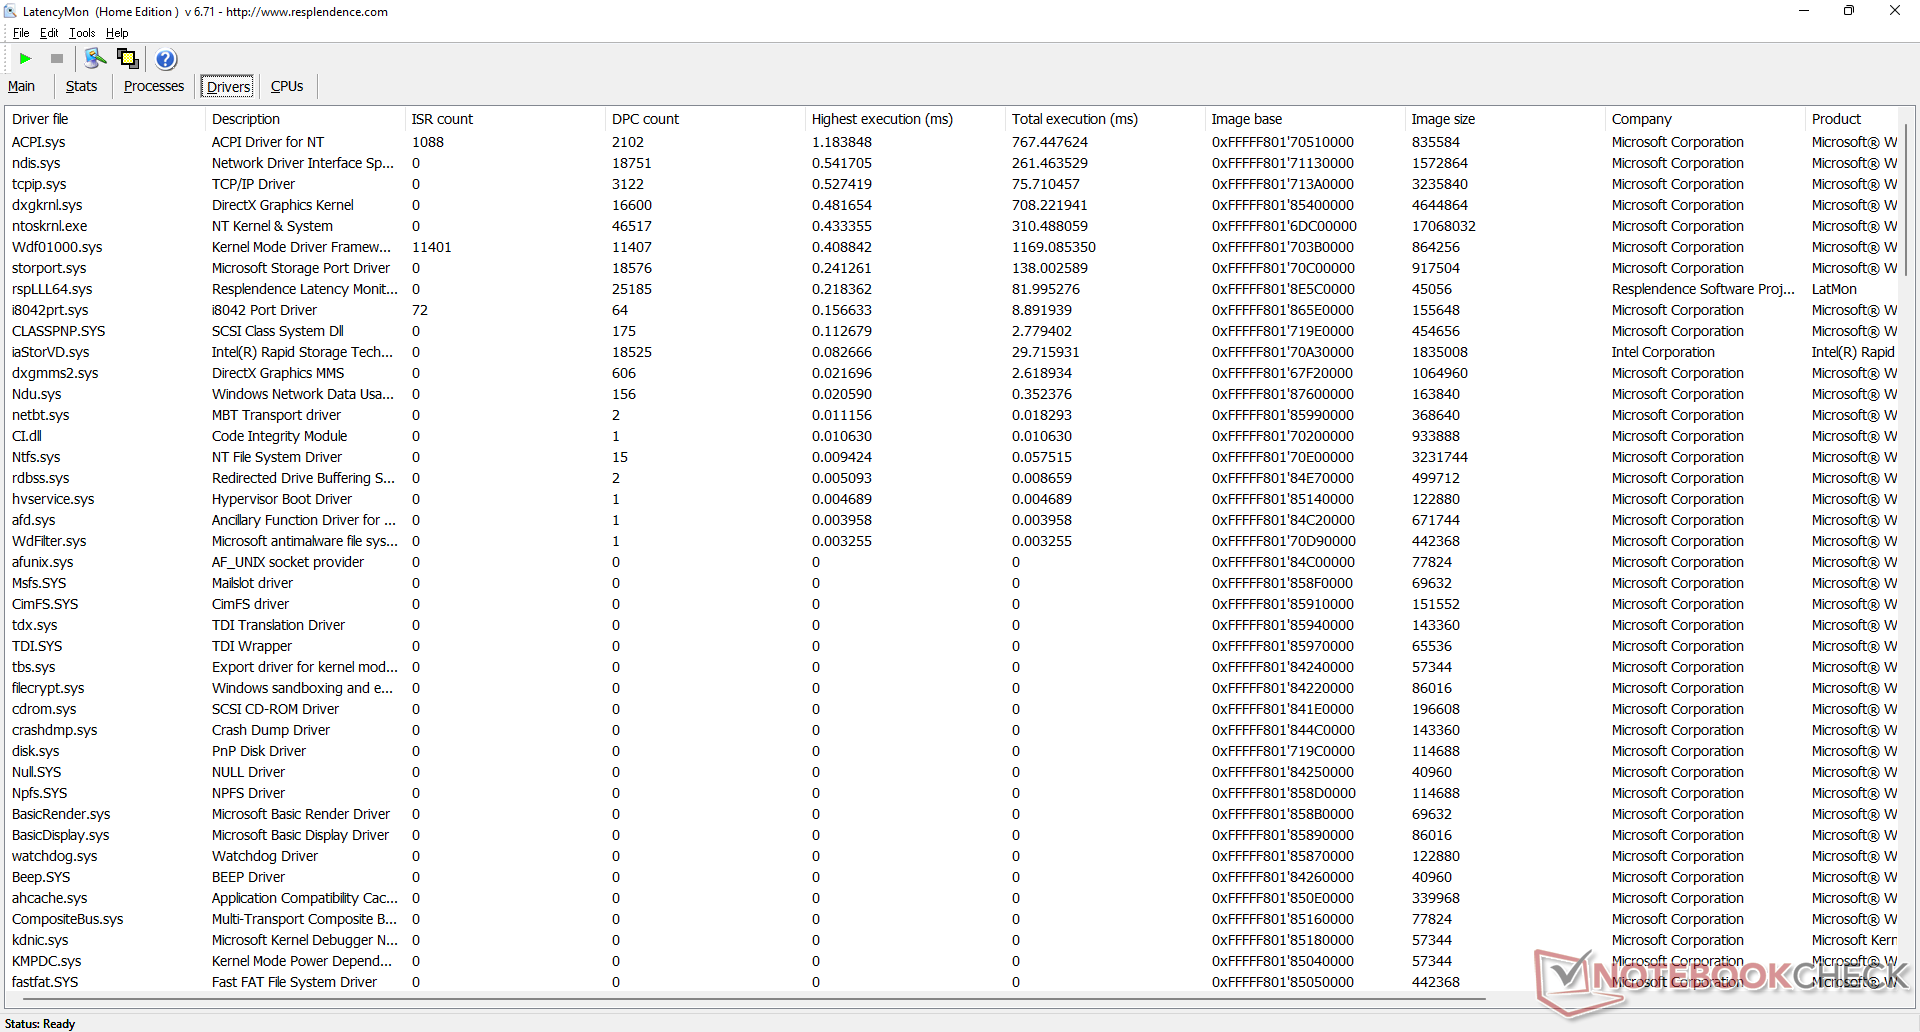
LatencyMon muestra problemas menores de latencia DPC relacionados con ACPI.sys al abrir varias pestañas de nuestra página web. No obstante, sigue siendo una mejora en comparación con lo que observamos en el modelo del año pasado
La reproducción de vídeo 4K a 60 FPS sigue siendo perfecta, sin caídas de frames y con un uso más eficiente de la GPU que con la UHD Graphics 620.
| DPC Latencies / LatencyMon - interrupt to process latency (max), Web, Youtube, Prime95 | |
| Dell Latitude 9510 2-in-1 | |
| Lenovo ThinkPad L15 G2 AMD | |
| HP EliteBook 850 G8 3C7Z8EA | |
| MSI Summit B15 A11M | |
| Microsoft Surface Laptop 4 15 AMD TFF_00028 | |
| Dell Latitude 15 9520 2-in-1 | |
* ... más pequeño es mejor
Dispositivos de almacenamiento
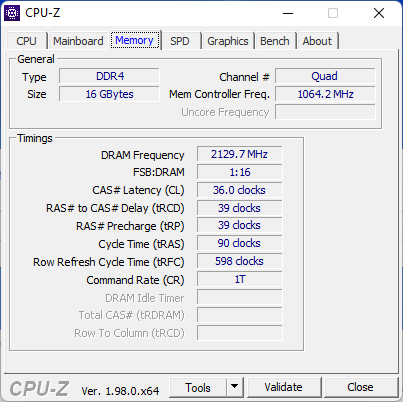
Nuestra unidad de prueba utiliza el mismo PCIe3 x4 Toshiba KBG40ZNS512G NVMe M.2 2230 que se encuentra en el Latitude 9510 2-en-1. Dell no ofrece actualmente opciones PCIe4 aunque el chipset Intel debería ser capaz de soportar teóricamente tales SSDs. Sin embargo, la falta de un disipador de calor significará que cualquier SSD PCIe4 probablemente se ralentizará tras un breve periodo de tiempo.

* ... más pequeño es mejor
Disk Throttling: DiskSpd Read Loop, Queue Depth 8
Rendimiento de la GPU
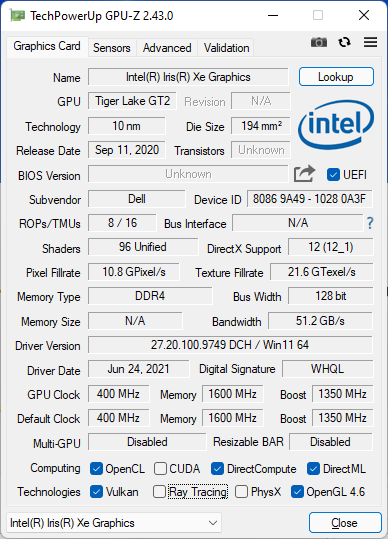
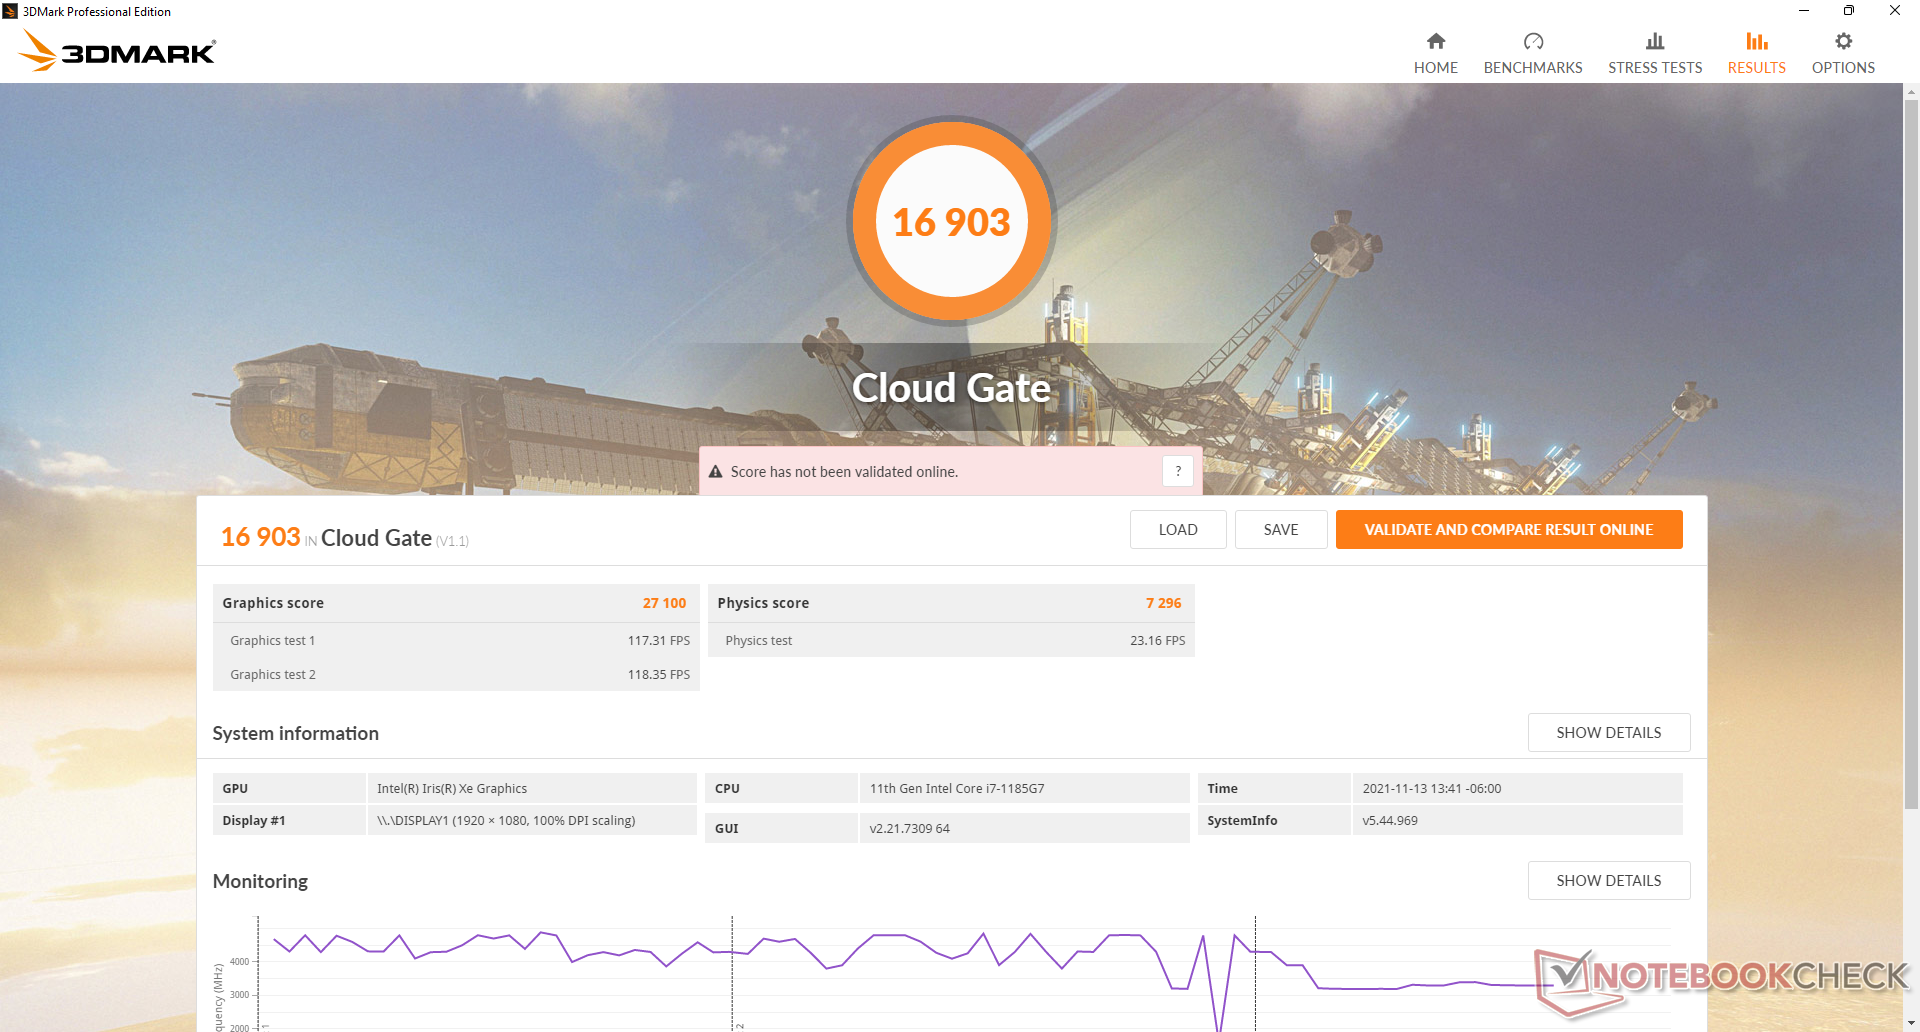
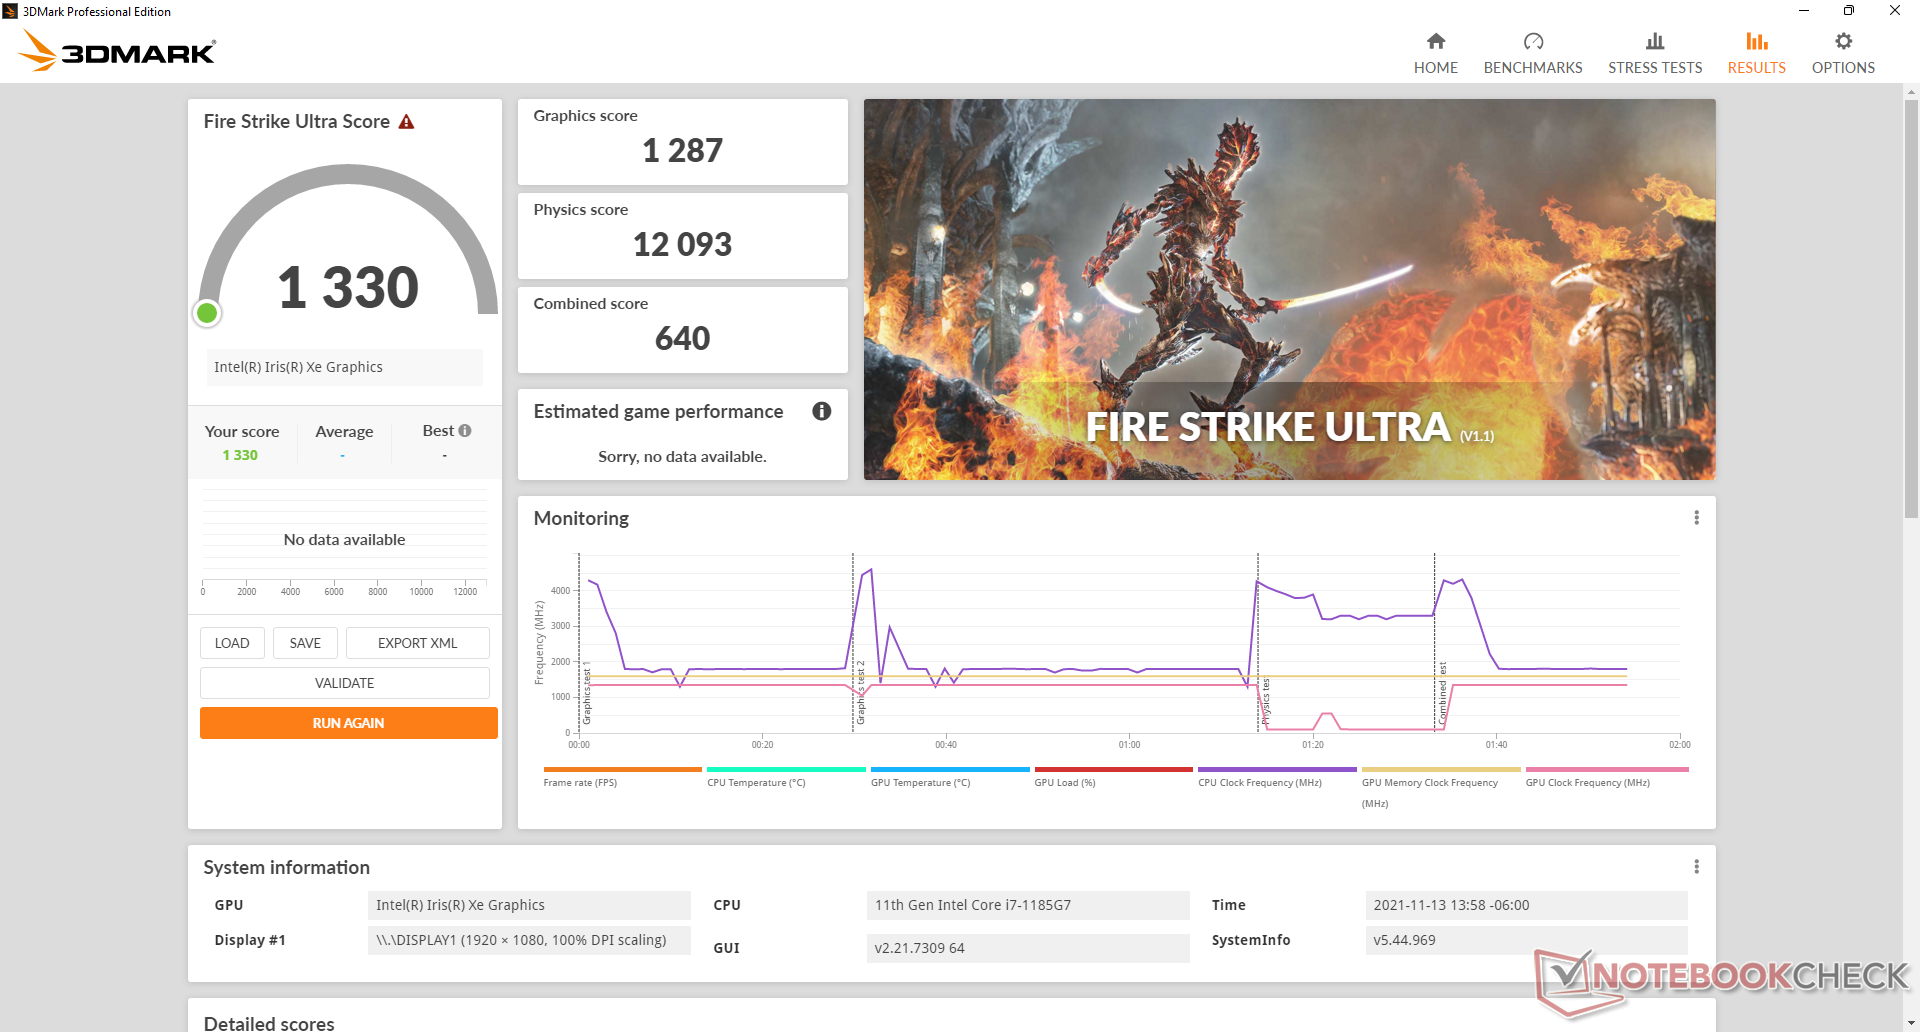
Las puntuaciones de 3DMark muestran que el Iris Xe 96 UE en nuestro Latitude 9520 2-en-1 rindiendo bien en relación con otros portátiles Iris Xe de nuestra base de datos. Sin embargo, el diablo está en los detalles, ya que el rendimiento de los juegos en el mundo real es pobre debido a la inusual fluctuación de las velocidades de fotogramas. Por ejemplo, las tasas de fotogramas saltan constantemente entre 40 FPS y 90 FPS cuando simplemente está en reposo en Witcher 3 en su configuración más baja, mientras que el Iris Xe-powered MSI Summit B15 funcionaría de forma mucho más estable sin ninguna de las fuertes caídas de FPS. Así, mientras que nuestro Latitude 9520 2-en-1 Iris Xe es indudablemente más rápido que el UHD Graphics 620 del Latitude 9510 2-en-1 del año pasado, podría haber sido definitivamente más estable en términos de rendimiento con el tiempo.
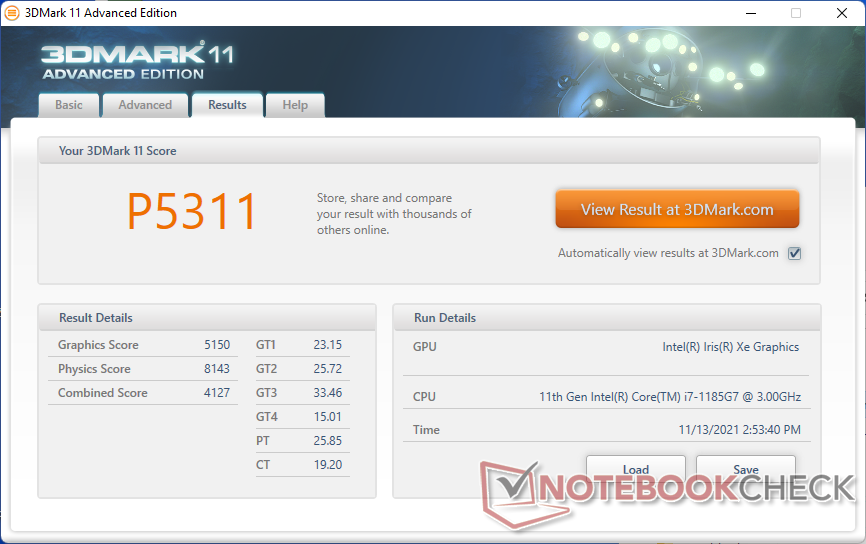
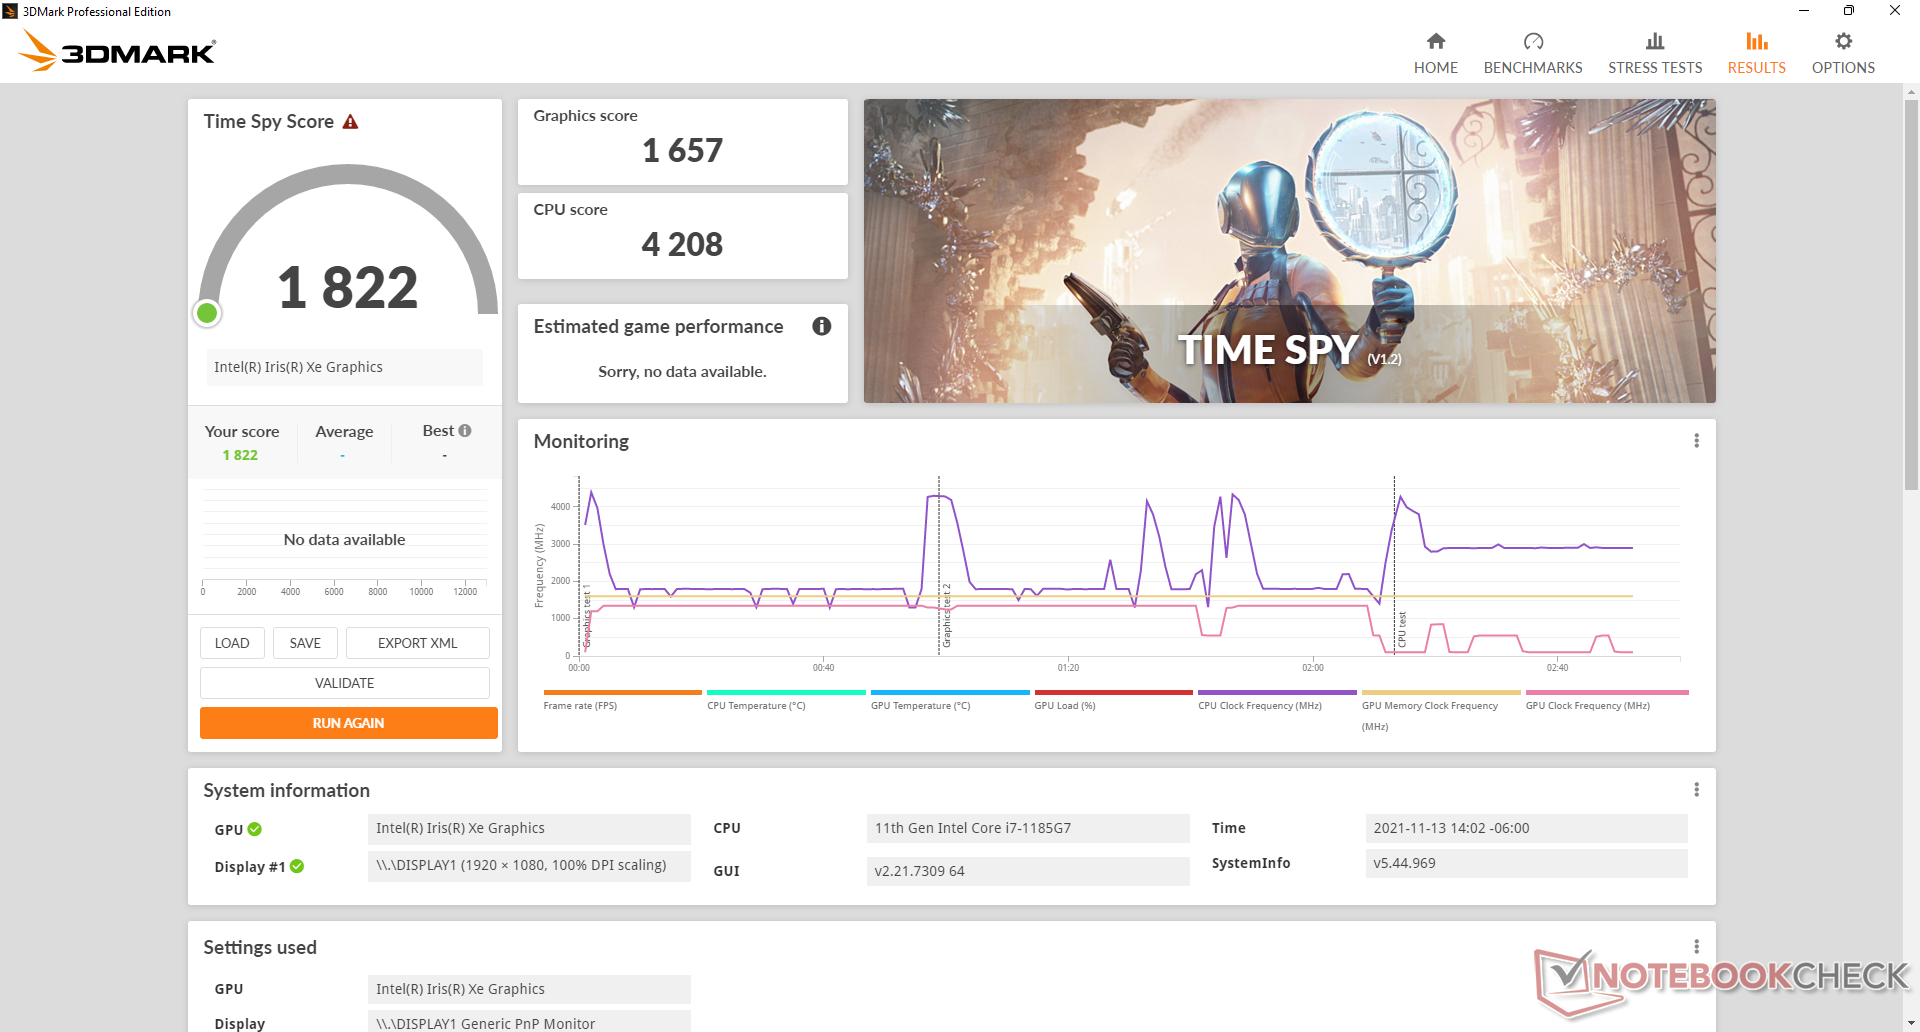
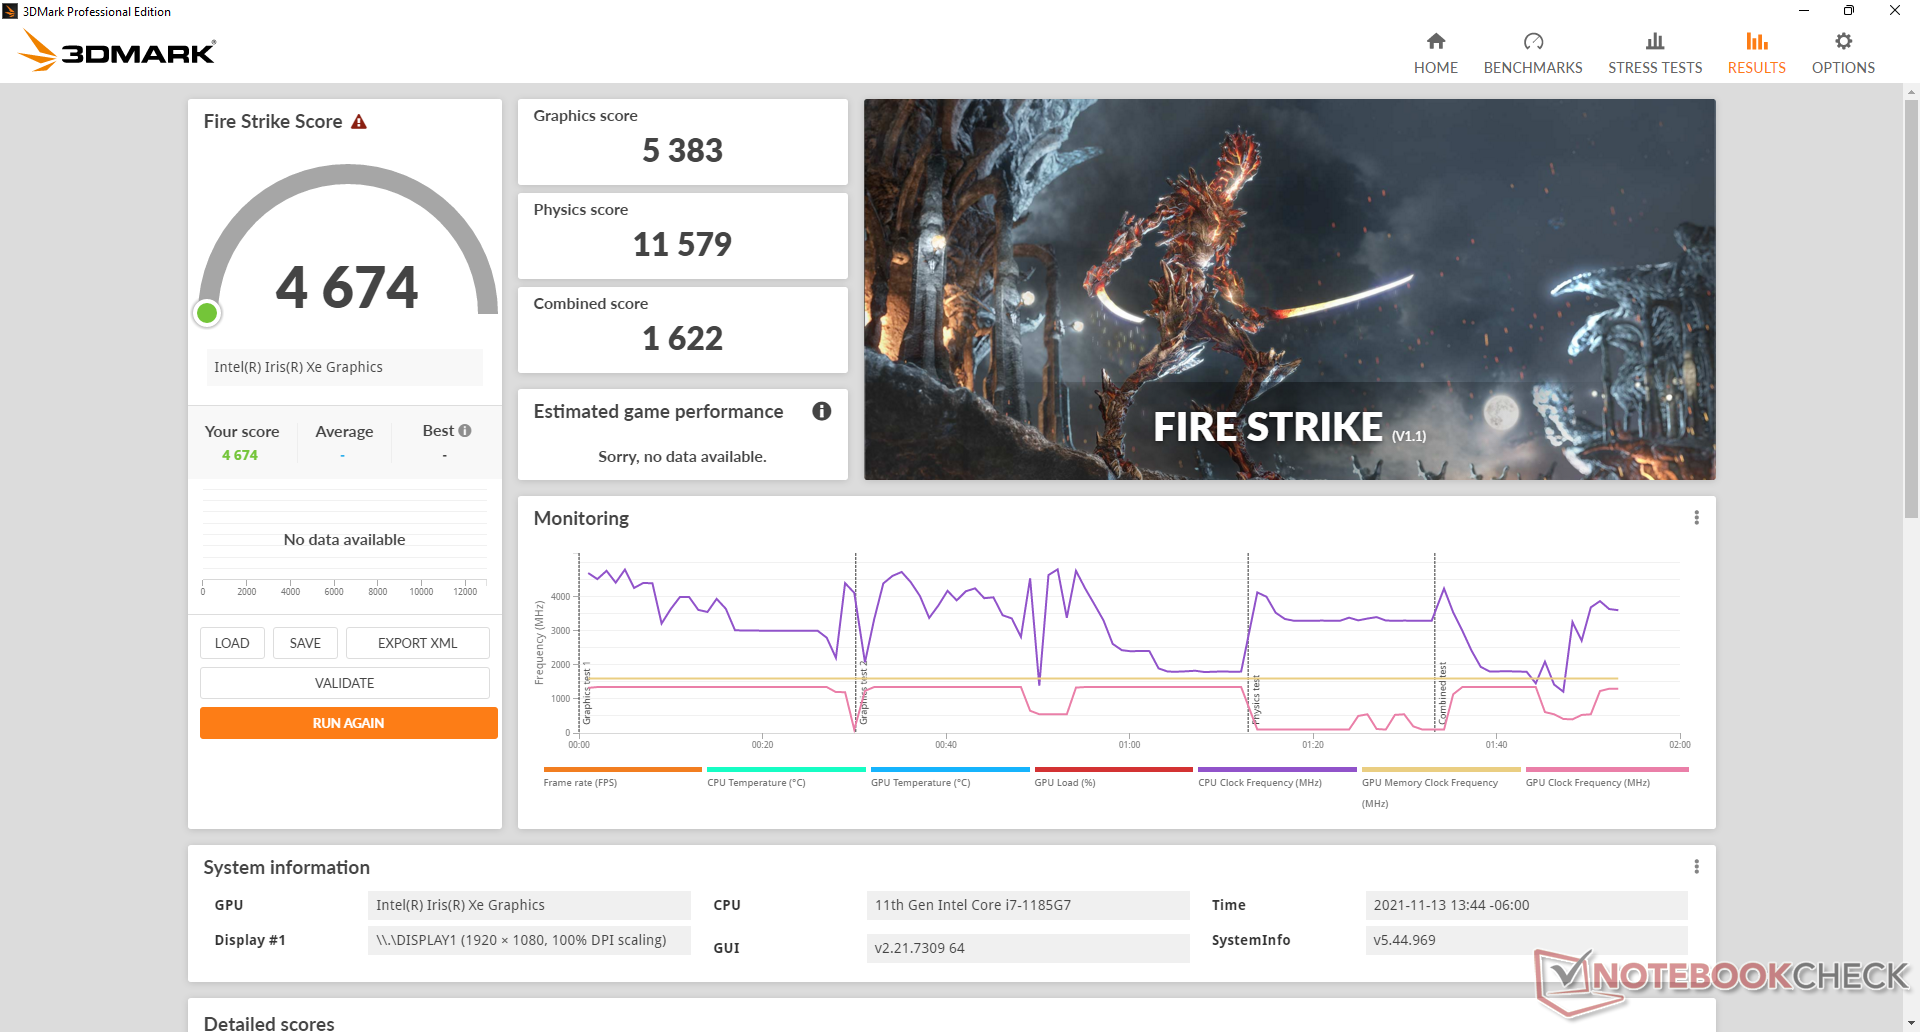
| 3DMark 11 Performance | 5311 puntos | |
| 3DMark Cloud Gate Standard Score | 16903 puntos | |
| 3DMark Fire Strike Score | 4674 puntos | |
| 3DMark Time Spy Score | 1822 puntos | |
ayuda | ||
Witcher 3 FPS Chart
| bajo | medio | alto | ultra | |
|---|---|---|---|---|
| GTA V (2015) | 81 | 70.5 | 27.2 | 10.6 |
| The Witcher 3 (2015) | 86.8 | 59.4 | 33.5 | 14.3 |
| Dota 2 Reborn (2015) | 103 | 61.7 | 39.8 | 39.8 |
| Final Fantasy XV Benchmark (2018) | 35 | 20 | 14.6 | |
| X-Plane 11.11 (2018) | 36 | 34.4 | 27.5 | |
| Strange Brigade (2018) | 82.8 | 32.7 | 26.3 | 23.2 |
Emisiones
Ruido del sistema
El ventilador interno es silencioso, con 24,1 dN(A) cuando está en reposo o navegando por la web en el modo equilibrado u optimizado o inferior. Ocasionalmente puede saltar a 25,8 dB(A), pero esto será imperceptible en la mayoría de los entornos. Los usuarios pueden alcanzar el ruido máximo del ventilador de poco menos de 40 dB(A) cuando se ejecutan cargas más altas como los juegos.
El ruido del ventilador será más frecuente si se ajusta al modo de alto rendimiento cuando se navega o se transmite vídeo. Por lo tanto, asegúrese de configurar el perfil de energía adecuadamente si el ruido del ventilador es una preocupación.
Ruido
| Ocioso |
| 24.1 / 24.1 / 25.8 dB(A) |
| Carga |
| 34.2 / 39.6 dB(A) |
 | ||
30 dB silencioso 40 dB(A) audible 50 dB(A) ruidosamente alto |
||
min: | ||
| Dell Latitude 15 9520 2-in-1 Iris Xe G7 96EUs, i7-1185G7, Toshiba KBG40ZNS512G NVMe | Dell Latitude 9510 2-in-1 UHD Graphics 620, i7-10810U, Toshiba KBG40ZNS512G NVMe | HP EliteBook 850 G8 3C7Z8EA Iris Xe G7 96EUs, i7-1165G7, Samsung PM981a MZVLB1T0HBLR | Lenovo ThinkPad L15 G2 AMD Vega 7, R5 5600U, SK Hynix HFS512 GDE9X081N | MSI Summit B15 A11M Iris Xe G7 96EUs, i7-1165G7, Kingston OM8PCP31024F | Microsoft Surface Laptop 4 15 AMD TFF_00028 Vega 8, R7 4980U, SK Hynix BC511 HFM512GDJTNI | |
|---|---|---|---|---|---|---|
| Noise | -7% | 0% | 6% | -1% | -2% | |
| apagado / medio ambiente * (dB) | 24 | 27.2 -13% | 26 -8% | 24.22 -1% | 25.2 -5% | 24.2 -1% |
| Idle Minimum * (dB) | 24.1 | 27.2 -13% | 26 -8% | 24.22 -0% | 26.4 -10% | 24.2 -0% |
| Idle Average * (dB) | 24.1 | 27.2 -13% | 26 -8% | 24.22 -0% | 26.4 -10% | 24.2 -0% |
| Idle Maximum * (dB) | 25.8 | 27.2 -5% | 26.2 -2% | 24.22 6% | 26.4 -2% | 24.2 6% |
| Load Average * (dB) | 34.2 | 33.4 2% | 29.5 14% | 25.84 24% | 26.8 22% | 39.9 -17% |
| Witcher 3 ultra * (dB) | 39.6 | 28 29% | 39.9 -1% | |||
| Load Maximum * (dB) | 39.6 | 39.5 -0% | 34 14% | 36.02 9% | 52.6 -33% | 39.9 -1% |
* ... más pequeño es mejor
Temperatura
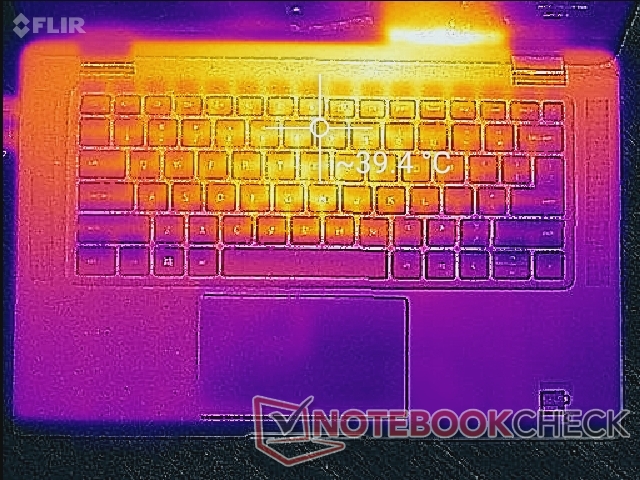
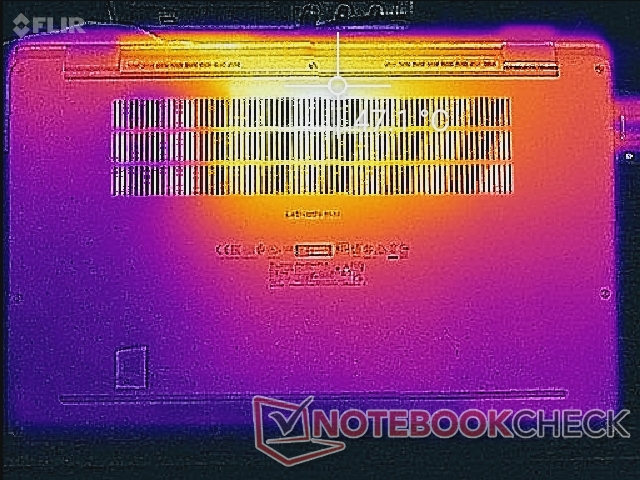
Las temperaturas de la superficie son similares a las del Latitude 9510 2-en-1 cuando se ejecutan cargas bajas o medias. Sin embargo, si se ejecutan cargas más altas, como los juegos, el punto caliente inferior del Latitude 9520 2-en-1 puede estar unos grados más caliente que en el modelo anterior.
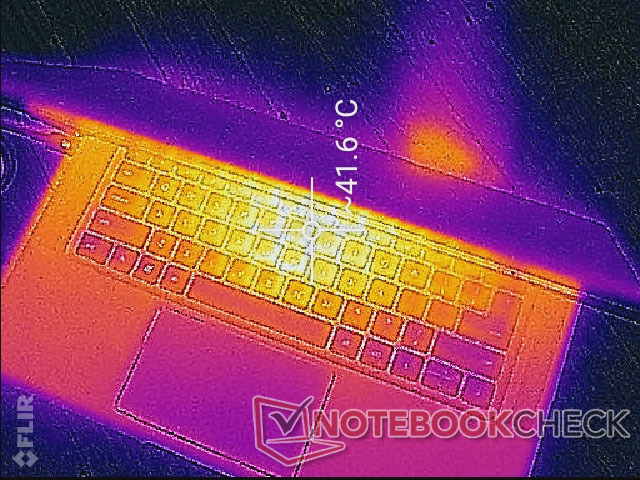
(±) La temperatura máxima en la parte superior es de 40 °C / 104 F, frente a la media de 34.3 °C / 94 F, que oscila entre 21.2 y 62.5 °C para la clase Office.
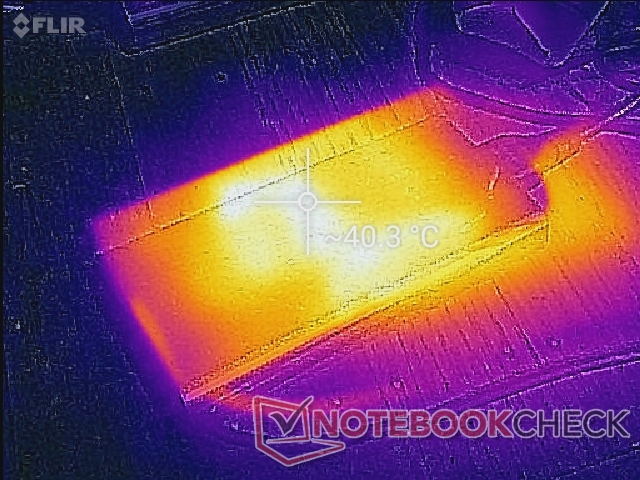
(-) El fondo se calienta hasta un máximo de 47.2 °C / 117 F, frente a la media de 36.8 °C / 98 F
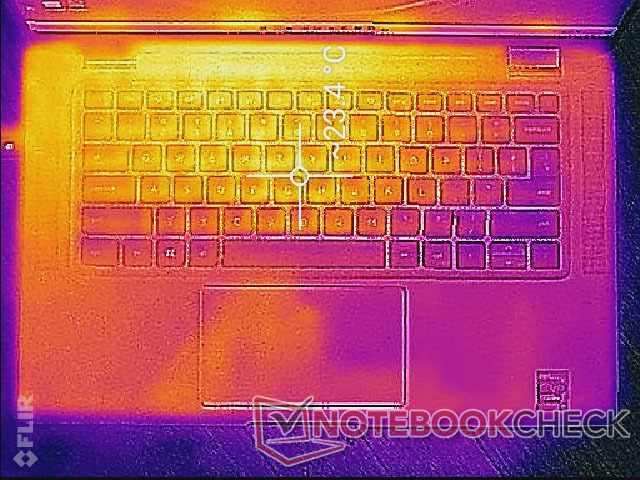
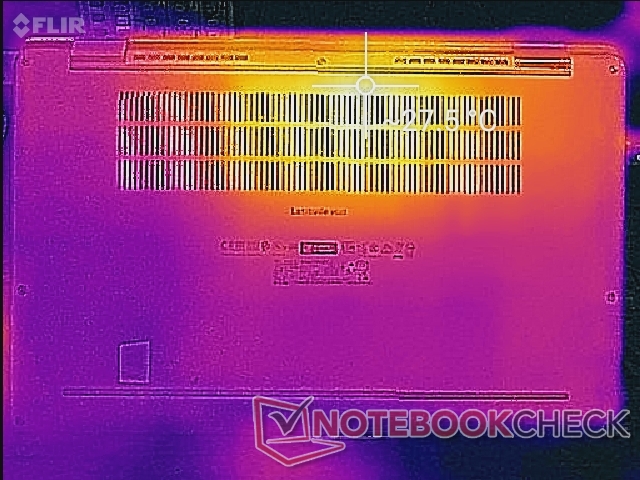
(+) En reposo, la temperatura media de la parte superior es de 22.5 °C / 73# F, frente a la media del dispositivo de 29.5 °C / 85 F.
(+) El reposamanos y el panel táctil están a una temperatura inferior a la de la piel, con un máximo de 28.6 °C / 83.5 F y, por tanto, son fríos al tacto.
(±) La temperatura media de la zona del reposamanos de dispositivos similares fue de 27.6 °C / 81.7 F (-1 °C / -1.8 F).
| Dell Latitude 15 9520 2-in-1 Intel Core i7-1185G7, Intel Iris Xe Graphics G7 96EUs | Dell Latitude 9510 2-in-1 Intel Core i7-10810U, Intel UHD Graphics 620 | HP EliteBook 850 G8 3C7Z8EA Intel Core i7-1165G7, Intel Iris Xe Graphics G7 96EUs | Lenovo ThinkPad L15 G2 AMD AMD Ryzen 5 5600U, AMD Radeon RX Vega 7 | MSI Summit B15 A11M Intel Core i7-1165G7, Intel Iris Xe Graphics G7 96EUs | Microsoft Surface Laptop 4 15 AMD TFF_00028 AMD Ryzen 7 4980U, AMD Radeon RX Vega 8 (Ryzen 4000/5000) | |
|---|---|---|---|---|---|---|
| Heat | -9% | -3% | -8% | -8% | 4% | |
| Maximum Upper Side * (°C) | 40 | 42.8 -7% | 37.9 5% | 42.8 -7% | 42.8 -7% | 41.8 -5% |
| Maximum Bottom * (°C) | 47.2 | 41.8 11% | 39 17% | 46 3% | 52.2 -11% | 44.8 5% |
| Idle Upper Side * (°C) | 23.4 | 29.2 -25% | 31 -32% | 26.9 -15% | 26 -11% | 23 2% |
| Idle Bottom * (°C) | 27.4 | 31 -13% | 27.8 -1% | 31.1 -14% | 28.2 -3% | 23.6 14% |
* ... más pequeño es mejor
Prueba de esfuerzo
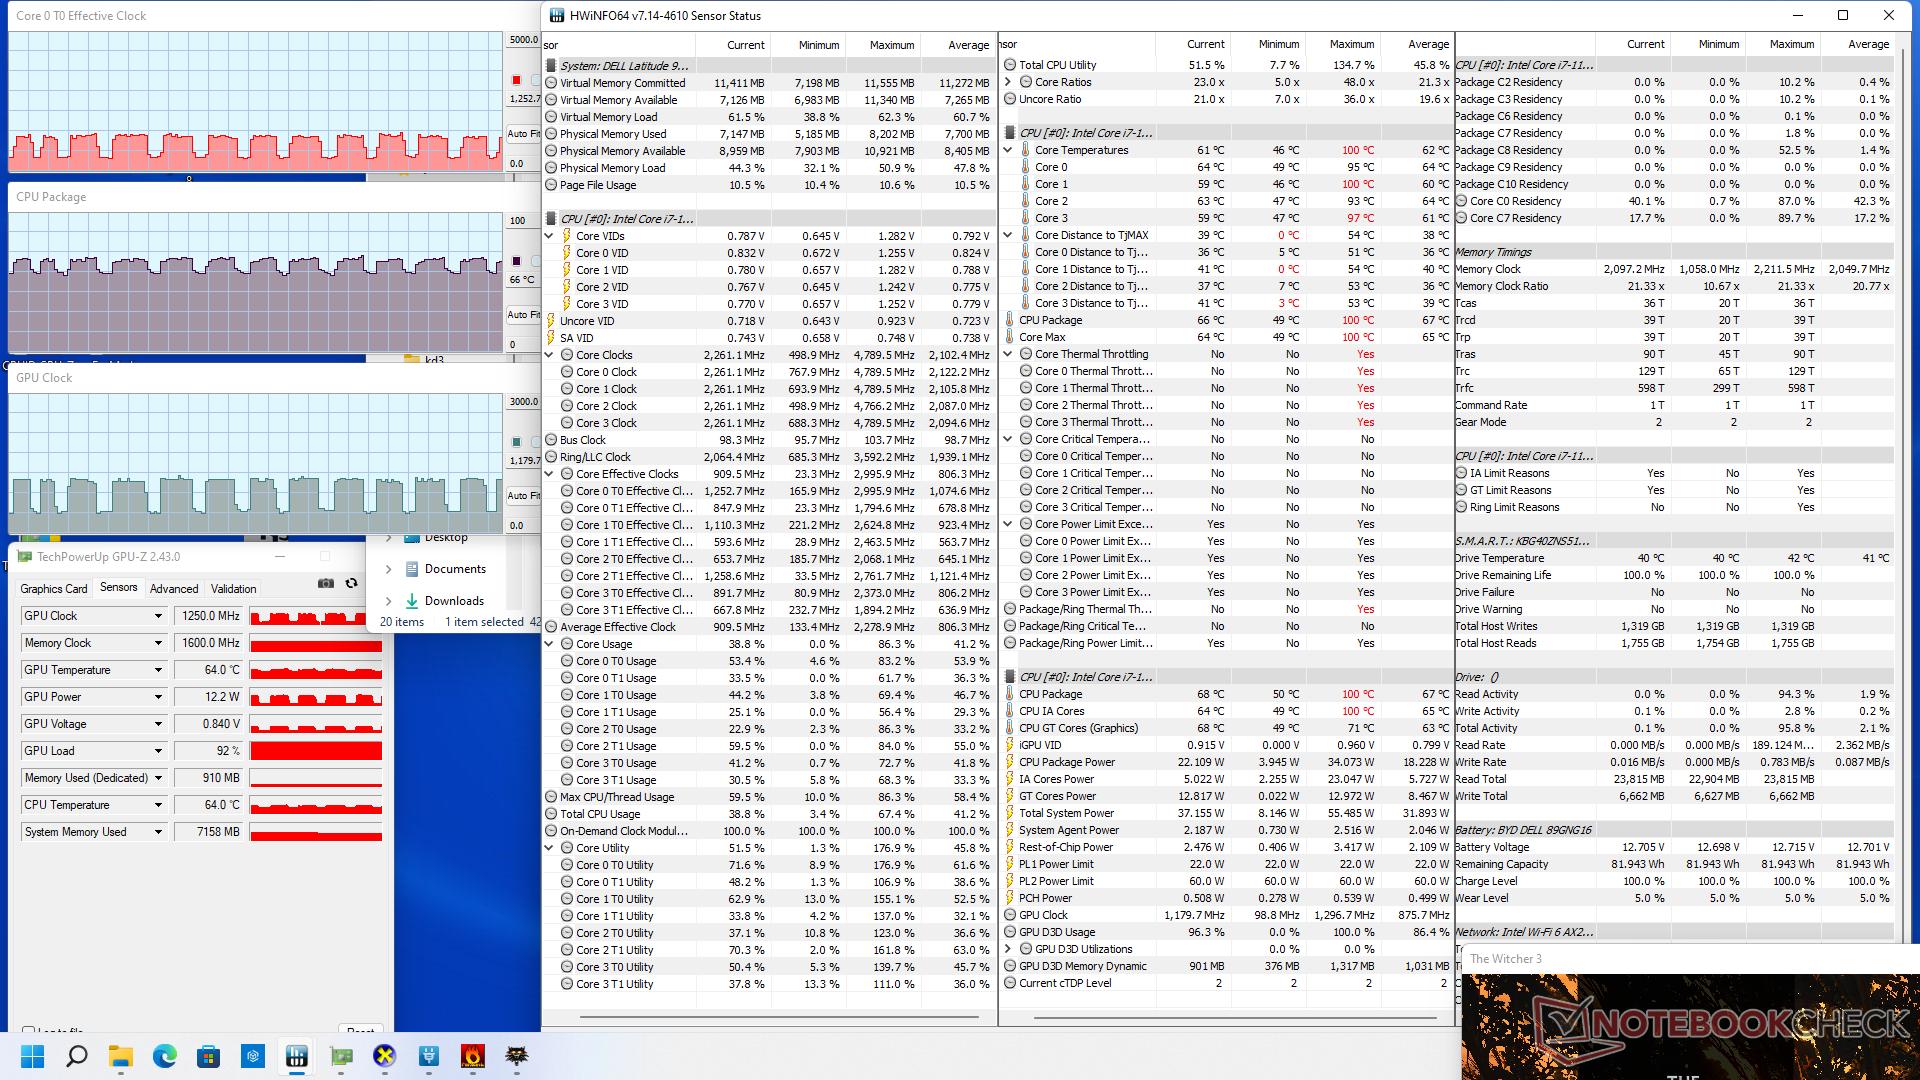
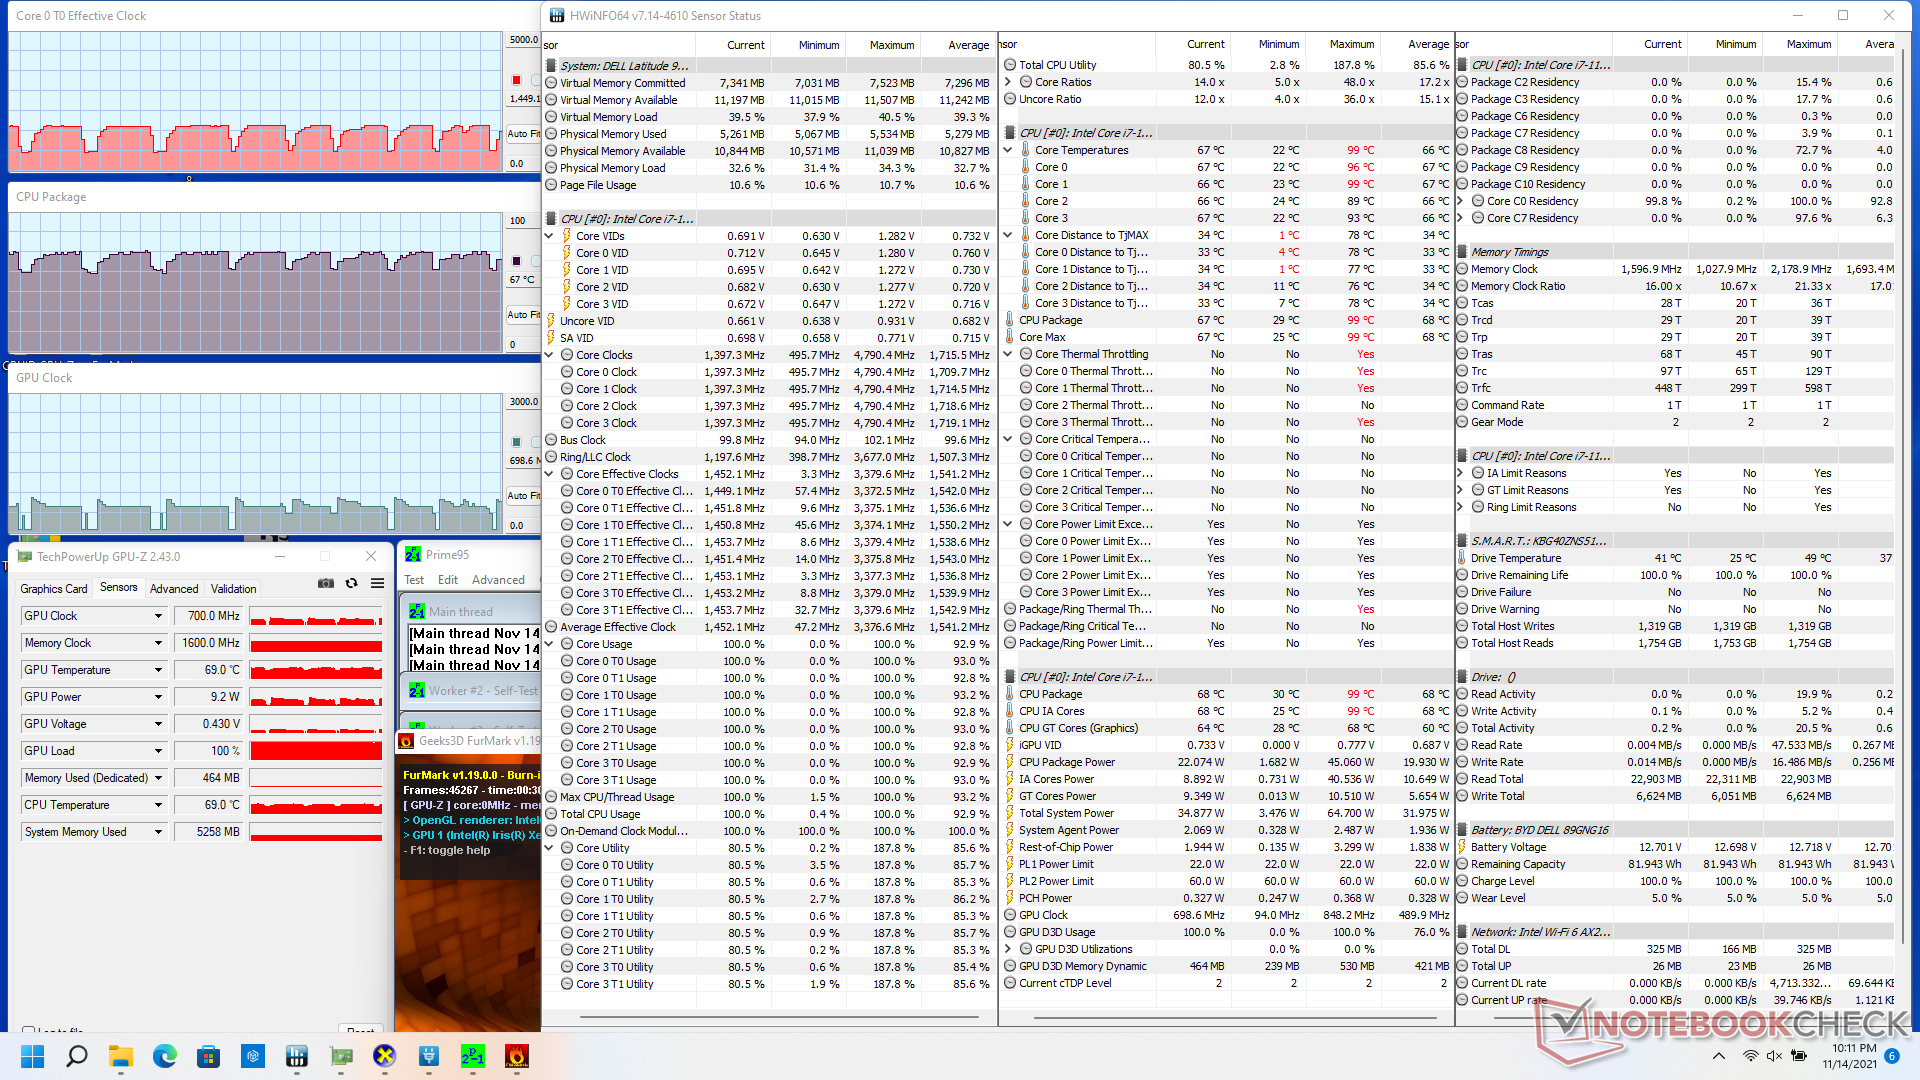
El rendimiento inestable cuando se ejecuta Witcher 3 como se mencionó anteriormente se puede atribuir a las tasas de reloj inestables cuando la CPU y la GPU están bajo carga simultánea. Las frecuencias de reloj de la GPU oscilan entre 500 MHz y 1200 MHz cuando se ejecuta el juego, mientras que la mayoría de los otros portátiles Iris Xe permanecen estables con frecuencias de reloj fijas para un rendimiento más estable. El MSI Summit B15por ejemplo, tendría una velocidad de reloj de la GPU estable de 1300 MHz en las mismas condiciones de juego que nuestro Dell. Este comportamiento indeseable de la GPU hace que el Latitude 9520 2-en-1 sea una opción comparativamente más pobre para tareas gráficas intensivas.
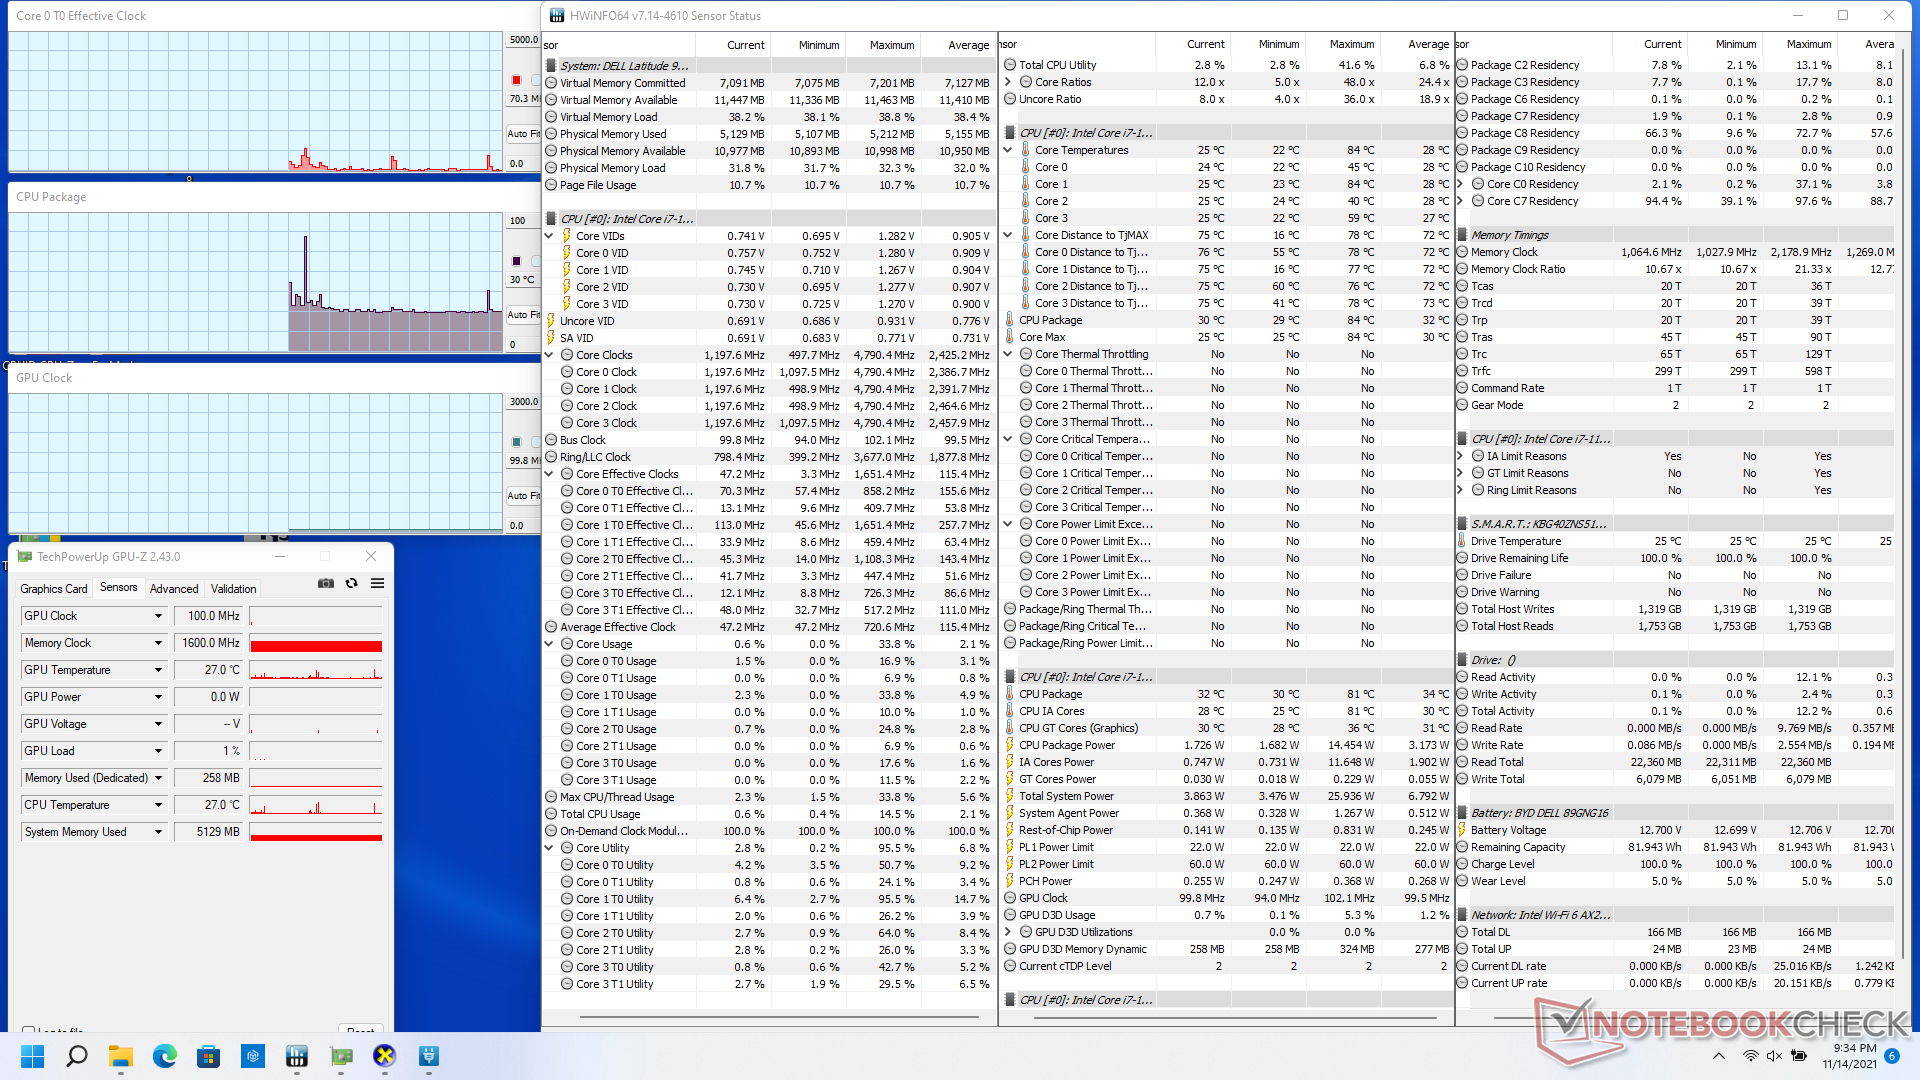
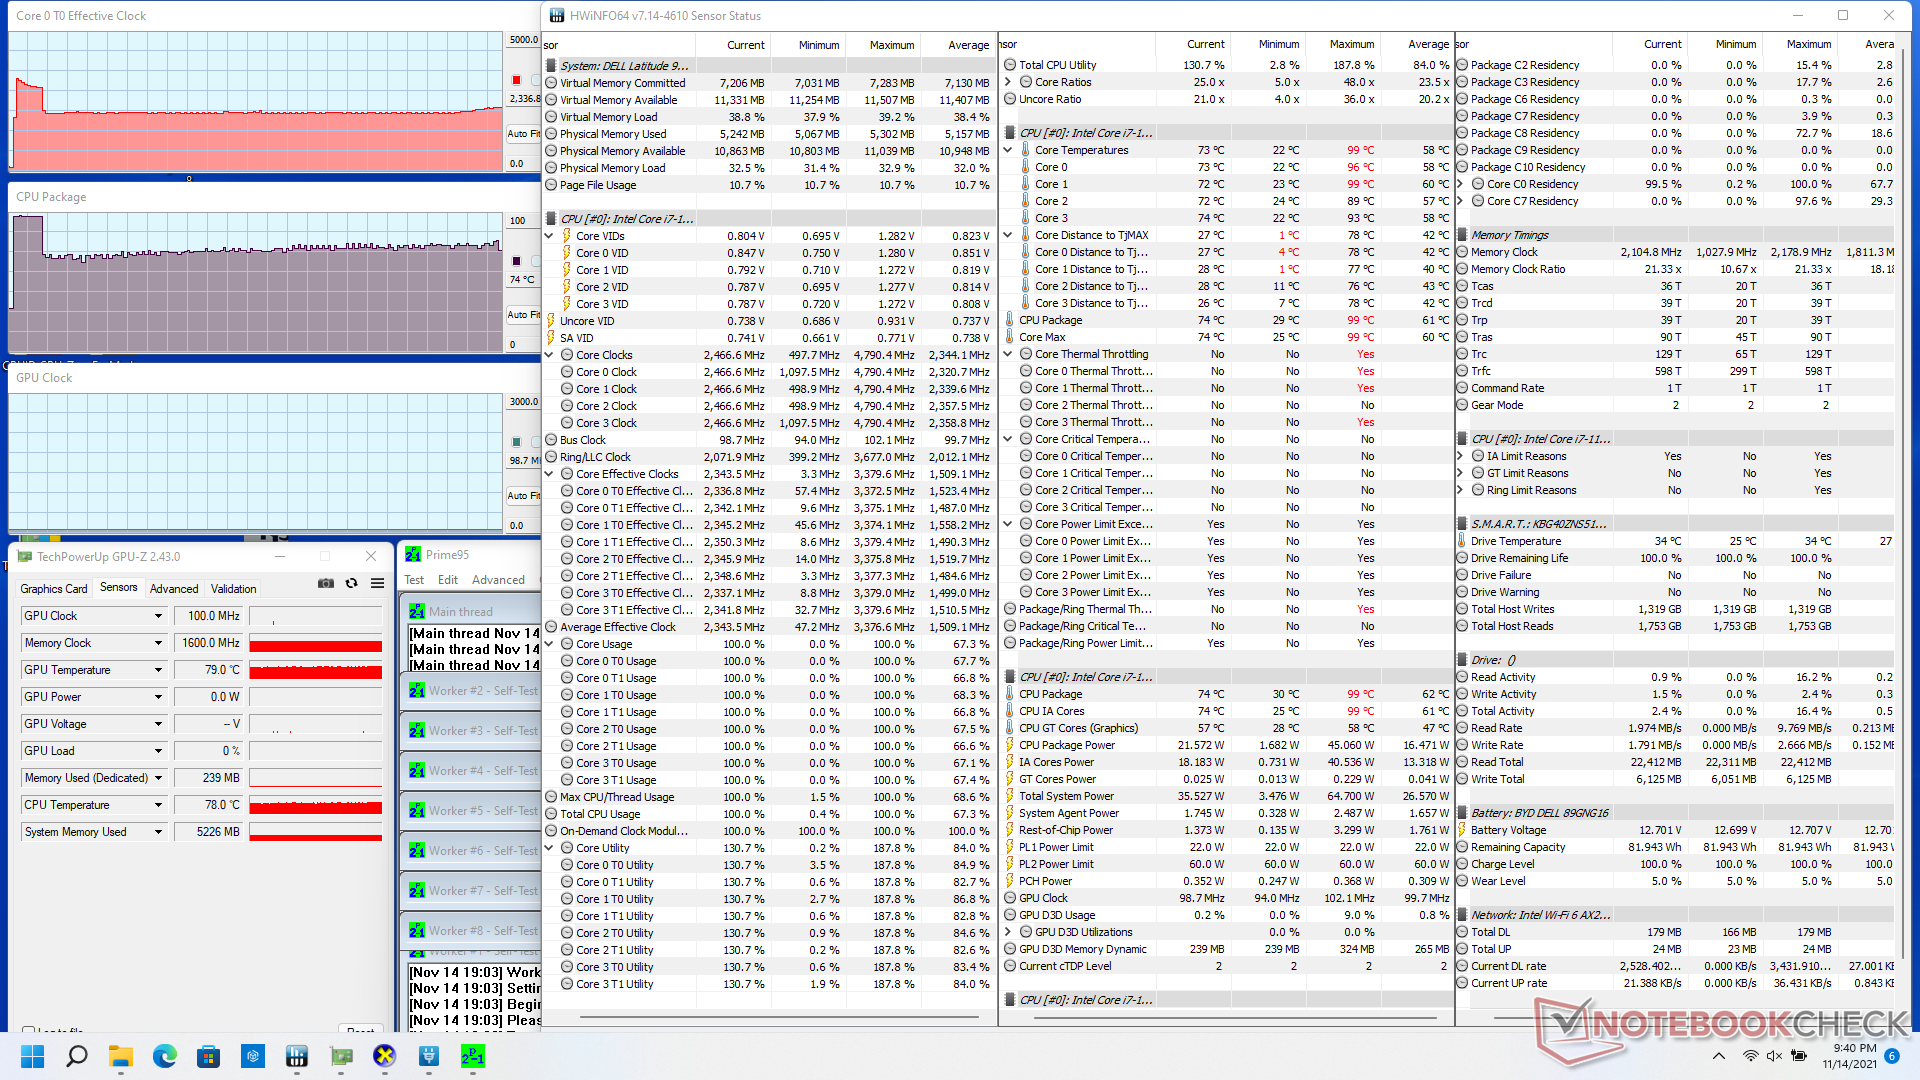
Si se estresa sólo la CPU a través de Prime95, las frecuencias de reloj aumentan a 3,2 GHz sólo durante los primeros segundos a una temperatura del núcleo de 98 C. A partir de entonces, las frecuencias de reloj caen a la gama baja de 2 GHz para mantener una temperatura del núcleo más fría de alrededor de 75 C. Los límites de energía PL1 a largo plazo y PL2 a corto plazo de varios hilos se sitúan en 22 W y 45 W, respectivamente, cuando el sistema está en modo de alto rendimiento.
El uso de la batería no limita el rendimiento, ya que las puntuaciones de 3DMark 11 son casi idénticas entre la red eléctrica y las baterías.
| Relojde la CPU(GHz) | Reloj dela GPU(MHz) | Temperaturamediade la CPU (°C) | |
| Sistema en reposo | |||
| EstrésPrime95 | 2.2 | -- | 75 |
| Prime95+ FurMark Stress | 0,6 - 1,7 | 100 - 800 | 58 - 73 |
| Witcher 3 Estrés | 0,5 - 1,3 | 500 - 1200 | 57 - 66 |
Altavoces
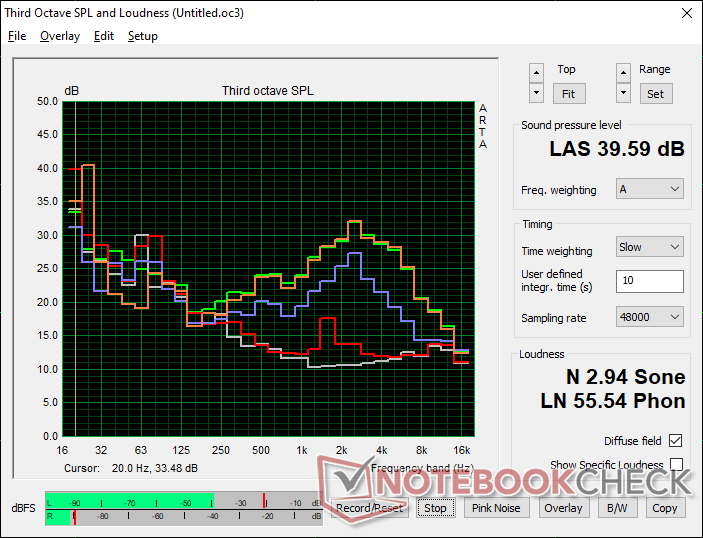
Dell Latitude 15 9520 2-in-1 análisis de audio
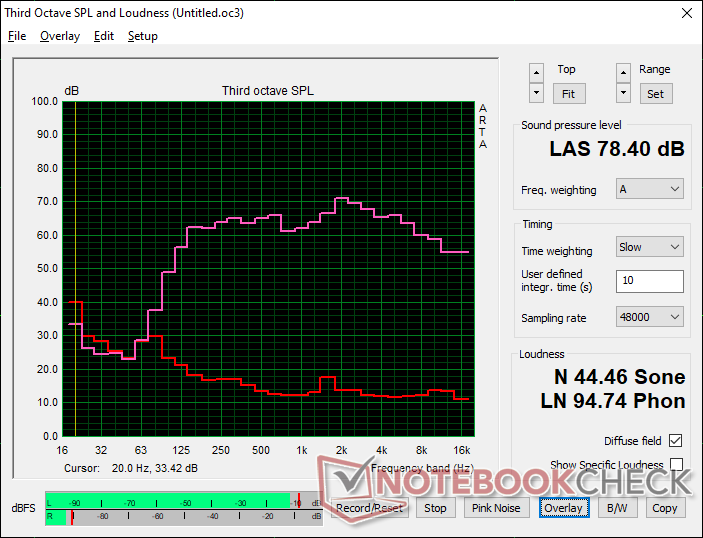
(±) | la sonoridad del altavoz es media pero buena (78.4 dB)
Graves 100 - 315 Hz
(+) | buen bajo - sólo 4.4% lejos de la mediana
(±) | la linealidad de los graves es media (9.4% delta a frecuencia anterior)
Medios 400 - 2000 Hz
(+) | medios equilibrados - a sólo 2.3% de la mediana
(+) | los medios son lineales (4.5% delta a la frecuencia anterior)
Altos 2 - 16 kHz
(+) | máximos equilibrados - a sólo 3.3% de la mediana
(+) | los máximos son lineales (3.9% delta a la frecuencia anterior)
Total 100 - 16.000 Hz
(+) | el sonido global es lineal (9.5% de diferencia con la mediana)
En comparación con la misma clase
» 1% de todos los dispositivos probados de esta clase eran mejores, 0% similares, 99% peores
» El mejor tuvo un delta de 7%, la media fue 21%, el peor fue ###max##%
En comparación con todos los dispositivos probados
» 4% de todos los dispositivos probados eran mejores, 1% similares, 95% peores
» El mejor tuvo un delta de 4%, la media fue 23%, el peor fue ###max##%
Apple MacBook 12 (Early 2016) 1.1 GHz análisis de audio
(+) | los altavoces pueden reproducir a un volumen relativamente alto (#83.6 dB)
Graves 100 - 315 Hz
(±) | lubina reducida - en promedio 11.3% inferior a la mediana
(±) | la linealidad de los graves es media (14.2% delta a frecuencia anterior)
Medios 400 - 2000 Hz
(+) | medios equilibrados - a sólo 2.4% de la mediana
(+) | los medios son lineales (5.5% delta a la frecuencia anterior)
Altos 2 - 16 kHz
(+) | máximos equilibrados - a sólo 2% de la mediana
(+) | los máximos son lineales (4.5% delta a la frecuencia anterior)
Total 100 - 16.000 Hz
(+) | el sonido global es lineal (10.2% de diferencia con la mediana)
En comparación con la misma clase
» 7% de todos los dispositivos probados de esta clase eran mejores, 2% similares, 90% peores
» El mejor tuvo un delta de 5%, la media fue 18%, el peor fue ###max##%
En comparación con todos los dispositivos probados
» 5% de todos los dispositivos probados eran mejores, 1% similares, 94% peores
» El mejor tuvo un delta de 4%, la media fue 23%, el peor fue ###max##%
Gestión de la energía
Consumo de energía
Ejecutar 3DMark 06 consumiría sólo 44 W en nuestro Latitude 9520 2-en-1 en comparación con los 46 W del Latitude 9510 2-en-1 a pesar del enorme aumento del rendimiento gráfico en el modelo más nuevo. Por lo tanto, los propietarios están obteniendo un aumento medio de 3 veces en el rendimiento de la GPU bajo la misma dotación de energía. No se puede subestimar el aumento del rendimiento por vatio de un año a otro.
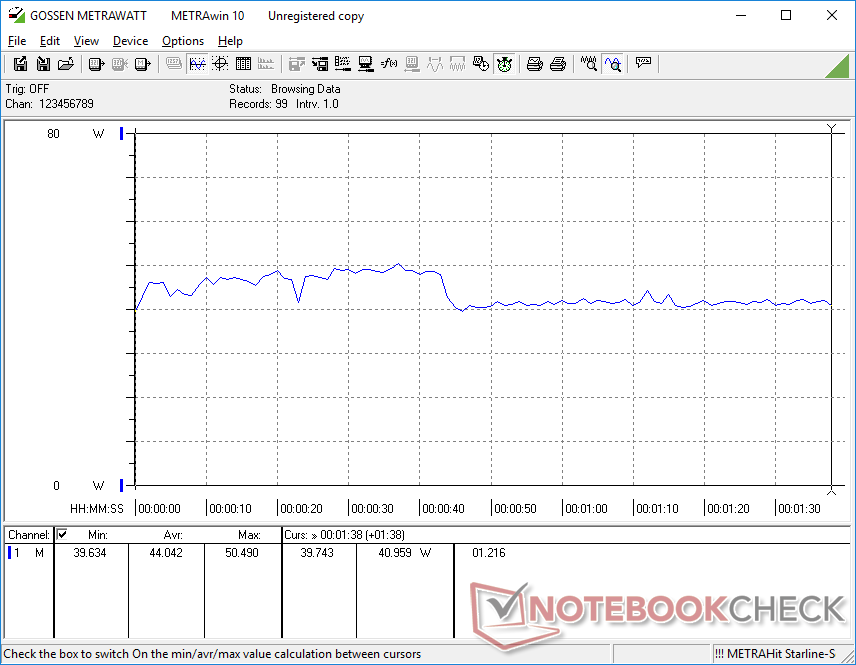
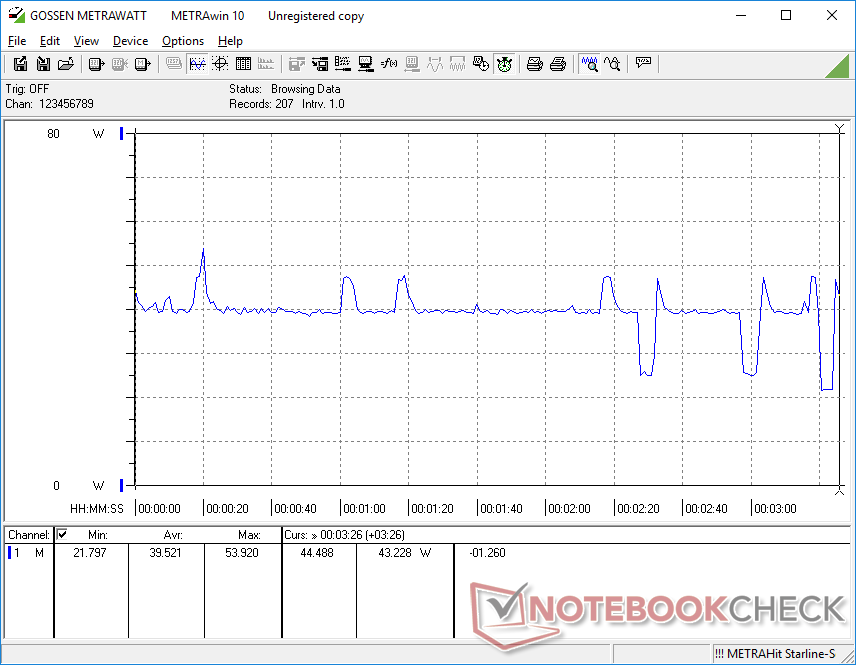
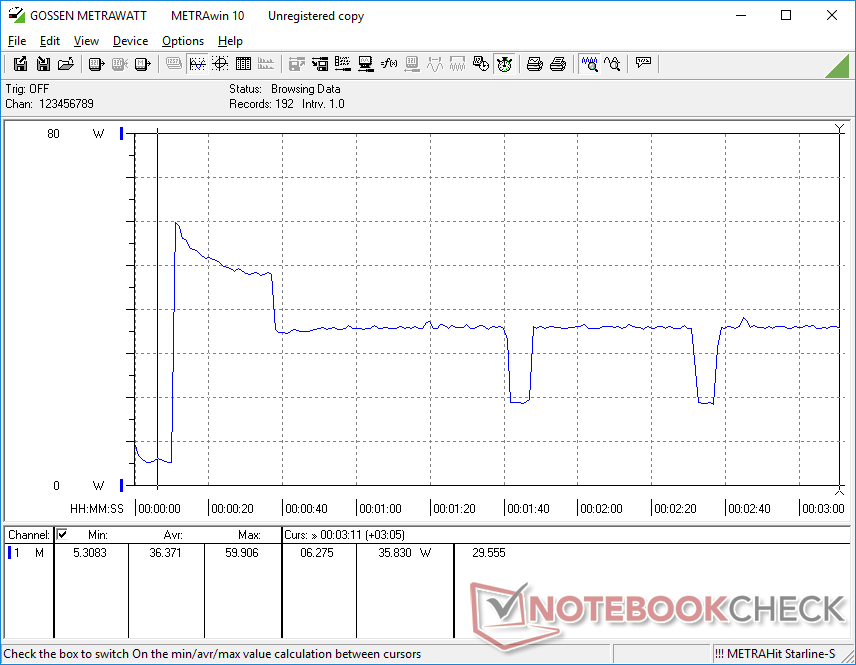
Por desgracia, el rendimiento inestable de la GPU mencionado anteriormente se refleja en las tasas de consumo de energía inestables, como muestran nuestros gráficos siguientes. Cuando se ejecuta Witcher 3 para representar cargas de juego, el consumo oscilaba entre 21 W y 40 W mientras que se mantenía estable en sólo 34 W en el HP EliteBook 850 G8 equipado con una CPU Core i7-1165G7 similar.
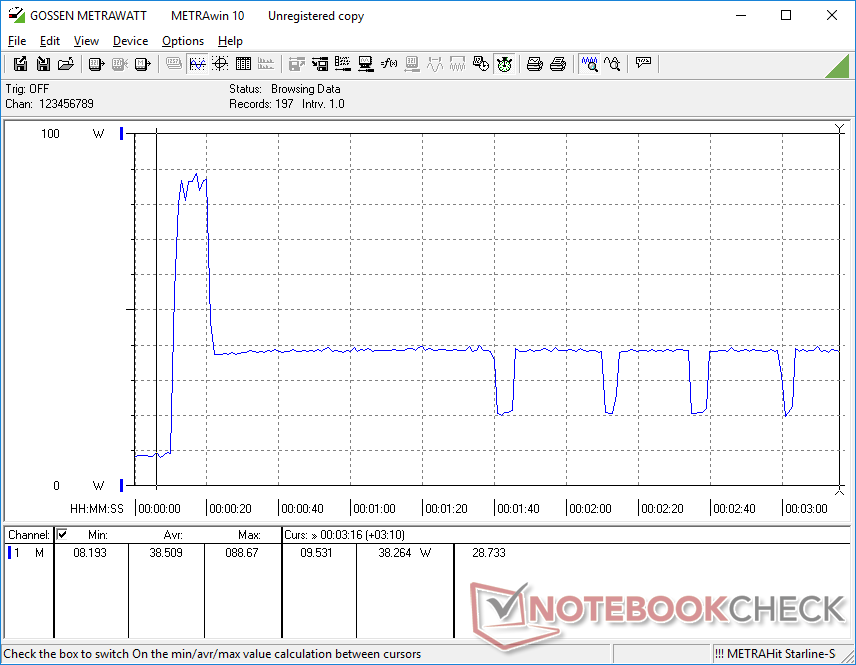
Pudimos registrar un consumo máximo de 88.7 W con el pequeño (~13 x 6.6 x 2.3 cm) adaptador de CA de 90 W. El sistema es incapaz de mantener esta tasa durante más de unos pocos segundos debido a las limitaciones térmicas.
| Off / Standby | |
| Ocioso | |
| Carga |
|
Clave:
min: | |
| Dell Latitude 15 9520 2-in-1 i7-1185G7, Iris Xe G7 96EUs, Toshiba KBG40ZNS512G NVMe, IPS, 1920x1080, 15" | Dell Latitude 9510 2-in-1 i7-10810U, UHD Graphics 620, Toshiba KBG40ZNS512G NVMe, IPS, 1920x1080, 15" | HP EliteBook 850 G8 3C7Z8EA i7-1165G7, Iris Xe G7 96EUs, Samsung PM981a MZVLB1T0HBLR, I, 1920x1080, 15.6" | Lenovo ThinkPad L15 G2 AMD R5 5600U, Vega 7, SK Hynix HFS512 GDE9X081N, IPS LED, 1920x1080, 15.6" | MSI Summit B15 A11M i7-1165G7, Iris Xe G7 96EUs, Kingston OM8PCP31024F, IPS, 1920x1080, 15.6" | Microsoft Surface Laptop 4 15 AMD TFF_00028 R7 4980U, Vega 8, SK Hynix BC511 HFM512GDJTNI, IPS, 2496x1664, 15" | |
|---|---|---|---|---|---|---|
| Power Consumption | 8% | -27% | -14% | -15% | -14% | |
| Idle Minimum * (Watt) | 2.6 | 2.1 19% | 5.8 -123% | 4.57 -76% | 4.2 -62% | 3.6 -38% |
| Idle Average * (Watt) | 5 | 4.6 8% | 8.4 -68% | 8.2 -64% | 7.7 -54% | 6.5 -30% |
| Idle Maximum * (Watt) | 7.1 | 5.3 25% | 9.9 -39% | 9.3 -31% | 8.4 -18% | 8.9 -25% |
| Load Average * (Watt) | 44 | 45.8 -4% | 33 25% | 31.9 27% | 37.8 14% | 46.5 -6% |
| Witcher 3 ultra * (Watt) | 39.5 | 34.3 13% | 34.5 13% | 36.6 7% | 43.4 -10% | |
| Load Maximum * (Watt) | 88.7 | 96.3 -9% | 60 32% | 47.4 47% | 67.5 24% | 64.9 27% |
* ... más pequeño es mejor
Power Consumption Witcher 3 / Stresstest
Duración de la batería
La duración es un poco más corta que la que registramos en el modelo del año pasado, a pesar de que las baterías de 88 Wh son idénticas. Aun así, las más de 14 horas de uso real de la WLAN no son nada del otro mundo y están muy por encima de la media para la categoría de tamaño
Dell ofrece modelos con baterías más pequeñas de 46 Wh para los usuarios a los que no les importe sacrificar la duración de la batería por una unidad más ligera
| Dell Latitude 15 9520 2-in-1 i7-1185G7, Iris Xe G7 96EUs, 88 Wh | Dell Latitude 9510 2-in-1 i7-10810U, UHD Graphics 620, 88 Wh | HP EliteBook 850 G8 3C7Z8EA i7-1165G7, Iris Xe G7 96EUs, 56 Wh | Lenovo ThinkPad L15 G2 AMD R5 5600U, Vega 7, 45 Wh | MSI Summit B15 A11M i7-1165G7, Iris Xe G7 96EUs, 52 Wh | Microsoft Surface Laptop 4 15 AMD TFF_00028 R7 4980U, Vega 8, 47.4 Wh | |
|---|---|---|---|---|---|---|
| Duración de Batería | 26% | -43% | -47% | -55% | -30% | |
| WiFi v1.3 (h) | 14.8 | 18.7 26% | 8.5 -43% | 7.8 -47% | 6.6 -55% | 10.4 -30% |
| Reader / Idle (h) | 59 | 18.4 | ||||
| Load (h) | 4 | 2.3 | 1 | 2.5 | ||
| H.264 (h) | 6.6 | 14.8 |
Pro
Contra
Veredicto

El Latitude 9520 2-en-1 ofrece importantes ventajas de rendimiento sobre el Latitude 9510 2-en-1 en papel. El antiguo UHD Graphics 620 ha quedado obsoleto ahora que el Iris Xe es cada vez más común. En la práctica, sin embargo, hay advertencias que los potenciales compradores no deberían ignorar.
En primer lugar, la GPU Iris Xe de la nueva Latitude funciona a velocidades de reloj cíclicas, lo que da lugar a frecuencias de cuadro cíclicas cuando se juega o a un rendimiento inestable cuando se ejecutan tareas intensivas de la GPU. Las frecuencias de cuadro pueden llegar a ser tan extremas que algunas aplicaciones en las que las frecuencias de cuadro constantes son vitales se vuelven casi imposibles de reproducir. Recomendamos mirar otros portátiles Tiger Lake-U como el MSI Summit E13 Flip oHP EliteBook 840 Aero G8 si se desea un rendimiento de GPU más estable y fiable.
El principal argumento de venta del Latitude 9520 2-en-1 sobre el 9510 2-en-1 es su rendimiento gráfico integrado significativamente más rápido. Sin embargo, el rendimiento gráfico inusualmente inestable del nuevo modelo puede ser un factor de rechazo para muchos compradores interesados.
En segundo lugar, el rendimiento de la CPU multihilo de nuestro Core i7-1185G7 es más lento en comparación con el antiguo Core i7-10810U del Latitude 9510 2-en-1. Aunque esta desventaja no es exclusiva de los PCs Dell, el i7-1185G7 del Latitude 9520 2-en-1 es más lento que en muchos otros portátiles con el mismo procesador. Así, el déficit de rendimiento multihilo se amplifica en el Dell.
Las razones para elegir el Latitude 9520 2-en-1 sobre el 9510 2-en-1 son menores de lo que nos gustaría, especialmente porque el nuevo modelo no ofrece nada nuevo en términos de calidad de pantalla, calidad de la webcam o duración de la batería. Esperemos que el rendimiento desigual de la GPU se solucione con una futura actualización.
Precio y disponibilidad
La mayoría de los principales minoristas como Amazon, Walmarty Newegg tienen el Latitude 9520 2-en-1 en stock en varias configuraciones. Los usuarios también pueden comprar directamente de Dell a partir de 2800 dólares para la versión Core i5.
Dell Latitude 15 9520 2-in-1
- 11/22/2021 v7 (old)
Allen Ngo
Price comparison

