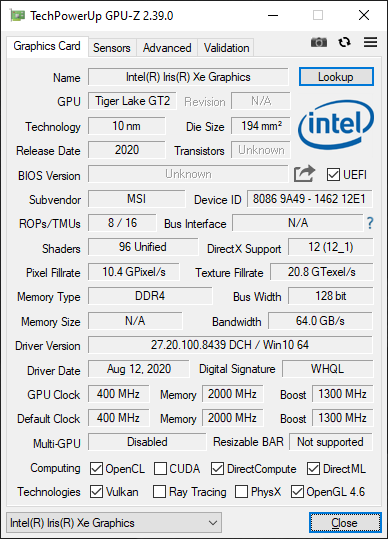
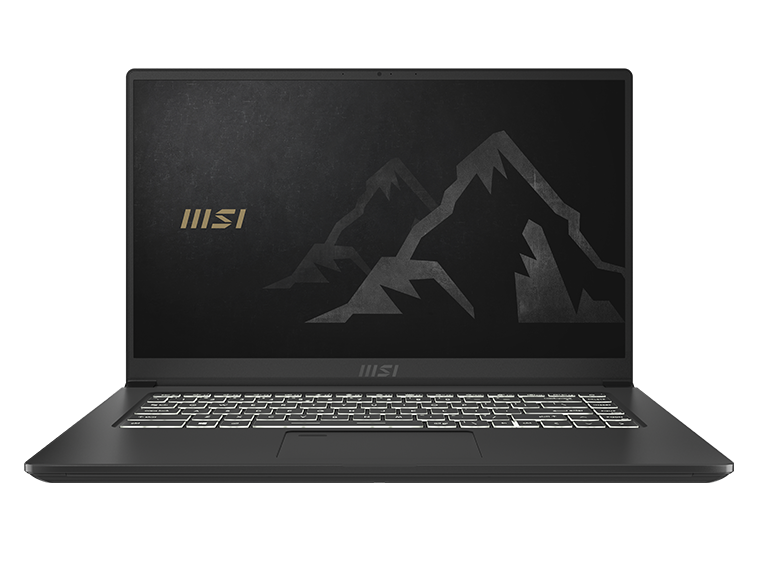
Análisis del portátil MSI Summit B15 A11M: La elección de Iris Xe en lugar de GeForce MX
MSI ha presentado en el CES 2021 su serie Summit, que engloba una gama de portátiles diseñados para lugares de trabajo, oficinas, creación de contenidos y otros entornos entre semiprofesionales y profesionales. Los modelos de gama alta incluyen el Summit E13 y el de 15,6 pulgadas Summit E15 cada uno de ellos con un precio de venta al público de unos 2.000 dólares.
El modelo que veremos aquí es un modelo básico de la serie llamado Summit B15. A diferencia de los modelos Summit E antes mencionados, el B15 carece de los adornos dorados y de las opciones de GPU discreta para conseguir un peso más ligero y un precio más asequible. Por lo demás, viene equipado con opciones similares de procesador de 11ª generación Tiger Lake-U. Entre sus competidores directos se encuentran otros portátiles prosumidores de gama media y media alta como el HP Envy 15, XPG Xenia Xe, Lenovo ThinkBook 15, Microsoft Surface Laptop 4o el LG Gram de LG.
Más opiniones de MSI:
potential competitors in comparison
Valoración | Fecha | Modelo | Peso | Altura | Tamaño | Resolución | Precio |
|---|---|---|---|---|---|---|---|
| 81.2 % v7 (old) | 05/2021 | MSI Summit B15 A11M i7-1165G7, Iris Xe G7 96EUs | 1.5 kg | 16.9 mm | 15.60" | 1920x1080 | |
| 83.7 % v7 (old) | 02/2021 | MSI Summit E15 A11SCST i7-1185G7, GeForce GTX 1650 Ti Max-Q | 1.8 kg | 16.9 mm | 15.60" | 1920x1080 | |
| 86.8 % v7 (old) | 05/2020 | Dell XPS 15 9500 Core i5 i5-10300H, UHD Graphics 630 | 1.8 kg | 18 mm | 15.60" | 1920x1200 | |
| 85 % v7 (old) | 01/2020 | HP Spectre X360 15-5ZV31AV i7-10510U, GeForce MX250 | 2.1 kg | 19.3 mm | 15.60" | 3840x2160 | |
| 87.5 % v7 (old) | 05/2021 | ADATA XPG Xenia Xe i7-1165G7, Iris Xe G7 96EUs | 1.7 kg | 14.9 mm | 15.60" | 1920x1080 | |
| 85.2 % v7 (old) | 03/2020 | Asus ZenBook 15 UX534FTC-A8190T i7-10510U, GeForce GTX 1650 Max-Q | 1.6 kg | 18.9 mm | 15.60" | 1920x1080 |
Caso
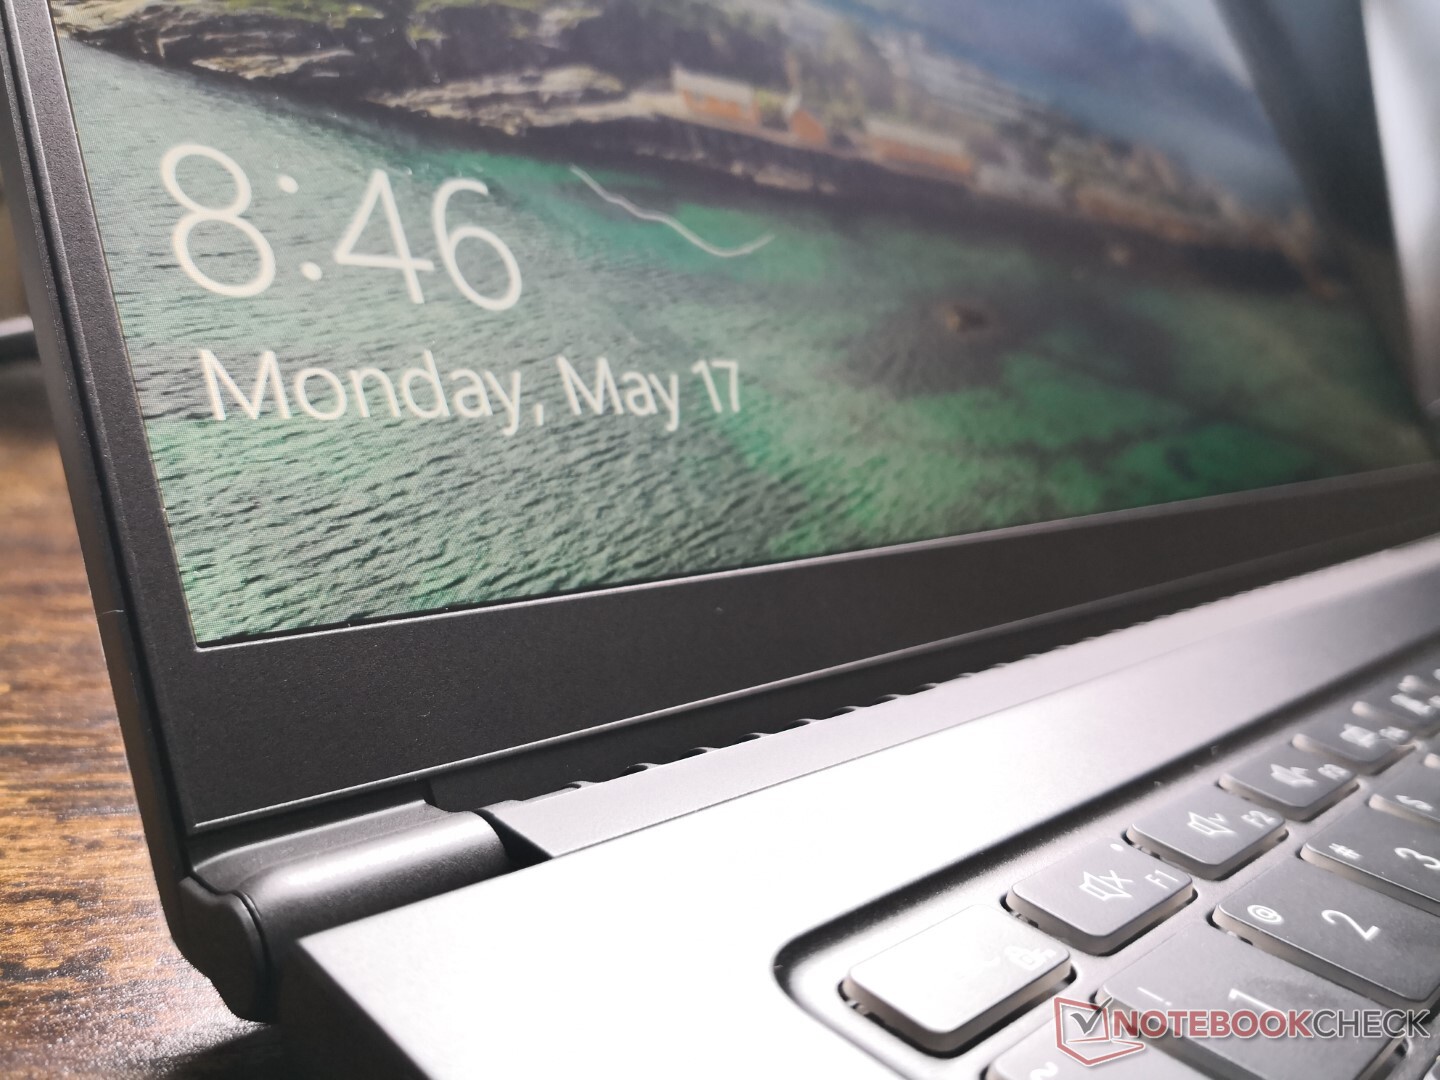
Si el Summit B15 le resulta familiar, es porque se trata esencialmente de un 2020 Modern 15 con un nuevo logotipo dorado "MSI" en la tapa exterior. Su chasis y características son casi idénticos a los del Modern 15, incluyendo incluso la placa base interior. MSI se encuentra actualmente en medio de la remodelación de su cartera de portátiles, por lo que las antiguas series Modern y Prestige se consolidarán bajo la nueva serie Summit en un futuro próximo. Este movimiento debería facilitar a los clientes la distinción entre los distintos portátiles de MSI, ya que la empresa tiene demasiados nombres de modelos que seguir
Nuestras impresiones originales sobre el Modern 15 del año pasado se aplican aquí al Summit B15. La rigidez de la base sigue siendo bastante buena mientras que la tapa sigue flexionando un poco más de lo que nos gustaría. Los portátiles empresariales completos como el Dell Latitude, el HP EliteBook o el Lenovo ThinkPad son definitivamente más caros, pero son de mayor calidad.
Una de las razones principales para elegir el Summit B15 (o Modern 15) en lugar de las alternativas de Dell, HP u otros es su peso muy ligero de sólo 1,5 kg. El competidor Lenovo ThinkBook 15 G2 o ADATA XPG Xenia Xe son cada uno unos 200 gramos más pesados en comparación, mientras que sus dimensiones son casi idénticas.
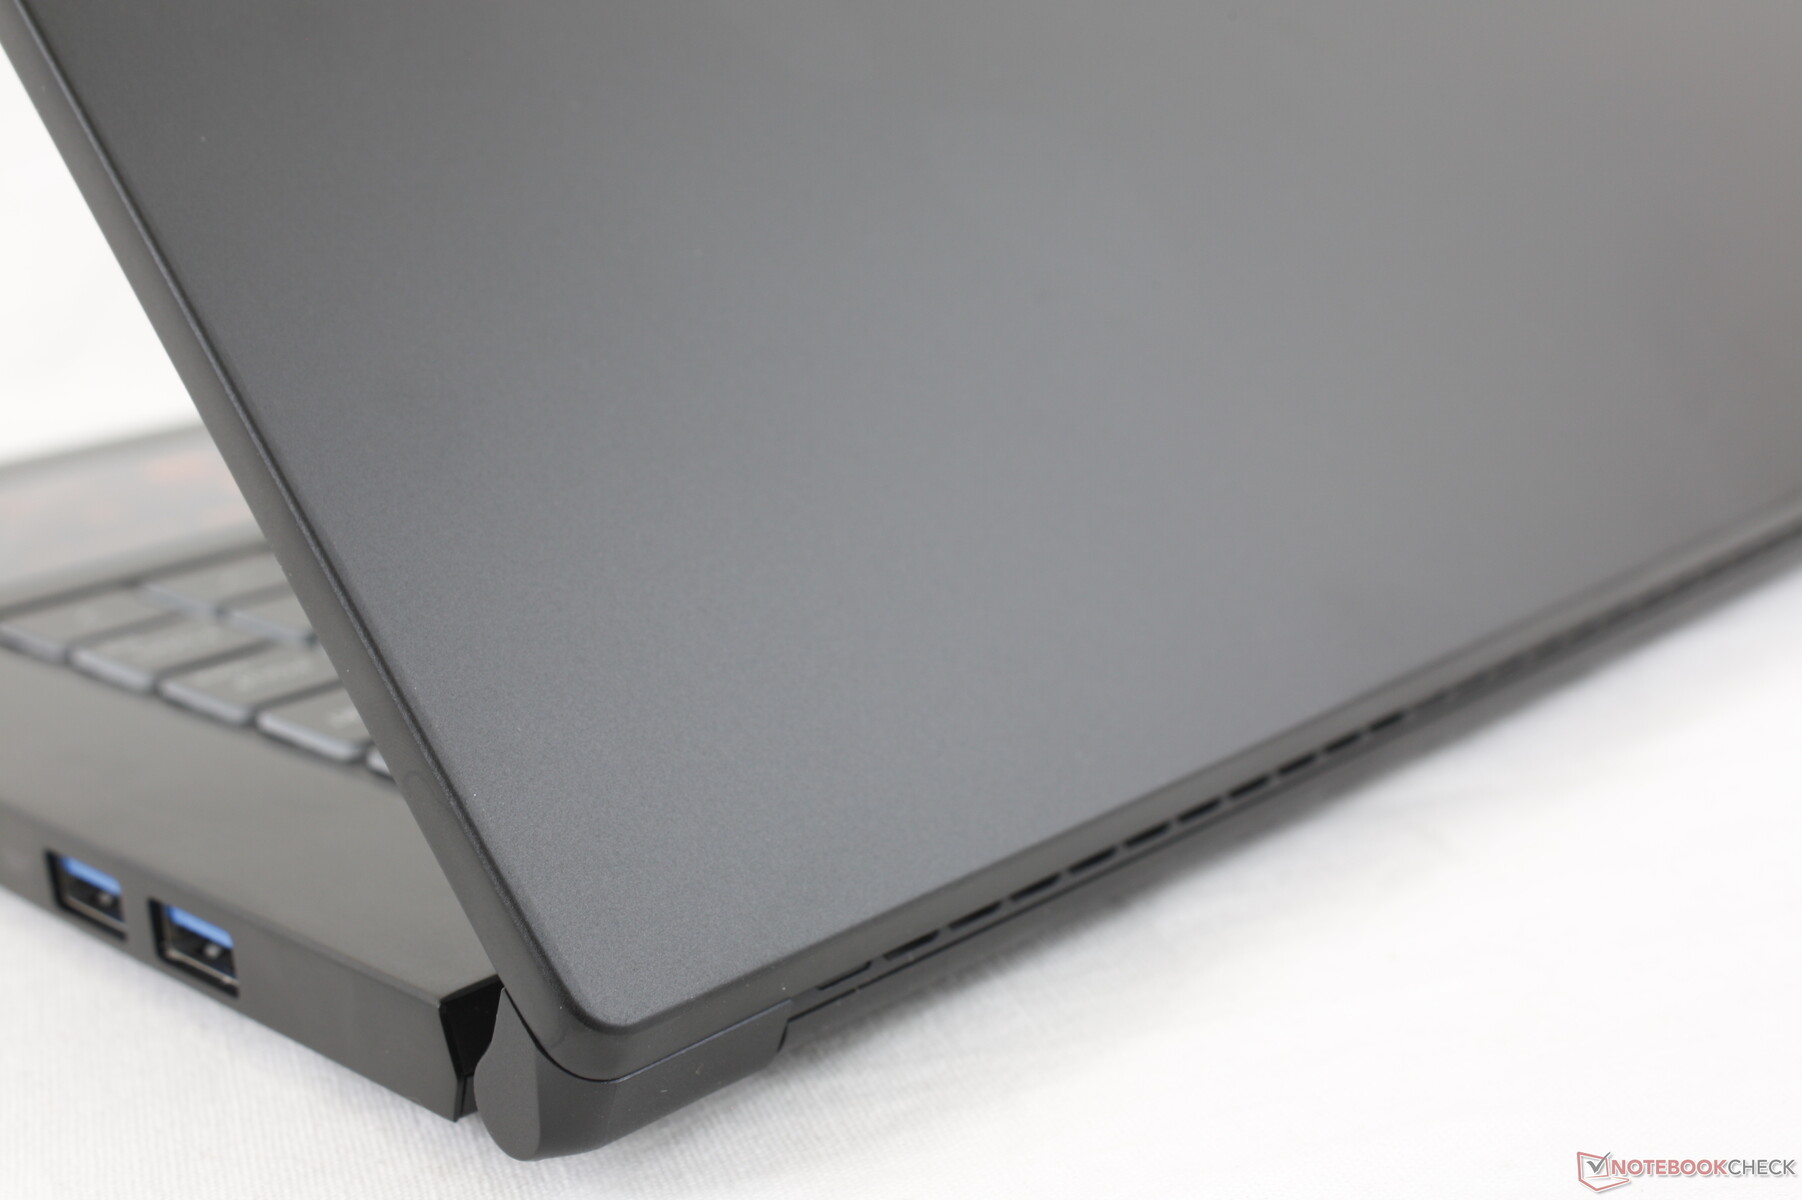
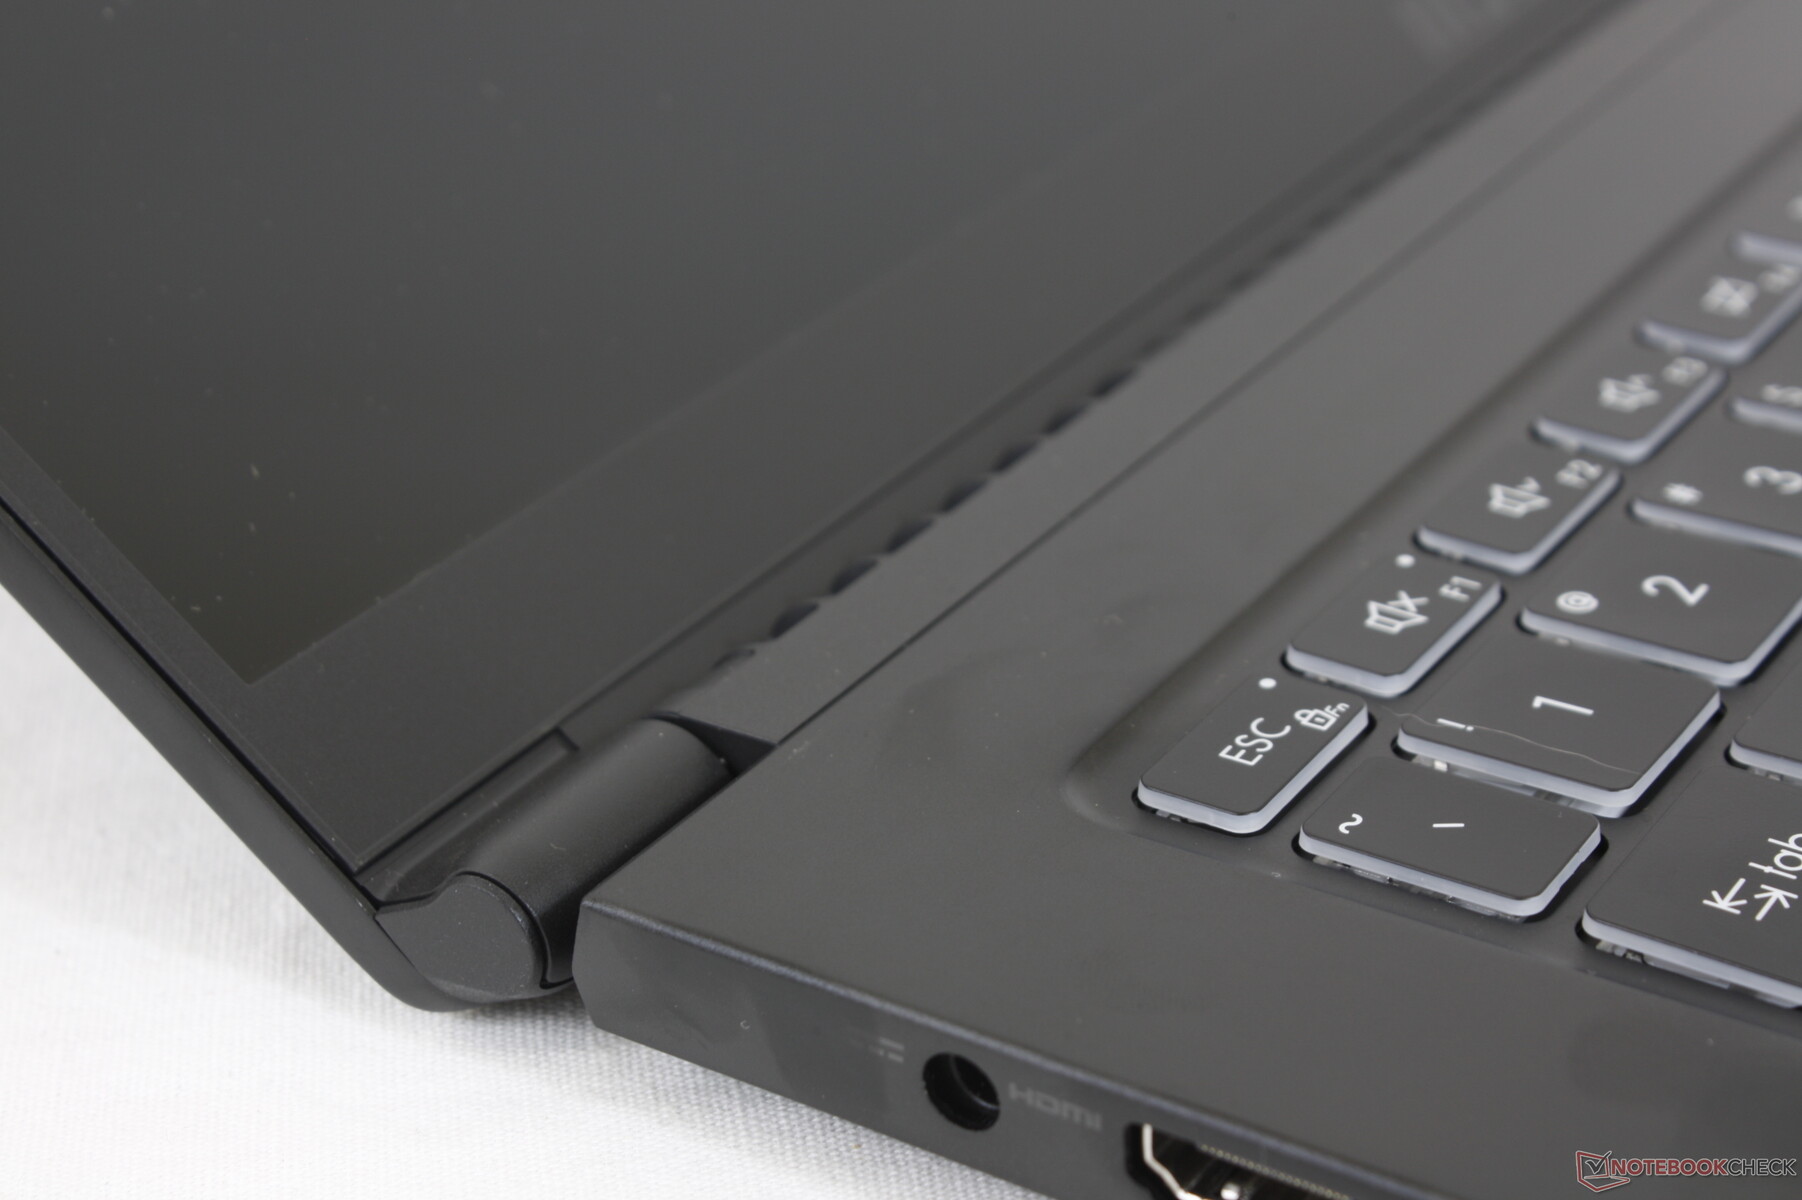
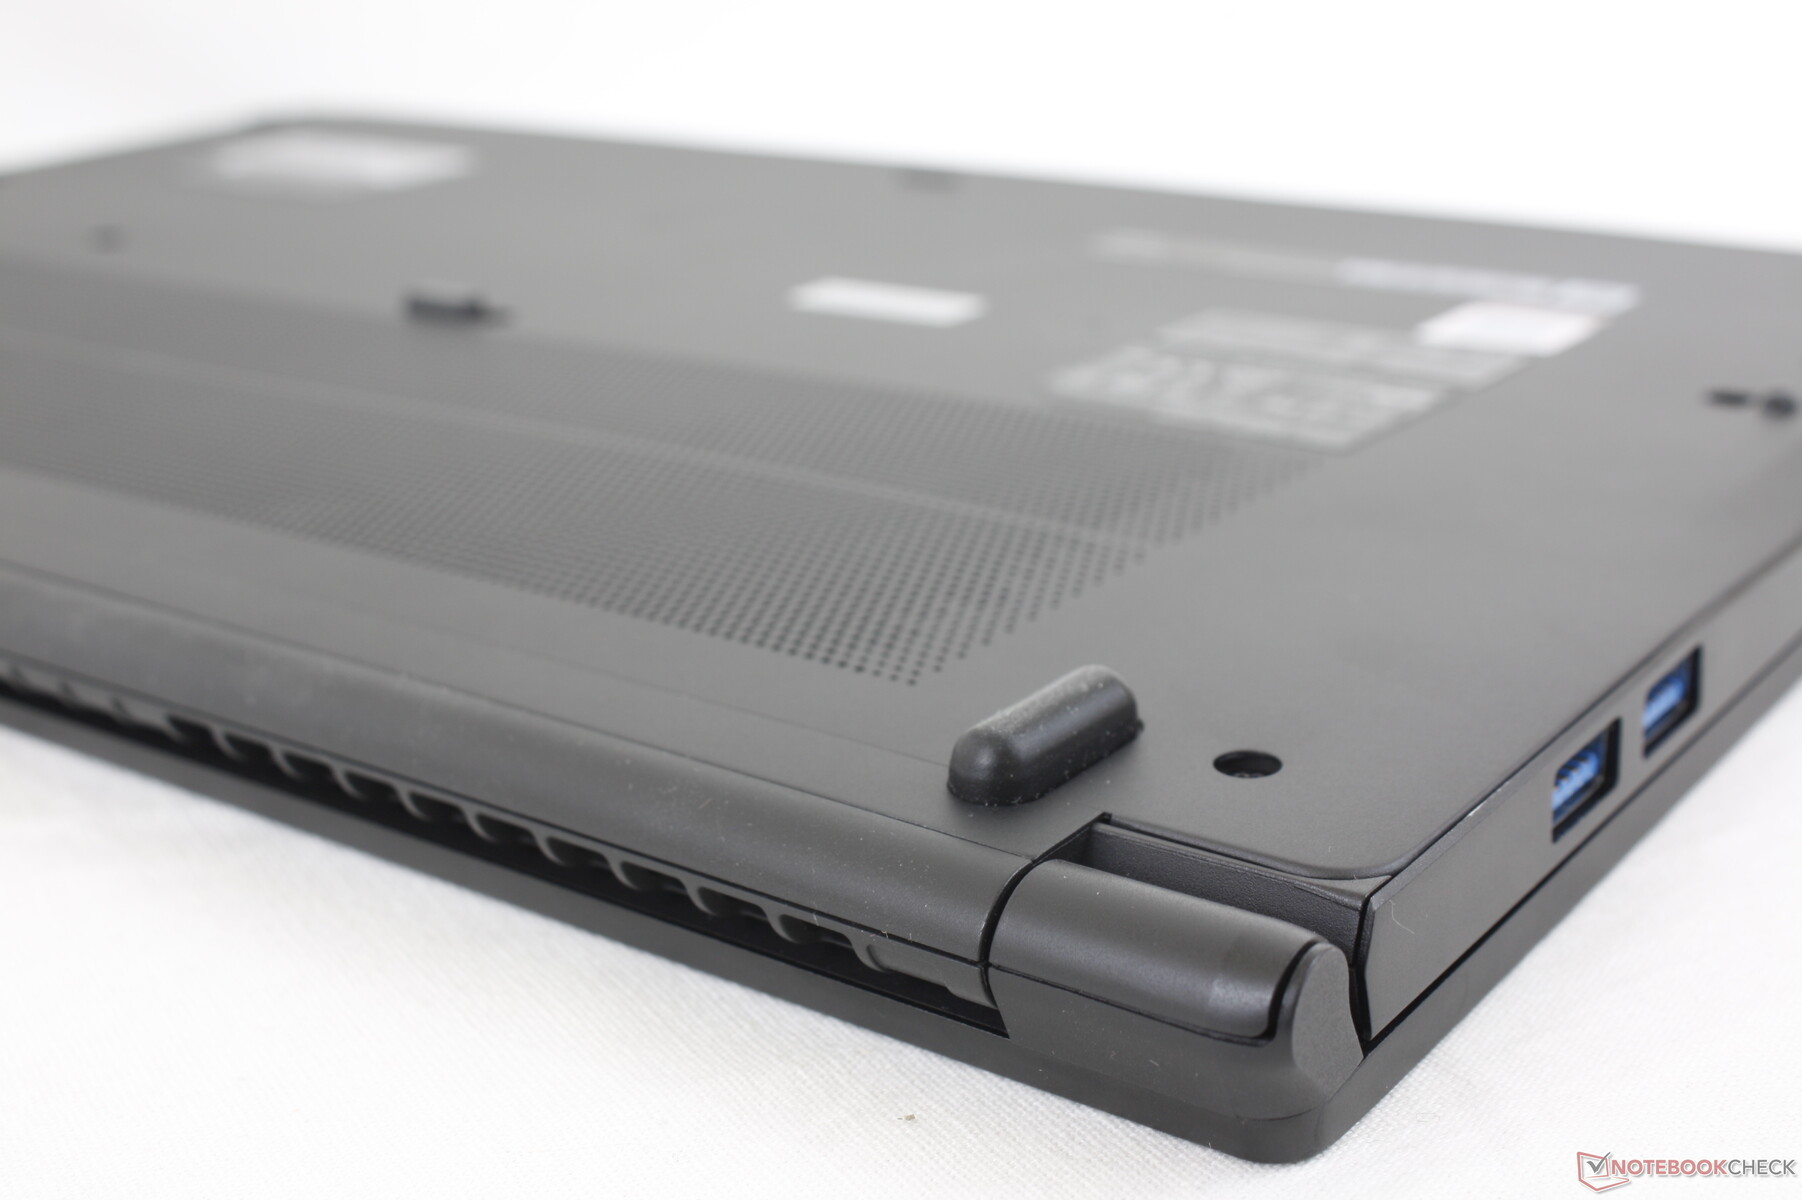
Conectividad
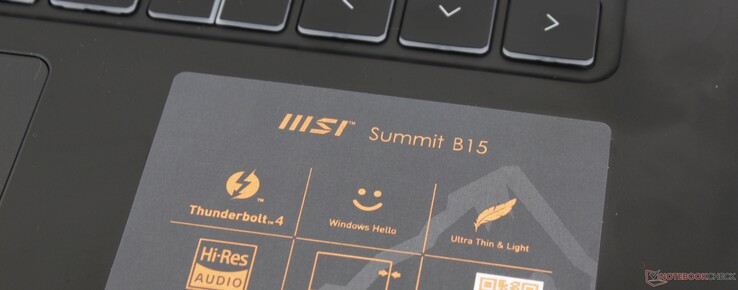
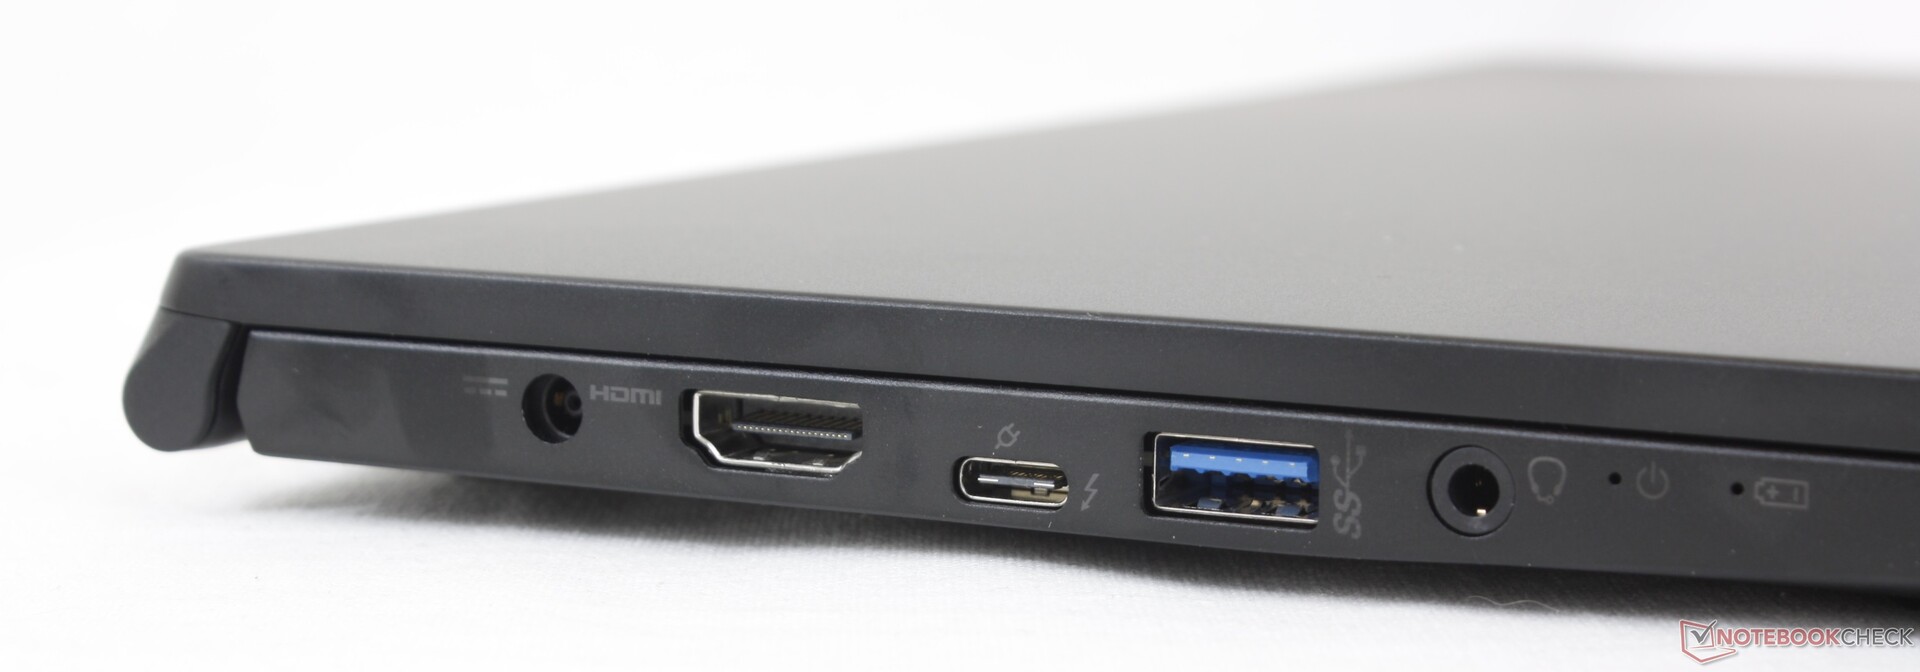
Las opciones de puerto no cambian respecto al Modern 15 salvo por dos actualizaciones importantes: el puerto HDMI ahora soporta salida 4K60 mientras que el puerto USB-C es ahora compatible con Thunderbolt 4. Los usuarios pueden conectar bases gráficas externas al Summit B15, mientras que eso era imposible en el Modern 15
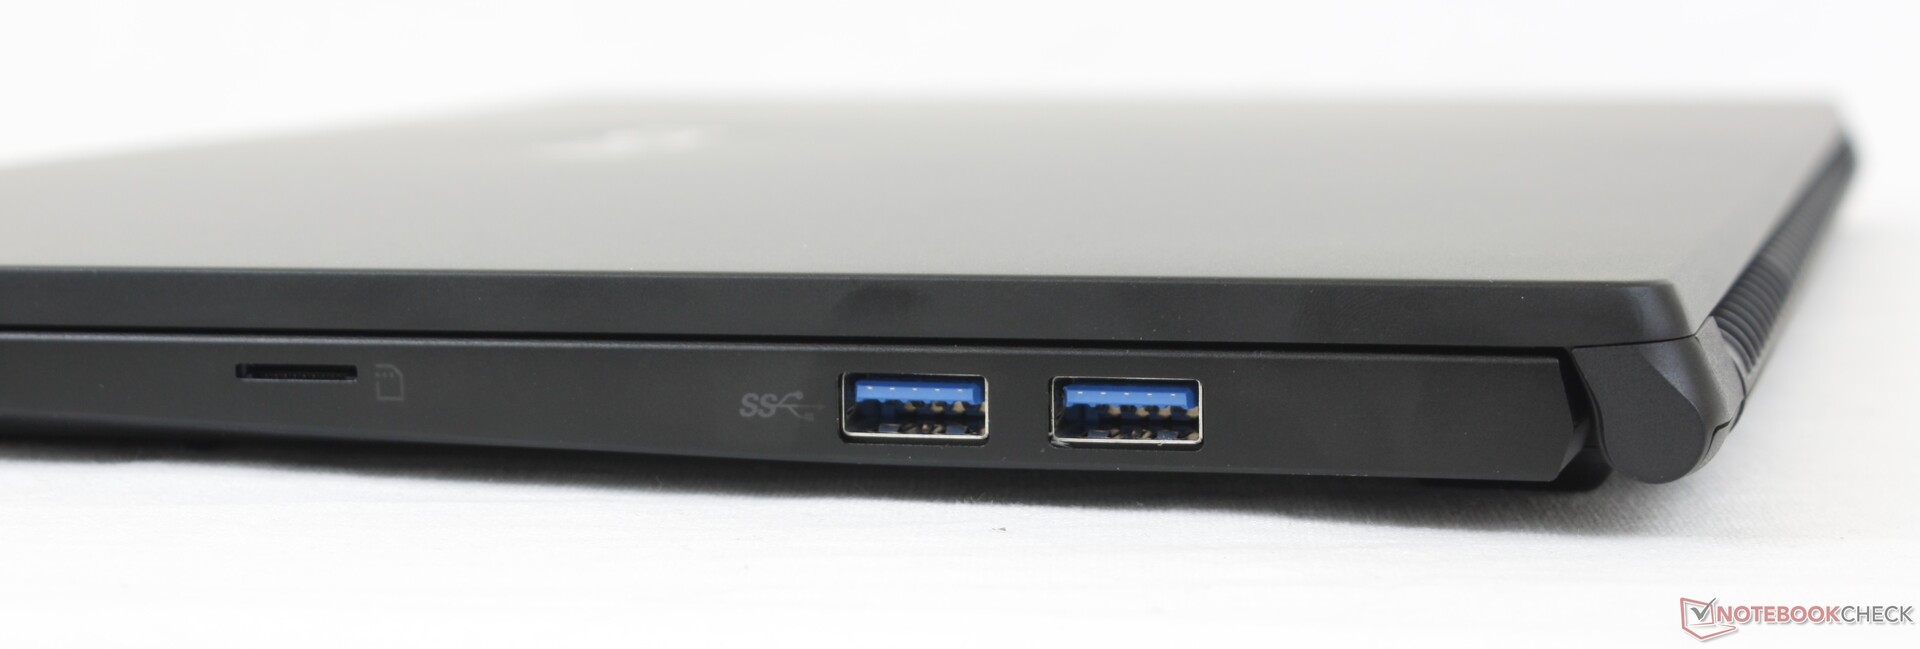
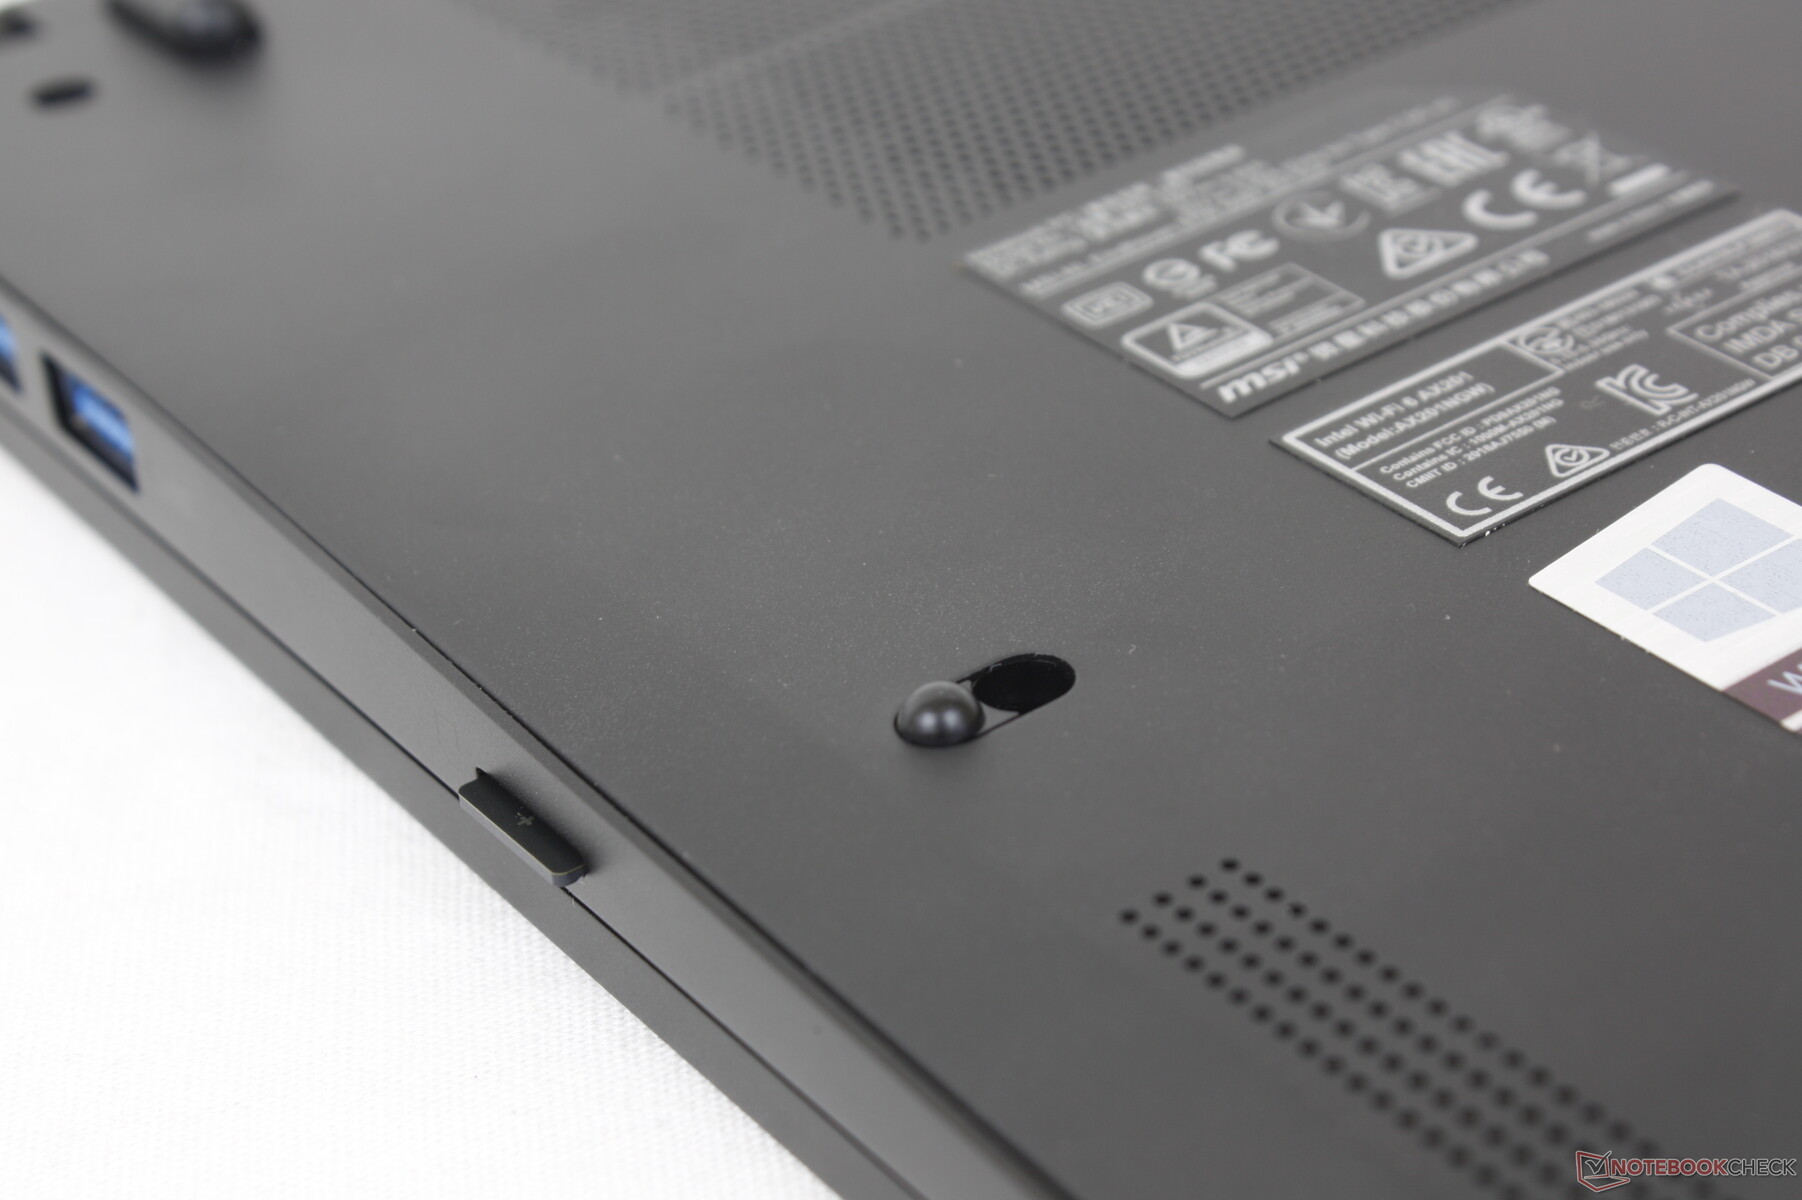
Lector de tarjetas SD
MSI ha mejorado la ranura MicroSD para que sea unas 6 veces más rápida que la misma ranura MicroSD del antiguo Modern 15. Pasar 1 GB de fotos de nuestra tarjeta de pruebas UHS-II al escritorio lleva unos 7 segundos frente a los 40 del modelo del año pasado.
| SD Card Reader | |
| average JPG Copy Test (av. of 3 runs) | |
| Dell XPS 15 9500 Core i5 (Toshiba Exceria Pro SDXC 64 GB UHS-II) | |
| HP Spectre X360 15-5ZV31AV (Toshiba Exceria Pro M501 UHS-II) | |
| MSI Summit B15 A11M (AV PRO microSD 128 GB V60) | |
| MSI Summit E13 Flip Evo A11MT (AV PRO microSD 128 GB V60) | |
| MSI Modern 15 A10RB (Toshiba Exceria Pro M501 UHS-II) | |
| maximum AS SSD Seq Read Test (1GB) | |
| Dell XPS 15 9500 Core i5 (Toshiba Exceria Pro SDXC 64 GB UHS-II) | |
| MSI Summit B15 A11M (AV PRO microSD 128 GB V60) | |
| HP Spectre X360 15-5ZV31AV (Toshiba Exceria Pro M501 UHS-II) | |
| MSI Summit E13 Flip Evo A11MT (AV PRO microSD 128 GB V60) | |
| MSI Modern 15 A10RB (Toshiba Exceria Pro M501 UHS-II) | |
Comunicación
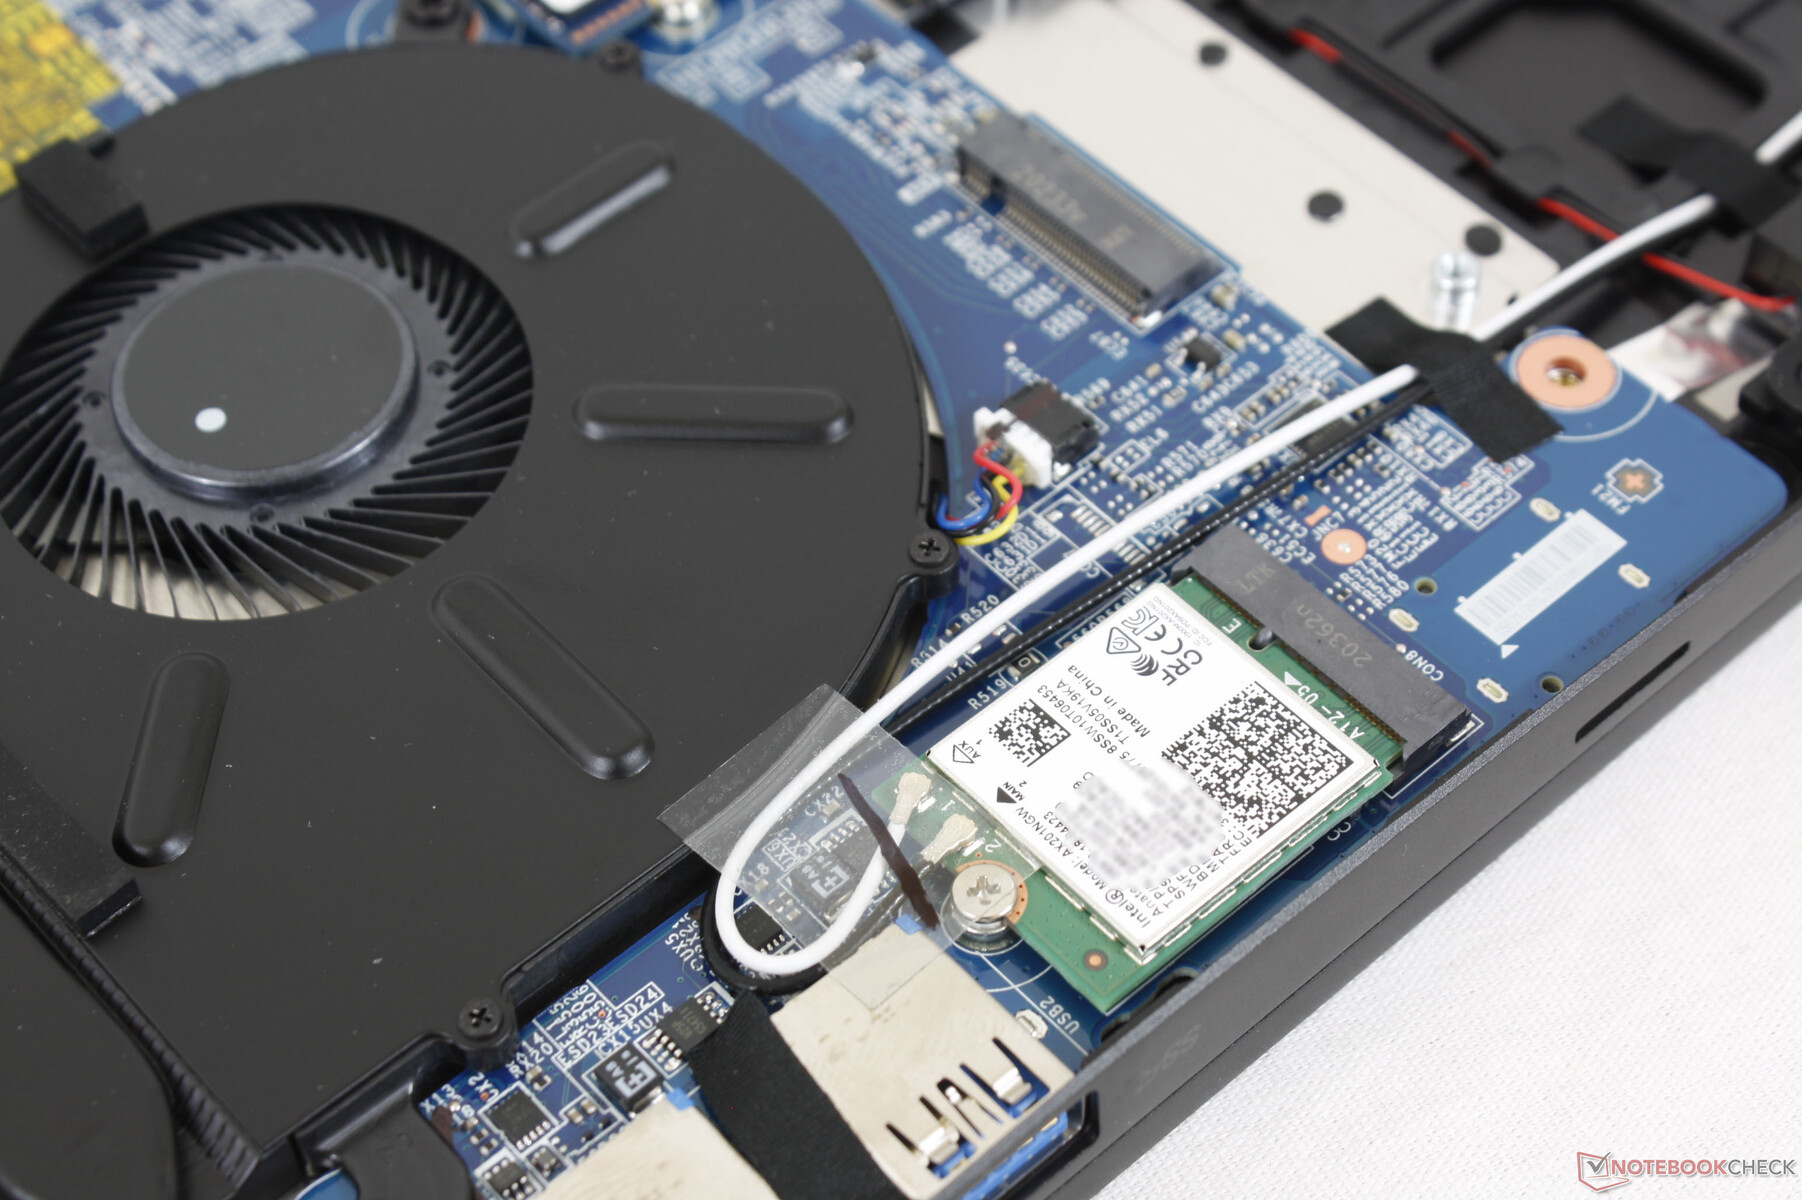
El Intel AX201 viene de serie con conectividad Wi-Fi 6 y Bluetooth 5.1. No experimentamos ningún problema al emparejarlo con nuestro router Netgear RAX200.
Cámara web


Mantenimiento
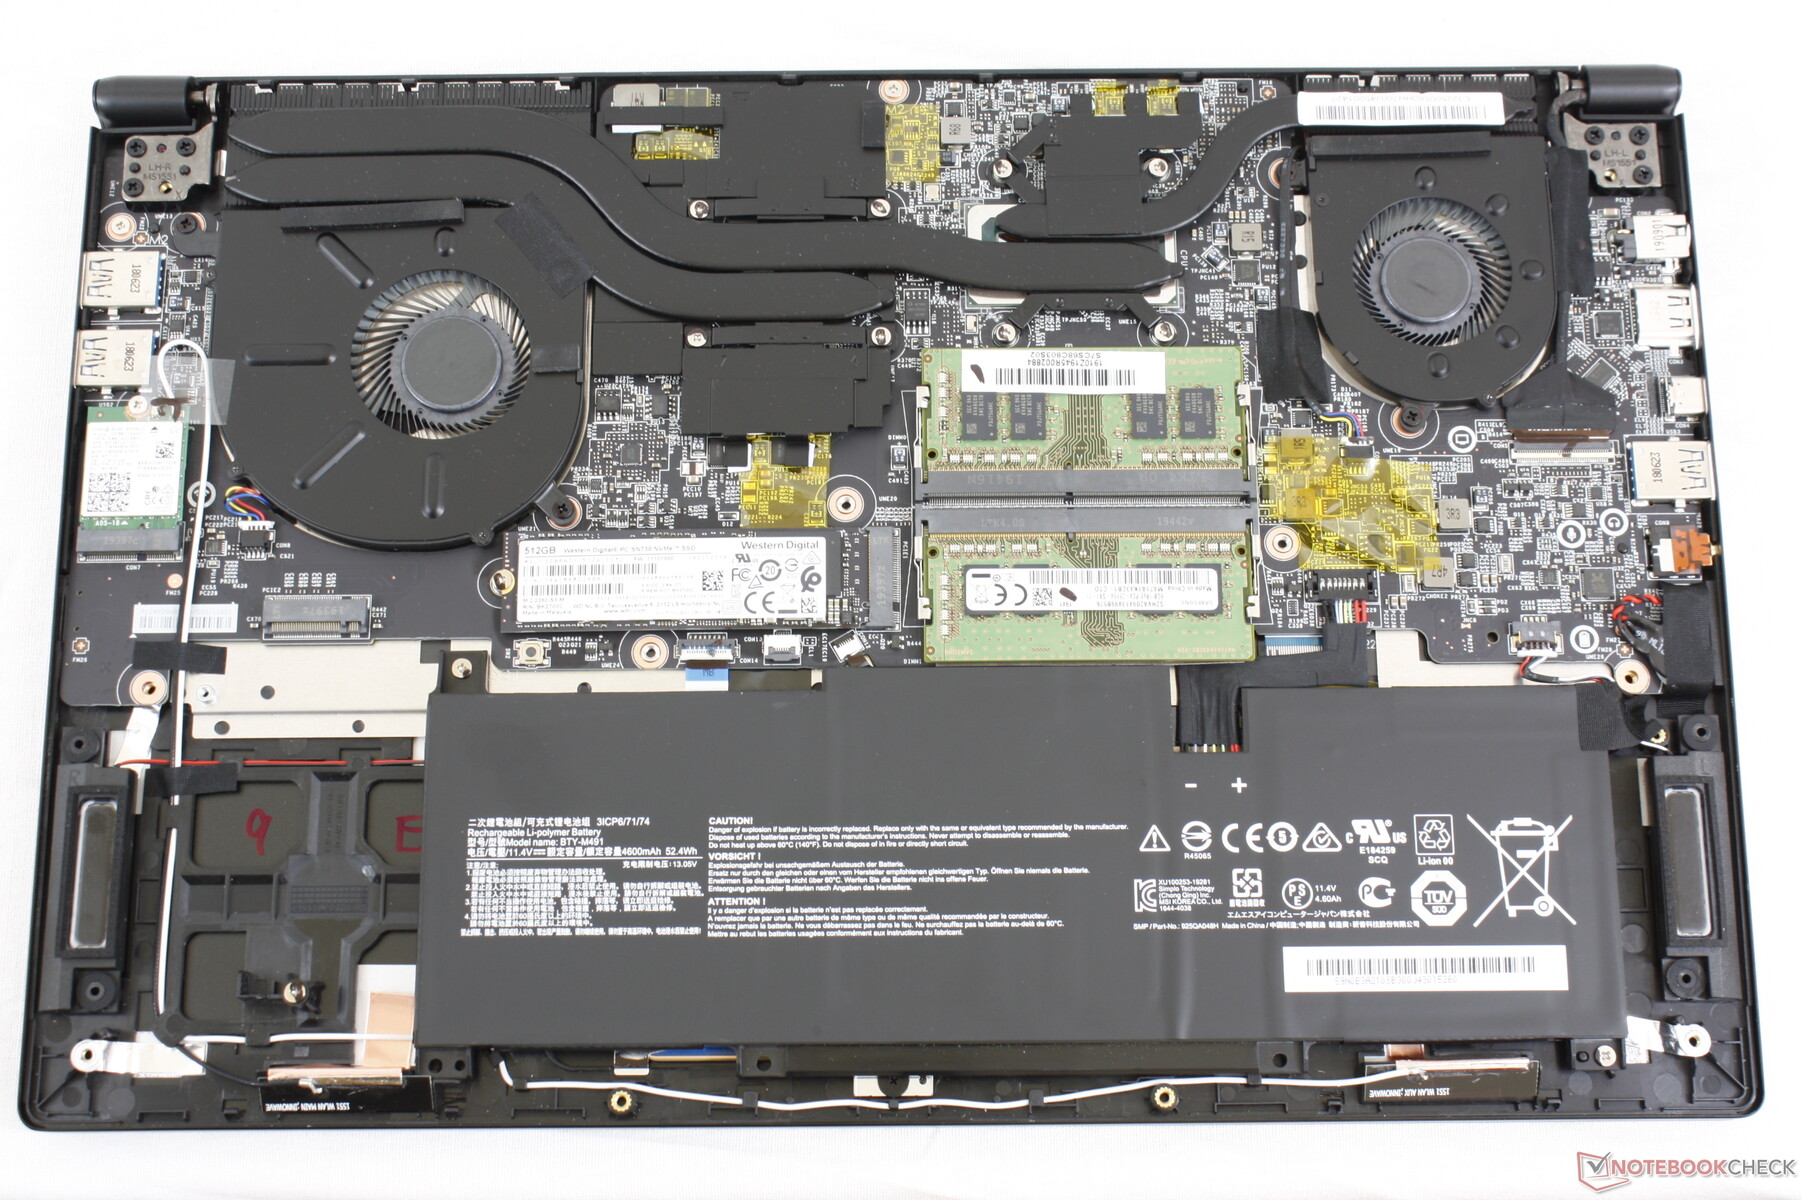
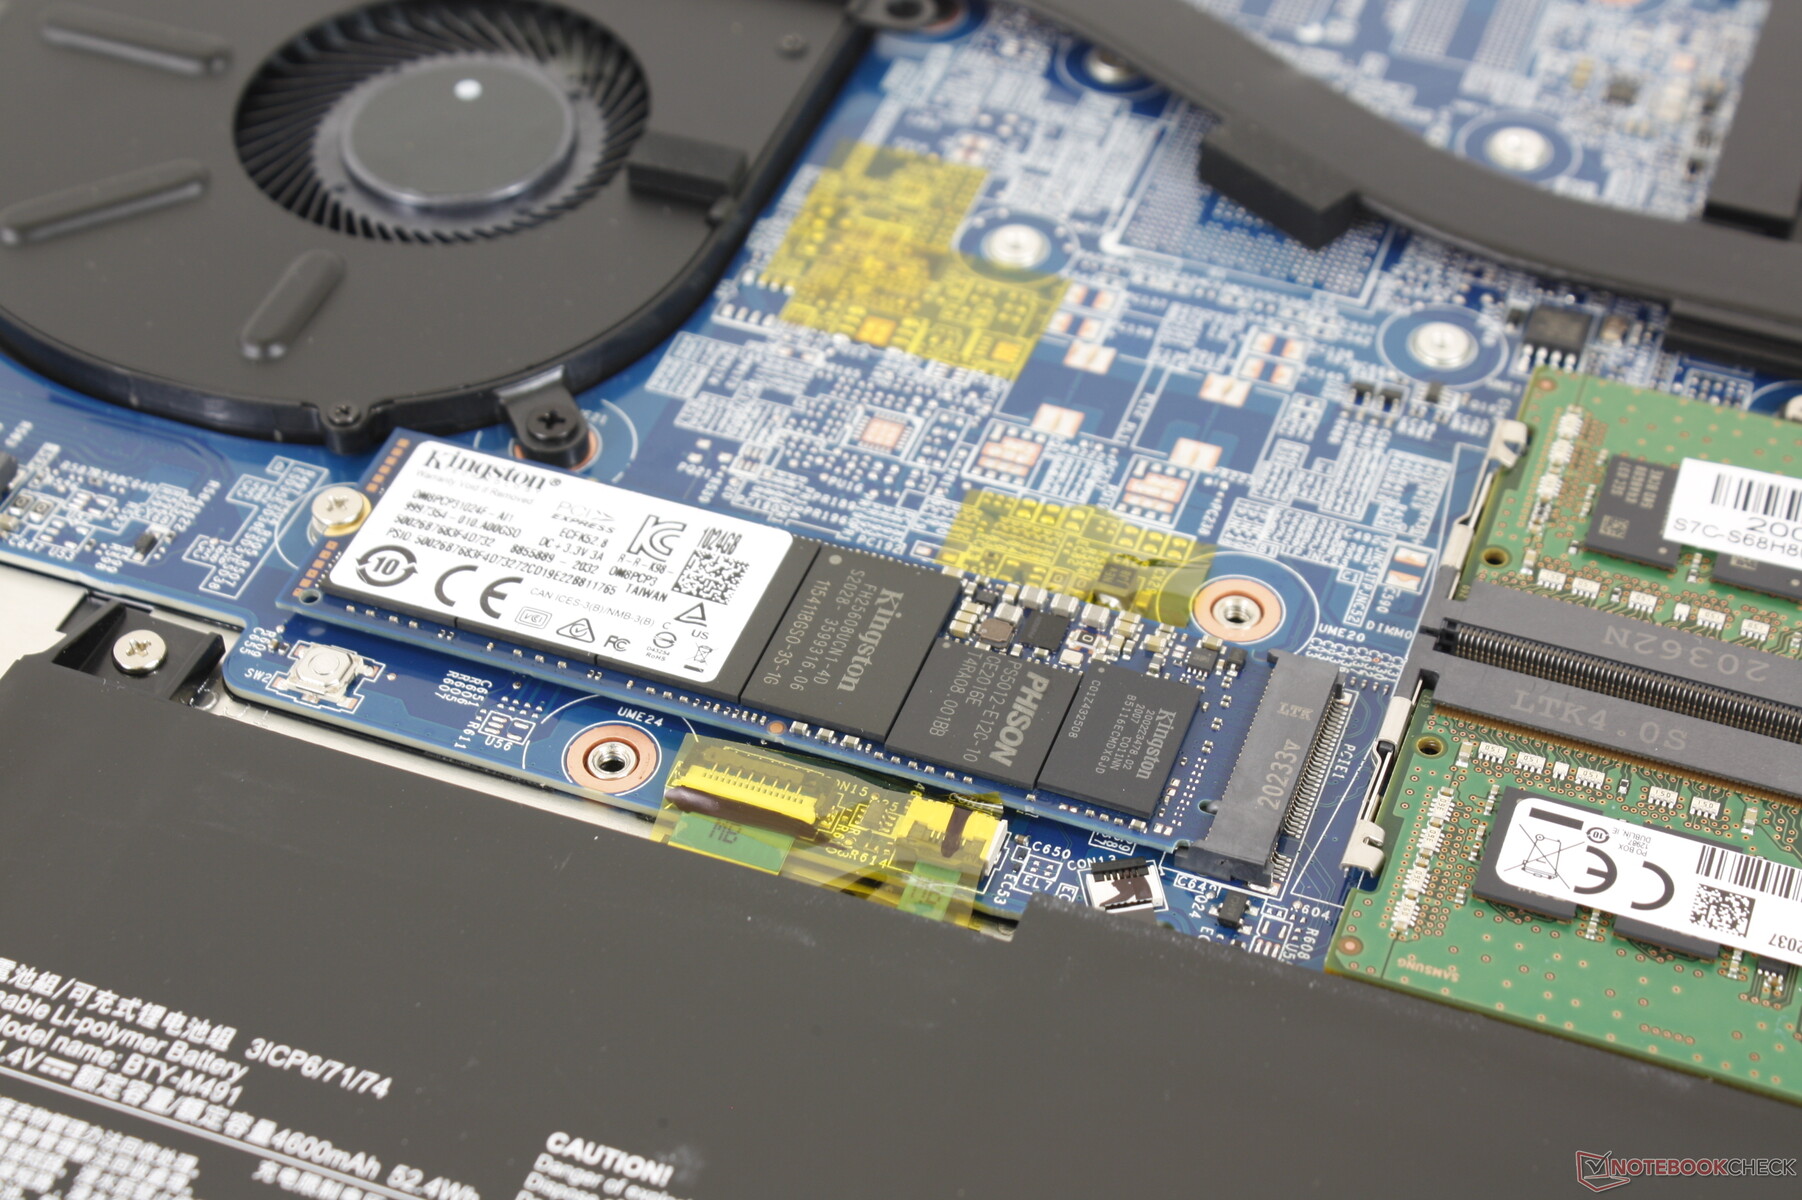
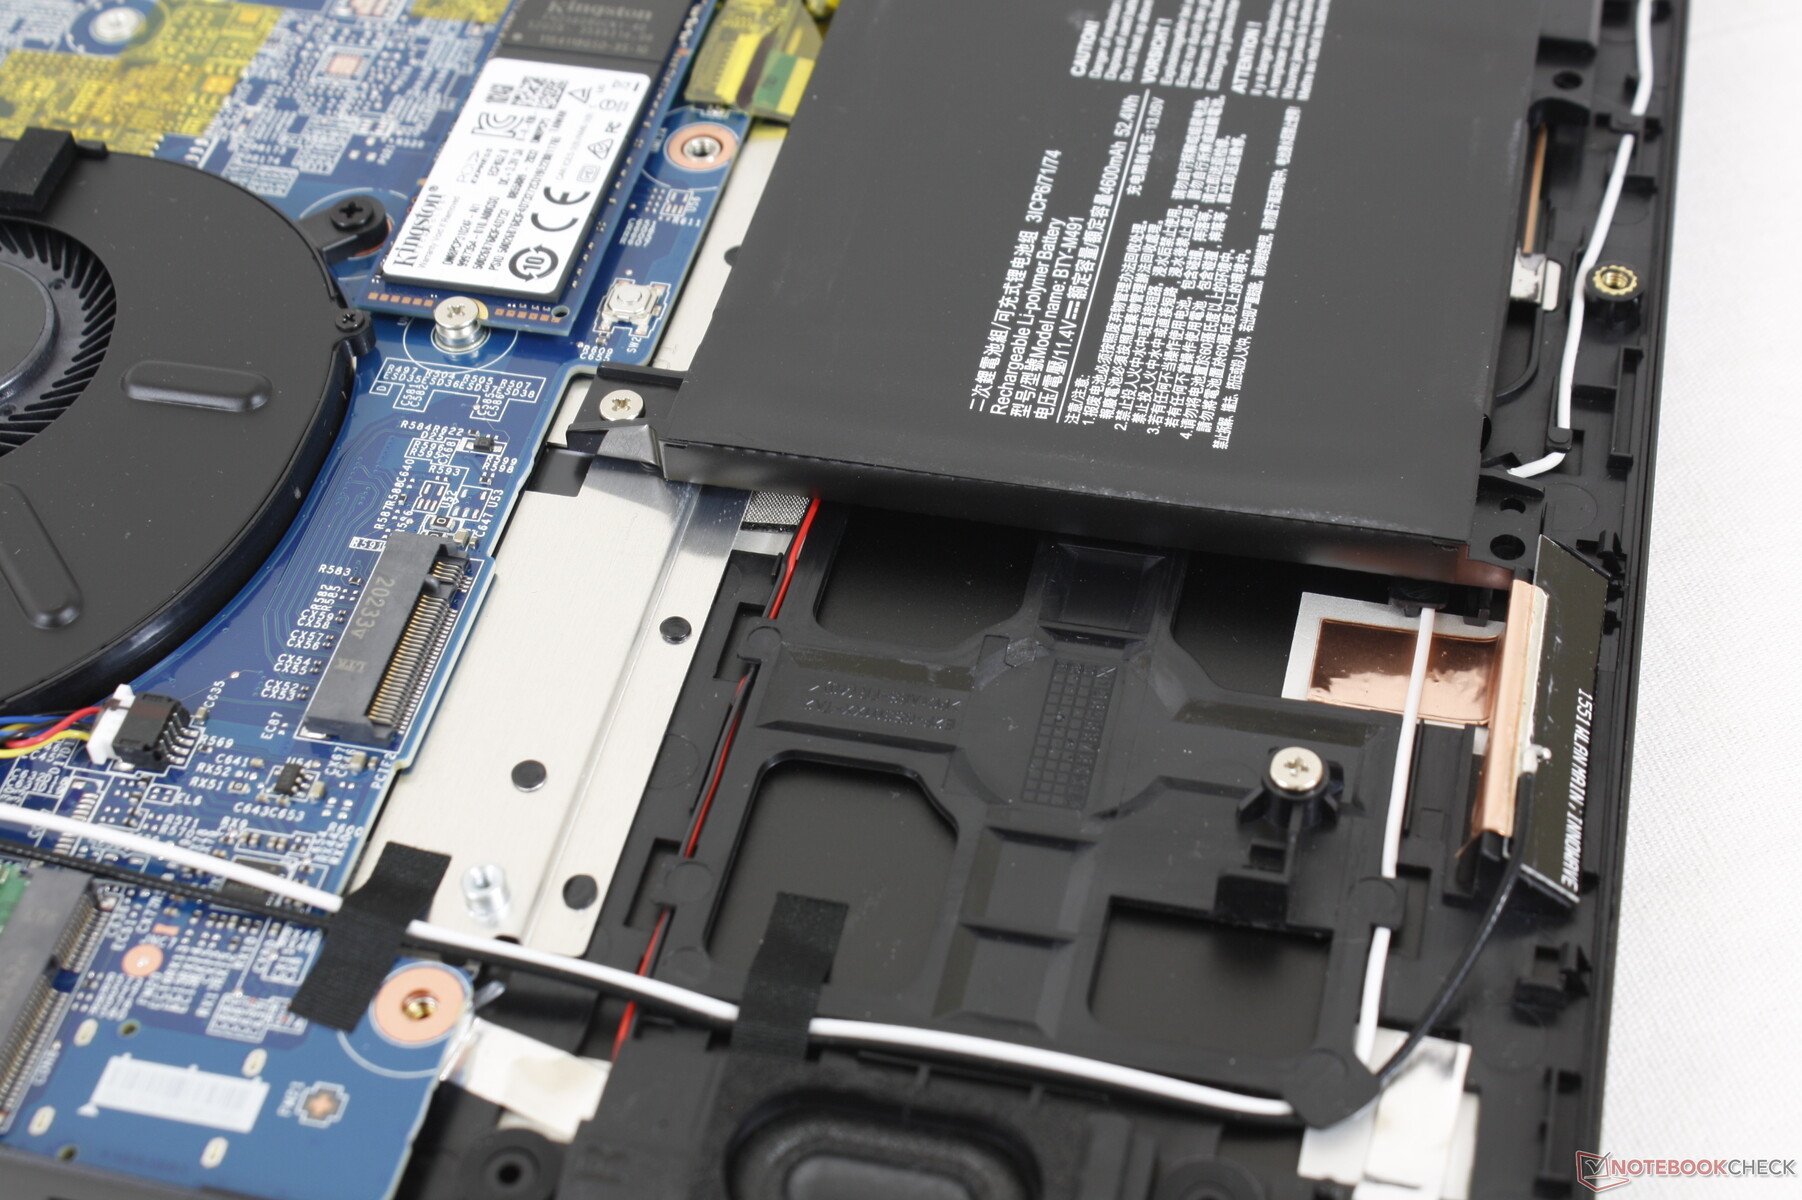
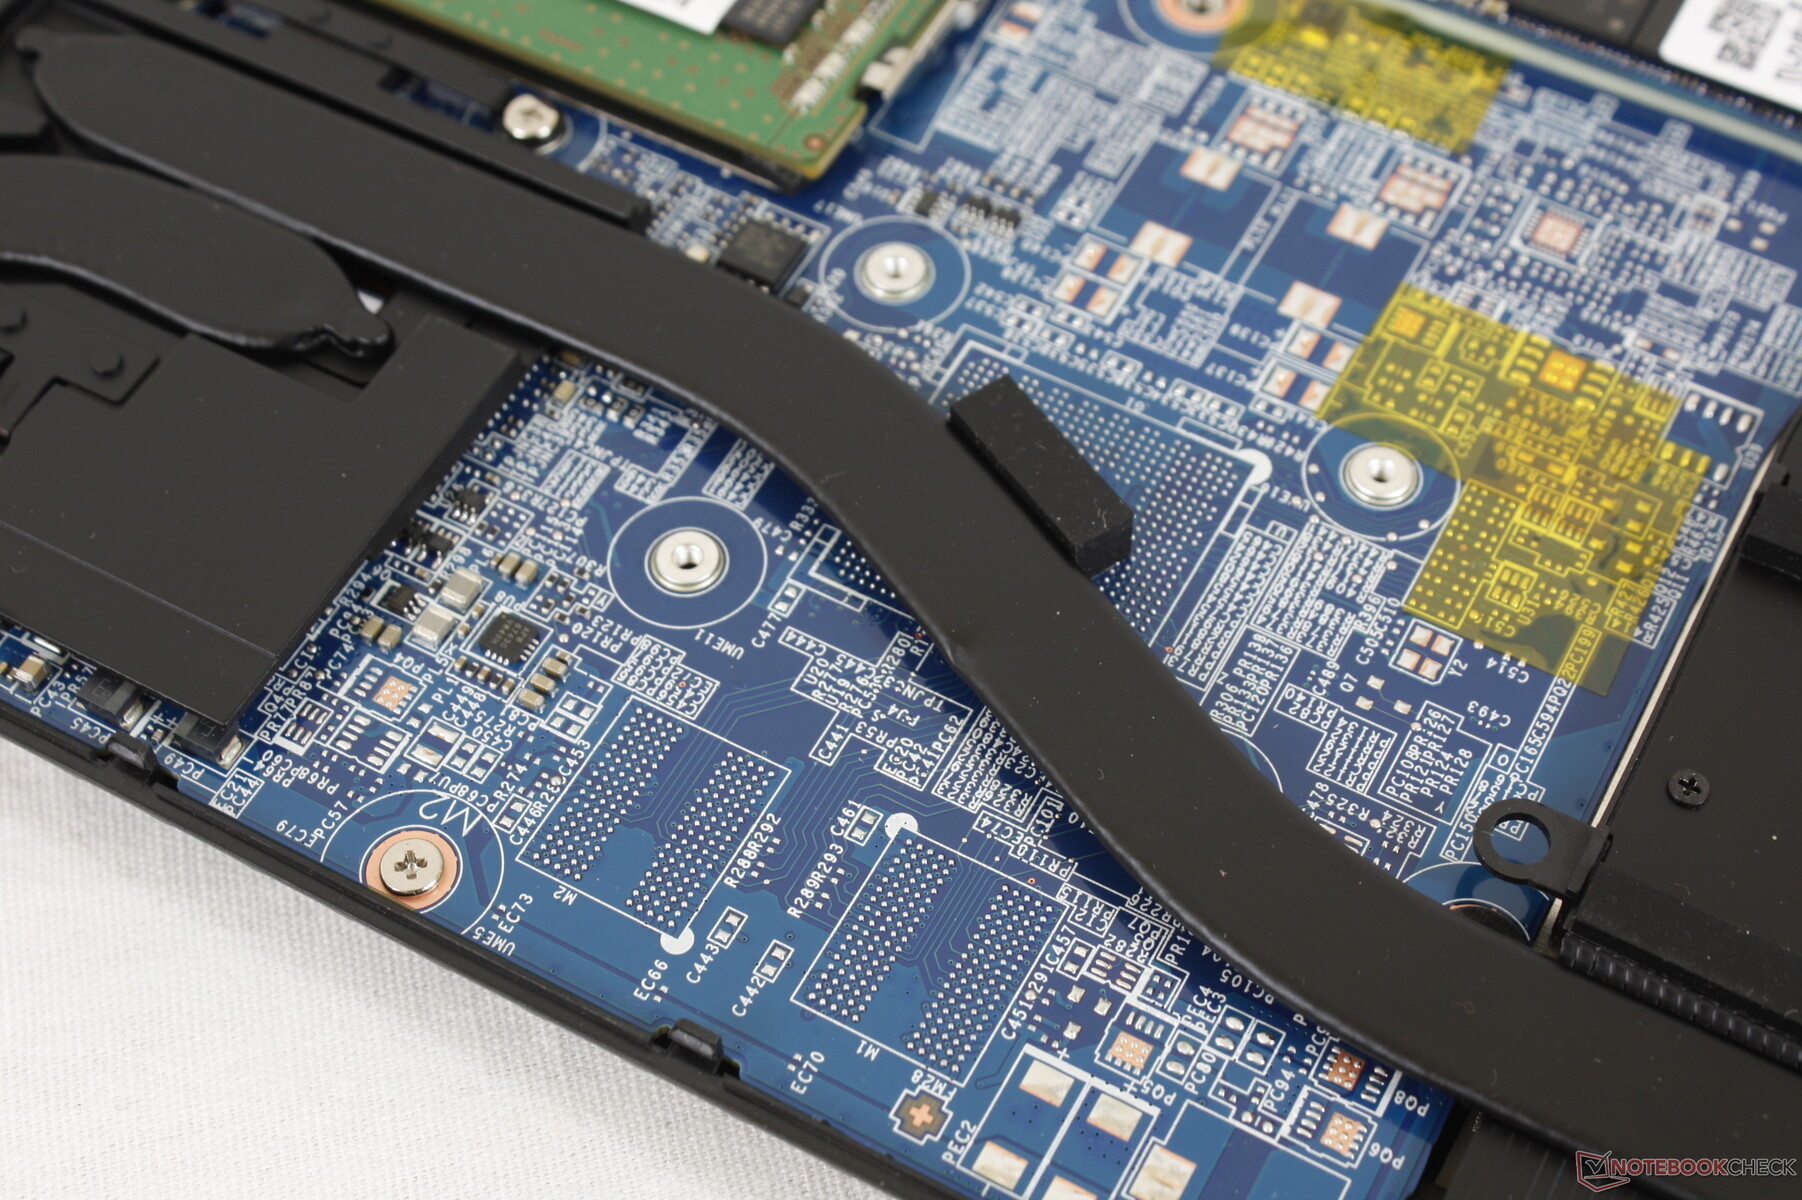
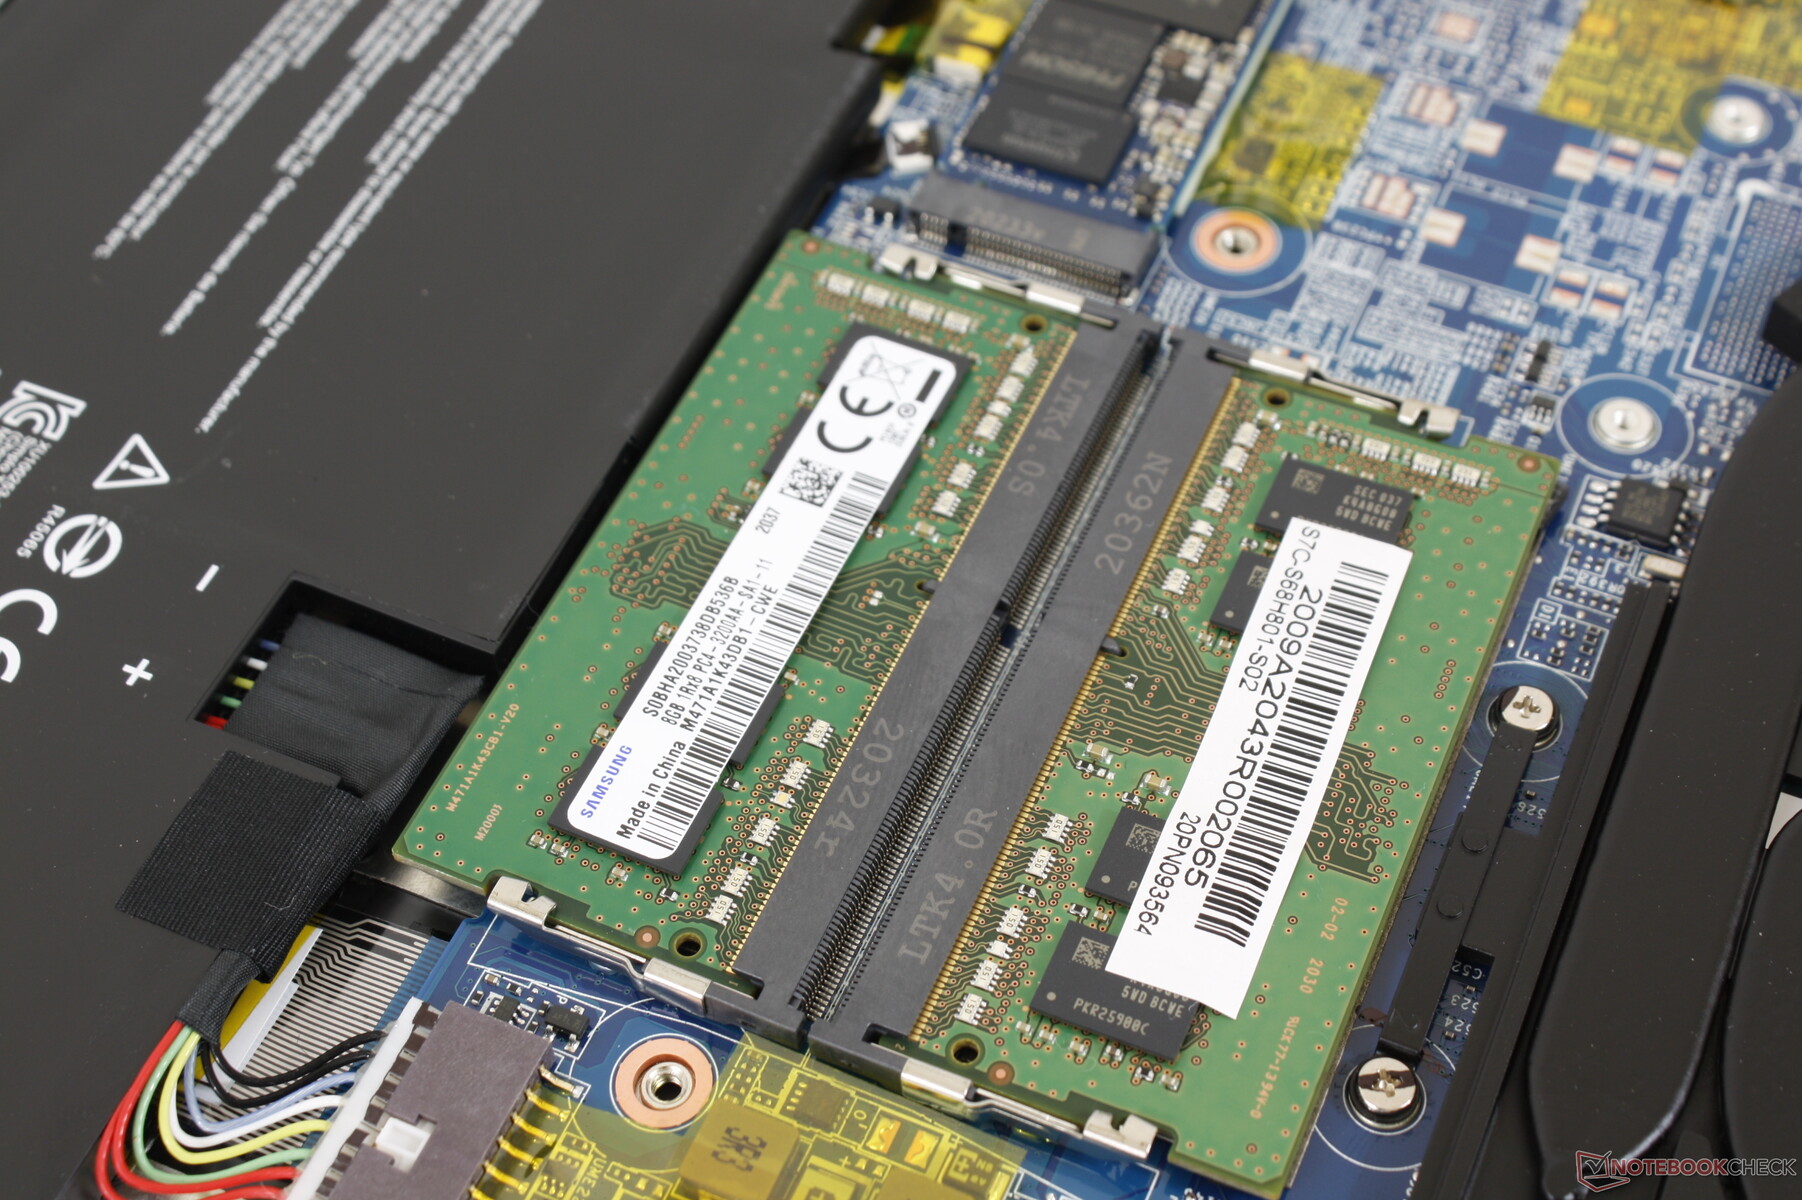
El panel inferior se extrae con bastante facilidad con un destornillador Philips. Sin embargo, hay que tener en cuenta que primero hay que romper una pegatina de sellado de fábrica. Una vez dentro, las similitudes entre el Summit B15 y el Modern 15 del año pasado se hacen aún más evidentes, como muestran las imágenes de comparación que aparecen a continuación.

Accesorios y garantía
La caja incluye un adaptador de USB-A a RJ-45 junto con la documentación y el adaptador de CA. Se aplica la garantía limitada estándar de un año con opciones de ampliación si se adquiere en Xotic PC.
Dispositivos de entrada
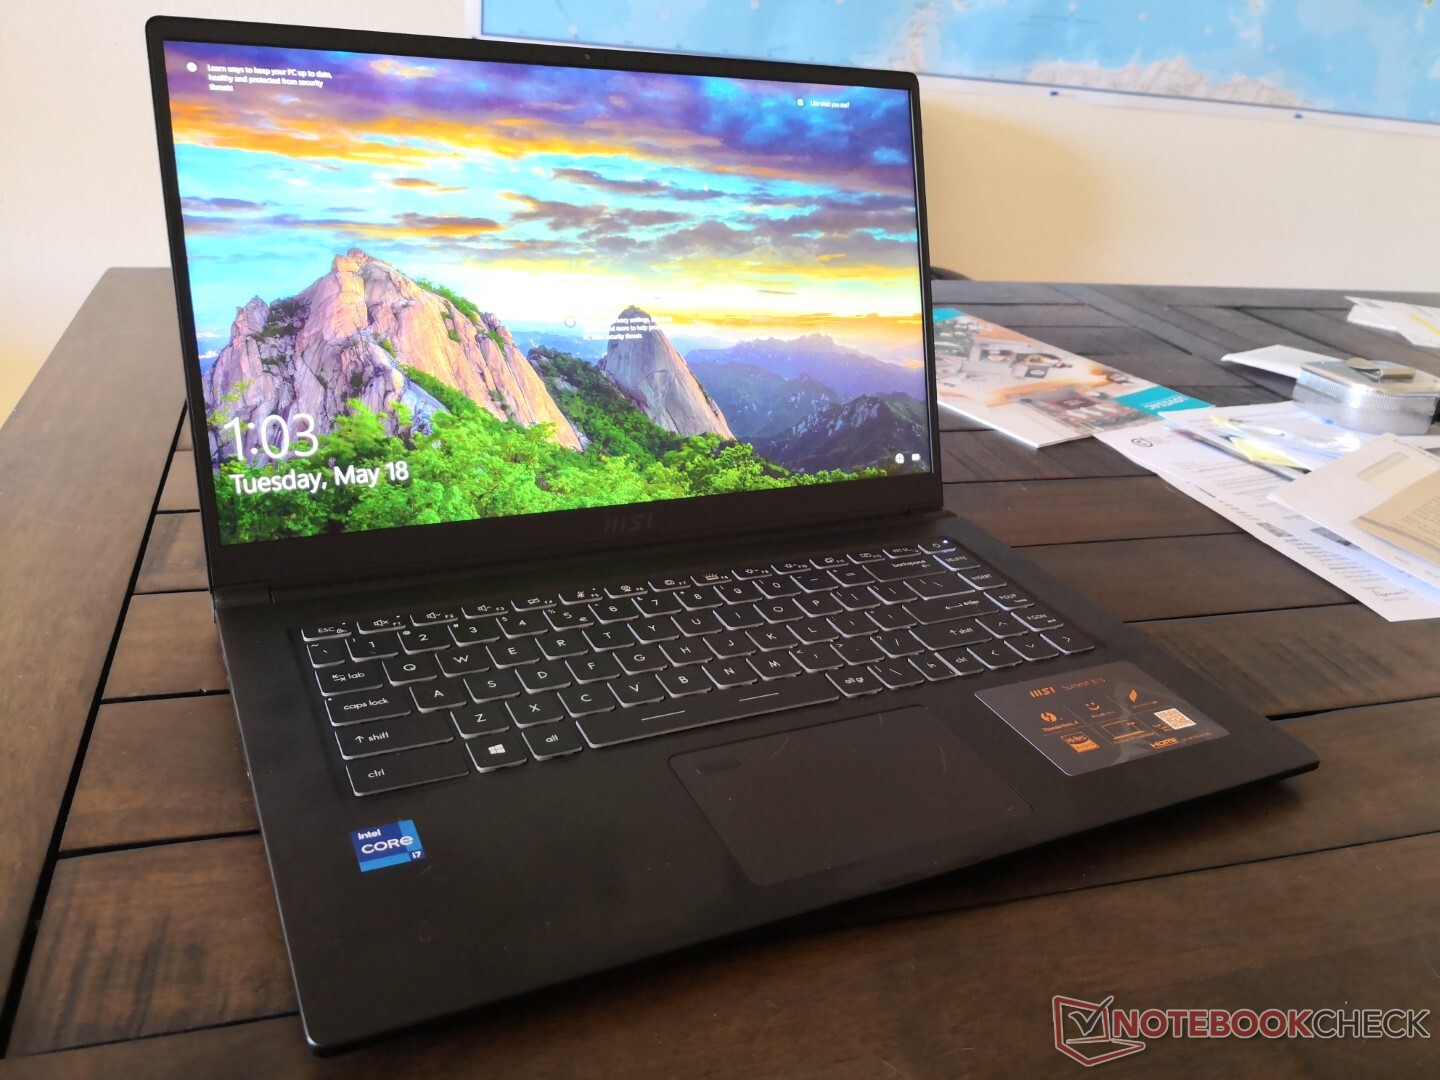
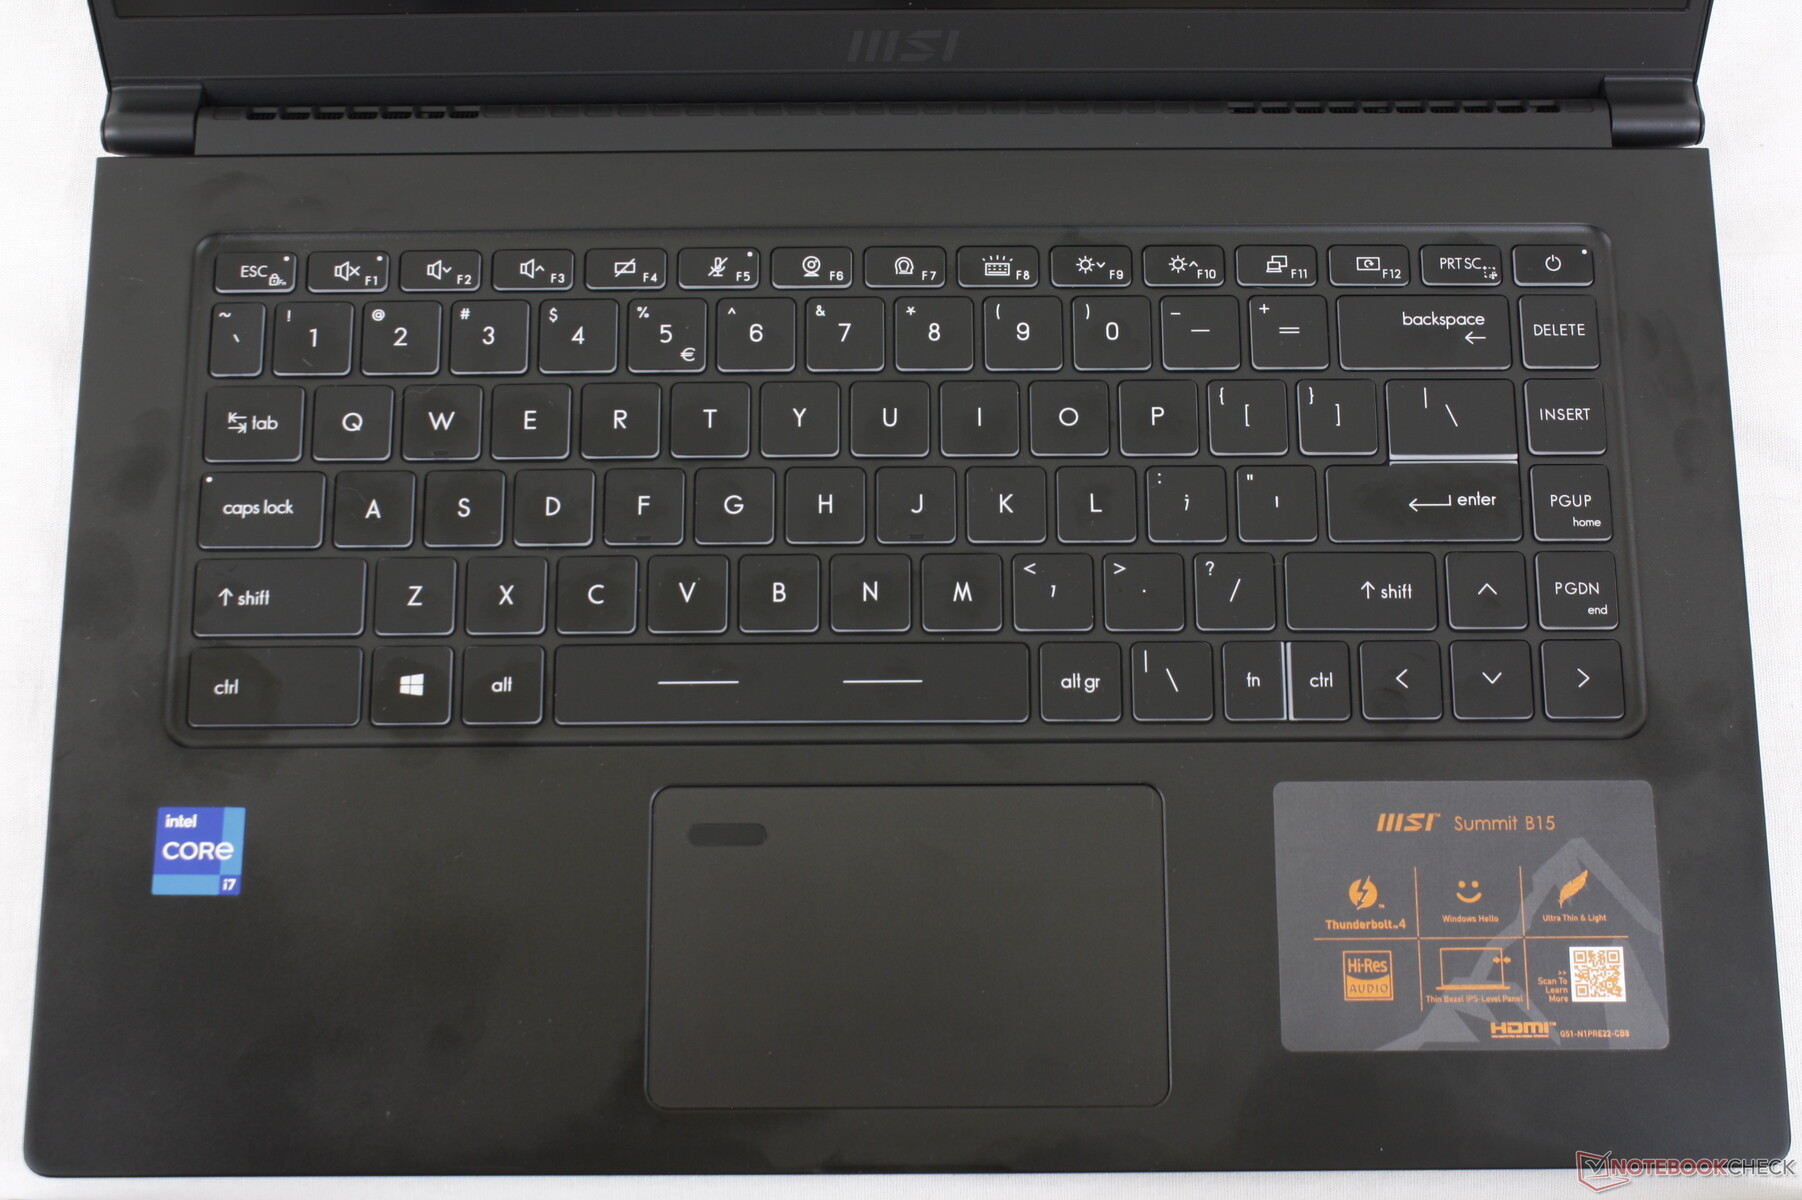
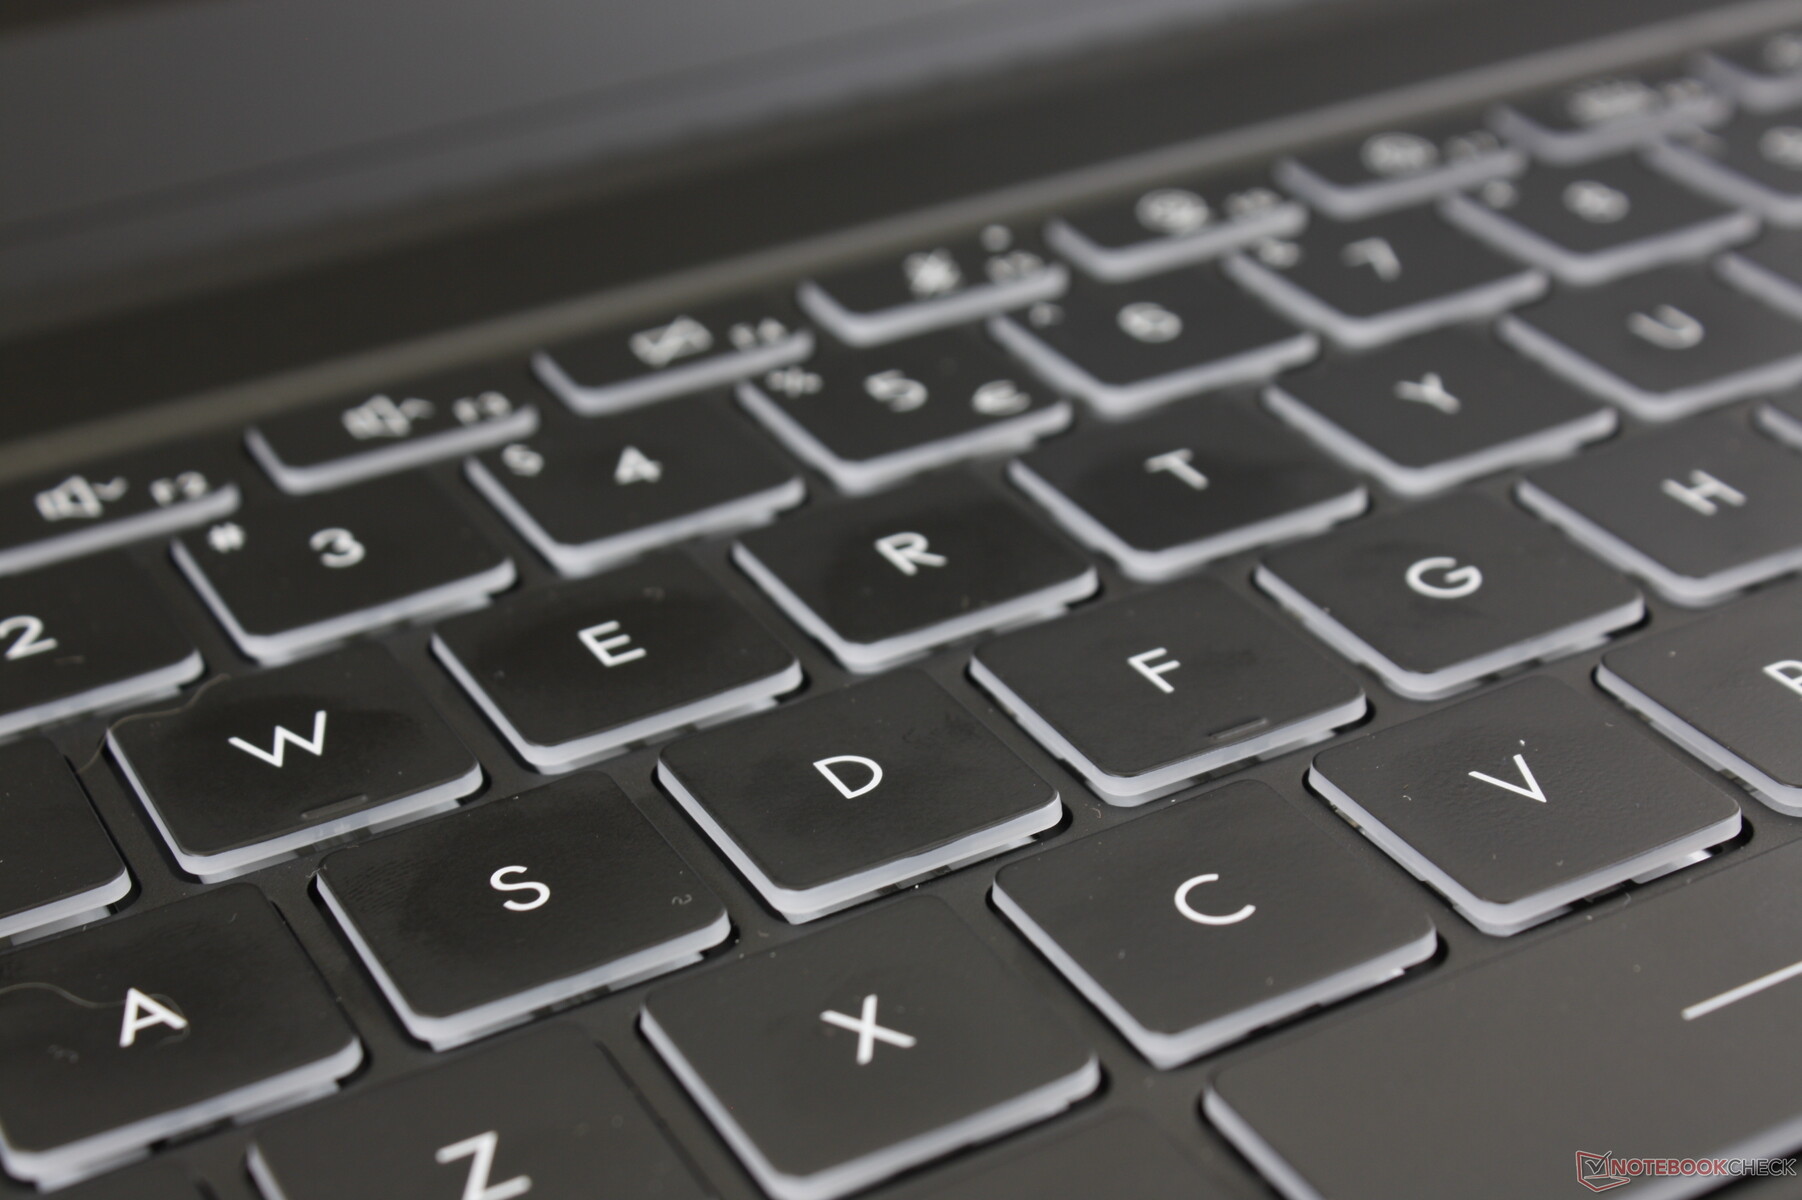
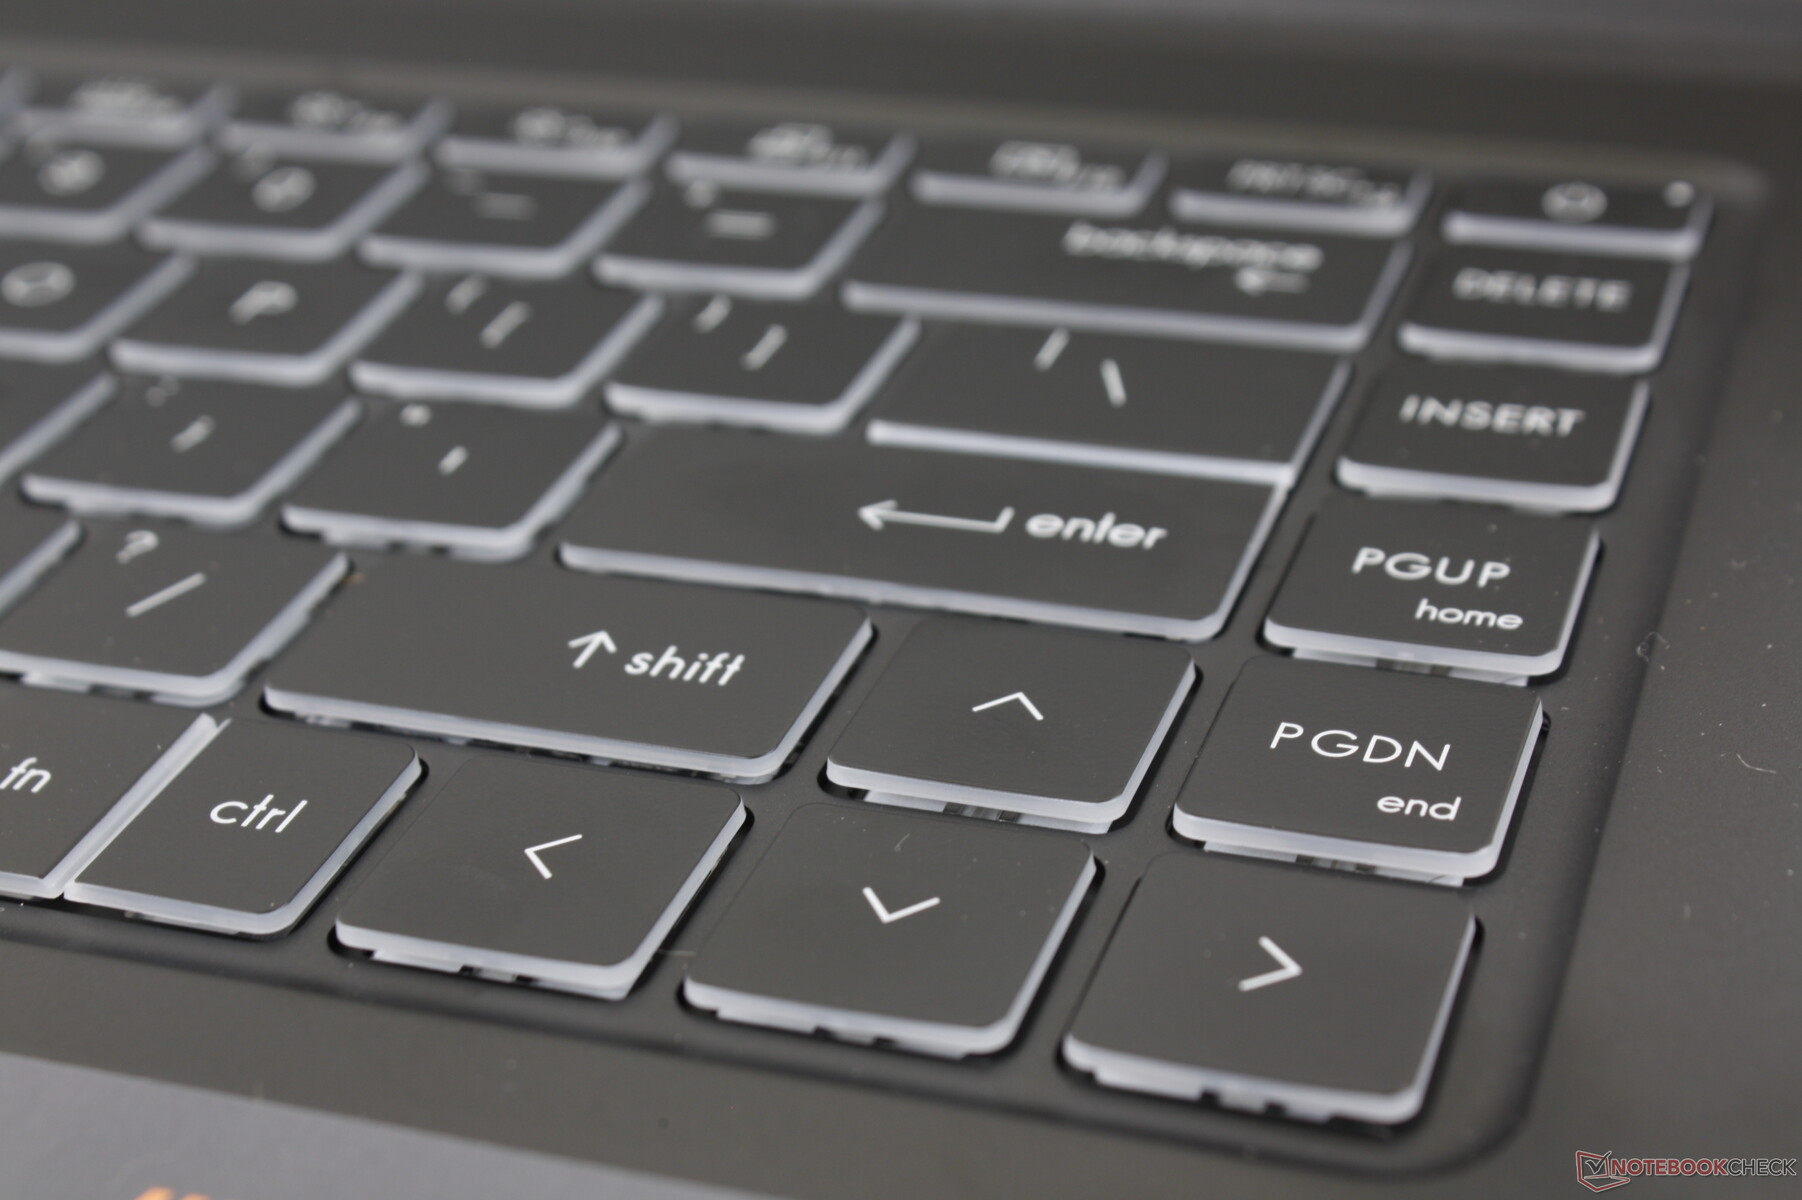
Teclado
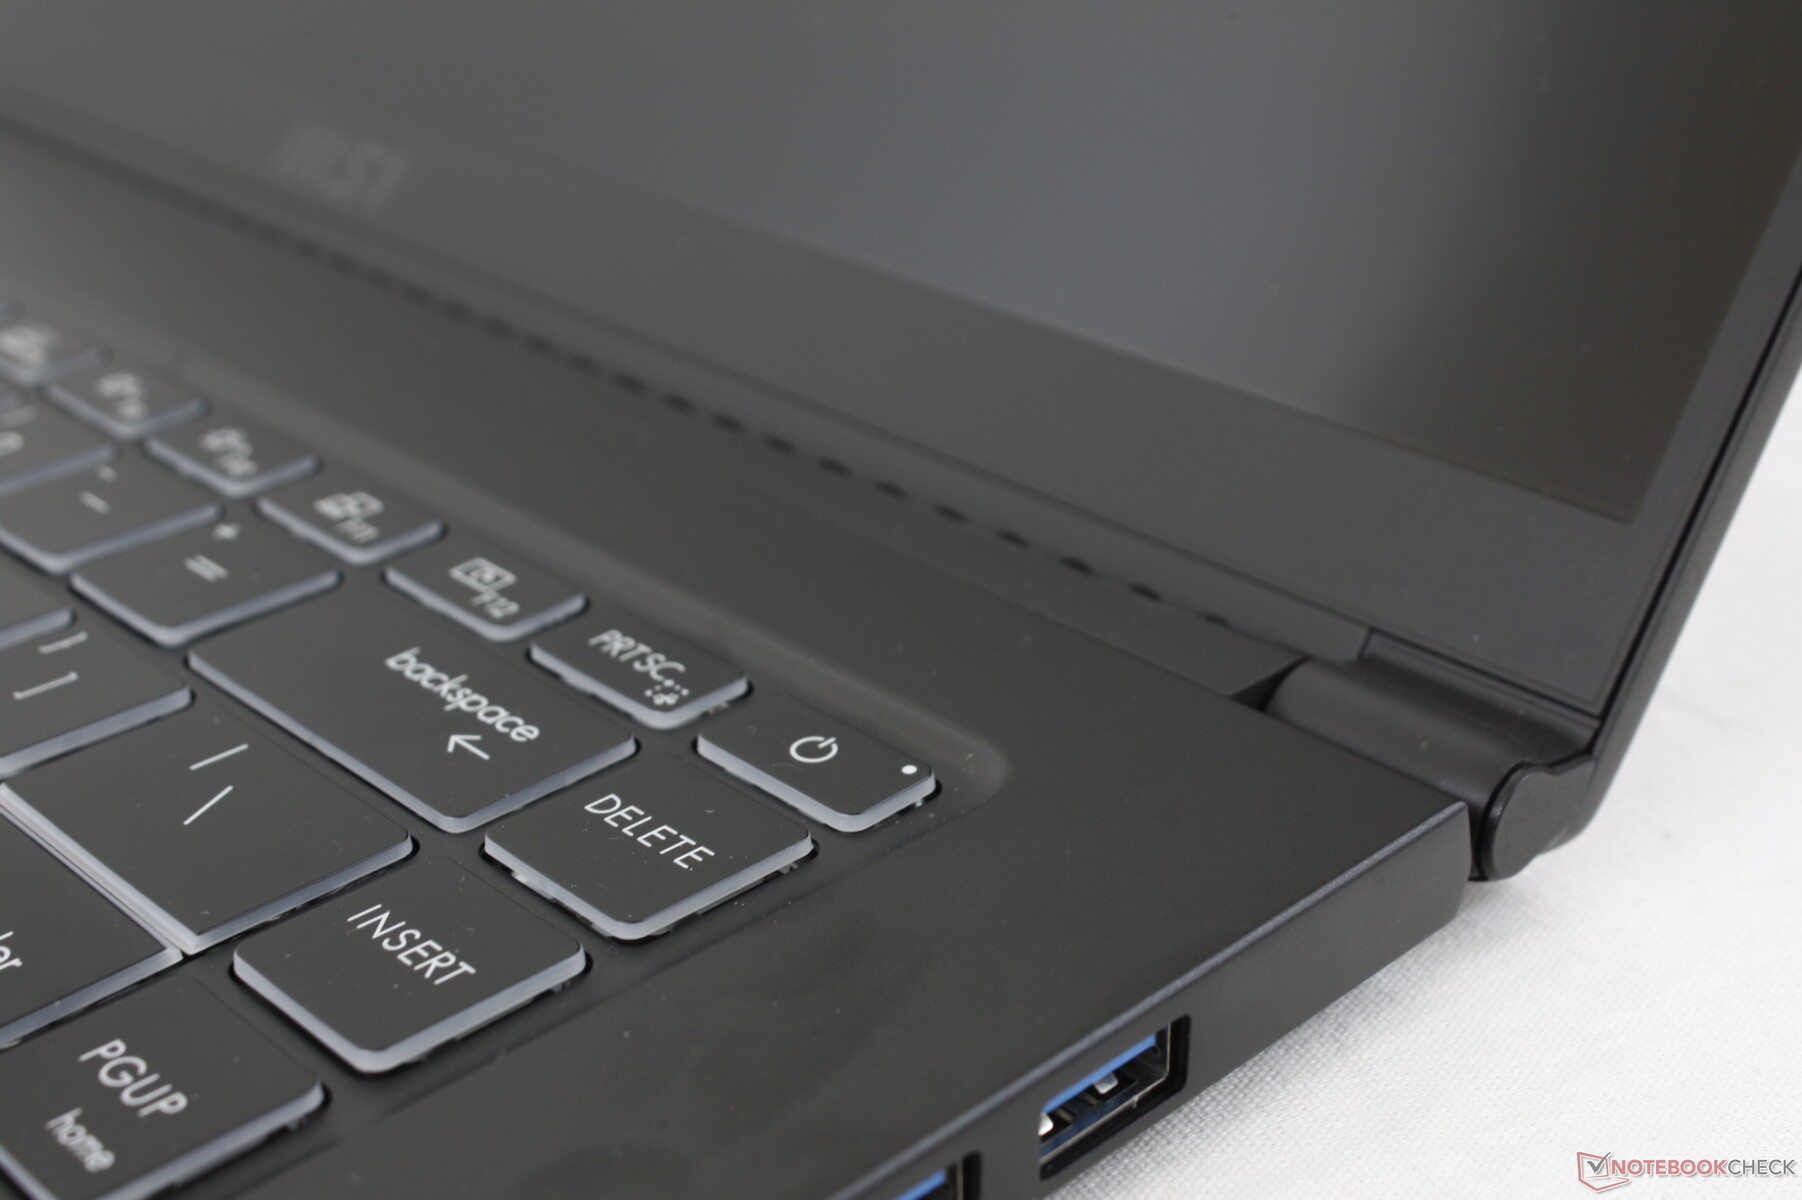
El tipo de letra de las teclas ha cambiado con respecto al Modern 15 para ser más nítido y no estar tan en negrita o cursiva. Por lo demás, la respuesta y la disposición de las teclas siguen siendo exactamente las mismas. Las teclas se sienten más firmes y profundas que en el XPG Xenia Xe y elDell XPS 15respectivamente, pero el ruido es ligeramente más fuerte como resultado. Apreciamos el tamaño completo de las teclas PgUp, PgDn, Delete y las teclas de flecha, ya que suelen estar reducidas en la mayoría de los otros portátiles.
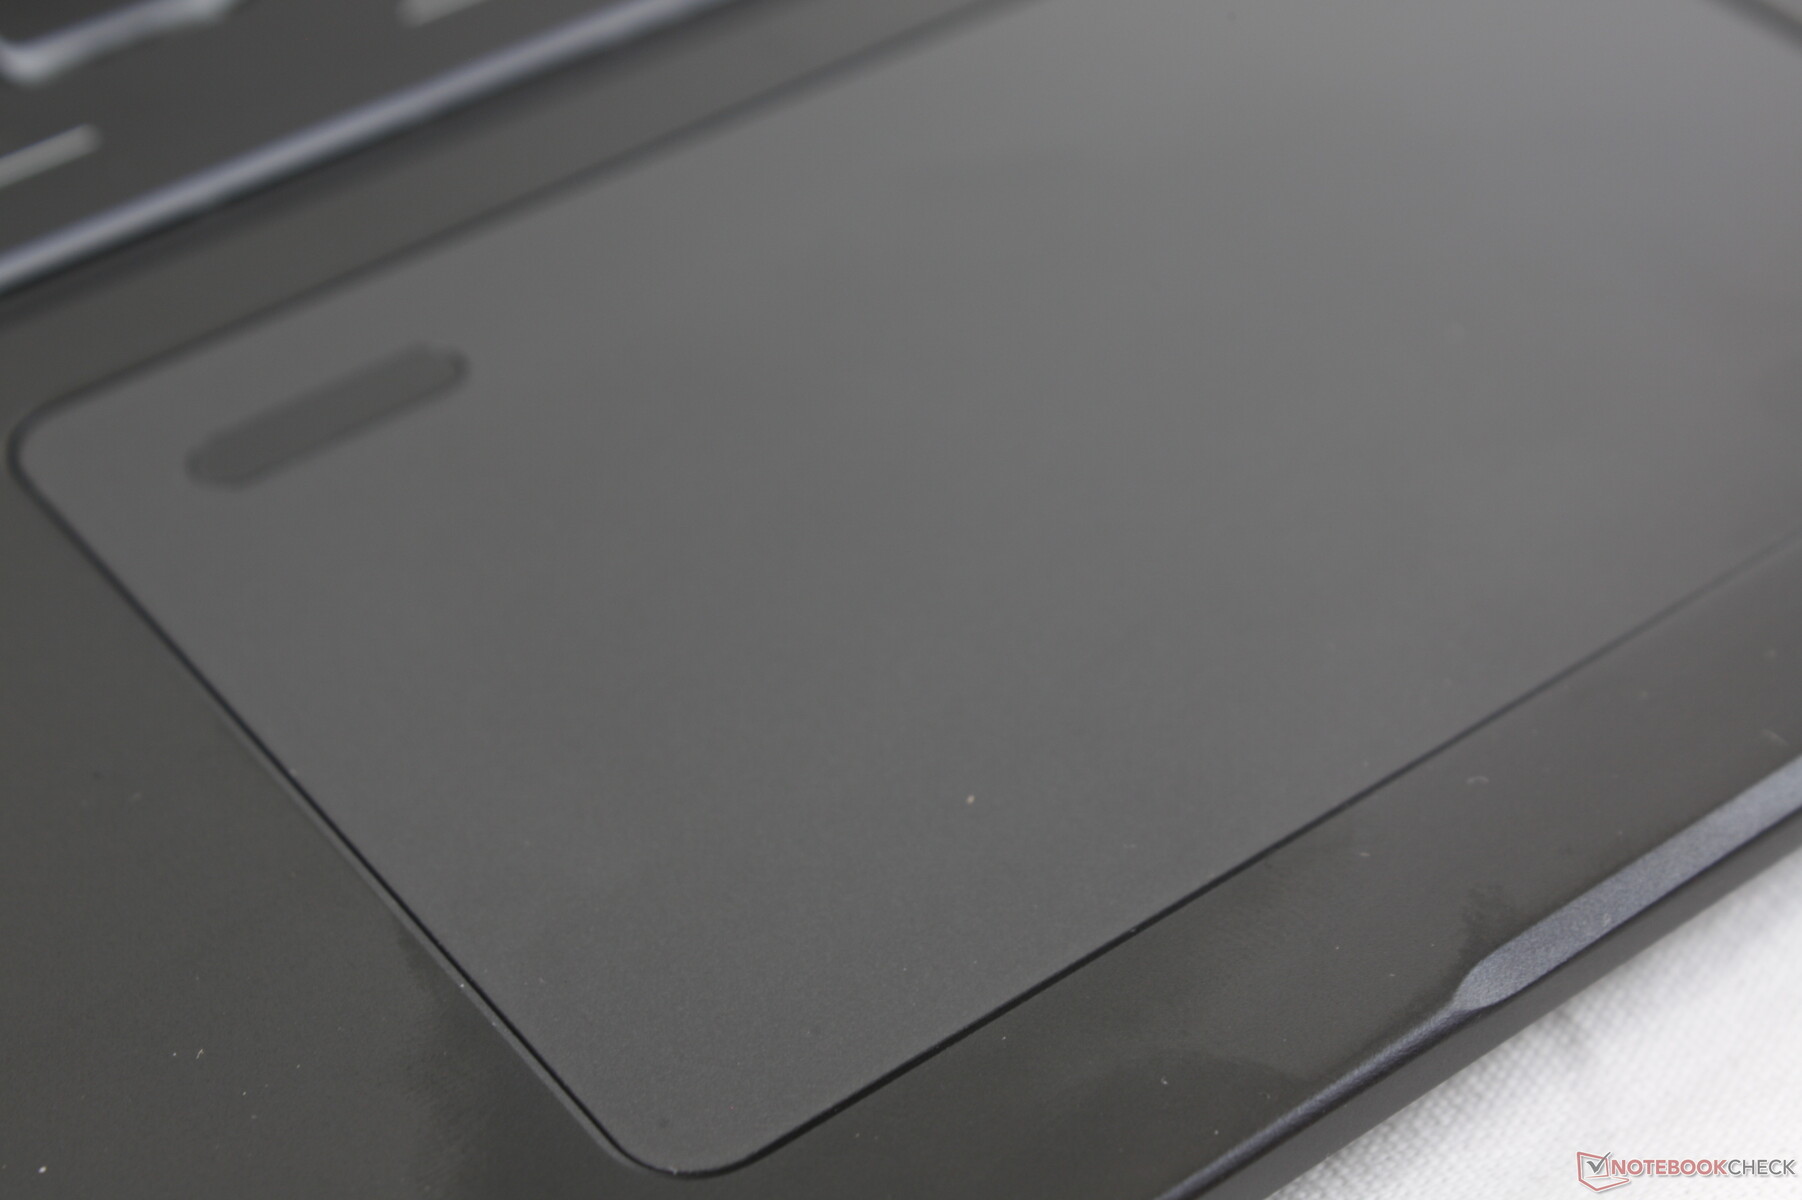
Panel táctil
El clickpad es del mismo tamaño que el del Modern 15 (10,5 x 6,5 cm) con la misma textura suave y respuesta esponjosa. No es tan suave como el clickpad del Xenia Xe, pero podría haber sido más firme para un clic más satisfactorio.
Sospechamos que MSI acabará alejando el lector de huellas dactilares del clickpad, como ya estamos viendo en Dell, HP y otros.
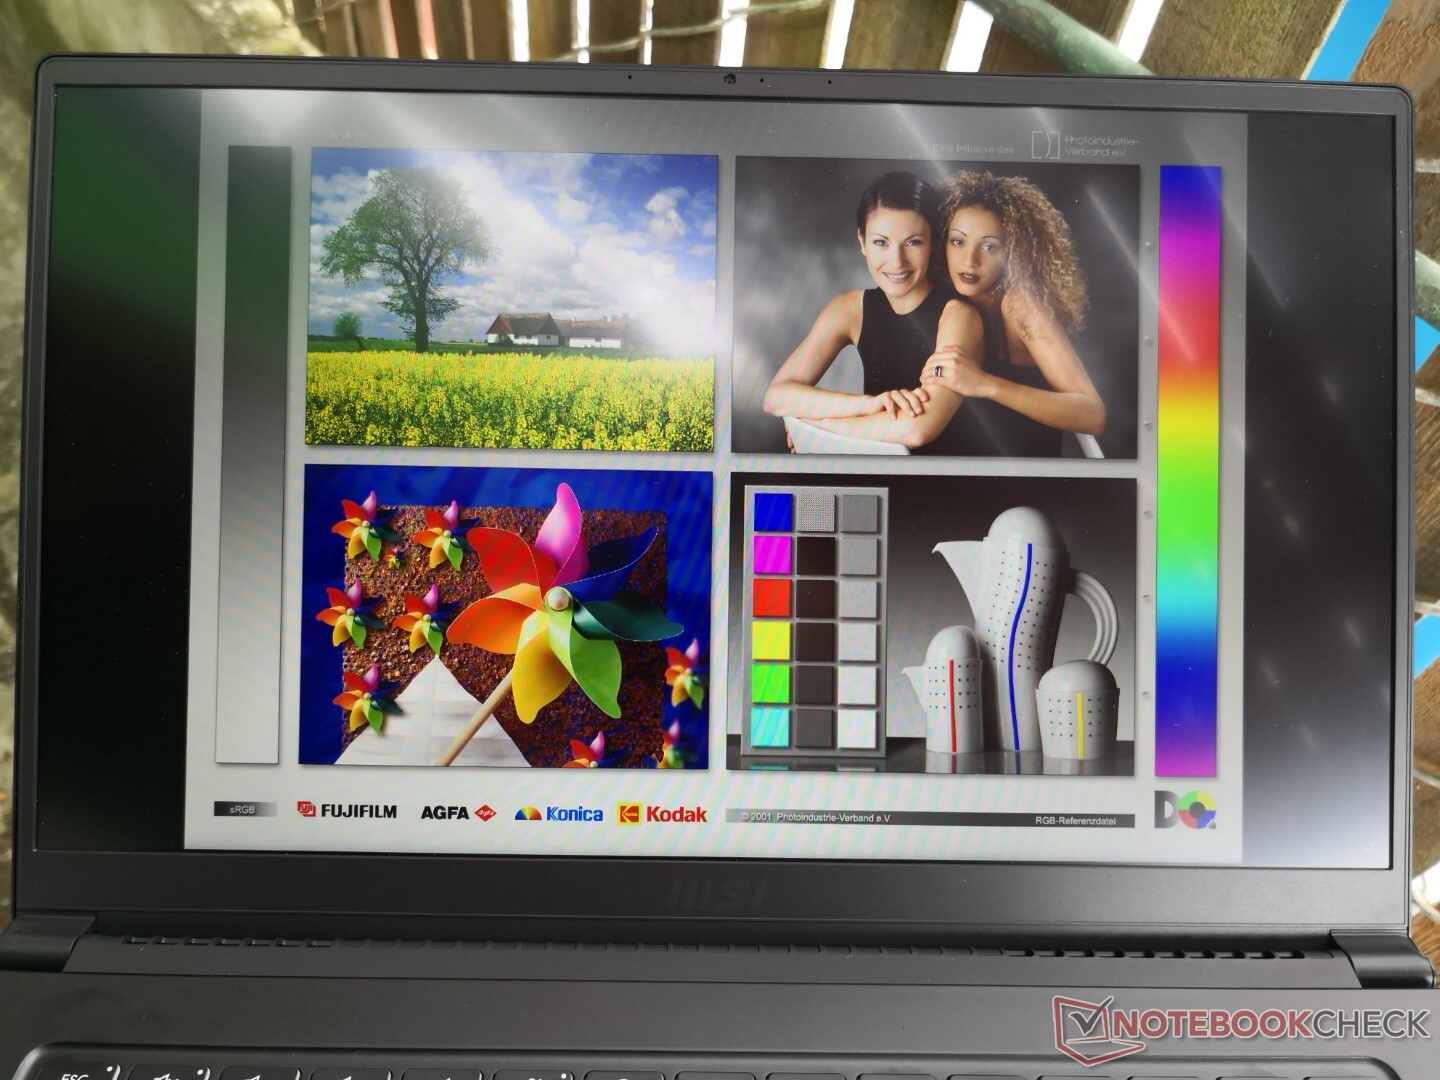
Mostrar
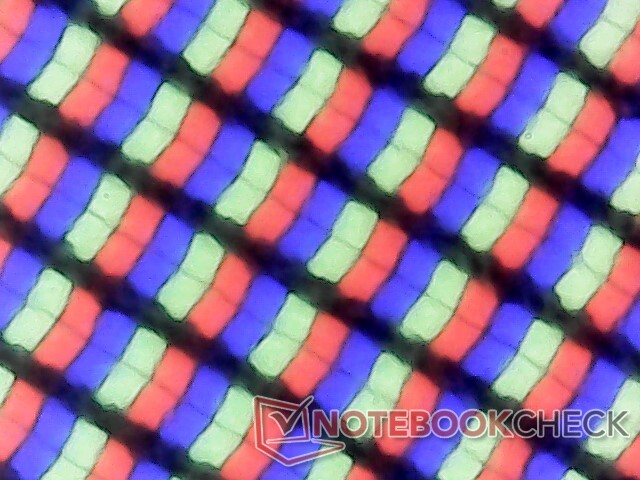
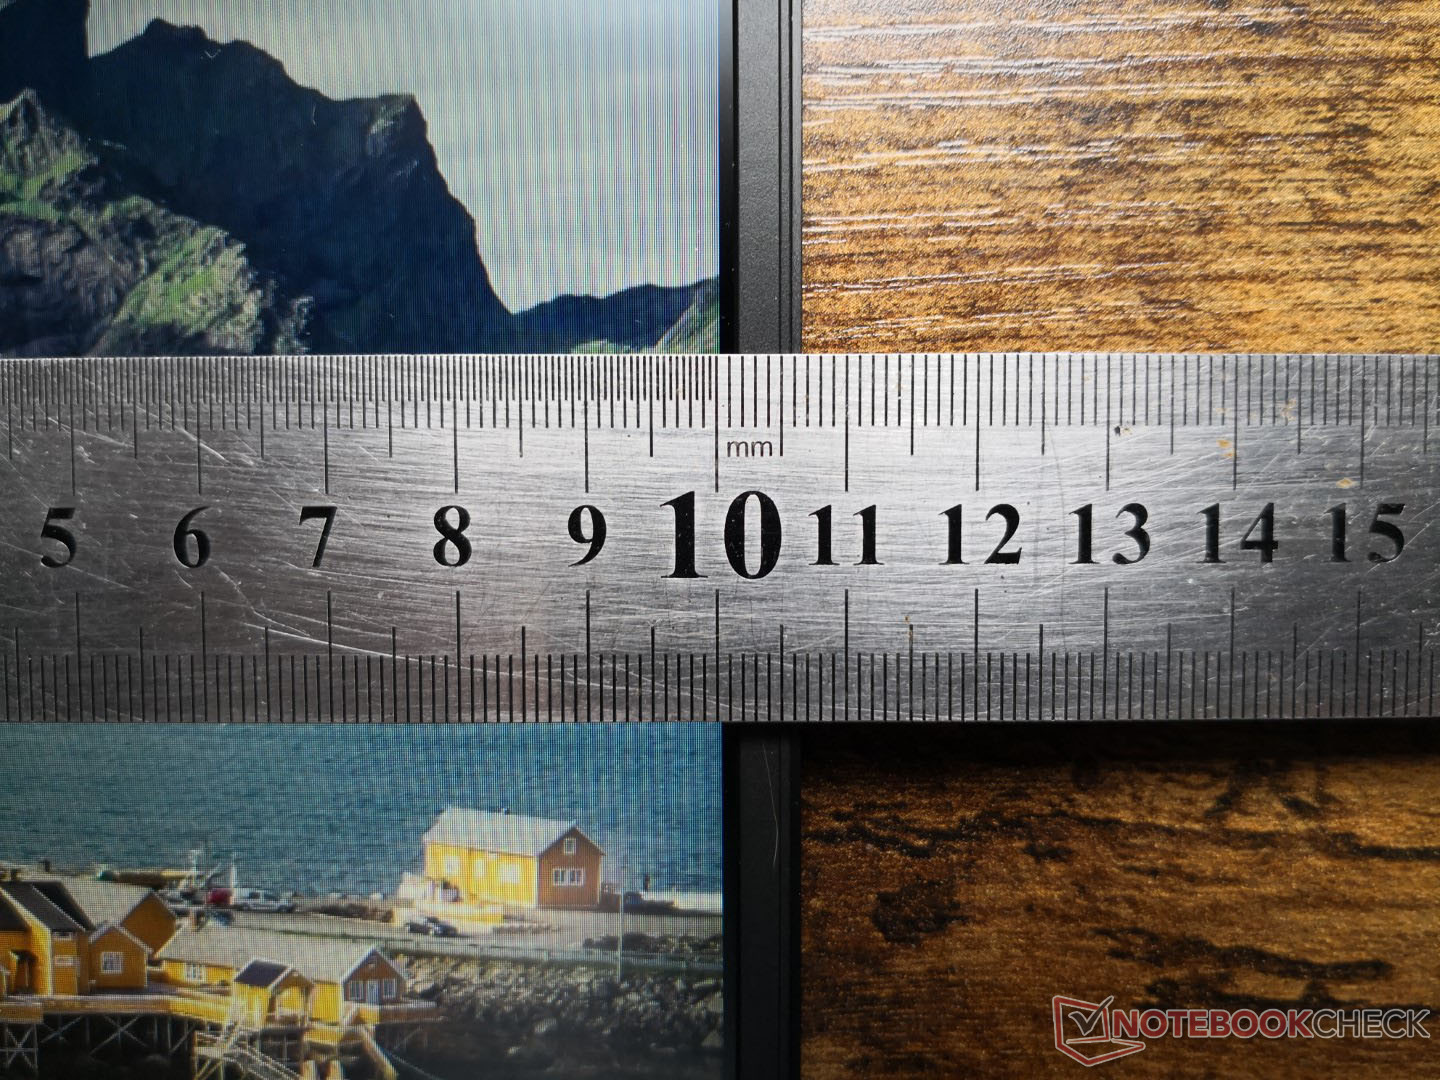
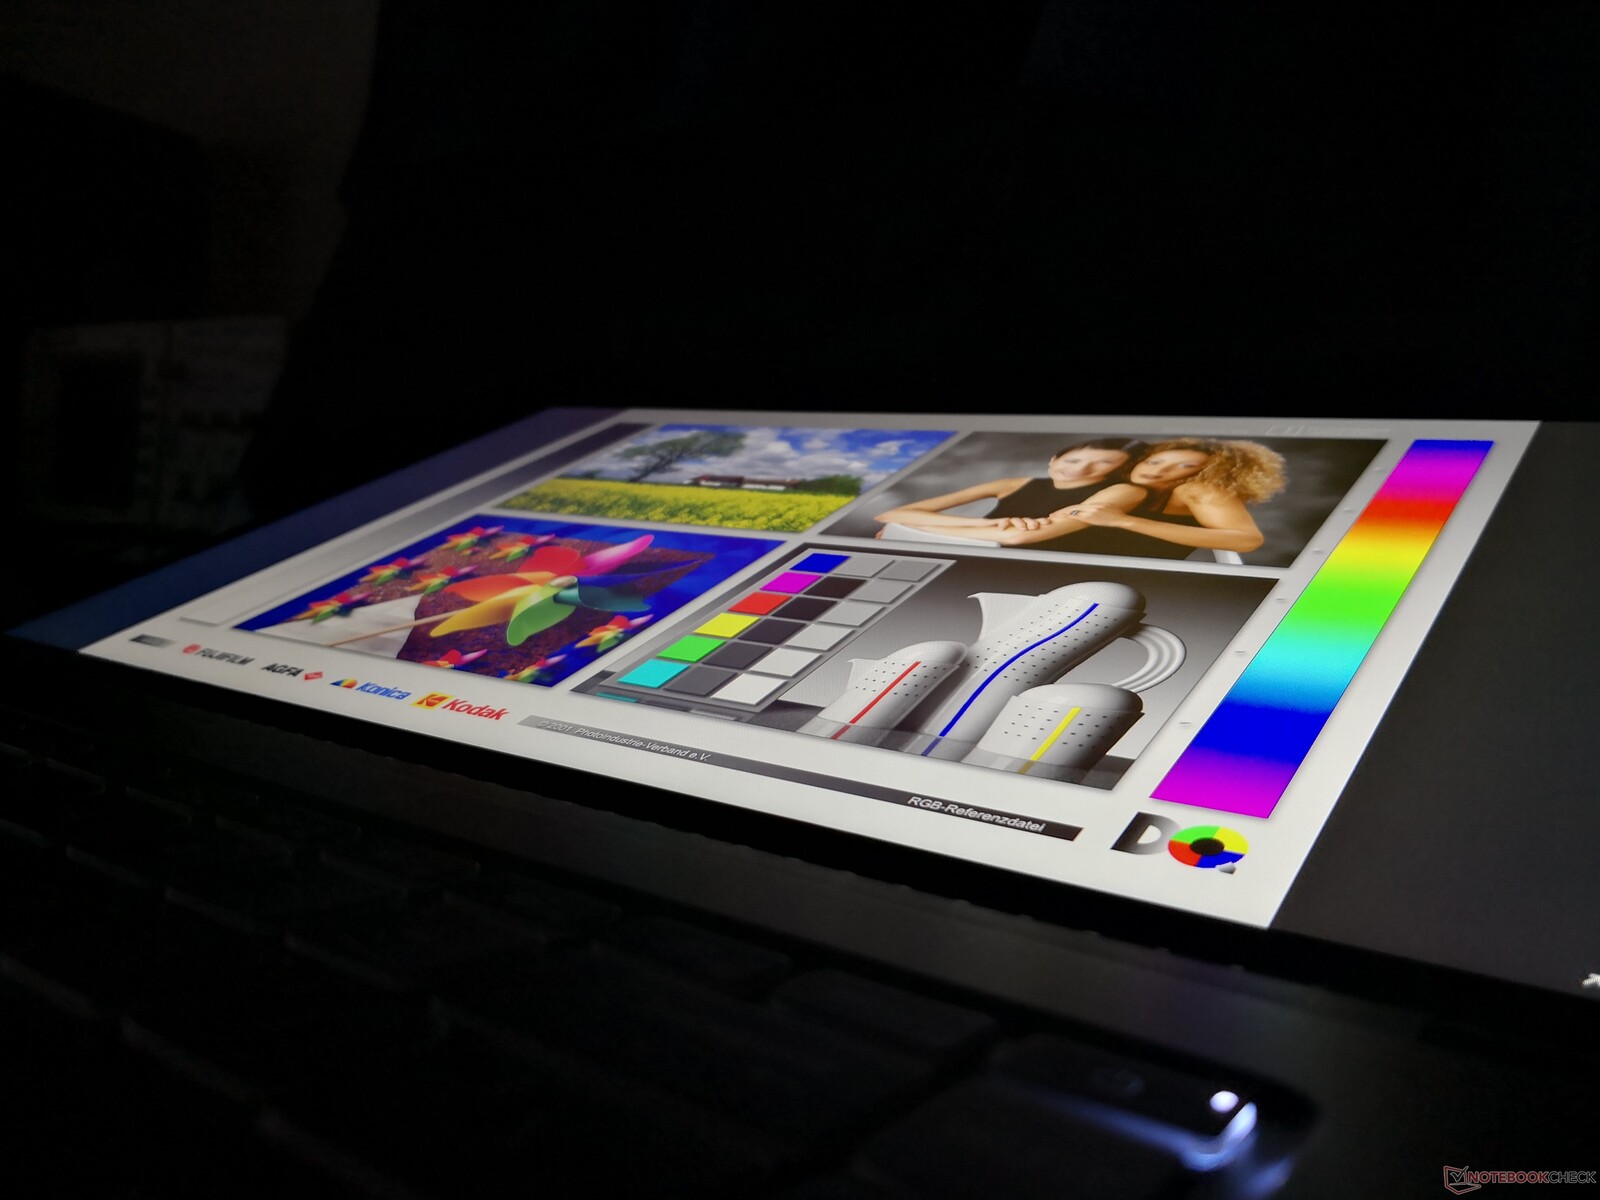
El Summit B15 utiliza el mismo panel IPS mate Chi Mei N156HCE-EN1 que se encuentra en el 2019 MSI PS63 Modern. De hecho, este panel exacto es bastante común en los portátiles de gama media superior de 15,6 pulgadas, incluyendo el ThinkPad P52y el ThinkPad X1 Extreme, Asus ZenBook Pro UX550e incluso el propio Modern 15 de MSI. La calidad de imagen es, por tanto, similar entre todos estos portátiles, incluyendo los tiempos medios de respuesta en blanco y negro y una relación de contraste decente. La modulación de ancho de pulso en niveles de brillo más bajos también está de vuelta.
| |||||||||||||||||||||||||
iluminación: 81 %
Brillo con batería: 341.3 cd/m²
Contraste: 758:1 (Negro: 0.45 cd/m²)
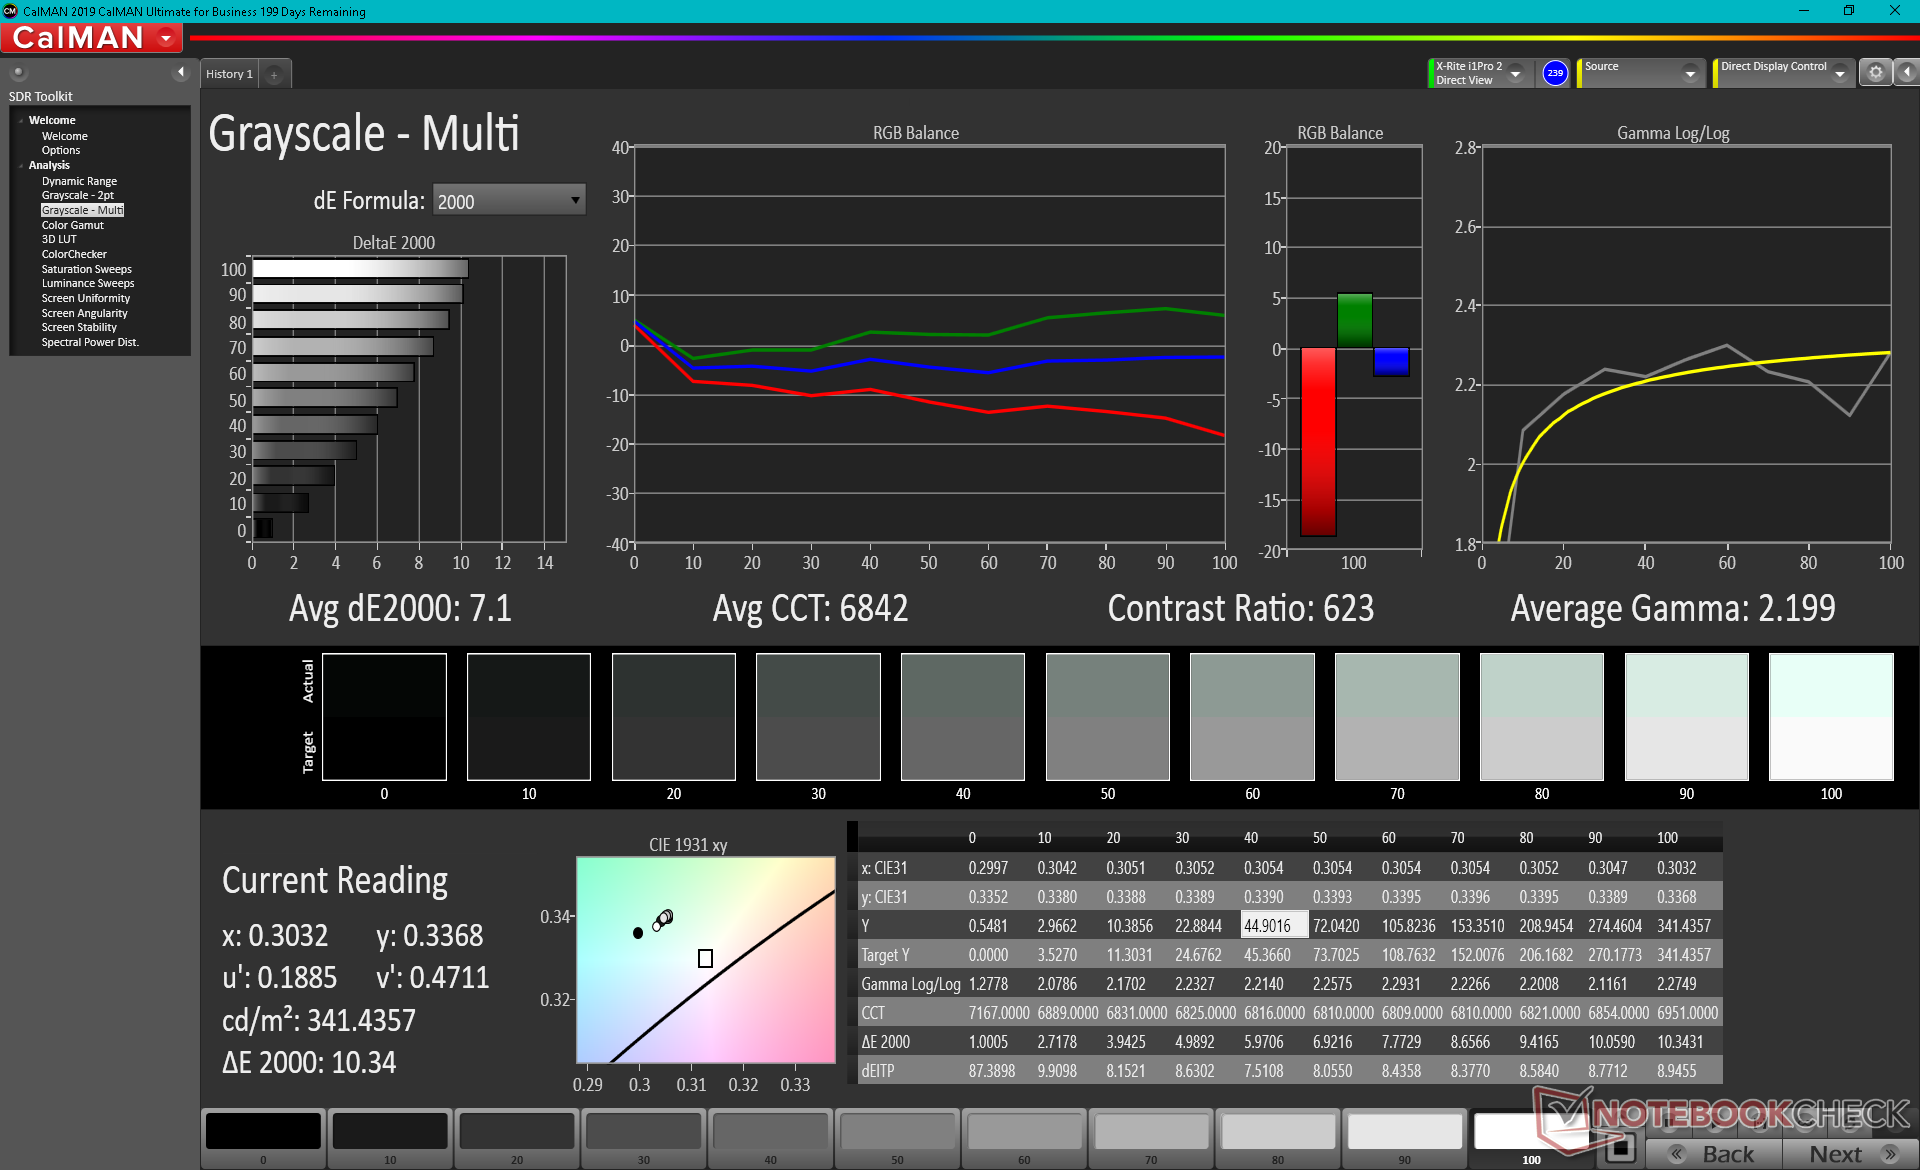
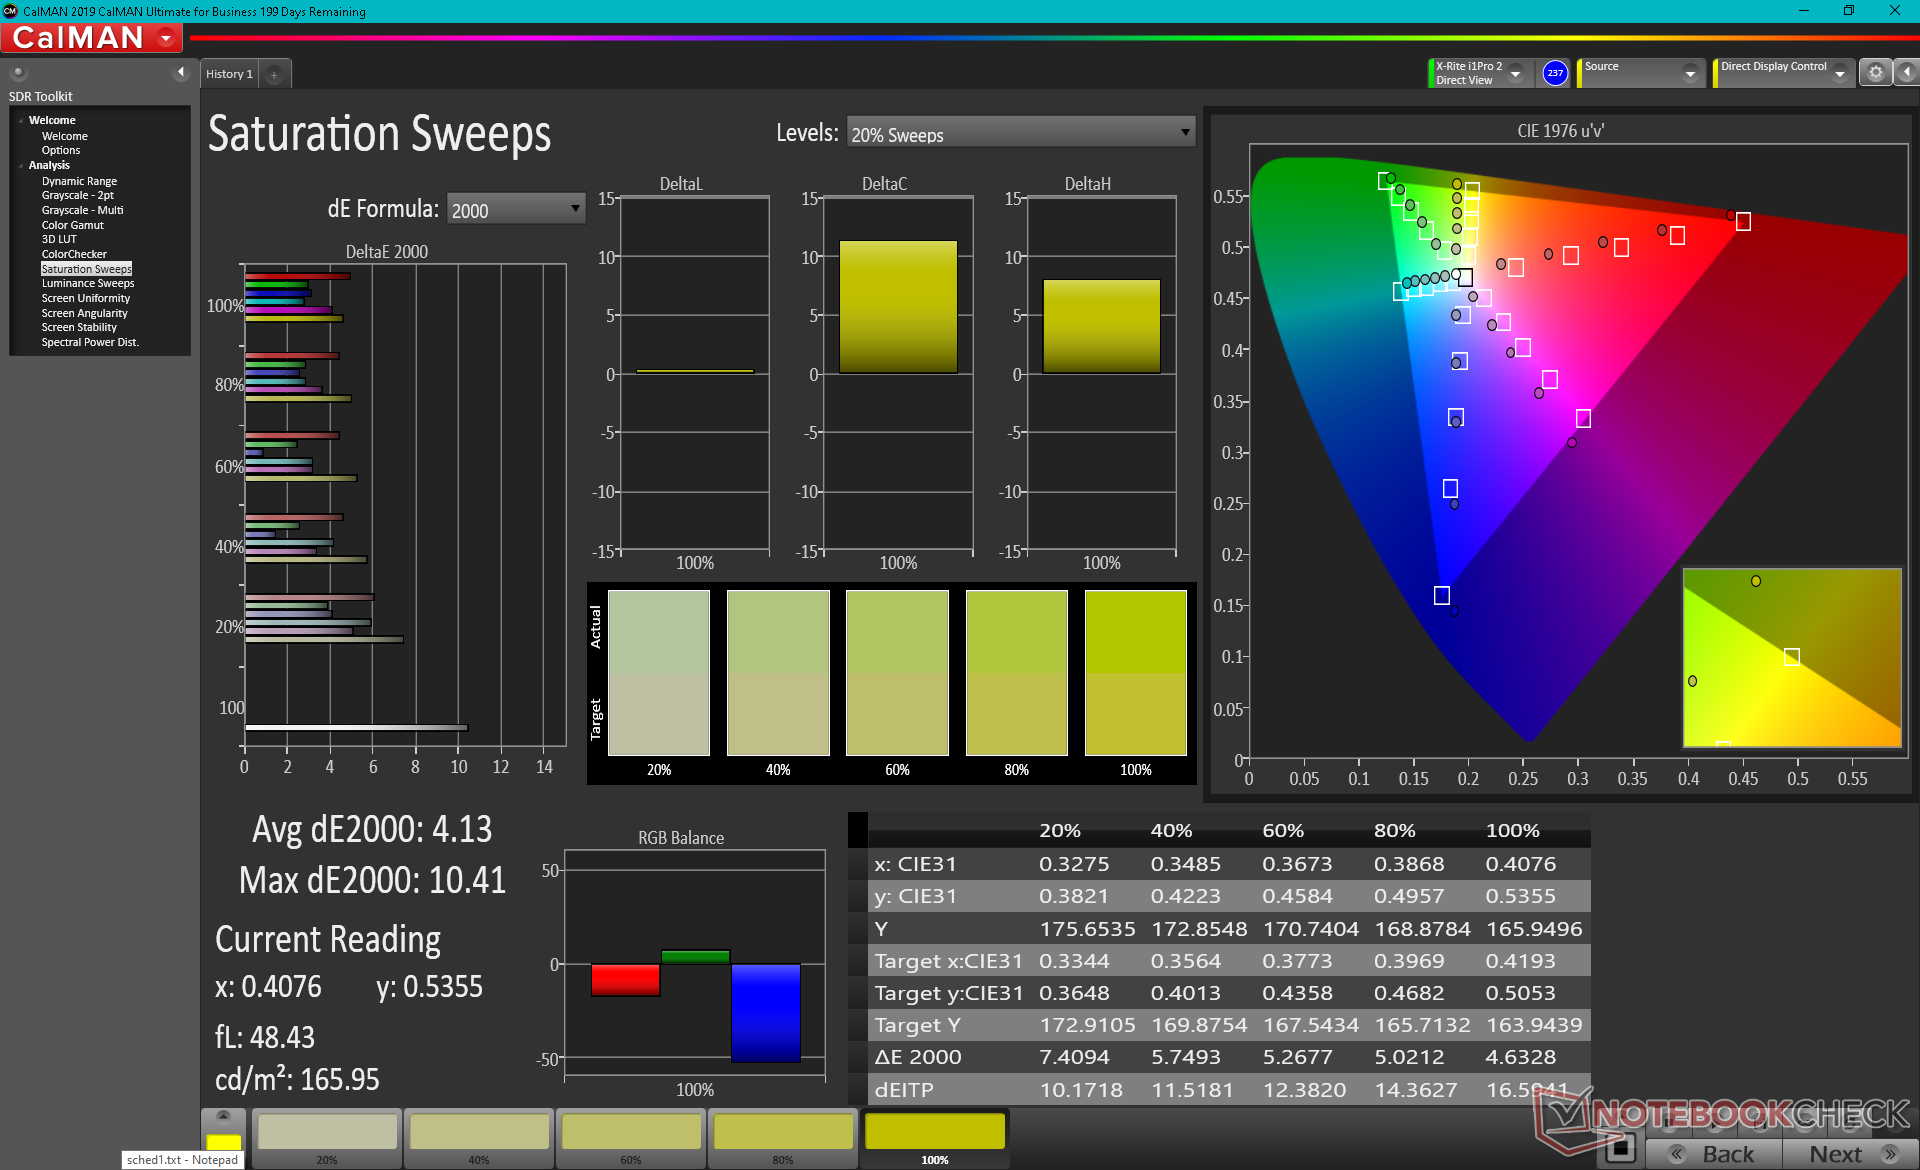
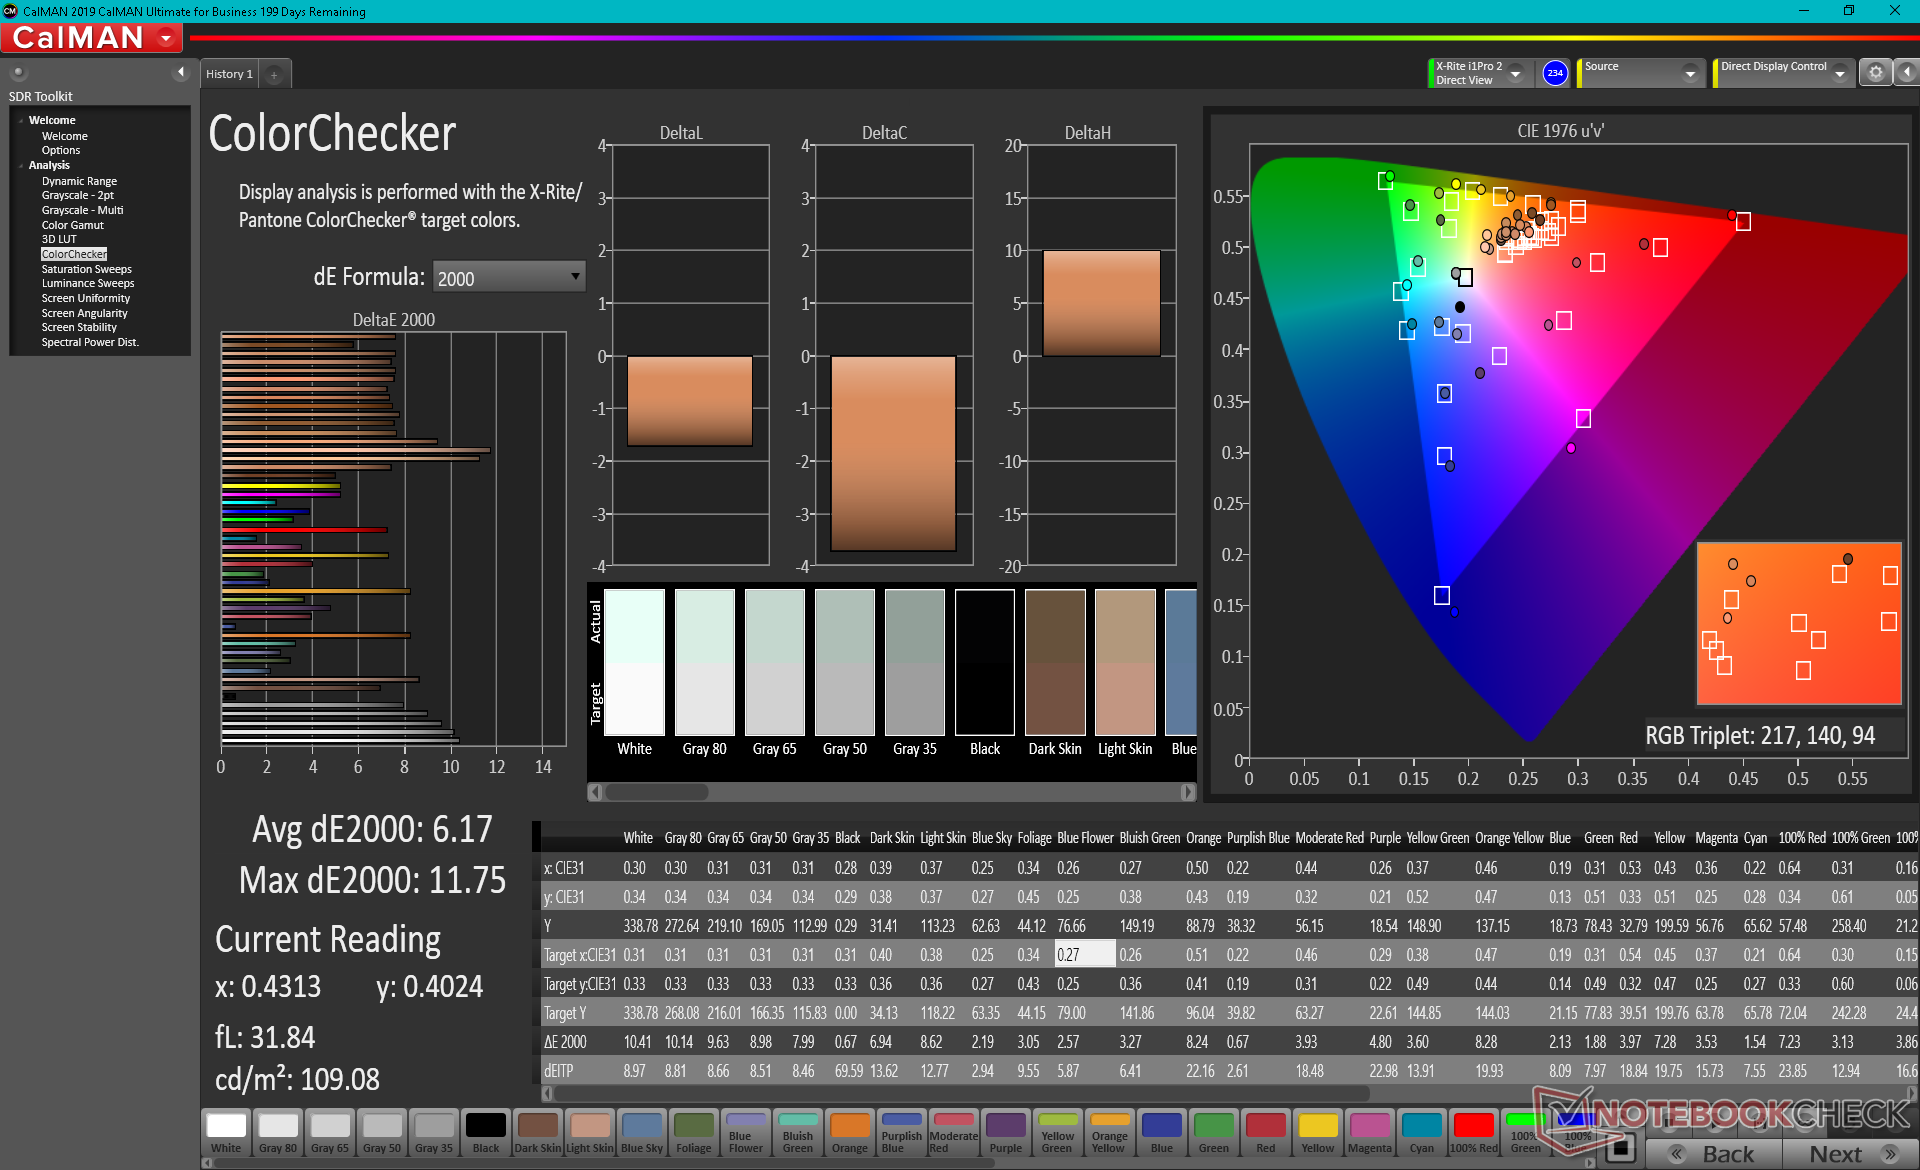
ΔE ColorChecker Calman: 6.17 | ∀{0.5-29.43 Ø4.71}
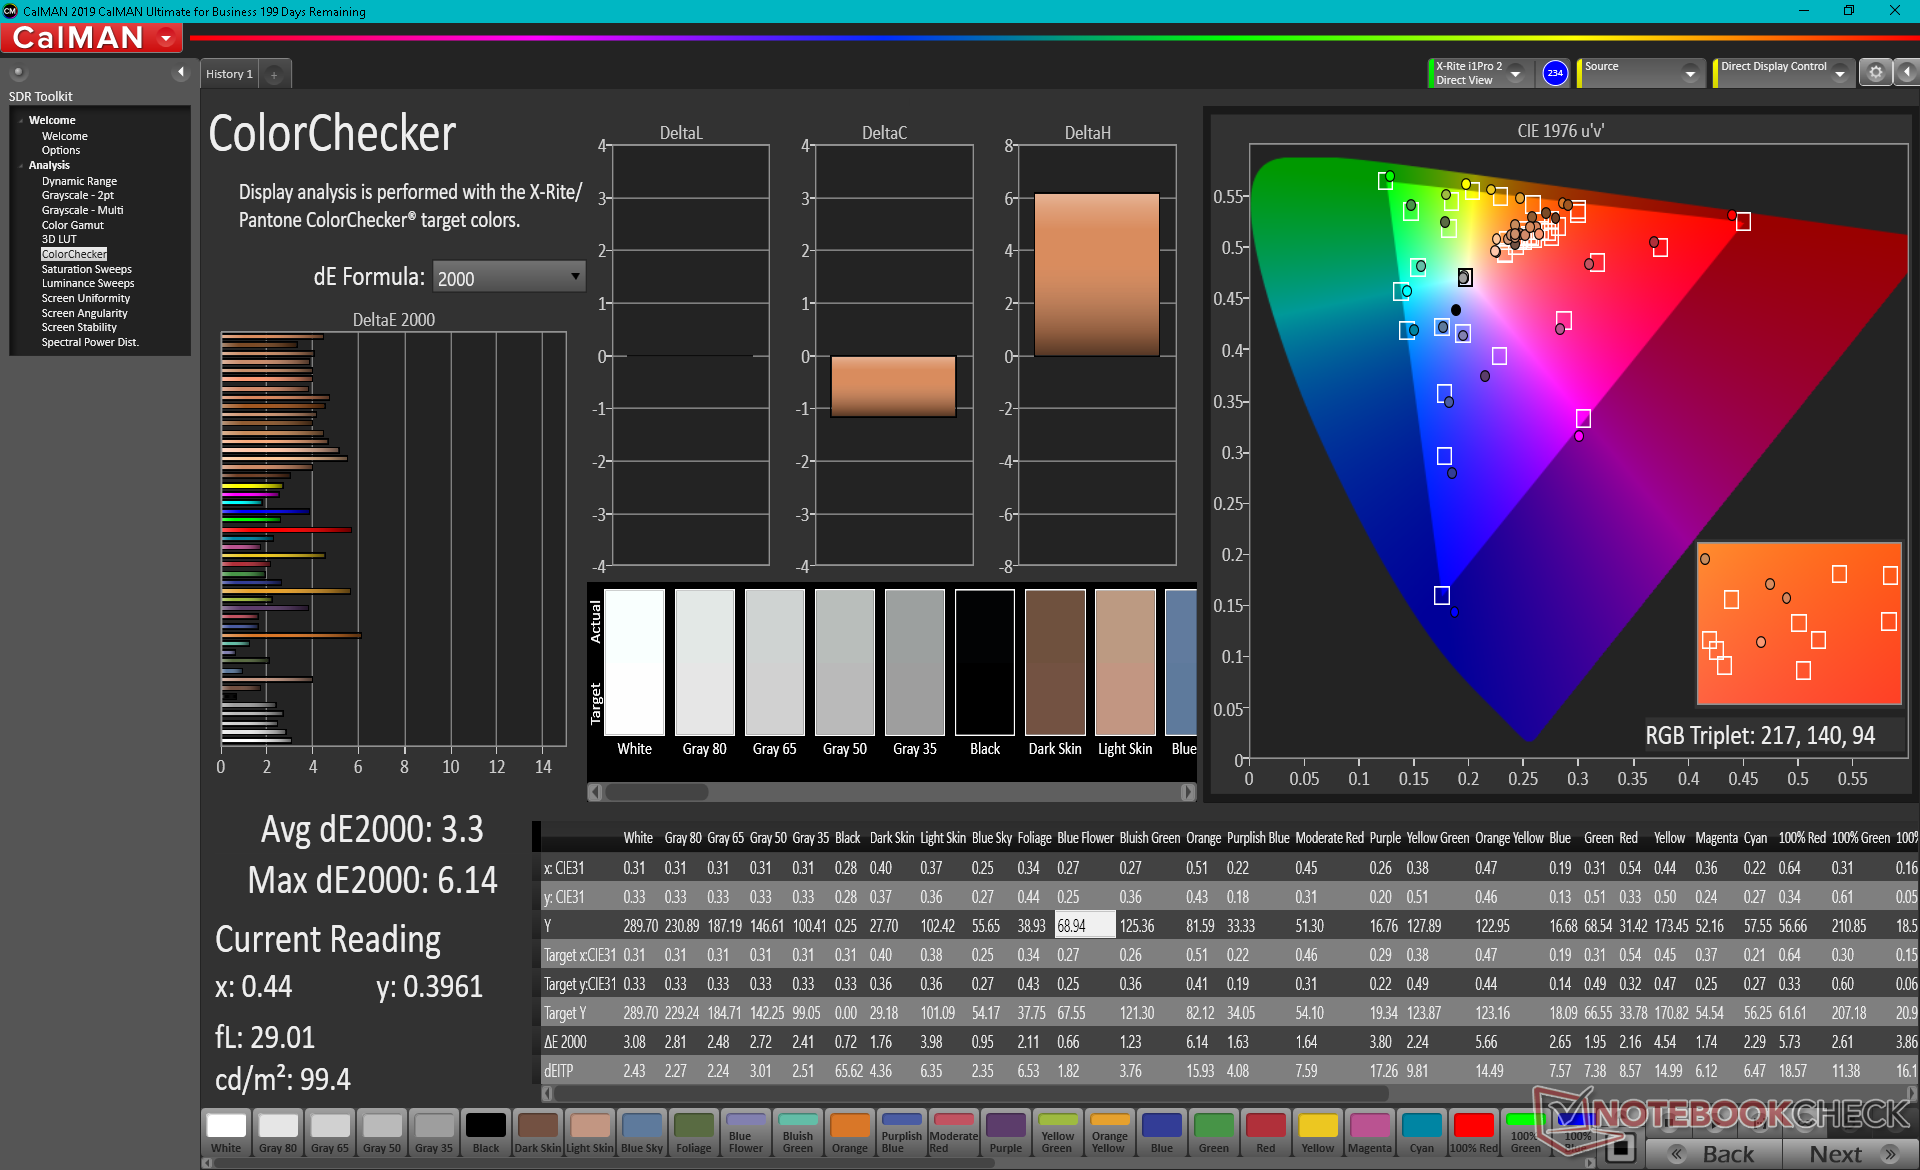
calibrated: 3.3
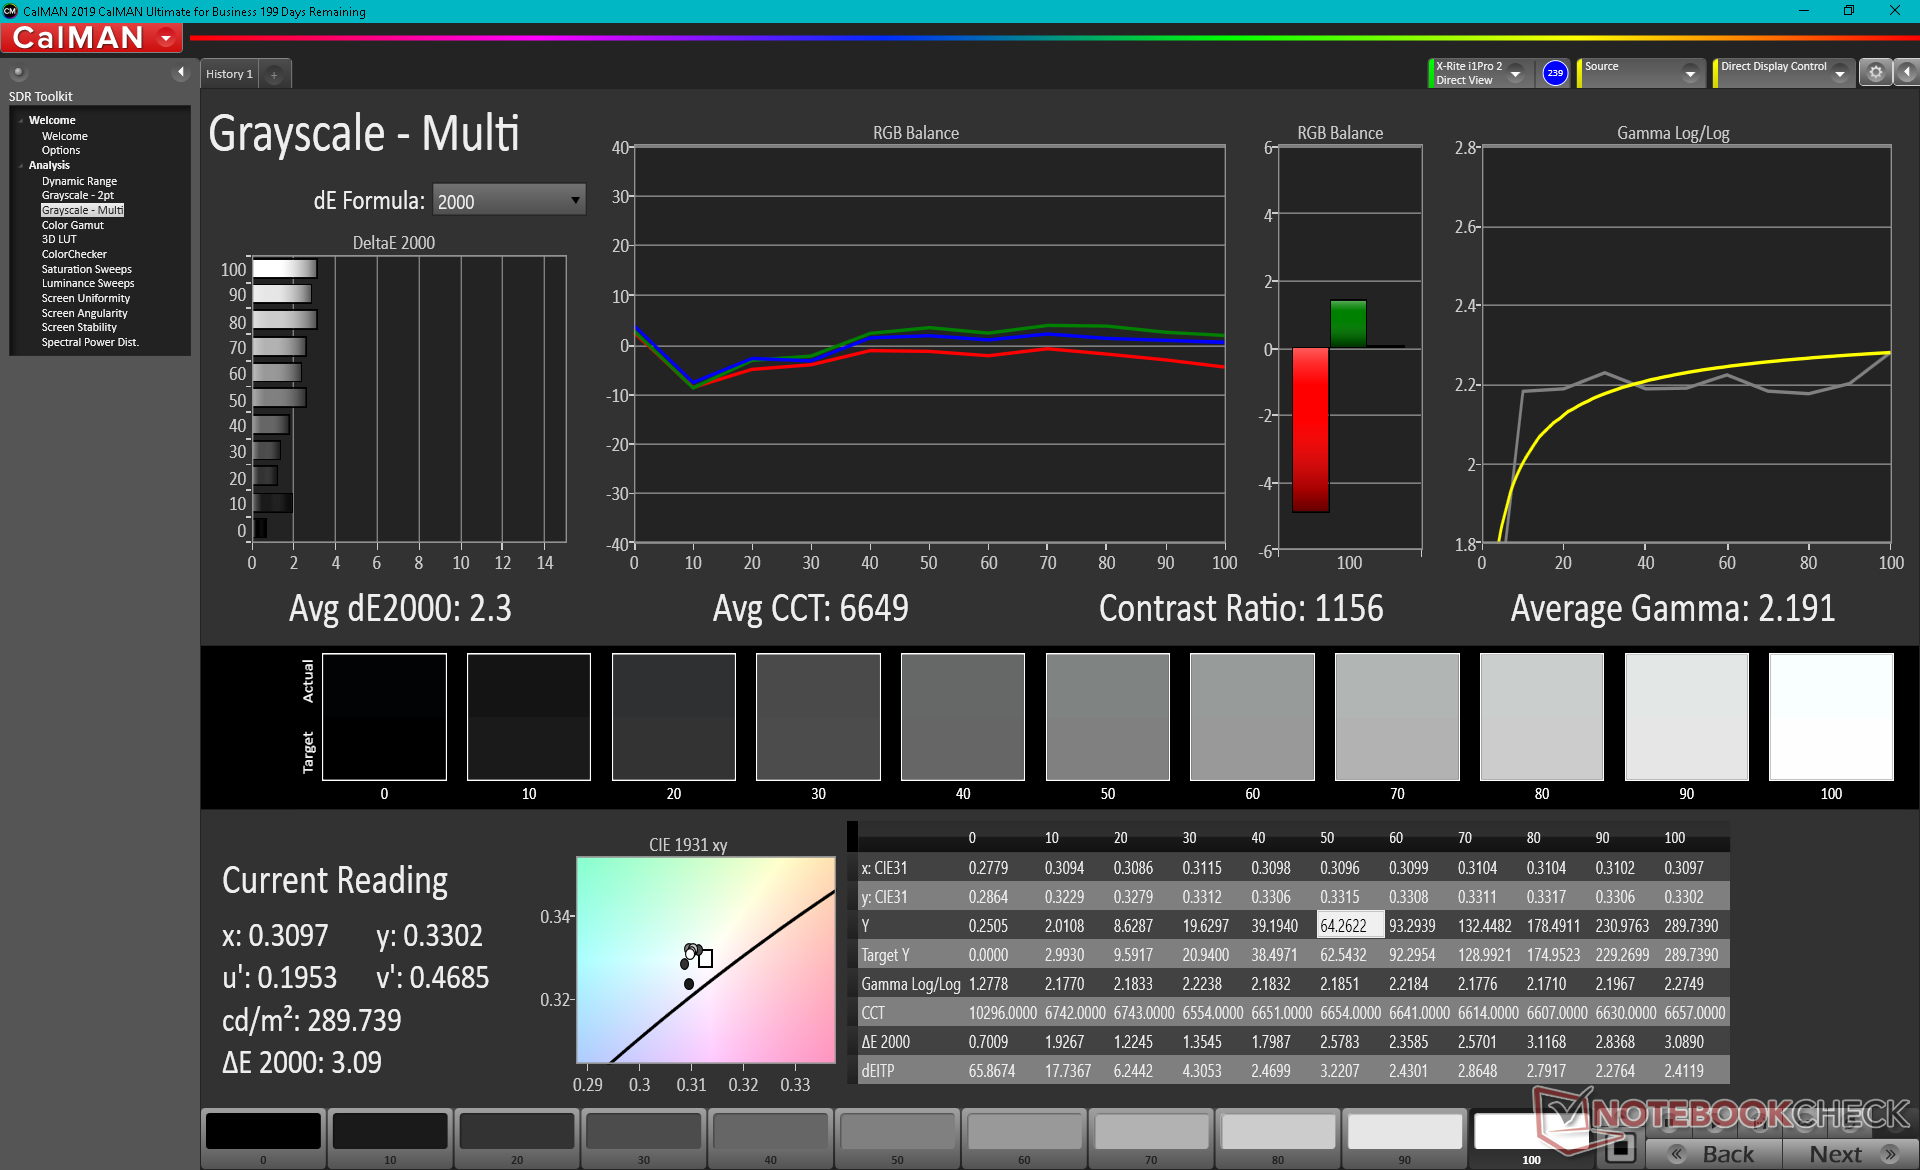
ΔE Greyscale Calman: 7.1 | ∀{0.09-98 Ø4.96}
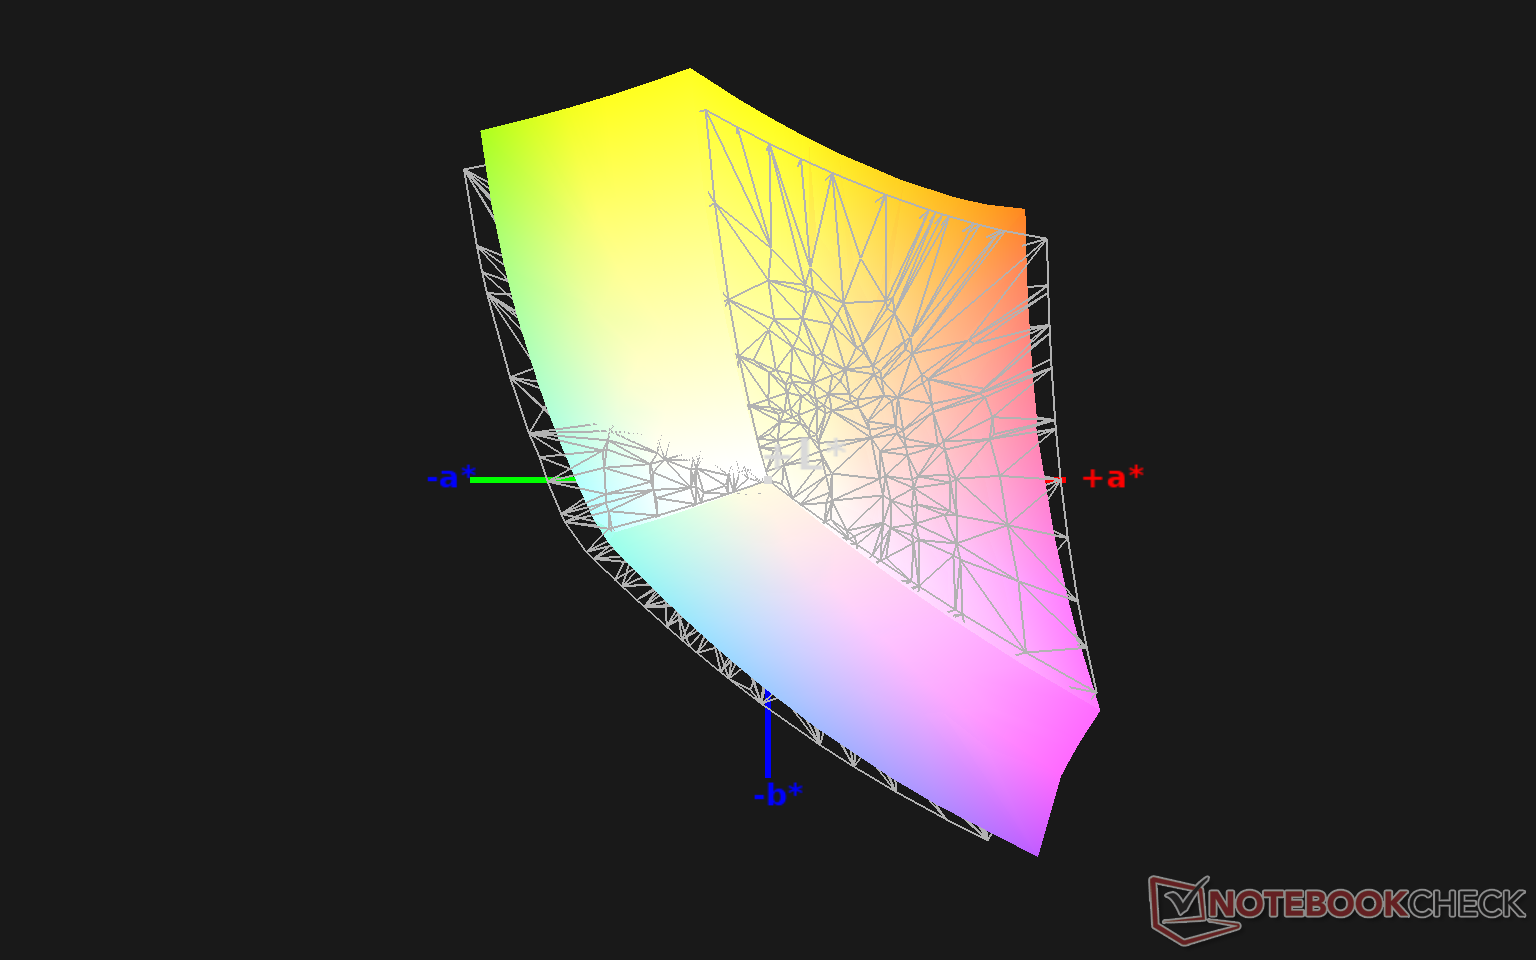
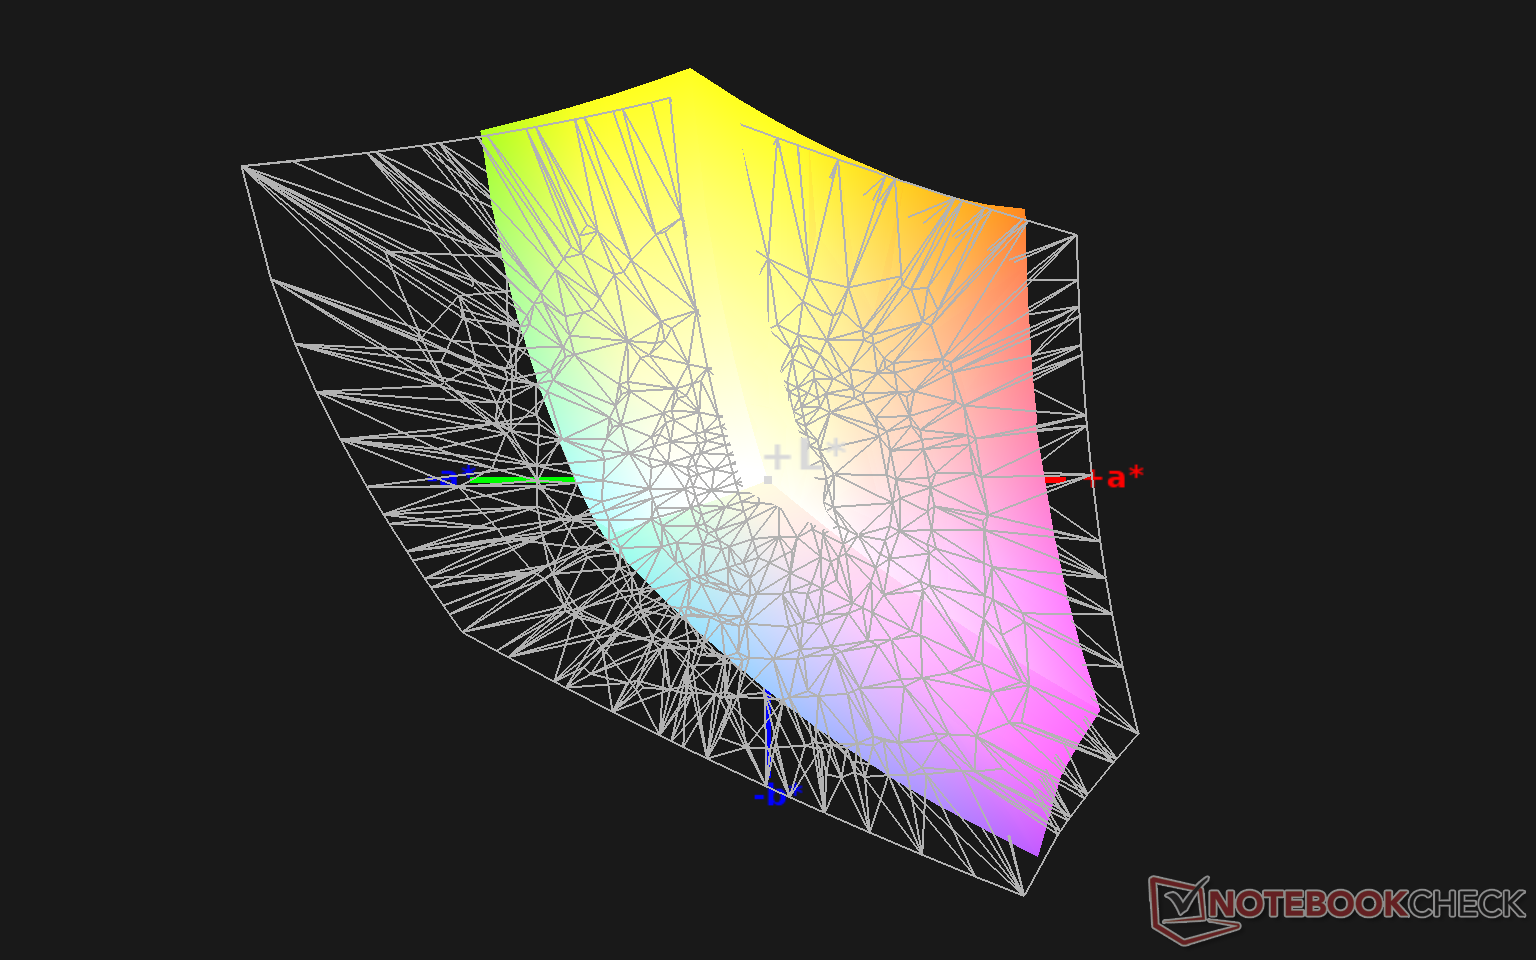
90.1% sRGB (Argyll 1.6.3 3D)
58.7% AdobeRGB 1998 (Argyll 1.6.3 3D)
66% AdobeRGB 1998 (Argyll 3D)
90.6% sRGB (Argyll 3D)
65.7% Display P3 (Argyll 3D)
Gamma: 2.2
CCT: 6842 K
| MSI Summit B15 A11M Chi Mei N156HCE-EN1, IPS, 15.6", 1920x1080 | MSI Summit E15 A11SCST AU Optronics B156HAB03.1, IPS, 15.6", 1920x1080 | Dell XPS 15 9500 Core i5 Sharp LQ156N1, IPS, 15.6", 1920x1200 | HP Spectre X360 15-5ZV31AV AU Optronics AUO30EB, IPS, 15.6", 3840x2160 | ADATA XPG Xenia Xe BOE08F5, IPS, 15.6", 1920x1080 | Asus ZenBook 15 UX534FTC-A8190T BOE CQ NV156FHM-N63, IPS, 15.6", 1920x1080 | |
|---|---|---|---|---|---|---|
| Display | -1% | 18% | 4% | 7% | -4% | |
| Display P3 Coverage (%) | 65.7 | 64.5 -2% | 81.5 24% | 68.3 4% | 70 7% | 65 -1% |
| sRGB Coverage (%) | 90.6 | 89.3 -1% | 100 10% | 94.3 4% | 95.2 5% | 86.2 -5% |
| AdobeRGB 1998 Coverage (%) | 66 | 65.3 -1% | 79.6 21% | 68.4 4% | 71.2 8% | 62.9 -5% |
| Response Times | -1% | 4% | -34% | -31% | -5% | |
| Response Time Grey 50% / Grey 80% * (ms) | 40.4 ? | 43.2 ? -7% | 42 ? -4% | 56.8 ? -41% | 56.8 ? -41% | 45 ? -11% |
| Response Time Black / White * (ms) | 32.4 ? | 30.8 ? 5% | 28.8 ? 11% | 40.8 ? -26% | 38.8 ? -20% | 32 ? 1% |
| PWM Frequency (Hz) | 25510 ? | |||||
| Screen | 20% | 41% | 22% | 39% | 22% | |
| Brightness middle (cd/m²) | 341.3 | 298 -13% | 592 73% | 284.6 -17% | 480.4 41% | 299 -12% |
| Brightness (cd/m²) | 310 | 280 -10% | 565 82% | 285 -8% | 451 45% | 280 -10% |
| Brightness Distribution (%) | 81 | 90 11% | 85 5% | 85 5% | 88 9% | 89 10% |
| Black Level * (cd/m²) | 0.45 | 0.22 51% | 0.46 -2% | 0.25 44% | 0.31 31% | 0.21 53% |
| Contrast (:1) | 758 | 1355 79% | 1287 70% | 1138 50% | 1550 104% | 1424 88% |
| Colorchecker dE 2000 * | 6.17 | 5.41 12% | 3.19 48% | 3.52 43% | 2.53 59% | 4.76 23% |
| Colorchecker dE 2000 max. * | 11.75 | 8.59 27% | 5.45 54% | 5.56 53% | 7.28 38% | 9 23% |
| Colorchecker dE 2000 calibrated * | 3.3 | 2.97 10% | 2.03 38% | 3 9% | 1.69 49% | |
| Greyscale dE 2000 * | 7.1 | 4.1 42% | 3.9 45% | 3.2 55% | 3.8 46% | 3.53 50% |
| Gamma | 2.2 100% | 2.334 94% | 2.25 98% | 2.28 96% | 2.15 102% | 2.3 96% |
| CCT | 6842 95% | 7025 93% | 6522 100% | 7070 92% | 6760 96% | 7228 90% |
| Color Space (Percent of AdobeRGB 1998) (%) | 58.7 | 65 11% | 71.6 22% | 61.1 4% | 63 7% | 56 -5% |
| Color Space (Percent of sRGB) (%) | 90.1 | 90 0% | 100 11% | 93.8 4% | 94.9 5% | 86 -5% |
| Media total (Programa/Opciones) | 6% /
13% | 21% /
32% | -3% /
12% | 5% /
25% | 4% /
13% |
* ... más pequeño es mejor
El espacio de color cubre aproximadamente el 90 por ciento de sRGB para ser lo suficientemente bueno para el editor de gráficos casual al que va dirigido. Tendrás que gastar más en modelos alternativos 4K u OLED de Dell, HP u otros si tu objetivo es la cobertura AdobeRGB.
Las mediciones del colorímetro X-Rite revelan una temperatura de color demasiado fría al sacarlo de la caja para una pobre reproducción de la escala de grises y del color a pesar de la relativamente alta cobertura del 90 por ciento de sRGB. Los datos tienen sentido porque MSI no precalibra la serie Summit B15 en fábrica. Los colores y la escala de grises mejoran significativamente después de la calibración, con valores promedio de DeltaE mucho más bajos. Recomendamos aplicar nuestro perfil ICM calibrado para obtener una visualización más precisa del color.
Tiempos de respuesta del display
| ↔ Tiempo de respuesta de Negro a Blanco | ||
|---|---|---|
| 32.4 ms ... subida ↗ y bajada ↘ combinada | ↗ 18.4 ms subida | 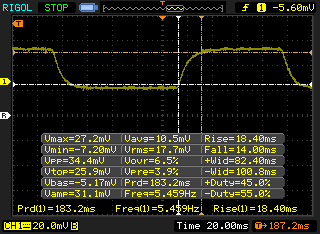 |
| ↘ 14 ms bajada | ||
| La pantalla mostró tiempos de respuesta lentos en nuestros tests y podría ser demasiado lenta para los jugones. En comparación, todos los dispositivos de prueba van de ##min### (mínimo) a 240 (máximo) ms. » 88 % de todos los dispositivos son mejores. Eso quiere decir que el tiempo de respuesta es peor que la media (19.8 ms) de todos los dispositivos testados. | ||
| ↔ Tiempo de respuesta 50% Gris a 80% Gris | ||
| 40.4 ms ... subida ↗ y bajada ↘ combinada | ↗ 20.4 ms subida |  |
| ↘ 20 ms bajada | ||
| La pantalla mostró tiempos de respuesta lentos en nuestros tests y podría ser demasiado lenta para los jugones. En comparación, todos los dispositivos de prueba van de ##min### (mínimo) a 636 (máximo) ms. » 64 % de todos los dispositivos son mejores. Eso quiere decir que el tiempo de respuesta es peor que la media (31 ms) de todos los dispositivos testados. | ||
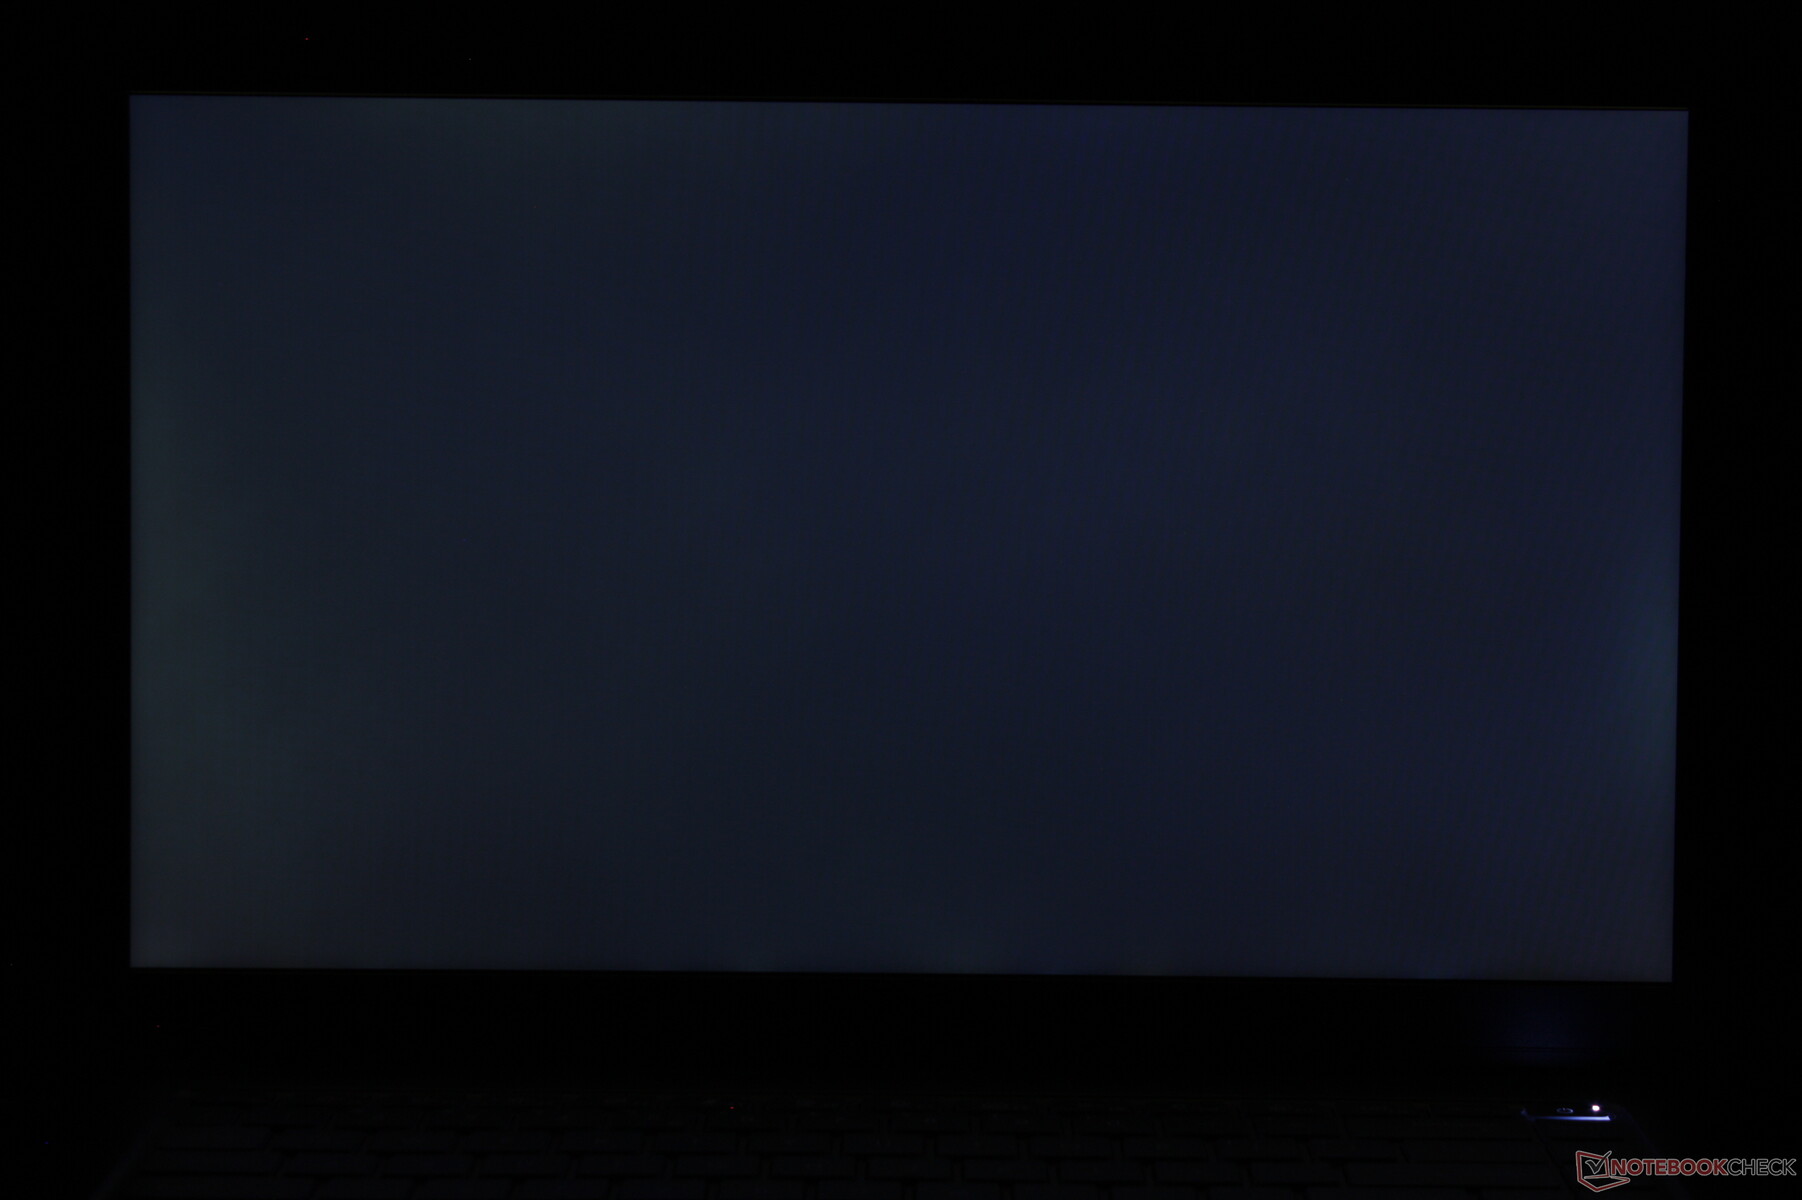
Parpadeo de Pantalla / PWM (Pulse-Width Modulation)
| Parpadeo de Pantalla / PWM detectado | 25510 Hz | ≤ 25 % de brillo | 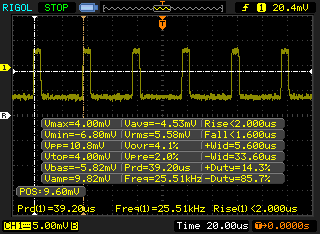 |
La retroiluminación del display parpadea a 25510 Hz (seguramente usa PWM - Pulse-Width Modulation) a un brillo del 25 % e inferior. Sobre este nivel de brillo no debería darse parpadeo / PWM. La frecuencia de 25510 Hz es bastante alta, por lo que la mayoría de gente sensible al parpadeo no debería ver parpadeo o tener fatiga visual. Comparación: 52 % de todos los dispositivos testados no usaron PWM para atenuar el display. Si se usó, medimos una media de 7754 (mínimo: 5 - máxmo: 343500) Hz. | |||
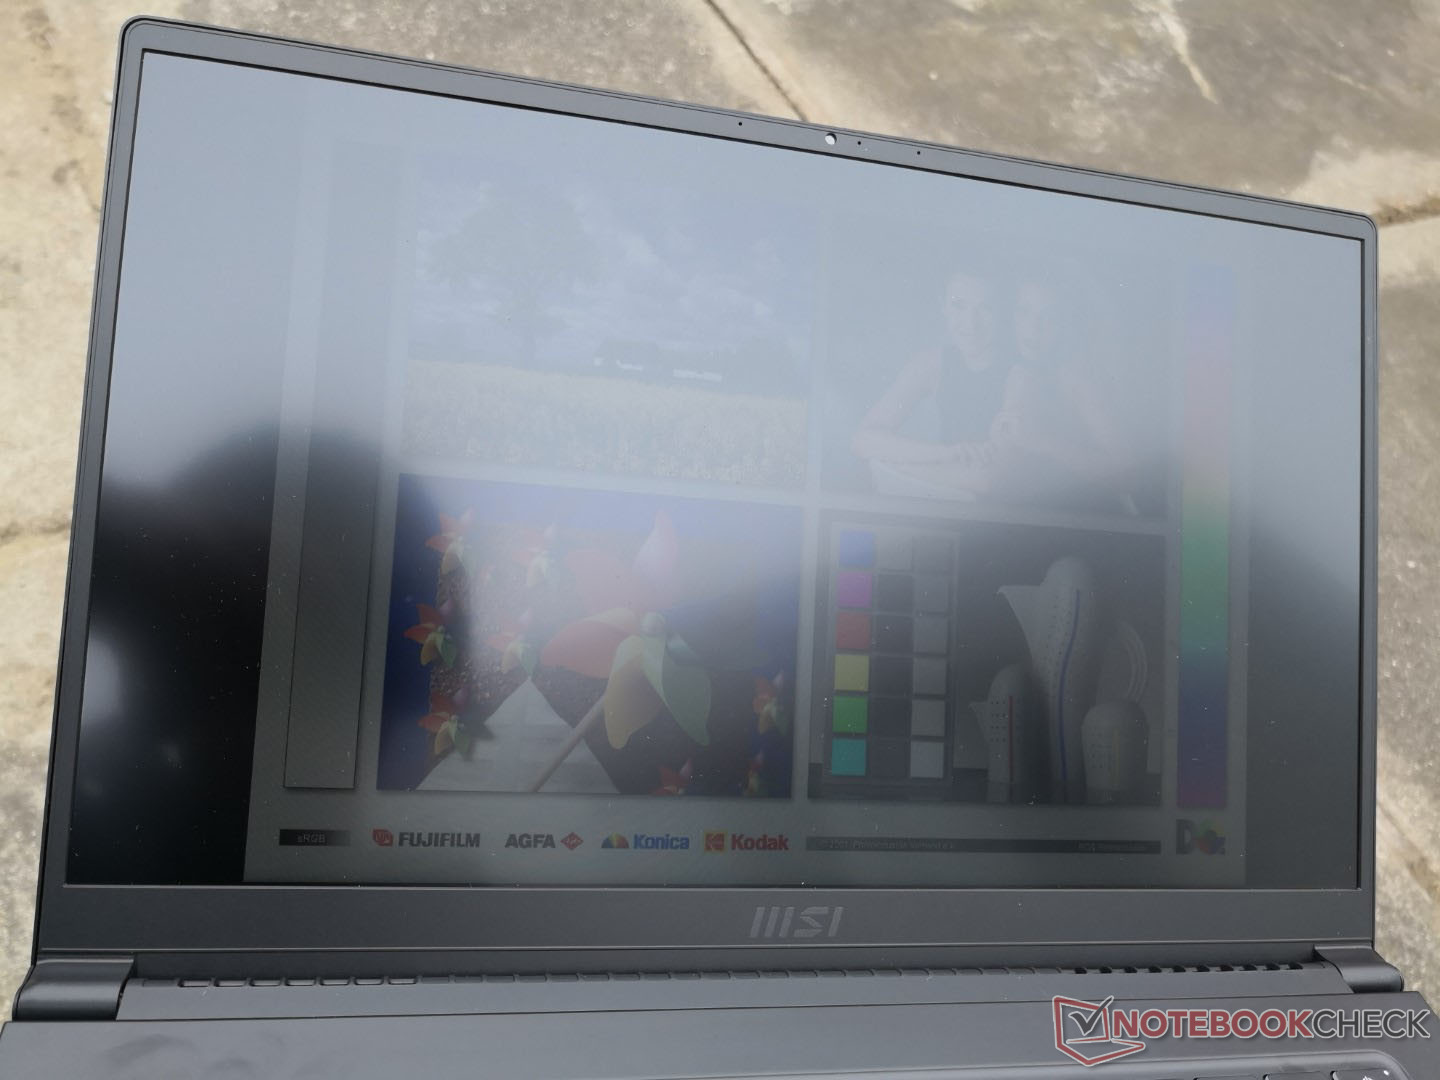
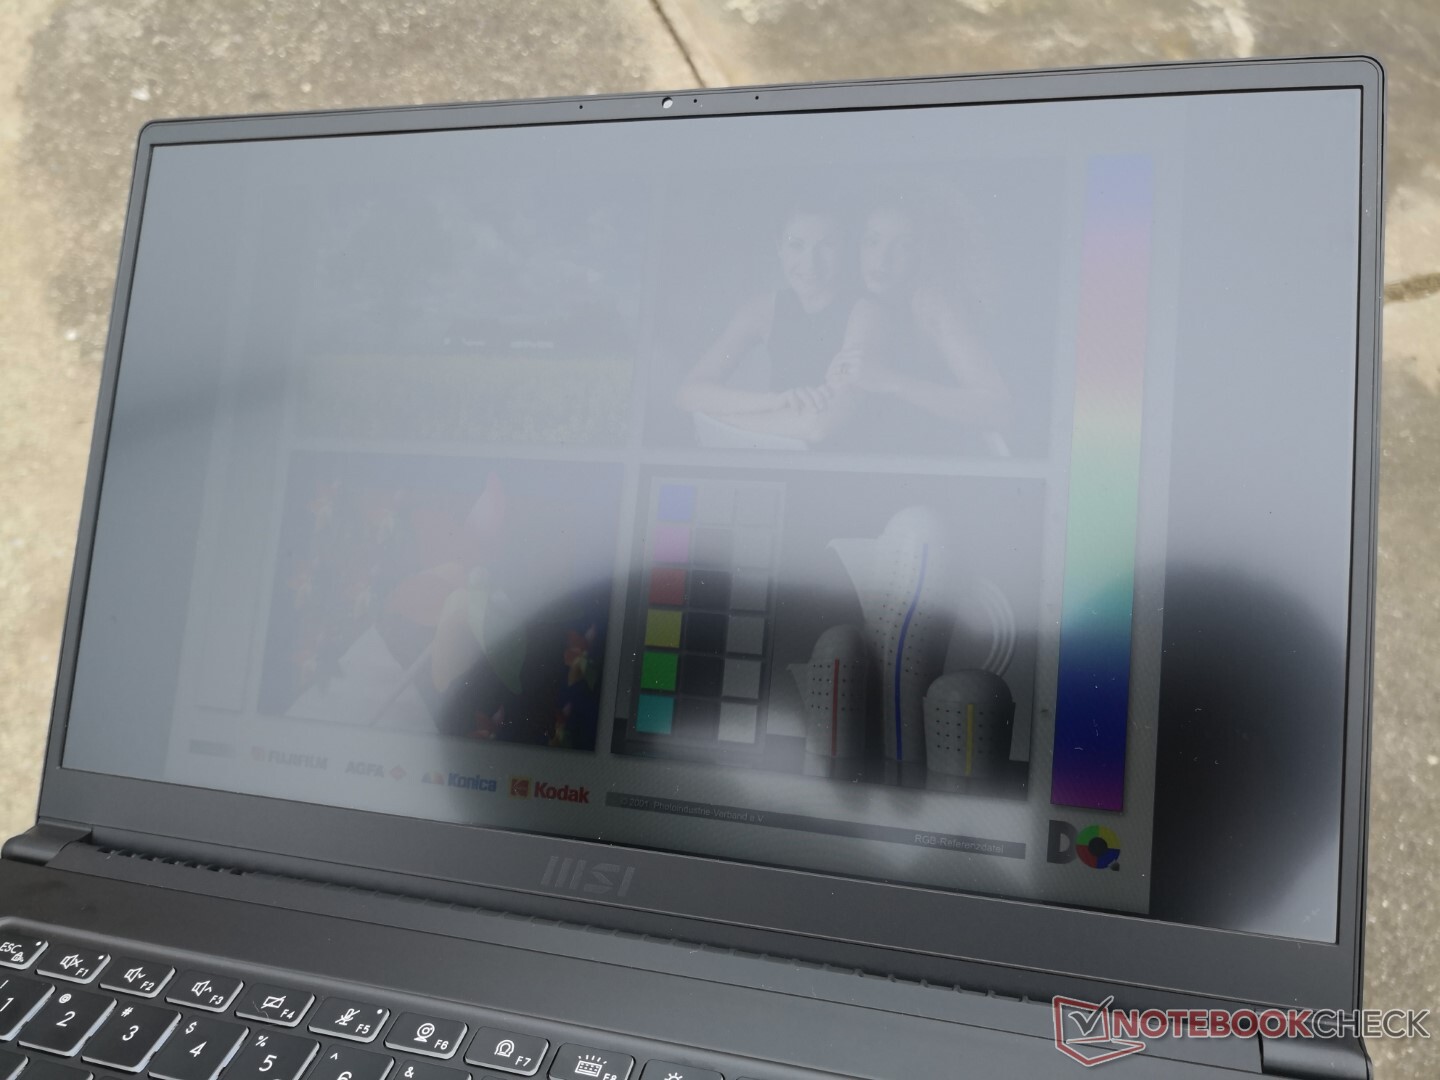
La visibilidad en exteriores no es tan buena como la del Dell XPS 15 o MacBook Pro 15 ambos con pantallas notablemente más brillantes. El resplandor no es tan fuerte en el MSI debido a su panel mate, pero la pantalla sigue siendo difícil de ver cómodamente en la mayoría de escenarios.
Rendimiento
Sólo hay dos SKUs disponibles en el momento de escribir este artículo con el ULV Core i5-1135G7 o el Core i7-1165G7. Para opciones Core H más rápidas, MSI ofrece la serie Creator Z16 en su lugar.
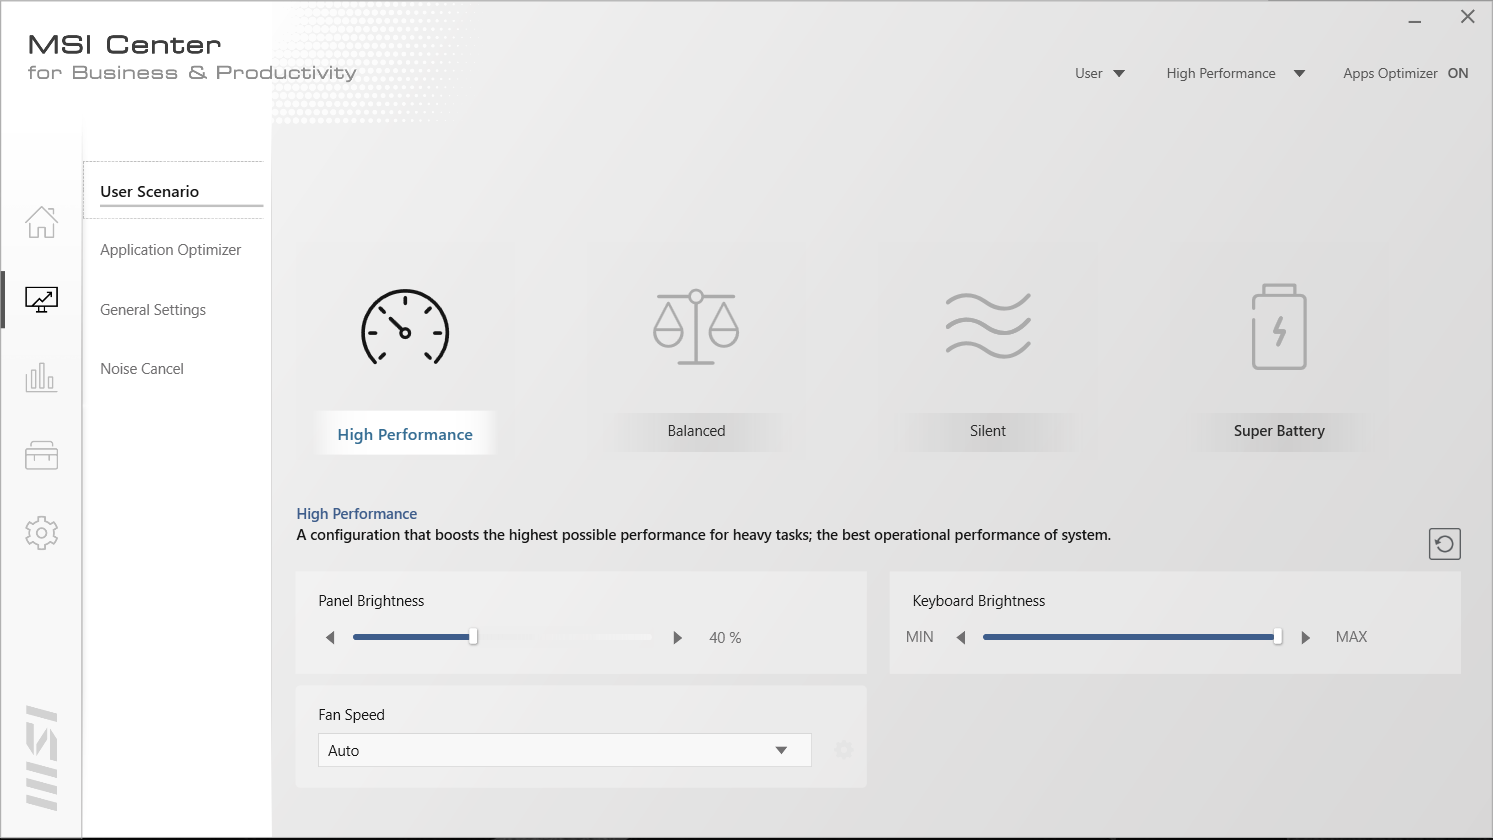
Nuestra unidad se puso en modo de alto rendimiento a través de MSI Center antes de ejecutar cualquier prueba de rendimiento para obtener las mejores puntuaciones posibles. Recomendamos a los propietarios que se familiaricen con este software ya que las actualizaciones y características específicas de MSI se encuentran aquí.
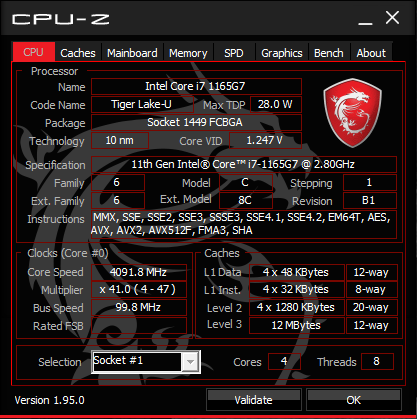
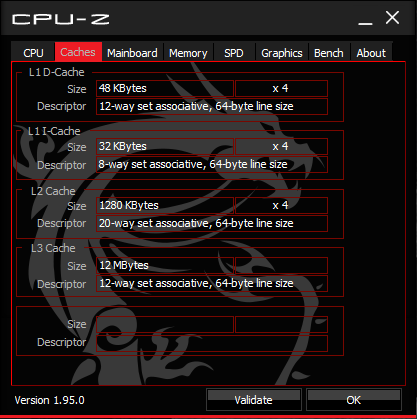
Procesador
El rendimiento de la CPU es excelente con puntuaciones en CineBench R15 xT que son un 12 por ciento más rápidas que la media de portátiles de nuestra base de datos equipados con la misma CPU. Las puntuaciones de CineBench R20 y R23 son incluso mejores, con un 23 por ciento por encima de la media, lo que implica una sostenibilidad de Turbo Boost superior a la de la mayoría de portátiles, ya que los benchmarks R20 y R23 son significativamente más largos que el R15. El procesador es capaz de superar sistemáticamente tanto al 10º gen Core i7-10510U y Core i5-10300H en el HP Spectre x360 15 y Dell XPS 15, respectivamente.
Si se opta por el más barato Core i5-1135G7 en lugar del Core i7-1165G7 resultará en una ligera disminución del 7 al 10 por ciento en el rendimiento del procesador, según nuestra experiencia con otros portátiles Core i5-1135G7.
Cinebench R23: Multi Core | Single Core
Cinebench R15: CPU Multi 64Bit | CPU Single 64Bit
Blender: v2.79 BMW27 CPU
7-Zip 18.03: 7z b 4 -mmt1 | 7z b 4
Geekbench 5.5: Single-Core | Multi-Core
HWBOT x265 Benchmark v2.2: 4k Preset
LibreOffice : 20 Documents To PDF
R Benchmark 2.5: Overall mean
| Cinebench R23 / Multi Core | |
| Lenovo IdeaPad Flex 5 14ALC05 82HU002YUS | |
| Lenovo Yoga Slim 7-14ARE | |
| MSI Summit B15 A11M | |
| MSI Summit E15 A11SCST | |
| Medio Intel Core i7-1165G7 (2525 - 6862, n=64) | |
| Cinebench R23 / Single Core | |
| MSI Summit B15 A11M | |
| MSI Summit E15 A11SCST | |
| Medio Intel Core i7-1165G7 (1110 - 1539, n=59) | |
| Lenovo IdeaPad Flex 5 14ALC05 82HU002YUS | |
| Lenovo Yoga Slim 7-14ARE | |
| HWBOT x265 Benchmark v2.2 / 4k Preset | |
| Lenovo Yoga Slim 7-14ARE | |
| Lenovo IdeaPad Flex 5 14ALC05 82HU002YUS | |
| Dell XPS 15 9500 Core i7 4K UHD | |
| Lenovo ThinkPad E15 Gen2-20T9S00K00 | |
| MSI Summit B15 A11M | |
| Dell XPS 15 9500 Core i5 | |
| Lenovo ThinkBook 15 Gen2 ITL | |
| MSI Summit E15 A11SCST | |
| Lenovo IdeaPad 5 15IIL05 | |
| Medio Intel Core i7-1165G7 (1.39 - 8.47, n=80) | |
Cinebench R23: Multi Core | Single Core
Cinebench R15: CPU Multi 64Bit | CPU Single 64Bit
Blender: v2.79 BMW27 CPU
7-Zip 18.03: 7z b 4 -mmt1 | 7z b 4
Geekbench 5.5: Single-Core | Multi-Core
HWBOT x265 Benchmark v2.2: 4k Preset
LibreOffice : 20 Documents To PDF
R Benchmark 2.5: Overall mean
* ... más pequeño es mejor
Rendimiento del sistema
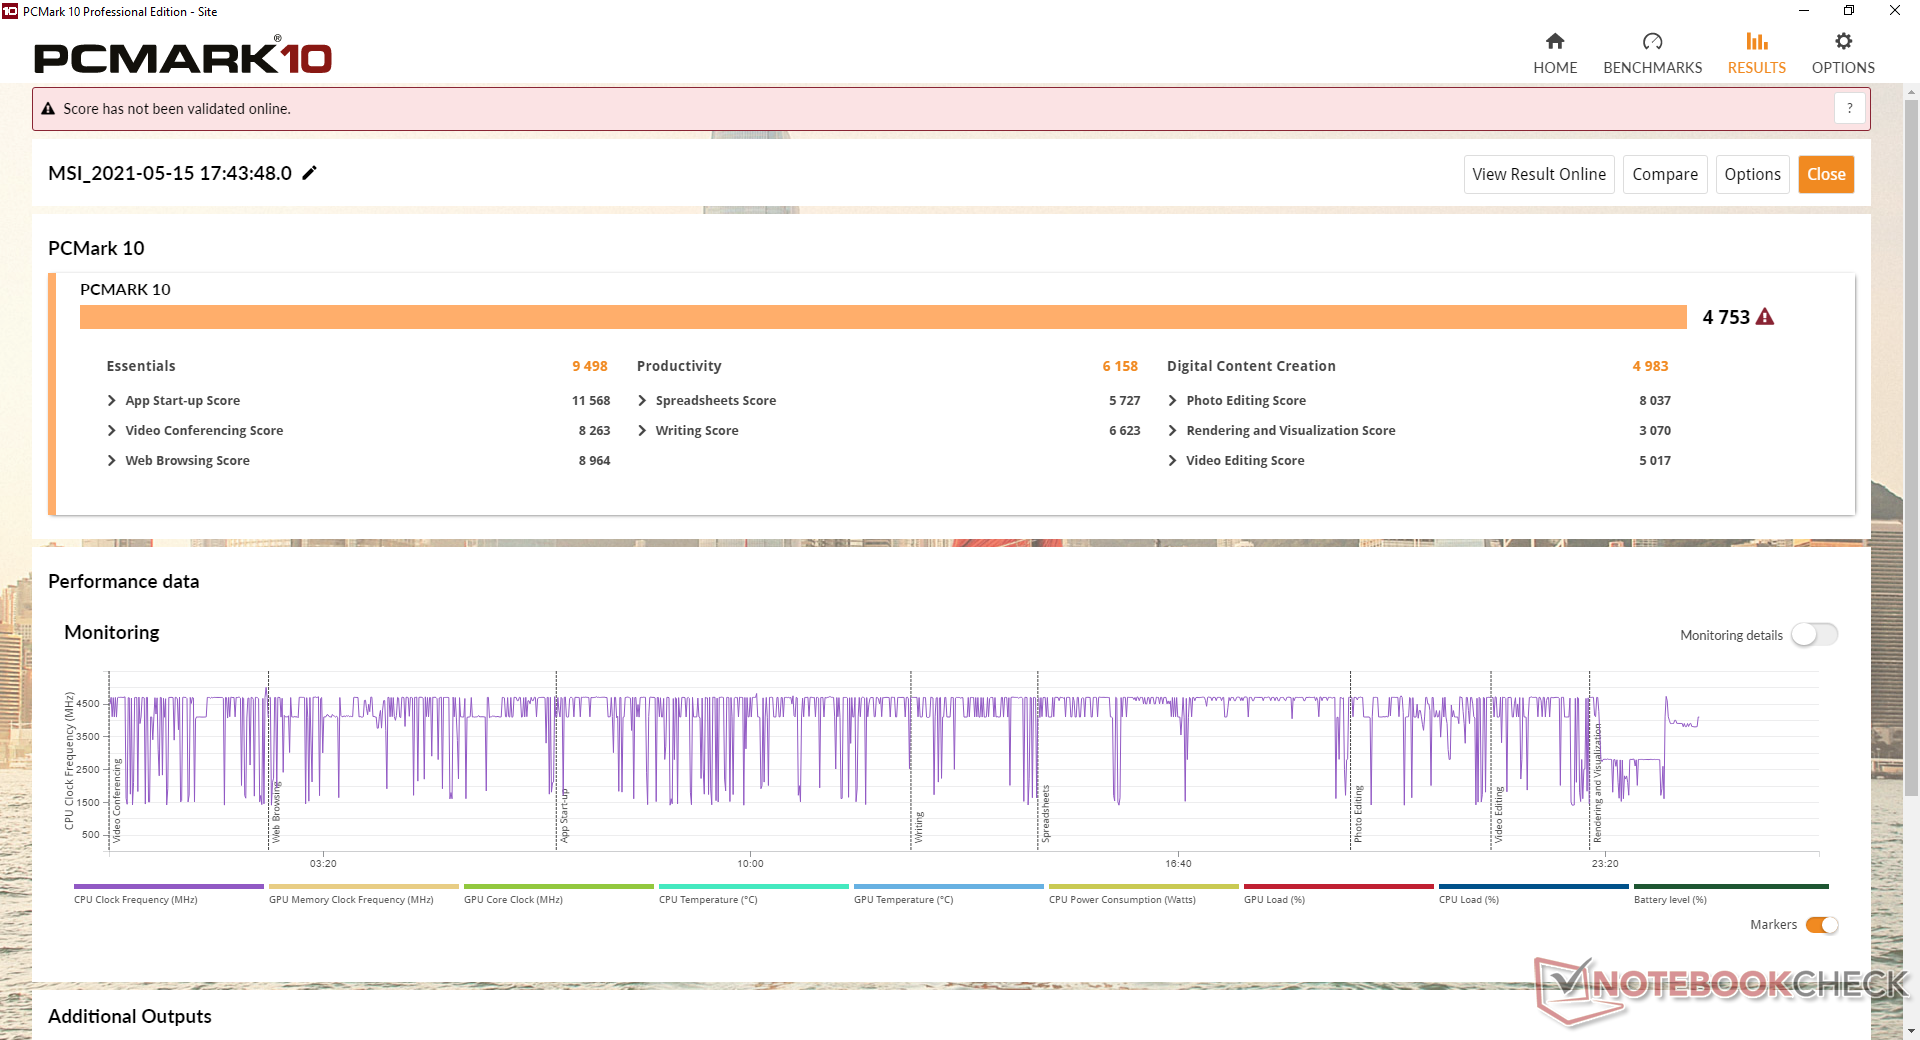
| PCMark 10 Score | 4753 puntos | |
ayuda | ||
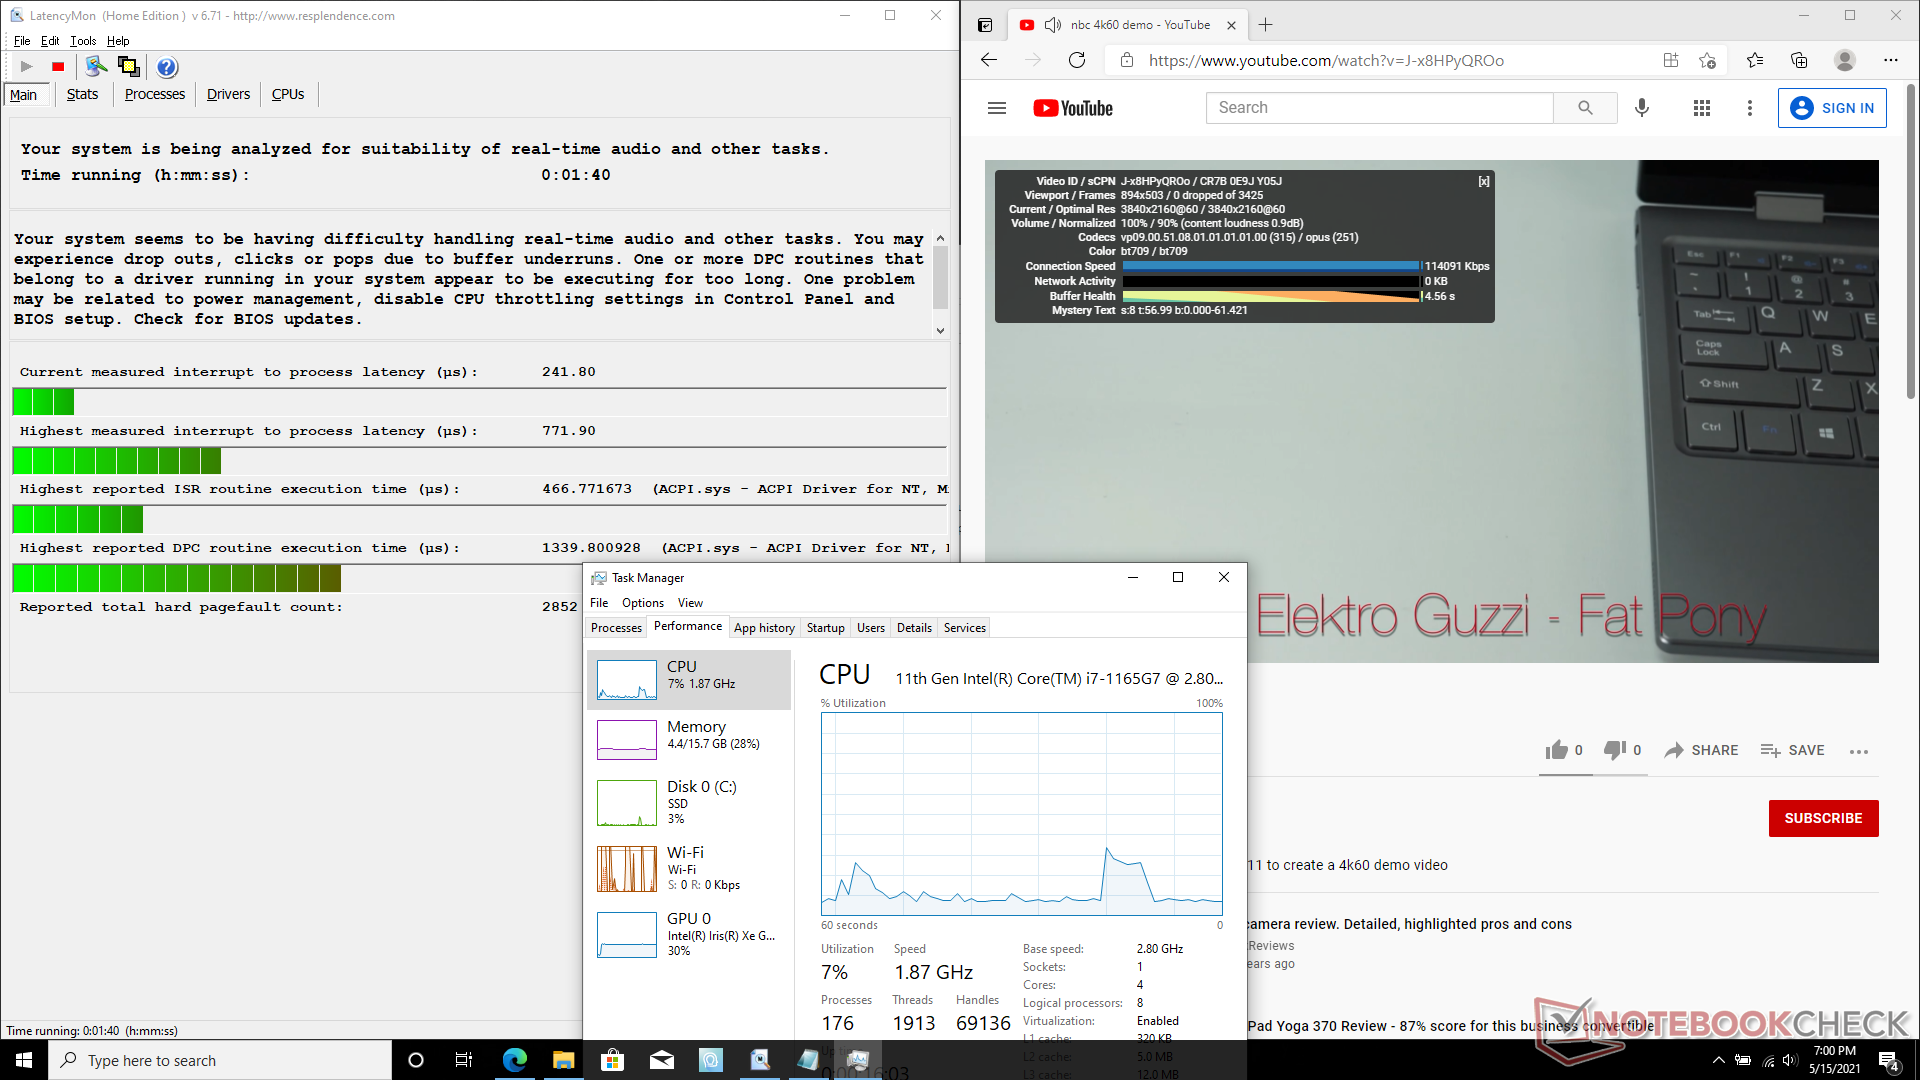
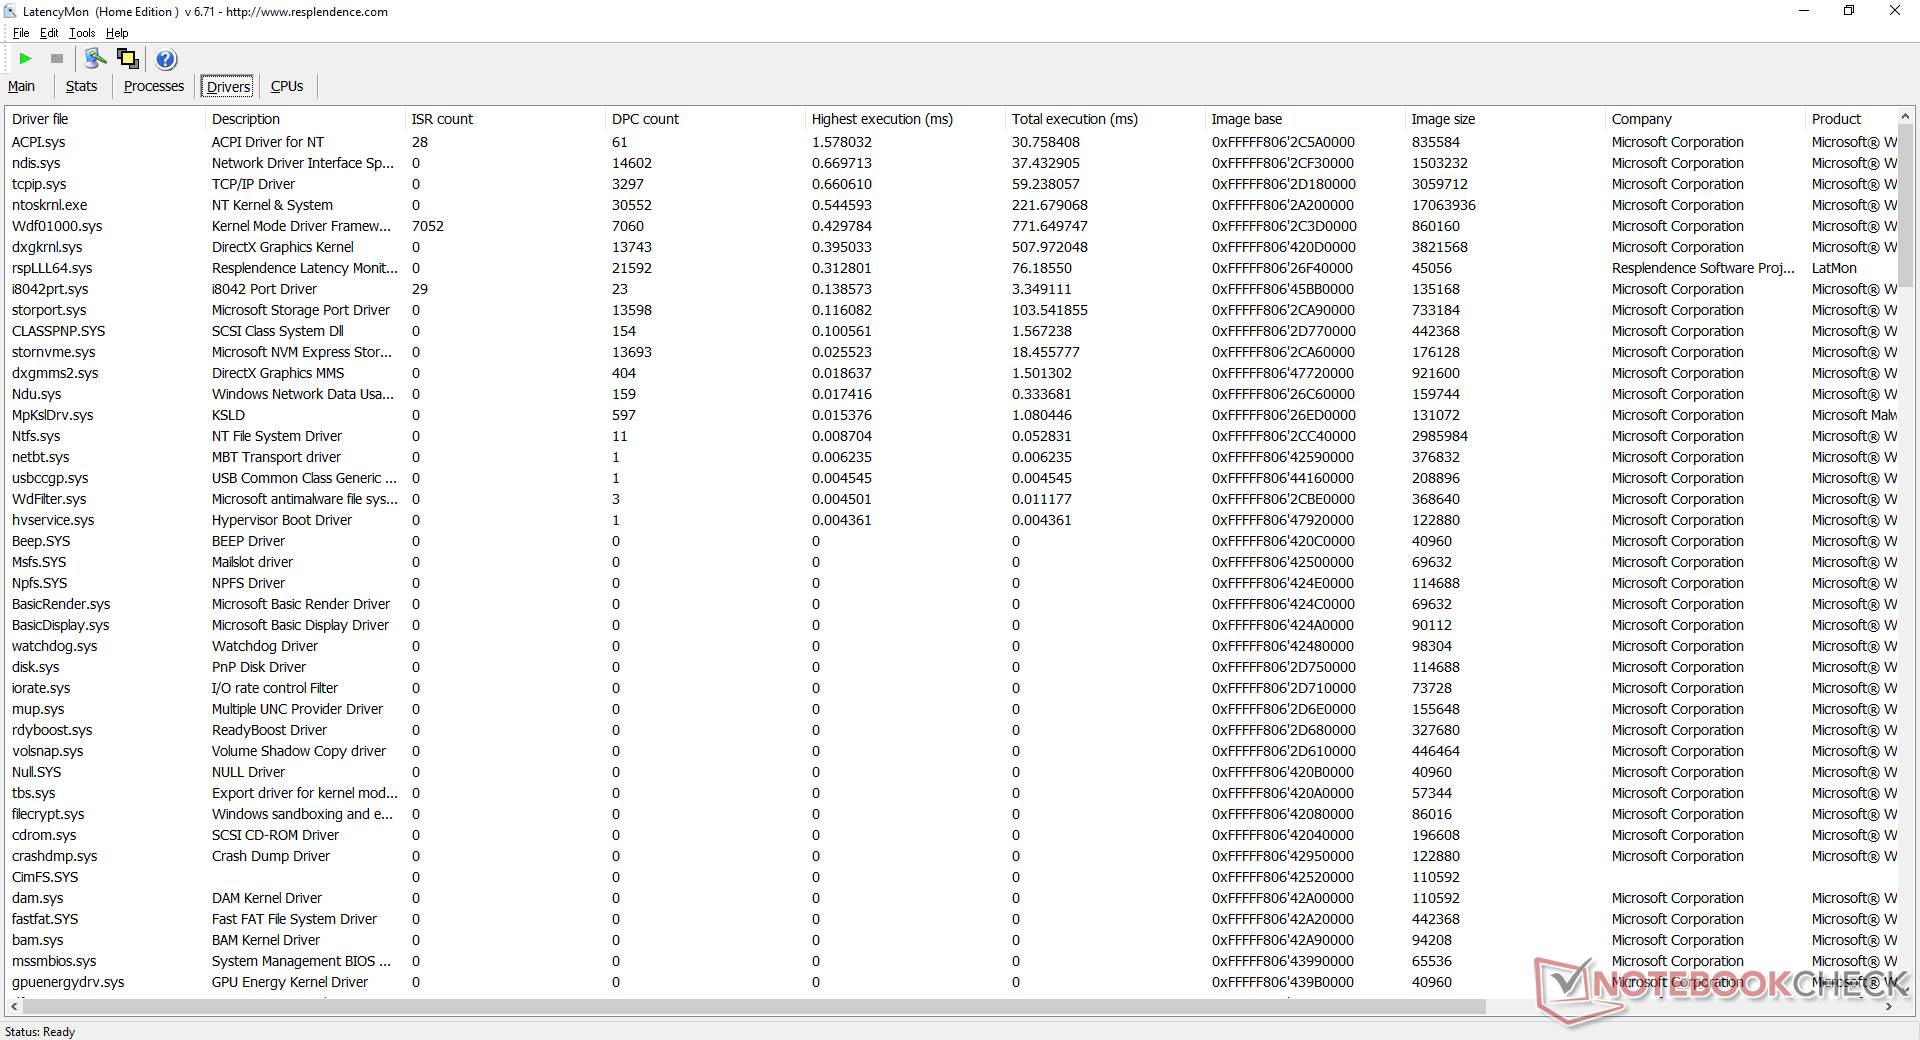
Latencia del CPD
LatencyMon muestra problemas menores de latencia del CPD al abrir varias pestañas del navegador en nuestra página de inicio. La reproducción de vídeo 4K a 60 FPS es, por lo demás, fluida y sin pérdida de fotogramas.
| DPC Latencies / LatencyMon - interrupt to process latency (max), Web, Youtube, Prime95 | |
| ADATA XPG Xenia Xe | |
| Dell XPS 15 9500 Core i5 | |
| MSI Summit E15 A11SCST | |
| MSI Summit B15 A11M | |
* ... más pequeño es mejor
Dispositivos de almacenamiento
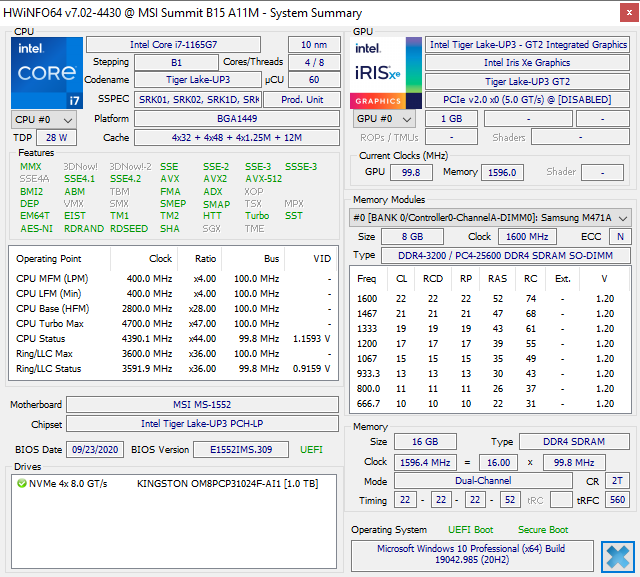
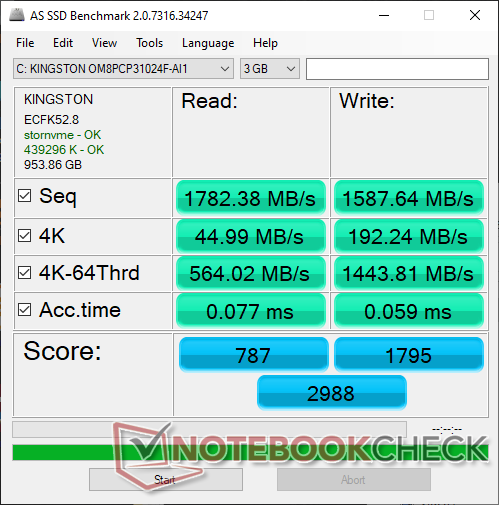
Se admiten hasta dos SSD M.2 2280 internos, siendo una de esas ranuras compatible con las velocidades PCIe 4.0. Nuestra unidad de prueba viene con el Kingston OM8PCP31024F de 1 TB, que es un SSD PCIe 3.0 NVMe bastante económico con tasas de transferencia medias que alcanzan los 2100 MB/s. Por supuesto, los usuarios pueden configurar SSDs más rápidos antes de comprar o instalar uno ellos mismos.
| MSI Summit B15 A11M Kingston OM8PCP31024F | MSI Summit E15 A11SCST Phison 1TB SM2801T24GKBB4S-E162 | HP Spectre X360 15-5ZV31AV Intel SSD 660p 2TB SSDPEKNW020T8 | ADATA XPG Xenia Xe ADATA XPG Gammix S50 1TB | |
|---|---|---|---|---|
| AS SSD | 42% | -12% | 25% | |
| Seq Read (MB/s) | 1782 | 3597 102% | 1220 -32% | 3842 116% |
| Seq Write (MB/s) | 1588 | 2101 32% | 1152 -27% | 1601 1% |
| 4K Read (MB/s) | 44.99 | 62.5 39% | 52.3 16% | 51.2 14% |
| 4K Write (MB/s) | 192.2 | 208.9 9% | 146.6 -24% | 260.8 36% |
| 4K-64 Read (MB/s) | 564 | 1145 103% | 652 16% | 1222 117% |
| 4K-64 Write (MB/s) | 1444 | 1482 3% | 847 -41% | 1508 4% |
| Access Time Read * (ms) | 0.077 | 0.05 35% | 0.077 -0% | 0.065 16% |
| Access Time Write * (ms) | 0.059 | 0.019 68% | 0.106 -80% | 0.249 -322% |
| Score Read (Points) | 787 | 1567 99% | 826 5% | 1657 111% |
| Score Write (Points) | 1795 | 1901 6% | 1109 -38% | 1929 7% |
| Score Total (Points) | 2988 | 4207 41% | 2371 -21% | 4329 45% |
| Copy ISO MB/s (MB/s) | 1541 | 2209 43% | 2070 34% | 2166 41% |
| Copy Program MB/s (MB/s) | 641 | 455.2 -29% | 571 -11% | 995 55% |
| Copy Game MB/s (MB/s) | 908 | 1225 35% | 1219 34% | 1844 103% |
| CrystalDiskMark 5.2 / 6 | 42% | -6% | 47% | |
| Write 4K (MB/s) | 235.9 | 242.9 3% | 151.5 -36% | 159.6 -32% |
| Read 4K (MB/s) | 47.06 | 54.6 16% | 59.3 26% | 45.45 -3% |
| Write Seq (MB/s) | 1684 | 2420 44% | 1424 -15% | 2498 48% |
| Read Seq (MB/s) | 1333 | 2300 73% | 1609 21% | 2340 76% |
| Write 4K Q32T1 (MB/s) | 606 | 392.7 -35% | 393.6 -35% | 645 6% |
| Read 4K Q32T1 (MB/s) | 422.8 | 667 58% | 369.4 -13% | 439.4 4% |
| Write Seq Q32T1 (MB/s) | 1688 | 2424 44% | 1946 15% | 4057 140% |
| Read Seq Q32T1 (MB/s) | 2116 | 4944 134% | 1934 -9% | 4960 134% |
| Media total (Programa/Opciones) | 42% /
42% | -9% /
-10% | 36% /
33% |
* ... más pequeño es mejor

Disk Throttling: DiskSpd Read Loop, Queue Depth 8
Rendimiento de la GPU
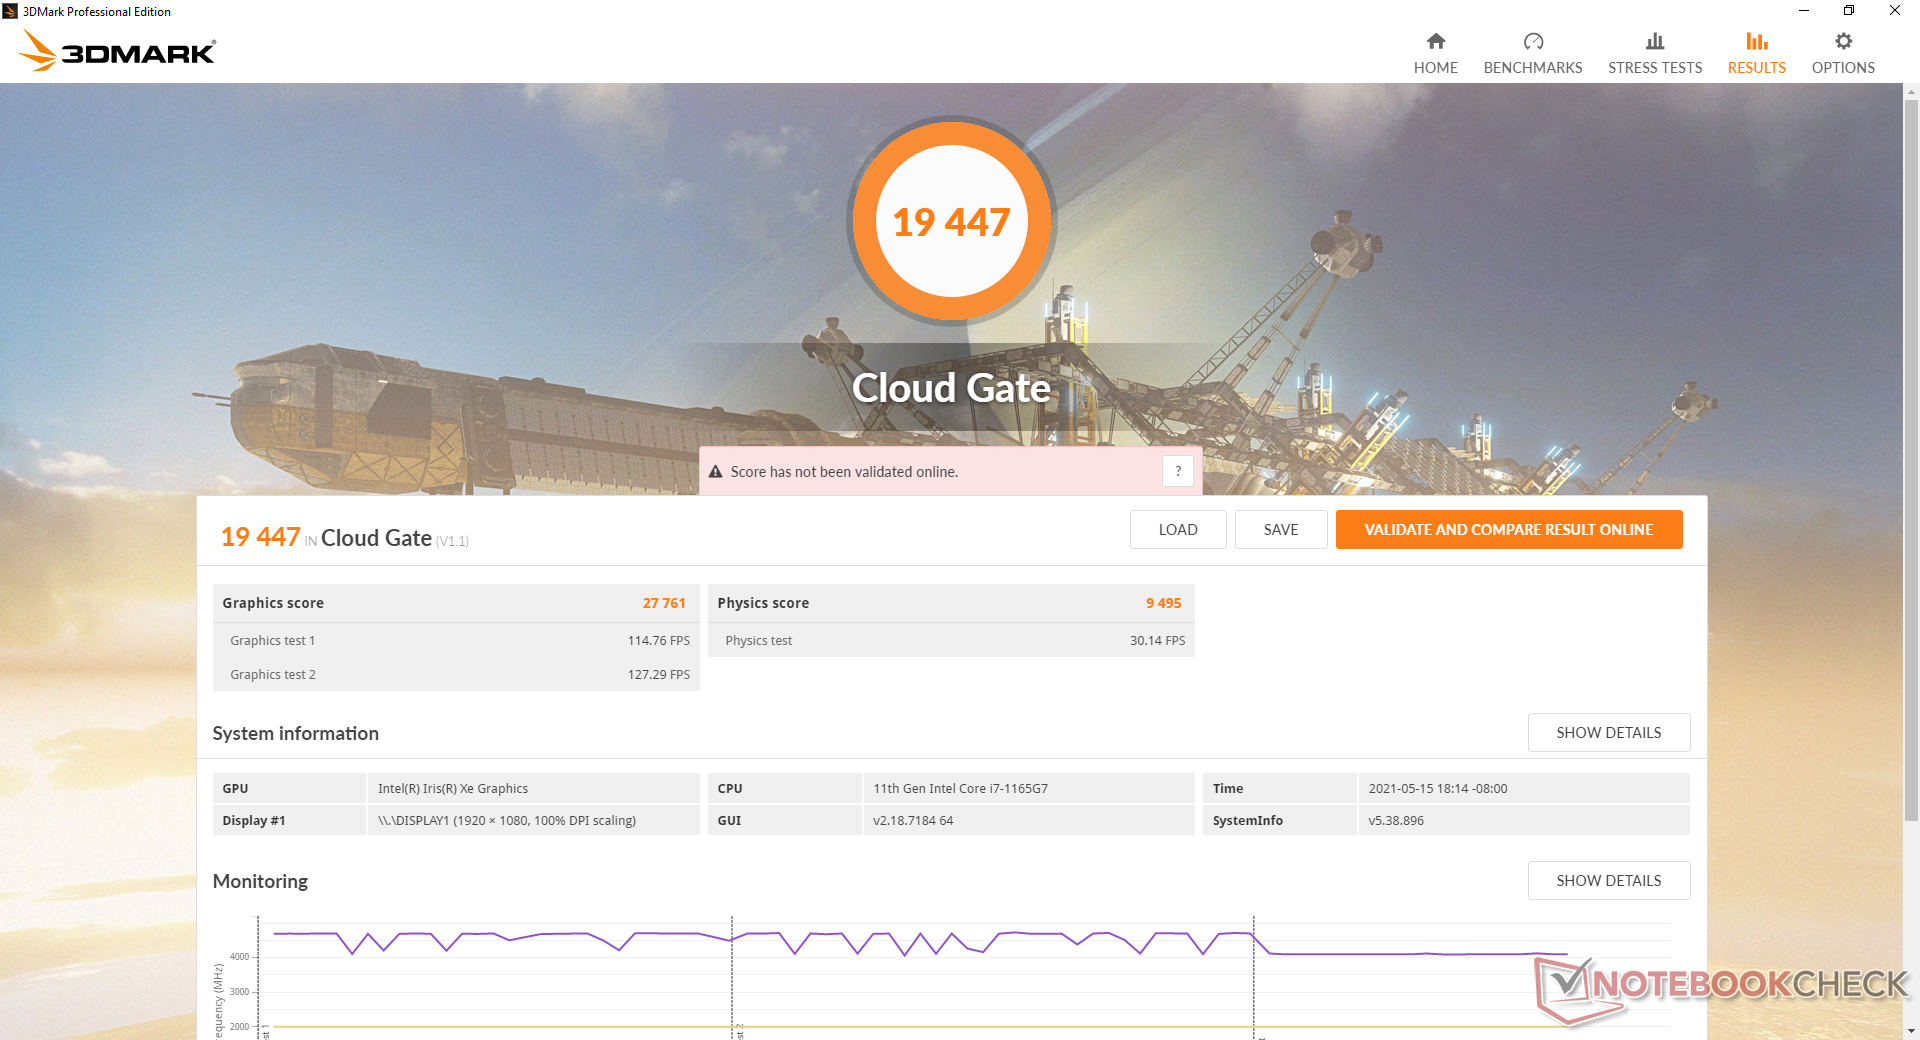
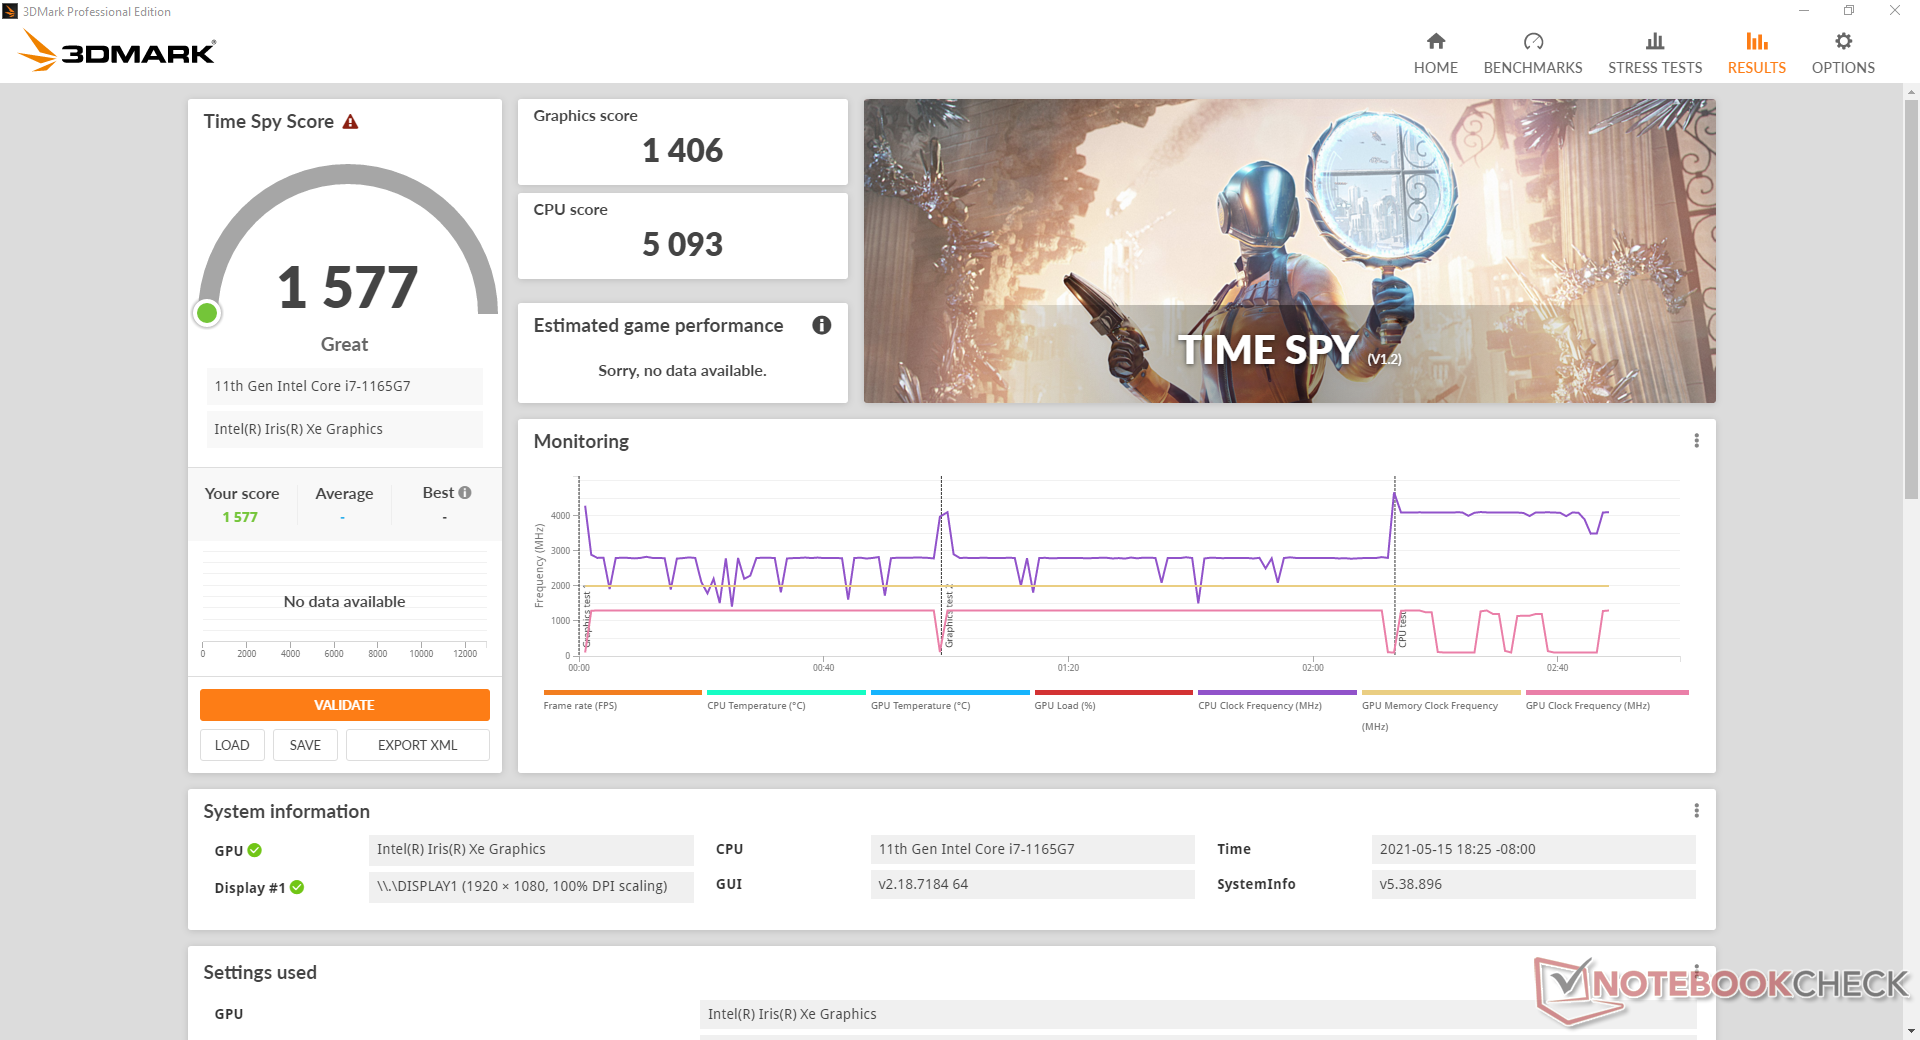
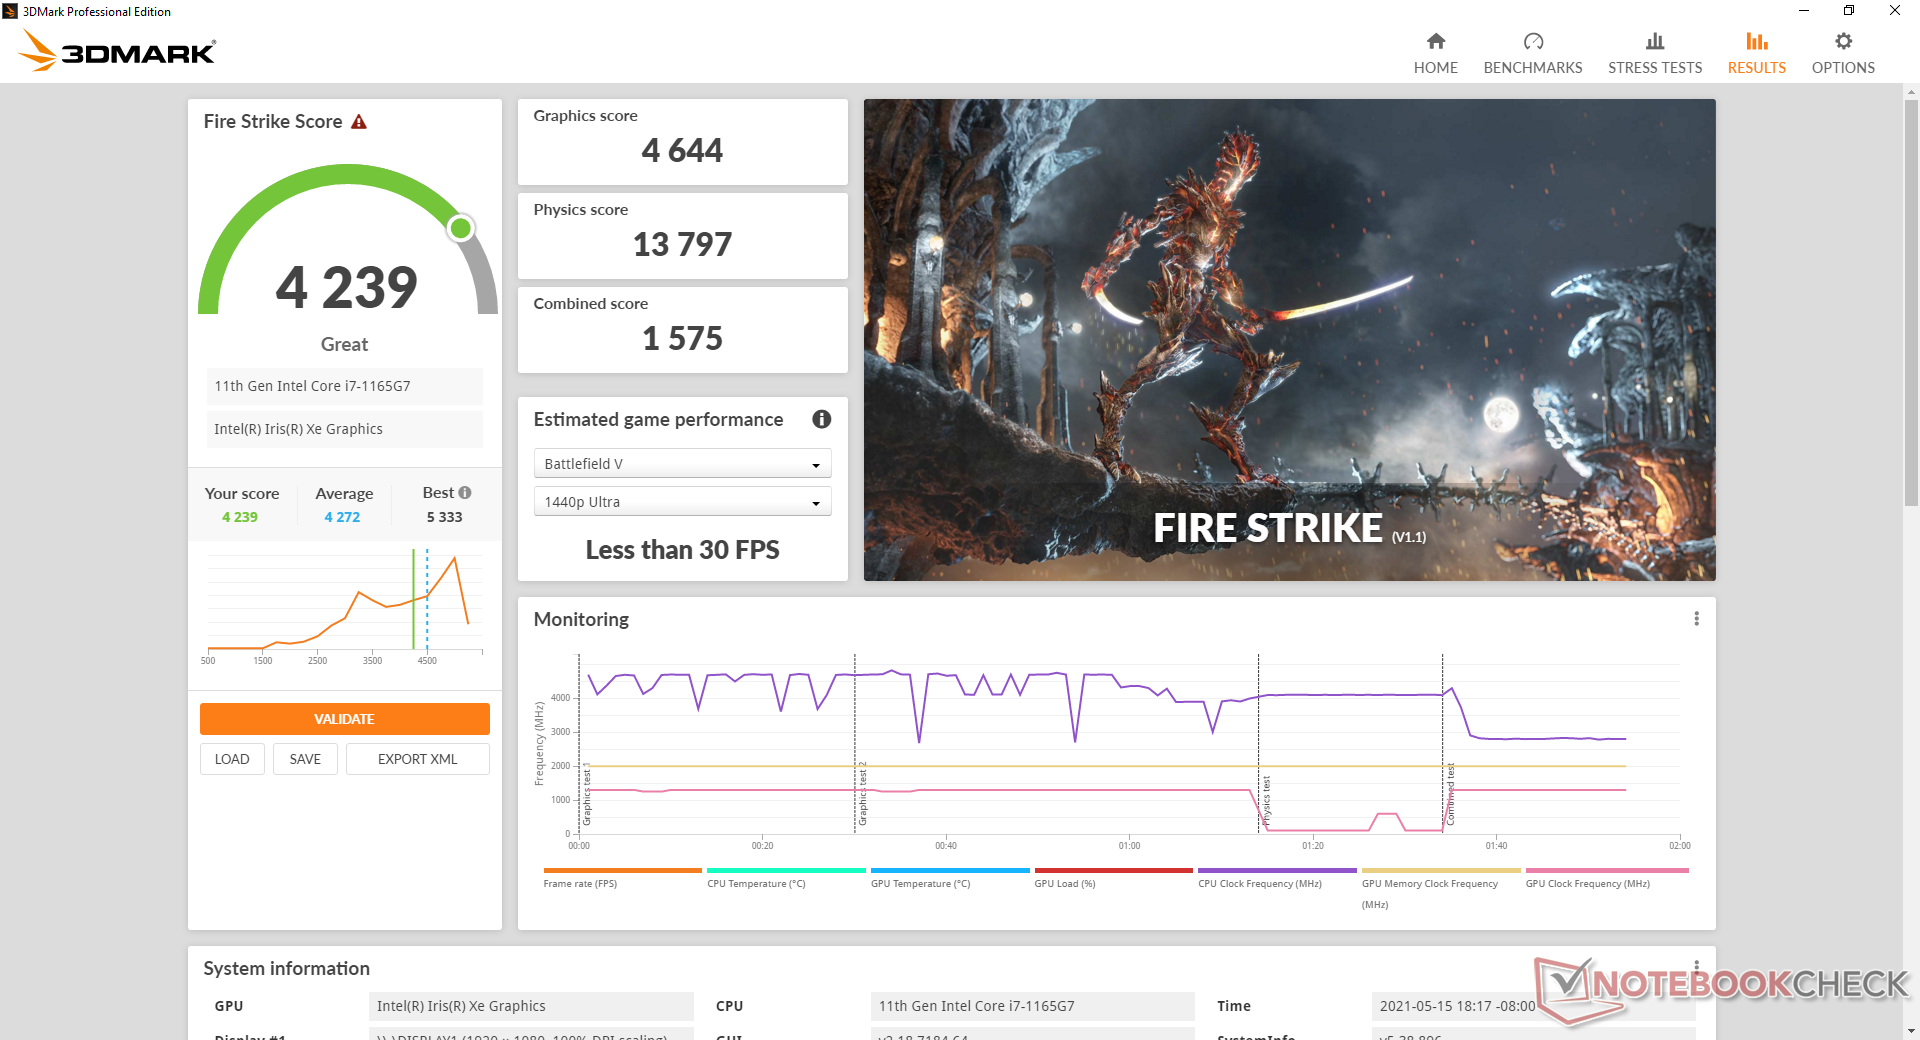
El rendimiento de los gráficos está dentro de unos pocos puntos porcentuales de la media de los portátiles de nuestra base de datos equipados con el mismo Iris Xe 96 EUs GPU. Aunque 3DMark muestra que supera al GeForce MX250/350/450, estas GPUs Nvidia siguen siendo la mejor apuesta en condiciones reales de juego, debido en gran parte a los controladores más maduros de Nvidia y a la mayor potencia disponible para la CPU cuando hay una GPU discreta. Sin embargo, en lo que respecta a las GPU integradas, Iris Xe es la mejor.
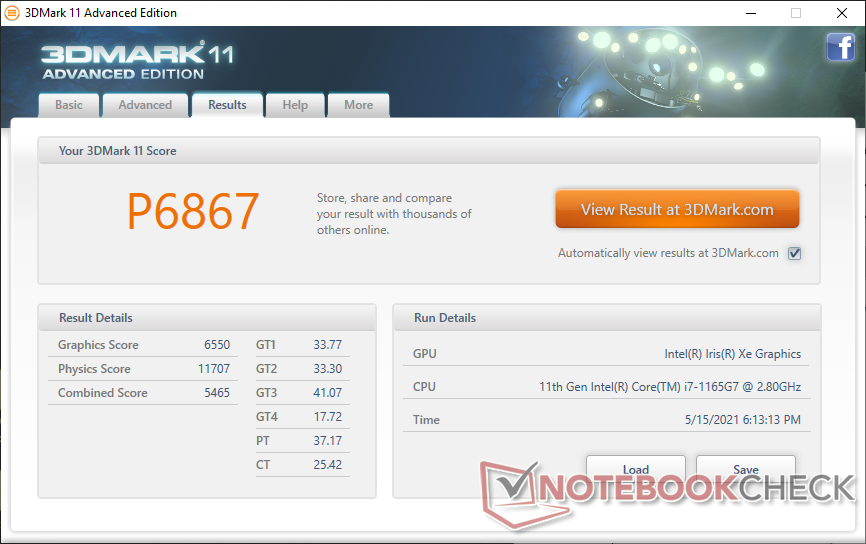
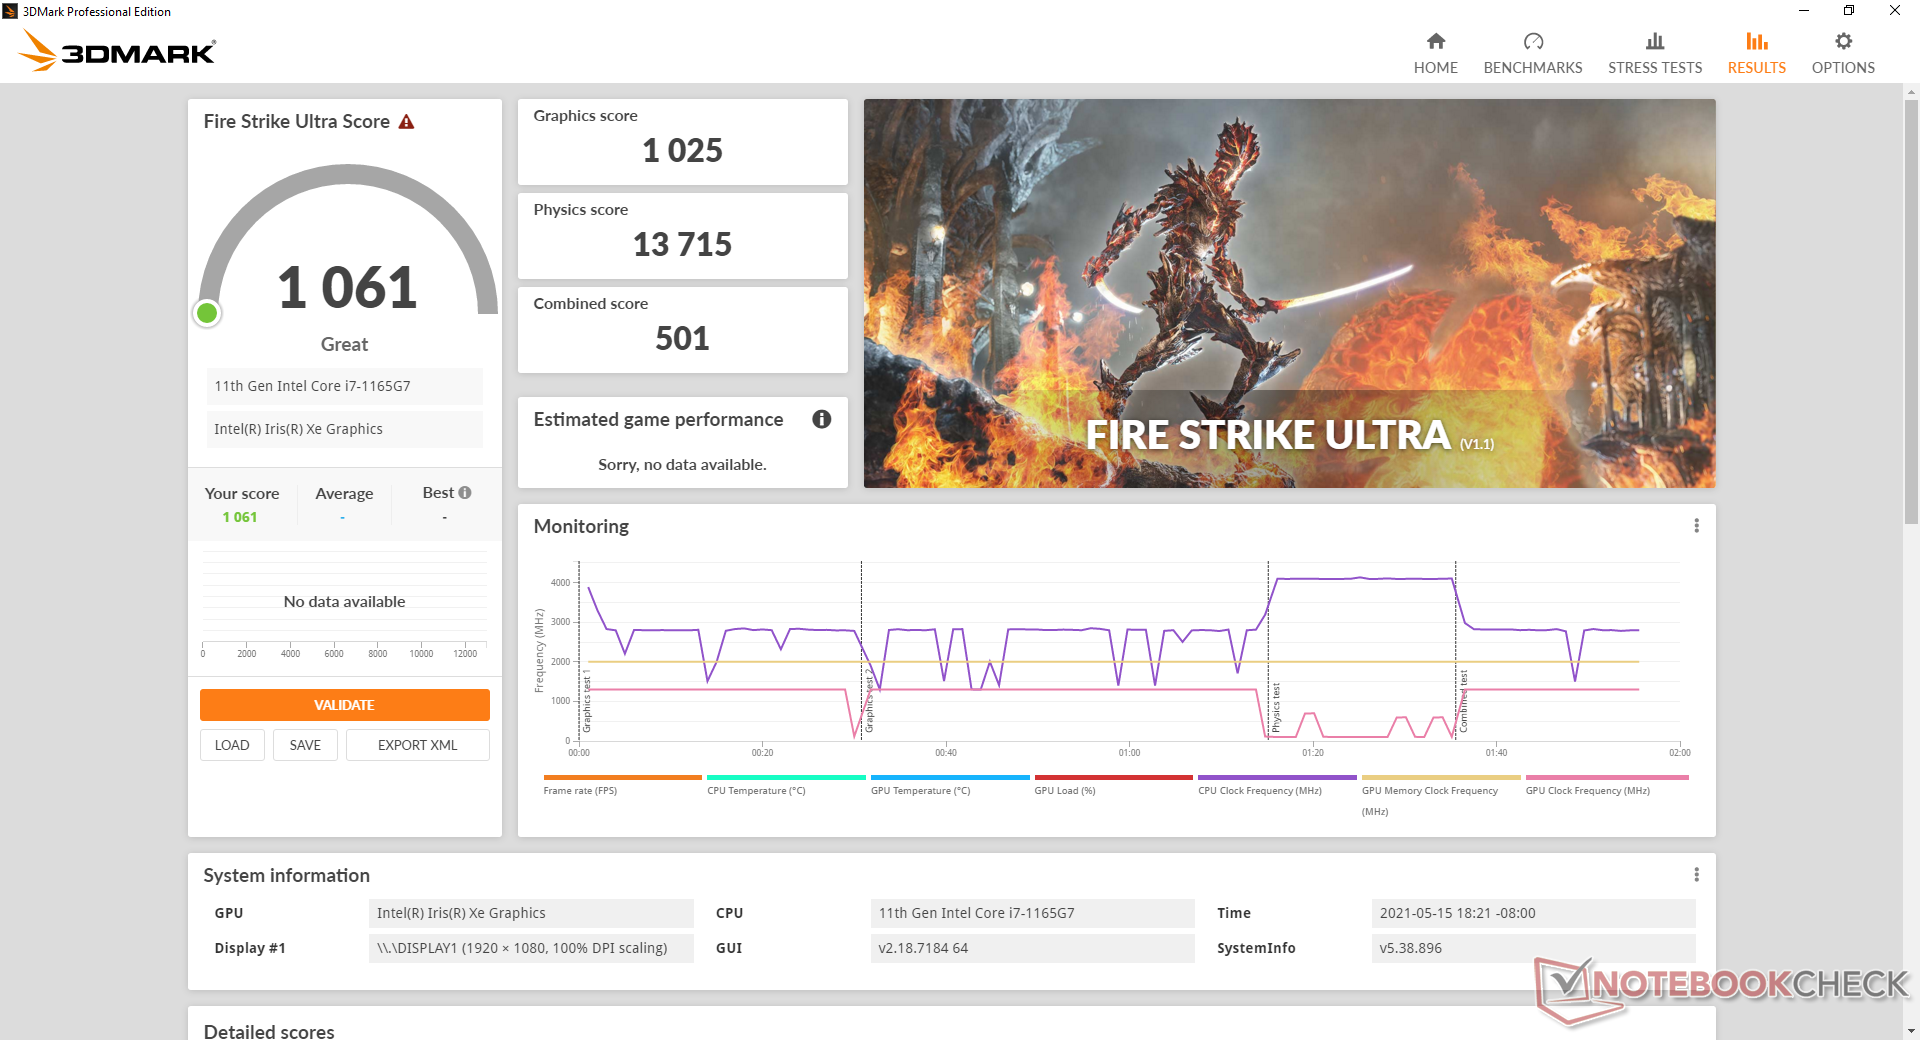
| 3DMark 11 Performance | 6867 puntos | |
| 3DMark Cloud Gate Standard Score | 19447 puntos | |
| 3DMark Fire Strike Score | 4239 puntos | |
| 3DMark Time Spy Score | 1577 puntos | |
ayuda | ||
| bajo | medio | alto | ultra | |
|---|---|---|---|---|
| The Witcher 3 (2015) | 95.3 | 56.3 | 30.8 | 14.5 |
| Dota 2 Reborn (2015) | 81.5 | 67.3 | 45.4 | 42.3 |
| Final Fantasy XV Benchmark (2018) | 39.1 | 20.4 | 15.8 | |
| X-Plane 11.11 (2018) | 59.3 | 42.3 | 38.5 |
Emissions
Ruido del sistema
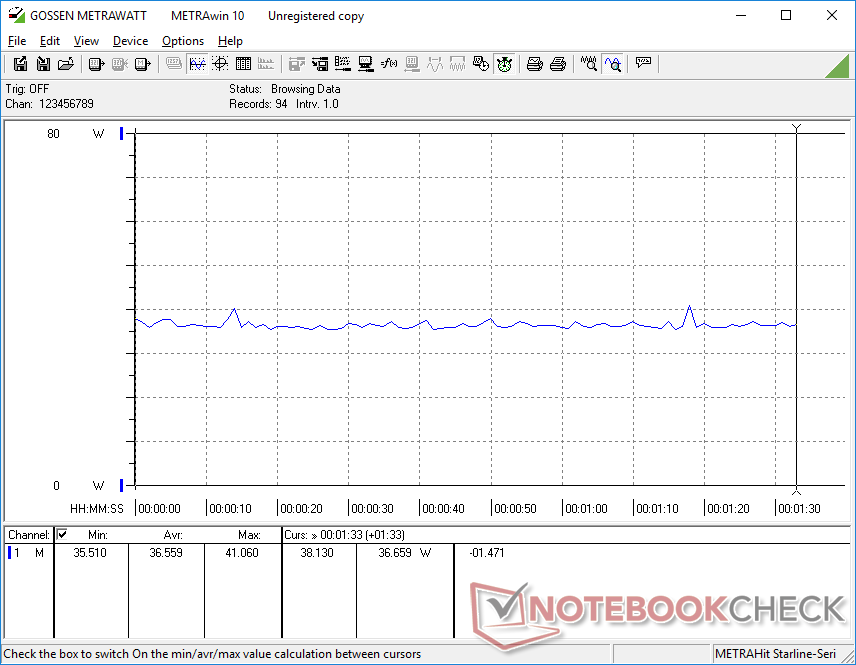
El ruido del ventilador nunca es realmente silencioso incluso cuando se ajusta al modo "Silencioso" en el Centro MSI. Pudimos registrar un ruido de ventilador muy leve de 26,4 dB(A) contra un fondo de 25,2 dB(A) sin importar la configuración del portátil.
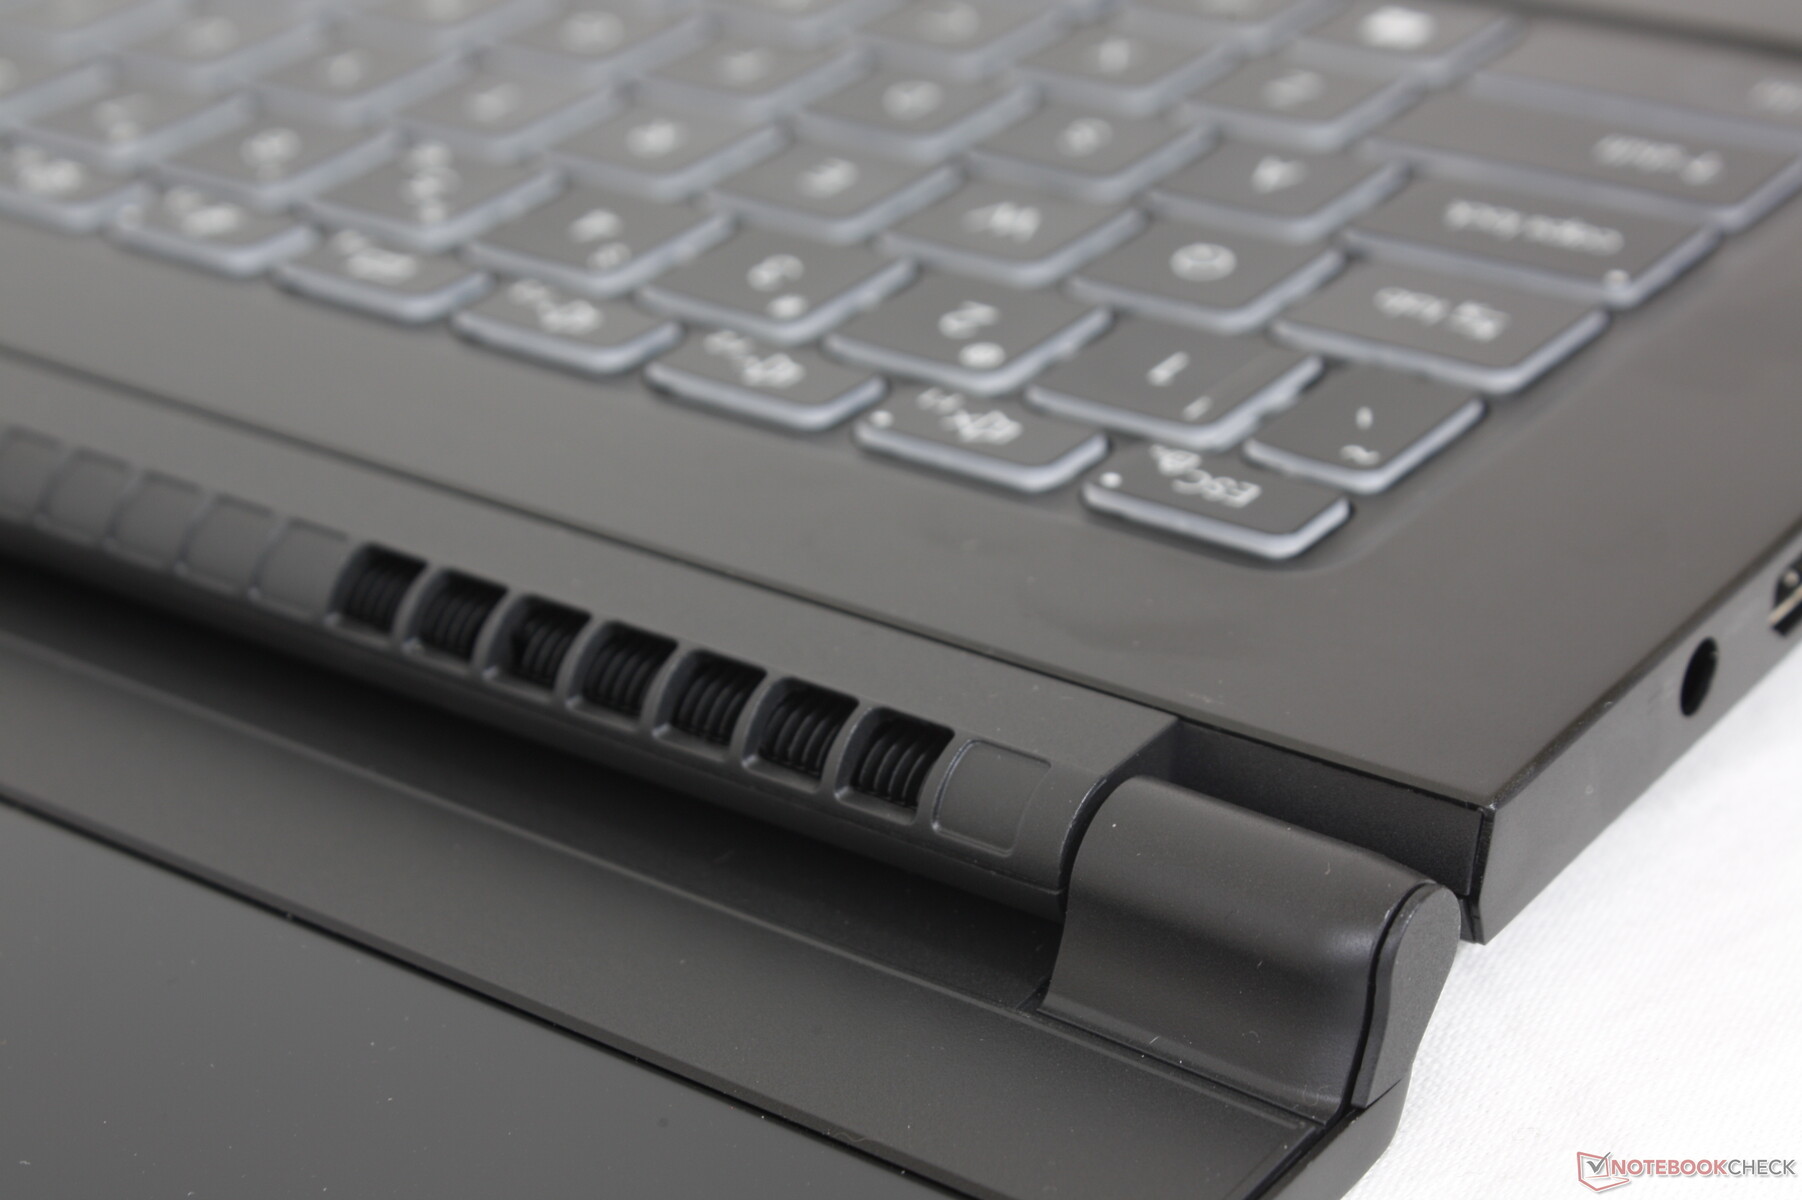
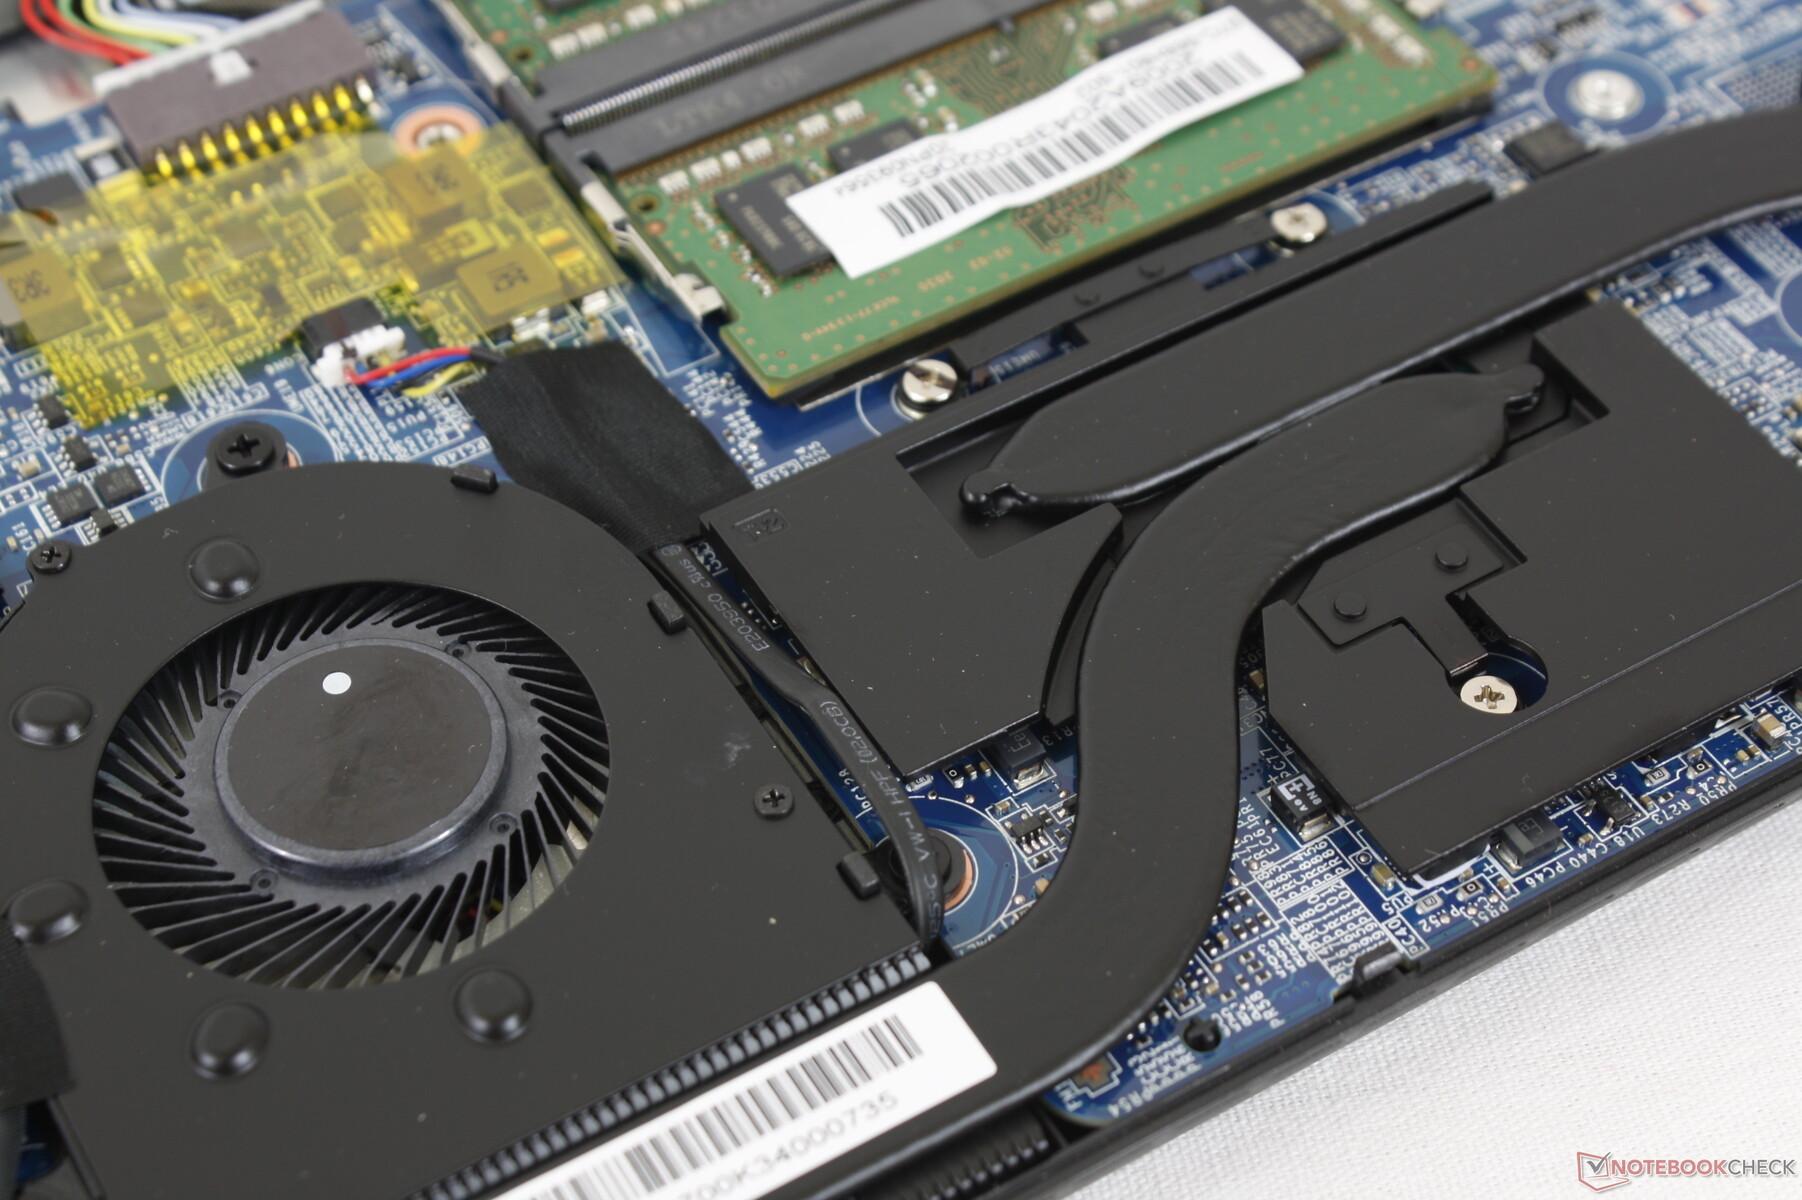
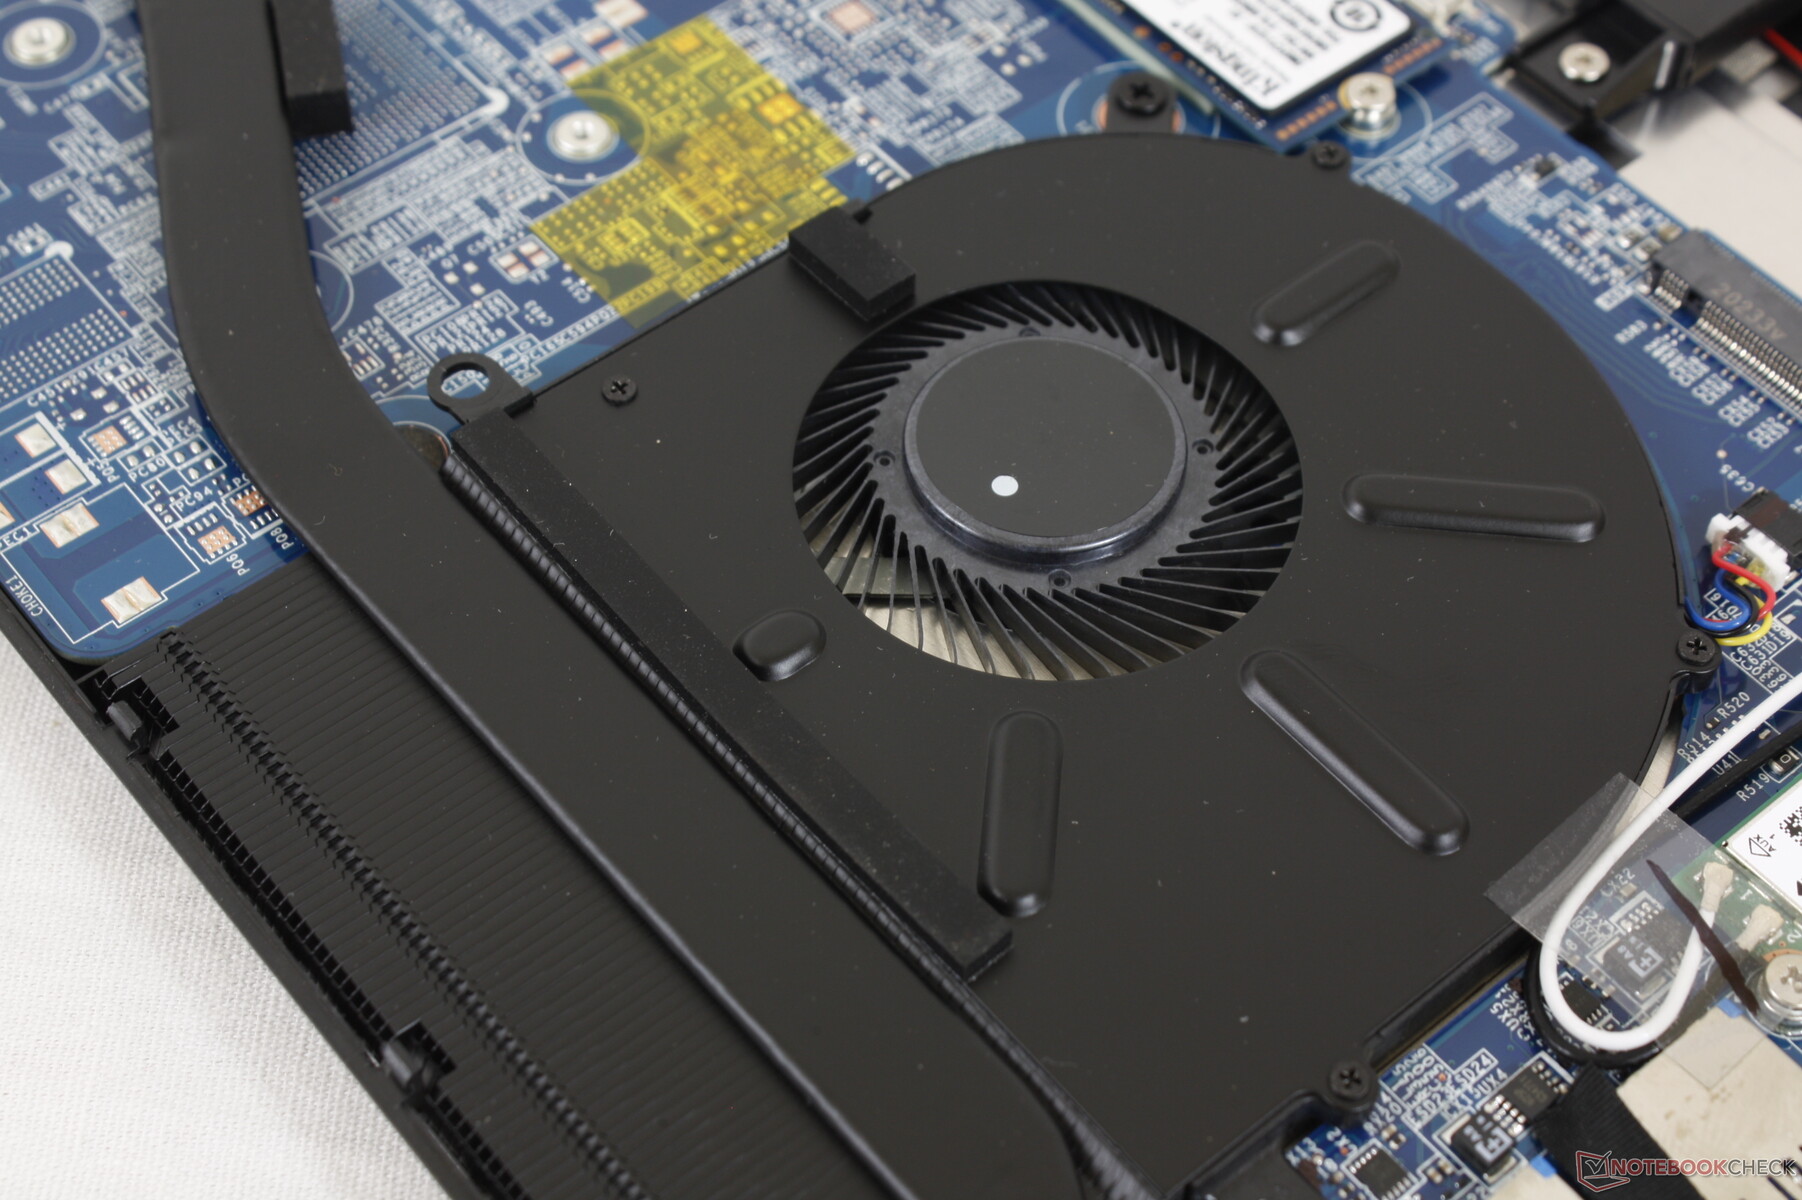
Afortunadamente, los ventiladores permanecen silenciosos a 26,4 dB(A) incluso después de ejecutar la primera escena de benchmark de 3DMark 06. Esto se debe a que la solución de refrigeración fue diseñada para enfriar tanto la CPU como la GPU discreta, como se muestra en las imágenes de abajo, a pesar de que nuestro Summit B15 no tiene GPU discreta. Así, los dos ventiladores internos no necesitan estar siempre activos para mantener el sistema tan fresco.
Por supuesto, el sistema puede seguir siendo muy ruidoso cuando se ejecutan juegos a altas velocidades de fotogramas donde la CPU se estresa. En este caso, el ruido del ventilador puede llegar a 40 dB(A) o 52,6 dB(A) cuando Cooler Boost está desactivado o activado, respectivamente. Tenga en cuenta que el Cooler Boost es sobre todo innecesario para este portátil ULV como nuestra sección de prueba de estrés a continuación mostrará.
El ruido del ventilador es muy bajo cuando se ejecuta Witcher 3 en la configuración Ultra, ya que las velocidades de fotogramas son de un solo dígito. Cuando se pone en ajustes gráficos bajos, el ruido del ventilador salta casi inmediatamente al rango de los 40 dB(A) debido al aumento del rendimiento de la CPU.
| MSI Summit B15 A11M Iris Xe G7 96EUs, i7-1165G7, Kingston OM8PCP31024F | MSI Summit E15 A11SCST GeForce GTX 1650 Ti Max-Q, i7-1185G7, Phison 1TB SM2801T24GKBB4S-E162 | Dell XPS 15 9500 Core i5 UHD Graphics 630, i5-10300H, Toshiba KBG40ZNS256G NVMe | HP Spectre X360 15-5ZV31AV GeForce MX250, i7-10510U, Intel SSD 660p 2TB SSDPEKNW020T8 | ADATA XPG Xenia Xe Iris Xe G7 96EUs, i7-1165G7, ADATA XPG Gammix S50 1TB | |
|---|---|---|---|---|---|
| Noise | -17% | -2% | -14% | -7% | |
| apagado / medio ambiente * (dB) | 25.2 | 24 5% | 28 -11% | 30.1 -19% | 25.2 -0% |
| Idle Minimum * (dB) | 26.4 | 28 -6% | 28 -6% | 30.1 -14% | 25.2 5% |
| Idle Average * (dB) | 26.4 | 29 -10% | 28 -6% | 30.1 -14% | 25.2 5% |
| Idle Maximum * (dB) | 26.4 | 32 -21% | 28 -6% | 30.1 -14% | 25.2 5% |
| Load Average * (dB) | 26.8 | 43 -60% | 28 -4% | 30.1 -12% | 35.7 -33% |
| Witcher 3 ultra * (dB) | 28 | 41 -46% | 39.7 -42% | 39.7 -42% | |
| Load Maximum * (dB) | 52.6 | 44 16% | 41.9 20% | 42 20% | 45.3 14% |
* ... más pequeño es mejor
Ruido
| Ocioso |
| 26.4 / 26.4 / 26.4 dB(A) |
| Carga |
| 26.8 / 52.6 dB(A) |
 | ||
30 dB silencioso 40 dB(A) audible 50 dB(A) ruidosamente alto |
||
min: | ||
Temperatura
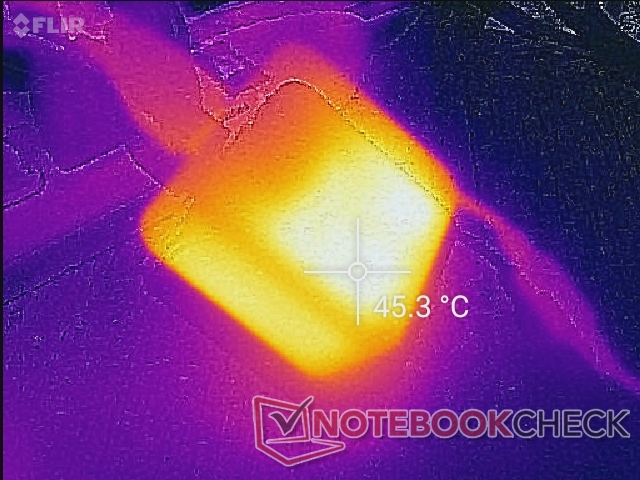
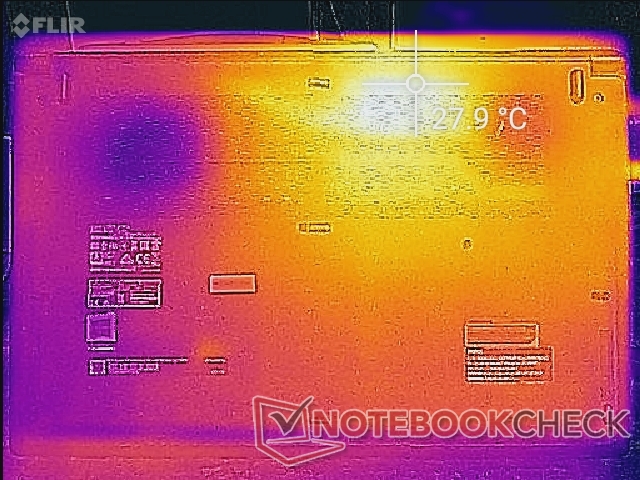
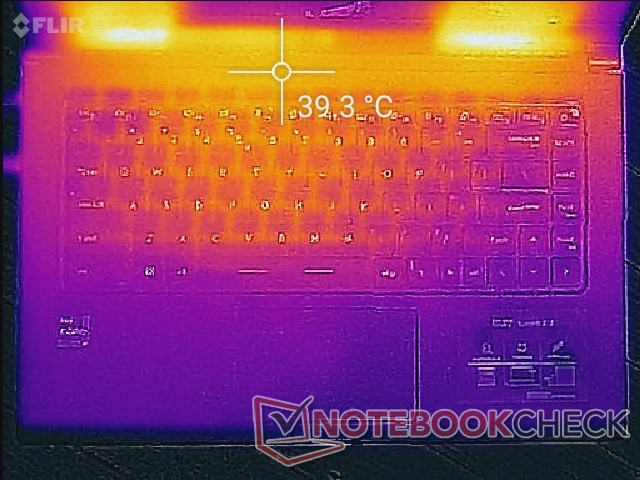
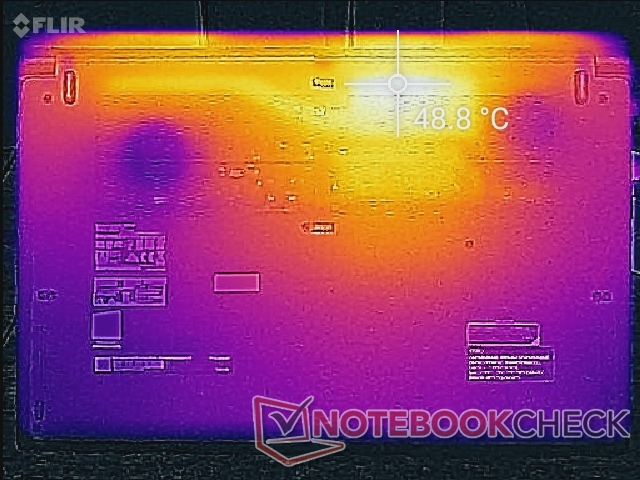
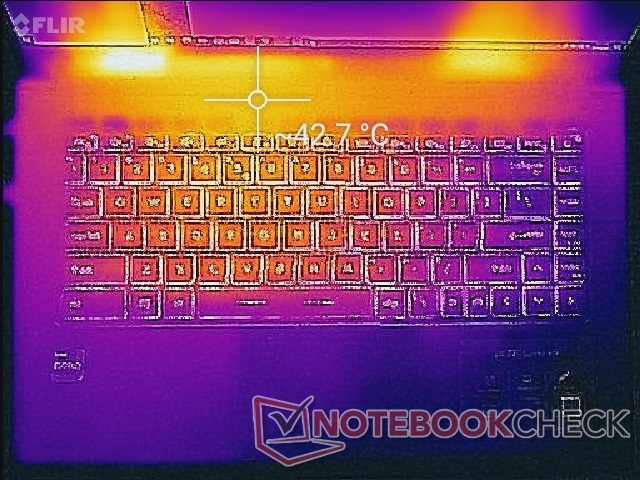
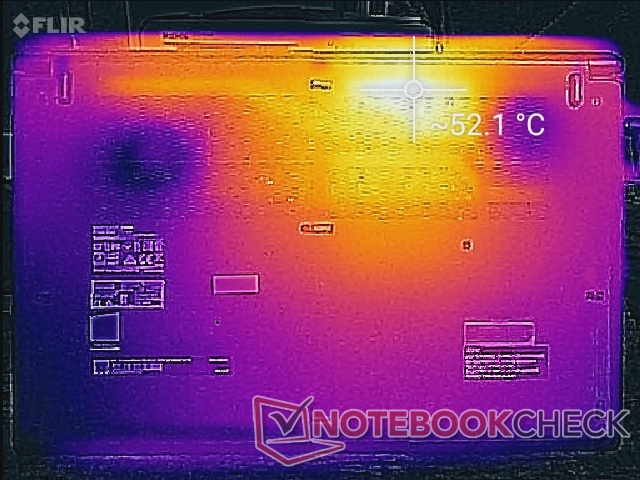
Las temperaturas de la superficie son notablemente más frías que las que observamos en el Modern 15, probablemente porque nuestro Summit B15 no viene con una GPU discreta. Por ejemplo, el centro del teclado se estabiliza en torno a los 38 C cuando se ejecutan cargas de procesamiento pesadas en comparación con los 45 C del Modern 15. Los puntos calientes de la parte inferior también son unos grados más fríos esta vez. La superficie inferior está más dedicada a la ventilación, a diferencia de las pequeñas rejillas del Razer Blade Stealth o Blade 15 de la serie Blade.
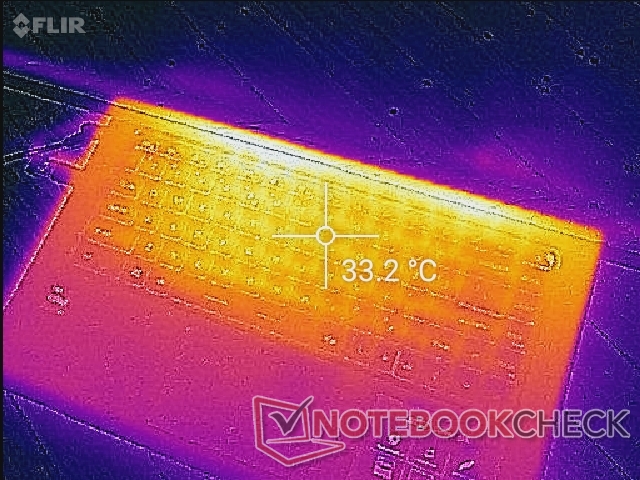
(±) La temperatura máxima en la parte superior es de 42.8 °C / 109 F, frente a la media de 34.3 °C / 94 F, que oscila entre 21.2 y 62.5 °C para la clase Office.
(-) El fondo se calienta hasta un máximo de 52.2 °C / 126 F, frente a la media de 36.8 °C / 98 F
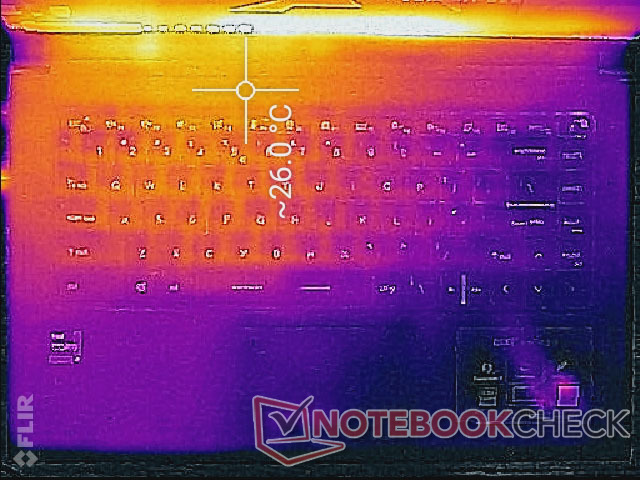
(+) En reposo, la temperatura media de la parte superior es de 24.2 °C / 76# F, frente a la media del dispositivo de 29.5 °C / 85 F.
(+) Jugando a The Witcher 3, la temperatura media de la parte superior es de 31.9 °C / 89 F, frente a la media del dispositivo de 29.5 °C / 85 F.
(+) El reposamanos y el panel táctil están a una temperatura inferior a la de la piel, con un máximo de 29.2 °C / 84.6 F y, por tanto, son fríos al tacto.
(±) La temperatura media de la zona del reposamanos de dispositivos similares fue de 27.5 °C / 81.5 F (-1.7 °C / -3.1 F).
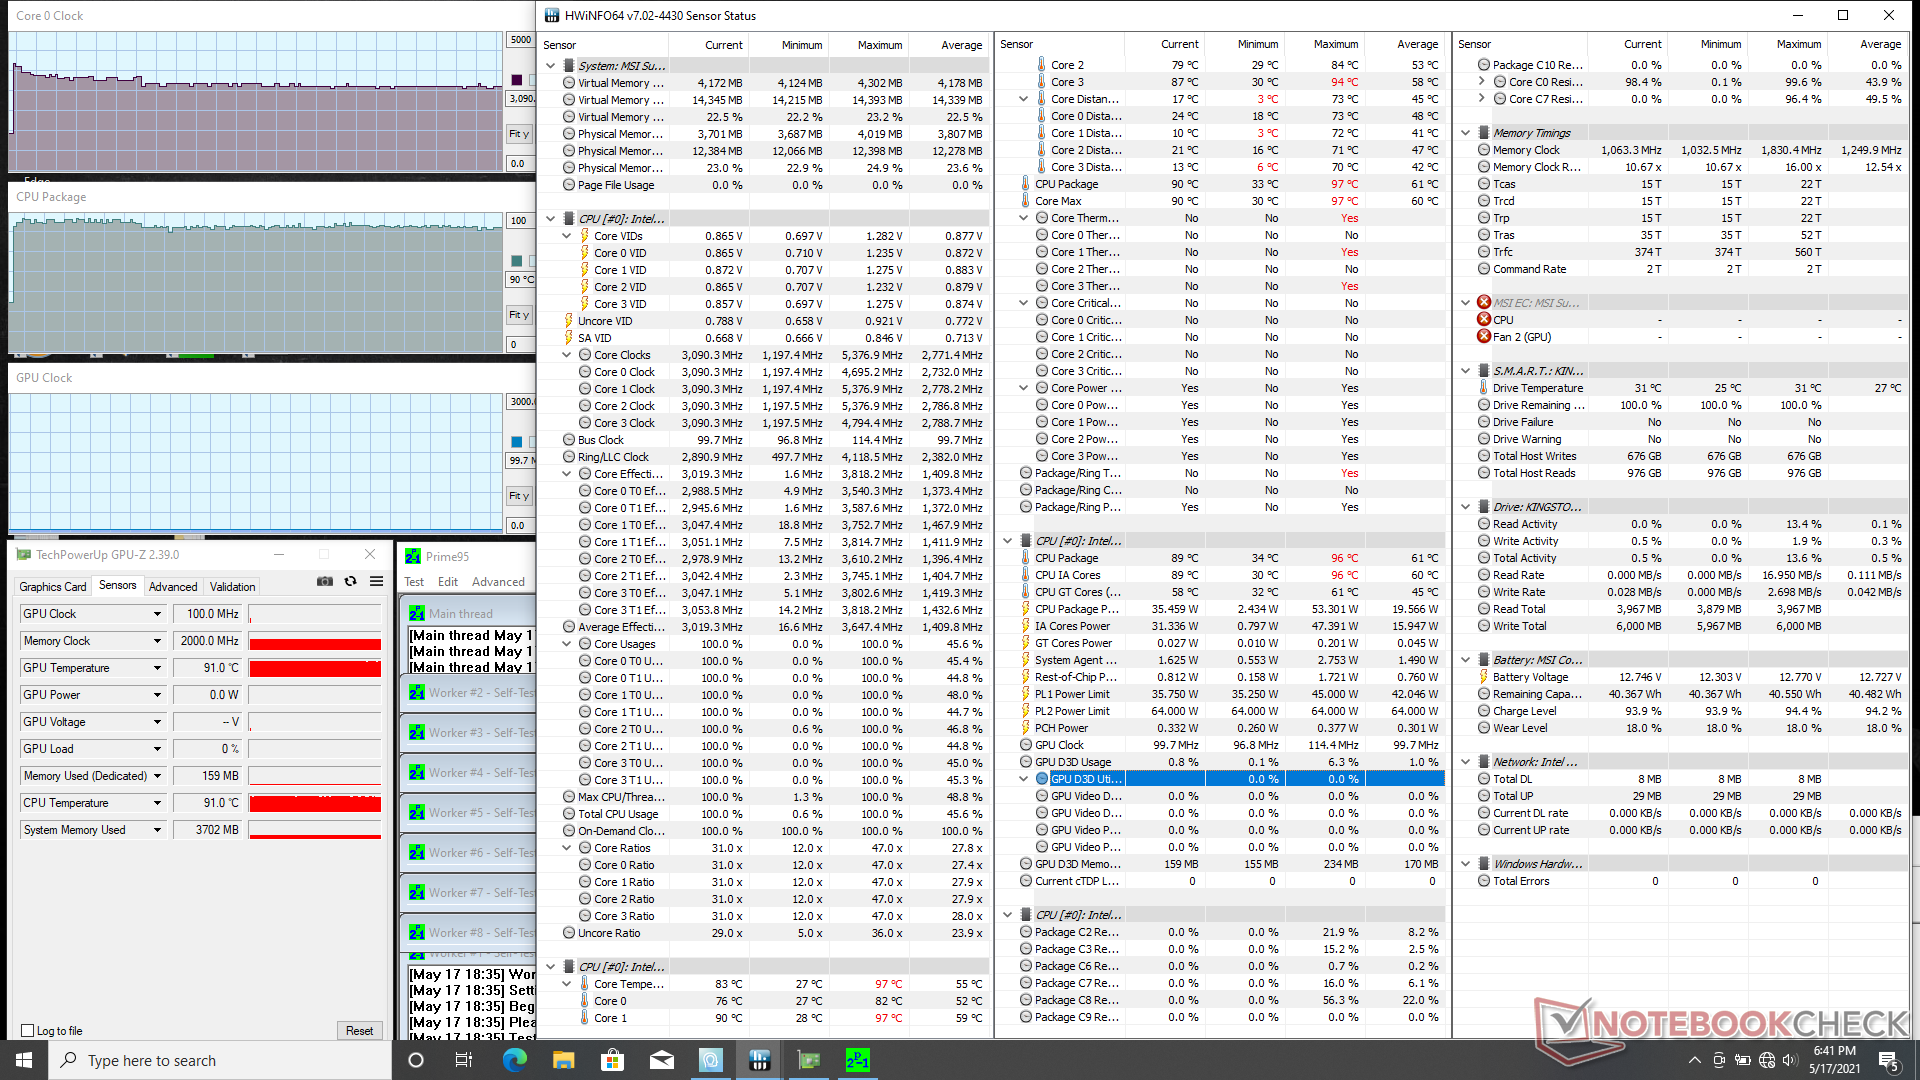
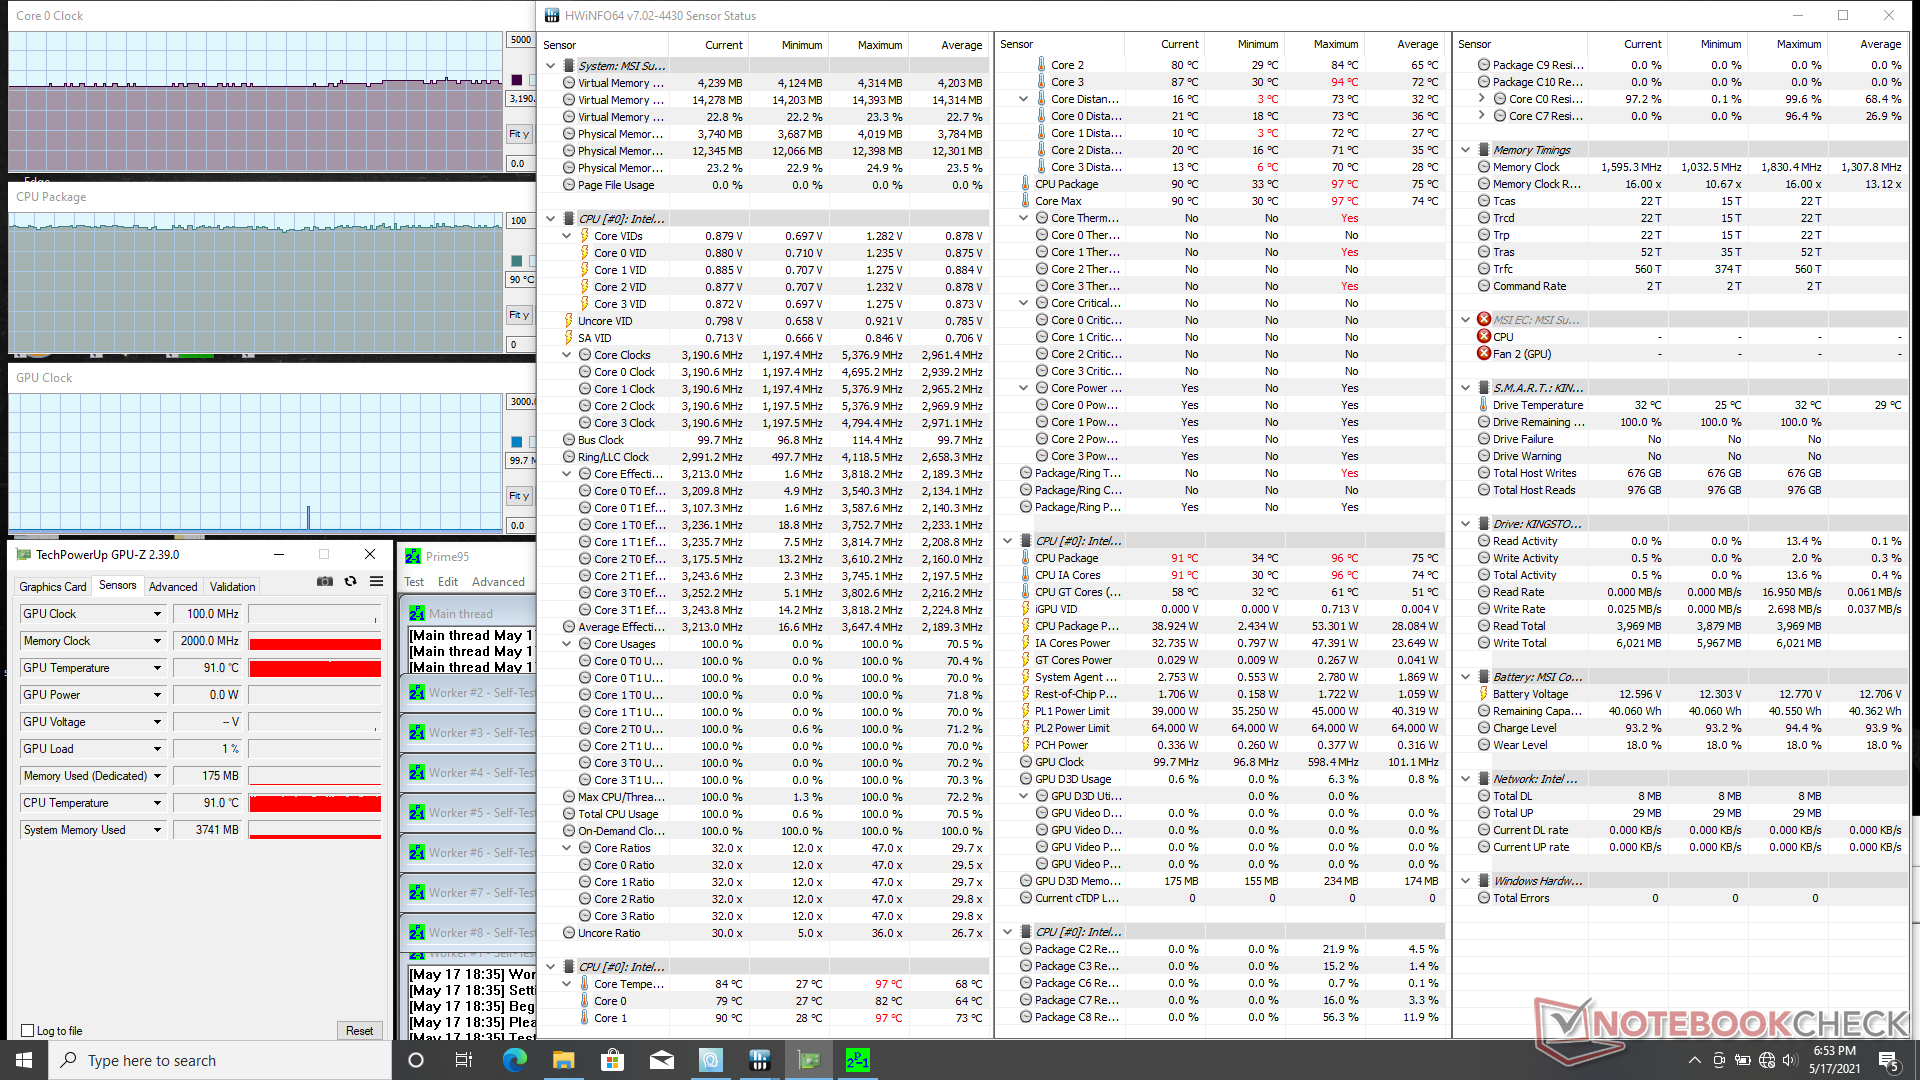
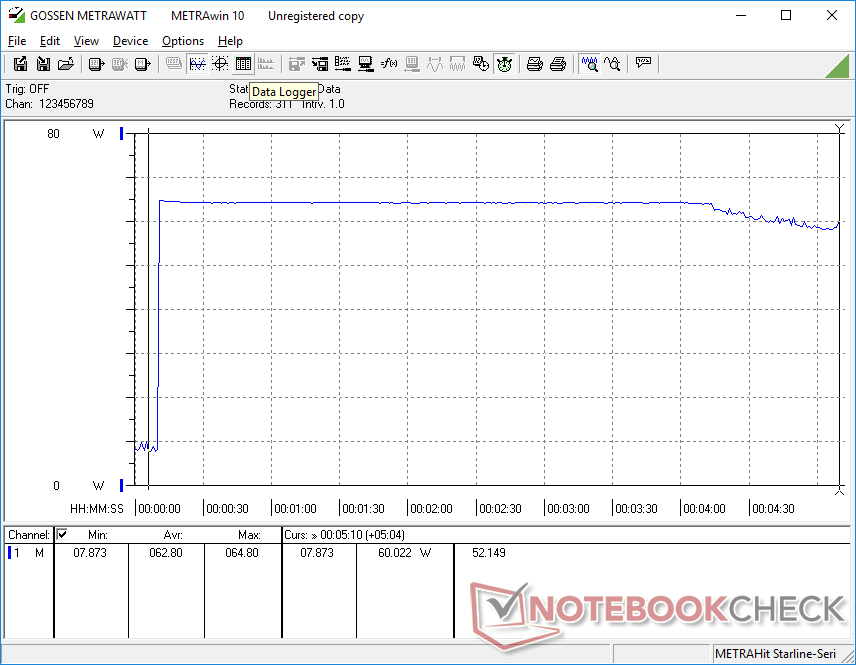
Prueba de esfuerzo
Cuando se estresa con Prime95, la CPU sube a 3,8 GHz durante los primeros segundos antes de caer constantemente y finalmente estabilizarse en el rango de 3,0 a 3,1 GHz. Si se activa el modo Cooler Boost (es decir, el modo de ventilador máximo), la CPU funcionará ligeramente más rápido, a 3,2 o 3,3 GHz, mientras que la temperatura del núcleo se mantiene igual, a 90 C. La temperatura de la CPU en el Modern 15 sería mucho más fría, a 73 C, bajo cargas similares
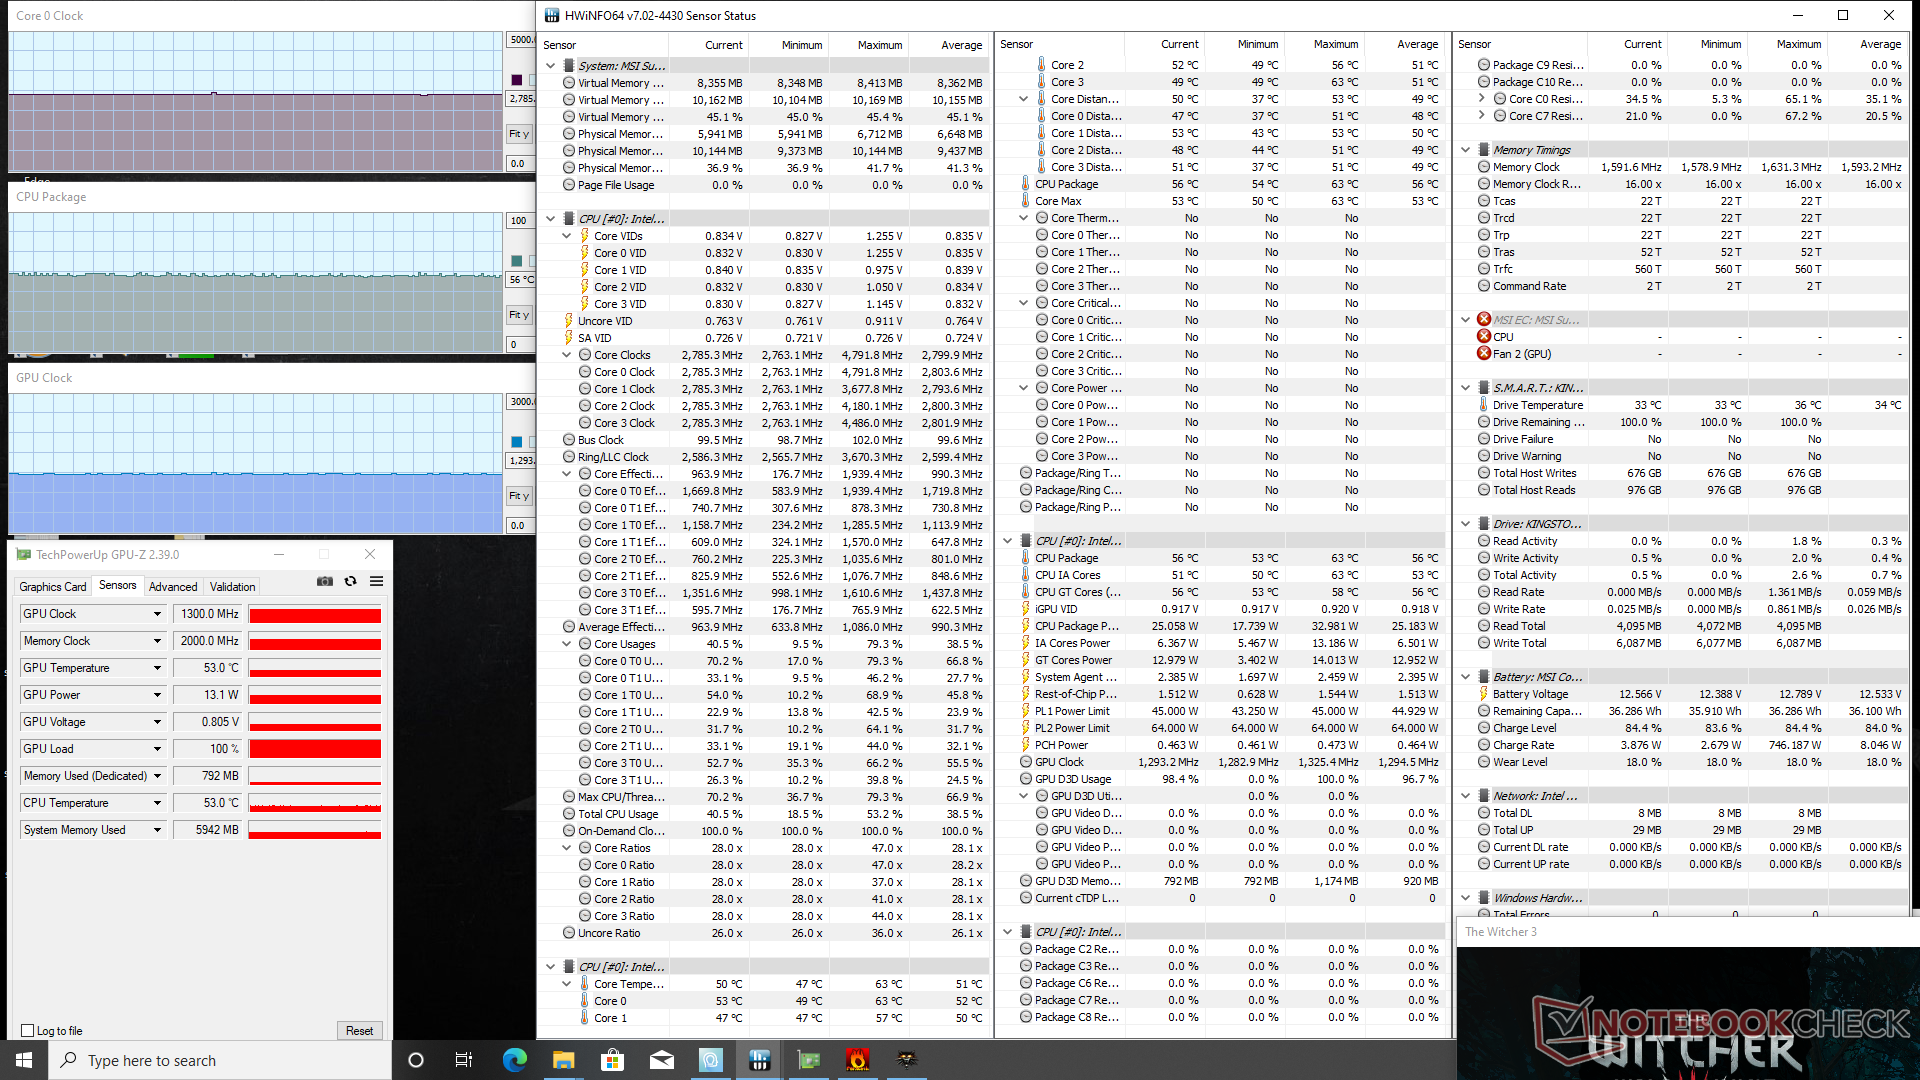
Cuando se ejecuta Witcher 3 para representar las cargas estresantes del mundo real, la CPU se estabilizaría a sólo 67 C o incluso 56 C si Cooler Boost está activado. Sin embargo, el rendimiento sigue siendo el mismo sin importar la configuración de Cooler Boost, lo que significa que la característica es principalmente para fines de temperatura
Funcionar con baterías puede afectar al rendimiento gráfico. Un test 3DMark 11 con batería devolvería la misma puntuación de Física que con el adaptador de CA pero con una puntuación gráfica ligeramente inferior (6550 vs. 6232 puntos).
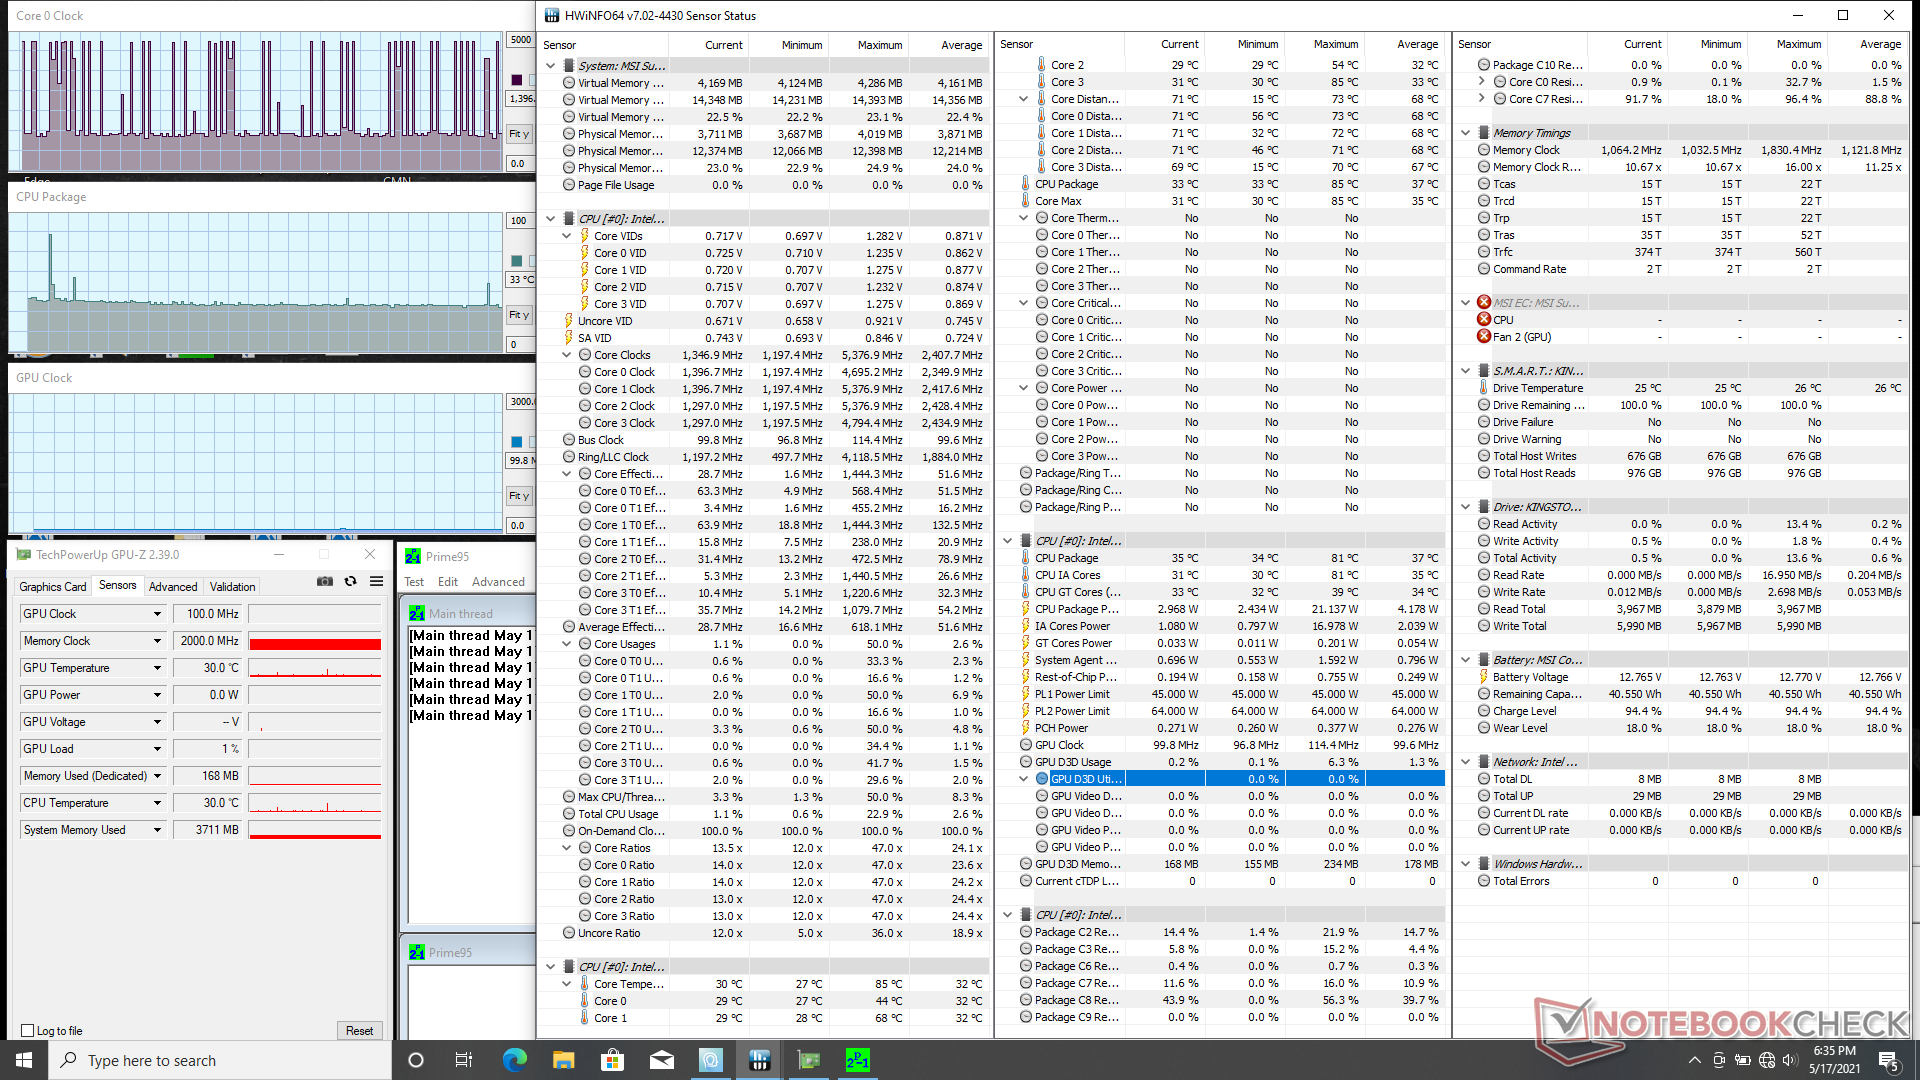
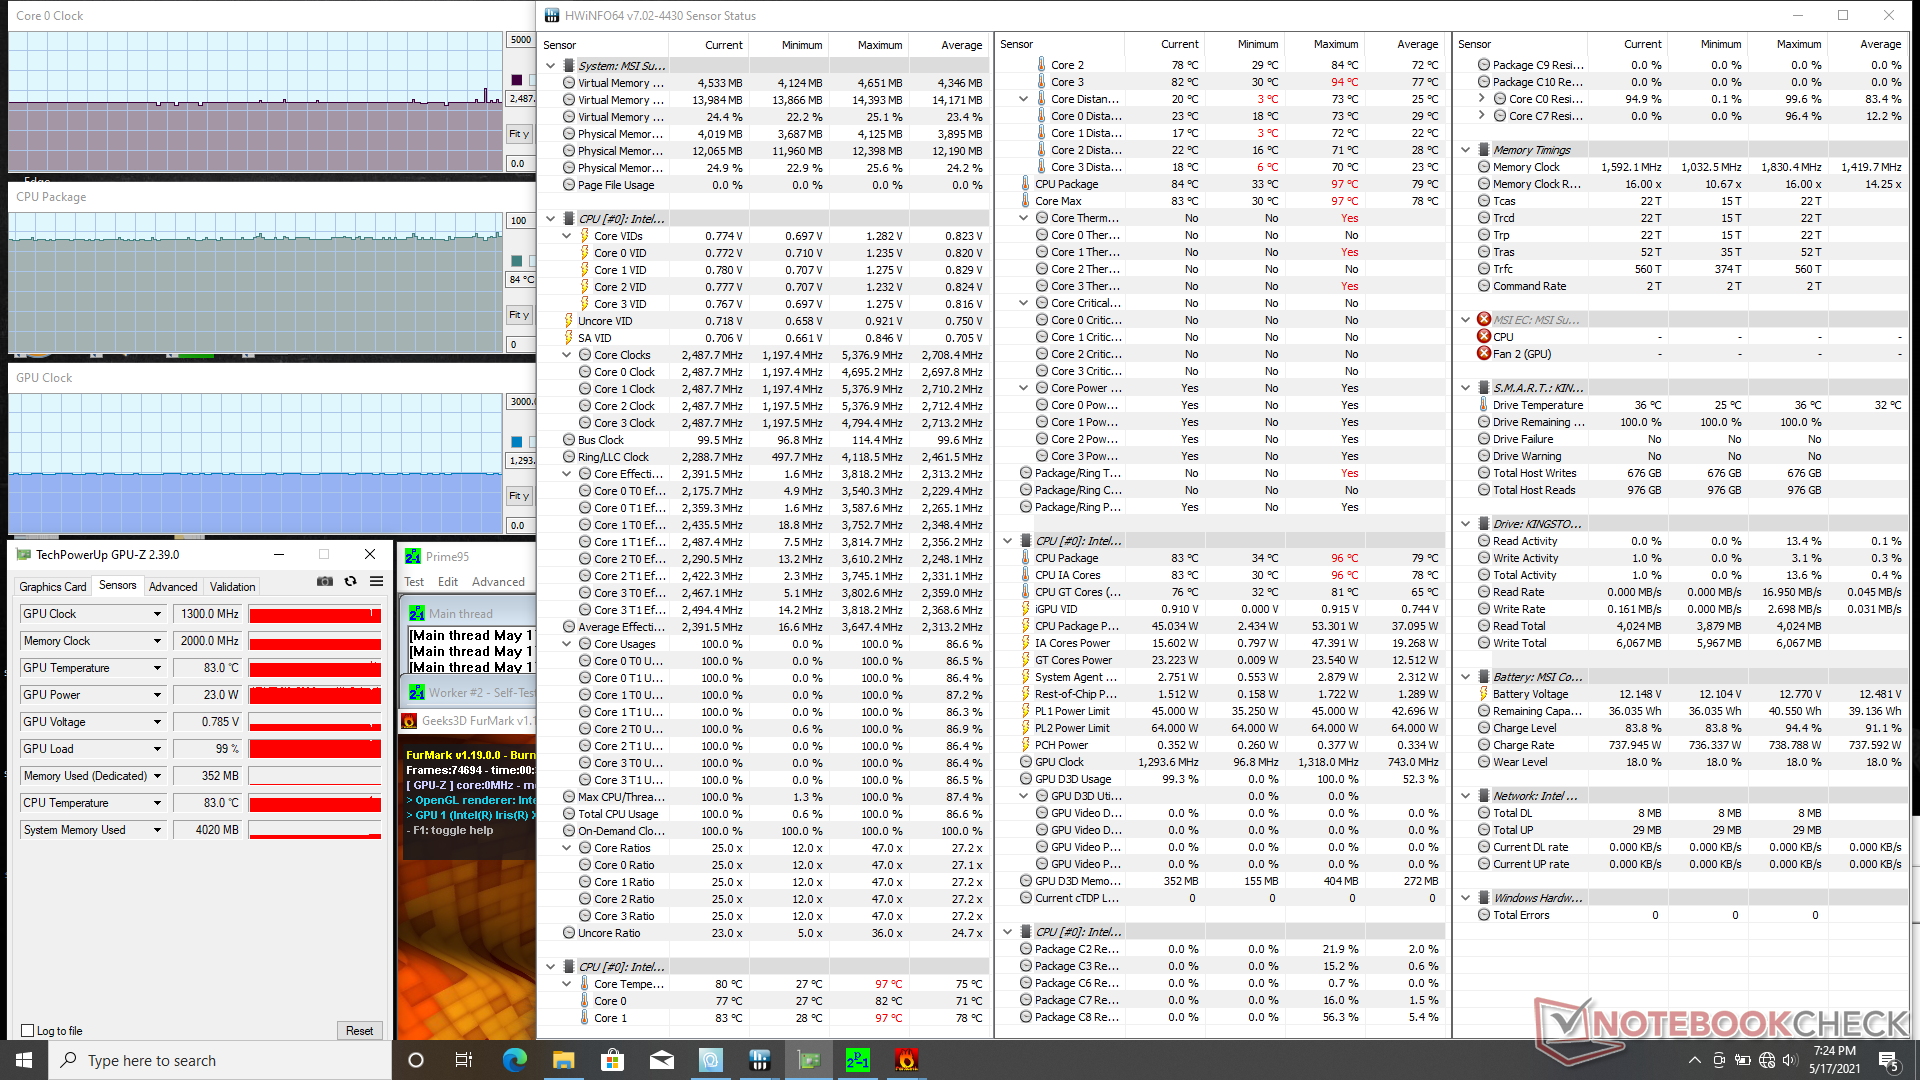

| Relojde la CPU(GHz) | Reloj dela GPU(MHz) | Temperaturamediade la CPU (°C) | |
| Sistema en reposo | |||
| Prime95 + FurMark Stress (Cooler Boost activado) | 2.5 | 1300 | 84 |
| Estrés de Prime95 (Cooler Boost desactivado) | 3,0 - 3,1 | -- | 90 |
| Estrés de Prime95 (Cooler Boost activado) | 3,2 - 3,3 | -- | 90 |
| Witcher 3 Tensión (Cooler Boost off) | 2.8 | 1300 | 67 |
| Witcher 3 Tensión (Cooler Boost activado) | 2,8 | 1300 | 56 |
Altavoces


MSI Summit B15 A11M análisis de audio
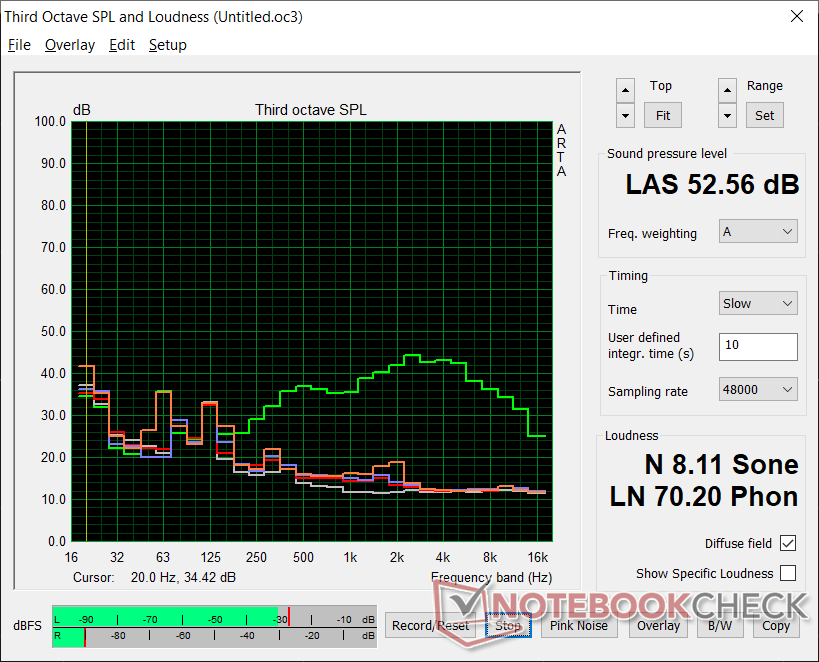
(+) | los altavoces pueden reproducir a un volumen relativamente alto (#83.9 dB)
Graves 100 - 315 Hz
(-) | casi sin bajos - de media 18.2% inferior a la mediana
(±) | la linealidad de los graves es media (12.2% delta a frecuencia anterior)
Medios 400 - 2000 Hz
(±) | medias más altas - de media 9.5% más altas que la mediana
(±) | la linealidad de los medios es media (9.3% delta respecto a la frecuencia anterior)
Altos 2 - 16 kHz
(±) | máximos más altos - de media 7.5% más altos que la mediana
(±) | la linealidad de los máximos es media (7.1% delta a frecuencia anterior)
Total 100 - 16.000 Hz
(±) | la linealidad del sonido global es media (25.6% de diferencia con la mediana)
En comparación con la misma clase
» 78% de todos los dispositivos probados de esta clase eran mejores, 6% similares, 16% peores
» El mejor tuvo un delta de 7%, la media fue 21%, el peor fue ###max##%
En comparación con todos los dispositivos probados
» 79% de todos los dispositivos probados eran mejores, 4% similares, 17% peores
» El mejor tuvo un delta de 4%, la media fue 23%, el peor fue ###max##%
Apple MacBook 12 (Early 2016) 1.1 GHz análisis de audio
(+) | los altavoces pueden reproducir a un volumen relativamente alto (#83.6 dB)
Graves 100 - 315 Hz
(±) | lubina reducida - en promedio 11.3% inferior a la mediana
(±) | la linealidad de los graves es media (14.2% delta a frecuencia anterior)
Medios 400 - 2000 Hz
(+) | medios equilibrados - a sólo 2.4% de la mediana
(+) | los medios son lineales (5.5% delta a la frecuencia anterior)
Altos 2 - 16 kHz
(+) | máximos equilibrados - a sólo 2% de la mediana
(+) | los máximos son lineales (4.5% delta a la frecuencia anterior)
Total 100 - 16.000 Hz
(+) | el sonido global es lineal (10.2% de diferencia con la mediana)
En comparación con la misma clase
» 7% de todos los dispositivos probados de esta clase eran mejores, 2% similares, 90% peores
» El mejor tuvo un delta de 5%, la media fue 18%, el peor fue ###max##%
En comparación con todos los dispositivos probados
» 5% de todos los dispositivos probados eran mejores, 1% similares, 94% peores
» El mejor tuvo un delta de 4%, la media fue 23%, el peor fue ###max##%
Energy Management
Consumo de energía
El consumo de energía es bajo, especialmente si se compara con el Modern 15 del año pasado. El funcionamiento en vacío en el escritorio consume entre 4 W y 9 W dependiendo del nivel de brillo y el perfil de energía mientras que el Modern 15 consumiría entre 6 W y 15 W. La ejecución de juegos también consumiría sólo 38 W en nuestro Summit B15 en comparación con los 59 W a 83 W del Modern 15 aunque nuestro sistema Summit puede superar a la CPU de 10ª generación del Modern 15 mientras que está más o menos a la par con el GeForce MX250
Curiosamente, el XPG Xenia Xe con la misma CPU Core i7-1165G7 y la GPU Iris Xe consumiría un poco más de energía que nuestro Summit B15 al jugar (44 W frente a 38 W). El sistema XPG, sin embargo, también superaría sistemáticamente a nuestro Summit en los benchmarks de GPU y en los juegos
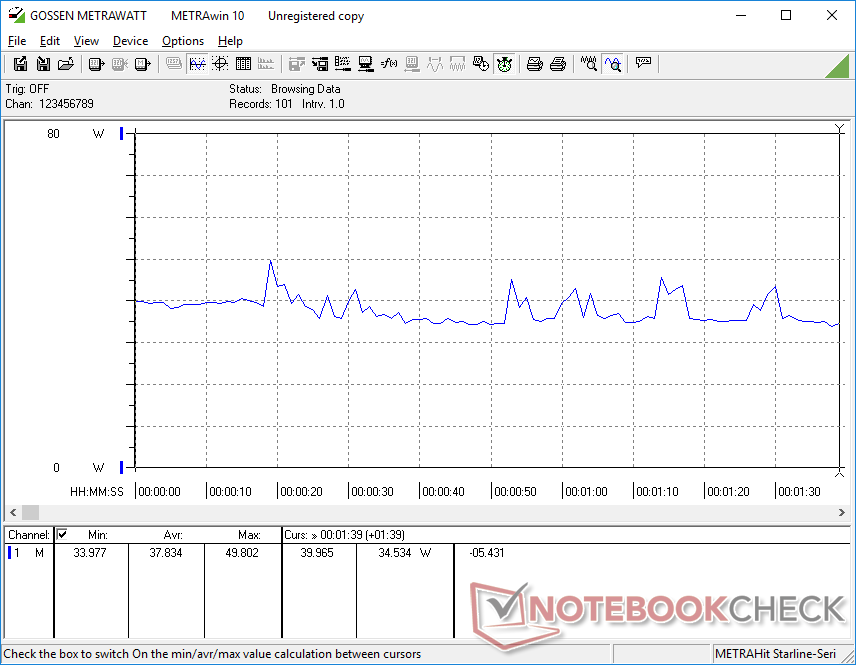
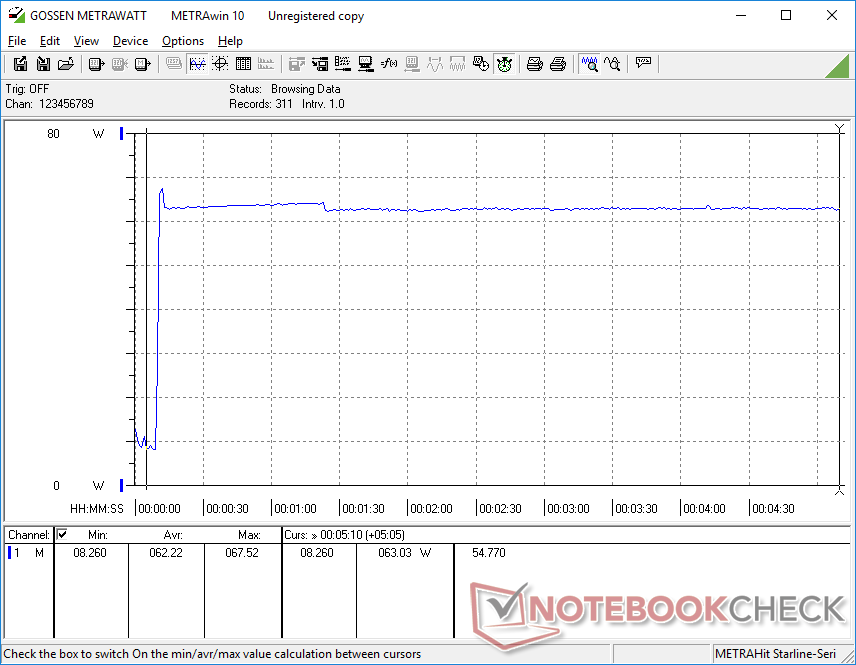
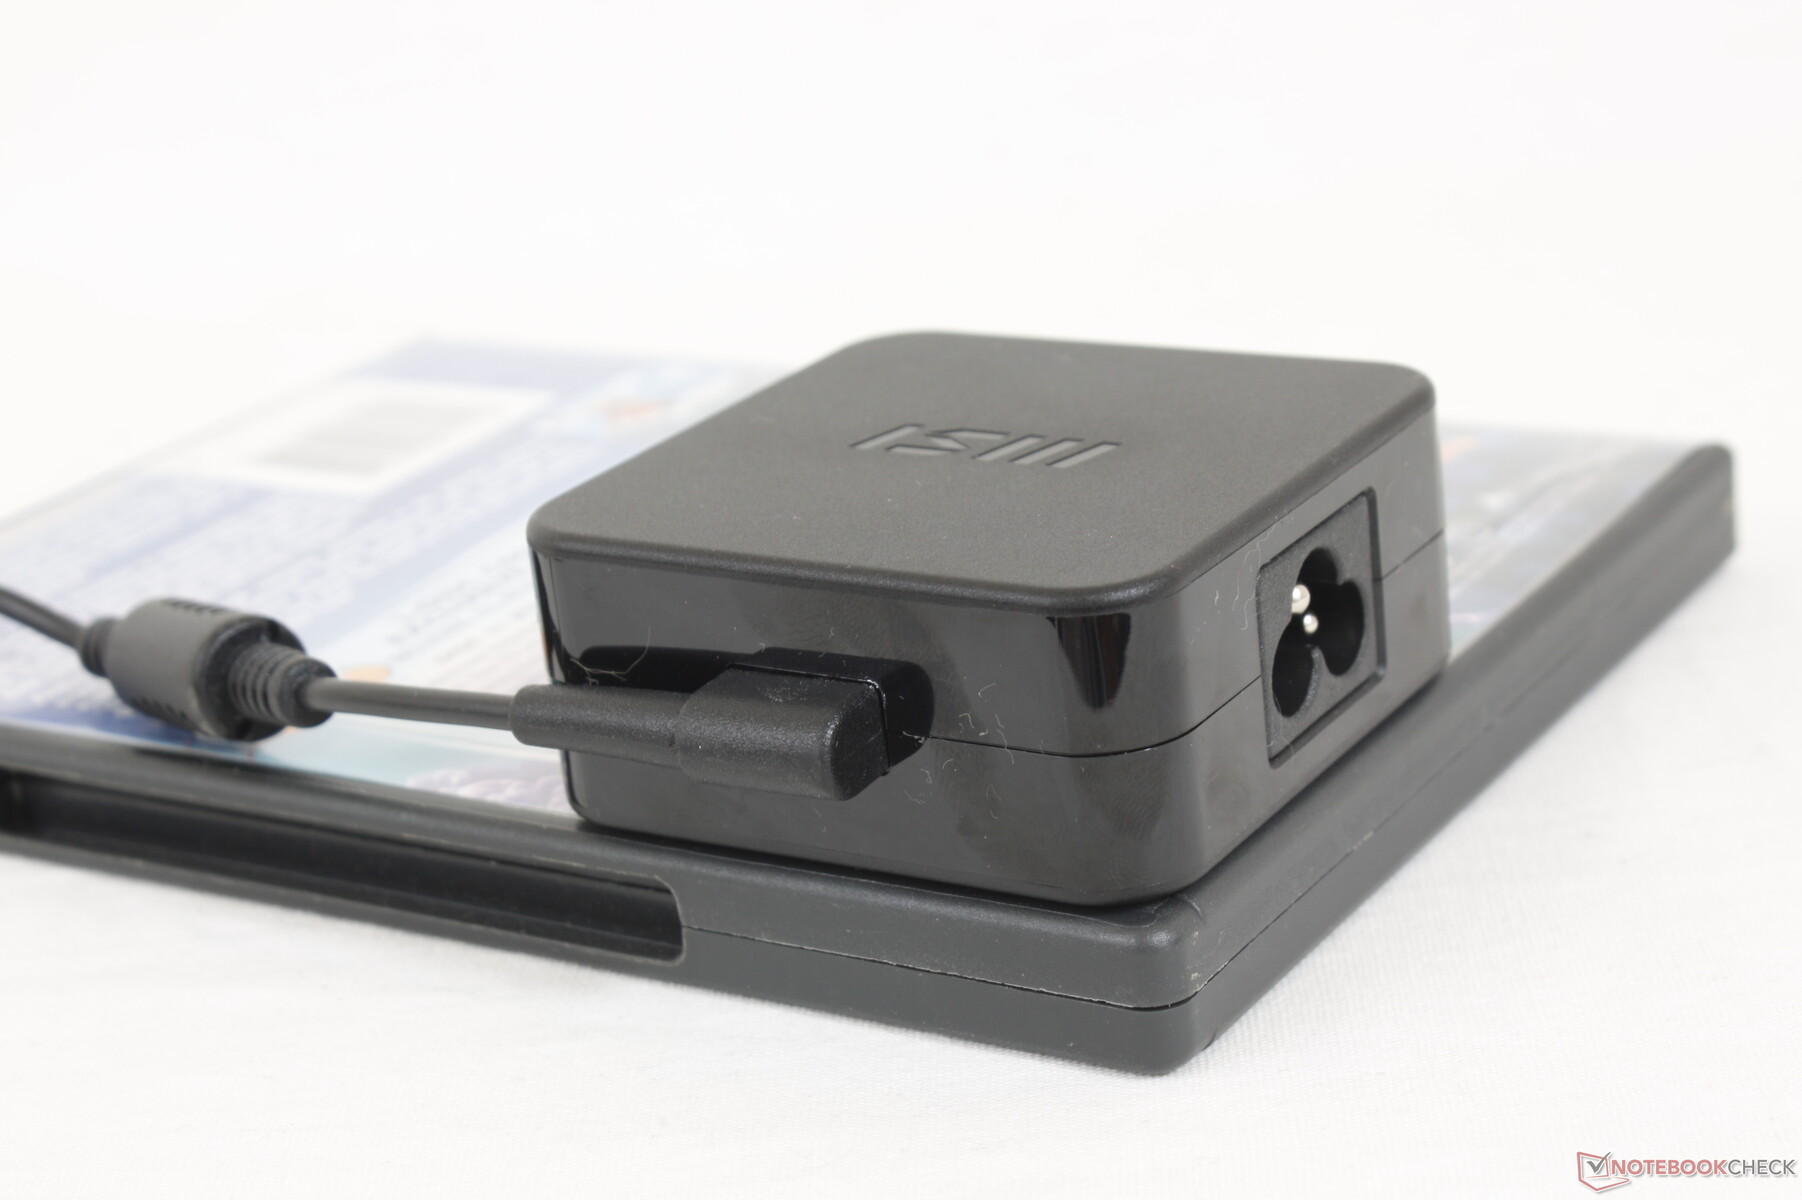
Podemos registrar un consumo máximo temporal de 67,5 W desde el pequeño (~6,5 x 6,5 x 2,8 cm) adaptador de CA de 65 W. El sistema puede incluso mantener un consumo aproximado de 60 a 63 W durante largos periodos de tiempo cuando está sometido a un estrés de procesamiento extremo, lo que demuestra que un adaptador de CA más capaz podría haber sido beneficioso.
| Off / Standby | |
| Ocioso | |
| Carga |
|
Clave:
min: | |
| MSI Summit B15 A11M i7-1165G7, Iris Xe G7 96EUs, Kingston OM8PCP31024F, IPS, 1920x1080, 15.6" | MSI Summit E15 A11SCST i7-1185G7, GeForce GTX 1650 Ti Max-Q, Phison 1TB SM2801T24GKBB4S-E162, IPS, 1920x1080, 15.6" | Dell XPS 15 9500 Core i5 i5-10300H, UHD Graphics 630, Toshiba KBG40ZNS256G NVMe, IPS, 1920x1200, 15.6" | HP Spectre X360 15-5ZV31AV i7-10510U, GeForce MX250, Intel SSD 660p 2TB SSDPEKNW020T8, IPS, 3840x2160, 15.6" | ADATA XPG Xenia Xe i7-1165G7, Iris Xe G7 96EUs, ADATA XPG Gammix S50 1TB, IPS, 1920x1080, 15.6" | Asus ZenBook 15 UX534FTC-A8190T i7-10510U, GeForce GTX 1650 Max-Q, Samsung SSD PM981 MZVLB1T0HALR, IPS, 1920x1080, 15.6" | |
|---|---|---|---|---|---|---|
| Power Consumption | -68% | -3% | -34% | 8% | -29% | |
| Idle Minimum * (Watt) | 4.2 | 6 -43% | 2.9 31% | 5.2 -24% | 2.7 36% | 2.8 33% |
| Idle Average * (Watt) | 7.7 | 10 -30% | 7.6 1% | 8.5 -10% | 5.3 31% | 7.7 -0% |
| Idle Maximum * (Watt) | 8.4 | 16 -90% | 8 5% | 8.7 -4% | 7.3 13% | 9.4 -12% |
| Load Average * (Watt) | 37.8 | 84 -122% | 41.7 -10% | 65.6 -74% | 43.6 -15% | 57 -51% |
| Witcher 3 ultra * (Watt) | 36.6 | 69 -89% | 56.5 -54% | 43.5 -19% | 62 -69% | |
| Load Maximum * (Watt) | 67.5 | 90 -33% | 94.8 -40% | 92.4 -37% | 66.8 1% | 116 -72% |
* ... más pequeño es mejor
Duración de la batería
La duración es decente, con unas 6,5 horas de uso real de la red WLAN, siendo varias horas menos que el Summit E15, más caro. La diferencia puede atribuirse a la menor capacidad de la batería, de sólo 52 W, frente a los 80 W del modelo mencionado.
Cargar el sistema de vacío a pleno rendimiento con el adaptador de barril de CA lleva unas 2 horas. El sistema también puede recargarse mediante adaptadores de CA USB-C de terceros. Sospechamos que los futuros modelos dejarán de lado el puerto de barril de CA propietario y cambiarán a la carga por USB-C únicamente.
| MSI Summit B15 A11M i7-1165G7, Iris Xe G7 96EUs, 52 Wh | MSI Summit E15 A11SCST i7-1185G7, GeForce GTX 1650 Ti Max-Q, 80.25 Wh | Dell XPS 15 9500 Core i5 i5-10300H, UHD Graphics 630, 56 Wh | HP Spectre X360 15-5ZV31AV i7-10510U, GeForce MX250, 84 Wh | ADATA XPG Xenia Xe i7-1165G7, Iris Xe G7 96EUs, 73.41 Wh | Asus ZenBook 15 UX534FTC-A8190T i7-10510U, GeForce GTX 1650 Max-Q, 71 Wh | |
|---|---|---|---|---|---|---|
| Duración de Batería | 41% | 48% | 92% | 77% | 92% | |
| Reader / Idle (h) | 18.4 | 19.5 6% | 26.4 43% | 22.6 23% | 27.2 48% | |
| WiFi v1.3 (h) | 6.6 | 9.1 38% | 9.3 41% | 10.8 64% | 11.7 77% | 12.4 88% |
| Load (h) | 1 | 1.8 80% | 1.6 60% | 2.9 190% | 2.4 140% |
Pro
Contra
Veredicto

¿Vale la pena comprar el MSI Summit B15 en lugar del antiguo Modern 15 aunque ambos sean portátiles muy similares? Si valoras el Thunderbolt 4, un procesador más rápido y un ruido de ventilador generalmente más silencioso, entonces el nuevo Summit B15 puede merecer la pena. Su rendimiento bruto es impresionante para un factor de forma tan ligero de 15,6 pulgadas y los usuarios siempre pueden conectar GPUs y monitores externos para obtener gráficos más rápidos y mejores colores, respectivamente.
A los viajeros les encantará el peso superligero, los ventiladores silenciosos y el alto rendimiento en comparación con los populares Ultrabooks de 15.6 pulgadas como el XPS 15, el Spectre x360 15 o el Lenovo IdeaPad 15. Sin embargo, para un portátil de más de 1000 dólares, la rigidez del chasis no es tan fuerte como nos gustaría.
Si tus cargas de trabajo consisten principalmente en navegación web básica, streaming de vídeo, juegos ligeros o edición mínima, entonces el Modern 15 con gráficos GeForce MX será más que suficiente mientras que cuesta cientos de dólares menos. Hay que tener en cuenta que los dos portátiles ofrecen la misma experiencia en cuanto a pantalla, teclado, clickpad y calidad del chasis. Sin embargo, perderás las lucrativas capacidades de acoplamiento de Thunderbolt.
Precio y disponibilidad
MSI Summit B15 A11M
- 05/20/2021 v7 (old)
Allen Ngo
Price comparison

