
Veredicto
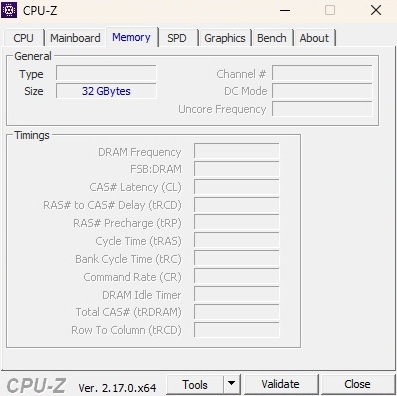
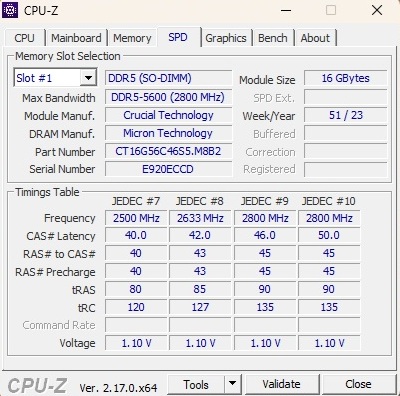
Si busca un portátil actual para juegos en el rango de los 1.000 euros, el T6 V3.5 de Tulpar Notebook puede ser una buena opción. Con la GeForce RTX 5060, el modelo de 16 pulgadas ofrece una sólida GPU de gama media emparejada con un rápido Core i7-14700HX (que, sin embargo, pierde algo de rendimiento bajo carga sostenida). Nuestra unidad de pruebas también incluía 32 GB de RAM DDR5 (2×16 GB) y una unidad SSD NVMe de 1 TB.
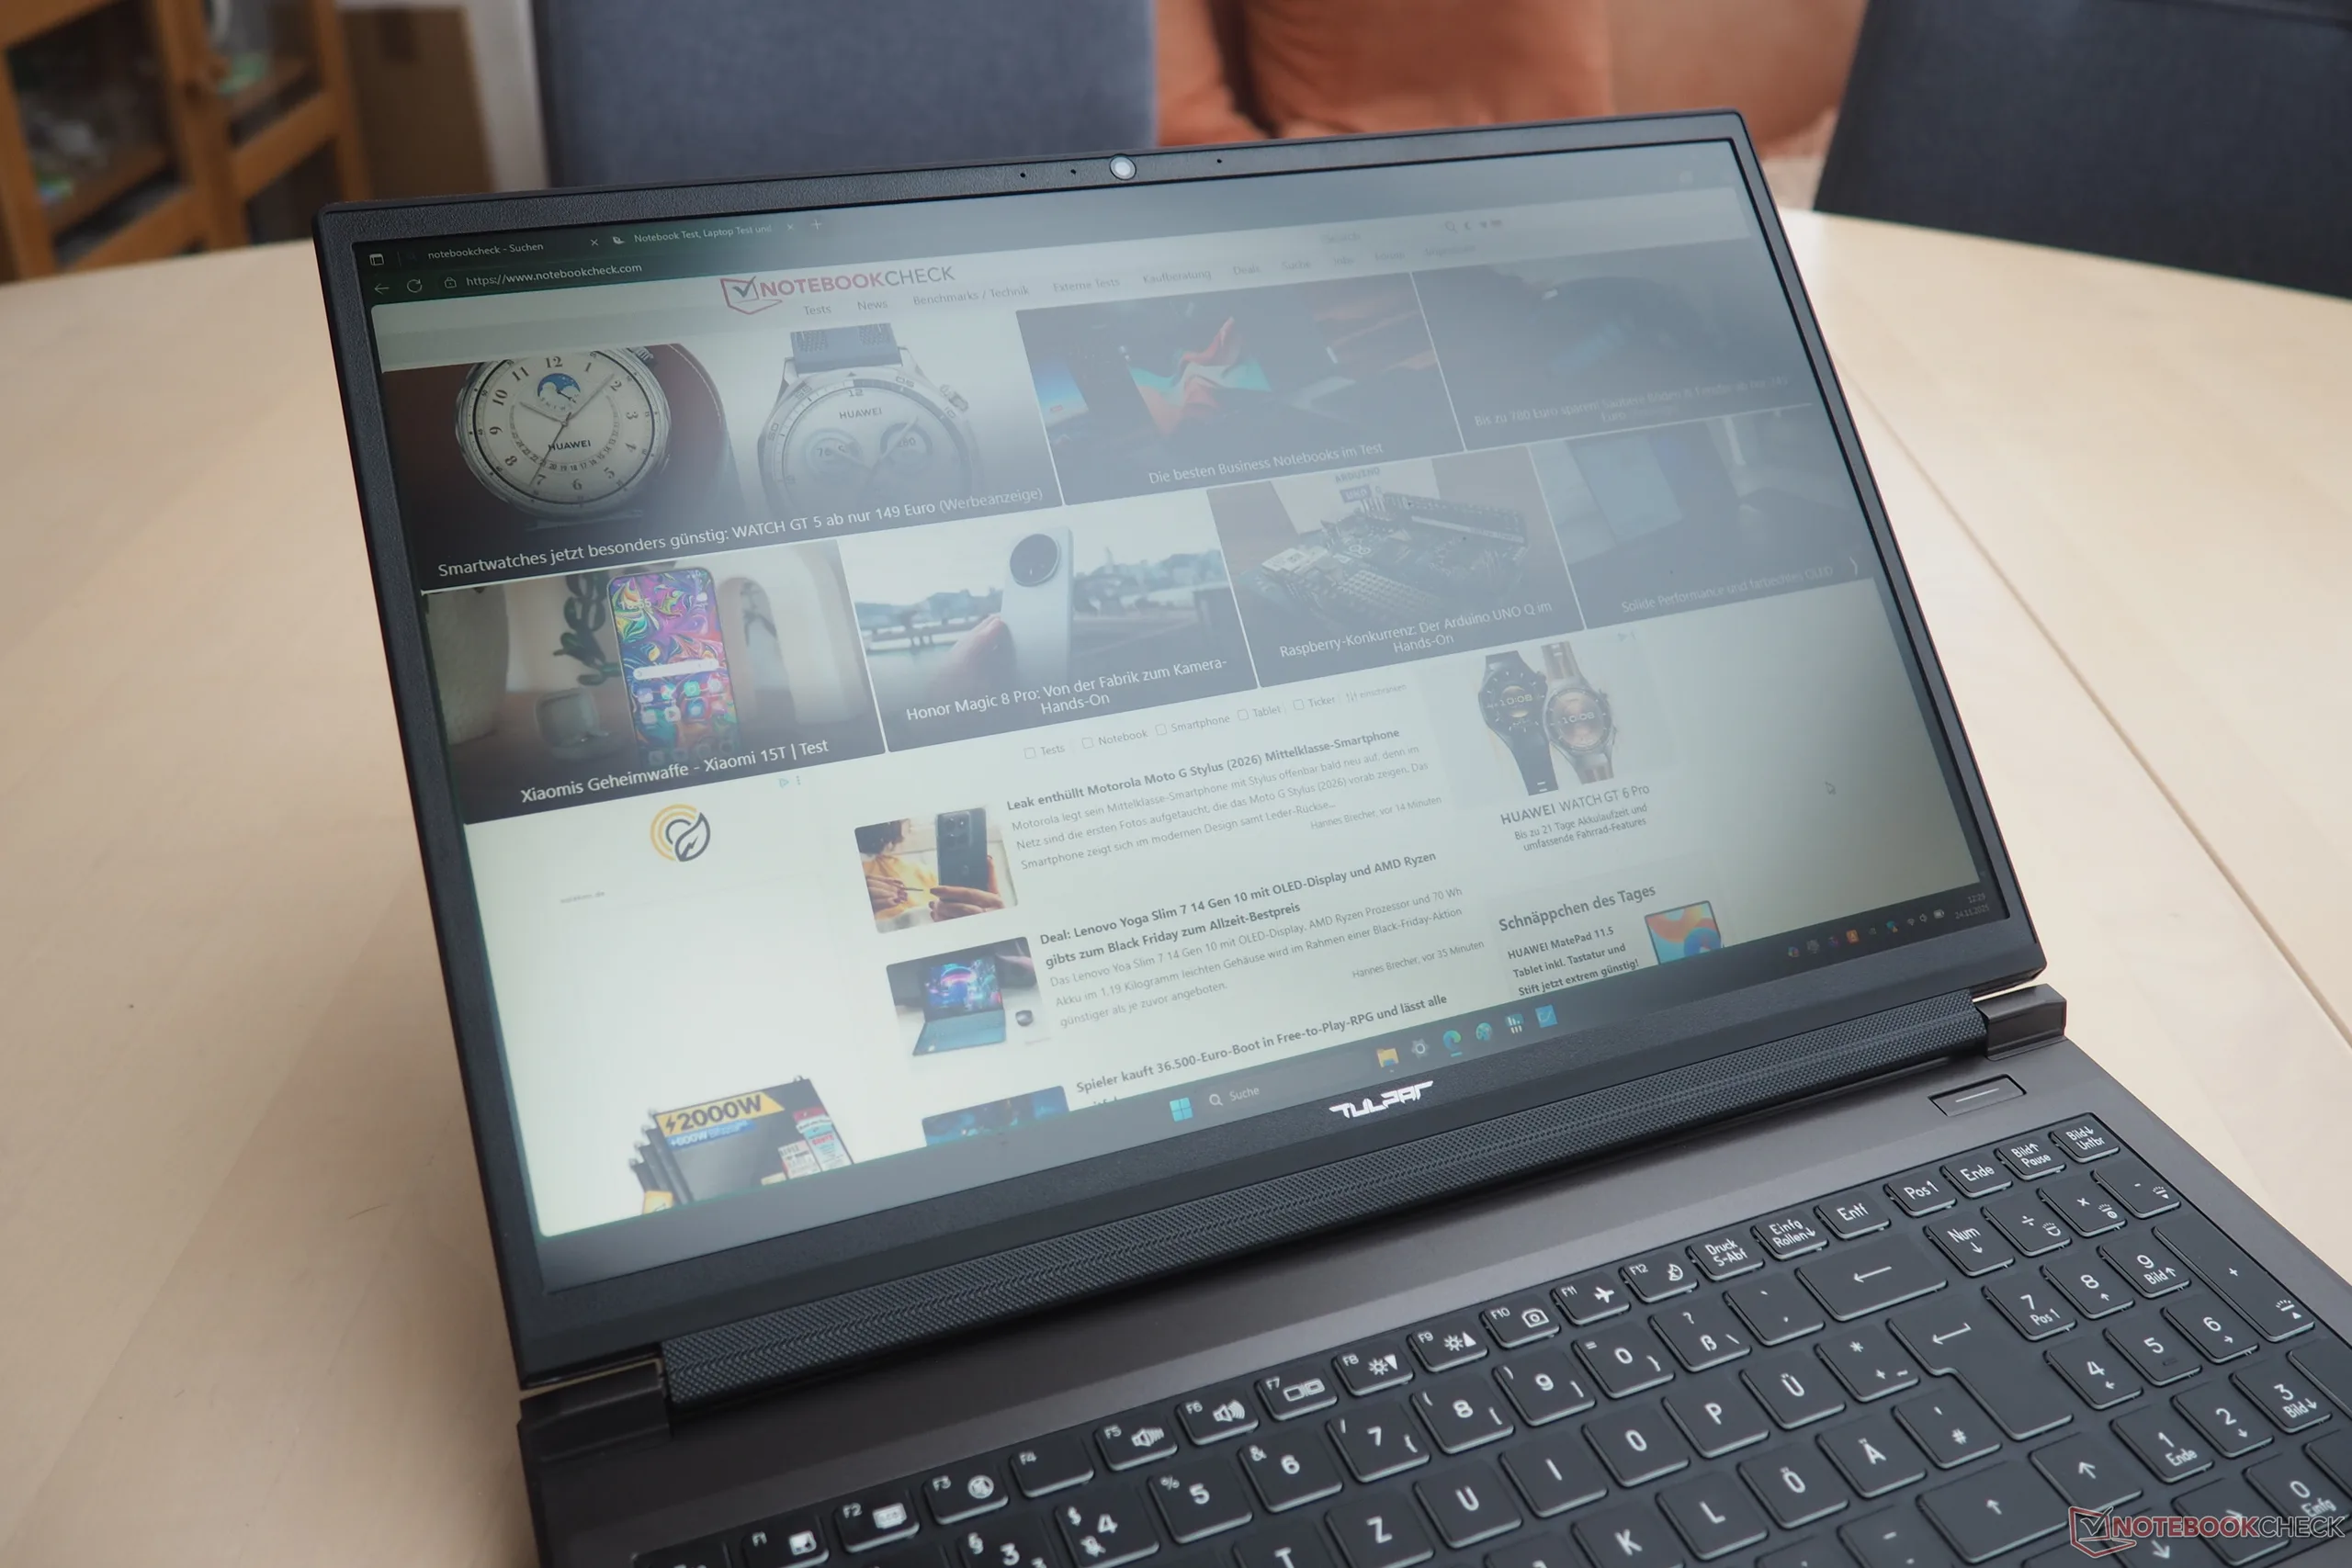
Los compradores pueden esperar lo normal en lo que se refiere a la carcasa. El chasis es totalmente de plástico y tiene un diseño más bien discreto. También hay margen de mejora en términos de conectividad (sin lector de tarjetas ni USB4). La pantalla cumple las expectativas para este segmento de precio. El panel basado en IPS de 165 Hz (1.920 × 1.200 píxeles) ofrece un brillo utilizable y una cobertura del espacio de color bastante buena, algo de lo que no pueden presumir todos los competidores (hablaremos de ello más adelante). Las emisiones, incluidos los niveles de temperatura y ruido, están en general en línea con otros portátiles para juegos, aunque el control del ventilador podría ser mejor.
En general, el Tulpar T6 V3.5 sigue siendo competitivo con marcas más conocidas, por lo que merece la pena tenerlo en cuenta.
Pro
Contra
Precio y disponibilidad
El Tulpar T6 V3.5 está disponible actualmente a partir de unos 1.160 euros (unos 1.345 dólares) en la página web del fabricante.
Nota del traductor: Los portátiles de Monster aún no están disponibles oficialmente en Norteamérica.
Entre los competidores del Tulpar T6 V3.5 se incluyen el Acer Nitro V 16 AIel Alienware 16 Aurora y el HP Omen 16, todos ellos también a un precio razonable. El ligeramente más caro Gigabyte Gaming A16 con una RTX 5070 y el actual modelo de referencia RTX 5060, el Lenovo Legion 5, también aparecen en nuestras tablas comparativas.
Especificaciones
Caso
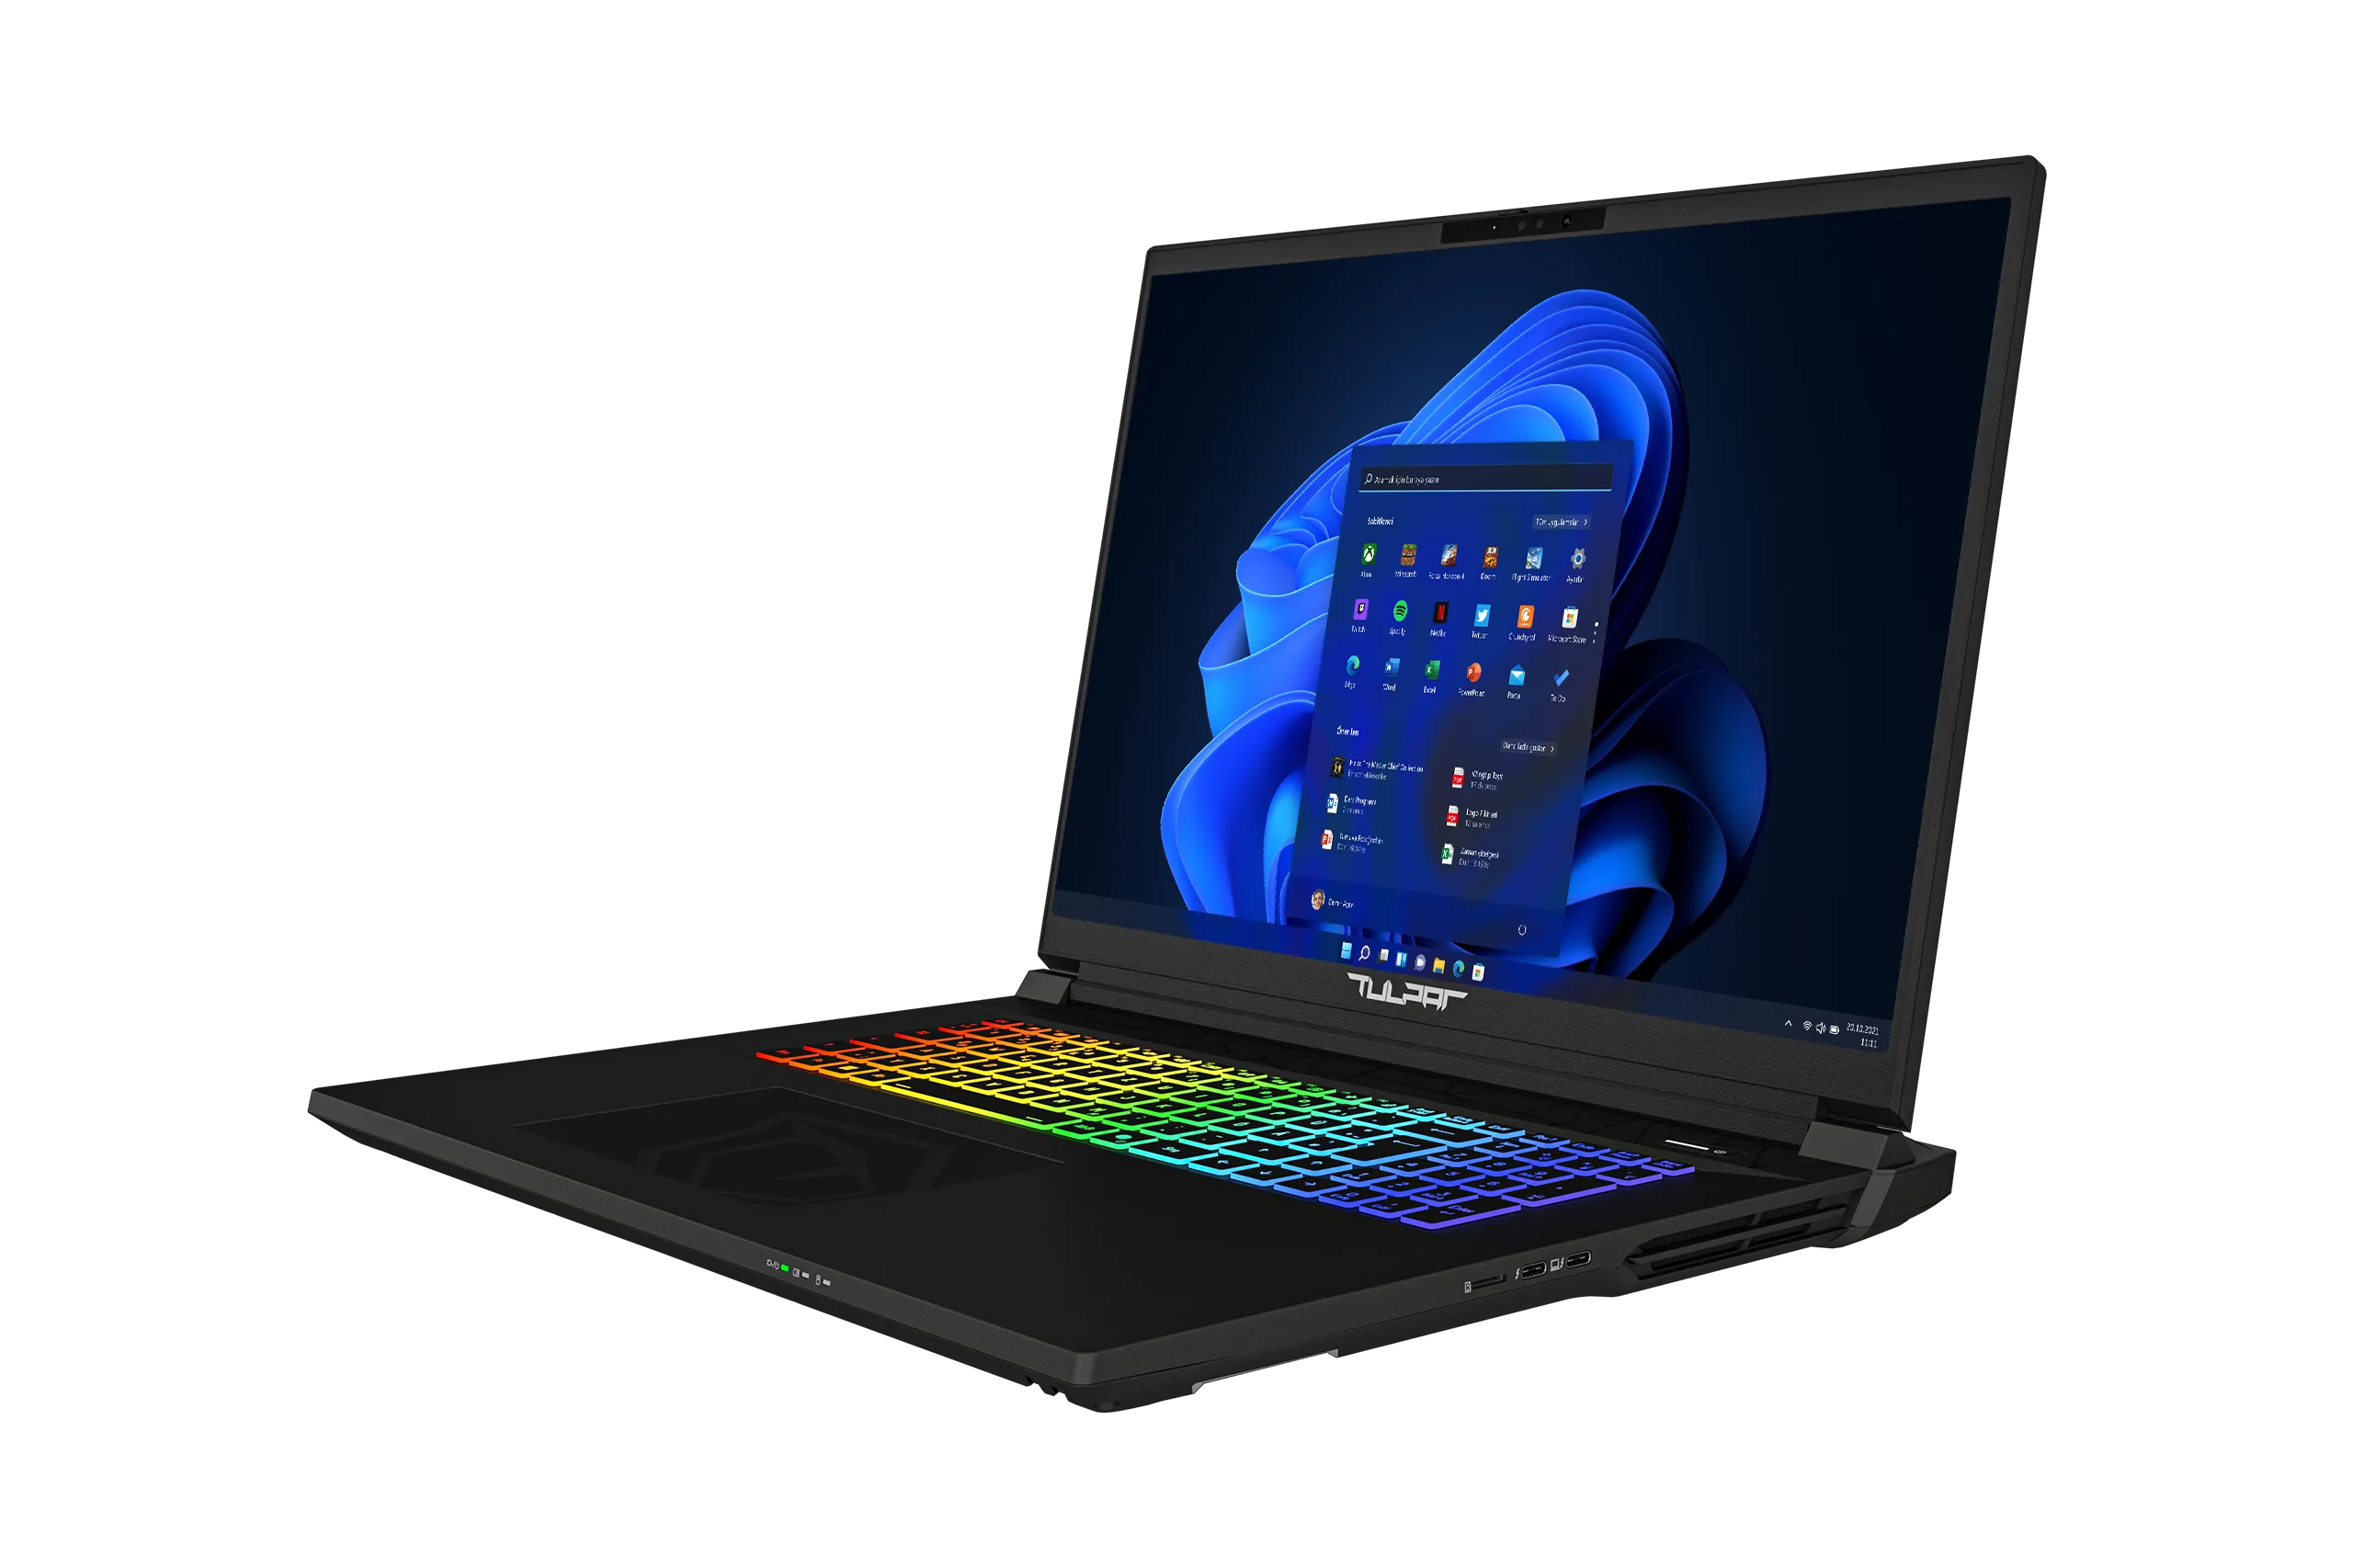
La carcasa de plástico ofrece una estabilidad más que decente y está pulcramente acabada en la mayoría de las zonas. Las bisagras funcionan discretamente en su mayor parte, aunque el ángulo máximo de apertura de aproximadamente 135° no es especialmente generoso. Las superficies de color gris oscuro dan al portátil un aspecto bastante discreto siempre que la retroiluminación del teclado esté apagada.
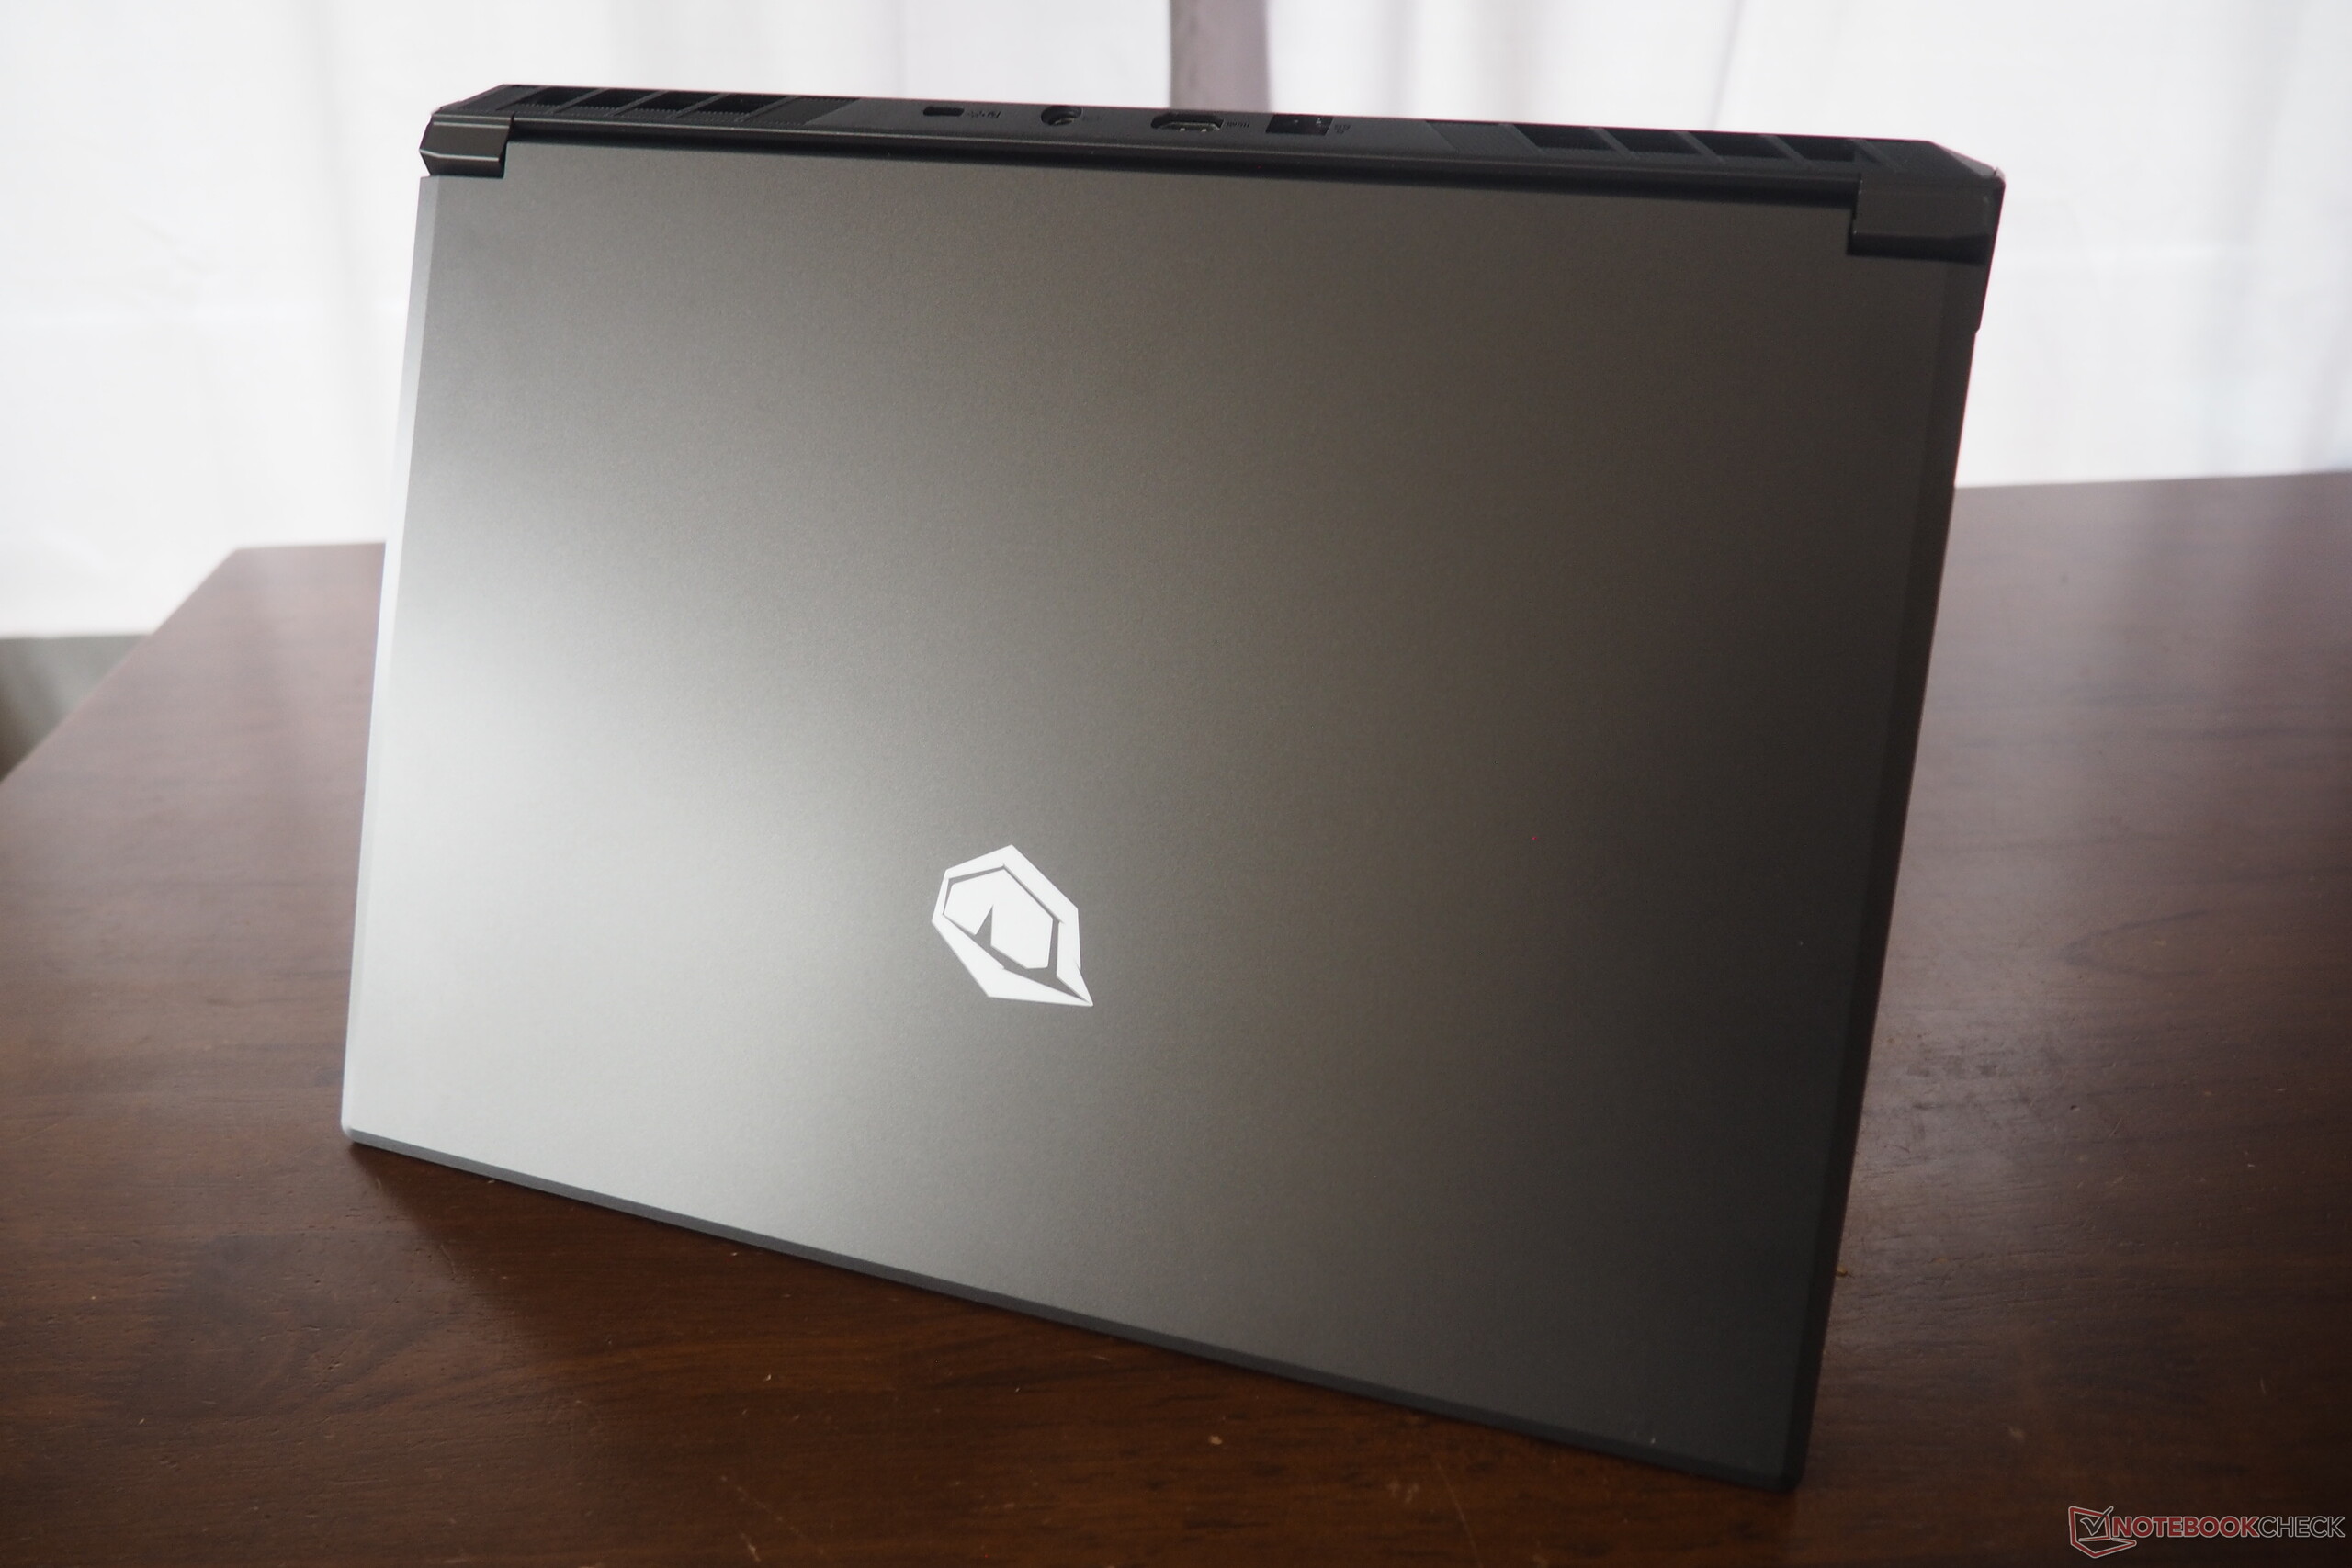
Con un peso de 2,4 kg, el T6 V3.5 está justo en línea con otros competidores de 16 pulgadas, que oscilan entre los 2,3 y los 2,6 kg, aparte del más ligero Legion 5. Su grosor de 2,5 cm también es típico de esta clase.
Equipamiento
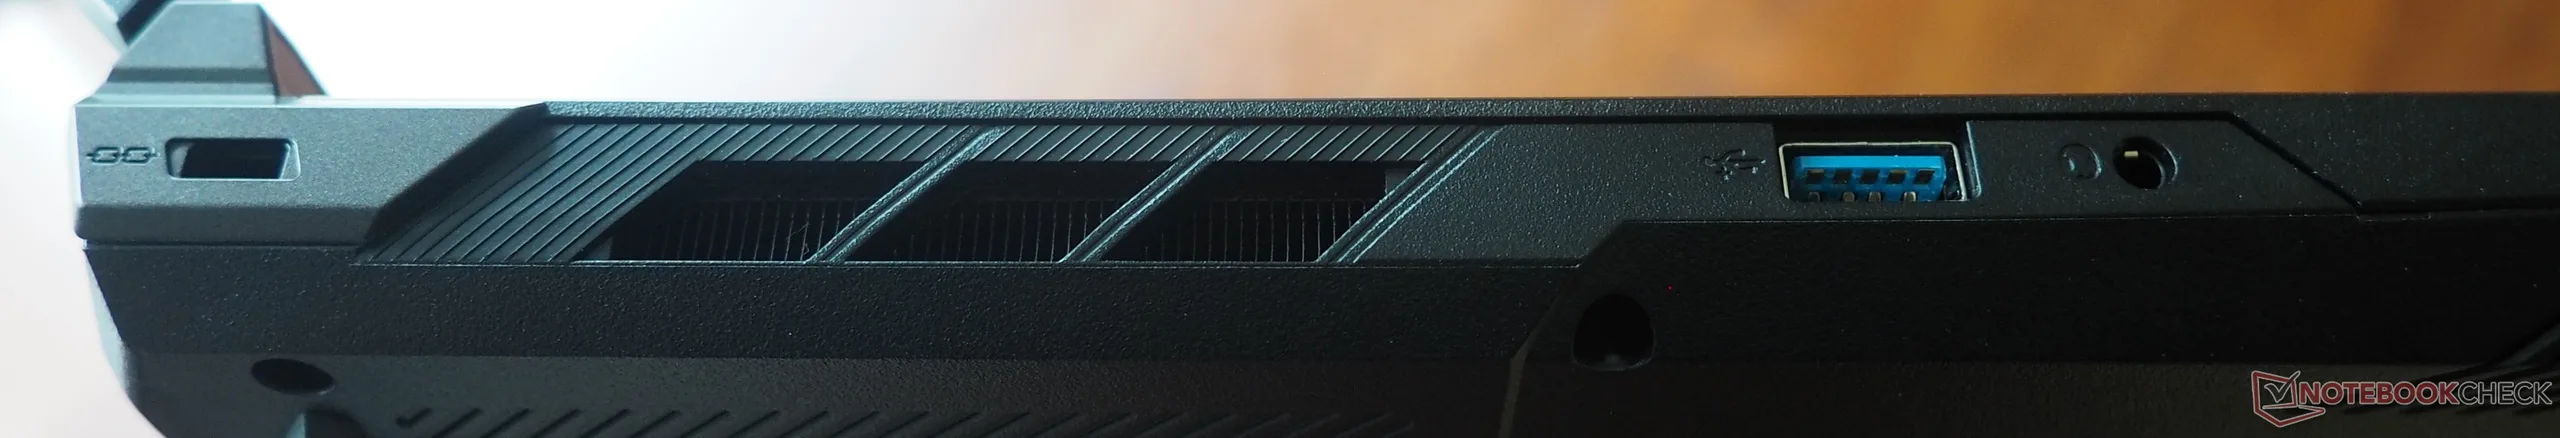
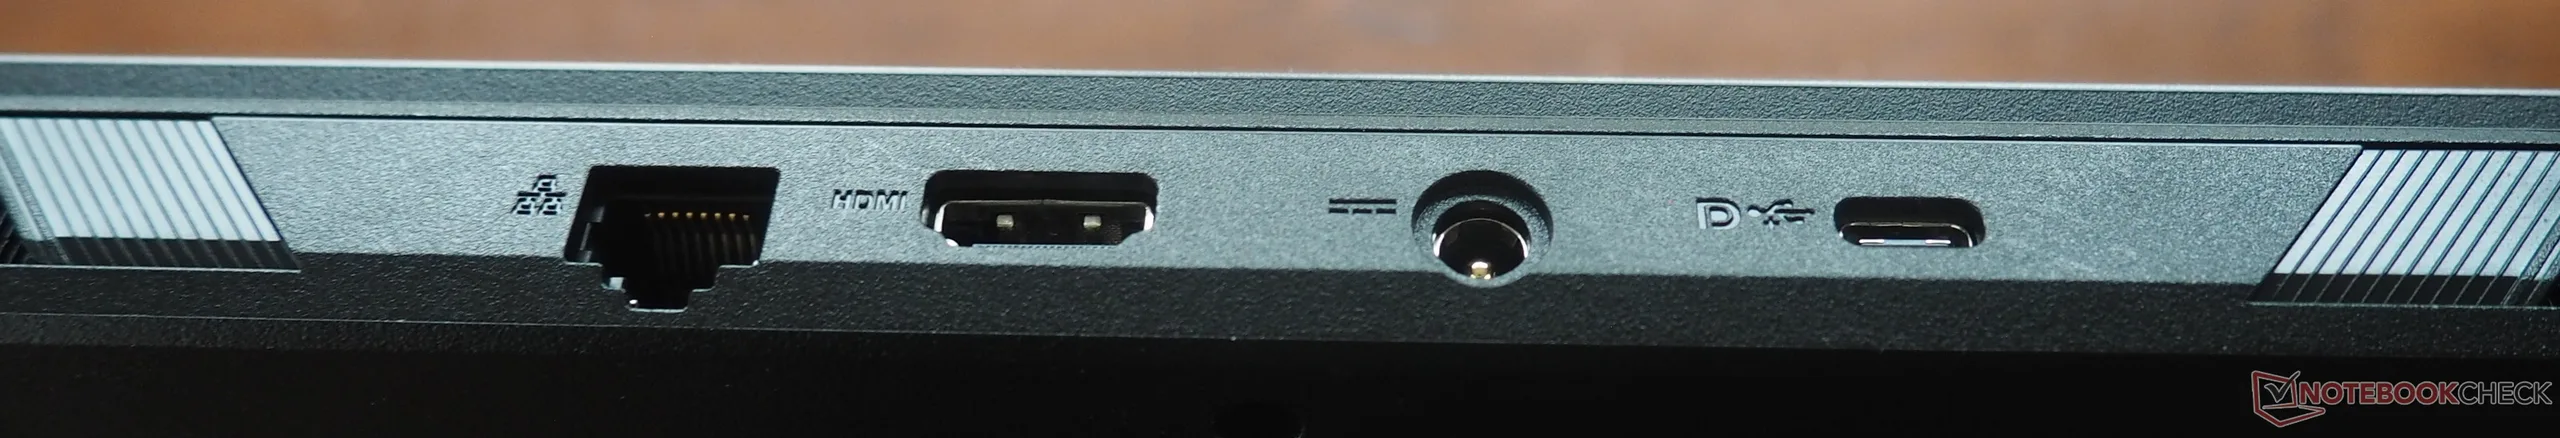
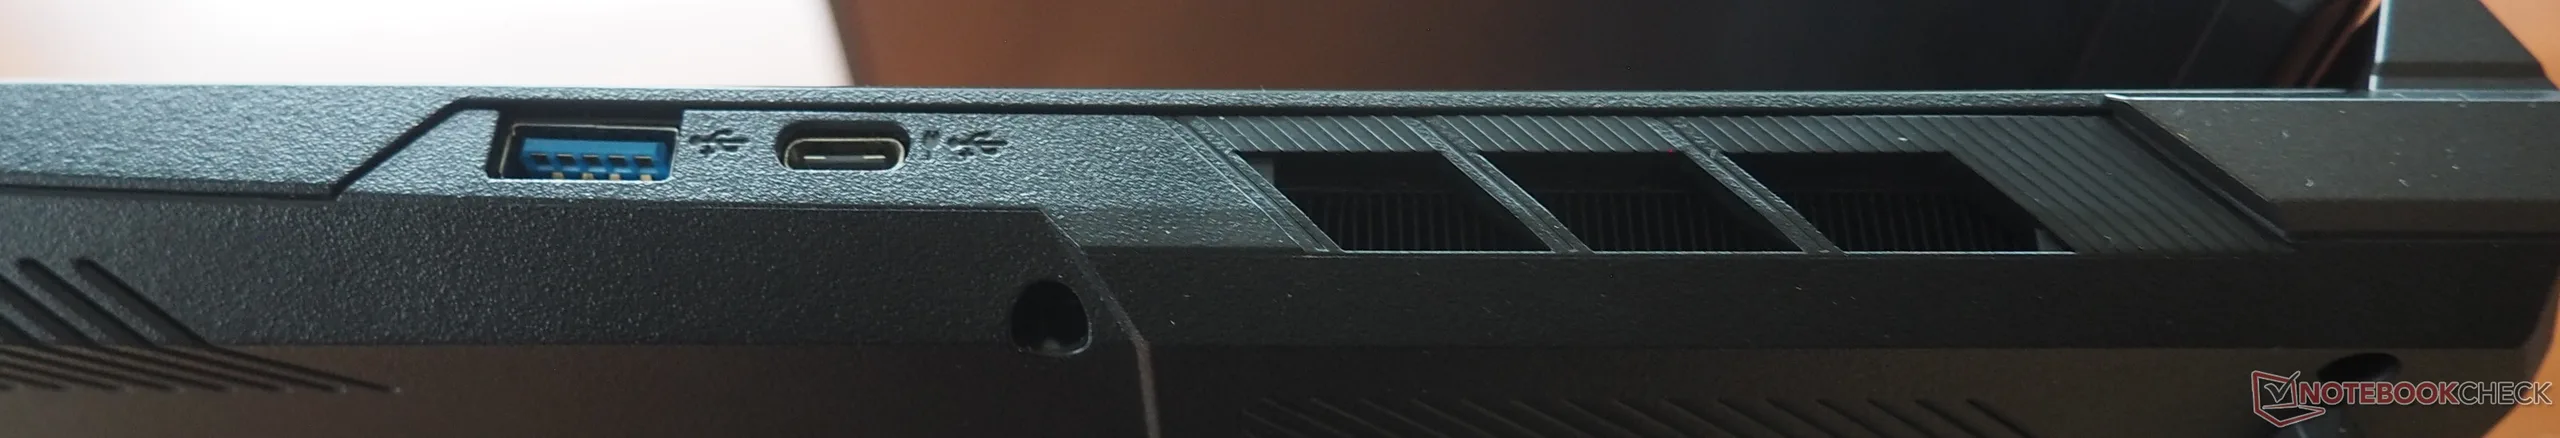
Conexiones
Los puertos están repartidos por casi todos los lados del chasis. Aunque carece de USB 4 o Thunderbolt, el sistema sigue ofreciendo cuatro puertos USB (dos Tipo-A y dos Tipo-C). Las pantallas externas se conectan más fácilmente a través de HDMI. También se incluyen un puerto LAN Gigabit, una toma de auriculares y una ranura para bloqueo Kensington.
Comunicación
El módulo inalámbrico integrado es una opción más rápida. El AX211 Wi-Fi 6E de Intel ofrece un rendimiento de sólido a excelente tanto en las pruebas de transmisión como de recepción.
Cámara web
La calidad de imagen de la cámara web es menos impresionante, a la que -como a muchos portátiles- le habría venido bien una resolución más alta.


Accesorios
El portátil viene con unos folletos informativos, un paño de limpieza y una fuente de alimentación mediana de 230 vatios.
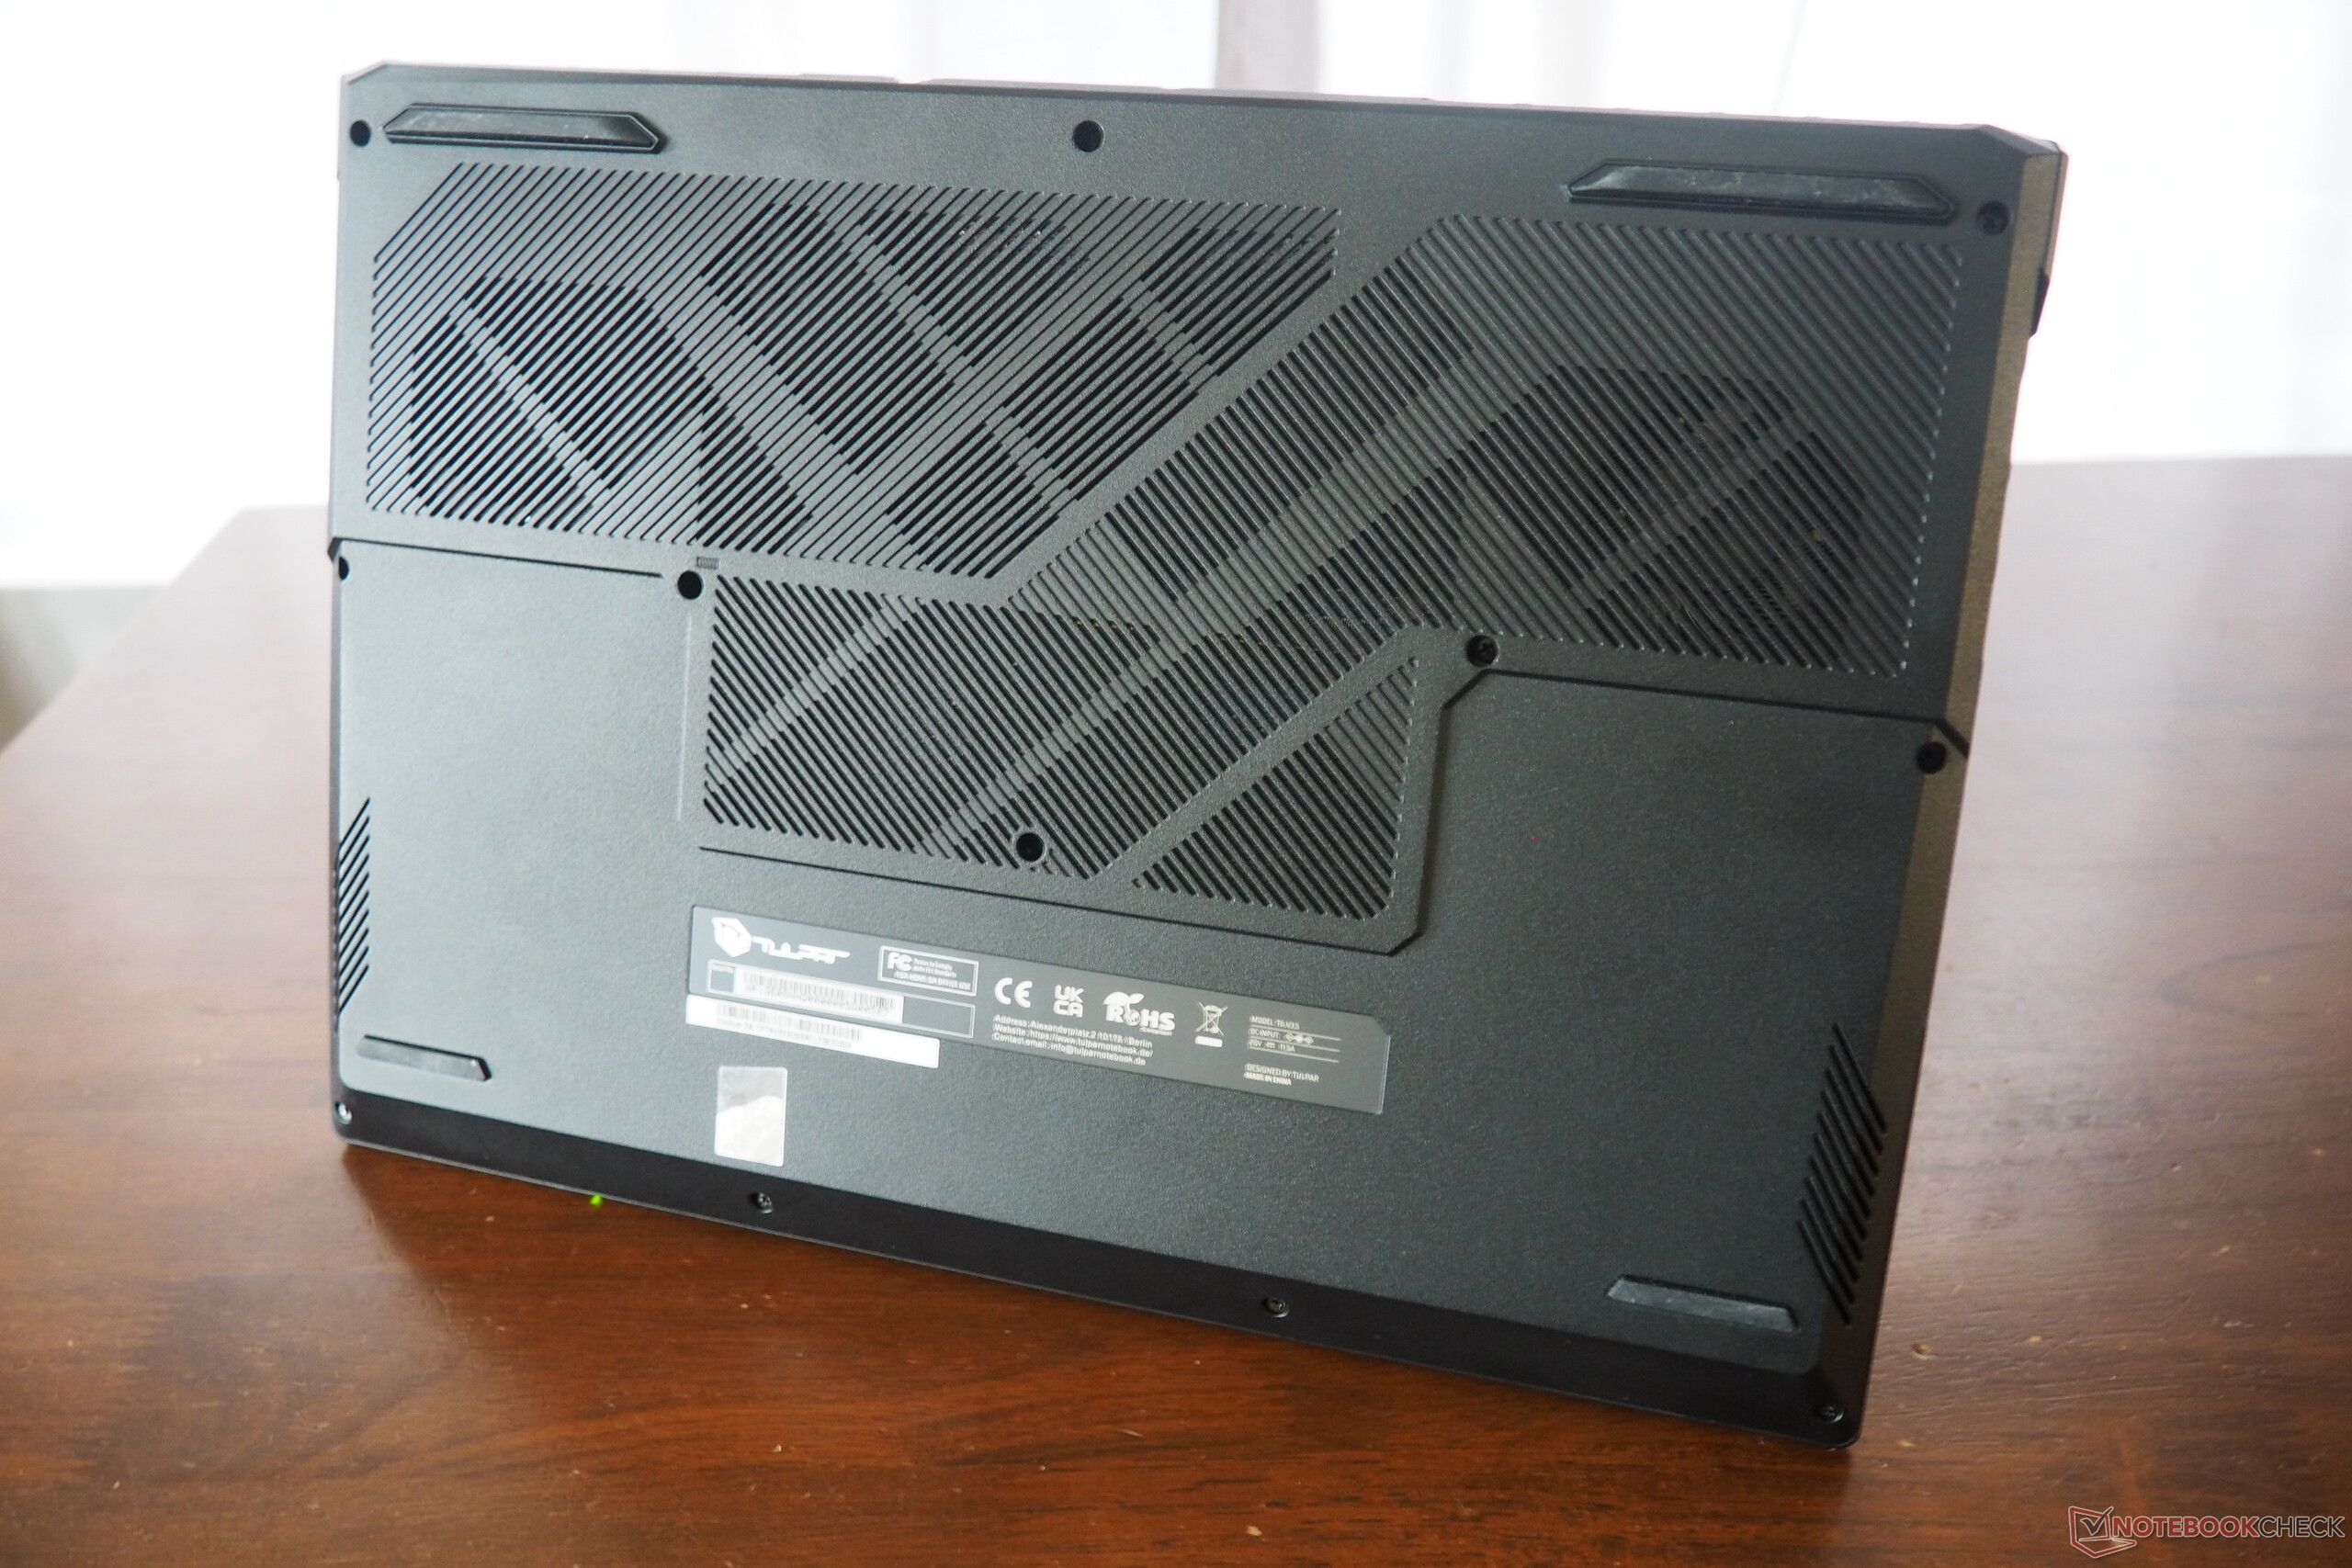
Mantenimiento
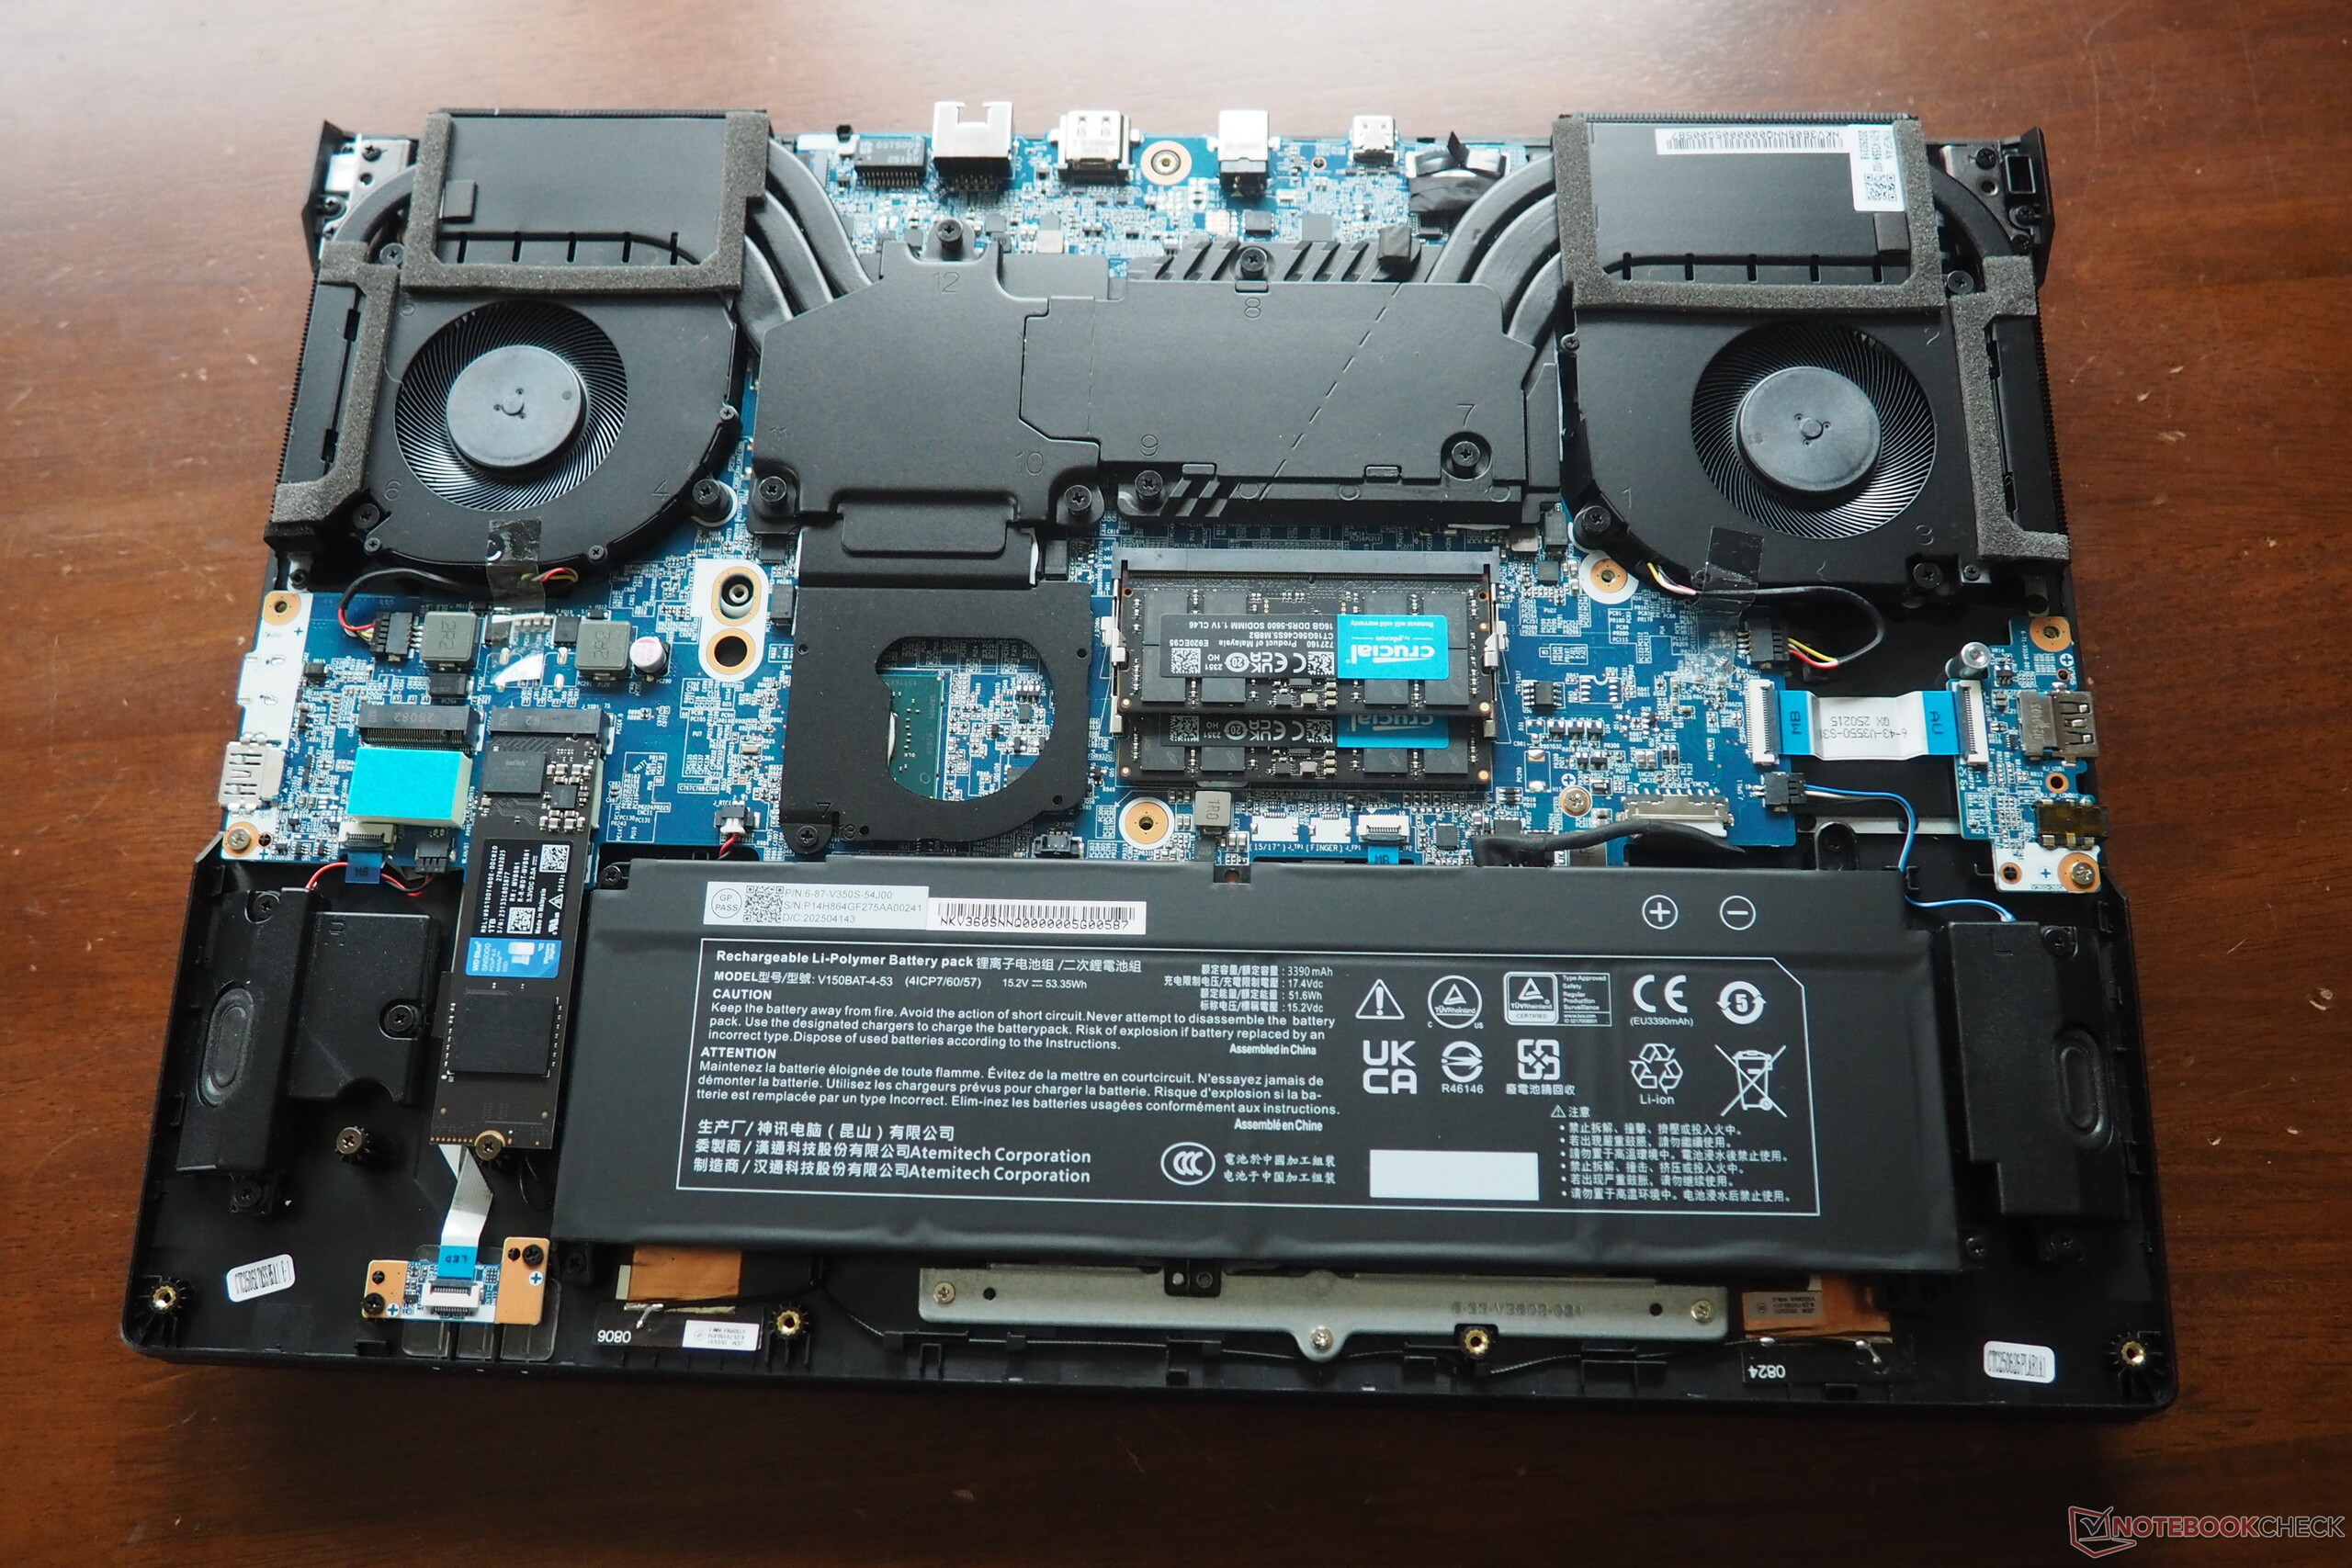
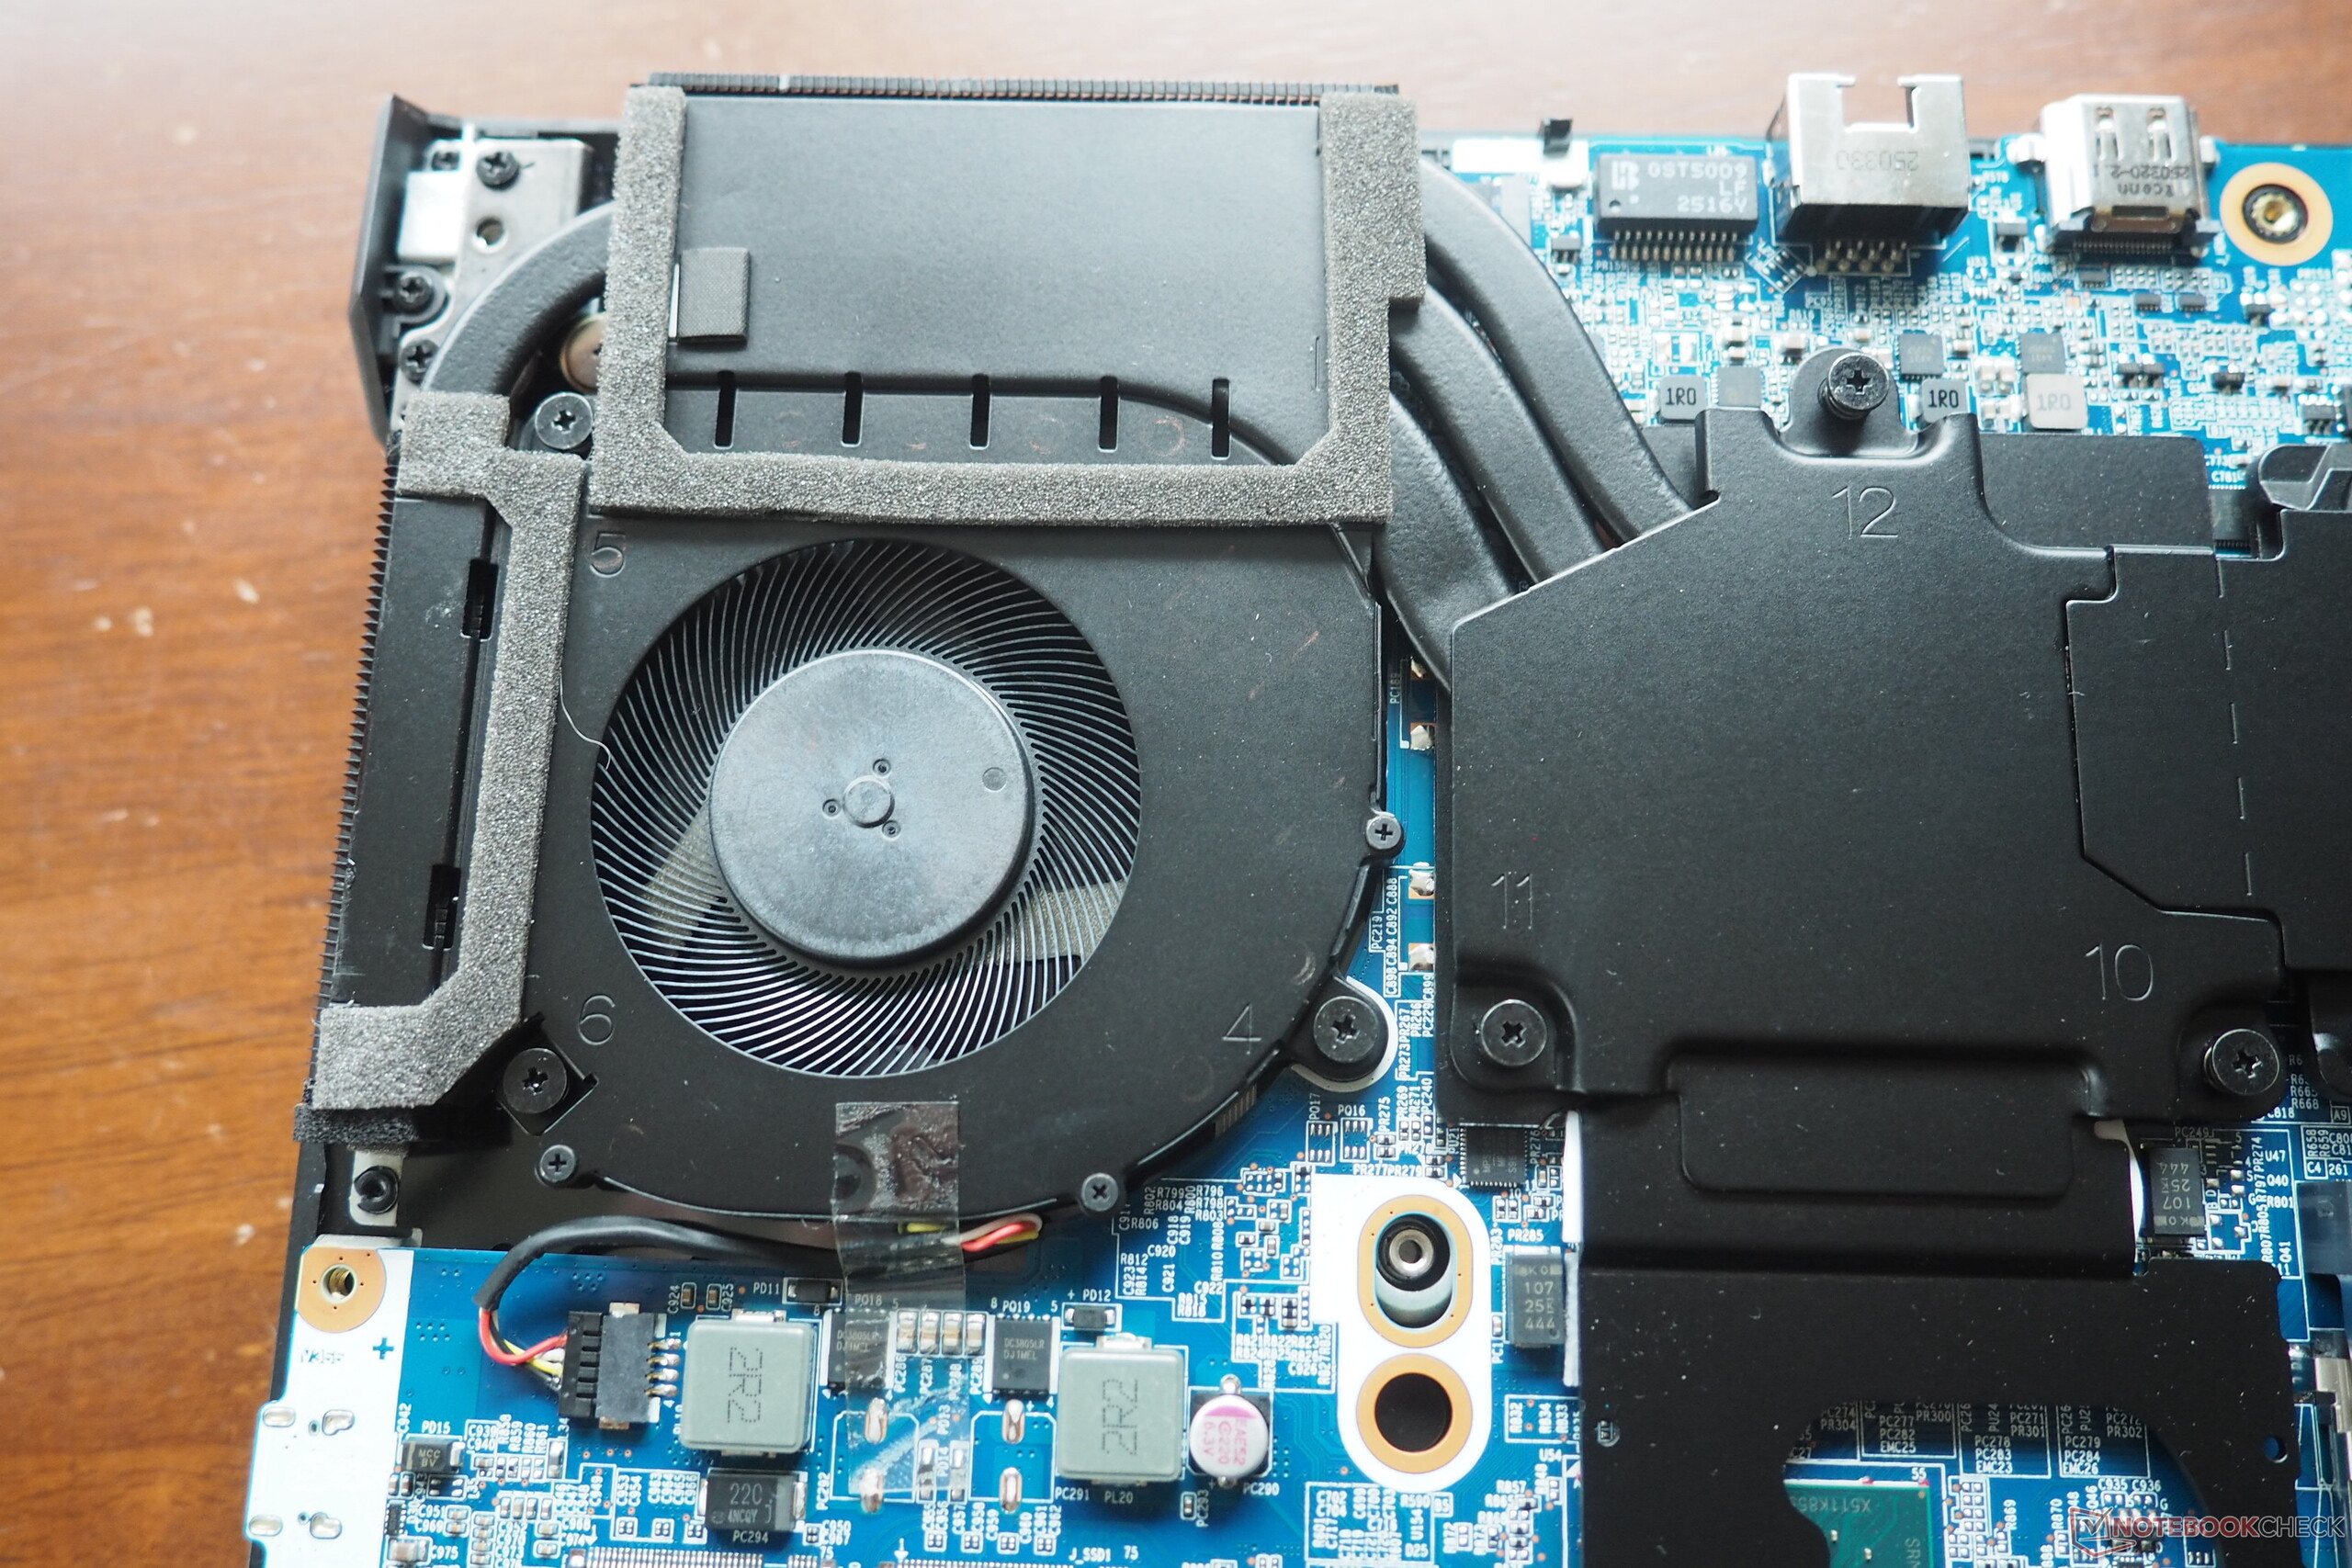
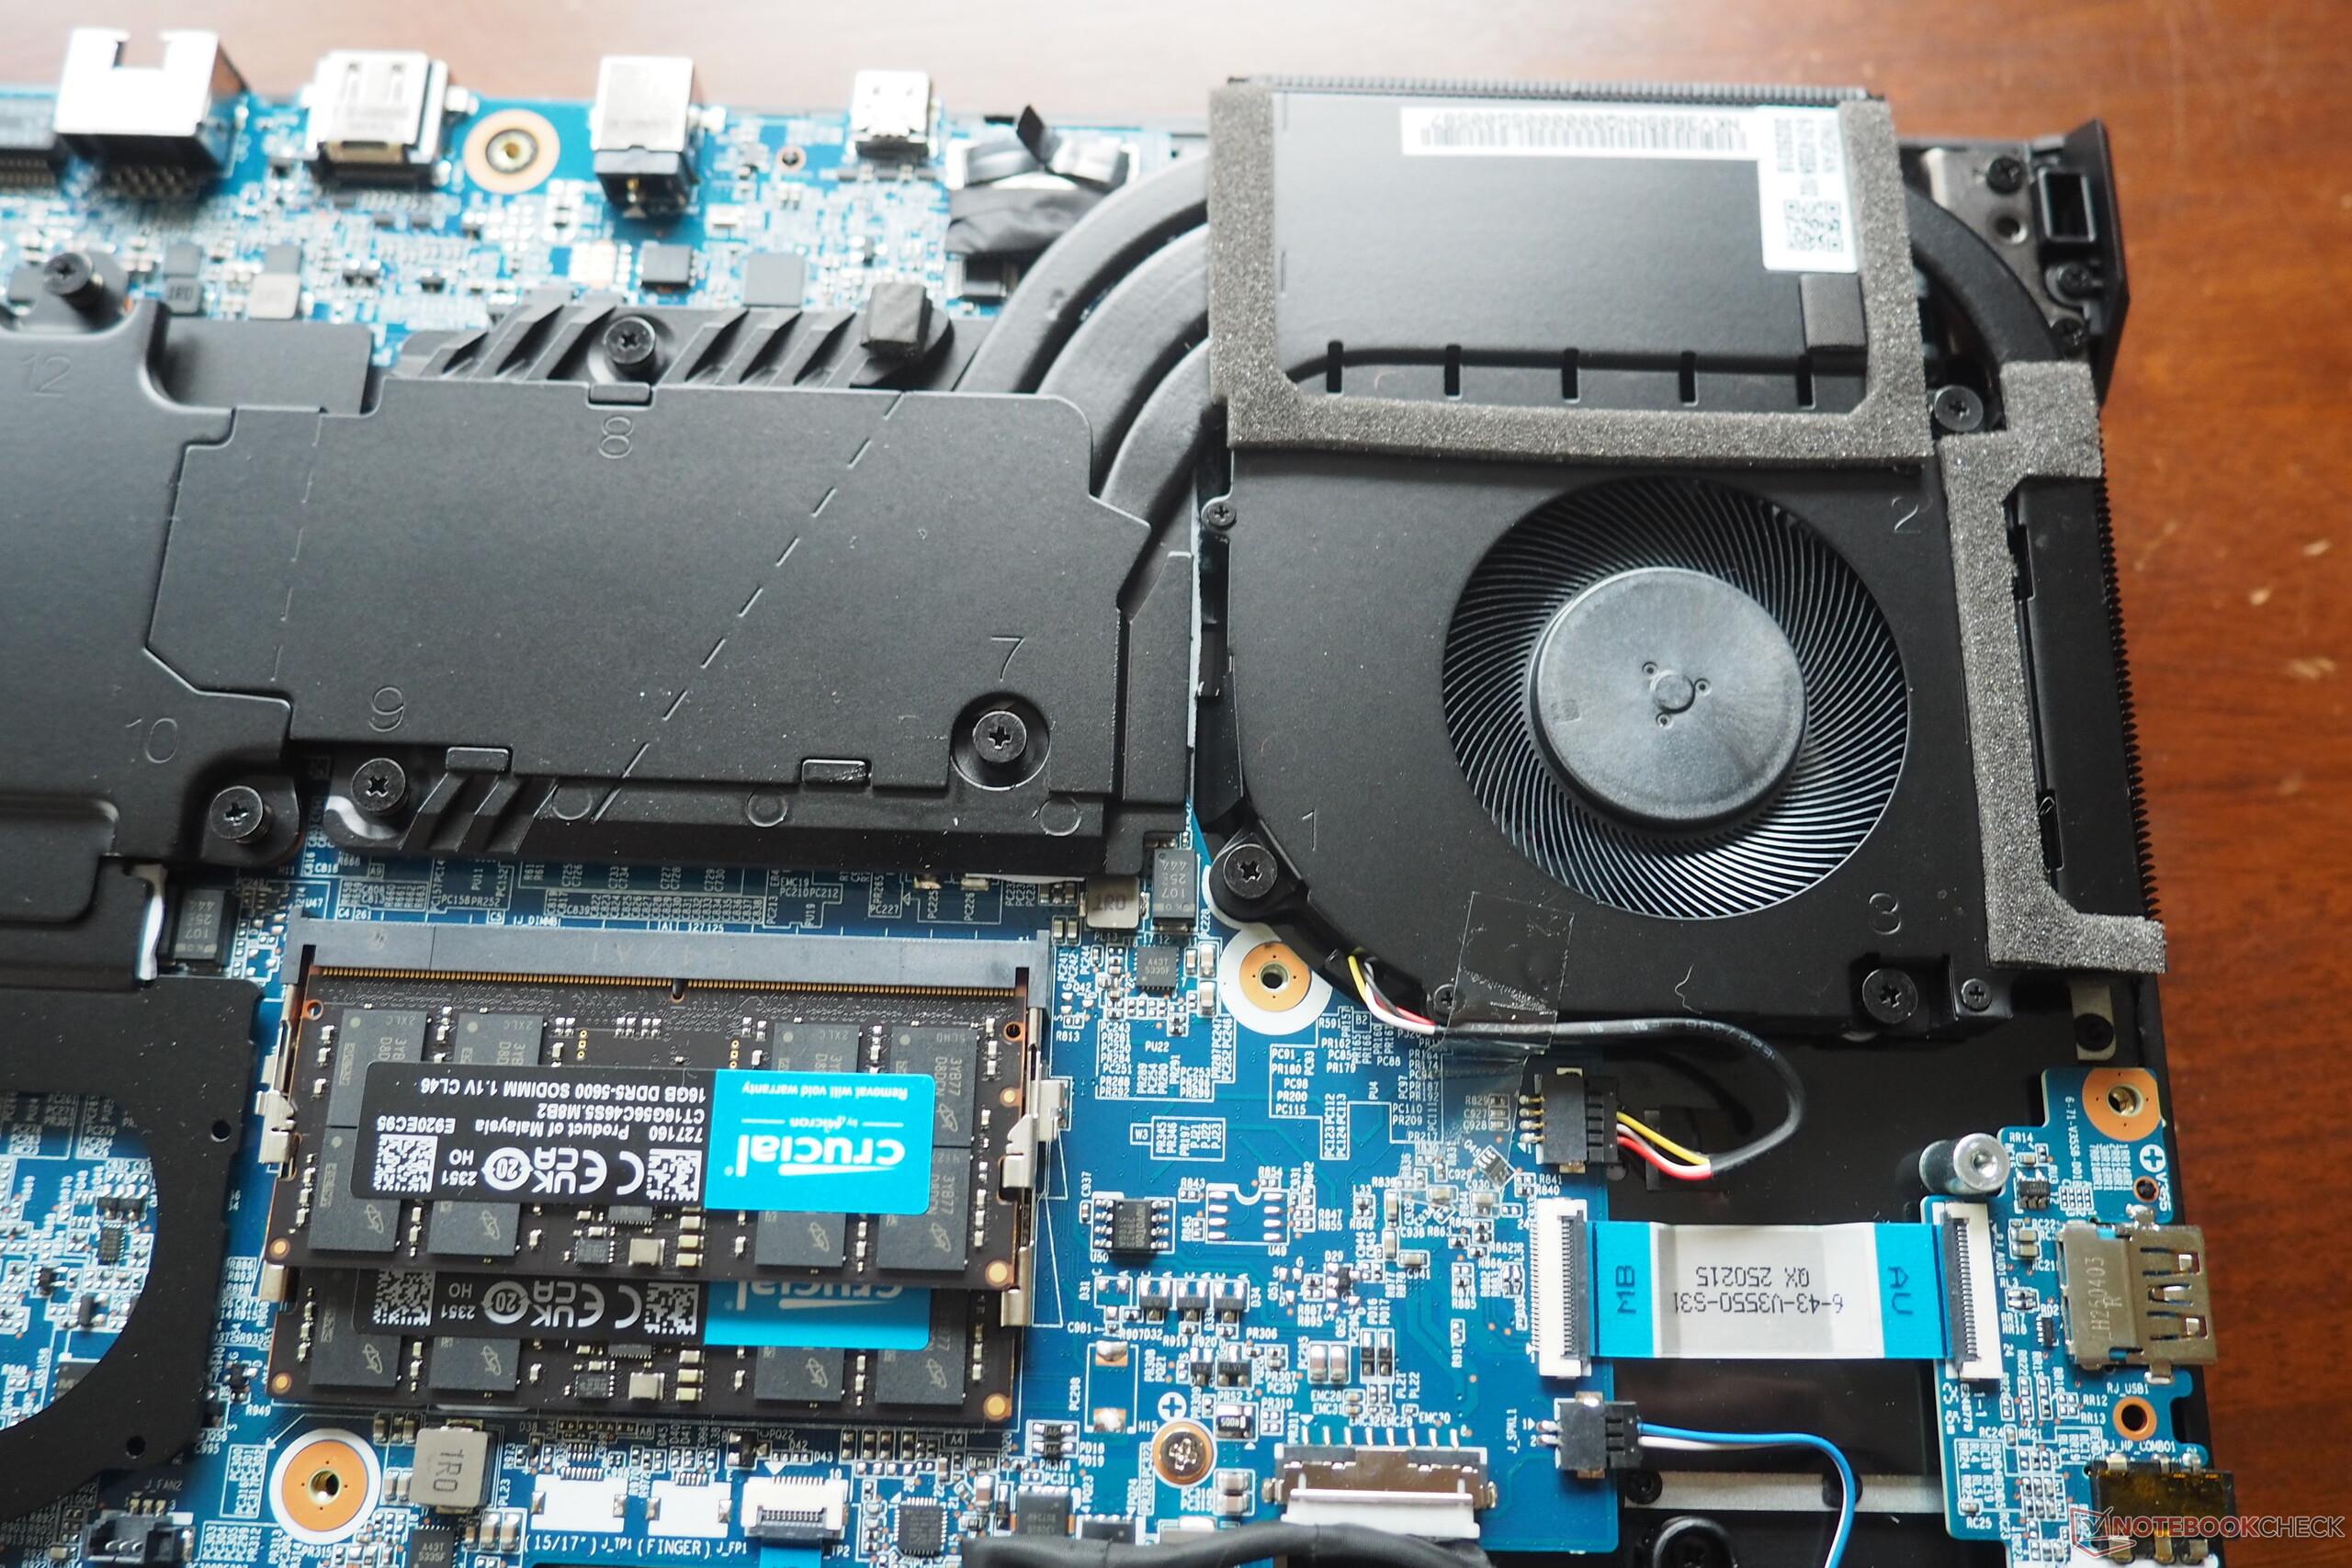
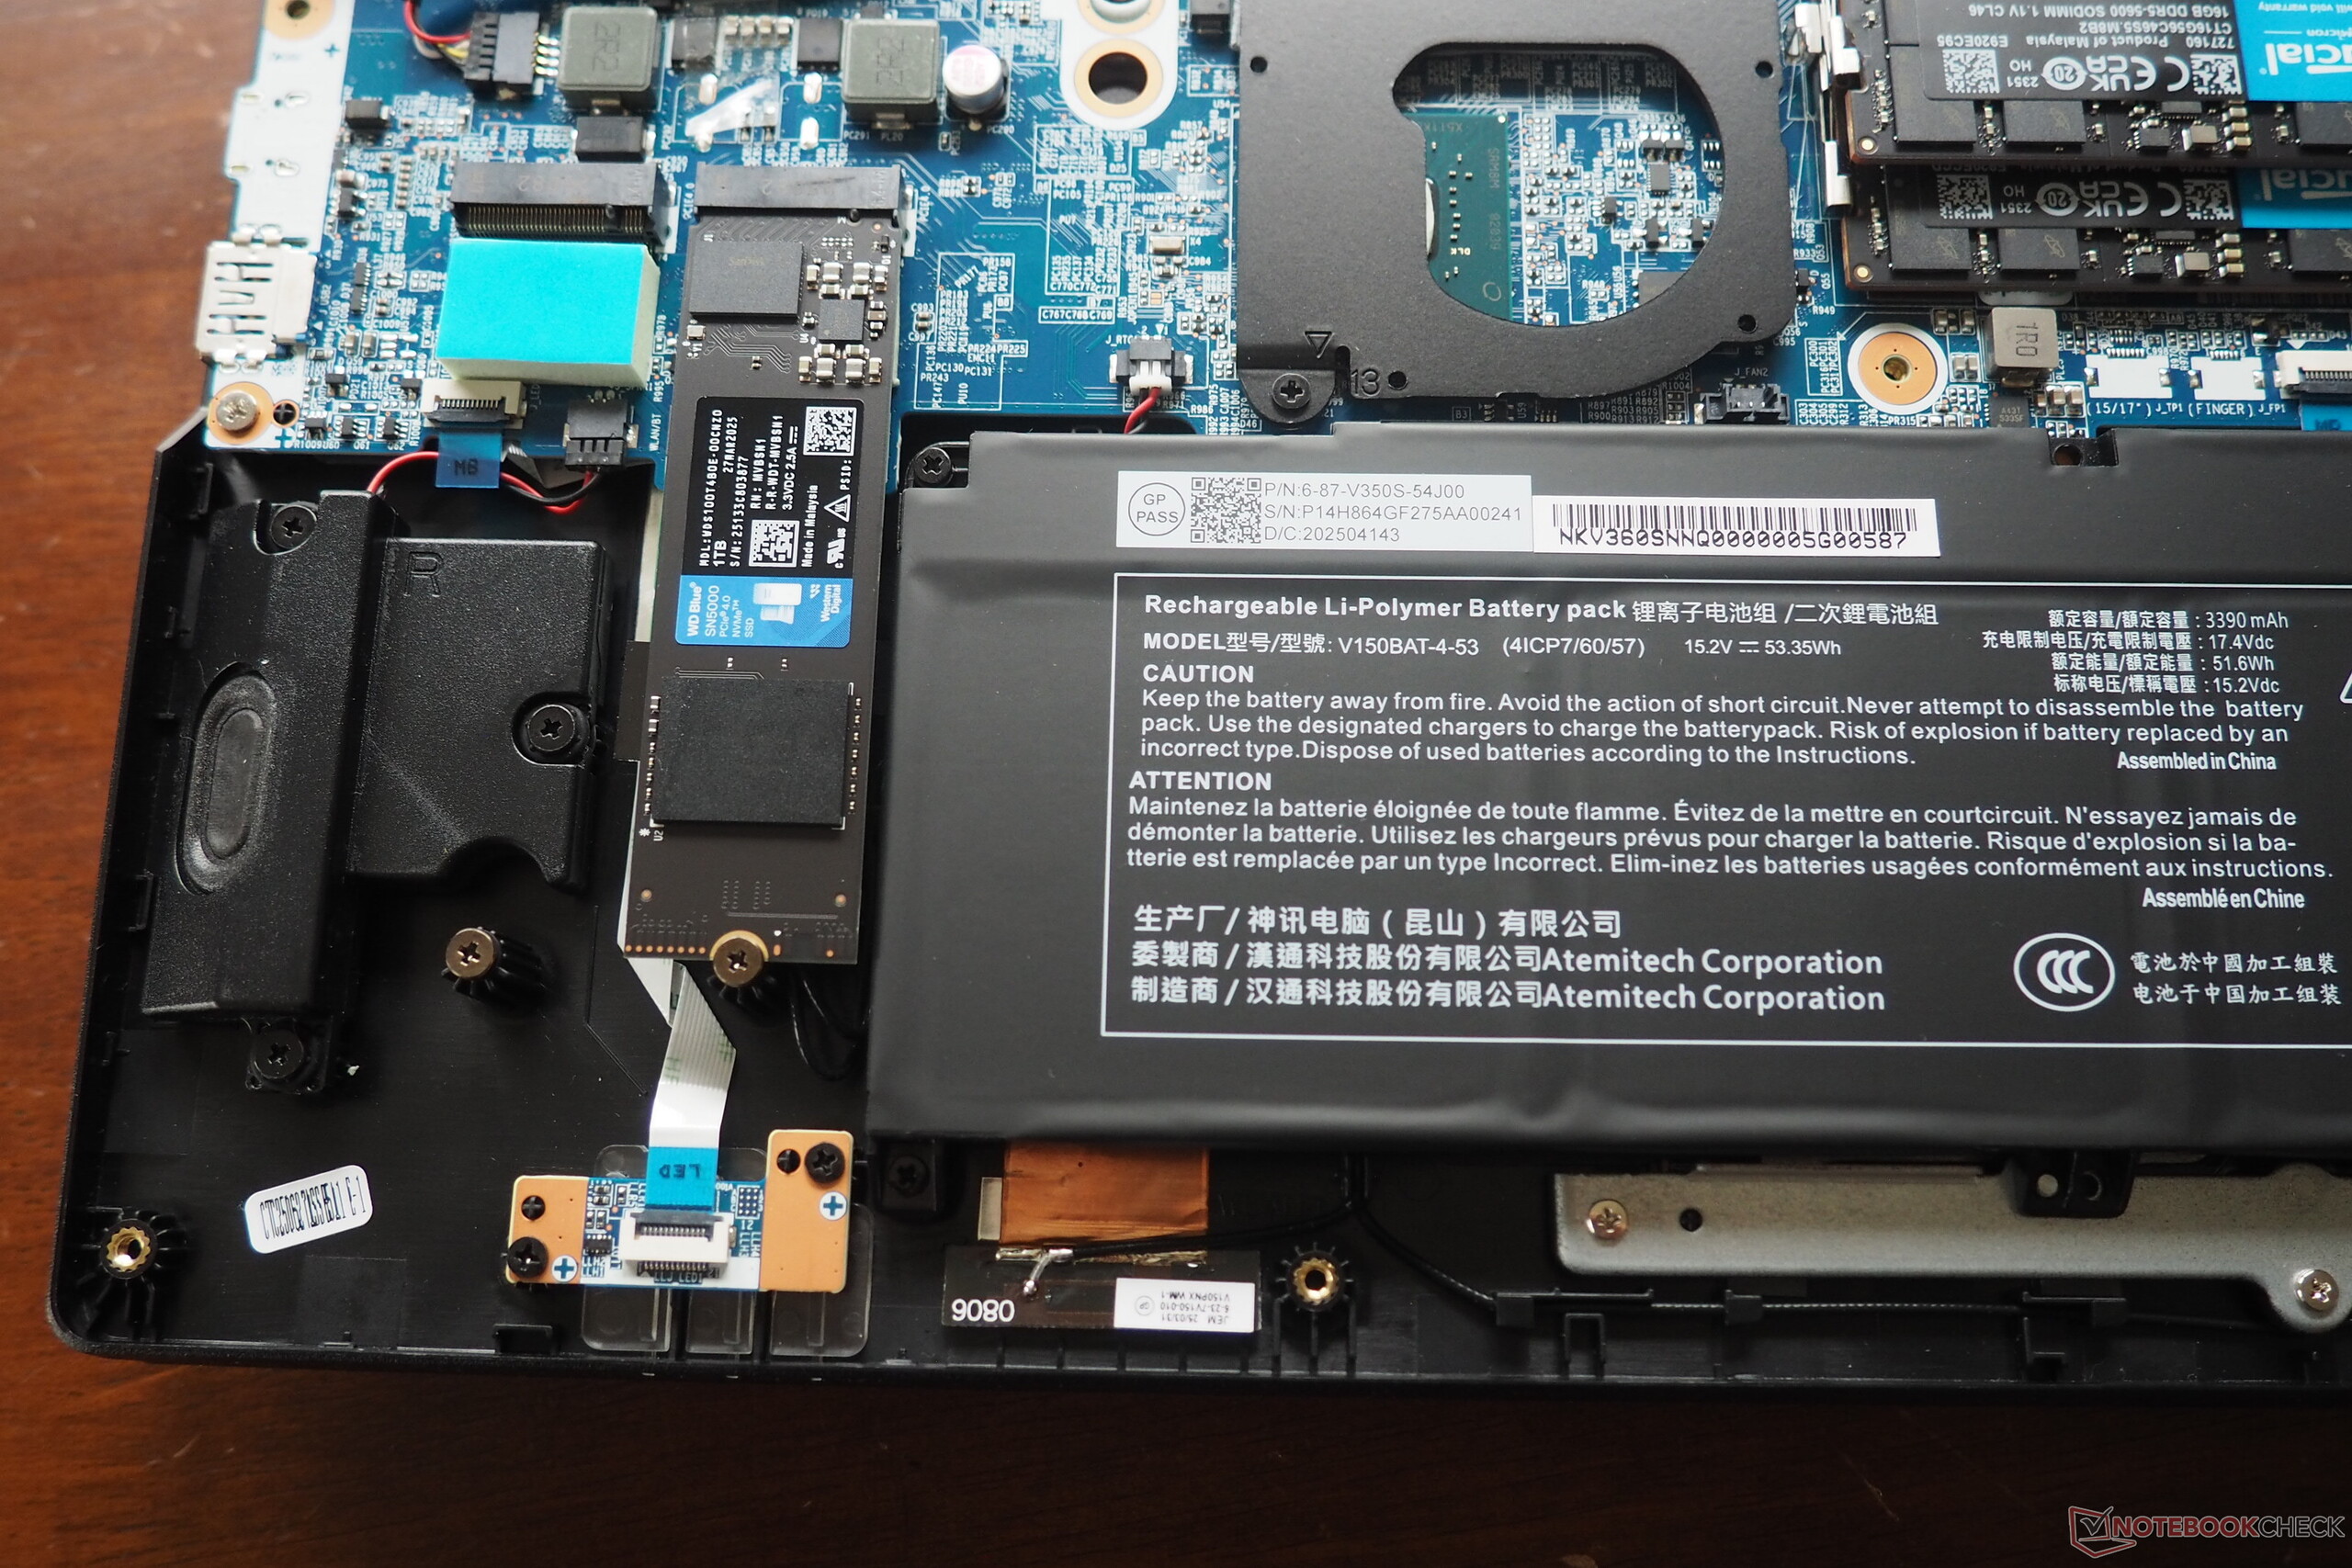
Hay que retirar un total de doce tornillos Phillips antes de poder hacer palanca para sacar la cubierta inferior de sus soportes. Bajo el capó, encontrará un sistema de refrigeración con dos ventiladores, junto con dos ranuras para RAM y dos ranuras para SSD. La batería también es accesible desde aquí.
Sostenibilidad
Por desgracia, el envase utiliza una gran cantidad de plástico.
Garantía
El portátil Tulpar ofrece una garantía de 24 meses para el dispositivo y anuncia un "servicio de mantenimiento gratuito de por vida" Visitamos al fabricante en Berlín hace algún tiempo, y el artículo relacionado cubre este servicio de mantenimiento en detalle.
Tulpar S8 V1.1 Portátil para juegos de 18": Pura potencia para la experiencia de juego definitiva
El Tulpar S8 V1.1 es un portátil para juegos de gama alta donde el rendimiento excepcional se une a un amplio conjunto de características y una enorme pantalla de 18 pulgadas. La combinación de una NVIDIA GeForce RTX 5080 y un Intel Core Ultra 9 275HX ofrece la máxima potencia para juegos y cargas de trabajo exigentes. Un robusto sistema de refrigeración garantiza un rendimiento estable sin concesiones.
Una característica destacada del Tulpar S8 V1.1 es su panel IPS LED, diseñado específicamente para jugadores. Con una resolución de 2560×1600 y una frecuencia de actualización de 240 Hz, la enorme pantalla de 18 pulgadas proporciona un juego vívido y ultrasuave. La pantalla también es compatible con NVIDIA G-SYNC y cubre el 100% del espacio de color DCI-P3, lo que la hace muy adecuada para los profesionales creativos.
Totalmente equipado como un PC de sobremesa, el Tulpar S8 V1.1 soporta hasta 192 GB de RAM DDR5-4400 y ofrece cuatro ranuras M.2 SSD, eliminando cualquier preocupación sobre limitaciones de memoria o almacenamiento. El portátil también incluye dos puertos RJ45, HDMI 2.1 y dos puertos Thunderbolt 5 (DisplayPort 2.1). Un potente sistema de audio de cinco altavoces redondea la experiencia premium.
El Tulpar S8 V1.1 puede personalizarse por completo en la tienda en línea de Tulpar para ajustarse exactamente a sus necesidades.
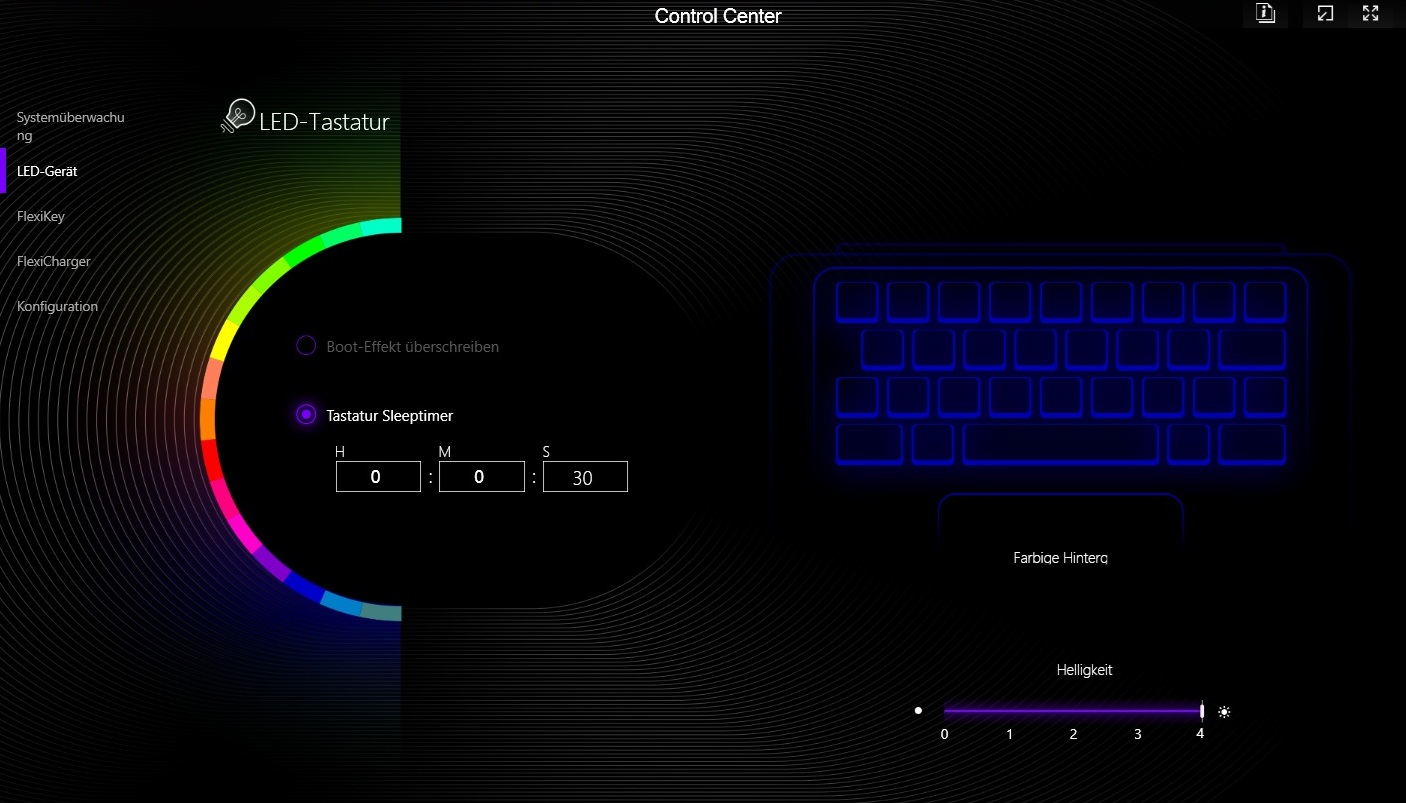
Dispositivos de entrada
Teclado
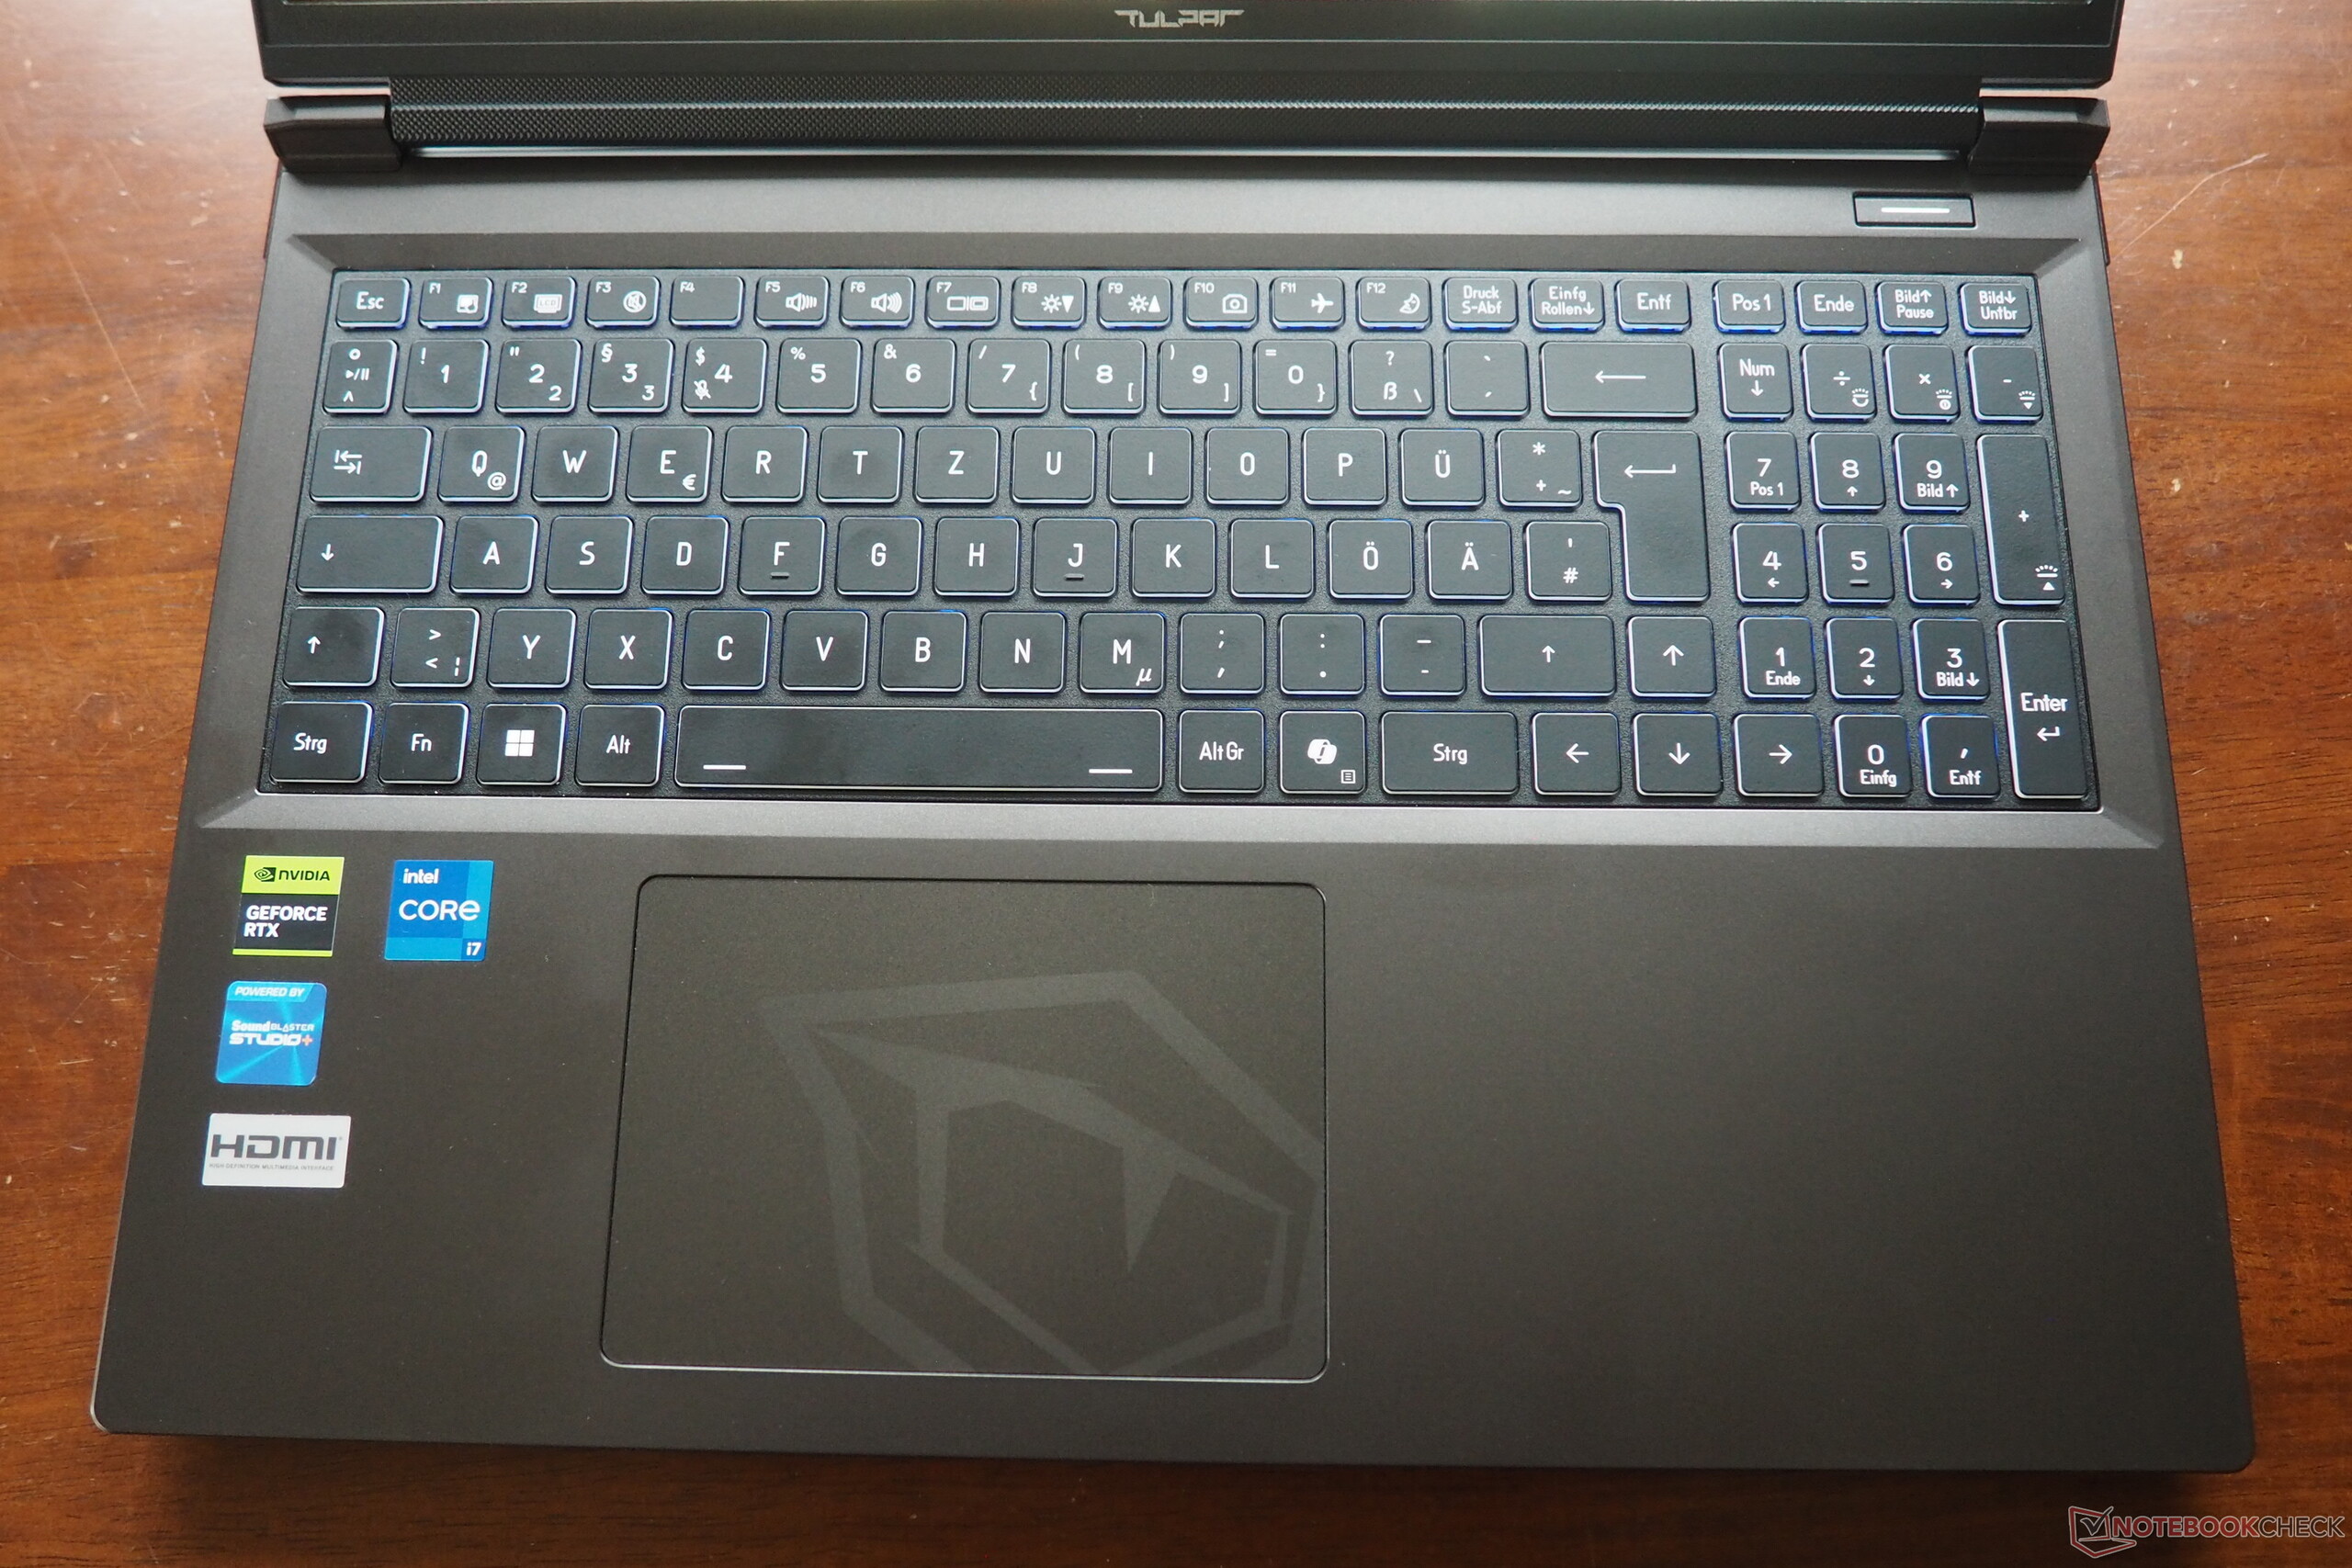
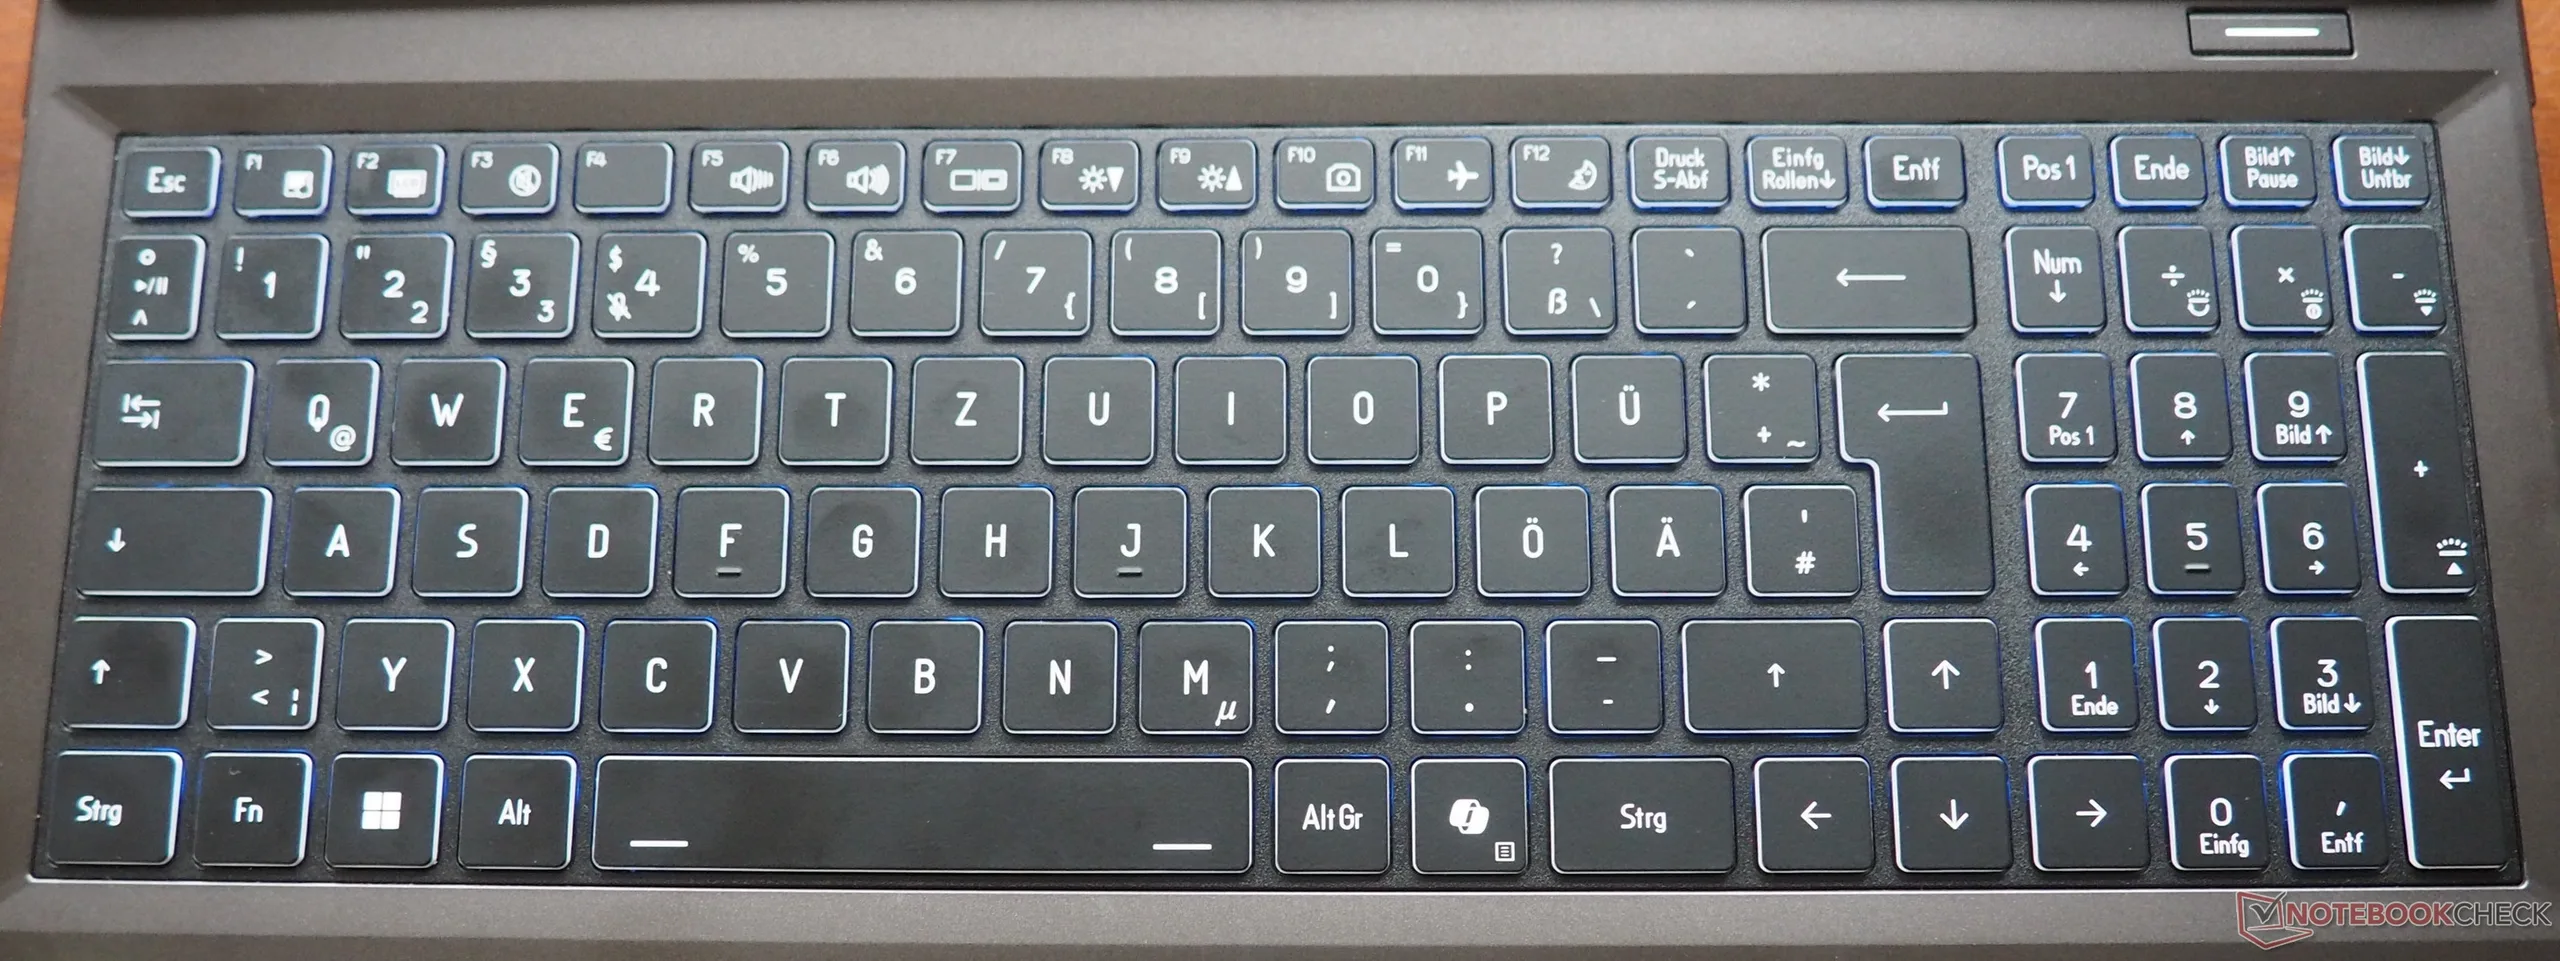
El teclado no destaca en la mayoría de las áreas, para bien o para mal. Sin embargo, la disposición es un punto fuerte, ya que se ciñe a una disposición estándar y ofrece teclas de flecha de buen tamaño. La sensación al teclear es aceptable, pero la retroiluminación podría ser más brillante incluso en su ajuste más alto.
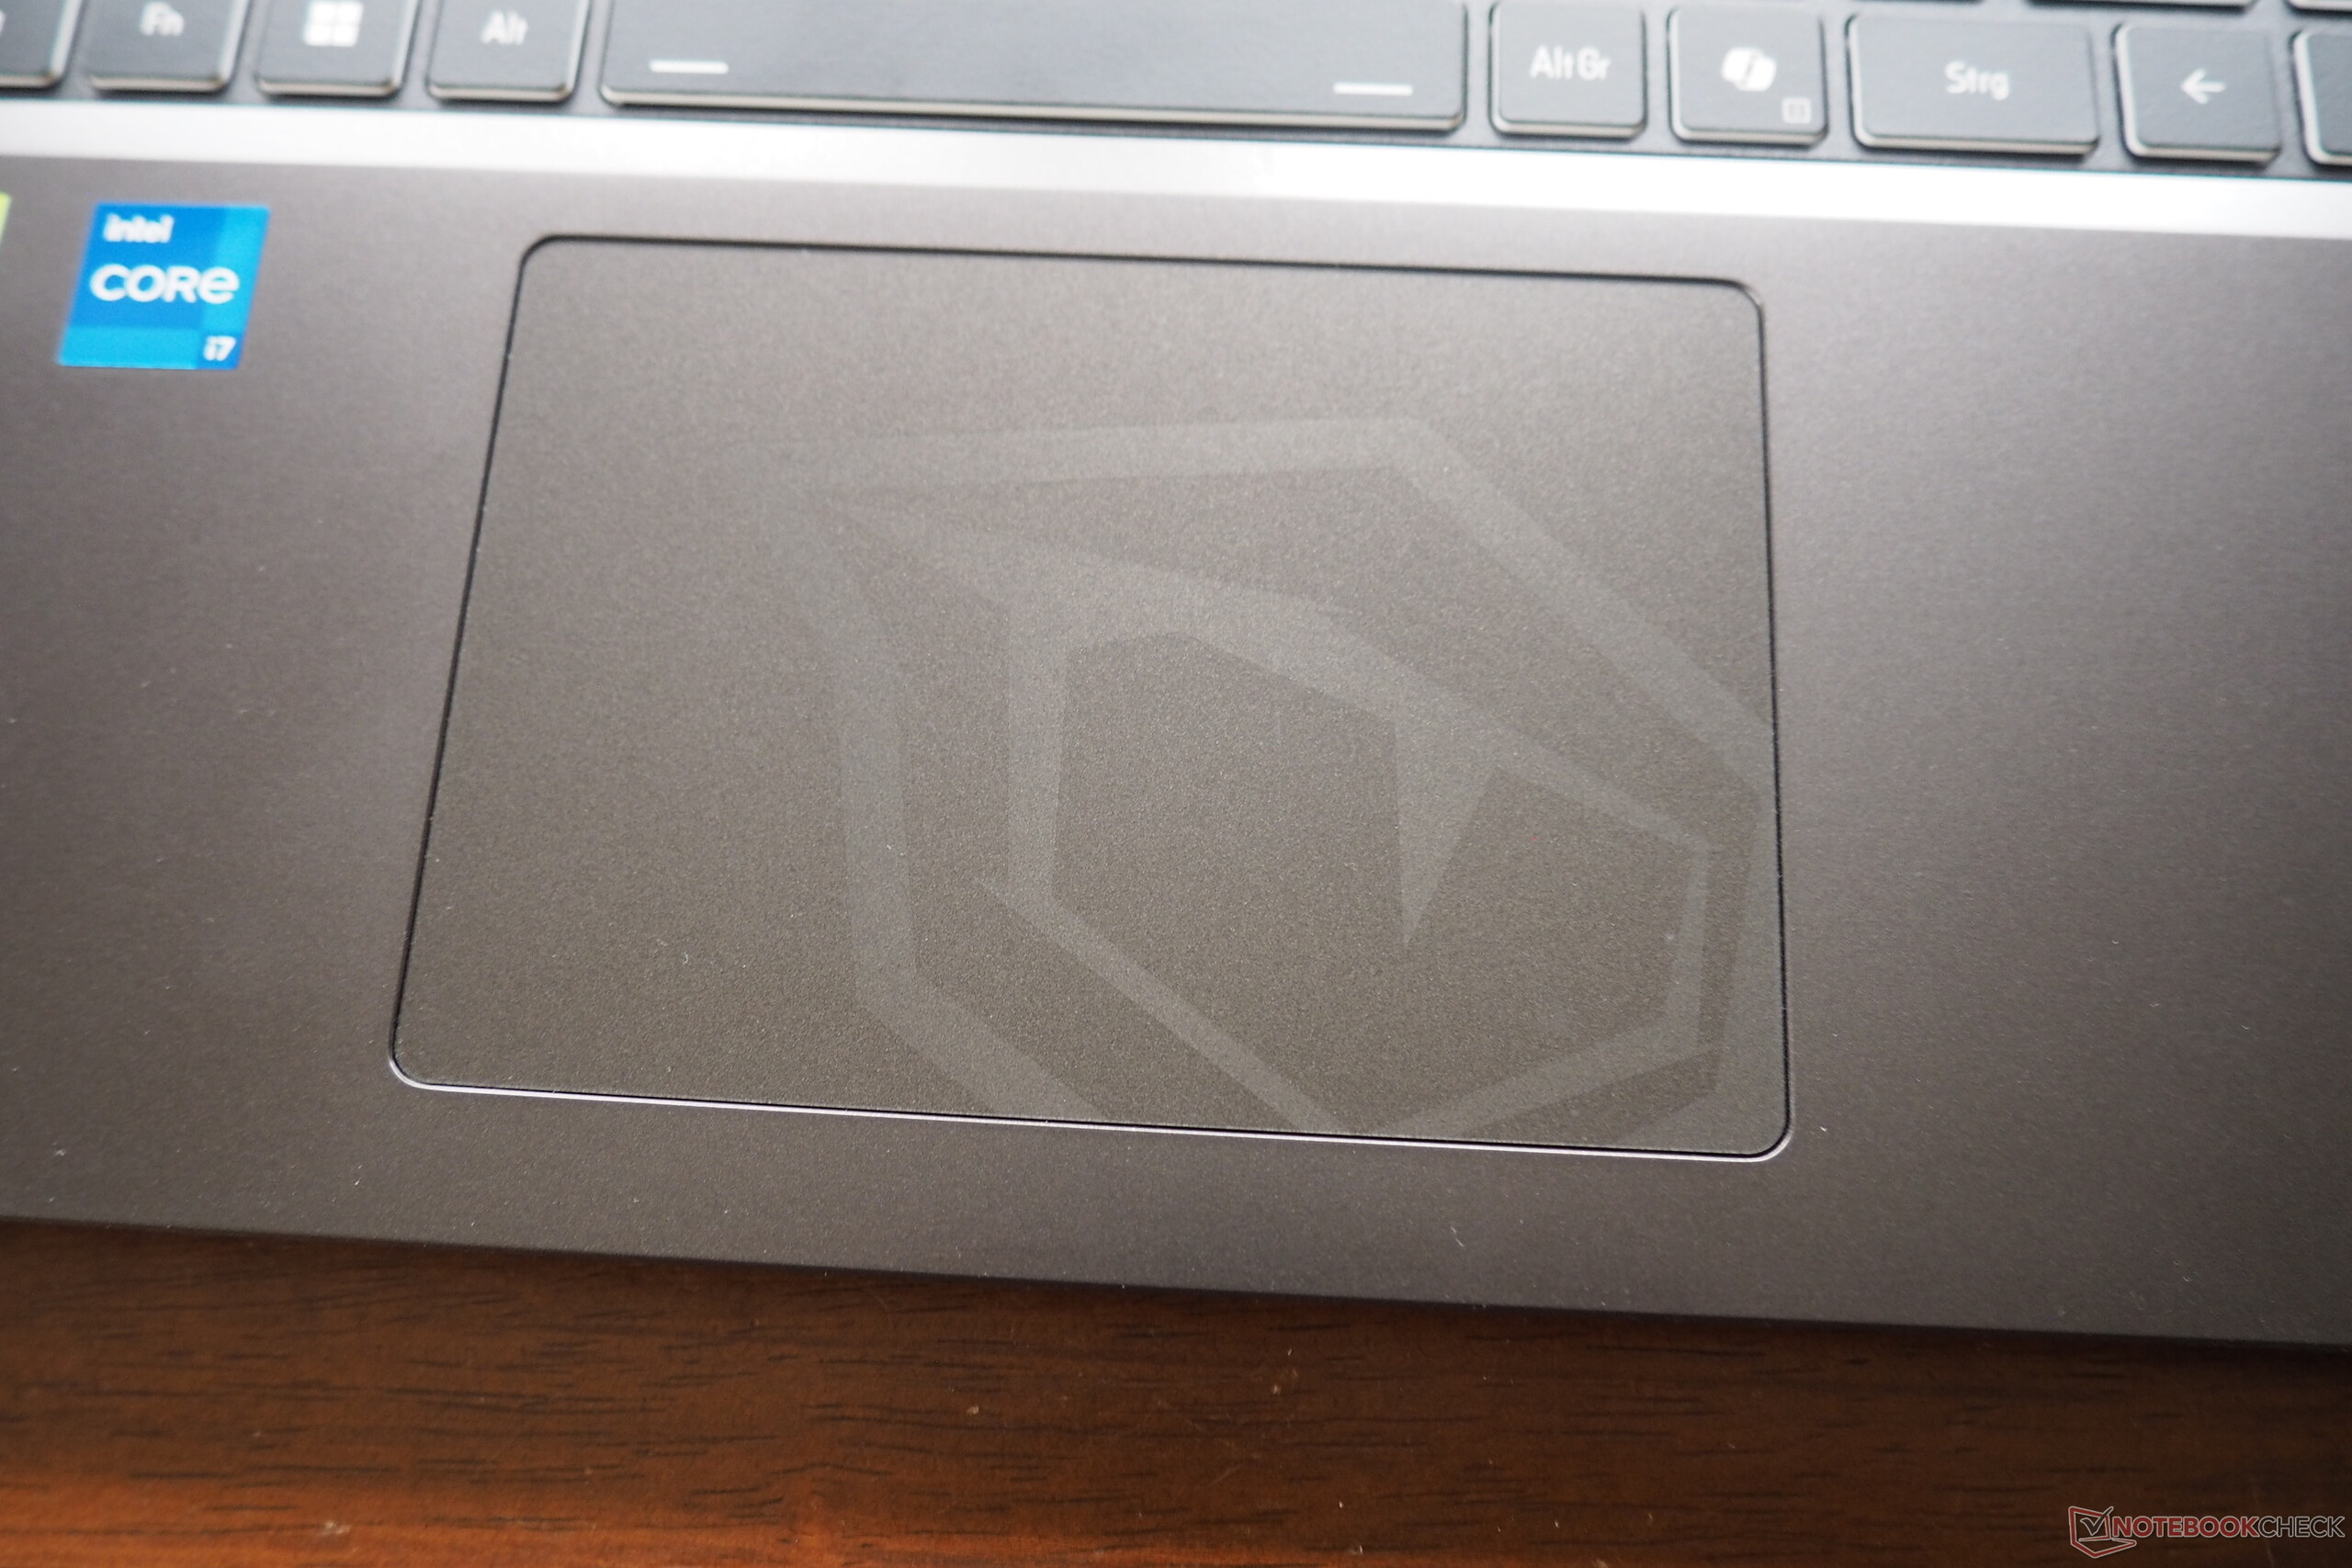
Panel táctil
Todavía hay margen de mejora con el touchpad, ya que el reconocimiento de gestos no siempre es fiable. Por lo demás, ofrece una precisión sólida y un deslizamiento suave. La superficie de unos 12,1 por 8,3 cm es más que adecuada para un portátil de 16 pulgadas. Como ocurre con varios competidores, los mecanismos de clic suenan un poco traqueteantes.
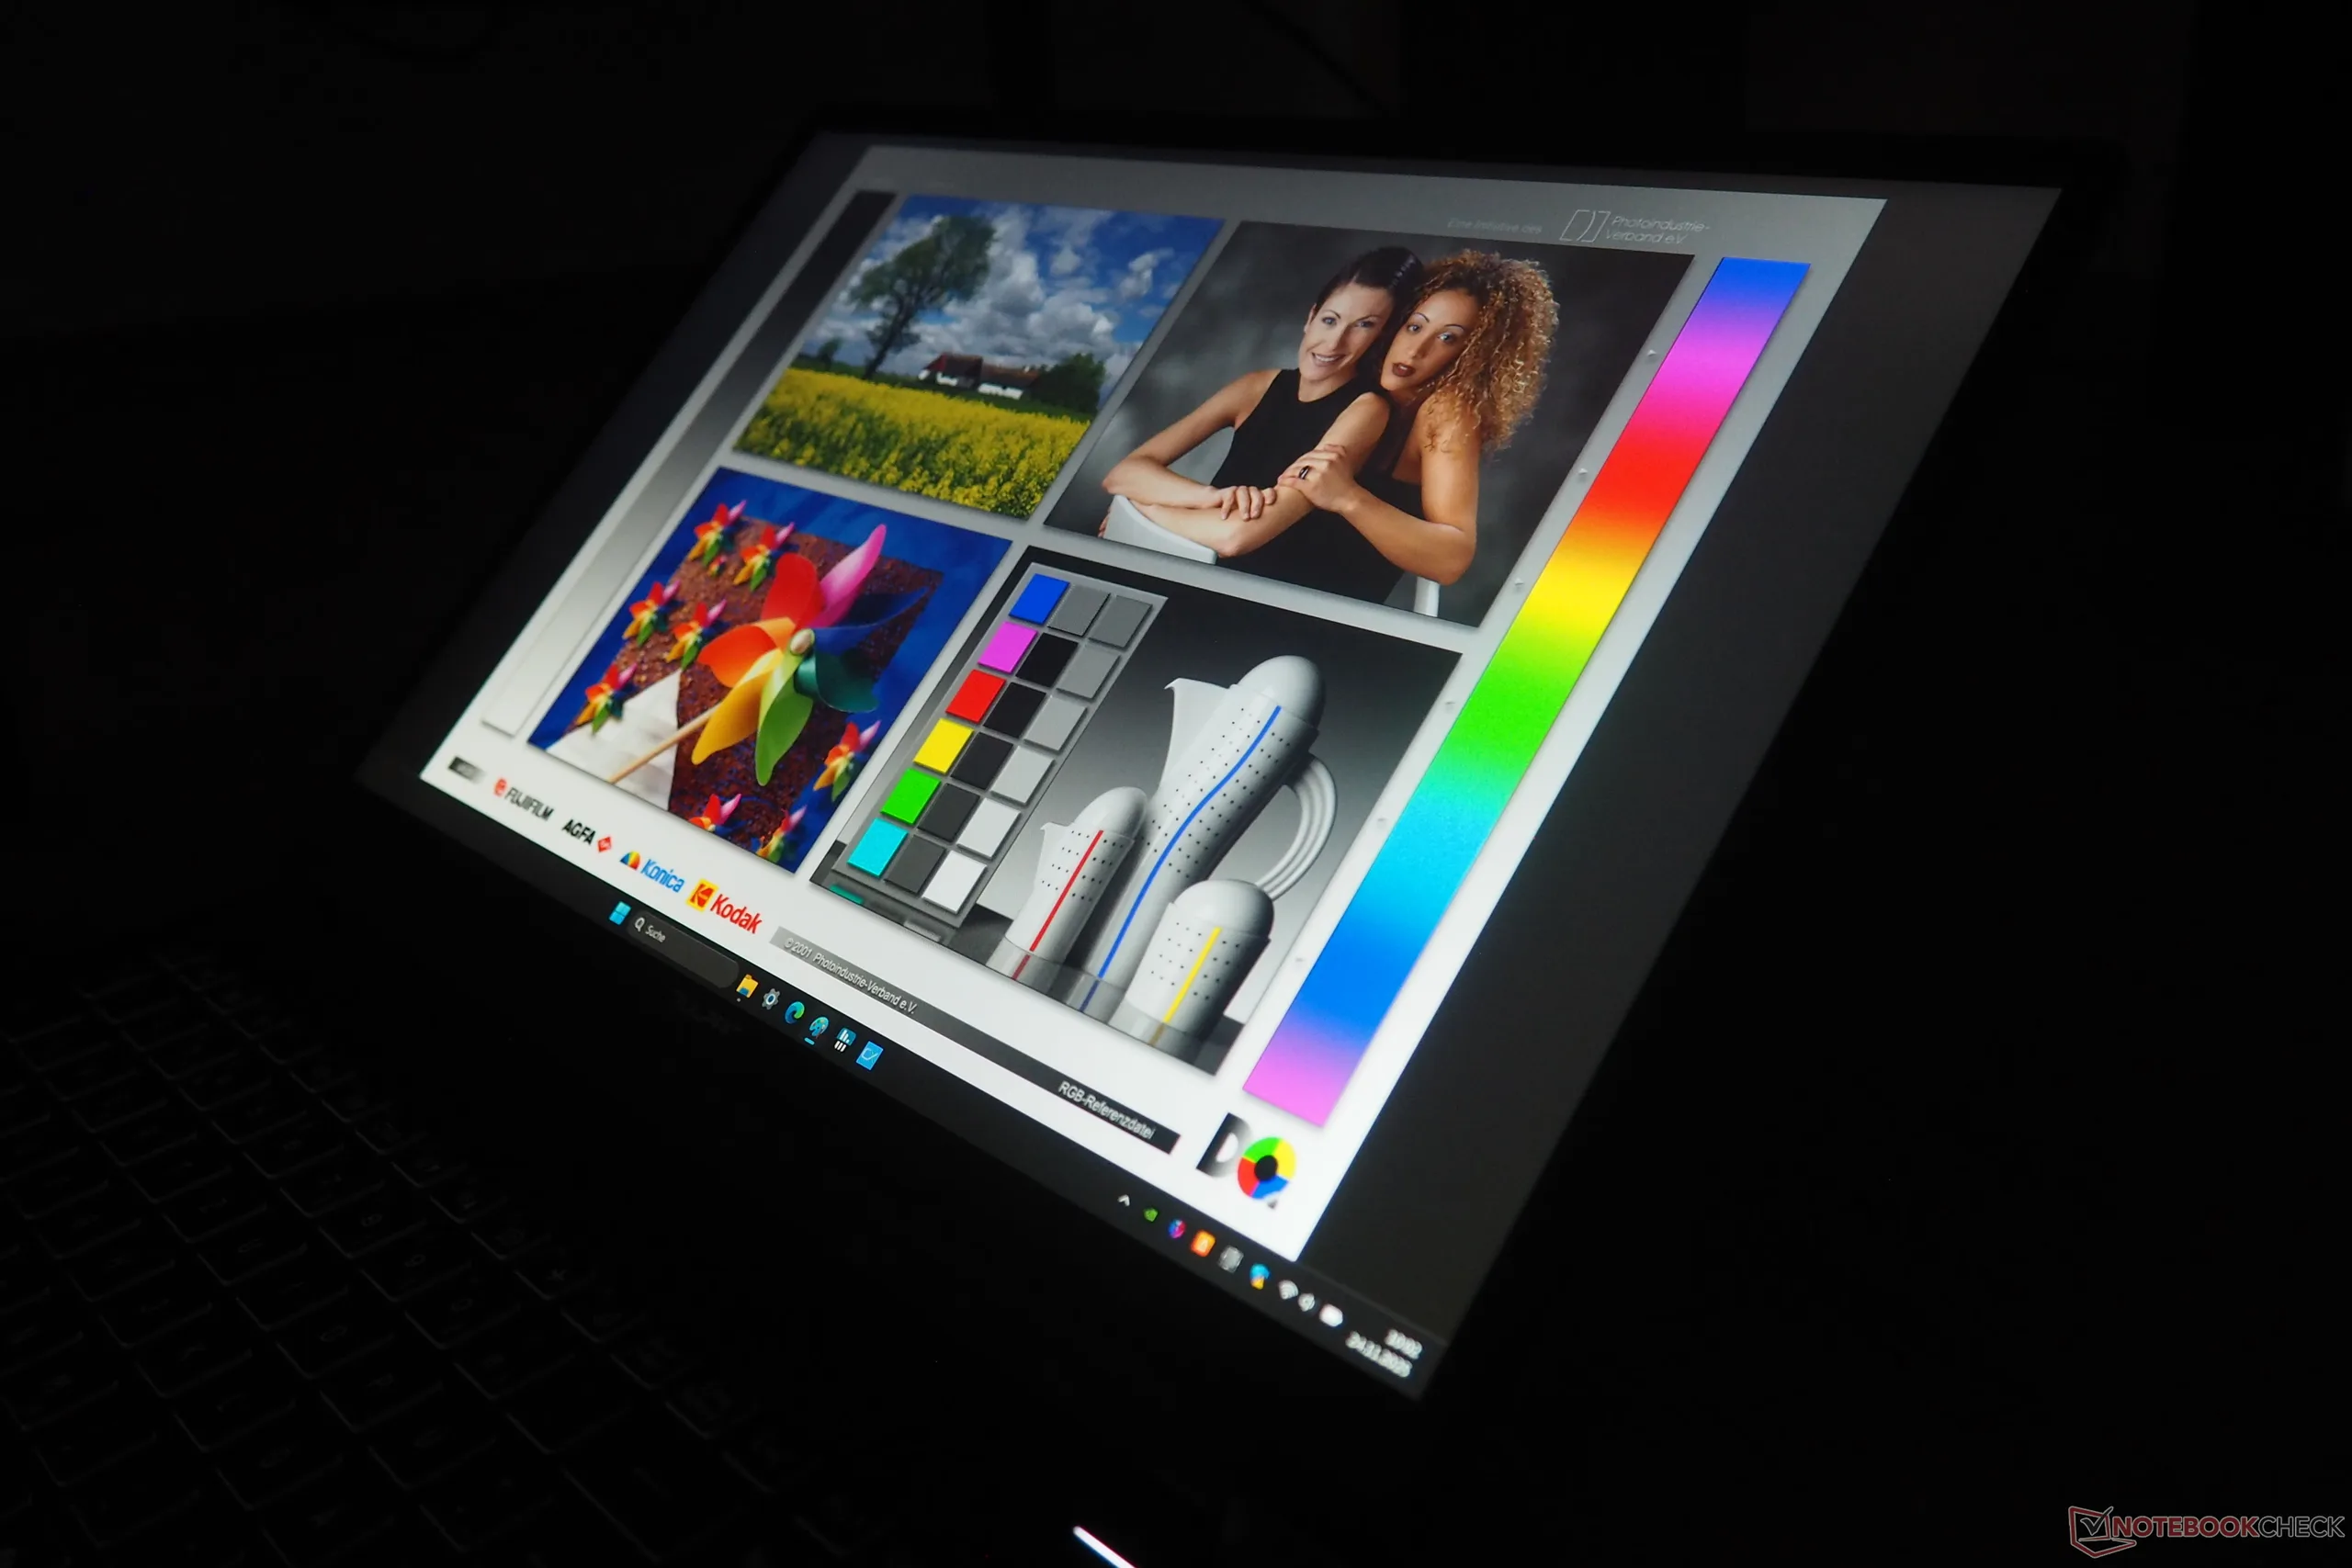
Mostrar
El T6 V3.5 cuenta con un panel mate de 165 Hz. Su brillo medio de 403 cd/m² es sólido para una pantalla IPS y hace que el portátil sea utilizable en entornos más luminosos, siempre que la luz solar no sea demasiado intensa ni incida directamente sobre la pantalla.
| |||||||||||||||||||||||||
iluminación: 79 %
Brillo con batería: 456 cd/m²
Contraste: 1169:1 (Negro: 0.39 cd/m²)
ΔE ColorChecker Calman: 3.05 | ∀{0.5-29.43 Ø4.72}
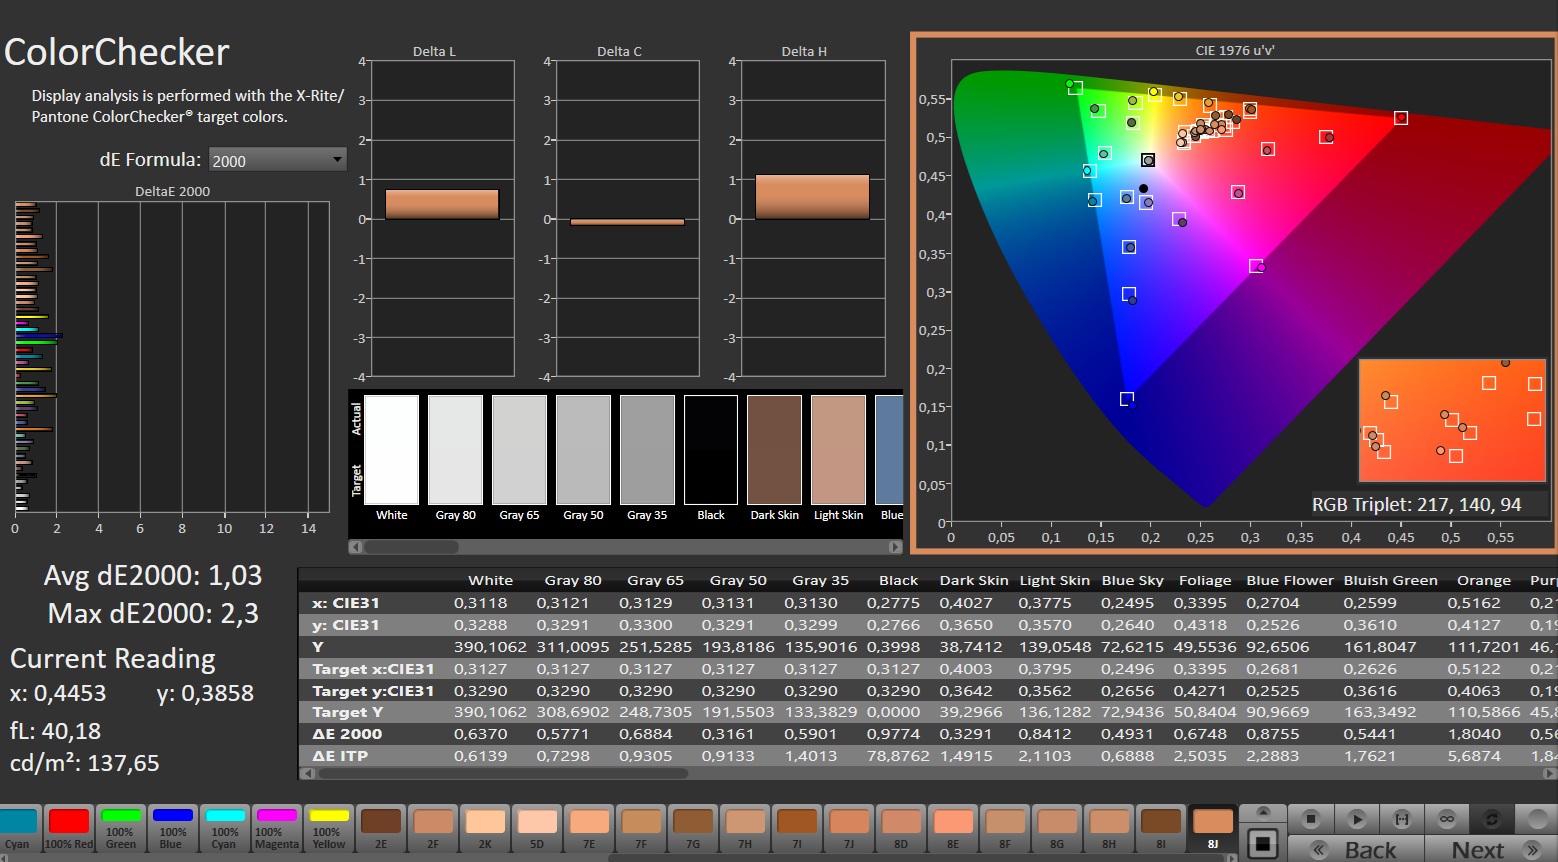
calibrated: 1.03
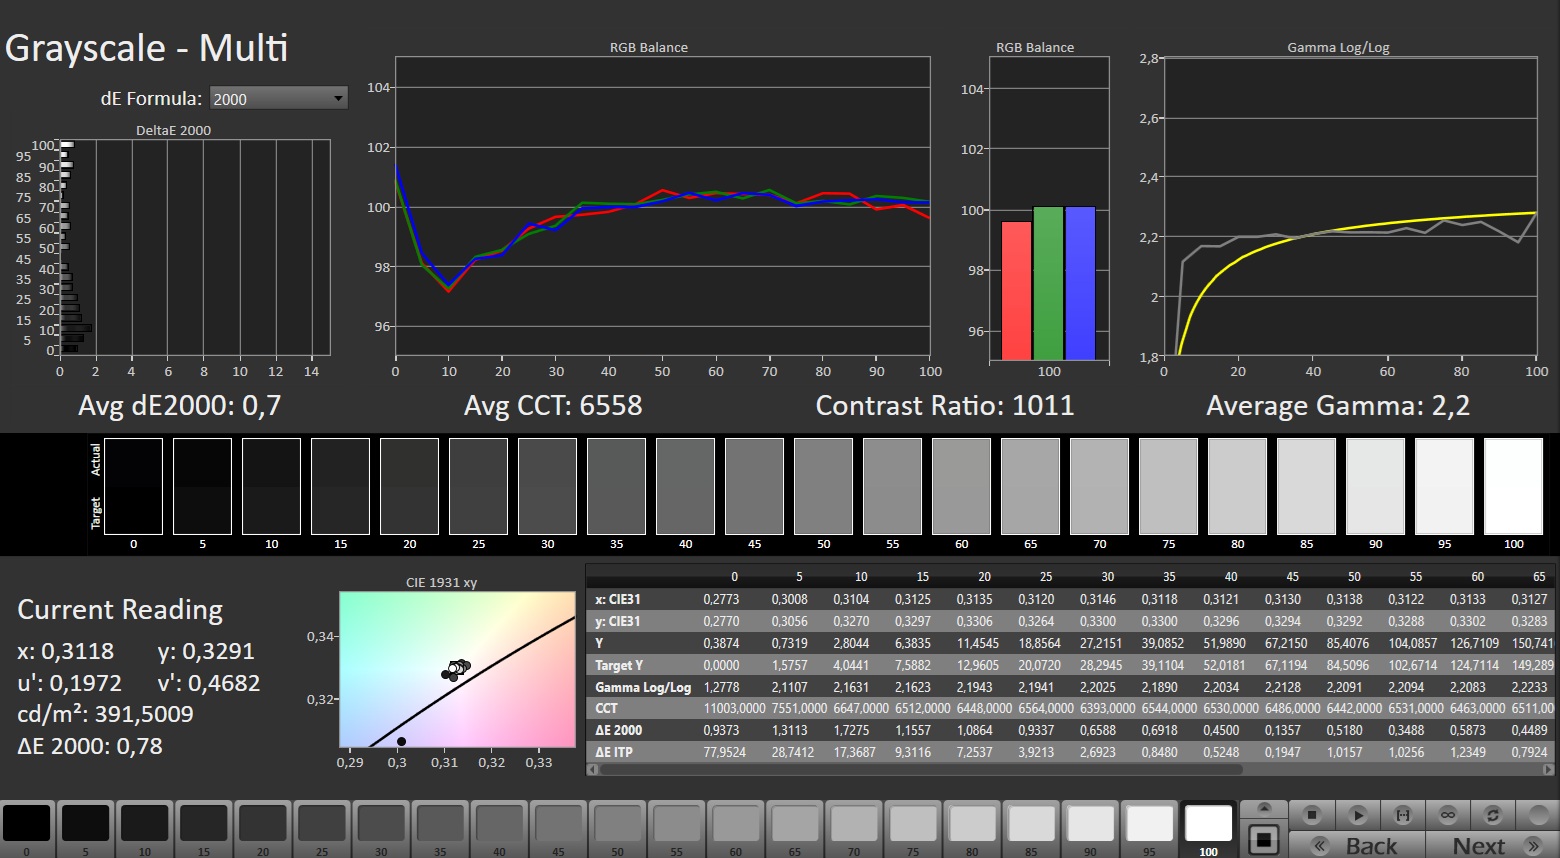
ΔE Greyscale Calman: 3.9 | ∀{0.09-98 Ø4.97}
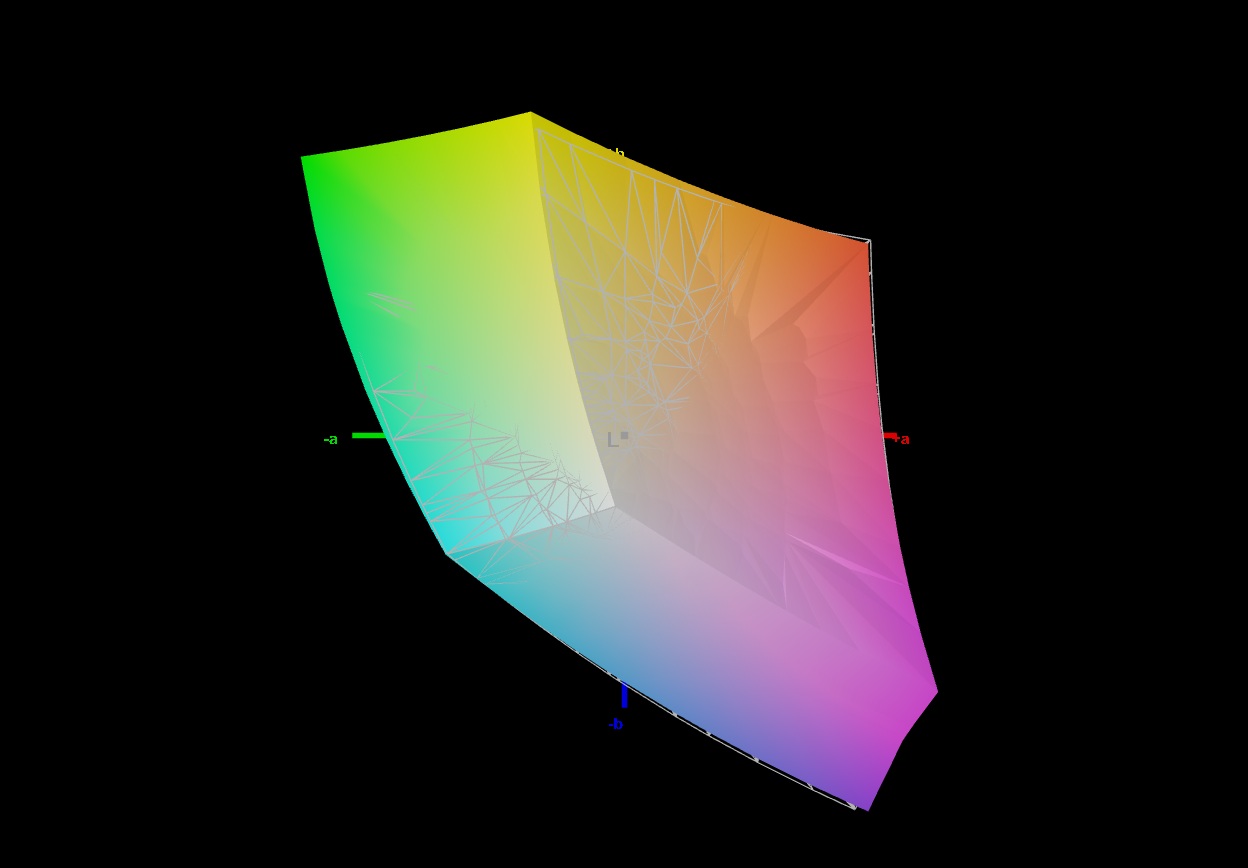
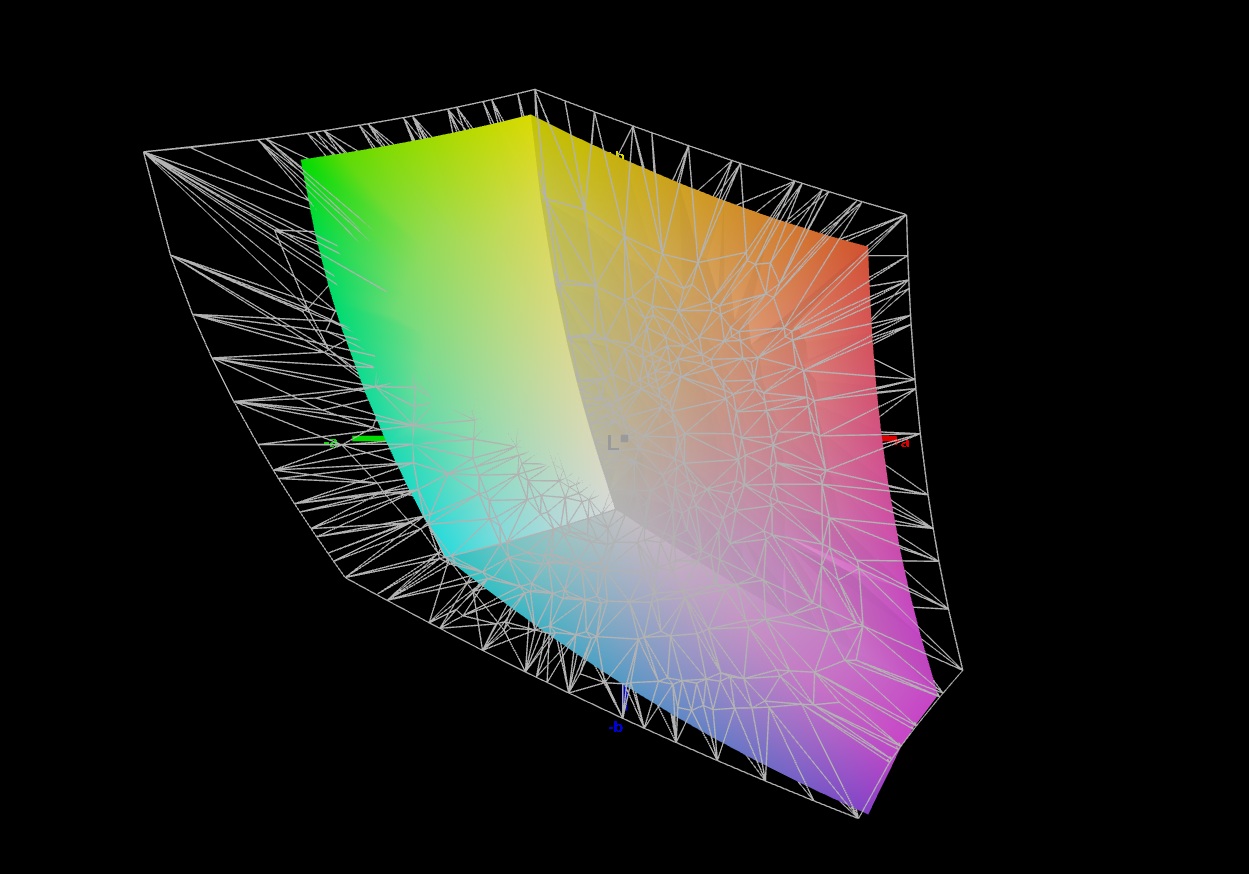
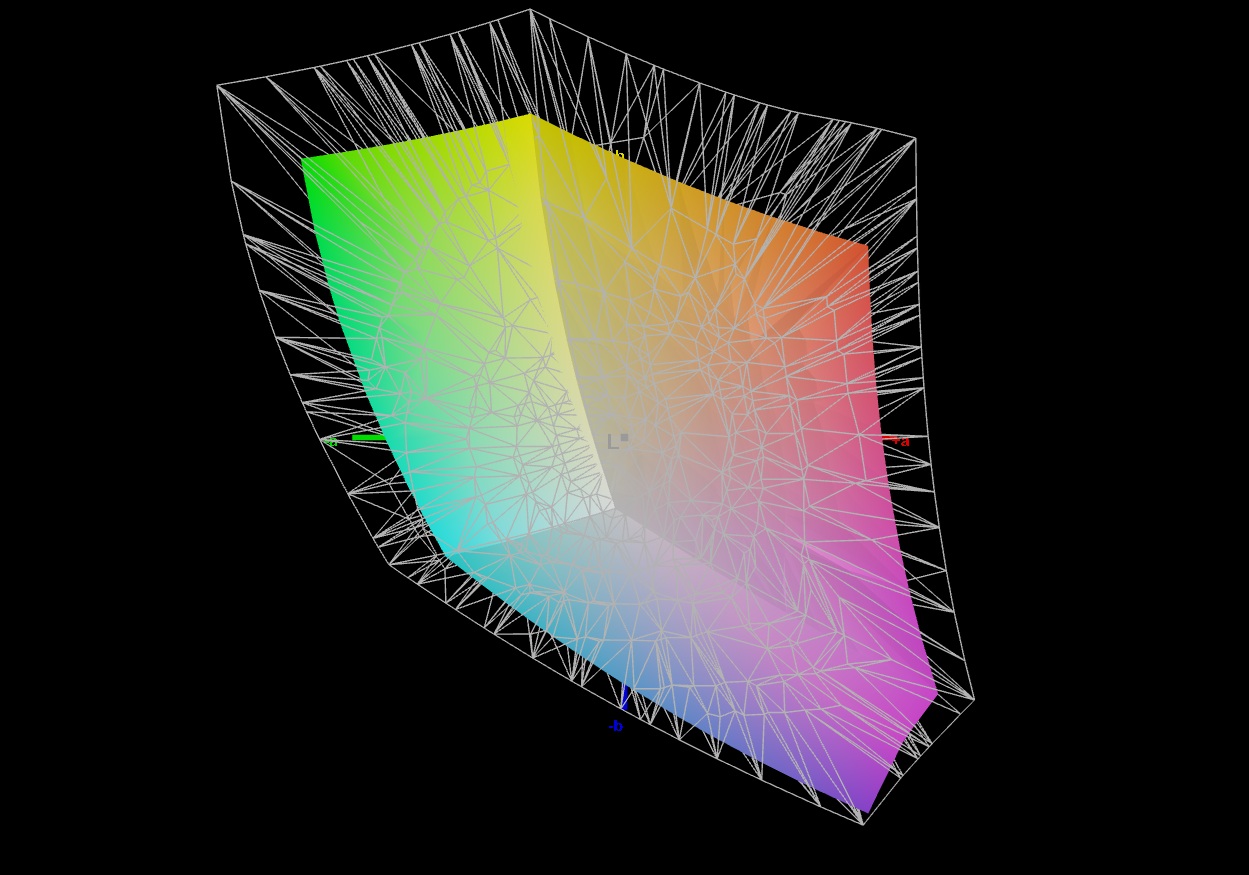
70.6% AdobeRGB 1998 (Argyll 3D)
98.7% sRGB (Argyll 3D)
68.6% Display P3 (Argyll 3D)
Gamma: 2.279
CCT: 7198 K
| Tulpar T6 V3.5 B160UANAC.J (AUO33B7), IPS, 1920x1200, 16", 165 Hz | Acer Nitro V 16 AI ANV16-42-R860 B160UAN08.3 (AUO2CB8), IPS, 1920x1200, 16", 180 Hz | Alienware 16 Aurora BOE NE16N41, IPS, 2560x1600, 16", 120 Hz | HP Omen 16-ap0091ng AUODBB2, IPS, 1920x1200, 16", 144 Hz | Lenovo Legion 5 15AHP G10 LEN151WQXGA, OLED, 2560x1600, 15.1", 165 Hz | Gigabyte Gaming A16 GA6H NE160QDM-NYJ (BOE0C80), IPS, 2560x1600, 16", 165 Hz | |
|---|---|---|---|---|---|---|
| Display | -42% | 2% | -43% | 29% | 1% | |
| Display P3 Coverage (%) | 68.6 | 39.2 -43% | 70.8 3% | 40 -42% | 99.9 46% | 69.4 1% |
| sRGB Coverage (%) | 98.7 | 58.2 -41% | 99.9 1% | 58.1 -41% | 100 1% | 99.5 1% |
| AdobeRGB 1998 Coverage (%) | 70.6 | 40.5 -43% | 72.1 2% | 38.7 -45% | 98.3 39% | 71.6 1% |
| Response Times | 8% | -281% | -132% | 96% | -1% | |
| Response Time Grey 50% / Grey 80% * (ms) | 12.4 ? | 11.6 ? 6% | 49.5 ? -299% | 27.6 ? -123% | 0.42 ? 97% | 14.3 ? -15% |
| Response Time Black / White * (ms) | 8.1 ? | 7.4 ? 9% | 29.3 ? -262% | 19.4 ? -140% | 0.4 ? 95% | 7 ? 14% |
| PWM Frequency (Hz) | 1152 ? | |||||
| PWM Amplitude * (%) | 11 | |||||
| Screen | -70% | 4% | -53% | 43% | -16% | |
| Brightness middle (cd/m²) | 456 | 384 -16% | 345.3 -24% | 328 -28% | 492 8% | 432 -5% |
| Brightness (cd/m²) | 403 | 372 -8% | 324 -20% | 313 -22% | 495 23% | 425 5% |
| Brightness Distribution (%) | 79 | 92 16% | 88 11% | 91 15% | 92 16% | 91 15% |
| Black Level * (cd/m²) | 0.39 | 0.36 8% | 0.23 41% | 0.26 33% | 0.37 5% | |
| Contrast (:1) | 1169 | 1067 -9% | 1501 28% | 1262 8% | 1168 0% | |
| Colorchecker dE 2000 * | 3.05 | 5.82 -91% | 3.22 -6% | 4.73 -55% | 0.9 70% | 4.76 -56% |
| Colorchecker dE 2000 max. * | 6.56 | 20.34 -210% | 5.68 13% | 17.47 -166% | 1.8 73% | 8.59 -31% |
| Colorchecker dE 2000 calibrated * | 1.03 | 3.95 -283% | 0.93 10% | 4.22 -310% | 1.18 -15% | |
| Greyscale dE 2000 * | 3.9 | 5.4 -38% | 4.5 -15% | 2.05 47% | 1.2 69% | 6.2 -59% |
| Gamma | 2.279 97% | 2.174 101% | 2.1 105% | 2.63 84% | 2.16 102% | 2.079 106% |
| CCT | 7198 90% | 6067 107% | 7041 92% | 6718 97% | 6291 103% | 6690 97% |
| Media total (Programa/Opciones) | -35% /
-53% | -92% /
-37% | -76% /
-62% | 56% /
49% | -5% /
-10% |
* ... más pequeño es mejor
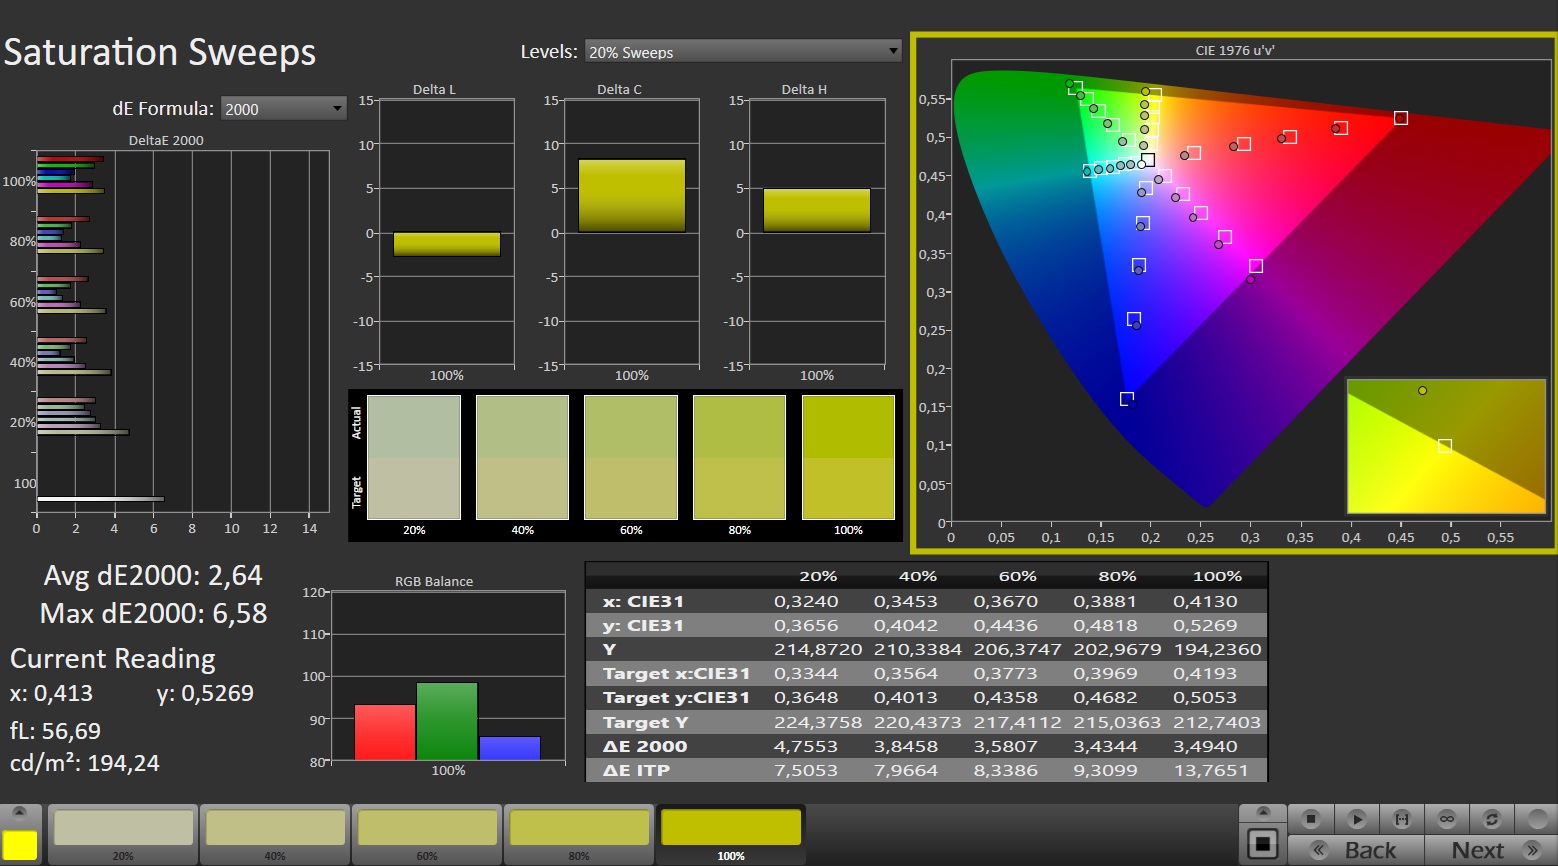
Aunque la pantalla de 16 pulgadas se queda corta en la cobertura AdobeRGB y DCI-P3, cubre casi por completo el espacio sRGB, que es lo que importa para la mayoría de los jugadores. Fuera de la caja, hay un tinte azul notable, pero la calibración lo arregla fácilmente.
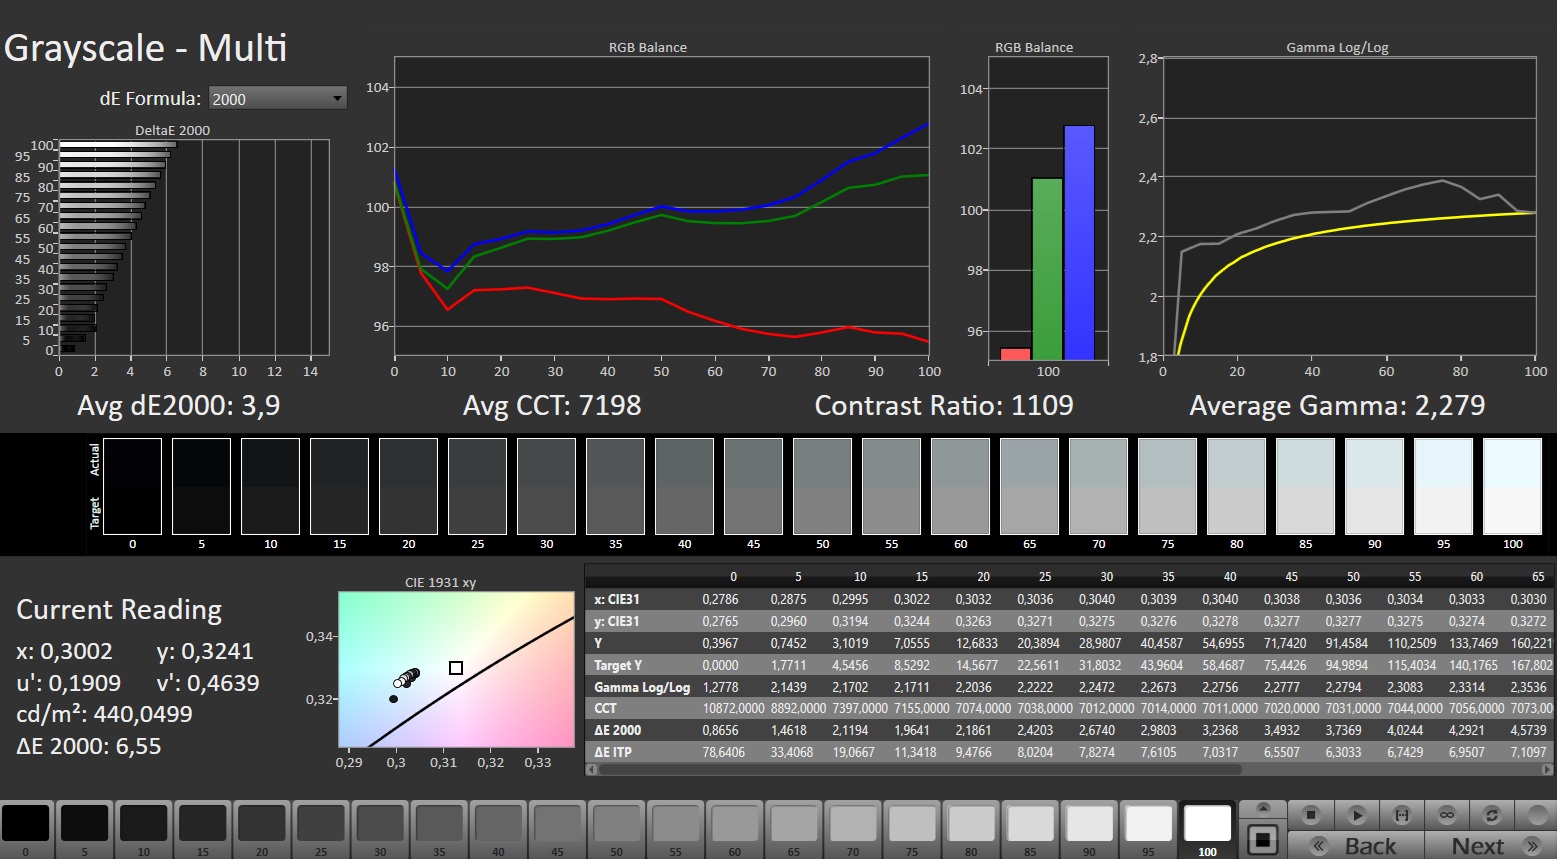
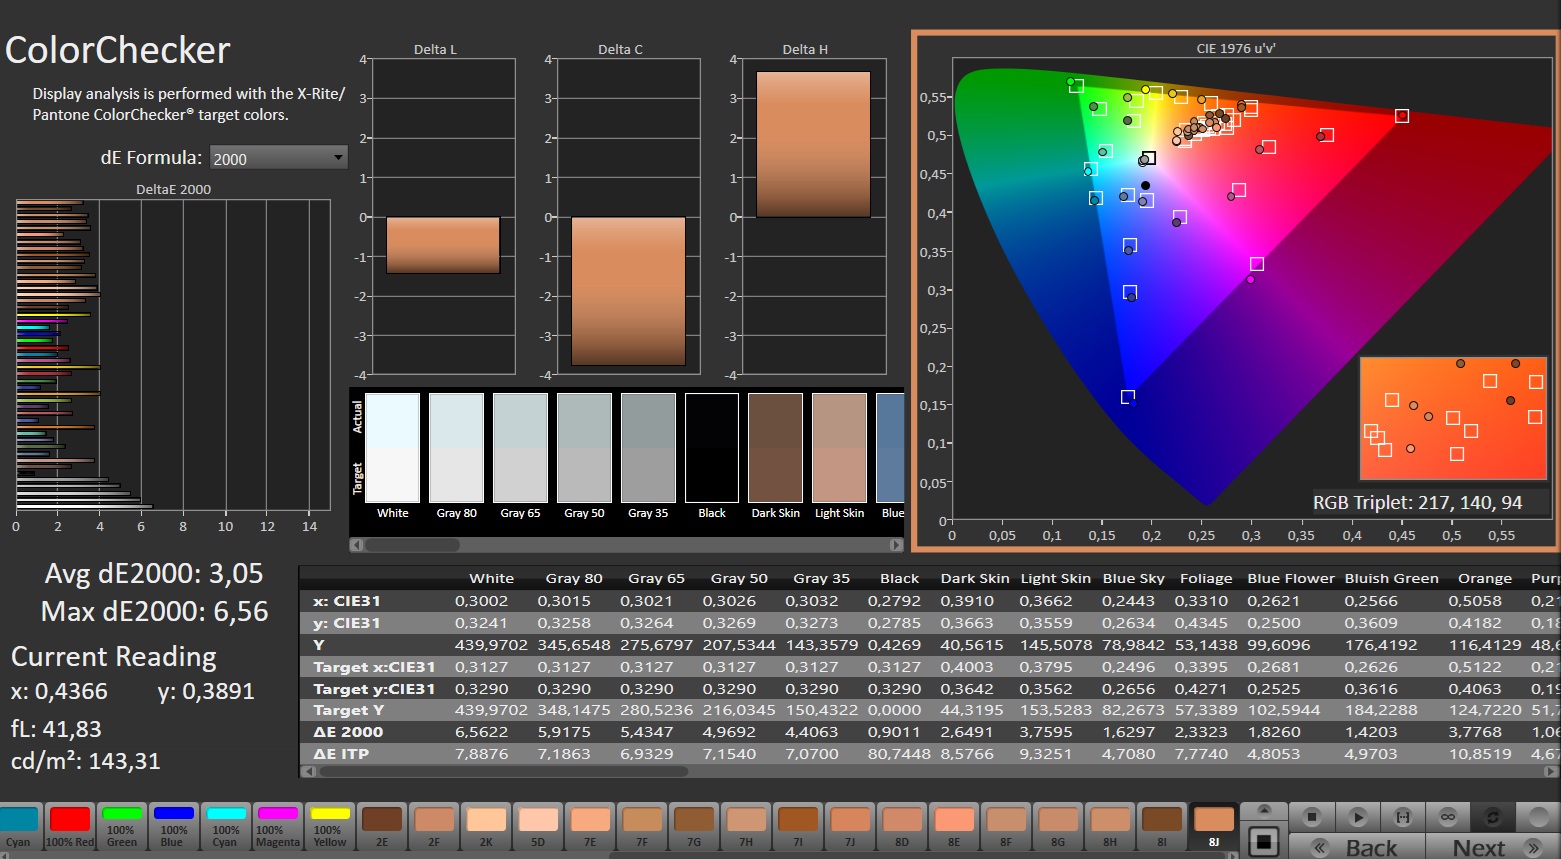
El nivel de negro podría ser mejor con 0,39 cd/m², pero el contraste sigue superando los 1.000:1, lo que es típico para esta clase.
Los tiempos de respuesta también son buenos en comparación con los modelos de la competencia. Sin embargo, nuestra unidad de pruebas mostró un sangrado de pantalla notable, principalmente a lo largo de los laterales y en las esquinas.
Tiempos de respuesta del display
| ↔ Tiempo de respuesta de Negro a Blanco | ||
|---|---|---|
| 8.1 ms ... subida ↗ y bajada ↘ combinada | ↗ 4.7 ms subida | 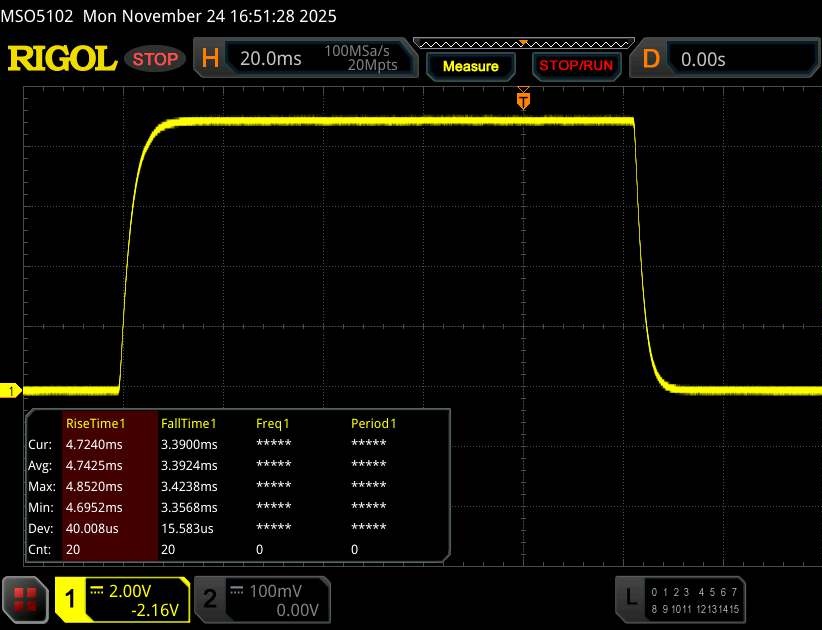 |
| ↘ 3.4 ms bajada | ||
| La pantalla mostró tiempos de respuesta rápidos en nuestros tests y debería ser adecuada para juegos. En comparación, todos los dispositivos de prueba van de ##min### (mínimo) a 240 (máximo) ms. » 23 % de todos los dispositivos son mejores. Esto quiere decir que el tiempo de respuesta medido es mejor que la media (19.8 ms) de todos los dispositivos testados. | ||
| ↔ Tiempo de respuesta 50% Gris a 80% Gris | ||
| 12.4 ms ... subida ↗ y bajada ↘ combinada | ↗ 6.2 ms subida | 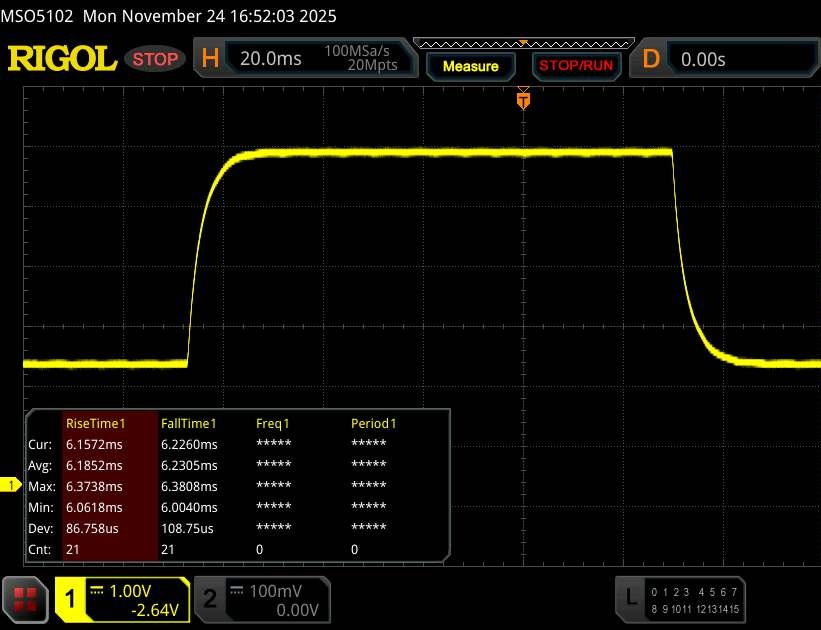 |
| ↘ 6.2 ms bajada | ||
| La pantalla mostró buenos tiempos de respuesta en nuestros tests pero podría ser demasiado lenta para los jugones competitivos. En comparación, todos los dispositivos de prueba van de ##min### (mínimo) a 636 (máximo) ms. » 26 % de todos los dispositivos son mejores. Esto quiere decir que el tiempo de respuesta medido es mejor que la media (31 ms) de todos los dispositivos testados. | ||
Parpadeo de Pantalla / PWM (Pulse-Width Modulation)
| Parpadeo de Pantalla / PWM no detectado | 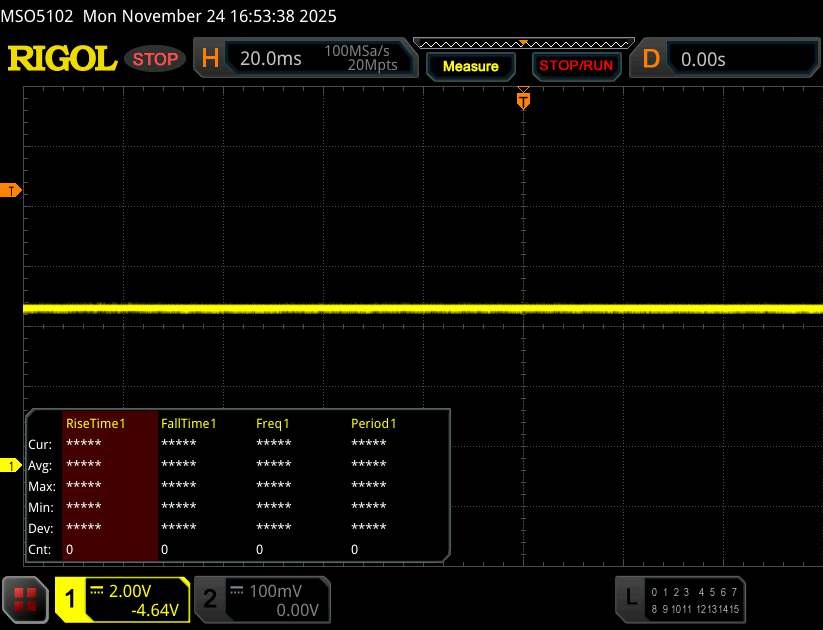 | ||
Comparación: 52 % de todos los dispositivos testados no usaron PWM para atenuar el display. Si se usó, medimos una media de 7763 (mínimo: 5 - máxmo: 343500) Hz. | |||
Rendimiento
El Tulpar T6 V3.5 es un sistema de gama media capaz de realizar casi cualquier tarea. Aparte del sistema operativo, la capacidad de RAM y la configuración de almacenamiento M.2, el sitio web del fabricante no ofrece opciones de personalización adicionales.
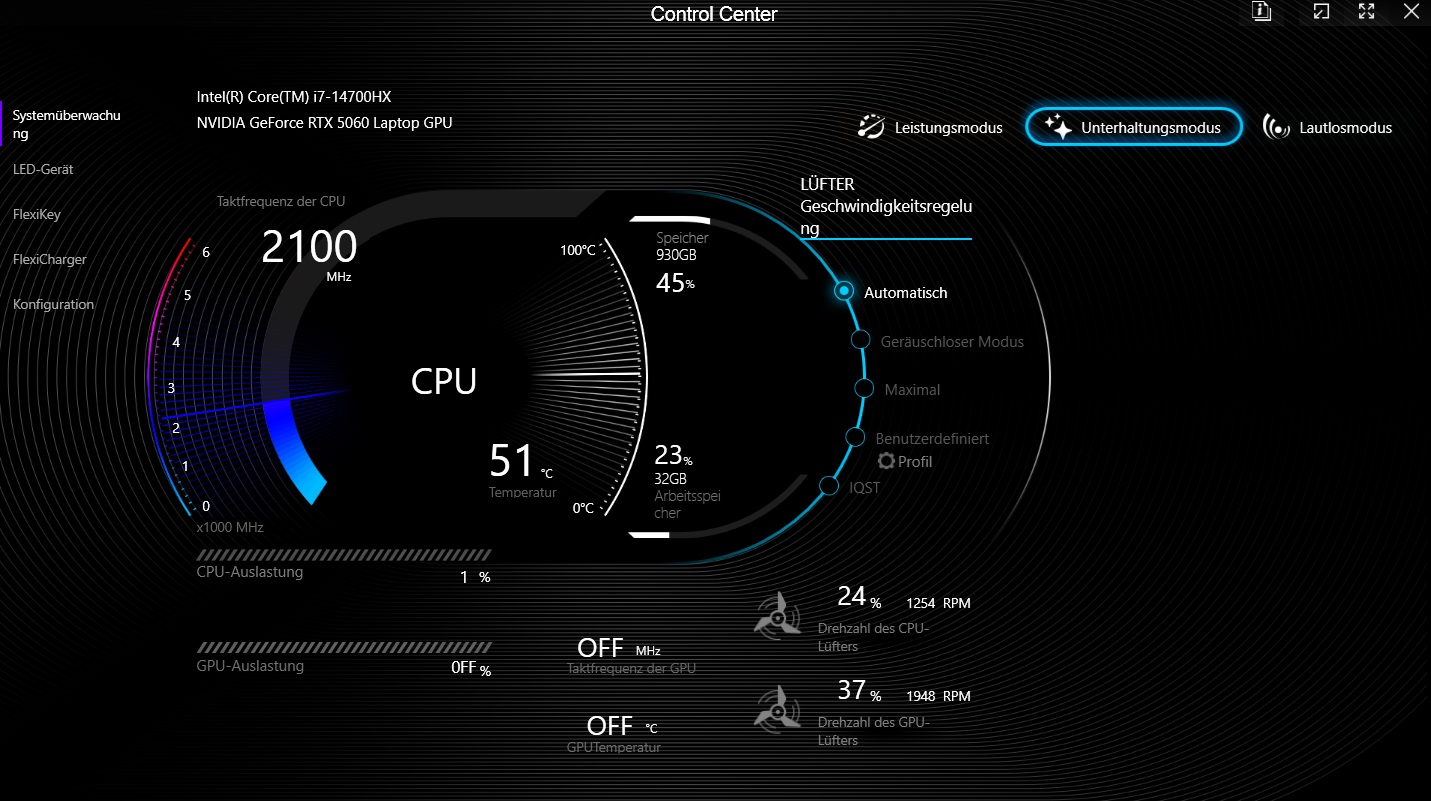
Condiciones de la prueba
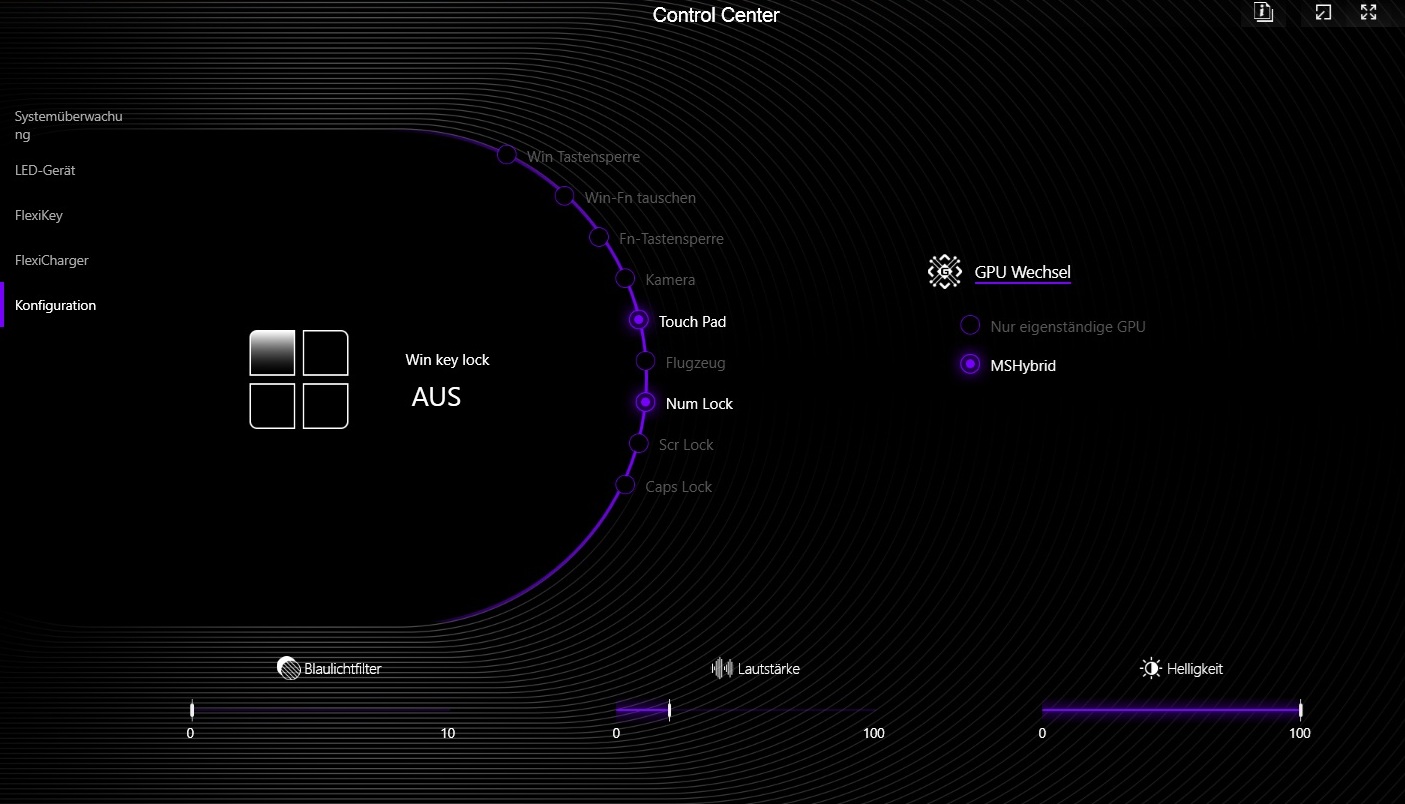
El Centro de Control preinstalado ofrece tres modos de funcionamiento. Dado que el modo de rendimiento no aumentó significativamente el rendimiento de la CPU o la GPU en nuestras pruebas pero sí el ruido, todas nuestras pruebas comparativas se ejecutaron en modo Entretenimiento.
| Modo | Silencioso | Entretenimiento | Rendimiento |
| Cyberpunk 2077 Ruido | 34 dB(A) | 52 dB(A) | 56 dB(A) |
| Velocidad de fotogramas de Cyberpunk 2077 (FHD/Ultra) | 62,4 fps | 81,8 fps | 82,3 fps |
| CPU PL1 | 28 W | 46 W | 55 W |
| CPU PL2 | 30 W | 115 W | 155 W |
| Cinebench R15 Puntuación múltiple | 1441 puntos | 3743 puntos | 3794 puntos |
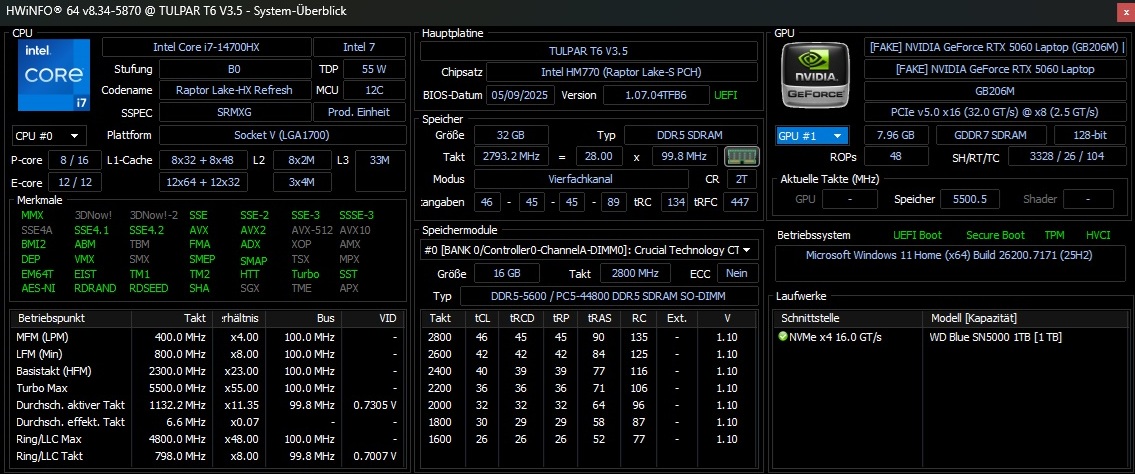
Procesador
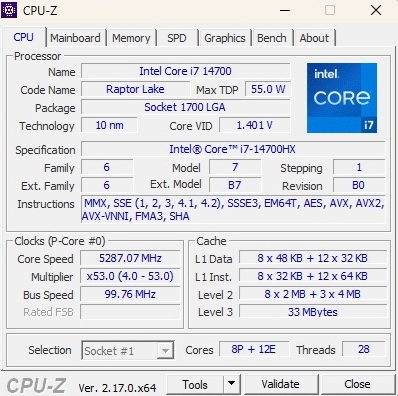
El Core i7-14700HX es un veloz procesador de la ya conocida generación Raptor Lake (10 nm). Ofrece ocho núcleos de rendimiento con Hyper-Threading y doce núcleos de eficiencia sin él, para un total de hasta 28 hilos paralelos. En nuestros benchmarks, el T6 V3.5 rindió ligeramente por debajo de la media típica de esta CPU. Más preocupante es que en el bucle Cinebench, el rendimiento cayó bruscamente después de sólo unas pocas ejecuciones. Esto no refleja bien la gestión de la energía del sistema o el rendimiento de la refrigeración, y el problema persistió incluso en el modo Rendimiento.
Cinebench R15 Prueba de resistencia múltiple
* ... más pequeño es mejor
AIDA64: FP32 Ray-Trace | FPU Julia | CPU SHA3 | CPU Queen | FPU SinJulia | FPU Mandel | CPU AES | CPU ZLib | FP64 Ray-Trace | CPU PhotoWorxx
| Performance rating | |
| HP Omen 16-ap0091ng | |
| Media de la clase Gaming | |
| Lenovo Legion 5 15AHP G10 | |
| Medio Intel Core i7-14700HX | |
| Acer Nitro V 16 AI ANV16-42-R860 | |
| Tulpar T6 V3.5 | |
| Alienware 16 Aurora | |
| Gigabyte Gaming A16 GA6H | |
| AIDA64 / FP32 Ray-Trace | |
| HP Omen 16-ap0091ng | |
| Media de la clase Gaming (10227 - 85542, n=107, últimos 2 años) | |
| Lenovo Legion 5 15AHP G10 | |
| Acer Nitro V 16 AI ANV16-42-R860 | |
| Medio Intel Core i7-14700HX (14147 - 23676, n=9) | |
| Alienware 16 Aurora | |
| Tulpar T6 V3.5 | |
| Gigabyte Gaming A16 GA6H | |
| AIDA64 / FPU Julia | |
| HP Omen 16-ap0091ng | |
| Media de la clase Gaming (51376 - 238426, n=107, últimos 2 años) | |
| Lenovo Legion 5 15AHP G10 | |
| Medio Intel Core i7-14700HX (71875 - 116556, n=9) | |
| Acer Nitro V 16 AI ANV16-42-R860 | |
| Alienware 16 Aurora | |
| Tulpar T6 V3.5 | |
| Gigabyte Gaming A16 GA6H | |
| AIDA64 / CPU SHA3 | |
| HP Omen 16-ap0091ng | |
| Media de la clase Gaming (2180 - 9817, n=107, últimos 2 años) | |
| Lenovo Legion 5 15AHP G10 | |
| Medio Intel Core i7-14700HX (3388 - 5567, n=9) | |
| Acer Nitro V 16 AI ANV16-42-R860 | |
| Tulpar T6 V3.5 | |
| Alienware 16 Aurora | |
| Gigabyte Gaming A16 GA6H | |
| AIDA64 / CPU Queen | |
| HP Omen 16-ap0091ng | |
| Medio Intel Core i7-14700HX (129134 - 152200, n=9) | |
| Tulpar T6 V3.5 | |
| Lenovo Legion 5 15AHP G10 | |
| Media de la clase Gaming (49785 - 173351, n=94, últimos 2 años) | |
| Acer Nitro V 16 AI ANV16-42-R860 | |
| Alienware 16 Aurora | |
| Gigabyte Gaming A16 GA6H | |
| AIDA64 / FPU SinJulia | |
| HP Omen 16-ap0091ng | |
| Lenovo Legion 5 15AHP G10 | |
| Media de la clase Gaming (4424 - 33636, n=107, últimos 2 años) | |
| Medio Intel Core i7-14700HX (10266 - 14434, n=9) | |
| Acer Nitro V 16 AI ANV16-42-R860 | |
| Tulpar T6 V3.5 | |
| Alienware 16 Aurora | |
| Gigabyte Gaming A16 GA6H | |
| AIDA64 / FPU Mandel | |
| HP Omen 16-ap0091ng | |
| Media de la clase Gaming (25115 - 128721, n=107, últimos 2 años) | |
| Lenovo Legion 5 15AHP G10 | |
| Medio Intel Core i7-14700HX (35155 - 58380, n=9) | |
| Acer Nitro V 16 AI ANV16-42-R860 | |
| Alienware 16 Aurora | |
| Tulpar T6 V3.5 | |
| Gigabyte Gaming A16 GA6H | |
| AIDA64 / CPU AES | |
| HP Omen 16-ap0091ng | |
| Media de la clase Gaming (39258 - 247074, n=107, últimos 2 años) | |
| Medio Intel Core i7-14700HX (68616 - 113157, n=9) | |
| Tulpar T6 V3.5 | |
| Lenovo Legion 5 15AHP G10 | |
| Acer Nitro V 16 AI ANV16-42-R860 | |
| Alienware 16 Aurora | |
| Gigabyte Gaming A16 GA6H | |
| AIDA64 / CPU ZLib | |
| HP Omen 16-ap0091ng | |
| Media de la clase Gaming (574 - 2531, n=107, últimos 2 años) | |
| Medio Intel Core i7-14700HX (1003 - 1682, n=9) | |
| Lenovo Legion 5 15AHP G10 | |
| Tulpar T6 V3.5 | |
| Alienware 16 Aurora | |
| Acer Nitro V 16 AI ANV16-42-R860 | |
| Gigabyte Gaming A16 GA6H | |
| AIDA64 / FP64 Ray-Trace | |
| HP Omen 16-ap0091ng | |
| Media de la clase Gaming (5509 - 45446, n=107, últimos 2 años) | |
| Lenovo Legion 5 15AHP G10 | |
| Acer Nitro V 16 AI ANV16-42-R860 | |
| Medio Intel Core i7-14700HX (7585 - 12928, n=9) | |
| Alienware 16 Aurora | |
| Tulpar T6 V3.5 | |
| Gigabyte Gaming A16 GA6H | |
| AIDA64 / CPU PhotoWorxx | |
| Tulpar T6 V3.5 | |
| Media de la clase Gaming (12271 - 89891, n=107, últimos 2 años) | |
| Medio Intel Core i7-14700HX (24276 - 49671, n=9) | |
| Lenovo Legion 5 15AHP G10 | |
| Alienware 16 Aurora | |
| Acer Nitro V 16 AI ANV16-42-R860 | |
| Gigabyte Gaming A16 GA6H | |
| HP Omen 16-ap0091ng | |
Rendimiento del sistema
El rendimiento del sistema, por el contrario, es poco destacable. Aparte de la relativamente lenta unidad SSD, a la que nos referiremos en breve, no hay nada especialmente digno de mención aquí.
PCMark 10: Score | Essentials | Productivity | Digital Content Creation
CrossMark: Overall | Productivity | Creativity | Responsiveness
WebXPRT 3: Overall
WebXPRT 4: Overall
Mozilla Kraken 1.1: Total
| Performance rating | |
| Media de la clase Gaming | |
| HP Omen 16-ap0091ng | |
| Lenovo Legion 5 15AHP G10 | |
| Alienware 16 Aurora -4! | |
| Tulpar T6 V3.5 | |
| Medio Intel Core i7-14700HX, NVIDIA GeForce RTX 5060 Laptop | |
| Gigabyte Gaming A16 GA6H | |
| Acer Nitro V 16 AI ANV16-42-R860 | |
| PCMark 10 / Score | |
| Media de la clase Gaming (5828 - 11574, n=95, últimos 2 años) | |
| Lenovo Legion 5 15AHP G10 | |
| HP Omen 16-ap0091ng | |
| Tulpar T6 V3.5 | |
| Medio Intel Core i7-14700HX, NVIDIA GeForce RTX 5060 Laptop (n=1) | |
| Acer Nitro V 16 AI ANV16-42-R860 | |
| Gigabyte Gaming A16 GA6H | |
| PCMark 10 / Essentials | |
| Lenovo Legion 5 15AHP G10 | |
| HP Omen 16-ap0091ng | |
| Media de la clase Gaming (8810 - 12600, n=99, últimos 2 años) | |
| Tulpar T6 V3.5 | |
| Medio Intel Core i7-14700HX, NVIDIA GeForce RTX 5060 Laptop (n=1) | |
| Gigabyte Gaming A16 GA6H | |
| Acer Nitro V 16 AI ANV16-42-R860 | |
| PCMark 10 / Productivity | |
| Media de la clase Gaming (6845 - 21327, n=97, últimos 2 años) | |
| Lenovo Legion 5 15AHP G10 | |
| HP Omen 16-ap0091ng | |
| Acer Nitro V 16 AI ANV16-42-R860 | |
| Tulpar T6 V3.5 | |
| Medio Intel Core i7-14700HX, NVIDIA GeForce RTX 5060 Laptop (n=1) | |
| Gigabyte Gaming A16 GA6H | |
| PCMark 10 / Digital Content Creation | |
| Media de la clase Gaming (7602 - 19657, n=97, últimos 2 años) | |
| Lenovo Legion 5 15AHP G10 | |
| HP Omen 16-ap0091ng | |
| Tulpar T6 V3.5 | |
| Medio Intel Core i7-14700HX, NVIDIA GeForce RTX 5060 Laptop (n=1) | |
| Gigabyte Gaming A16 GA6H | |
| Acer Nitro V 16 AI ANV16-42-R860 | |
| CrossMark / Overall | |
| Alienware 16 Aurora | |
| Media de la clase Gaming (1366 - 2409, n=96, últimos 2 años) | |
| HP Omen 16-ap0091ng | |
| Tulpar T6 V3.5 | |
| Medio Intel Core i7-14700HX, NVIDIA GeForce RTX 5060 Laptop (n=1) | |
| Gigabyte Gaming A16 GA6H | |
| Lenovo Legion 5 15AHP G10 | |
| Acer Nitro V 16 AI ANV16-42-R860 | |
| CrossMark / Productivity | |
| Alienware 16 Aurora | |
| Media de la clase Gaming (1386 - 2254, n=96, últimos 2 años) | |
| HP Omen 16-ap0091ng | |
| Gigabyte Gaming A16 GA6H | |
| Lenovo Legion 5 15AHP G10 | |
| Tulpar T6 V3.5 | |
| Medio Intel Core i7-14700HX, NVIDIA GeForce RTX 5060 Laptop (n=1) | |
| Acer Nitro V 16 AI ANV16-42-R860 | |
| CrossMark / Creativity | |
| Tulpar T6 V3.5 | |
| Medio Intel Core i7-14700HX, NVIDIA GeForce RTX 5060 Laptop (n=1) | |
| Media de la clase Gaming (1343 - 2729, n=96, últimos 2 años) | |
| Alienware 16 Aurora | |
| HP Omen 16-ap0091ng | |
| Lenovo Legion 5 15AHP G10 | |
| Gigabyte Gaming A16 GA6H | |
| Acer Nitro V 16 AI ANV16-42-R860 | |
| CrossMark / Responsiveness | |
| Alienware 16 Aurora | |
| Gigabyte Gaming A16 GA6H | |
| Media de la clase Gaming (1226 - 2334, n=96, últimos 2 años) | |
| Lenovo Legion 5 15AHP G10 | |
| HP Omen 16-ap0091ng | |
| Acer Nitro V 16 AI ANV16-42-R860 | |
| Tulpar T6 V3.5 | |
| Medio Intel Core i7-14700HX, NVIDIA GeForce RTX 5060 Laptop (n=1) | |
| WebXPRT 3 / Overall | |
| HP Omen 16-ap0091ng | |
| Media de la clase Gaming (220 - 532, n=100, últimos 2 años) | |
| Lenovo Legion 5 15AHP G10 | |
| Tulpar T6 V3.5 | |
| Medio Intel Core i7-14700HX, NVIDIA GeForce RTX 5060 Laptop (n=1) | |
| Alienware 16 Aurora | |
| Acer Nitro V 16 AI ANV16-42-R860 | |
| Gigabyte Gaming A16 GA6H | |
| WebXPRT 4 / Overall | |
| Tulpar T6 V3.5 | |
| Medio Intel Core i7-14700HX, NVIDIA GeForce RTX 5060 Laptop (n=1) | |
| Media de la clase Gaming (165 - 354, n=101, últimos 2 años) | |
| Lenovo Legion 5 15AHP G10 | |
| Alienware 16 Aurora | |
| Gigabyte Gaming A16 GA6H | |
| HP Omen 16-ap0091ng | |
| Acer Nitro V 16 AI ANV16-42-R860 | |
| Mozilla Kraken 1.1 / Total | |
| Acer Nitro V 16 AI ANV16-42-R860 | |
| Alienware 16 Aurora | |
| Gigabyte Gaming A16 GA6H | |
| HP Omen 16-ap0091ng | |
| Lenovo Legion 5 15AHP G10 | |
| Tulpar T6 V3.5 | |
| Medio Intel Core i7-14700HX, NVIDIA GeForce RTX 5060 Laptop (n=1) | |
| Media de la clase Gaming (391 - 590, n=104, últimos 2 años) | |
* ... más pequeño es mejor
| PCMark 10 Score | 7269 puntos | |
ayuda | ||
| AIDA64 / Memory Copy | |
| Tulpar T6 V3.5 | |
| Media de la clase Gaming (21750 - 129946, n=107, últimos 2 años) | |
| Lenovo Legion 5 15AHP G10 | |
| Medio Intel Core i7-14700HX (41617 - 78742, n=9) | |
| Alienware 16 Aurora | |
| Acer Nitro V 16 AI ANV16-42-R860 | |
| Gigabyte Gaming A16 GA6H | |
| HP Omen 16-ap0091ng | |
| AIDA64 / Memory Read | |
| Tulpar T6 V3.5 | |
| Medio Intel Core i7-14700HX (46627 - 86175, n=9) | |
| Media de la clase Gaming (22956 - 118858, n=107, últimos 2 años) | |
| Alienware 16 Aurora | |
| Acer Nitro V 16 AI ANV16-42-R860 | |
| Lenovo Legion 5 15AHP G10 | |
| HP Omen 16-ap0091ng | |
| Gigabyte Gaming A16 GA6H | |
| AIDA64 / Memory Write | |
| Lenovo Legion 5 15AHP G10 | |
| Acer Nitro V 16 AI ANV16-42-R860 | |
| Tulpar T6 V3.5 | |
| Media de la clase Gaming (22297 - 135096, n=107, últimos 2 años) | |
| Medio Intel Core i7-14700HX (39155 - 76976, n=9) | |
| Alienware 16 Aurora | |
| HP Omen 16-ap0091ng | |
| Gigabyte Gaming A16 GA6H | |
| AIDA64 / Memory Latency | |
| Media de la clase Gaming (75.3 - 259, n=107, últimos 2 años) | |
| Alienware 16 Aurora | |
| Gigabyte Gaming A16 GA6H | |
| Acer Nitro V 16 AI ANV16-42-R860 | |
| Lenovo Legion 5 15AHP G10 | |
| Medio Intel Core i7-14700HX (82.7 - 96.4, n=9) | |
| Tulpar T6 V3.5 | |
| HP Omen 16-ap0091ng | |
* ... más pequeño es mejor
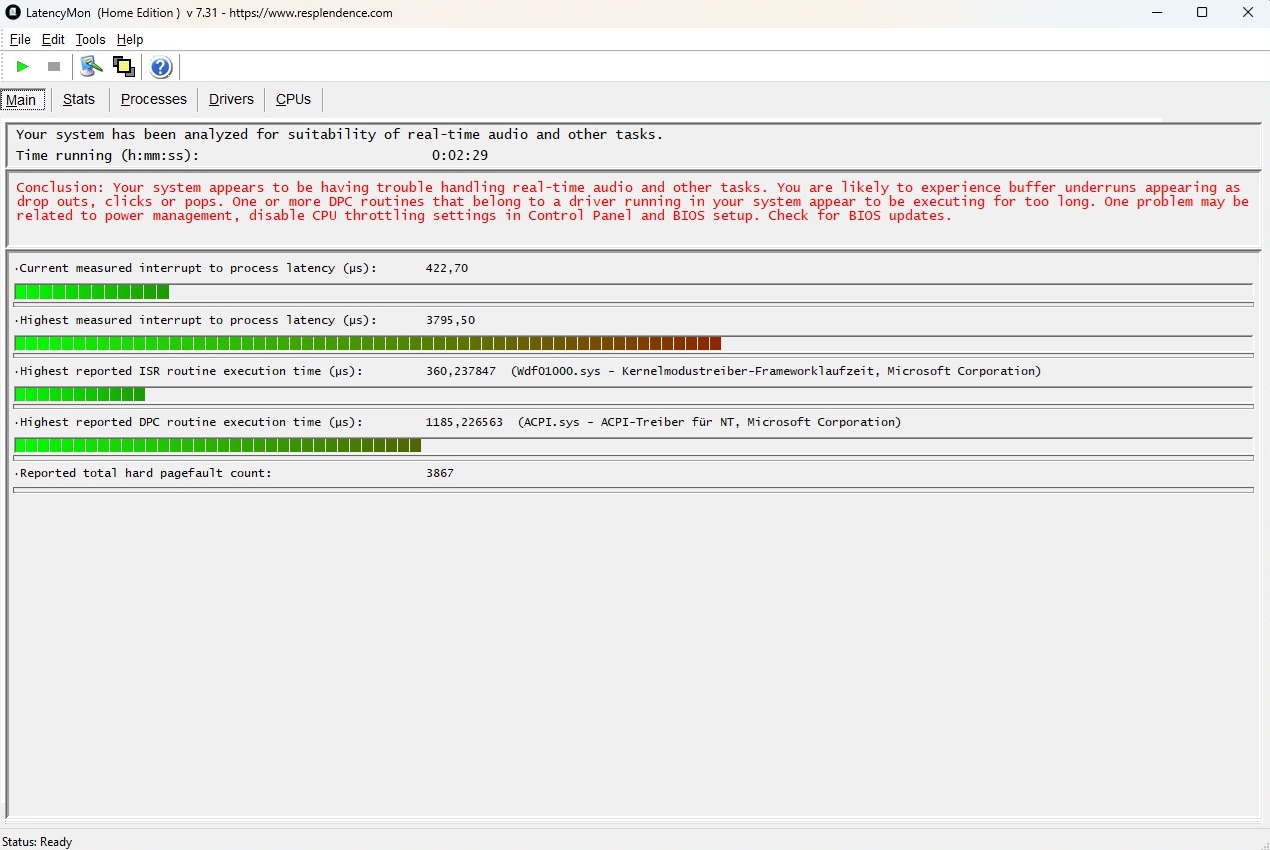
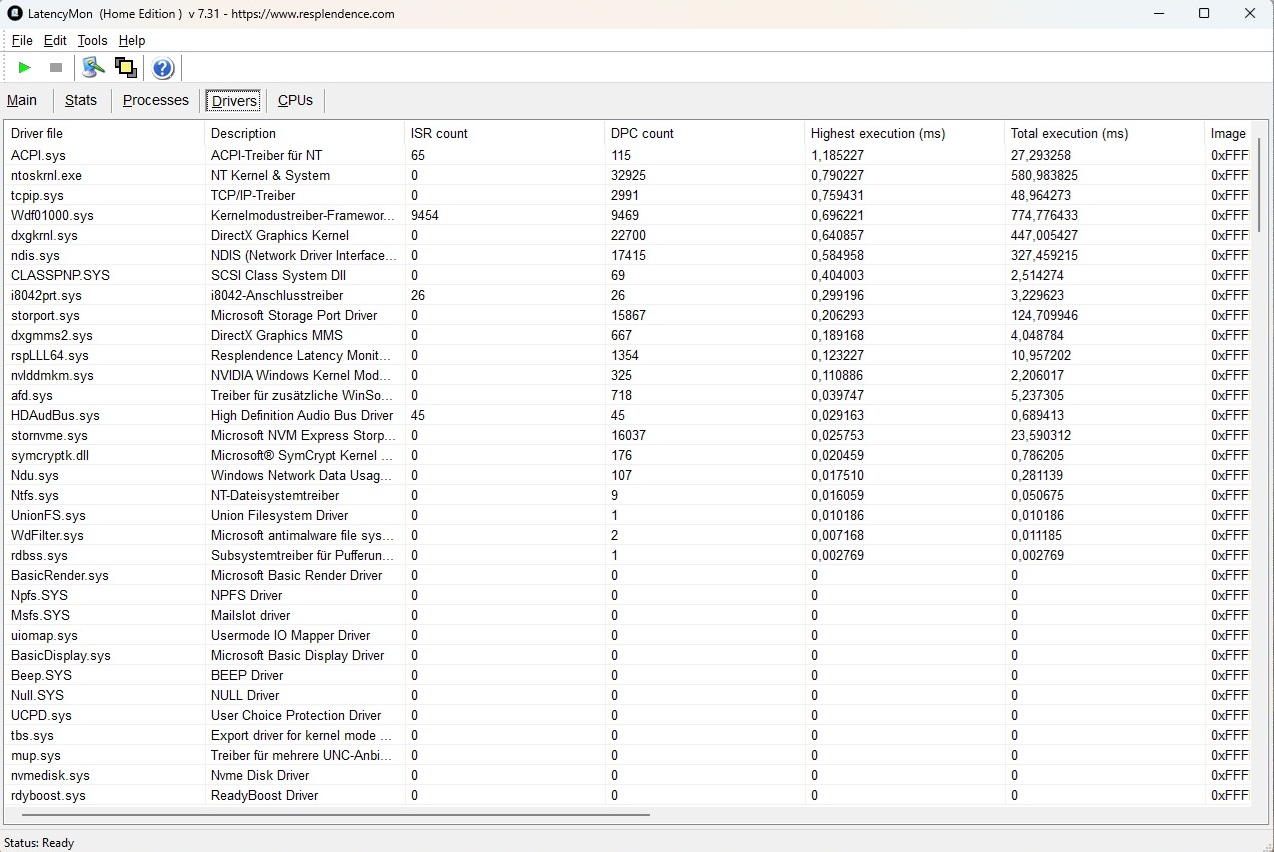
Latencias del CPD
Los resultados de latencia podrían ser mejores, pero están en el mismo rango que los modelos comparables de Gigabyte y Acer.
| DPC Latencies / LatencyMon - interrupt to process latency (max), Web, Youtube, Prime95 | |
| Gigabyte Gaming A16 GA6H | |
| Acer Nitro V 16 AI ANV16-42-R860 | |
| Tulpar T6 V3.5 | |
| Lenovo Legion 5 15AHP G10 | |
| HP Omen 16-ap0091ng | |
* ... más pequeño es mejor
Dispositivos de almacenamiento
A diferencia de la CPU, el sistema de almacenamiento mantiene todo su rendimiento a lo largo del tiempo, lo que no puede decirse de todos los competidores. Aun así, la unidad Western Digital de 1 TB incorporada se sitúa en el extremo inferior en las pruebas comparativas de SSD, con velocidades de escritura especialmente débiles.

* ... más pequeño es mejor
Rendimiento continuo de lectura: Bucle de lectura DiskSpd, profundidad de cola 8
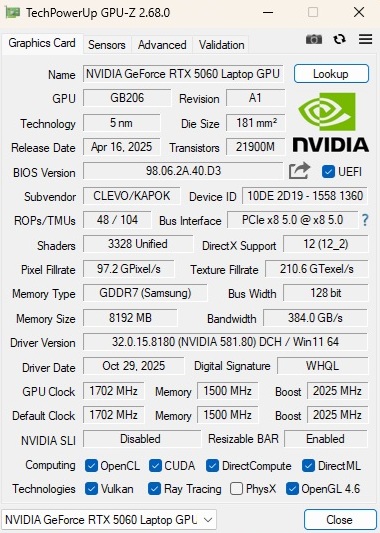
Rendimiento de la GPU
La tarjeta gráfica tampoco alcanza todo su potencial. Aunque la GeForce RTX 5060 está clasificada para su TGP completo de 115 vatios sobre el papel (incluidos 15 vatios de Dynamic Boost), el rendimiento en el mundo real queda ligeramente por debajo de la media típica de las RTX 5060 y se sitúa aproximadamente al nivel de la Alienware 16 Aurora.
| 3DMark 11 Performance | 31398 puntos | |
| 3DMark Cloud Gate Standard Score | 47731 puntos | |
| 3DMark Fire Strike Score | 26286 puntos | |
| 3DMark Time Spy Score | 11164 puntos | |
ayuda | ||
* ... más pequeño es mejor
Rendimiento de juego
En las pruebas comparativas de juegos, la diferencia de rendimiento se reduce, y el Tulpar T6 V3.5 ofrece en general lo que cabría esperar. Los títulos más antiguos o menos exigentes se ejecutan con gran fluidez con los ajustes máximos, pero los juegos más nuevos y con mayor carga de CPU, como Borderlands 4 a veces requieren un escalado incluso a la resolución nativa Full HD+.
Con DLSS Balanced Transformer activado, por ejemplo, Black Ops 7 mejoró de 32 a 49 fps en el preajuste Extremo con trazado de rayos alto. Con la generación cuádruple de fotogramas añadida, el sistema alcanzó los 141 fps, aunque la mejora percibida no es una correspondencia directa 1:1 con los números.
| bajo | medio | alto | ultra | |
|---|---|---|---|---|
| GTA V (2015) | 178.9 | 176.1 | 123.8 | |
| Dota 2 Reborn (2015) | 168.2 | 163.6 | 150.6 | |
| Final Fantasy XV Benchmark (2018) | 143.7 | 110 | ||
| X-Plane 11.11 (2018) | 118.3 | 102.8 | ||
| Strange Brigade (2018) | 288 | 227 | 195 | |
| Baldur's Gate 3 (2023) | 95 | 93 | 90 | |
| Cyberpunk 2077 (2023) | 107.4 | 93.2 | 81.8 | |
| Borderlands 4 (2025) | 40.3 | 31.6 | 16.3 | |
| The Outer Worlds 2 (2025) | 82.1 | 65 | 35.7 | |
| ARC Raiders (2025) | 118.4 | 93.5 | 59.8 | |
| Anno 117: Pax Romana (2025) | 73.8 | 55.4 | 28.4 | |
| Call of Duty Black Ops 7 (2025) | 130 | 95 | 32 |
| The Outer Worlds 2 | |
| 1920x1080 High Preset AA:T | |
| Media de la clase Gaming (51.1 - 94.5, n=11, últimos 2 años) | |
| Medio NVIDIA GeForce RTX 5060 Laptop (58.3 - 72.7, n=4) | |
| Tulpar T6 V3.5 | |
| Acer Nitro V 16 AI ANV16-42-R860 | |
| 1920x1080 Very High Preset AA:T | |
| Media de la clase Gaming (26.4 - 58.4, n=11, últimos 2 años) | |
| Medio NVIDIA GeForce RTX 5060 Laptop (31.1 - 40.9, n=4) | |
| Tulpar T6 V3.5 | |
| Acer Nitro V 16 AI ANV16-42-R860 | |
| Borderlands 4 | |
| 1920x1080 High Preset AA:FX | |
| Media de la clase Gaming (28.7 - 76.6, n=13, últimos 2 años) | |
| Medio NVIDIA GeForce RTX 5060 Laptop (28.7 - 39.3, n=4) | |
| Tulpar T6 V3.5 | |
| Acer Nitro V 16 AI ANV16-42-R860 | |
| 1920x1080 Badass Preset AA:FX | |
| Media de la clase Gaming (16 - 54, n=13, últimos 2 años) | |
| Medio NVIDIA GeForce RTX 5060 Laptop (16.3 - 24.8, n=4) | |
| Acer Nitro V 16 AI ANV16-42-R860 | |
| Tulpar T6 V3.5 | |
| Call of Duty Black Ops 7 | |
| 1920x1080 Ultra Preset | |
| Media de la clase Gaming (70 - 157, n=11, últimos 2 años) | |
| Medio NVIDIA GeForce RTX 5060 Laptop (95 - 103, n=4) | |
| Tulpar T6 V3.5 | |
| 1920x1080 Extreme Preset + Raytracing | |
| Media de la clase Gaming (24 - 60, n=11, últimos 2 años) | |
| Medio NVIDIA GeForce RTX 5060 Laptop (32 - 38, n=4) | |
| Tulpar T6 V3.5 | |
| ARC Raiders | |
| 1920x1080 High Preset AA:TSR | |
| Media de la clase Gaming (64.5 - 144.4, n=11, últimos 2 años) | |
| Tulpar T6 V3.5 | |
| Medio NVIDIA GeForce RTX 5060 Laptop (79.9 - 104.9, n=4) | |
| 1920x1080 Epic Preset + Epic Raytracing AA:TSR | |
| Media de la clase Gaming (43.5 - 98.6, n=11, últimos 2 años) | |
| Medio NVIDIA GeForce RTX 5060 Laptop (55 - 70.2, n=4) | |
| Tulpar T6 V3.5 | |
En una prueba de estrés de 30 minutos de Cyberpunk 2077, la tasa de imágenes por segundo se mantuvo prácticamente estable.
Cyberpunk 2077 ultra FPS gráfico
Emisiones
Ruido del sistema
Al control del ventilador le vendría bien algo de trabajo. Incluso cuando el sistema está en reposo, los ventiladores se disparan ocasionalmente, lo que puede resultar irritante. Bajo carga, el portátil de 16 pulgadas se hace claramente audible, con niveles de ruido de 52 a 53 dB(A) que hacen de unos auriculares la elección más sensata.
Ruido
| Ocioso |
| 26 / 29 / 31 dB(A) |
| Carga |
| 52 / 53 dB(A) |
 | ||
30 dB silencioso 40 dB(A) audible 50 dB(A) ruidosamente alto |
||
min: | ||
| Tulpar T6 V3.5 i7-14700HX, GeForce RTX 5060 Laptop | Acer Nitro V 16 AI ANV16-42-R860 R5 240, GeForce RTX 5050 Laptop | Alienware 16 Aurora Core 7 240H, GeForce RTX 5060 Laptop | HP Omen 16-ap0091ng R9 8940HX, GeForce RTX 5060 Laptop | Lenovo Legion 5 15AHP G10 R7 260, GeForce RTX 5060 Laptop | Gigabyte Gaming A16 GA6H i7-13620H, GeForce RTX 5070 Laptop | |
|---|---|---|---|---|---|---|
| Noise | 4% | 7% | 8% | 9% | 2% | |
| apagado / medio ambiente * (dB) | 24 | 25 -4% | 22.9 5% | 23 4% | 25.5 -6% | 24 -0% |
| Idle Minimum * (dB) | 26 | 25 4% | 24 8% | 23 12% | 25.5 2% | 25 4% |
| Idle Average * (dB) | 29 | 30 -3% | 25.6 12% | 23 21% | 25.5 12% | 26 10% |
| Idle Maximum * (dB) | 31 | 33 -6% | 25.6 17% | 27.64 11% | 26.9 13% | 27 13% |
| Load Average * (dB) | 52 | 38 27% | 46.8 10% | 49.5 5% | 34.6 33% | 54 -4% |
| Cyberpunk 2077 ultra * (dB) | 52 | 49 6% | 49.9 4% | 49.5 5% | 50.1 4% | 54 -4% |
| Load Maximum * (dB) | 53 | 50 6% | 55.6 -5% | 52.73 1% | 50.1 5% | 55 -4% |
* ... más pequeño es mejor
Temperatura
Las temperaturas de la superficie se mantienen razonables en cargas de trabajo 3D, con la parte superior alcanzando un máximo de 40 °C. Sin embargo, la parte inferior puede calentarse hasta 47 °C. En reposo, el chasis se asienta en unos moderados 24 a 35 °C.
(±) La temperatura máxima en la parte superior es de 40 °C / 104 F, frente a la media de 40.4 °C / 105 F, que oscila entre 21.2 y 68.8 °C para la clase Gaming.
(-) El fondo se calienta hasta un máximo de 47 °C / 117 F, frente a la media de 43.2 °C / 110 F
(+) En reposo, la temperatura media de la parte superior es de 27.4 °C / 81# F, frente a la media del dispositivo de 33.9 °C / 93 F.
(±) 3: The average temperature for the upper side is 34.8 °C / 95 F, compared to the average of 33.9 °C / 93 F for the class Gaming.
(+) El reposamanos y el panel táctil están a una temperatura inferior a la de la piel, con un máximo de 27 °C / 80.6 F y, por tanto, son fríos al tacto.
(±) La temperatura media de la zona del reposamanos de dispositivos similares fue de 28.8 °C / 83.8 F (+1.8 °C / 3.2 F).
| Tulpar T6 V3.5 i7-14700HX, GeForce RTX 5060 Laptop | Acer Nitro V 16 AI ANV16-42-R860 R5 240, GeForce RTX 5050 Laptop | Alienware 16 Aurora Core 7 240H, GeForce RTX 5060 Laptop | HP Omen 16-ap0091ng R9 8940HX, GeForce RTX 5060 Laptop | Lenovo Legion 5 15AHP G10 R7 260, GeForce RTX 5060 Laptop | Gigabyte Gaming A16 GA6H i7-13620H, GeForce RTX 5070 Laptop | |
|---|---|---|---|---|---|---|
| Heat | -10% | 10% | 2% | -11% | ||
| Maximum Upper Side * (°C) | 40 | 45 -13% | 36 10% | 42.2 -6% | 50 -25% | |
| Maximum Bottom * (°C) | 47 | 59 -26% | 37 21% | 51.7 -10% | 49 -4% | |
| Idle Upper Side * (°C) | 30 | 29 3% | 30 -0% | 28.5 5% | 35 -17% | |
| Idle Bottom * (°C) | 35 | 36 -3% | 32 9% | 29.2 17% | 34 3% |
* ... más pequeño es mejor
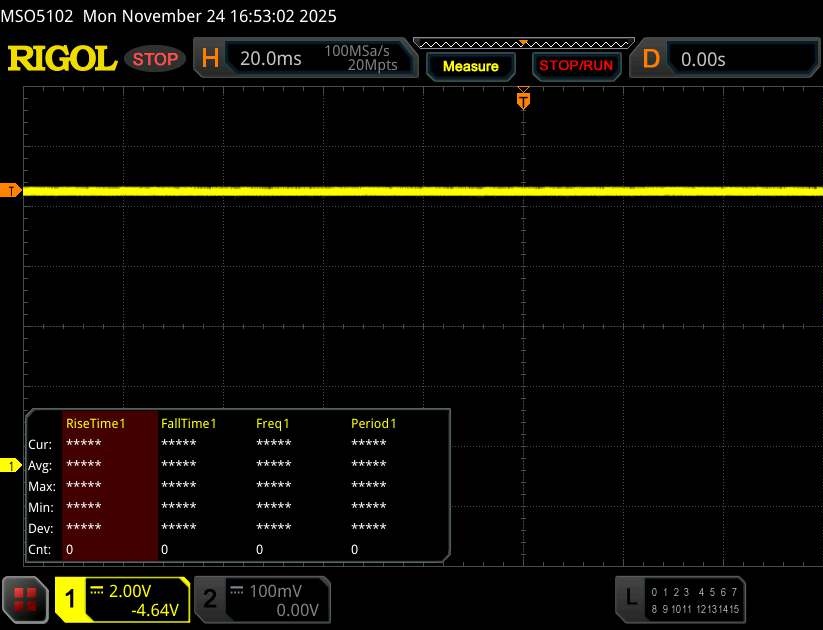
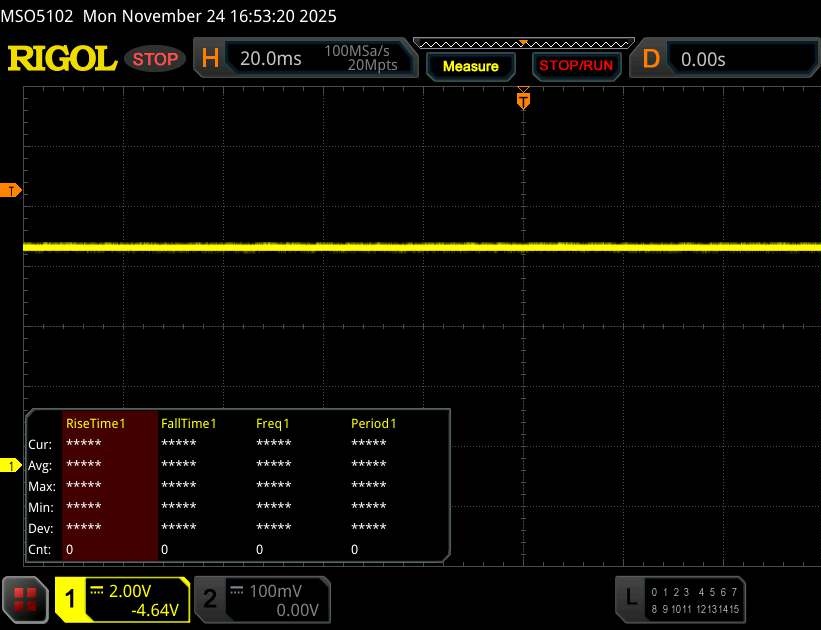
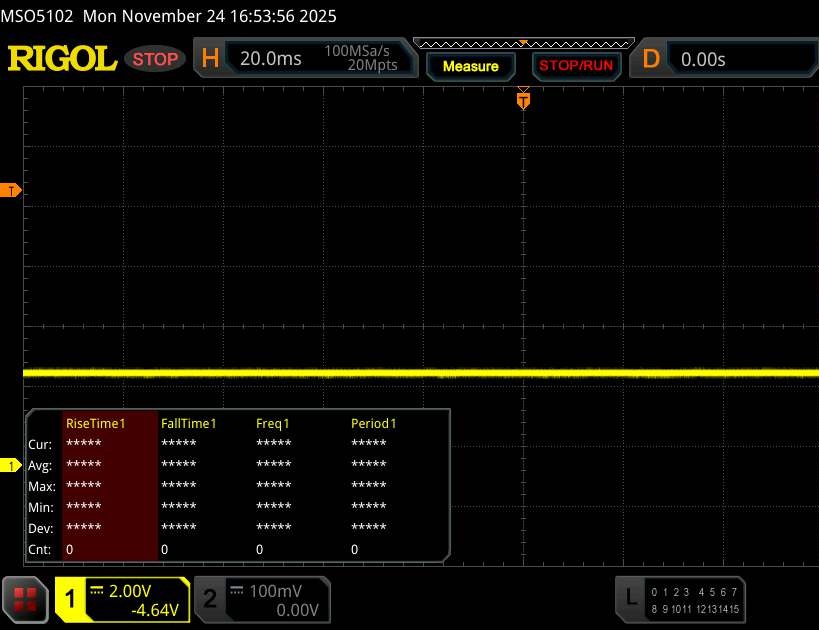
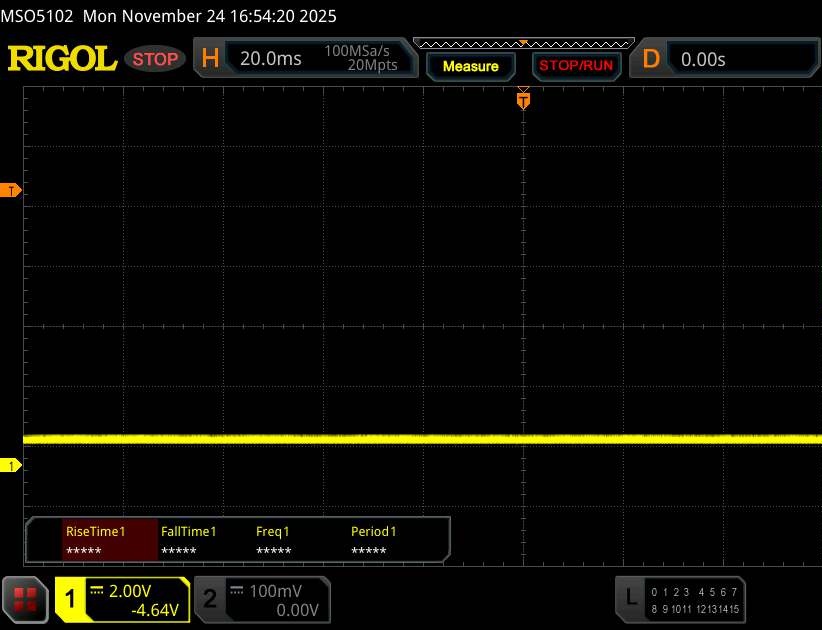
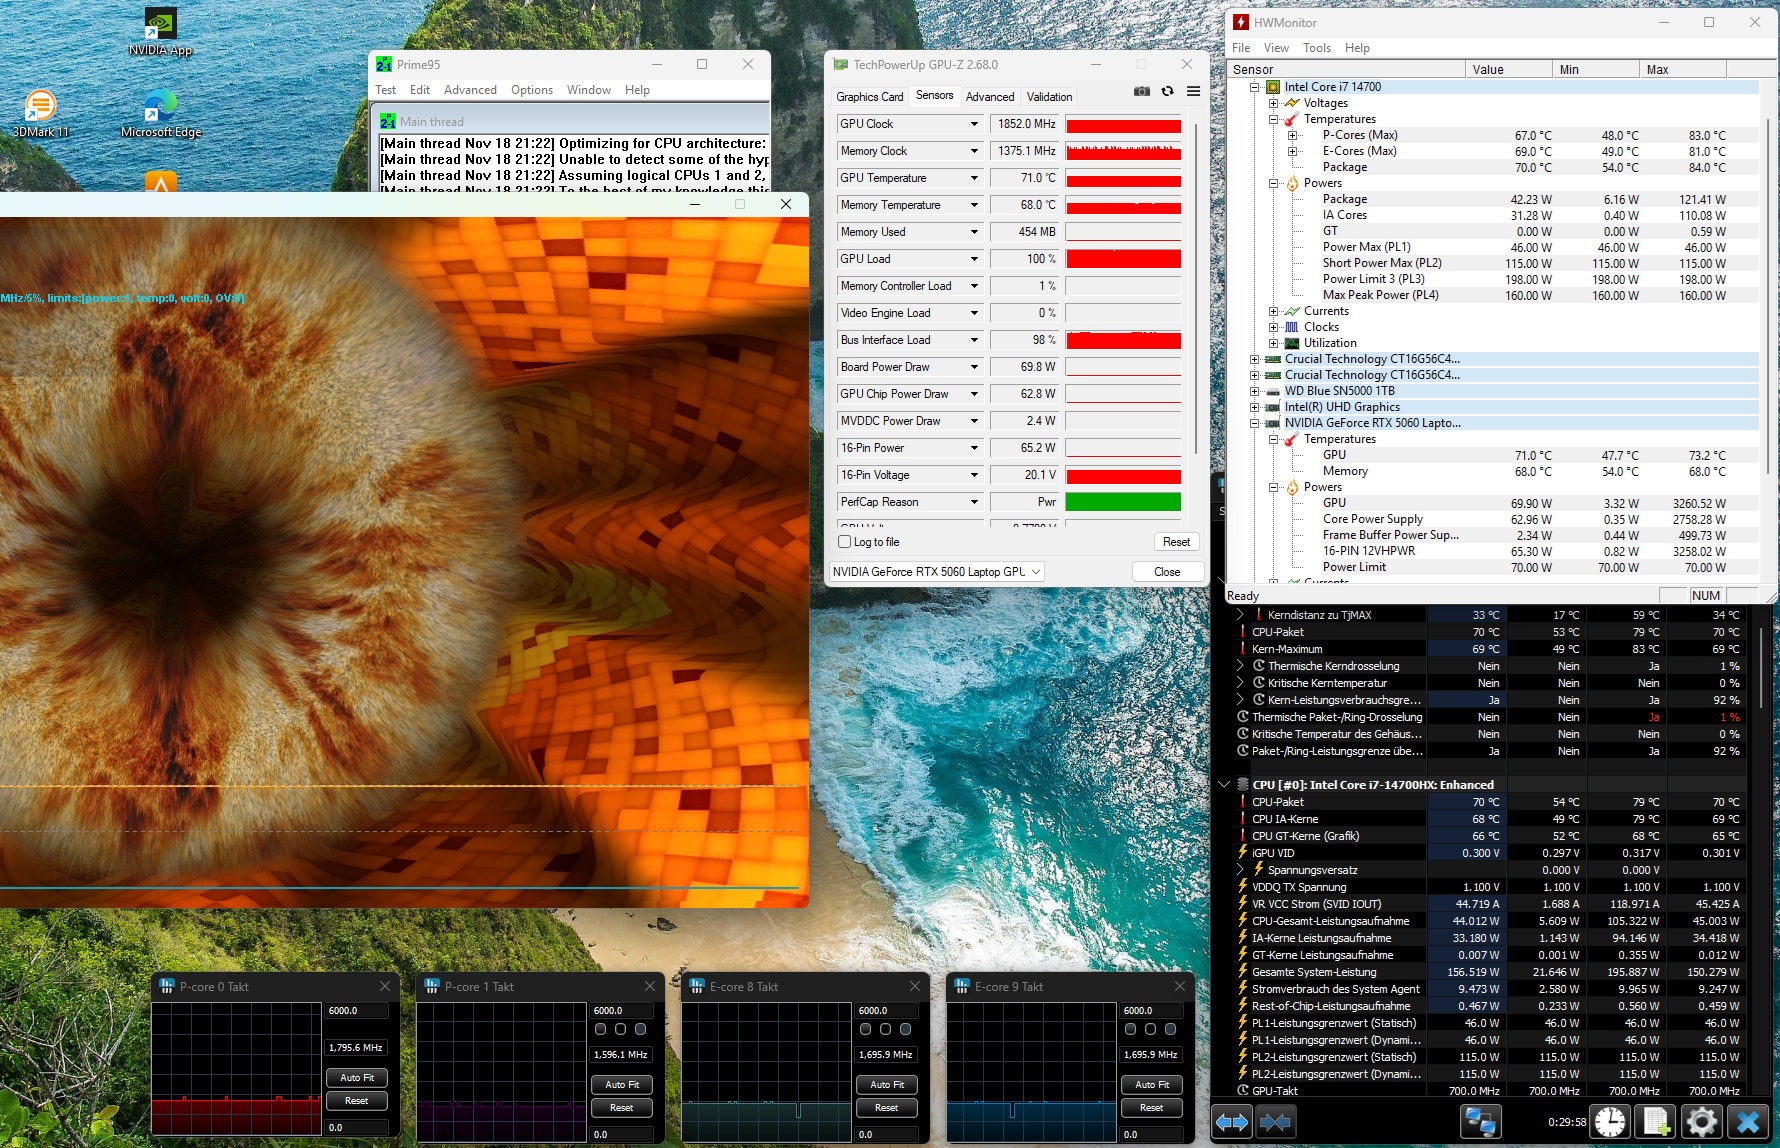
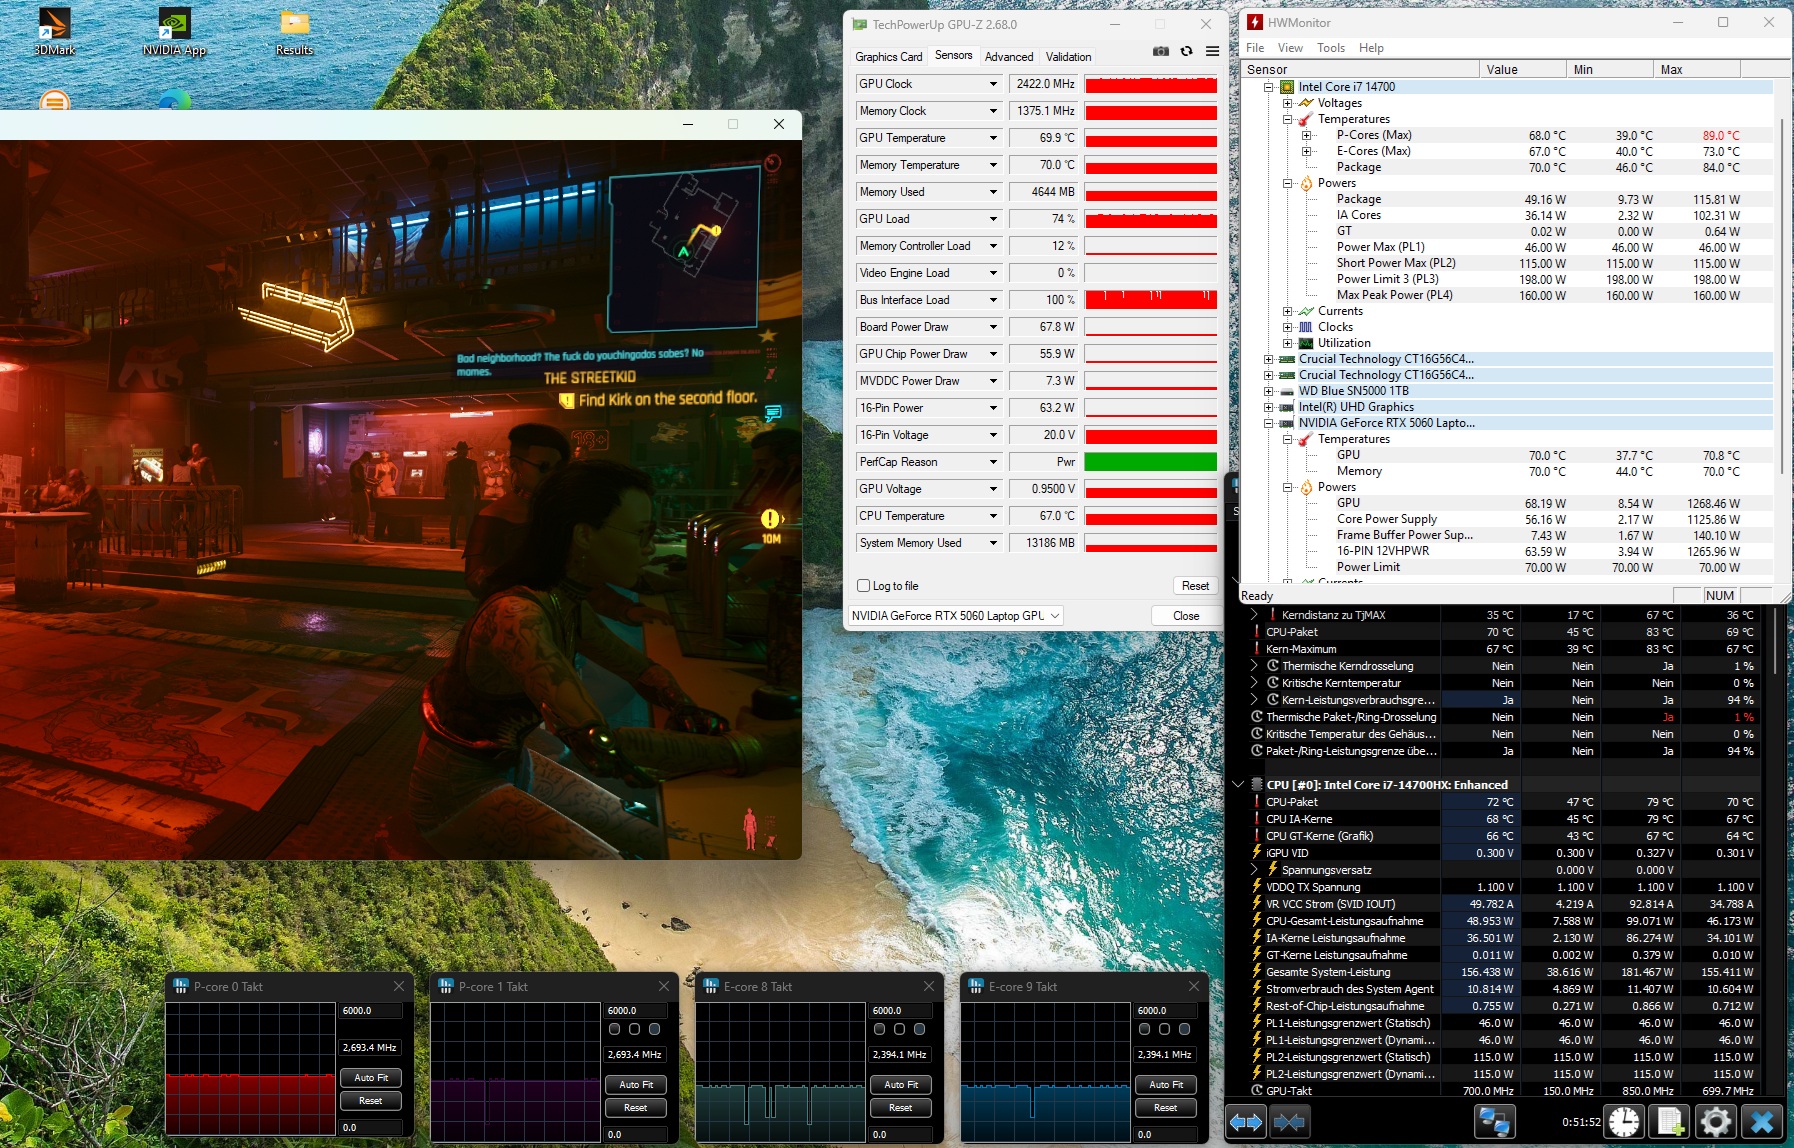
Prueba de esfuerzo
El Core i7-14700HX de ralentización completó la prueba de estrés combinada Furmark y Prime95 a unos 70 °C, lo que es completamente inofensivo. La GeForce RTX 5060 también se niveló en torno a los 70 °C.
.jpg)
.jpg)
.jpg)
.jpg)
#0 could not convert image to webp (convert_image_webp function, file: /Notebooks/Tulpar/T6_V3.5/temp_tulpar-(1).jpg, status:2), tried cmd /usr/local/bin/magick /var/www/notebookcheck/fileadmin/Notebooks/Tulpar/T6_V3.5/temp_tulpar-(1).jpg -resize 227x -quality 82 -auto-orient /var/www/notebookcheck/fileadmin/_processed_/webp/Notebooks/Tulpar/T6_V3.5/temp_tulpar-(1)-q82-w227-h.webp && chmod 644 /var/www/notebookcheck/fileadmin/_processed_/webp/Notebooks/Tulpar/T6_V3.5/temp_tulpar-(1)-q82-w227-h.webp +0.001s ... 0.008s
#1 cant get getimagesize for webp image. +0s ... 0.008s
#2 could not convert image to webp (convert_image_webp function, file: /Notebooks/Tulpar/T6_V3.5/temp_tulpar-(1).jpg, status:2), tried cmd /usr/local/bin/magick /var/www/notebookcheck/fileadmin/Notebooks/Tulpar/T6_V3.5/temp_tulpar-(1).jpg -resize 454x -quality 82 -auto-orient /var/www/notebookcheck/fileadmin/_processed_/webp/Notebooks/Tulpar/T6_V3.5/temp_tulpar-(1)-q82-w454-h.webp && chmod 644 /var/www/notebookcheck/fileadmin/_processed_/webp/Notebooks/Tulpar/T6_V3.5/temp_tulpar-(1)-q82-w454-h.webp +0.001s ... 0.011s
#3 cant get getimagesize for webp image. +0s ... 0.011s
#4 could not convert image to webp (convert_image_webp function, file: /Notebooks/Tulpar/T6_V3.5/temp_tulpar-(2).jpg, status:2), tried cmd /usr/local/bin/magick /var/www/notebookcheck/fileadmin/Notebooks/Tulpar/T6_V3.5/temp_tulpar-(2).jpg -resize 227x -quality 82 -auto-orient /var/www/notebookcheck/fileadmin/_processed_/webp/Notebooks/Tulpar/T6_V3.5/temp_tulpar-(2)-q82-w227-h.webp && chmod 644 /var/www/notebookcheck/fileadmin/_processed_/webp/Notebooks/Tulpar/T6_V3.5/temp_tulpar-(2)-q82-w227-h.webp +0.001s ... 0.018s
#5 cant get getimagesize for webp image. +0s ... 0.018s
#6 could not convert image to webp (convert_image_webp function, file: /Notebooks/Tulpar/T6_V3.5/temp_tulpar-(2).jpg, status:2), tried cmd /usr/local/bin/magick /var/www/notebookcheck/fileadmin/Notebooks/Tulpar/T6_V3.5/temp_tulpar-(2).jpg -resize 454x -quality 82 -auto-orient /var/www/notebookcheck/fileadmin/_processed_/webp/Notebooks/Tulpar/T6_V3.5/temp_tulpar-(2)-q82-w454-h.webp && chmod 644 /var/www/notebookcheck/fileadmin/_processed_/webp/Notebooks/Tulpar/T6_V3.5/temp_tulpar-(2)-q82-w454-h.webp +0.001s ... 0.021s
#7 cant get getimagesize for webp image. +0s ... 0.021s
#8 could not convert image to webp (convert_image_webp function, file: /Notebooks/Tulpar/T6_V3.5/temp_tulpar-(3).jpg, status:2), tried cmd /usr/local/bin/magick /var/www/notebookcheck/fileadmin/Notebooks/Tulpar/T6_V3.5/temp_tulpar-(3).jpg -resize 226x -quality 82 -auto-orient /var/www/notebookcheck/fileadmin/_processed_/webp/Notebooks/Tulpar/T6_V3.5/temp_tulpar-(3)-q82-w226-h.webp && chmod 644 /var/www/notebookcheck/fileadmin/_processed_/webp/Notebooks/Tulpar/T6_V3.5/temp_tulpar-(3)-q82-w226-h.webp +0.001s ... 0.025s
#9 cant get getimagesize for webp image. +0s ... 0.025s
#10 could not convert image to webp (convert_image_webp function, file: /Notebooks/Tulpar/T6_V3.5/temp_tulpar-(3).jpg, status:2), tried cmd /usr/local/bin/magick /var/www/notebookcheck/fileadmin/Notebooks/Tulpar/T6_V3.5/temp_tulpar-(3).jpg -resize 452x -quality 82 -auto-orient /var/www/notebookcheck/fileadmin/_processed_/webp/Notebooks/Tulpar/T6_V3.5/temp_tulpar-(3)-q82-w452-h.webp && chmod 644 /var/www/notebookcheck/fileadmin/_processed_/webp/Notebooks/Tulpar/T6_V3.5/temp_tulpar-(3)-q82-w452-h.webp +0.001s ... 0.027s
#11 cant get getimagesize for webp image. +0s ... 0.027s
#12 could not convert image to webp (convert_image_webp function, file: /Notebooks/Tulpar/T6_V3.5/temp_tulpar-(4).jpg, status:2), tried cmd /usr/local/bin/magick /var/www/notebookcheck/fileadmin/Notebooks/Tulpar/T6_V3.5/temp_tulpar-(4).jpg -resize 226x -quality 82 -auto-orient /var/www/notebookcheck/fileadmin/_processed_/webp/Notebooks/Tulpar/T6_V3.5/temp_tulpar-(4)-q82-w226-h.webp && chmod 644 /var/www/notebookcheck/fileadmin/_processed_/webp/Notebooks/Tulpar/T6_V3.5/temp_tulpar-(4)-q82-w226-h.webp +0.001s ... 0.03s
#13 cant get getimagesize for webp image. +0s ... 0.03s
#14 could not convert image to webp (convert_image_webp function, file: /Notebooks/Tulpar/T6_V3.5/temp_tulpar-(4).jpg, status:2), tried cmd /usr/local/bin/magick /var/www/notebookcheck/fileadmin/Notebooks/Tulpar/T6_V3.5/temp_tulpar-(4).jpg -resize 452x -quality 82 -auto-orient /var/www/notebookcheck/fileadmin/_processed_/webp/Notebooks/Tulpar/T6_V3.5/temp_tulpar-(4)-q82-w452-h.webp && chmod 644 /var/www/notebookcheck/fileadmin/_processed_/webp/Notebooks/Tulpar/T6_V3.5/temp_tulpar-(4)-q82-w452-h.webp +0.001s ... 0.031s
#15 cant get getimagesize for webp image. +0s ... 0.031s
Altavoces
Dado que los altavoces 2.0 integrados ofrecen una calidad de sonido limitada, especialmente en la gama de graves, se recomienda utilizar un sistema de audio externo para un uso prolongado.
Tulpar T6 V3.5 análisis de audio
(+) | los altavoces pueden reproducir a un volumen relativamente alto (#82 dB)
Graves 100 - 315 Hz
(-) | casi sin bajos - de media 22.4% inferior a la mediana
(±) | la linealidad de los graves es media (14.4% delta a frecuencia anterior)
Medios 400 - 2000 Hz
(±) | medias más altas - de media 10.7% más altas que la mediana
(+) | los medios son lineales (6.6% delta a la frecuencia anterior)
Altos 2 - 16 kHz
(+) | máximos equilibrados - a sólo 3.5% de la mediana
(±) | la linealidad de los máximos es media (7.4% delta a frecuencia anterior)
Total 100 - 16.000 Hz
(±) | la linealidad del sonido global es media (24% de diferencia con la mediana)
En comparación con la misma clase
» 86% de todos los dispositivos probados de esta clase eran mejores, 4% similares, 9% peores
» El mejor tuvo un delta de 6%, la media fue 18%, el peor fue ###max##%
En comparación con todos los dispositivos probados
» 72% de todos los dispositivos probados eran mejores, 6% similares, 22% peores
» El mejor tuvo un delta de 4%, la media fue 24%, el peor fue ###max##%
HP Omen 16-ap0091ng análisis de audio
(±) | la sonoridad del altavoz es media pero buena (79.91 dB)
Graves 100 - 315 Hz
(-) | casi sin bajos - de media 18% inferior a la mediana
(±) | la linealidad de los graves es media (11.1% delta a frecuencia anterior)
Medios 400 - 2000 Hz
(±) | medias más altas - de media 6.9% más altas que la mediana
(±) | la linealidad de los medios es media (7.5% delta respecto a la frecuencia anterior)
Altos 2 - 16 kHz
(+) | máximos equilibrados - a sólo 2.1% de la mediana
(±) | la linealidad de los máximos es media (7.5% delta a frecuencia anterior)
Total 100 - 16.000 Hz
(±) | la linealidad del sonido global es media (17.8% de diferencia con la mediana)
En comparación con la misma clase
» 53% de todos los dispositivos probados de esta clase eran mejores, 10% similares, 37% peores
» El mejor tuvo un delta de 6%, la media fue 18%, el peor fue ###max##%
En comparación con todos los dispositivos probados
» 36% de todos los dispositivos probados eran mejores, 8% similares, 56% peores
» El mejor tuvo un delta de 4%, la media fue 24%, el peor fue ###max##%
Gestión de la energía
Consumo de energía
El consumo de energía es razonable en general, aunque la T6 V3.5 podría ser un poco más eficiente en comparación con algunos modelos de la competencia. Su adaptador de corriente de 230 vatios rara vez se acerca a su límite.
| Off / Standby | |
| Ocioso | |
| Carga |
|
Clave:
min: | |
| Tulpar T6 V3.5 i7-14700HX, GeForce RTX 5060 Laptop | Acer Nitro V 16 AI ANV16-42-R860 R5 240, GeForce RTX 5050 Laptop | Alienware 16 Aurora Core 7 240H, GeForce RTX 5060 Laptop | HP Omen 16-ap0091ng R9 8940HX, GeForce RTX 5060 Laptop | Lenovo Legion 5 15AHP G10 R7 260, GeForce RTX 5060 Laptop | Gigabyte Gaming A16 GA6H i7-13620H, GeForce RTX 5070 Laptop | Media de la clase Gaming | |
|---|---|---|---|---|---|---|---|
| Power Consumption | 38% | 17% | 1% | 15% | 10% | -26% | |
| Idle Minimum * (Watt) | 6.7 | 4.2 37% | 4.4 34% | 7.8 -16% | 6.9 -3% | 9 -34% | 13 ? -94% |
| Idle Average * (Watt) | 13.7 | 6.8 50% | 18 -31% | 8.8 36% | 10.7 22% | 11 20% | 18.7 ? -36% |
| Idle Maximum * (Watt) | 21.8 | 9.8 55% | 18.2 17% | 21.5 1% | 11.3 48% | 23 -6% | 24.3 ? -11% |
| Load Average * (Watt) | 127 | 62 51% | 87.1 31% | 119 6% | 69.7 45% | 91 28% | 108.2 ? 15% |
| Cyberpunk 2077 ultra external monitor * (Watt) | 151.9 | 129.6 15% | 120.6 21% | 164.5 -8% | 165 -9% | 130 14% | |
| Cyberpunk 2077 ultra * (Watt) | 156.7 | 130.3 17% | 123 22% | 192 -23% | 162.6 -4% | 132.5 15% | |
| Load Maximum * (Watt) | 242 | 135 44% | 183 24% | 208 14% | 233.6 3% | 155 36% | 254 ? -5% |
* ... más pequeño es mejor
consumo de energía Cyberpunk / Prueba de estrés
consumo de energía con monitor externo
Duración de las pilas
En nuestra prueba Wi-Fi con el brillo de la pantalla ajustado a 150 cd/m², la batería de 53 Wh duró algo menos de 4,5 horas, lo que es un resultado mediocre. A modo de comparación, los competidores con baterías más grandes de 70 a 96 Wh oscilan entre unas 5 horas (HP Omen 16) y 11 horas (Acer Nitro V 16 AI).
| Tulpar T6 V3.5 i7-14700HX, GeForce RTX 5060 Laptop, 53.35 Wh | Acer Nitro V 16 AI ANV16-42-R860 R5 240, GeForce RTX 5050 Laptop, 76 Wh | Alienware 16 Aurora Core 7 240H, GeForce RTX 5060 Laptop, 96 Wh | HP Omen 16-ap0091ng R9 8940HX, GeForce RTX 5060 Laptop, 70 Wh | Lenovo Legion 5 15AHP G10 R7 260, GeForce RTX 5060 Laptop, 80 Wh | Gigabyte Gaming A16 GA6H i7-13620H, GeForce RTX 5070 Laptop, 76 Wh | Media de la clase Gaming | |
|---|---|---|---|---|---|---|---|
| Duración de Batería | 155% | 70% | 14% | 120% | 75% | 59% | |
| WiFi v1.3 (h) | 4.4 | 11.2 155% | 7.5 70% | 5 14% | 9.7 120% | 7.7 75% | 7 ? 59% |
| H.264 (h) | 5.1 | 11.5 | 8.9 ? | ||||
| Load (h) | 1.3 | 1.2 | 1.51 ? | ||||
| Cyberpunk 2077 ultra 150cd (h) | 0.9 |
Valoración general de Notebookcheck
En general, el Tulpar T6 V3.5 es un sólido portátil para juegos con una RTX 5060 y una equilibrada relación precio-rendimiento.
Tulpar T6 V3.5
- 11/25/2025 v8
Florian Glaser
 Total Sustainability Score:
 Posibles alternativas en comparación
Imagen | Modelo | Precio | Peso | Altura | Pantalla |
|---|---|---|---|---|---|
1. 77.8%  | Tulpar T6 V3.5 Intel Core i7-14700HX ⎘ NVIDIA GeForce RTX 5060 Laptop ⎘ 32 GB Memoría, 1000 GB SSD | Amazon: Precio de catálogo: 1160 EUR | 2.4 kg | 25 mm | 16.00" 1920x1200 142 PPI IPS |
2. 77.5% 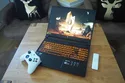 | Acer Nitro V 16 AI ANV16-42-R860 AMD Ryzen 5 240 ⎘ NVIDIA GeForce RTX 5050 Laptop ⎘ 16 GB Memoría, 1024 GB SSD | Amazon: 1. $949.99 acer Nitro V 16" WUXGA IPS G... 2. $16.99 180W/135W AC Adapter Compati... 3. $989.00 Acer Nitro V 16 AI Gaming La... Precio de catálogo: 1100 EUR | 2.4 kg | 24.5 mm | 16.00" 1920x1200 142 PPI IPS |
3. 76.2%  | Alienware 16 Aurora Intel Core 7 240H ⎘ NVIDIA GeForce RTX 5060 Laptop ⎘ 32 GB Memoría | Amazon: Precio de catálogo: 1100 USD | 2.6 kg | 15.2 mm | 16.00" 2560x1600 189 PPI IPS |
4. 82.5% 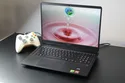 | HP Omen 16-ap0091ng AMD Ryzen 9 8940HX ⎘ NVIDIA GeForce RTX 5060 Laptop ⎘ 16 GB Memoría, 1000 GB SSD | Amazon: Precio de catálogo: 1500 Euro | 2.4 kg | 23.7 mm | 16.00" 1920x1200 162 PPI IPS |
5. 87.2%  | Lenovo Legion 5 15AHP G10 AMD Ryzen 7 260 ⎘ NVIDIA GeForce RTX 5060 Laptop ⎘ 32 GB Memoría, 1024 GB SSD | Amazon: Precio de catálogo: 1449€ | 1.9 kg | 21.5 mm | 15.10" 2560x1600 200 PPI OLED |
6. 80.1%  | Gigabyte Gaming A16 GA6H Intel Core i7-13620H ⎘ NVIDIA GeForce RTX 5070 Laptop ⎘ 16 GB Memoría, 1024 GB SSD | Amazon: 1. $1,598.77 GIGABYTE - Gaming A16 Gaming... 2. $1,085.33 GIGABYTE - Gaming A16 Gaming... 3. $1,224.02 GIGABYTE - Gaming A16 Gaming... Precio de catálogo: 1700 EUR | 2.3 kg | 23 mm | 16.00" 2560x1600 189 PPI IPS |
Transparencia
La selección de los dispositivos que se van a reseñar corre a cargo de nuestro equipo editorial. La muestra de prueba fue proporcionada al autor en calidad de préstamo por el fabricante o el minorista a los efectos de esta reseña. El prestamista no tuvo ninguna influencia en esta reseña, ni el fabricante recibió una copia de la misma antes de su publicación. No había ninguna obligación de publicar esta reseña. Como empresa de medios independiente, Notebookcheck no está sujeta a la autoridad de fabricantes, minoristas o editores.
Así es como prueba Notebookcheck
Cada año, Notebookcheck revisa de forma independiente cientos de portátiles y smartphones utilizando procedimientos estandarizados para asegurar que todos los resultados son comparables. Hemos desarrollado continuamente nuestros métodos de prueba durante unos 20 años y hemos establecido los estándares de la industria en el proceso. En nuestros laboratorios de pruebas, técnicos y editores experimentados utilizan equipos de medición de alta calidad. Estas pruebas implican un proceso de validación en varias fases. Nuestro complejo sistema de clasificación se basa en cientos de mediciones y puntos de referencia bien fundamentados, lo que mantiene la objetividad.