Notebookcheck Logo

NVIDIA GeForce RTX 5050 Laptop

La Nvidia GeForce RTX 5050 Laptop es una tarjeta gráfica dedicada de la familia Blackwell para portátiles, que fue presentada por Team Green en junio de 2025. Utiliza el chip GB207.

Al igual que la RTX 4050 Laptop, la GPU ofrece 2.560 sombreadores unificados (núcleos CUDA) combinados con un bus de memoria de 128 bits para 8 GB de memoria gráfica GDDR7.

Otras características de la GPU incluyen núcleos nativos de trazado de rayos de 5ª generación, compatibilidad con PCIe 5, DisplayPort 2.1a y 440 TOPS de rendimiento de IA (gracias a los núcleos Tensor incorporados).

El rendimiento sin generación de fotogramas DLSS debería ser similar al de la antigua GPU RTX 4060 para portátiles gPU para portátiles. La RTX 5060 es un 21 - 22% más rápida a 115 W (incl. Dynamic Boost) en las pruebas 3DMark (vía Videocardz). Como es habitual, el rendimiento depende en gran medida del consumo de energía (TGP) y de la refrigeración. Por tanto, también habrá modelos significativamente más lentos en portátiles.

El chip se fabrica en TSMC utilizando el proceso de 4nm (4N). El consumo de energía (TGP) está especificado entre 35 y 100 vatios (115 vatios incl. Dynamic Boost 2.0).

GeForce RTX 5000 Laptop GPU Serie

GeForce RTX 5090 Laptop 10496 @ 0.99 - 1.52 GHz256 Bit @ 28000 MHz
GeForce RTX 5080 Laptop 8192 @ 0.98 - 2.29 GHz256 Bit @ 28000 MHz
GeForce RTX 5070 Ti Laptop 5888 @ 0.85 - 2.22 GHz192 Bit @ 32000 MHz
GeForce RTX 5070 Laptop 4608 @ 0.91 - 2.35 GHz128 Bit @ 32000 MHz
GeForce RTX 5060 Laptop 3328 @ 0.95 - 1.46 GHz128 Bit @ 24000 MHz
GeForce RTX 5050 Laptop 2560 @ 1.02 - 2.66 GHz128 Bit @ 14000 MHz
Nombre CódigoGN22-X2
ArquitecturaBlackwell
Pipelines2560 - unificado
TMUs80
ROPs32
Raytracing Cores20
Tensor / AI Cores80
Velocidad del núcleo1020 - 2662 (Boost) MHz
AI GPU440 TOPS INT8
CacheL1: 2.5 MB, L2: 32 MB
Velocidad de Memoria14000 effective = 1750 MHz
Ancho de Bus de Memoria128 Bit
Tipo de MemoriaGDDR6
Max. Cantidad de Memoria8 GB
Memoria Compartidano
Memory Bandwidth224 GB/s
APIDirectX 12_2
Consumo de corriente100 Watt (35 - 100 Watt TGP)
tecnología5 nm
PCIe5
Displays4 Displays (max.), DisplayPort 2.1a
Tamaño de la portátilde tamaño mediano
Fecha de Anuncio02.01.2025
Link a la Página del Fabricantewww.nvidia.com
PredecessorGeForce RTX 4050 Laptop GPU

Benchmarks

Performance Rating - 3DMark 11 + Fire Strike + Time Spy
10.1 pt (30%)
Restrict / Search: Model: Max. age: years
3DMark - 3DMark Fire Strike Standard Score
min: 22488     de promedio: 23247     mediana: 23413 (35%)     max: 23840 Points
3DMark - 3DMark Fire Strike Standard Graphics
min: 26850     de promedio: 27305     mediana: 27025 (25%)     max: 28040 Points
3DMark - 3DMark Ice Storm Graphics
436477 Points (48%)
3DMark - 3DMark Time Spy Score
min: 9098     de promedio: 9451     mediana: 9457 (25%)     max: 9799 Points
3DMark - 3DMark Time Spy Graphics
min: 9202     de promedio: 9600     mediana: 9784 (20%)     max: 9814 Points
107.5 -99%
...
8798 -8%
8989 -6%
9033 -6%
9097 -5%
NVIDIA RTX PRO 2000 Blackwell Generation Laptop
9120 -5%
9164 -5%
9300 -3%
9332 -3%
AMD Radeon 8050S
9502 -1%
NVIDIA GeForce RTX 5050 Laptop
9600
9652 1%
9770 2%
9943 4%
10043 5%
10046 5%
10206 6%
NVIDIA GeForce RTX 2080 Super Mobile
10301 7%
10455 9%
10478 9%
...
Nvidia RTX PRO 5000 Blackwell Generation Laptop
23742 147%
max:
NVIDIA GeForce RTX 5090
46337 383%
0%
100%
Restrict / Search: Model: Max. age: years
3DMark - 3DMark Cloud Gate Score
min: 46692     de promedio: 49821     mediana: 50444 (48%)     max: 52328 Points
3DMark - 3DMark Cloud Gate Graphics
min: 124650     de promedio: 137712     mediana: 138945 (34%)     max: 149542 Points
3DMark 11 - 3DM11 Performance Score
min: 25519     de promedio: 26872     mediana: 26964 (33%)     max: 28133 Points
3DMark 11 - 3DM11 Performance GPU
min: 32115     de promedio: 32485     mediana: 32220 (25%)     max: 33119 Points
171.8 -99%
...
28461 -12%
28692 -12%
NVIDIA GeForce RTX 2070 Super Mobile
29416 -9%
29447 -9%
29663 -9%
30499 -6%
31142 -4%
NVIDIA RTX PRO 2000 Blackwell Generation Laptop
31736 -2%
32331 0%
NVIDIA GeForce RTX 5050 Laptop
32485
32662 1%
32846 1%
33169 2%
33497 3%
34188 5%
34860 7%
35101 8%
NVIDIA GeForce RTX 2080 Super Mobile
35153 8%
35286 9%
...
Nvidia RTX PRO 5000 Blackwell Generation Laptop
68846 112%
max:
NVIDIA GeForce RTX 5090
129772 299%
0%
100%
Restrict / Search: Model: Max. age: years
3DMark Vantage
3DM Vant. Perf. total +
3DMark Vantage - 3DM Vant. Perf. total
76534 Points (22%)
3DM Vant. Perf. GPU no PhysX +
3DMark Vantage - 3DM Vant. Perf. GPU no PhysX
82905 Points (45%)
Restrict / Search: Model: Max. age: years
3DMark 06 3DMark 06 - Standard 1280x1024 +
3DMark 06
47989 Points (63%)
Blender - Blender 3.3 Classroom CUDA *
min: 49     de promedio: 49.7     mediana: 50 (7%)     max: 50 Seconds
Blender - Blender 3.3 Classroom OPTIX *
min: 26     de promedio: 27.7     mediana: 28 (10%)     max: 29 Seconds
Cinebench R10 Cinebench R10 Shading (32bit) +
Cinebench R10 - Cinebench R10 Shading (32bit)
15349 puntos (11%)
Cinebench R11.5 Cinebench R11.5 OpenGL 64 Bit +
Cinebench R11.5 - Cinebench R11.5 OpenGL 64 Bit
135.1 fps (44%)
Cinebench R15
Cinebench R15 OpenGL 64 Bit +
Cinebench R15 - Cinebench R15 OpenGL 64 Bit
min: 144.2     de promedio: 174     mediana: 173.9 (10%)     max: 204 fps
Cinebench R15 OpenGL Ref. Match 64 Bit +
Cinebench R15 - Cinebench R15 OpenGL Ref. Match 64 Bit
99.6 % (100%)
GFXBench - GFXBench 5.0 4K Aztec Ruins High Tier Offscreen
100.4 fps (38%)
GFXBench - GFXBench 5.0 Aztec Ruins High Tier Offscreen
232.1 fps (42%)
Restrict / Search: Model: Max. age: years
GFXBench - GFXBench 5.0 Aztec Ruins Normal Tier Offscreen
609 fps (45%)
Basemark GPU 1.2 - Basemark GPU 1.2 Vulkan Official Medium Offscreen 1080
104.6 fps (3%)
Geekbench 6.5 - Geekbench 6.5 GPU OpenCL
min: 91102     de promedio: 91592     mediana: 91702 (24%)     max: 91972 puntos
Geekbench 6.5 - Geekbench 6.5 GPU Vulkan
min: 10922     de promedio: 15760     mediana: 10979 (3%)     max: 25378 puntos
LuxMark v2.0 64Bit - LuxMark v2.0 Room GPU
5328 Samples/s (19%)
LuxMark v2.0 64Bit - LuxMark v2.0 Sala GPU
11437 Samples/s (20%)
ComputeMark v2.1 - ComputeMark v2.1 Result
20725 puntos (17%)
Power Consumption - Furmark Stress Test Power Consumption - external Monitor *
min: 118     de promedio: 130.3     mediana: 122.2 (16%)     max: 150.7 Watt
0102030405060708090100110120130140150160Tooltip
Power Consumption - Cyberpunk 2077 Power Consumption 150cd *
min: 128.4     de promedio: 144     mediana: 130.3 (36%)     max: 173.4 Watt
0102030405060708090100110120130140150160170180Tooltip
Power Consumption - Cyberpunk 2077 Power Consumption - external Monitor *
min: 126.7     de promedio: 142.7     mediana: 129.6 (16%)     max: 171.9 Watt
0102030405060708090100110120130140150160170180Tooltip
Power Consumption - Power Efficiency - Cyberpunk 2077 ultra
0.5 fps per Watt (2%)
- Gama de valores de las pruebas para esta tarjeta gráfica
red legend - Valores medios de las pruebas para esta tarjeta gráfica
* A menor número, mayor rendimiento

Pruebas de juegos

Los siguientes benchmarks se derivan de nuestros benchmarks de los portátiles de análisis. El rendimiento depende de la memoria gráfica utilizada, velocidad de reloj, procesador, configuración del sistema, controladores y sistemas operativos. Así que los resultados no tienen que ser representativos de todos los portátiles con esta GPU. Para información más detallada sobre los resultados del benchmark, haga clic en el número de fps.

bajo 1920x1080
83.5  fps    + Comparar + 📈 Graph
medio 1920x1080
77.3  fps    + Comparar + 📈 Graph
alto 1920x1080
60  fps    + Comparar + 📈 Graph
ultra 1920x1080
33.2  fps    + Comparar + 📈 Graph
QHD 2560x1440
21.5  fps    + Comparar + 📈 Graph
QHD DLSS 2560x1440
32.8  fps    + Comparar + 📈 Graph
» Jugable con todos los portátiles probados en ajustes de detalle alto.
medio 1920x1080
87.7 93.4 ~ 91 fps    + Comparar + 📈 Graph
alto 1920x1080
73.6 78.3 ~ 76 fps    + Comparar + 📈 Graph
ultra 1920x1080
53.9 55.7 ~ 55 fps    + Comparar + 📈 Graph
» Jugable con todos los portátiles probados en ajustes de detalle ultra.
medio 1920x1080
35.7 38.6 ~ 37 fps    + Comparar + 📈 Graph
alto 1920x1080
29.6 30 ~ 30 fps    + Comparar + 📈 Graph
ultra 1920x1080
16 16.5 ~ 16 fps    + Comparar + 📈 Graph
» Jugable con todos los portátiles probados en ajustes de detalle medio.
F1 25

F1 25

2025
medio 1920x1080
96 157 ~ 127 fps    + Comparar
alto 1920x1080
93 132 ~ 113 fps    + Comparar
ultra 1920x1080
15 18 ~ 17 fps    + Comparar
QHD 2560x1440
5  fps    + Comparar
QHD DLSS 2560x1440
9  fps    + Comparar
» Jugable con todos los portátiles probados en ajustes de detalle alto.
medio 1920x1080
53.7 58.4 ~ 56 fps    + Comparar + 📈 Graph
alto 1920x1080
48.8 52.6 ~ 51 fps    + Comparar + 📈 Graph
ultra 1920x1080
47.3 51 ~ 49 fps    + Comparar + 📈 Graph
QHD 2560x1440
31.9  fps    + Comparar + 📈 Graph
QHD DLSS 2560x1440
49.5  fps    + Comparar + 📈 Graph
» Jugable con todos los portátiles probados en ajustes de detalle ultra.
medio 1920x1080
48.3 52.2 ~ 50 fps    + Comparar + 📈 Graph
alto 1920x1080
45.1 48.2 ~ 47 fps    + Comparar + 📈 Graph
ultra 1920x1080
22.9 25 ~ 24 fps    + Comparar + 📈 Graph
QHD 2560x1440
13.4  fps    + Comparar + 📈 Graph
QHD DLSS 2560x1440
26.5  fps    + Comparar + 📈 Graph
» Jugable con todos los portátiles probados en ajustes de detalle alto.
medio 1920x1080
32 51 ~ 42 fps    + Comparar
alto 1920x1080
28 43 ~ 36 fps    + Comparar
ultra 1920x1080
21 29 ~ 25 fps    + Comparar
QHD 2560x1440
25  fps    + Comparar
QHD DLSS 2560x1440
29  fps    + Comparar
» Jugable con la mayoría de los portátiles probados en ajustes de detalle alto.
medio 1920x1080
83.2 90.5 ~ 87 fps    + Comparar + 📈 Graph
alto 1920x1080
67.6 73.6 ~ 71 fps    + Comparar + 📈 Graph
ultra 1920x1080
46.8 51.6 ~ 49 fps    + Comparar + 📈 Graph
QHD 2560x1440
36.8  fps    + Comparar + 📈 Graph
QHD DLSS 2560x1440
50.3  fps    + Comparar + 📈 Graph
» Jugable con todos los portátiles probados en ajustes de detalle ultra.
alto 1920x1080
52.1 58.6 ~ 55 fps    + Comparar + 📈 Graph
ultra 1920x1080
15.6 22.2 ~ 19 fps    + Comparar + 📈 Graph
QHD 2560x1440
9.6  fps    + Comparar + 📈 Graph
QHD DLSS 2560x1440
0 (!)  fps    + Comparar
» Jugable con todos los portátiles probados en ajustes de detalle alto.
Stalker 2

Stalker 2

2024
medio 1920x1080
42 56.4 ~ 49 fps    + Comparar + 📈 Graph
alto 1920x1080
38.9 48 ~ 43 fps    + Comparar + 📈 Graph
ultra 1920x1080
33.8 39.9 ~ 37 fps    + Comparar + 📈 Graph
QHD 2560x1440
29  fps    + Comparar + 📈 Graph
QHD DLSS 2560x1440
62.7  fps    + Comparar + 📈 Graph
» Jugable con la mayoría de los portátiles probados en ajustes de detalle ultra.
medio 1920x1080
79.9 79.9 ~ 80 fps    + Comparar + 📈 Graph
alto 1920x1080
54.2 55.8 ~ 55 fps    + Comparar + 📈 Graph
ultra 1920x1080
41.3 41.5 ~ 41 fps    + Comparar + 📈 Graph
QHD 2560x1440
30.4  fps    + Comparar + 📈 Graph
QHD DLSS 2560x1440
39.5  fps    + Comparar + 📈 Graph
» Jugable con todos los portátiles probados en ajustes de detalle ultra.
medio 1920x1080
54.8 79.2 ~ 67 fps    + Comparar + 📈 Graph
alto 1920x1080
54.3 75.6 ~ 65 fps    + Comparar + 📈 Graph
ultra 1920x1080
52.8 70.8 ~ 62 fps    + Comparar + 📈 Graph
QHD 2560x1440
49.5  fps    + Comparar + 📈 Graph
QHD DLSS 2560x1440
65.7  fps    + Comparar + 📈 Graph
» Jugable con todos los portátiles probados en ajustes de detalle ultra.
medio 1920x1080 cinem.
46.4 46.5 ~ 46 fps    + Comparar + 📈 Graph
alto 1920x1080 cinem.
40.4 41.2 ~ 41 fps    + Comparar + 📈 Graph
ultra 1920x1080 cinem.
32.8 33 ~ 33 fps    + Comparar + 📈 Graph
QHD 2560x1440 cinem.
23.2  fps    + Comparar + 📈 Graph
QHD DLSS 2560x1440 cinem.
32.6  fps    + Comparar + 📈 Graph
» Jugable con todos los portátiles probados en ajustes de detalle alto.
medio 1920x1080
47.4 50.4 ~ 49 fps    + Comparar + 📈 Graph
alto 1920x1080
33.9 35.1 ~ 35 fps    + Comparar + 📈 Graph
QHD 2560x1440
24.2  fps    + Comparar + 📈 Graph
QHD DLSS 2560x1440
39.6  fps    + Comparar + 📈 Graph
» Jugable con todos los portátiles probados en ajustes de detalle medio.
medio 1920x1080
74.1 75.9 ~ 75 fps    + Comparar + 📈 Graph
alto 1920x1080
67.7 68.2 ~ 68 fps    + Comparar + 📈 Graph
ultra 1920x1080
52.5 54.5 ~ 54 fps    + Comparar + 📈 Graph
QHD 2560x1440
39.7  fps    + Comparar + 📈 Graph
QHD DLSS 2560x1440
55.2  fps    + Comparar + 📈 Graph
» Jugable con todos los portátiles probados en ajustes de detalle ultra.
medio 1920x1080
72.3 86.2 ~ 79 fps    + Comparar + 📈 Graph
alto 1920x1080
54.7 64.1 ~ 59 fps    + Comparar + 📈 Graph
ultra 1920x1080
53.8 62 ~ 58 fps    + Comparar + 📈 Graph
QHD 2560x1440
45.7  fps    + Comparar + 📈 Graph
QHD DLSS 2560x1440
58.4  fps    + Comparar + 📈 Graph
» Jugable con todos los portátiles probados en ajustes de detalle ultra.
medio 1920x1080
92 97.5 98.1 ~ 96 fps    + Comparar
alto 1920x1080
78.8 83.4 87.7 ~ 83 fps    + Comparar
ultra 1920x1080
71 75.2 76.9 ~ 74 fps    + Comparar
QHD 2560x1440
47.2  fps    + Comparar
» Jugable con todos los portátiles probados en ajustes de detalle ultra.
Additional Benchmarks
30min Start Ultra Preset (FSR off) 1920x1080
69.1
65.9
66.3
medio 1920x1080
96.9 101.1 108.4 ~ 102 fps    + Comparar + 📈 Graph
alto 1920x1080
82.4 86.9 87.3 ~ 86 fps    + Comparar + 📈 Graph
ultra 1920x1080
80.4 80.7 86.3 ~ 82 fps    + Comparar + 📈 Graph
QHD 2560x1440
60  fps    + Comparar + 📈 Graph
» Jugable con todos los portátiles probados en ajustes de detalle ultra.
Strange Brigade

Strange Brigade

2018
medio 1920x1080
234 273 278 ~ 262 fps    + Comparar
alto 1920x1080
192.2 220 220 ~ 211 fps    + Comparar
ultra 1920x1080
173.4 189.6 189.7 ~ 184 fps    + Comparar
QHD 2560x1440
132  fps    + Comparar
» Jugable con todos los portátiles probados en ajustes de detalle ultra.
bajo 1280x720
98.5  fps    + Comparar
medio 1920x1080
76.2 88.5 93 ~ 86 fps    + Comparar
alto 1920x1080
65.5 77.1 78 ~ 74 fps    + Comparar
» Jugable con todos los portátiles probados en ajustes de detalle alto.
medio 1920x1080
105.2 132.4 139.3 ~ 126 fps    + Comparar
alto 1920x1080
86.2 100.4 102 ~ 96 fps    + Comparar
QHD 2560x1440
73.6  fps    + Comparar
» Jugable con todos los portátiles probados en ajustes de detalle alto.
bajo 1280x720
165.7  fps    + Comparar
medio 1366x768
126.2 137.7 148.9 ~ 138 fps    + Comparar
alto 1920x1080
121.7 131 141.7 ~ 131 fps    + Comparar
ultra 1920x1080
116.2 119.9 133 ~ 123 fps    + Comparar
» Jugable con todos los portátiles probados en ajustes de detalle ultra.
GTA V

GTA V

2015
medio 1366x768
155.1 171.6 177.2 ~ 168 fps    + Comparar
alto 1920x1080
132.2 165.7 170.4 ~ 156 fps    + Comparar
ultra 1920x1080
88.1 112.9 117.6 ~ 106 fps    + Comparar
QHD 2560x1440
93.7  fps    + Comparar
» Jugable con todos los portátiles probados en ajustes de detalle ultra.
bajomedioaltoultraQHD4K
The Outer Worlds 283.577.36033.221.5
Battlefield 6917655
Borderlands 4373016
F1 25127113175
Doom: The Dark Ages56514931.9
The Elder Scrolls IV Oblivion Remastered50472413.4
Assassin's Creed Shadows42362525
Kingdom Come Deliverance 287714936.8
Indiana Jones and the Great Circle55199.58
Stalker 249433729
Until Dawn80554130.4
Space Marine 267656249.5
Star Wars Outlaws46413323.2
Senua's Saga Hellblade 2493524.2
Ghost of Tsushima75685439.7
Horizon Forbidden West79595845.7
Cyberpunk 2077 2.2 Phantom Liberty96837447.2
Baldur's Gate 3102868260
Strange Brigade262211184132
X-Plane 11.1198.58674
Final Fantasy XV Benchmark1269673.6
Dota 2 Reborn165.7138131123
GTA V16815610693.7
bajomedioaltoultraQHD4K
< 30 fps
< 60 fps
< 120 fps
≥ 120 fps


2
1

7
10
5

10
10
3
5
9
4
2
8
7
3
1


Para ver más juegos jugables y una lista de todos los juegos y tarjetas gráficas visita nuestroListado de juegos

v1.35
log 13. 09:16:35

#0 ran 0s before starting gpusingle class +0s ... 0s

#1 no ids found in url (should be separated by "_") +0s ... 0s

#2 not redirecting to Ajax server +0s ... 0s

#3 did not recreate cache, as it is less than 5 days old! Created at Thu, 13 Nov 2025 05:38:39 +0100 +0.001s ... 0.001s

#4 no comparison url found in template nbc.compare_page_1 needed +0.03s ... 0.031s

#5 no comparison url found in template nbc.compare_page_1 needed +0s ... 0.031s

#6 no comparison url found in template nbc.compare_page_1 needed +0s ... 0.032s

#7 no comparison url found in template nbc.compare_page_1 needed +0s ... 0.032s

#8 no comparison url found in template nbc.compare_page_1 needed +0s ... 0.032s

#9 composed specs +0.001s ... 0.033s

#10 did output specs +0s ... 0.033s

#11 start showIntegratedCPUs +0s ... 0.033s

#12 getting avg benchmarks for device 12923 +0.032s ... 0.065s

#13 got single benchmarks 12923 +0.026s ... 0.091s

#14 got avg benchmarks for devices +0s ... 0.091s

#15 min, max, avg, median took s +0.699s ... 0.789s

#16 before gaming benchmark output +0s ... 0.789s

#17 Got 182 rows for game benchmarks. +0.05s ... 0.839s

#18 composed SQL query for gamebenchmarks +0s ... 0.839s

#19 got data and put it in $dataArray +0.015s ... 0.854s

#20 benchmarks composed for output. +0.191s ... 1.046s

#21 no comparison url found in template nbc.compare_page_1 needed +0.006s ... 1.052s

#22 return log +0s ... 1.052s

Análises de portátiles con NVIDIA GeForce RTX 5050 Laptop tarjeta gráfica

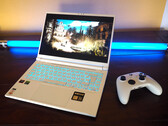
Análisis de Acer Nitro V 16 AI

Análisis del Acer Nitro V 16 AI: Portátil para juegos asequible con gran autonomía de batería
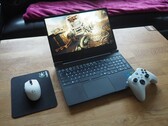
Si está buscando un portátil para juegos con una tarjeta gráfica moderna que no rompa el banco, el Acer Nitro V 16 AI podría encajar a la perfección. Echamos un...
AMD Ryzen 5 240 | NVIDIA GeForce RTX 5050 Laptop | 16.00" | 2.4 kg
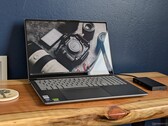
Un gamer económico por 1.200 dólares: análisis del portátil HP Victus 15 RTX 5050

Un gamer económico por 1.200 dólares: análisis del portátil HP Victus 15 RTX 5050

Con la versión RTX 5050 del Victus 15, HP ofrece uno de los portátiles para juegos más asequibles basados en la arquitectura Blackwell de Nvidia. Ponemos a prue...
Intel Core i5-13420H | NVIDIA GeForce RTX 5050 Laptop | 15.60" | 2.4 kg
Medion Erazer Scout 17 E1 con RTX 5050 en análisis

Análisis del Medion Erazer Scout 17 E1: Evaluando la valía del portátil RTX 5050 como GPU de gama media-baja

El Medion Erazer Scout 17 E1 es el primer portátil basado en la GeForce RTX 5050 Laptop que aterriza en nuestra redacción. Nuestro análisis pone a prueba el Por...
Intel Core 5 210H | NVIDIA GeForce RTX 5050 Laptop | 17.30" | 2.7 kg

Lenovo Legion 5 15AHP10, Ryzen 7 260 RTX 5050: AMD Ryzen 7 260, 15.10", 1.9 kg
  análise externo » Lenovo Legion 5 15AHP10, Ryzen 7 260 RTX 5050

MSI Katana 15 HX B14WEK: Intel Core i7-14650HX, 15.60", 2.4 kg
  análise externo » MSI Katana 15 HX B14WEK

Gigabyte Gaming A16 GA63H: AMD Ryzen 7 260, 16.00", 2.2 kg
  análise externo » Gigabyte Gaming A16 GA63H

Acer Nitro V15 ANV15-52: Intel Core i7-13620H, 15.60", 2.1 kg
  análise externo » Acer Nitro V15 ANV15-52

LG gram Pro AI 17 17Z90TR: Intel Core Ultra 9 285H, 17.00", 1.5 kg
  análise externo » LG gram Pro AI 17 17Z90TR

Asus TUF Gaming A18 FA808UH: AMD Ryzen 7 260, 18.00", 2.6 kg
  análise externo » Asus TUF Gaming A18 FA808UH

Asus TUF Gaming F16 FX608JHR: Intel Core i7-14650HX, 16.00", 2.2 kg
  análise externo » Asus TUF Gaming F16 FX608JHR

Asus TUF Gaming F16 FX608JHV: Intel Core i5-13450HX, 16.00", 2.2 kg
  análise externo » Asus TUF Gaming F16 FX608JH

Asus V16 V3607VH: Intel Core 7 240H, 16.00", 2 kg
  análise externo » Asus V16 V3607VH

Please share our article, every link counts!
Mail Logo

Class 1

Class 2

GeForce RTX 2080 Super Mobile
RTX PRO 2000 Blackwell Generation Laptop *
M1 Max 32-Core GPU *
GeForce RTX 2070 Super Mobile
M1 Max 24-Core GPU *
Radeon 8050S *
Radeon RX 5700M *
M1 Pro 16-Core GPU *
Radeon PRO W6600M *
GeForce RTX 2070 Super Max-Q
M1 Pro 14-Core GPU *
RTX PRO 1000 Blackwell Generation Laptop *
Quadro P4200
Radeon 8040S *
Arc B 12 Xe3 Panther Lake iGPU

Class 3

Quadro P5000 Max-Q *
Arc 140T *
Arc 130T *
Quadro P4000 Max-Q
Radeon RX 580X (Laptop) *
Radeon RX 580 (Laptop)
Radeon Pro 5300M
Radeon RX 5300M
Quadro P3000 Max-Q *
Radeon Pro WX 7100 *
Radeon RX 570X (Laptop) *
Radeon RX 570 (Laptop) *
Radeon RX 470 (Laptop) *
GeForce GTX 1050 Ti Mobile
Radeon 680M
Quadro P2000 Max-Q
Radeon R9 M395X
GeForce GTX 1050 Ti Max-Q *
Radeon Pro Vega 16
WX Vega M GL
Radeon R9 M485X
GeForce GTX 1050 Max-Q *
Radeon 660M
Radeon RX 560X (Laptop)
Radeon RX 560 (Laptop)
Radeon Pro 560X
Radeon Pro 560
Radeon Pro 460
Radeon Pro WX 4130 *
Quadro P620 *
Radeon RX 550X (Laptop)
Radeon Pro 555X
Radeon Pro 555
Radeon Pro 455
Quadro P600
Graphics 3-Core iGPU (Arrow Lake) *
Radeon RX 540X *
Radeon Pro WX 2100 *
Radeon Pro WX 3100 *
Graphics 2-Core iGPU (Arrow Lake) *
Radeon Pro 450
Radeon 630
Radeon 540X *
Quadro P520
Quadro P500 *
Iris Plus Graphics G7 (Ice Lake 64 EU) *
Vega 10 *
Iris Pro Graphics 580
Vega 9
FirePro W5130M
UHD Graphics Xe G4 48EUs *
UHD Graphics 32EUs
UHD Graphics Xe 32EUs (Tiger Lake-H) *
UHD Graphics 750
UHD Graphics 730
Vega 7
Radeon R7 M465
Vega 8
Iris Plus Graphics G4 (Ice Lake 48 EU)
Quadro M600M
FirePro W4190M
Radeon R7 M445
UHD Graphics 24EUs (Alder Lake-N) *
Radeon R7 M340
Radeon 610M *
UHD Graphics G1 (Ice Lake 32 EU)
UHD Graphics Xe 16EUs (Tiger Lake-H) *
Radeon R5 (Bristol Ridge)
Adreno 690 *
Adreno 685 *
Adreno 680 *

Class 4

Posición aproximada del adaptador gráfico

Klaus Hinum, 2025-07- 1 (Update: 2025-07- 1)