Review del portátil de la estación de trabajo MSI WS66 10TMT: Más rápido que el Razer Blade 15 Studio
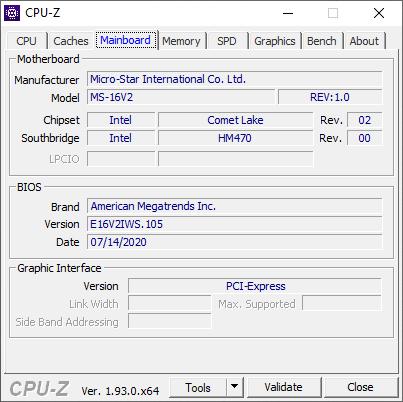
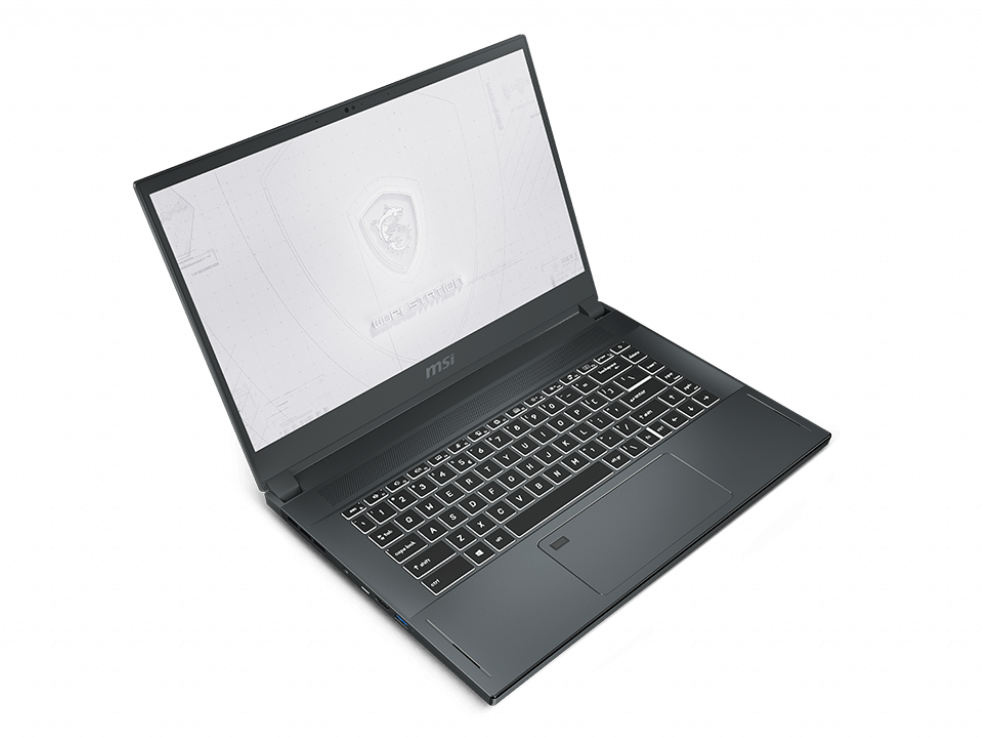
El WS66 es la última estación de trabajo móvil ultrafina de MSI derivada del portátil para juegos GS66 que sucedió a los WS63 y WS65 del año pasado. Es un completo rediseño en comparación con el modelo de última generación para competir mejor con otras elegantes estaciones de trabajo Nvidia Studio como la Razer Blade 15 Studio, la serie Asus ProArt, la HP ZBook Studio, o la Dell Precision 5550.
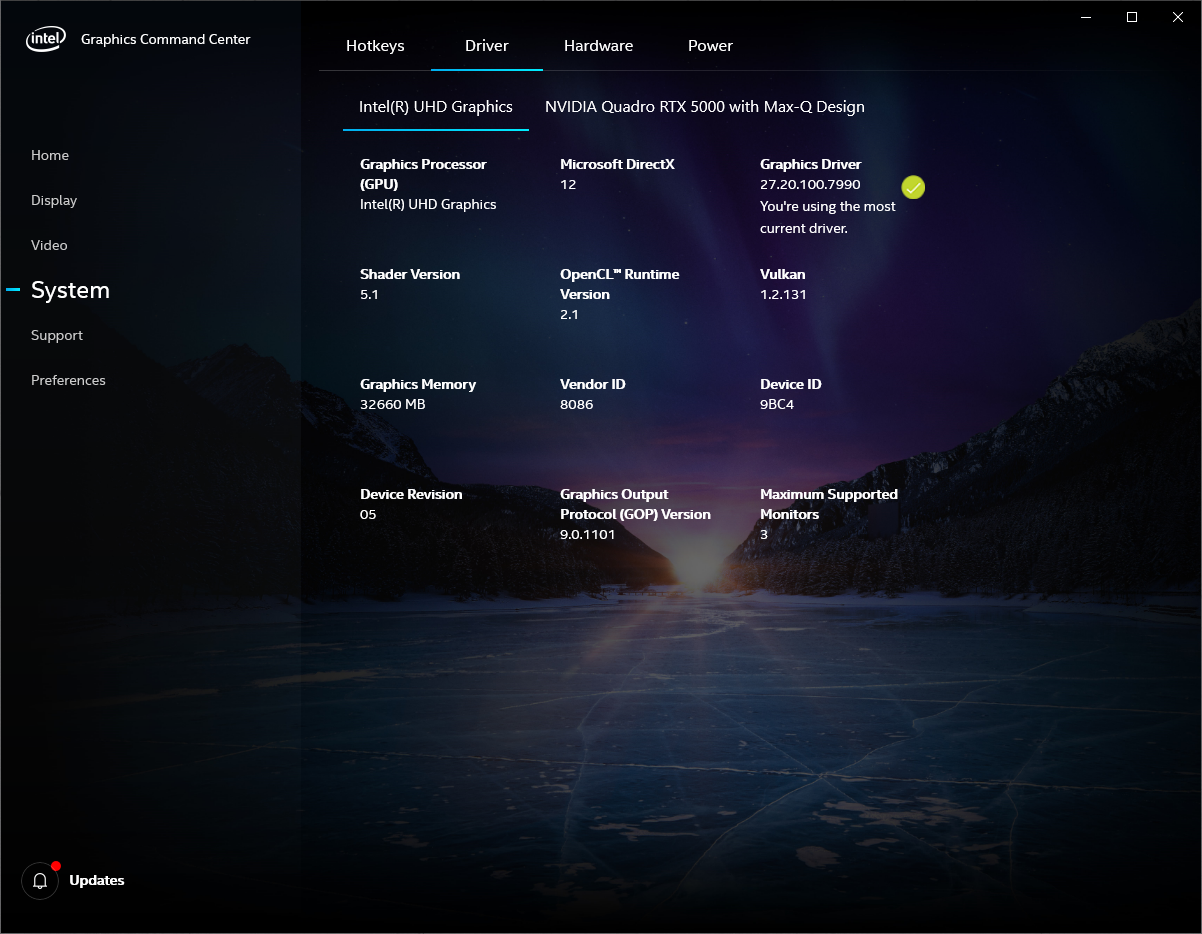
Las versiones actuales van desde la CPU Core i7-10875H, la GPU Quadro RTX 3000 y la pantalla táctil FHD por 2500 dólares hasta el Core i9-10980HK, Quadro RTX 5000 Max-Q y la pantalla táctil 4K UHD por hasta 4000 dólares, dependiendo de la memoria RAM o el almacenamiento.
Recomendamos consultar nuestras reviews existentes sobre el GS66 para obtener más información sobre el chasis, el teclado, el panel de control y otras características físicas, ya que el WS66 comparte casi el mismo diseño externo.
Más reviews de MSI:
Valoración | Fecha | Modelo | Peso | Altura | Tamaño | Resolución | Precio |
|---|---|---|---|---|---|---|---|
| 83.4 % v7 (old) | 08/2020 | MSI WS66 10TMT-207US i9-10980HK, Quadro RTX 5000 Max-Q | 2.3 kg | 19.8 mm | 15.60" | 1920x1080 | |
| 87.8 % v7 (old) | 08/2020 | Dell Precision 7550 W-10885M, Quadro RTX 5000 Max-Q | 2.8 kg | 27.36 mm | 15.60" | 3840x2160 | |
| 86.3 % v7 (old) | 08/2020 | Dell Precision 5550 P91F i7-10875H, Quadro T2000 Max-Q | 2 kg | 18 mm | 15.60" | 3840x2400 | |
| 87 % v7 (old) | 08/2020 | Razer Blade 15 Studio Edition 2020 i7-10875H, Quadro RTX 5000 Max-Q | 2.2 kg | 13.98 mm | 15.60" | 3840x2160 | |
| 85.6 % v6 (old) | 10/2017 | MSI WS63VR 7RL-023US i7-7700HQ, Quadro P4000 Max-Q | 1.9 kg | 18 mm | 15.60" | 3840x2160 | |
| 82.1 % v7 (old) | 06/2020 | Acer ConceptD 3 Pro CN315-71P-73W1 i7-9750H, Quadro T1000 (Laptop) | 2.4 kg | 23.4 mm | 15.60" | 1920x1080 |
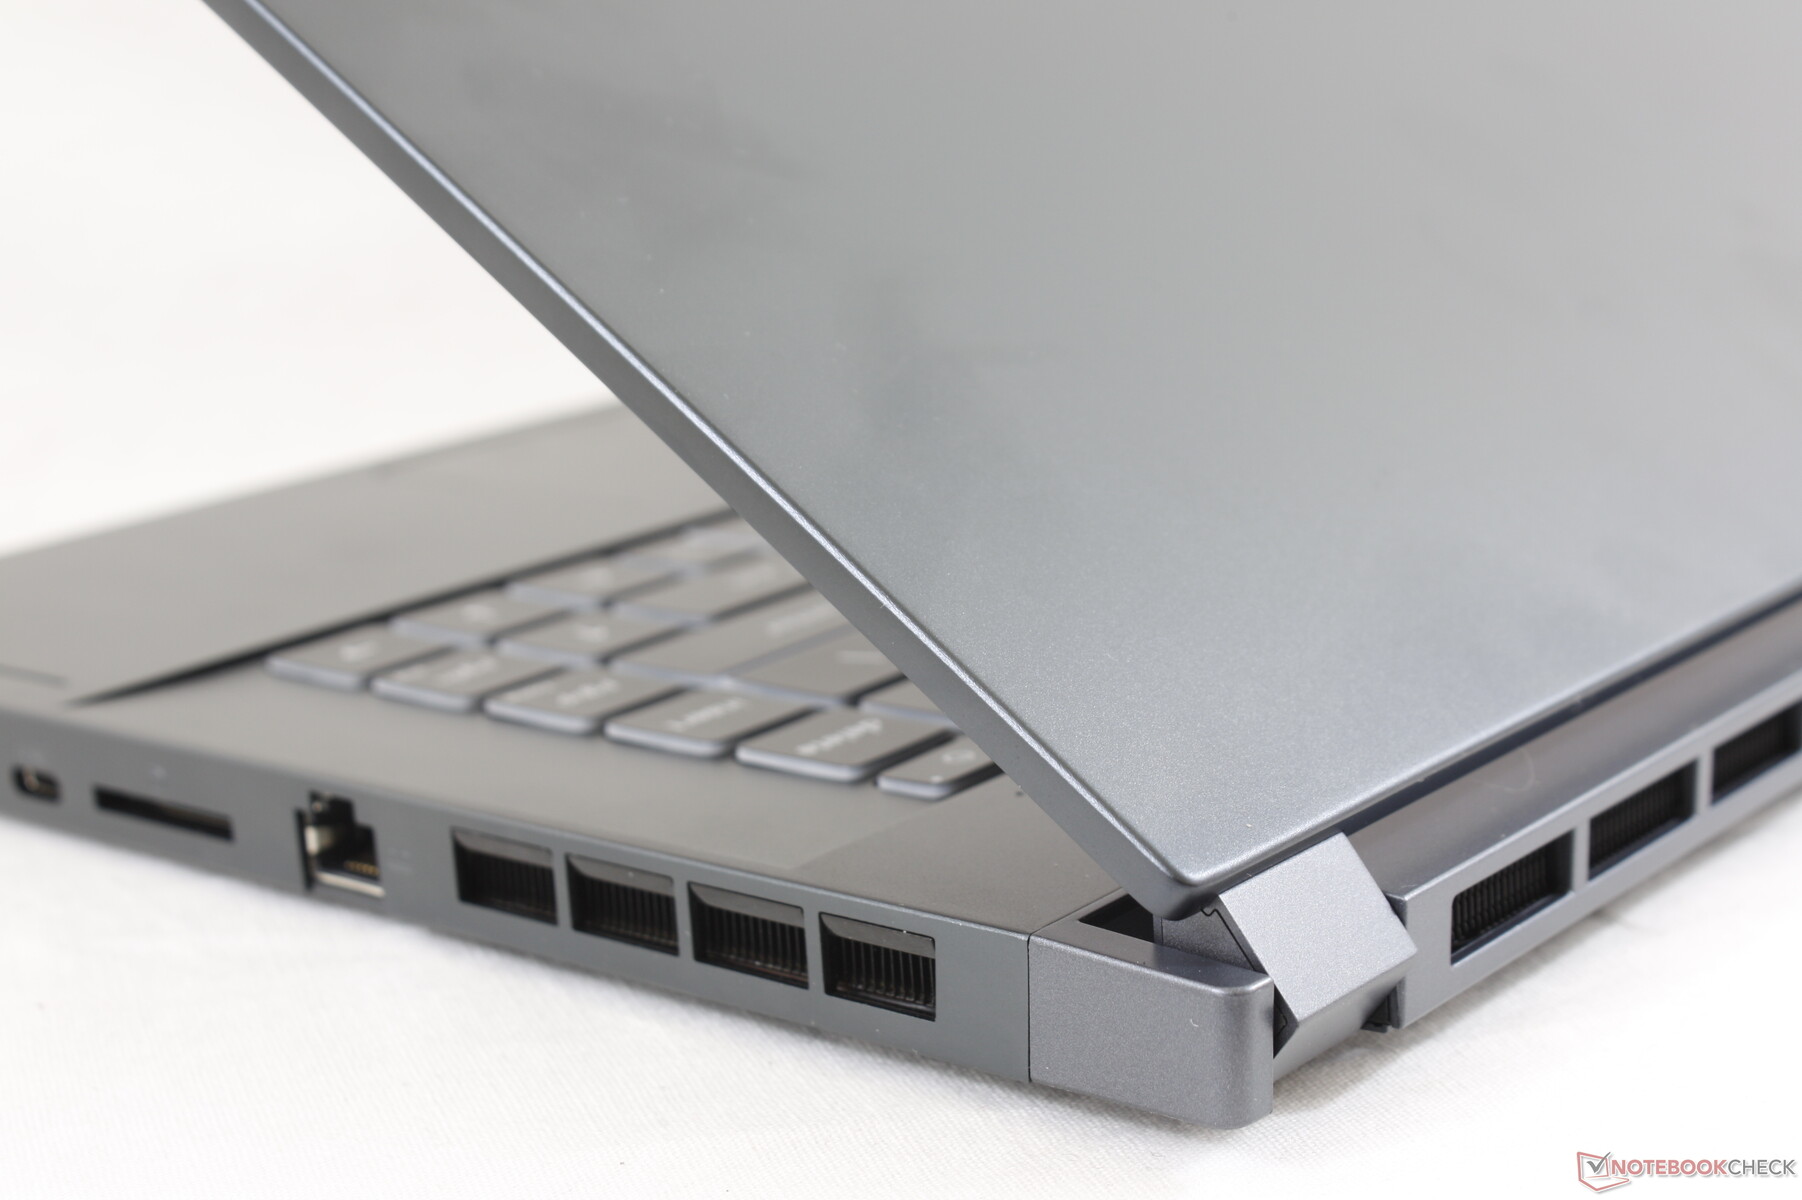
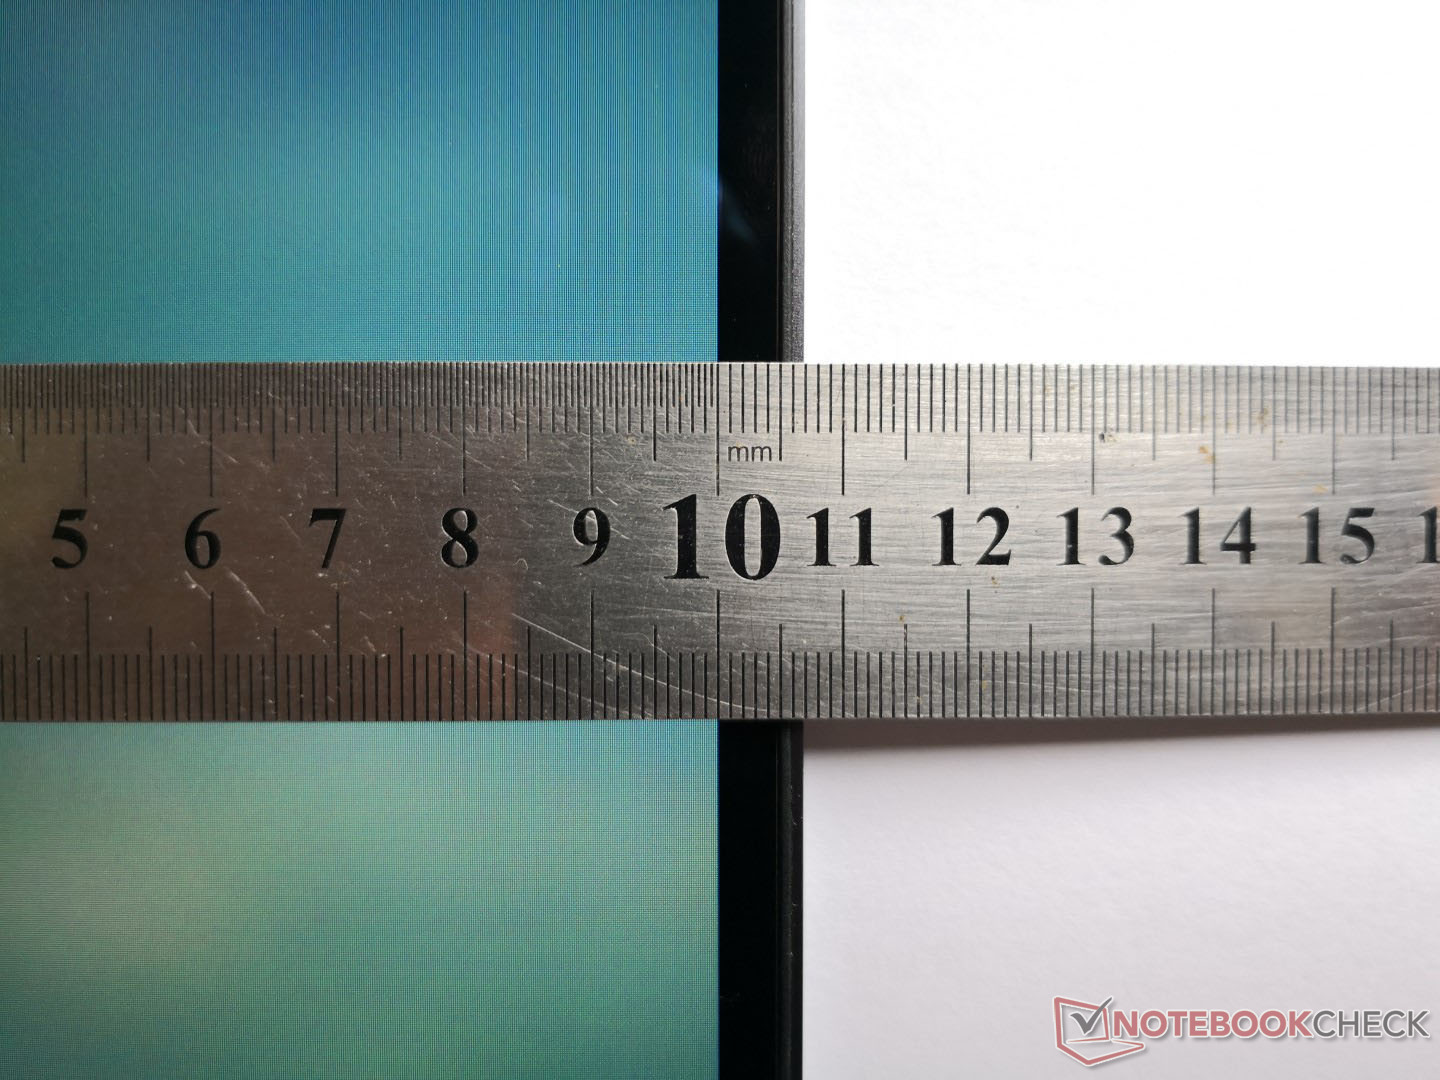
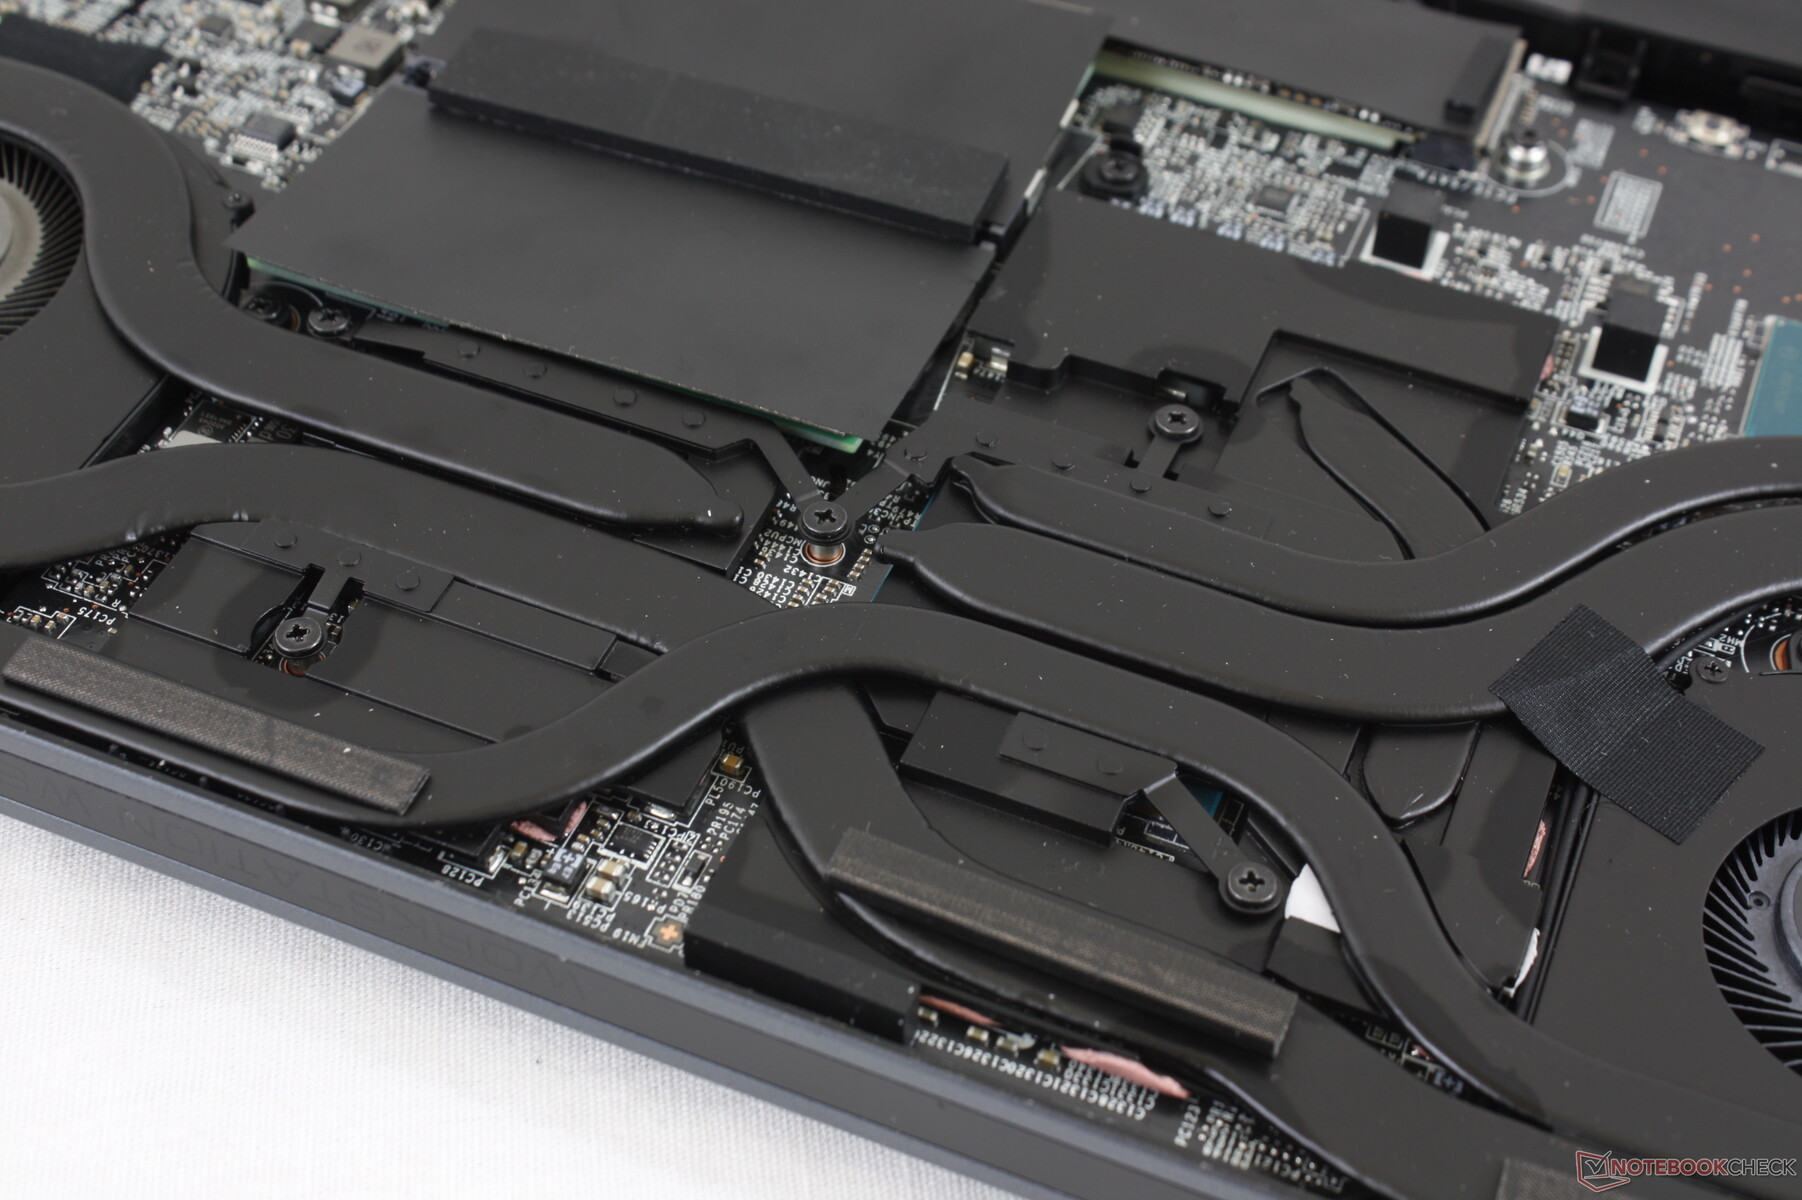
Carcasa
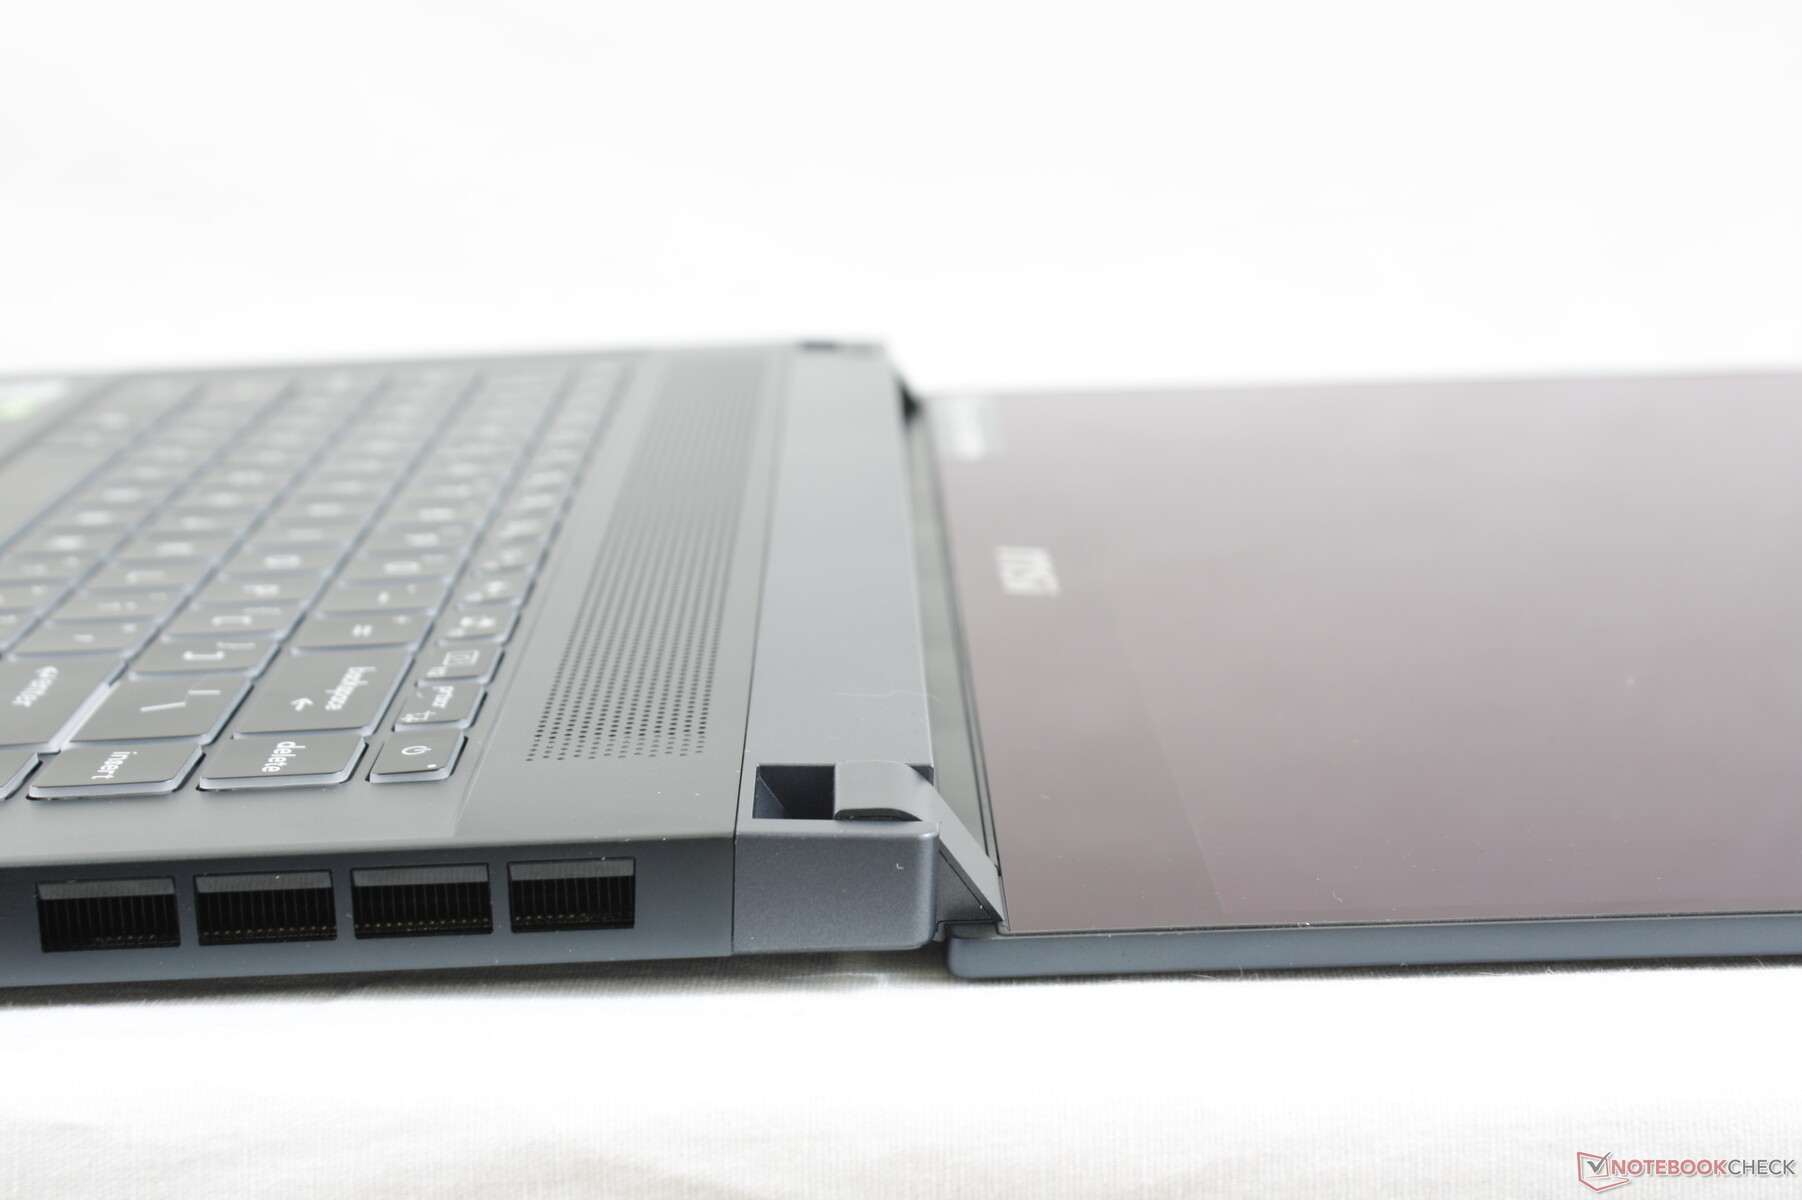
El nuevo chasis se siente más fuerte que el WS63 de última generación, pero sigue siendo un paso más abajo que el Razer Blade 15 Studio. El crujido y la flexión son más notables en el sistema MSI que en el Razer.
Al igual que el salto del GS63 al GS66, el WS66 es a la vez más grueso y más pesado que el antiguo WS63 debido a las mejoras de generación a generación en la rigidez del chasis y las térmicas. A pesar de ello, sigue siendo una de las estaciones de trabajo más delgadas que se pueden conseguir y que puede ser configurada tanto con una CPU Core i9 como con una GPU Quadro RTX 5000 Max-Q.
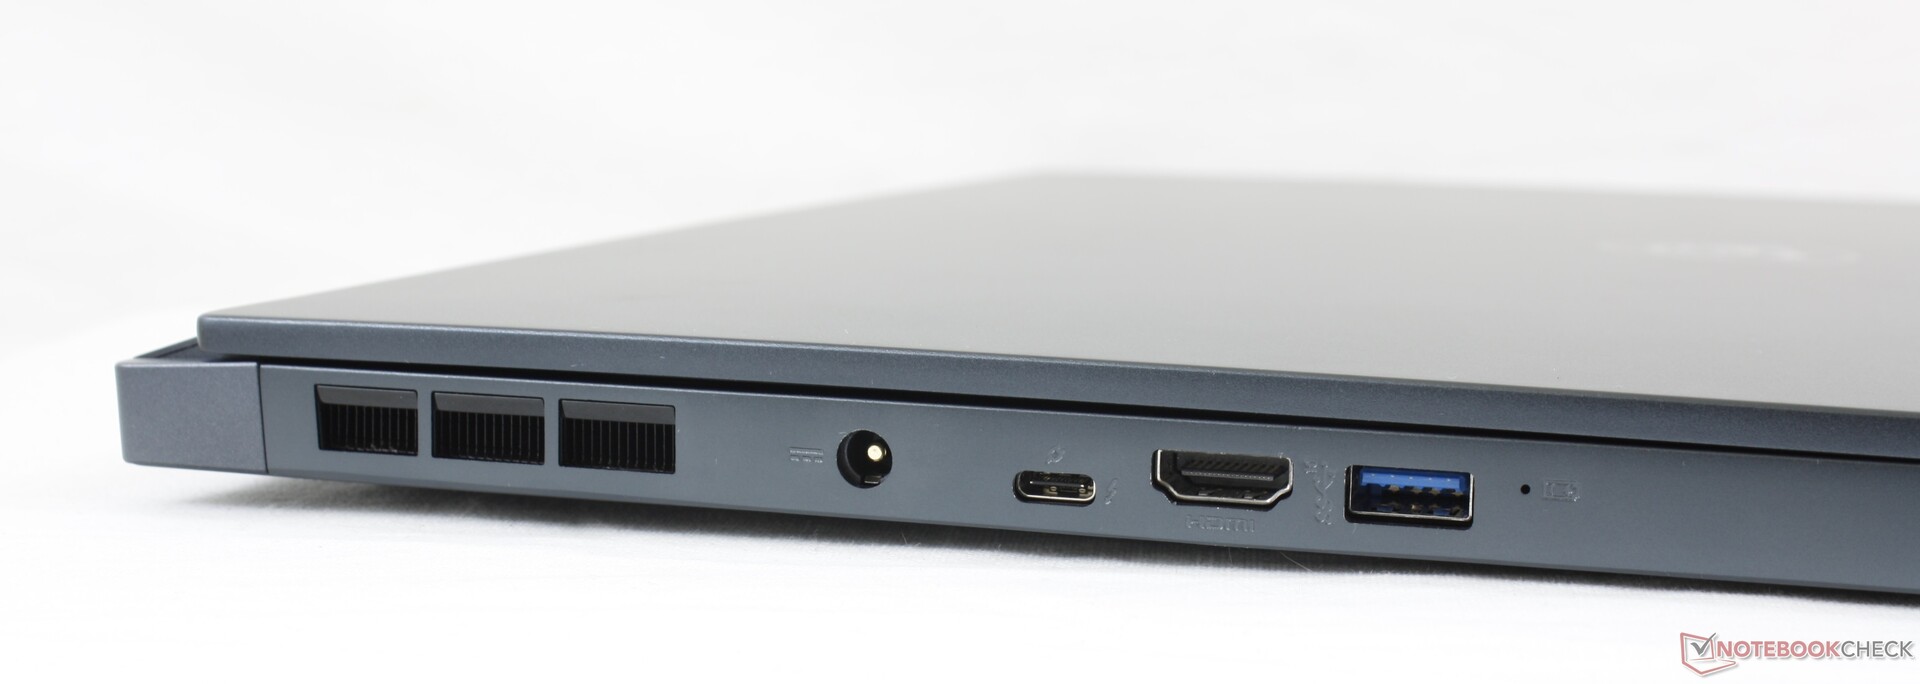
Conectividad
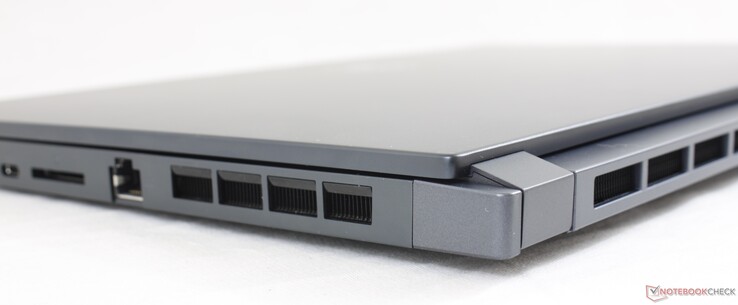
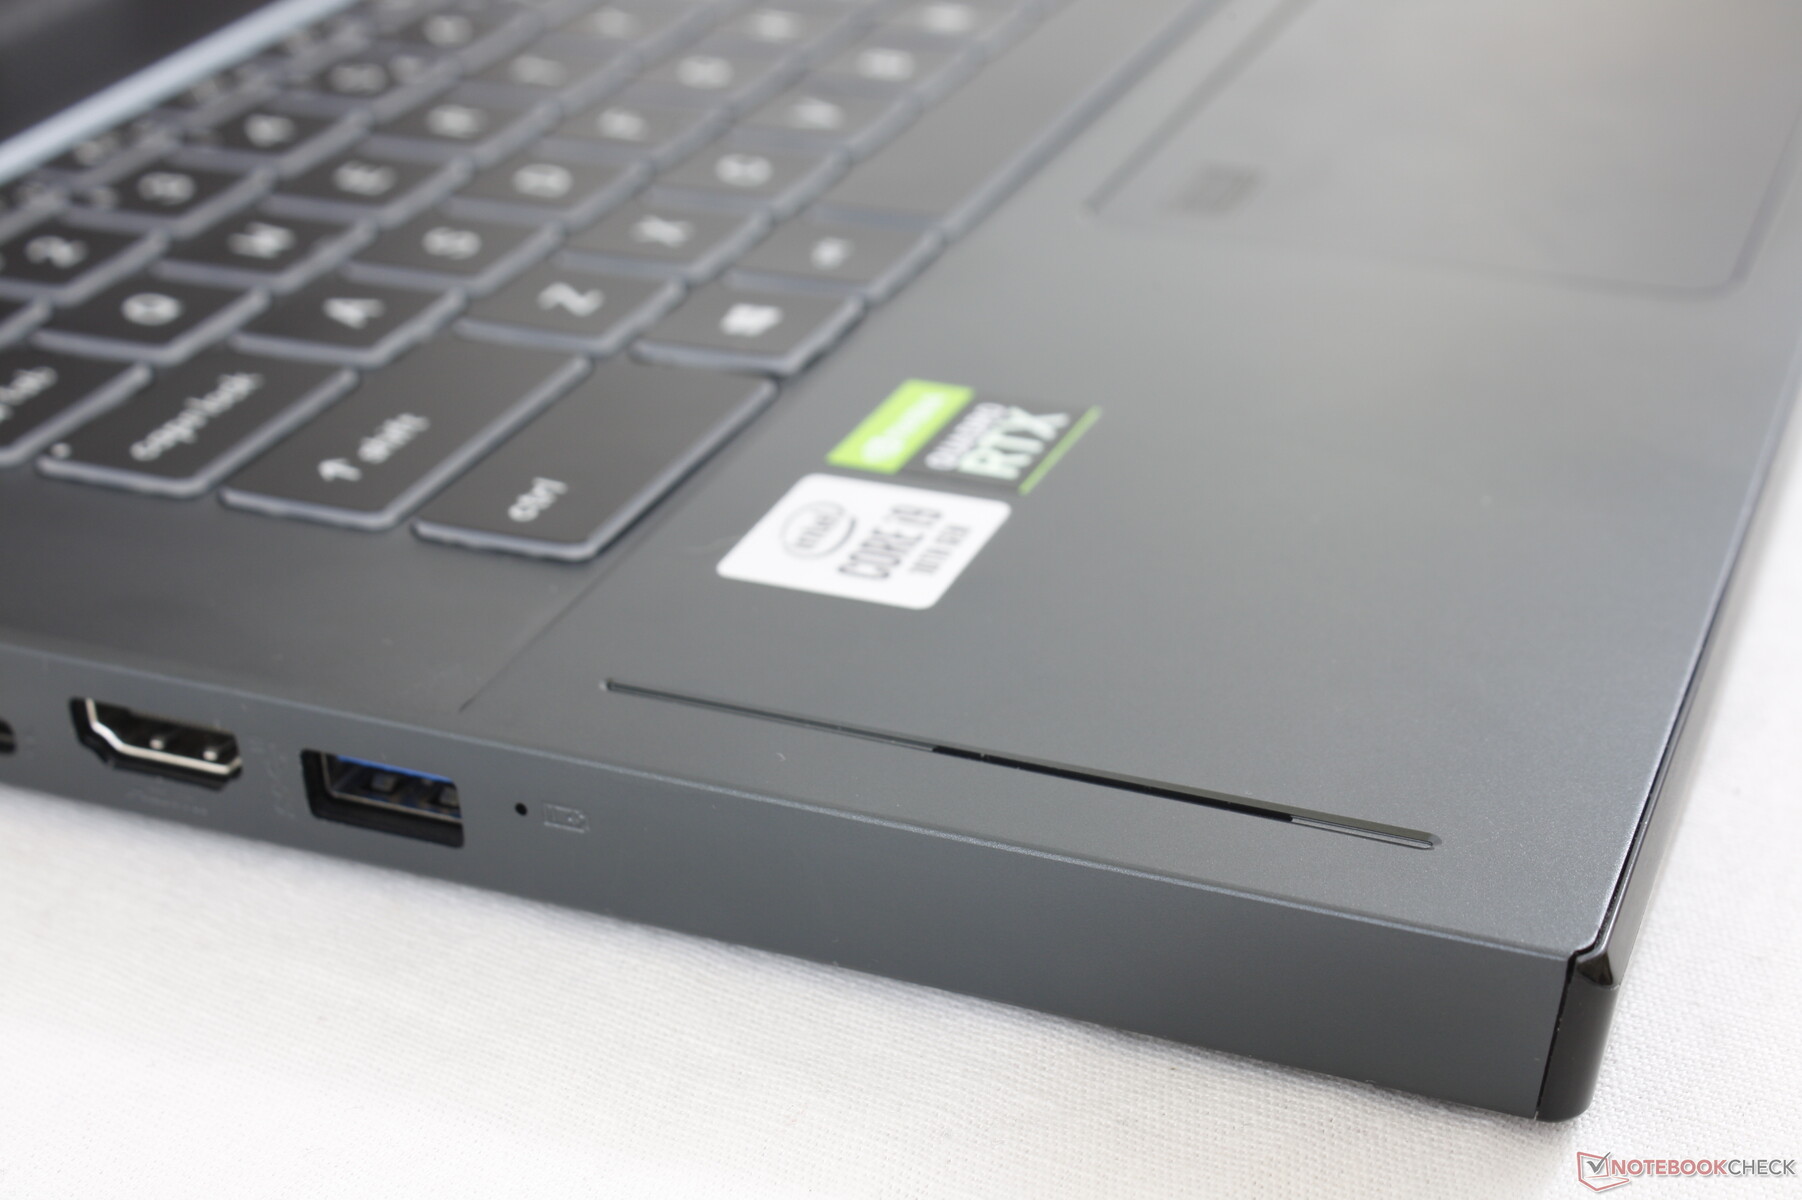
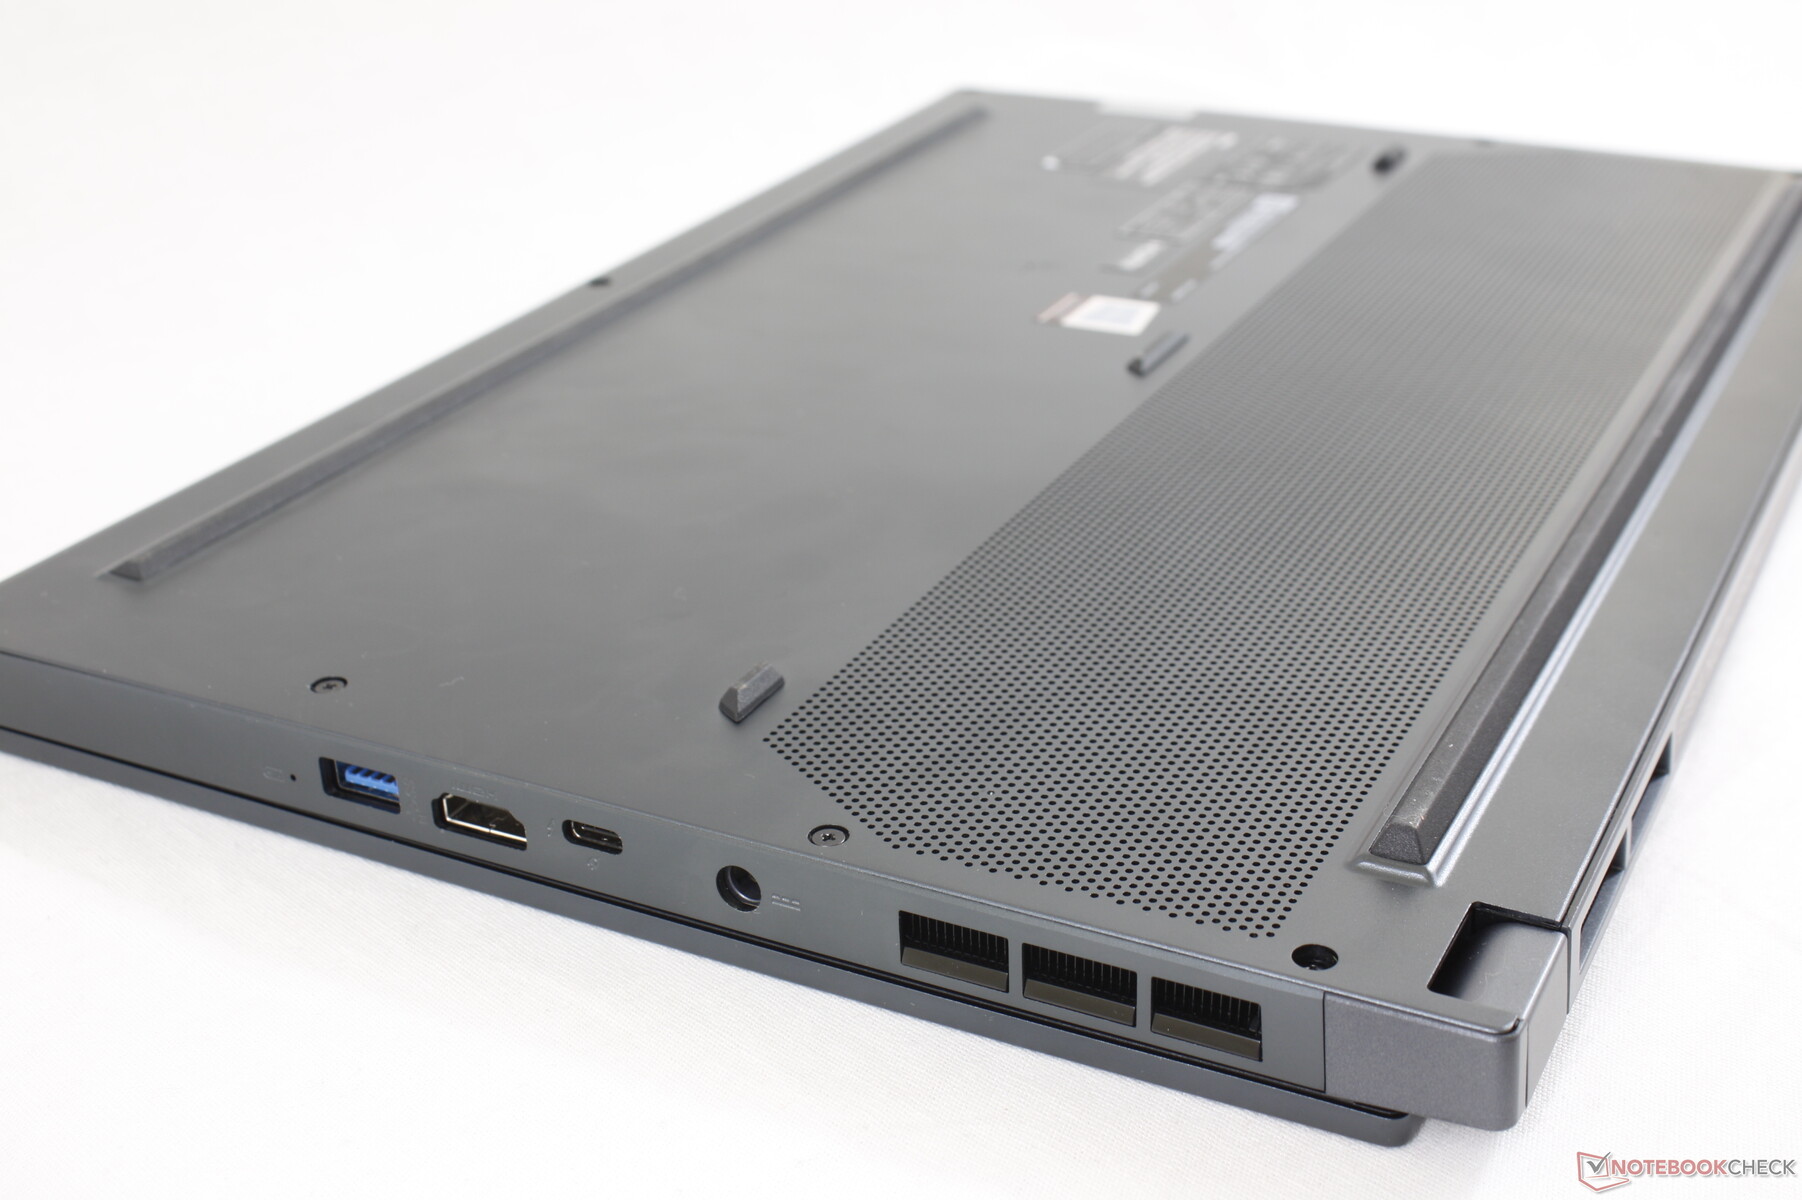
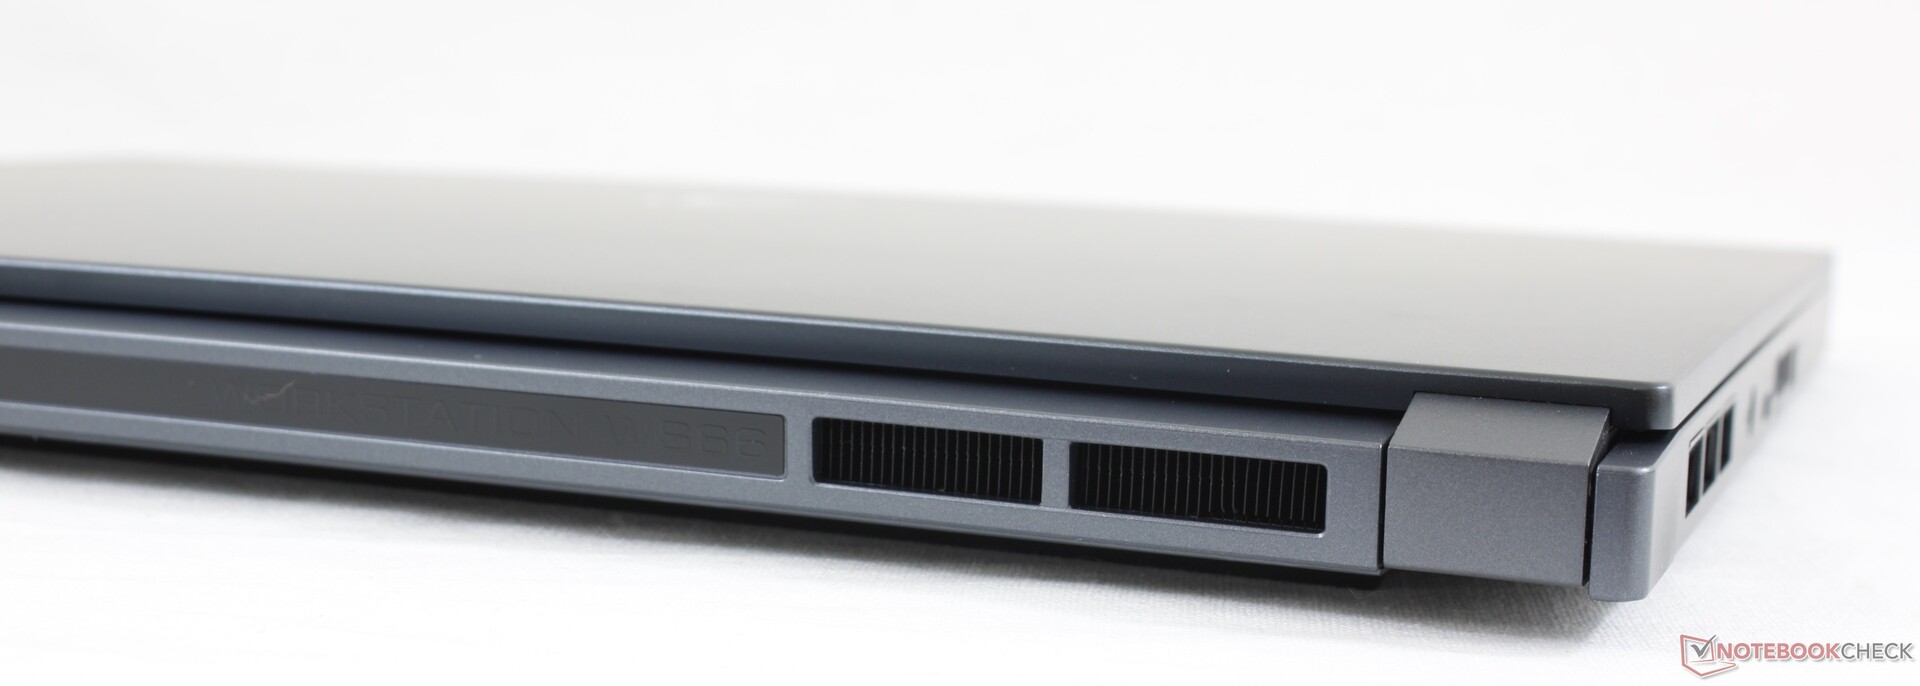
Una forma fácil de distinguir el WS66 del GS66 es mirando sus puertos USB-A. El WS66 tiene sólo un puerto USB-A mientras que el GS66 tiene tres. A cambio, el WS66 obtiene un lector de tarjetas SD de tamaño completo.
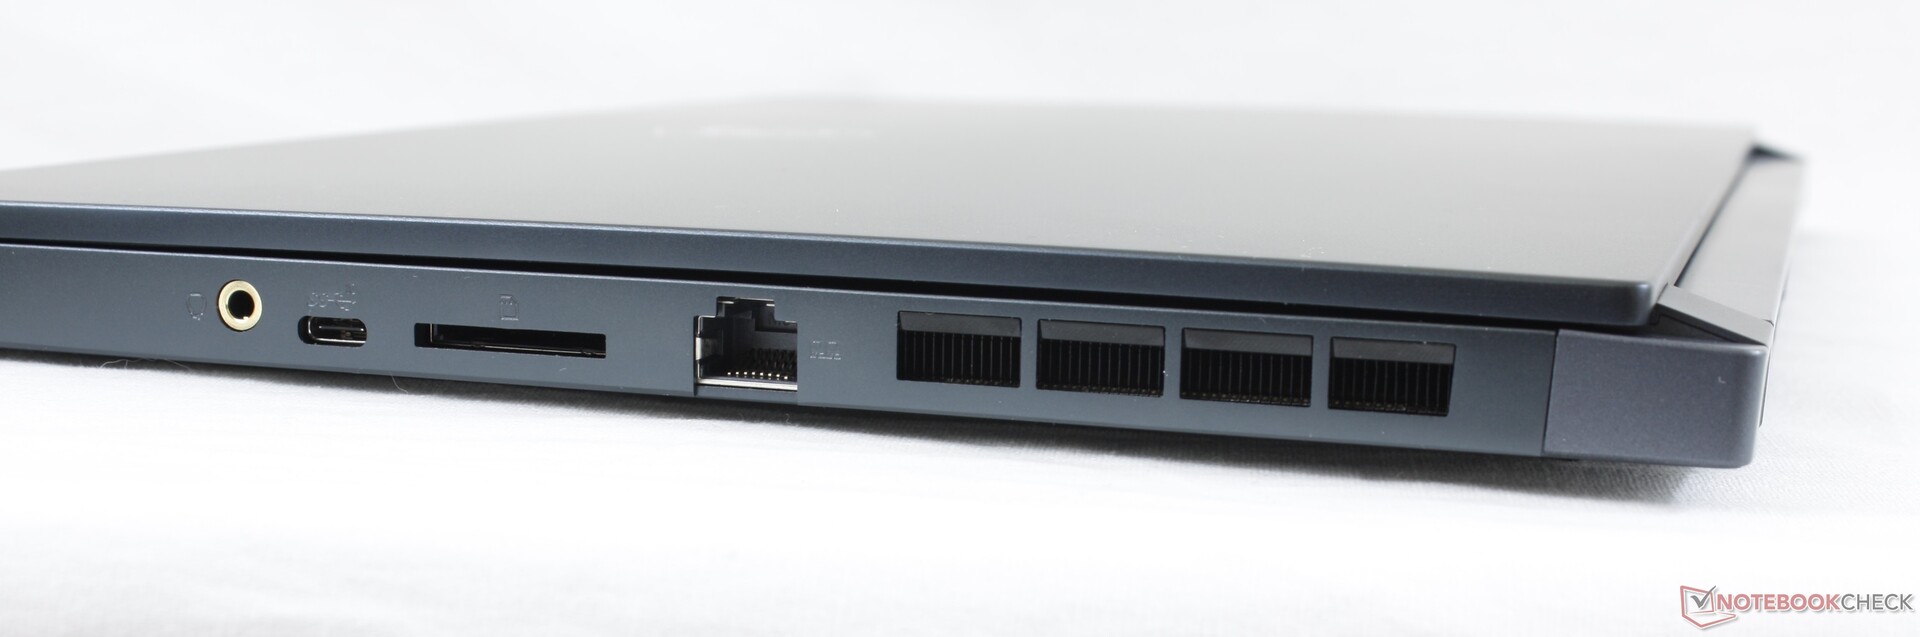
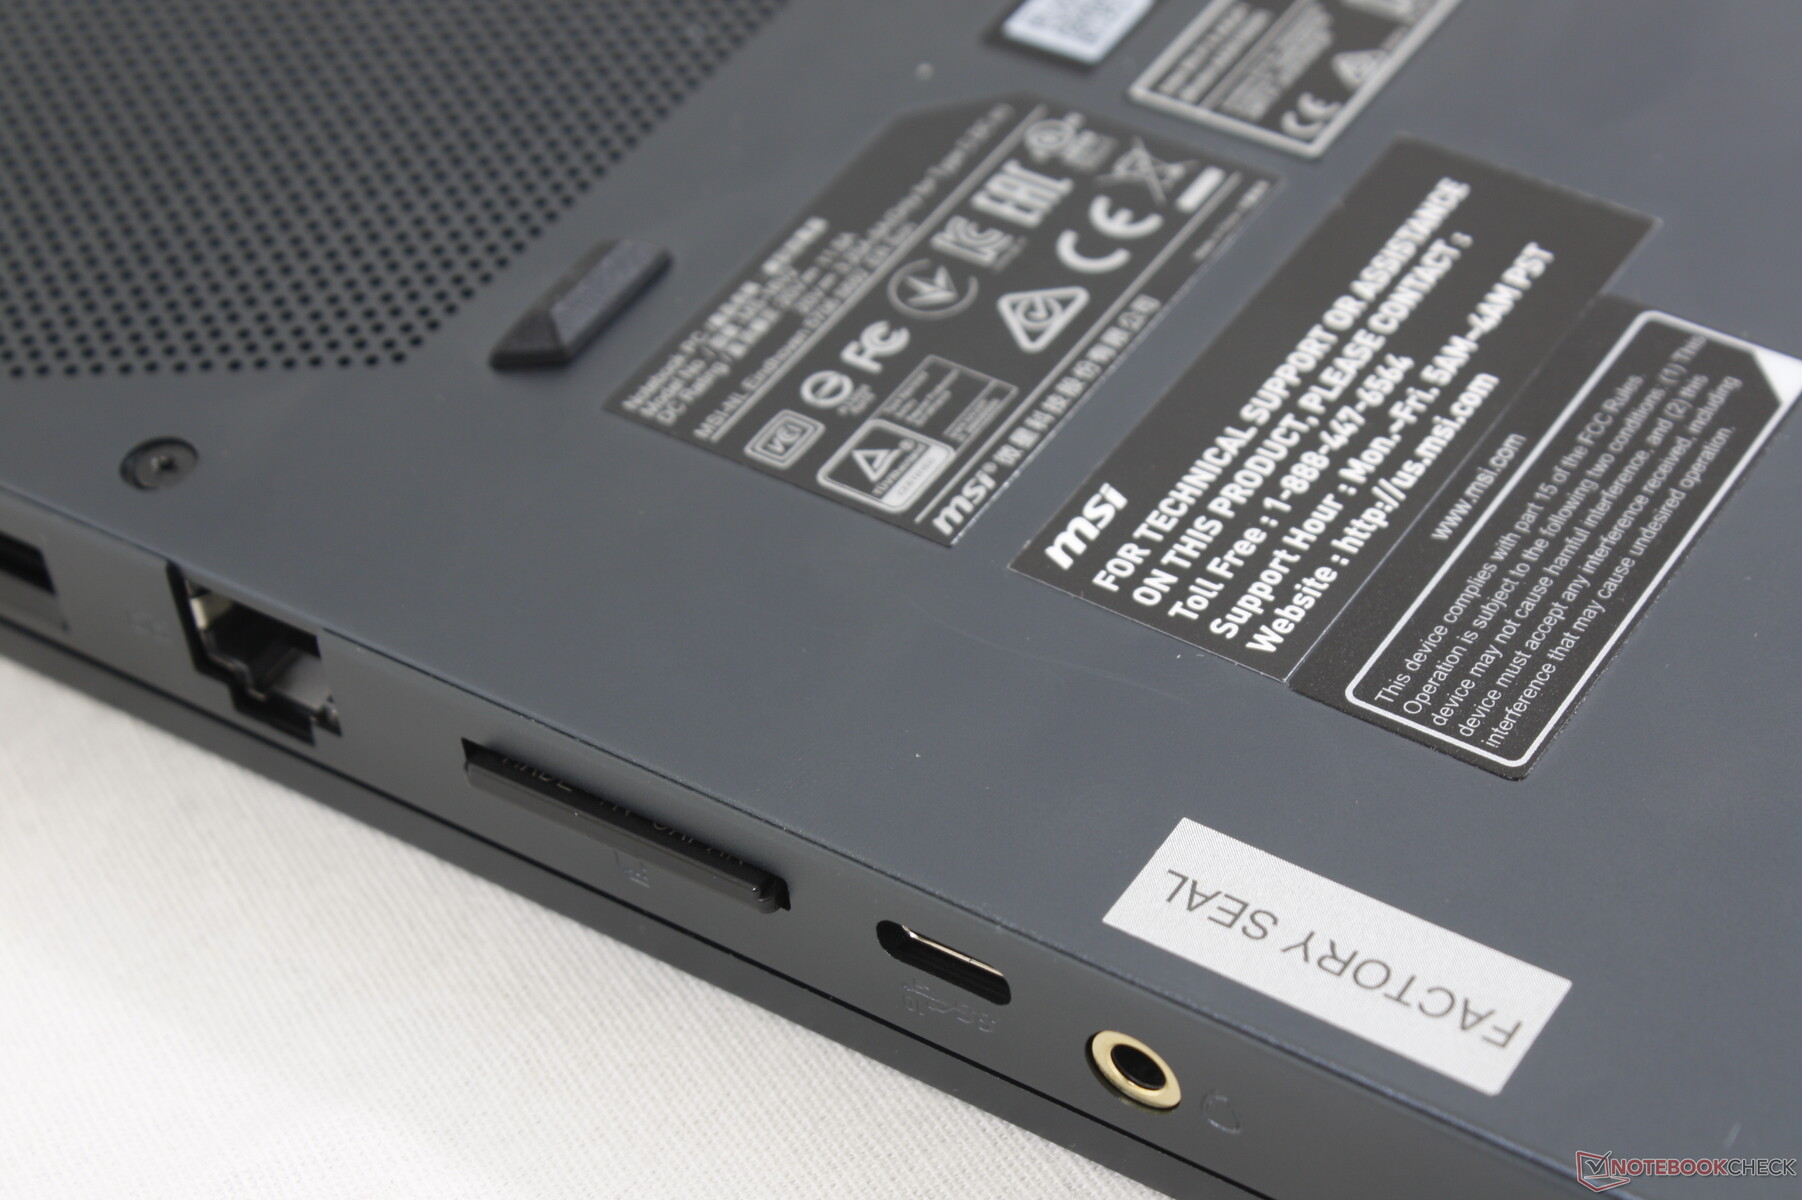
Lector de tarjetas SD
Las tasas de transferencia del lector SD integrado son extremadamente rápidas. Mover 1 GB de imágenes de nuestra tarjeta de prueba UHS-II al escritorio toma menos de 5 segundos comparado con casi 40 segundos en el MSI WE75.
| SD Card Reader | |
| average JPG Copy Test (av. of 3 runs) | |
| MSI WS66 10TMT-207US (Toshiba Exceria Pro SDXC 64 GB UHS-II) | |
| Razer Blade 15 RTX 2070 Super Max-Q (Toshiba Exceria Pro SDXC 64 GB UHS-II) | |
| Dell Precision 5550 P91F (Toshiba Exceria Pro SDXC 64 GB UHS-II) | |
| Dell Precision 7550 (Toshiba Exceria Pro SDXC 64 GB UHS-II) | |
| MSI WS63VR 7RL-023US | |
| MSI WE75 9TK (Toshiba Exceria Pro SDXC 64 GB UHS-II) | |
| maximum AS SSD Seq Read Test (1GB) | |
| MSI WS63VR 7RL-023US | |
| MSI WS66 10TMT-207US (Toshiba Exceria Pro SDXC 64 GB UHS-II) | |
| Razer Blade 15 RTX 2070 Super Max-Q (Toshiba Exceria Pro SDXC 64 GB UHS-II) | |
| Dell Precision 5550 P91F (Toshiba Exceria Pro SDXC 64 GB UHS-II) | |
| Dell Precision 7550 (Toshiba Exceria Pro SDXC 64 GB UHS-II) | |
| MSI WE75 9TK (Toshiba Exceria Pro SDXC 64 GB UHS-II) | |
Comunicación
El Intel AX201 viene de serie para la conexión Wi-Fi 6 y Bluetooth 5.1. Curiosamente, las velocidades de recepción se incrementan a unos 900 Mbps cuando sabemos que son capaces de mucho más, pero por lo demás no experimentamos ningún problema al conectarnos a nuestro enrutador Netgear RAX200.

Webcam


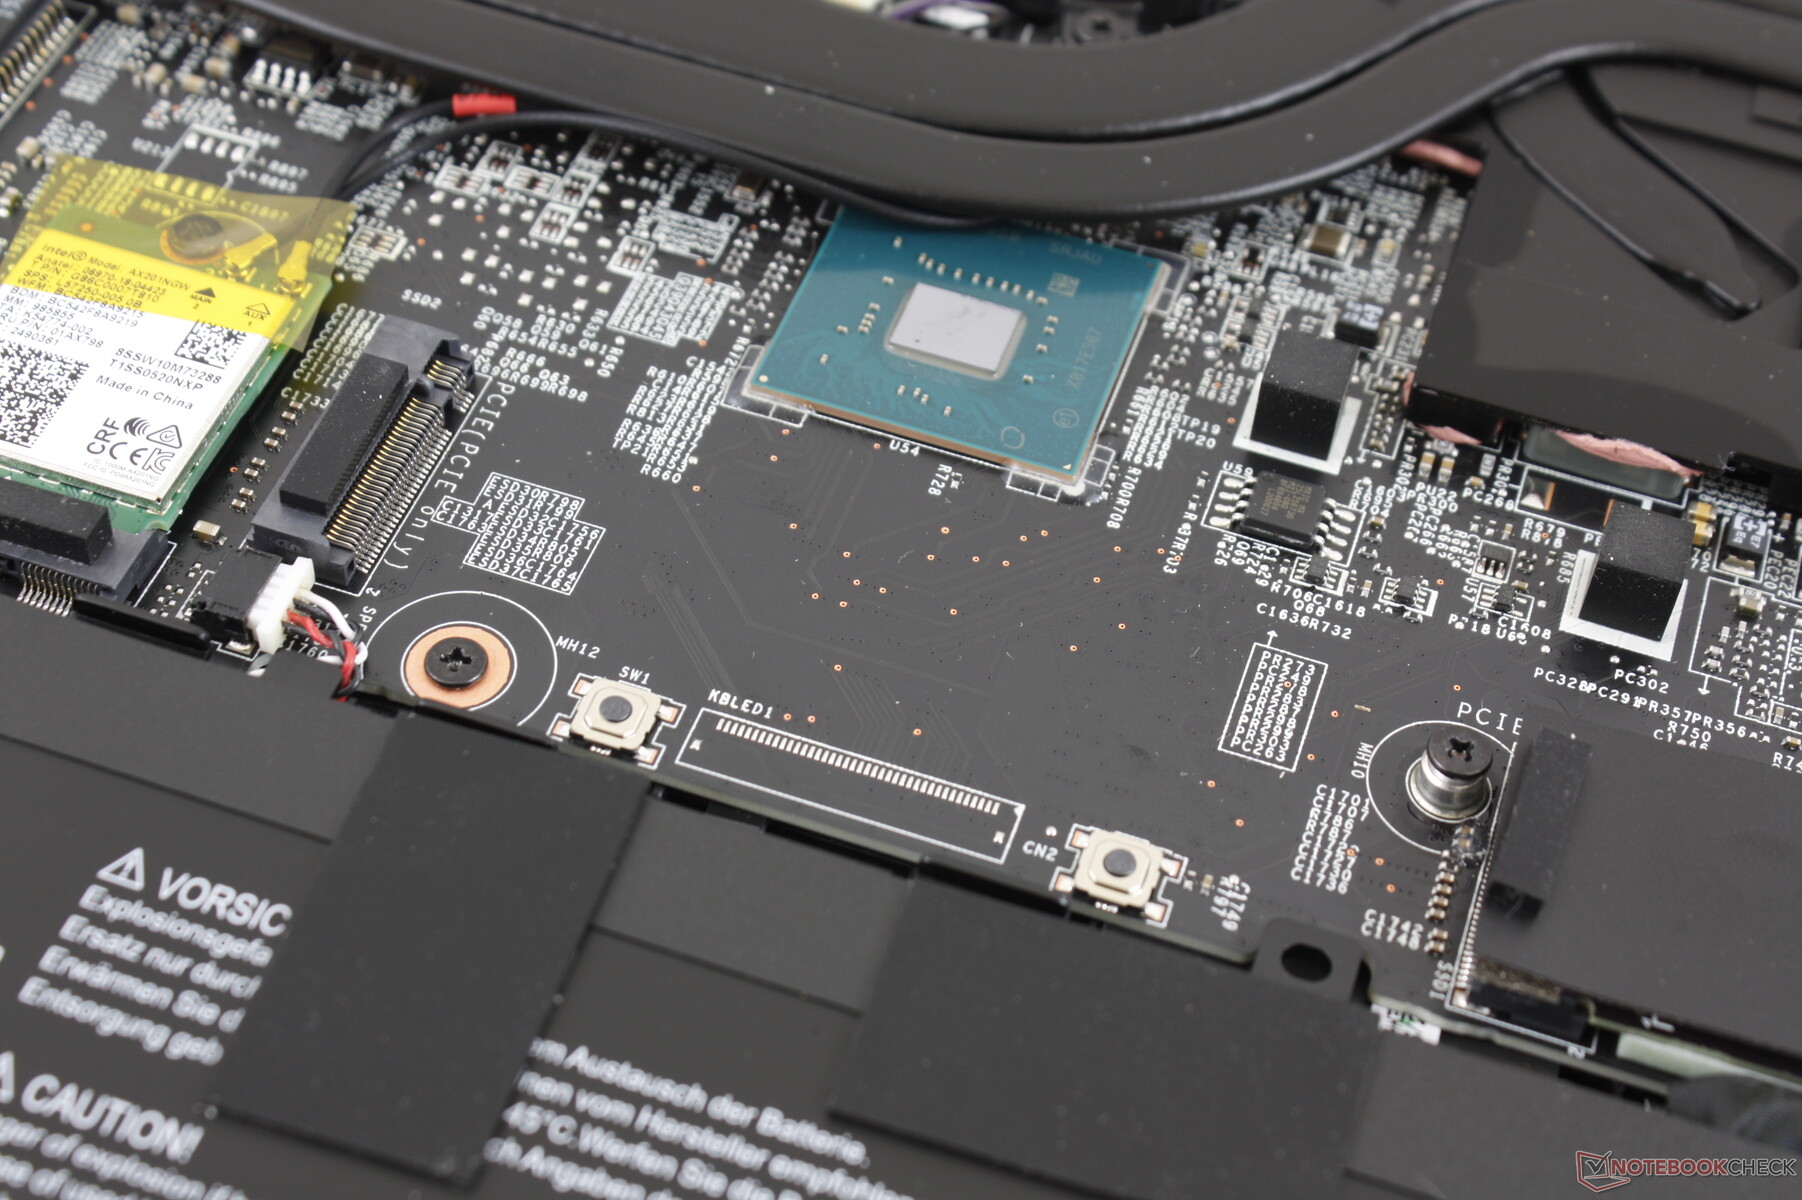
Mantenimiento
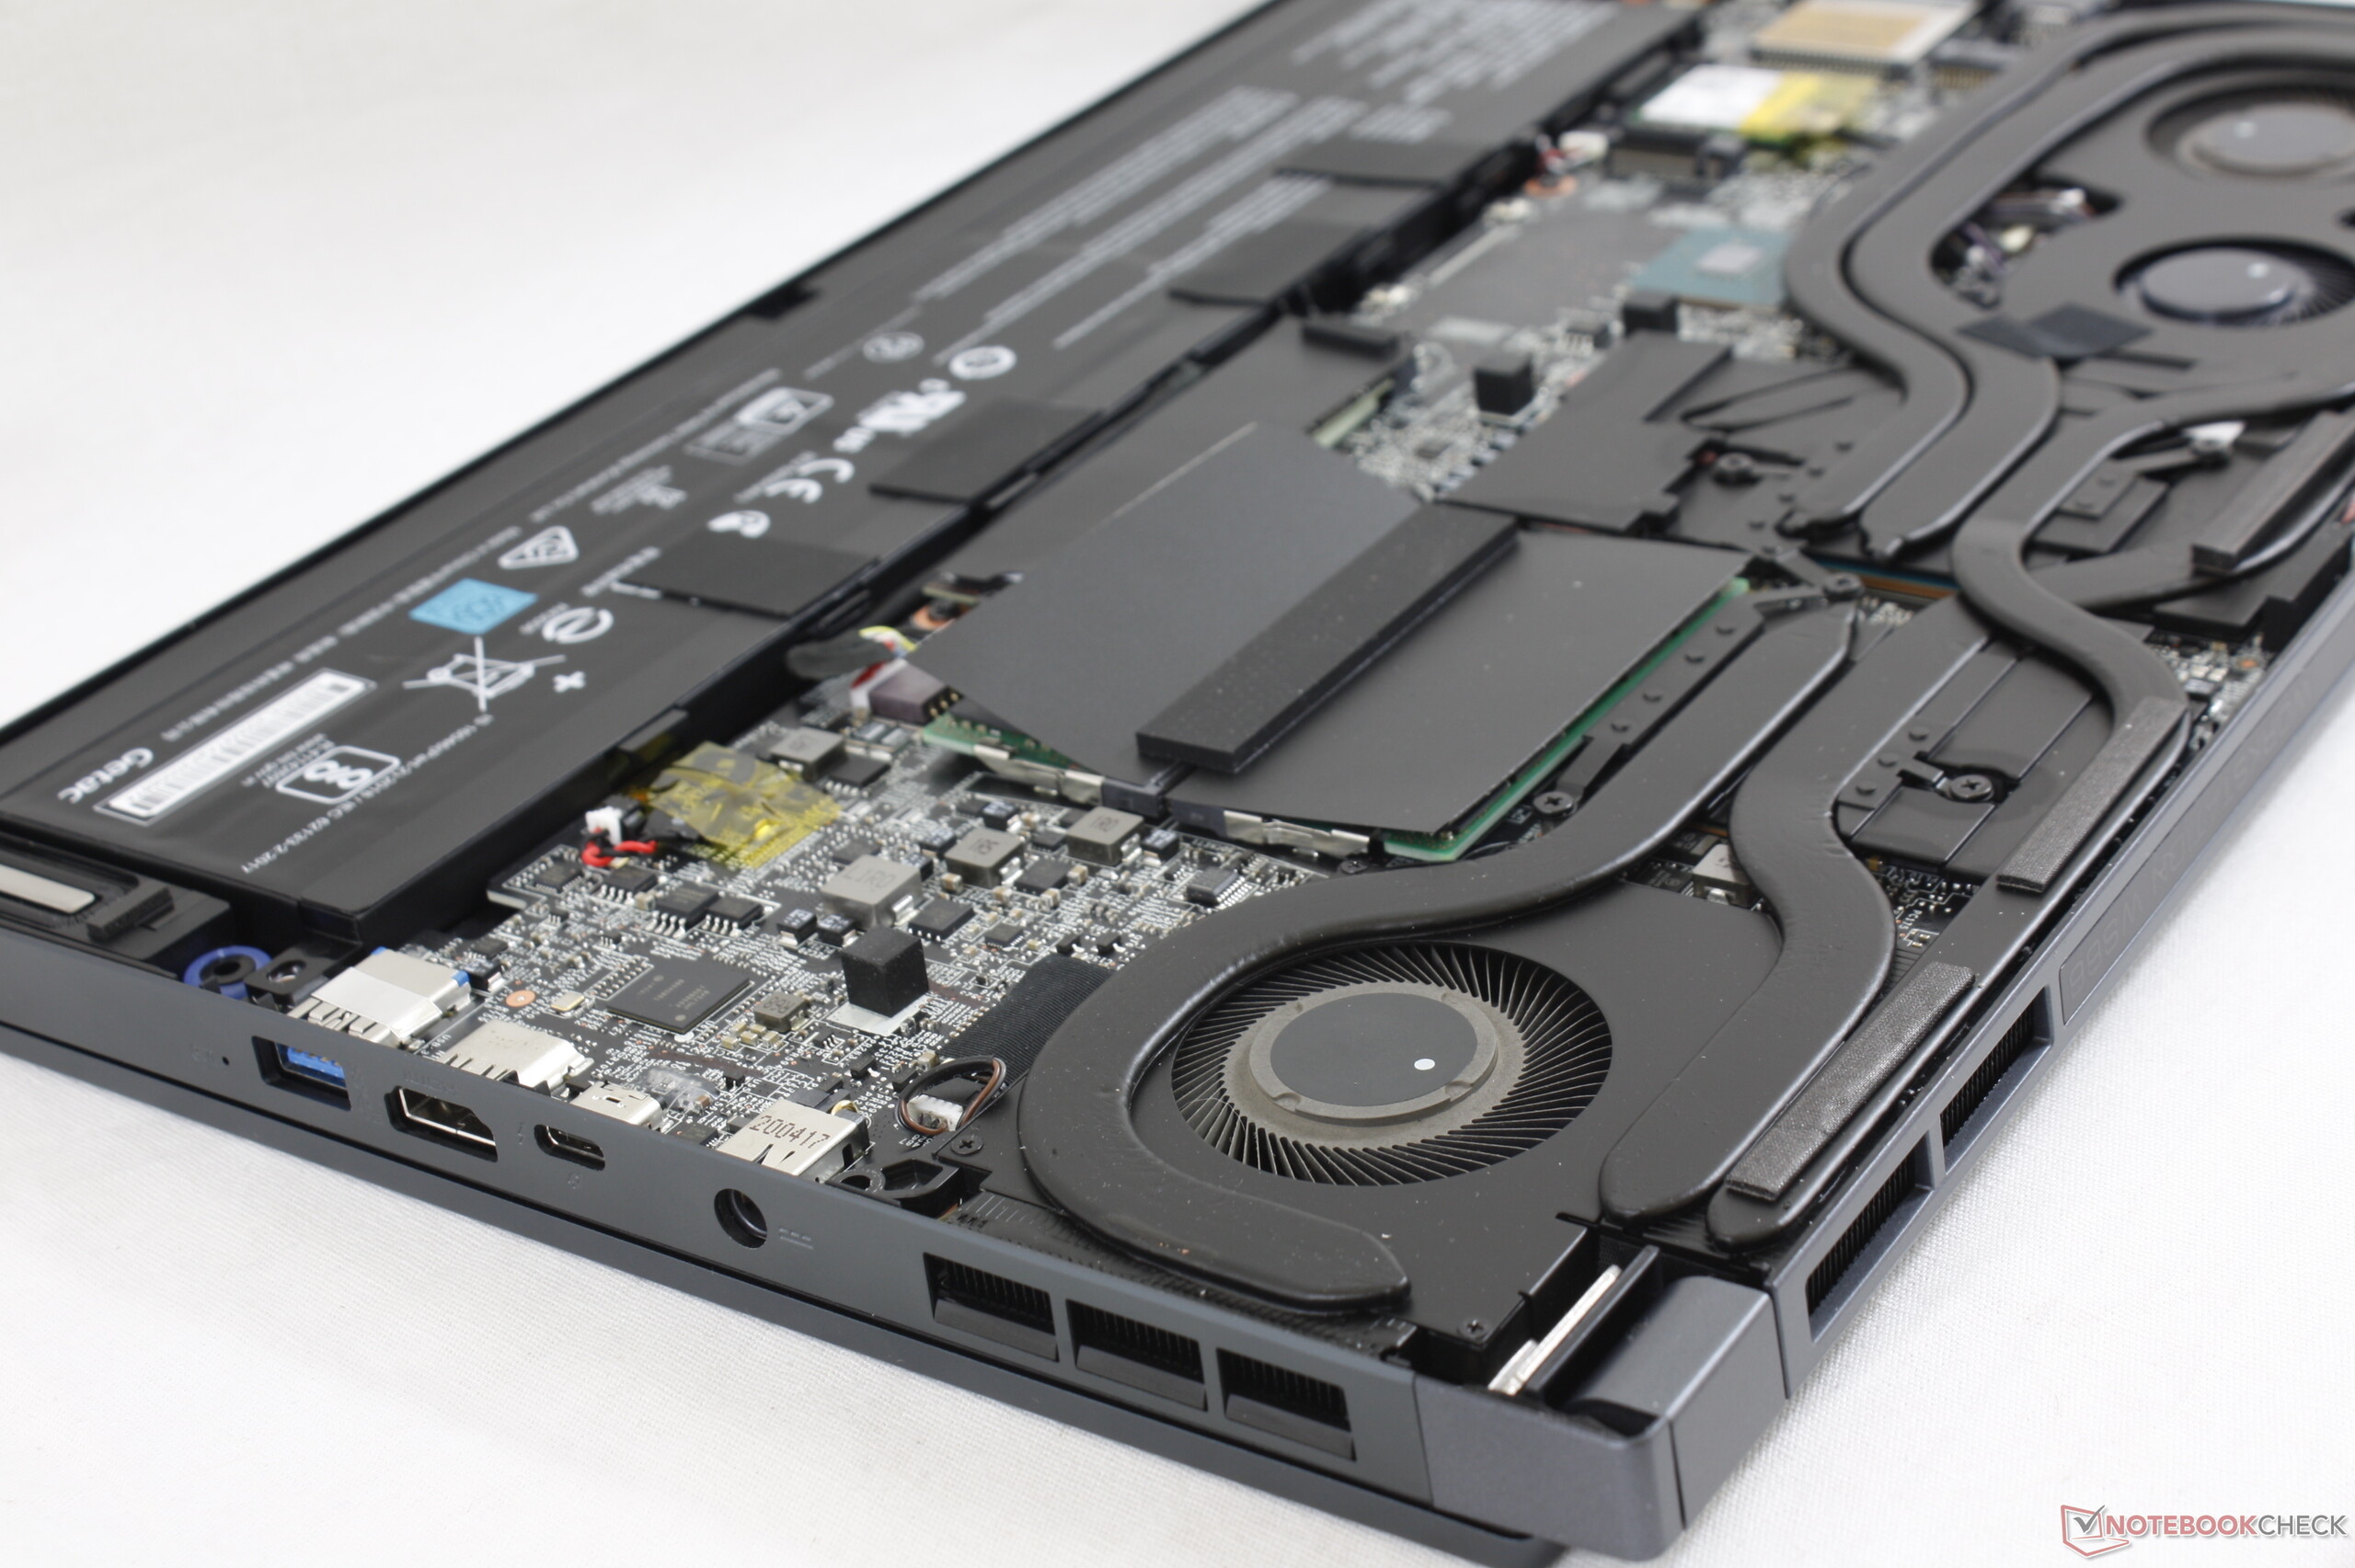
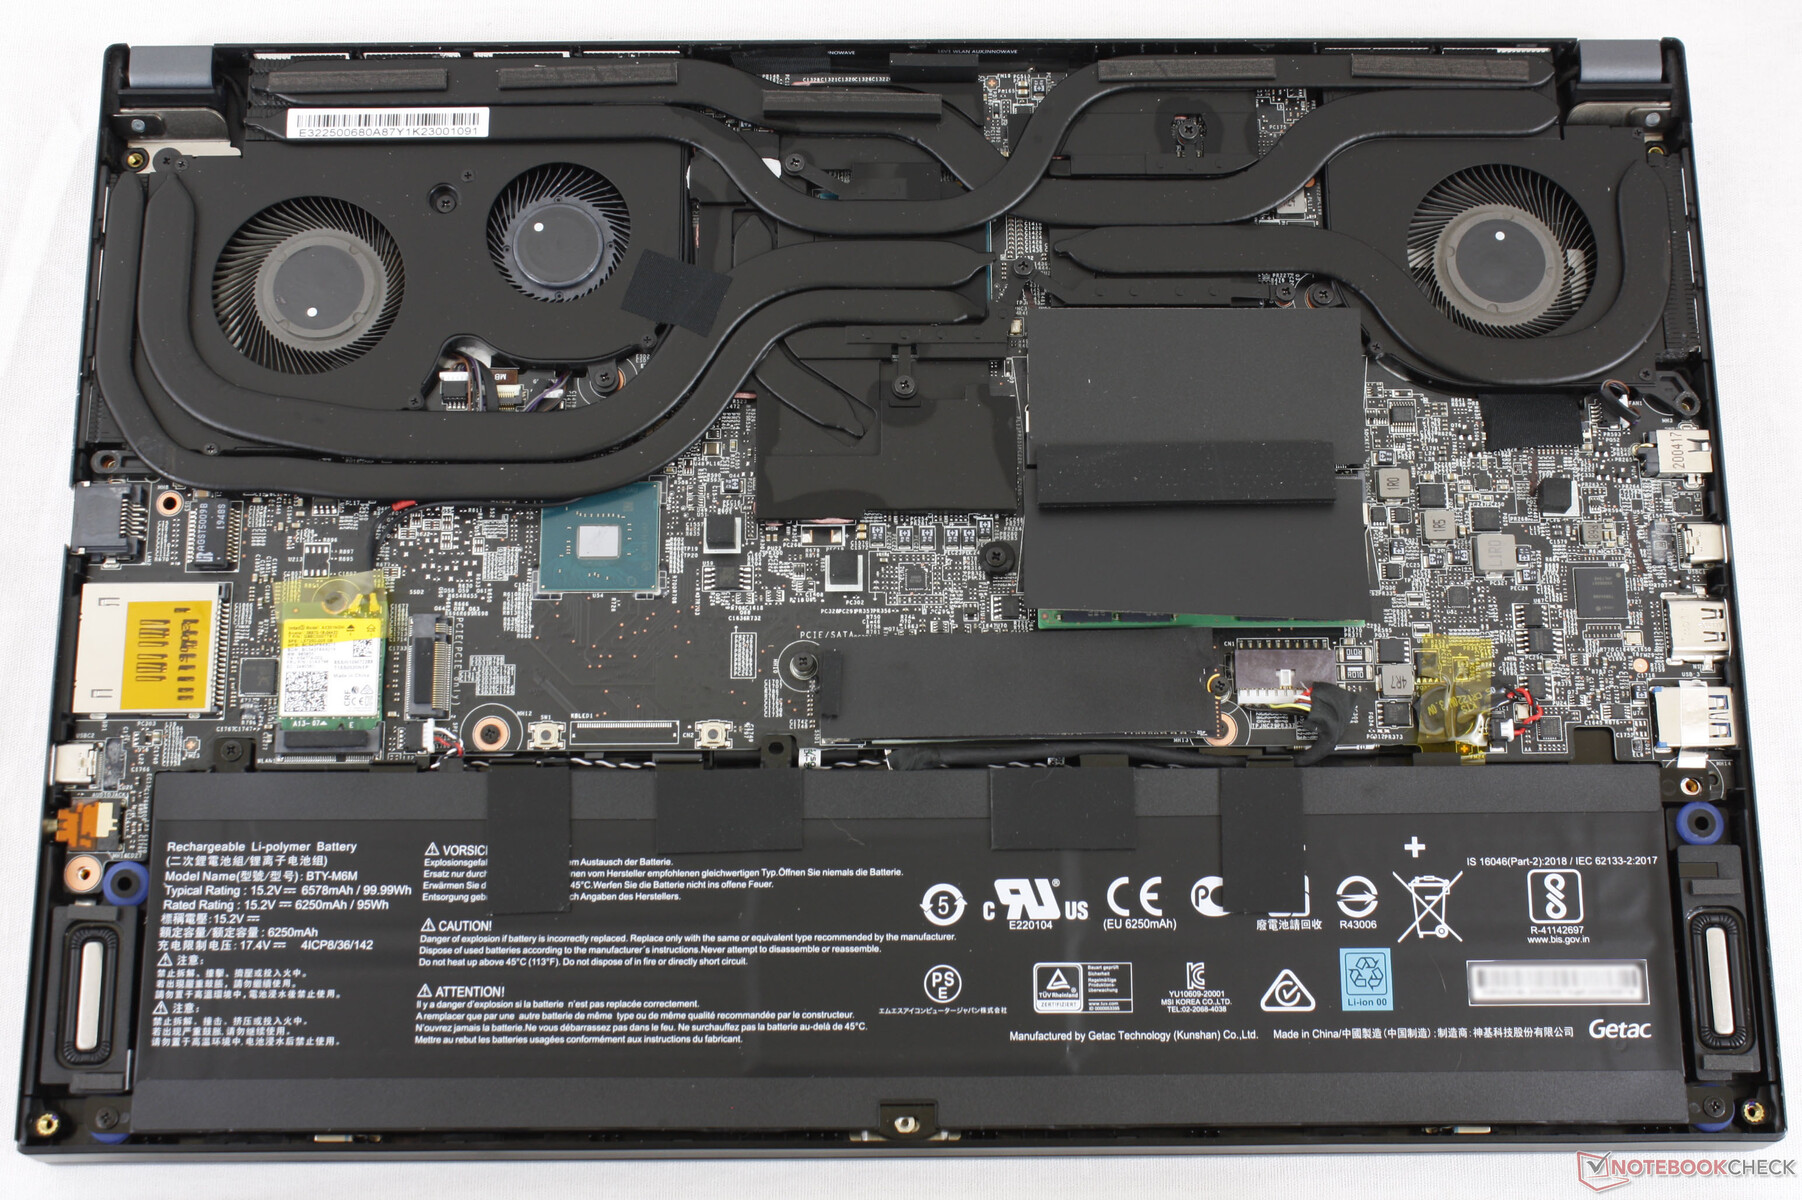
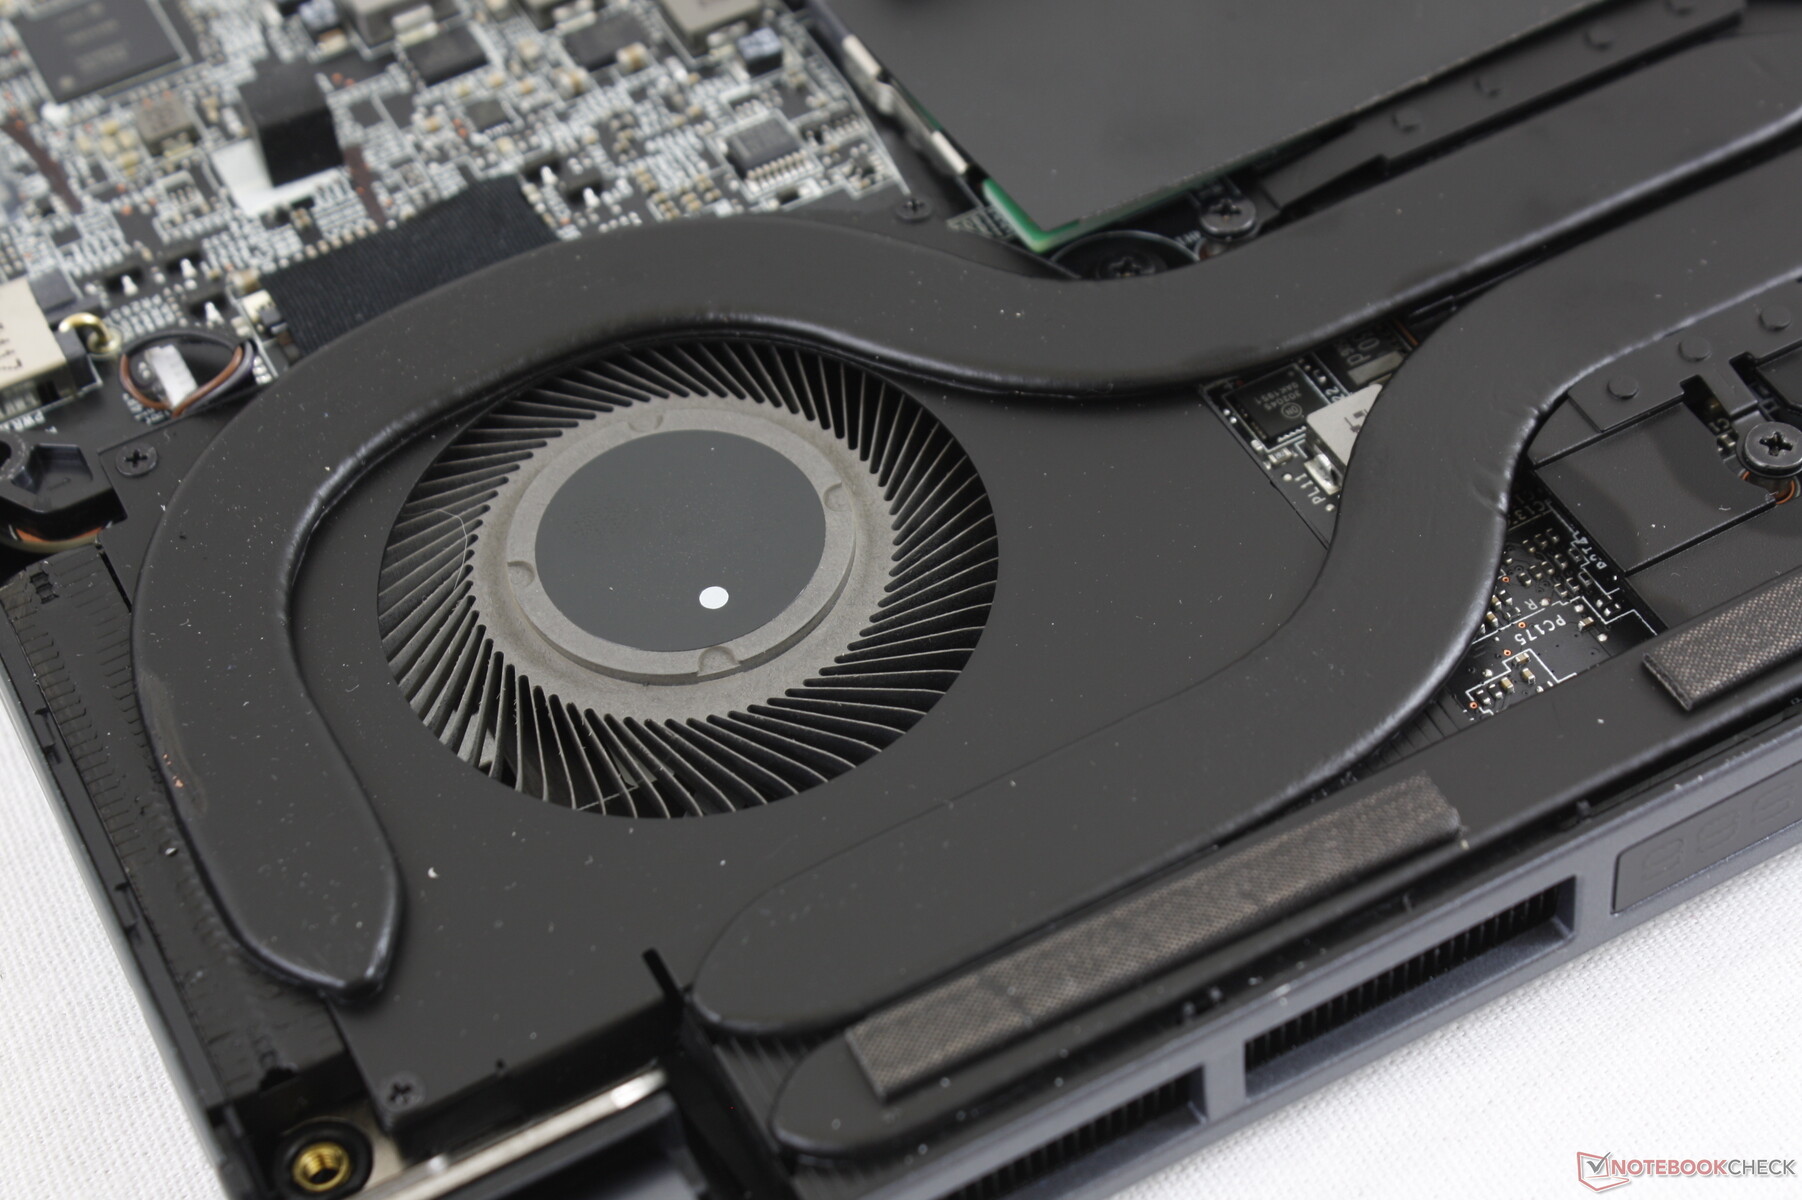
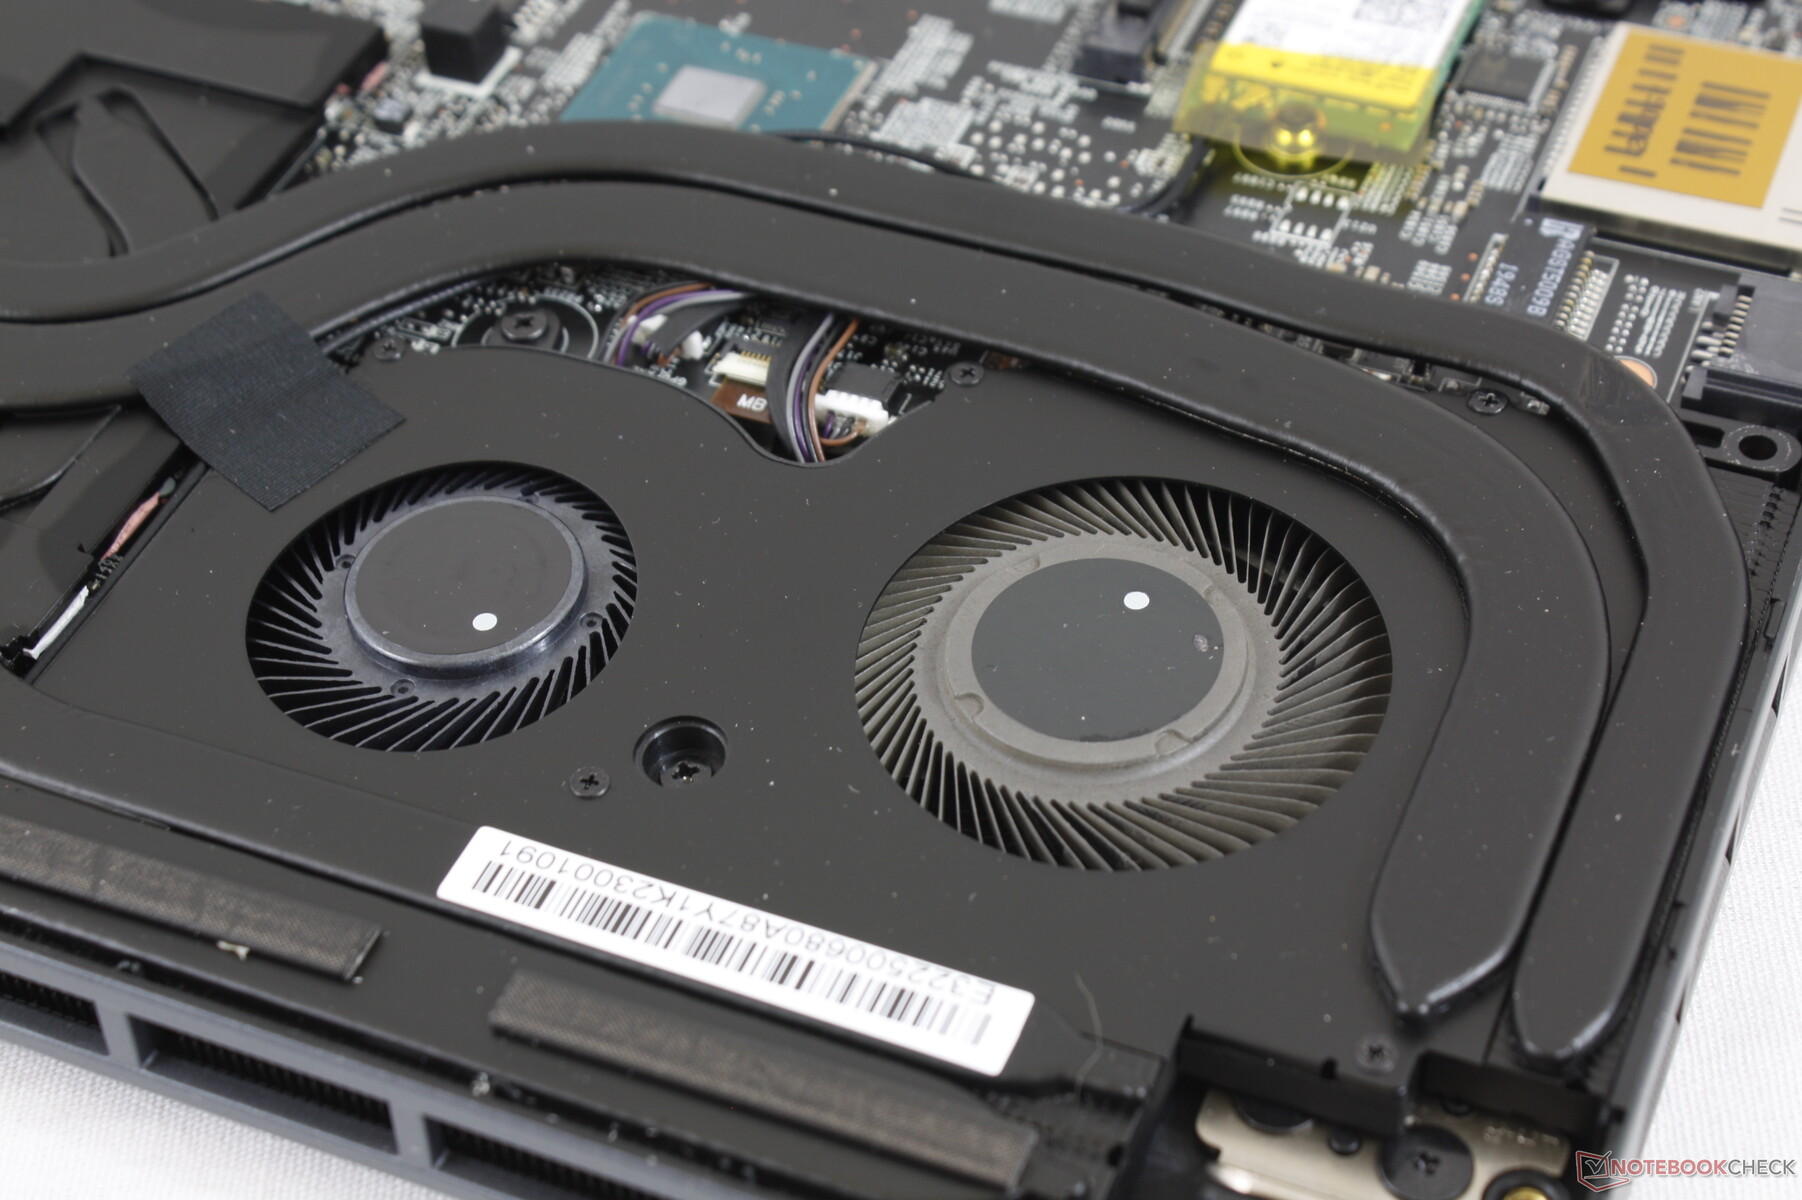
El panel inferior está asegurado por 9 tornillos Philips. Quitarlo es difícil porque los bordes afilados y las esquinas están bien sujetos a la base cuando se comparan con los paneles inferiores del WS63 o del Razer Blade 15 Studio.
Accesorios y garantía
No hay más extras en la caja que el adaptador de CA y el papeleo. MSI ofrece una garantía limitada de tres añoscon servicio in situ como estándar.
Dispositivos de entrada
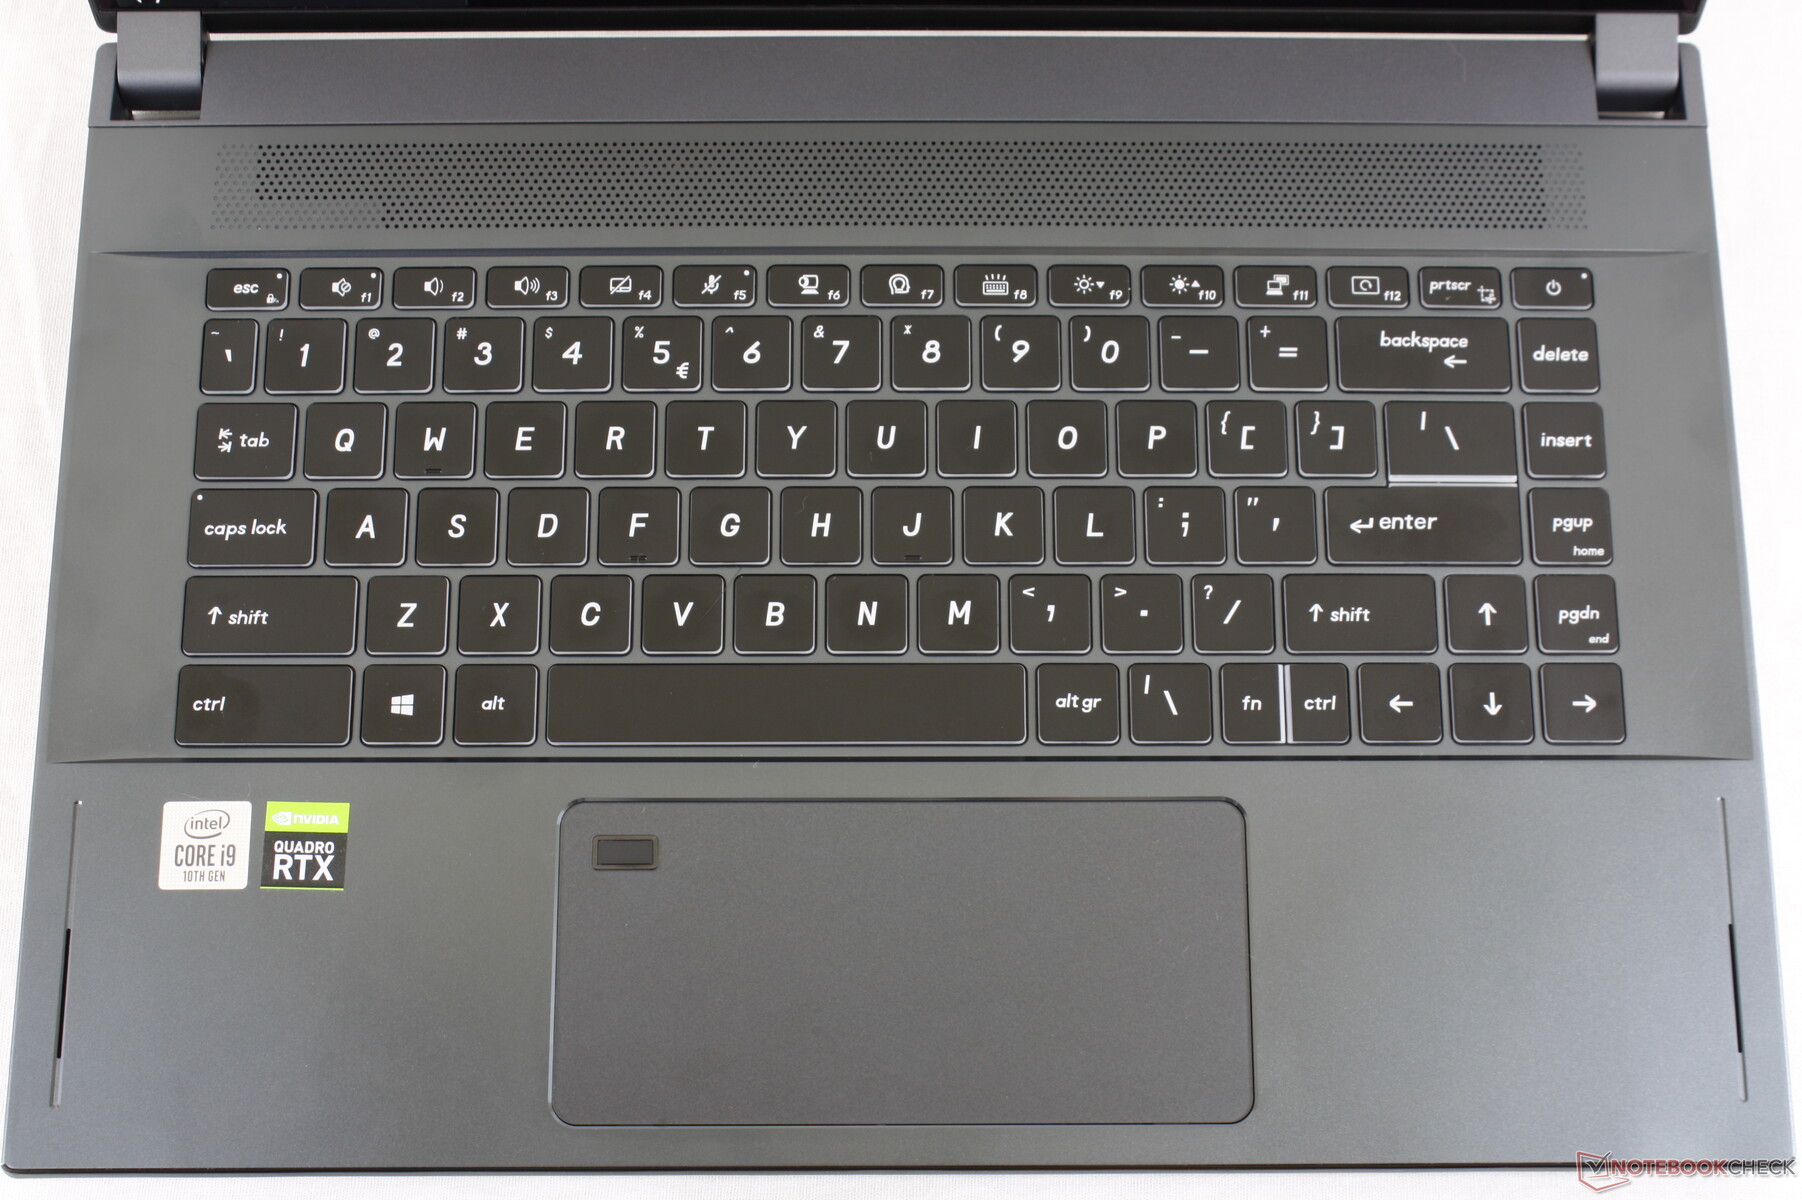
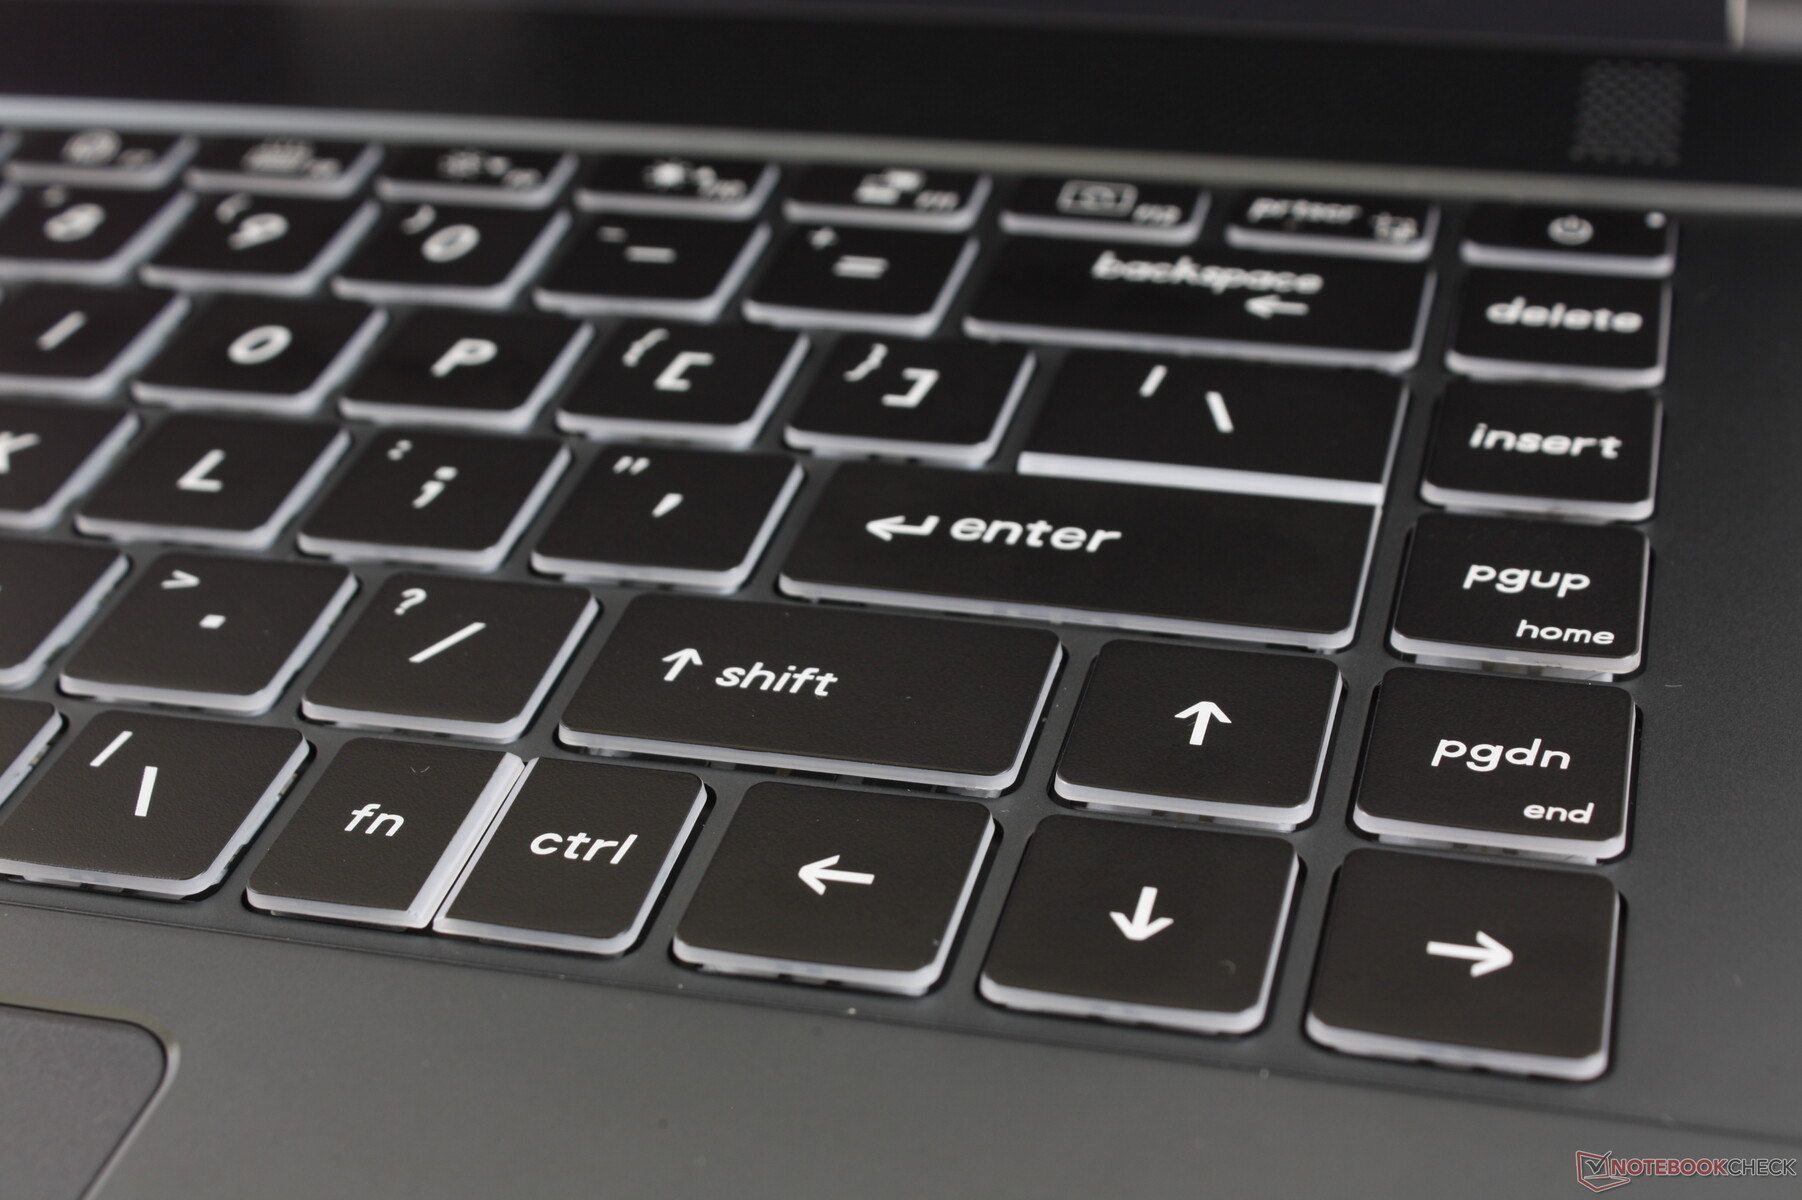
Teclado
La disposición y la respuesta de las teclas son idénticas a las del GS66 para bien o para mal. Encontramos que las teclas son demasiado superficiales con una retroalimentación débil, especialmente cuando se comparan con los teclados superiores de las series WE o WT de MSI. Sin embargo, si ya estás acostumbrado a escribir en los Ultrabooks, entonces el WS66 no se sentirá tan diferente.
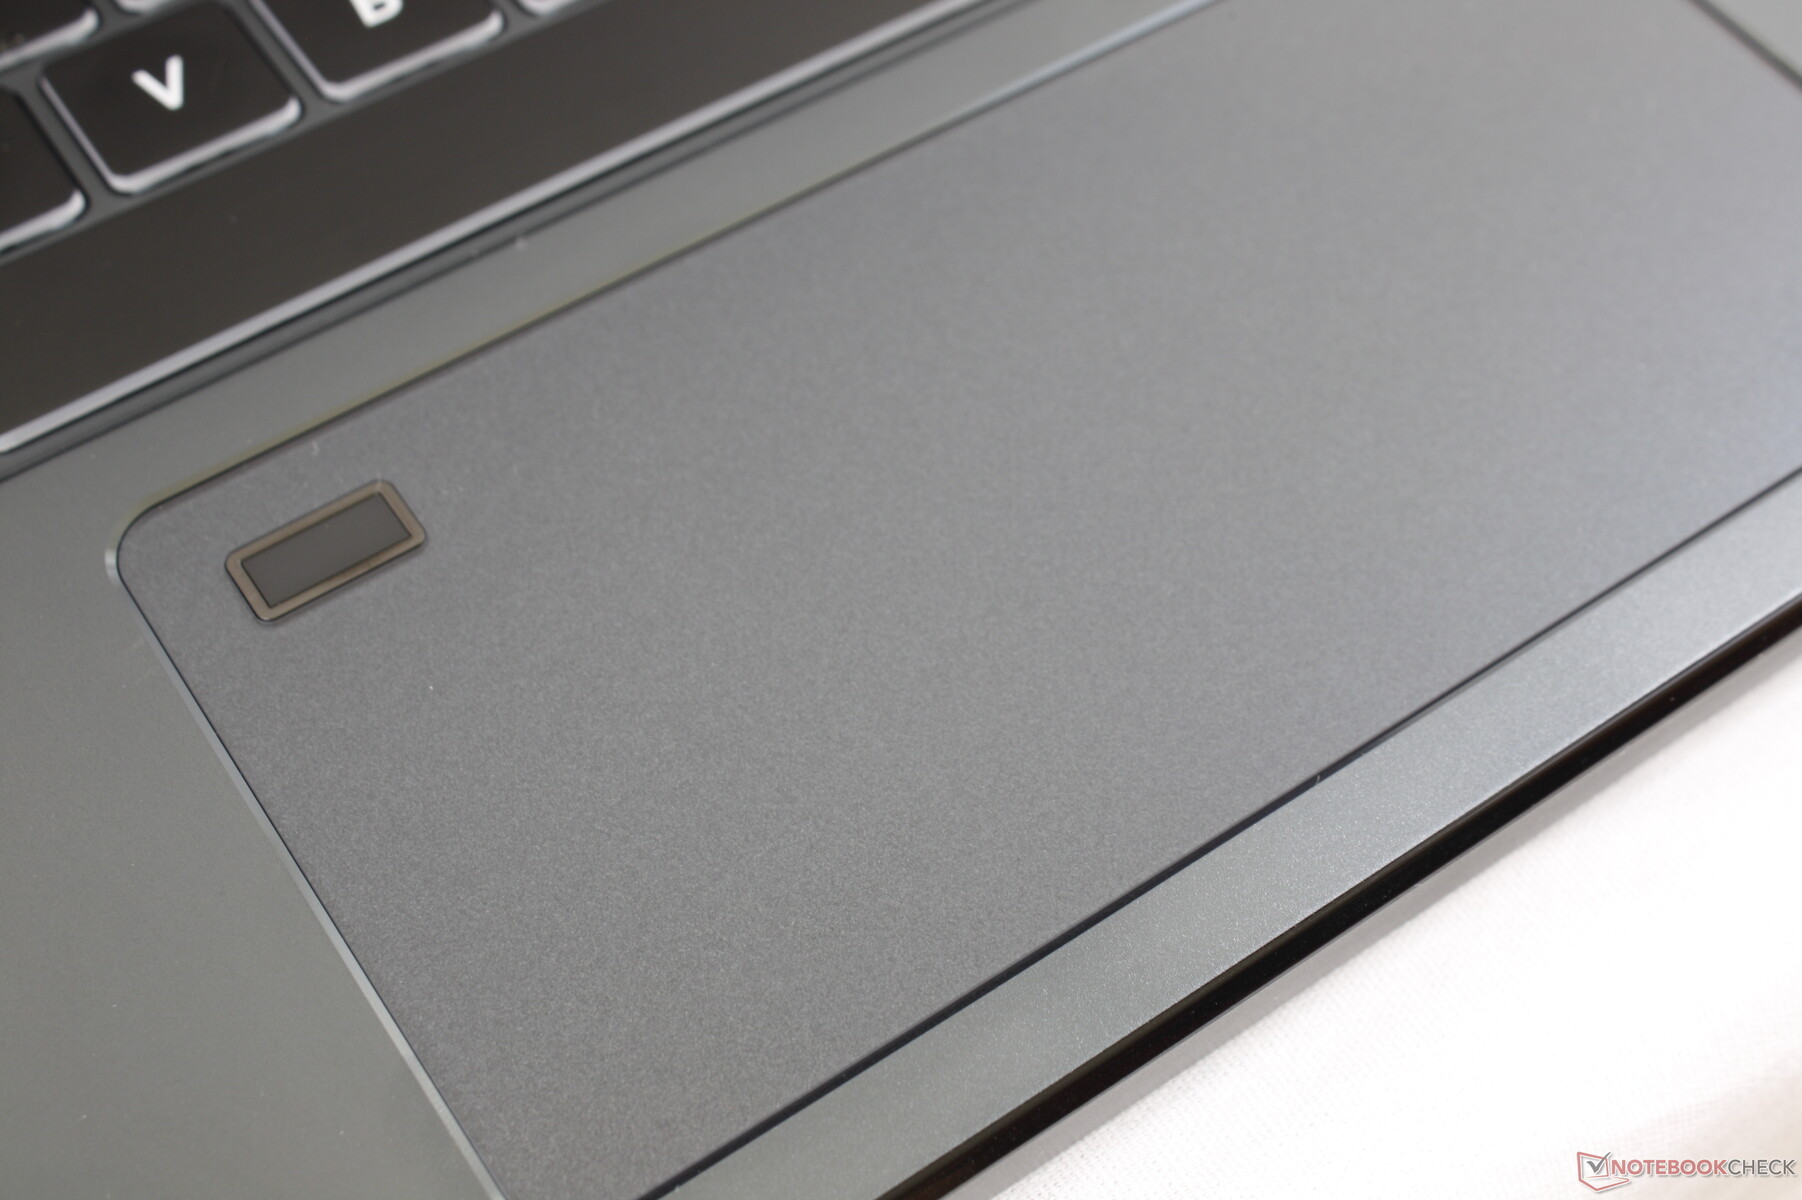
Touchpad
El amplio panel de clicks de precisión (14 x 6,5 cm) es suave y sólo se pega un poco cuando se desliza a baja velocidad. Desafortunadamente, los botones integrados del ratón son suaves en la retroalimentación con viajes poco profundos para una experiencia insatisfactoria. Además, al hacer clic en la mitad derecha del panel de clic se siente más esponjoso que la mitad izquierda cuando debería ser uniforme de un borde al otro. El espacio extra es agradable para las entradas multitáctiles, pero preferimos la precisión de los botones dedicados del ratón como los del MSI WT75.
Una consecuencia molesta del alargado clickpad es que la palma de la mano derecha casi siempre estará presionando sobre él mientras escribe. El rechazo de la palma no es perfecto, así que puedes esperar algunas entradas accidentales de ratón de vez en cuando.

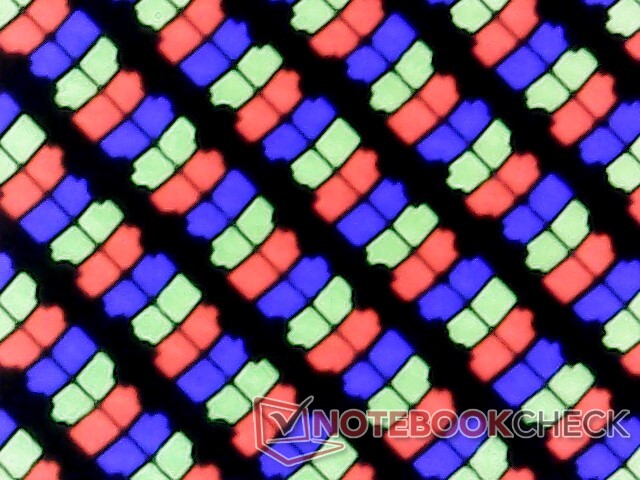
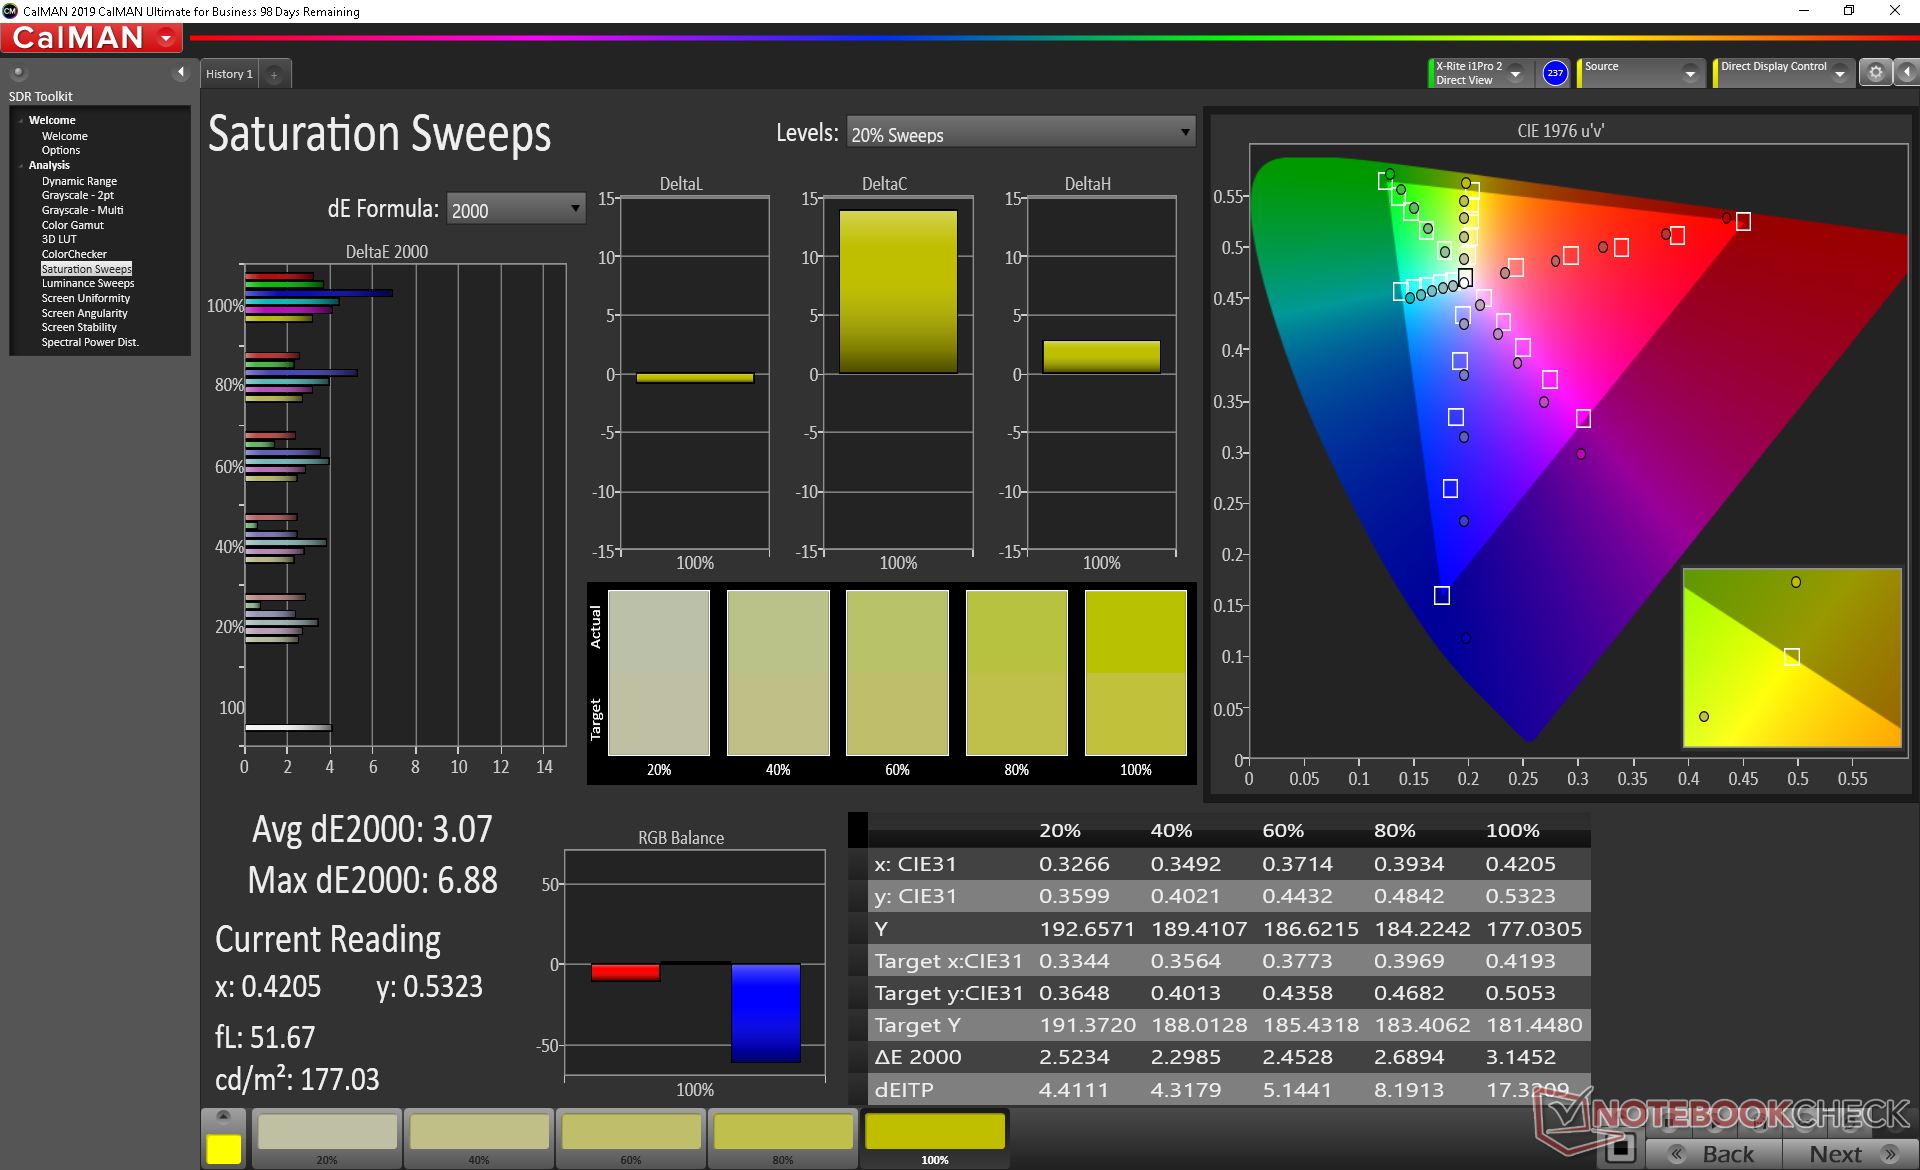
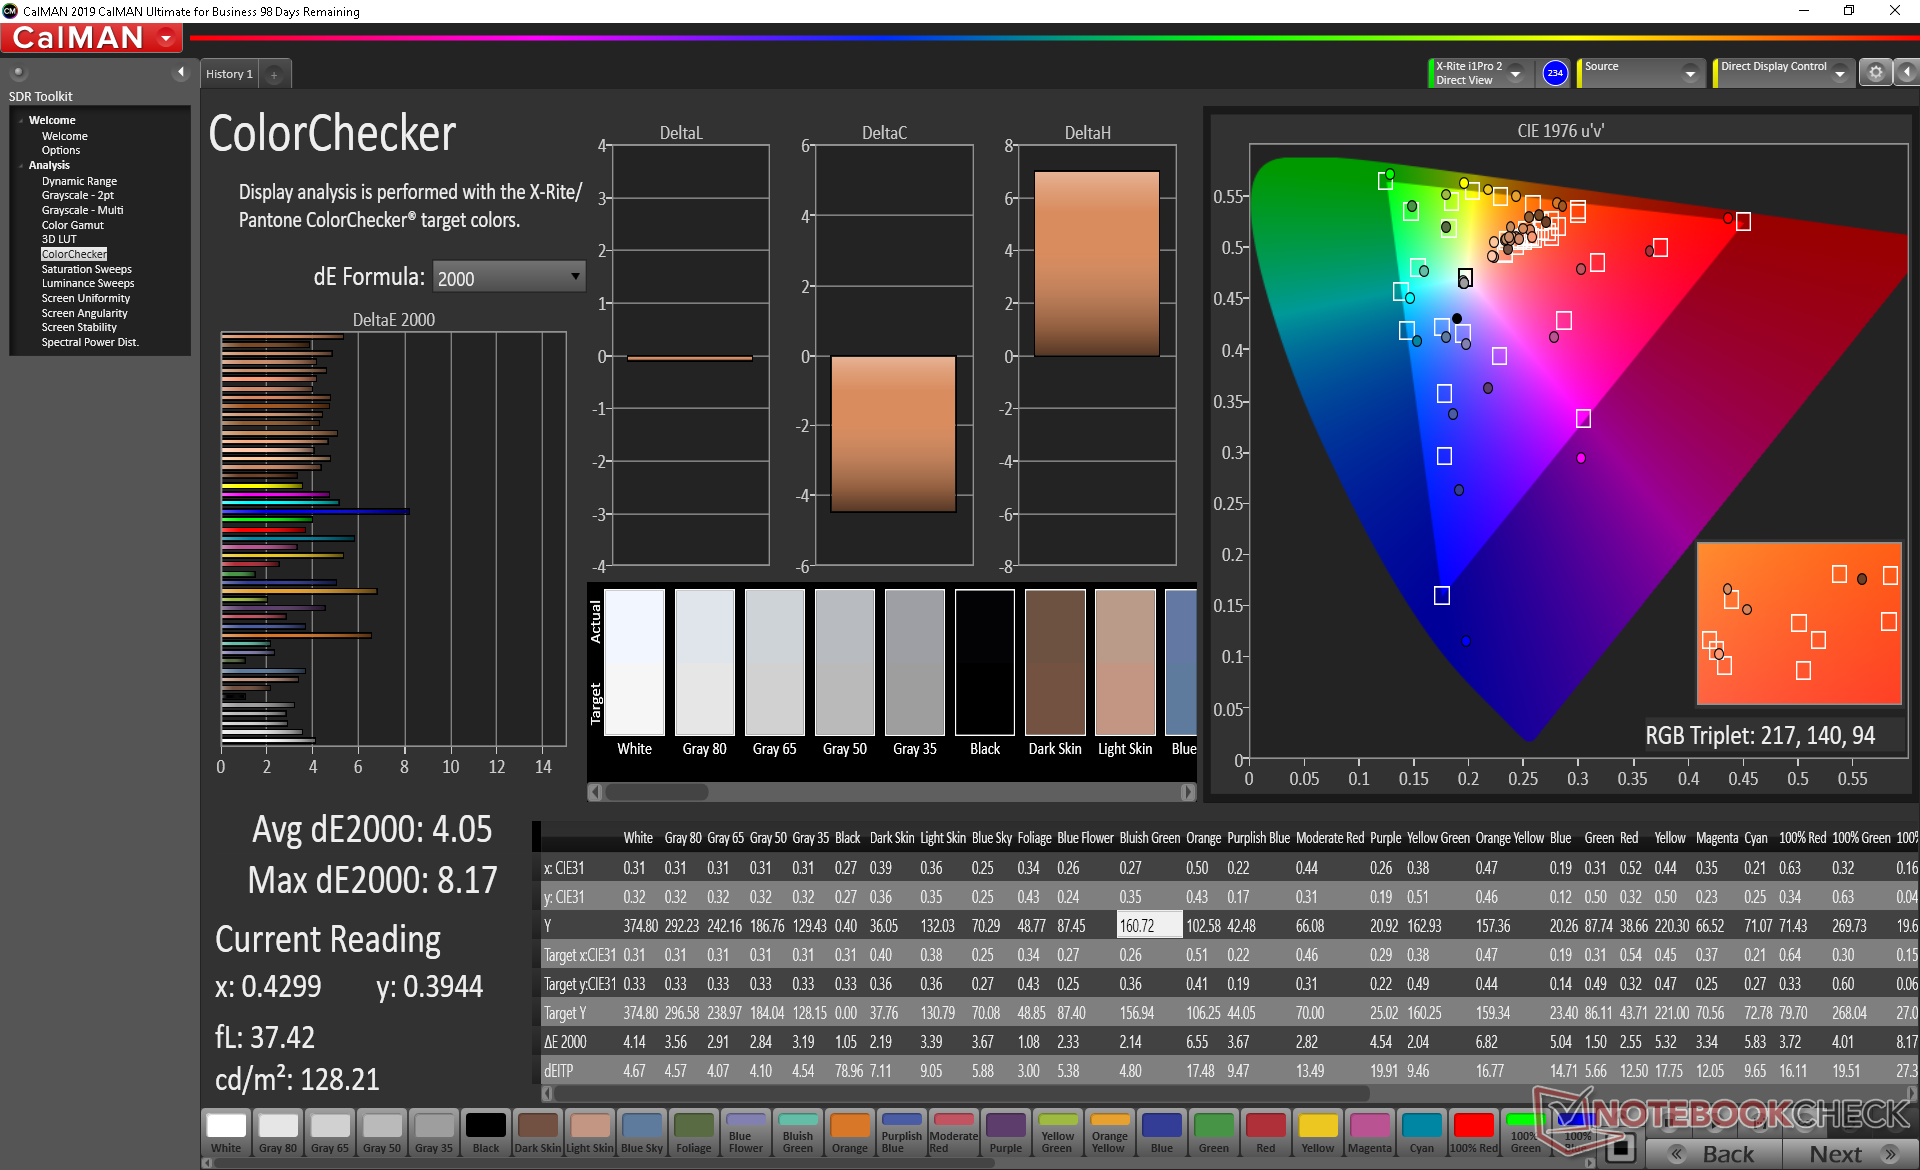
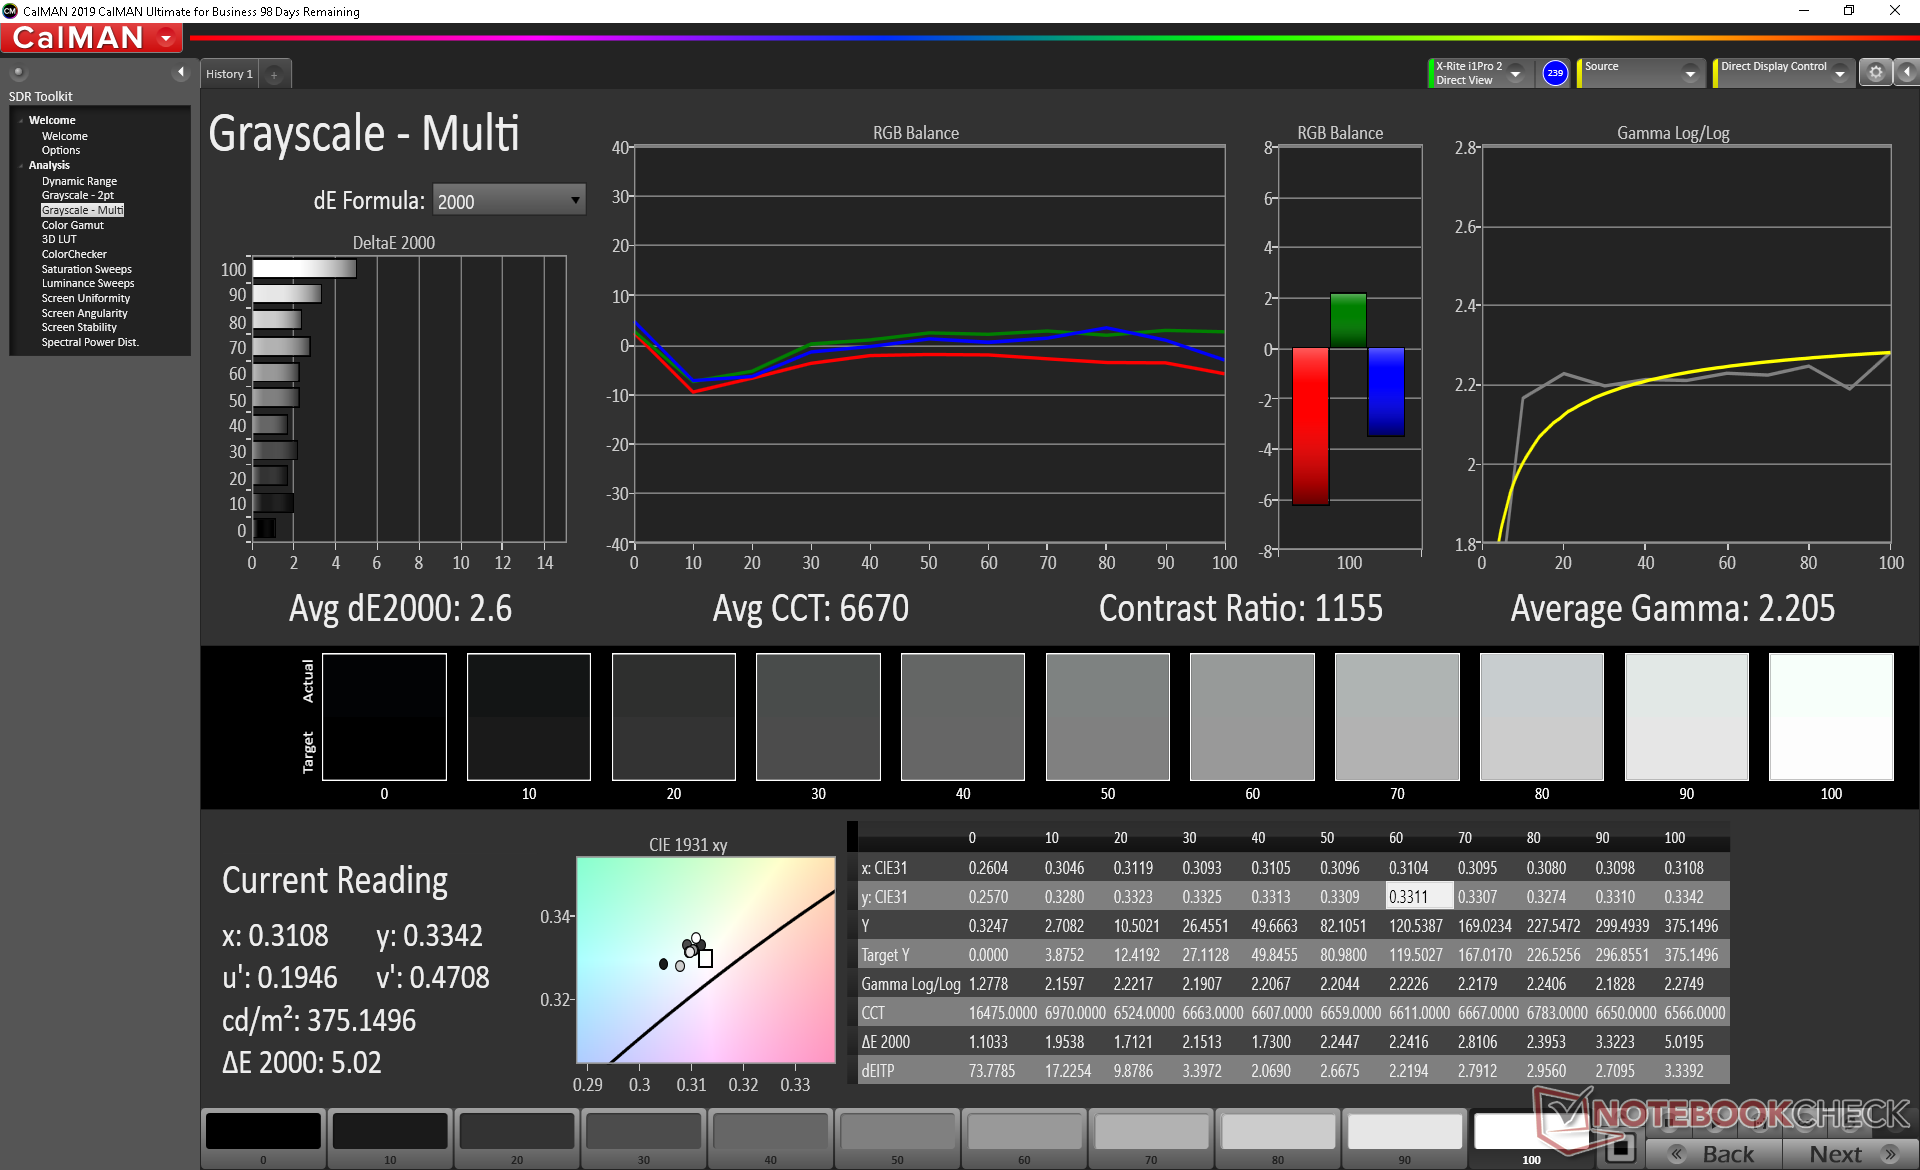
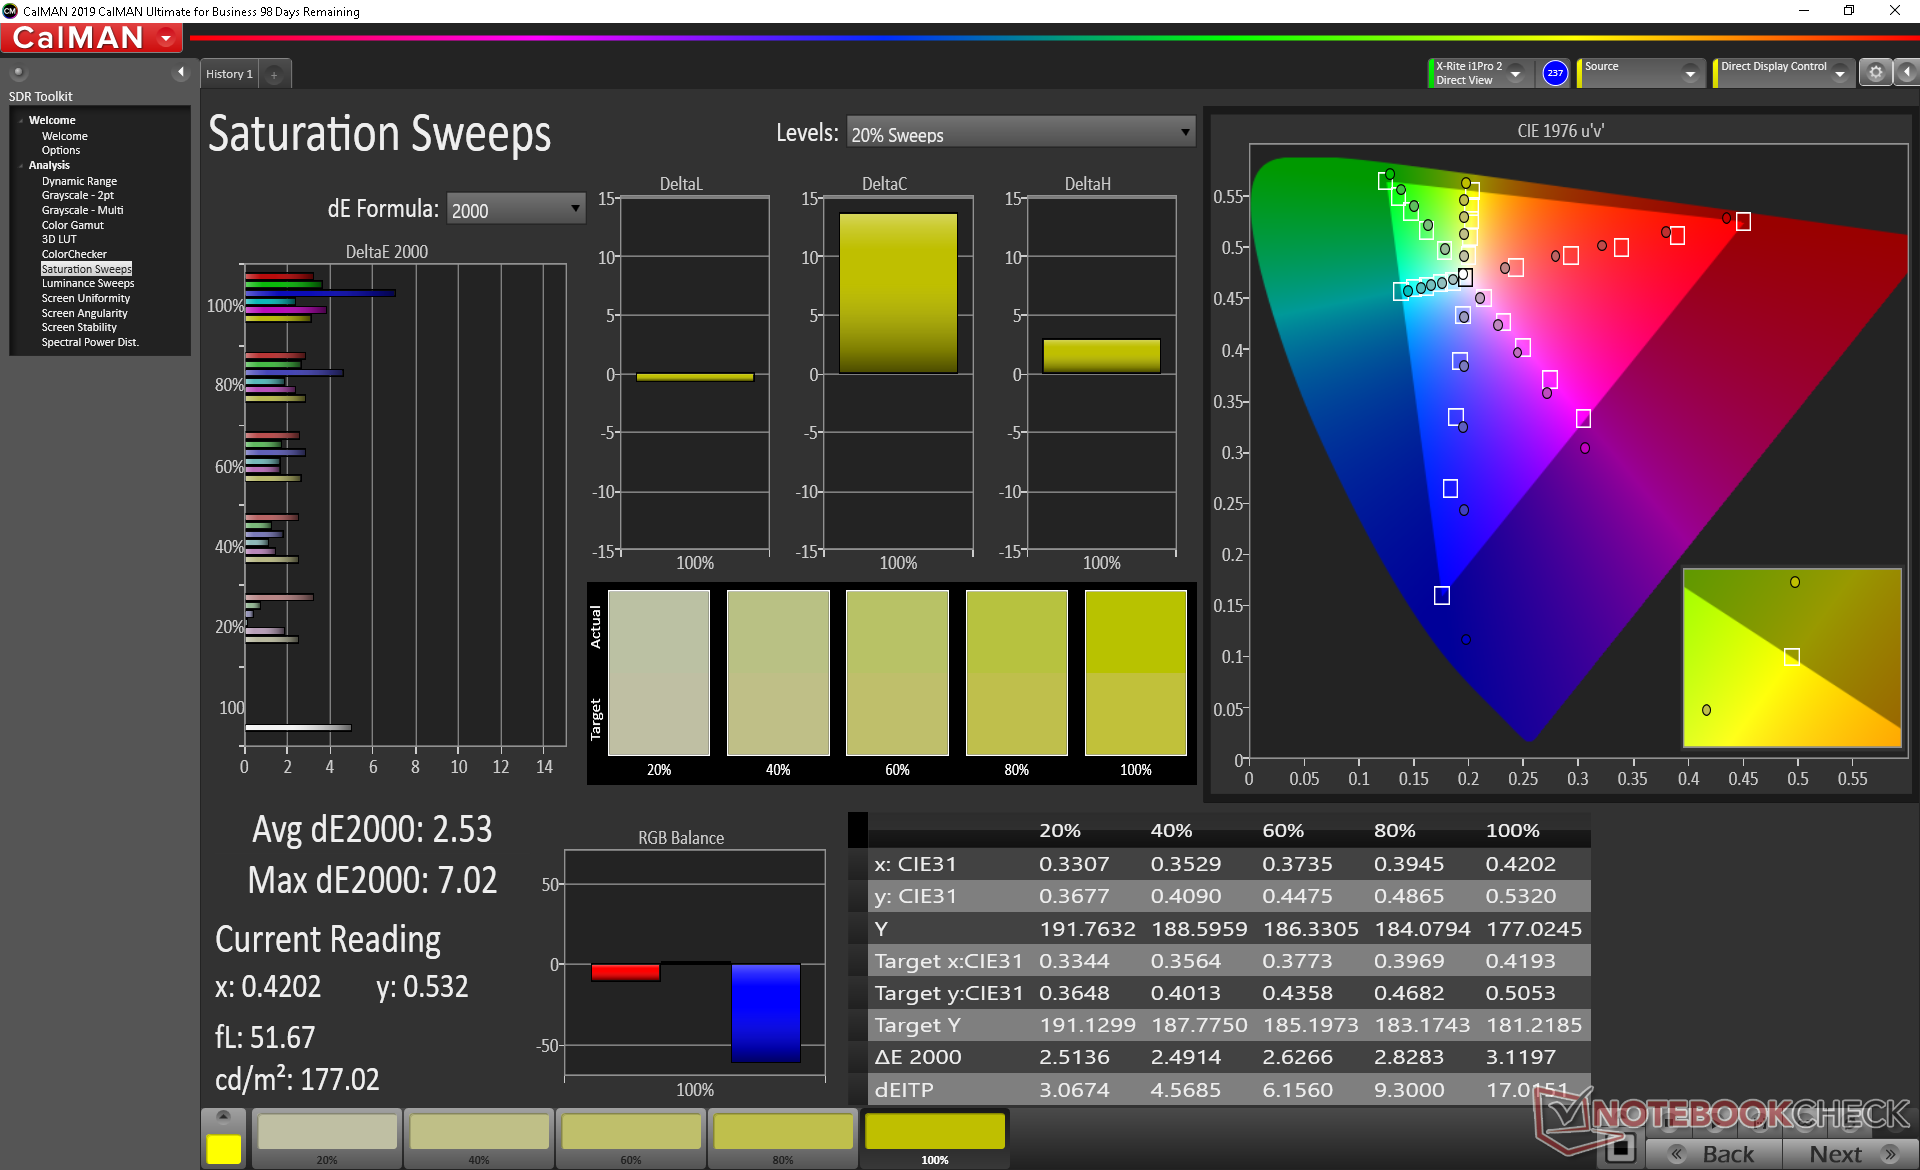
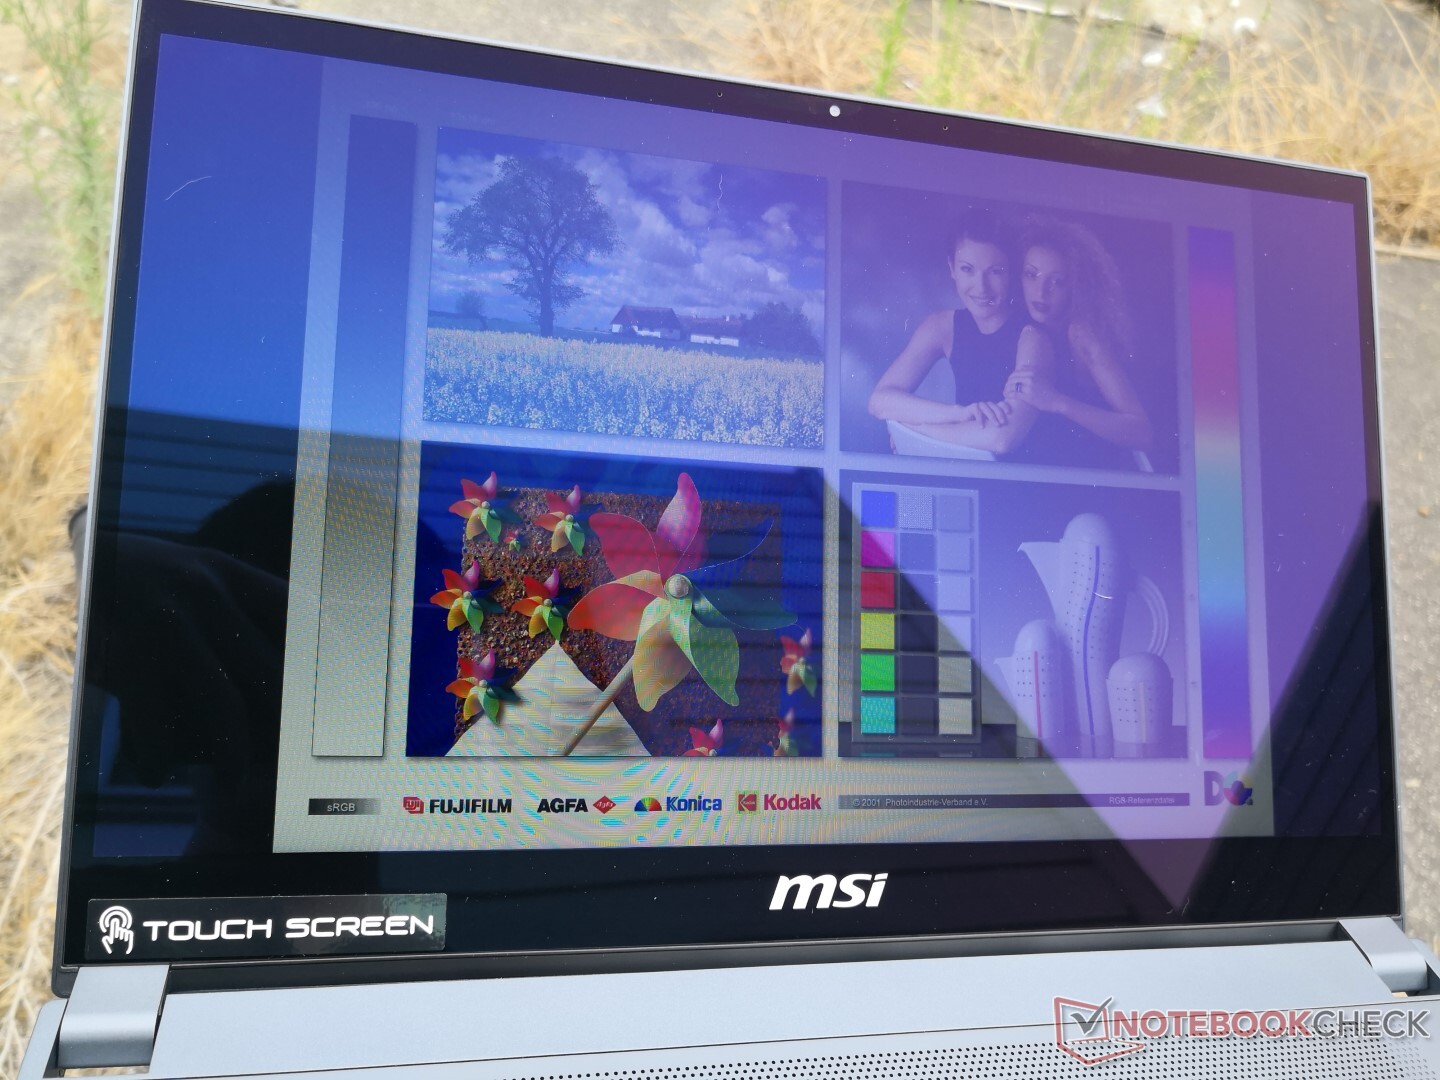
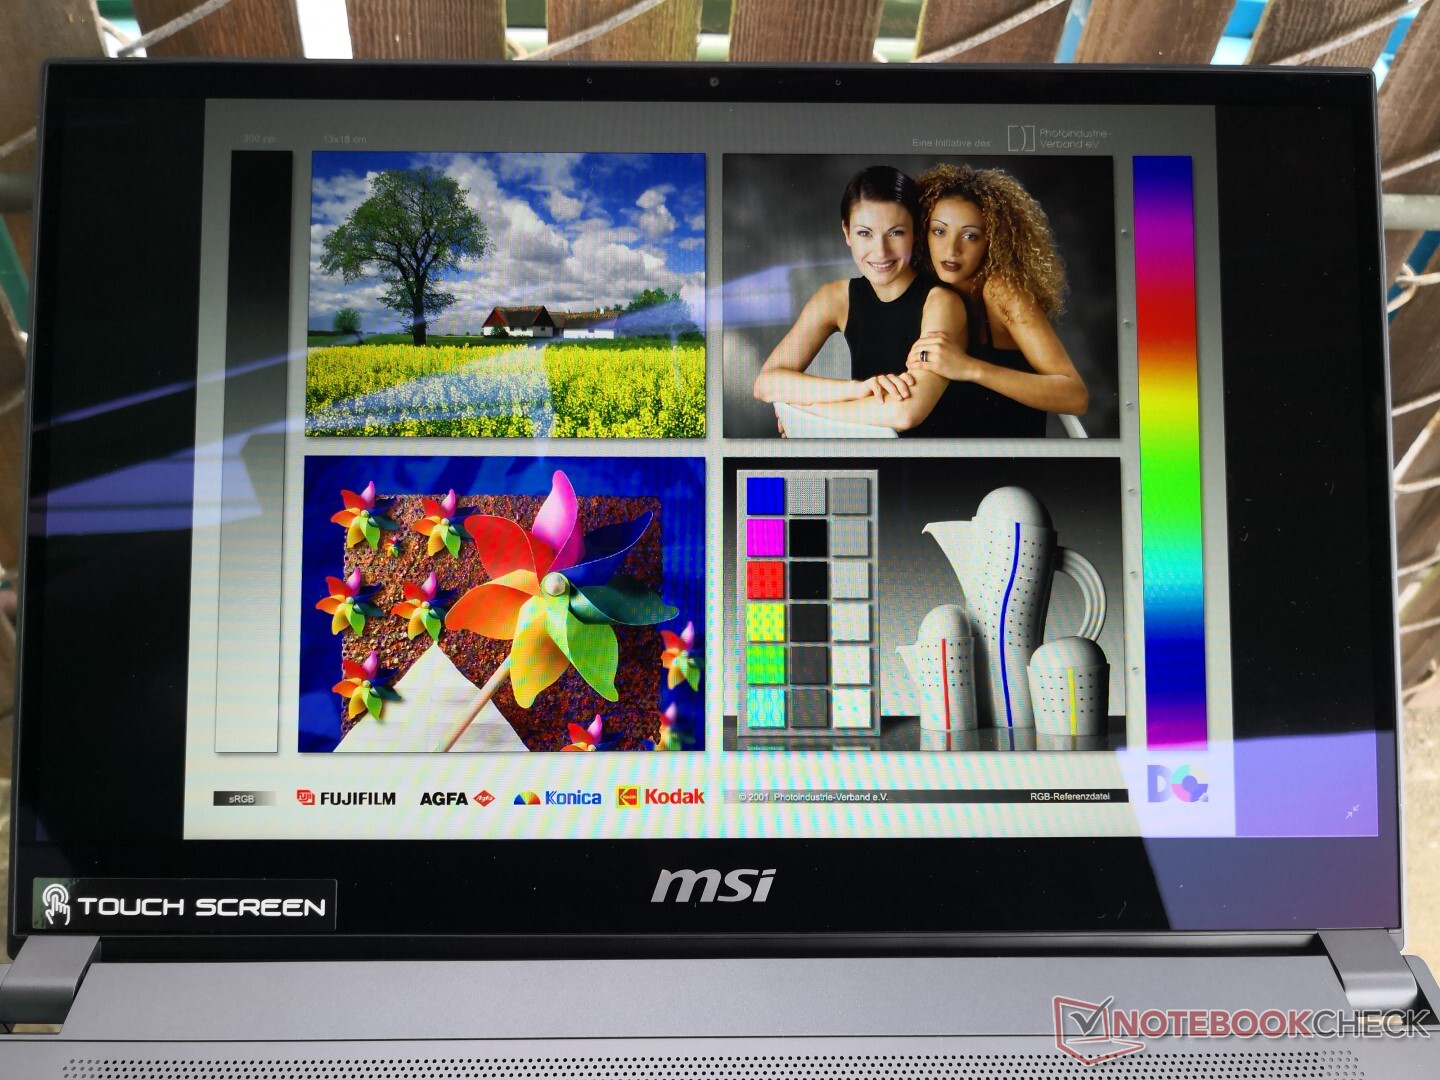
Display
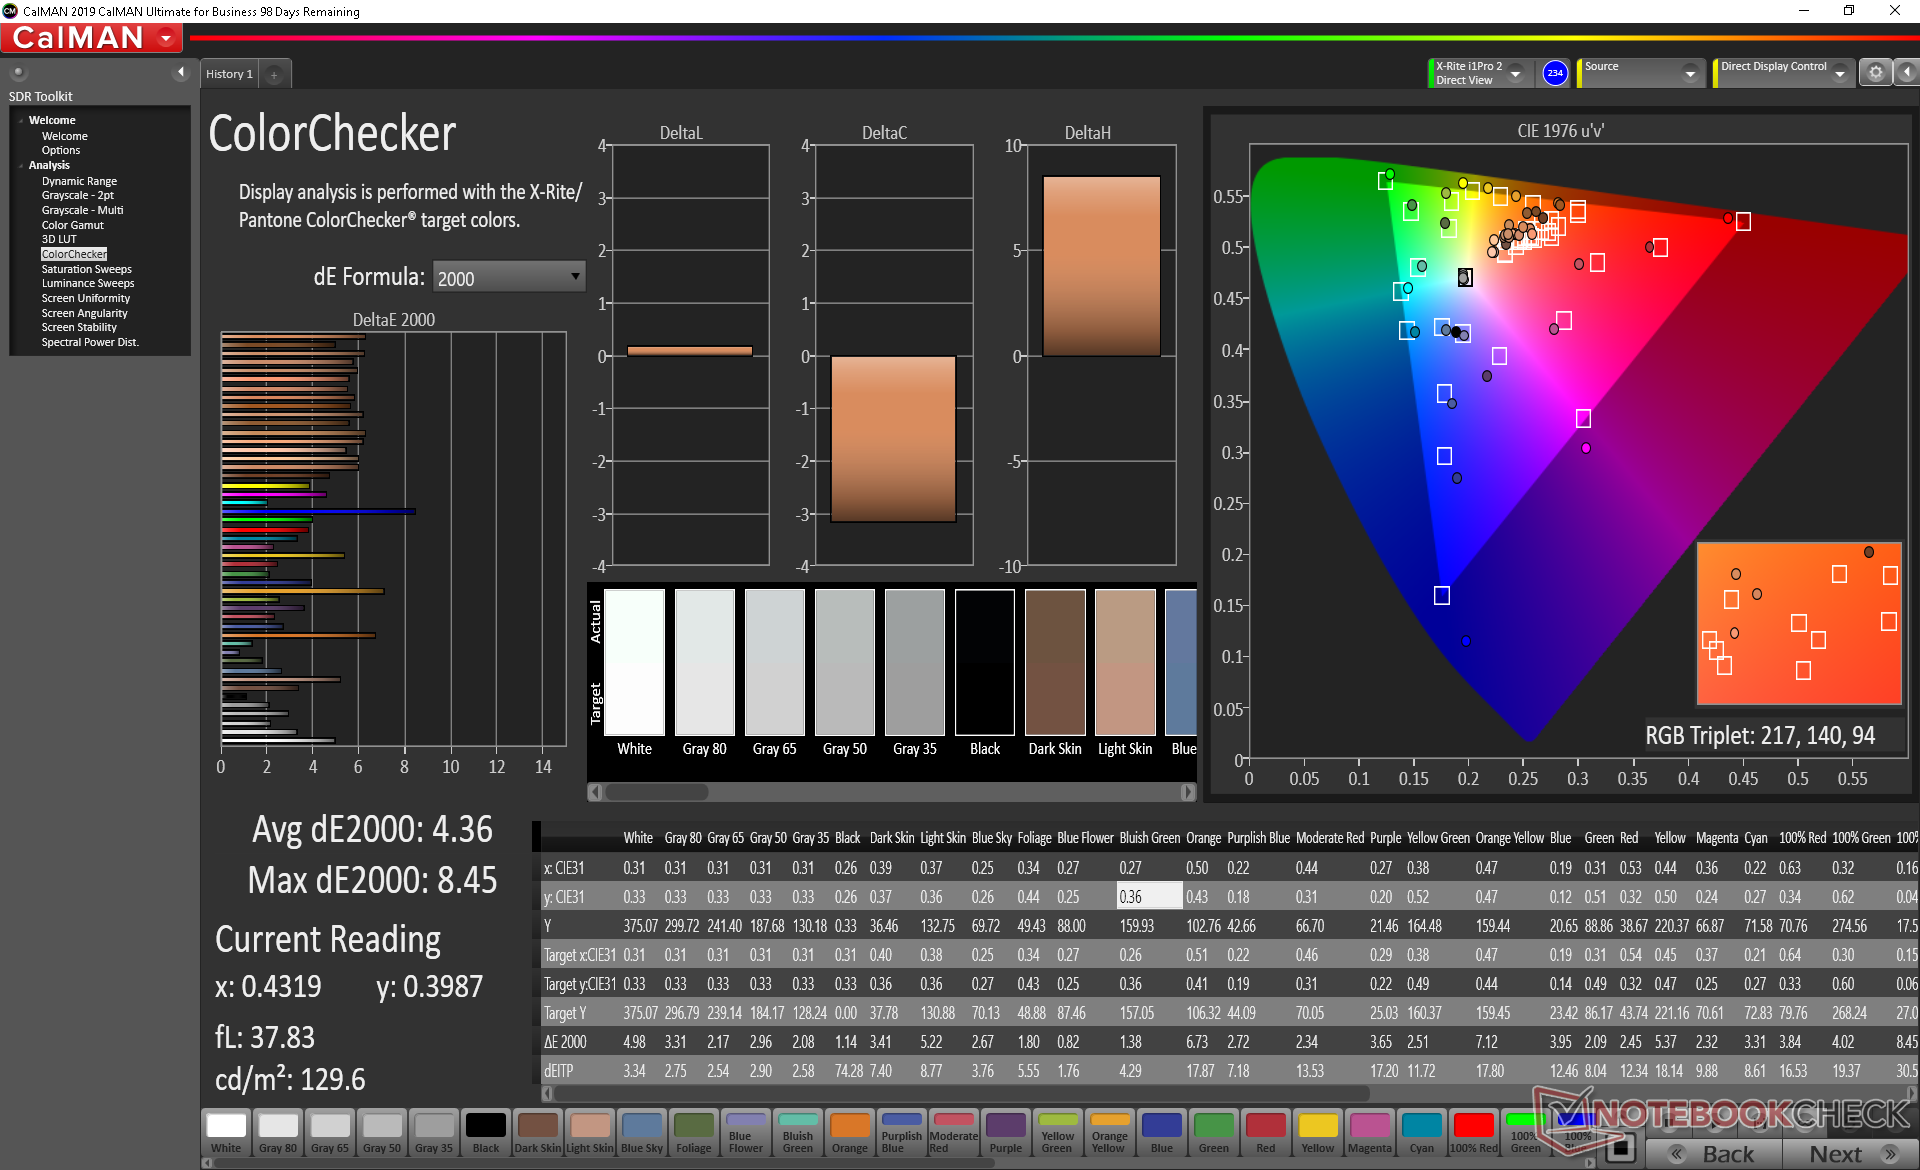
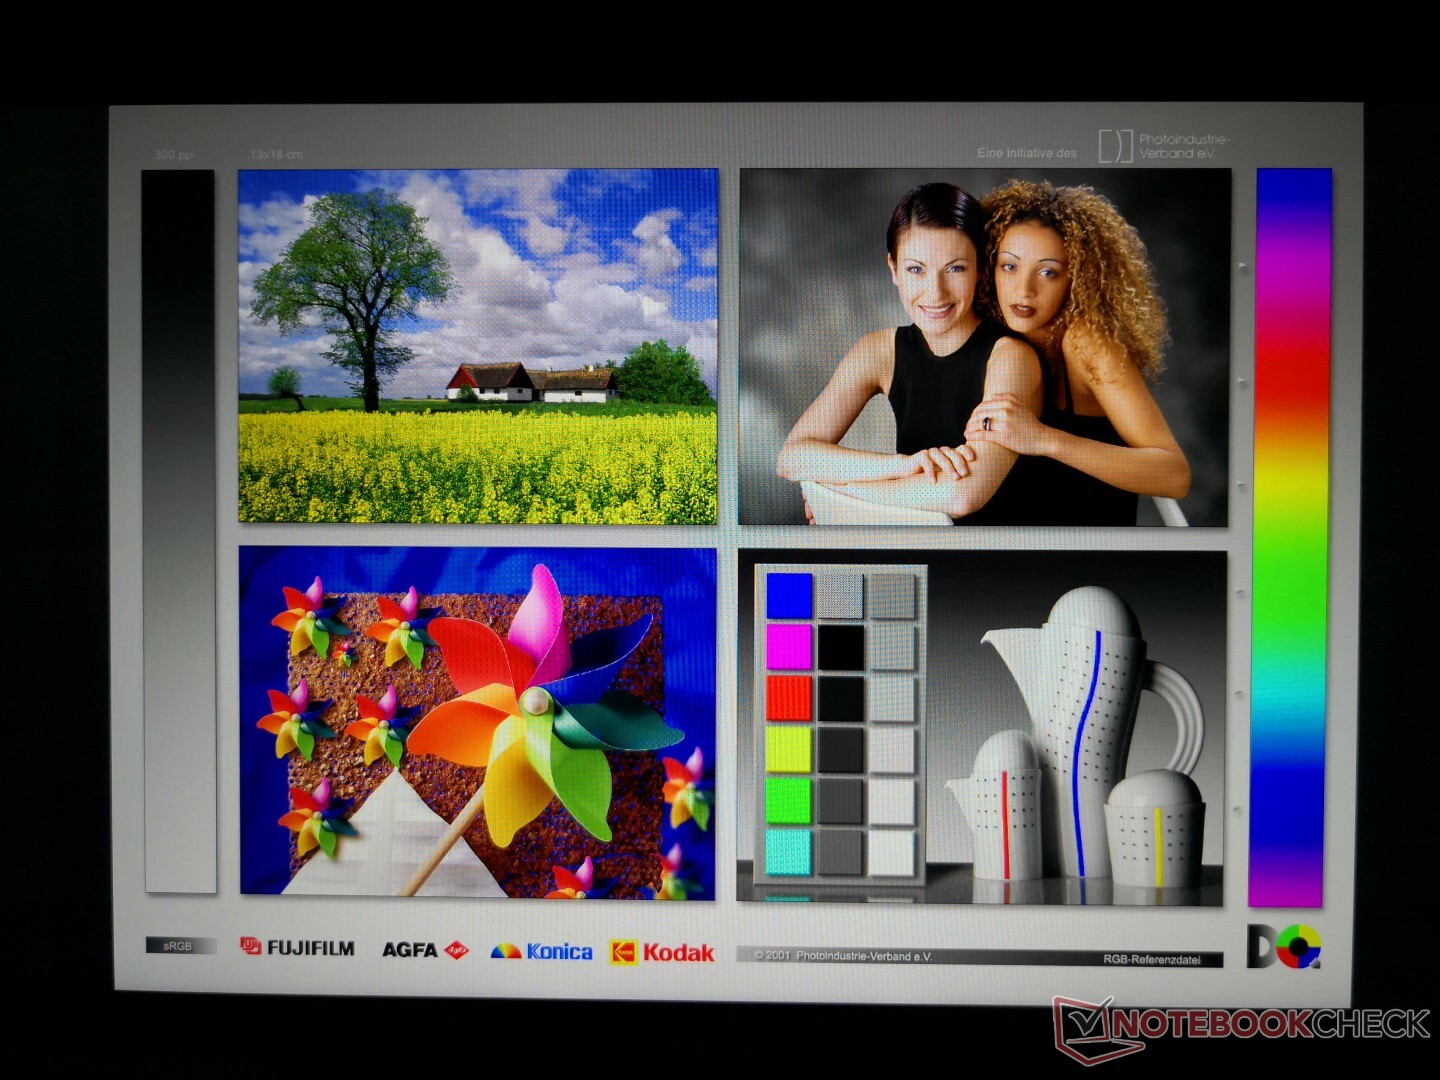
El panel de AU Optronics B156HAB03.0 IPS aquí es el primero en aparecer en nuestra base de datos. El contraste y el brillo son ambos buenos para la categoría en alrededor de 900:1 y 363 nits, respectivamente, pero algunas otras estaciones de trabajo ultrafinas como la Precision 5550 son más brillantes, más coloridas y tienen niveles de negro más profundos para una calidad de imagen superior. Los tiempos de respuesta del negro-blanco son promedio, lo cual es de esperarse ya que esta no es una máquina de juegos.
| |||||||||||||||||||||||||
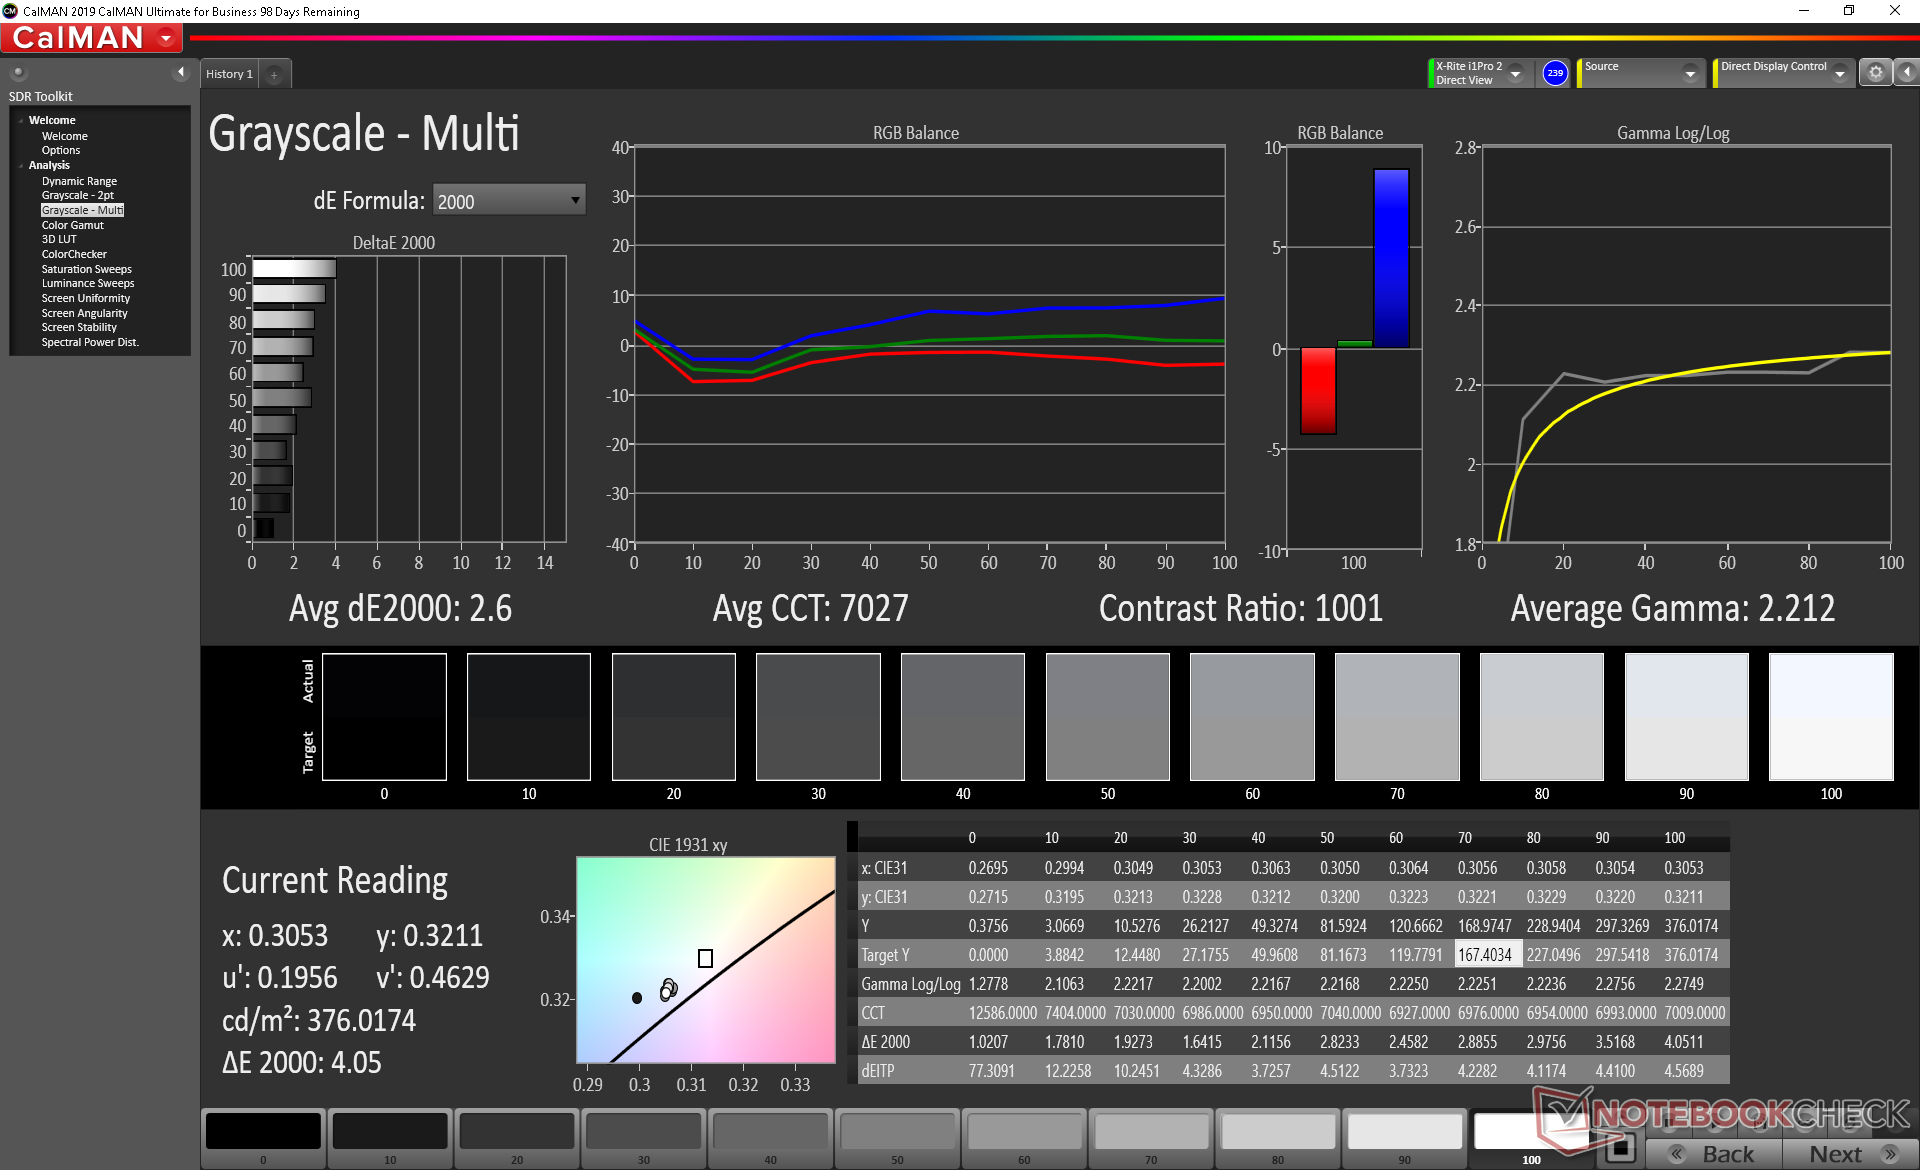
iluminación: 91 %
Brillo con batería: 374.5 cd/m²
Contraste: 892:1 (Negro: 0.42 cd/m²)
ΔE ColorChecker Calman: 4.05 | ∀{0.5-29.43 Ø4.72}
calibrated: 4.36
ΔE Greyscale Calman: 2.6 | ∀{0.09-98 Ø4.97}
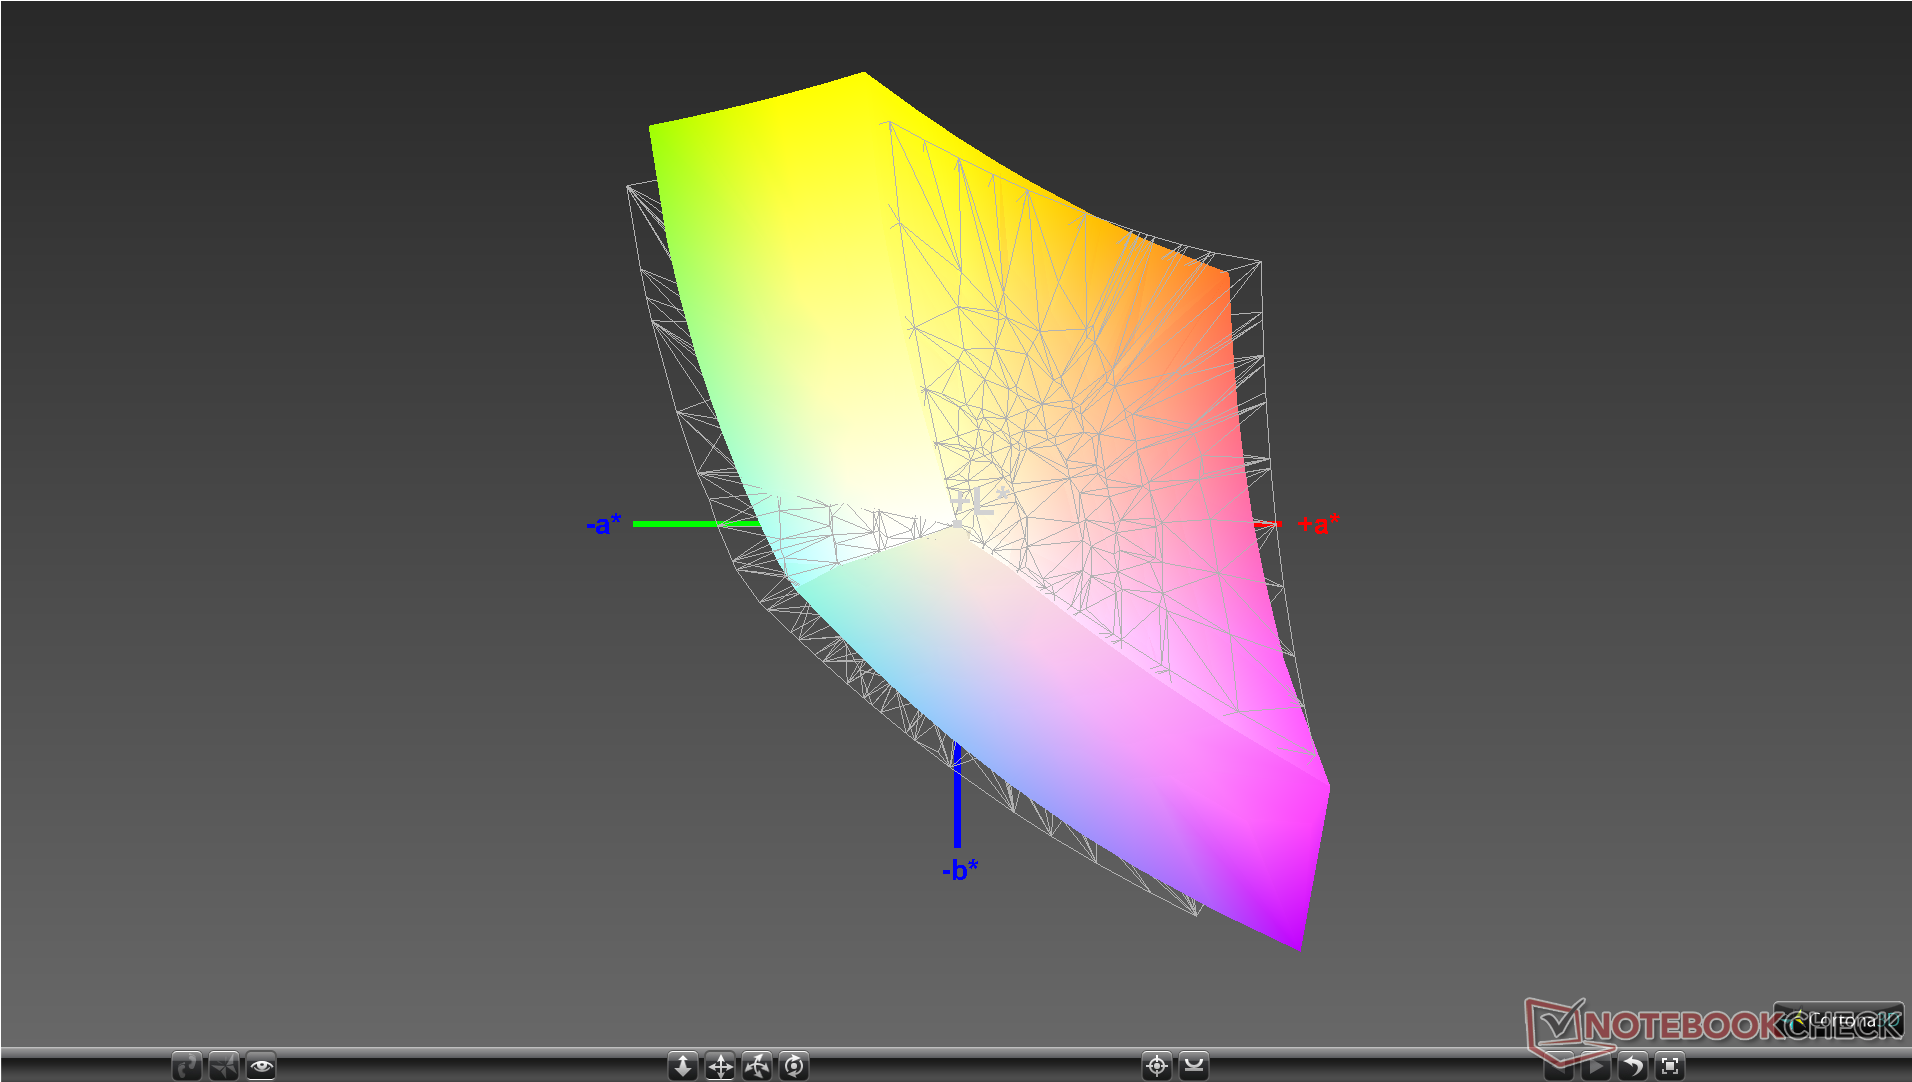
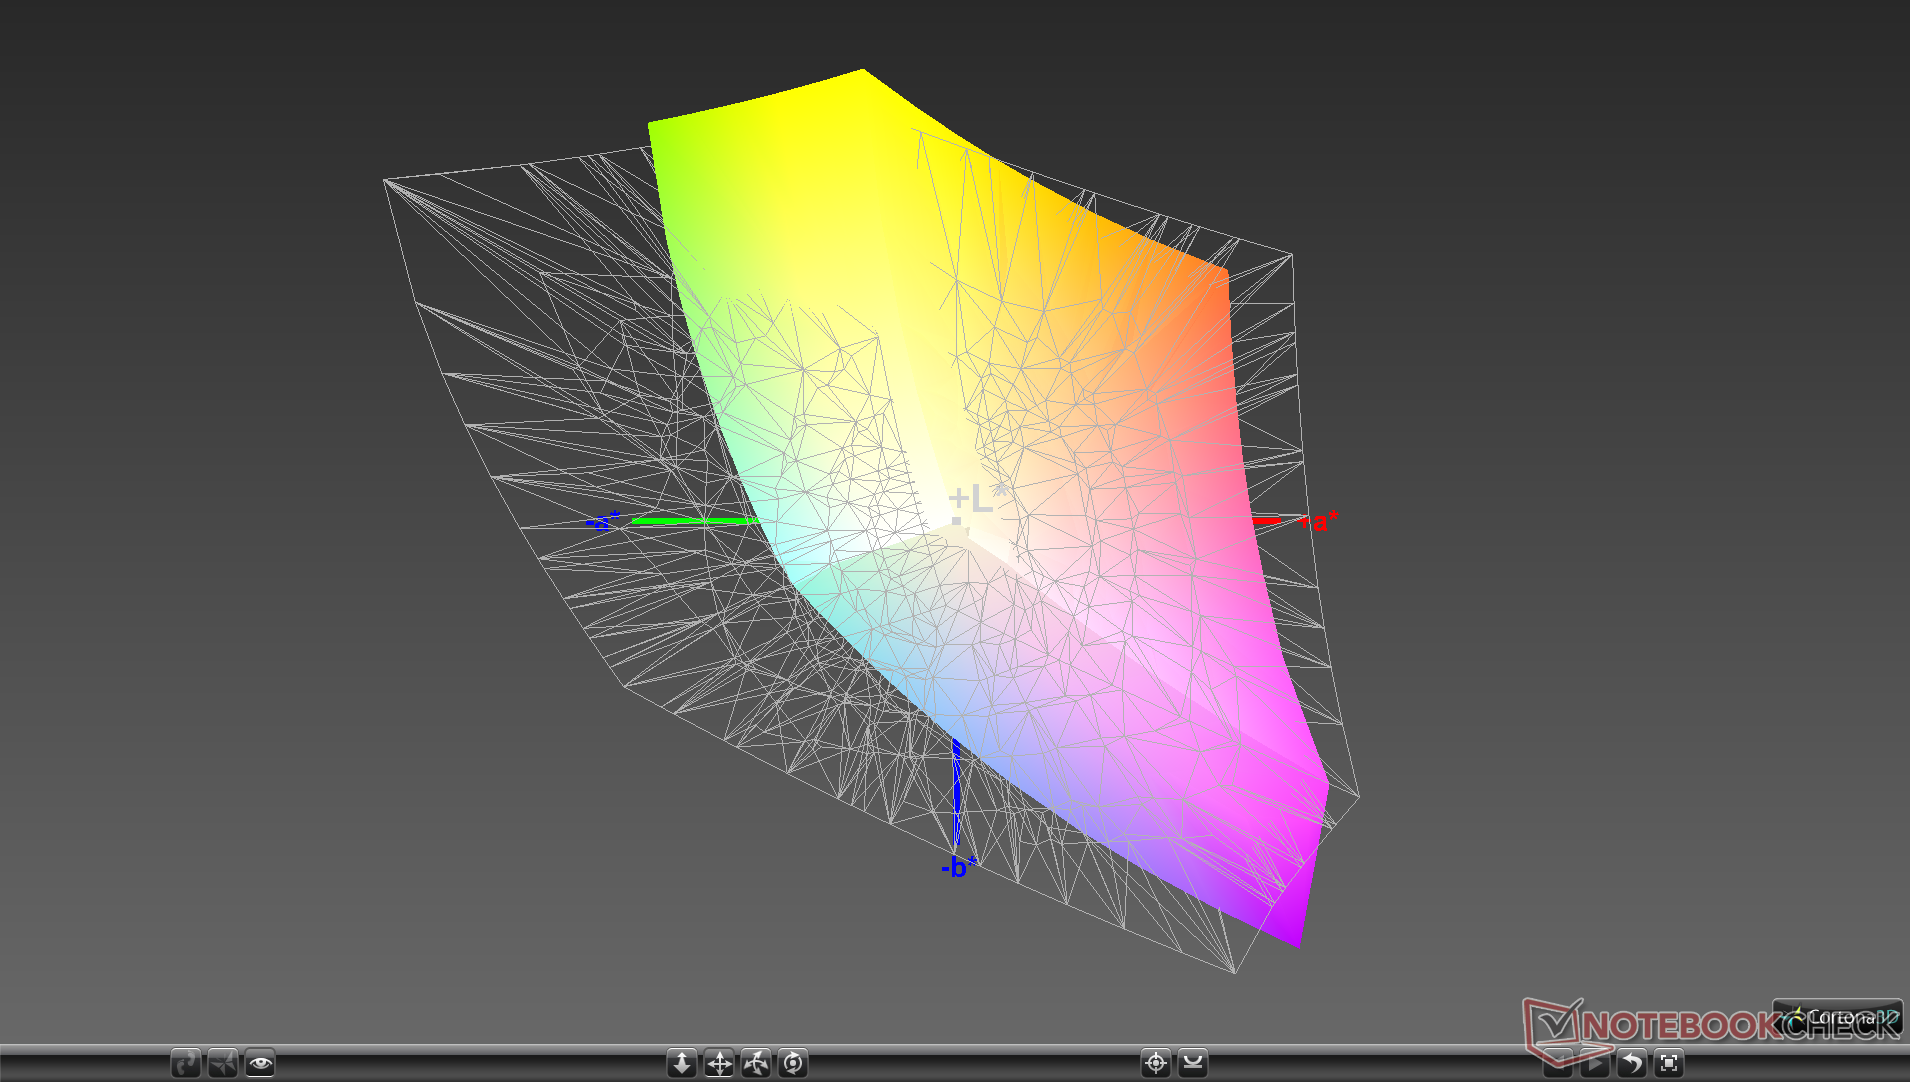
86.3% sRGB (Argyll 1.6.3 3D)
56.4% AdobeRGB 1998 (Argyll 1.6.3 3D)
63.6% AdobeRGB 1998 (Argyll 3D)
86.9% sRGB (Argyll 3D)
62.8% Display P3 (Argyll 3D)
Gamma: 2.21
CCT: 7027 K
| MSI WS66 10TMT-207US AU Optronics B156HAB03.0, IPS, 15.6", 1920x1080 | Dell Precision 7550 AU Optronics B156ZAN, IPS, 15.6", 3840x2160 | Dell Precision 5550 P91F Sharp LQ156R1, IPS, 15.6", 3840x2400 | Razer Blade 15 Studio Edition 2020 Samsung SDCA029, OLED, 15.6", 3840x2160 | MSI WS63VR 7RL-023US SAMSUNG LƒFL156FL02-101 , IPS, 15.6", 3840x2160 | Acer ConceptD 3 Pro CN315-71P-73W1 Chi Mei N156HCE-EN2, IPS, 15.6", 1920x1080 | |
|---|---|---|---|---|---|---|
| Display | 33% | 38% | 42% | -22% | 36% | |
| Display P3 Coverage (%) | 62.8 | 82.1 31% | 89.9 43% | 99.9 59% | 47.43 -24% | 97.9 56% |
| sRGB Coverage (%) | 86.9 | 99.6 15% | 100 15% | 100 15% | 71.4 -18% | 99.9 15% |
| AdobeRGB 1998 Coverage (%) | 63.6 | 96.8 52% | 99.9 57% | 97.3 53% | 49 -23% | 87.2 37% |
| Response Times | -16% | -11% | 89% | 10% | 25% | |
| Response Time Grey 50% / Grey 80% * (ms) | 44.8 ? | 51.2 ? -14% | 46 ? -3% | 4 ? 91% | 36.8 ? 18% | 33 ? 26% |
| Response Time Black / White * (ms) | 28.8 ? | 34 ? -18% | 34 ? -18% | 4 ? 86% | 28.4 ? 1% | 22 ? 24% |
| PWM Frequency (Hz) | 1351 ? | |||||
| Screen | -2% | 1% | 212% | -27% | 16% | |
| Brightness middle (cd/m²) | 374.5 | 473.5 26% | 469.8 25% | 380 1% | 259.4 -31% | 343 -8% |
| Brightness (cd/m²) | 363 | 461 27% | 464 28% | 388 7% | 247 -32% | 309 -15% |
| Brightness Distribution (%) | 91 | 90 -1% | 85 -7% | 93 2% | 85 -7% | 85 -7% |
| Black Level * (cd/m²) | 0.42 | 0.55 -31% | 0.42 -0% | 0.018 96% | 0.43 -2% | 0.22 48% |
| Contrast (:1) | 892 | 861 -3% | 1119 25% | 21111 2267% | 603 -32% | 1559 75% |
| Colorchecker dE 2000 * | 4.05 | 4.8 -19% | 5.16 -27% | 5.47 -35% | 5.5 -36% | 3.73 8% |
| Colorchecker dE 2000 max. * | 8.17 | 8.73 -7% | 9.33 -14% | 8.19 -0% | 12.7 -55% | 6.51 20% |
| Colorchecker dE 2000 calibrated * | 4.36 | 3.08 29% | 3.75 14% | 3.04 30% | 1.43 67% | |
| Greyscale dE 2000 * | 2.6 | 5.6 -115% | 5.5 -112% | 5.3 -104% | 3.6 -38% | 4.24 -63% |
| Gamma | 2.21 100% | 2.34 94% | 2 110% | 2.15 102% | 2.24 98% | 2.2 100% |
| CCT | 7027 93% | 7549 86% | 6198 105% | 6128 106% | 7163 91% | 6329 103% |
| Color Space (Percent of AdobeRGB 1998) (%) | 56.4 | 86.4 53% | 89.2 58% | 86 52% | 45 -20% | 78 38% |
| Color Space (Percent of sRGB) (%) | 86.3 | 99.7 16% | 100 16% | 100 16% | 71 -18% | 100 16% |
| Media total (Programa/Opciones) | 5% /
3% | 9% /
6% | 114% /
165% | -13% /
-21% | 26% /
21% |
* ... más pequeño es mejor
El espacio de color cubre aproximadamente el 86 por ciento de sRGB, lo que supone una mejora con respecto al WS63 del año pasado, pero sigue siendo menor que la cobertura del 100 por ciento ofrecida en la mayoría de las demás estaciones de trabajo móviles. Las opciones OLED no están disponibles aquí, lo que habría concedido la cobertura del DCI-P3.
Las mediciones del colorímetro de X-Rite muestran una pantalla bien calibrada fuera de la caja, tal como lo anuncia MSI. La temperatura del color está ligeramente en el lado frío, pero esto se puede solucionar con una calibración de usuario final.
Tiempos de respuesta del display
| ↔ Tiempo de respuesta de Negro a Blanco | ||
|---|---|---|
| 28.8 ms ... subida ↗ y bajada ↘ combinada | ↗ 17.2 ms subida | 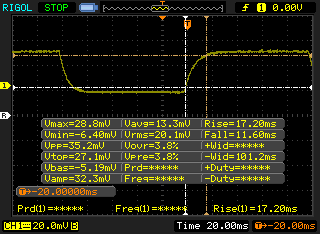 |
| ↘ 11.6 ms bajada | ||
| La pantalla mostró tiempos de respuesta relativamente lentos en nuestros tests pero podría ser demasiado lenta para los jugones. En comparación, todos los dispositivos de prueba van de ##min### (mínimo) a 240 (máximo) ms. » 76 % de todos los dispositivos son mejores. Eso quiere decir que el tiempo de respuesta es peor que la media (19.8 ms) de todos los dispositivos testados. | ||
| ↔ Tiempo de respuesta 50% Gris a 80% Gris | ||
| 44.8 ms ... subida ↗ y bajada ↘ combinada | ↗ 21.2 ms subida | 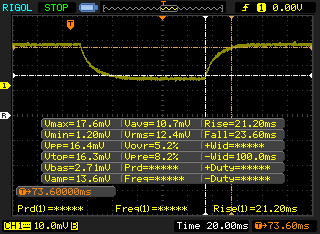 |
| ↘ 23.6 ms bajada | ||
| La pantalla mostró tiempos de respuesta lentos en nuestros tests y podría ser demasiado lenta para los jugones. En comparación, todos los dispositivos de prueba van de ##min### (mínimo) a 636 (máximo) ms. » 76 % de todos los dispositivos son mejores. Eso quiere decir que el tiempo de respuesta es peor que la media (31 ms) de todos los dispositivos testados. | ||
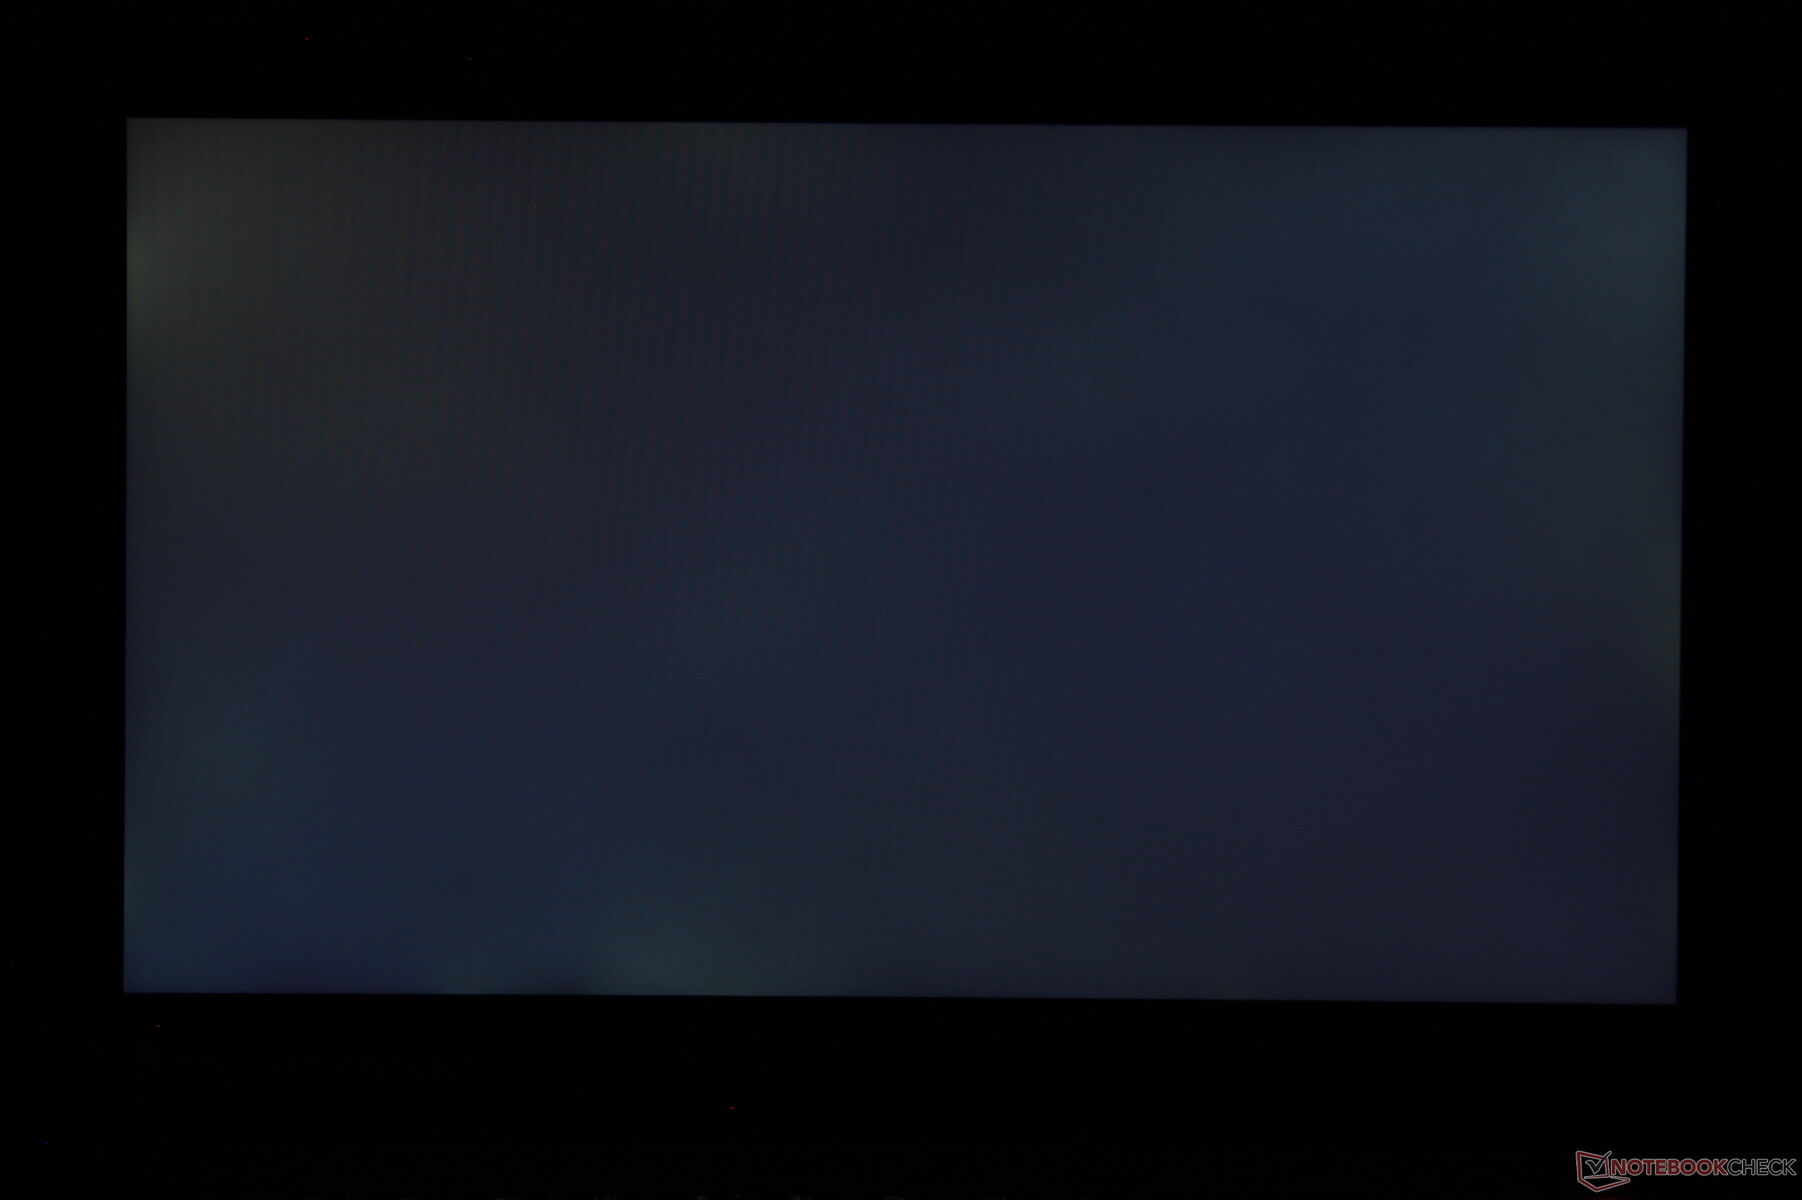
Parpadeo de Pantalla / PWM (Pulse-Width Modulation)
| Parpadeo de Pantalla / PWM no detectado | 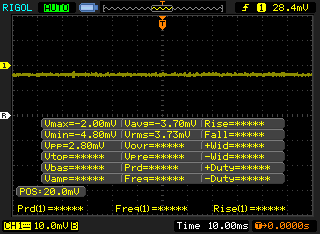 | ||
Comparación: 52 % de todos los dispositivos testados no usaron PWM para atenuar el display. Si se usó, medimos una media de 7769 (mínimo: 5 - máxmo: 343500) Hz. | |||
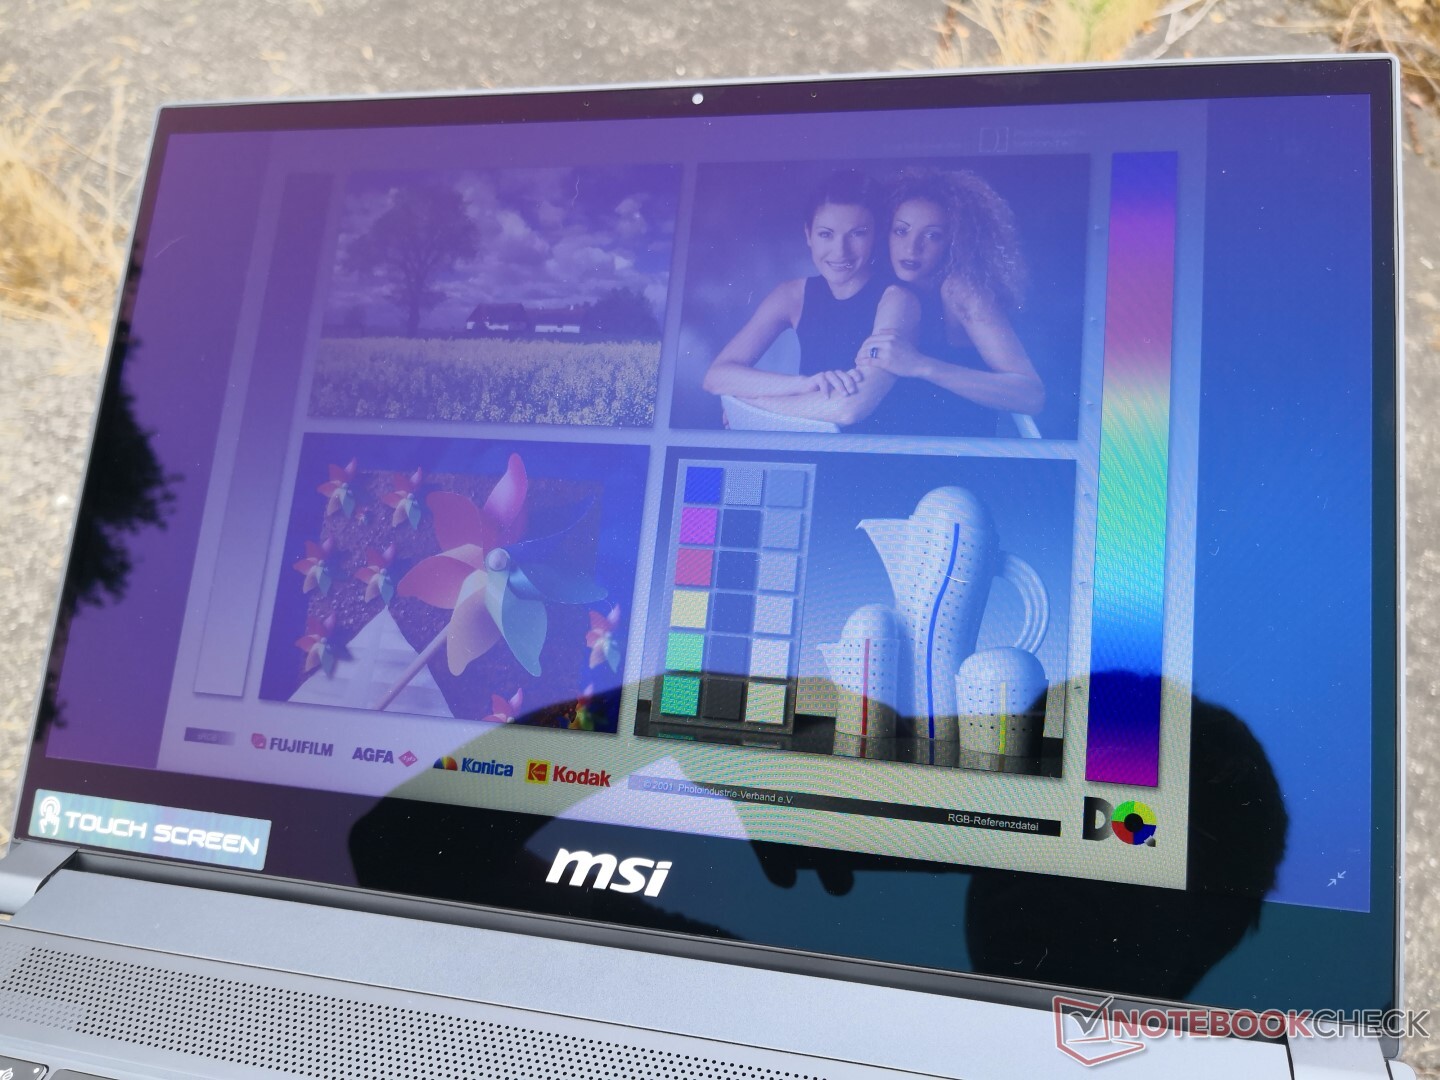
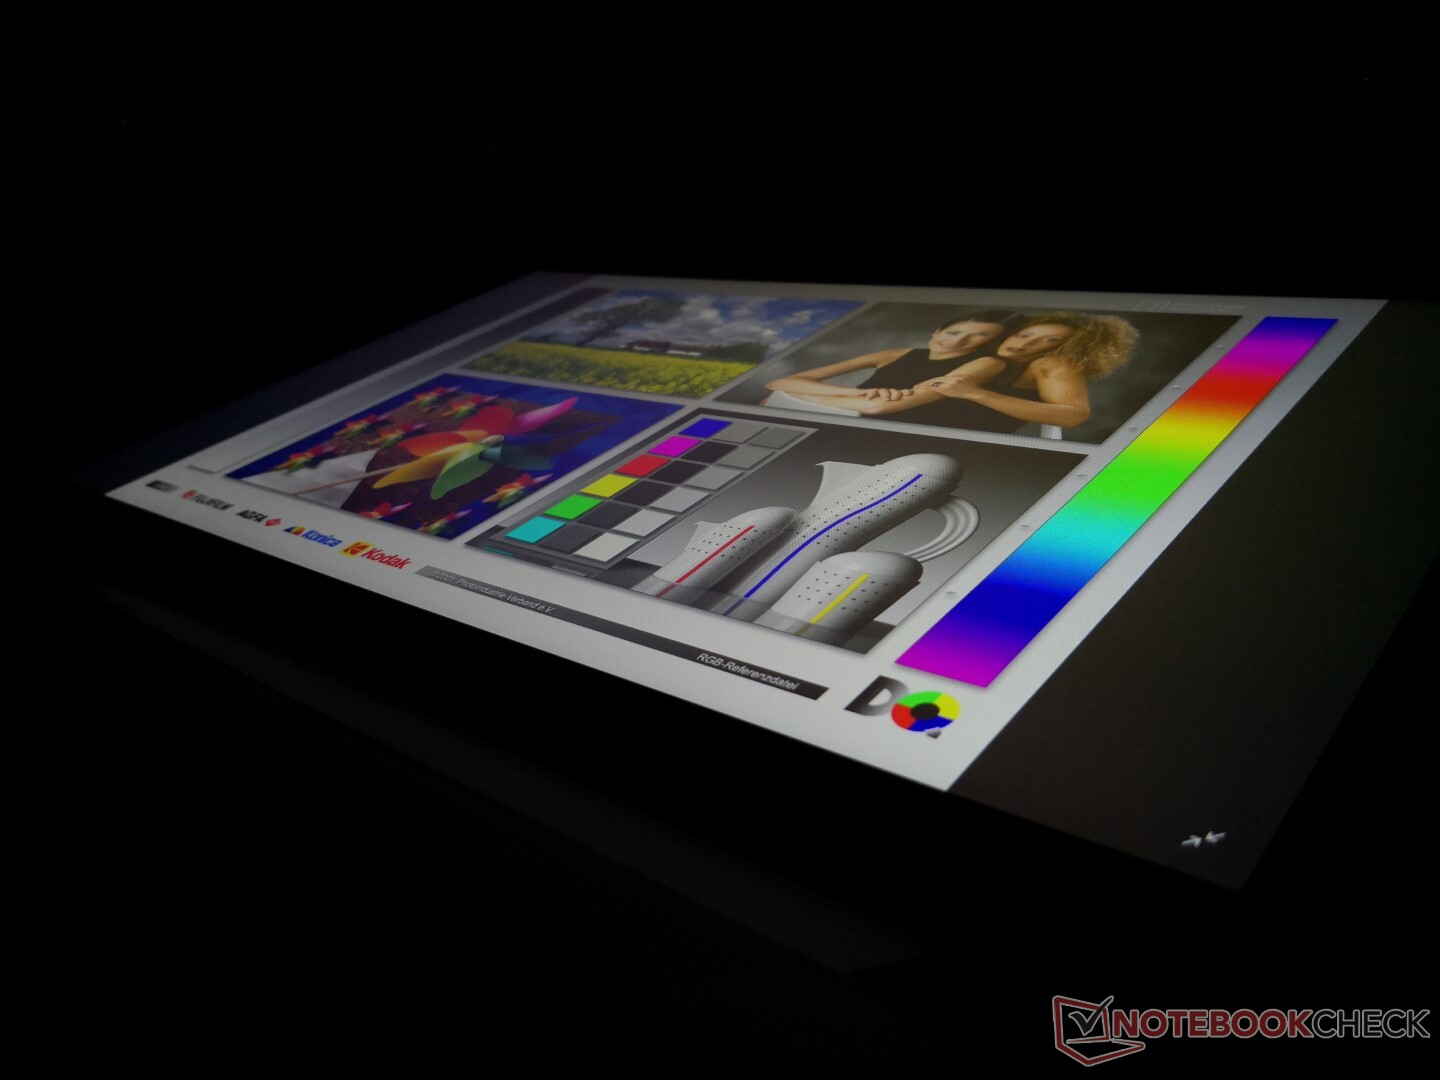
La visibilidad exterior es decente cuando está a la sombra. De lo contrario, la luz ambiental brillante abrumará el contenido de la pantalla y causará deslumbramiento. El panel brillante exhibe un ligero reflejo púrpura, a diferencia de la mayoría de los otros portátiles, que impacta en los colores si se ve desde un ángulo.
Rendimiento
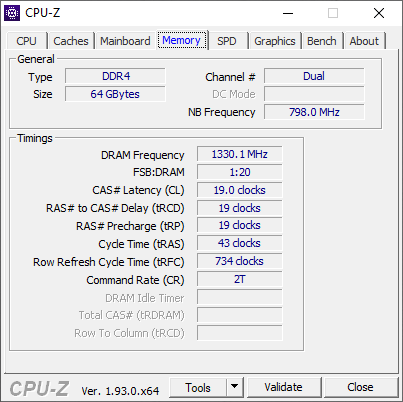
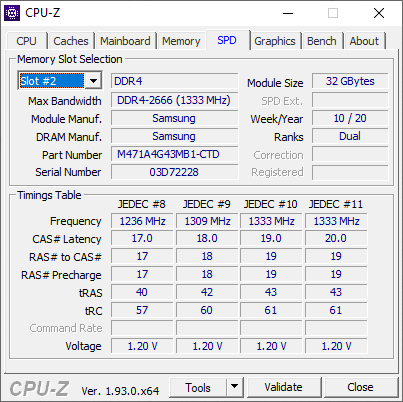
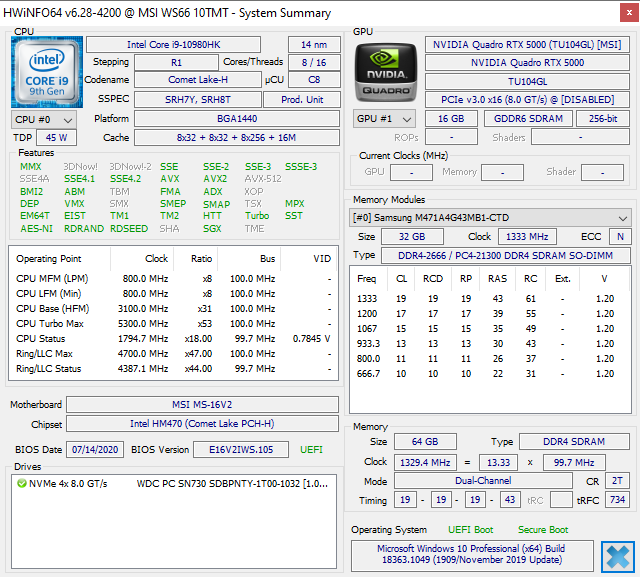
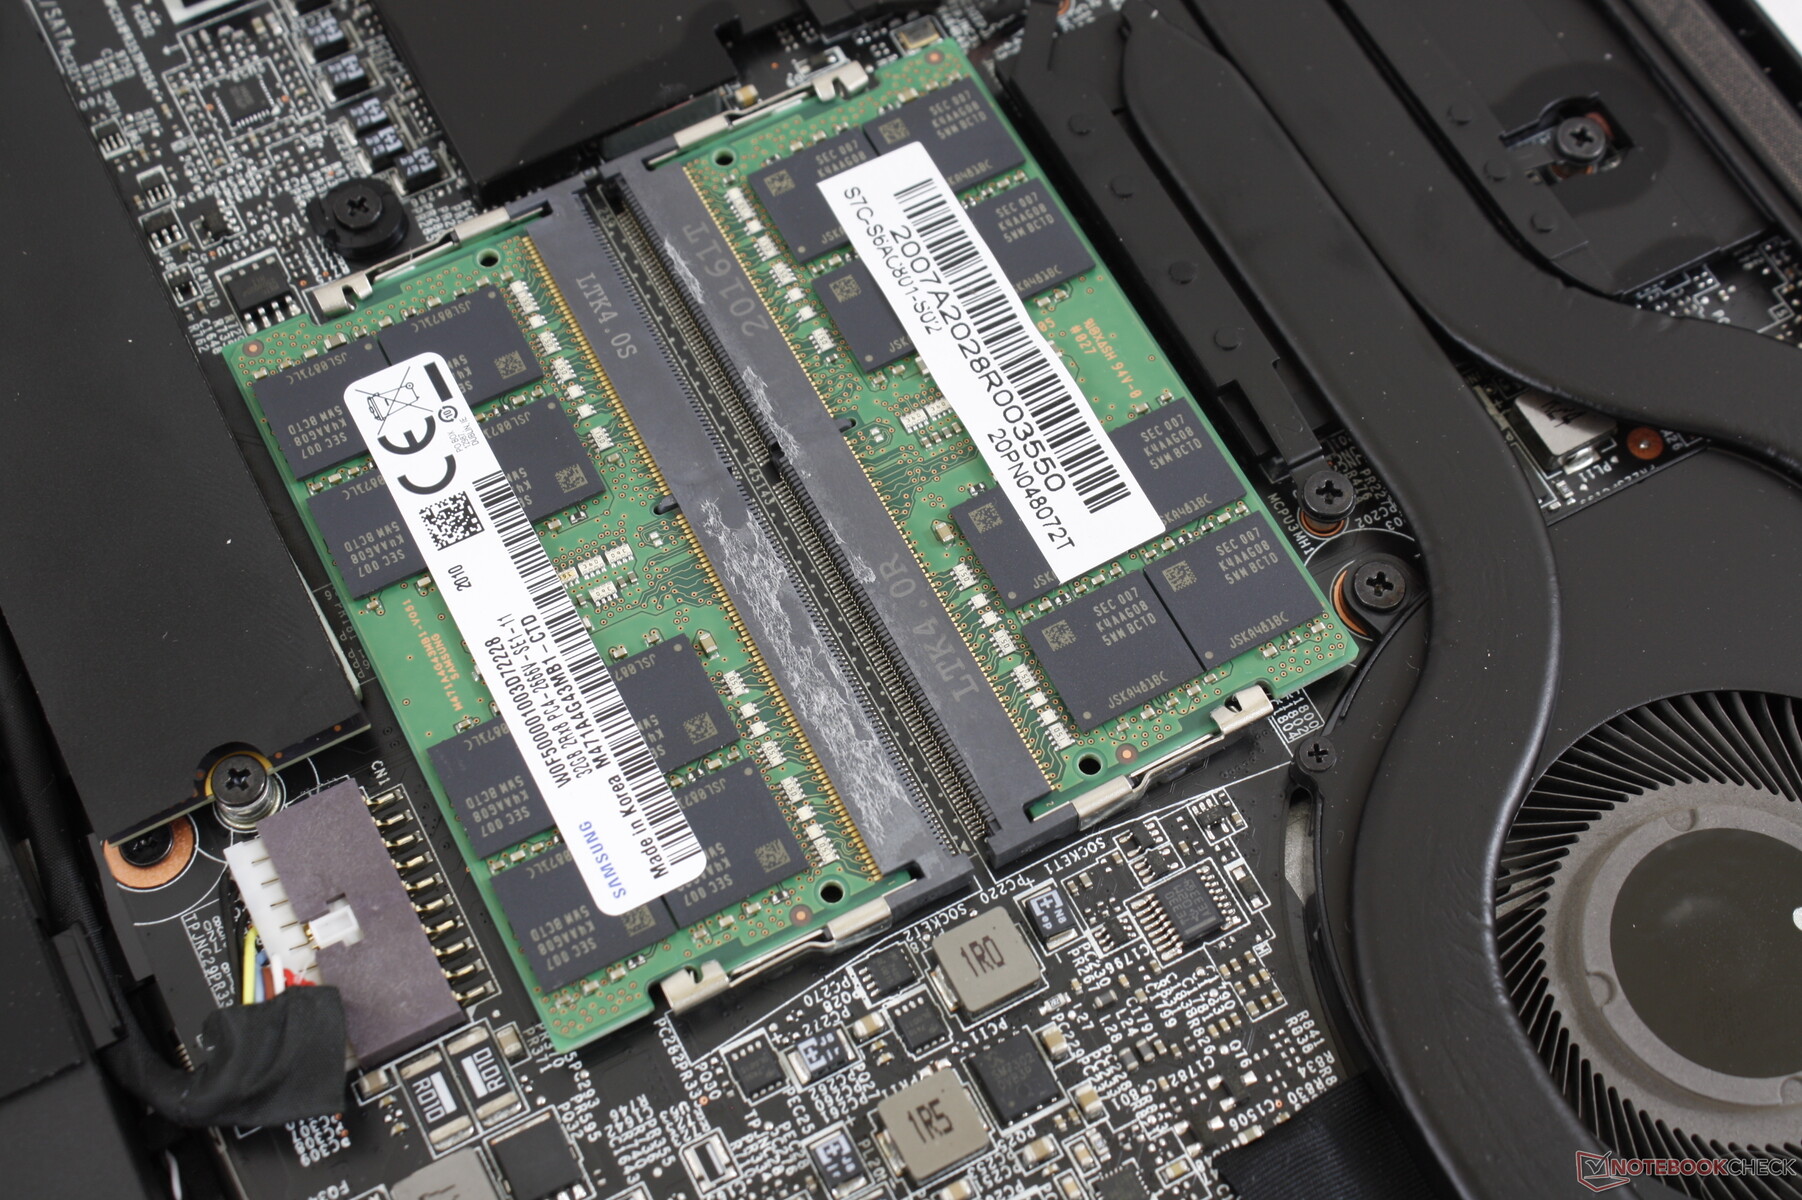
A diferencia del Razer Blade 15 Studio, que se fija en el Core i7-10875H, el WS66 ofrece opciones de Xeon y Core i9 para el soporte de RAM ECC y una mayor potencia de cálculo bruto, respectivamente. La memoria RAM es configurable hasta 64 GB en comparación con 128 GB en estaciones de trabajo de tamaño completo como la Dell Precision 7550. Optimus viene de serie para el cambio automático de gráficos.
Utilizamos el perfil de potencia de rendimiento Ultra Performance de MSI con Cooler Boost activo para ejecutar los siguientes puntos de referencia de rendimiento para obtener las puntuaciones más altas posibles.
Procesador
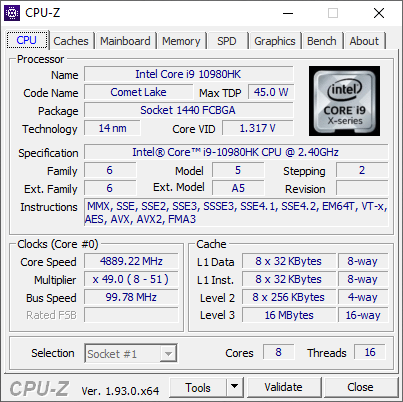
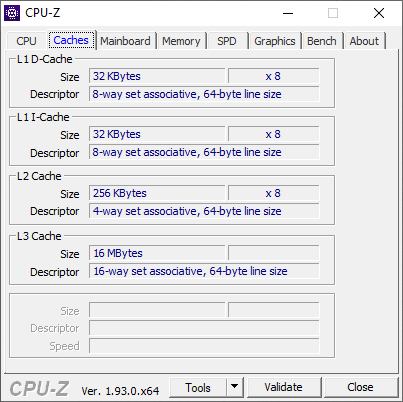
El rendimiento de la CPU es excelente con las puntuaciones de CineBench Multi-Thread que son entre un 25 y un 30 por ciento más altas que el bajo rendimiento del Core i7-10875H en el Razer Blade 15 Studio. La sostenibilidad del rendimiento también es respetable con una caída del 10 por ciento a lo largo del tiempo, como muestra nuestro gráfico de bucle CineBench R15 xT a continuación. La configuración con una CPU Intel Xeon dará como resultado un rendimiento del procesador ligeramente más lento pero con el beneficio añadido de la RAM ECC.
Consulte nuestra página sobre el Core i9-10980HK para obtener más información técnica y comparaciones de referencia.
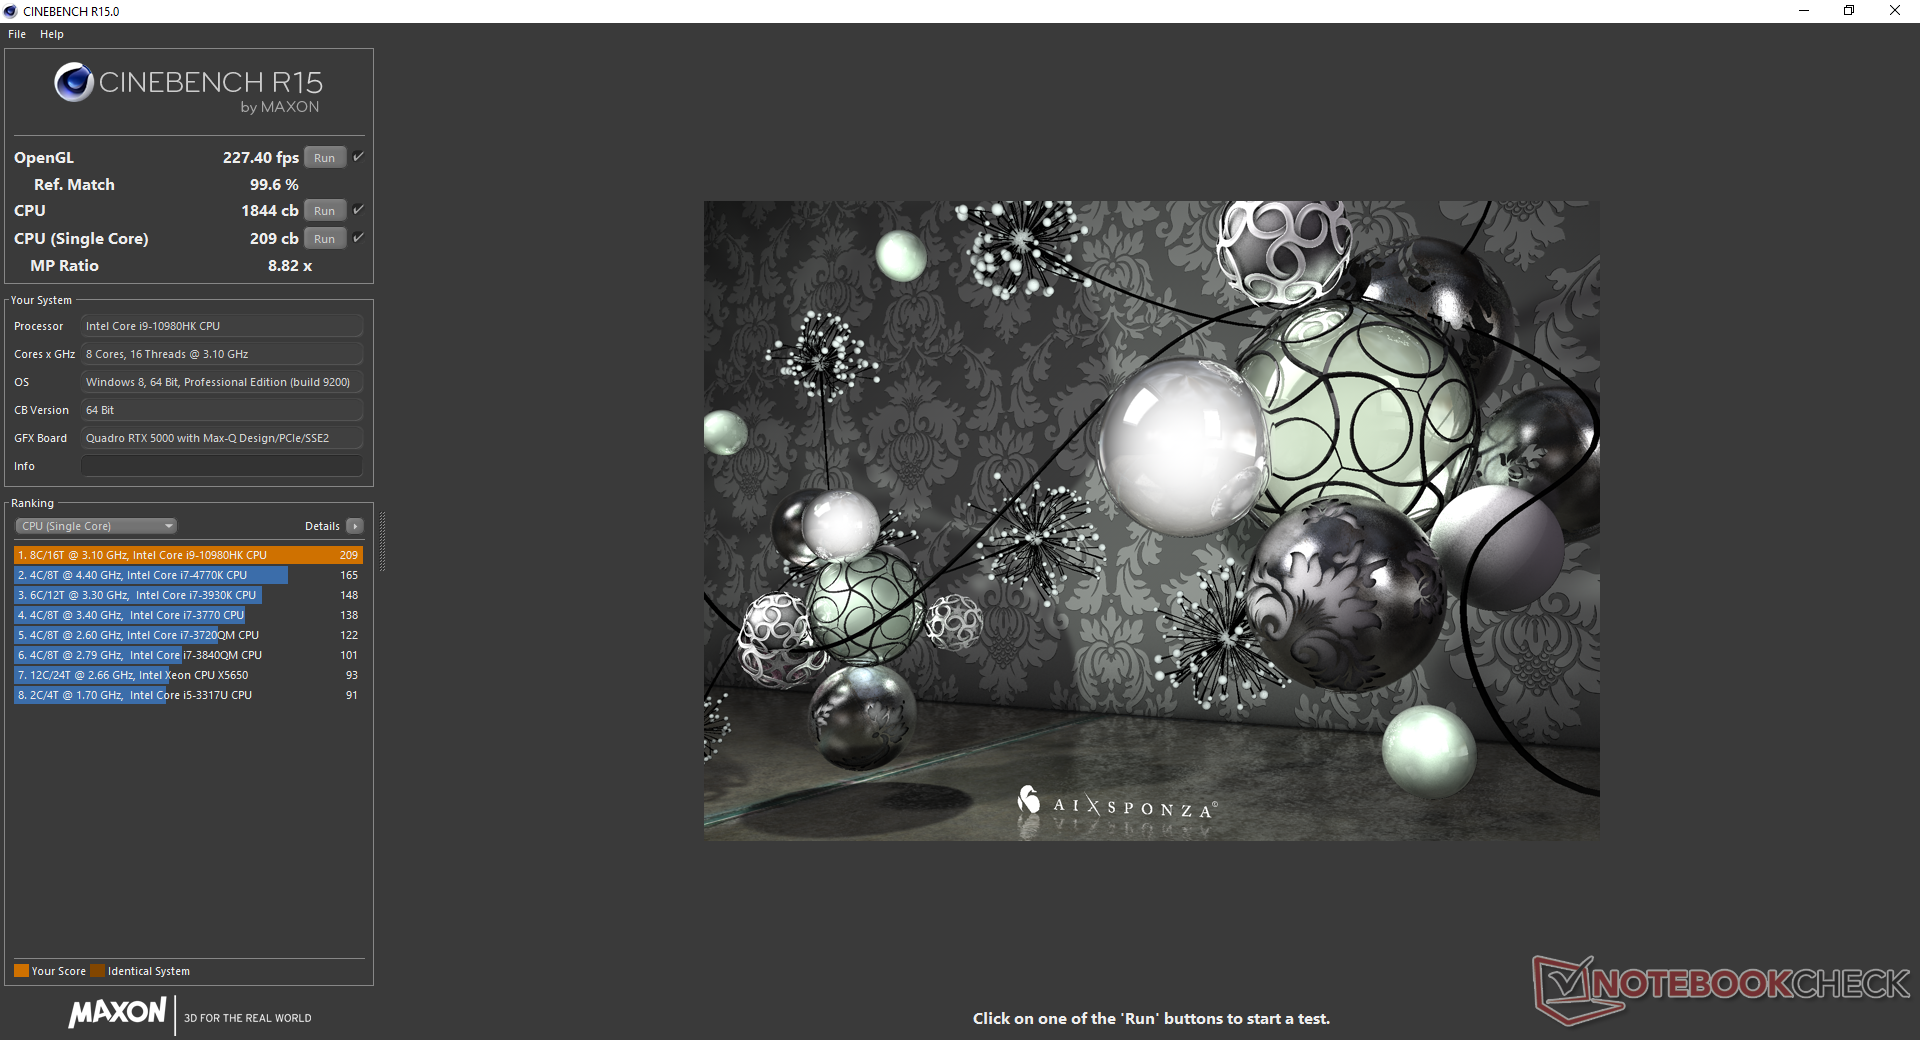
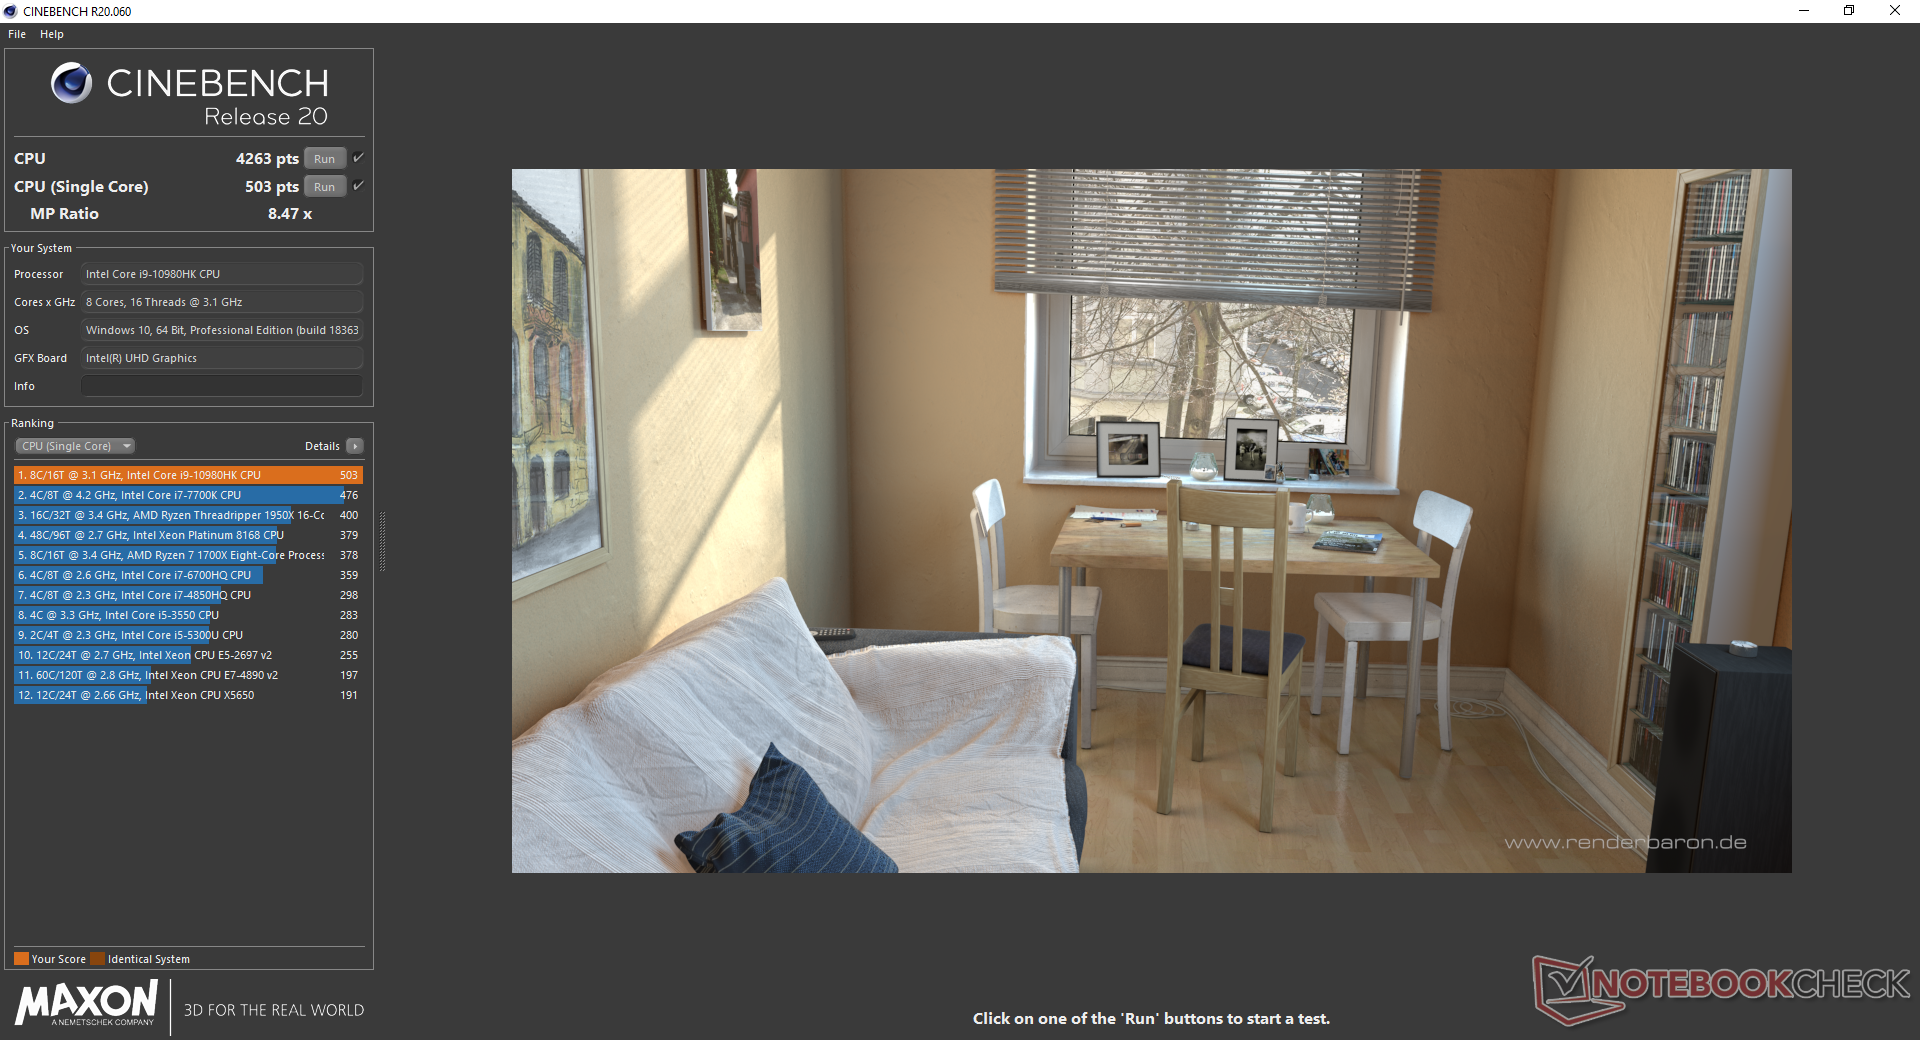
Cinebench R15: CPU Single 64Bit | CPU Multi 64Bit
Blender: v2.79 BMW27 CPU
7-Zip 18.03: 7z b 4 -mmt1 | 7z b 4
Geekbench 5.5: Single-Core | Multi-Core
HWBOT x265 Benchmark v2.2: 4k Preset
LibreOffice : 20 Documents To PDF
R Benchmark 2.5: Overall mean
| Cinebench R20 / CPU (Multi Core) | |
| Intel Core i9-9900KS, Nvidia Titan RTX | |
| Eluktronics RP-15 | |
| MSI WS66 10TMT-207US | |
| Medio Intel Core i9-10980HK (3526 - 4487, n=13) | |
| Dell Precision 7550 | |
| Dell Precision 5550 P91F | |
| Razer Blade 15 RTX 2070 Super Max-Q | |
| HP Envy 15-ep0098nr | |
| Acer ConceptD 9 Pro | |
| Acer ConceptD 3 Pro CN315-71P-73W1 | |
| Cinebench R20 / CPU (Single Core) | |
| Intel Core i9-9900KS, Nvidia Titan RTX | |
| Acer ConceptD 9 Pro | |
| MSI WS66 10TMT-207US | |
| Dell Precision 5550 P91F | |
| Eluktronics RP-15 | |
| Razer Blade 15 RTX 2070 Super Max-Q | |
| Dell Precision 7550 | |
| Medio Intel Core i9-10980HK (465 - 507, n=13) | |
| Acer ConceptD 3 Pro CN315-71P-73W1 | |
| HP Envy 15-ep0098nr | |
| Cinebench R15 / CPU Single 64Bit | |
| Intel Core i9-9900KS, Nvidia Titan RTX | |
| MSI WS66 10TMT-207US | |
| Dell Precision 7550 | |
| Medio Intel Core i9-10980HK (198 - 219, n=15) | |
| Dell Precision 5550 P91F | |
| Razer Blade 15 RTX 2070 Super Max-Q | |
| Acer ConceptD 9 Pro | |
| HP Envy 15-ep0098nr | |
| Eluktronics RP-15 | |
| Acer ConceptD 3 Pro CN315-71P-73W1 | |
| Cinebench R15 / CPU Multi 64Bit | |
| Intel Core i9-9900KS, Nvidia Titan RTX | |
| Eluktronics RP-15 | |
| Medio Intel Core i9-10980HK (1606 - 1862, n=15) | |
| MSI WS66 10TMT-207US | |
| Dell Precision 7550 | |
| Acer ConceptD 9 Pro | |
| Dell Precision 5550 P91F | |
| Razer Blade 15 RTX 2070 Super Max-Q | |
| HP Envy 15-ep0098nr | |
| Acer ConceptD 3 Pro CN315-71P-73W1 | |
| Blender / v2.79 BMW27 CPU | |
| Acer ConceptD 3 Pro CN315-71P-73W1 | |
| HP Envy 15-ep0098nr | |
| Dell Precision 5550 P91F | |
| Razer Blade 15 RTX 2070 Super Max-Q | |
| Dell Precision 7550 | |
| Medio Intel Core i9-10980HK (239 - 299, n=13) | |
| MSI WS66 10TMT-207US | |
| Eluktronics RP-15 | |
| Intel Core i9-9900KS, Nvidia Titan RTX | |
| Geekbench 5.5 / Single-Core | |
| MSI WS66 10TMT-207US | |
| Medio Intel Core i9-10980HK (1283 - 1401, n=12) | |
| Dell Precision 7550 | |
| Dell Precision 5550 P91F | |
| Acer ConceptD 9 Pro | |
| Razer Blade 15 RTX 2070 Super Max-Q | |
| HP Envy 15-ep0098nr | |
| Eluktronics RP-15 | |
| Acer ConceptD 3 Pro CN315-71P-73W1 | |
| Geekbench 5.5 / Multi-Core | |
| Eluktronics RP-15 | |
| Dell Precision 5550 P91F | |
| Dell Precision 7550 | |
| MSI WS66 10TMT-207US | |
| Medio Intel Core i9-10980HK (7634 - 8666, n=12) | |
| Acer ConceptD 9 Pro | |
| Razer Blade 15 RTX 2070 Super Max-Q | |
| HP Envy 15-ep0098nr | |
| Acer ConceptD 3 Pro CN315-71P-73W1 | |
| HWBOT x265 Benchmark v2.2 / 4k Preset | |
| Intel Core i9-9900KS, Nvidia Titan RTX | |
| Eluktronics RP-15 | |
| Dell Precision 7550 | |
| MSI WS66 10TMT-207US | |
| Medio Intel Core i9-10980HK (12 - 14.6, n=13) | |
| Razer Blade 15 RTX 2070 Super Max-Q | |
| Dell Precision 5550 P91F | |
| HP Envy 15-ep0098nr | |
| Acer ConceptD 3 Pro CN315-71P-73W1 | |
| LibreOffice / 20 Documents To PDF | |
| Eluktronics RP-15 | |
| Acer ConceptD 9 Pro | |
| Acer ConceptD 3 Pro CN315-71P-73W1 | |
| Medio Intel Core i9-10980HK (44 - 89, n=13) | |
| HP Envy 15-ep0098nr | |
| Dell Precision 7550 | |
| Razer Blade 15 RTX 2070 Super Max-Q | |
| MSI WS66 10TMT-207US | |
| Dell Precision 5550 P91F | |
| R Benchmark 2.5 / Overall mean | |
| Acer ConceptD 3 Pro CN315-71P-73W1 | |
| HP Envy 15-ep0098nr | |
| Dell Precision 5550 P91F | |
| Razer Blade 15 RTX 2070 Super Max-Q | |
| Medio Intel Core i9-10980HK (0.561 - 0.596, n=13) | |
| Eluktronics RP-15 | |
| MSI WS66 10TMT-207US | |
| Dell Precision 7550 | |
* ... más pequeño es mejor
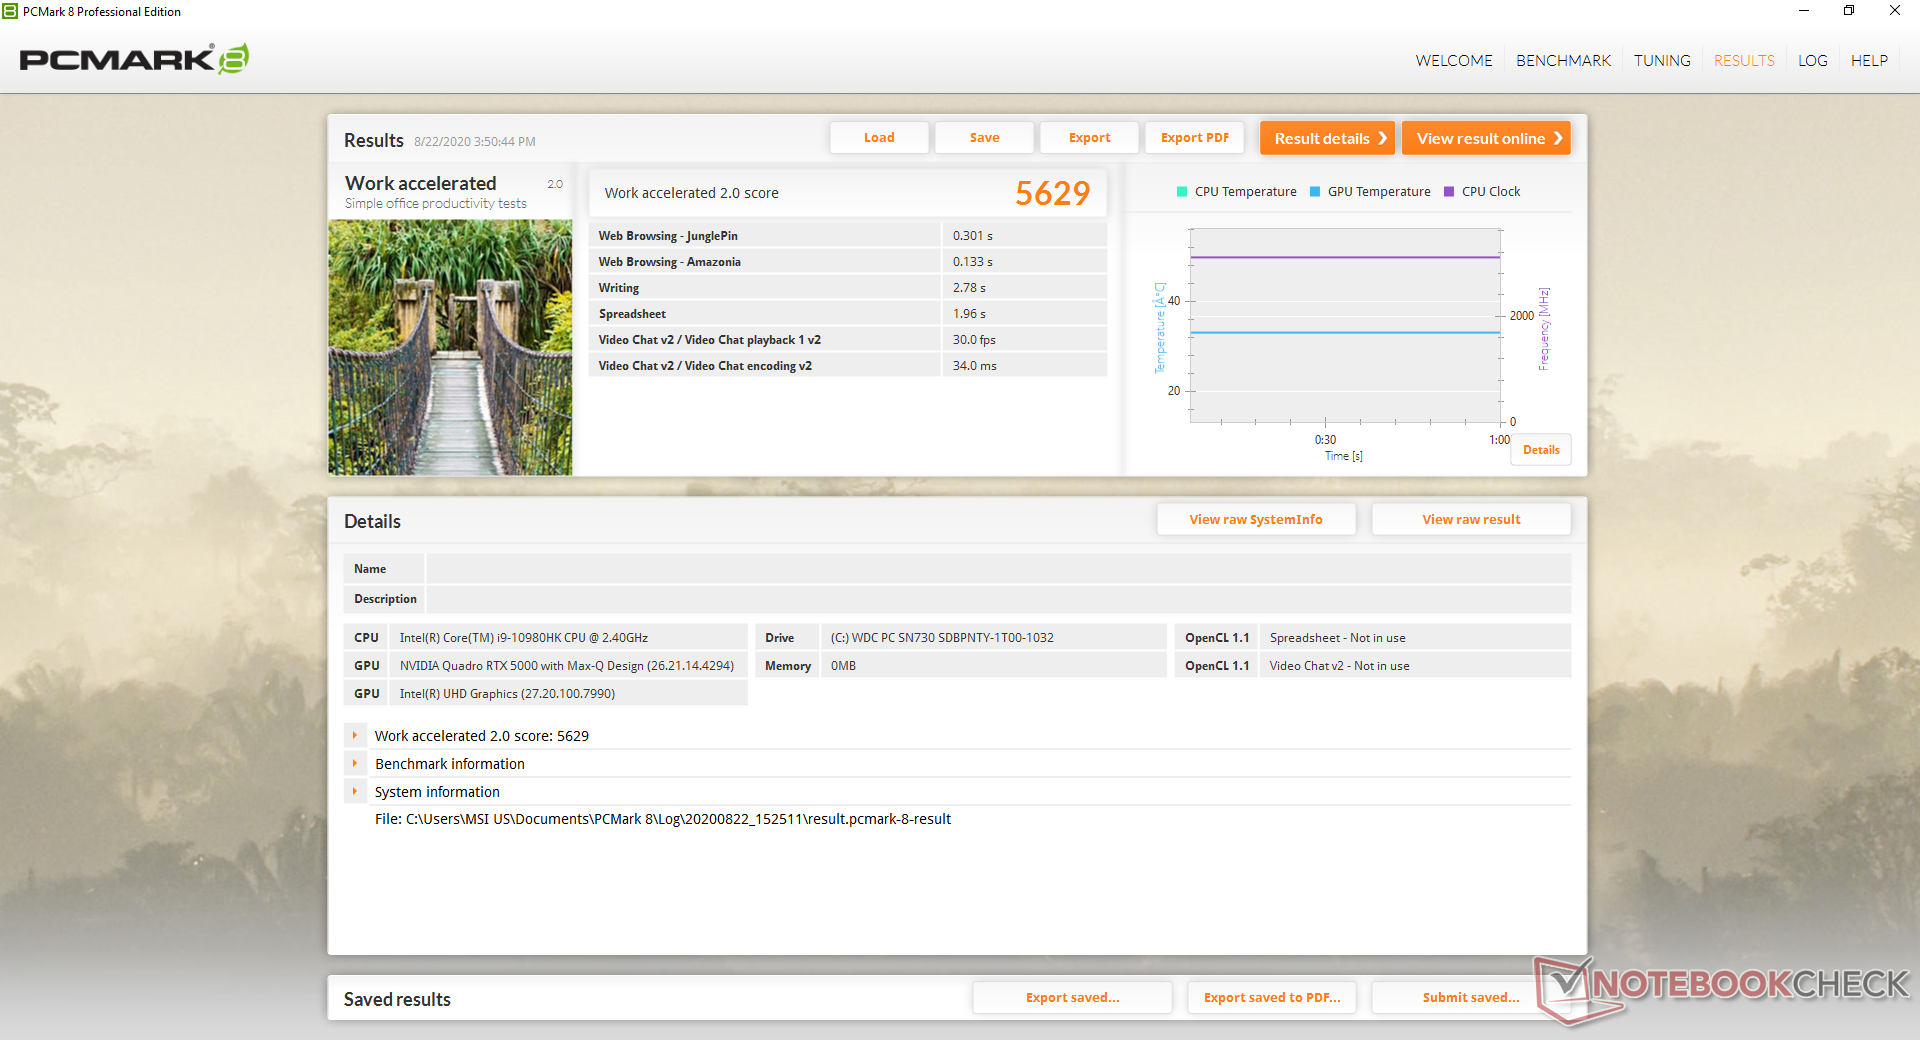
Rendimiento del sistema
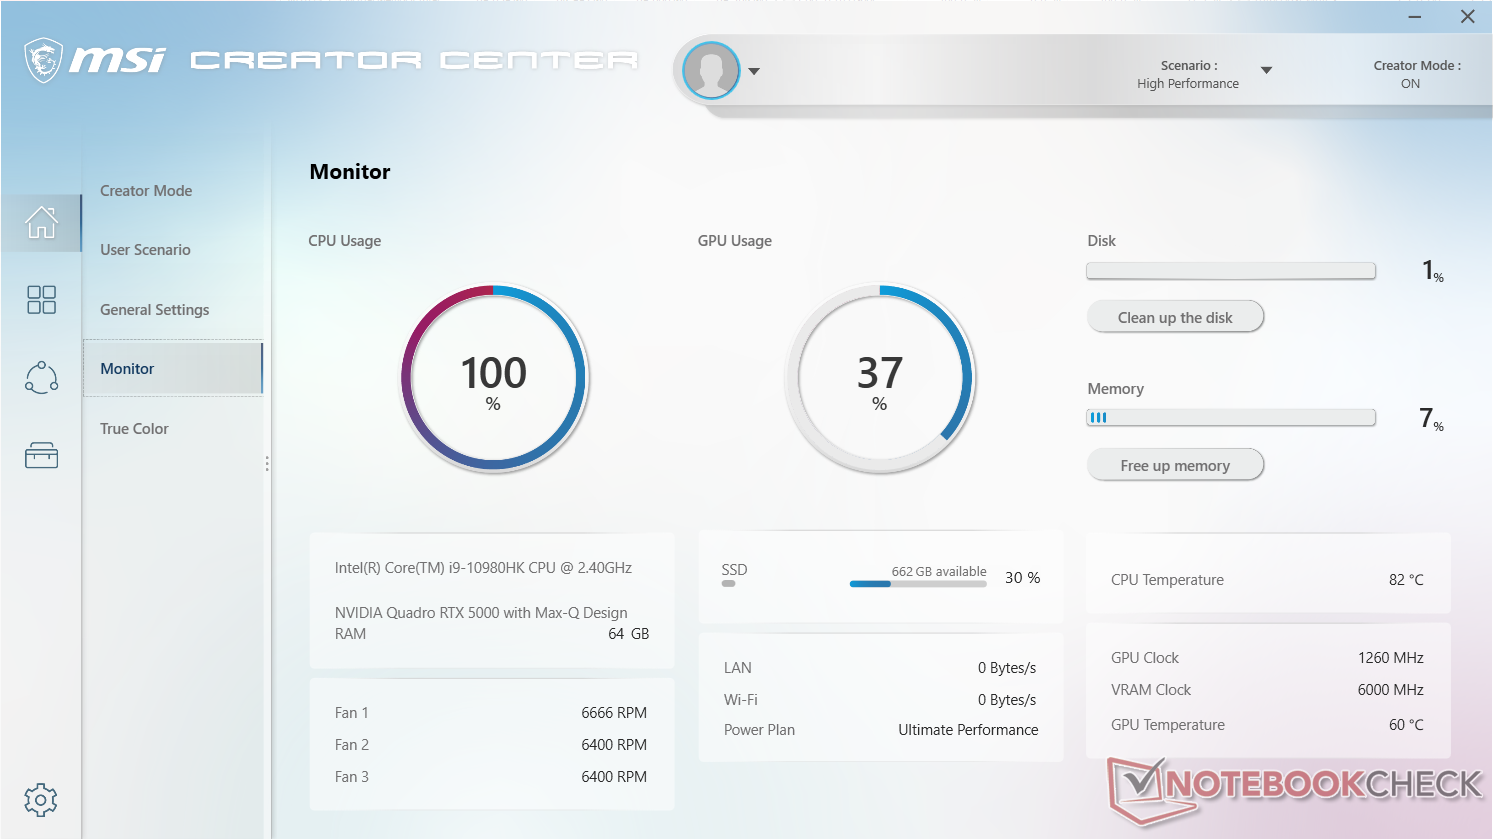
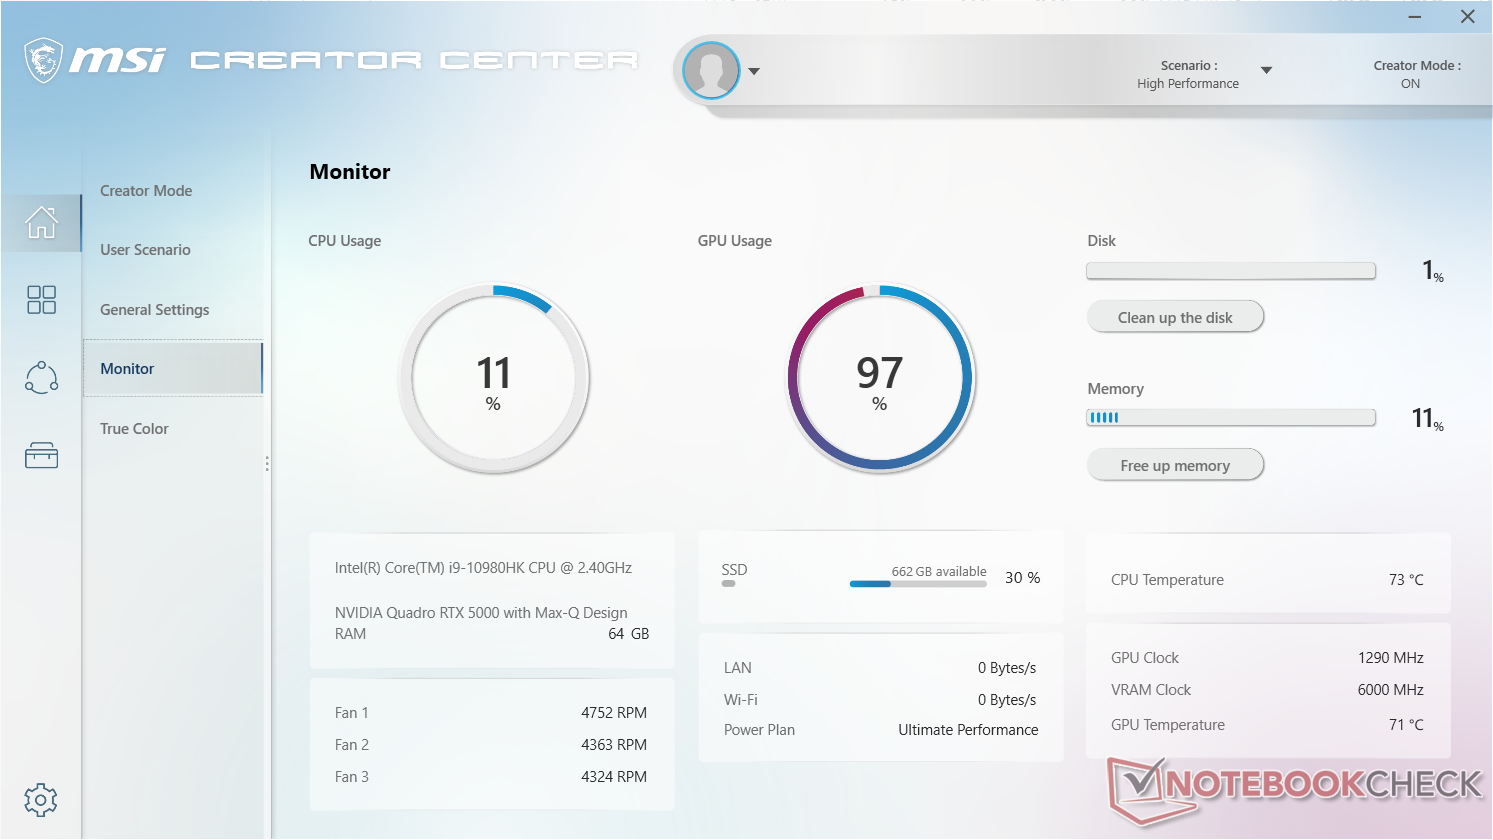
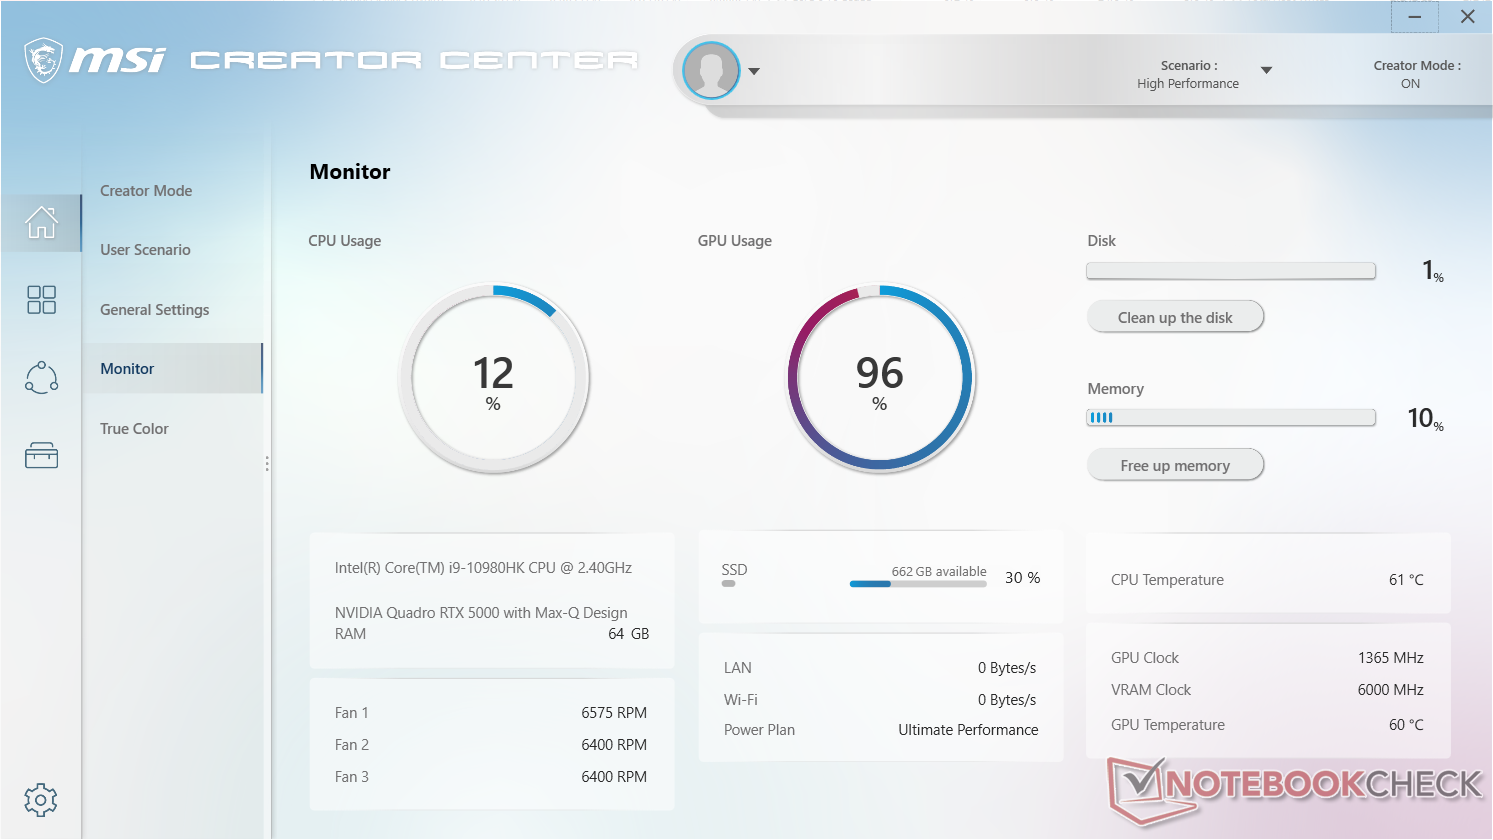
Los puntos de referencia de PCMark están constantemente por delante del Razer Blade 15 Studio, probablemente debido en parte al rendimiento general más rápido de la CPU mencionado anteriormente. No experimentamos ningún problema de software durante el tiempo que estuvimos con la unidad de prueba, pero recomendamos familiarizarse con el MSI Creator Center ya que el rendimiento y los controles de ruido del ventilador residen aquí.
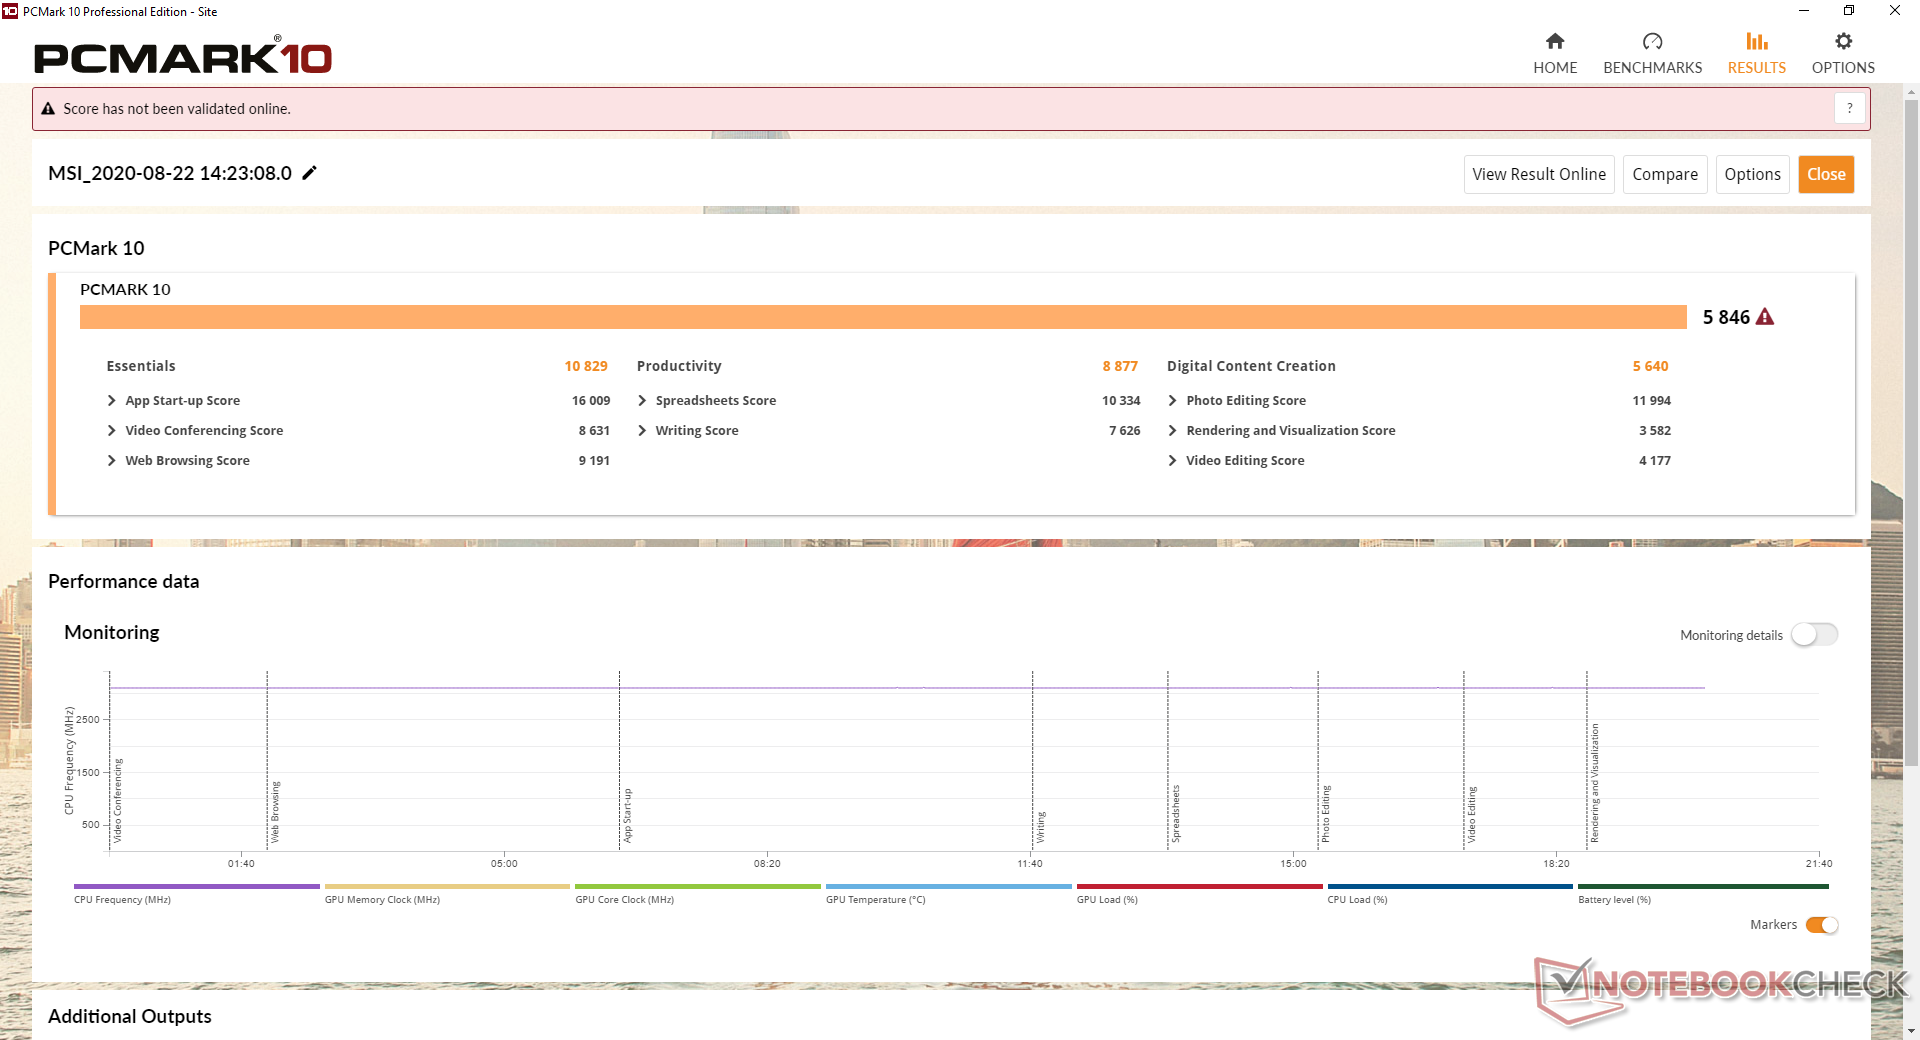
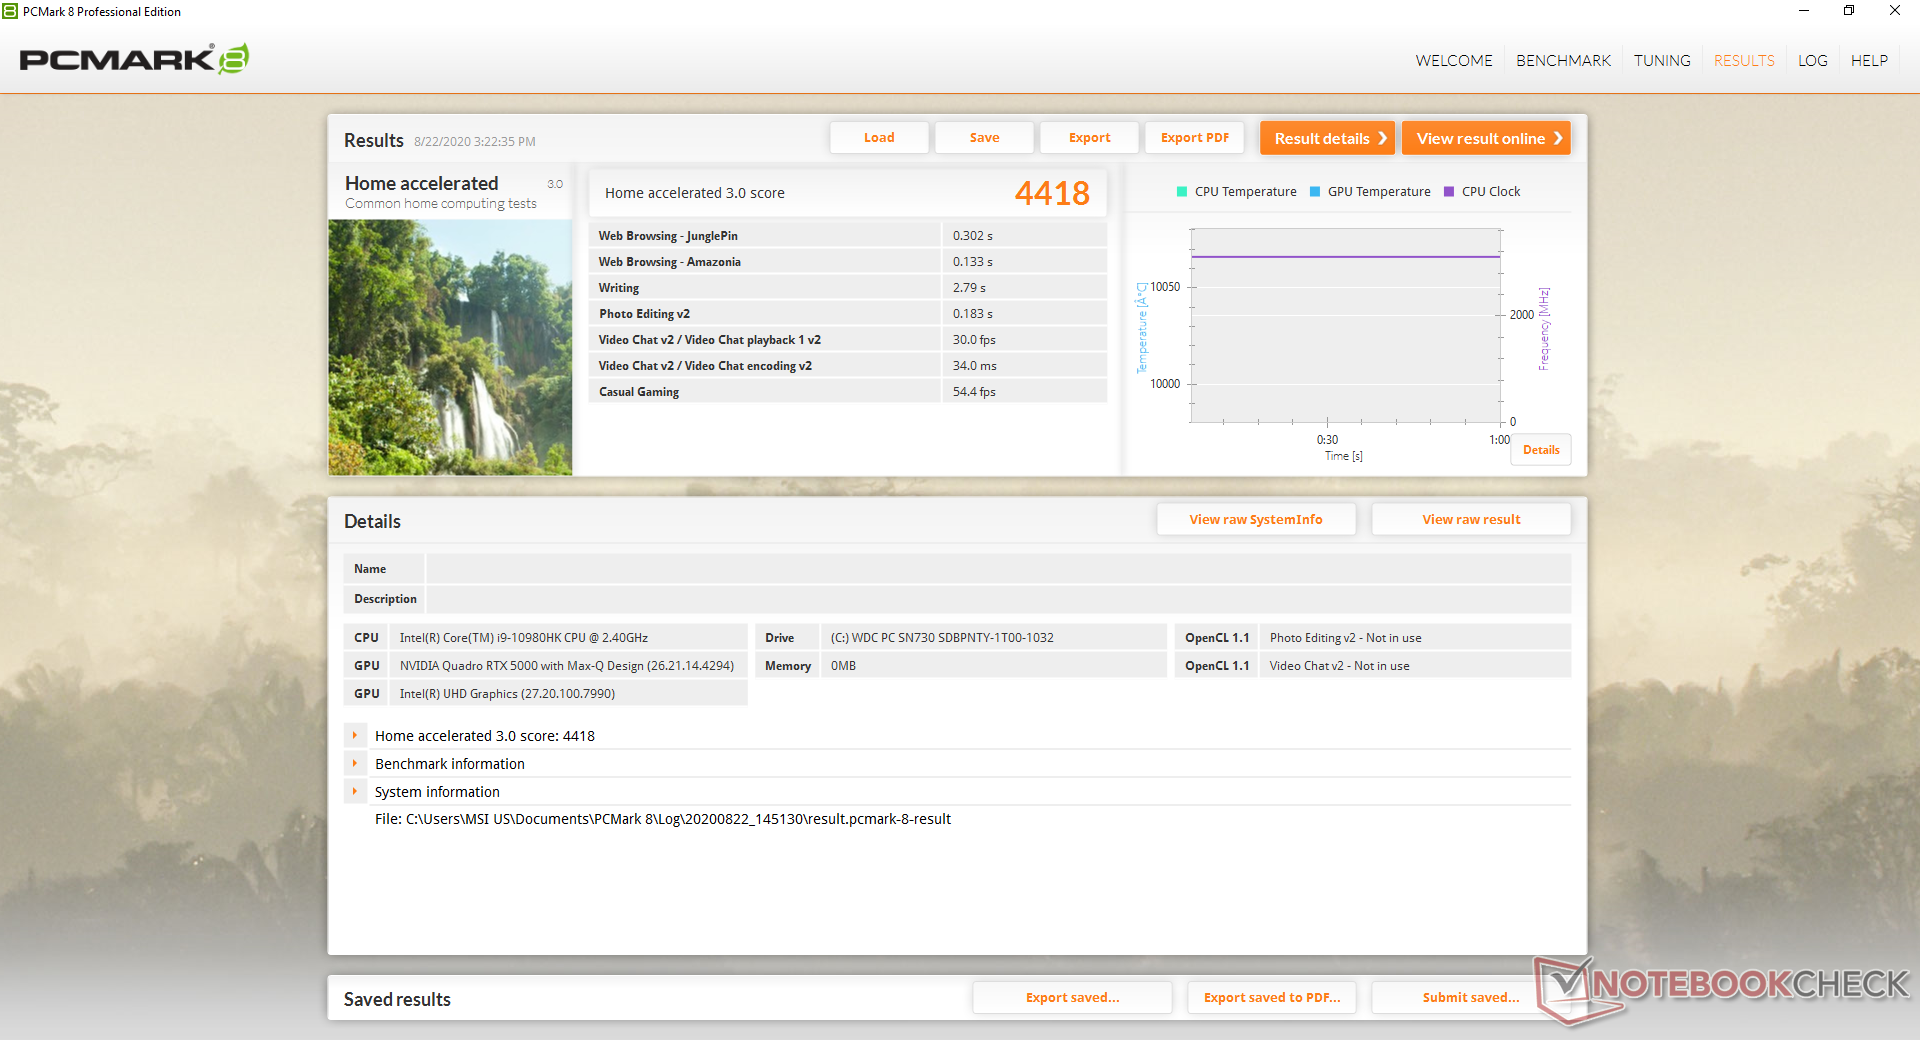
| PCMark 8 Home Score Accelerated v2 | 4418 puntos | |
| PCMark 8 Work Score Accelerated v2 | 5629 puntos | |
| PCMark 10 Score | 5846 puntos | |
ayuda | ||
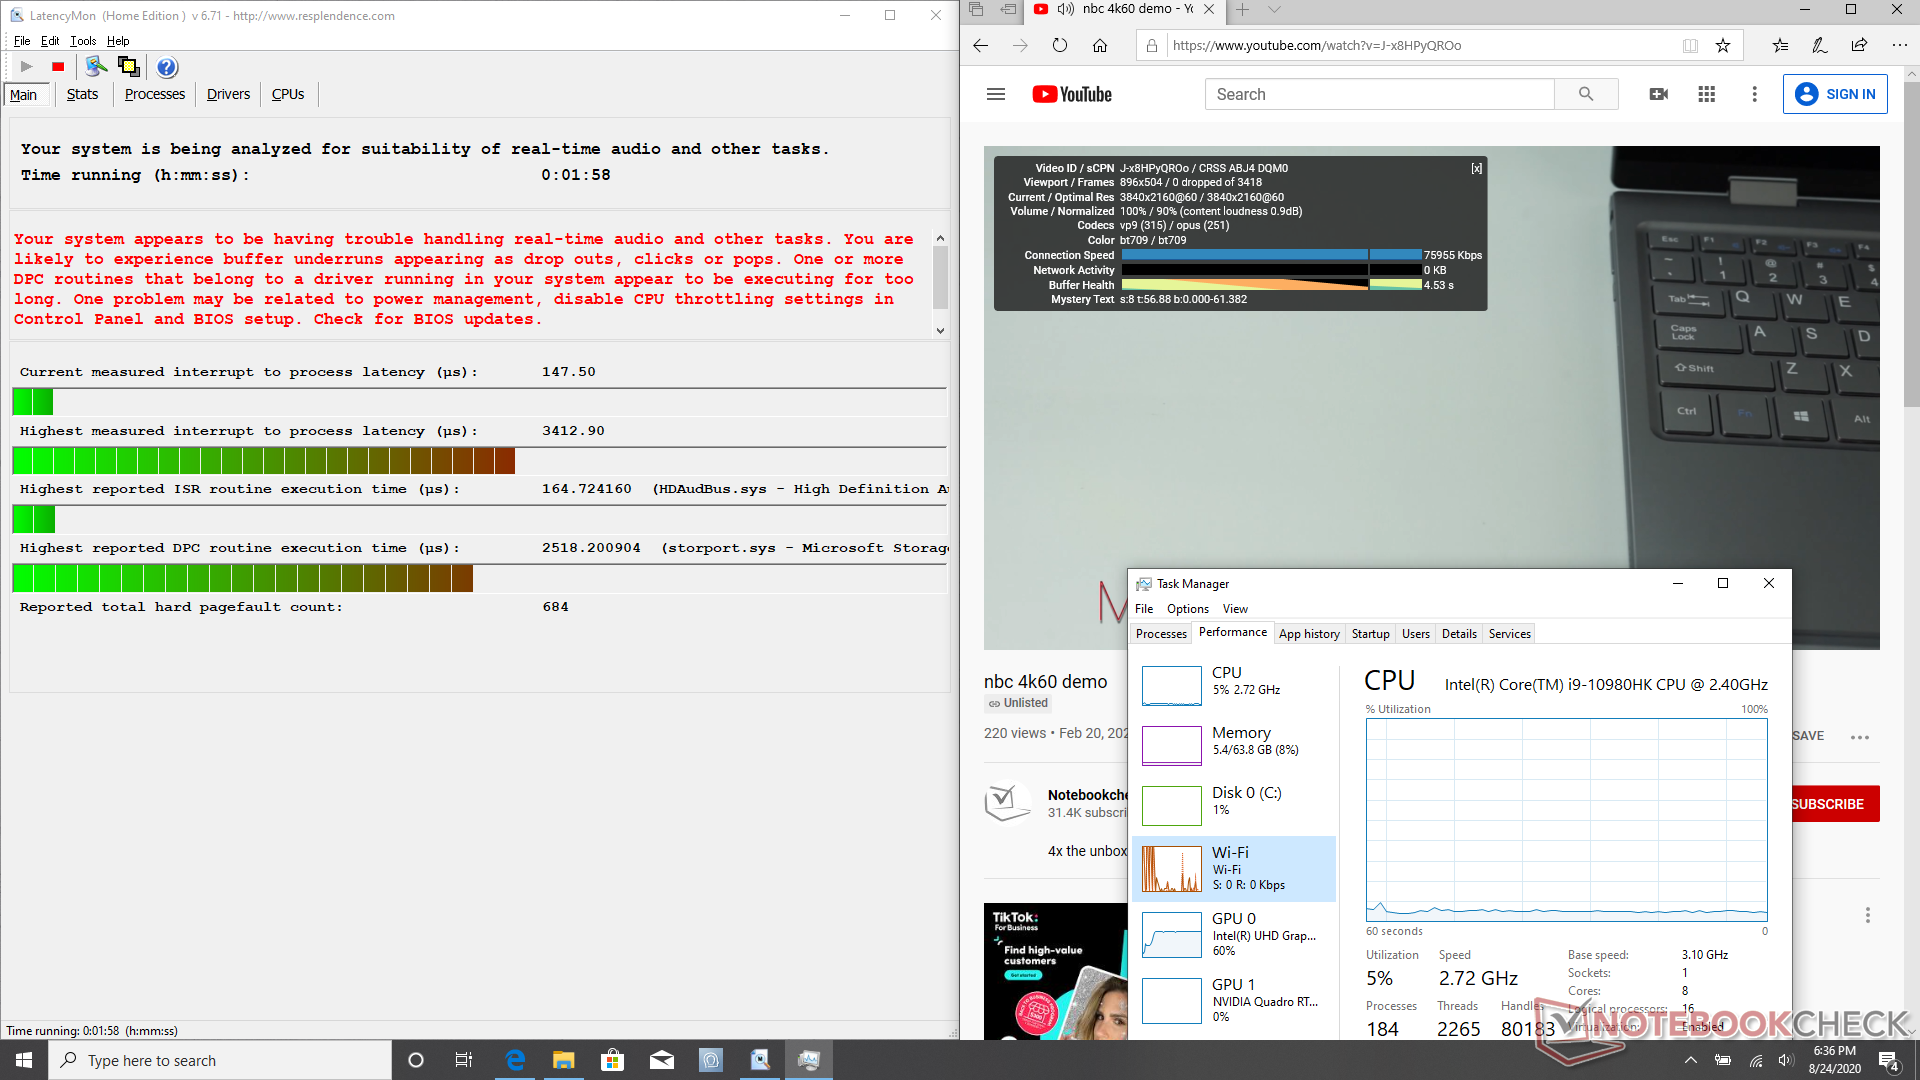
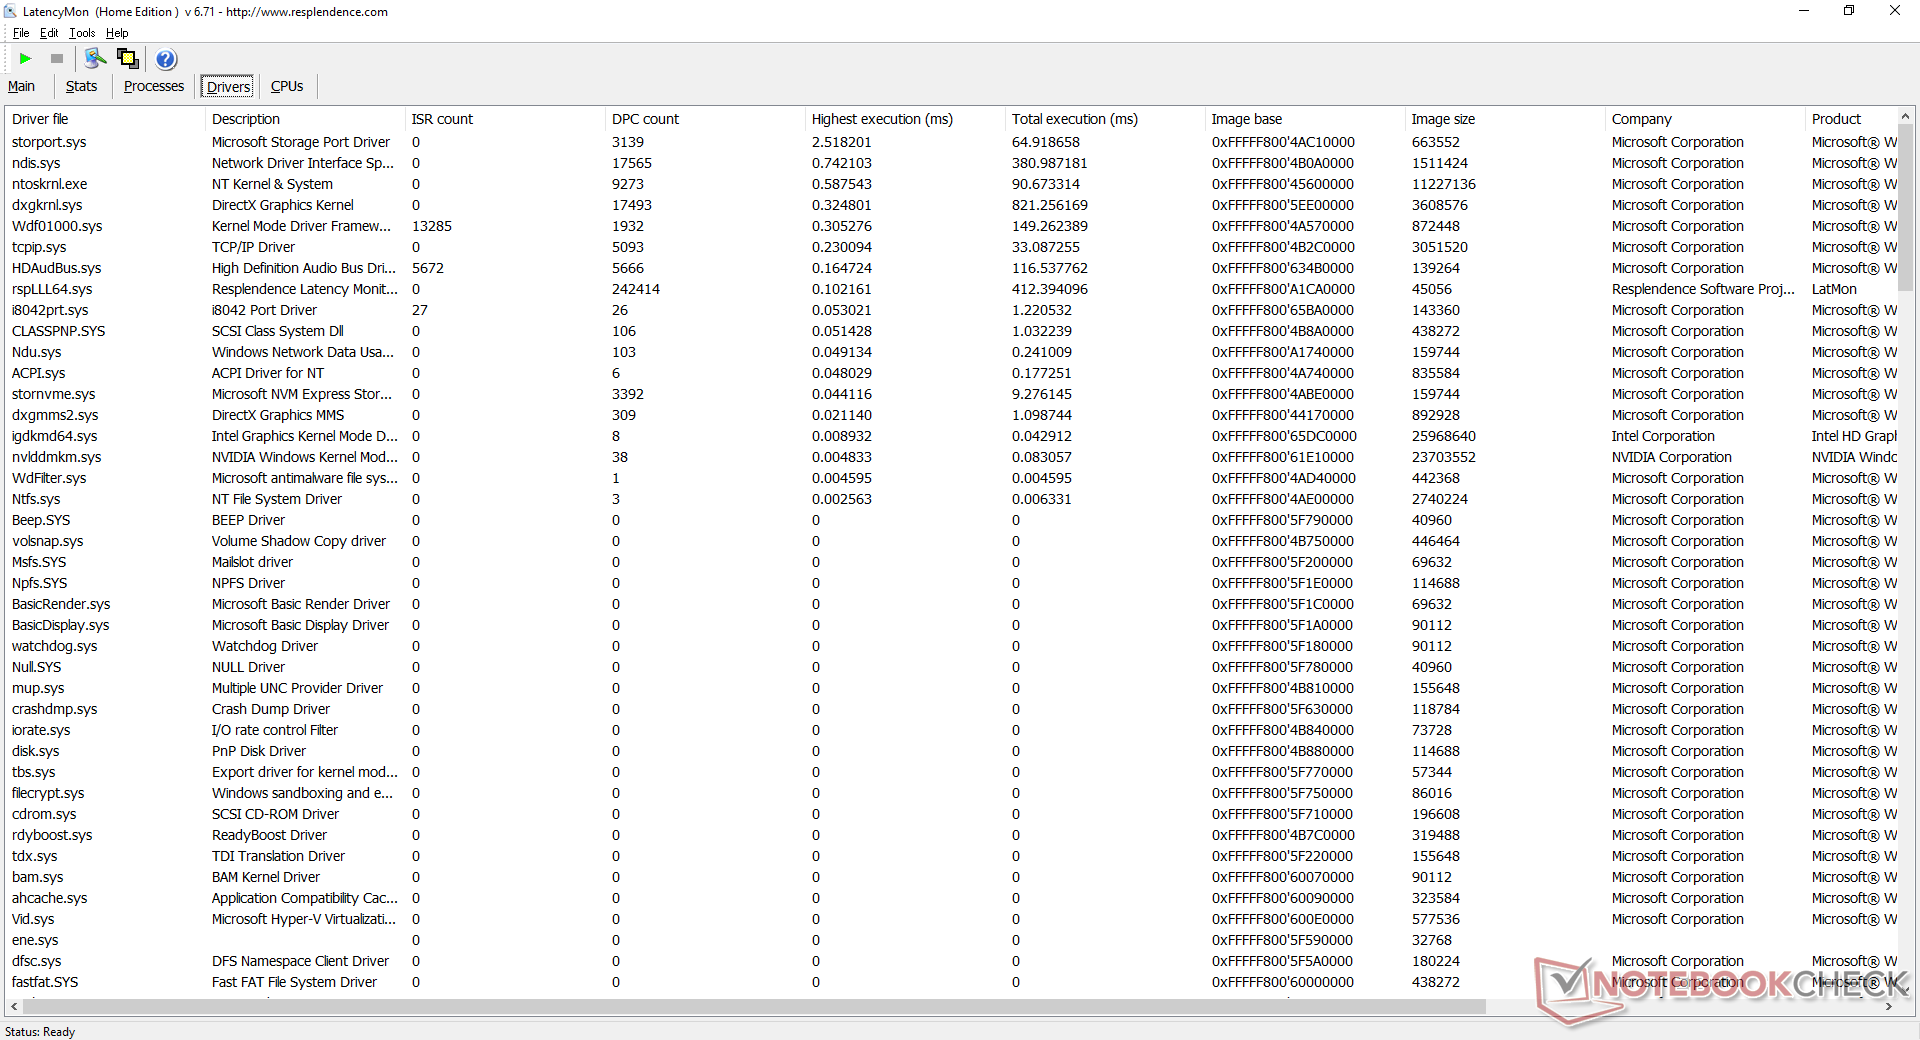
Latencia DPC
LatencyMon muestra los problemas de latencia de DPC mientras abre múltiples pestañas en nuestra página de inicio, lo cual es decepcionante de ver en una estación de trabajo móvil. La reproducción de 4K60 es, por lo demás, suave y sin caídas durante nuestro video de prueba de un minuto en YouTube.
| DPC Latencies / LatencyMon - interrupt to process latency (max), Web, Youtube, Prime95 | |
| Dell Precision 7550 | |
| MSI WS66 10TMT-207US | |
| Razer Blade 15 RTX 2070 Super Max-Q | |
| Acer ConceptD 3 Pro CN315-71P-73W1 | |
| Razer Blade 15 Studio Edition 2020 | |
| Dell Precision 5550 P91F | |
* ... más pequeño es mejor
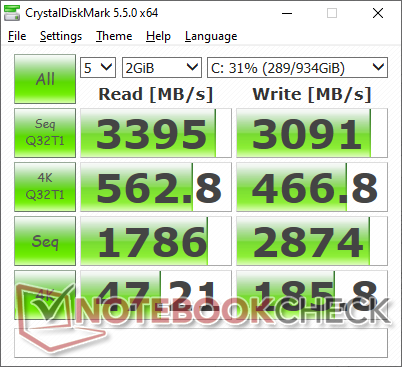
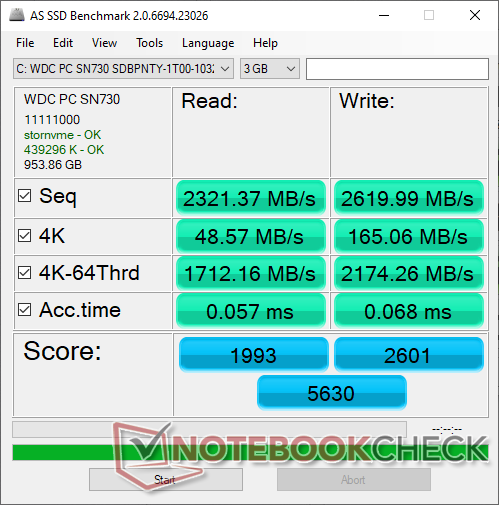
Dispositivos de almacenamiento
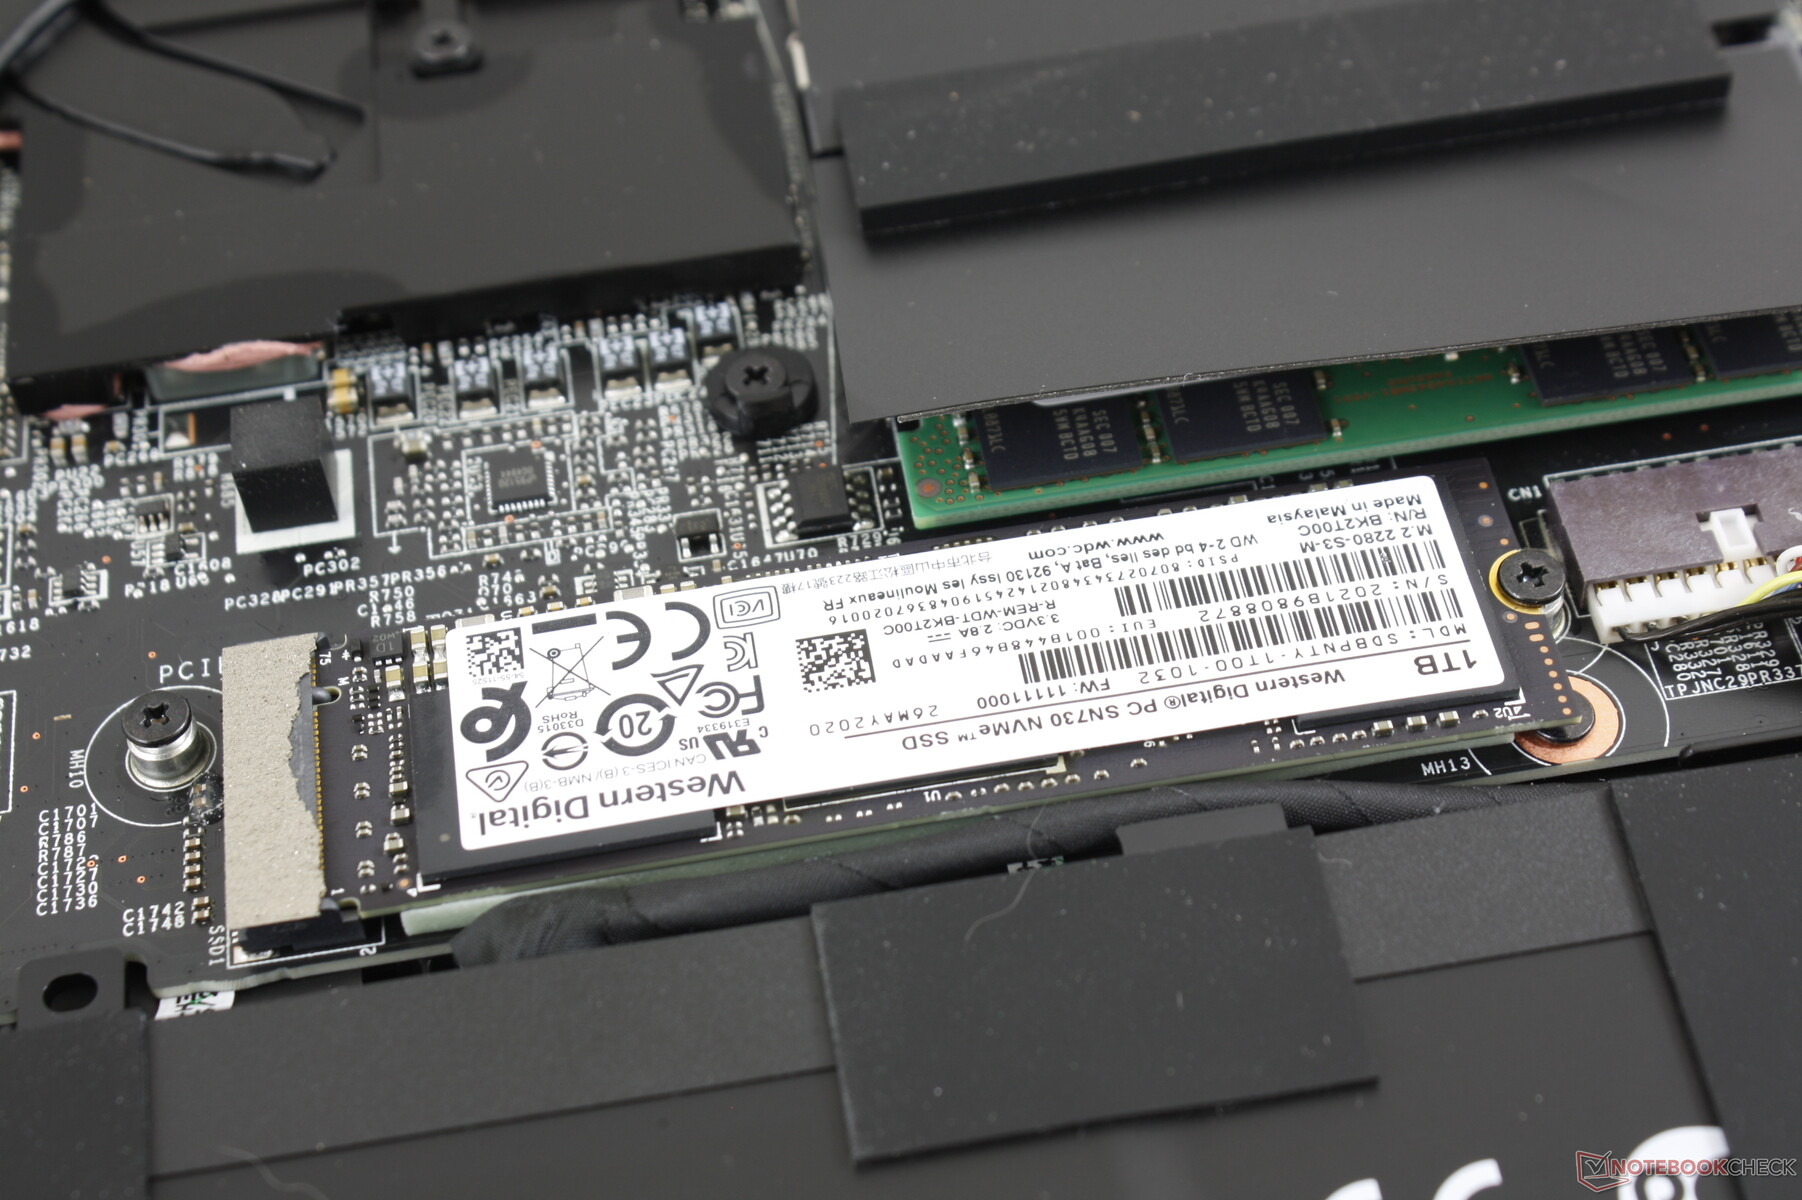
| MSI WS66 10TMT-207US WDC PC SN730 SDBPNTY-1T00 | Dell Precision 7550 SK Hynix PC601A NVMe 1TB | Dell Precision 5550 P91F SK Hynix PC601A NVMe 1TB | Razer Blade 15 Studio Edition 2020 Samsung PM981a MZVLB1T0HBLR | MSI WS63VR 7RL-023US Toshiba NVMe THNSN5512GPU7 | Acer ConceptD 3 Pro CN315-71P-73W1 WDC PC SN720 SDAPNTW-512G | |
|---|---|---|---|---|---|---|
| AS SSD | -30% | -117% | -18% | -47% | -22% | |
| Seq Read (MB/s) | 2321 | 2028 -13% | 2039 -12% | 1982 -15% | 2133 -8% | 2973 28% |
| Seq Write (MB/s) | 2620 | 1193 -54% | 1376 -47% | 2252 -14% | 1287 -51% | 2429 -7% |
| 4K Read (MB/s) | 48.57 | 42.31 -13% | 44.11 -9% | 47.13 -3% | 40.2 -17% | 24.7 -49% |
| 4K Write (MB/s) | 165.1 | 105.5 -36% | 113.3 -31% | 88.2 -47% | 114.6 -31% | 115.3 -30% |
| 4K-64 Read (MB/s) | 1712 | 1128 -34% | 1094 -36% | 1481 -13% | 710 -59% | 1243 -27% |
| 4K-64 Write (MB/s) | 2174 | 1537 -29% | 1630 -25% | 1842 -15% | 314 -86% | 835 -62% |
| Access Time Read * (ms) | 0.057 | 0.069 -21% | 0.059 -4% | 0.087 -53% | 0.128 -125% | |
| Access Time Write * (ms) | 0.068 | 0.106 -56% | 0.99 -1356% | 0.04 41% | 0.033 51% | 0.034 50% |
| Score Read (Points) | 1993 | 1373 -31% | 1342 -33% | 1726 -13% | 962 -52% | 1565 -21% |
| Score Write (Points) | 2601 | 1762 -32% | 1881 -28% | 2155 -17% | 557 -79% | 1193 -54% |
| Score Total (Points) | 5630 | 3801 -32% | 3883 -31% | 4781 -15% | 1979 -65% | 3525 -37% |
| Copy ISO MB/s (MB/s) | 2589 | 1768 -32% | 2489 -4% | 1982 -23% | 2136 -17% | |
| Copy Program MB/s (MB/s) | 791 | 627 -21% | 682 -14% | 501 -37% | 489.6 -38% | |
| Copy Game MB/s (MB/s) | 1625 | 1477 -9% | 1515 -7% | 1140 -30% | 1163 -28% | |
| CrystalDiskMark 5.2 / 6 | -16% | -17% | -6% | -27% | -19% | |
| Write 4K (MB/s) | 185.8 | 121 -35% | 122.6 -34% | 132.9 -28% | 157.1 -15% | 113.2 -39% |
| Read 4K (MB/s) | 47.21 | 42.16 -11% | 42.4 -10% | 46.73 -1% | 43.82 -7% | 31.1 -34% |
| Write Seq (MB/s) | 2874 | 2150 -25% | 2167 -25% | 2214 -23% | 1110 -61% | 2540 -12% |
| Read Seq (MB/s) | 1786 | 1755 -2% | 1747 -2% | 2018 13% | 1162 -35% | 2005 12% |
| Write 4K Q32T1 (MB/s) | 466.8 | 395.3 -15% | 388.8 -17% | 478.9 3% | 361.3 -23% | 331.4 -29% |
| Read 4K Q32T1 (MB/s) | 563 | 381.8 -32% | 367.3 -35% | 540 -4% | 563 0% | 368.3 -35% |
| Write Seq Q32T1 (MB/s) | 3091 | 2730 -12% | 2629 -15% | 2975 -4% | 1558 -50% | 2535 -18% |
| Read Seq Q32T1 (MB/s) | 3395 | 3468 2% | 3460 2% | 3195 -6% | 2635 -22% | 3427 1% |
| Media total (Programa/Opciones) | -23% /
-25% | -67% /
-81% | -12% /
-14% | -37% /
-39% | -21% /
-21% |
* ... más pequeño es mejor

Estrangulamiento del disco: DiskSpd Read Loop, Queue Depth 8
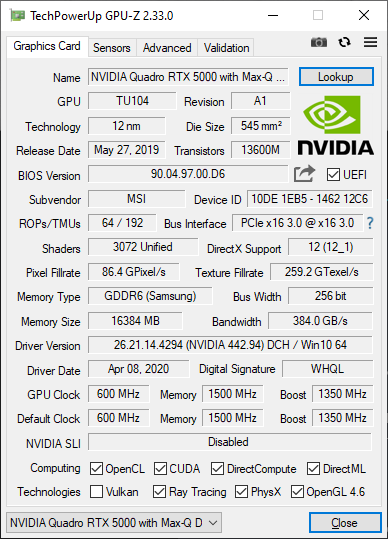
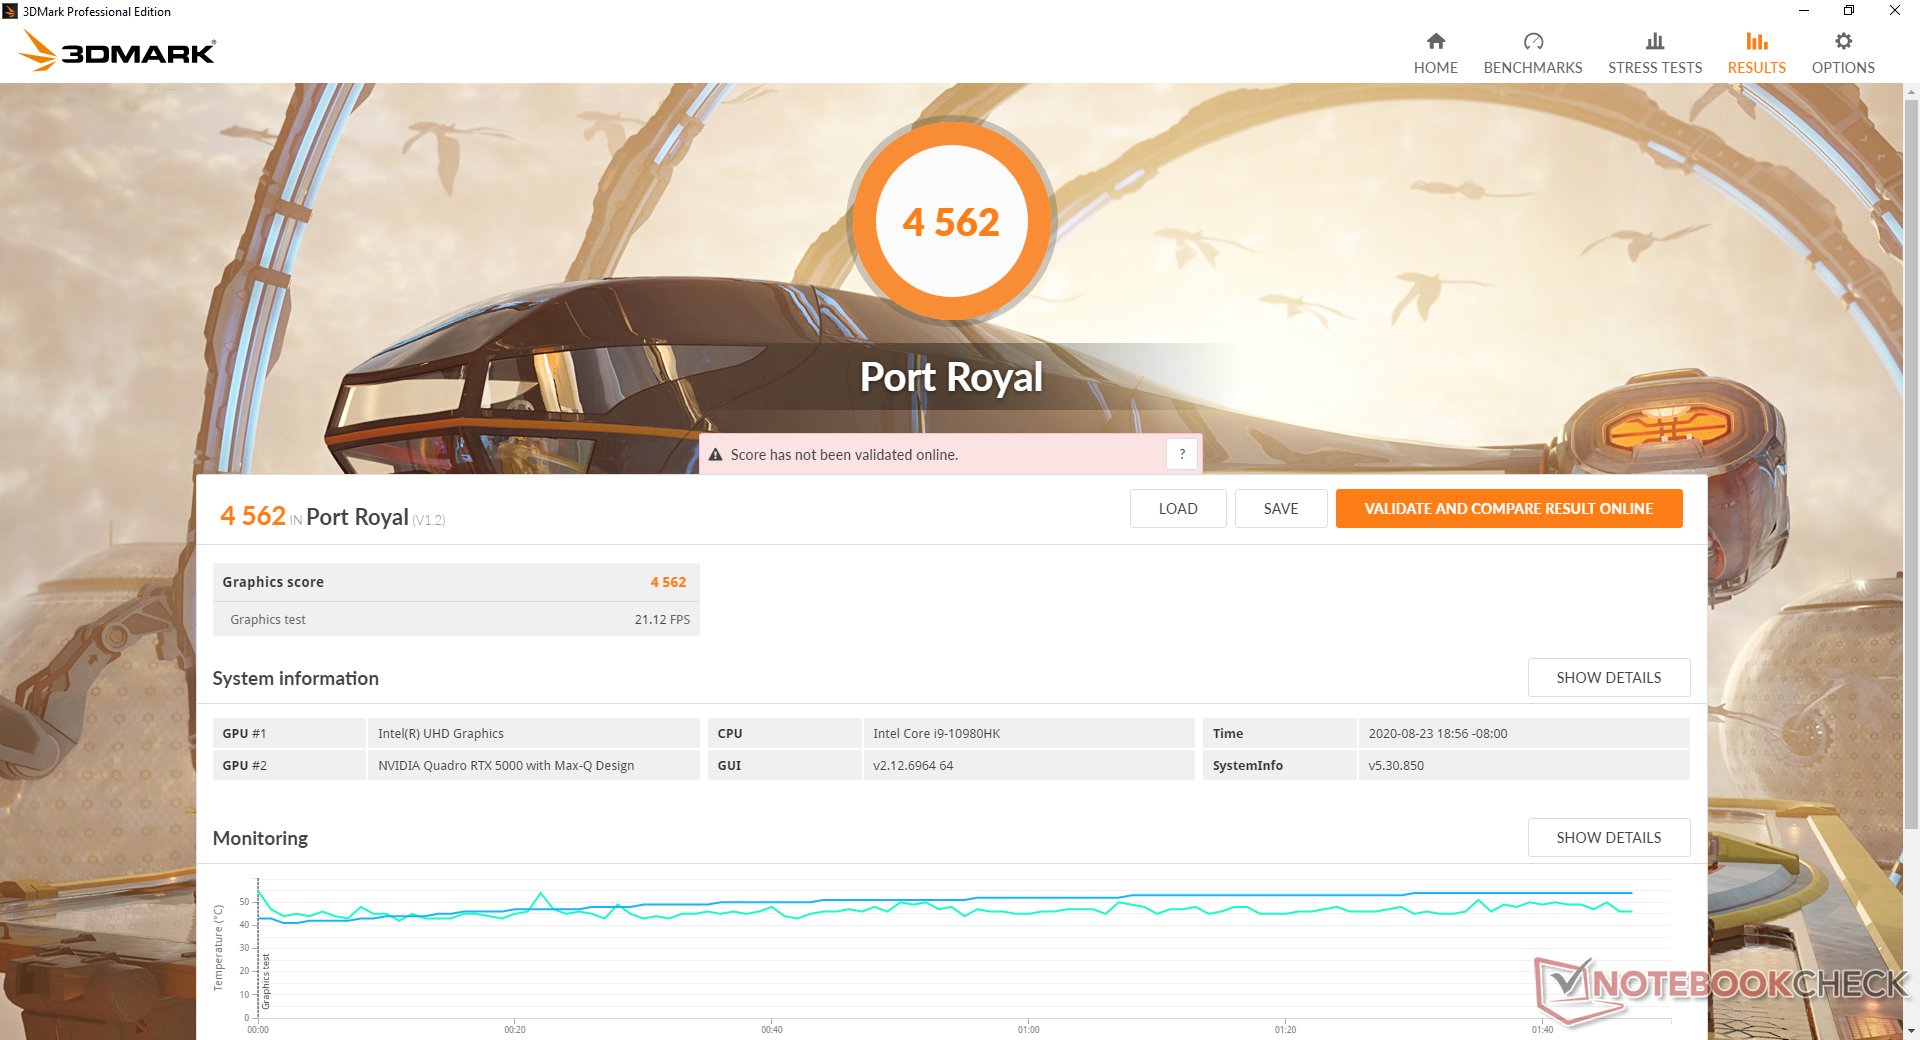
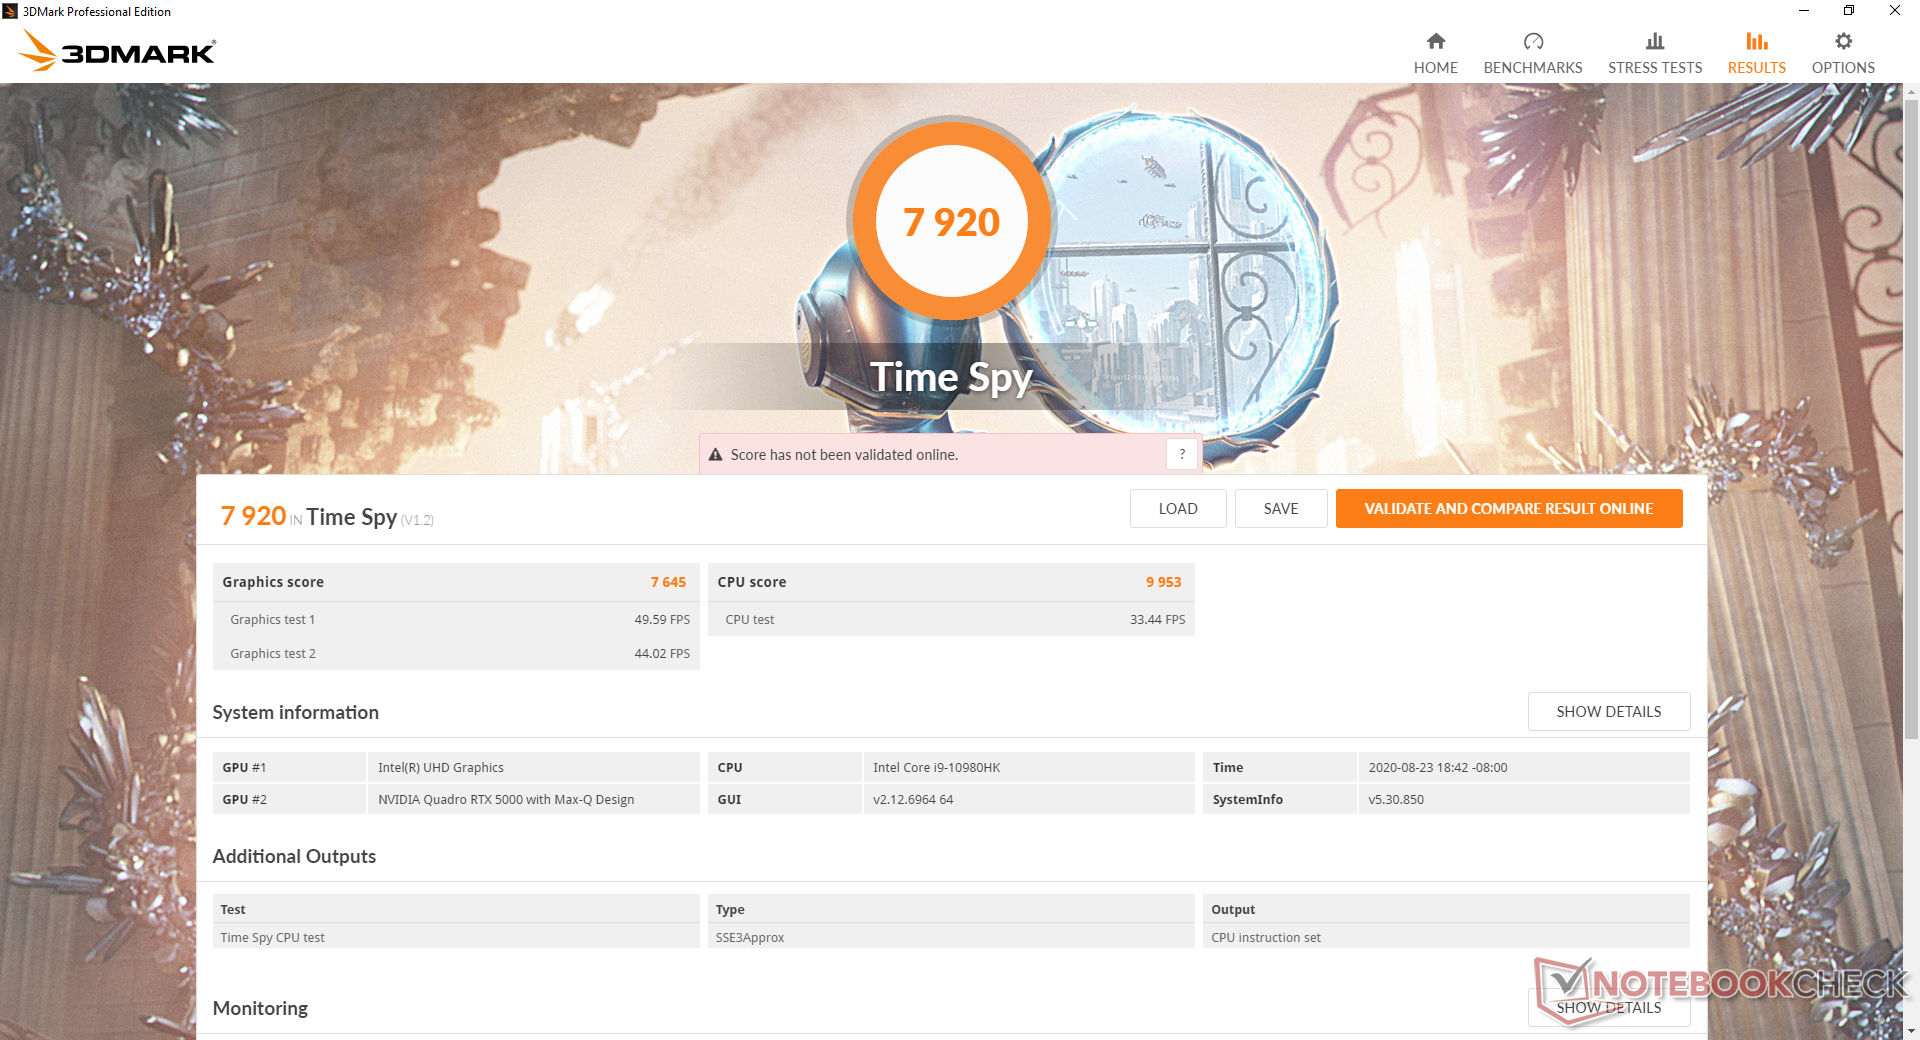
Rendimiento de la GPU
El Quadro RTX 5000 Max-Q está funcionando donde esperamos que esté en relación con otros portátiles con la misma GPU. La actualización a estaciones de trabajo más gruesas como el Acer ConceptD 9 Pro o Eurocom Tornado F5W con la potente Quadro RTX 5000 puede dar un aumento de entre el 30 y el 50 por ciento de la potencia gráfica.
Consulta nuestra página dedicada a la Quadro RTX 5000 Max-Q para obtener más información técnica y comparaciones de referencia.
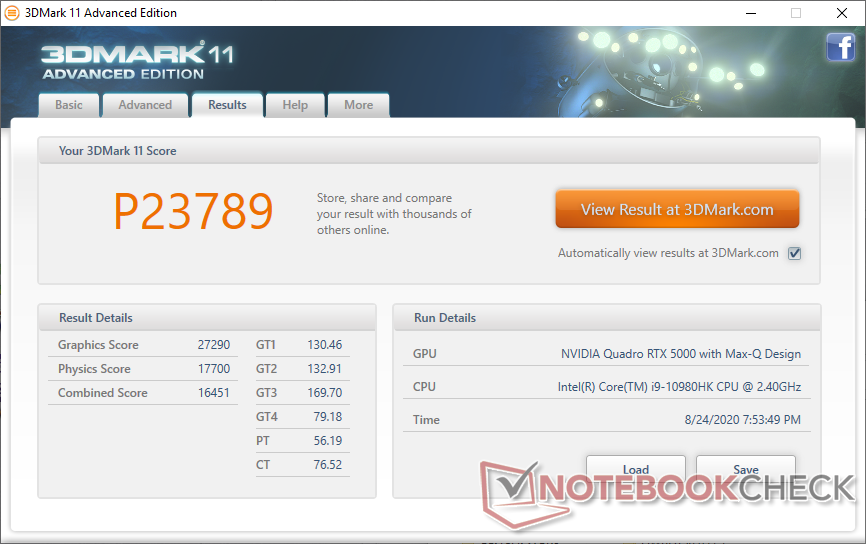

| 3DMark 11 Performance | 23789 puntos | |
| 3DMark Cloud Gate Standard Score | 52005 puntos | |
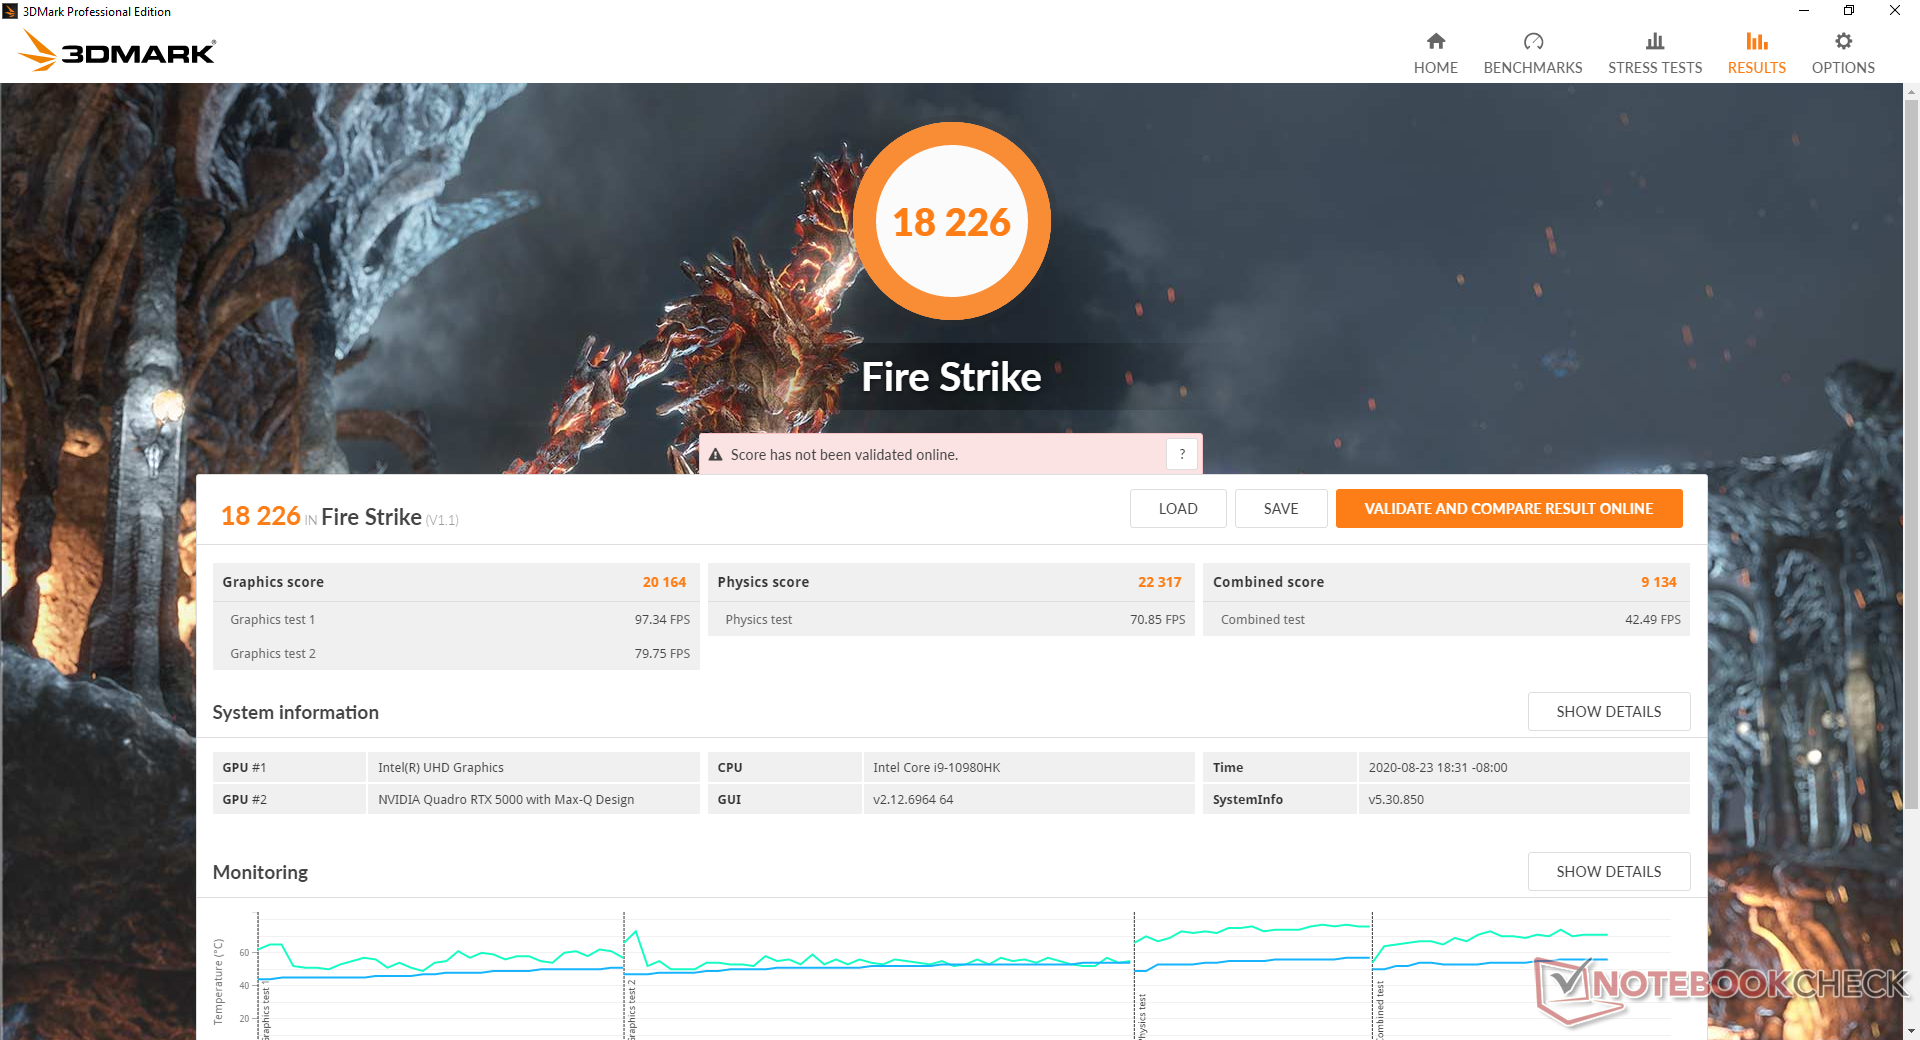
| 3DMark Fire Strike Score | 18226 puntos | |
| 3DMark Time Spy Score | 7920 puntos | |
ayuda | ||
| bajo | medio | alto | ultra | |
|---|---|---|---|---|
| The Witcher 3 (2015) | 353.2 | 249.8 | 158.2 | 81.1 |
| Dota 2 Reborn (2015) | 161 | 143 | 130 | 122 |
| Final Fantasy XV Benchmark (2018) | 177 | 103 | 80.8 | |
| X-Plane 11.11 (2018) | 113 | 98.9 | 82 |
Emisiones
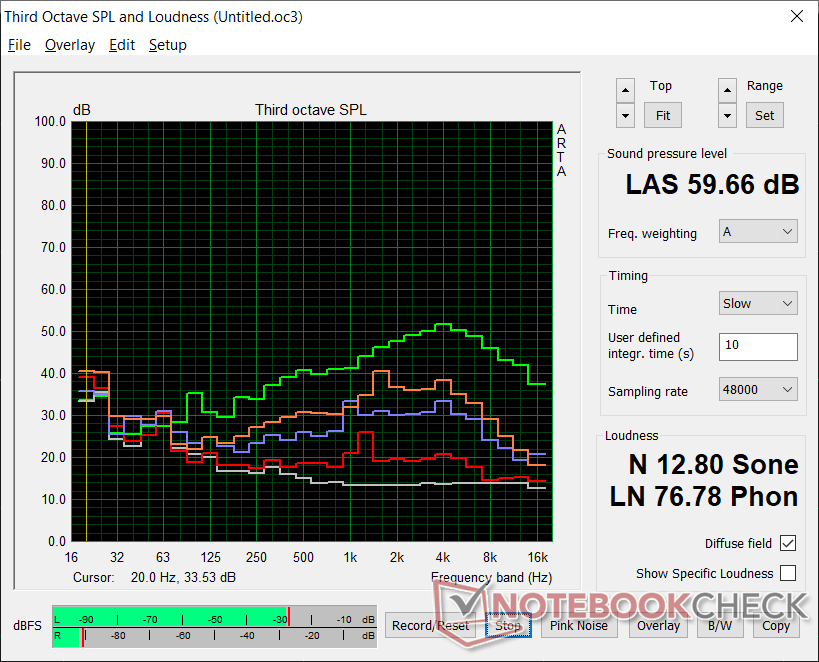
Ruido de sistema
Los ventiladores nunca están en silencio, incluso cuando están en modo silencioso a unos 32 dB(A) mínimo contra un fondo de 26 dB(A). Esto es similar a lo que observamos en el WS63 del año pasado, que sugiere que el comportamiento de los ventiladores no ha mejorado realmente entre generaciones a pesar del rediseño del chasis. No obstante, se recomienda el modo silencioso cuando se navega por la web o se transmite vídeo, ya que los ventiladores pulsarán con más frecuencia cuando se ajusten a otros perfiles de potencia.
Correr cargas exigentes como Witcher 3 inducirá un ruido de ventilador cíclico entre 45,5 dB(A) y 47,4 d(A) cuando Cooler Boost esté apagado. Si Cooler Boost está activado, el ruido del ventilador saltará y se estabilizará en 59,7 dB(A) para ser una de las estaciones de trabajo de 15,6 pulgadas más ruidosas que hayamos registrado.
| MSI WS66 10TMT-207US Quadro RTX 5000 Max-Q, i9-10980HK, WDC PC SN730 SDBPNTY-1T00 | Dell Precision 7550 Quadro RTX 5000 Max-Q, W-10885M, SK Hynix PC601A NVMe 1TB | Dell Precision 5550 P91F Quadro T2000 Max-Q, i7-10875H, SK Hynix PC601A NVMe 1TB | Razer Blade 15 Studio Edition 2020 Quadro RTX 5000 Max-Q, i7-10875H, Samsung PM981a MZVLB1T0HBLR | MSI WS63VR 7RL-023US Quadro P4000 Max-Q, i7-7700HQ, Toshiba NVMe THNSN5512GPU7 | Acer ConceptD 3 Pro CN315-71P-73W1 Quadro T1000 (Laptop), i7-9750H, WDC PC SN720 SDAPNTW-512G | |
|---|---|---|---|---|---|---|
| Noise | 6% | 13% | 4% | 4% | 7% | |
| apagado / medio ambiente * (dB) | 26 | 25.8 1% | 26.2 -1% | 30.1 -16% | 28 -8% | 31.2 -20% |
| Idle Minimum * (dB) | 32 | 25.8 19% | 26.2 18% | 30.1 6% | 33.2 -4% | 31.2 2% |
| Idle Average * (dB) | 32 | 25.8 19% | 26.2 18% | 30.1 6% | 33.2 -4% | 31.2 2% |
| Idle Maximum * (dB) | 32 | 25.9 19% | 26.2 18% | 30.1 6% | 33.2 -4% | 31.5 2% |
| Load Average * (dB) | 42 | 51.2 -22% | 39.2 7% | 42.3 -1% | 41.4 1% | 38.4 9% |
| Witcher 3 ultra * (dB) | 47.4 | 51.9 -9% | 39 18% | 48.2 -2% | 38.4 19% | 36.9 22% |
| Load Maximum * (dB) | 59.7 | 51.9 13% | 50.6 15% | 42.1 29% | 43.5 27% | 41.2 31% |
* ... más pequeño es mejor
Ruido
| Ocioso |
| 32 / 32 / 32 dB(A) |
| Carga |
| 42 / 59.7 dB(A) |
 | ||
30 dB silencioso 40 dB(A) audible 50 dB(A) ruidosamente alto |
||
min: | ||
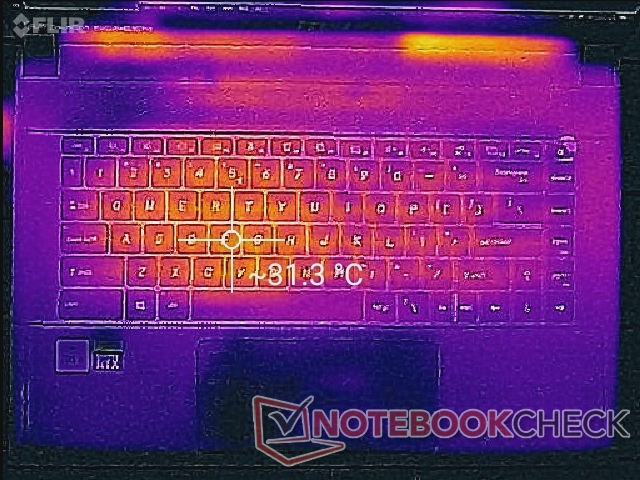
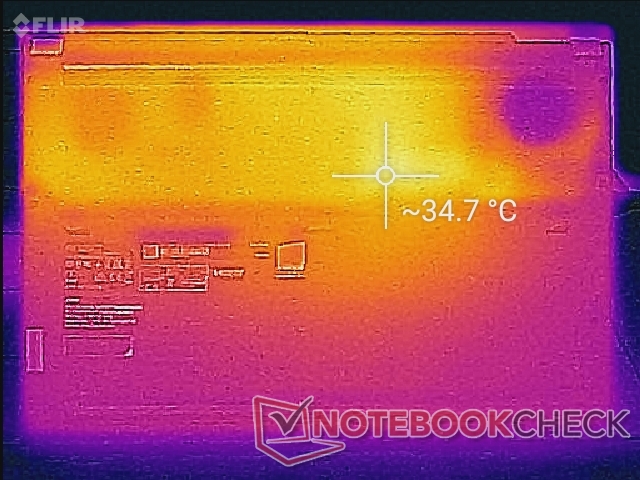
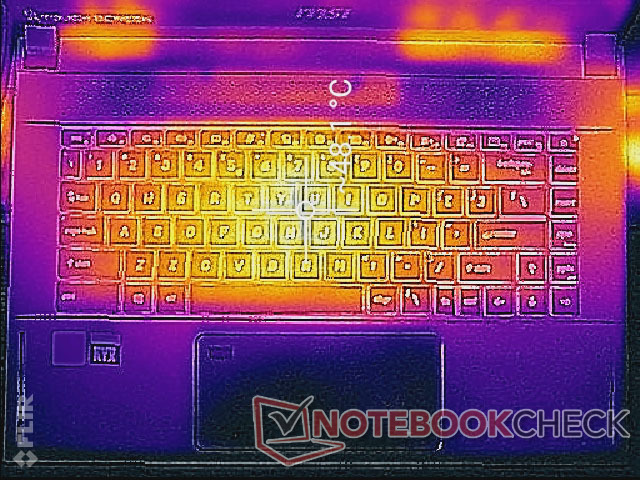
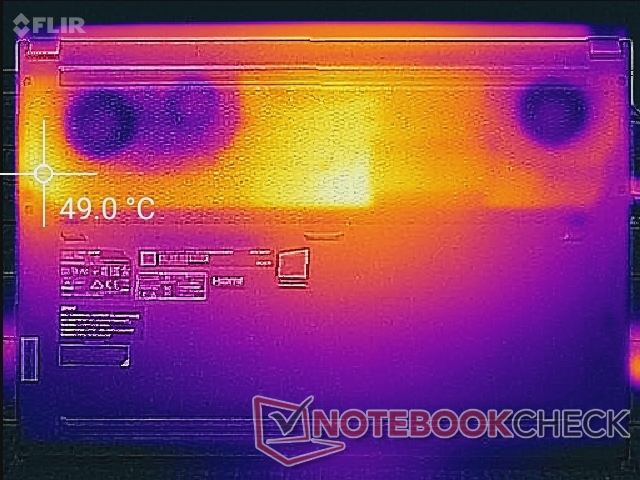
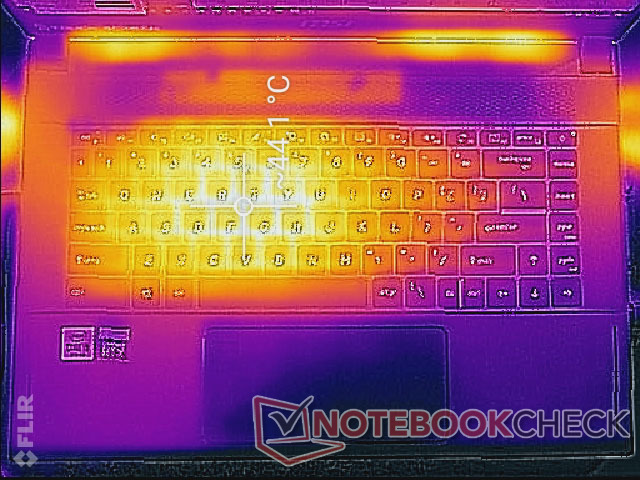
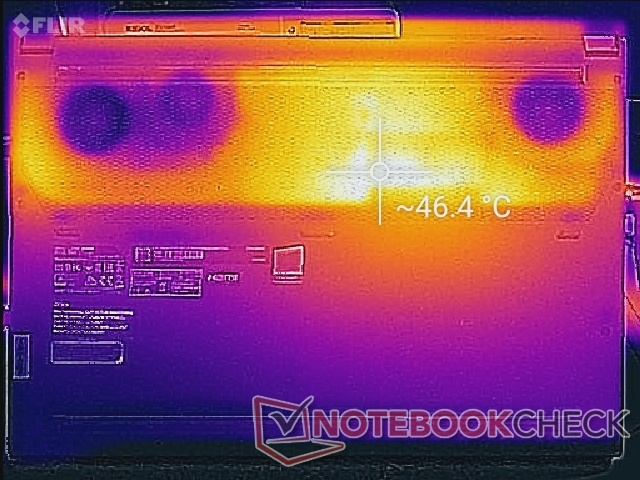
Temperatura
Las temperaturas de la superficie son más cálidas hacia el centro del teclado, donde pueden ser de 44 C a 48 C cuando están bajo cargas de procesamiento extremas. Los resultados son más fríos que los que grabamos en el Razer Blade 15 Studio, donde los puntos calientes y los apoyos de la palma pueden ser tan calientes como 60 C y 38 C, respectivamente. Los ventiladores más ruidosos de la MSI pueden ser en parte responsables de las menores temperaturas de la superficie en general cuando se comparan con la alternativa de Razer.
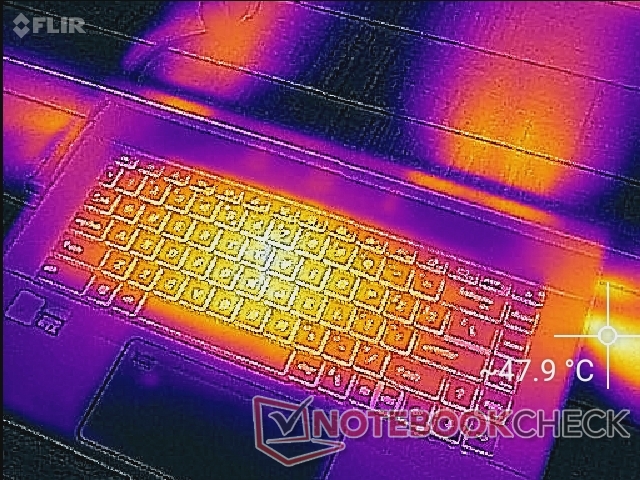
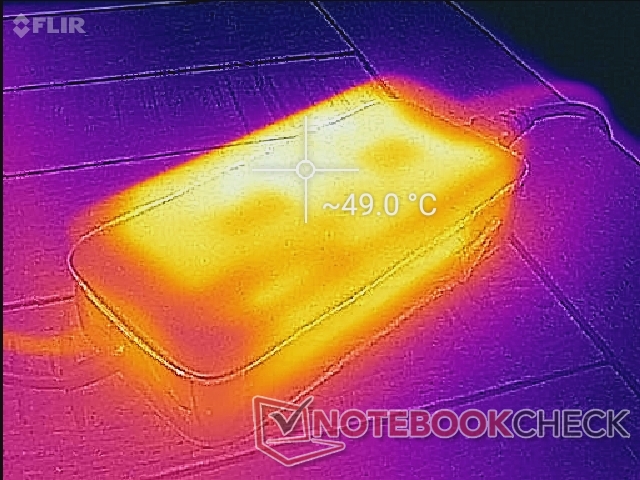
(±) La temperatura máxima en la parte superior es de 44.2 °C / 112 F, frente a la media de 38.2 °C / 101 F, que oscila entre 22.2 y 69.8 °C para la clase Workstation.
(-) El fondo se calienta hasta un máximo de 46.2 °C / 115 F, frente a la media de 41.1 °C / 106 F
(+) En reposo, la temperatura media de la parte superior es de 29 °C / 84# F, frente a la media del dispositivo de 32 °C / 90 F.
(±) Jugando a The Witcher 3, la temperatura media de la parte superior es de 36.8 °C / 98 F, frente a la media del dispositivo de 32 °C / 90 F.
(+) Los reposamanos y el panel táctil alcanzan como máximo la temperatura de la piel (32 °C / 89.6 F) y, por tanto, no están calientes.
(-) La temperatura media de la zona del reposamanos de dispositivos similares fue de 27.8 °C / 82 F (-4.2 °C / -7.6 F).
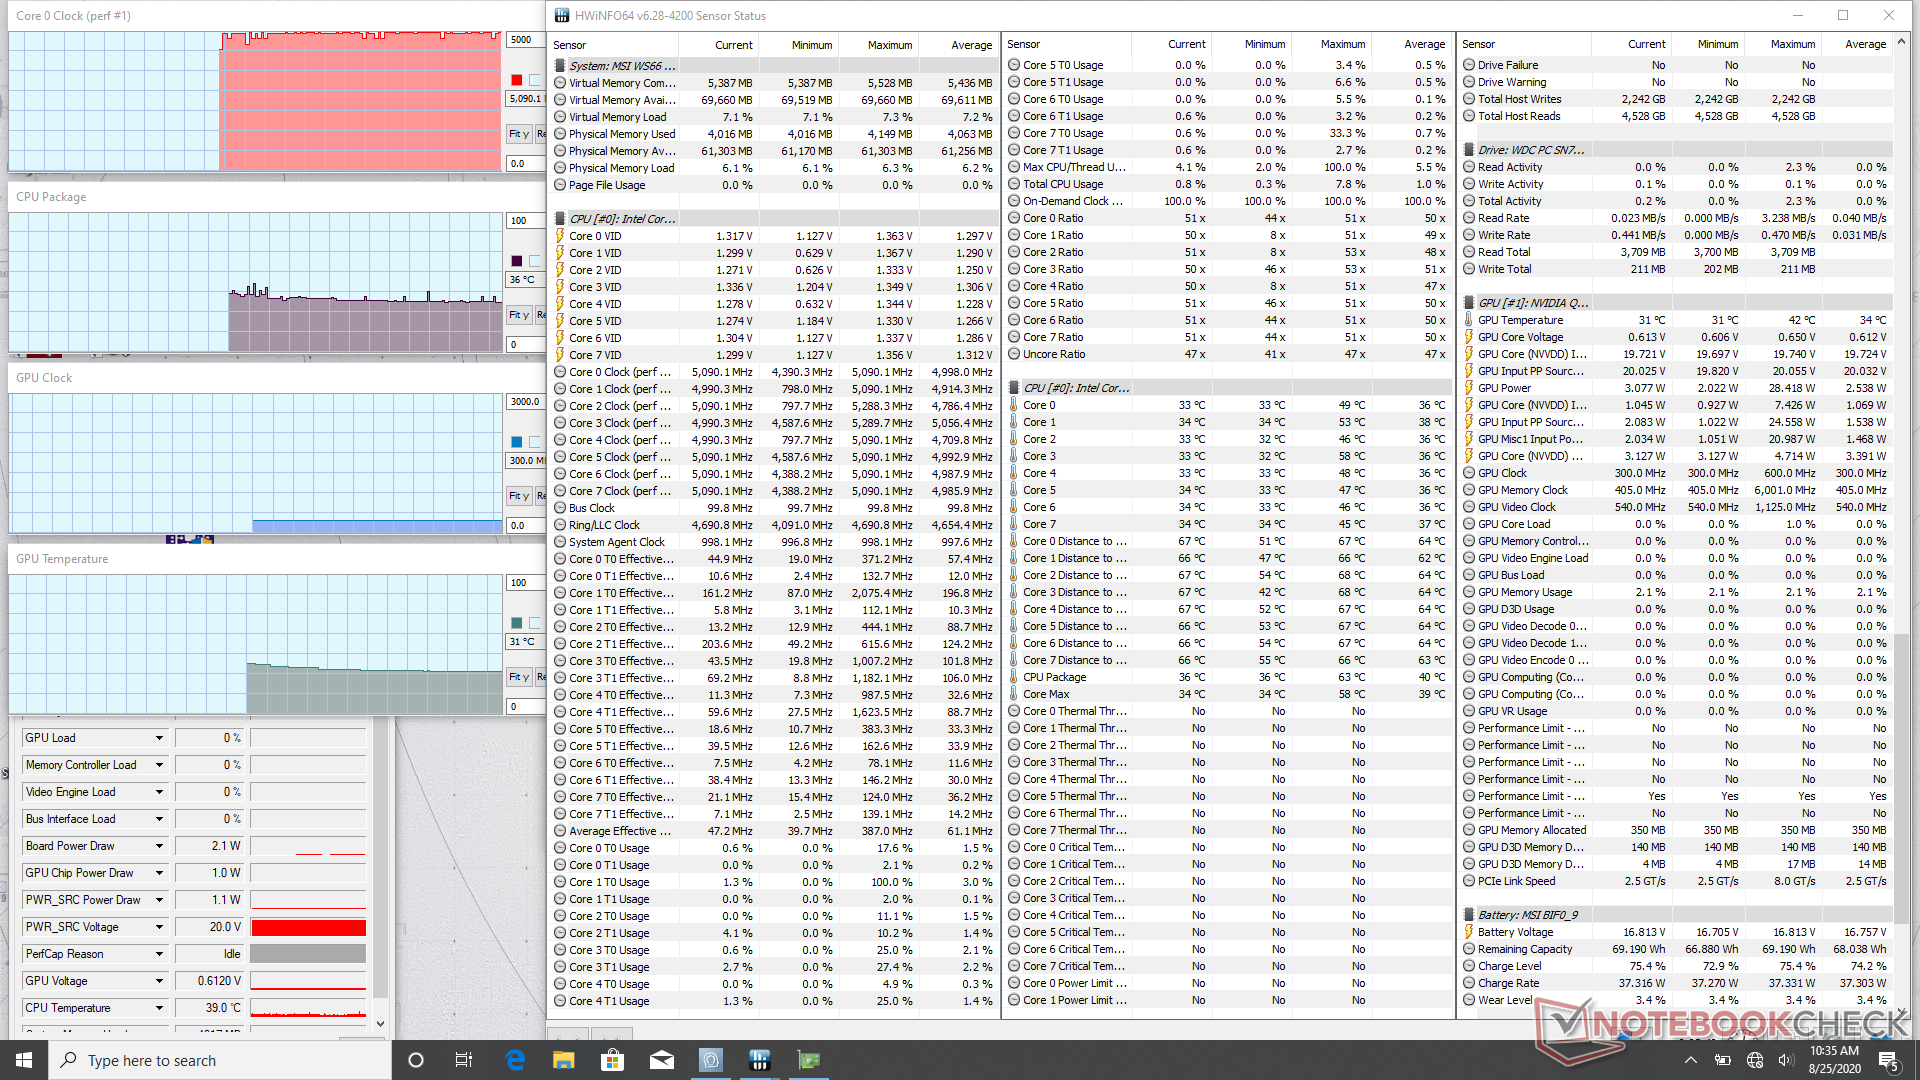
Prueba de estrés
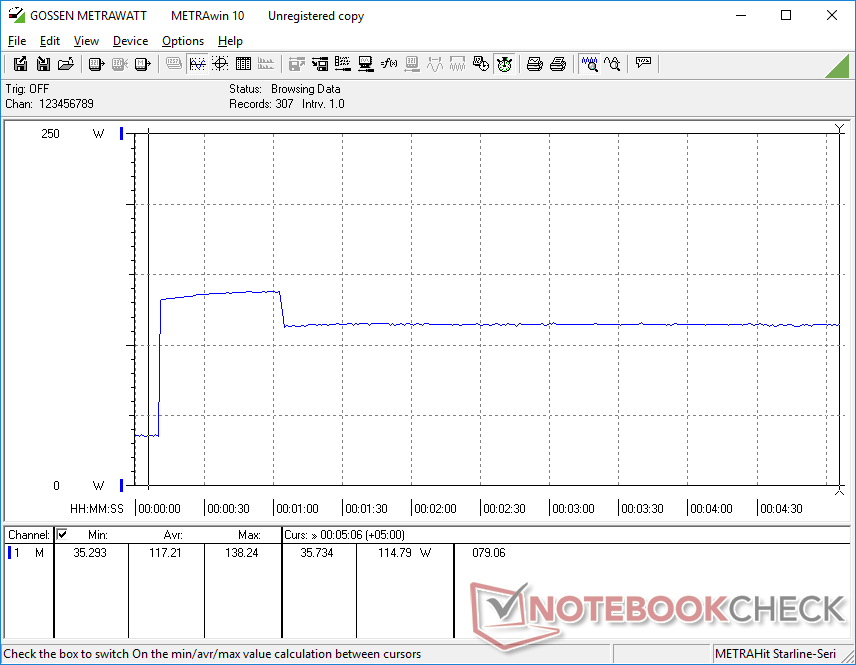
Cuando se ejecuta Prime95 para acentuar la CPU, las velocidades se elevan a 4,3 GHz durante aproximadamente un minuto hasta alcanzar una temperatura central de 84 C. Las velocidades bajan entonces a 3,9 GHz para mantener una temperatura central más fría de 74 C. Este comportamiento también se puede observar en nuestra sección de Consumo de energía a continuación.
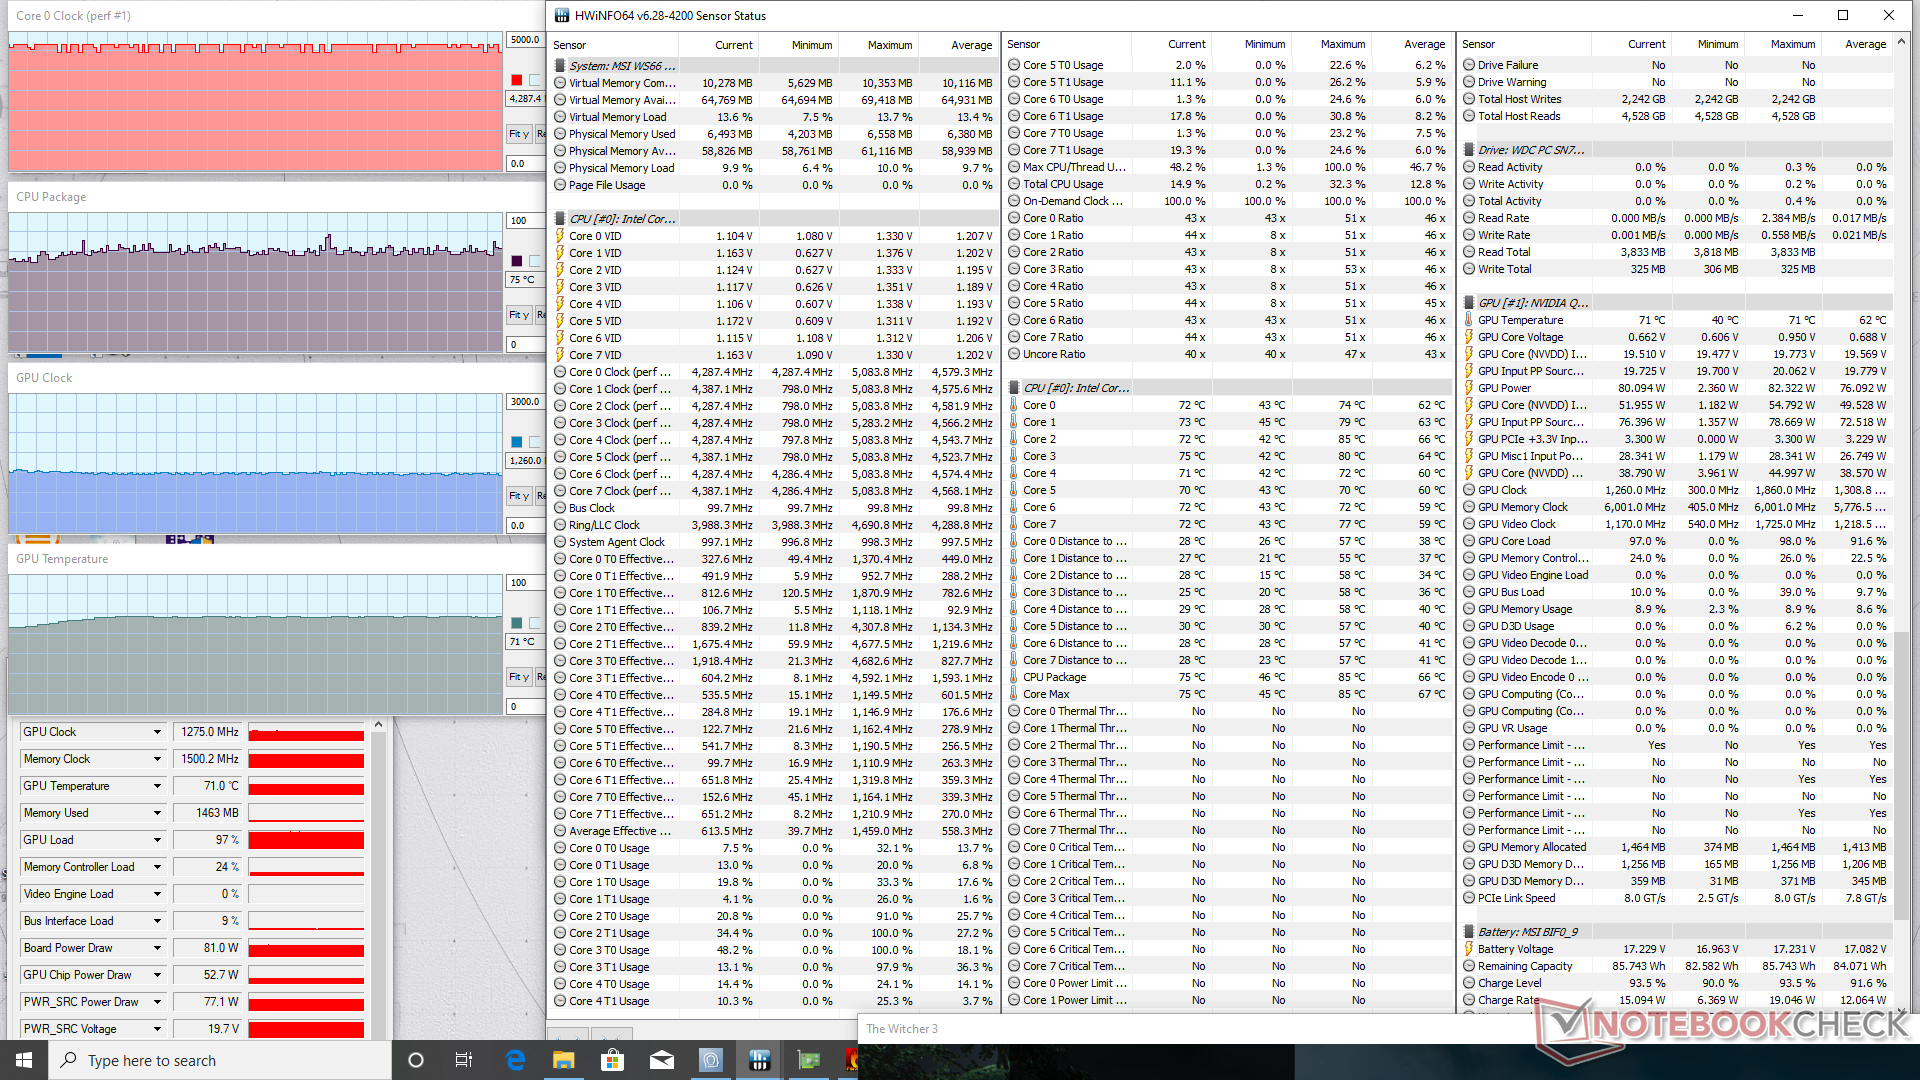
Si se activa la función Cooler Boost, se incrementarán ligeramente las velocidades de la CPU y la GPU y se reducirán las temperaturas del núcleo, tal como se muestra en la siguiente tabla. Cuando se ejecuta Witcher 3 con la función desactivada, por ejemplo, las temperaturas de la CPU y la GPU se establecerán en 75 C y 71 C, respectivamente, en comparación con 67 C y 60 C cuando la función está activada.
El funcionamiento con la energía de la batería limitará el rendimiento. Un Fire Strike ejecutado con baterías produciría puntuaciones en Física y Gráficos de 13238 y 5944 puntos, respectivamente, en comparación con los 22317 y 20164 puntos cuando está activado.
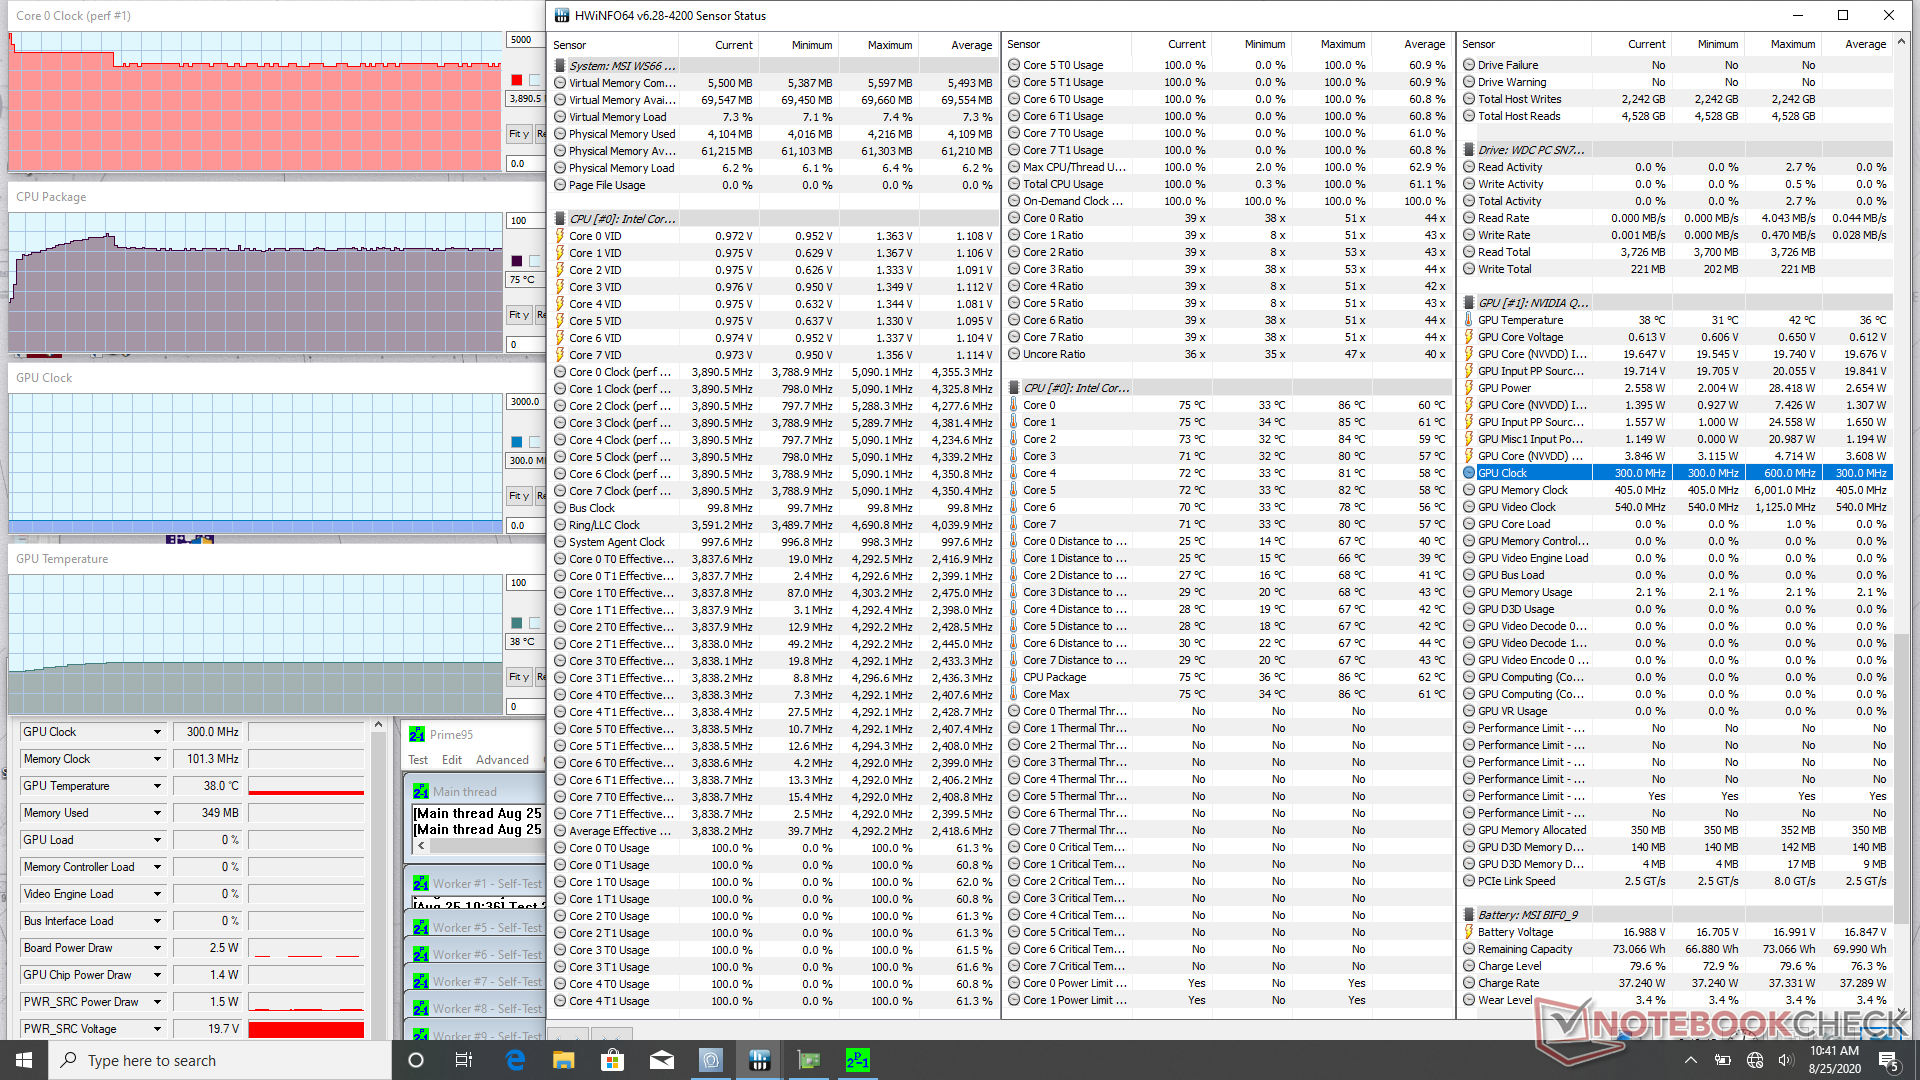
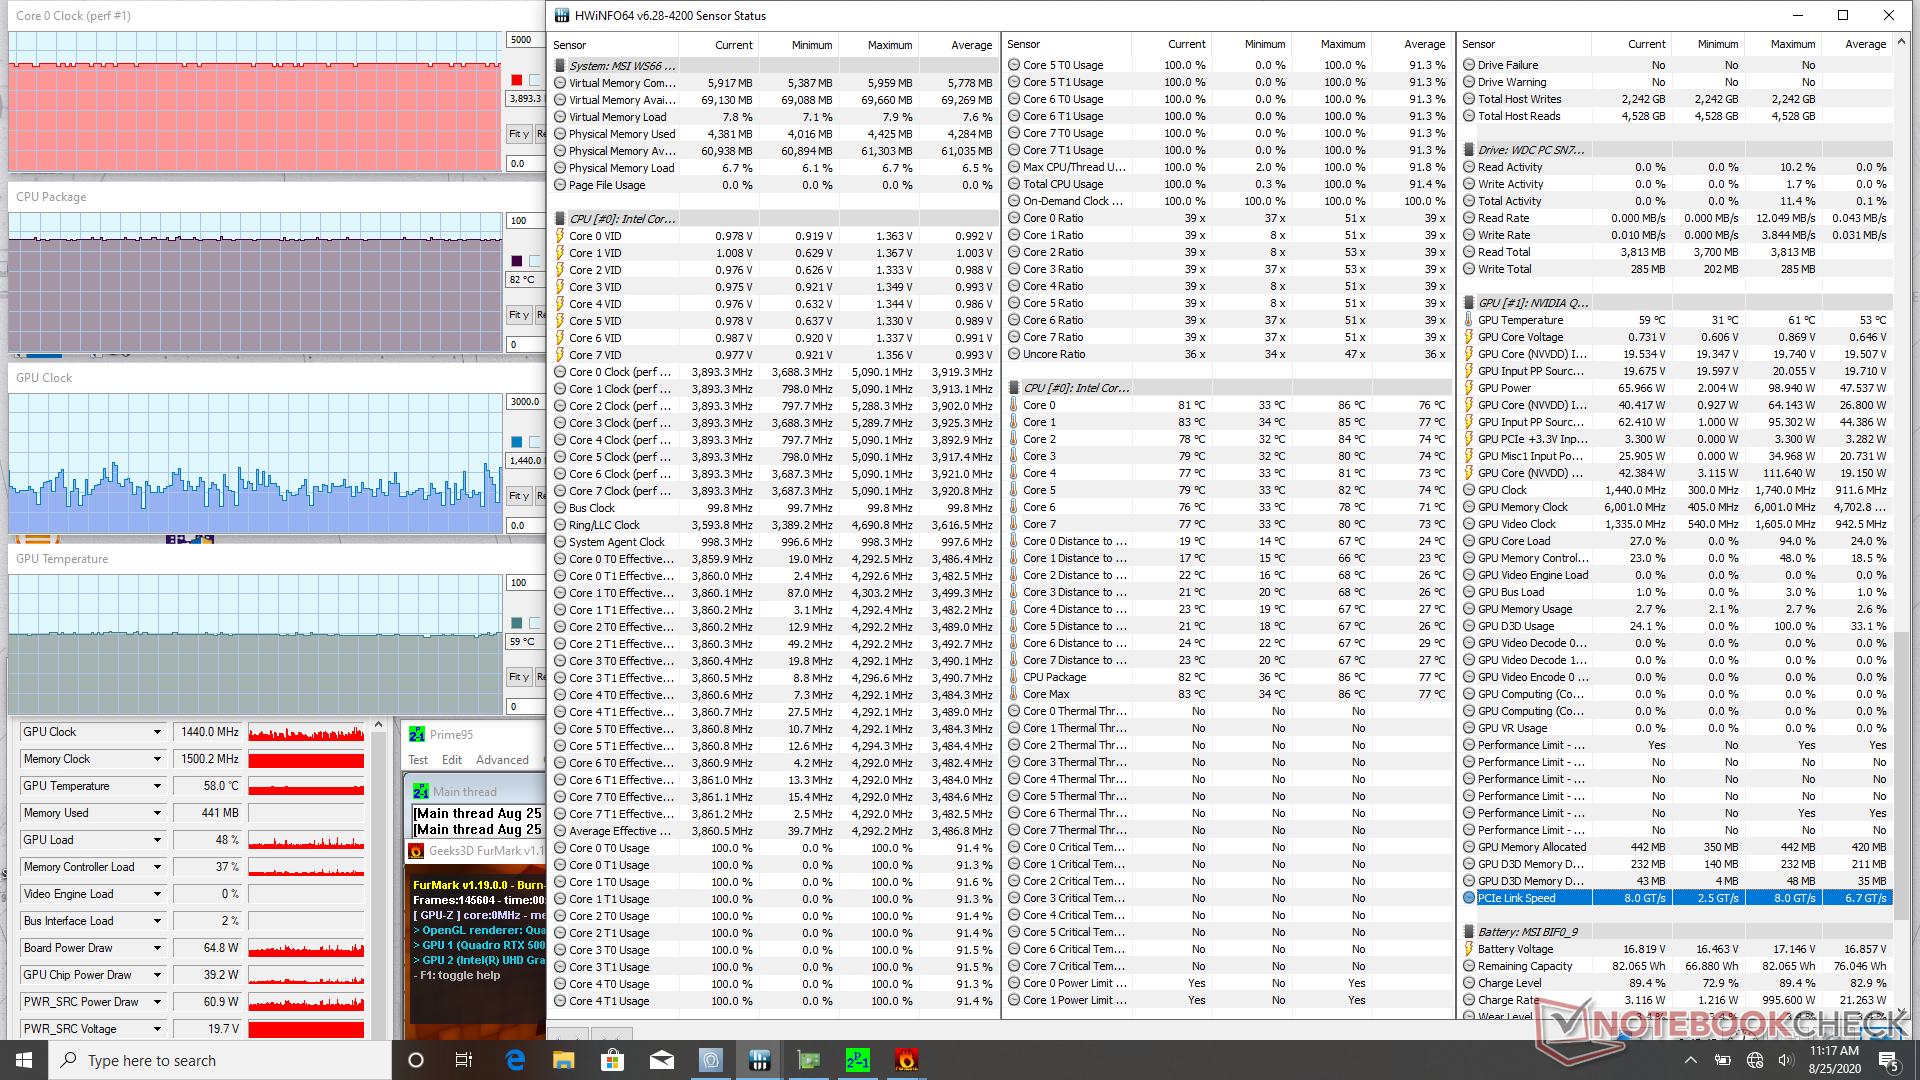
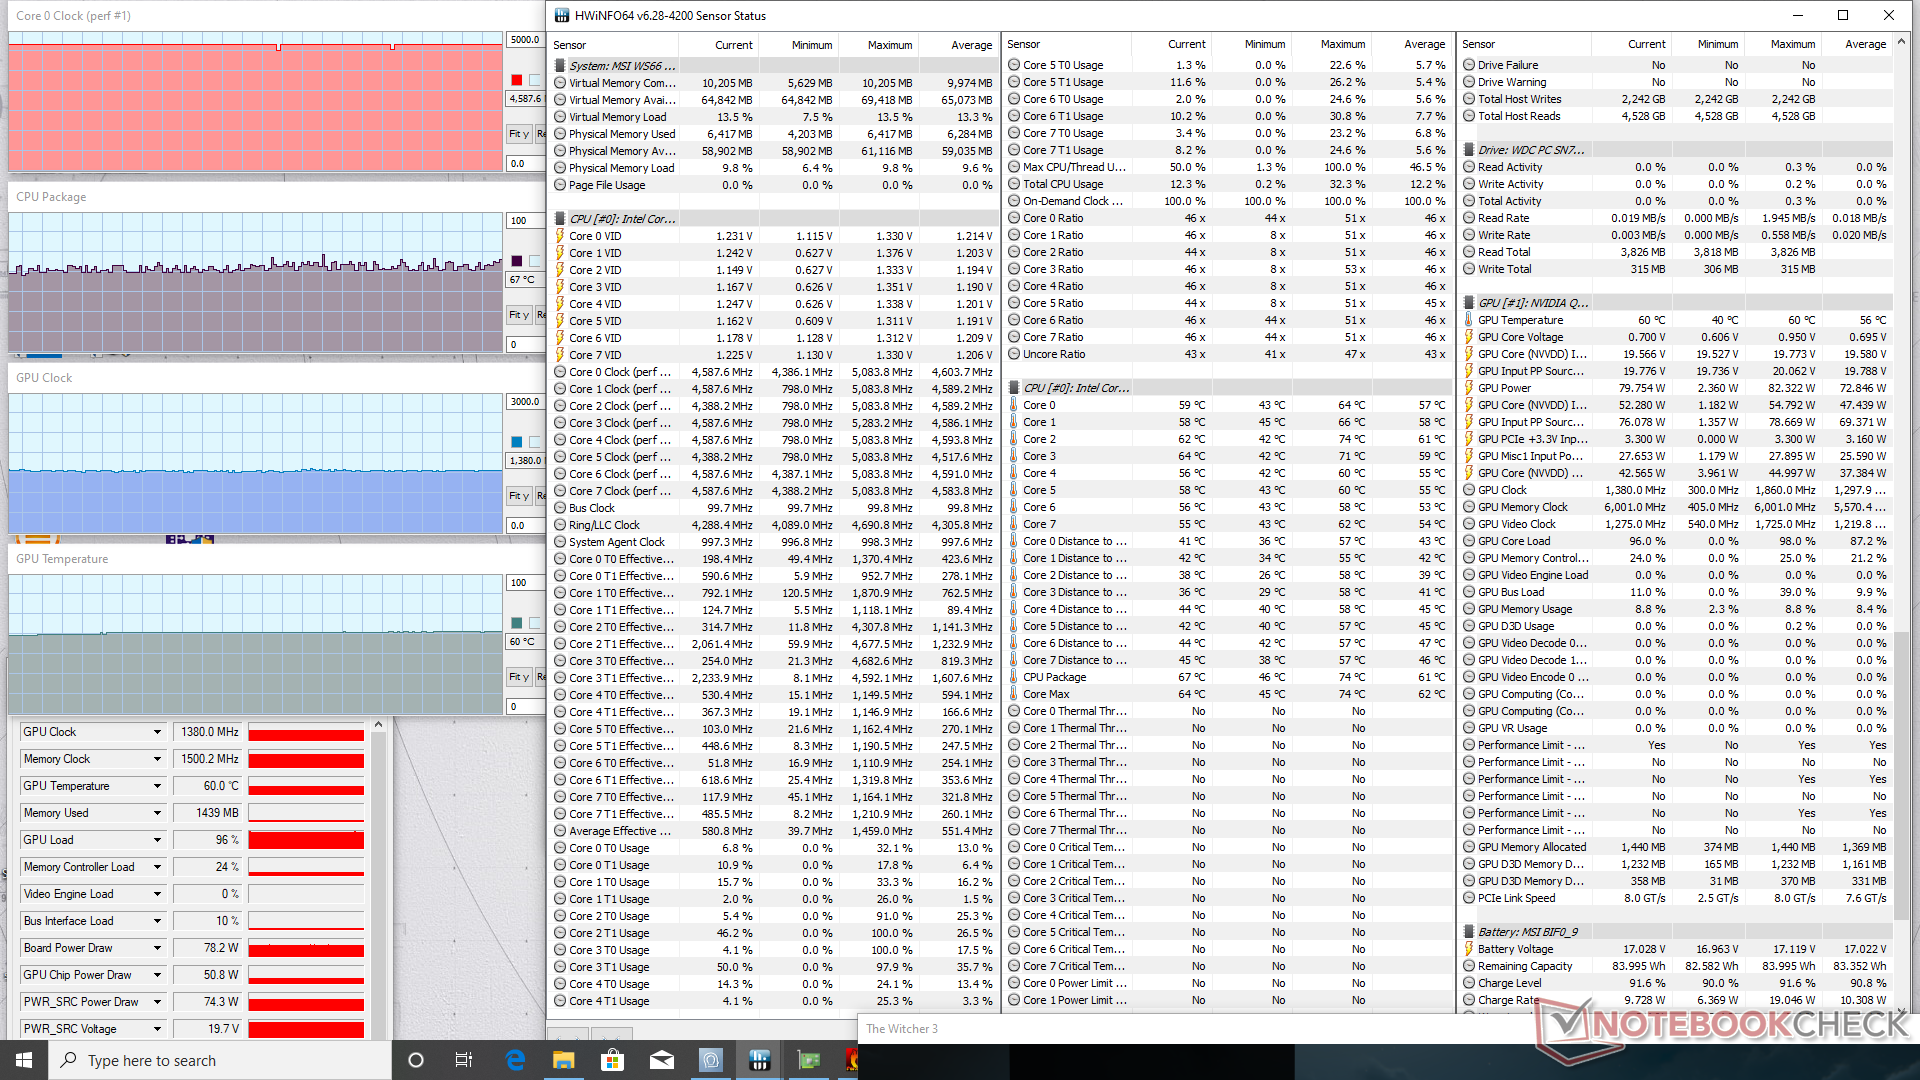
| CPU Clock (GHz) | GPU Clock (MHz) | Average CPU Temperature (°C) | Average GPU Temperature (°C) | |
| System Idle (Cooler Boost on) | -- | -- | 36 | 31 |
| Prime95 Stress (Cooler Boost on) | 3.8 - 3.9 | -- | 75 | 38 |
| Prime95 + FurMark Stress (Cooler Boost on) | 3.8 - 3.9 | ~500 - 1440 | 82 | 59 |
| Witcher 3 Stress (Cooler Boost off) | 4.3 - 4.4 | 1275 | 75 | 71 |
| Witcher 3 Stress (Cooler Boost on) | 4.6 | 1380 | 67 | 60 |
Altavoces


MSI WS66 10TMT-207US análisis de audio
(±) | la sonoridad del altavoz es media pero buena (80.5 dB)
Graves 100 - 315 Hz
(-) | casi sin bajos - de media 22.6% inferior a la mediana
(±) | la linealidad de los graves es media (9.8% delta a frecuencia anterior)
Medios 400 - 2000 Hz
(±) | medias más altas - de media 7.5% más altas que la mediana
(±) | la linealidad de los medios es media (11.7% delta respecto a la frecuencia anterior)
Altos 2 - 16 kHz
(+) | máximos equilibrados - a sólo 3.4% de la mediana
(±) | la linealidad de los máximos es media (8.5% delta a frecuencia anterior)
Total 100 - 16.000 Hz
(±) | la linealidad del sonido global es media (26.1% de diferencia con la mediana)
En comparación con la misma clase
» 88% de todos los dispositivos probados de esta clase eran mejores, 6% similares, 6% peores
» El mejor tuvo un delta de 7%, la media fue 17%, el peor fue ###max##%
En comparación con todos los dispositivos probados
» 80% de todos los dispositivos probados eran mejores, 4% similares, 16% peores
» El mejor tuvo un delta de 4%, la media fue 24%, el peor fue ###max##%
Apple MacBook 12 (Early 2016) 1.1 GHz análisis de audio
(+) | los altavoces pueden reproducir a un volumen relativamente alto (#83.6 dB)
Graves 100 - 315 Hz
(±) | lubina reducida - en promedio 11.3% inferior a la mediana
(±) | la linealidad de los graves es media (14.2% delta a frecuencia anterior)
Medios 400 - 2000 Hz
(+) | medios equilibrados - a sólo 2.4% de la mediana
(+) | los medios son lineales (5.5% delta a la frecuencia anterior)
Altos 2 - 16 kHz
(+) | máximos equilibrados - a sólo 2% de la mediana
(+) | los máximos son lineales (4.5% delta a la frecuencia anterior)
Total 100 - 16.000 Hz
(+) | el sonido global es lineal (10.2% de diferencia con la mediana)
En comparación con la misma clase
» 7% de todos los dispositivos probados de esta clase eran mejores, 2% similares, 91% peores
» El mejor tuvo un delta de 5%, la media fue 18%, el peor fue ###max##%
En comparación con todos los dispositivos probados
» 5% de todos los dispositivos probados eran mejores, 1% similares, 94% peores
» El mejor tuvo un delta de 4%, la media fue 24%, el peor fue ###max##%
Gestión de la energía
Consumo de energía
Si el brillo se ajusta al máximo, éste salta a 19 W. El modo de aumento del rendimiento del refrigerador de ultra rendimiento consume 42 W como mínimo, lo que significa que no es el modo ideal para tareas sencillas como la transmisión de vídeo o el correo electrónico.
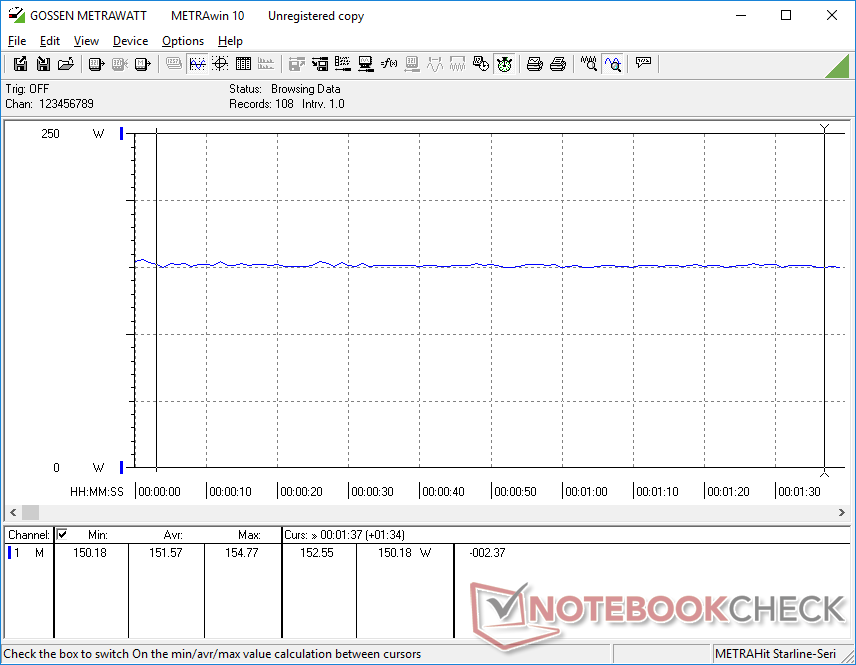
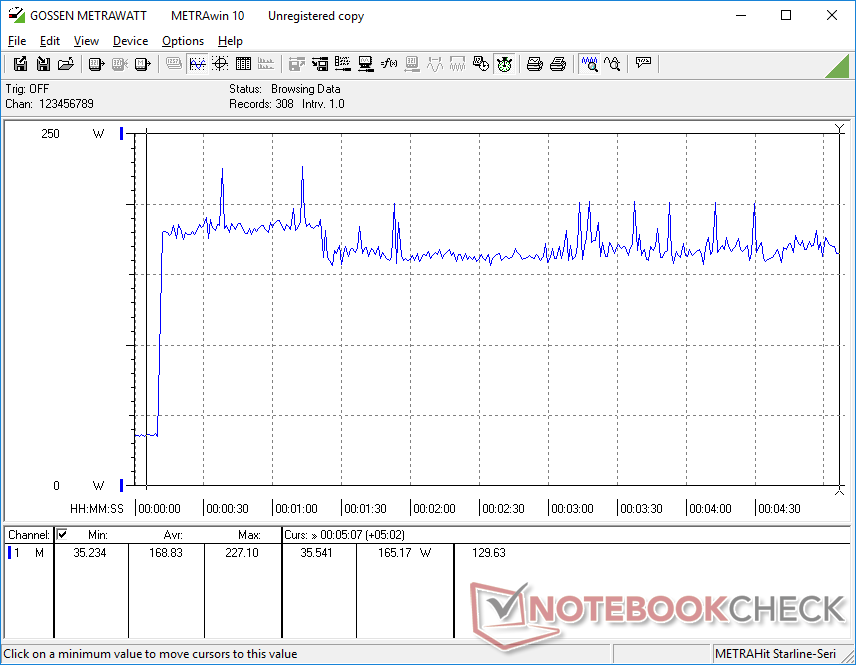
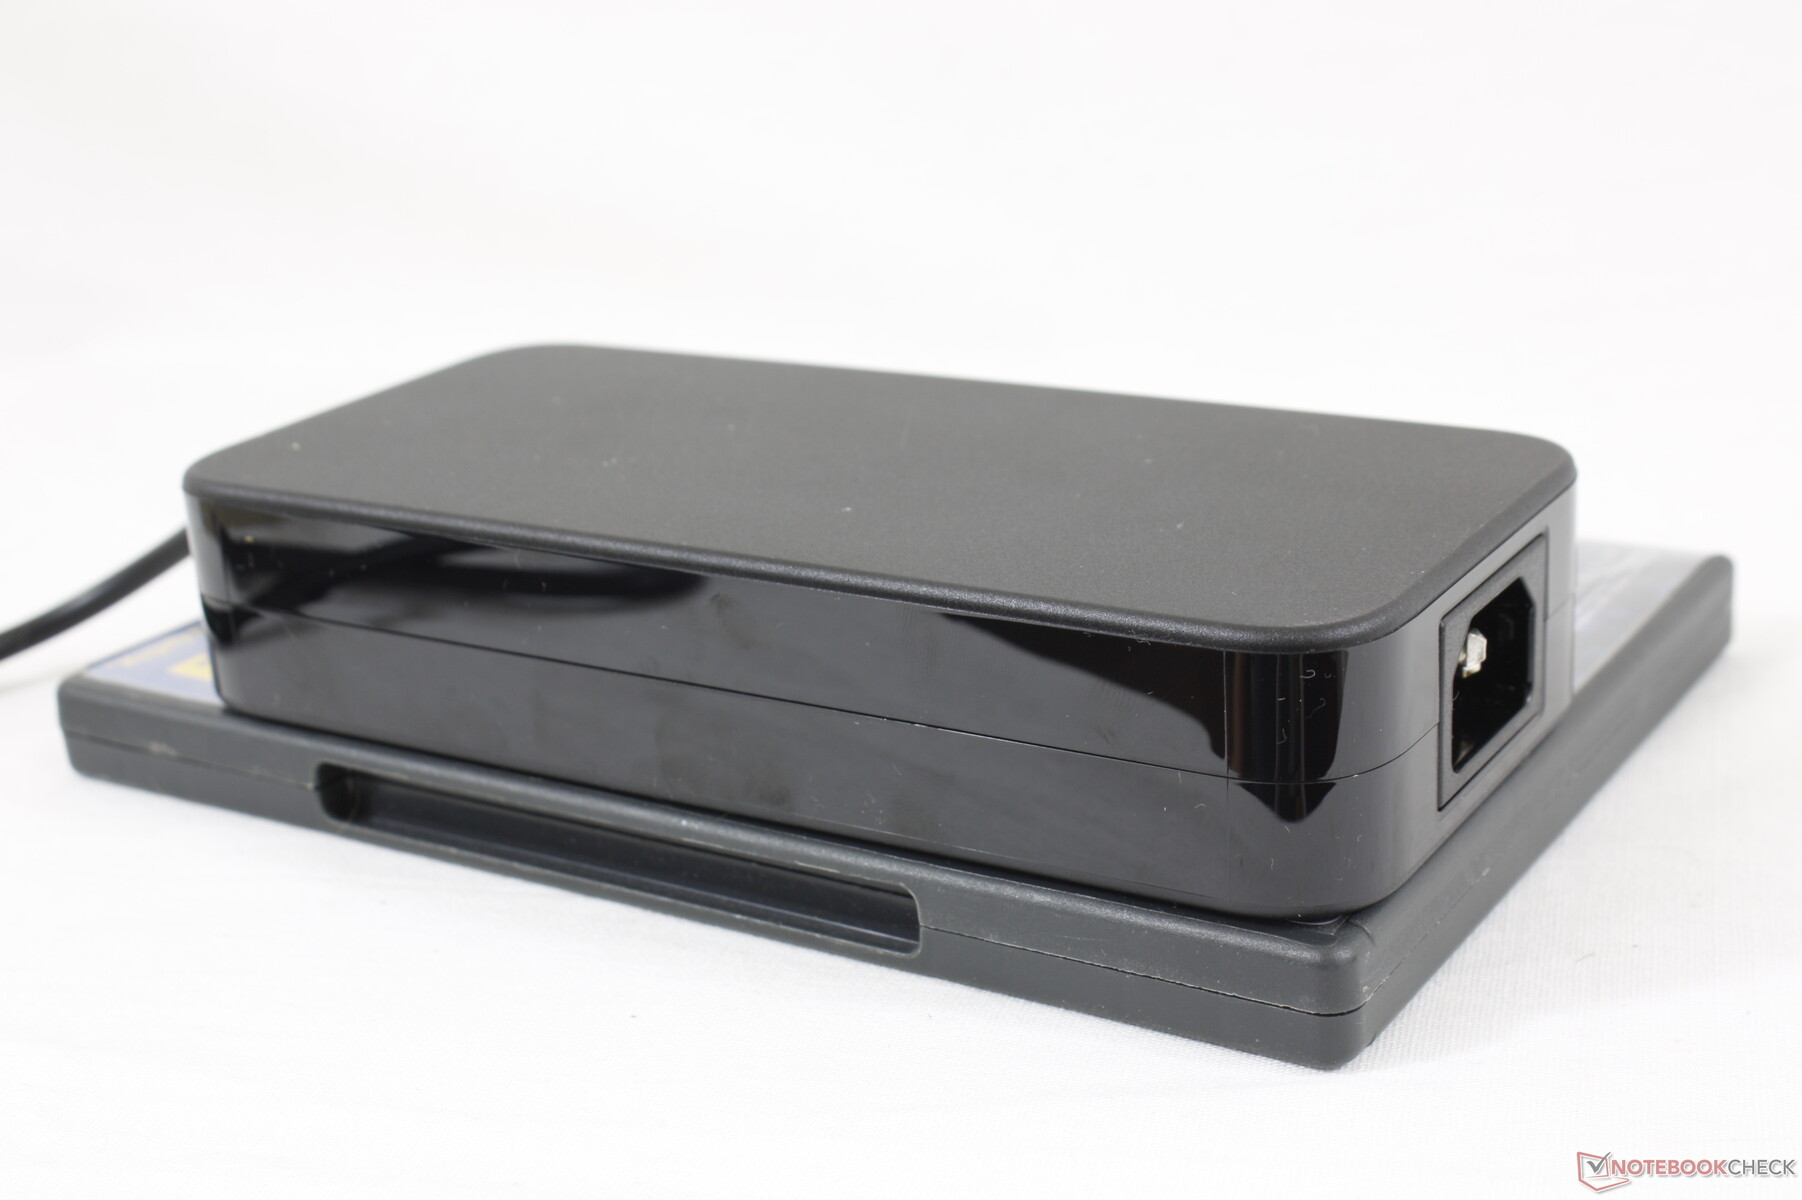
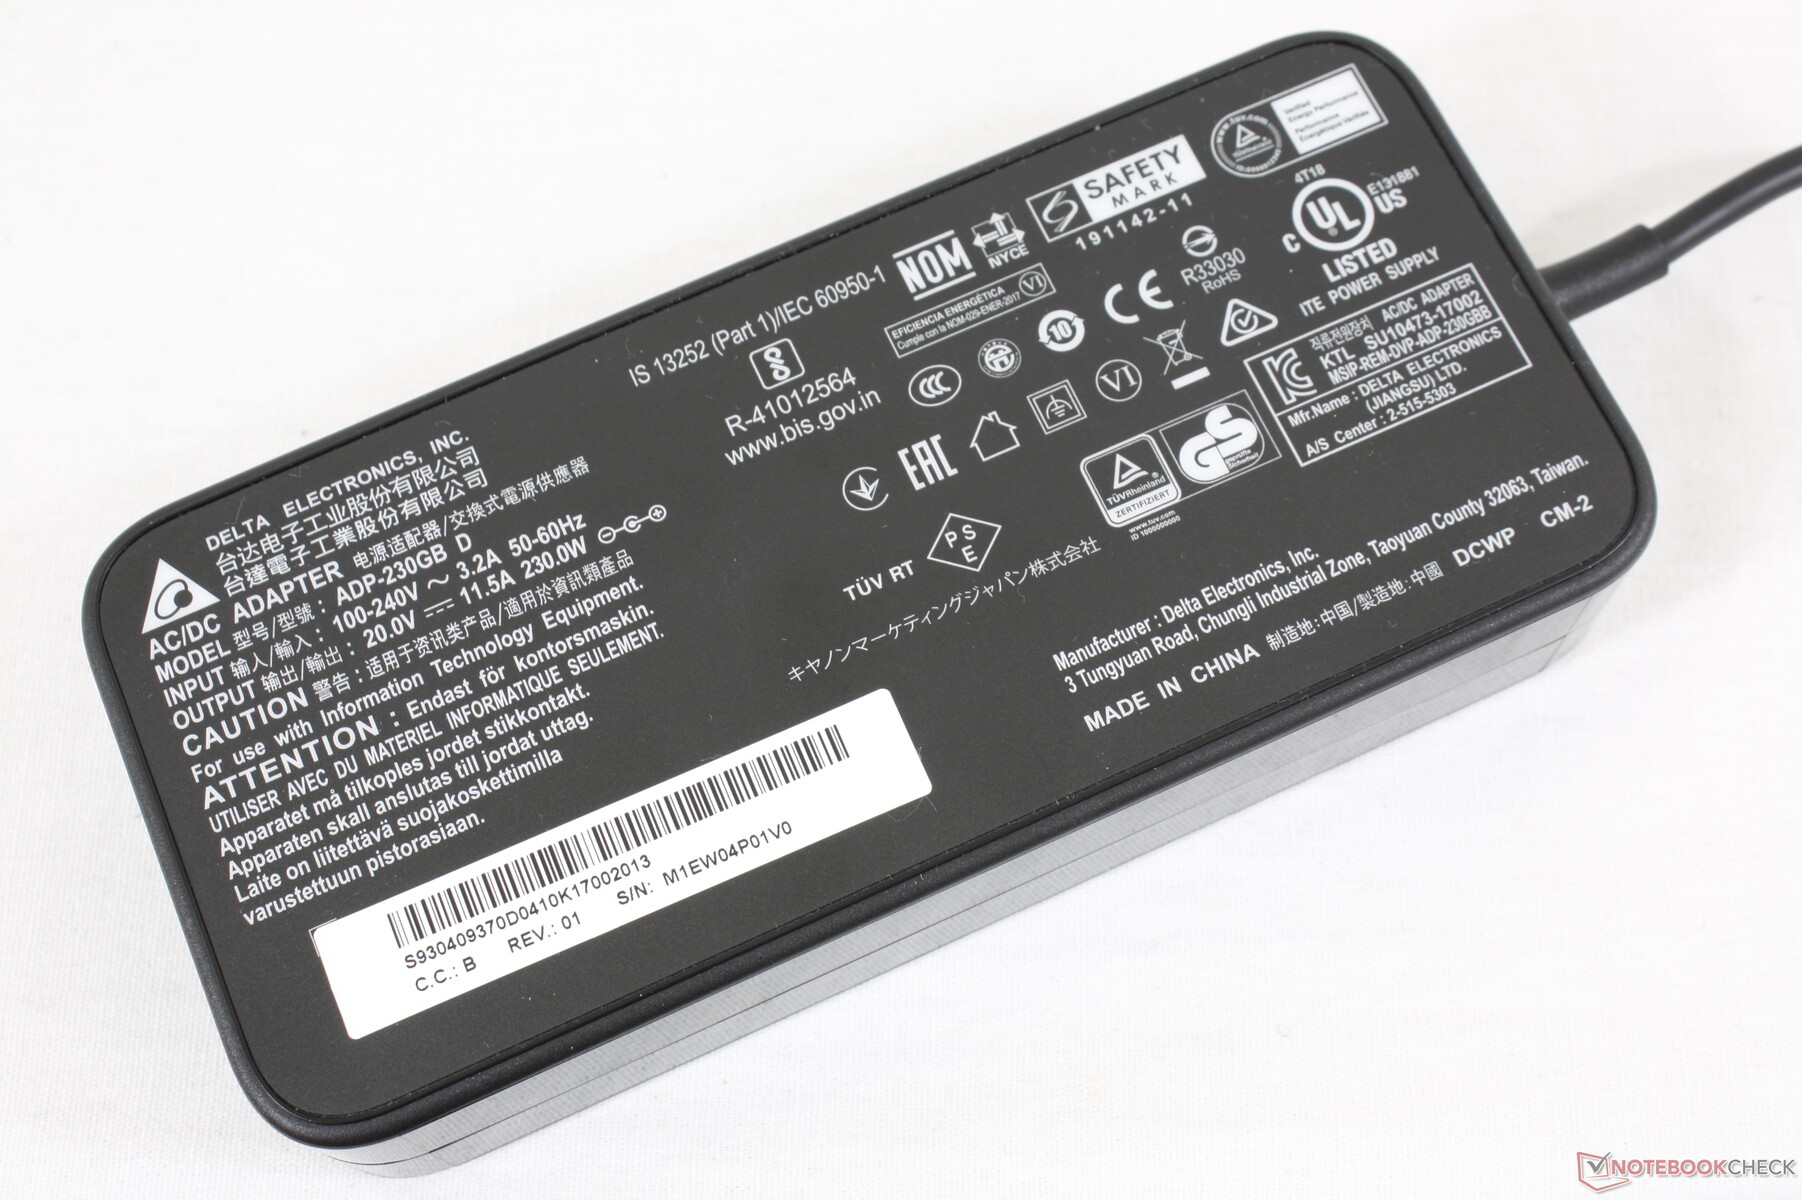
Ejecutar cargas estresantes como los juegos consumirá unos 152 W para ser similar a lo que grabamos en el Dell Precision 7550 o en el Razer Blade 15 Studio, cada uno equipado con la misma GPU Quadro RTX 5000 Max-Q. Somos capaces de grabar picos temporales de hasta 227 W desde el adaptador de CA de 230 W de tamaño medio (16,4 x 7,5 x 3,4 cm) cuando tanto la CPU como la GPU están al 100% de utilización. El consumo medio siempre será mucho menor, lo que significa que el portátil puede seguir recargándose a un ritmo decente incluso cuando se ejecutan cargas extremas, a diferencia del Precision 5750.

| Off / Standby | |
| Ocioso | |
| Carga |
|
Clave:
min: | |
| MSI WS66 10TMT-207US i9-10980HK, Quadro RTX 5000 Max-Q, WDC PC SN730 SDBPNTY-1T00, IPS, 1920x1080, 15.6" | Dell Precision 7550 W-10885M, Quadro RTX 5000 Max-Q, SK Hynix PC601A NVMe 1TB, IPS, 3840x2160, 15.6" | Dell Precision 5550 P91F i7-10875H, Quadro T2000 Max-Q, SK Hynix PC601A NVMe 1TB, IPS, 3840x2400, 15.6" | Razer Blade 15 Studio Edition 2020 i7-10875H, Quadro RTX 5000 Max-Q, Samsung PM981a MZVLB1T0HBLR, OLED, 3840x2160, 15.6" | MSI WS63VR 7RL-023US i7-7700HQ, Quadro P4000 Max-Q, Toshiba NVMe THNSN5512GPU7, IPS, 3840x2160, 15.6" | Acer ConceptD 3 Pro CN315-71P-73W1 i7-9750H, Quadro T1000 (Laptop), WDC PC SN720 SDAPNTW-512G, IPS, 1920x1080, 15.6" | |
|---|---|---|---|---|---|---|
| Power Consumption | 13% | 40% | 12% | 29% | 58% | |
| Idle Minimum * (Watt) | 13.8 | 8.2 41% | 5.6 59% | 13.4 3% | 13.3 4% | 2.9 79% |
| Idle Average * (Watt) | 18.4 | 16.8 9% | 11.2 39% | 18 2% | 17.2 7% | 5.5 70% |
| Idle Maximum * (Watt) | 41.5 | 24.4 41% | 18.4 56% | 26.1 37% | 17.9 57% | 10.6 74% |
| Load Average * (Watt) | 110.5 | 131 -19% | 114 -3% | 115 -4% | 83.7 24% | 86 22% |
| Witcher 3 ultra * (Watt) | 151.6 | 156.6 -3% | 76.7 49% | 145 4% | 101.9 33% | 83 45% |
| Load Maximum * (Watt) | 227.1 | 201.8 11% | 134.2 41% | 165 27% | 114.3 50% | 100.7 56% |
* ... más pequeño es mejor
Duración de la batería
La duración de la navegación por la web es de apenas 8 horas, incluso si se ajusta al perfil de energía de la Superbatería de MSI. Cargar la gran batería de 99,99 Wh de vacío a lleno lleva unas 2 horas.
El sistema también puede recargarse a través del puerto USB-C en el borde izquierdo solamente.
| MSI WS66 10TMT-207US i9-10980HK, Quadro RTX 5000 Max-Q, 99.99 Wh | Dell Precision 7550 W-10885M, Quadro RTX 5000 Max-Q, 95 Wh | Dell Precision 5550 P91F i7-10875H, Quadro T2000 Max-Q, 86 Wh | Razer Blade 15 Studio Edition 2020 i7-10875H, Quadro RTX 5000 Max-Q, 80 Wh | MSI WS63VR 7RL-023US i7-7700HQ, Quadro P4000 Max-Q, 48 Wh | Acer ConceptD 3 Pro CN315-71P-73W1 i7-9750H, Quadro T1000 (Laptop), 58.7 Wh | |
|---|---|---|---|---|---|---|
| Duración de Batería | 10% | 68% | 15% | -47% | 4% | |
| Reader / Idle (h) | 8.3 | 11.1 34% | 22.6 172% | 8.8 6% | 3.9 -53% | |
| WiFi v1.3 (h) | 7.8 | 8.9 14% | 9 15% | 5.7 -27% | 2.9 -63% | 8.1 4% |
| Load (h) | 1.2 | 1 -17% | 1.4 17% | 2 67% | 0.9 -25% |
Pro
Contra
Veredicto
Si quieres el rendimiento más rápido posible de un diseño de chasis superfino, entonces el MSI WS66 no te decepcionará. Su CPU Core i9 es consistentemente más rápido que el Razer Blade 15 Studio, especialmente porque este último se limita a un Core i7.
La mentalidad de "rendimiento a toda costa" del WS66 tiene su justa parte de desventajas. Lo más notable es que el ruido del ventilador es significativamente más fuerte que el mencionado Razer y la mayoría de las otras estaciones de trabajo. Además, los orígenes del juego del WS66 ultra-delgado significan que el sistema excluye muchas de las características básicas que llevan las estaciones de trabajo tradicionales. Tendrás que mirar modelos más voluminosos como el Dell Precision 7550, Lenovo ThinkPad P53, o HP ZBook 15 si las características como los lectores de tarjetas inteligentes, la amplia gama de colores, los botones del ratón, las teclas NumPad, NFC, SIM, o las opciones de panel mate son importantes para tu línea de trabajo
El MSI WS66 está enfocado a maximizar el rendimiento para ser más rápido de lo que su delgado diseño podría sugerir. Las características auxiliares consiguen el extremo corto del palo y el ruido del ventilador será muy alto si quieres sacar el máximo provecho del sistema.
MSI WS66 10TMT-207US
- 08/30/2020 v7 (old)
Allen Ngo
Price comparison
