Análisis del portátil MSI Prestige 15: Deslumbrante calidad de imagen 4K, sólido rendimiento

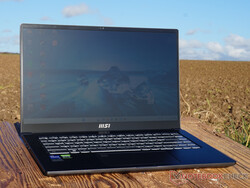
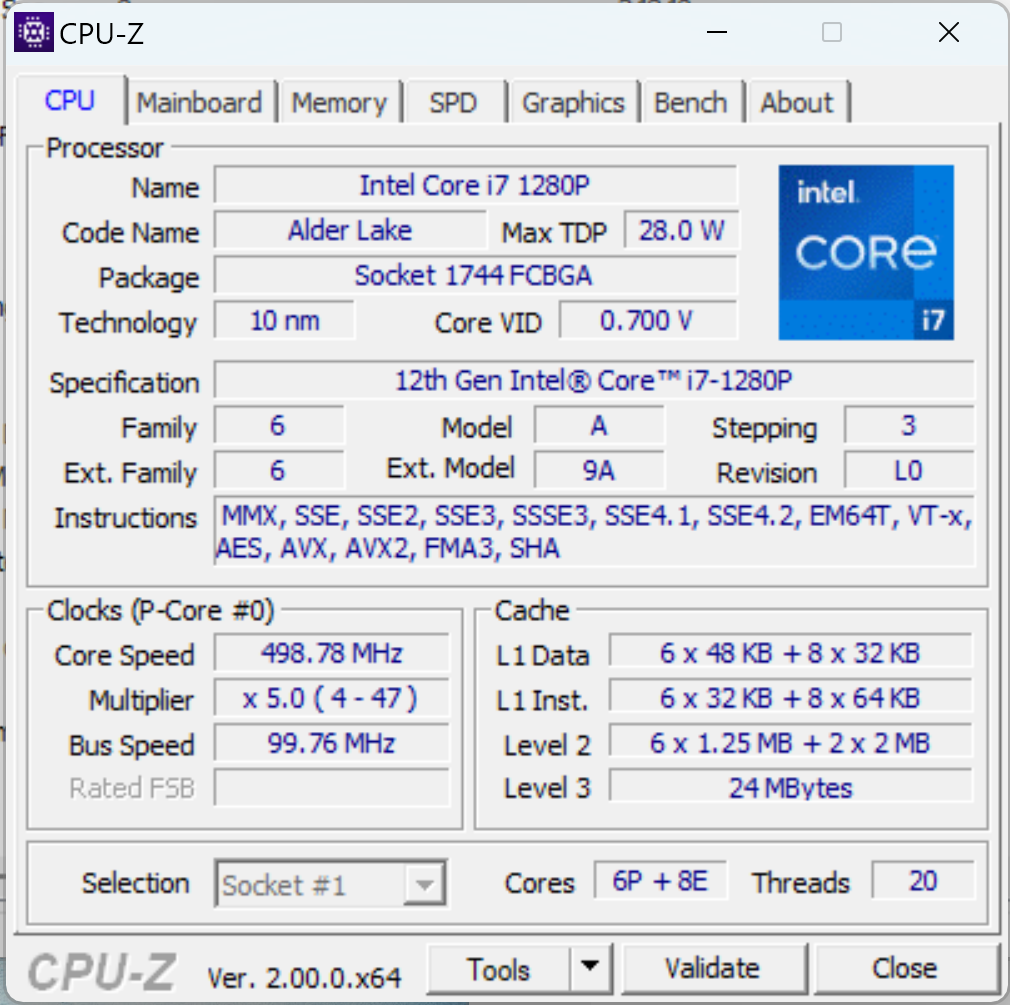
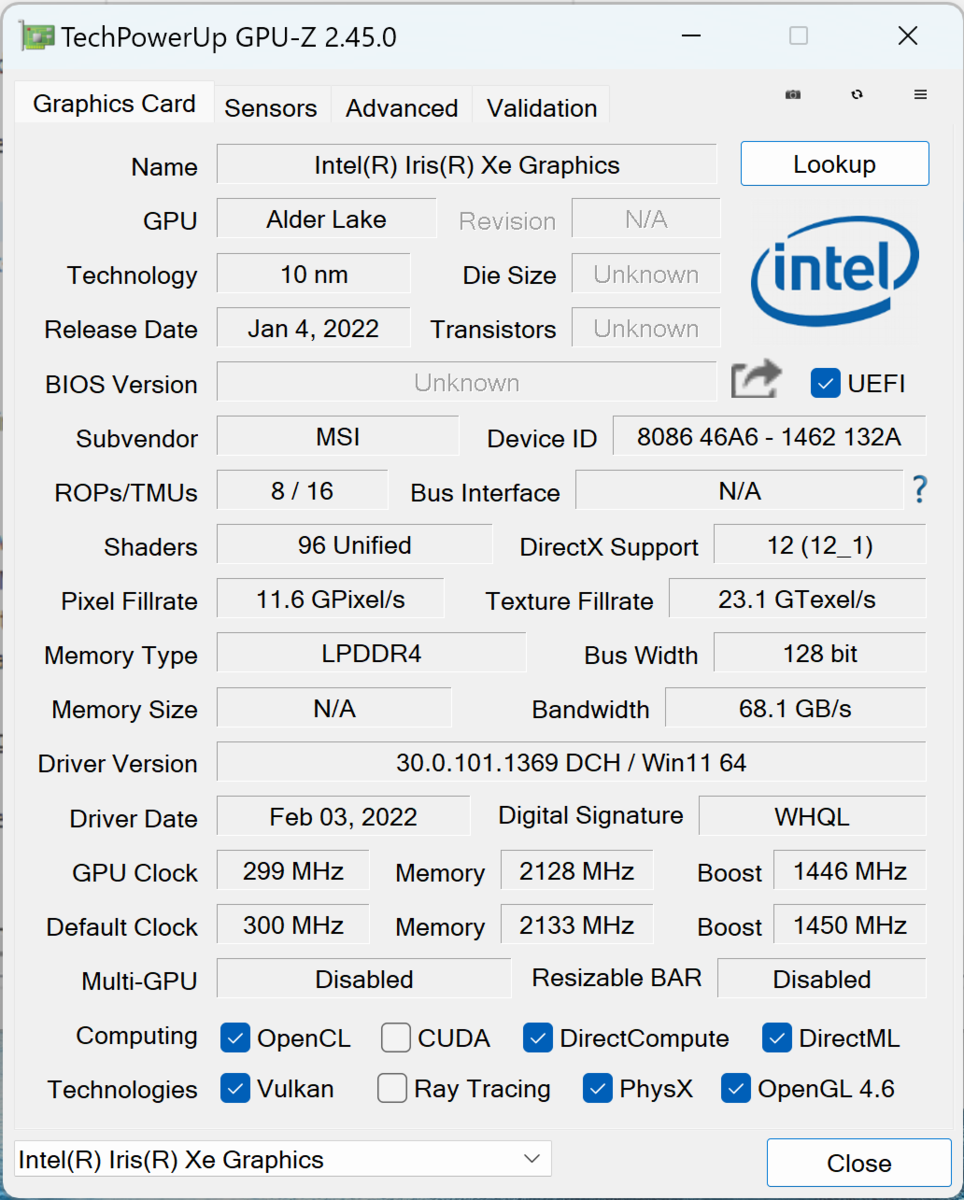
El MSI Prestige 15 A12UD-093 parece hecho para tareas gráficamente exigentes. Su pantalla 4K con AdobeRGB ofrece imágenes detalladas con los colores más reales posibles, de modo que las fotografías digitales de alta calidad se pueden ver, modificar y optimizar sin necesidad de un monitor externo. Un procesador Intel Alder Lake de la serie "P", uni7-1280P en este caso, proporciona suficiente potencia de cálculo para todas las tareas. De las tareas gráficamente intensivas se encarga la Nvidia GeForce RTX 3050 Ti.
Al mismo tiempo, MSI se ha asegurado de que no se produzcan los típicos problemas asociados a una configuración demasiado potente con un chip gráfico independiente. Se ha limitado el consumo de energía, lo que se traduce en una larga duración de la batería, un ruido mínimo del ventilador y un calentamiento limitado. El trabajo silencioso y concentrado tiene prioridad sobre los valores de rendimiento puro.
Además del modelo analizado, también hay otras variantes que sólo ofrecen una pantalla Full HD con un espacio de color menor. En este caso, sí que sería necesario un monitor externo para la edición profesional de imágenes. Además, el más débil y aún más económico Intel Core i5-1240Ppuede ser elegido en lugar del i7-1280P.
En cuanto a la creación de contenidos, la edición de medios y demás, la competencia es feroz. ElAcer Swift X SFX16 con el Intel Arc A370M, el Asus Vivobook Pro 16X OLED o el Schenker Vision 14 todos ellos ofrecen valores de rendimiento menores o mayores, pero también pretenden ofrecer una rápida edición de vídeo e imágenes.
Posibles contendientes en la comparación
Valoración | Fecha | Modelo | Peso | Altura | Tamaño | Resolución | Precio |
|---|---|---|---|---|---|---|---|
| 85.4 % v7 (old) | 12/2022 | MSI Prestige 15 A12UD-093 i7-1280P, GeForce RTX 3050 Ti Laptop GPU | 1.8 kg | 20.1 mm | 15.60" | 3840x2160 | |
| 89.5 % v7 (old) | 05/2022 | Dell XPS 15 9520 RTX 3050 Ti i7-12700H, GeForce RTX 3050 Ti Laptop GPU | 1.9 kg | 18 mm | 15.60" | 3456x2160 | |
| 88.8 % v7 (old) | 10/2022 | Schenker Vision 14 2022 RTX 3050 Ti i7-12700H, GeForce RTX 3050 Ti Laptop GPU | 1.3 kg | 16.6 mm | 14.00" | 2880x1800 | |
| 86.4 % v7 (old) | 11/2022 | Acer Swift X SFX16-52G-77RX i7-1260P, A370M | 1.8 kg | 21.2 mm | 16.00" | 2560x1600 | |
| 83.7 % v7 (old) | 11/2022 | Asus VivoBook Pro 16X OLED N7600PC-L2026X i7-11370H, GeForce RTX 3050 4GB Laptop GPU | 2 kg | 18.9 mm | 16.00" | 3840x2400 | |
| 79.8 % v7 (old) | 08/2022 | Samsung Galaxy Book2 15 i7-1260P, A350M | 1.6 kg | 15 mm | 15.60" | 1920x1080 |
Caso - La Prestige 15 causa una gran impresión
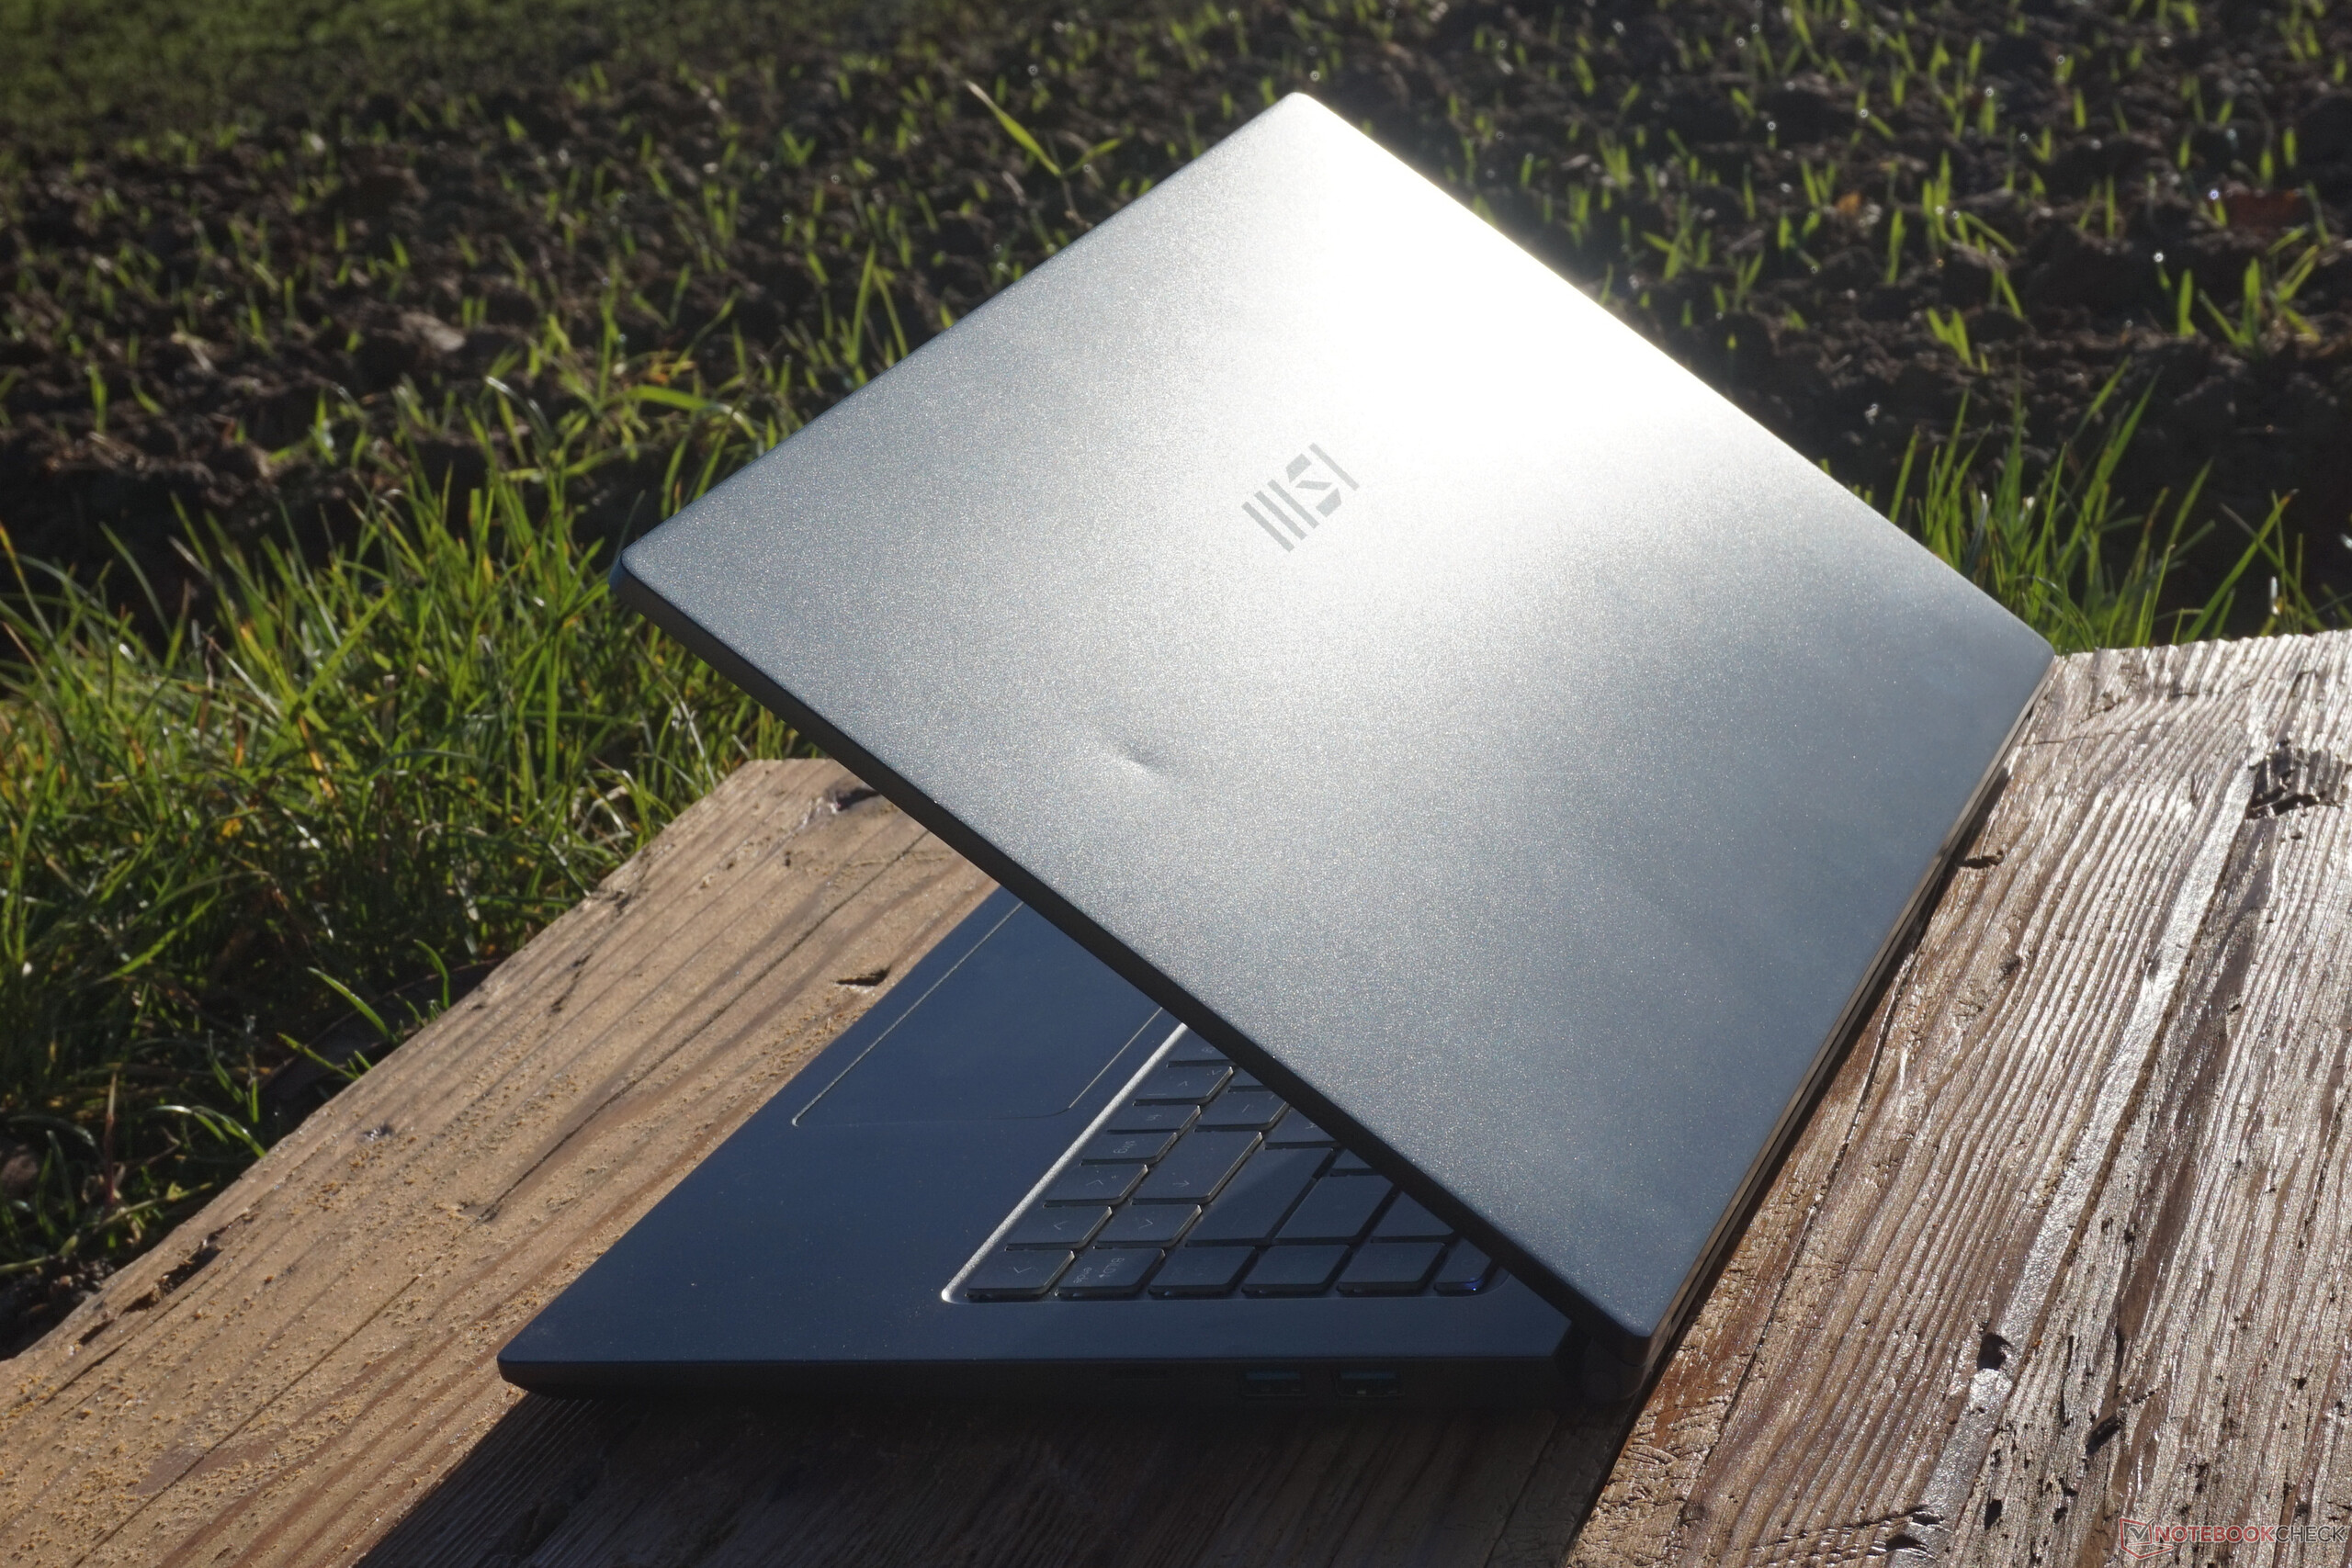
Con un gris oscuro intenso, casi negro, y el apenas reconocible logotipo "MSI" en la parte trasera, el chasis puede describirse como sobrio y discreto. La tapa metálica de la pantalla y el marco del teclado parecen de alta calidad, pero son muy sensibles a las huellas dactilares. El hecho de que el marco de la pantalla y la placa base sean de plástico es claramente perceptible.
Al menos esto no afecta a la estabilidad. El tambaleo de la pantalla es mínimo y la apertura con una sola mano no plantea problemas, al menos hasta 180 grados. Aquí tampoco se puede torcer nada. La parte inferior permanece plana en todo momento, y la pantalla sólo puede doblarse mínimamente
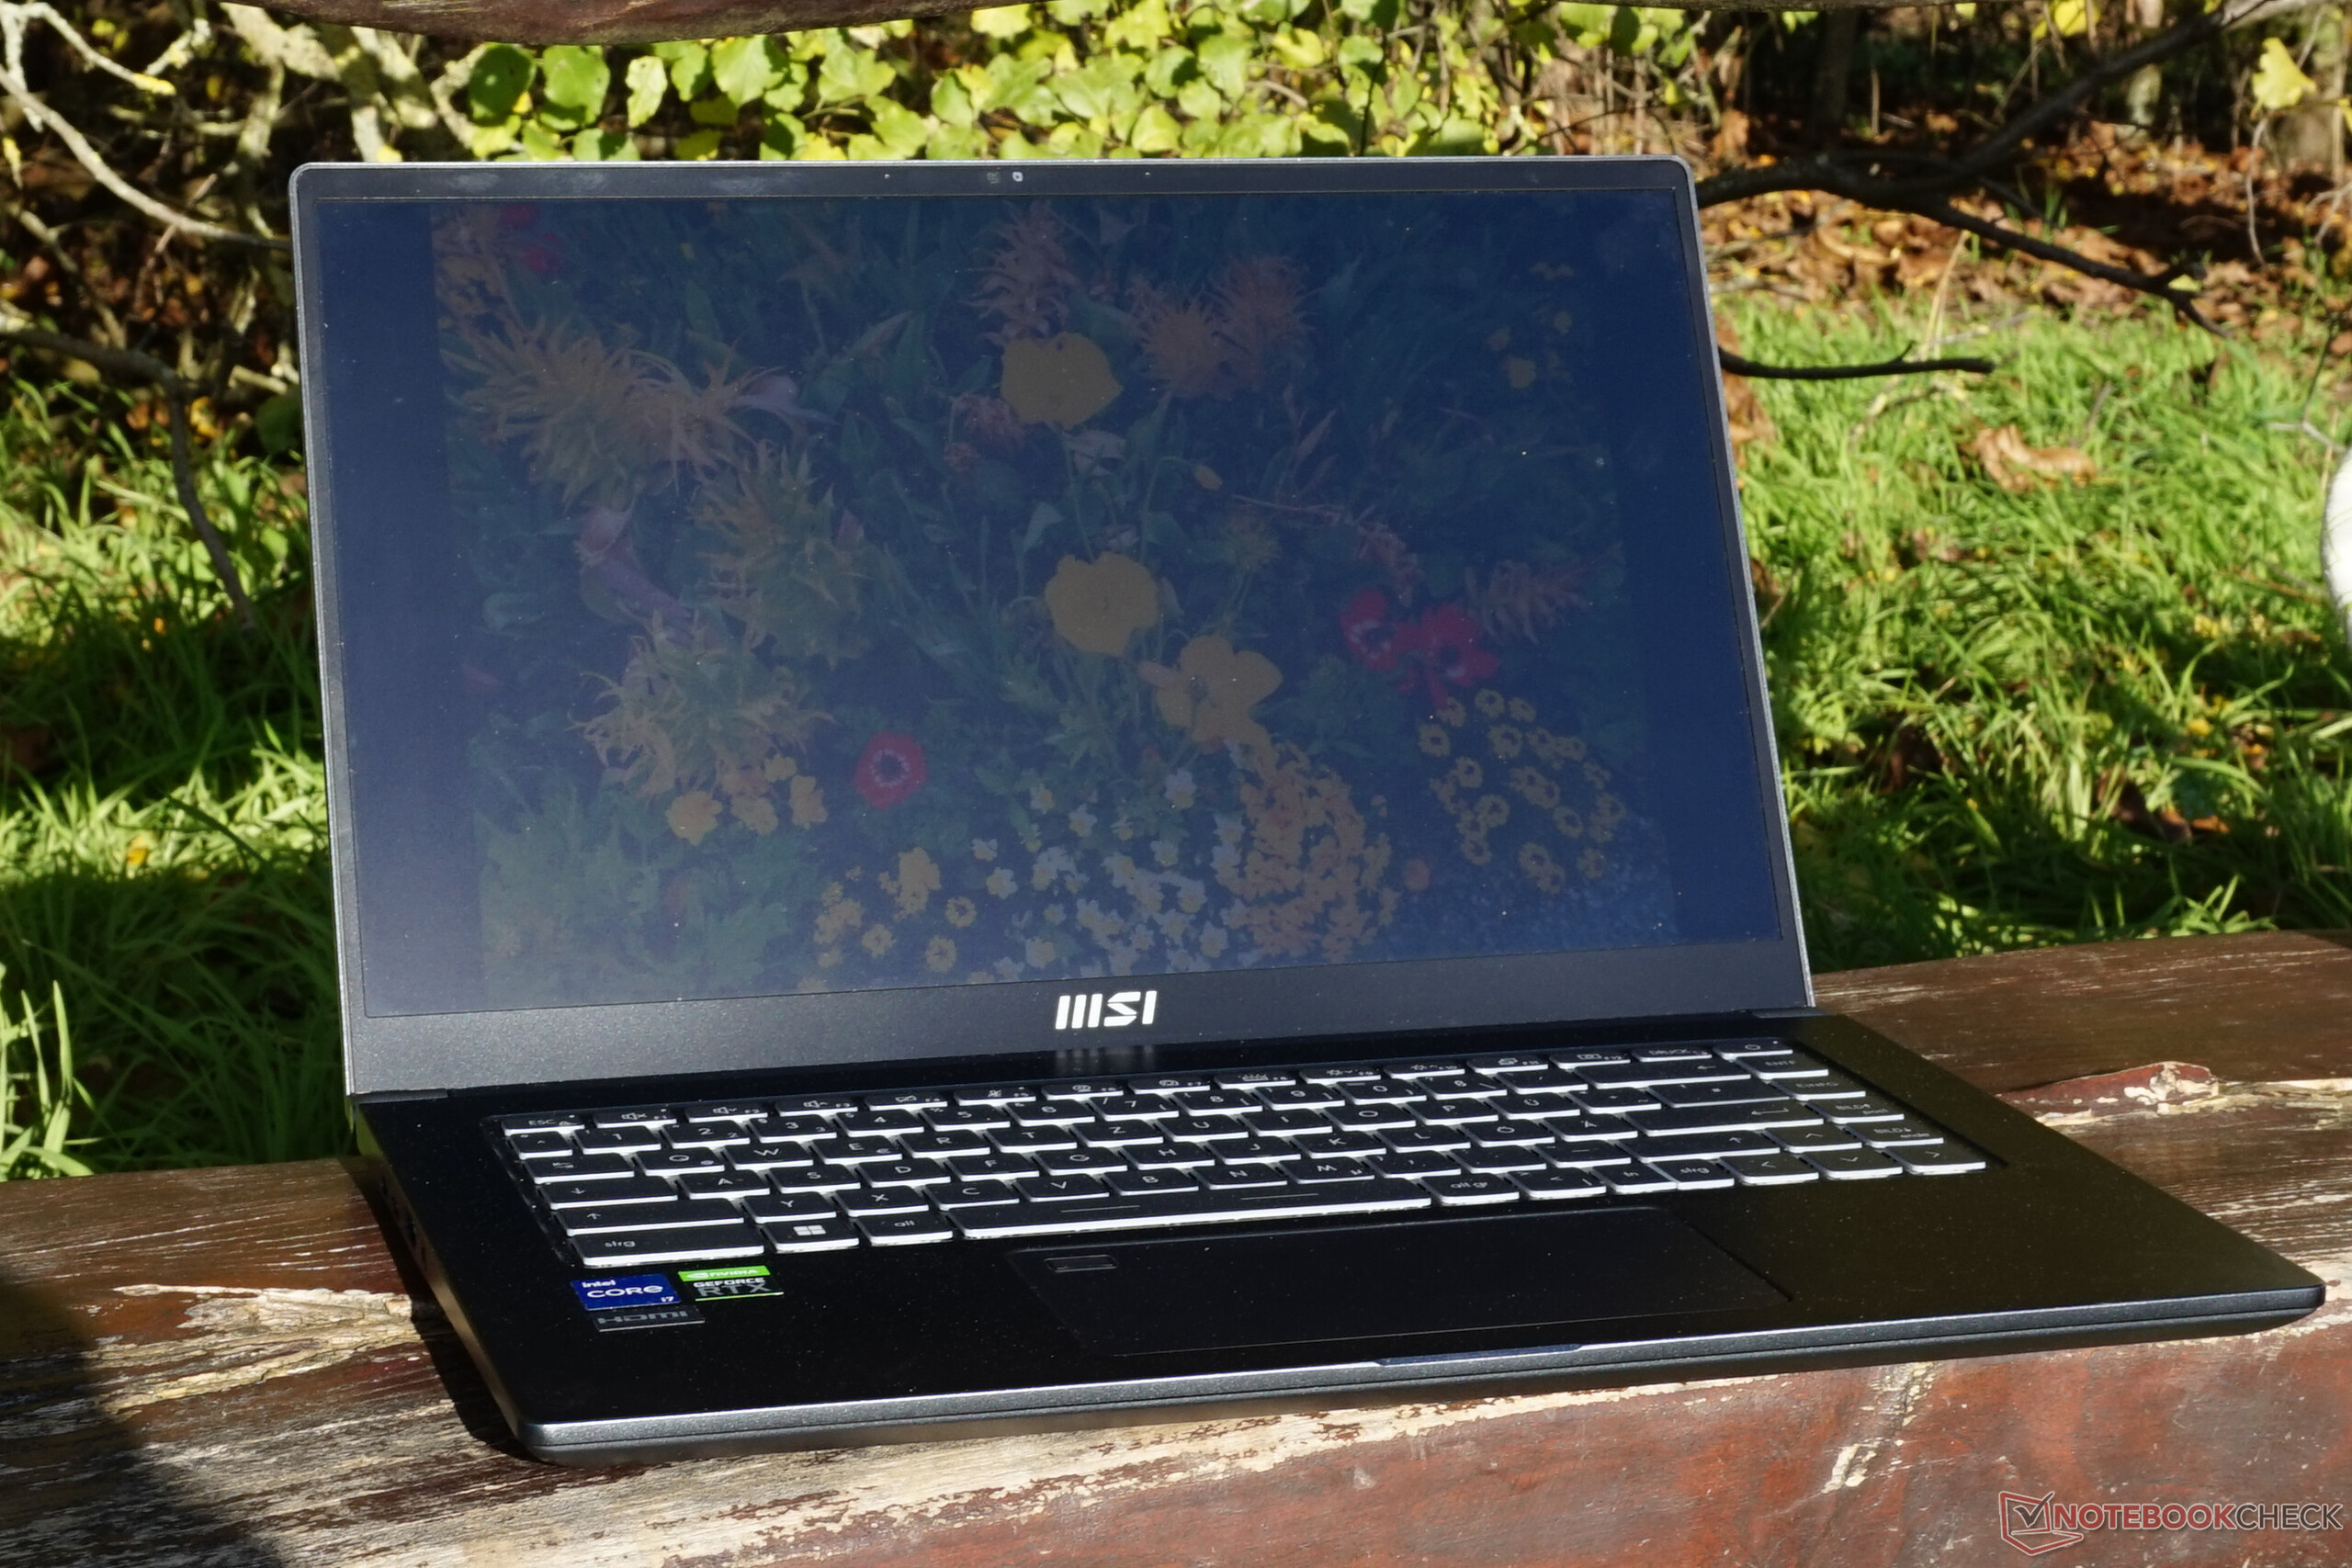
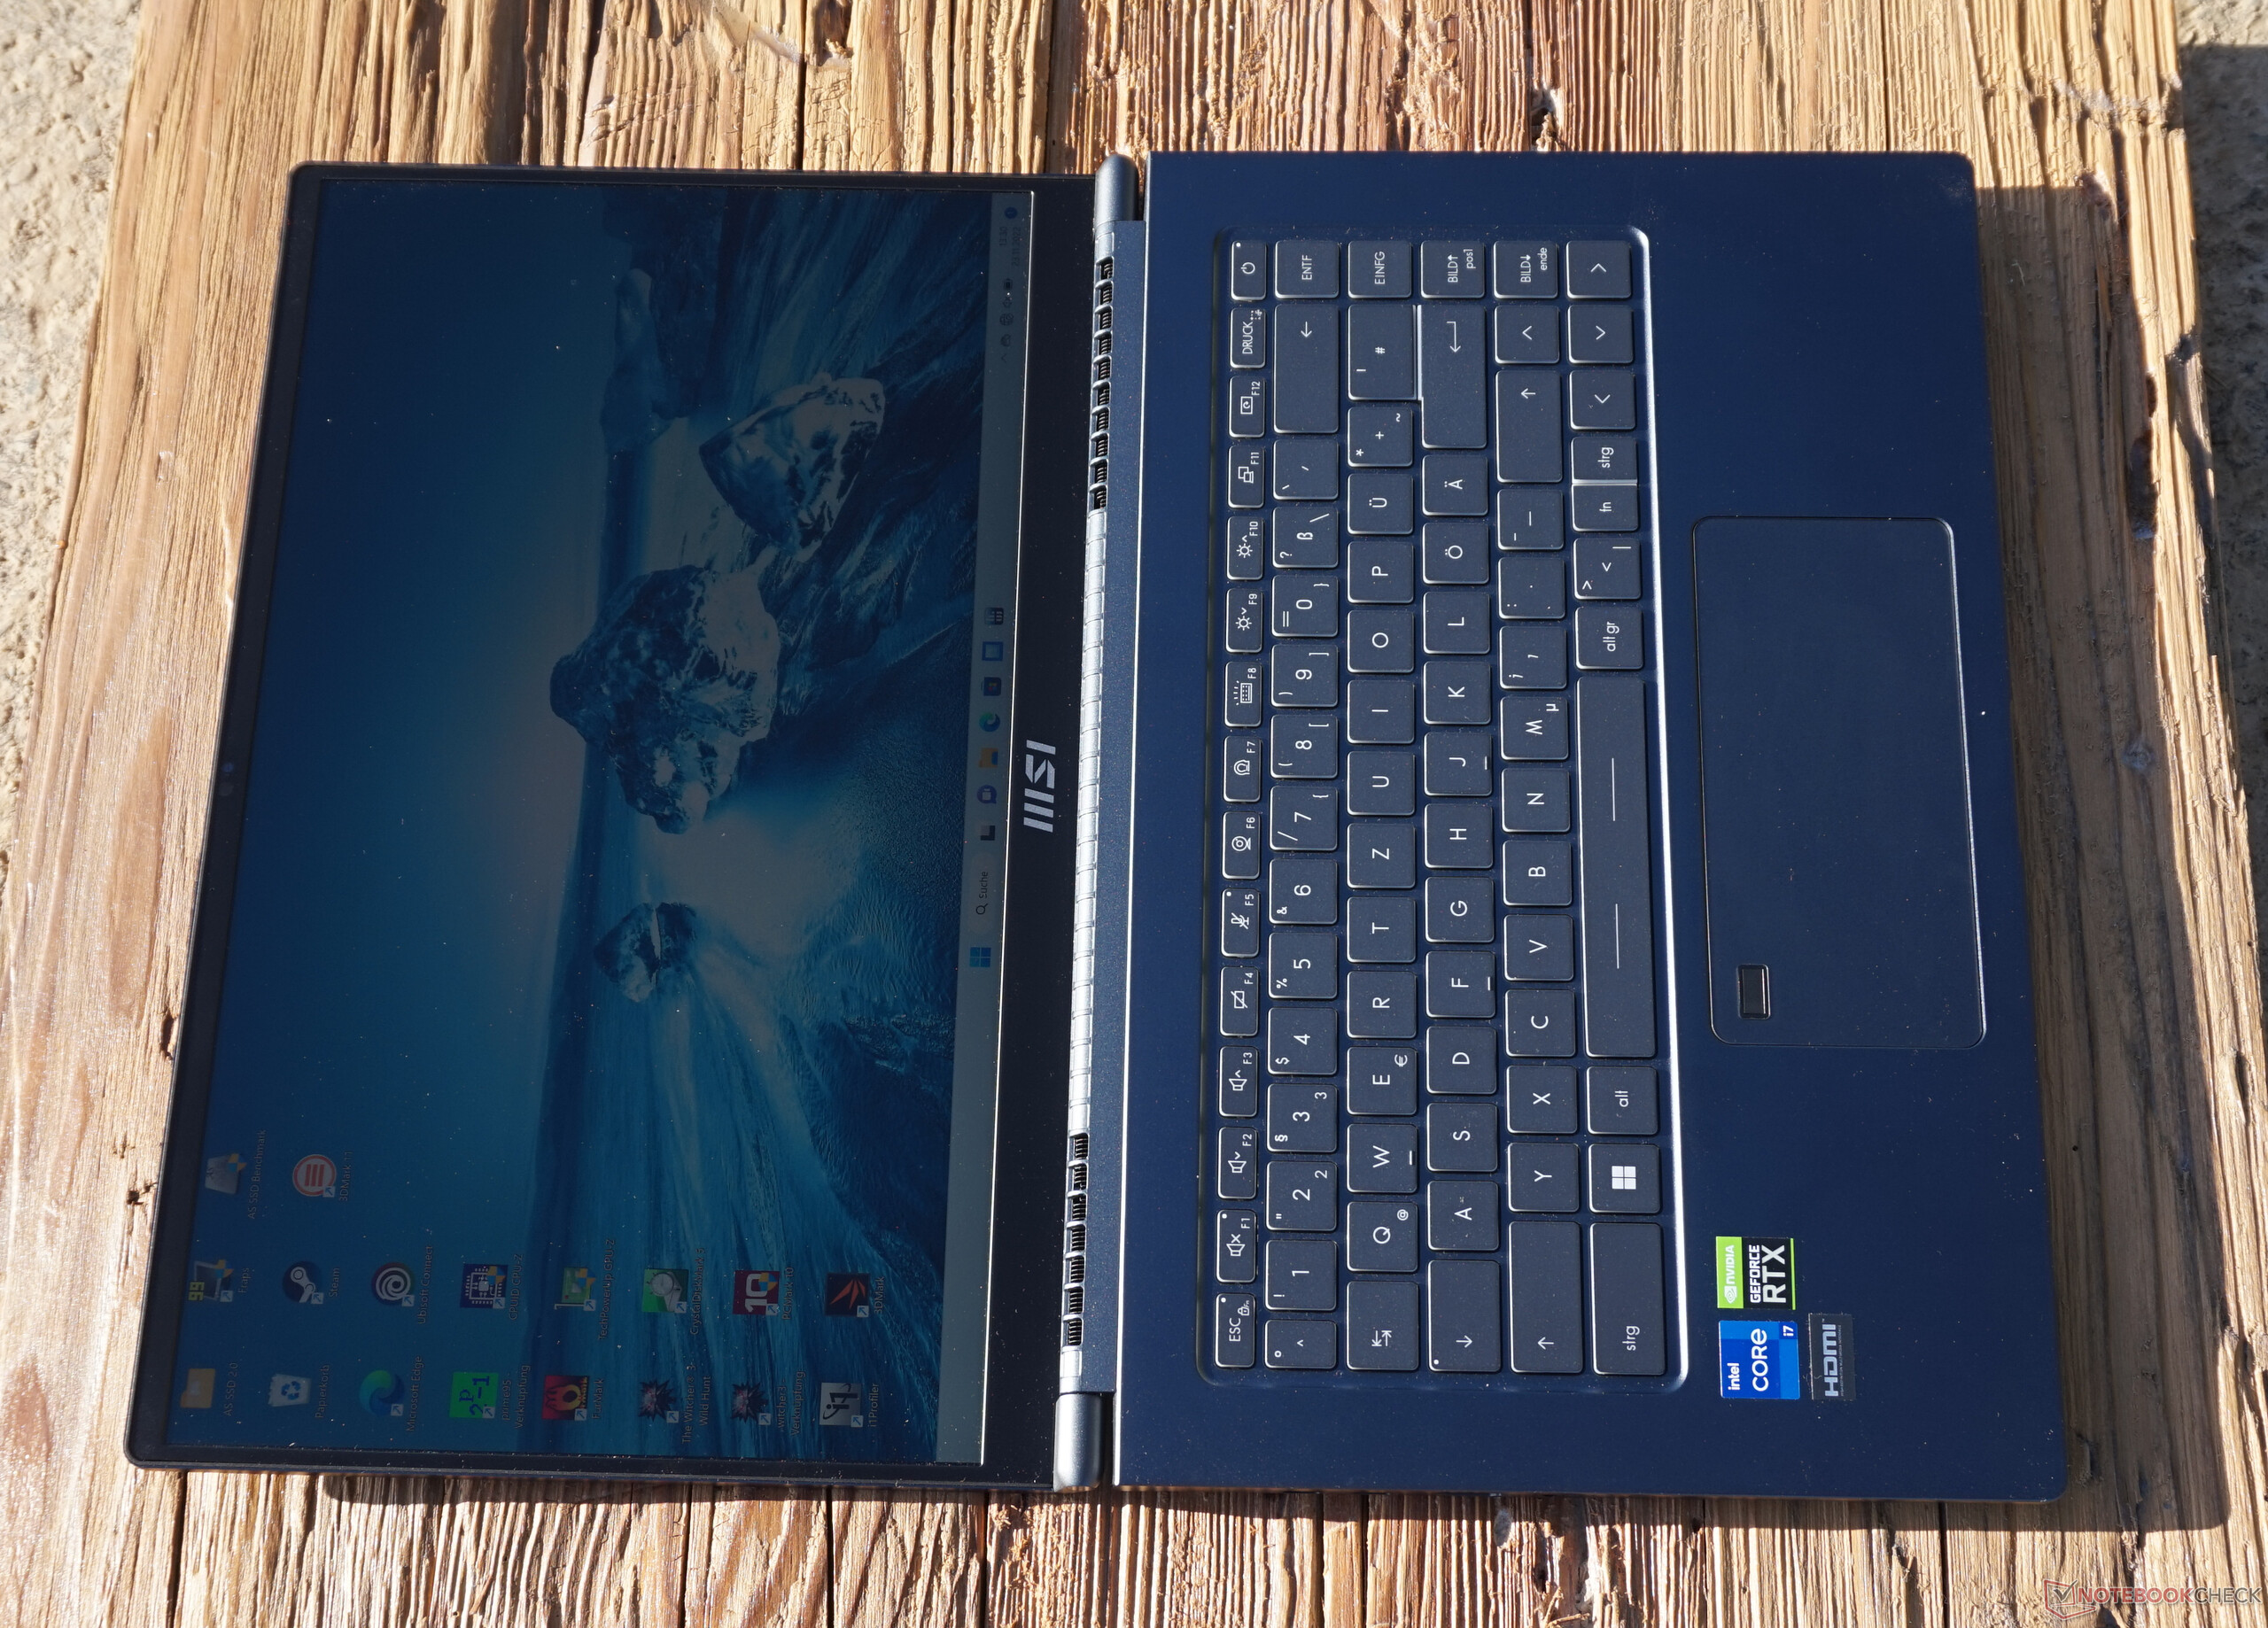
Mirando los componentes incorporados, no hay sorpresas en cuanto a peso y tamaño. 1.los 8 kg son apropiados para la pantalla y el hardware y se corresponden con los valores de los portátiles de la competencia. Lo mismo se aplica a las dimensiones, que, teniendo en cuenta la pantalla y sus bordes de 5 mm de ancho, son bastante compactas en general. La carcasa podría haber sido un poco más delgada.
Equipamiento - Portátil Creator con conexión rápida
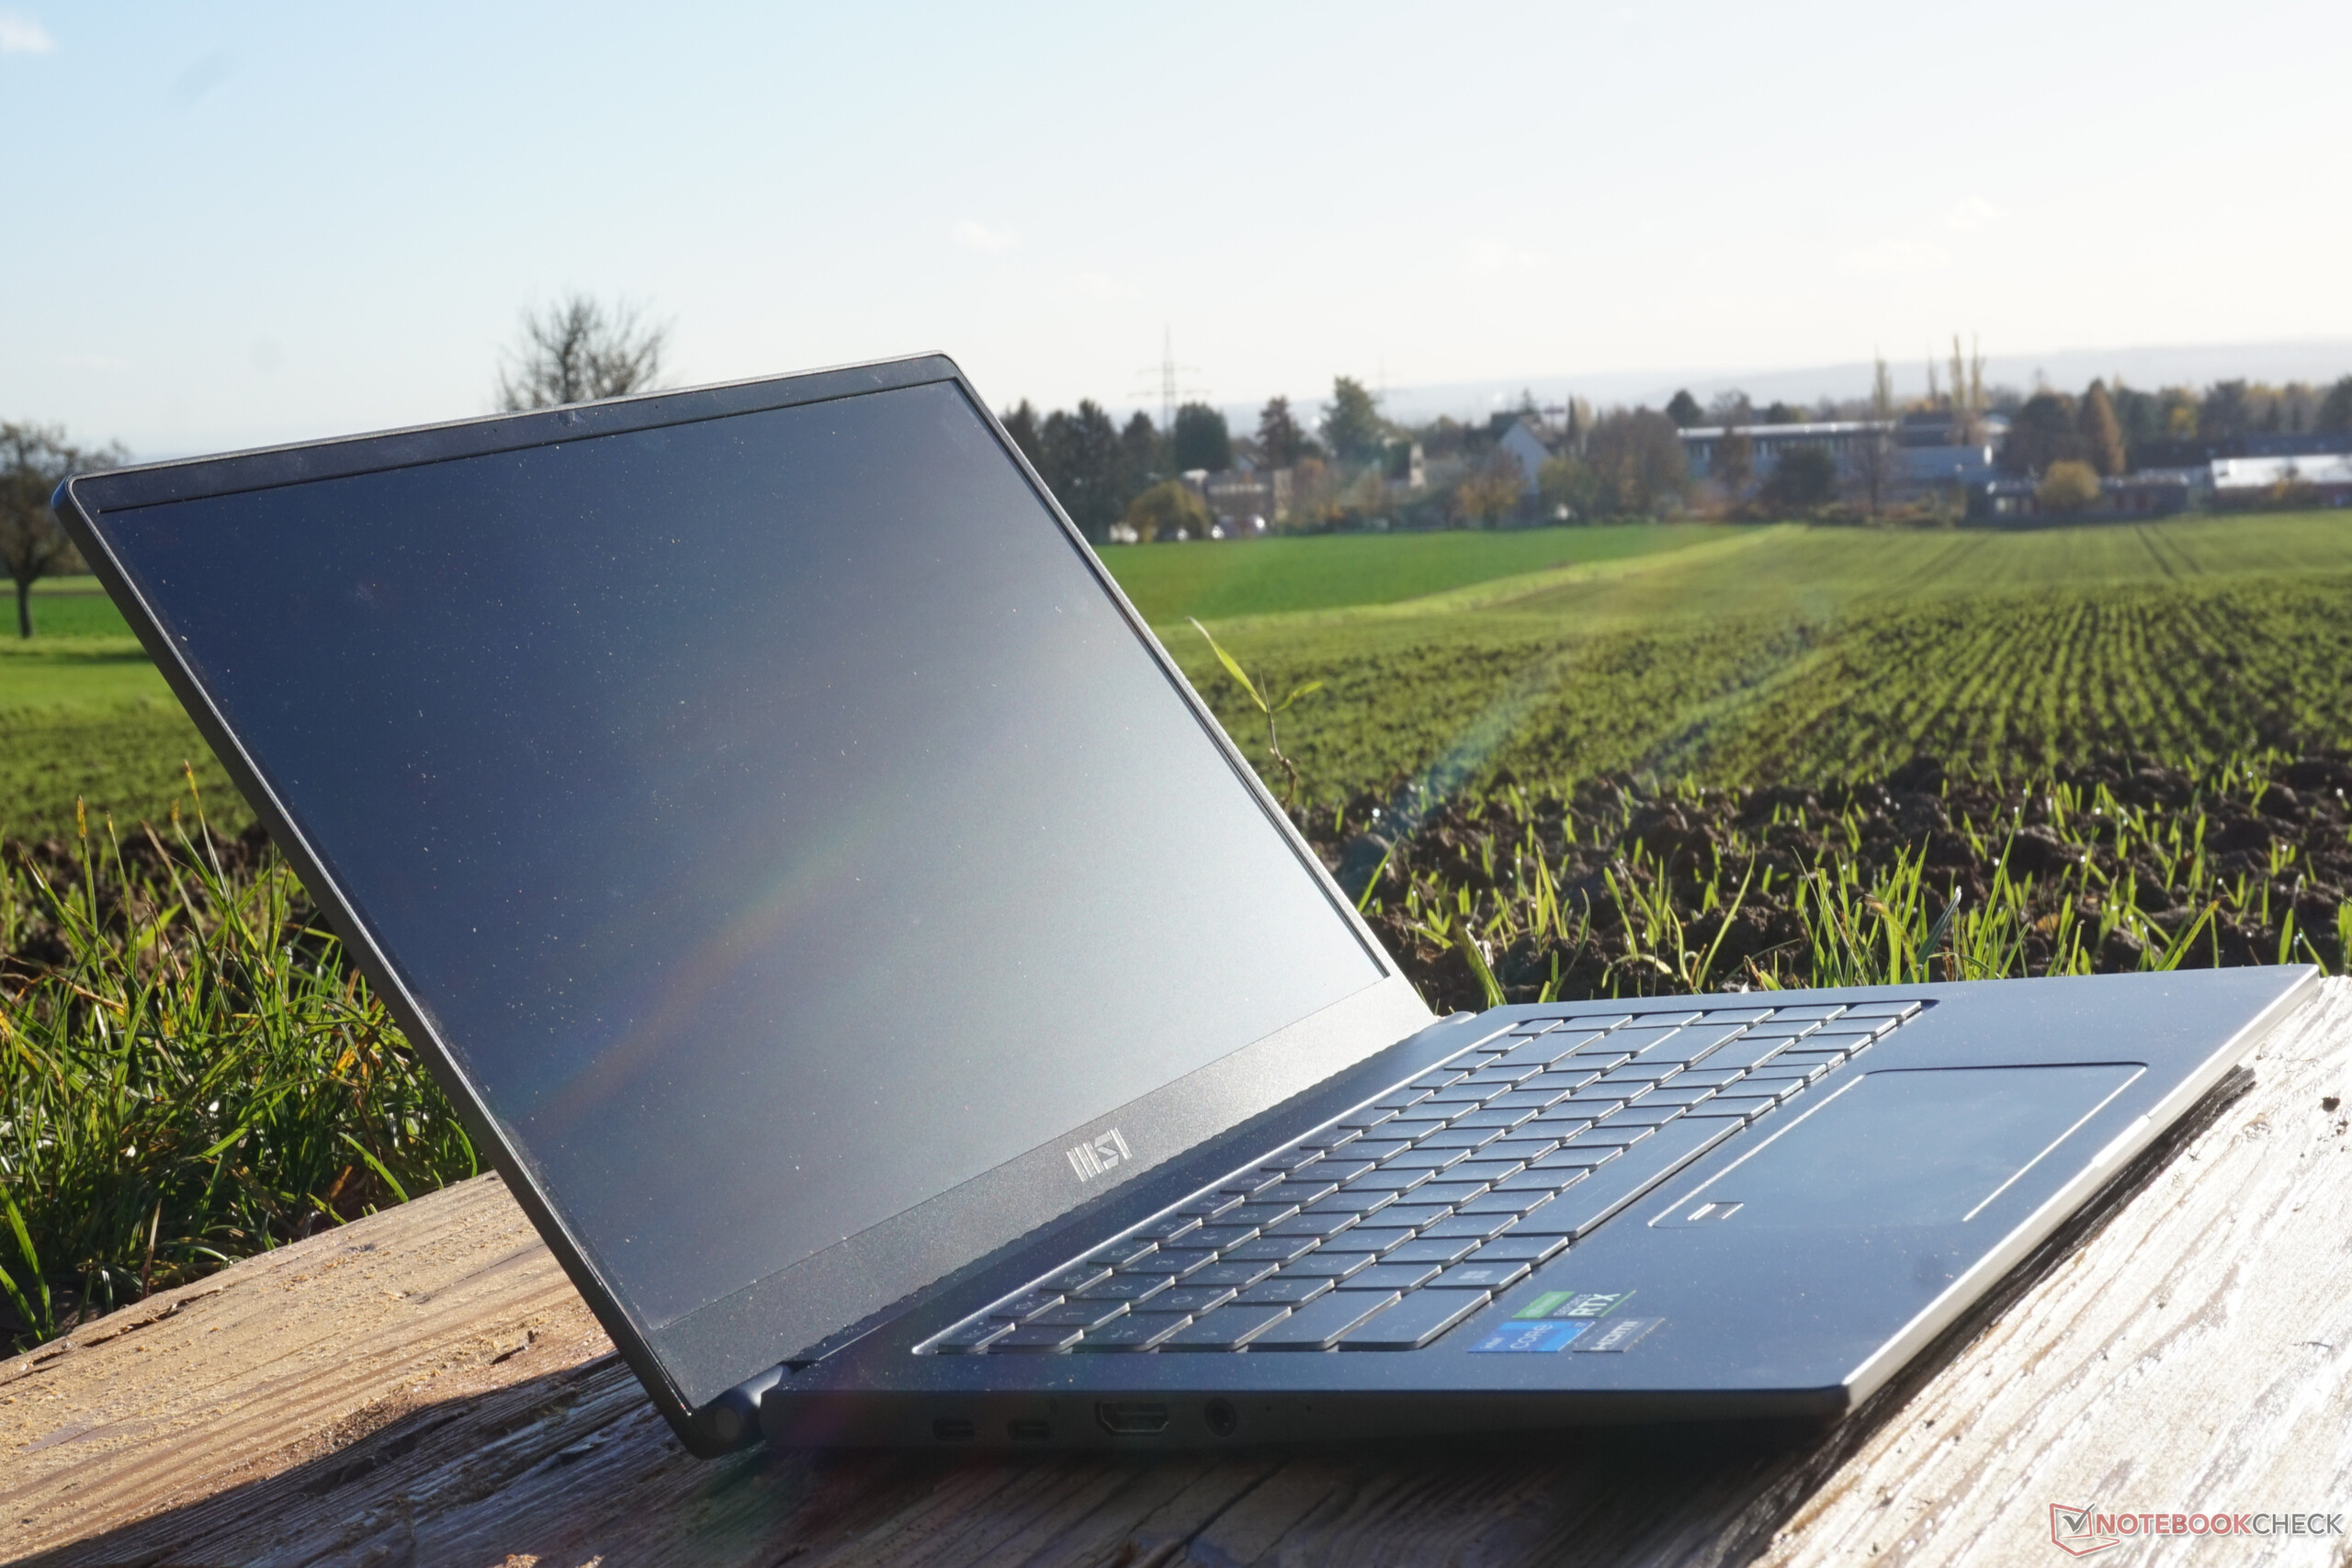
El número y la velocidad de los puertos son impresionantes. En particular, los dos puertos Thunderbolt 4 de la izquierda ofrecen un uso variable y altas tasas de transferencia. La batería también se recarga a través de este puerto, pero como hay dos puertos uno al lado del otro, uno siempre está libre. Por suerte, los dos puertos USB-A normales alcanzan los 10 Gbit/s, lo que debería ser suficiente para un SSD externo en muchos casos
Otras conexiones esenciales son la ranura para tarjetas, el HDMI y los auriculares. Sin embargo, la selección es un poco escasa en general. Se echa en falta un puerto LAN o el típico cierre Kensington. Tampoco hay un argumento real en contra de una ranura para tarjetas SD completa, para la que habría habido espacio de sobra
Lector de tarjetas SD
Los valores medidos con la tarjeta de referencia AV PRO microSD 128 GB V60 son medios. Esto significa que la velocidad de transferencia de fotos y vídeos es aceptable en general, lo que significa que se pueden trasladar grandes cantidades de datos a la Prestige 15 en pocos minutos.
| SD Card Reader | |
| average JPG Copy Test (av. of 3 runs) | |
| Dell XPS 15 9520 RTX 3050 Ti (Toshiba Exceria Pro SDXC 64 GB UHS-II) | |
| Media de la clase Multimedia (23 - 531, n=37, últimos 2 años) | |
| MSI Prestige 15 A12UD-093 (AV Pro SD microSD 128 GB V60) | |
| Schenker Vision 14 2022 RTX 3050 Ti | |
| Asus VivoBook Pro 16X OLED N7600PC-L2026X | |
| maximum AS SSD Seq Read Test (1GB) | |
| Media de la clase Multimedia (37.3 - 1455, n=36, últimos 2 años) | |
| Dell XPS 15 9520 RTX 3050 Ti (Toshiba Exceria Pro SDXC 64 GB UHS-II) | |
| MSI Prestige 15 A12UD-093 (AV Pro SD microSD 128 GB V60) | |
| Schenker Vision 14 2022 RTX 3050 Ti | |
| Asus VivoBook Pro 16X OLED N7600PC-L2026X | |
Comunicación
Al menos al recibir datos, el módulo WLAN Intel AX211 alcanza valores superiores a la media. En el envío, los valores son un poco bajos, aunque algo menos de 1.000 Mbit/s sigue siendo impresionante. La medición de la velocidad máxima de transmisión fue propensa a errores en nuestras pruebas, pero podemos asumir con confianza que funciona lo suficientemente bien en la práctica en vista de las buenas tasas de recepción
Cámara web
La webcam del MSI Prestige 15 no es muy impresionante: una calidad meramente HD, que no funciona bien durante las videollamadas, es realmente demasiado poco para un portátil multimedia. Por otro lado, el reconocimiento con poca luz es convincente. Incluso el brillo de la pantalla es suficiente para que el portátil pueda utilizarse para la videotelefonía en cualquier momento.
Los dos micrófonos no compensan la débil calidad de vídeo. Las voces suenan metálico, y lo que se dice sólo puede entenderse cuando se habla directamente frente al portátil.
Al menos el reconocimiento facial con infrarrojos funciona de forma fiable. En general, la webcam es utilizable, pero la resolución y los micrófonos sólo cumplen los requisitos mínimos


Seguridad
Aunque no hay cerradura Kensington para asegurar el dispositivo en el escritorio o el lugar de trabajo, al menos el inicio de sesión se puede hacer seguro a través del reconocimiento facial y el sensor de huellas dactilares.
Algo inusual es la posición del sensor en el touchpad, pero su generoso diseño asegura que esto no deje una impresión negativa durante el uso. Sin embargo, los usuarios zurdos pueden ver esto de otra manera. La construcción y el funcionamiento obtuvieron muy buena puntuación en nuestras pruebas funcionales. La tecnología parece ser significativamente más robusta que muchos sensores de huellas dactilares incorporados en el teclado.
El reconocimiento facial en la Prestige 15 también funcionó sin errores. Independientemente de las condiciones de iluminación, la cámara de infrarrojos reconoció al usuario correctamente
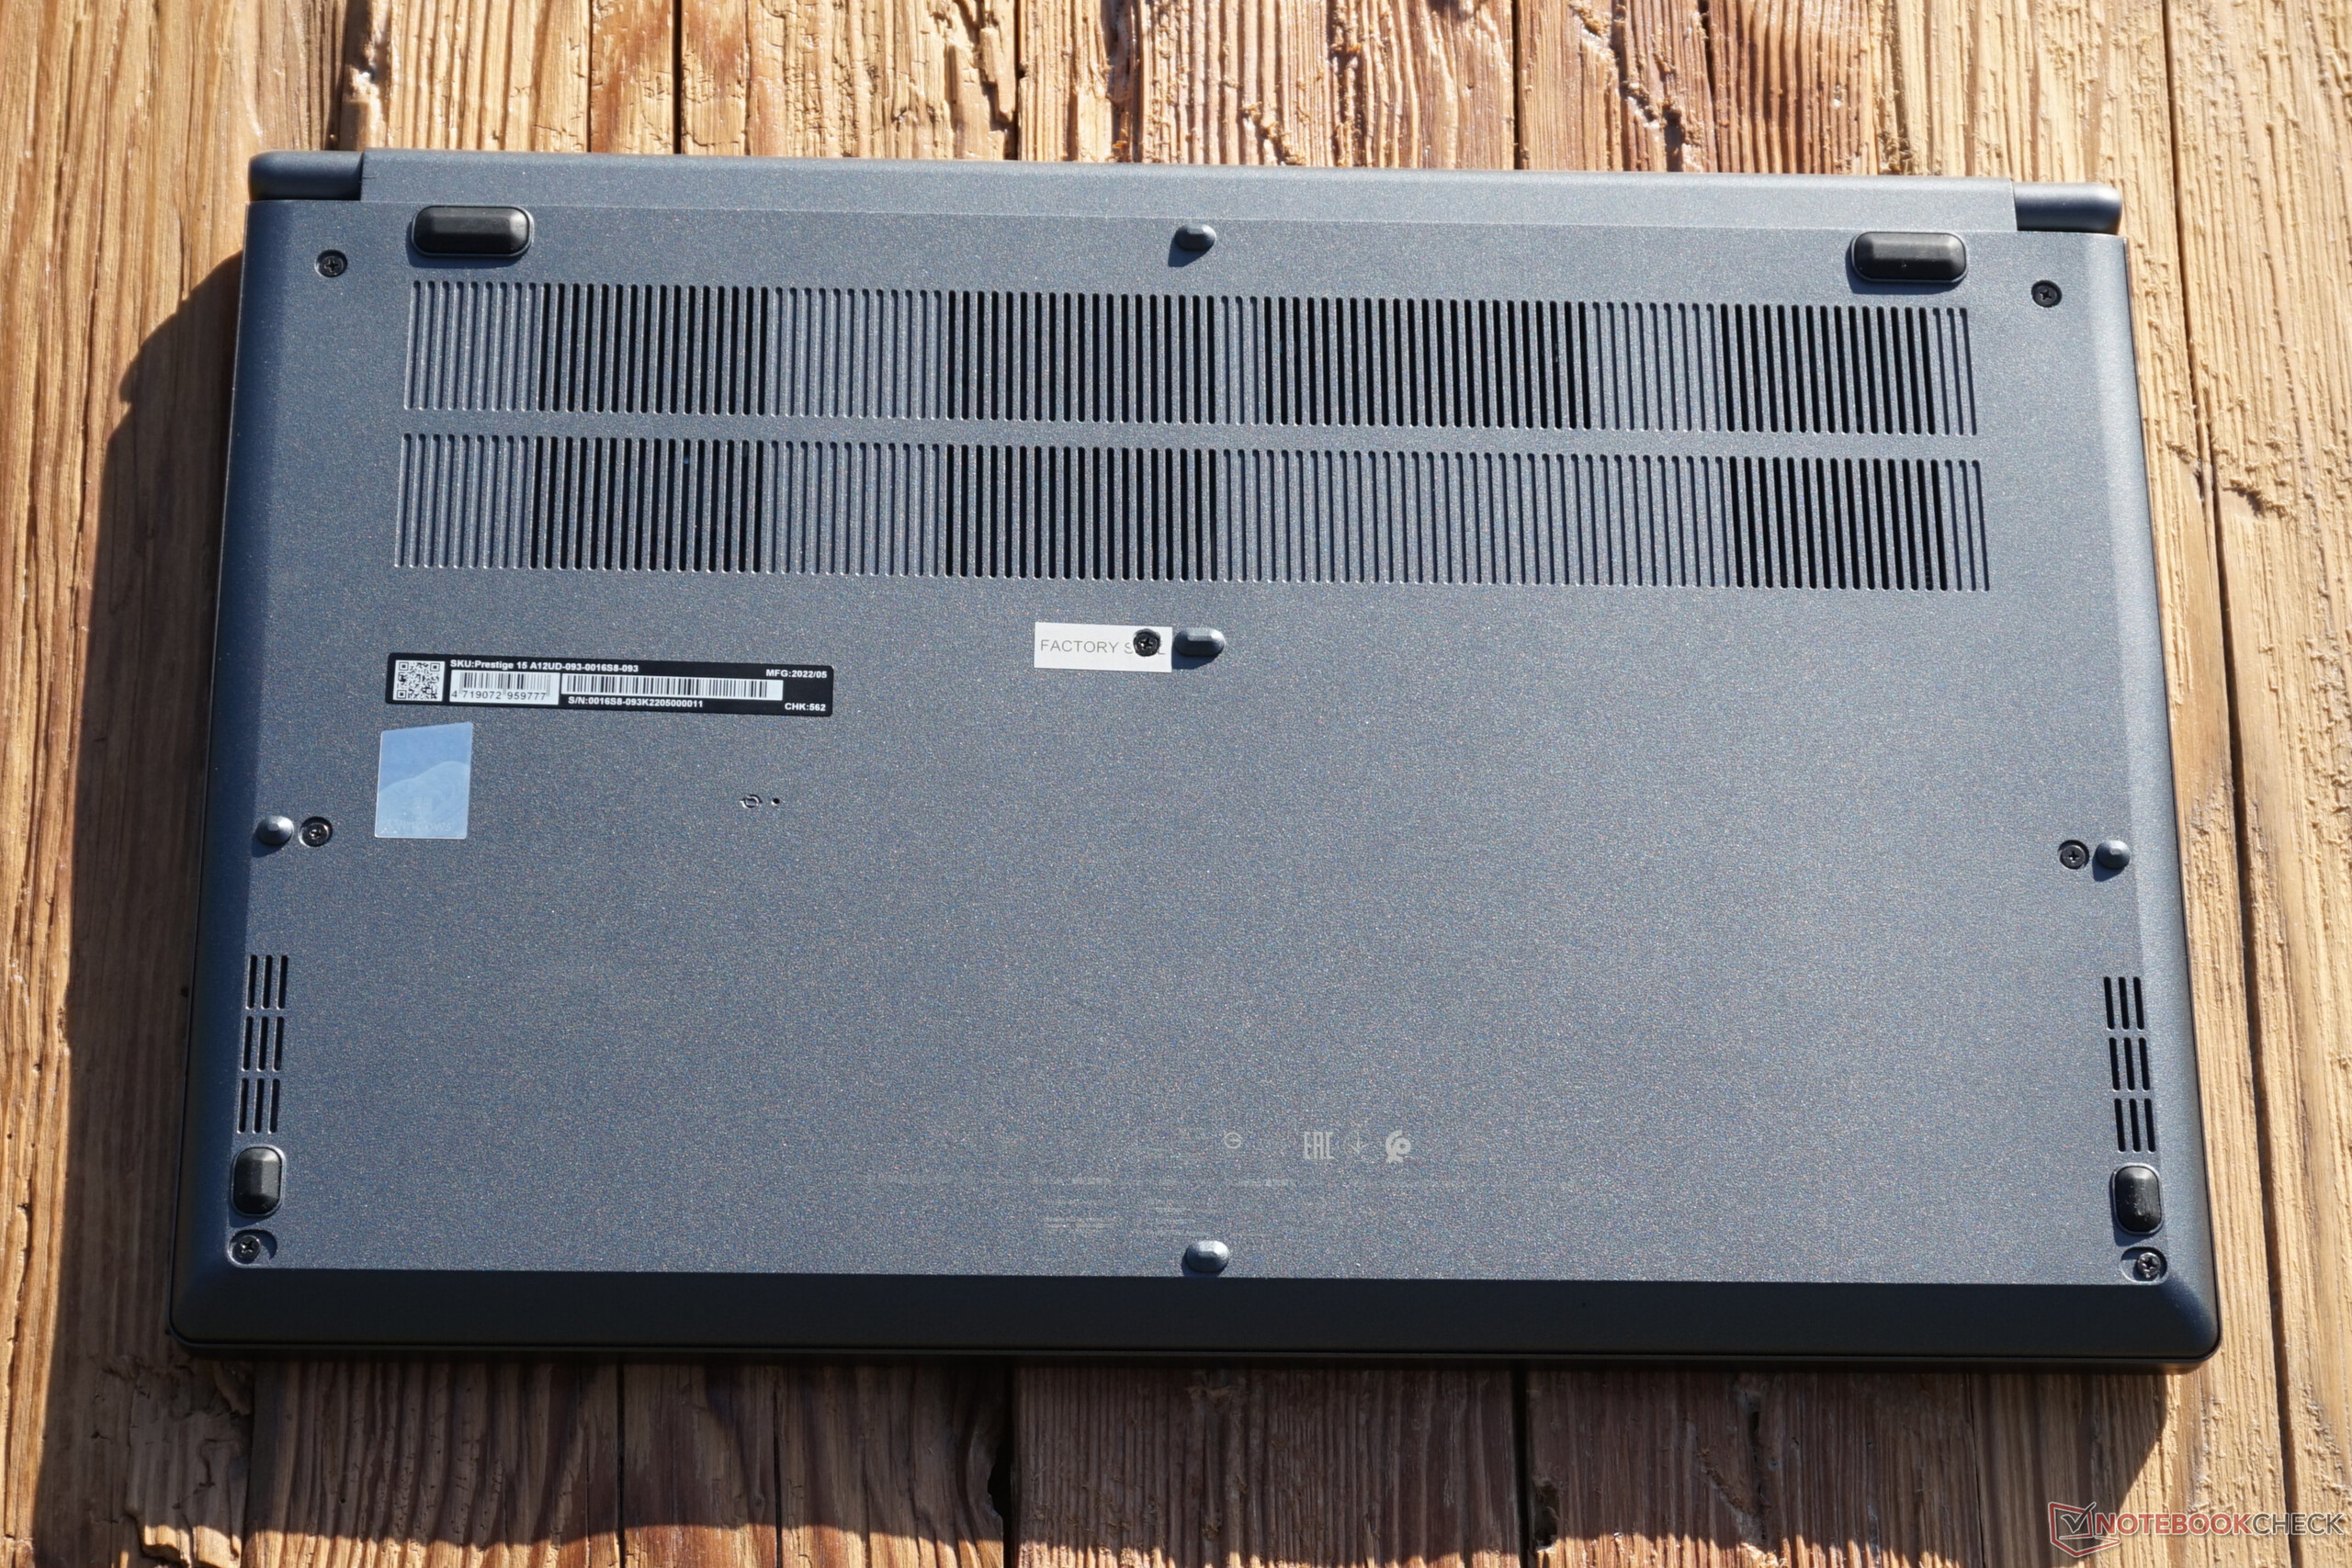
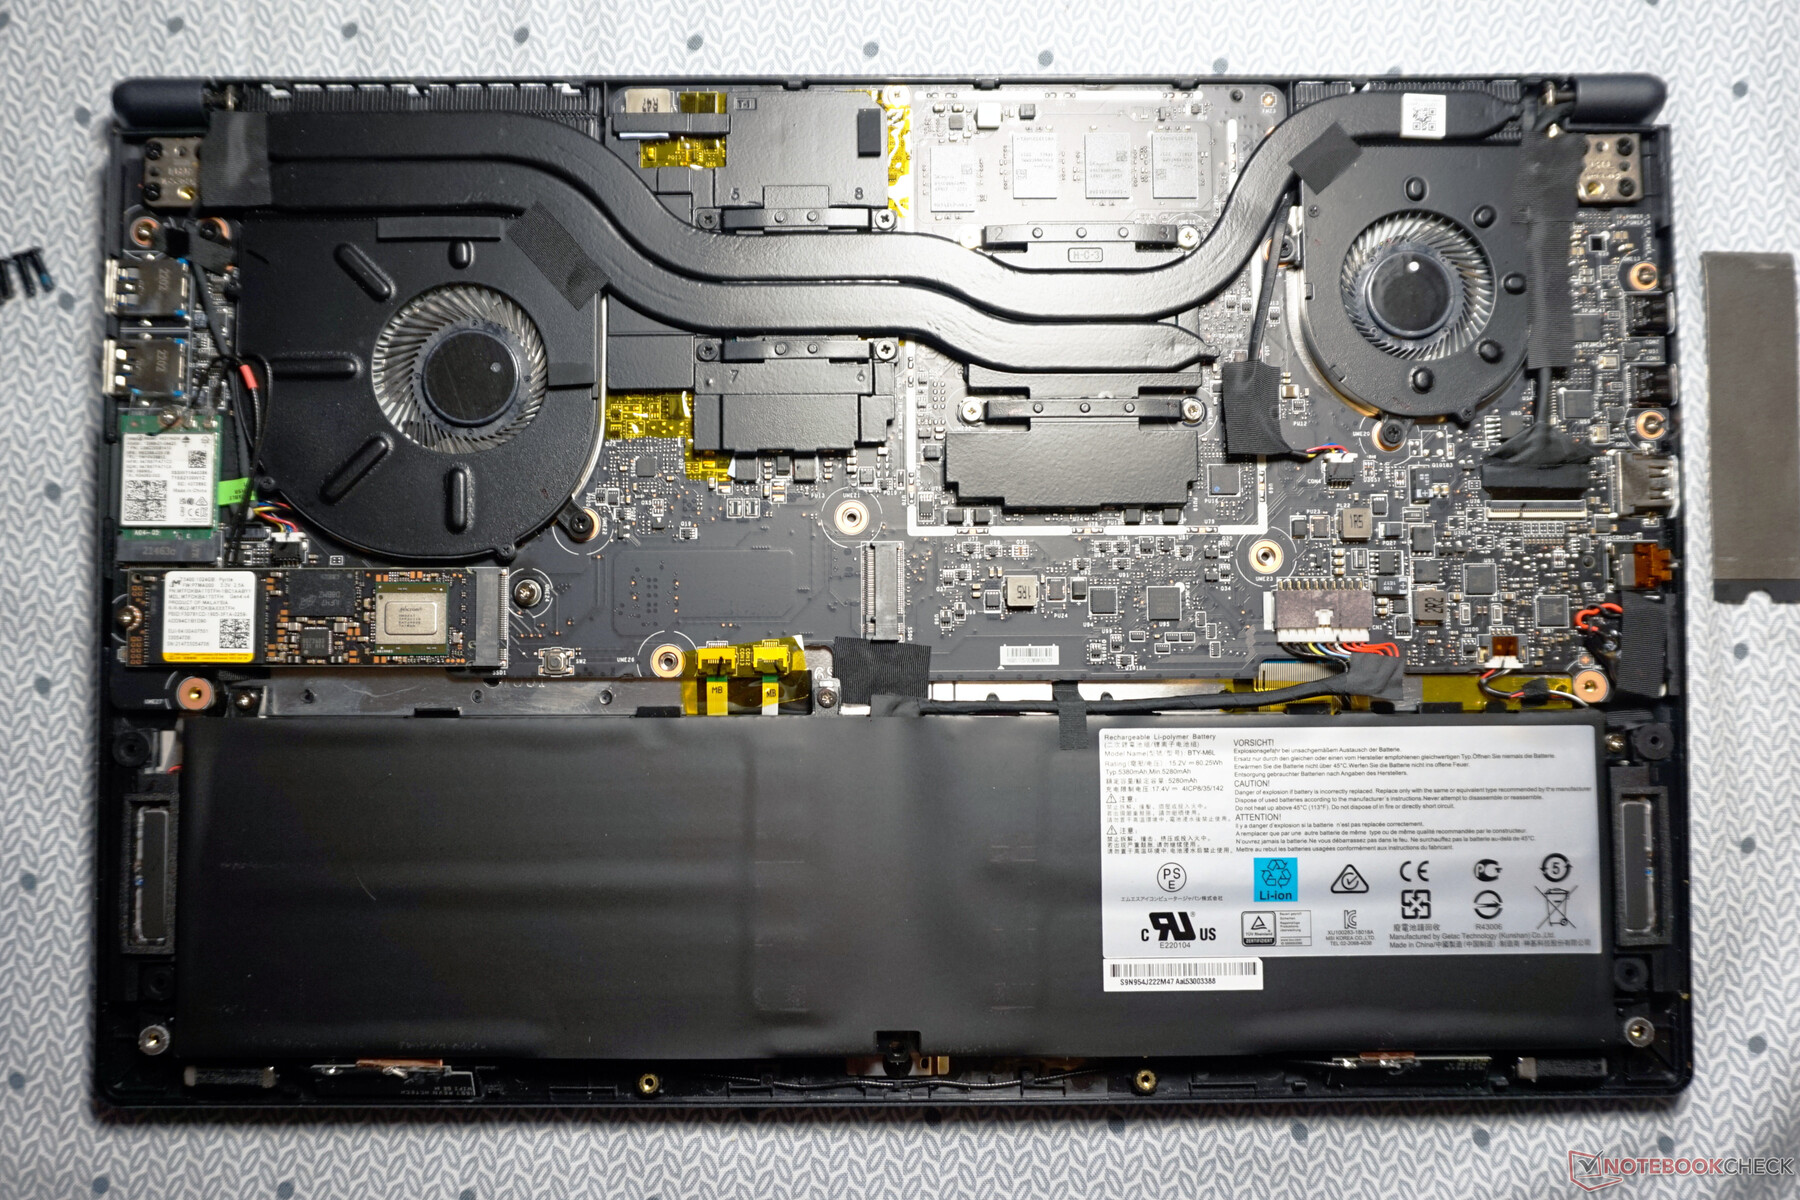
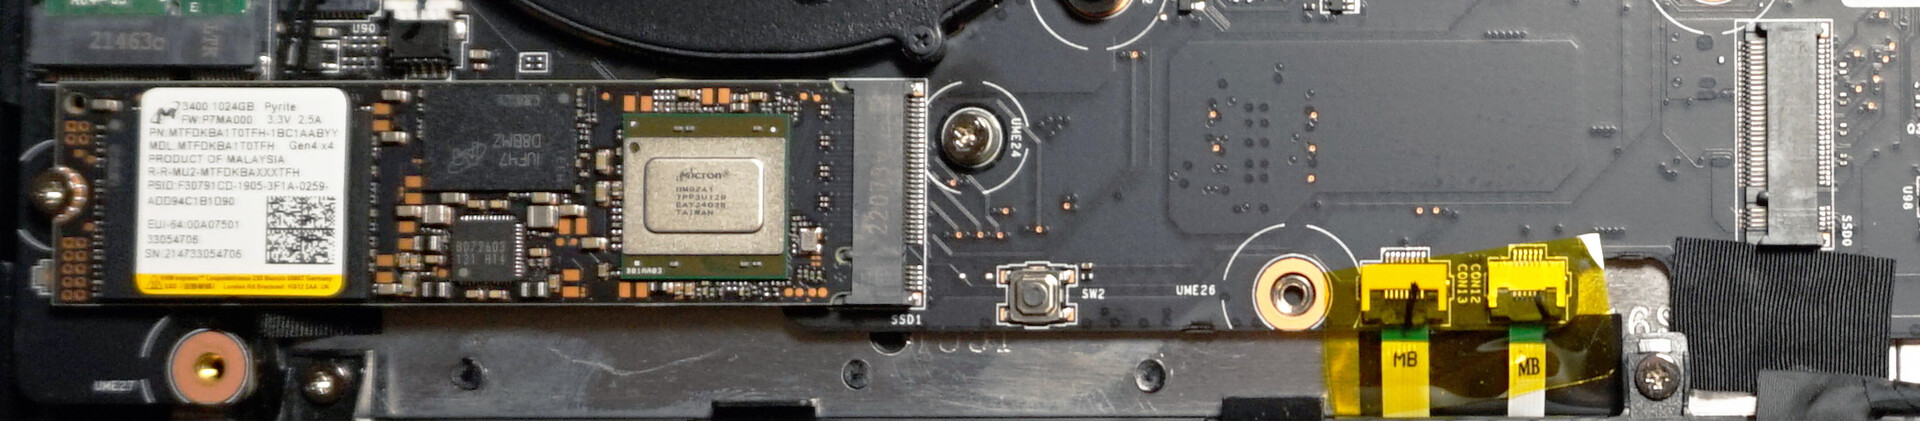
Mantenimiento

El portátil MSI fue fácil de abrir. Sólo hay que aflojar siete tornillos Phillips para separar la placa base con poco esfuerzo. Desafortunadamente, el tornillo del medio está cubierto con un sello. Tras contactar con MSI, nos aseguraron que romper el sello no anula la garantía. Sin embargo, esto puede tener un efecto disuasorio en algunos usuarios
Por lo demás, un vistazo al interior revela un diseño interno bien pensado. Sólo la batería está atornillada. El módulo WLAN también se puede cambiar si es necesario.
Además, la ampliación del espacio de almacenamiento está diseñada para ser completamente sencilla, lo que hace que el cierre sea aún menos comprensible. Además del SSD ya instalado, se puede insertar un SSD adicional en una segunda ranura M.2 en el formato estándar 2280. Esto tiene mucho sentido para la edición de vídeo.
Sólo la RAM está permanentemente soldada. Como mucho, esto podría resultar problemático en la variante de portátil con 16 GB en algún momento del futuro. La configuración de 32 GB, por otro lado, debería ser completamente suficiente a largo plazo.
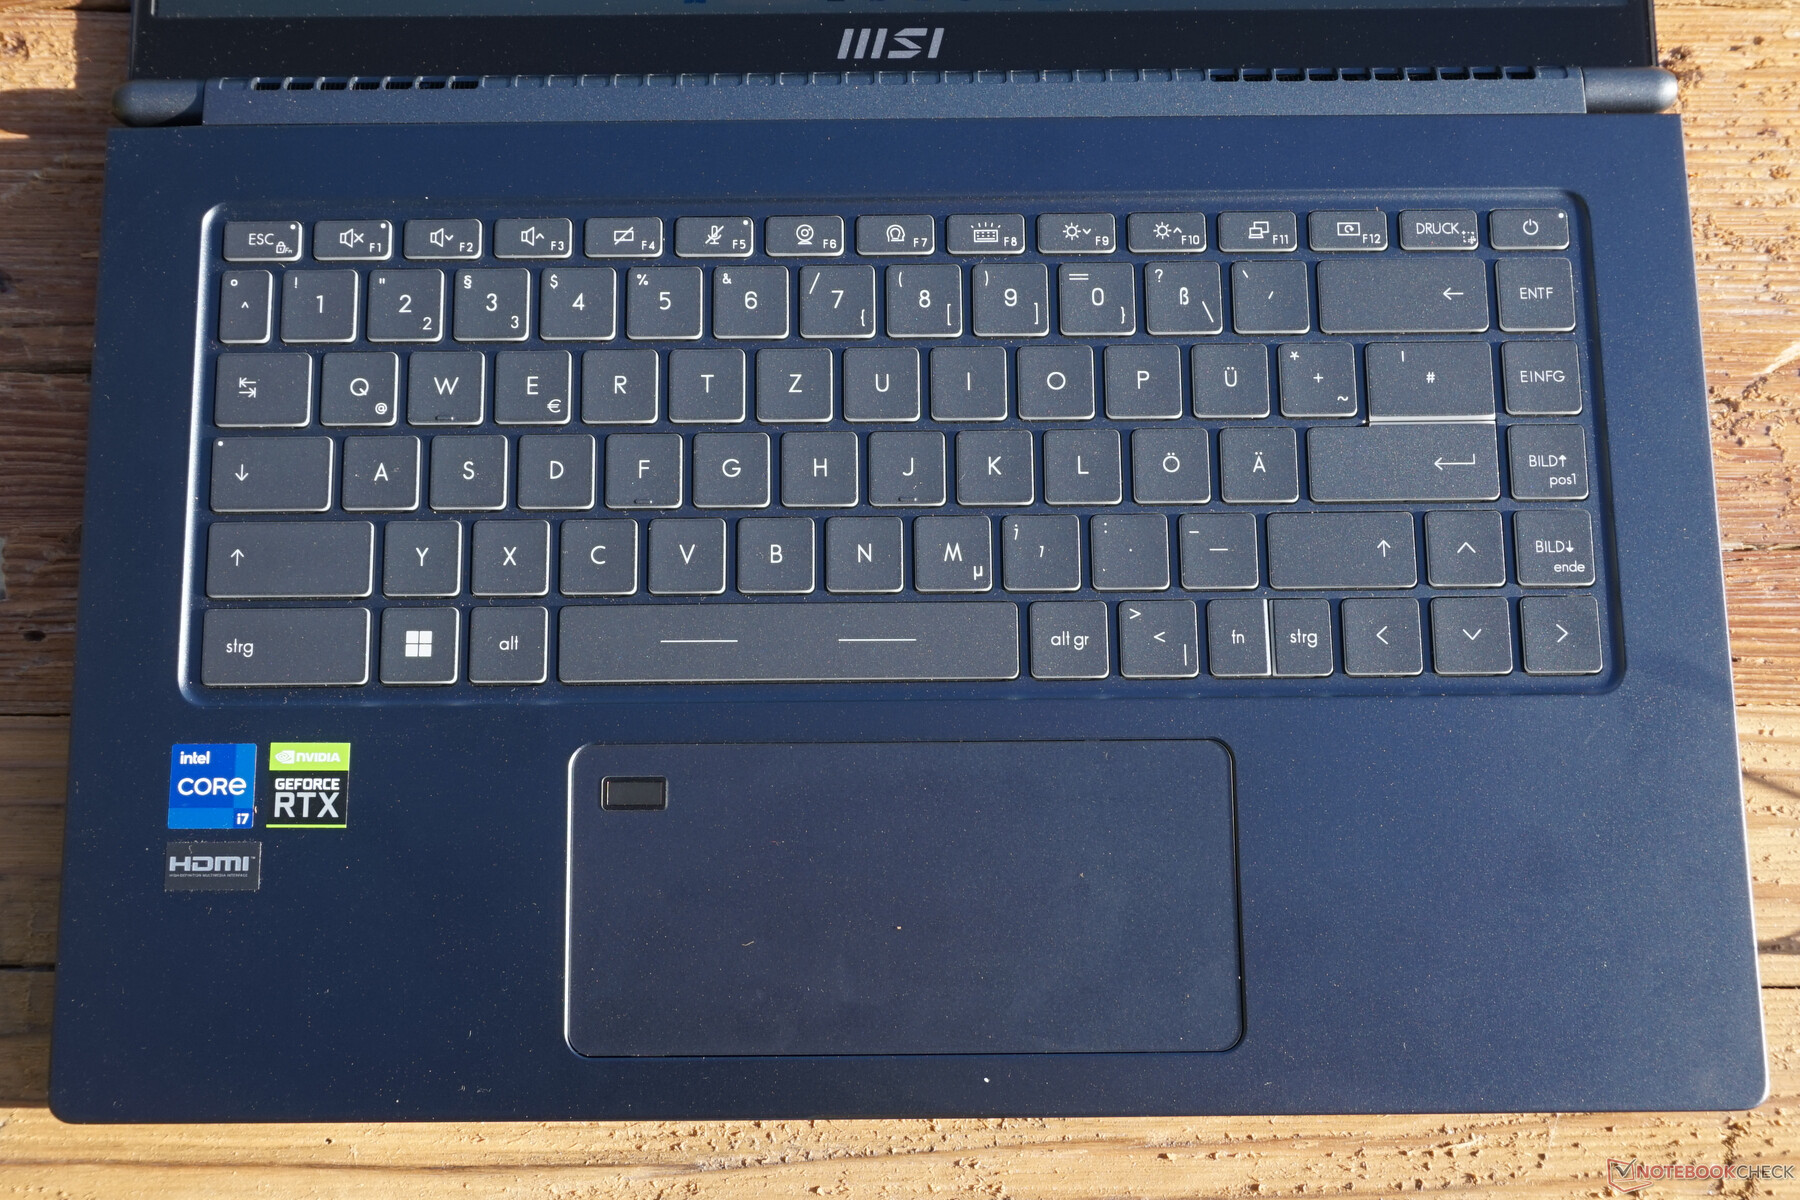
Dispositivos de entrada - Portátil Creator con estándar simple
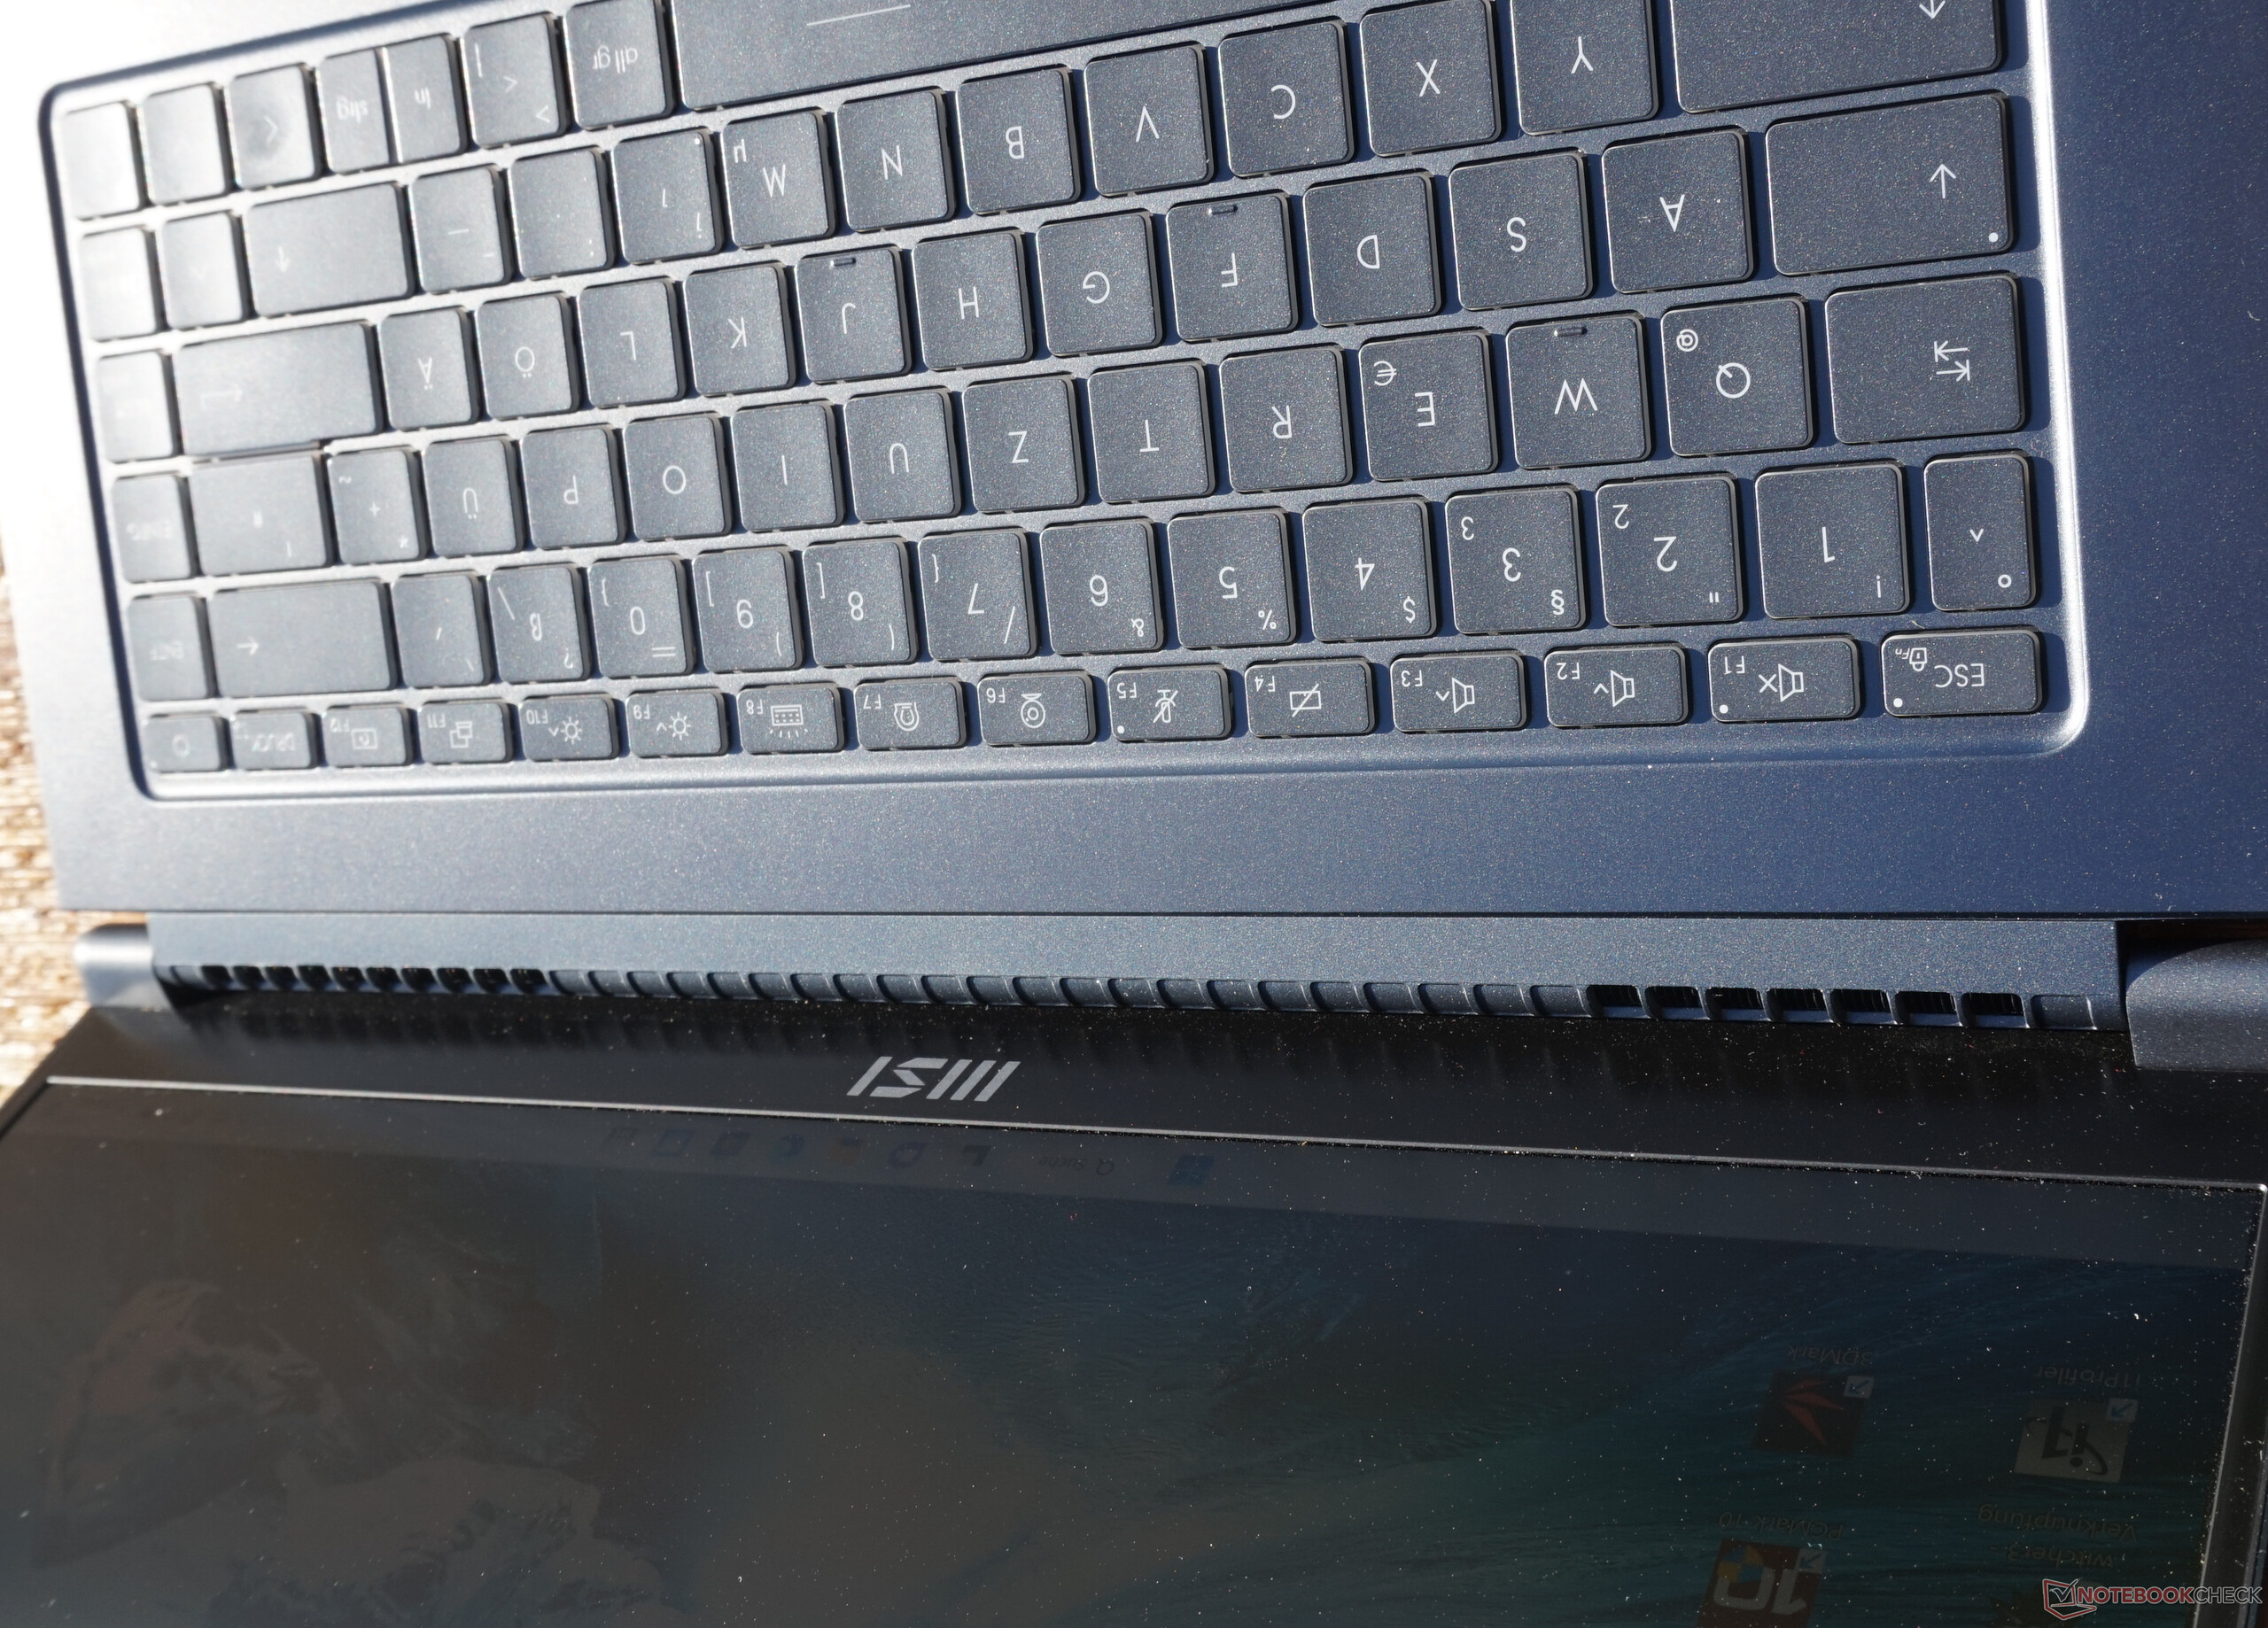
La letra claramente reconocible y, sobre todo, el tamaño familiar y el espaciado estandarizado ahorran cualquier acostumbramiento. Escribir en el teclado del MSI Prestige 15 es rápido y preciso. No es particularmente ruidoso ni muy silencioso.
La resistencia de las teclas está bien dosificada y también debería ser adecuada para largos periodos de trabajo. Sin embargo, un poco más de 1 mm de recorrido habría sido deseable, especialmente con un uso intensivo.
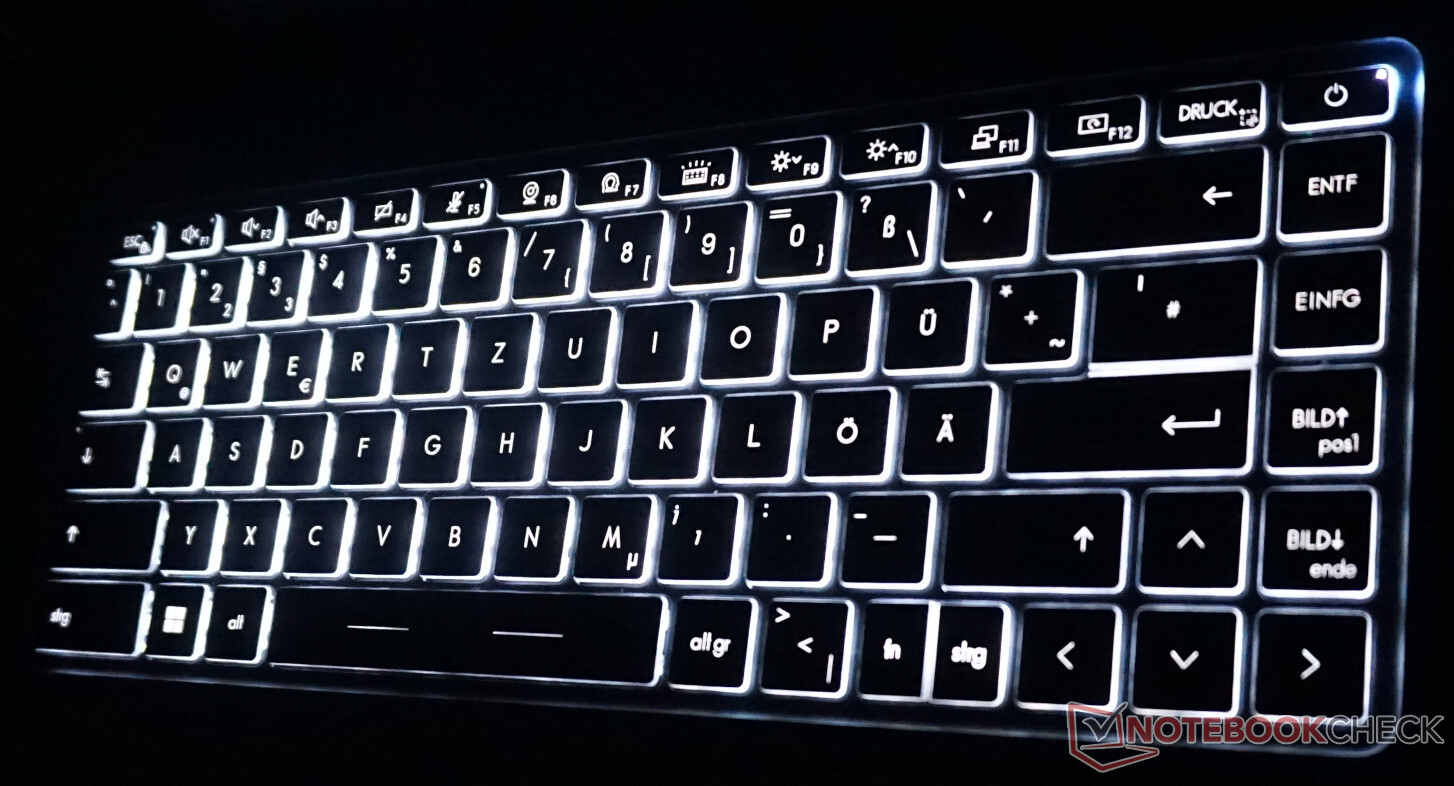
La retroiluminación tampoco deja lugar a críticas. Hay tres niveles de brillo diferentes y no se observaron irregularidades. Además, el marco iluminado de cada tecla asegura una excelente orientación en entornos oscuros.
El touchpad también deja una impresión positiva en general. Las entradas con uno o más dedos se implementan con precisión. La superficie de vidrio se siente muy bien, y las teclas cubiertas en el área inferior también funcionan sin problemas.
No pudimos ver ninguna ventaja real en el diseño particularmente ancho a primera vista, especialmente porque el sensor de huellas digitales también está instalado aquí. La longitud de sólo 65 mm, por otra parte, parece un poco ajustada. Aquí, uno se desliza rápidamente más allá del touchpad.
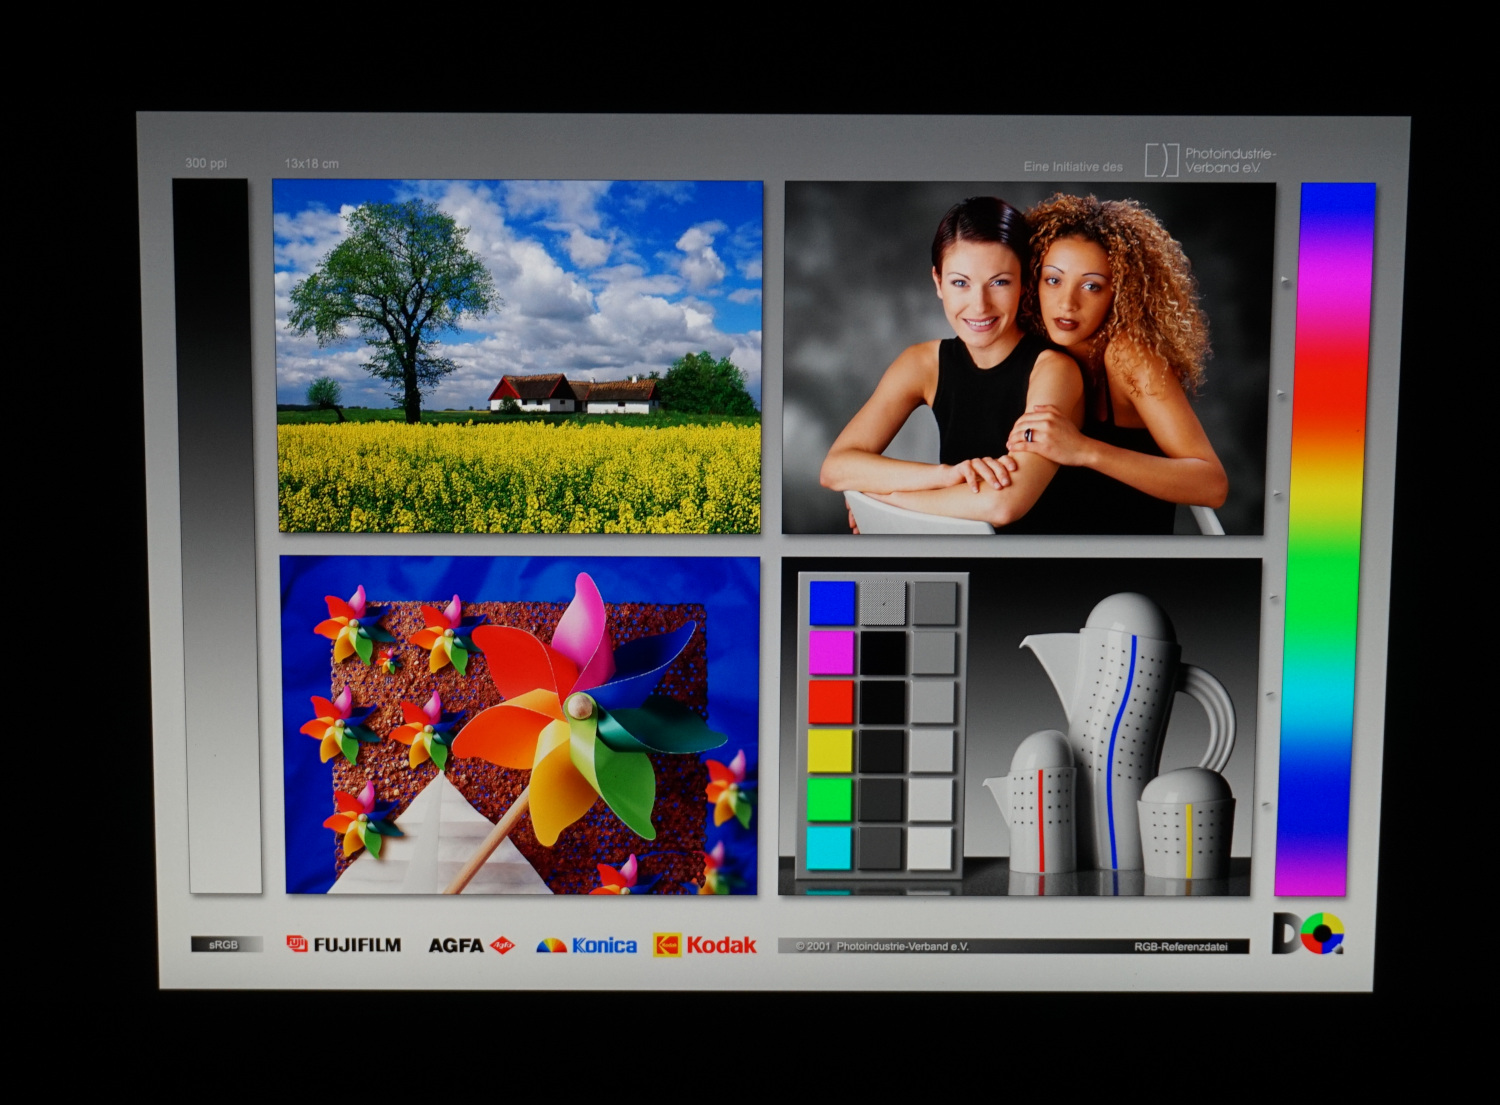
Pantalla - La Prestige 15 ofrece 4K y más

Los valores de la pantalla indican claramente que MSI se toma muy en serio su posicionamiento como portátil para creadores. Con una diagonal de 15.6 pulgadas, la resolución 4K asegura una densidad de pixel extremadamente alta. Los píxeles individuales no son discernibles, incluso a corta distancia. Como alternativa, se puede usar una pantalla Full HD, que por desgracia rinde un poco peor en términos de reproducción del color
El contraste es impresionante y se apoya en un valor de negro muy bajo, entre otras cosas. El brillo está ligeramente por encima de la media con una media de 420 cd/m², que no disminuye en modo batería.
Observamos un mínimo sangrado de pantalla en el borde inferior. Sin embargo, esto sólo ocurre durante el brillo total de la pantalla, una imagen completamente negra y largos tiempos de exposición. Esto tampoco debería ser visible a simple vista. Los tiempos de respuesta son aceptables para un portátil multimedia. No se detectó parpadeo en varios niveles de brillo.
Sin embargo, la resolución 4K en un área que apenas es mayor que una hoja DIN A4 no parece realmente práctica. Windows recomienda un aumento del 250%, lo que parece realista. Incluso el 200% dificulta la lectura en la pantalla. Una pantalla de tamaño completo hace que trabajar en la Prestige 15 sea casi imposible. Además, es probable que muy pocos sean capaces de distinguir si la imagen mostrada está en FullHD o 4K porque los detalles son simplemente demasiado pequeños.
En cualquier caso, la pantalla está hecha para la edición de fotos. Pero tus propios ojos pueden tener problemas para reconocer este nivel de detalle. Conectar un monitor adecuado en combinación con una pantalla Full HD integrada parece más práctico
| |||||||||||||||||||||||||
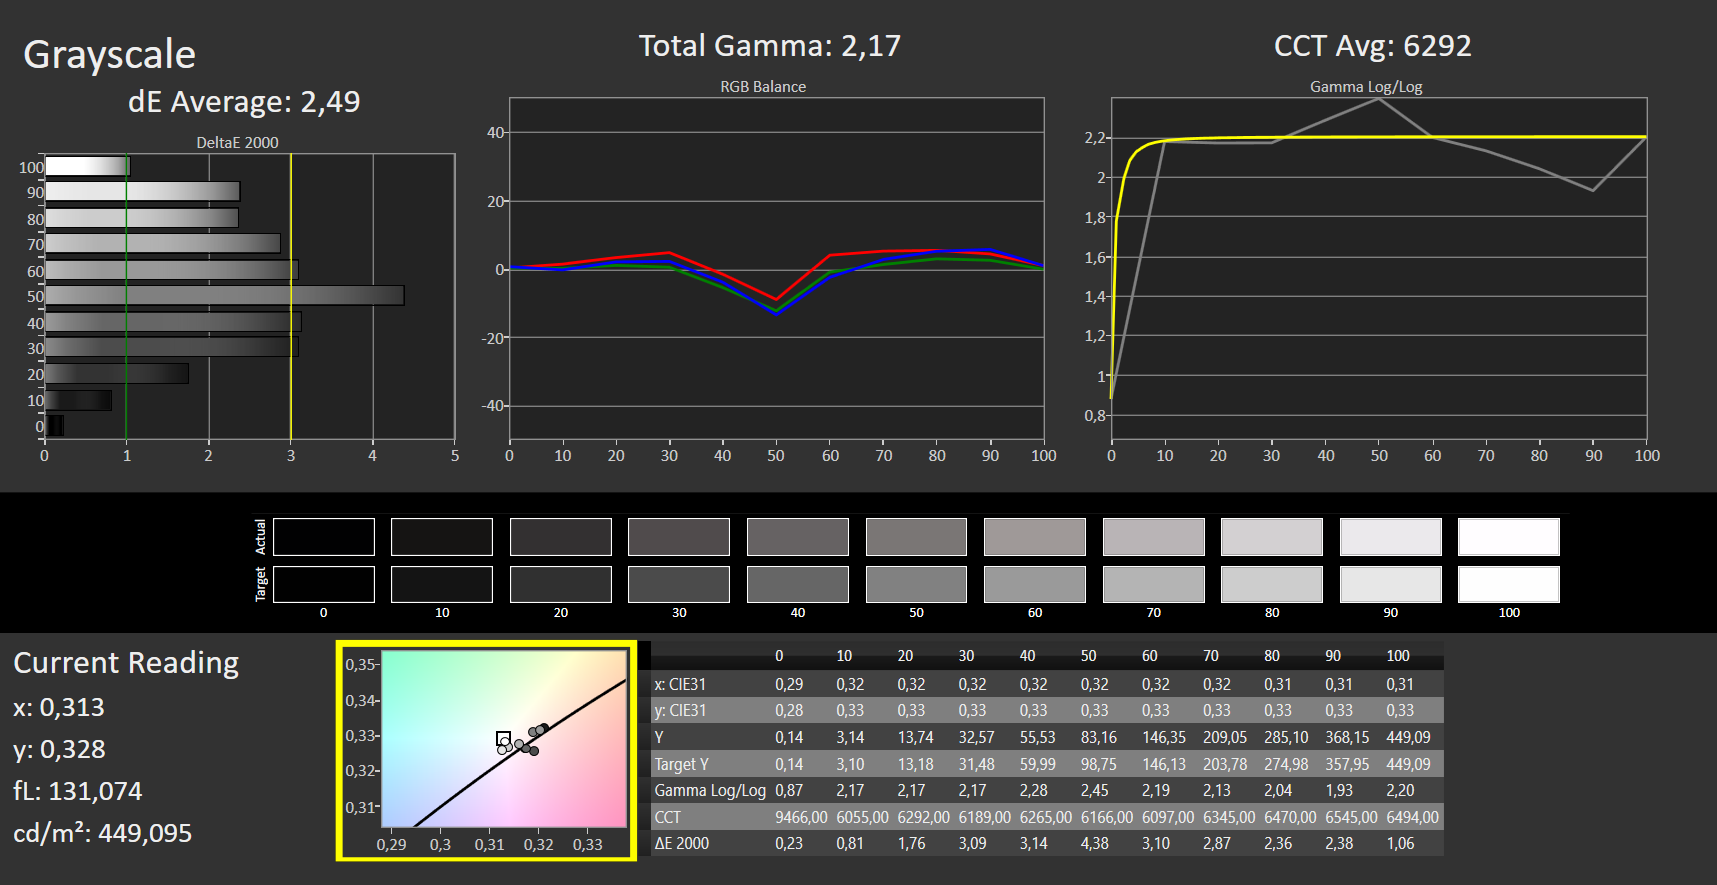
iluminación: 85 %
Brillo con batería: 441 cd/m²
Contraste: 2845:1 (Negro: 0.155 cd/m²)
ΔE ColorChecker Calman: 1.51 | ∀{0.5-29.43 Ø4.71}
ΔE Greyscale Calman: 2.49 | ∀{0.09-98 Ø4.96}
94.02% AdobeRGB 1998 (Argyll 3D)
96.95% sRGB (Argyll 3D)
80.48% Display P3 (Argyll 3D)
Gamma: 2.17
CCT: 6292 K
| MSI Prestige 15 A12UD-093 Sharp LQ156D1JW42, IPS, 3840x2160, 15.6" | Acer Swift X SFX16-52G-77RX B160QAN02.M, IPS-LED, 2560x1600, 16" | Schenker Vision 14 2022 RTX 3050 Ti MNE007ZA1-1, IPS, 2880x1800, 14" | Asus VivoBook Pro 16X OLED N7600PC-L2026X Samsung ATNA60YV02-0, OLED, 3840x2400, 16" | Lenovo IdeaPad Gaming 3 15ARH7 LEN156FHD, IPS, 1920x1080, 15.6" | Dell XPS 15 9520 RTX 3050 Ti Samsung 156XG01, OLED, 3456x2160, 15.6" | |
|---|---|---|---|---|---|---|
| Display | -7% | -9% | 10% | -49% | 5% | |
| Display P3 Coverage (%) | 80.48 | 76.4 -5% | 74.1 -8% | 99.9 24% | 39.4 -51% | 97.8 22% |
| sRGB Coverage (%) | 96.95 | 100 3% | 97.4 0% | 100 3% | 58 -40% | 99.9 3% |
| AdobeRGB 1998 Coverage (%) | 94.02 | 76.6 -19% | 75.3 -20% | 98.05 4% | 40.7 -57% | 86 -9% |
| Response Times | 39% | 41% | 95% | 44% | 95% | |
| Response Time Grey 50% / Grey 80% * (ms) | 51 ? | 33 ? 35% | 31.5 ? 38% | 1 98% | 20.8 ? 59% | 1.9 ? 96% |
| Response Time Black / White * (ms) | 26 ? | 15 ? 42% | 14.5 ? 44% | 2 ? 92% | 18.4 ? 29% | 1.9 ? 93% |
| PWM Frequency (Hz) | 247 ? | 59.52 ? | ||||
| Screen | -30% | -46% | 57% | -138% | -56% | |
| Brightness middle (cd/m²) | 441 | 411 -7% | 421 -5% | 383 -13% | 287.8 -35% | 381.4 -14% |
| Brightness (cd/m²) | 416 | 378 -9% | 416 0% | 390 -6% | 268 -36% | 384 -8% |
| Brightness Distribution (%) | 85 | 83 -2% | 89 5% | 96 13% | 86 1% | 95 12% |
| Black Level * (cd/m²) | 0.155 | 0.29 -87% | 0.28 -81% | 0.027 83% | 0.3 -94% | |
| Contrast (:1) | 2845 | 1417 -50% | 1504 -47% | 14185 399% | 959 -66% | |
| Colorchecker dE 2000 * | 1.51 | 2.18 -44% | 3.2 -112% | 2.29 -52% | 6.3 -317% | 4.34 -187% |
| Colorchecker dE 2000 max. * | 3.56 | 4.84 -36% | 5.5 -54% | 3.47 3% | 21.32 -499% | 9.24 -160% |
| Greyscale dE 2000 * | 2.49 | 2.68 -8% | 4.4 -77% | 1.84 26% | 4 -61% | 2 20% |
| Gamma | 2.17 101% | 2.43 91% | 2.22 99% | 2.32 95% | 2.21 100% | 2.13 103% |
| CCT | 6292 103% | 6717 97% | 6384 102% | 6308 103% | 6762 96% | 6210 105% |
| Colorchecker dE 2000 calibrated * | 1.48 | 2 | 2.53 | |||
| Media total (Programa/Opciones) | 1% /
-14% | -5% /
-24% | 54% /
52% | -48% /
-90% | 15% /
-12% |
* ... más pequeño es mejor
MSI promete una cobertura del 100% del espacio de color AdobeRGB en el Prestige 15. Más bien, afirma sin rodeos que debería ser el caso típico. El 94% medido está un poco lejos del objetivo, pero sigue siendo adecuado para mostrar y editar fotos a un alto nivel.
La pantalla es mucho peor a la hora de cubrir el espacio de color DCI-P3, que suele usarse para contenidos de vídeo y tiene mayores gamas de verde y amarillo. Esto no es sorprendente, ya que el enfoque es la edición de imágenes
El calibrado de fábrica especificado está ligeramente fuera de la marca en nuestra muestra de revisión con un DeltaE máximo de 2. Para ser justos, las desviaciones de color sólo son perceptibles a partir de un valor de 3, por lo que el valor medio se mantiene muy por debajo de eso.
En consecuencia, la pantalla del Prestige 15 mostrará colores casi reales sin necesidad de más ajustes
Tiempos de respuesta del display
| ↔ Tiempo de respuesta de Negro a Blanco | ||
|---|---|---|
| 26 ms ... subida ↗ y bajada ↘ combinada | ↗ 11 ms subida |  |
| ↘ 15 ms bajada | ||
| La pantalla mostró tiempos de respuesta relativamente lentos en nuestros tests pero podría ser demasiado lenta para los jugones. En comparación, todos los dispositivos de prueba van de ##min### (mínimo) a 240 (máximo) ms. » 63 % de todos los dispositivos son mejores. Eso quiere decir que el tiempo de respuesta es peor que la media (19.8 ms) de todos los dispositivos testados. | ||
| ↔ Tiempo de respuesta 50% Gris a 80% Gris | ||
| 51 ms ... subida ↗ y bajada ↘ combinada | ↗ 23 ms subida |  |
| ↘ 28 ms bajada | ||
| La pantalla mostró tiempos de respuesta lentos en nuestros tests y podría ser demasiado lenta para los jugones. En comparación, todos los dispositivos de prueba van de ##min### (mínimo) a 636 (máximo) ms. » 87 % de todos los dispositivos son mejores. Eso quiere decir que el tiempo de respuesta es peor que la media (31 ms) de todos los dispositivos testados. | ||
Parpadeo de Pantalla / PWM (Pulse-Width Modulation)
| Parpadeo de Pantalla / PWM no detectado |  | ||
Comparación: 52 % de todos los dispositivos testados no usaron PWM para atenuar el display. Si se usó, medimos una media de 7757 (mínimo: 5 - máxmo: 343500) Hz. | |||


Los textos son legibles en exteriores e incluso con luz solar directa. Por otro lado, hay que buscar un lugar con sombra para los contenidos de la pantalla en color, ya que de lo contrario la reproducción del color se resiente.
En general, la luminosidad permite utilizar el Prestige 15 en exteriores, aunque sea por poco
Como es habitual, los paneles IPS deberían garantizar una estabilidad de ángulos de visión casi perfecta, pero no es el caso del Prestige 15. Los colores y el brillo permanecen inalterados sólo hasta unos 30 grados. Más allá de eso, se aprecia una decoloración marrón, especialmente en las superficies negras.
Sospechamos que se trata de un efecto de interferencia debido a la alta densidad de píxeles, como puede verse en los experimentos de doble rendija. Otro punto que habla a favor de los modelos con pantallas Full HD.

Rendimiento: portátil creador rápido y silencioso
La combinación de un muy eficiente, pero potenteIntel Core i7-1280P y una Nvidia GeForce RTX 3050 Tigarantiza unos tiempos de espera mínimos durante el inicio del sistema y de los programas. Con 14 núcleos y 20 hilos, el MSI Prestige 15 no se deja amedrentar por la ejecución simultánea de varios programas. Por supuesto, los 32 GB de RAM también ayudan
Al igual que la variante de sobremesa grande, la RTX 3050 Ti móvil es principalmente adecuada para la edición de imágenes y vídeos. Las tareas complejas como el renderizado de vídeo y la optimización de fotos son correspondientemente rápidas. Sin embargo, los juegos revelan los límites de la GPU. Una experiencia de juego fluida sólo es realista con una resolución limitada y detalles restringidos.
Si los tiempos de procesamiento más cortos no son tan importantes para la edición de medios, nada habla en contra del Prestige 15 A12UC-099 con el Intel Core i5-1240P y 16 GB de RAM. Como mucho, las limitaciones sólo salen a relucir en la multitarea
Condiciones de la prueba
"Smart Auto" fue configurado en el MSI Center Pro para todas las pruebas. Este modo pretende asegurar que se seleccionen los ajustes más deseables para el procesador según los programas en ejecución y el entorno.
El modo ampliado con ruido de ventilador dinámico, que se supone que es menor en entornos silenciosos que en los ruidosos, parece estar aún en fase experimental. Aparte de los mensajes de error, no hay cambios notables
Por otro lado, los que quieran seleccionar el modo de rendimiento por sí mismos tienen las siguientes opciones:
| Alto rendimiento | Equilibrado | Silencioso | Super Battery | |
|---|---|---|---|---|
| PL1 | 50 vatios | 35 vatios | 20 vatios | 12 vatios |
| PL2 | 64 vatios | 40 vatios | 35 vatios | 15 vatios |
Procesador
El Intel Core i7-1280Ptiene 6 núcleos de rendimiento y 8 de eficiencia, sumando un total de 20 hilos (sólo los núcleos P soportan 2 hilos). La configuración recuerda mucho a la del Intel Core i7-12700Hque, sin embargo, está diseñado para una carga continua de 45 vatios y no sólo 28 vatios como el i7-1280P.
Al principio de nuestras pruebas de resistencia con Cinebench R15, están al menos a la par debido a la configuración comparable. Sin embargo, el Prestige 15 tiene que restringir la potencia muy rápidamente, lo que lleva a una reducción significativa del rendimiento. No obstante, la CPU se mantiene por encima de unIntel Core i7-11370Hy al nivel del AMD Ryzen 5 6600Hincluso con el freno de mano puesto.
El i7-1280P puede así utilizar sus puntos fuertes exactamente de la manera que MSI pretendía. Una cantidad extremadamente alta de rendimiento está disponible en los primeros segundos, lo cual es necesario cuando se ejecutan programas o instalaciones. El procesamiento de imágenes tampoco suele tardar más de 30 segundos, incluso en archivos de gran tamaño.
El i7-1280P puede, por tanto, seguir el ritmo del mucho más grande i7-12700H en todos los escenarios típicos. Sólo los programas más exigentes, como el software de edición de vídeo y los juegos, experimentan caídas de rendimiento. Pero éstas son menos dramáticas de lo que sugiere el consumo de energía: Mientras que el i7-12700H ofrece unos índices un 40% mejores, consume casi el doble de energía.
El procesador instalado aquí sigue estando al nivel de las CPUs no muy actualizadas que se encuentran en los portátiles para juegos. Debido a su consumo de energía significativamente menor, la ventilación sigue siendo silenciosa y la carcasa se calienta menos.
Se pueden encontrar más pruebas para diferentes procesadores en nuestraLista de pruebas de CPU.
Cinebench R15 Multi Sustained Load
Cinebench R23: Multi Core | Single Core
Cinebench R20: CPU (Multi Core) | CPU (Single Core)
Cinebench R15: CPU Multi 64Bit | CPU Single 64Bit
Blender: v2.79 BMW27 CPU
7-Zip 18.03: 7z b 4 | 7z b 4 -mmt1
Geekbench 5.5: Multi-Core | Single-Core
HWBOT x265 Benchmark v2.2: 4k Preset
LibreOffice : 20 Documents To PDF
R Benchmark 2.5: Overall mean
| CPU Performance rating | |
| Media de la clase Multimedia | |
| Dell XPS 15 9520 RTX 3050 Ti | |
| Schenker Vision 14 2022 RTX 3050 Ti | |
| MSI Prestige 15 A12UD-093 -1! | |
| Medio Intel Core i7-1280P | |
| Acer Swift X SFX16-52G-77RX | |
| Lenovo IdeaPad Gaming 3 15ARH7 | |
| Asus VivoBook Pro 16X OLED N7600PC-L2026X | |
| Cinebench R23 / Multi Core | |
| Media de la clase Multimedia (4861 - 33362, n=74, últimos 2 años) | |
| Schenker Vision 14 2022 RTX 3050 Ti | |
| Dell XPS 15 9520 RTX 3050 Ti | |
| MSI Prestige 15 A12UD-093 | |
| Medio Intel Core i7-1280P (8632 - 14803, n=8) | |
| Acer Swift X SFX16-52G-77RX | |
| Lenovo IdeaPad Gaming 3 15ARH7 | |
| Asus VivoBook Pro 16X OLED N7600PC-L2026X | |
| Cinebench R23 / Single Core | |
| Media de la clase Multimedia (1128 - 2459, n=66, últimos 2 años) | |
| Dell XPS 15 9520 RTX 3050 Ti | |
| Acer Swift X SFX16-52G-77RX | |
| Schenker Vision 14 2022 RTX 3050 Ti | |
| Medio Intel Core i7-1280P (1609 - 1787, n=7) | |
| MSI Prestige 15 A12UD-093 | |
| Asus VivoBook Pro 16X OLED N7600PC-L2026X | |
| Lenovo IdeaPad Gaming 3 15ARH7 | |
| Cinebench R20 / CPU (Multi Core) | |
| Media de la clase Multimedia (1887 - 12912, n=57, últimos 2 años) | |
| Schenker Vision 14 2022 RTX 3050 Ti | |
| Dell XPS 15 9520 RTX 3050 Ti | |
| Medio Intel Core i7-1280P (3283 - 5415, n=8) | |
| MSI Prestige 15 A12UD-093 | |
| Acer Swift X SFX16-52G-77RX | |
| Lenovo IdeaPad Gaming 3 15ARH7 | |
| Asus VivoBook Pro 16X OLED N7600PC-L2026X | |
| Cinebench R20 / CPU (Single Core) | |
| Media de la clase Multimedia (425 - 853, n=57, últimos 2 años) | |
| Schenker Vision 14 2022 RTX 3050 Ti | |
| Dell XPS 15 9520 RTX 3050 Ti | |
| MSI Prestige 15 A12UD-093 | |
| Acer Swift X SFX16-52G-77RX | |
| Medio Intel Core i7-1280P (615 - 701, n=8) | |
| Asus VivoBook Pro 16X OLED N7600PC-L2026X | |
| Lenovo IdeaPad Gaming 3 15ARH7 | |
| Cinebench R15 / CPU Multi 64Bit | |
| Media de la clase Multimedia (856 - 5224, n=61, últimos 2 años) | |
| MSI Prestige 15 A12UD-093 | |
| Dell XPS 15 9520 RTX 3050 Ti | |
| Schenker Vision 14 2022 RTX 3050 Ti | |
| Medio Intel Core i7-1280P (1905 - 2332, n=7) | |
| Acer Swift X SFX16-52G-77RX | |
| Lenovo IdeaPad Gaming 3 15ARH7 | |
| Asus VivoBook Pro 16X OLED N7600PC-L2026X | |
| Cinebench R15 / CPU Single 64Bit | |
| Media de la clase Multimedia (184.8 - 326, n=59, últimos 2 años) | |
| Schenker Vision 14 2022 RTX 3050 Ti | |
| Dell XPS 15 9520 RTX 3050 Ti | |
| Acer Swift X SFX16-52G-77RX | |
| Medio Intel Core i7-1280P (203 - 258, n=7) | |
| Lenovo IdeaPad Gaming 3 15ARH7 | |
| Asus VivoBook Pro 16X OLED N7600PC-L2026X | |
| Asus VivoBook Pro 16X OLED N7600PC-L2026X | |
| MSI Prestige 15 A12UD-093 | |
| Blender / v2.79 BMW27 CPU | |
| Asus VivoBook Pro 16X OLED N7600PC-L2026X | |
| Lenovo IdeaPad Gaming 3 15ARH7 | |
| Acer Swift X SFX16-52G-77RX | |
| MSI Prestige 15 A12UD-093 | |
| Medio Intel Core i7-1280P (259 - 309, n=7) | |
| Schenker Vision 14 2022 RTX 3050 Ti | |
| Media de la clase Multimedia (100 - 557, n=58, últimos 2 años) | |
| Dell XPS 15 9520 RTX 3050 Ti | |
| 7-Zip 18.03 / 7z b 4 | |
| Dell XPS 15 9520 RTX 3050 Ti | |
| Media de la clase Multimedia (26062 - 130368, n=55, últimos 2 años) | |
| MSI Prestige 15 A12UD-093 | |
| Schenker Vision 14 2022 RTX 3050 Ti | |
| Medio Intel Core i7-1280P (45292 - 53710, n=7) | |
| Acer Swift X SFX16-52G-77RX | |
| Lenovo IdeaPad Gaming 3 15ARH7 | |
| Asus VivoBook Pro 16X OLED N7600PC-L2026X | |
| 7-Zip 18.03 / 7z b 4 -mmt1 | |
| Media de la clase Multimedia (3666 - 7545, n=56, últimos 2 años) | |
| Schenker Vision 14 2022 RTX 3050 Ti | |
| Dell XPS 15 9520 RTX 3050 Ti | |
| MSI Prestige 15 A12UD-093 | |
| Medio Intel Core i7-1280P (4995 - 5874, n=7) | |
| Lenovo IdeaPad Gaming 3 15ARH7 | |
| Asus VivoBook Pro 16X OLED N7600PC-L2026X | |
| Acer Swift X SFX16-52G-77RX | |
| Geekbench 5.5 / Multi-Core | |
| Media de la clase Multimedia (4652 - 20422, n=56, últimos 2 años) | |
| Dell XPS 15 9520 RTX 3050 Ti | |
| MSI Prestige 15 A12UD-093 | |
| Schenker Vision 14 2022 RTX 3050 Ti | |
| Medio Intel Core i7-1280P (9623 - 11811, n=7) | |
| Acer Swift X SFX16-52G-77RX | |
| Lenovo IdeaPad Gaming 3 15ARH7 | |
| Asus VivoBook Pro 16X OLED N7600PC-L2026X | |
| Geekbench 5.5 / Single-Core | |
| Media de la clase Multimedia (805 - 2974, n=56, últimos 2 años) | |
| Acer Swift X SFX16-52G-77RX | |
| Schenker Vision 14 2022 RTX 3050 Ti | |
| Dell XPS 15 9520 RTX 3050 Ti | |
| Medio Intel Core i7-1280P (1571 - 1802, n=7) | |
| MSI Prestige 15 A12UD-093 | |
| Asus VivoBook Pro 16X OLED N7600PC-L2026X | |
| Lenovo IdeaPad Gaming 3 15ARH7 | |
| HWBOT x265 Benchmark v2.2 / 4k Preset | |
| Media de la clase Multimedia (5.26 - 36.1, n=56, últimos 2 años) | |
| Dell XPS 15 9520 RTX 3050 Ti | |
| Schenker Vision 14 2022 RTX 3050 Ti | |
| Acer Swift X SFX16-52G-77RX | |
| Medio Intel Core i7-1280P (9.62 - 14.5, n=5) | |
| Lenovo IdeaPad Gaming 3 15ARH7 | |
| Asus VivoBook Pro 16X OLED N7600PC-L2026X | |
| LibreOffice / 20 Documents To PDF | |
| MSI Prestige 15 A12UD-093 | |
| MSI Prestige 15 A12UD-093 | |
| Lenovo IdeaPad Gaming 3 15ARH7 | |
| Acer Swift X SFX16-52G-77RX | |
| Asus VivoBook Pro 16X OLED N7600PC-L2026X | |
| Medio Intel Core i7-1280P (41 - 61.6, n=8) | |
| Media de la clase Multimedia (23.9 - 146.7, n=57, últimos 2 años) | |
| Schenker Vision 14 2022 RTX 3050 Ti | |
| Dell XPS 15 9520 RTX 3050 Ti | |
| R Benchmark 2.5 / Overall mean | |
| Asus VivoBook Pro 16X OLED N7600PC-L2026X | |
| Lenovo IdeaPad Gaming 3 15ARH7 | |
| Medio Intel Core i7-1280P (0.4505 - 0.512, n=7) | |
| Acer Swift X SFX16-52G-77RX | |
| Media de la clase Multimedia (0.3604 - 0.947, n=56, últimos 2 años) | |
| Schenker Vision 14 2022 RTX 3050 Ti | |
| Dell XPS 15 9520 RTX 3050 Ti | |
| MSI Prestige 15 A12UD-093 | |
* ... más pequeño es mejor
AIDA64: FP32 Ray-Trace | FPU Julia | CPU SHA3 | CPU Queen | FPU SinJulia | FPU Mandel | CPU AES | CPU ZLib | FP64 Ray-Trace | CPU PhotoWorxx
| Performance rating | |
| Media de la clase Multimedia | |
| Lenovo IdeaPad Gaming 3 15ARH7 | |
| Schenker Vision 14 2022 RTX 3050 Ti | |
| MSI Prestige 15 A12UD-093 | |
| Medio Intel Core i7-1280P | |
| Dell XPS 15 9520 RTX 3050 Ti | |
| Acer Swift X SFX16-52G-77RX | |
| Asus VivoBook Pro 16X OLED N7600PC-L2026X | |
| AIDA64 / FP32 Ray-Trace | |
| Media de la clase Multimedia (2214 - 50388, n=53, últimos 2 años) | |
| Schenker Vision 14 2022 RTX 3050 Ti | |
| Lenovo IdeaPad Gaming 3 15ARH7 | |
| MSI Prestige 15 A12UD-093 | |
| Medio Intel Core i7-1280P (7466 - 13068, n=6) | |
| Acer Swift X SFX16-52G-77RX | |
| Dell XPS 15 9520 RTX 3050 Ti | |
| Asus VivoBook Pro 16X OLED N7600PC-L2026X | |
| AIDA64 / FPU Julia | |
| Media de la clase Multimedia (12867 - 201874, n=54, últimos 2 años) | |
| Lenovo IdeaPad Gaming 3 15ARH7 | |
| Schenker Vision 14 2022 RTX 3050 Ti | |
| MSI Prestige 15 A12UD-093 | |
| Medio Intel Core i7-1280P (38904 - 66081, n=6) | |
| Acer Swift X SFX16-52G-77RX | |
| Dell XPS 15 9520 RTX 3050 Ti | |
| Asus VivoBook Pro 16X OLED N7600PC-L2026X | |
| AIDA64 / CPU SHA3 | |
| Media de la clase Multimedia (626 - 8623, n=54, últimos 2 años) | |
| Schenker Vision 14 2022 RTX 3050 Ti | |
| Dell XPS 15 9520 RTX 3050 Ti | |
| MSI Prestige 15 A12UD-093 | |
| Lenovo IdeaPad Gaming 3 15ARH7 | |
| Medio Intel Core i7-1280P (1826 - 2992, n=6) | |
| Acer Swift X SFX16-52G-77RX | |
| Asus VivoBook Pro 16X OLED N7600PC-L2026X | |
| AIDA64 / CPU Queen | |
| Dell XPS 15 9520 RTX 3050 Ti | |
| Medio Intel Core i7-1280P (80180 - 100358, n=6) | |
| Schenker Vision 14 2022 RTX 3050 Ti | |
| Acer Swift X SFX16-52G-77RX | |
| MSI Prestige 15 A12UD-093 | |
| Lenovo IdeaPad Gaming 3 15ARH7 | |
| Media de la clase Multimedia (13483 - 181505, n=41, últimos 2 años) | |
| Asus VivoBook Pro 16X OLED N7600PC-L2026X | |
| AIDA64 / FPU SinJulia | |
| Lenovo IdeaPad Gaming 3 15ARH7 | |
| Media de la clase Multimedia (886 - 28794, n=54, últimos 2 años) | |
| Dell XPS 15 9520 RTX 3050 Ti | |
| Schenker Vision 14 2022 RTX 3050 Ti | |
| MSI Prestige 15 A12UD-093 | |
| Medio Intel Core i7-1280P (5880 - 8571, n=6) | |
| Acer Swift X SFX16-52G-77RX | |
| Asus VivoBook Pro 16X OLED N7600PC-L2026X | |
| AIDA64 / FPU Mandel | |
| Media de la clase Multimedia (6395 - 105740, n=53, últimos 2 años) | |
| Lenovo IdeaPad Gaming 3 15ARH7 | |
| Schenker Vision 14 2022 RTX 3050 Ti | |
| MSI Prestige 15 A12UD-093 | |
| Medio Intel Core i7-1280P (18907 - 32766, n=6) | |
| Acer Swift X SFX16-52G-77RX | |
| Dell XPS 15 9520 RTX 3050 Ti | |
| Asus VivoBook Pro 16X OLED N7600PC-L2026X | |
| AIDA64 / CPU AES | |
| Lenovo IdeaPad Gaming 3 15ARH7 | |
| MSI Prestige 15 A12UD-093 | |
| Dell XPS 15 9520 RTX 3050 Ti | |
| Schenker Vision 14 2022 RTX 3050 Ti | |
| Media de la clase Multimedia (8171 - 126790, n=54, últimos 2 años) | |
| Asus VivoBook Pro 16X OLED N7600PC-L2026X | |
| Medio Intel Core i7-1280P (40691 - 99367, n=6) | |
| Acer Swift X SFX16-52G-77RX | |
| AIDA64 / CPU ZLib | |
| Media de la clase Multimedia (143.8 - 2022, n=54, últimos 2 años) | |
| Schenker Vision 14 2022 RTX 3050 Ti | |
| Dell XPS 15 9520 RTX 3050 Ti | |
| Medio Intel Core i7-1280P (540 - 880, n=6) | |
| MSI Prestige 15 A12UD-093 | |
| Acer Swift X SFX16-52G-77RX | |
| Lenovo IdeaPad Gaming 3 15ARH7 | |
| Asus VivoBook Pro 16X OLED N7600PC-L2026X | |
| AIDA64 / FP64 Ray-Trace | |
| Media de la clase Multimedia (1014 - 26875, n=54, últimos 2 años) | |
| Schenker Vision 14 2022 RTX 3050 Ti | |
| Lenovo IdeaPad Gaming 3 15ARH7 | |
| Medio Intel Core i7-1280P (4006 - 7184, n=6) | |
| MSI Prestige 15 A12UD-093 | |
| Acer Swift X SFX16-52G-77RX | |
| Dell XPS 15 9520 RTX 3050 Ti | |
| Asus VivoBook Pro 16X OLED N7600PC-L2026X | |
| AIDA64 / CPU PhotoWorxx | |
| Media de la clase Multimedia (8187 - 88154, n=54, últimos 2 años) | |
| MSI Prestige 15 A12UD-093 | |
| Acer Swift X SFX16-52G-77RX | |
| Medio Intel Core i7-1280P (36663 - 48416, n=6) | |
| Dell XPS 15 9520 RTX 3050 Ti | |
| Schenker Vision 14 2022 RTX 3050 Ti | |
| Lenovo IdeaPad Gaming 3 15ARH7 | |
| Asus VivoBook Pro 16X OLED N7600PC-L2026X | |
Rendimiento del sistema
Nuestra buena impresión, aunque subjetiva, se refleja en las puntuaciones de PCMark. La prueba estandarizada y relativamente realista sitúa al MSI Prestige 15 en lo alto de la clasificación. El procesador y la tarjeta gráfica, que son muy potentes durante periodos cortos de tiempo, nunca tienen dificultades.
Una razón para esto es también la frugalidad bajo carga sostenida. El sistema no se calienta tanto aquí. Por lo tanto, el máximo rendimiento está siempre disponible cuando se necesita, como cuando se tiene que iniciar un programa, que entonces es sólo por breves momentos.
La gran potencia de cálculo se nota siempre al navegar, instalar e iniciar juegos.
CrossMark: Overall | Productivity | Creativity | Responsiveness
| PCMark 10 / Score | |
| Media de la clase Multimedia (4325 - 10386, n=52, últimos 2 años) | |
| Dell XPS 15 9520 RTX 3050 Ti | |
| Schenker Vision 14 2022 RTX 3050 Ti | |
| MSI Prestige 15 A12UD-093 | |
| Medio Intel Core i7-1280P, NVIDIA GeForce RTX 3050 Ti Laptop GPU (5984 - 6379, n=2) | |
| Lenovo IdeaPad Gaming 3 15ARH7 | |
| Acer Swift X SFX16-52G-77RX | |
| Asus VivoBook Pro 16X OLED N7600PC-L2026X | |
| PCMark 10 / Essentials | |
| Dell XPS 15 9520 RTX 3050 Ti | |
| Acer Swift X SFX16-52G-77RX | |
| Media de la clase Multimedia (8025 - 11664, n=51, últimos 2 años) | |
| Schenker Vision 14 2022 RTX 3050 Ti | |
| MSI Prestige 15 A12UD-093 | |
| Medio Intel Core i7-1280P, NVIDIA GeForce RTX 3050 Ti Laptop GPU (9687 - 10227, n=2) | |
| Lenovo IdeaPad Gaming 3 15ARH7 | |
| Asus VivoBook Pro 16X OLED N7600PC-L2026X | |
| PCMark 10 / Productivity | |
| Media de la clase Multimedia (7323 - 18233, n=51, últimos 2 años) | |
| Dell XPS 15 9520 RTX 3050 Ti | |
| MSI Prestige 15 A12UD-093 | |
| Lenovo IdeaPad Gaming 3 15ARH7 | |
| Schenker Vision 14 2022 RTX 3050 Ti | |
| Asus VivoBook Pro 16X OLED N7600PC-L2026X | |
| Medio Intel Core i7-1280P, NVIDIA GeForce RTX 3050 Ti Laptop GPU (7521 - 9165, n=2) | |
| Acer Swift X SFX16-52G-77RX | |
| PCMark 10 / Digital Content Creation | |
| Media de la clase Multimedia (3651 - 16240, n=51, últimos 2 años) | |
| Dell XPS 15 9520 RTX 3050 Ti | |
| Schenker Vision 14 2022 RTX 3050 Ti | |
| Medio Intel Core i7-1280P, NVIDIA GeForce RTX 3050 Ti Laptop GPU (7518 - 7980, n=2) | |
| Acer Swift X SFX16-52G-77RX | |
| MSI Prestige 15 A12UD-093 | |
| Lenovo IdeaPad Gaming 3 15ARH7 | |
| Asus VivoBook Pro 16X OLED N7600PC-L2026X | |
| CrossMark / Overall | |
| Media de la clase Multimedia (866 - 2728, n=60, últimos 2 años) | |
| Dell XPS 15 9520 RTX 3050 Ti | |
| Acer Swift X SFX16-52G-77RX | |
| MSI Prestige 15 A12UD-093 | |
| Medio Intel Core i7-1280P, NVIDIA GeForce RTX 3050 Ti Laptop GPU (1652 - 1671, n=2) | |
| Schenker Vision 14 2022 RTX 3050 Ti | |
| Lenovo IdeaPad Gaming 3 15ARH7 | |
| Asus VivoBook Pro 16X OLED N7600PC-L2026X | |
| CrossMark / Productivity | |
| Dell XPS 15 9520 RTX 3050 Ti | |
| Media de la clase Multimedia (931 - 2489, n=60, últimos 2 años) | |
| Acer Swift X SFX16-52G-77RX | |
| Schenker Vision 14 2022 RTX 3050 Ti | |
| MSI Prestige 15 A12UD-093 | |
| Medio Intel Core i7-1280P, NVIDIA GeForce RTX 3050 Ti Laptop GPU (1583 - 1618, n=2) | |
| Lenovo IdeaPad Gaming 3 15ARH7 | |
| Asus VivoBook Pro 16X OLED N7600PC-L2026X | |
| CrossMark / Creativity | |
| Media de la clase Multimedia (907 - 3465, n=60, últimos 2 años) | |
| Dell XPS 15 9520 RTX 3050 Ti | |
| Acer Swift X SFX16-52G-77RX | |
| Medio Intel Core i7-1280P, NVIDIA GeForce RTX 3050 Ti Laptop GPU (1752 - 1761, n=2) | |
| MSI Prestige 15 A12UD-093 | |
| Schenker Vision 14 2022 RTX 3050 Ti | |
| Lenovo IdeaPad Gaming 3 15ARH7 | |
| Asus VivoBook Pro 16X OLED N7600PC-L2026X | |
| CrossMark / Responsiveness | |
| Dell XPS 15 9520 RTX 3050 Ti | |
| Acer Swift X SFX16-52G-77RX | |
| MSI Prestige 15 A12UD-093 | |
| Medio Intel Core i7-1280P, NVIDIA GeForce RTX 3050 Ti Laptop GPU (1550 - 1594, n=2) | |
| Schenker Vision 14 2022 RTX 3050 Ti | |
| Media de la clase Multimedia (605 - 2024, n=60, últimos 2 años) | |
| Lenovo IdeaPad Gaming 3 15ARH7 | |
| Asus VivoBook Pro 16X OLED N7600PC-L2026X | |
| PCMark 10 Score | 6379 puntos | |
ayuda | ||
| AIDA64 / Memory Copy | |
| Media de la clase Multimedia (11299 - 132135, n=54, últimos 2 años) | |
| Medio Intel Core i7-1280P (56337 - 73486, n=6) | |
| Acer Swift X SFX16-52G-77RX | |
| MSI Prestige 15 A12UD-093 | |
| Dell XPS 15 9520 RTX 3050 Ti | |
| Schenker Vision 14 2022 RTX 3050 Ti | |
| Asus VivoBook Pro 16X OLED N7600PC-L2026X | |
| Lenovo IdeaPad Gaming 3 15ARH7 | |
| AIDA64 / Memory Read | |
| Media de la clase Multimedia (11624 - 174586, n=54, últimos 2 años) | |
| Medio Intel Core i7-1280P (63221 - 73719, n=6) | |
| Acer Swift X SFX16-52G-77RX | |
| MSI Prestige 15 A12UD-093 | |
| Dell XPS 15 9520 RTX 3050 Ti | |
| Schenker Vision 14 2022 RTX 3050 Ti | |
| Asus VivoBook Pro 16X OLED N7600PC-L2026X | |
| Lenovo IdeaPad Gaming 3 15ARH7 | |
| AIDA64 / Memory Write | |
| Media de la clase Multimedia (11755 - 134998, n=54, últimos 2 años) | |
| MSI Prestige 15 A12UD-093 | |
| Medio Intel Core i7-1280P (58729 - 68247, n=6) | |
| Acer Swift X SFX16-52G-77RX | |
| Dell XPS 15 9520 RTX 3050 Ti | |
| Schenker Vision 14 2022 RTX 3050 Ti | |
| Asus VivoBook Pro 16X OLED N7600PC-L2026X | |
| Lenovo IdeaPad Gaming 3 15ARH7 | |
| AIDA64 / Memory Latency | |
| Media de la clase Multimedia (7 - 535, n=53, últimos 2 años) | |
| Acer Swift X SFX16-52G-77RX | |
| Medio Intel Core i7-1280P (93.1 - 153.3, n=6) | |
| Dell XPS 15 9520 RTX 3050 Ti | |
| MSI Prestige 15 A12UD-093 | |
| Schenker Vision 14 2022 RTX 3050 Ti | |
| Asus VivoBook Pro 16X OLED N7600PC-L2026X | |
| Lenovo IdeaPad Gaming 3 15ARH7 | |
* ... más pequeño es mejor
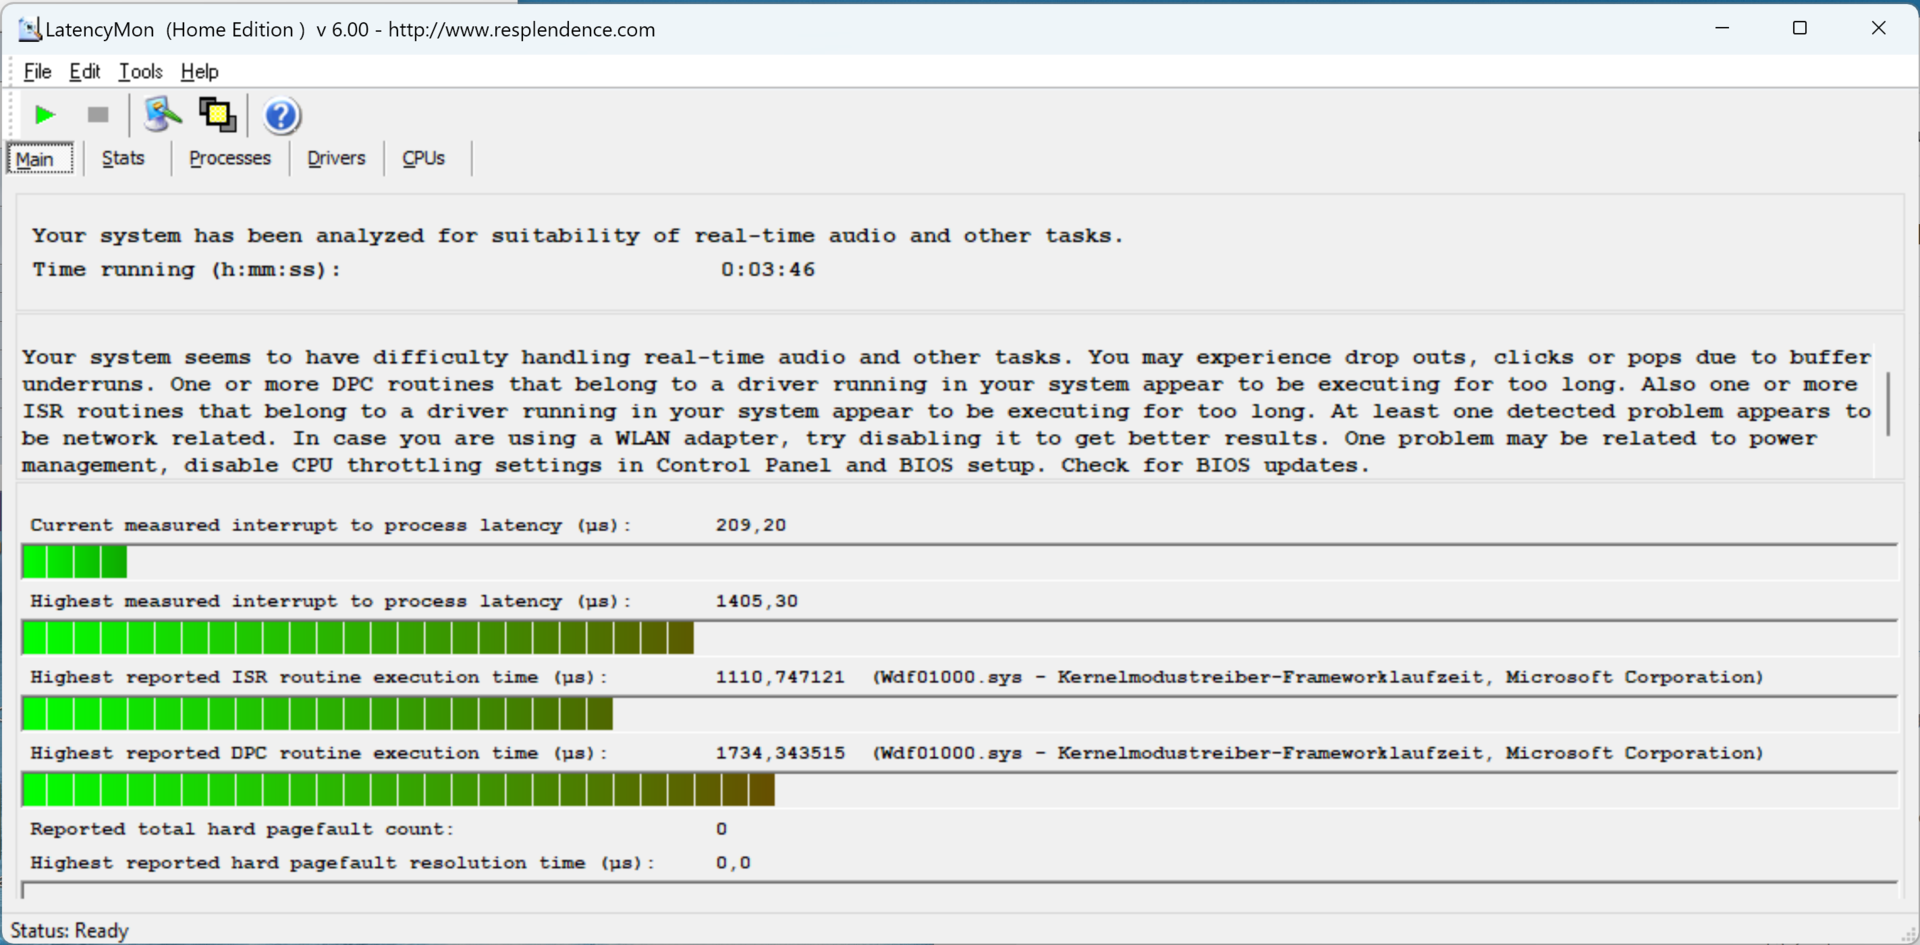
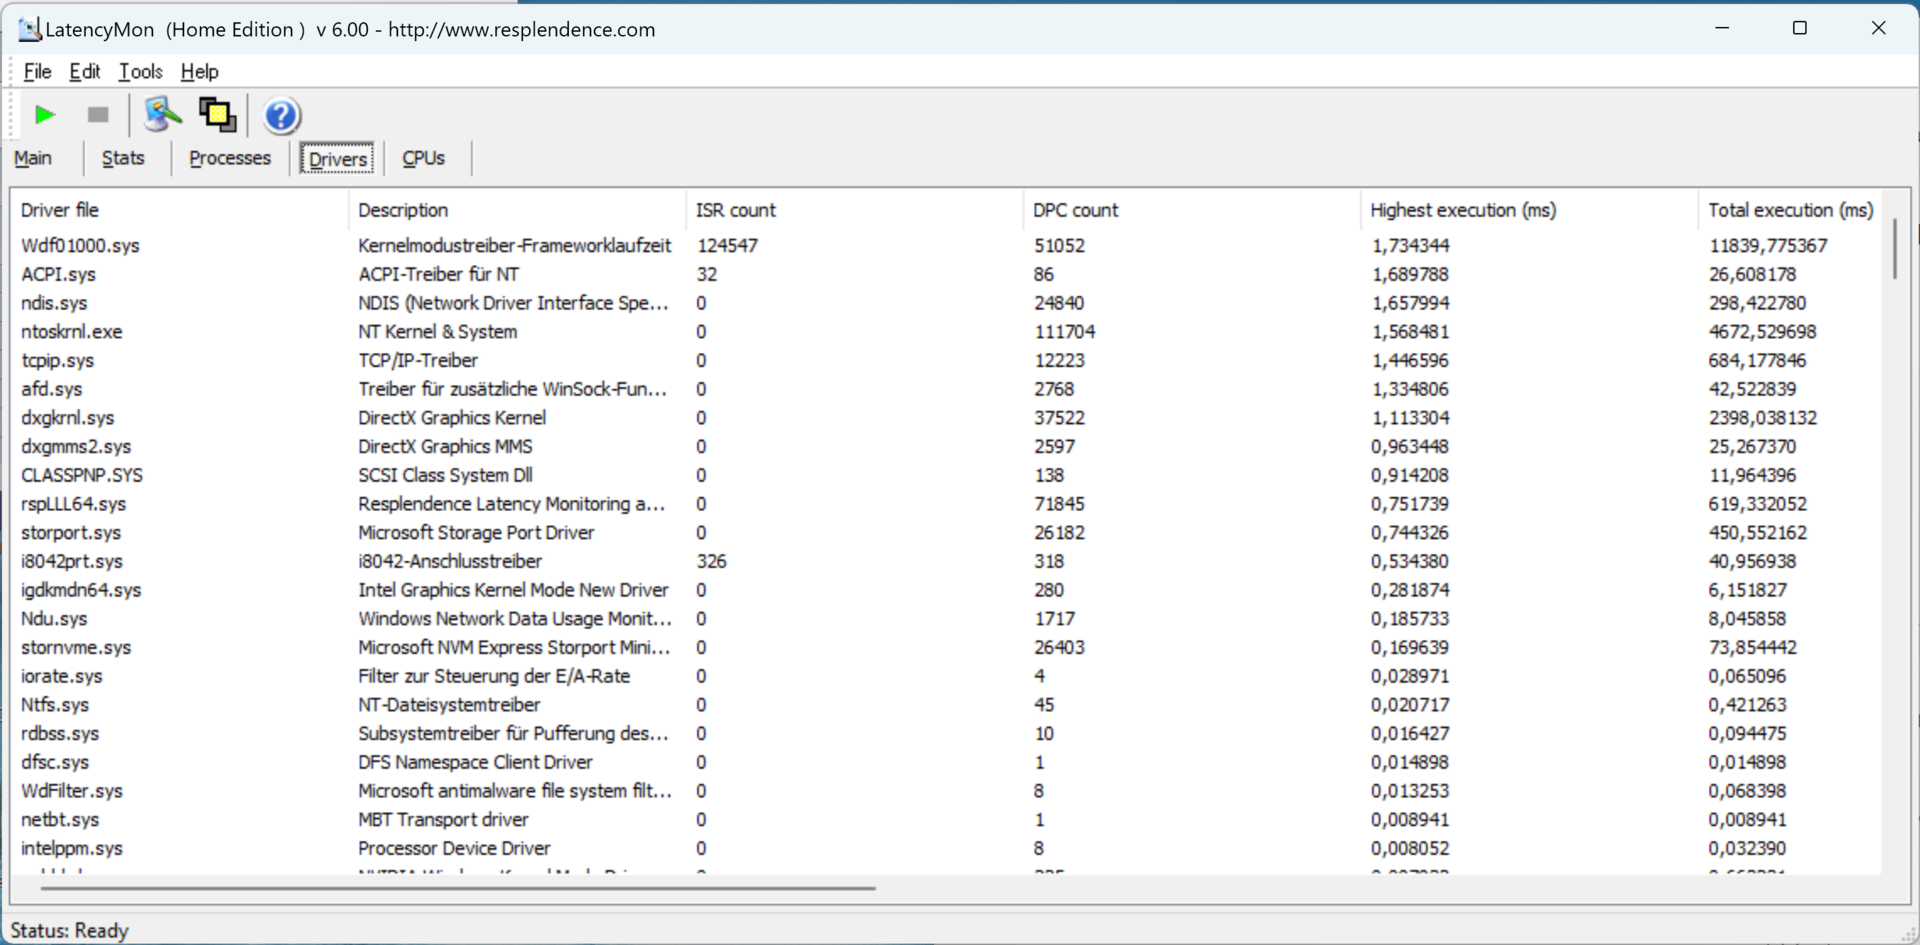
Latencia del CPD
La Prestige 15 no es adecuada para la edición de audio y vídeo en tiempo real. Tiene la mayor latencia en el campo de los competidores.
El marco de controladores en modo kernel es el principal responsable de esto. Un ajuste de la configuración de los controladores, actualizaciones y demás pueden remediar el problema
| DPC Latencies / LatencyMon - interrupt to process latency (max), Web, Youtube, Prime95 | |
| MSI Prestige 15 A12UD-093 | |
| Dell XPS 15 9520 RTX 3050 Ti | |
| Schenker Vision 14 2022 RTX 3050 Ti | |
| Acer Swift X SFX16-52G-77RX | |
| Lenovo IdeaPad Gaming 3 15ARH7 | |
| Asus VivoBook Pro 16X OLED N7600PC-L2026X | |
* ... más pequeño es mejor
Dispositivos de almacenamiento
El SSD de Micron alcanza más de 6.000 MB/s en lectura secuencial. Esta tasa también se mantiene estable durante largos periodos de tiempo, lo que habla de la adecuada refrigeración del hardware.
Esto significa que la interfaz PCIe 4.0 se puede utilizar bien con el SSD M.2. Sin embargo, las otras tasas no están a la altura de los mejores discos duros. Pero esto no tiene ningún efecto negativo para un portátil rápido, aunque no sea un creador excepcional.
Por otro lado, el tamaño de 1 TB es adecuado. Los datos en bruto, ya sean vídeos o imágenes, ocupan mucho espacio. Así que tiene sentido la segunda ranura para SSD, a la que se puede acceder fácilmente sin importar el sello

* ... más pequeño es mejor
Sustained Read Performance: DiskSpd Read Loop, Queue Depth 8
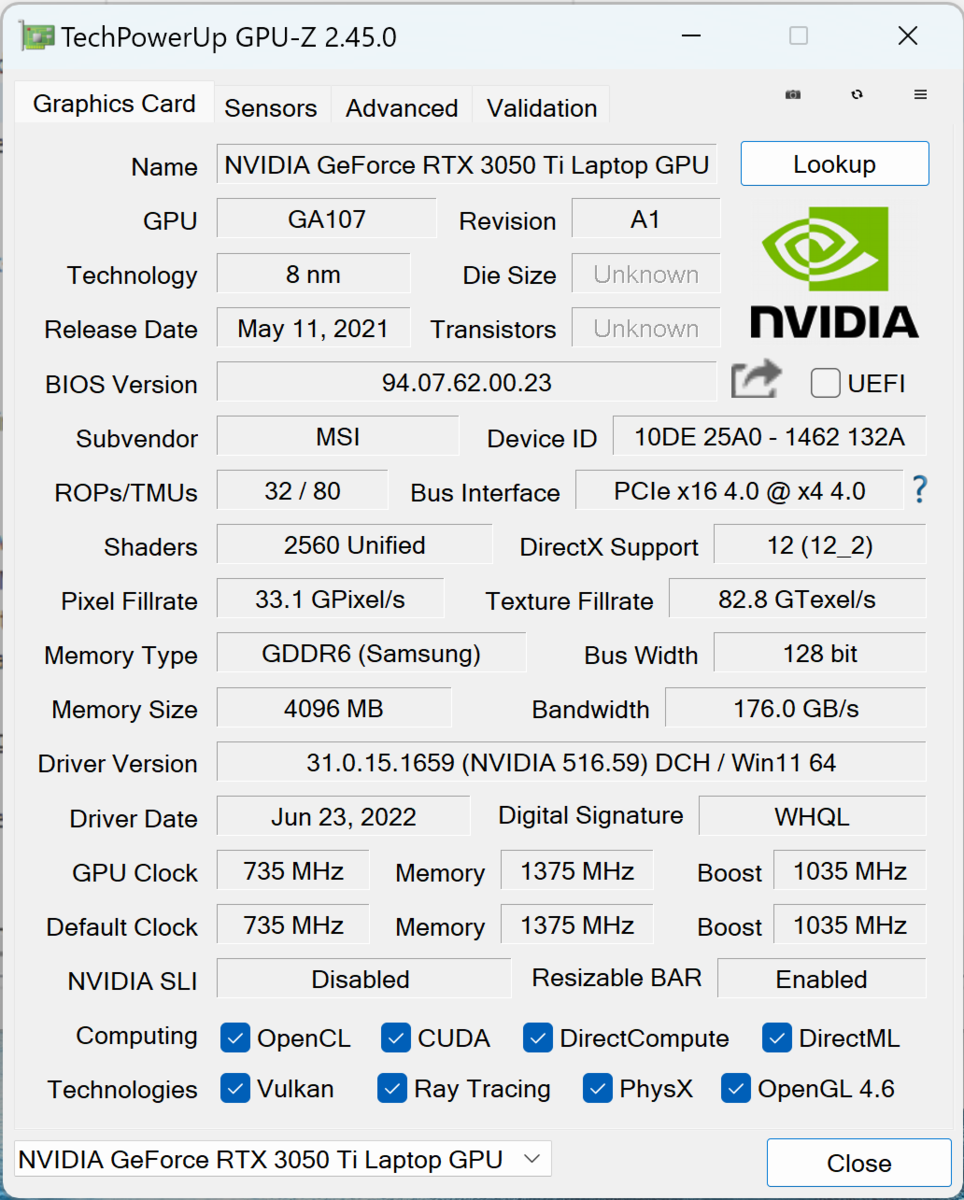
Tarjeta gráfica
La página web Nvidia GeForce RTX 3050 Tino es la recomendación más sólida para los juegos, incluso cuando está libre de limitaciones. Aquí está limitada a un máximo de 40 vatios en el MSI Prestige 15, lo que reduce aún más el rendimiento en funcionamiento continuo. Al menos en teoría, es posible un funcionamiento de hasta 80 vatios.
Por supuesto, esto no es necesario aquí. Al igual que el procesador, el chip gráfico sólo pretende ofrecer potentes ráfagas de rendimiento para acelerar los procesos del programa. Esto lo consigue de forma muy convincente en comparación con un GeForce MX450. Por otro lado, el Intel Arc A370M, que en realidad es algo más débil de media en nuestras mediciones, es capaz de superar a la estrangulada RTX 3050 Ti.
Este limitado consumo de energía garantiza que no haya una caída del rendimiento ni siquiera bajo carga sostenida. Incluso en modo batería, el rendimiento gráfico se mantiene aproximadamente al mismo nivel. Esta decisión parece lógica, ya que los portátiles multimedia no deberían tardar más en editar imágenes sólo porque no haya una toma de corriente cerca.
Sin embargo, el hecho de que las mejores tasas de rendimiento se consigan en modo batería podría deberse a que el software MSI Center Pro no está configurado correctamente. El sistema recibe entonces más energía que con el adaptador de corriente conectado
Se pueden encontrar más pruebas de rendimiento de la GPUaquí.
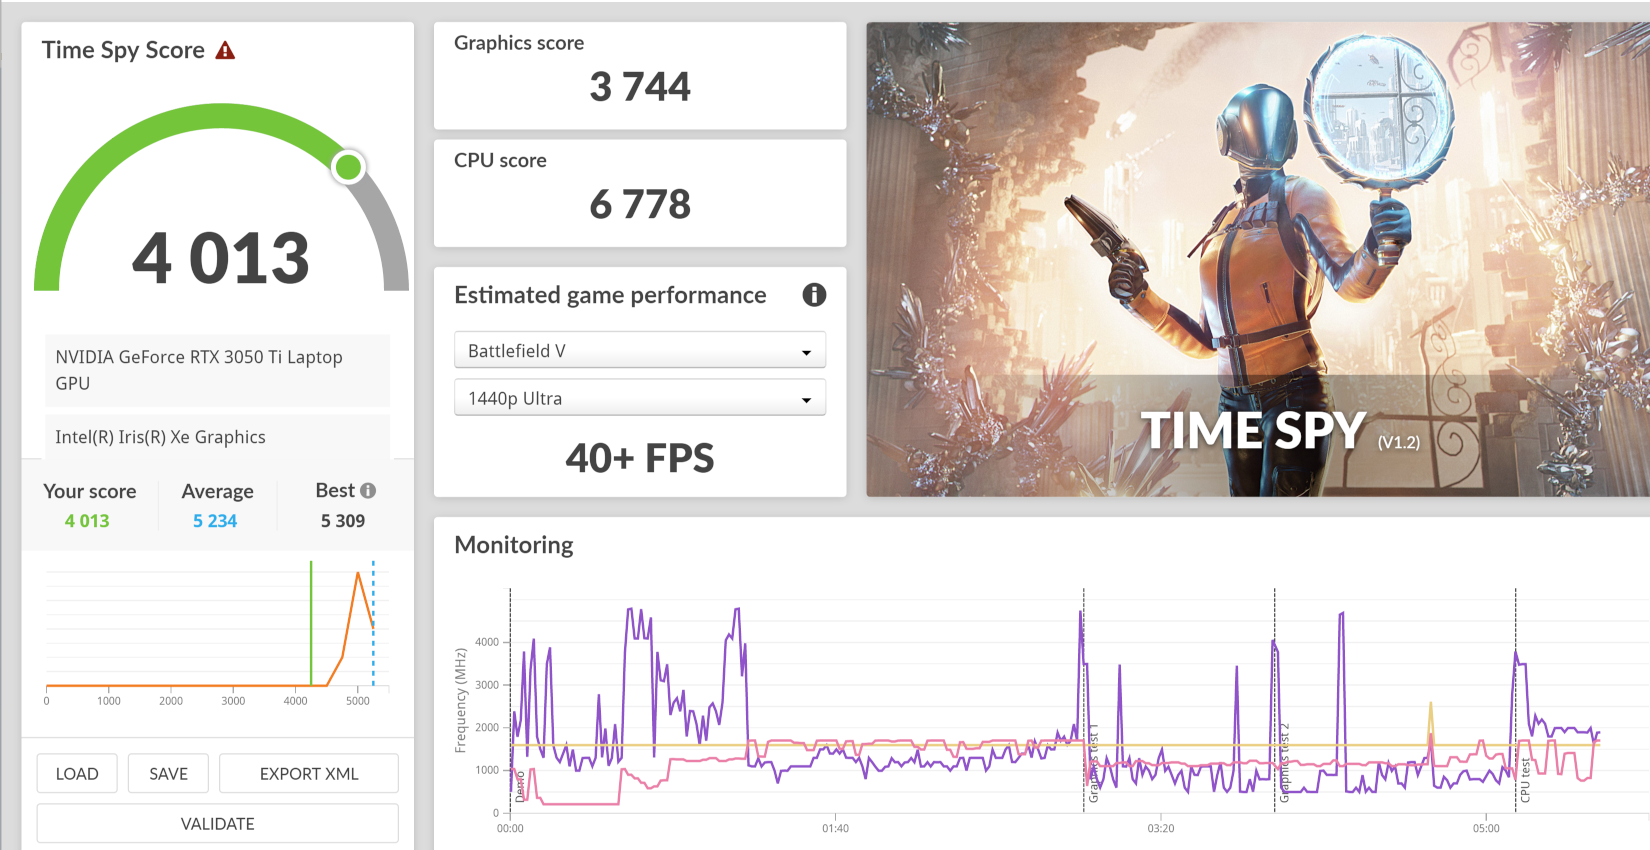
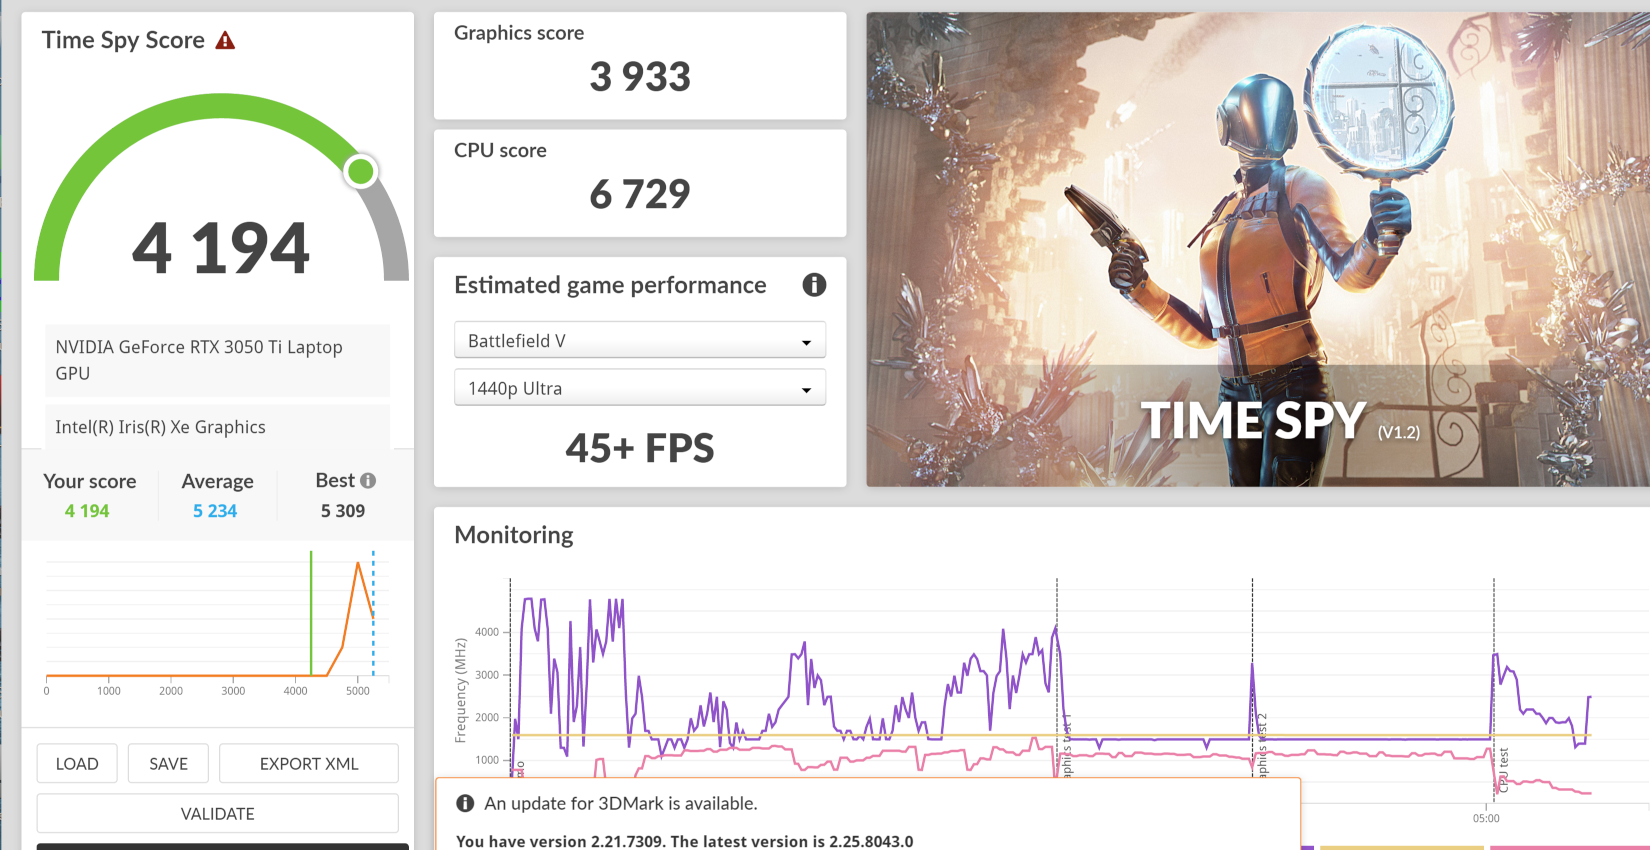
| 3DMark 11 Performance | 8322 puntos | |
| 3DMark Cloud Gate Standard Score | 21679 puntos | |
| 3DMark Fire Strike Score | 6670 puntos | |
| 3DMark Time Spy Score | 4013 puntos | |
ayuda | ||
* ... más pequeño es mejor
Rendimiento de los juegos
La limitación de la tarjeta gráfica a 35 vatios o 40 vatios en modo turbo y la configuración general del sistema para operaciones silenciosas deprimen constantemente los valores medidos en el juego. Incluso el Acer Swift X SFX16con el nominalmente más débil Intel Arc A370M ofrece mejores velocidades de fotogramas en algunos juegos.
Una vez más, se puede atribuir al Prestige 15 el hecho de que simplemente no está diseñado para una carga sostenida de la CPU y la GPU y que sus puntos fuertes residen en otra parte. Aun así, creemos que al sistema le vendría bien un "modo de alto rendimiento". El hardware para ello está ahí, pero siempre funciona en modo económico
| The Witcher 3 - 1920x1080 Ultra Graphics & Postprocessing (HBAO+) | |
| Lenovo IdeaPad Gaming 3 15ARH7 | |
| Media de la clase Multimedia (11 - 121, n=7, últimos 2 años) | |
| Asus VivoBook Pro 16X OLED N7600PC-L2026X | |
| Schenker Vision 14 2022 RTX 3050 Ti | |
| Dell XPS 15 9520 RTX 3050 Ti | |
| Acer Swift X SFX16-52G-77RX | |
| MSI Prestige 15 A12UD-093 | |
| F1 22 | |
| 1920x1080 Ultra High Preset AA:T AF:16x | |
| Schenker Vision 14 2022 RTX 3050 Ti | |
| Medio NVIDIA GeForce RTX 3050 Ti Laptop GPU (16 - 35, n=7) | |
| Media de la clase Multimedia (11 - 54.1, n=8, últimos 2 años) | |
| Asus VivoBook Pro 16X OLED N7600PC-L2026X | |
| MSI Prestige 15 A12UD-093 | |
| 3840x2160 Ultra High Preset AA:T AF:16x | |
| MSI Prestige 15 A12UD-093 | |
| Medio NVIDIA GeForce RTX 3050 Ti Laptop GPU (n=1) | |
La diferencia se hace evidente cuando comparamos un pequeño portátil para juegos con una GPU idéntica. El Lenovo IdeaPad Gaming 3 15IAH7ofrece el doble de velocidad de fotogramas y esto parece ser incluso más consistente que en el MSI Prestige 15.
Los portátiles con una iGPU son, sin embargo, bastante más débiles, como puede verse en el ejemplo delAsus ExpertBook Flip 2 con su Iris Xe G7. El Intel Arc A350M en el Samsung Galaxy Book 2 15 está a la par.
Witcher 3 FPS Chart
| bajo | medio | alto | ultra | QHD | 4K | |
|---|---|---|---|---|---|---|
| GTA V (2015) | 144 | 136 | 53.8 | 27.8 | 22.8 | |
| The Witcher 3 (2015) | 75 | 48 | 30 | 19 | 10 | |
| Dota 2 Reborn (2015) | 153.8 | 111.9 | 74.8 | 67.3 | 31.9 | |
| Final Fantasy XV Benchmark (2018) | 55.9 | 33.4 | 23.5 | 18.4 | 12.8 | |
| X-Plane 11.11 (2018) | 100.8 | 72.7 | 62 | 32.8 | ||
| Far Cry 5 (2018) | 56 | 44 | 36 | 30 | 19 | 13 |
| Strange Brigade (2018) | 103.3 | 53 | 34.8 | 28.1 | 18.9 | |
| F1 22 (2022) | 70 | 63 | 48 | 16 | 10 | 4 |
Emisiones - El portátil de MSI se mantiene silencioso y fresco
Ruido
Los ventiladores casi nunca están completamente quietos. Siempre son audibles en el fondo durante el uso normal, pero de ninguna manera son incómodos cuando cambian de velocidad o se aceleran brevemente.
Bajo carga, la refrigeración es particularmente eficiente en comparación con muchos rivales. Se vuelve un poco más ruidosa, pero sigue siendo discreta y notablemente más silenciosa que en muchos portátiles similares.
Ruido
| Ocioso |
| 26 / 30.7 / 30.7 dB(A) |
| Carga |
| 41.9 / 40.7 dB(A) |
 | ||
30 dB silencioso 40 dB(A) audible 50 dB(A) ruidosamente alto |
||
min: | ||
| MSI Prestige 15 A12UD-093 GeForce RTX 3050 Ti Laptop GPU, i7-1280P, Micron 3400 1TB MTFDKBA1T0TFH | Acer Swift X SFX16-52G-77RX A370M, i7-1260P, WDC PC SN810 1TB | Schenker Vision 14 2022 RTX 3050 Ti GeForce RTX 3050 Ti Laptop GPU, i7-12700H, Samsung SSD 980 Pro 1TB MZ-V8P1T0BW | Asus VivoBook Pro 16X OLED N7600PC-L2026X GeForce RTX 3050 4GB Laptop GPU, i7-11370H, Intel Optane Memory H10 with Solid State Storage 32GB + 512GB HBRPEKNX0202A(L/H) | Lenovo IdeaPad Gaming 3 15ARH7 GeForce RTX 3050 4GB Laptop GPU, R5 6600H, Lenovo UMIS AM630 RPJTJ256MGE1QDY | Dell XPS 15 9520 RTX 3050 Ti GeForce RTX 3050 Ti Laptop GPU, i7-12700H, WDC PC SN810 512GB | |
|---|---|---|---|---|---|---|
| Noise | 5% | 3% | -17% | 8% | 15% | |
| apagado / medio ambiente * (dB) | 26 | 25 4% | 24.4 6% | 25.15 3% | 23.3 10% | 22.8 12% |
| Idle Minimum * (dB) | 26 | 25 4% | 24.4 6% | 30 -15% | 23.8 8% | 22.9 12% |
| Idle Average * (dB) | 30.7 | 25 19% | 24.4 21% | 30 2% | 23.8 22% | 22.9 25% |
| Idle Maximum * (dB) | 30.7 | 25 19% | 27.8 9% | 30 2% | 27.2 11% | 22.9 25% |
| Load Average * (dB) | 41.9 | 44.7 -7% | 43.3 -3% | 57.6 -37% | 34.8 17% | 30.9 26% |
| Load Maximum * (dB) | 40.7 | 45.6 -12% | 48.8 -20% | 62.9 -55% | 49.4 -21% | 44.7 -10% |
| Witcher 3 ultra * (dB) | 48.2 | 49.3 | 37.8 |
* ... más pequeño es mejor
Temperatura
El portátil Creator no sólo es silencioso, sino también fresco. Las temperaturas sólo se elevan a más de 50 °C en casos extremos en el borde superior, que también alberga las ranuras de ventilación. Por otro lado, si utilizas el portátil normalmente y no para pruebas de estrés, es poco probable que sientas algo más que un ligero calentamiento.
La distribución del calor es especialmente acertada. Las altas temperaturas están completamente ausentes en la zona del reposamanos, y el aumento de la temperatura de la carcasa sólo se nota en la zona superior del teclado
(-) La temperatura máxima en la parte superior es de 49 °C / 120 F, frente a la media de 36.8 °C / 98 F, que oscila entre 21 y 71 °C para la clase Multimedia.
(-) El fondo se calienta hasta un máximo de 52.6 °C / 127 F, frente a la media de 39.1 °C / 102 F
(+) En reposo, la temperatura media de la parte superior es de 27.7 °C / 82# F, frente a la media del dispositivo de 31.3 °C / 88 F.
(±) Jugando a The Witcher 3, la temperatura media de la parte superior es de 34.9 °C / 95 F, frente a la media del dispositivo de 31.3 °C / 88 F.
(+) El reposamanos y el panel táctil están a una temperatura inferior a la de la piel, con un máximo de 29.5 °C / 85.1 F y, por tanto, son fríos al tacto.
(±) La temperatura media de la zona del reposamanos de dispositivos similares fue de 28.7 °C / 83.7 F (-0.8 °C / -1.4 F).
| MSI Prestige 15 A12UD-093 Intel Core i7-1280P, NVIDIA GeForce RTX 3050 Ti Laptop GPU | Acer Swift X SFX16-52G-77RX Intel Core i7-1260P, Intel Arc A370M | Schenker Vision 14 2022 RTX 3050 Ti Intel Core i7-12700H, NVIDIA GeForce RTX 3050 Ti Laptop GPU | Asus VivoBook Pro 16X OLED N7600PC-L2026X Intel Core i7-11370H, NVIDIA GeForce RTX 3050 4GB Laptop GPU | Lenovo IdeaPad Gaming 3 15ARH7 AMD Ryzen 5 6600H, NVIDIA GeForce RTX 3050 4GB Laptop GPU | Dell XPS 15 9520 RTX 3050 Ti Intel Core i7-12700H, NVIDIA GeForce RTX 3050 Ti Laptop GPU | |
|---|---|---|---|---|---|---|
| Heat | -2% | 1% | 7% | 8% | -3% | |
| Maximum Upper Side * (°C) | 49 | 49.4 -1% | 48.4 1% | 40.6 17% | 47.6 3% | 51.4 -5% |
| Maximum Bottom * (°C) | 52.6 | 55.5 -6% | 57.1 -9% | 53 -1% | 46.6 11% | 51 3% |
| Idle Upper Side * (°C) | 29.7 | 28.4 4% | 28.1 5% | 29 2% | 27.2 8% | 30 -1% |
| Idle Bottom * (°C) | 30.7 | 32.6 -6% | 29 6% | 28.3 8% | 27.2 11% | 33 -7% |
* ... más pequeño es mejor
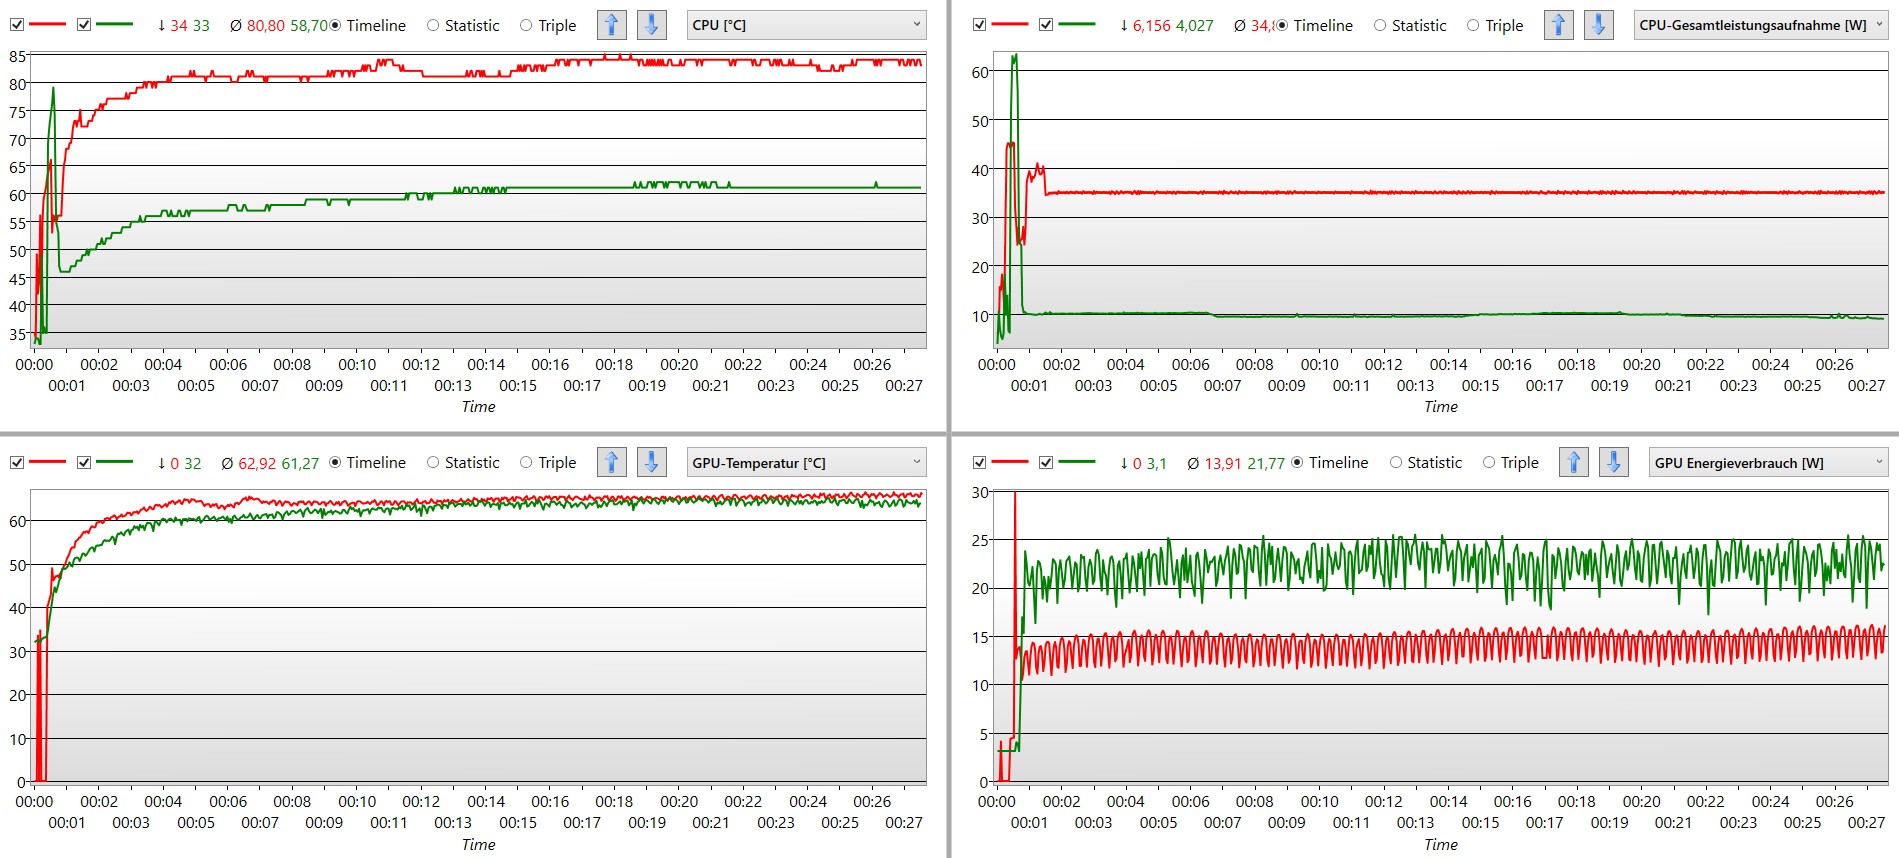
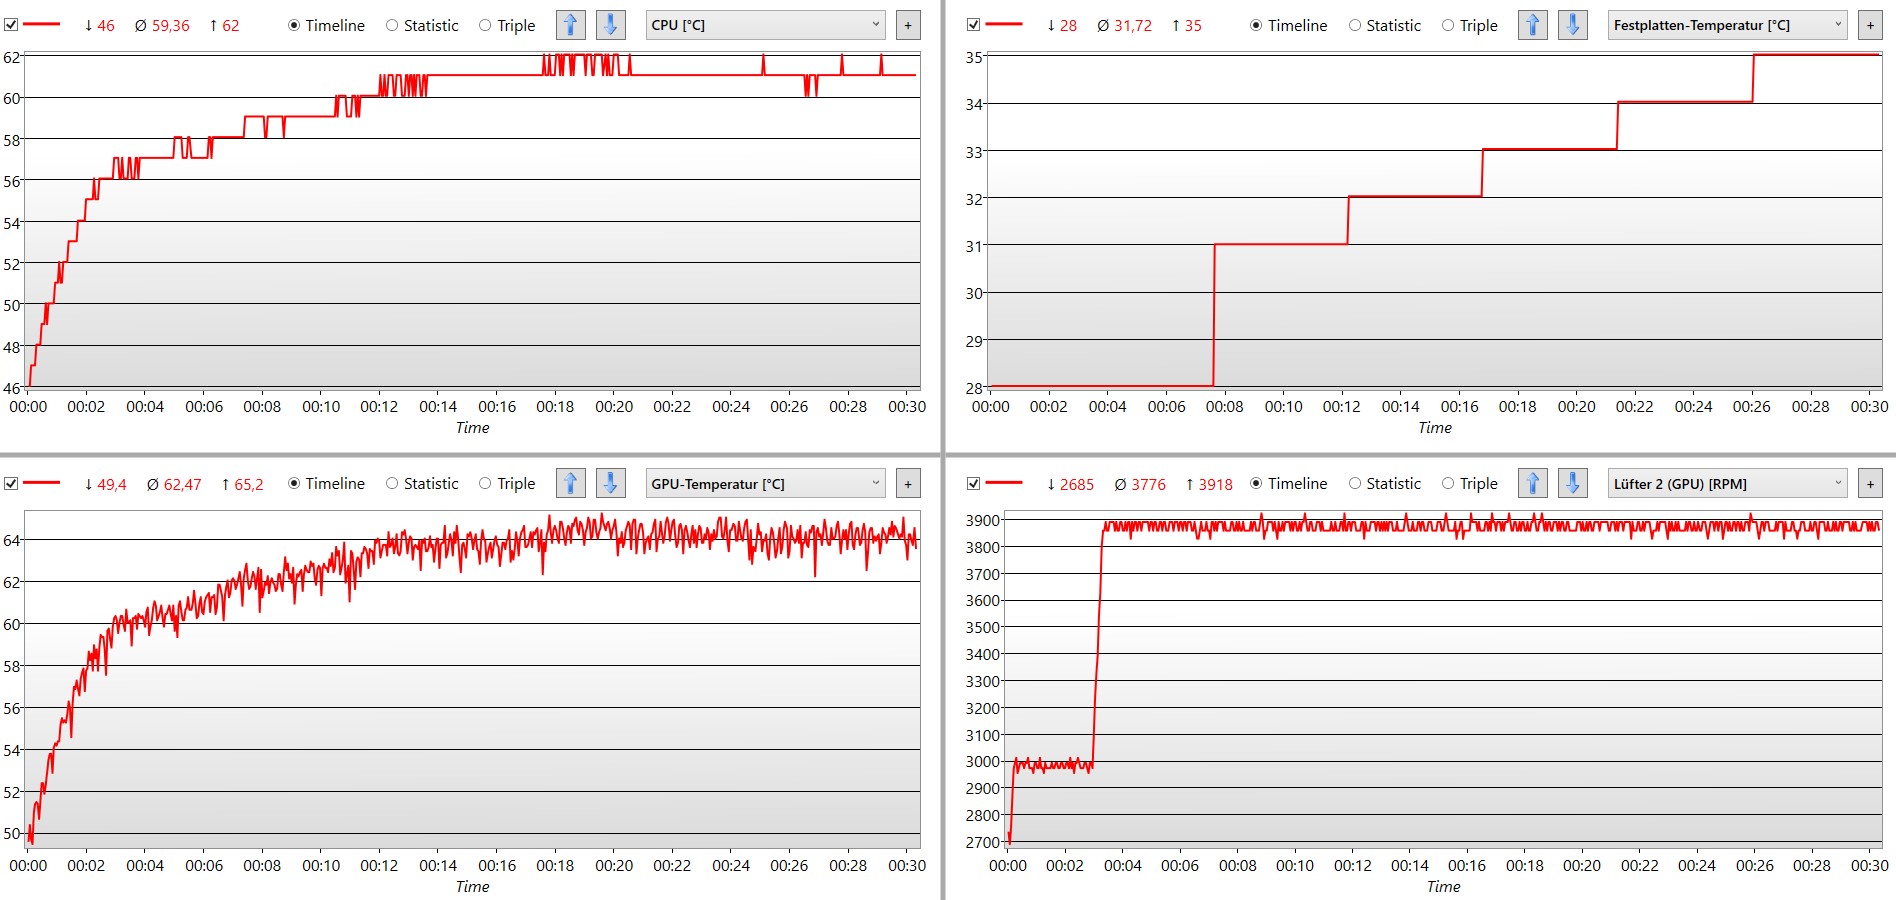
Prueba de esfuerzo
Incluso la carga completa en Prime95 y Furmark no da lugar a temperaturas poco saludables. La CPU sube un poco más de 60 °C, mientras que los sensores de la GPU indican algo menos de 65 °C. El ventilador gira a una velocidad constantemente alta. Los valores máximos se alcanzan tras 10 minutos como máximo, y el portátil se mantiene en el mismo nivel.
Aquí, el ajuste "Smart Auto" con su límite de consumo de energía asegura siempre temperaturas tolerables. De este modo, el rendimiento máximo está disponible inmediatamente después de dichas cargas, ya que el sistema no tiene que enfriarse a partir de 80 o 90 °C
Altavoces
Una comparación con elApple MacBook Pro 16 2021revela una desafortunada carencia: Los altavoces del Prestige 15 empiezan a sobremodularse a volúmenes altos. Por ejemplo, los bajos y los medios más bajos, en los que se escuchan las guitarras eléctricas, son muy débiles.
El sonido de las voces es decente y detallado. En general, es suficiente para comprobar el sonido de los vídeos, para transmitir películas o para hacer videollamadas. Sin embargo, en cuanto empieza a sonar la música, los puntos débiles de los altavoces se hacen claramente audibles
MSI Prestige 15 A12UD-093 análisis de audio
(+) | los altavoces pueden reproducir a un volumen relativamente alto (#89.3 dB)
Graves 100 - 315 Hz
(-) | casi sin bajos - de media 34.4% inferior a la mediana
(±) | la linealidad de los graves es media (10.7% delta a frecuencia anterior)
Medios 400 - 2000 Hz
(±) | medios reducidos - de media 10.8% inferior a la mediana
(±) | la linealidad de los medios es media (11.1% delta respecto a la frecuencia anterior)
Altos 2 - 16 kHz
(±) | máximos más altos - de media 9% más altos que la mediana
(+) | los máximos son lineales (3.7% delta a la frecuencia anterior)
Total 100 - 16.000 Hz
(±) | la linealidad del sonido global es media (28.1% de diferencia con la mediana)
En comparación con la misma clase
» 94% de todos los dispositivos probados de esta clase eran mejores, 1% similares, 5% peores
» El mejor tuvo un delta de 5%, la media fue 17%, el peor fue ###max##%
En comparación con todos los dispositivos probados
» 85% de todos los dispositivos probados eran mejores, 3% similares, 12% peores
» El mejor tuvo un delta de 4%, la media fue 23%, el peor fue ###max##%
Apple MacBook Pro 16 2021 M1 Pro análisis de audio
(+) | los altavoces pueden reproducir a un volumen relativamente alto (#84.7 dB)
Graves 100 - 315 Hz
(+) | buen bajo - sólo 3.8% lejos de la mediana
(+) | el bajo es lineal (5.2% delta a la frecuencia anterior)
Medios 400 - 2000 Hz
(+) | medios equilibrados - a sólo 1.3% de la mediana
(+) | los medios son lineales (2.1% delta a la frecuencia anterior)
Altos 2 - 16 kHz
(+) | máximos equilibrados - a sólo 1.9% de la mediana
(+) | los máximos son lineales (2.7% delta a la frecuencia anterior)
Total 100 - 16.000 Hz
(+) | el sonido global es lineal (4.6% de diferencia con la mediana)
En comparación con la misma clase
» 0% de todos los dispositivos probados de esta clase eran mejores, 0% similares, 100% peores
» El mejor tuvo un delta de 5%, la media fue 17%, el peor fue ###max##%
En comparación con todos los dispositivos probados
» 0% de todos los dispositivos probados eran mejores, 0% similares, 100% peores
» El mejor tuvo un delta de 4%, la media fue 23%, el peor fue ###max##%
Gestión de la energía - El Prestige 15 puntúa con la eficiencia
Consumo de energía
El i7-1280Pdemuestra que puede funcionar con eficiencia energética. Un mínimo de 5 vatios atestigua su funcionamiento económico. Sin embargo, no necesita alimentar una pantalla OLED como el Asus VivoBook Pro 16Xsino un monitor 4K.
La diferencia en el consumo máximo de energía es especialmente llamativa. El hecho de que MSI estrangule la CPU y la GPU considerablemente para lograr un comportamiento lo más silencioso posible resulta en alrededor de la mitad de los índices máximos habituales
La fuente de alimentación es un poco justa. La recarga se hace con un estándar de 60 vatios a través de uno de los puertos Thunderbolt. Bajo carga, esto es apenas suficiente para suministrar energía al portátil. Durante operaciones informáticas intensivas y prolongadas, observamos que la batería sólo se cargaba a la velocidad mínima o no se cargaba en absoluto. Por otro lado, no notamos una descarga a pesar de un adaptador de corriente conectado
| Off / Standby | |
| Ocioso | |
| Carga |
|
Clave:
min: | |
| MSI Prestige 15 A12UD-093 i7-1280P, GeForce RTX 3050 Ti Laptop GPU, Micron 3400 1TB MTFDKBA1T0TFH, IPS, 3840x2160, 15.6" | Acer Swift X SFX16-52G-77RX i7-1260P, A370M, WDC PC SN810 1TB, IPS-LED, 2560x1600, 16" | Schenker Vision 14 2022 RTX 3050 Ti i7-12700H, GeForce RTX 3050 Ti Laptop GPU, Samsung SSD 980 Pro 1TB MZ-V8P1T0BW, IPS, 2880x1800, 14" | Asus VivoBook Pro 16X OLED N7600PC-L2026X i7-11370H, GeForce RTX 3050 4GB Laptop GPU, Intel Optane Memory H10 with Solid State Storage 32GB + 512GB HBRPEKNX0202A(L/H), OLED, 3840x2400, 16" | Lenovo IdeaPad Gaming 3 15ARH7 R5 6600H, GeForce RTX 3050 4GB Laptop GPU, Lenovo UMIS AM630 RPJTJ256MGE1QDY, IPS, 1920x1080, 15.6" | Dell XPS 15 9520 RTX 3050 Ti i7-12700H, GeForce RTX 3050 Ti Laptop GPU, WDC PC SN810 512GB, OLED, 3456x2160, 15.6" | Medio NVIDIA GeForce RTX 3050 Ti Laptop GPU | Media de la clase Multimedia | |
|---|---|---|---|---|---|---|---|---|
| Power Consumption | -16% | -46% | -55% | -76% | -44% | -63% | -22% | |
| Idle Minimum * (Watt) | 5.4 | 3.7 31% | 7.5 -39% | 8.9 -65% | 7.7 -43% | 5.5 -2% | 8.2 ? -52% | 5.66 ? -5% |
| Idle Average * (Watt) | 11.8 | 7.6 36% | 10.4 12% | 10.2 14% | 9.1 23% | 7.2 39% | 12.6 ? -7% | 10.2 ? 14% |
| Idle Maximum * (Watt) | 12.7 | 11.1 13% | 11.4 10% | 12 6% | 15.6 -23% | 16 -26% | 17.2 ? -35% | 12.5 ? 2% |
| Load Average * (Watt) | 45.9 | 70 -53% | 83.3 -81% | 94 -105% | 90.7 -98% | 91.8 -100% | 92 ? -100% | 65.2 ? -42% |
| Witcher 3 ultra * (Watt) | 45.7 | 68.8 -51% | 92.7 -103% | 93.1 -104% | 122.9 -169% | 74.6 -63% | ||
| Load Maximum * (Watt) | 63 | 108 -71% | 110.3 -75% | 112 -78% | 155.2 -146% | 134.7 -114% | 139.1 ? -121% | 113.5 ? -80% |
* ... más pequeño es mejor
Power Consumption Witcher 3 / Stresstest
Power Consumption with an External Monitor
Duración de la batería
Con unos impresionantes 80 Wh, una buena duración está casi garantizada. Si se reduce el brillo, el MSI Prestige 15 logra casi 9 horas en nuestro test de navegación web. La variante con pantalla Full HD debería poder superar la marca de las 10 horas con relativa facilidad.
Las cifras no son tan impresionantes a pleno brillo o durante la reproducción de un vídeo Full HD en bucle continuo. No obstante, con 7 horas, el portátil debería ser suficiente para la mayoría de las operaciones.
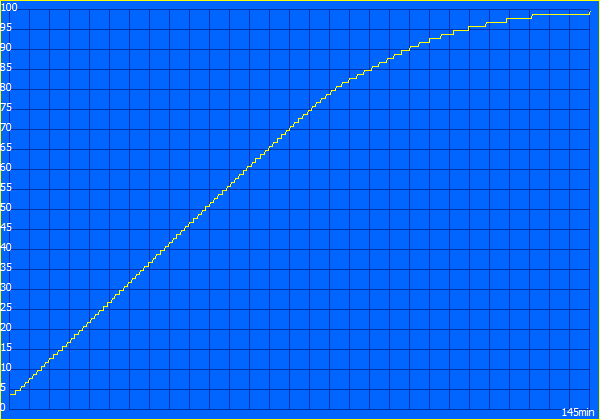
Bajo carga completa, la falta de ralentización empuja la duración de la batería al valor bajo esperado. Un consumo de 60 vatios y una batería de 80 Wh dan como resultado 80 minutos. Después de todo, el rendimiento completo está disponible incluso sin una fuente de alimentación externa
| MSI Prestige 15 A12UD-093 i7-1280P, GeForce RTX 3050 Ti Laptop GPU, 80 Wh | Acer Swift X SFX16-52G-77RX i7-1260P, A370M, 56 Wh | Schenker Vision 14 2022 RTX 3050 Ti i7-12700H, GeForce RTX 3050 Ti Laptop GPU, 99.8 Wh | Asus VivoBook Pro 16X OLED N7600PC-L2026X i7-11370H, GeForce RTX 3050 4GB Laptop GPU, 96 Wh | Lenovo IdeaPad Gaming 3 15ARH7 R5 6600H, GeForce RTX 3050 4GB Laptop GPU, 45 Wh | Dell XPS 15 9520 RTX 3050 Ti i7-12700H, GeForce RTX 3050 Ti Laptop GPU, 86 Wh | Media de la clase Multimedia | |
|---|---|---|---|---|---|---|---|
| Duración de Batería | 9% | 40% | 39% | -32% | 64% | 66% | |
| H.264 (h) | 7.1 | 10.4 46% | 11.1 56% | 17.1 ? 141% | |||
| WiFi v1.3 (h) | 8.9 | 9.1 2% | 10.1 13% | 8.7 -2% | 6.5 -27% | 8.8 -1% | 12.2 ? 37% |
| Load (h) | 1.4 | 1.1 -21% | 2.1 50% | 2.5 79% | 0.9 -36% | 3.2 129% | 1.664 ? 19% |
Pro
Contra
Veredicto: Una combinación bien equilibrada de componentes en el Prestige 15
El MSI Prestige 15 parece implementar de forma consistente el principio rector de estrangular el hardware sólido y eficiente hasta tal punto que la creación de contenido tiene éxito perfectamente. Por otro lado, las tareas que exigen mucho rendimiento se ralentizan un poco por el reducido consumo de energía.
A la inversa, esto significa que la carcasa se mantiene relativamente fresca y el doble ventilador se mantiene en silencio. La duración de la batería también se beneficia un poco. Así que las pérdidas no son realmente dramáticas porque el rendimiento completo sigue estando disponible para ráfagas cortas.
Esto también diferencia al Prestige de un portátil con iGPU, a pesar del rendimiento gráfico relativamente bajo. Aunque el rendimiento es débil en los juegos, sigue siendo suficiente y está bien ajustado para el software de edición de imágenes y vídeo, y está claramente por encima de lo que pueden hacer los chips gráficos integrados.
Silencioso, móvil y potente: la elección perfecta para los creativos.
Además, la pantalla está óptimamente ajustada. el 4K y el espacio de color AdobeRGB demuestran ser dignos de una pantalla tan profesional. Sin embargo, en 15,6 pulgadas, los numerosos píxeles no pueden aprovechar al máximo su potencial. En cambio, consumen más energía y ocupan más capacidad de cálculo que una pantalla FullHD, que sería aún más brillante con la misma salida de luz.
El Prestige 15 convence en otros aspectos, quizá no con un rendimiento máximo, pero sí con una buena gama de características de hardware. Entre ellas, dos puertos Thunderbolt y dos puertos USB-A razonablemente rápidos. El teclado y el touchpad causan una sólida impresión y nos gustaron incluso sin los detalles de lujo.
Si el objetivo es la edición de imagen y vídeo, el Prestige ofrece una mezcla casi perfecta que está diseñada para funcionar de forma agradable. Sólo la pantalla es quizás demasiado buena.
En términos de alternativas, el Dell XPS 15 9520 tiene menos puntos débiles en ciertas áreas, que van desde la webcam, el teclado y hasta los altavoces. El Schenker Vision 14 2022 impresiona con un alto rendimiento de componentes similares. Sin embargo, ambos modelos cuestan más y no alcanzan la eficiencia del Prestige 15.
Precio y disponibilidad
Las variantes regionales de la Prestige 15 A12UD todavía se están lanzando a nivel internacional. En los Estados Unidos, por ejemplo, sólo el modelo Prestige 15 A12UD-010 (con un Intel Core i7-1260P en lugar de un i7-1280P) parece estar a la venta por 1.899 dólares (actualmente agotado en todos los minoristas aplicables)
Se aconseja a los usuarios que lo comprueben directamente a través de MSI (en su caso) y que escriban Prestige 15 A12UD en la barra de búsqueda
MSI Prestige 15 A12UD-093
- 11/30/2022 v7 (old)
Mario Petzold
Price comparison

