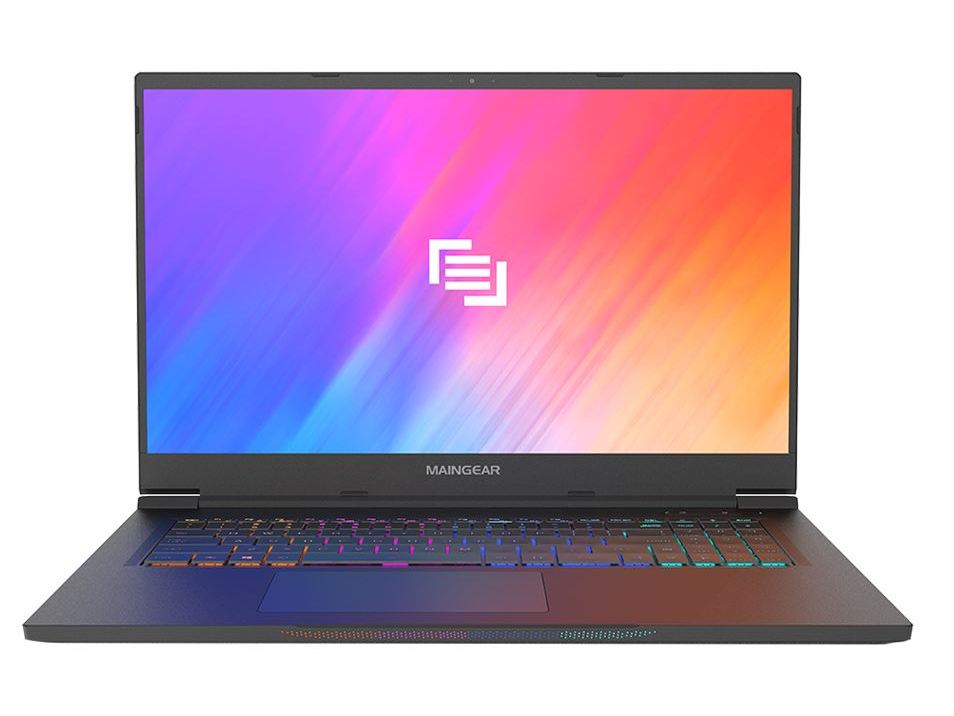
Análisis del portátil Maingear Vector Pro MG-VCP17: 165 W GeForce RTX 3080 para un tamaño ultradelgado
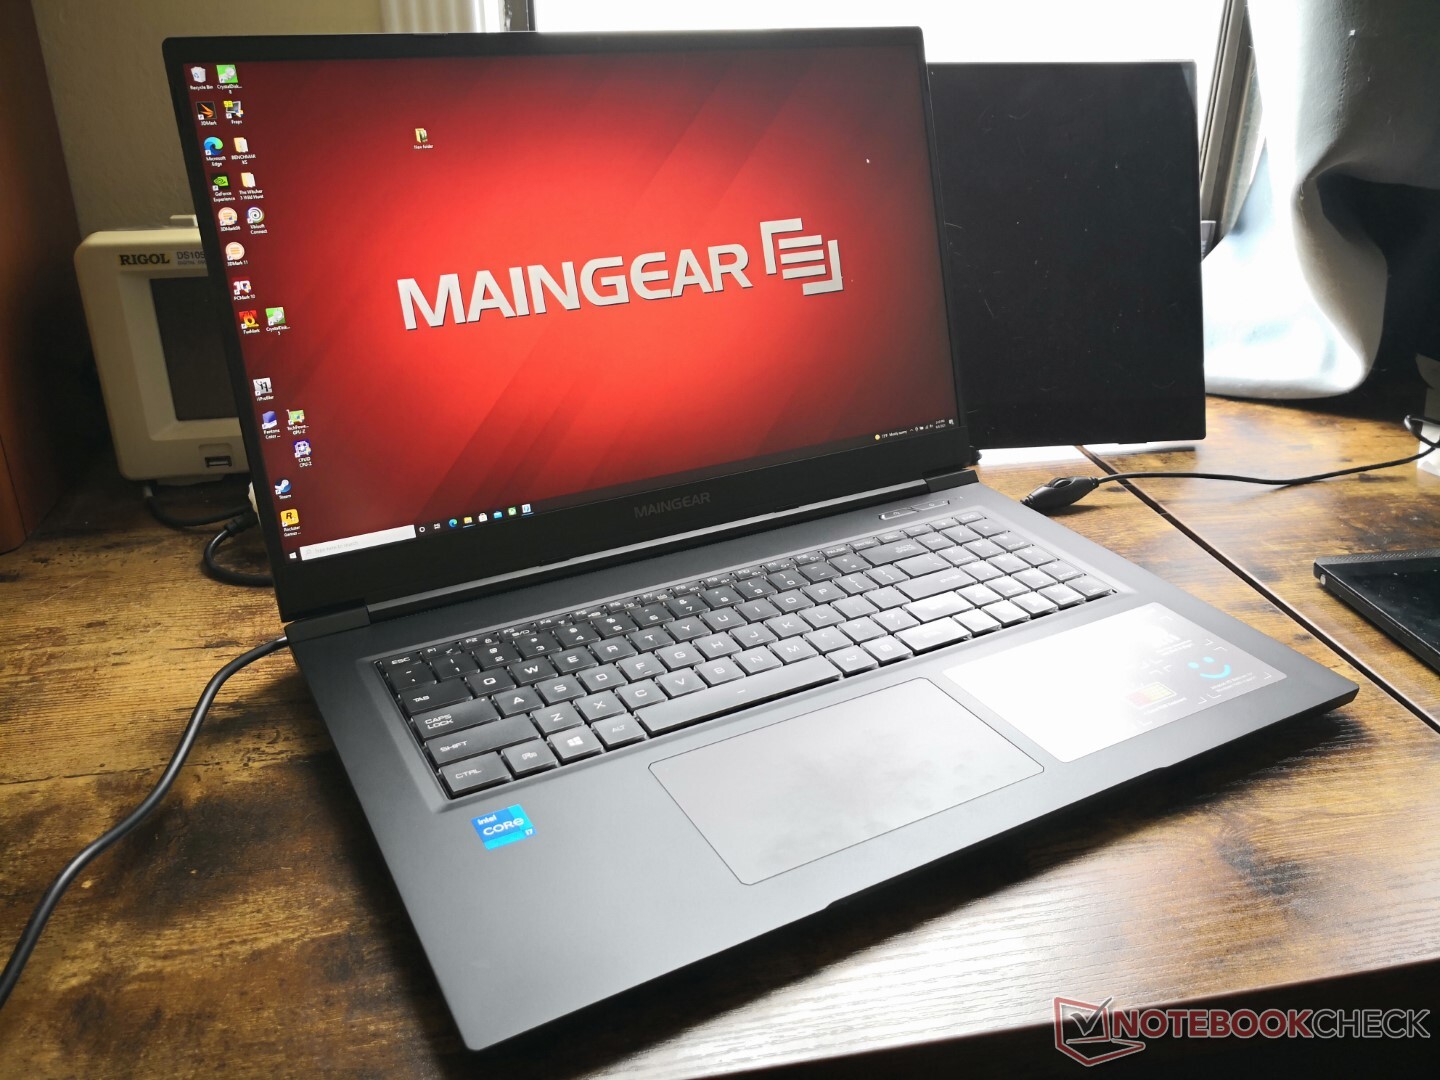
El Vector Pro es un portátil para juegos ultrafino de 17,3 pulgadas del fabricante de PCs personalizados Maingear. Es un sistema ultrafino de alto rendimiento en la misma línea que el MSI GS75, Razer Blade Pro, Asus Zephyrus S17o la serie Dell Alienware x17.
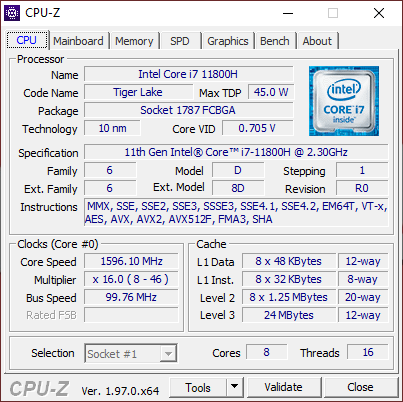
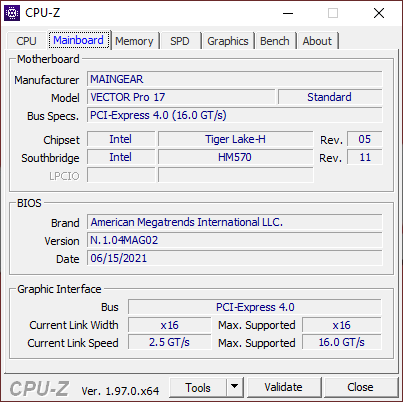
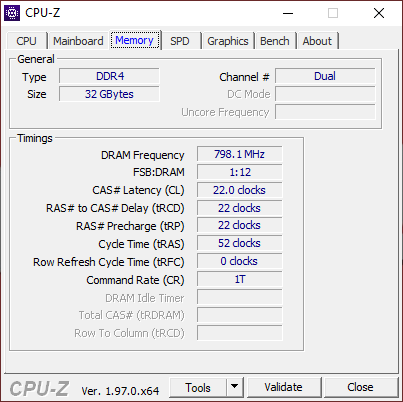
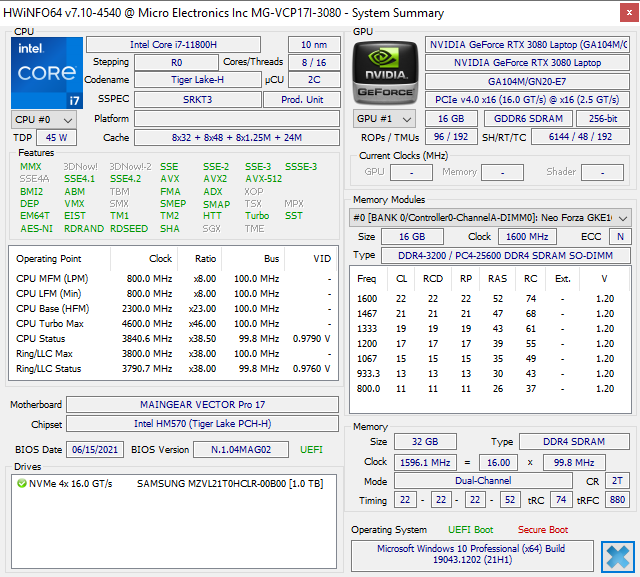
Nuestra unidad de prueba se ha configurado completamente con la CPU Core i7-11800H de 11ª generación, la GPU GeForce RTX 3080 de 165 W y la pantalla IPS 1440p de 165 Hz por un precio de venta al público de aproximadamente 2.500 dólares. Se pondrán a disposición SKUs menores con la RTX 3070 por precios iniciales más bajos
Cabe mencionar que el Vector Pro utiliza un chasis de marca blanca de Tongfang. Así, los usuarios pueden encontrar diseños y características muy similares en otros distribuidores como el Schenker XMG Neo 17 oXMG Core 17.
potential competitors in comparison
Valoración | Fecha | Modelo | Peso | Altura | Tamaño | Resolución | Precio |
|---|---|---|---|---|---|---|---|
| 87.8 % v7 (old) | 09/2021 | Maingear Vector Pro MG-VCP17 i7-11800H, GeForce RTX 3080 Laptop GPU | 2.3 kg | 19.81 mm | 17.30" | 2560x1440 | |
| 90.1 % v7 (old) | 07/2021 | Asus ROG Zephyrus S17 GX703HSD i9-11900H, GeForce RTX 3080 Laptop GPU | 2.8 kg | 19.9 mm | 17.30" | 2560x1440 | |
| 83.9 % v7 (old) | 06/2021 | Schenker XMG Core 17 (Early 2021) i7-10870H, GeForce RTX 3060 Laptop GPU | 2.5 kg | 30.05 mm | 17.30" | 2560x1440 | |
| 85.1 % v7 (old) | 01/2021 | Schenker XMG Neo 17 (Early 2021, RTX 3070, 5800H) R7 5800H, GeForce RTX 3070 Laptop GPU | 2.5 kg | 27 mm | 17.30" | 2560x1440 | |
| 84 % v7 (old) | 12/2020 | Schenker Compact 17 i7-10875H, GeForce RTX 2070 Super Mobile | 2.9 kg | 29.9 mm | 17.30" | 3840x2160 | |
| 83.7 % v7 (old) | 07/2020 | MSI GS75 10SF-609US i7-10875H, GeForce RTX 2070 Max-Q | 2.3 kg | 18.9 mm | 17.30" | 1920x1080 |
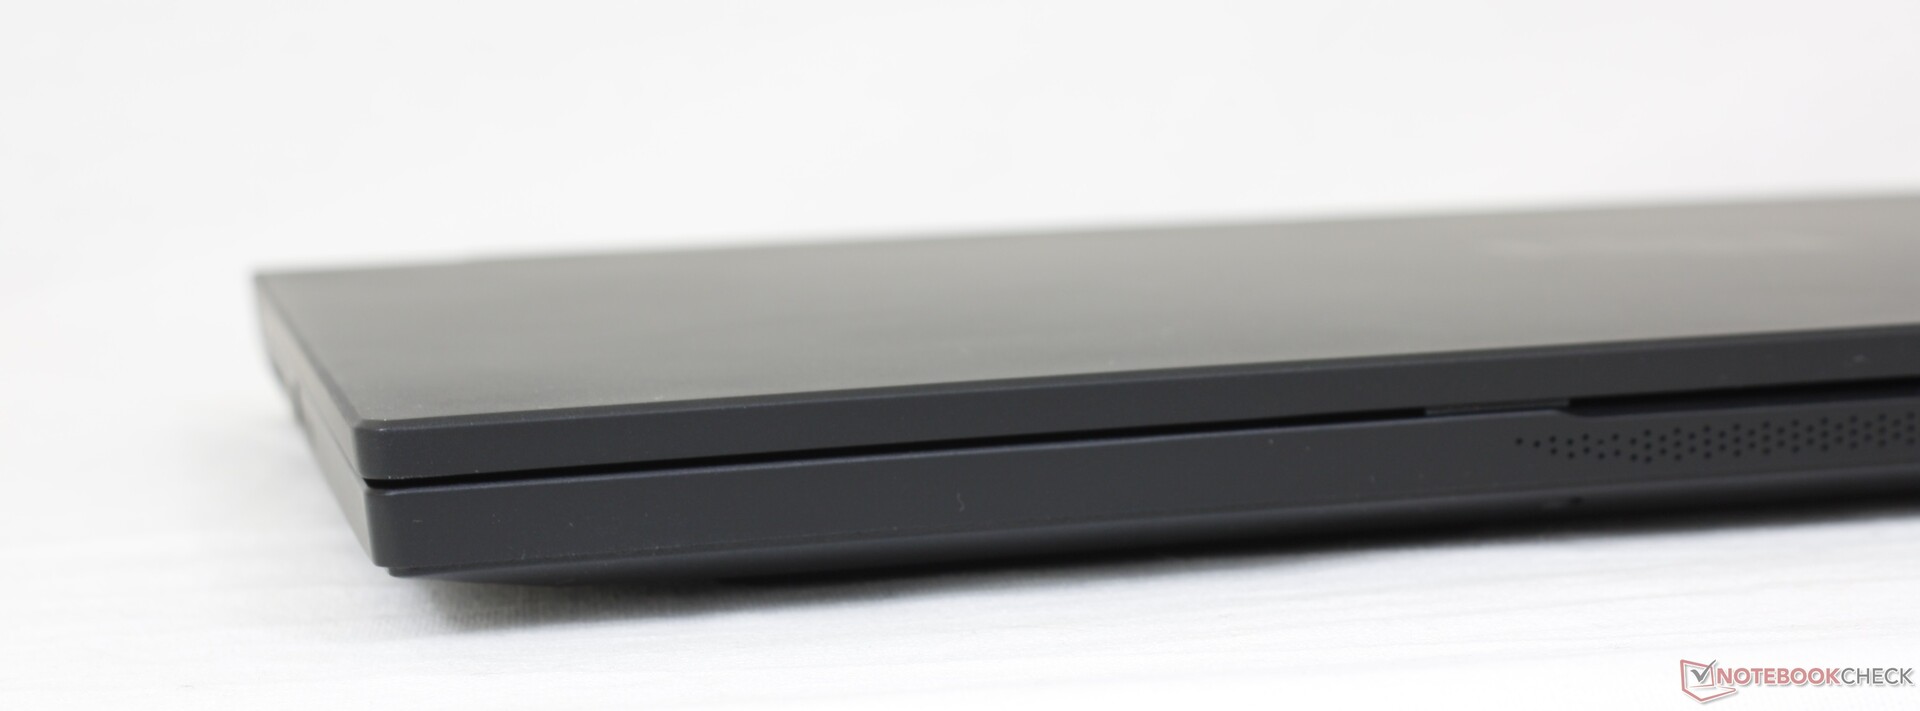
Caso
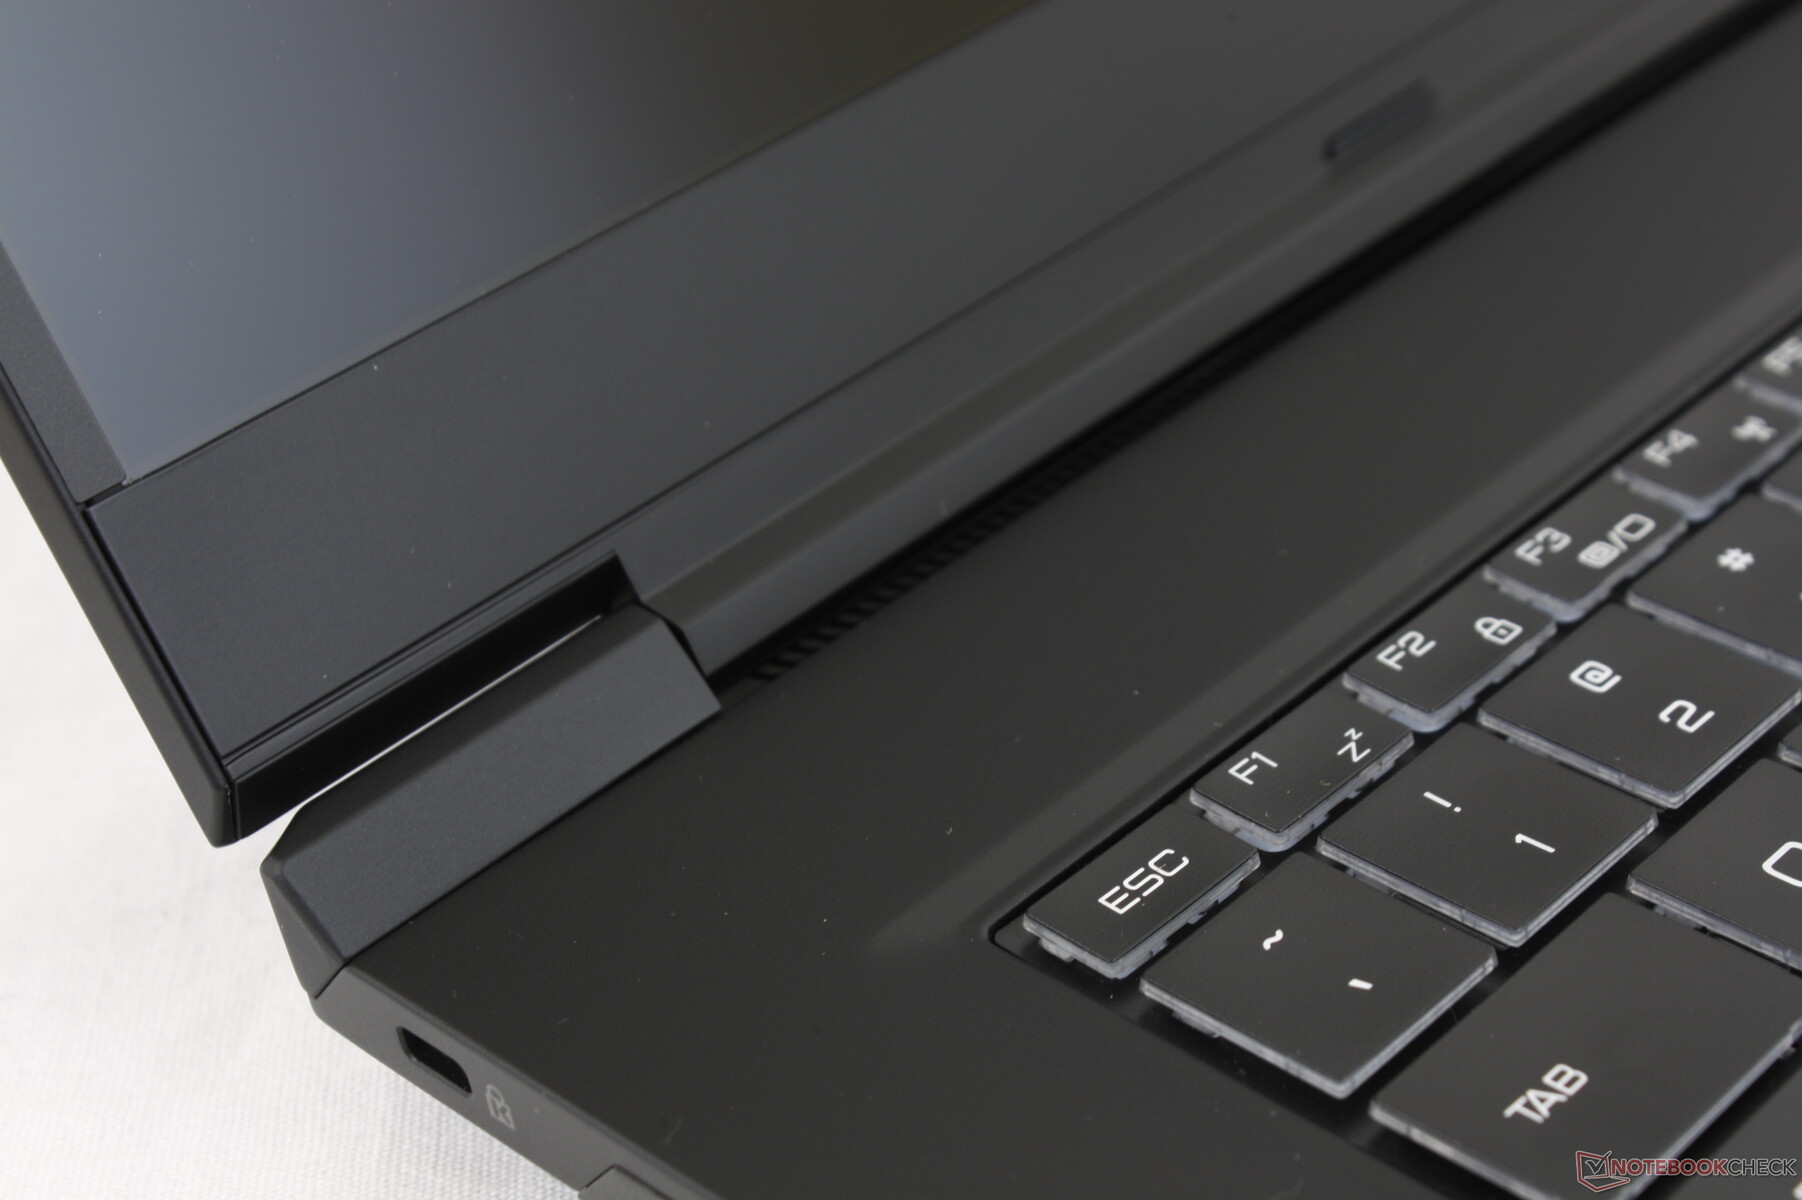
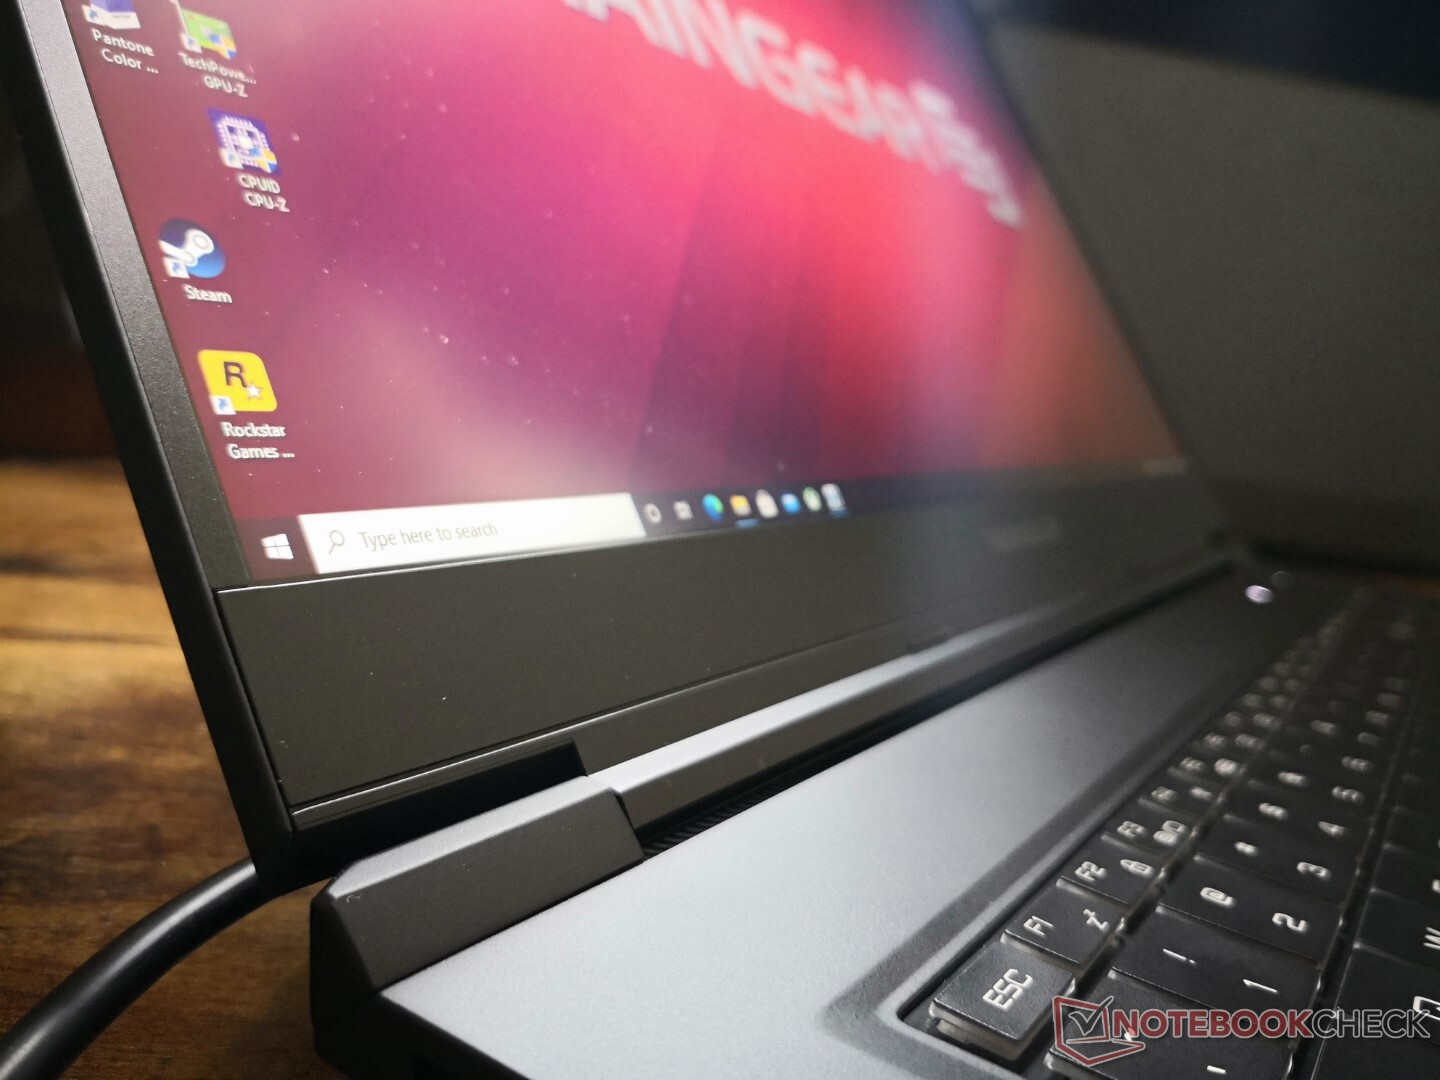
Puede que el chasis no sea tan llamativo como un Asus Zephyrus S o un MSI GS75, pero ciertamente se siente más fuerte y más rígido. La base no cede ni cruje al intentar girar sus esquinas para dar una fuerte primera impresión. La tapa y las bisagras, sin embargo, podrían haber sido más rígidas para reducir el tambaleo al ajustar los ángulos. El grosor del Asus ROG Strix más gruesos tienen bisagras más grandes para una mejor sensación de longevidad.
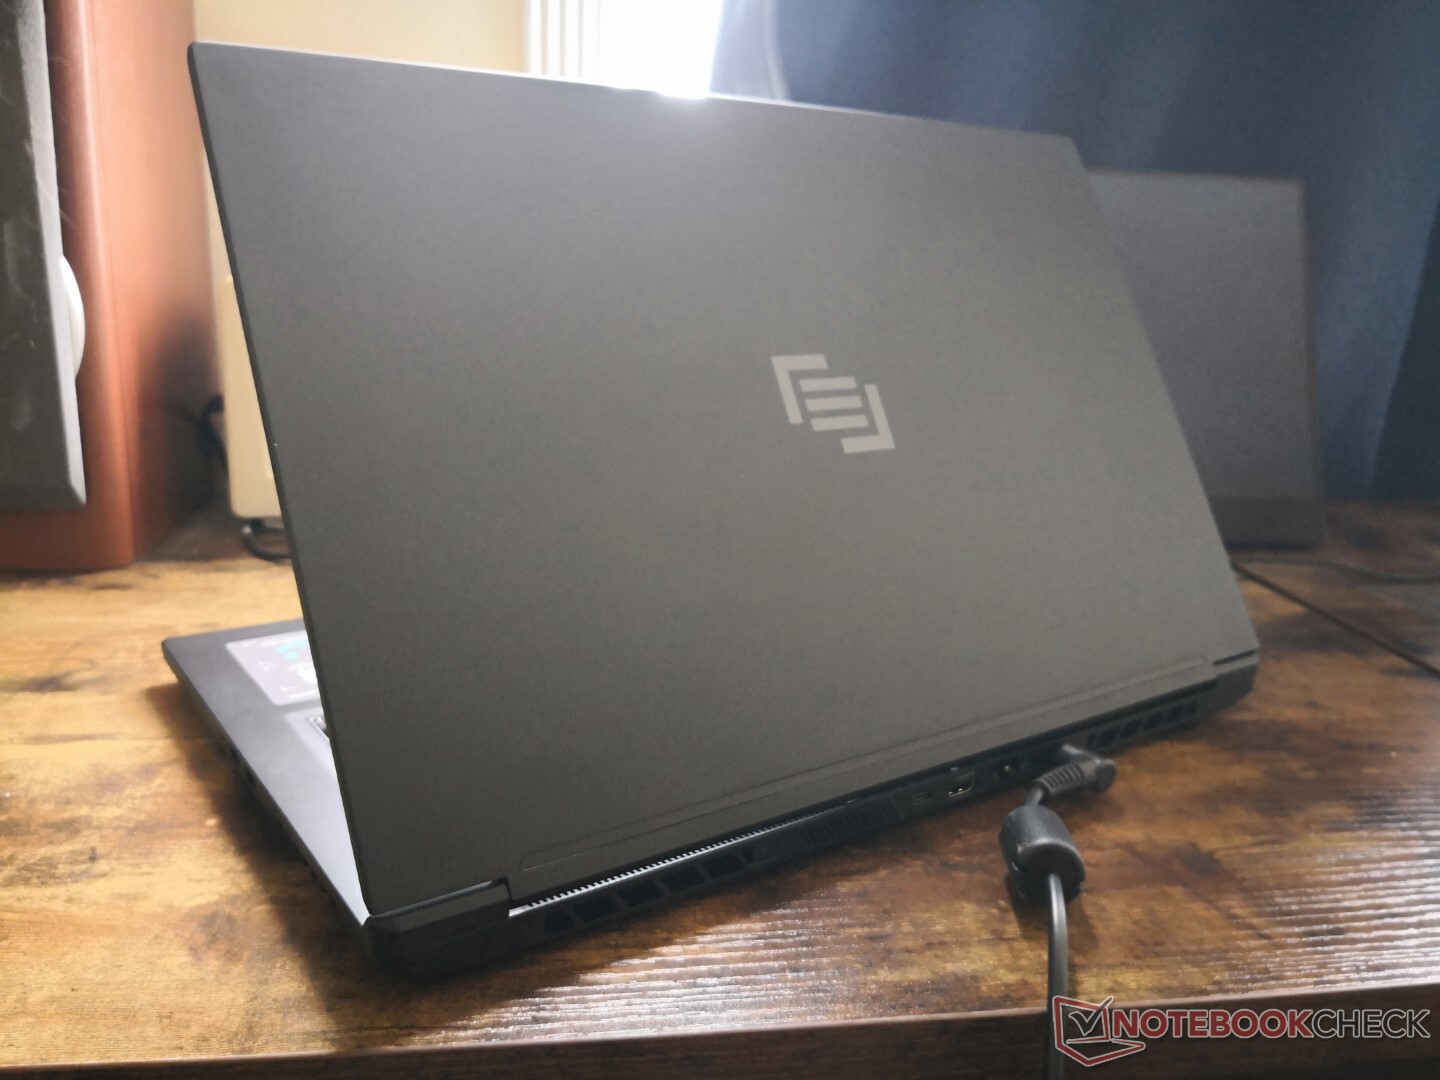
Las dimensiones son casi idénticas a las del Razer Blade Pro. El peso, sin embargo, es casi medio kilo más ligero a favor del Maingear. La falta de un refrigerador con cámara de vapor en el Maingear es probablemente la causa del menor peso.
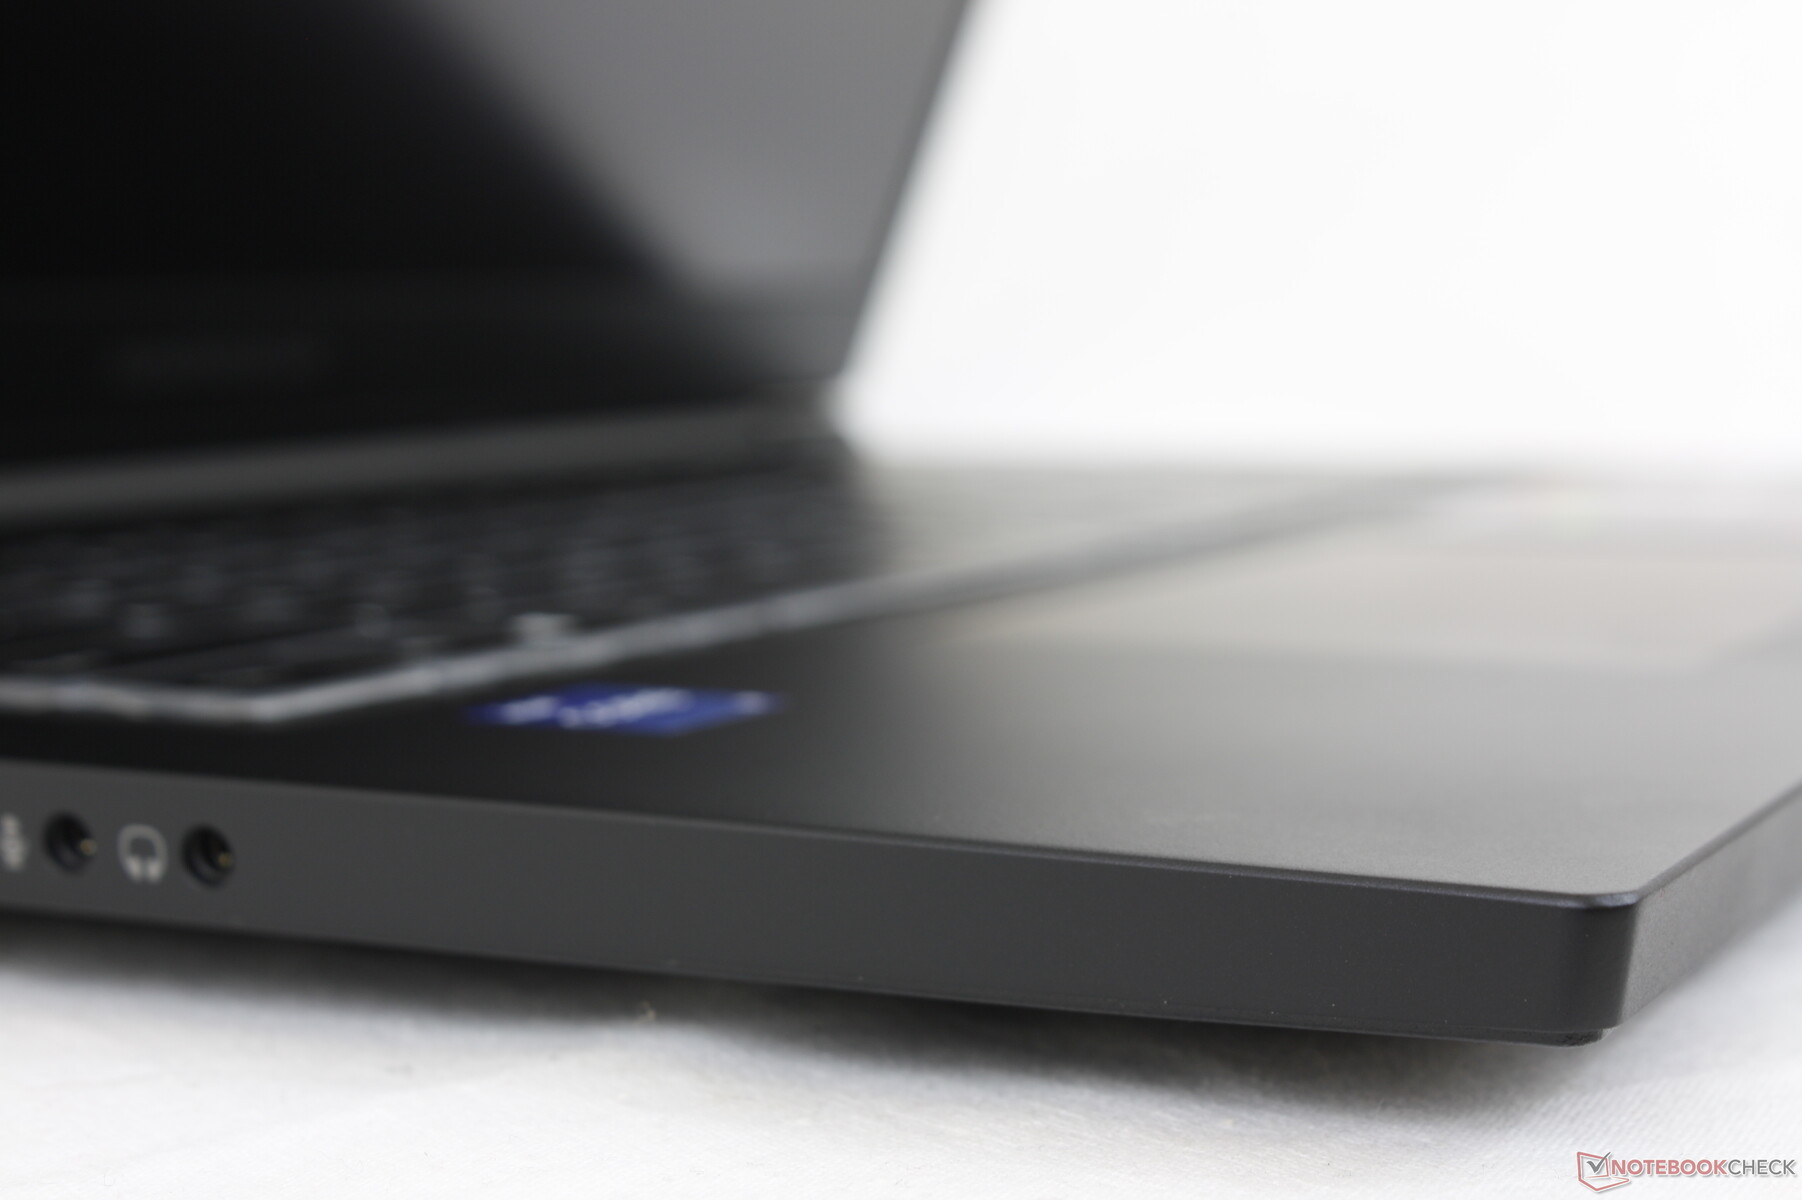
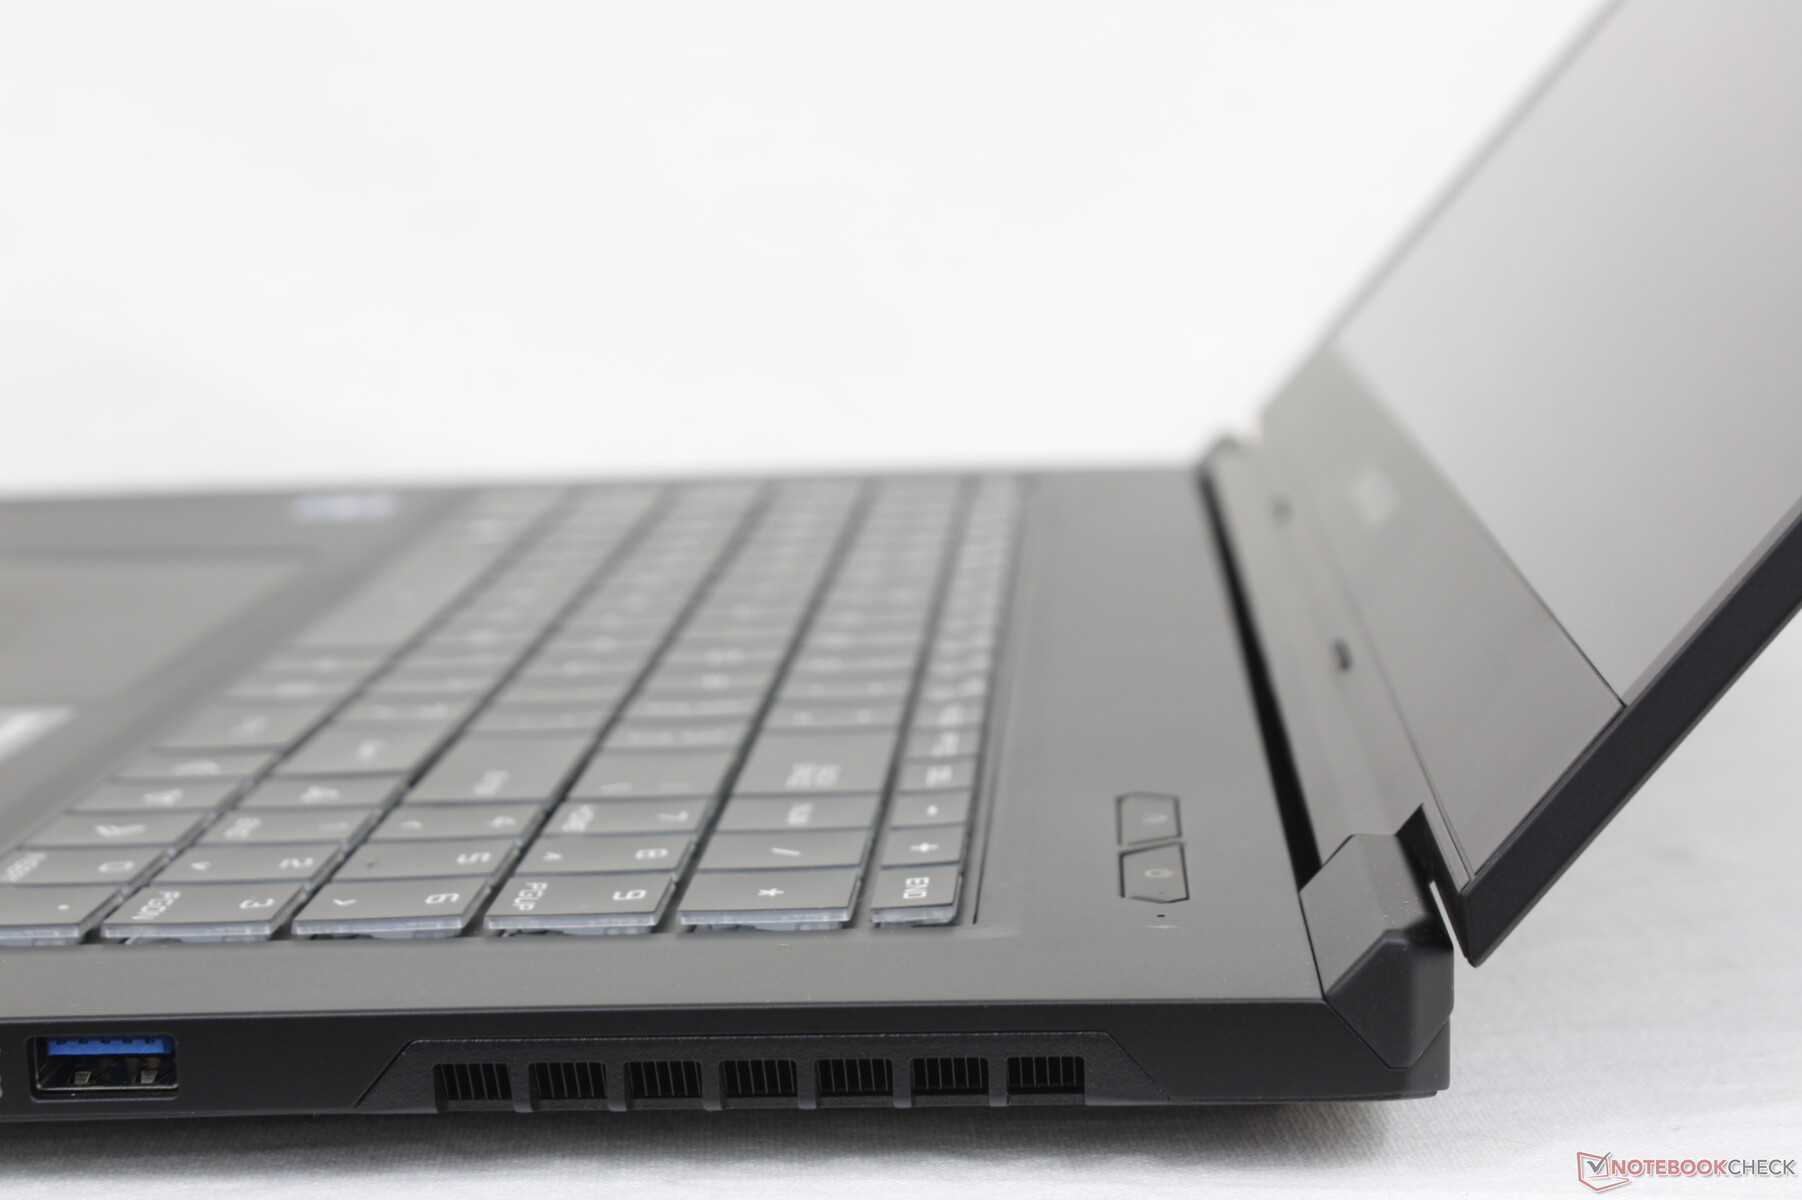
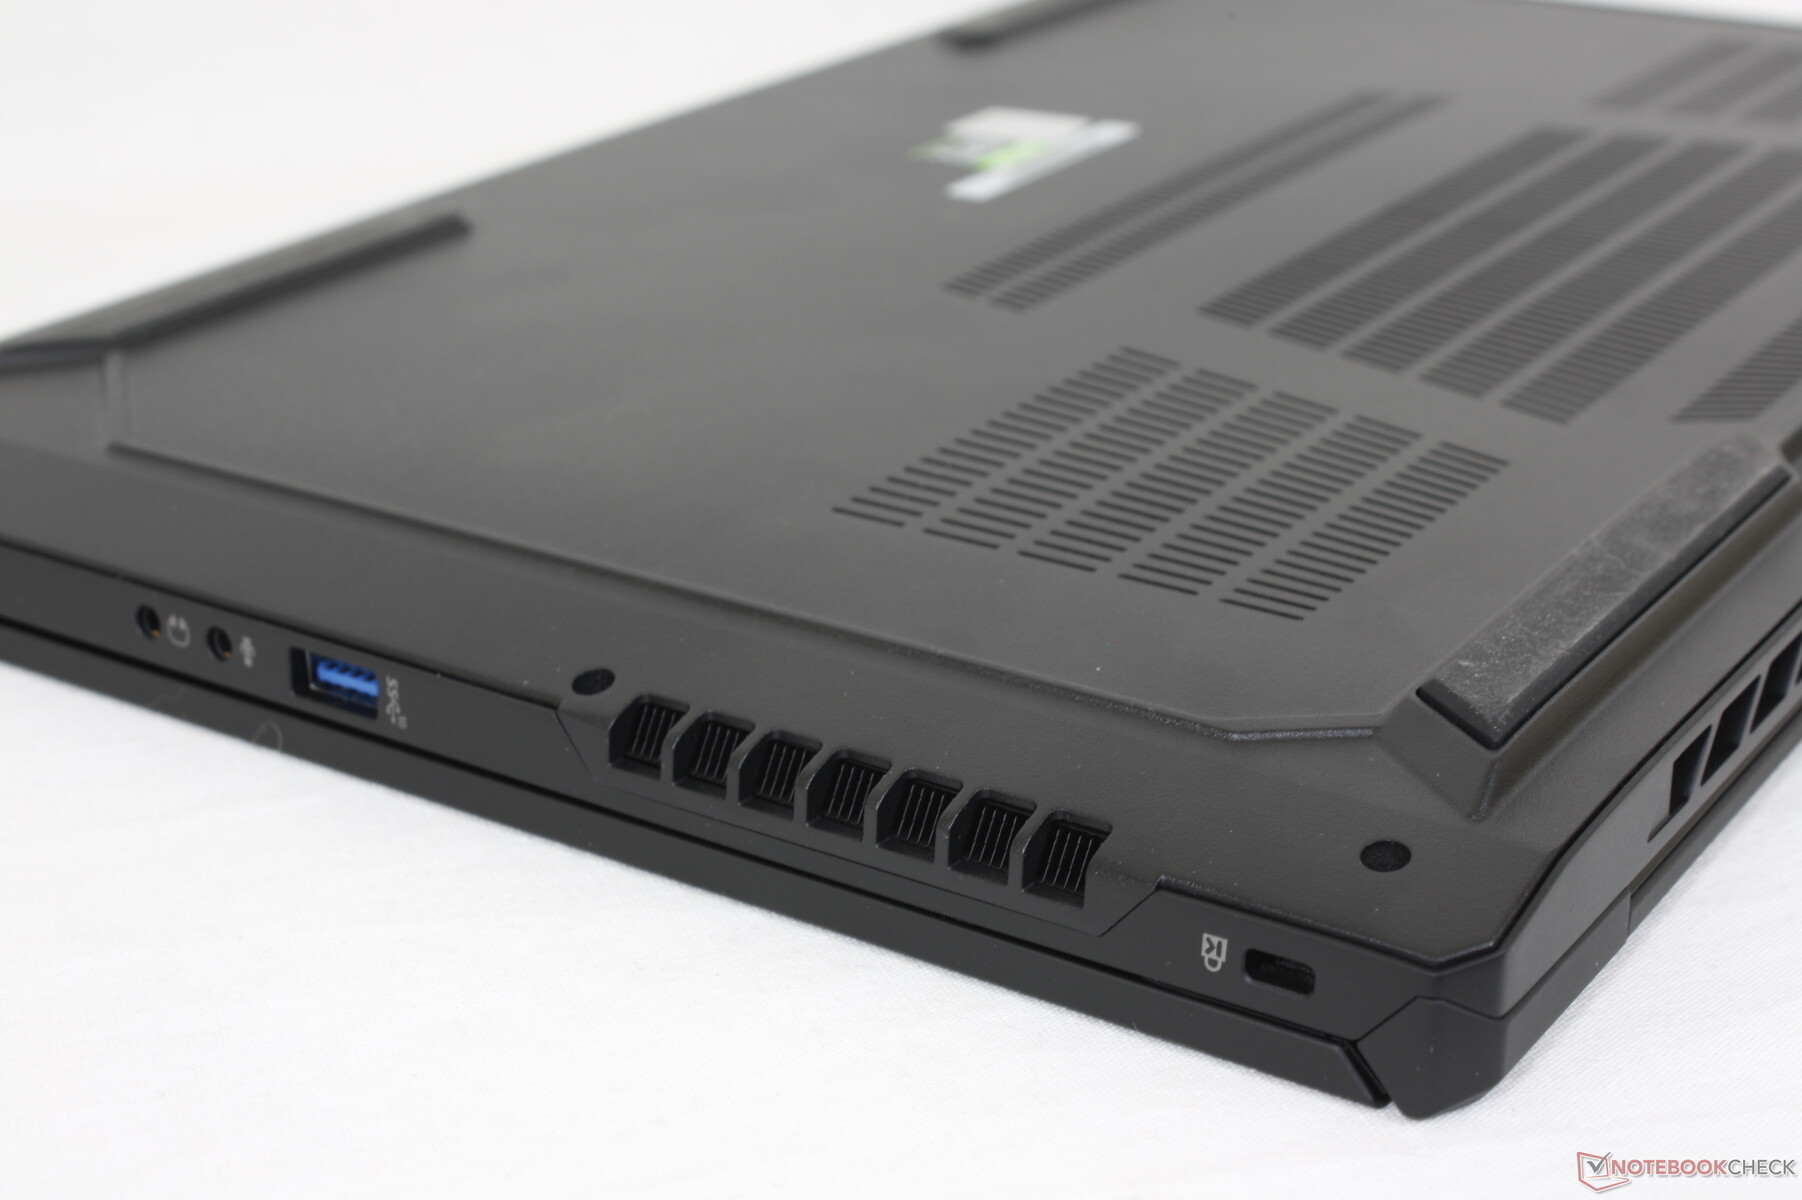
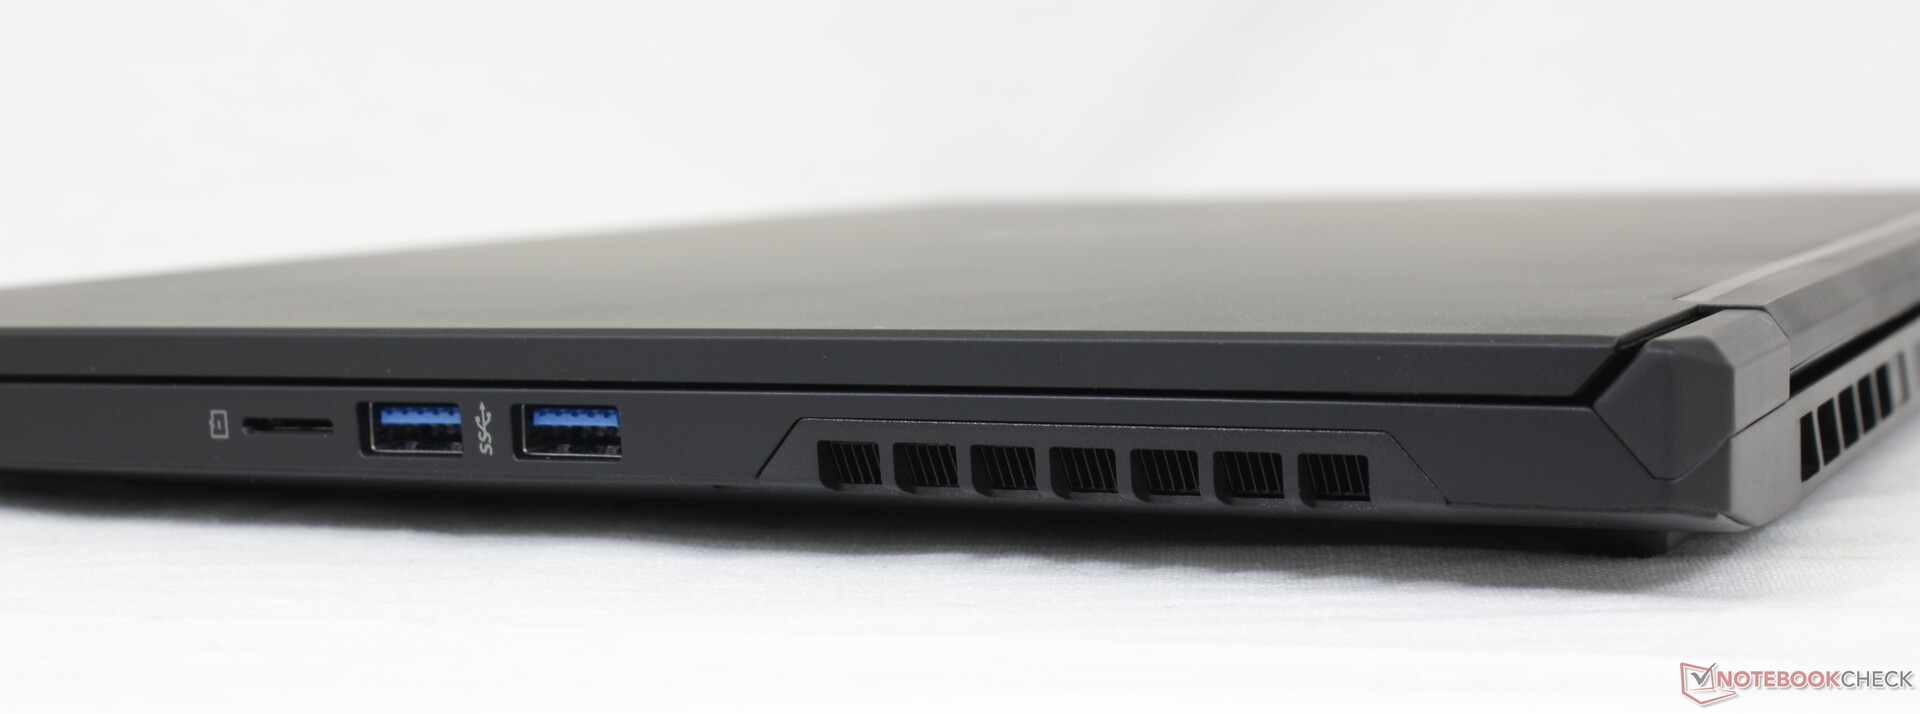
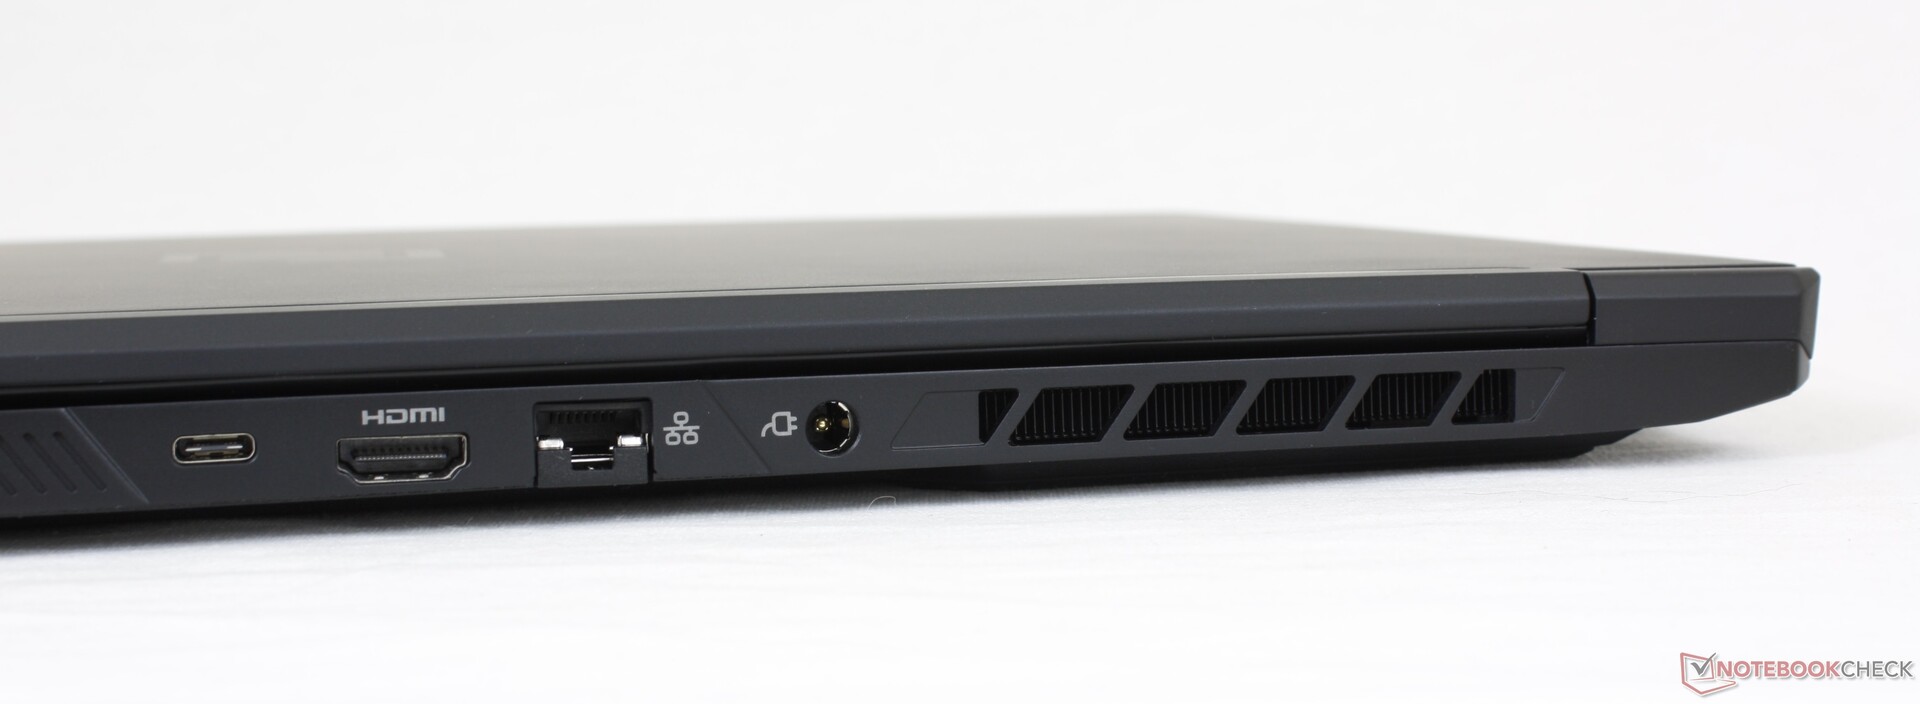
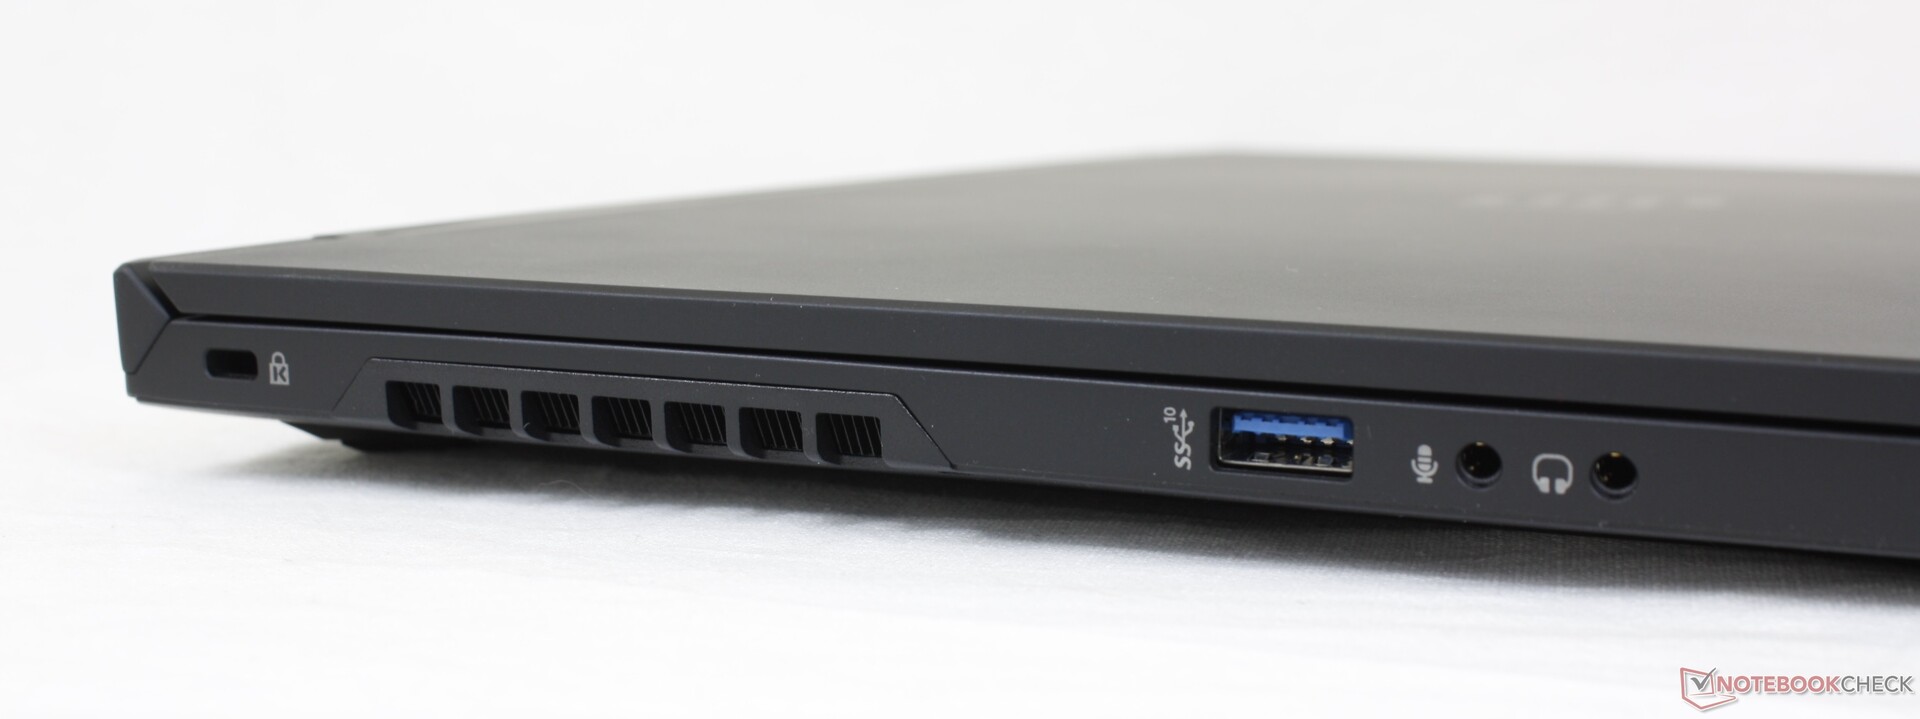
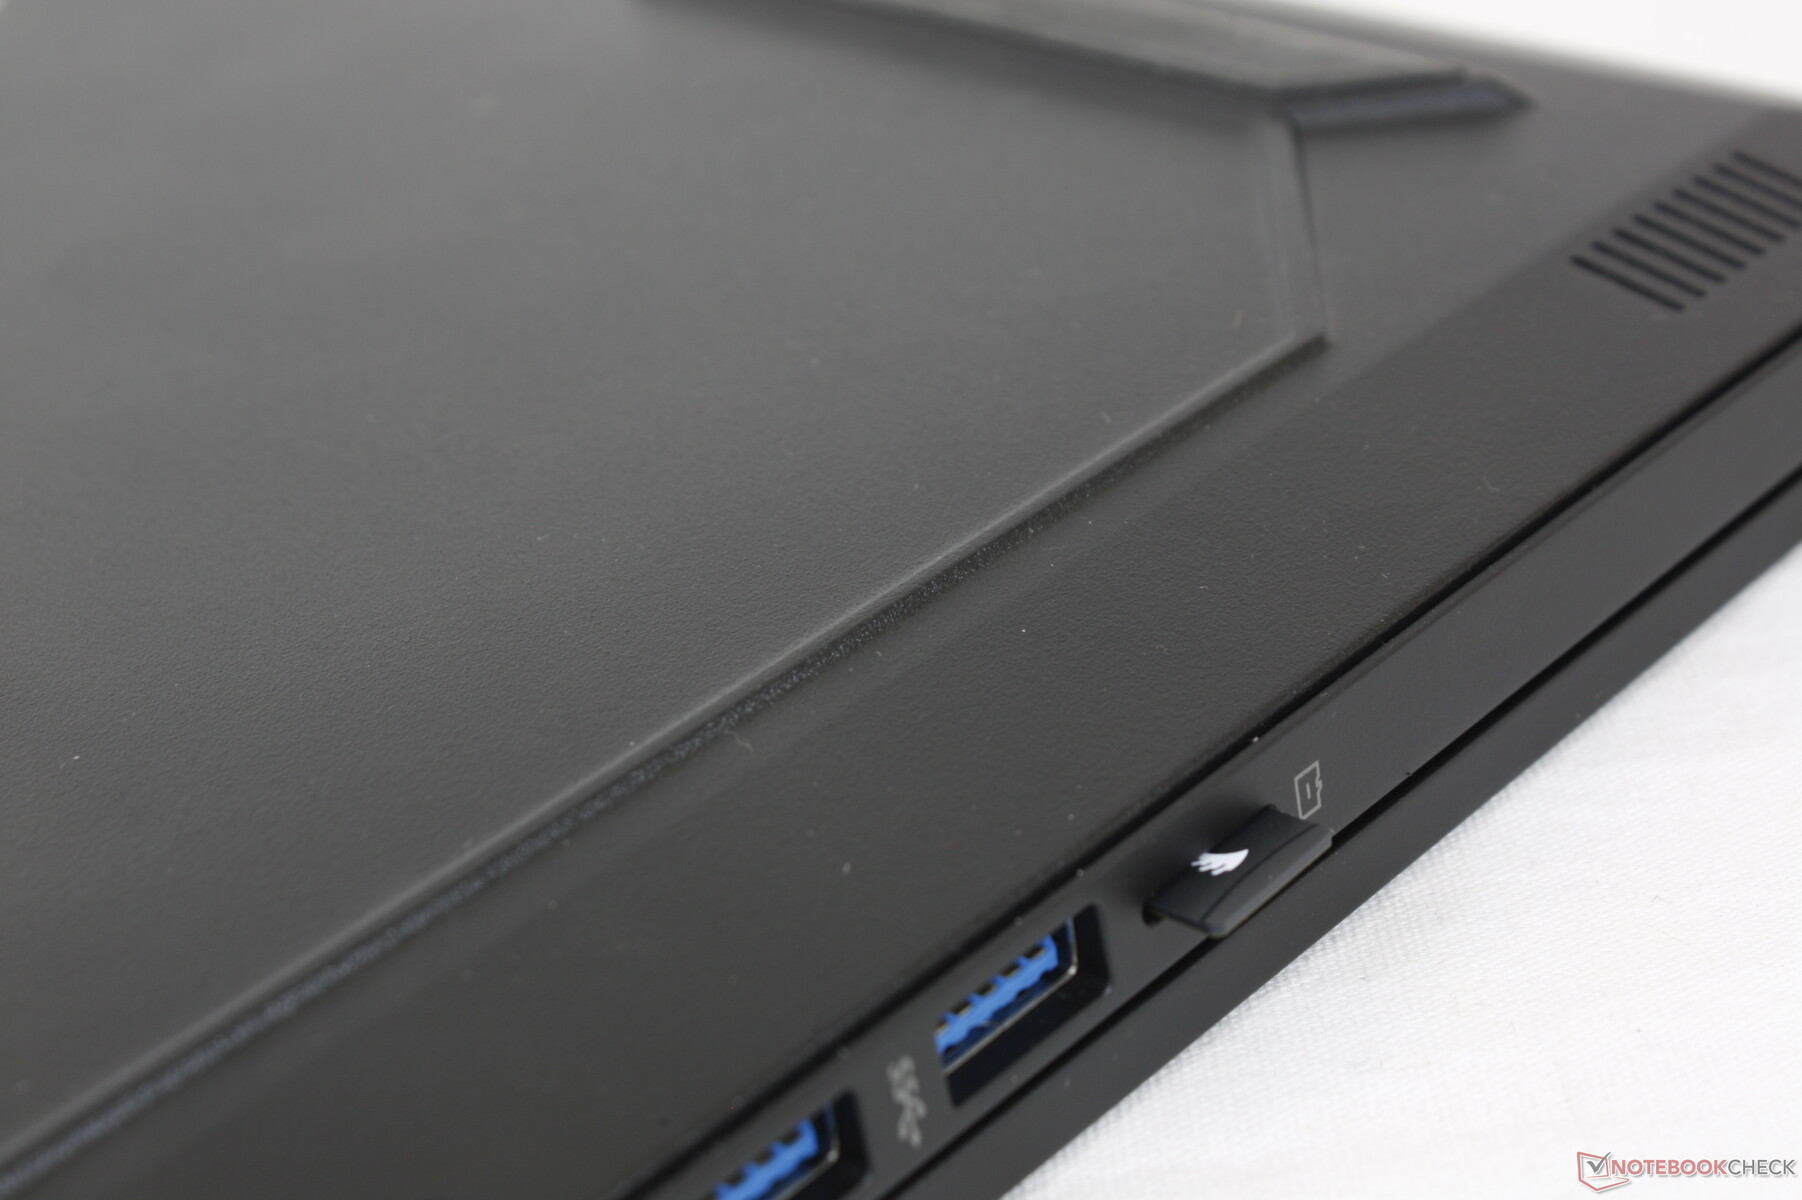
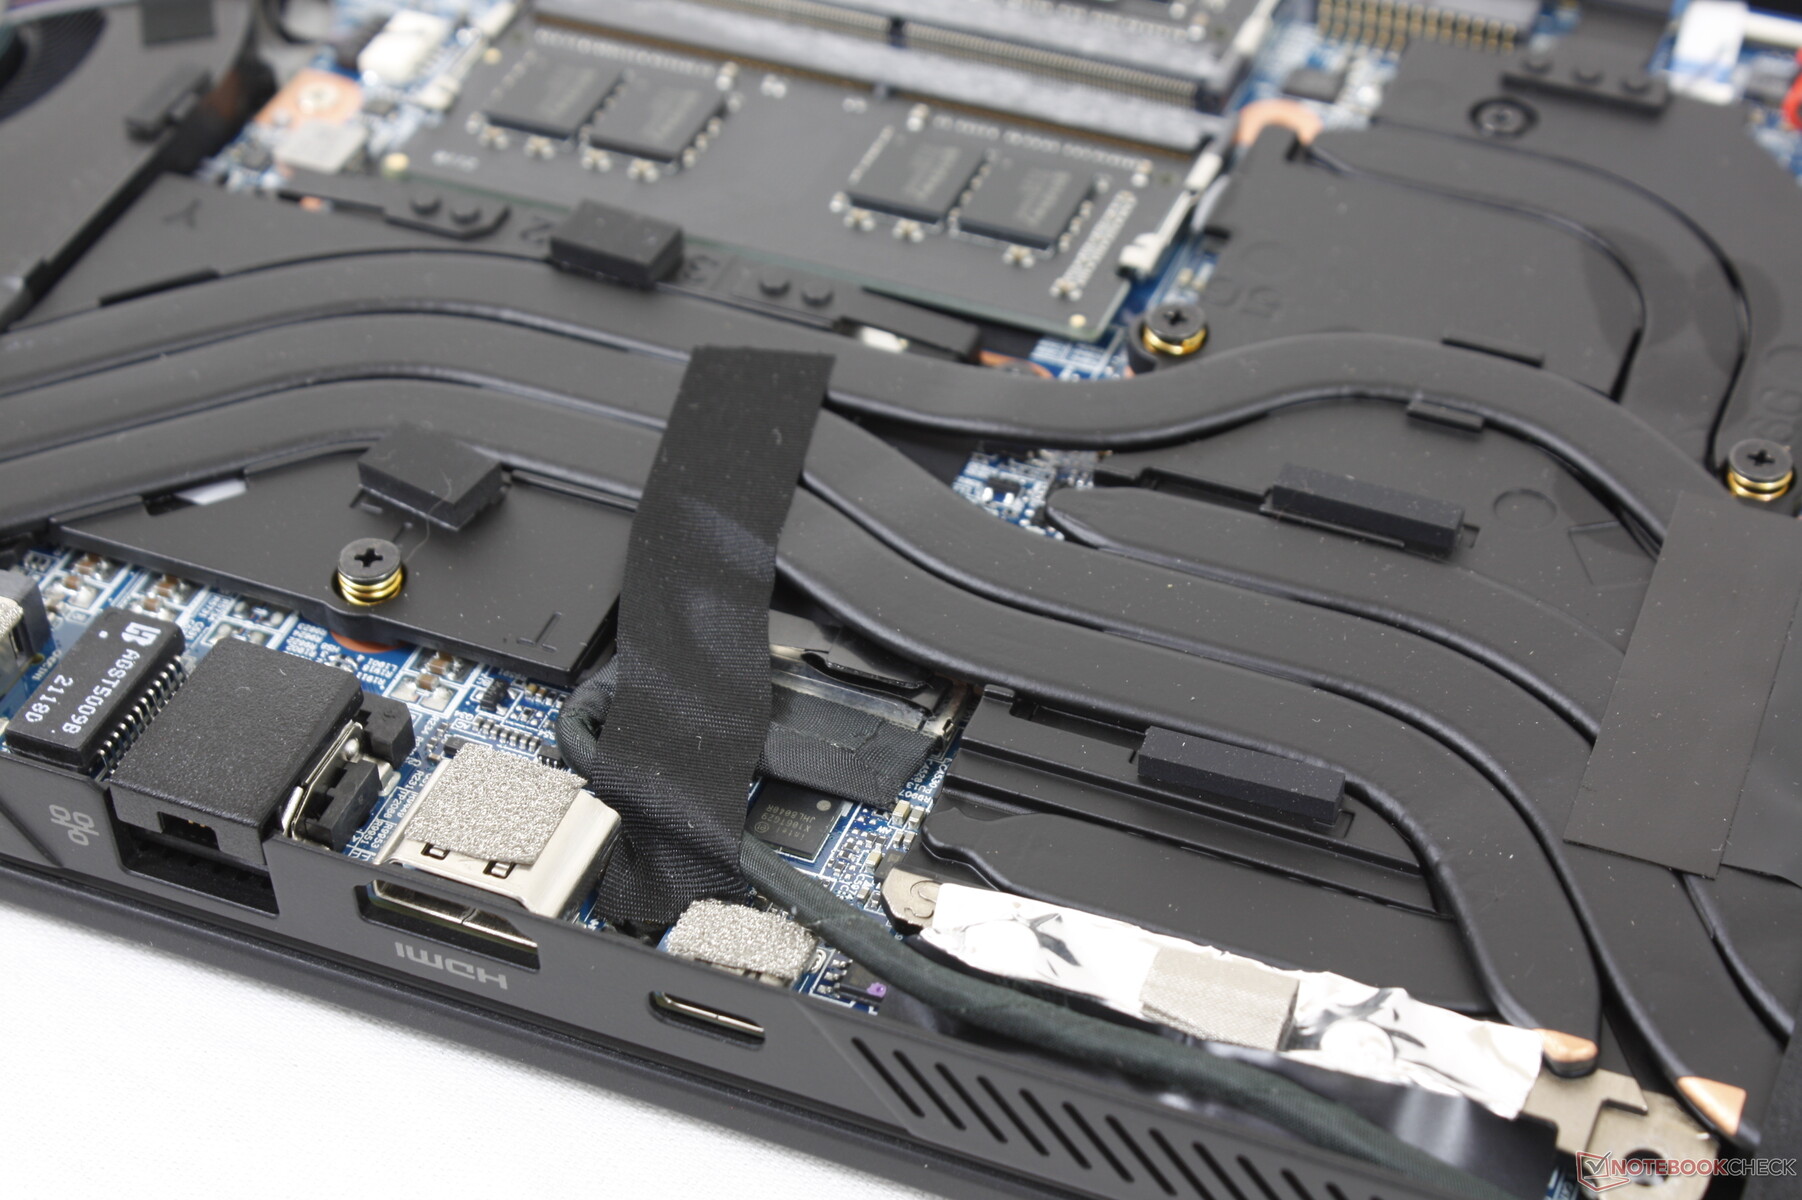
Conectividad
Las opciones de puerto son casi idénticas a las del Tongfang GM7ZG7S o GM7MG0R pero con una notable excepción: nuestro chasis Maingear integra un lector de MicroSD en lugar de uno de tamaño completo. Thunderbolt 4 se soporta de forma nativa a través del chipset de Intel, a diferencia de lo que ocurre en los portátiles con tecnología AMD
Por desgracia, el portátil no puede recargarse por USB-C incluso tras probar múltiples adaptadores USB-C.
Lector de tarjetas SD
Las velocidades de transferencia son medias desde el lector MicroSD integrado. Mover 1 GB de imágenes desde nuestra tarjeta de prueba UHS-II al escritorio lleva unos 14 segundos, frente a menos de la mitad en el MSI GS75.
| SD Card Reader | |
| average JPG Copy Test (av. of 3 runs) | |
| MSI GS75 10SF-609US (Toshiba Exceria Pro M501 UHS-II) | |
| Asus ROG Zephyrus S17 GX703HSD | |
| Schenker Compact 17 (Toshiba Exceria Pro SDXC 64 GB UHS-II) | |
| Schenker XMG Neo 17 (Early 2021, RTX 3070, 5800H) (Toshiba Exceria Pro SDXC 64 GB UHS-II) | |
| Maingear Vector Pro MG-VCP17 (AV Pro V60) | |
| Schenker XMG Core 17 (Early 2021) (AV PRO microSD 128 GB V60) | |
| maximum AS SSD Seq Read Test (1GB) | |
| Asus ROG Zephyrus S17 GX703HSD | |
| MSI GS75 10SF-609US (Toshiba Exceria Pro M501 UHS-II) | |
| Schenker Compact 17 (Toshiba Exceria Pro SDXC 64 GB UHS-II) | |
| Schenker XMG Neo 17 (Early 2021, RTX 3070, 5800H) (Toshiba Exceria Pro SDXC 64 GB UHS-II) | |
| Maingear Vector Pro MG-VCP17 (AV Pro V60) | |
| Schenker XMG Core 17 (Early 2021) (AV PRO microSD 128 GB V60) | |
Comunicación
Cámara web
Aunque hay IR para la compatibilidad con Windows Hello, la cámara web de 720p no integra ningún obturador de privacidad.


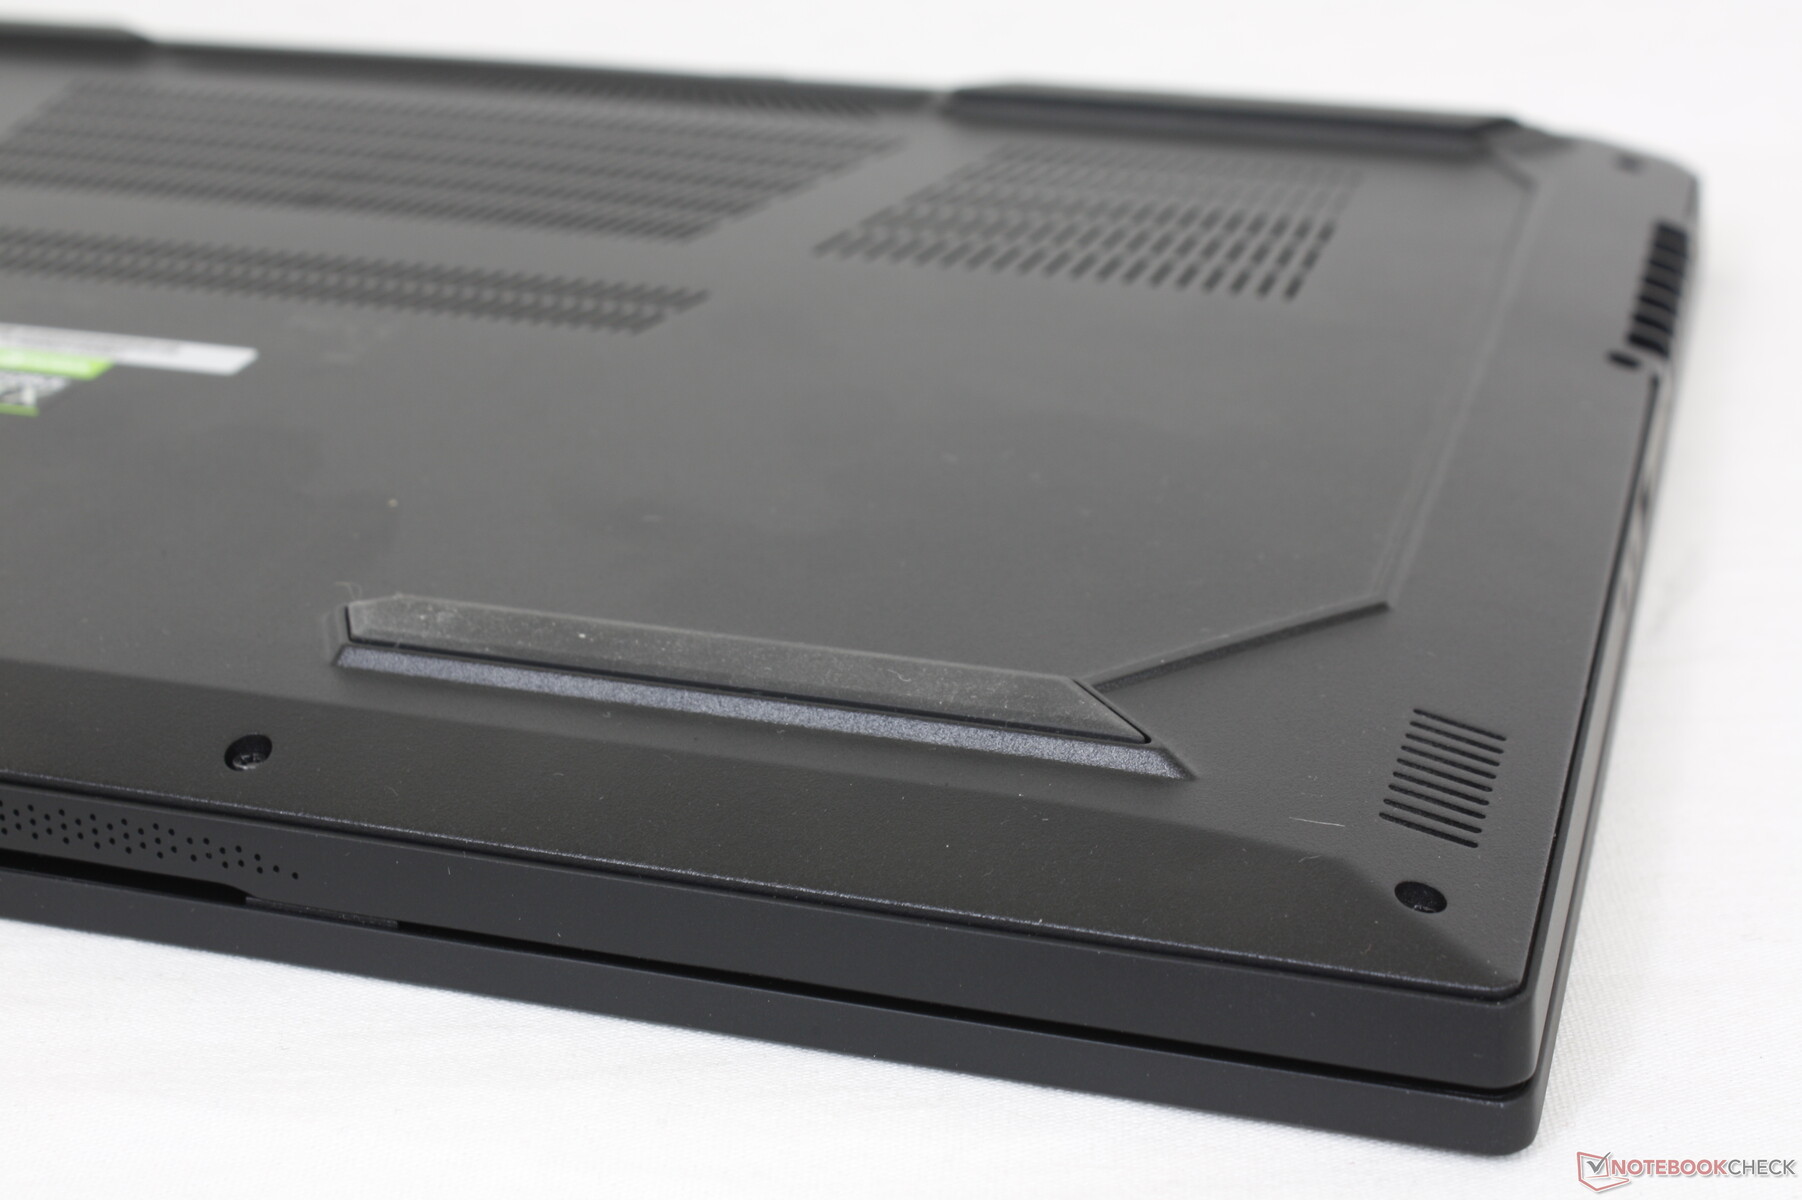
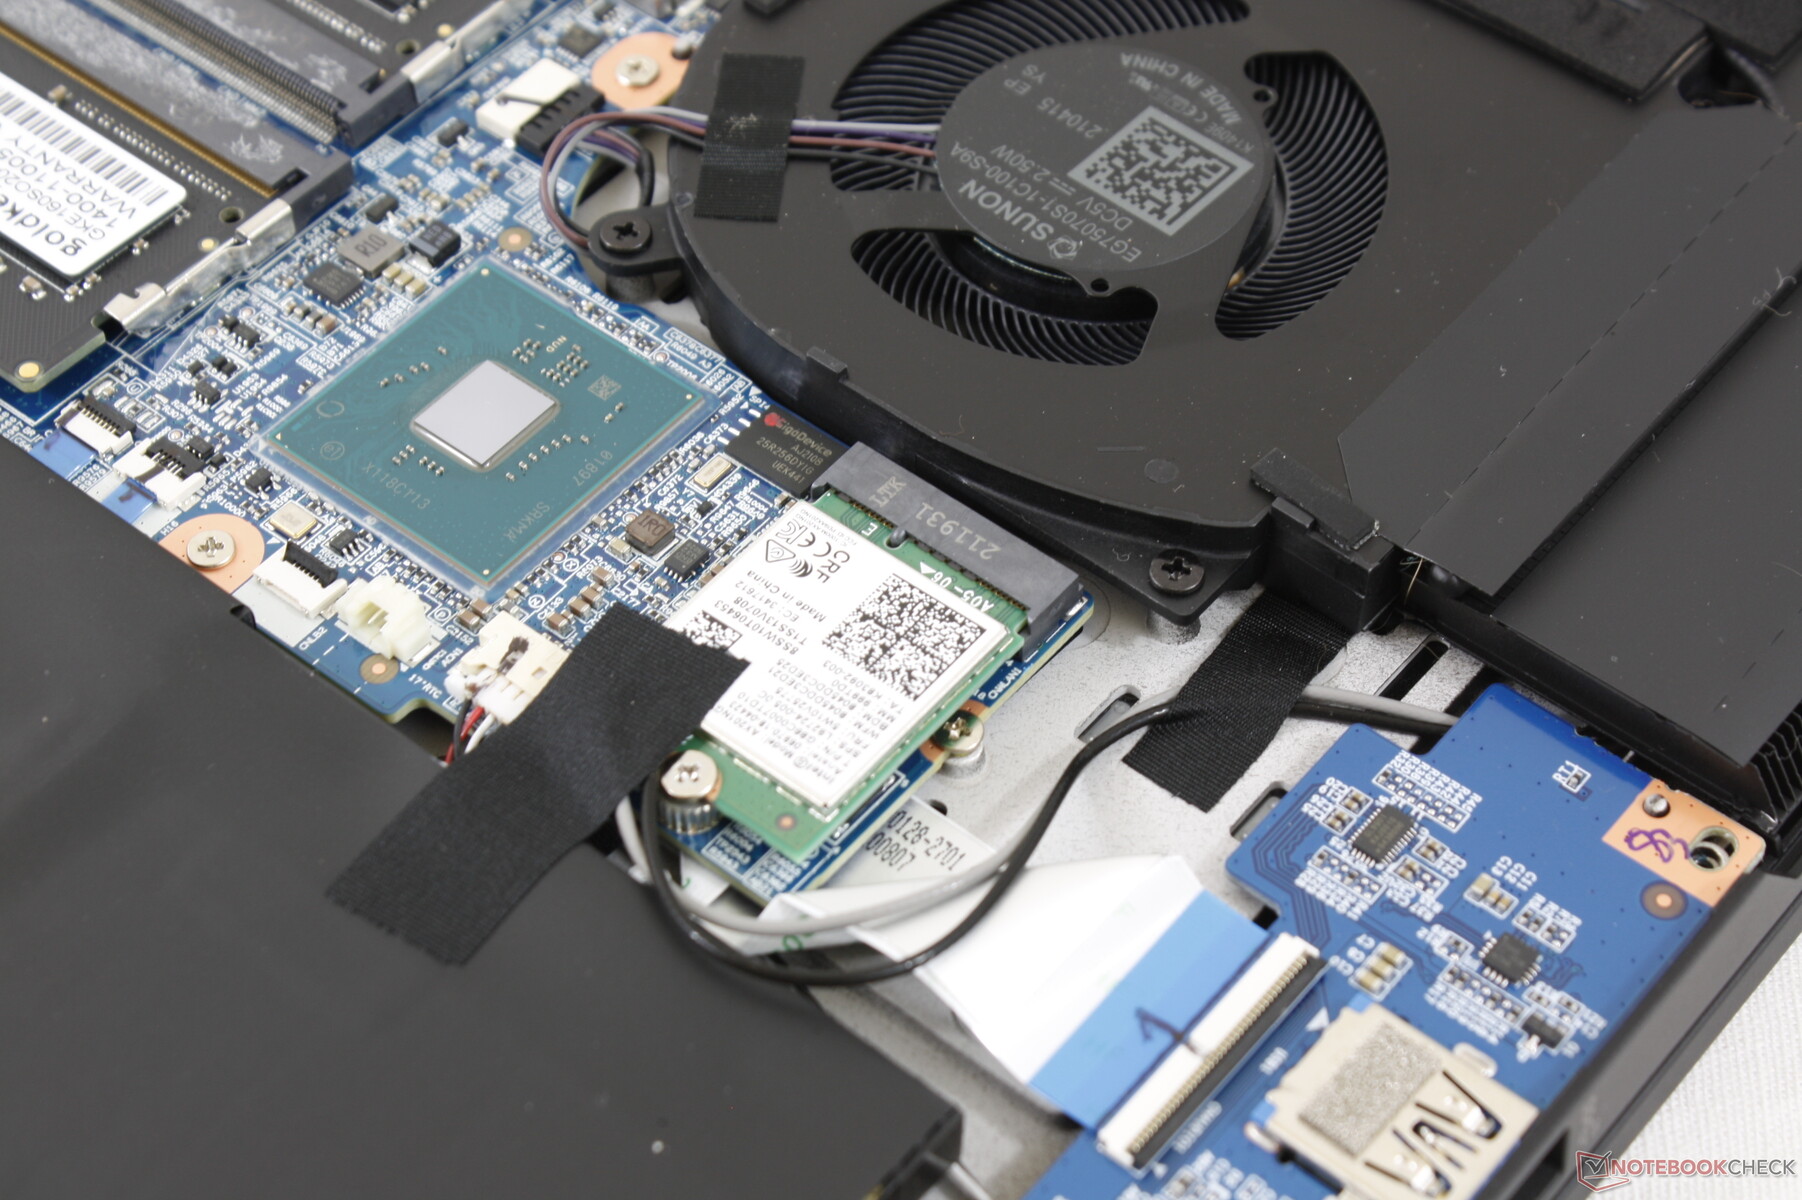
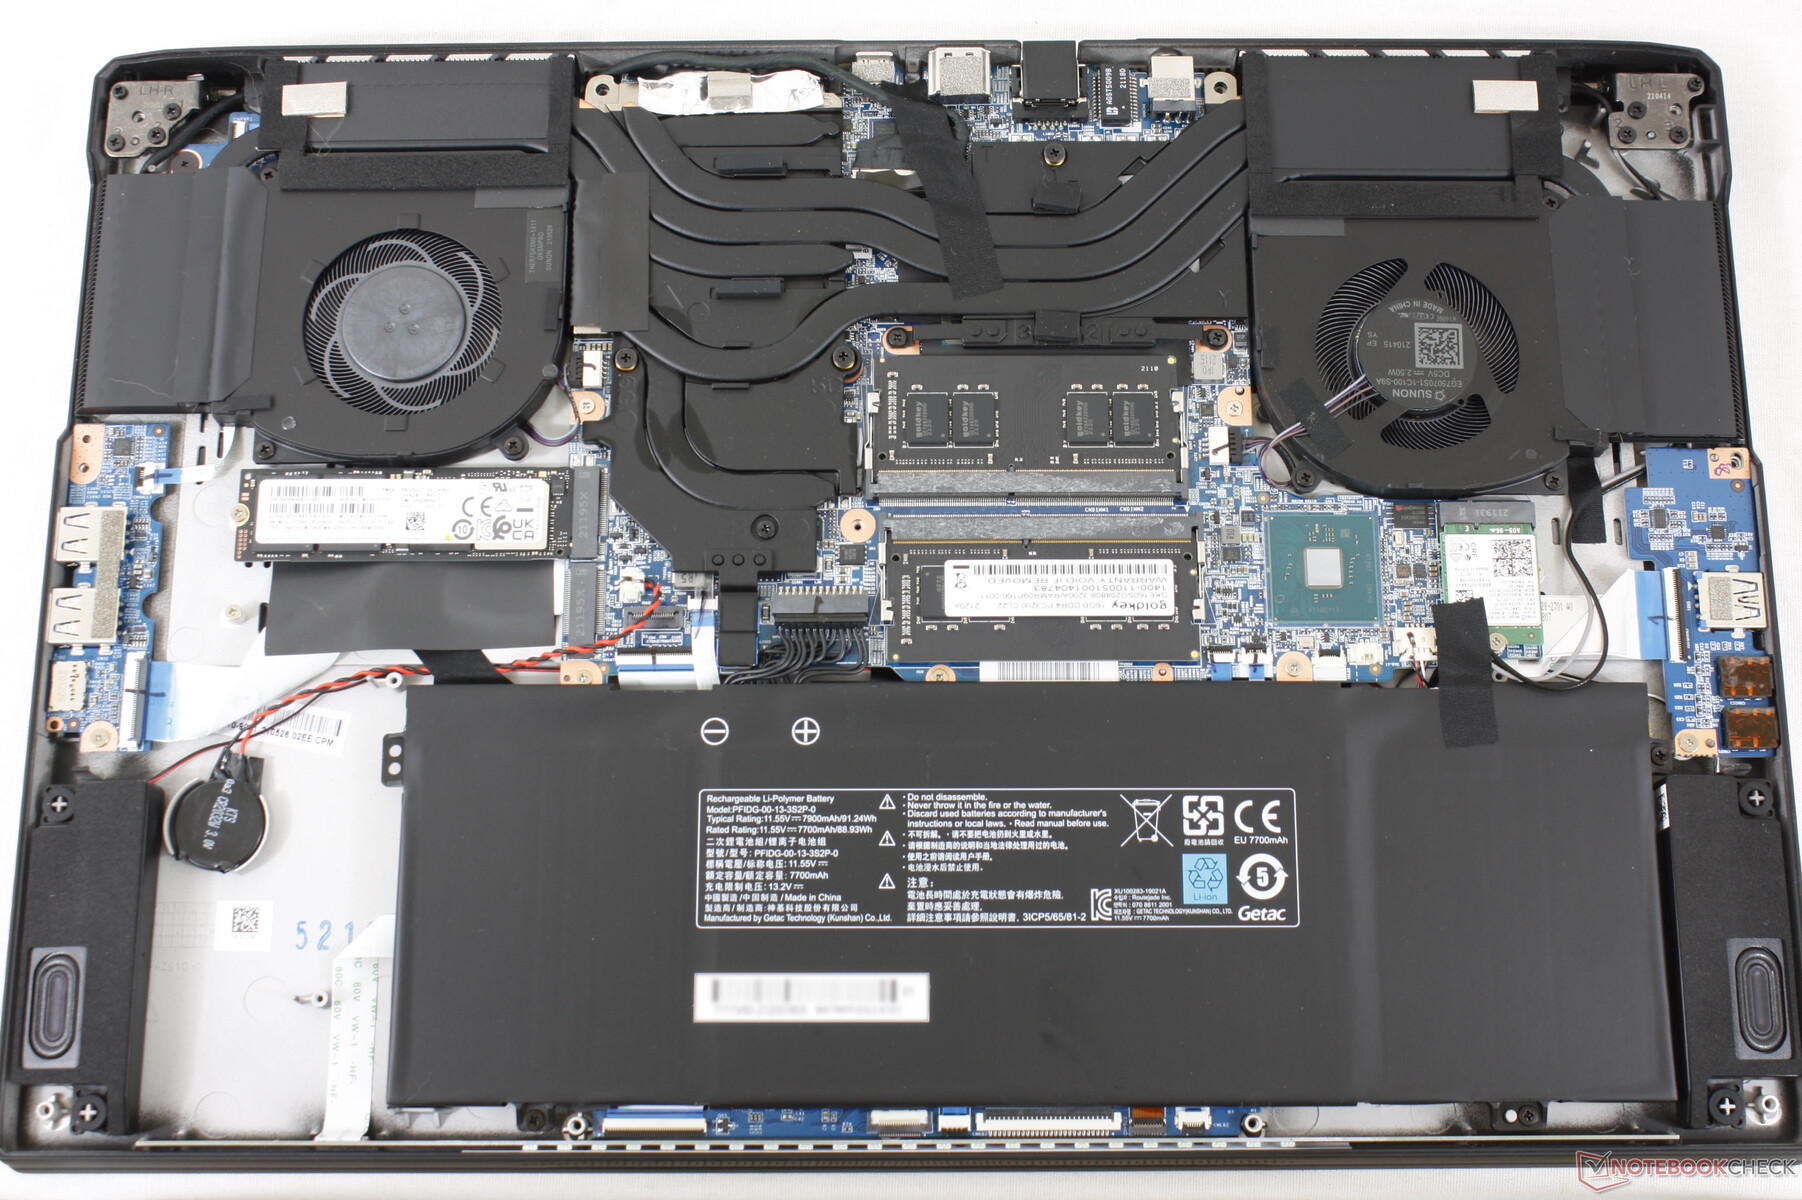
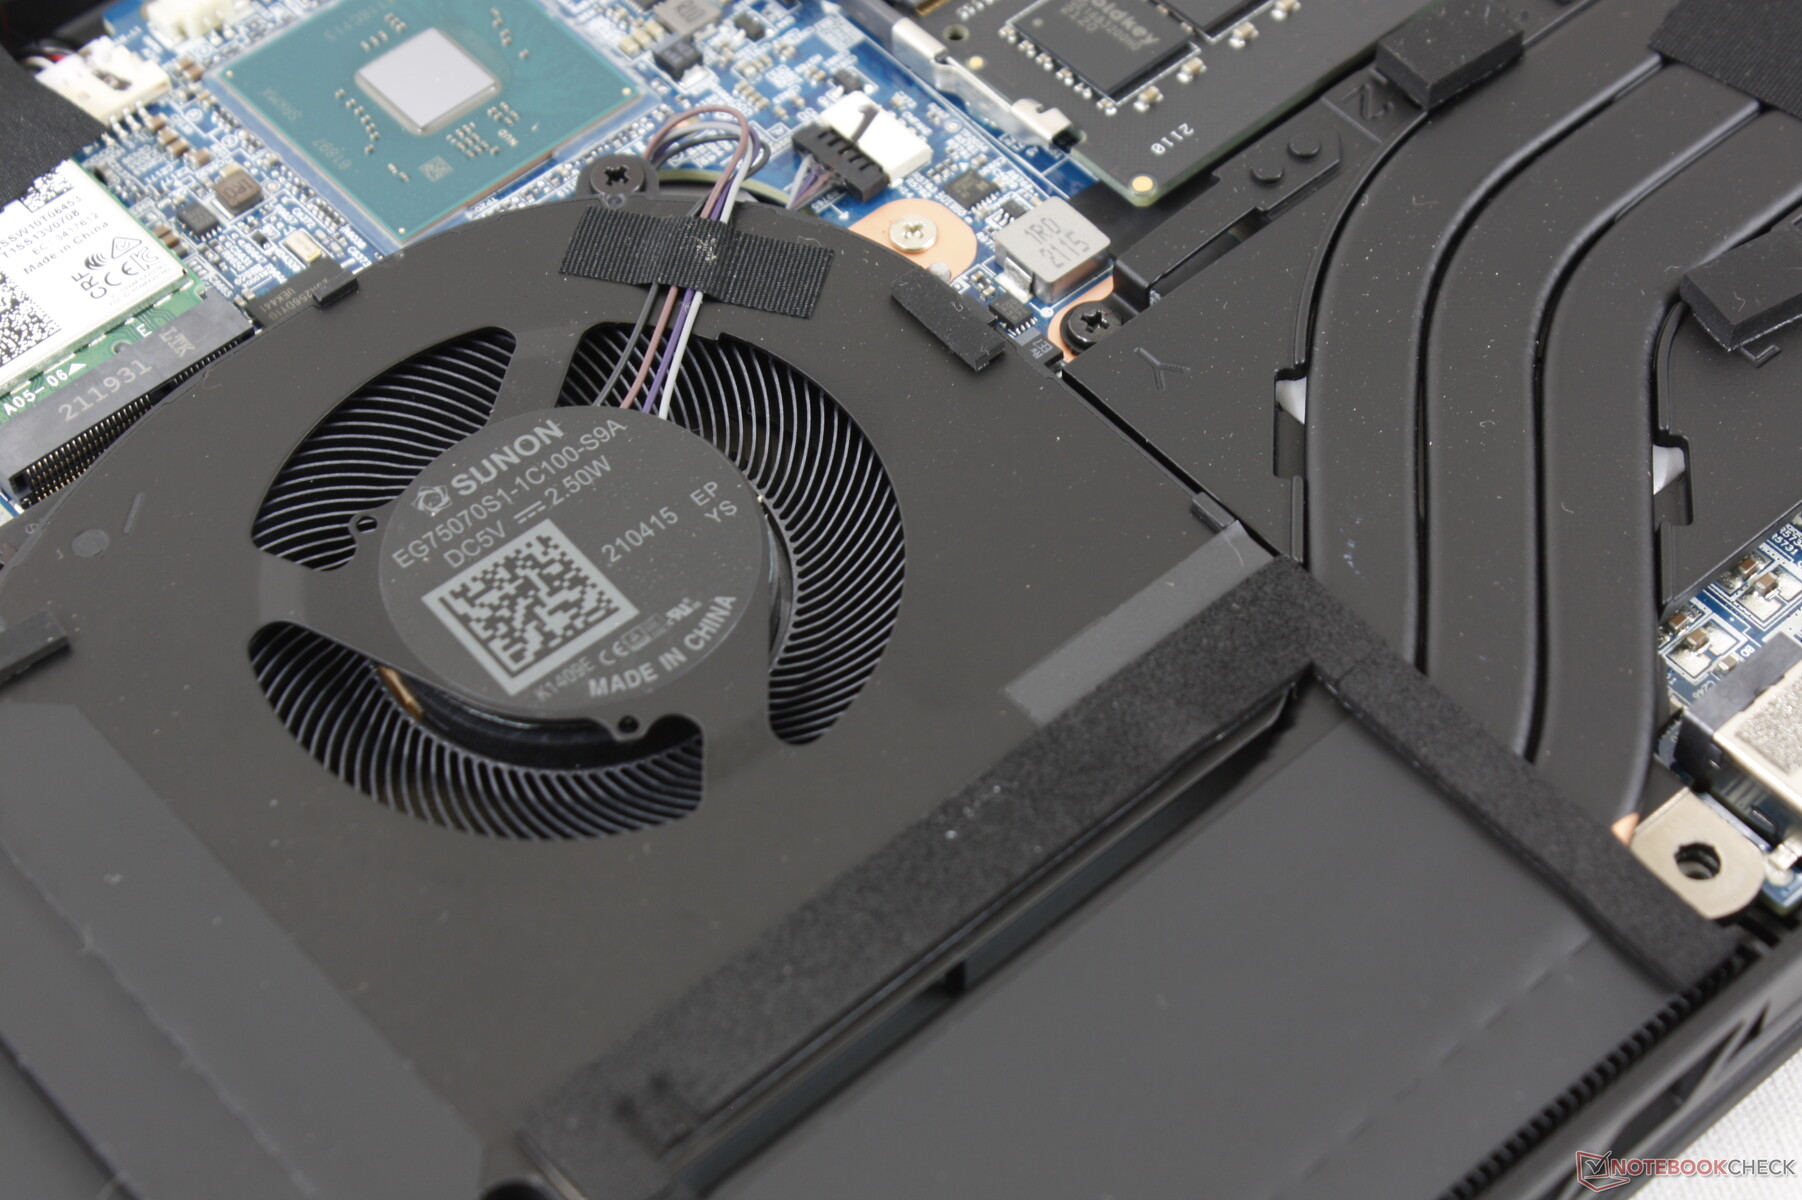
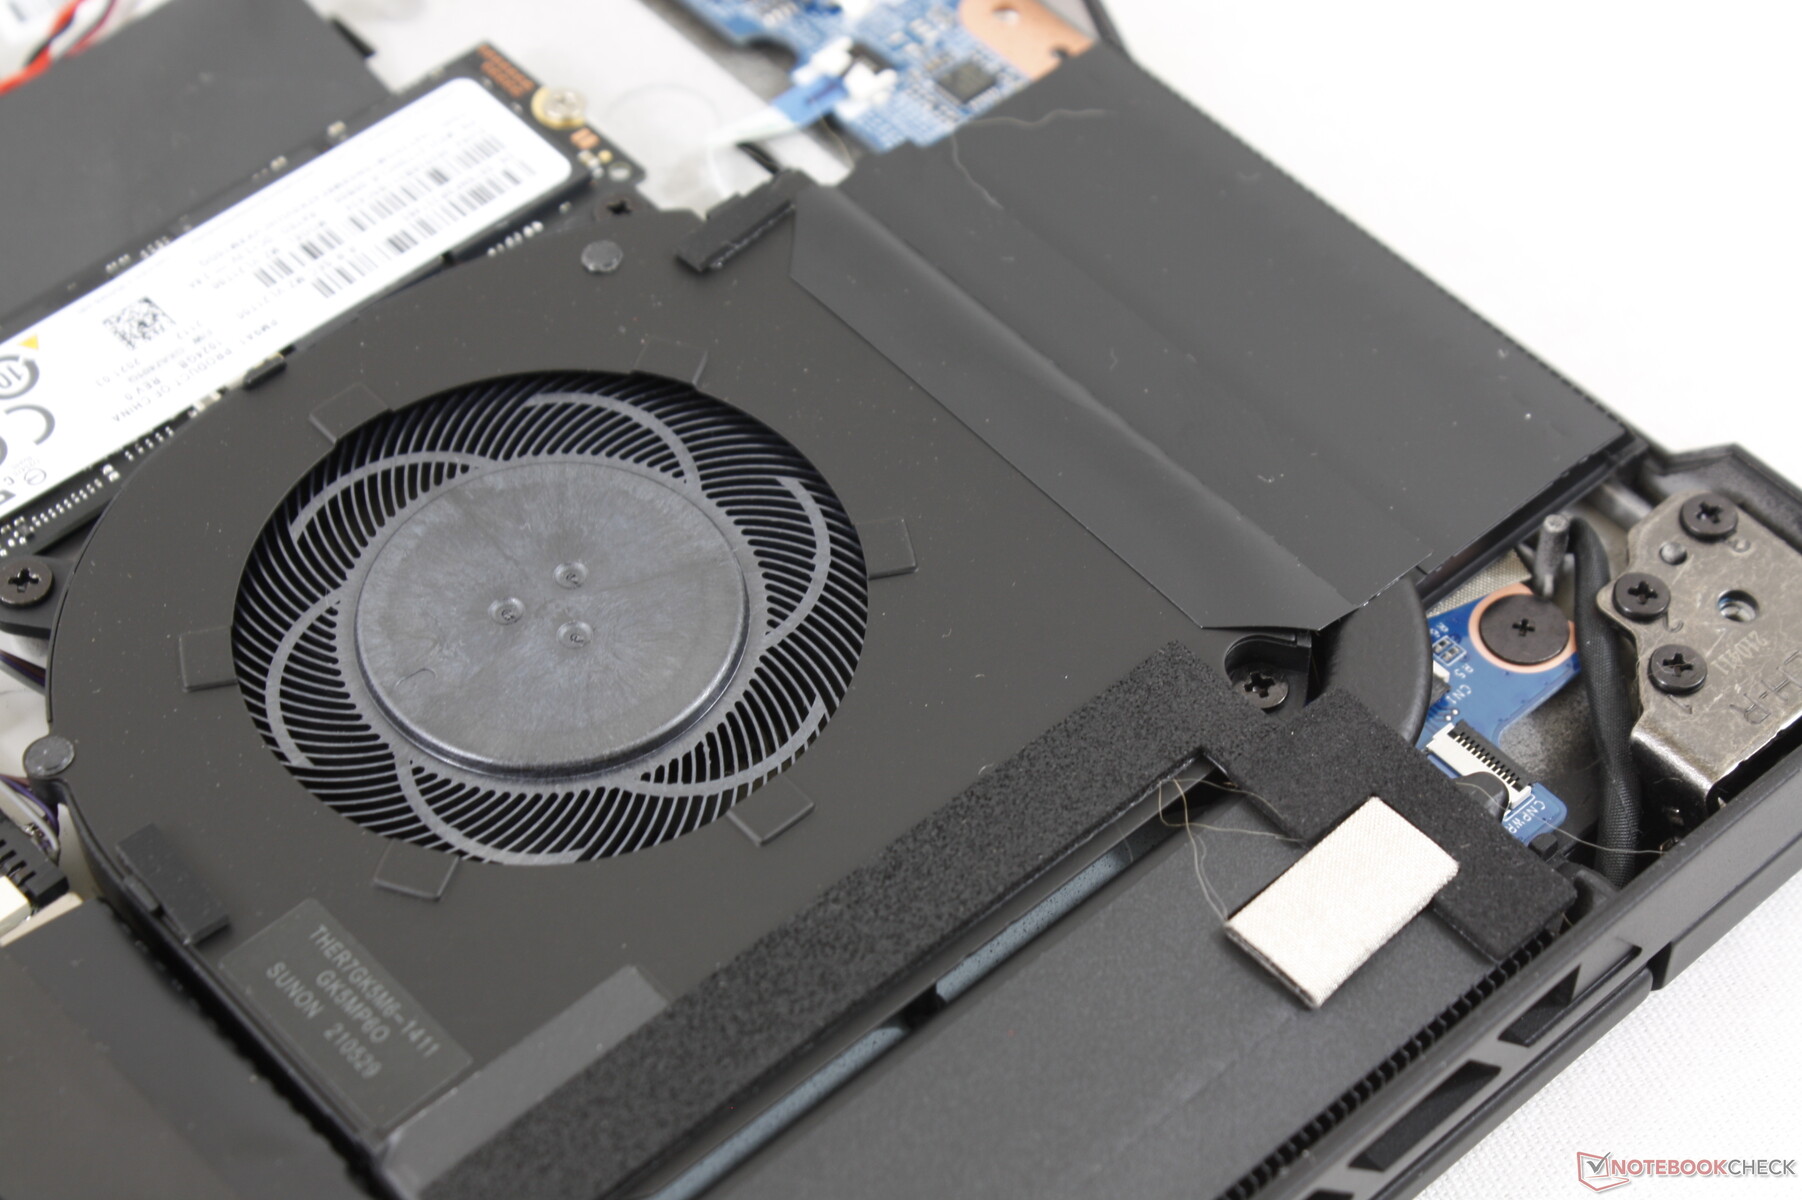
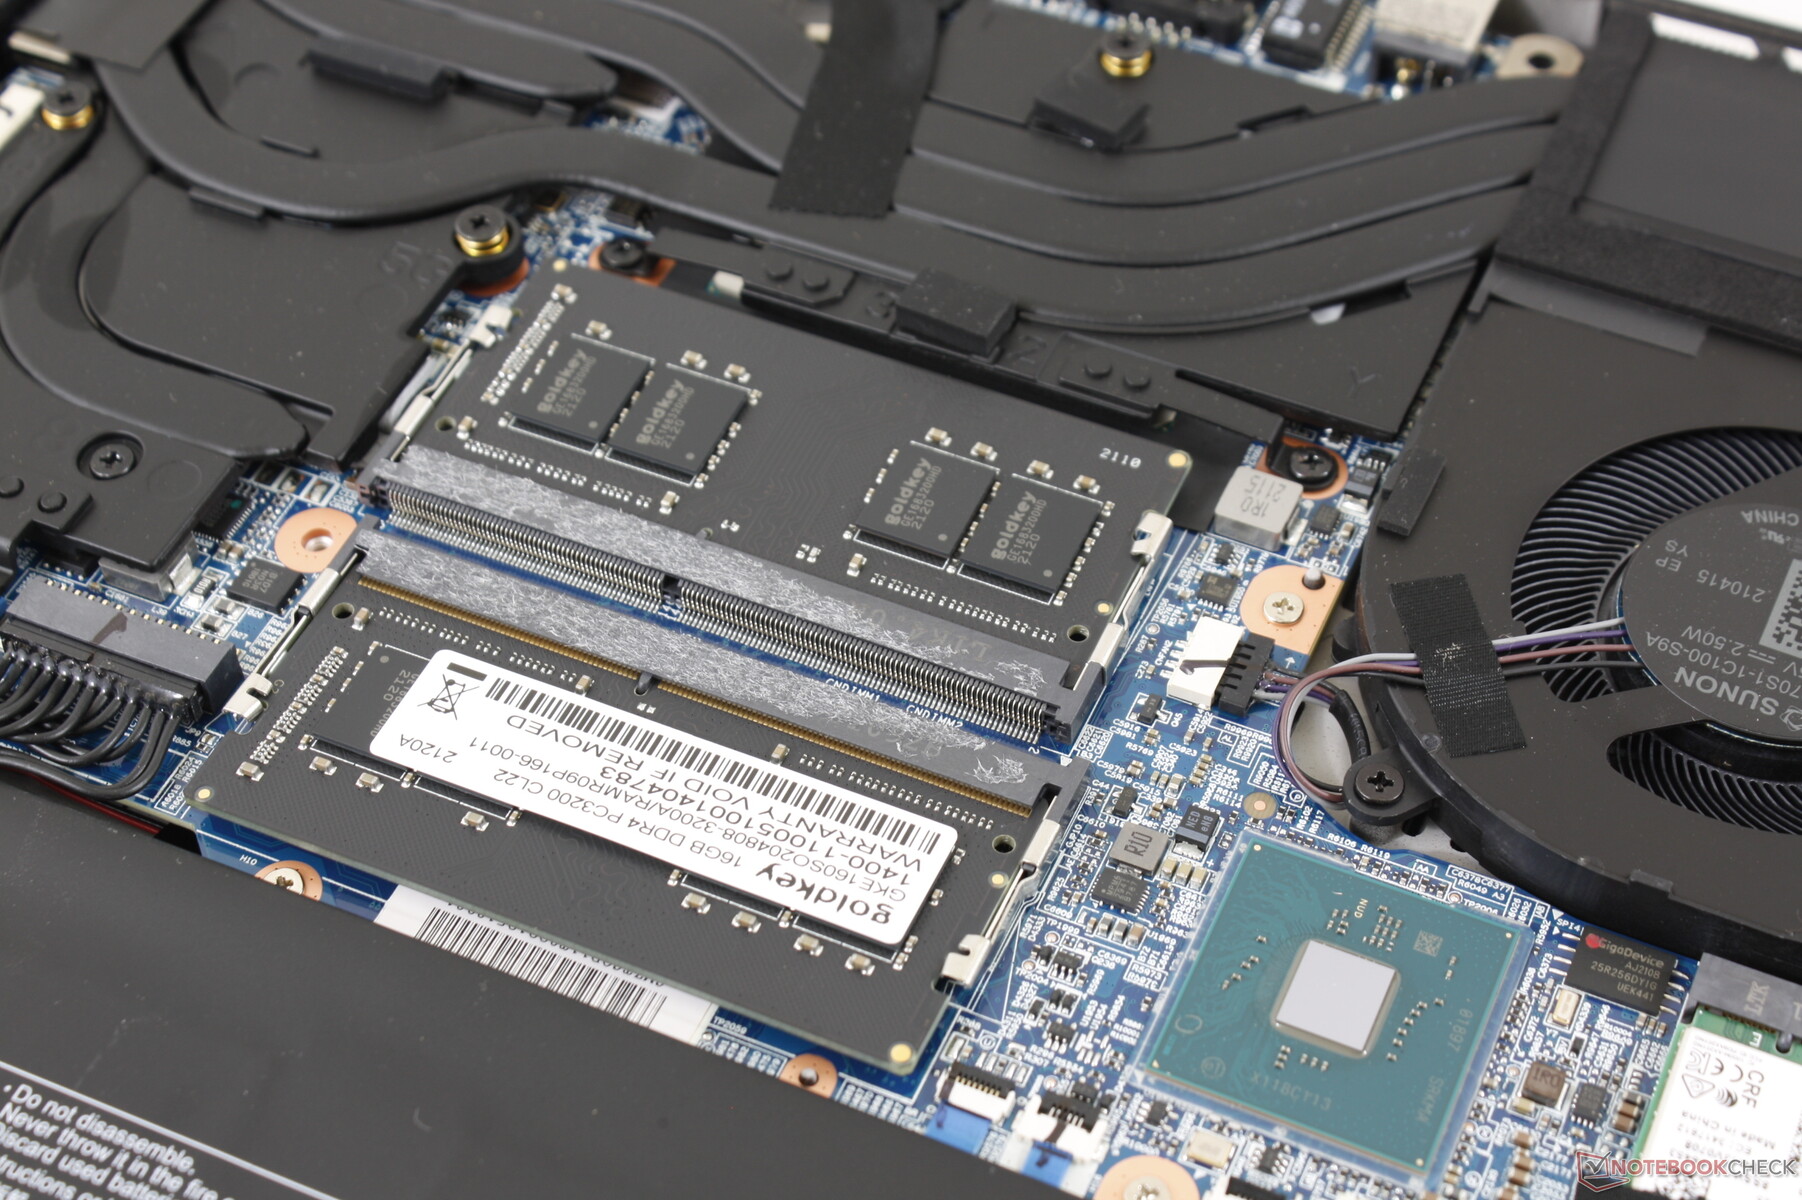
Mantenimiento
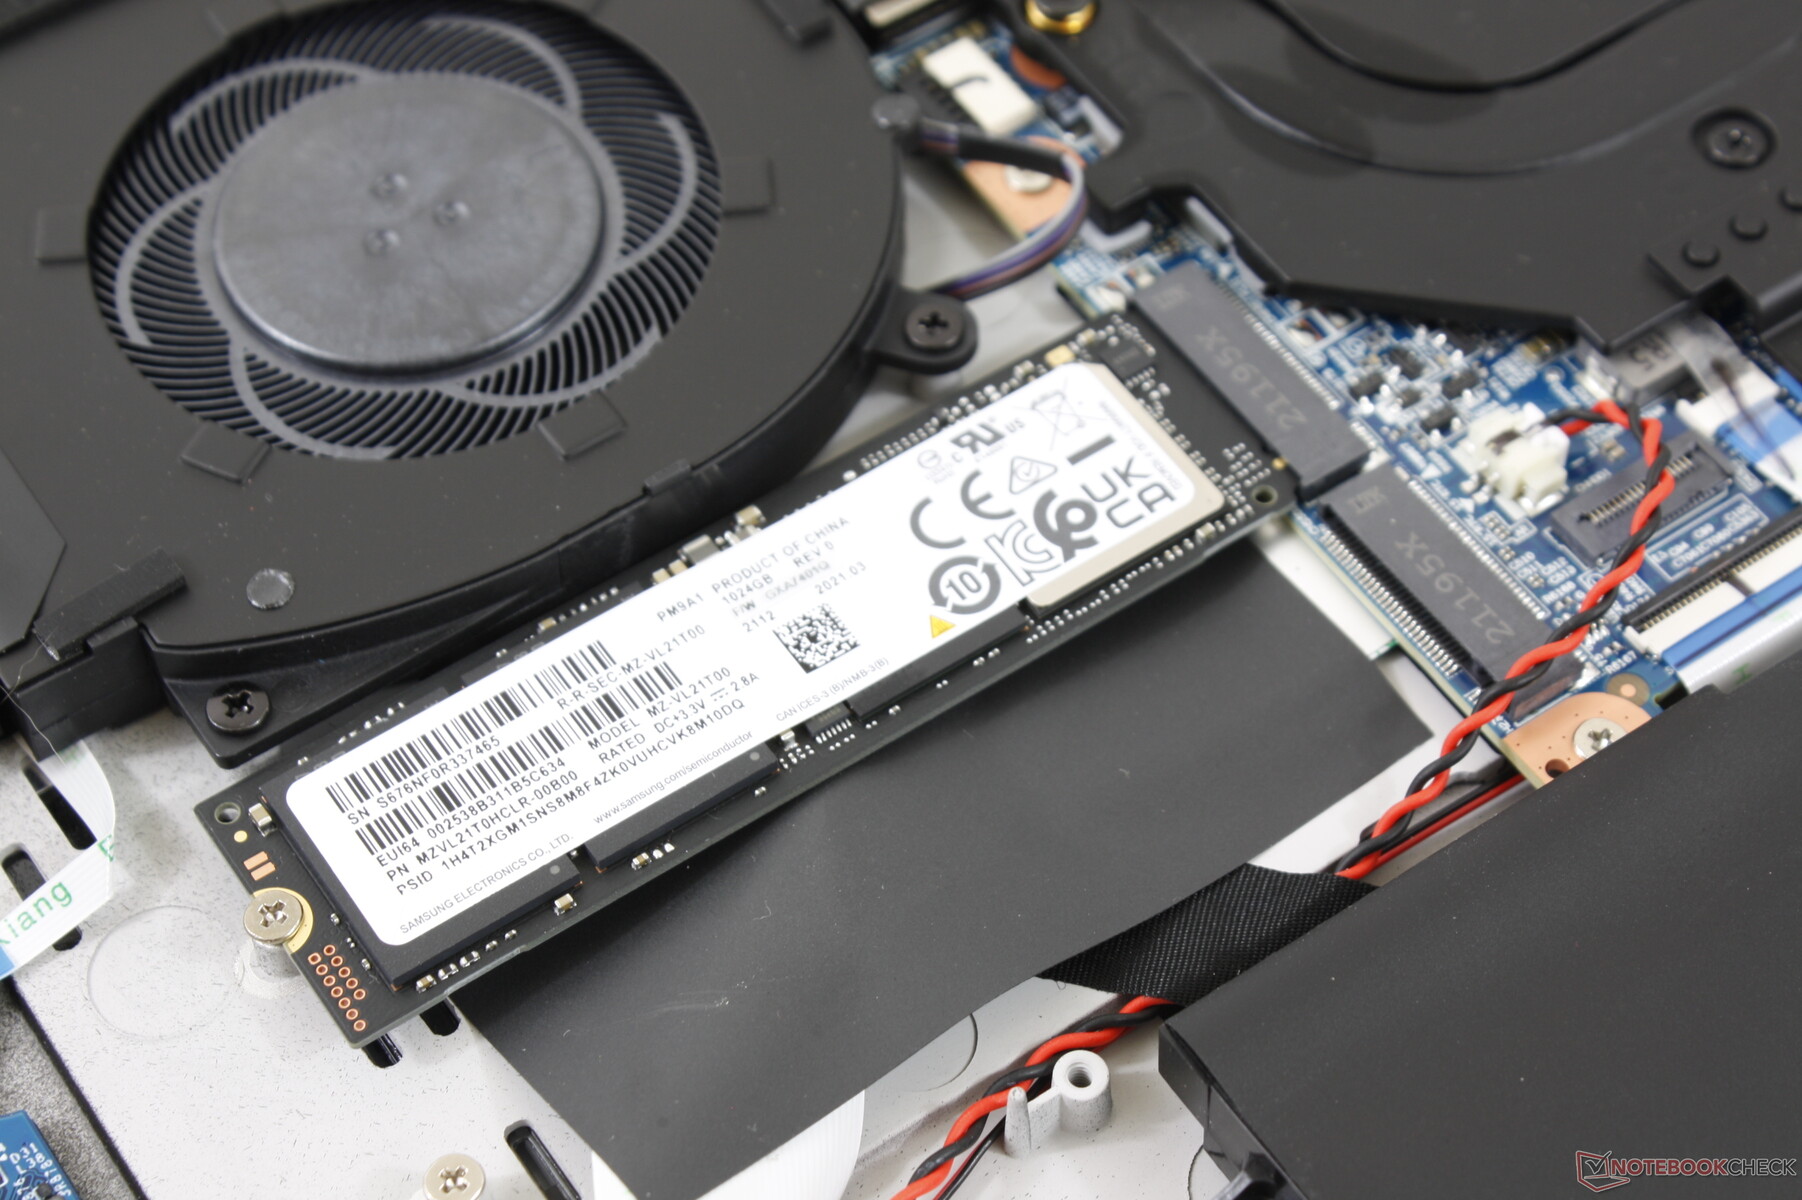
El panel inferior se desprende con bastante facilidad tras retirar los diez tornillos Philips que hay debajo. Los propietarios tienen acceso directo a la batería, las dos ranuras M.2 2280, las dos ranuras de RAM y el módulo WLAN.
Accesorios y garantía
En la caja no hay más extras que el adaptador de CA, la documentación y un par de pegatinas con el logotipo de Maingear. Se aplica la garantía limitada estándar de un año con opciones de extensión de Maingear.
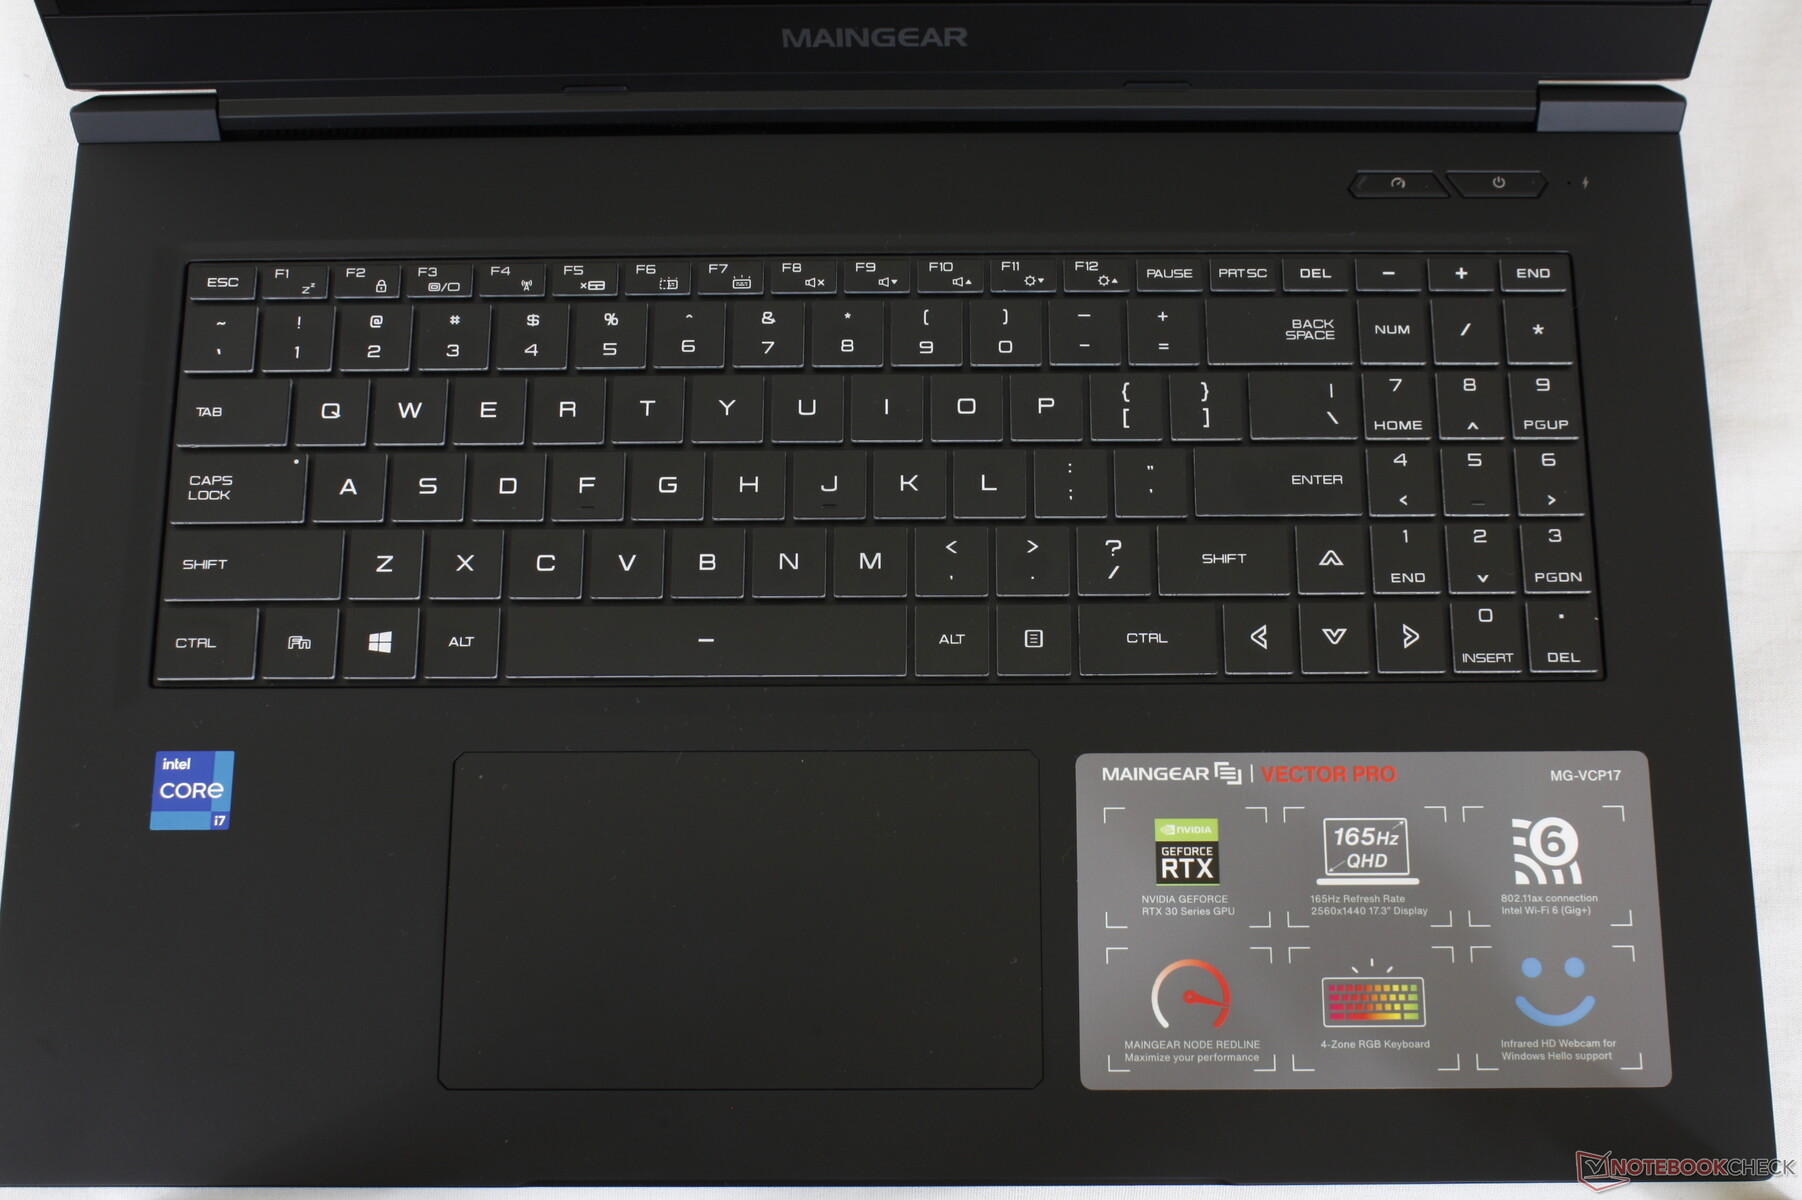
Dispositivos de entrada
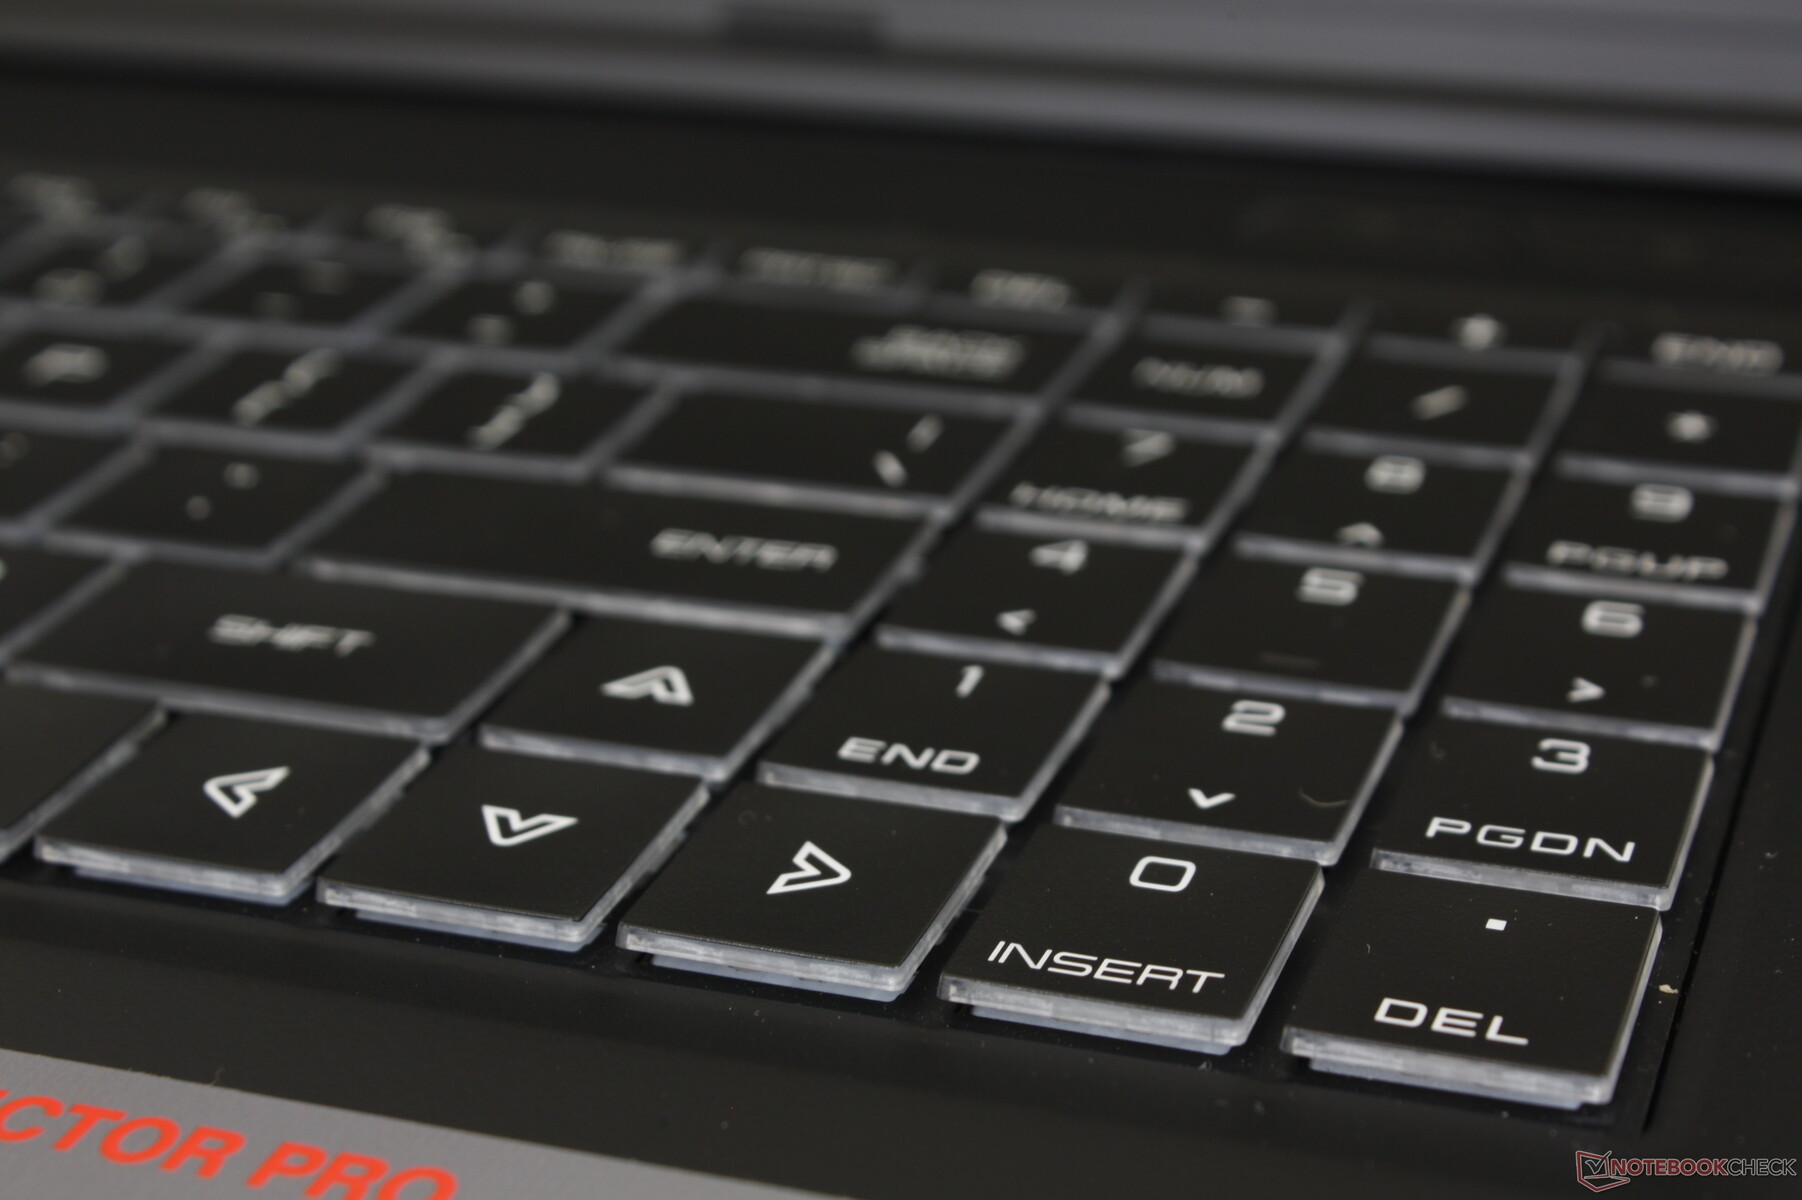
Teclado
La respuesta y el recorrido de las teclas podrían haber sido más firmes y profundos, especialmente para un portátil de juegos. Aunque no es tan ligero o poco profundo como un Asus VivoBook barato, una mayor cesión de las teclas podría haber mejorado la experiencia de juego y tecleo. La respuesta es más comparable a la de un Asus Zephyrus que a la de un modelo MSI GT o GS.
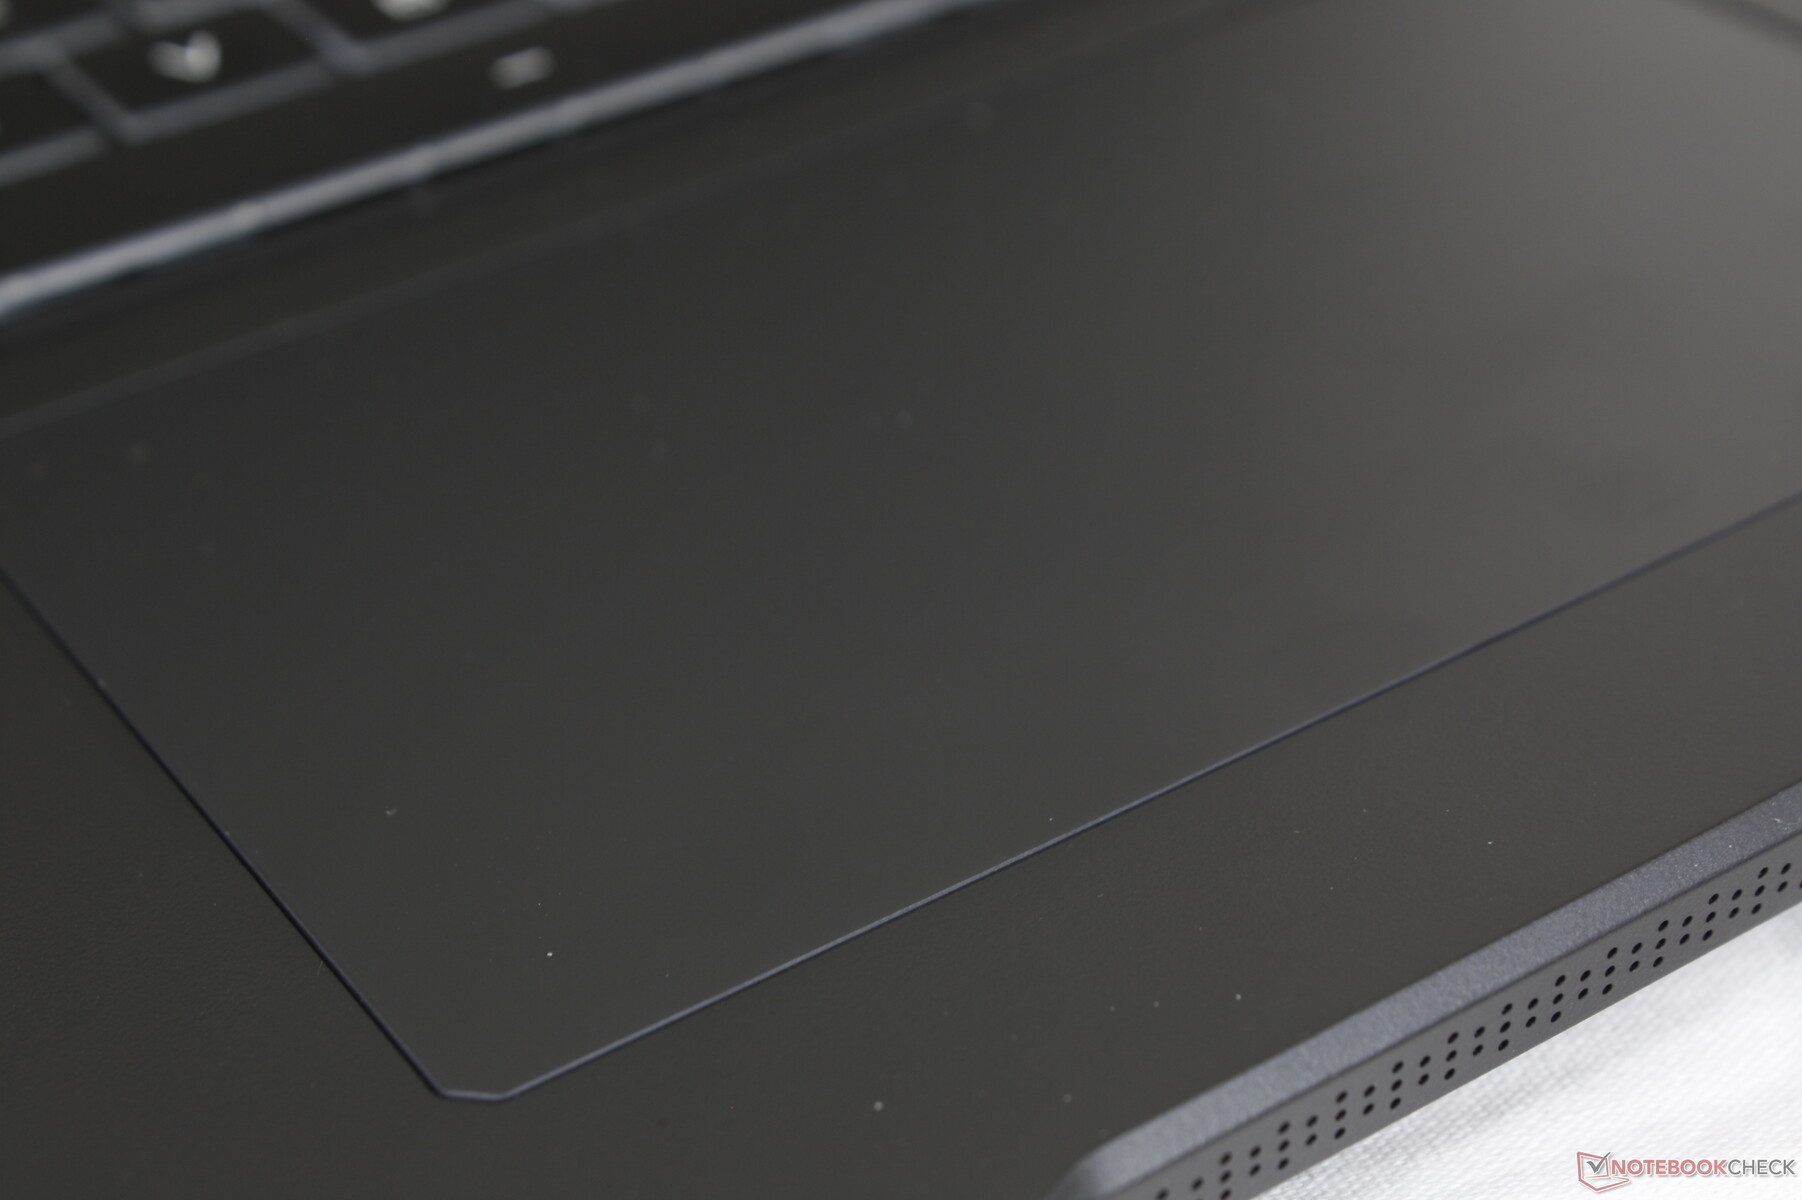
Panel táctil
El clickpad es un poco más pequeño que el del Razer Blade Pro (13,3 x 7,5 cm frente a 13 x 8 cm). La respuesta, sin embargo, es más fuerte y no tan esponjosa en el Maingear.

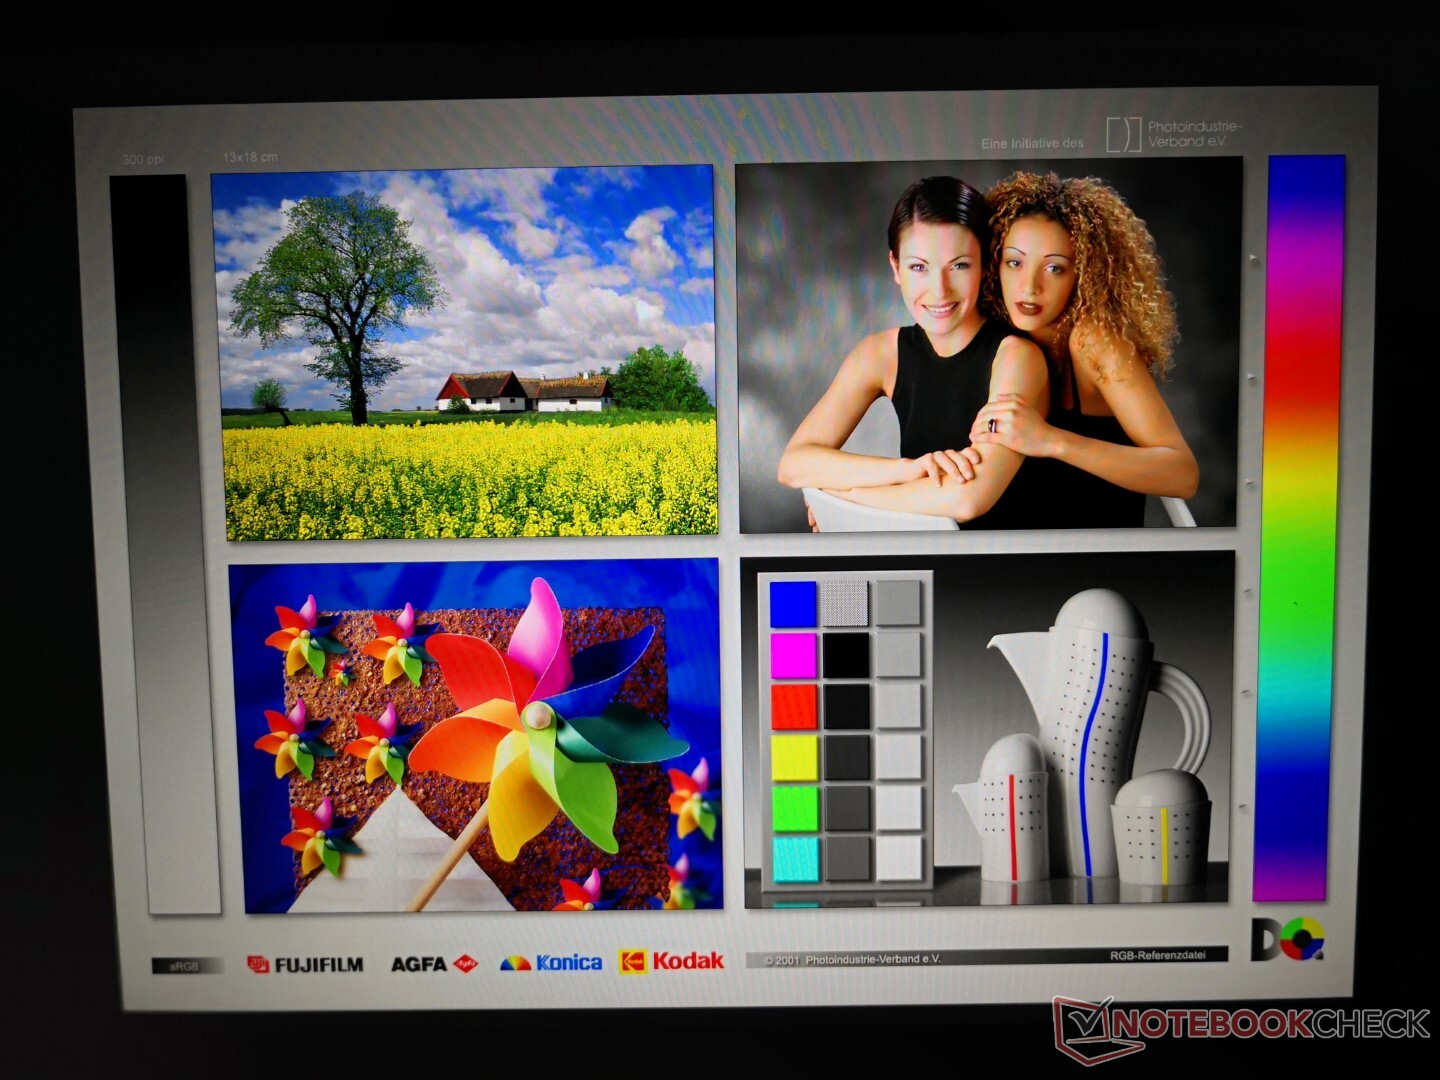
Mostrar
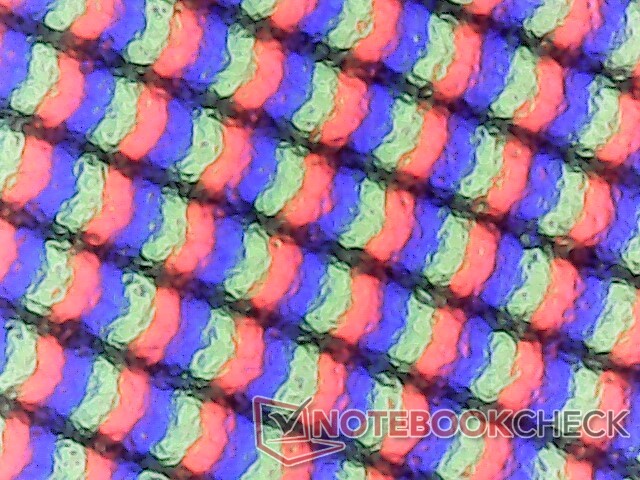
Nuestro Vector Pro utiliza el mismo panel IPS NE173QHM-NY2 de BOE que se encuentra en el Schenker XMG Core 17, lo que significa que ambos portátiles comparten atributos de pantalla similares. Los tiempos de respuesta son rápidos con buen brillo, niveles de contraste y tasas de refresco para representar un panel de 1440p de gama alta diseñado para juegos. BOE tiene un panel NE173QHM-NY3 más nuevo con tiempos de respuesta aún más rápidos y mejores colores como el que se encuentra en elAsus ROG Zephyrus S17 GX703 por lo que es un poco decepcionante que nuestro Maingear utilice una versión más antigua
| |||||||||||||||||||||||||
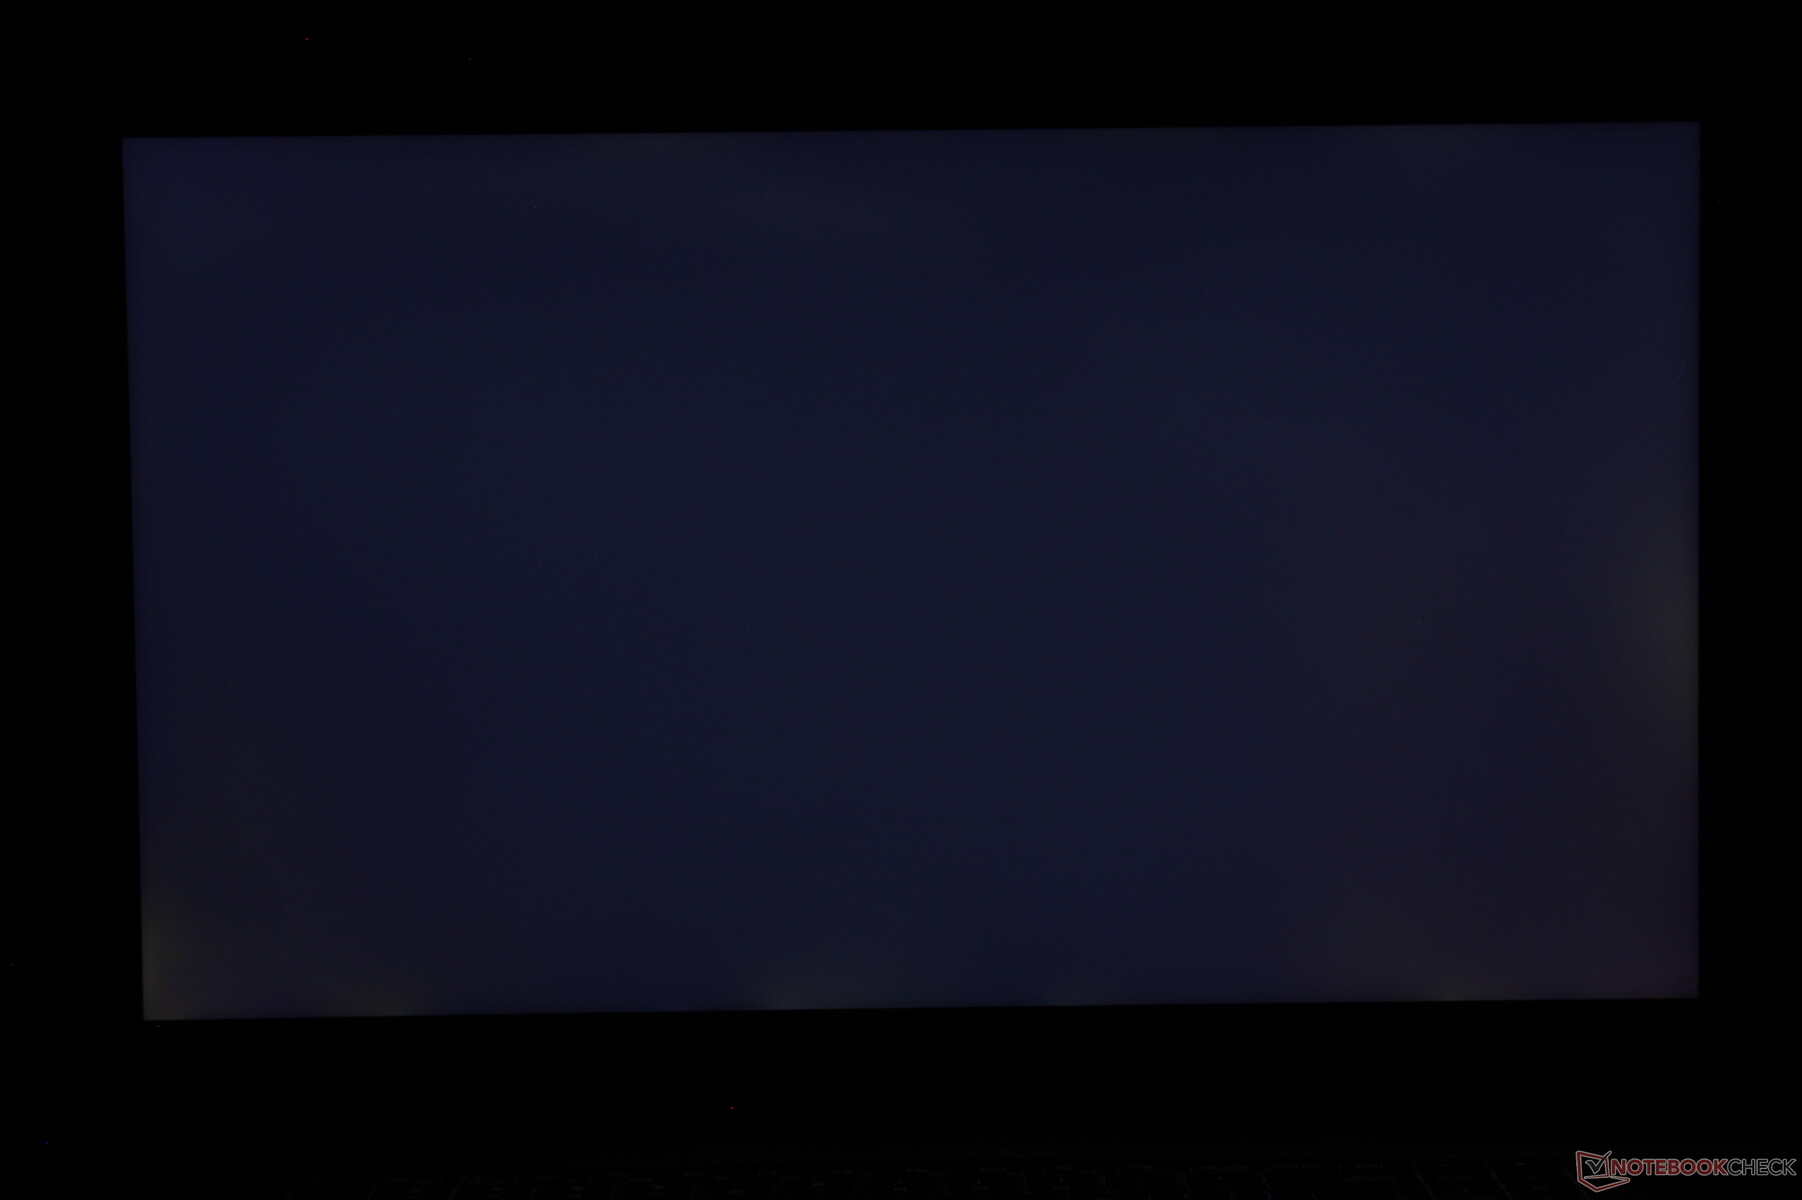
iluminación: 84 %
Brillo con batería: 389.7 cd/m²
Contraste: 829:1 (Negro: 0.47 cd/m²)
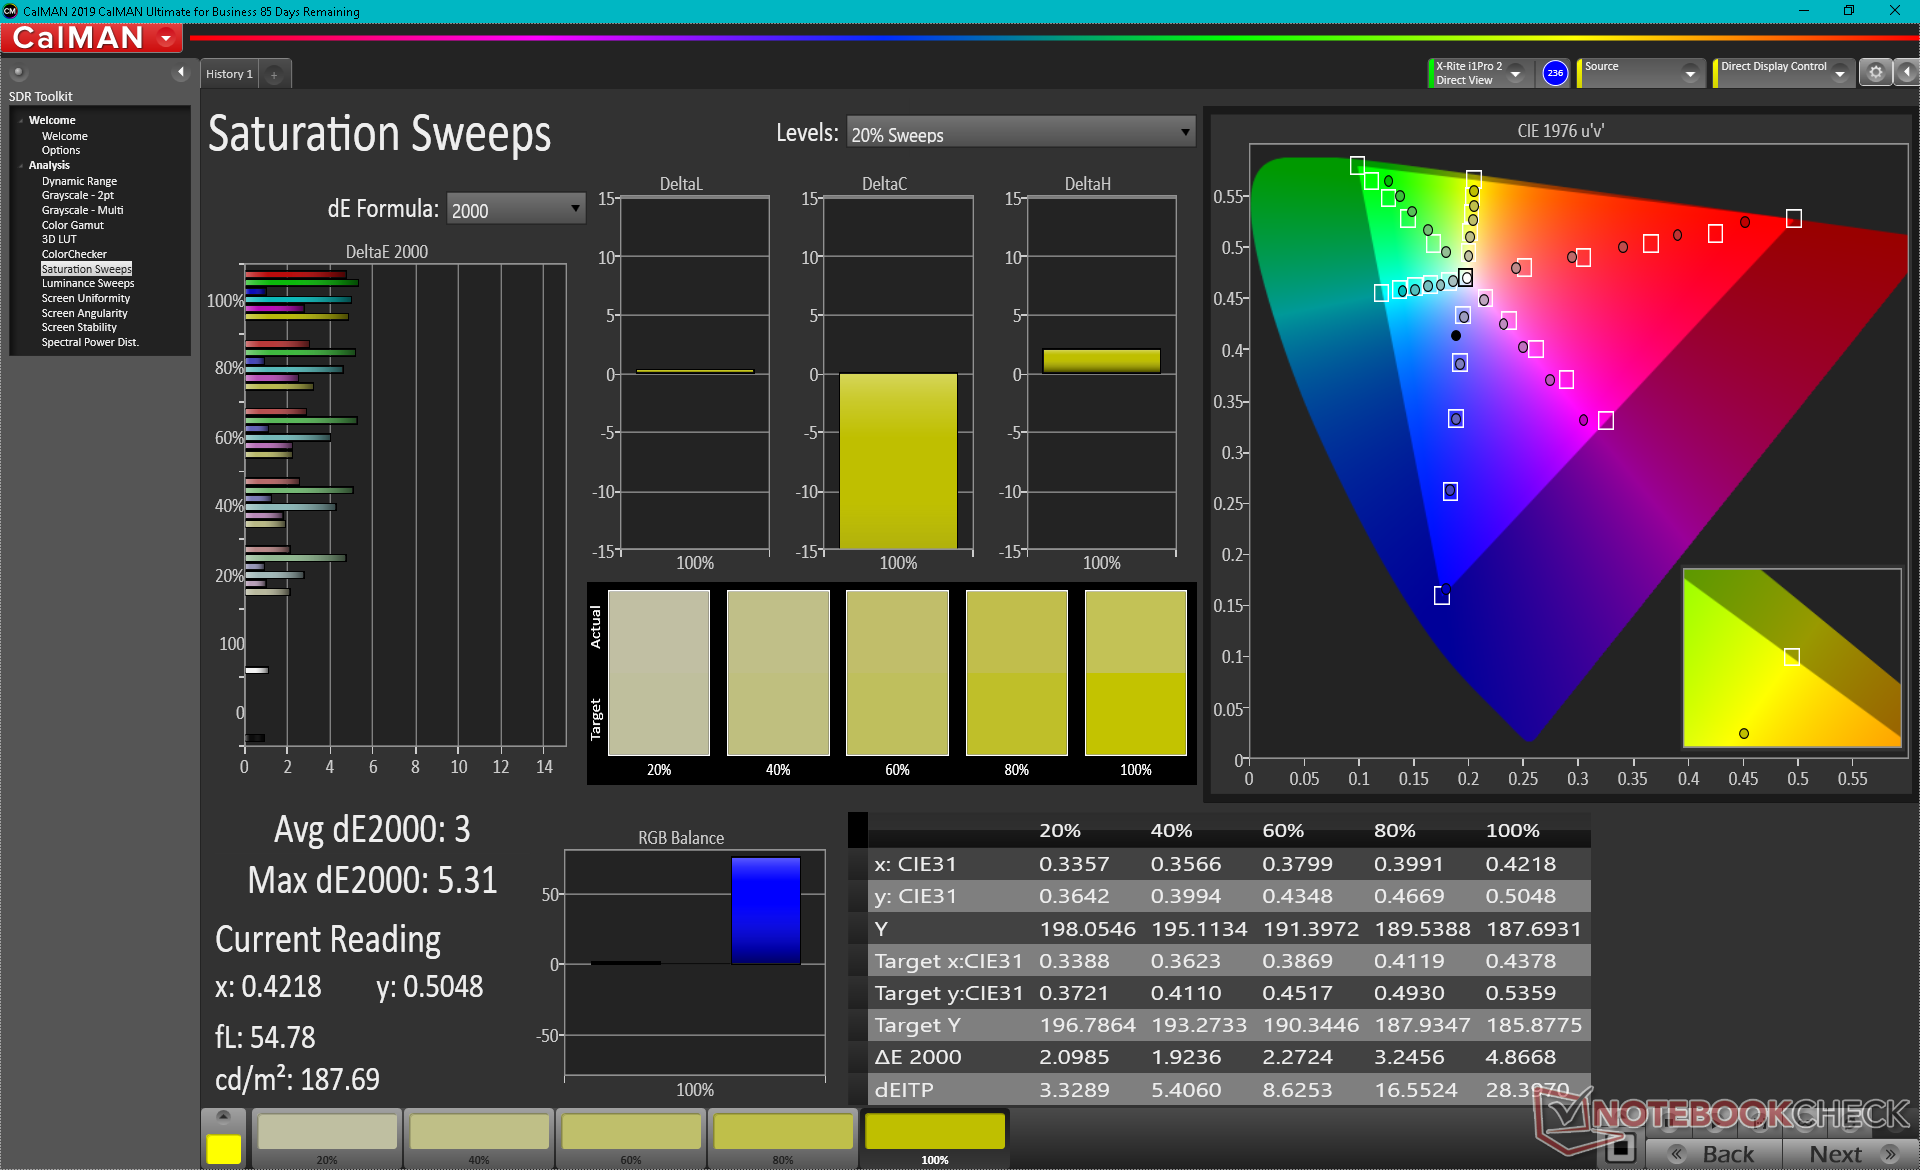
ΔE ColorChecker Calman: 1.93 | ∀{0.5-29.43 Ø4.71}
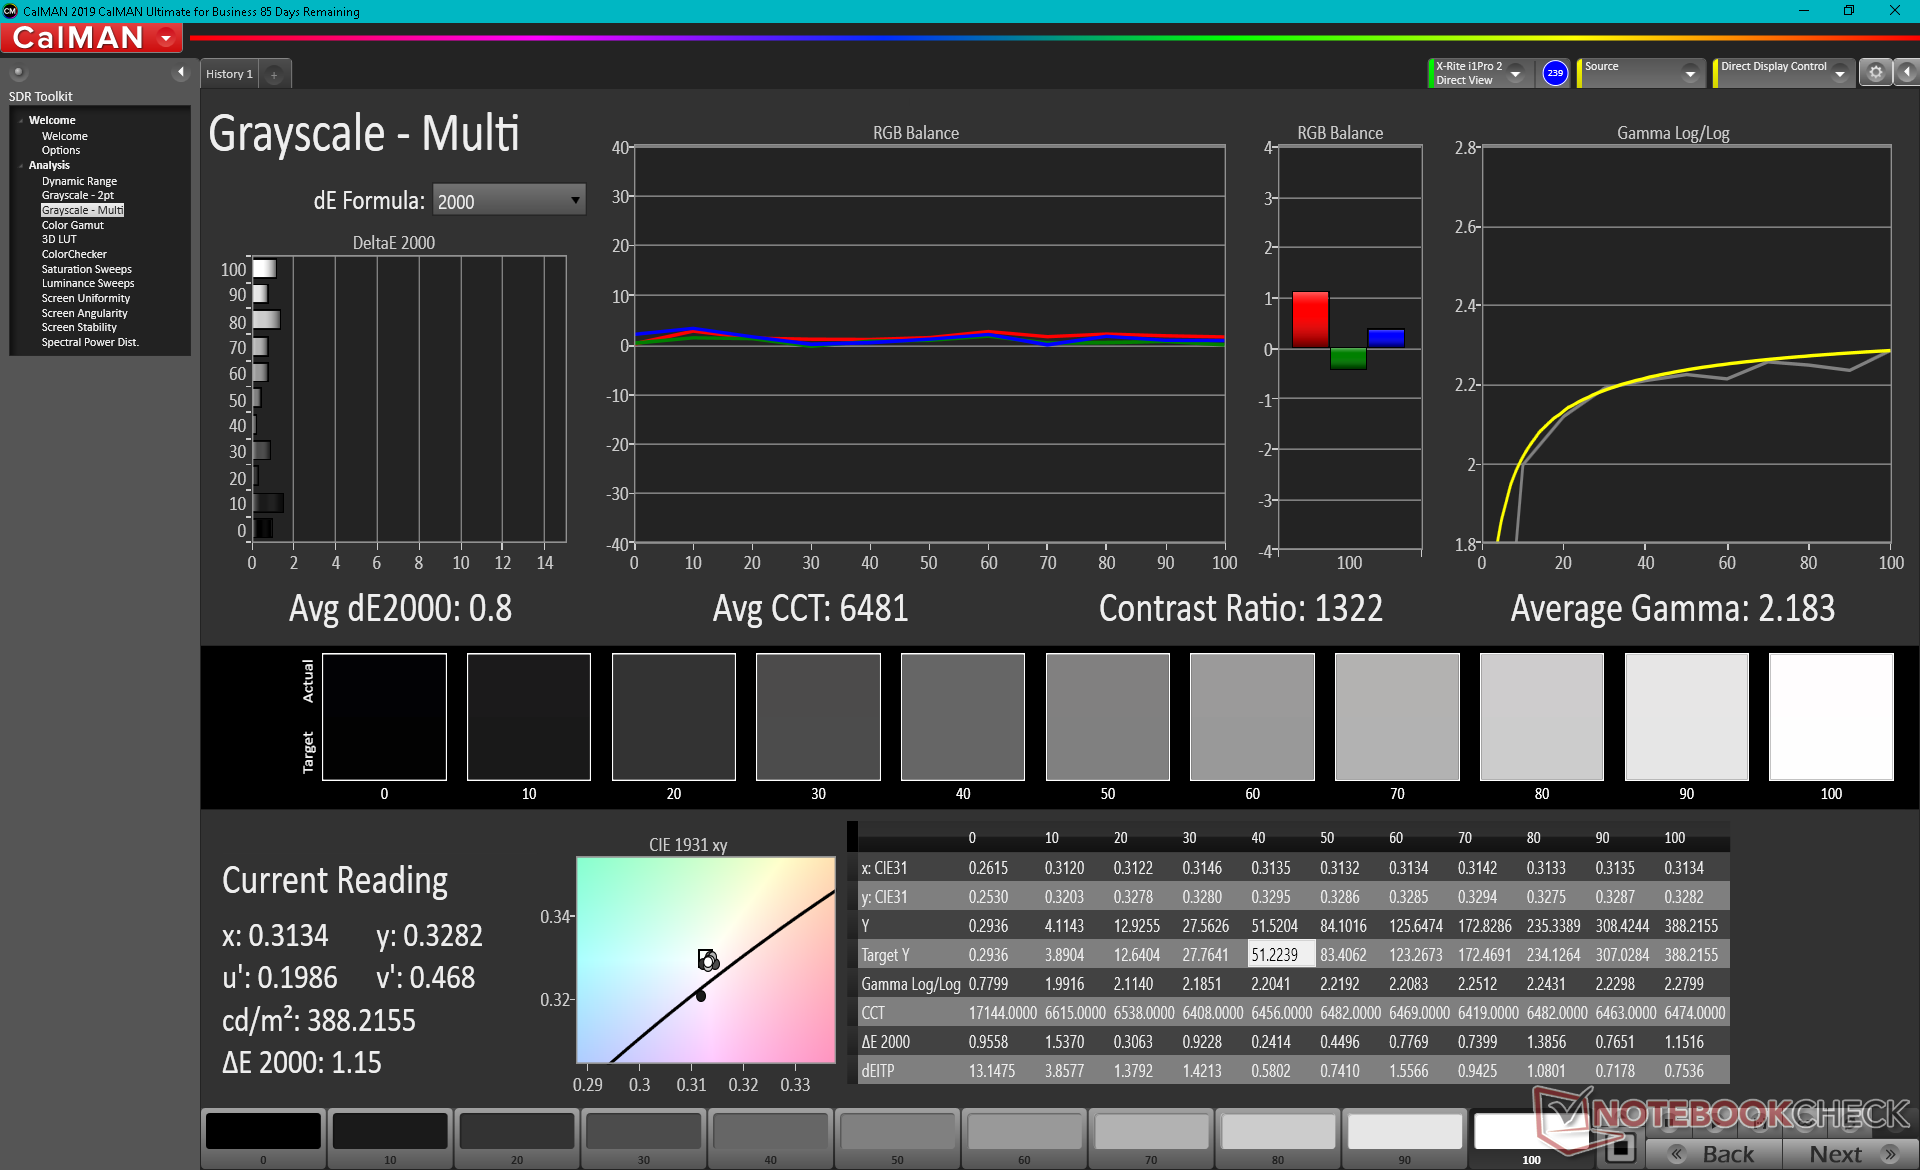
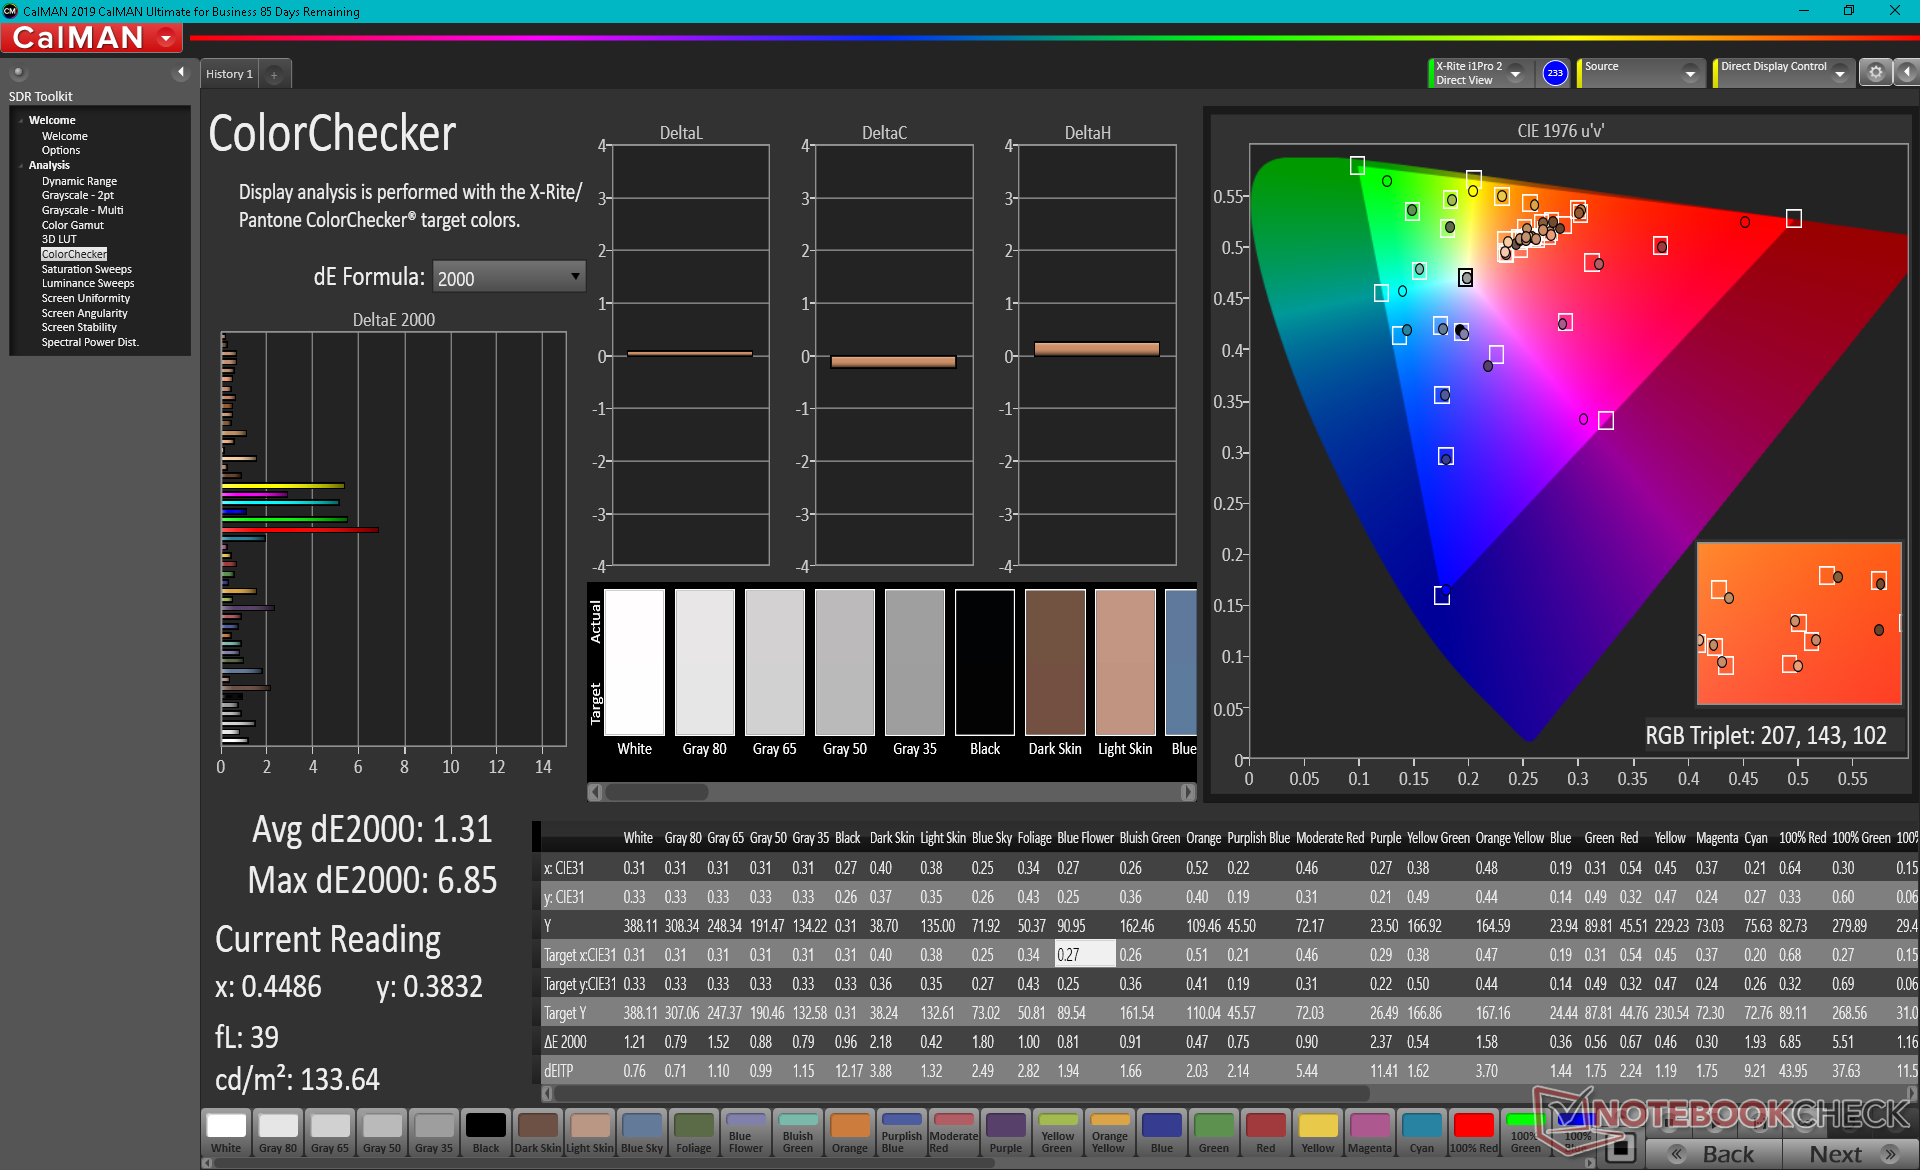
calibrated: 1.31
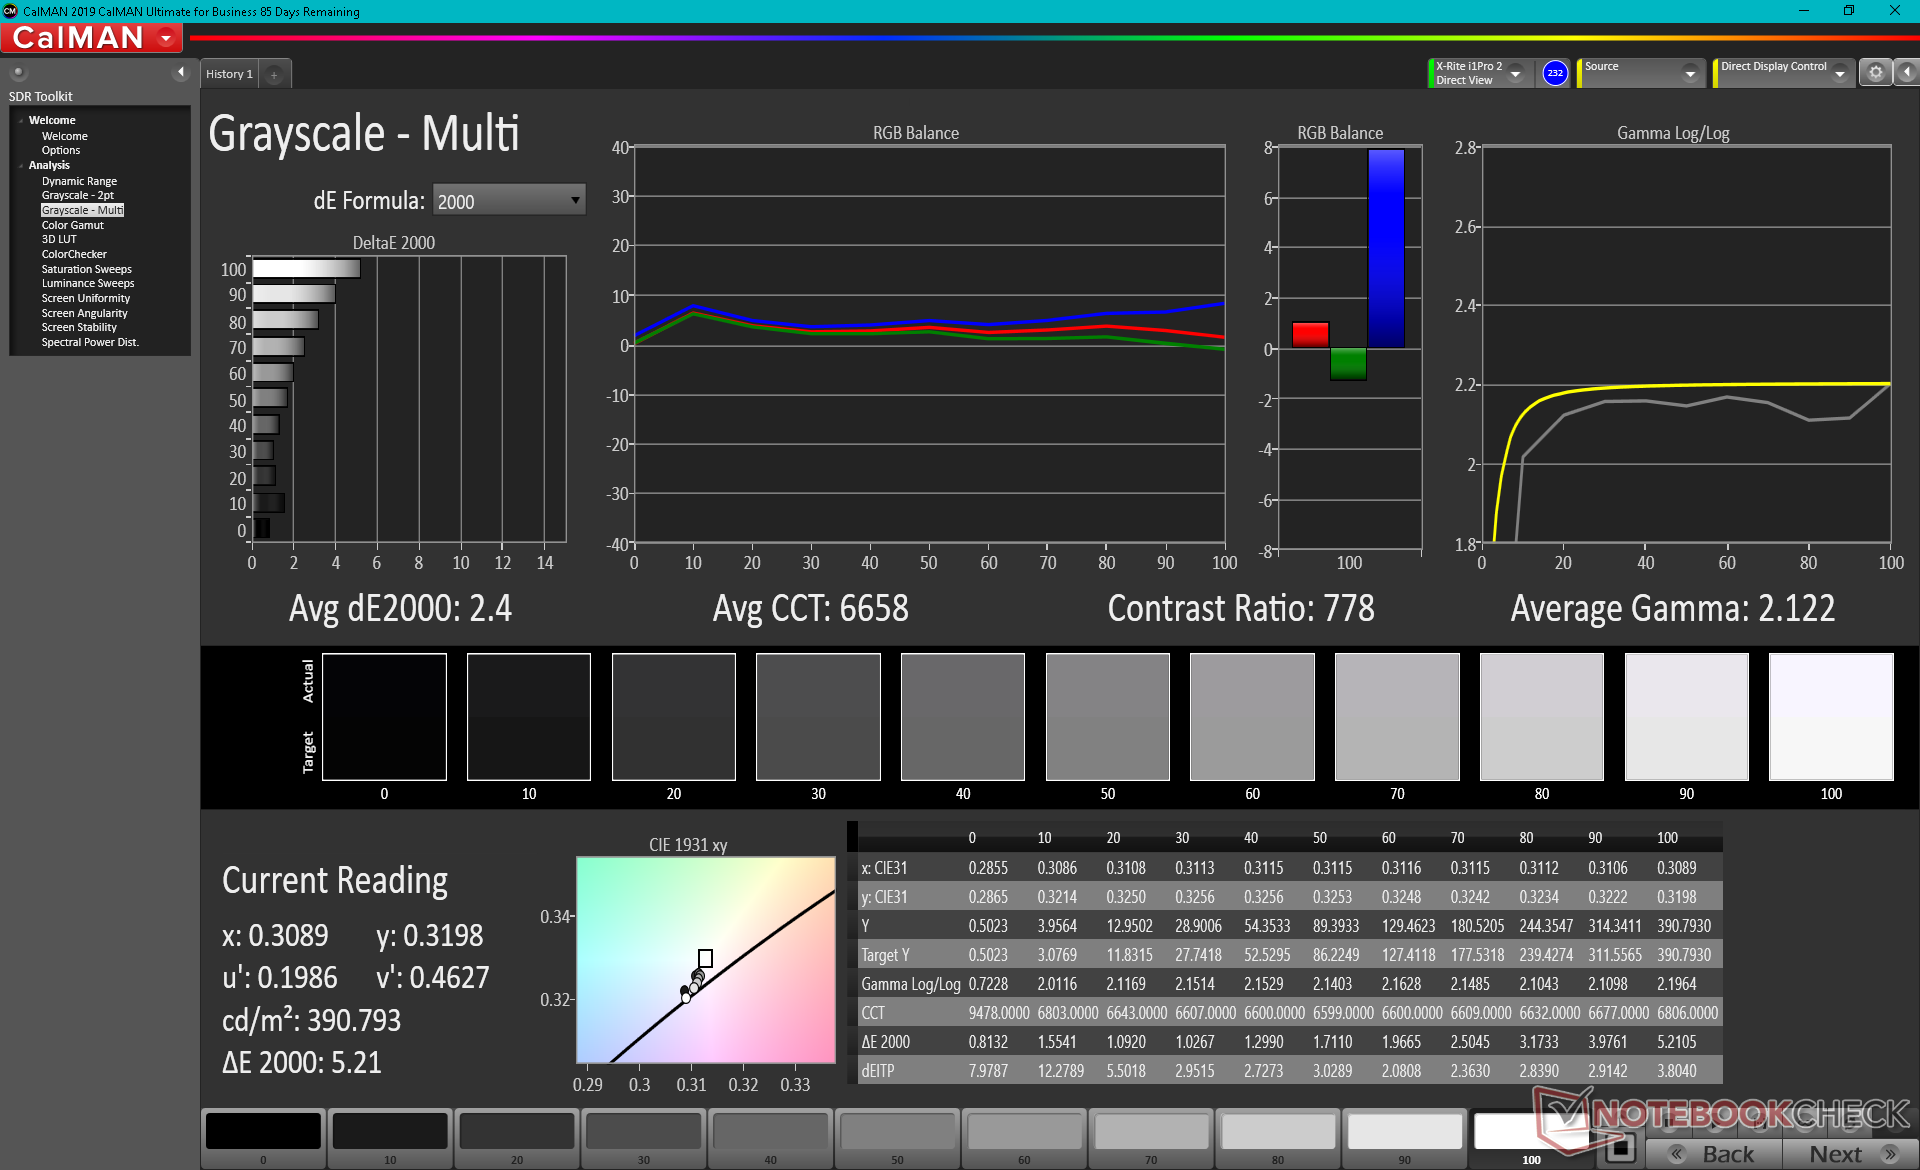
ΔE Greyscale Calman: 2.4 | ∀{0.09-98 Ø4.96}
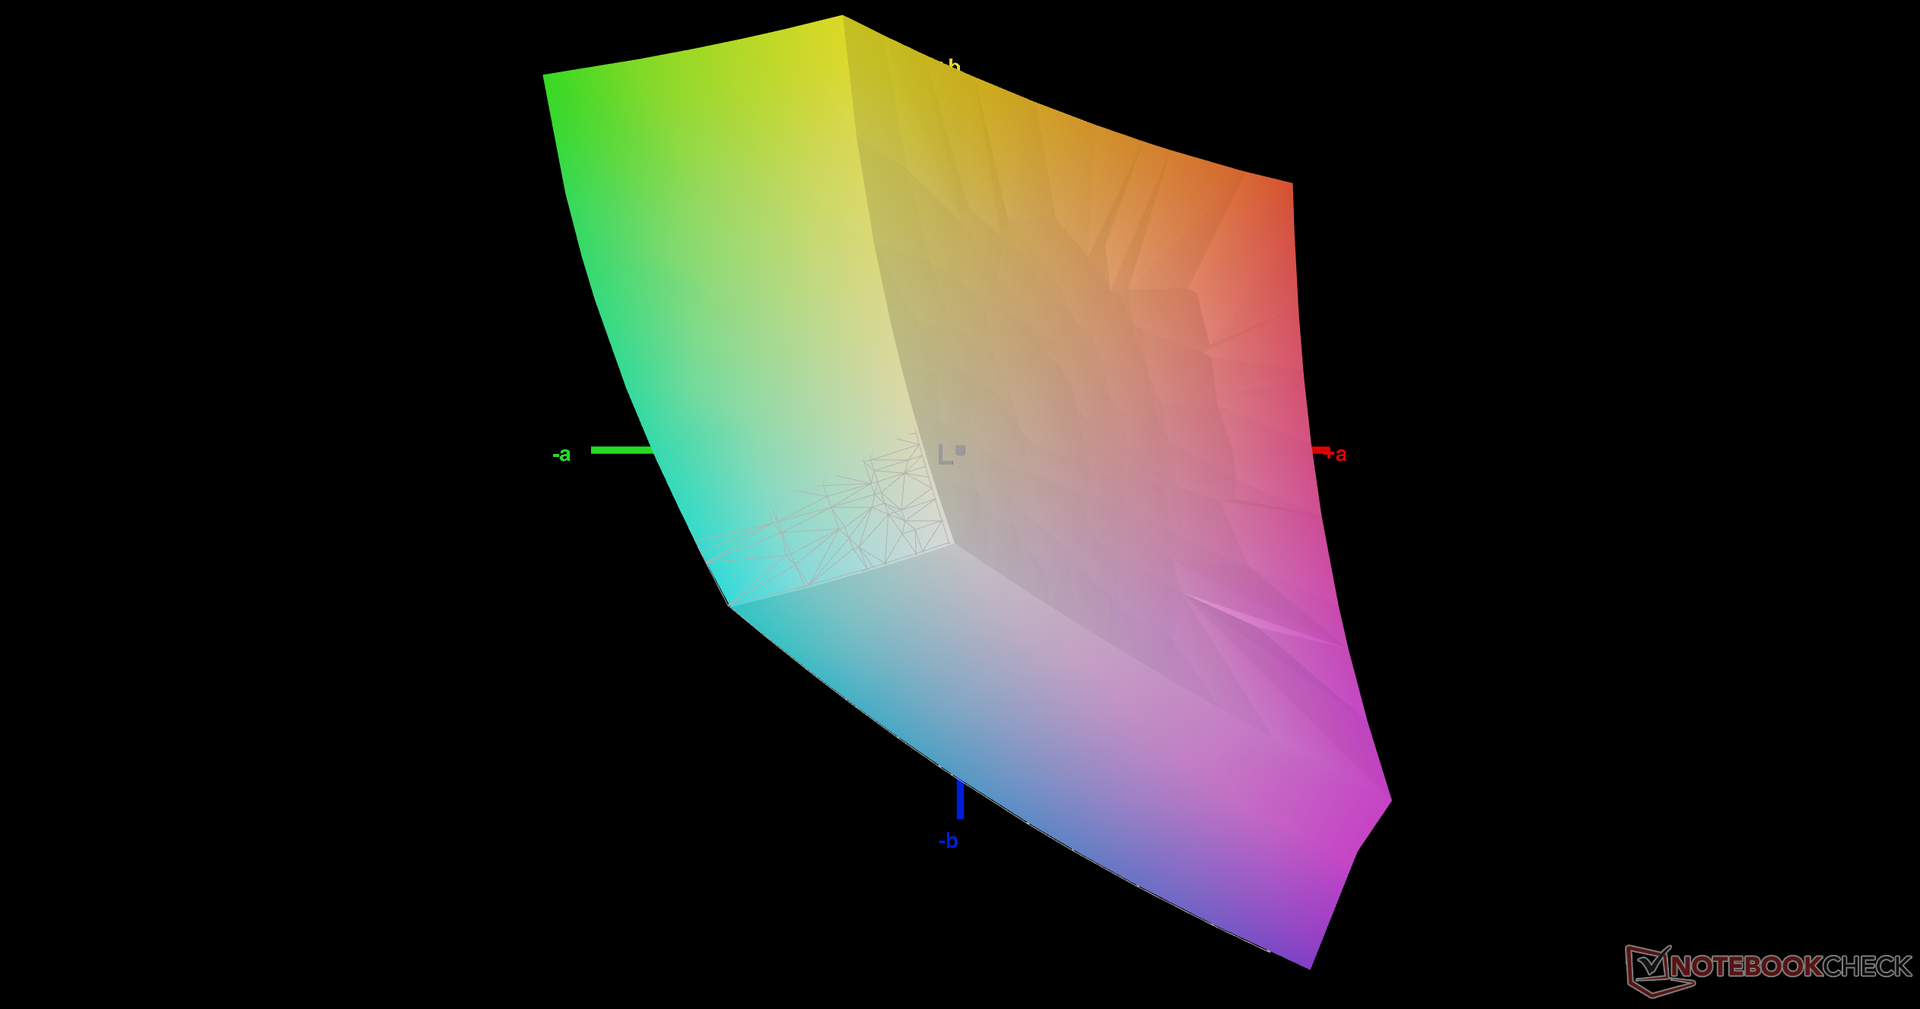
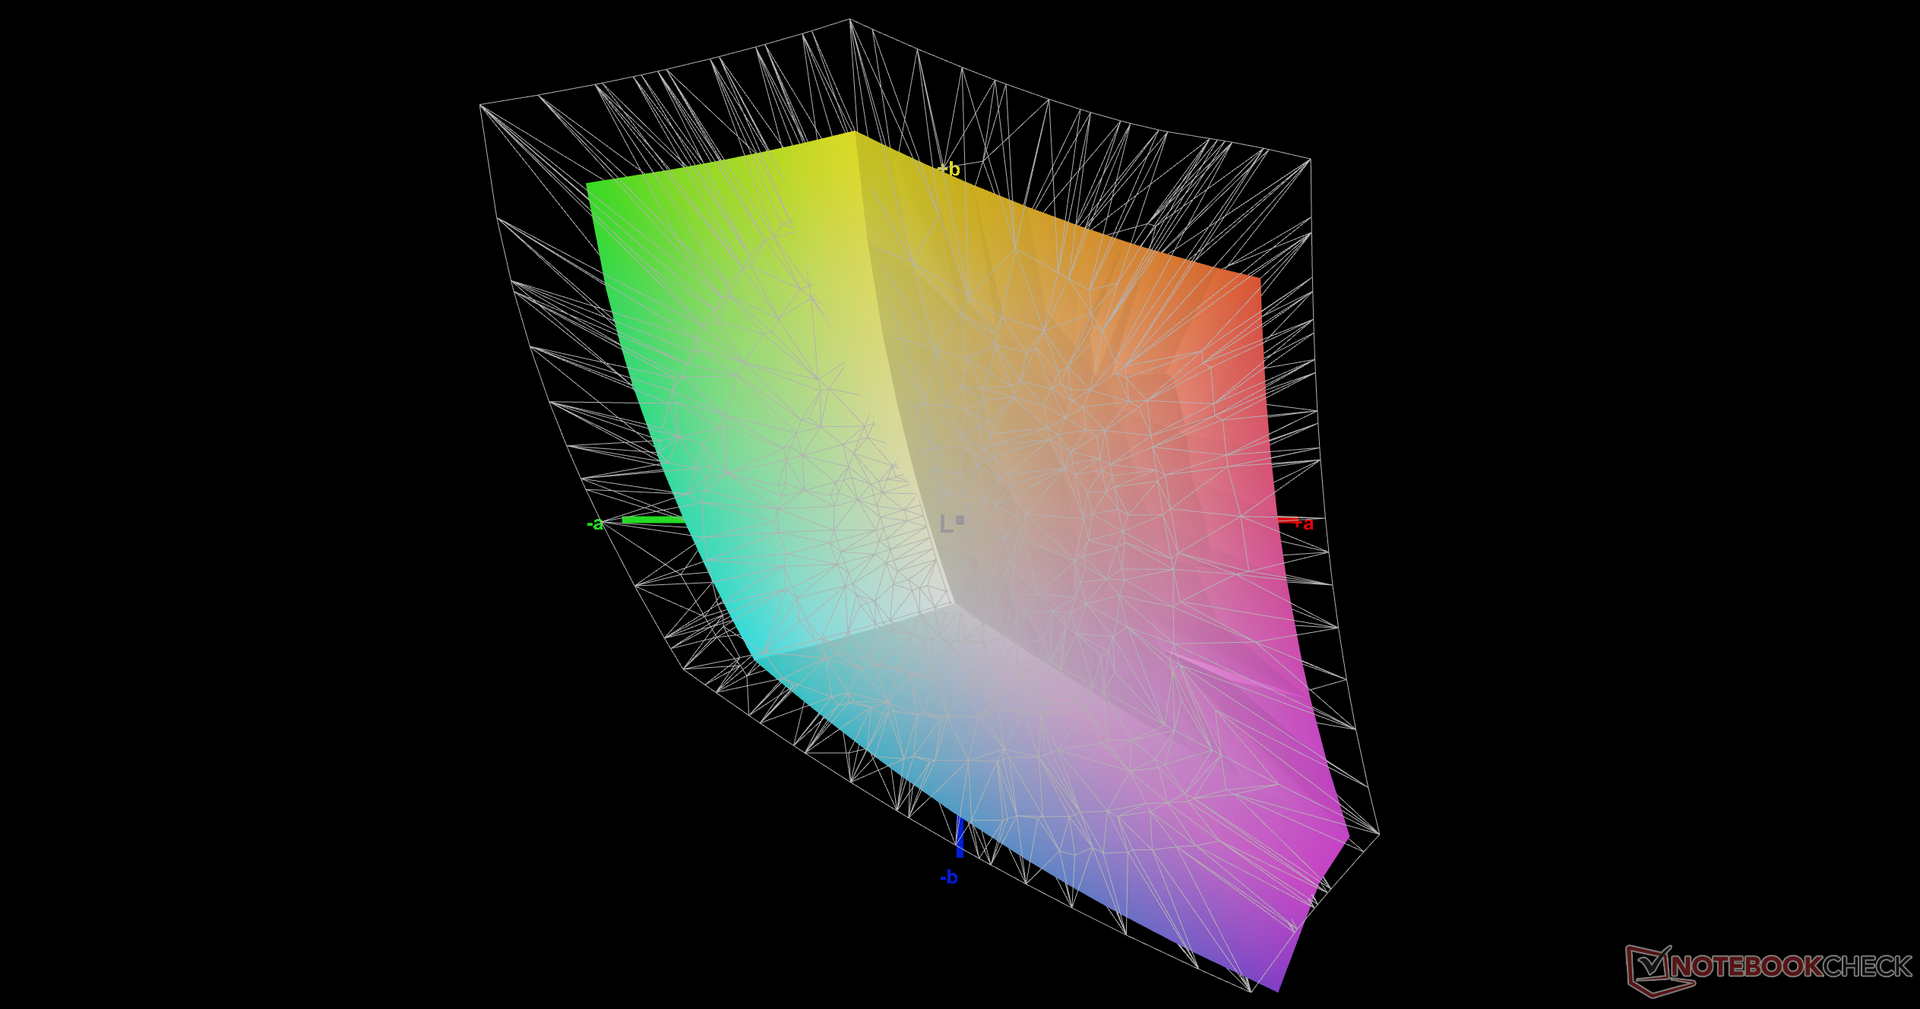
71.7% AdobeRGB 1998 (Argyll 3D)
99.4% sRGB (Argyll 3D)
70.7% Display P3 (Argyll 3D)
Gamma: 2.12
CCT: 6658 K
| Maingear Vector Pro MG-VCP17 BOE NE173QHM-NY2, IPS, 17.3", 2560x1440 | Asus ROG Zephyrus S17 GX703HSD BOE099D (BOE CQ NE173QHM-NY3), IPS, 17.3", 2560x1440 | Schenker XMG Core 17 (Early 2021) BOE CQ NE173QHM-NY2, IPS, 17.3", 2560x1440 | Schenker XMG Neo 17 (Early 2021, RTX 3070, 5800H) BOE NE173QHM-NY2 (BOE0977), IPS, 17.3", 2560x1440 | Schenker Compact 17 AU Optronics B173ZAN03.0, IPS, 17.3", 3840x2160 | MSI GS75 10SF-609US Sharp LQ173M1JW05, IPS, 17.3", 1920x1080 | |
|---|---|---|---|---|---|---|
| Display | 17% | -3% | 0% | 19% | 4% | |
| Display P3 Coverage (%) | 70.7 | 94.2 33% | 68.1 -4% | 70.5 0% | 84.4 19% | 75.6 7% |
| sRGB Coverage (%) | 99.4 | 98.7 -1% | 98.5 -1% | 99.5 0% | 99.9 1% | 99.8 0% |
| AdobeRGB 1998 Coverage (%) | 71.7 | 84.4 18% | 69.3 -3% | 71.8 0% | 98 37% | 75.1 5% |
| Response Times | 51% | 5% | 5% | -197% | 57% | |
| Response Time Grey 50% / Grey 80% * (ms) | 15.6 ? | 4.8 69% | 16.8 ? -8% | 16.8 ? -8% | 51 ? -227% | 5 ? 68% |
| Response Time Black / White * (ms) | 12 ? | 8 33% | 10 ? 17% | 10 ? 17% | 32 ? -167% | 6.6 ? 45% |
| PWM Frequency (Hz) | ||||||
| Screen | -11% | -7% | 4% | -40% | 3% | |
| Brightness middle (cd/m²) | 389.7 | 322 -17% | 370 -5% | 410 5% | 437 12% | 299.4 -23% |
| Brightness (cd/m²) | 363 | 288 -21% | 333 -8% | 381 5% | 413 14% | 299 -18% |
| Brightness Distribution (%) | 84 | 72 -14% | 84 0% | 88 5% | 88 5% | 84 0% |
| Black Level * (cd/m²) | 0.47 | 0.3 36% | 0.38 19% | 0.37 21% | 0.6 -28% | 0.31 34% |
| Contrast (:1) | 829 | 1073 29% | 974 17% | 1108 34% | 728 -12% | 966 17% |
| Colorchecker dE 2000 * | 1.93 | 3.05 -58% | 2.41 -25% | 2.55 -32% | 4.28 -122% | 1.82 6% |
| Colorchecker dE 2000 max. * | 6.84 | 5.23 24% | 7.32 -7% | 4.33 37% | 7.65 -12% | 3.91 43% |
| Colorchecker dE 2000 calibrated * | 1.31 | 1.92 -47% | 1.19 9% | 1.28 2% | 3.41 -160% | 1.59 -21% |
| Greyscale dE 2000 * | 2.4 | 3.11 -30% | 3.9 -63% | 3.4 -42% | 3.8 -58% | 2.7 -13% |
| Gamma | 2.12 104% | 2.13 103% | 2.287 96% | 2.275 97% | 2.49 88% | 2.18 101% |
| CCT | 6658 98% | 6553 99% | 7302 89% | 6637 98% | 7363 88% | 6837 95% |
| Color Space (Percent of AdobeRGB 1998) (%) | 84 | 69 | 72 | 87 | 67.1 | |
| Color Space (Percent of sRGB) (%) | 99 | 93 | 95 | 100 | 99.8 | |
| Media total (Programa/Opciones) | 19% /
4% | -2% /
-4% | 3% /
3% | -73% /
-50% | 21% /
11% |
* ... más pequeño es mejor
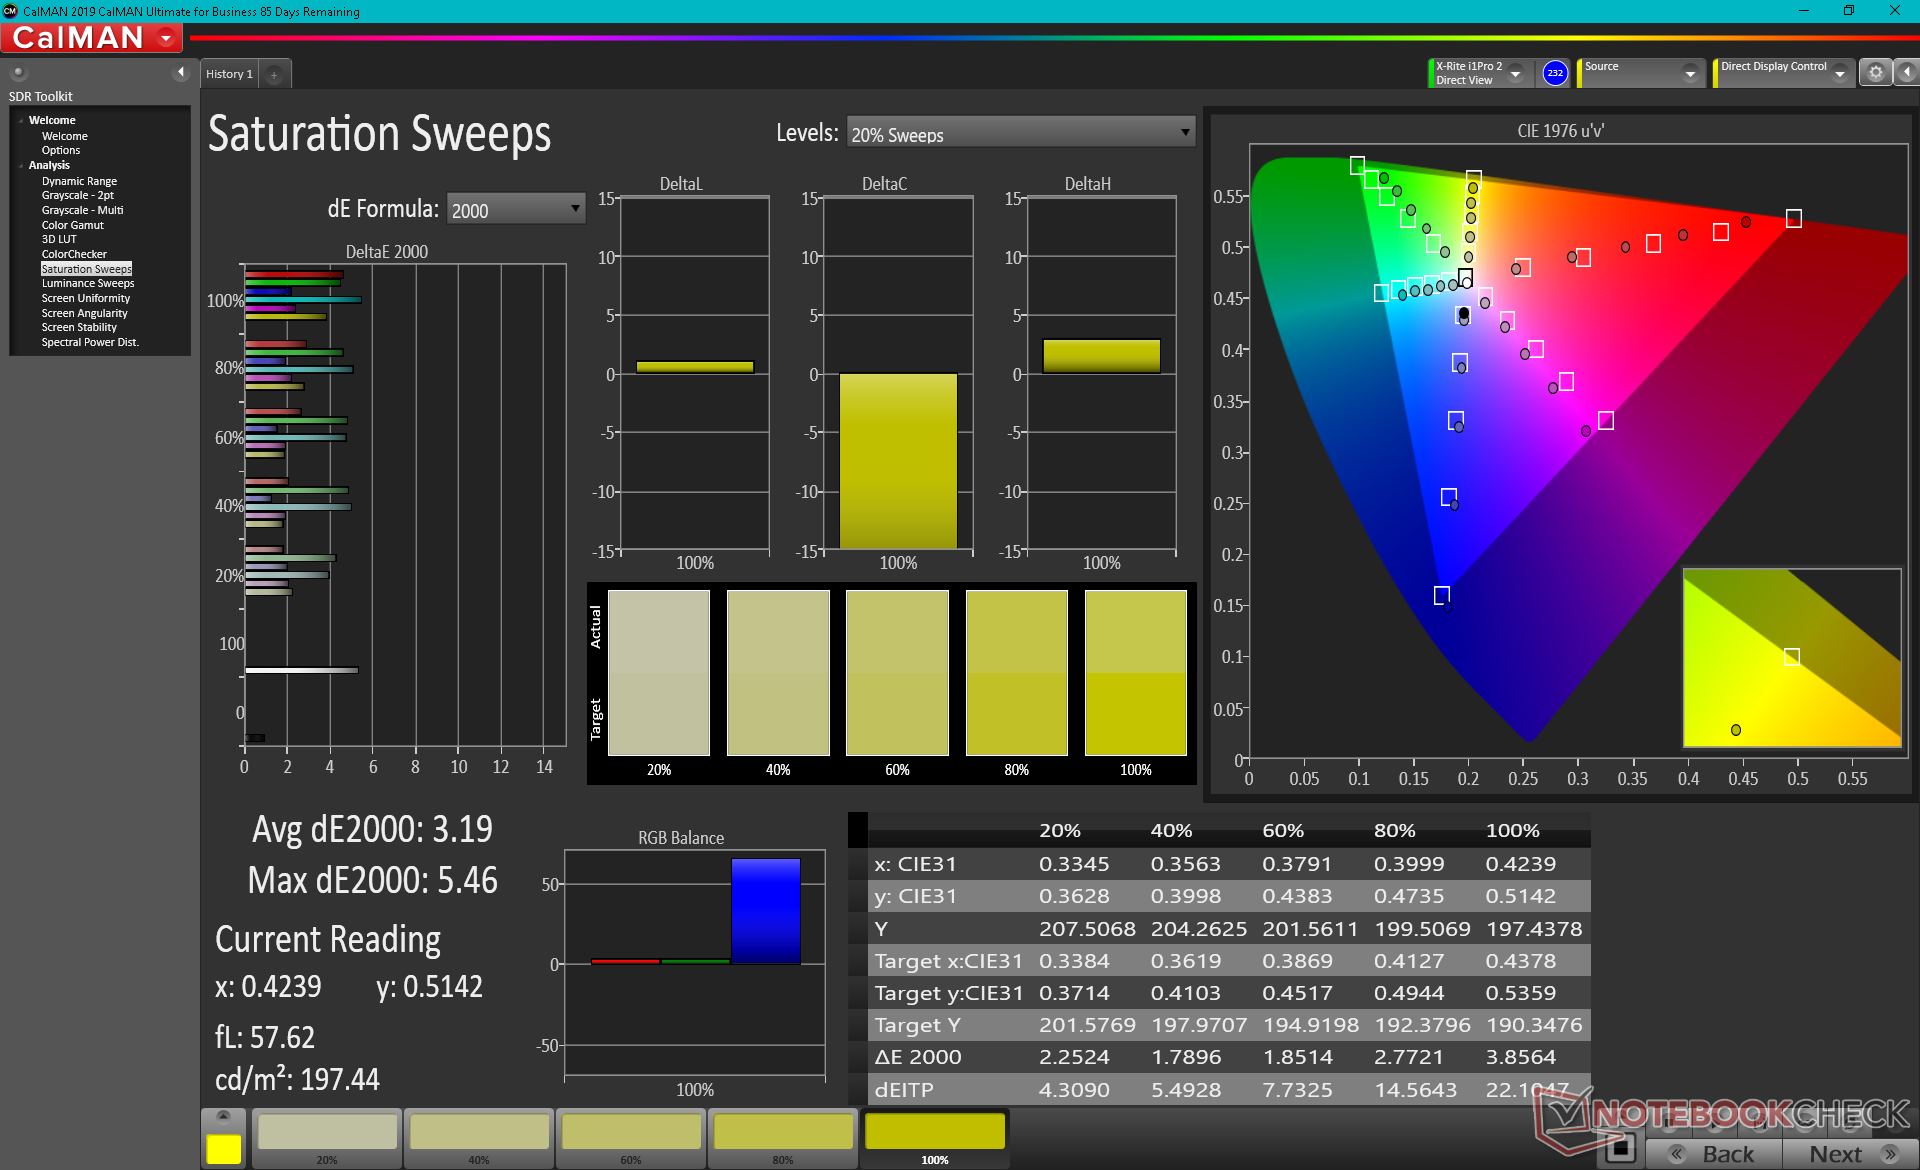
El espacio de color cubre completamente el sRGB y aproximadamente el 72% del AdobeRGB. Los paneles IPS 4K de mayor resolución tienden a ofrecer colores más profundos, aunque a costa de tasas de refresco y tiempos de respuesta más lentos.
Los colores y la escala de grises son bastante precisos al sacarlos de la caja, lo que sugiere que no es necesario que el usuario final los modifique. No obstante, nuestra propia calibración con un colorímetro X-Rite mejoraría ligeramente los valores medios de la escala de grises.

Tiempos de respuesta del display
| ↔ Tiempo de respuesta de Negro a Blanco | ||
|---|---|---|
| 12 ms ... subida ↗ y bajada ↘ combinada | ↗ 6.8 ms subida | 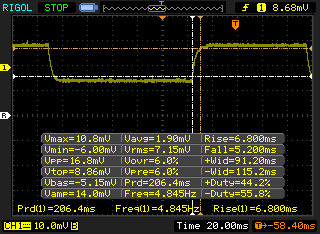 |
| ↘ 5.2 ms bajada | ||
| La pantalla mostró buenos tiempos de respuesta en nuestros tests pero podría ser demasiado lenta para los jugones competitivos. En comparación, todos los dispositivos de prueba van de ##min### (mínimo) a 240 (máximo) ms. » 32 % de todos los dispositivos son mejores. Esto quiere decir que el tiempo de respuesta medido es mejor que la media (19.8 ms) de todos los dispositivos testados. | ||
| ↔ Tiempo de respuesta 50% Gris a 80% Gris | ||
| 15.6 ms ... subida ↗ y bajada ↘ combinada | ↗ 8.4 ms subida | 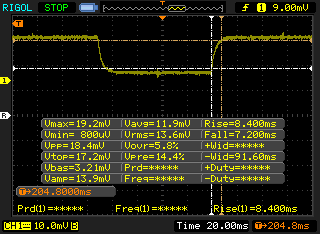 |
| ↘ 7.2 ms bajada | ||
| La pantalla mostró buenos tiempos de respuesta en nuestros tests pero podría ser demasiado lenta para los jugones competitivos. En comparación, todos los dispositivos de prueba van de ##min### (mínimo) a 636 (máximo) ms. » 30 % de todos los dispositivos son mejores. Esto quiere decir que el tiempo de respuesta medido es mejor que la media (30.9 ms) de todos los dispositivos testados. | ||
Parpadeo de Pantalla / PWM (Pulse-Width Modulation)
| Parpadeo de Pantalla / PWM no detectado | 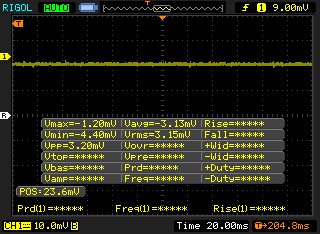 | ||
Comparación: 52 % de todos los dispositivos testados no usaron PWM para atenuar el display. Si se usó, medimos una media de 7741 (mínimo: 5 - máxmo: 343500) Hz. | |||
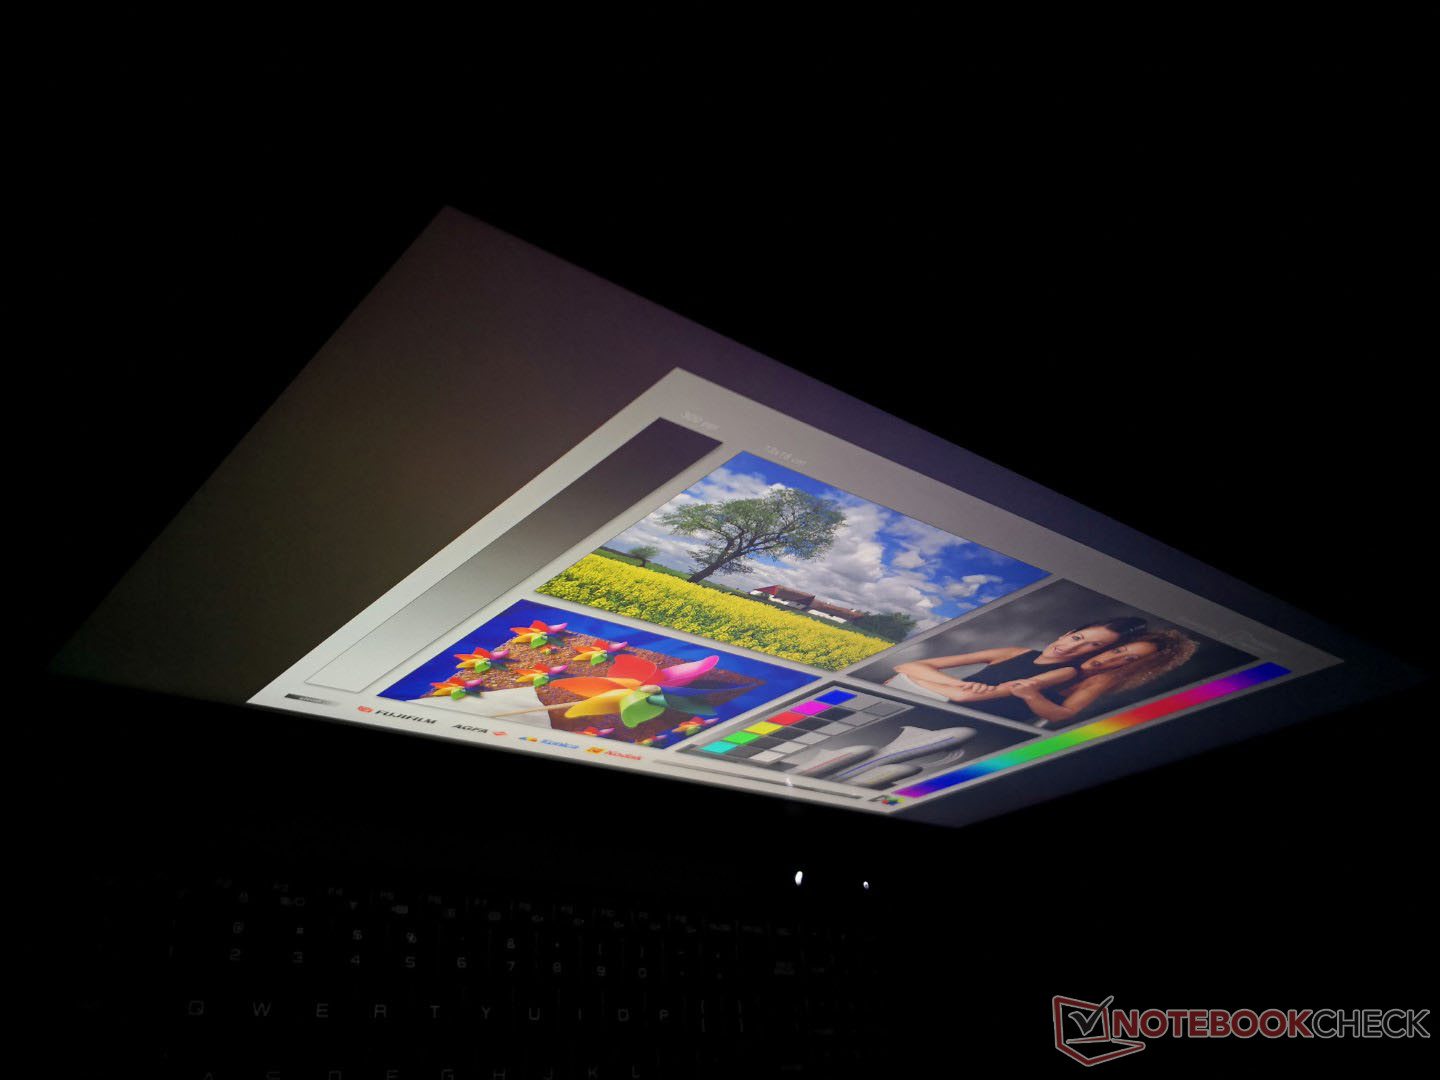
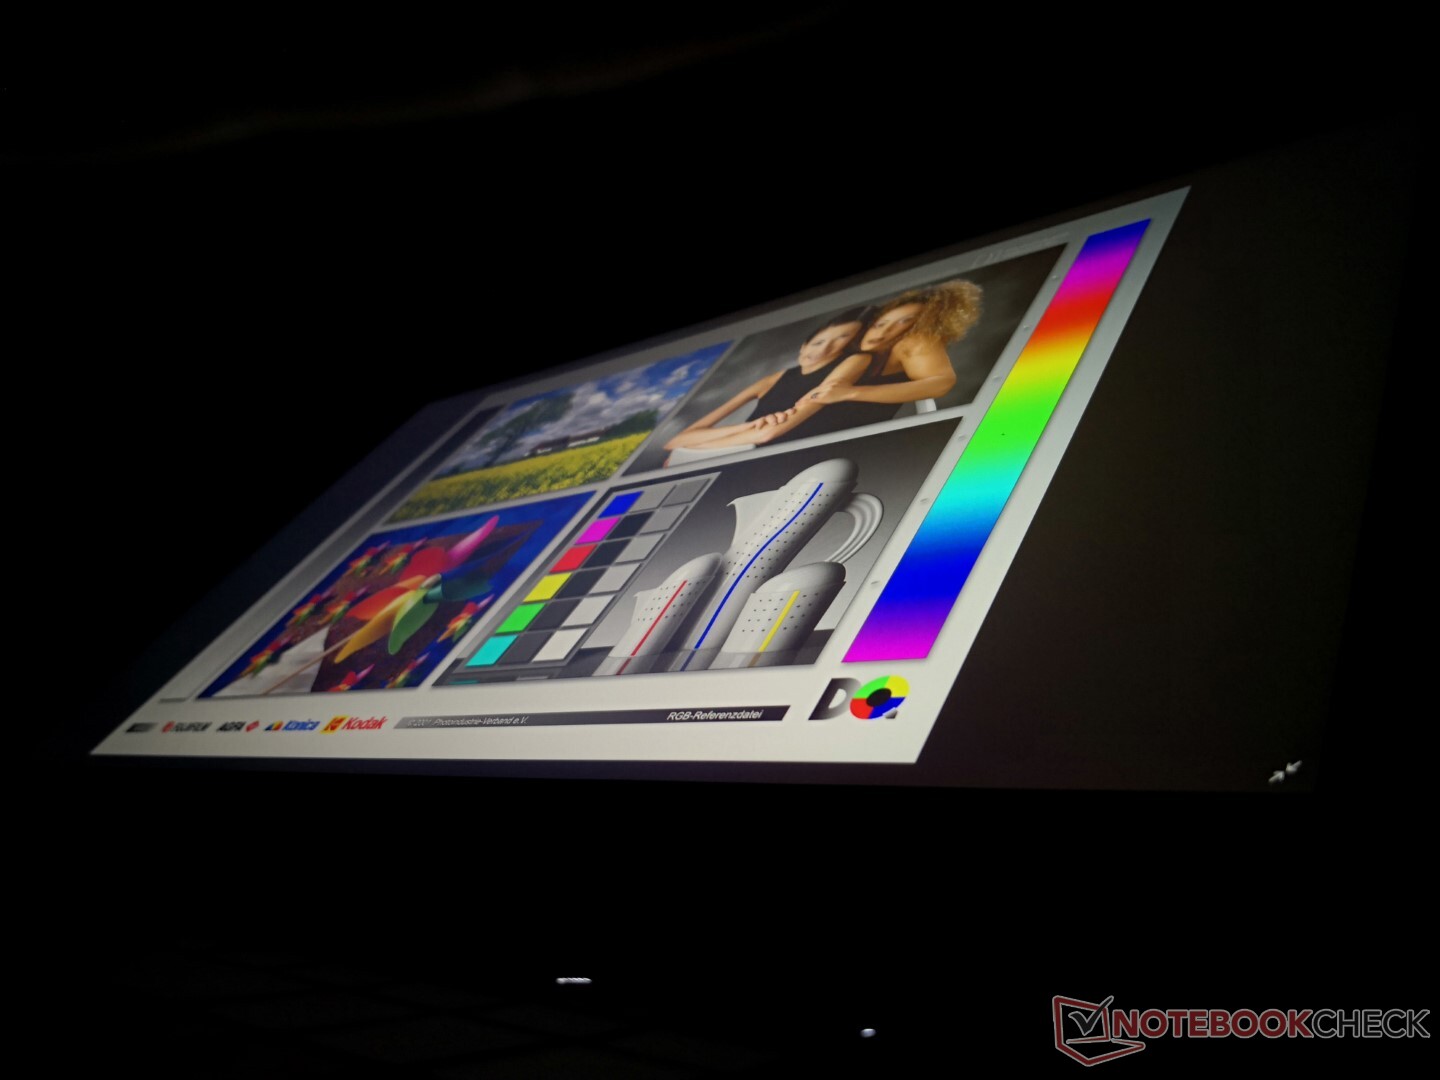
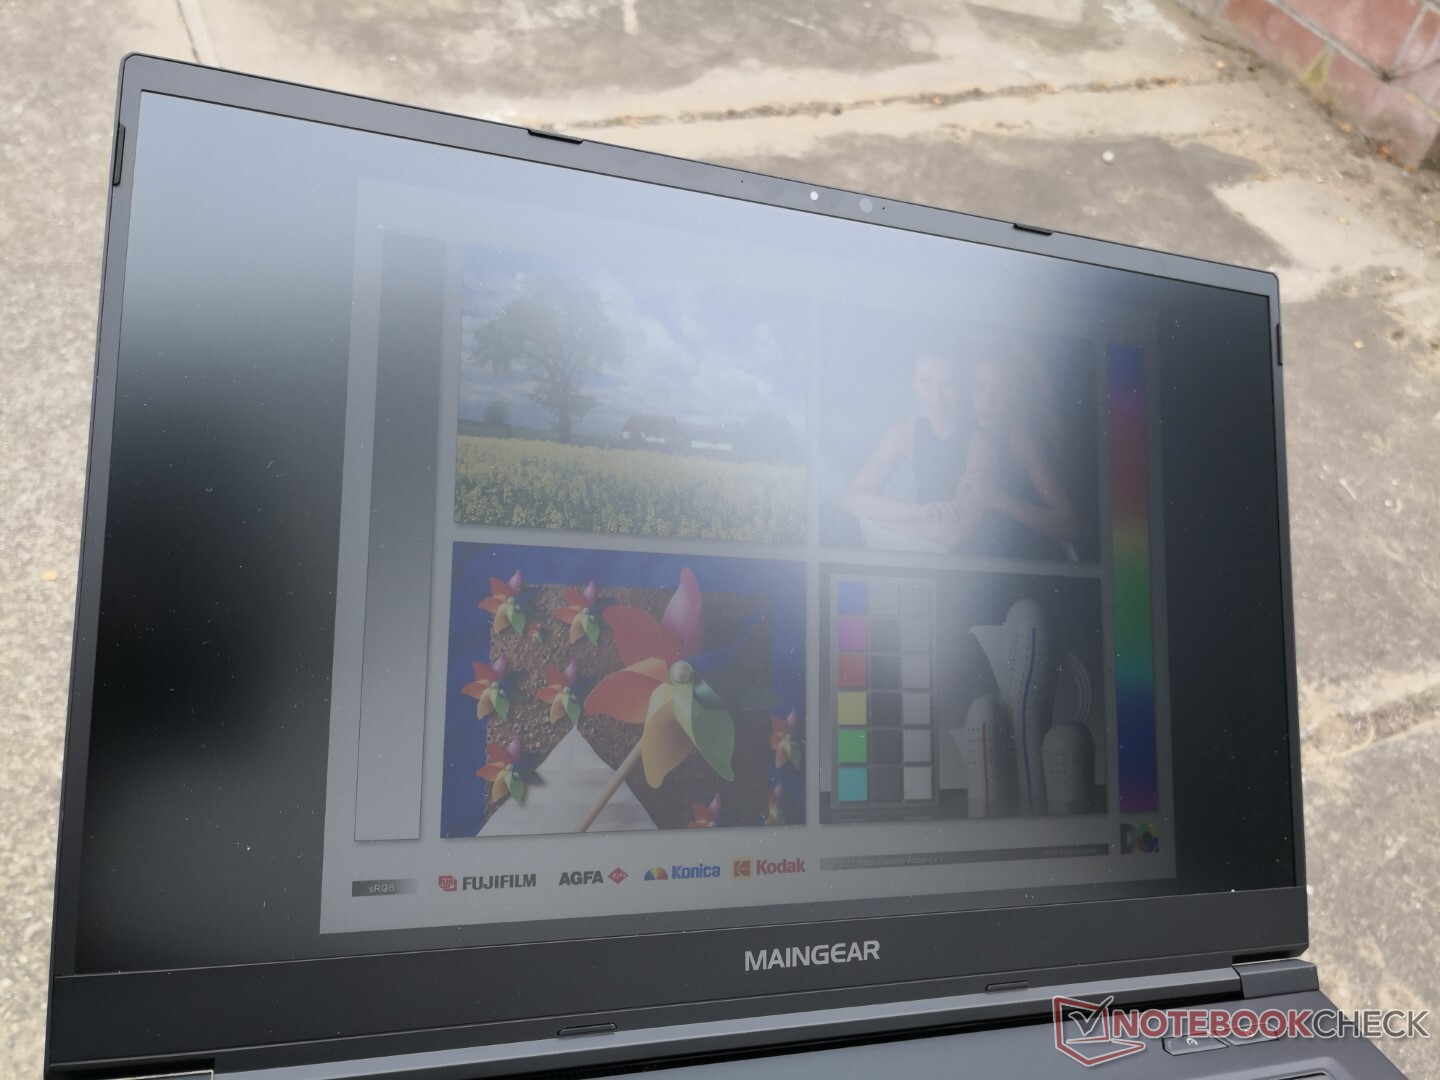
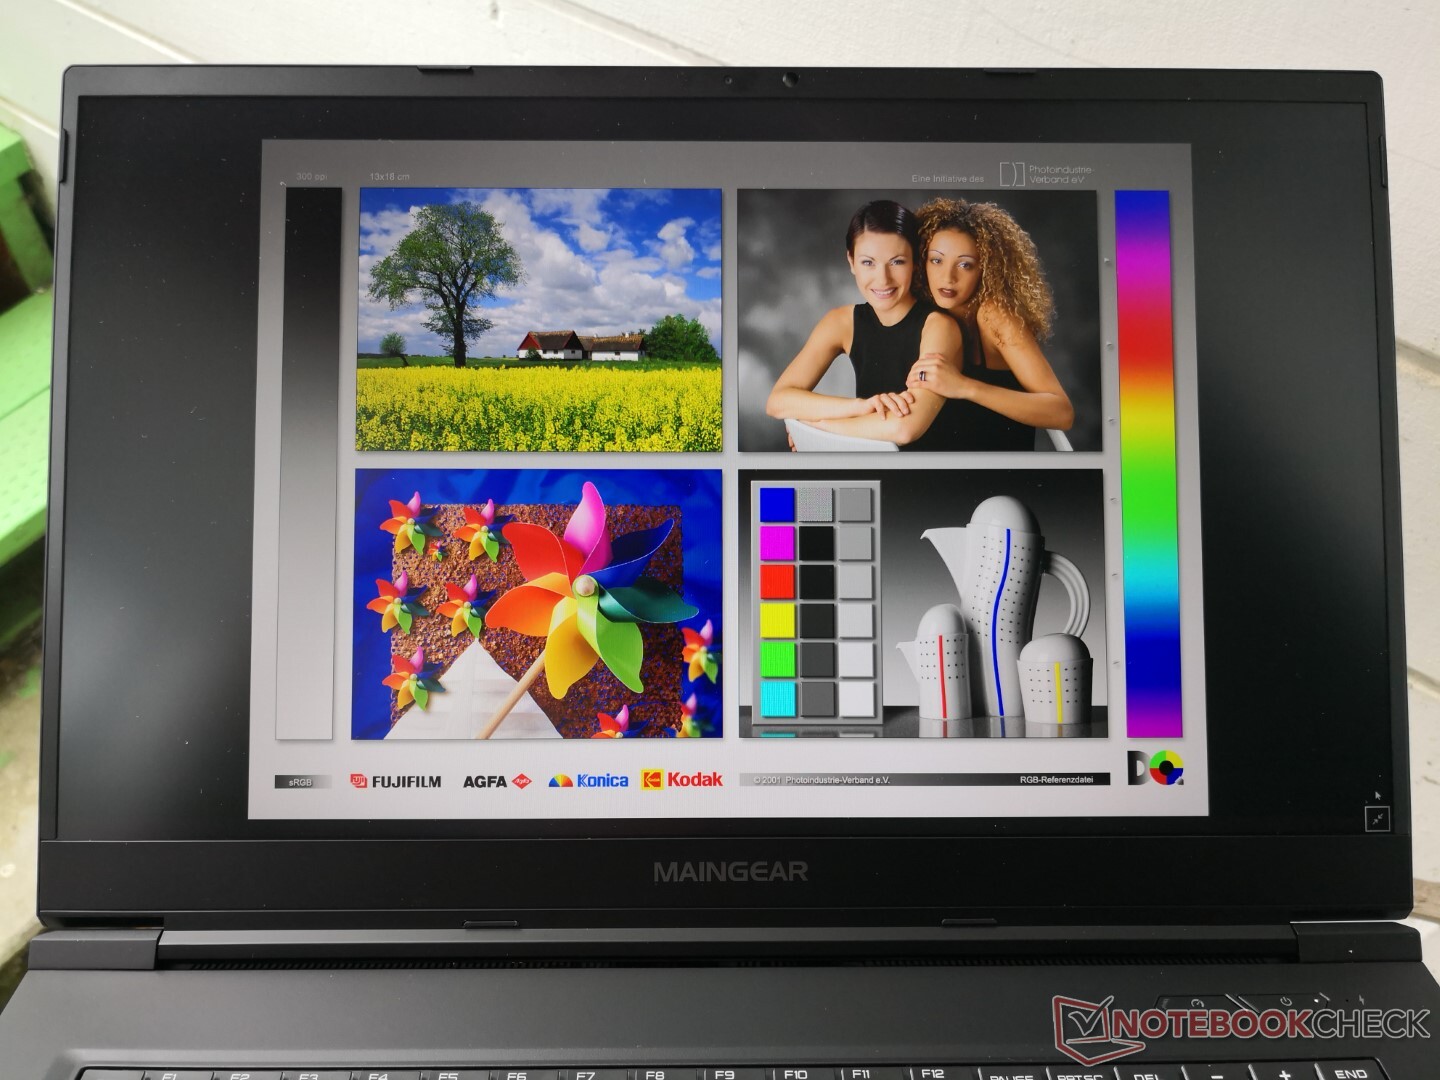
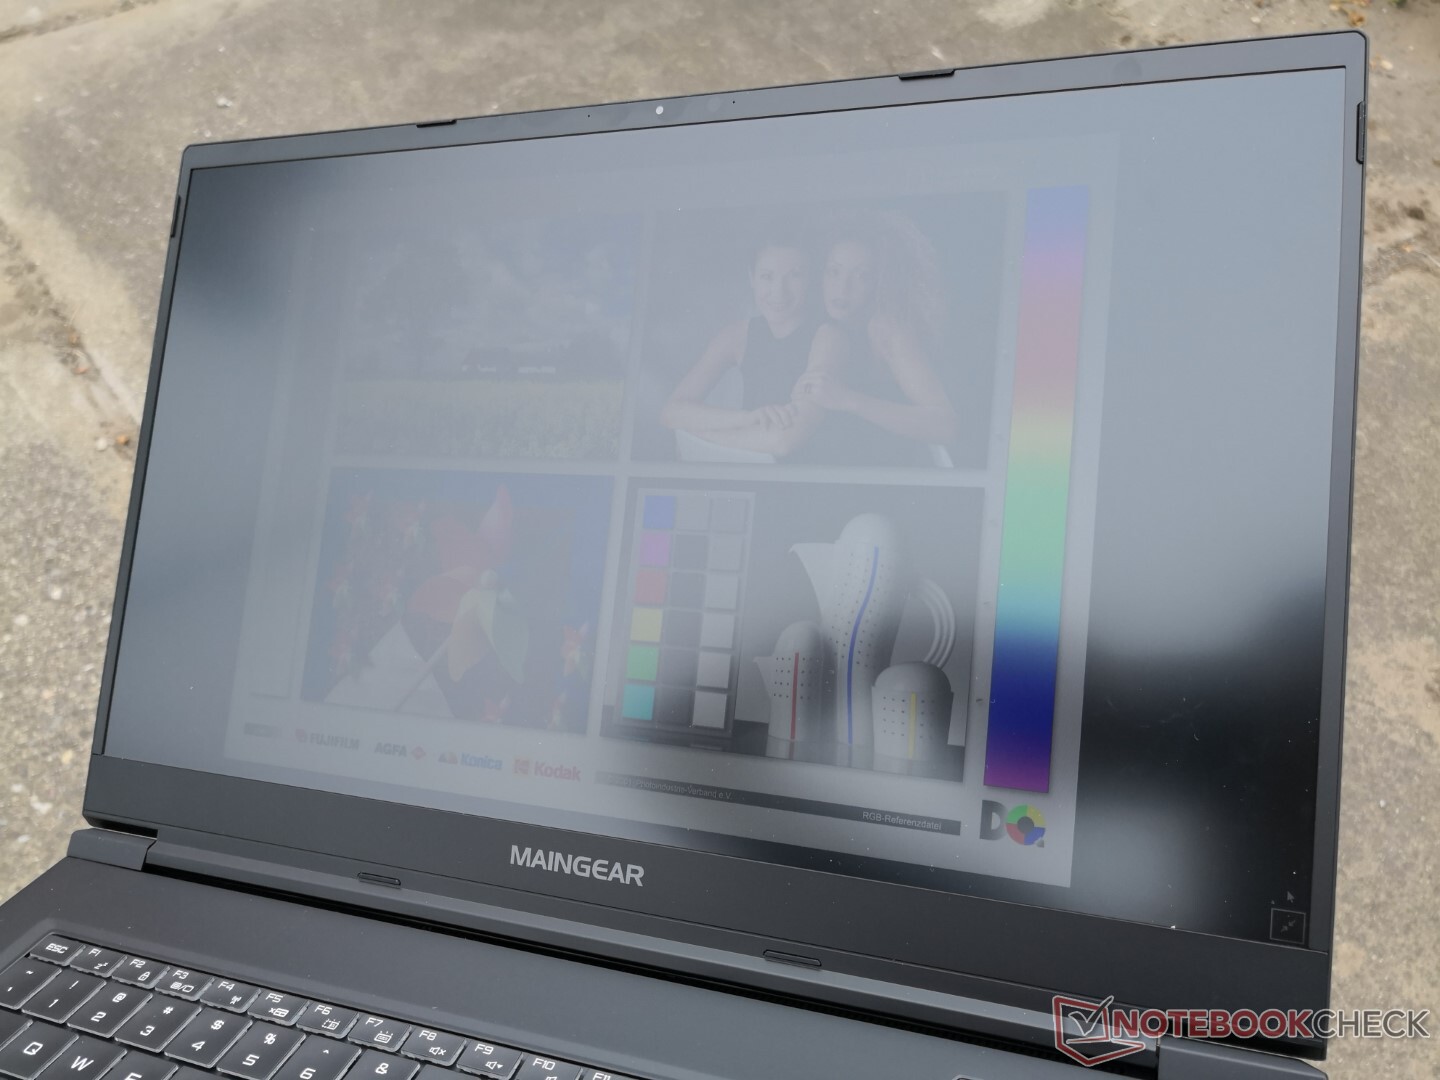
La visibilidad en exteriores es mejor que en la mayoría de los portátiles para juegos de 17,3 pulgadas, ya que el brillo máximo se acerca a los 400 nits en lugar de los habituales 300 nits. Sin embargo, hay que evitar la luz solar directa, o la pantalla se apagará.
Rendimiento
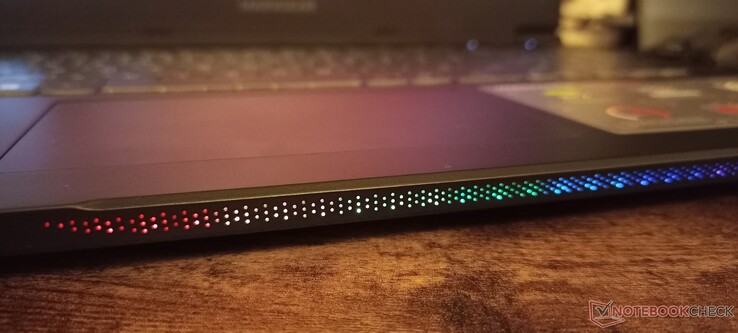
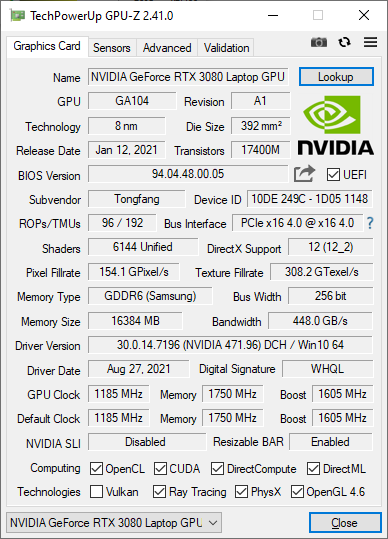
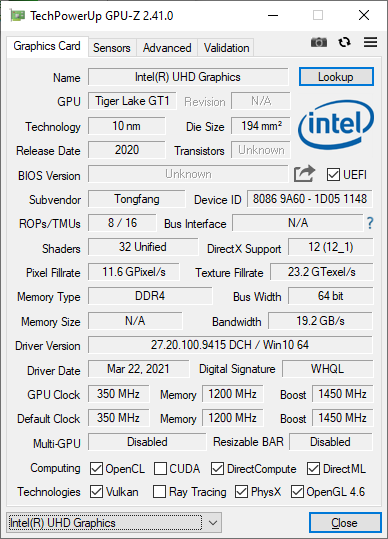
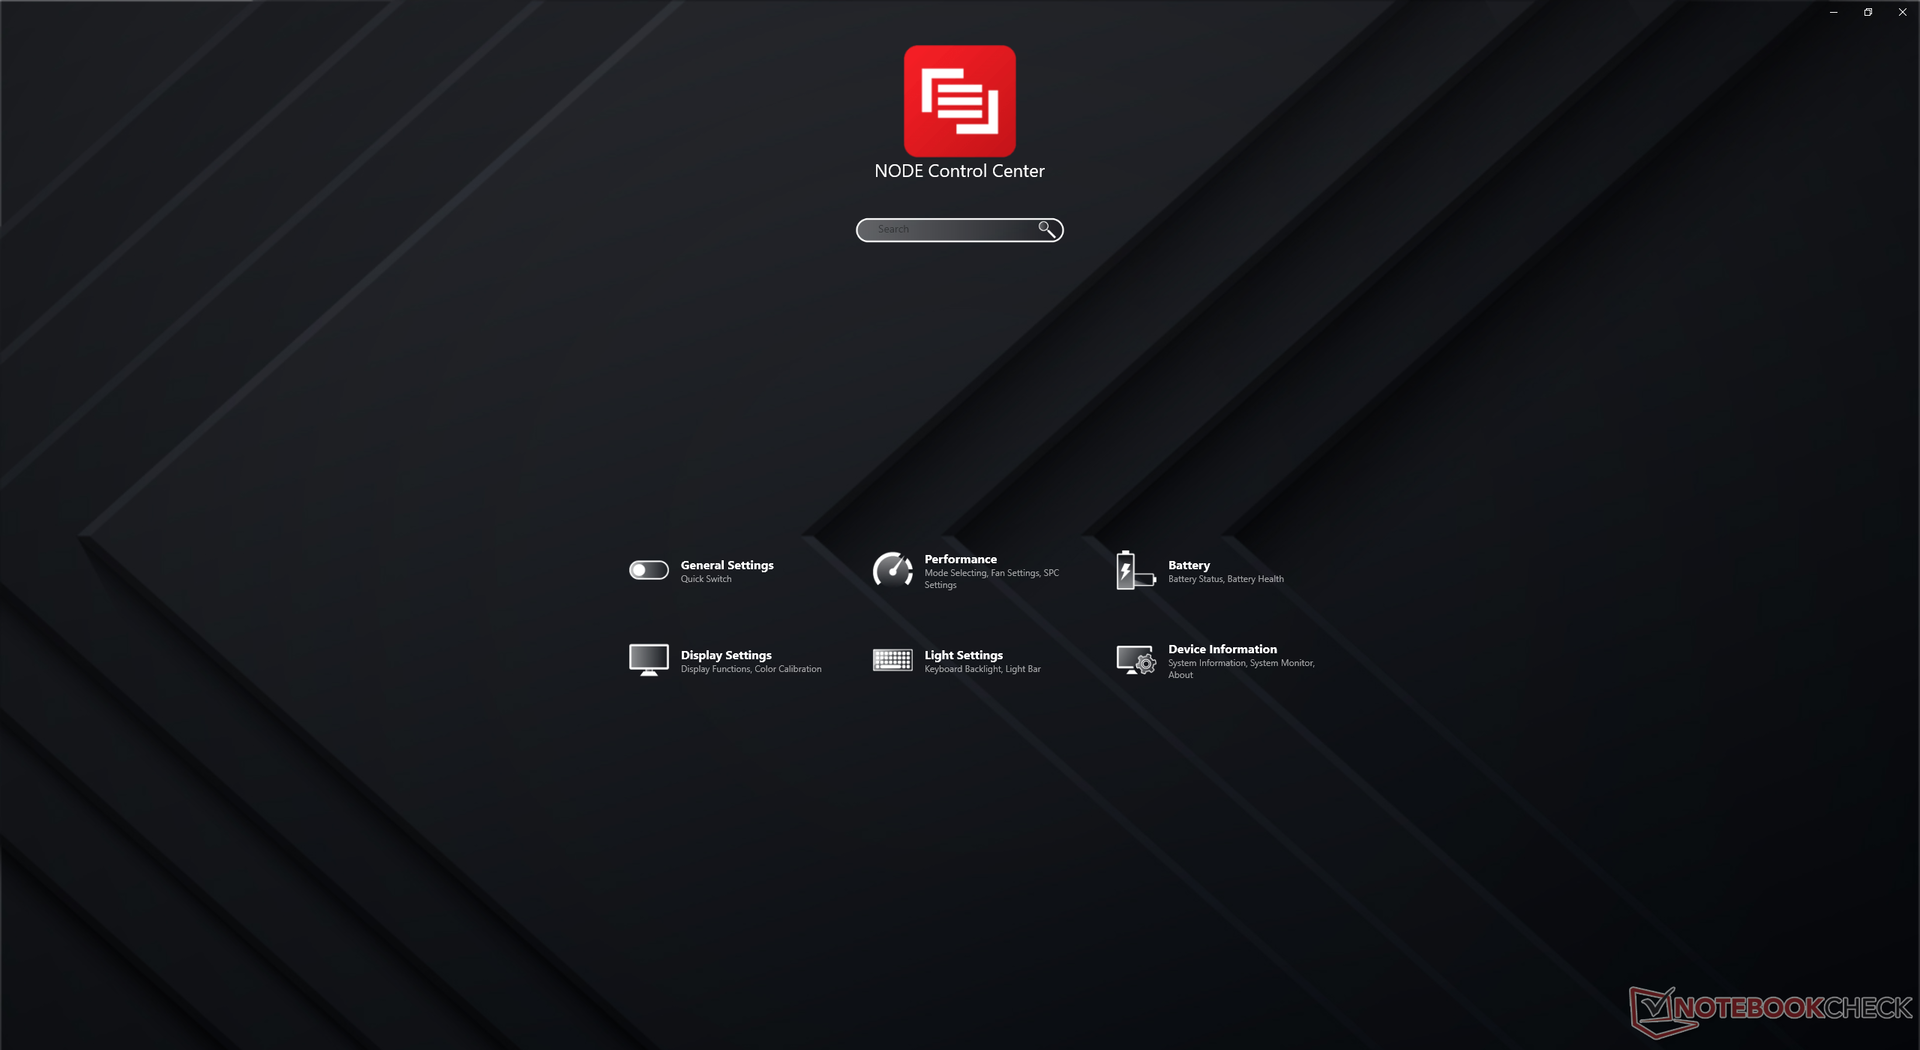
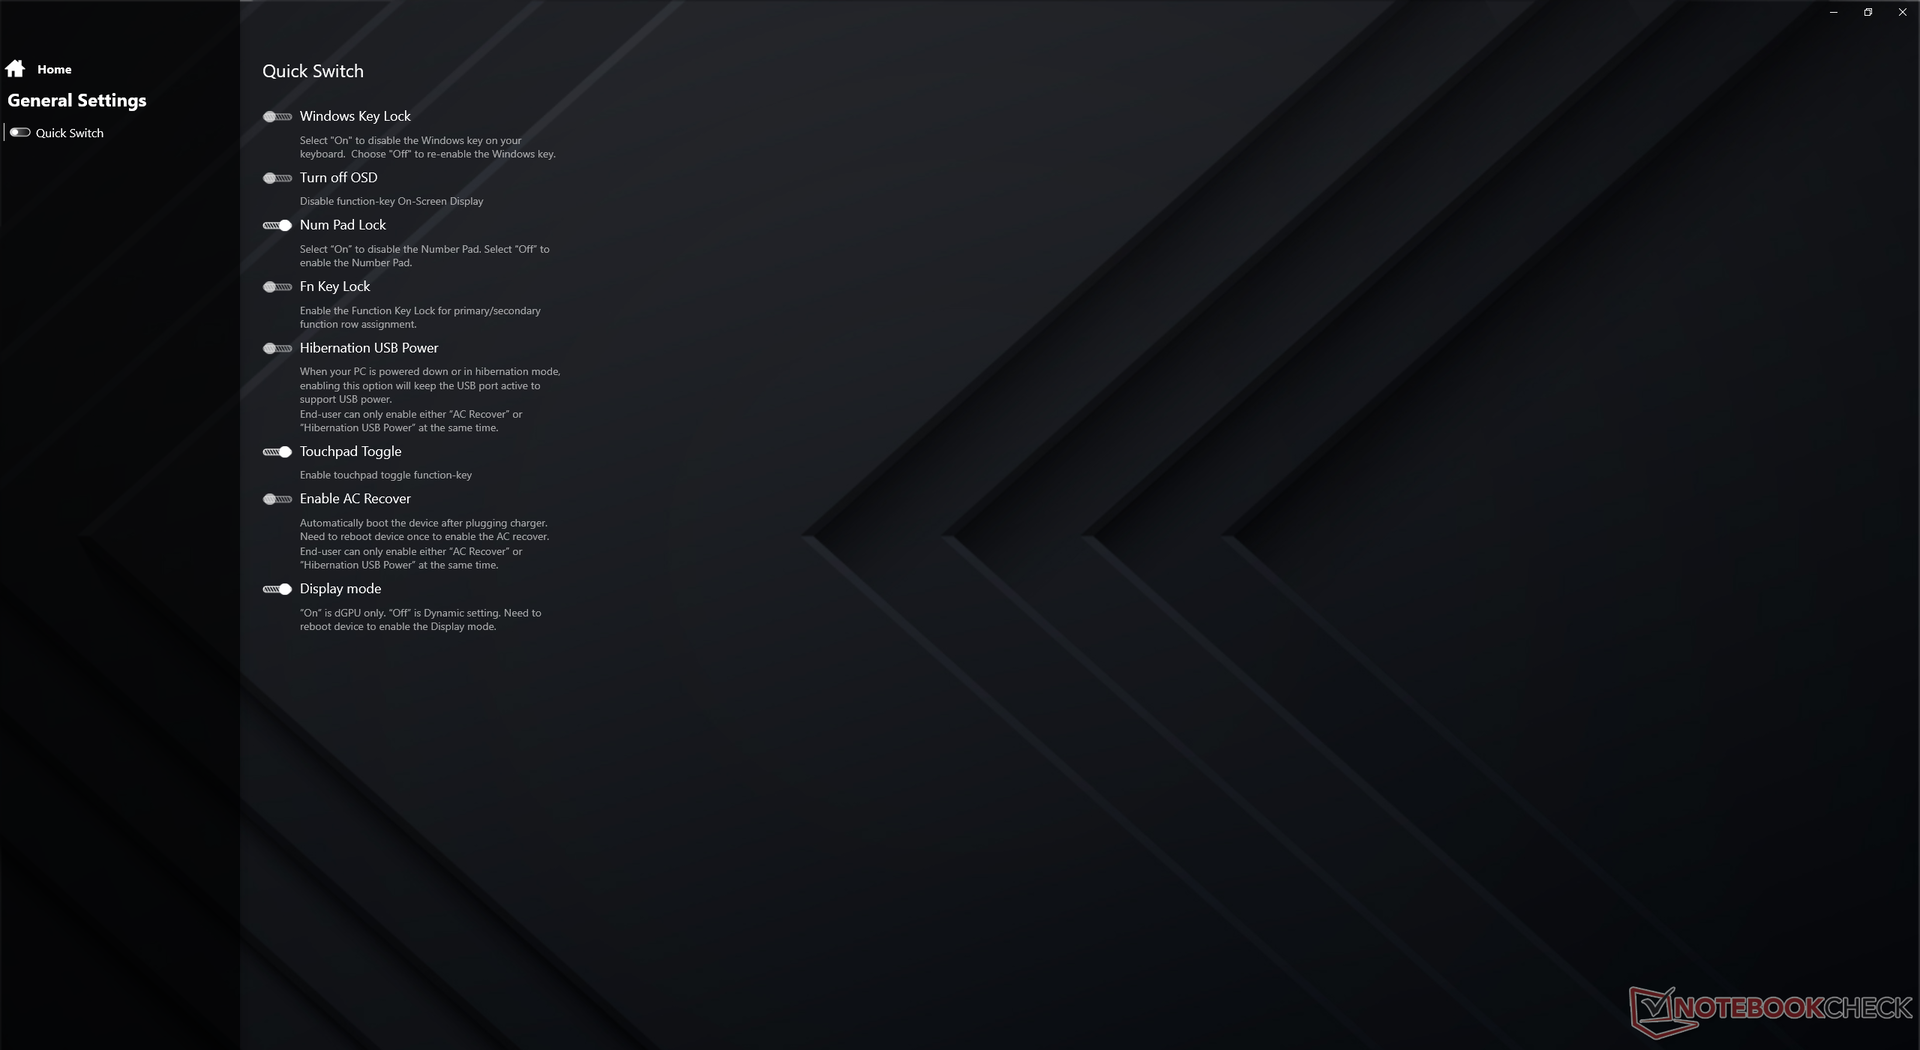
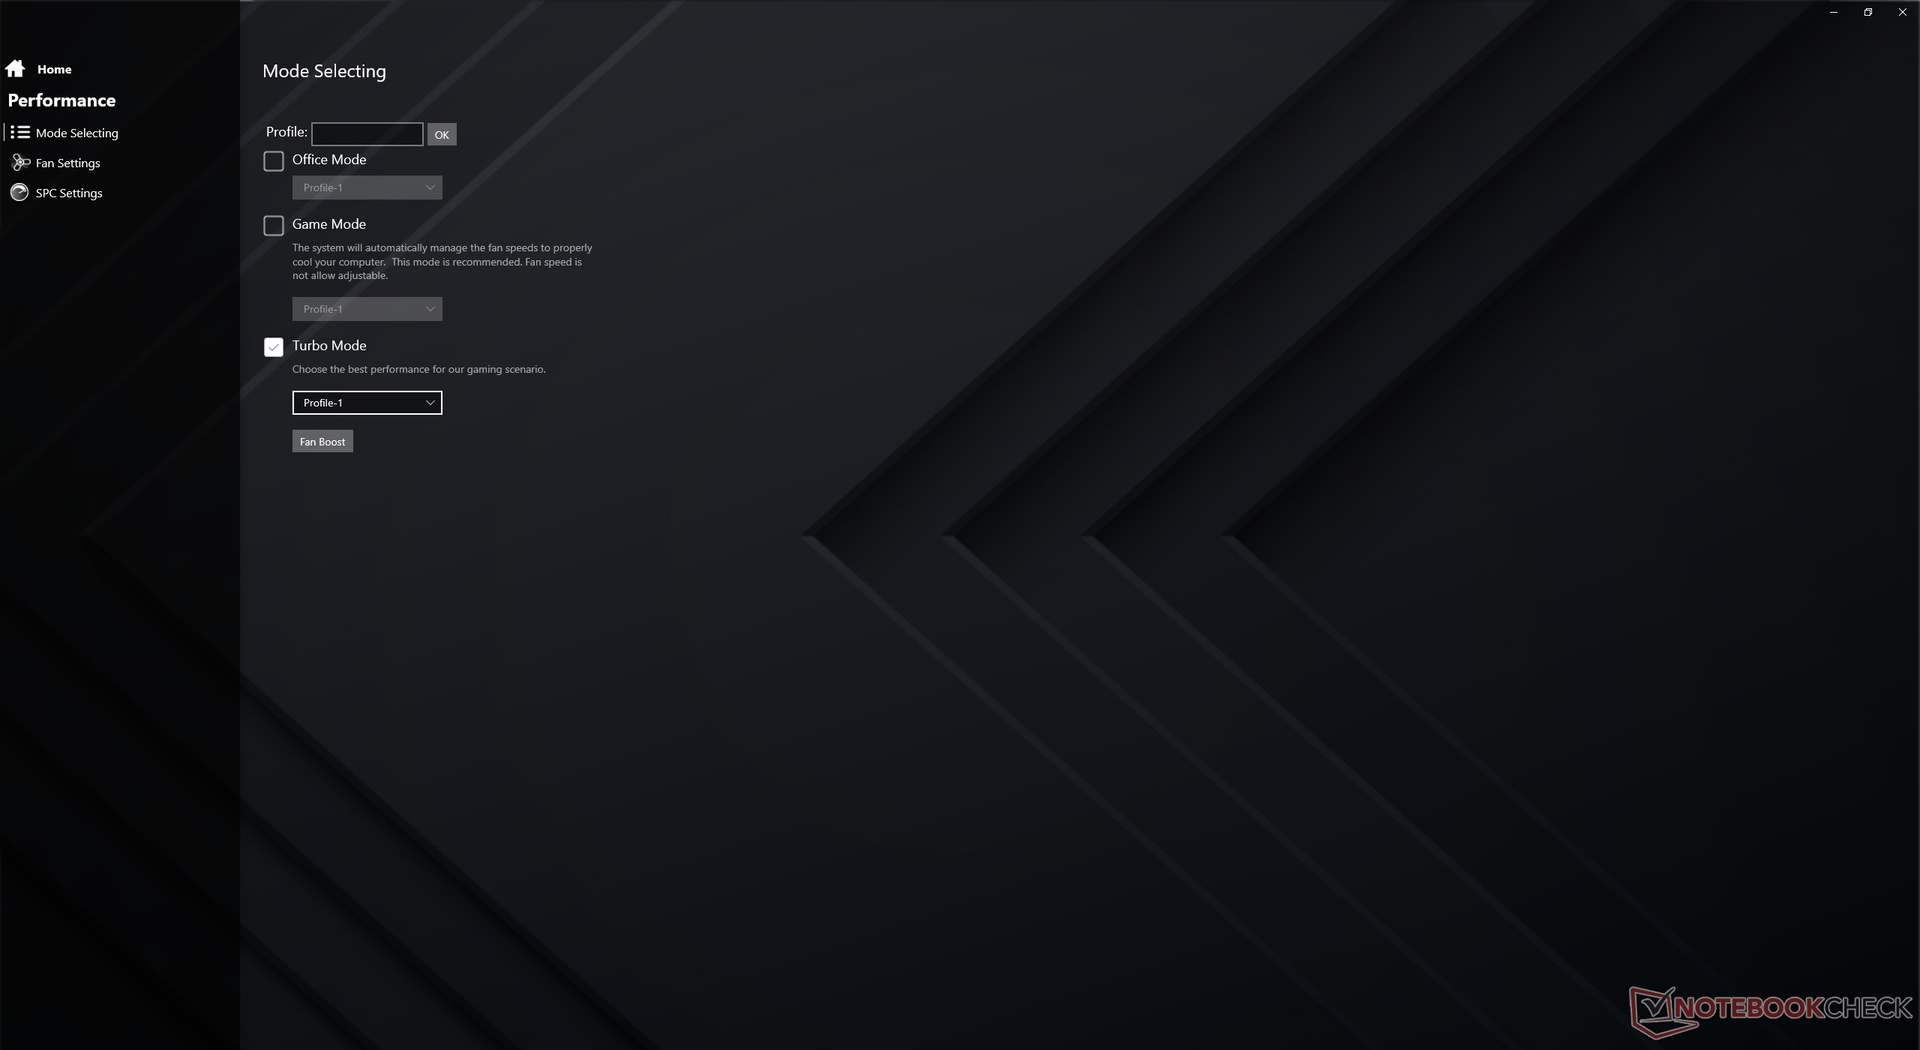
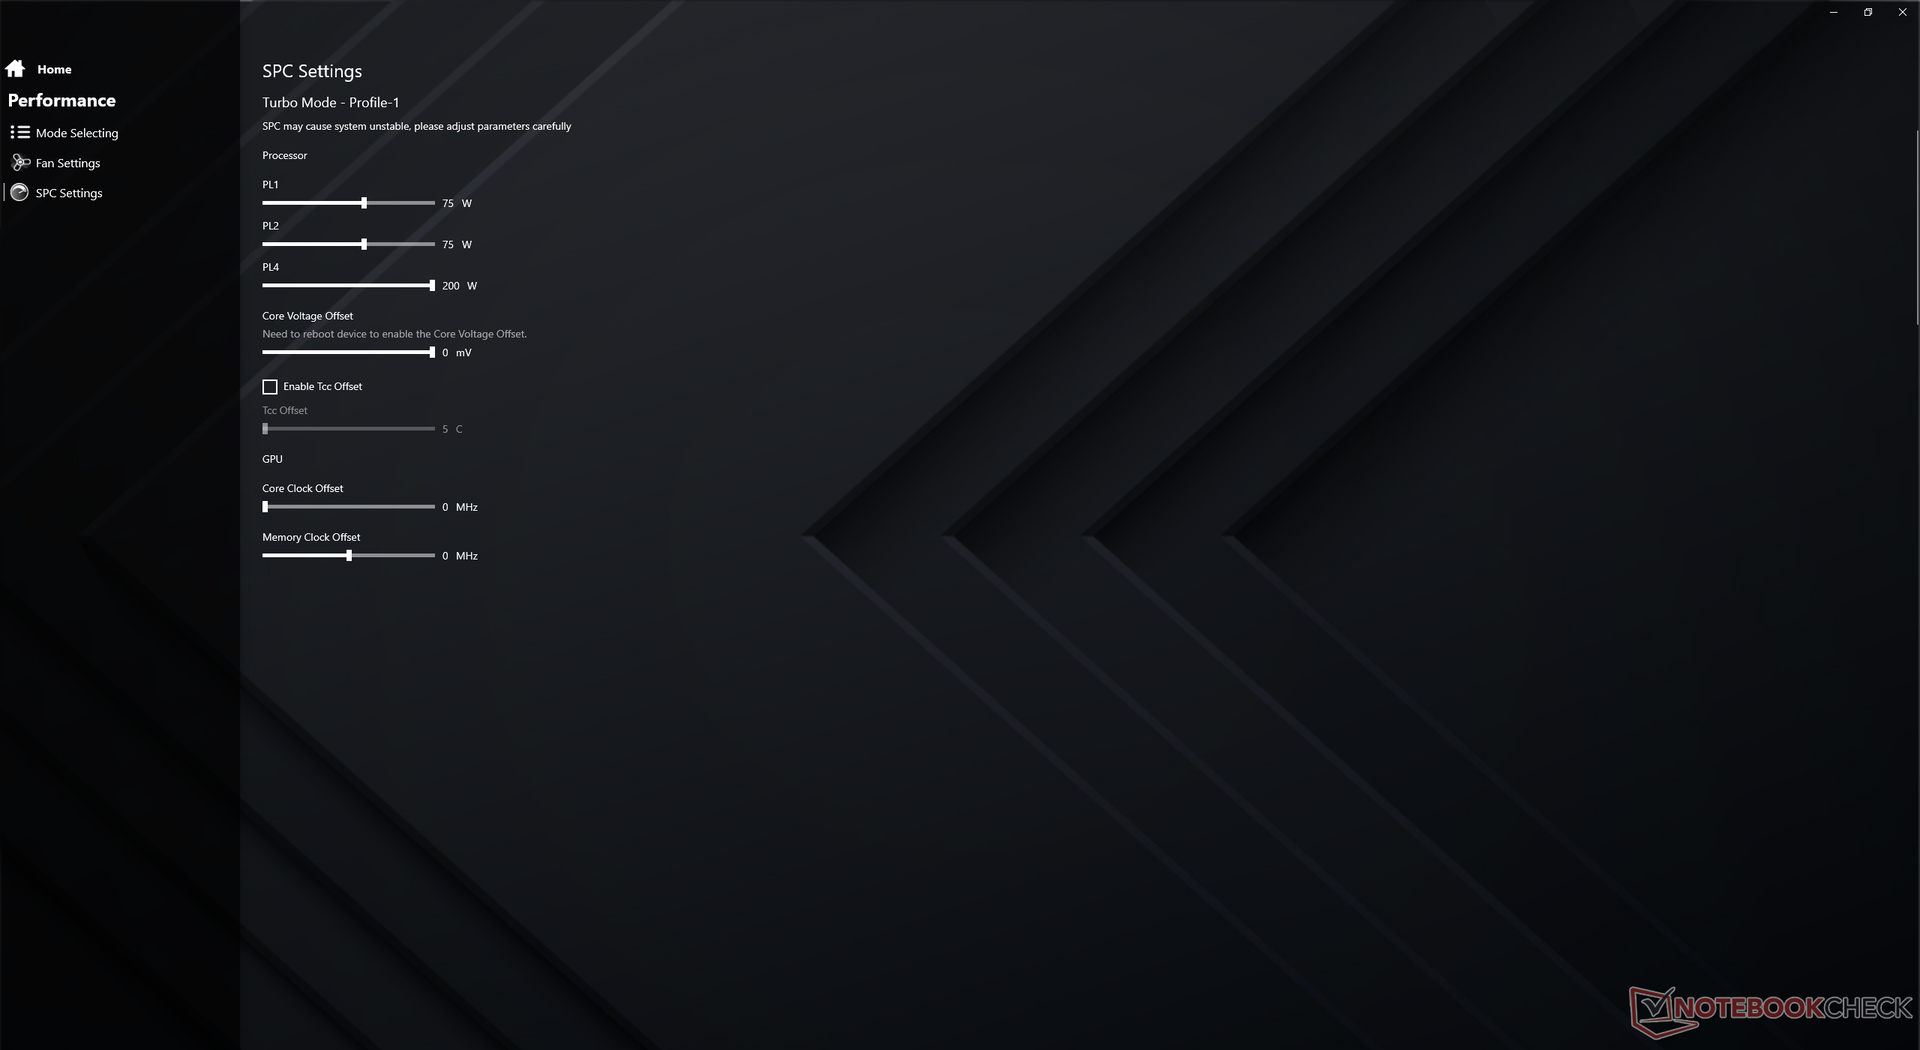
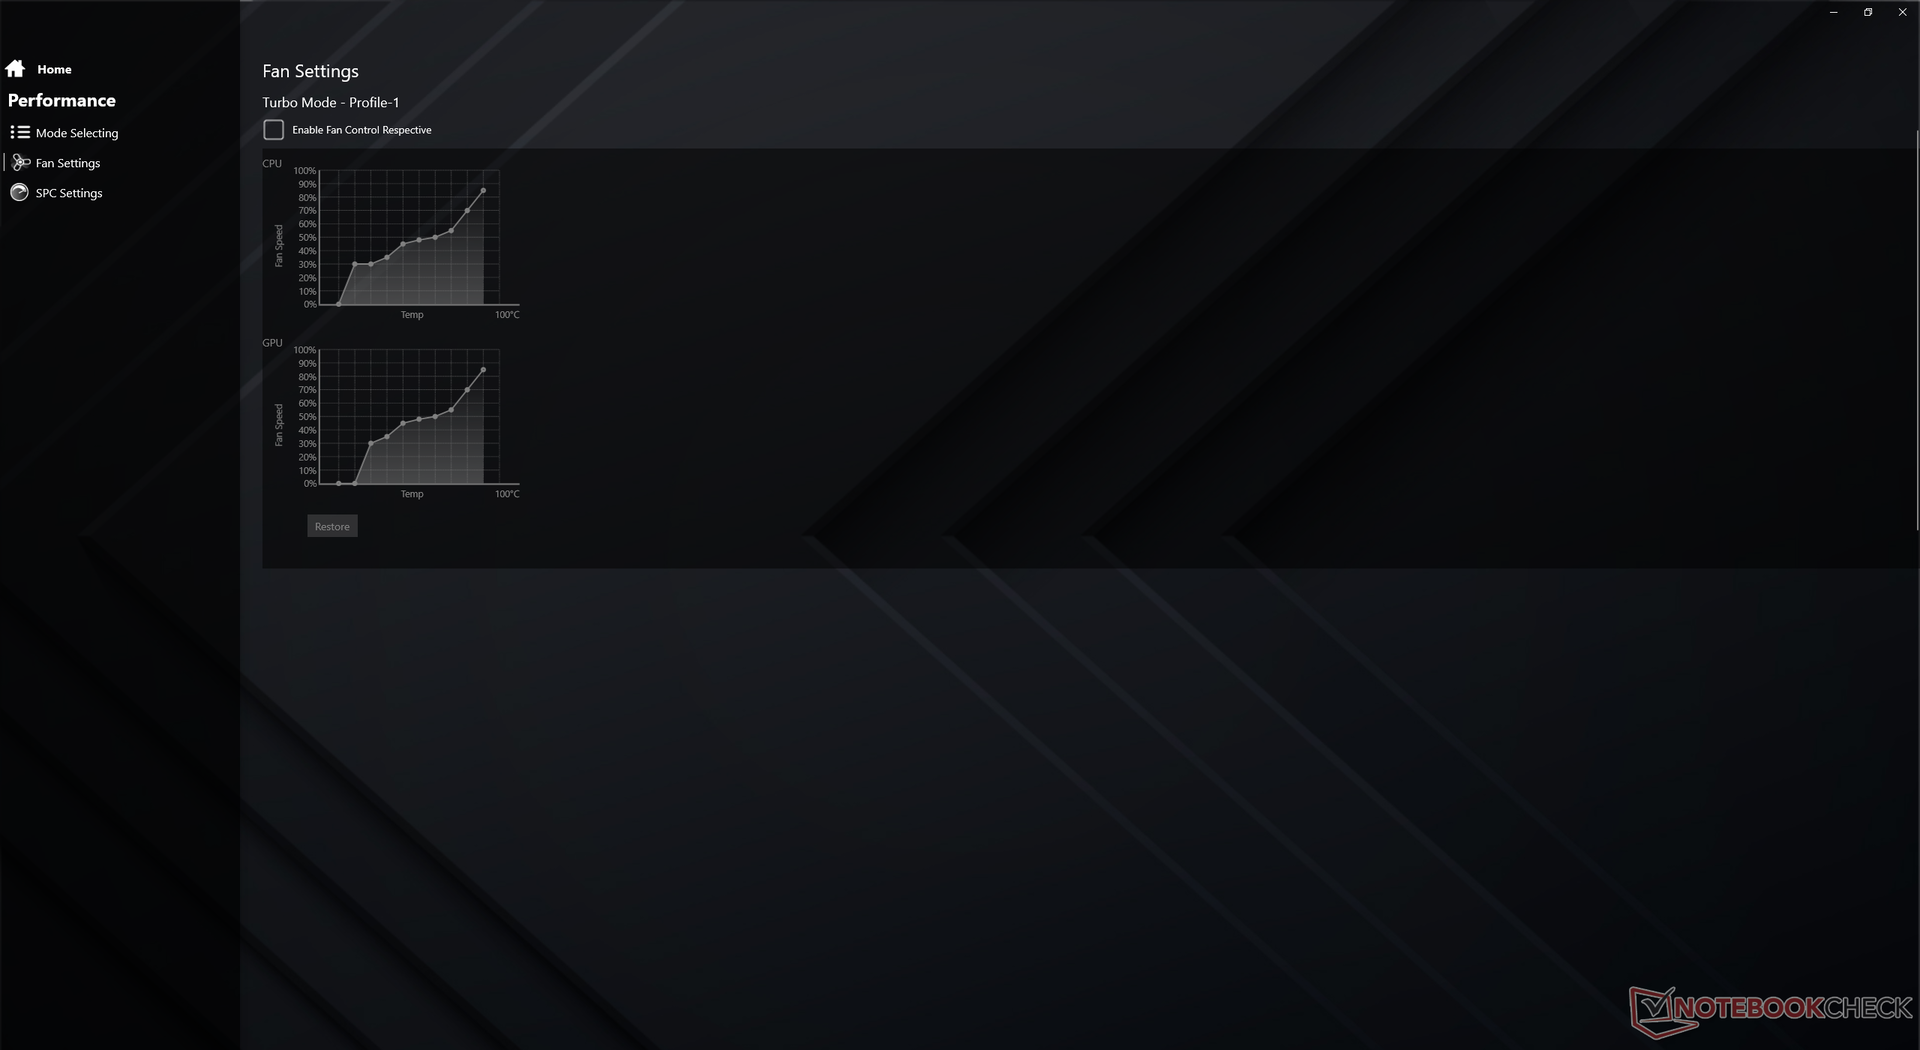
El Maingear exprime una GPU GeForce RTX 3080 de 165 W a pesar de su compacto diseño para ser similar a la GPU que se encuentra en el más gruesoSchenker XMG Ultra 17 en términos de TGP objetivo. La barra redimensionable, Dynamic Boost 2.0 y WhisperMode 2.0 son compatibles, mientras que Advanced Optimus y G-Sync interno no lo son. Por lo tanto, hay un interruptor manual disponible a través del software Maingear NODE Control Center para alternar entre el modo dGPU (es decir, el modo de rendimiento completo de la GPU) o el modo Optimus. Recomendamos a los usuarios que se familiaricen con este software, ya que muchos ajustes específicos del sistema y las características de los LEDs se pueden cambiar aquí
Nuestro sistema se configuró en modo Turbo y en modo dGPU antes de ejecutar cualquier prueba de rendimiento para obtener las mejores puntuaciones posibles.
Procesador
El rendimiento de la CPU es excelente y está donde esperamos que esté en relación con otros portátiles equipados con el mismo procesador. Los usuarios que se actualicen desde unCore i7-10750H o Core i7-10875H verán un aumento de rendimiento de aproximadamente el 40 y el 20 por ciento, respectivamente. El competidor Ryzen 7 5800H es ligeramente más rápido en cargas multihilo mientras que es ligeramente más lento en cargas de un solo hilo que nuestro Core i7-11800H
Cinebench R15 Multi Loop
Cinebench R23: Multi Core | Single Core
Cinebench R15: CPU Multi 64Bit | CPU Single 64Bit
Blender: v2.79 BMW27 CPU
7-Zip 18.03: 7z b 4 -mmt1 | 7z b 4
Geekbench 5.5: Single-Core | Multi-Core
HWBOT x265 Benchmark v2.2: 4k Preset
LibreOffice : 20 Documents To PDF
R Benchmark 2.5: Overall mean
* ... más pequeño es mejor
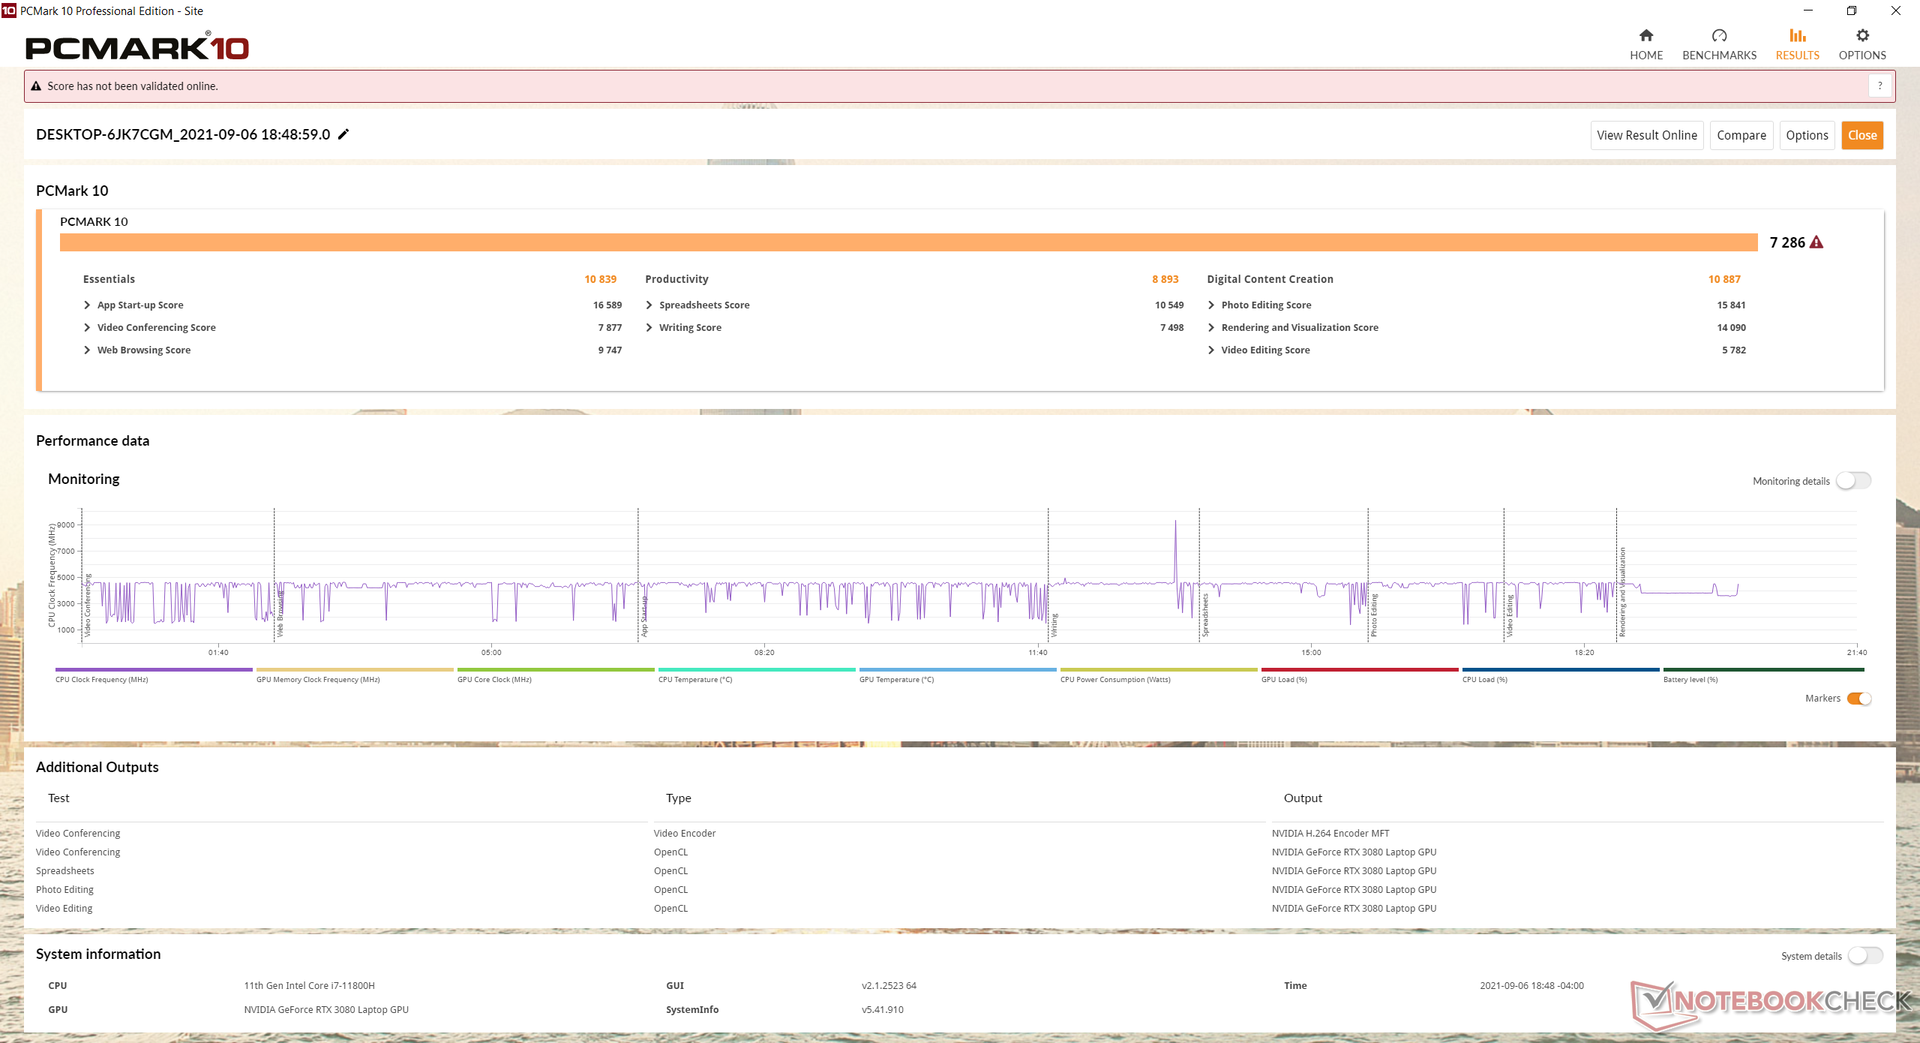
Rendimiento del sistema
| PCMark 10 / Score | |
| Maingear Vector Pro MG-VCP17 | |
| Asus ROG Zephyrus S17 GX703HSD | |
| Medio Intel Core i7-11800H, NVIDIA GeForce RTX 3080 Laptop GPU (6673 - 7470, n=11) | |
| Schenker XMG Neo 17 (Early 2021, RTX 3070, 5800H) | |
| MSI GS75 10SF-609US | |
| Schenker Compact 17 | |
| Schenker XMG Core 17 (Early 2021) | |
| PCMark 10 / Essentials | |
| Maingear Vector Pro MG-VCP17 | |
| Asus ROG Zephyrus S17 GX703HSD | |
| Medio Intel Core i7-11800H, NVIDIA GeForce RTX 3080 Laptop GPU (9862 - 11064, n=11) | |
| MSI GS75 10SF-609US | |
| Schenker XMG Neo 17 (Early 2021, RTX 3070, 5800H) | |
| Schenker Compact 17 | |
| Schenker XMG Core 17 (Early 2021) | |
| PCMark 10 / Productivity | |
| Asus ROG Zephyrus S17 GX703HSD | |
| Medio Intel Core i7-11800H, NVIDIA GeForce RTX 3080 Laptop GPU (8278 - 9803, n=11) | |
| Maingear Vector Pro MG-VCP17 | |
| Schenker XMG Neo 17 (Early 2021, RTX 3070, 5800H) | |
| Schenker Compact 17 | |
| MSI GS75 10SF-609US | |
| Schenker XMG Core 17 (Early 2021) | |
| PCMark 10 / Digital Content Creation | |
| Maingear Vector Pro MG-VCP17 | |
| Asus ROG Zephyrus S17 GX703HSD | |
| Medio Intel Core i7-11800H, NVIDIA GeForce RTX 3080 Laptop GPU (9881 - 11323, n=11) | |
| Schenker XMG Neo 17 (Early 2021, RTX 3070, 5800H) | |
| MSI GS75 10SF-609US | |
| Schenker Compact 17 | |
| Schenker XMG Core 17 (Early 2021) | |
| PCMark 10 Score | 7286 puntos | |
ayuda | ||
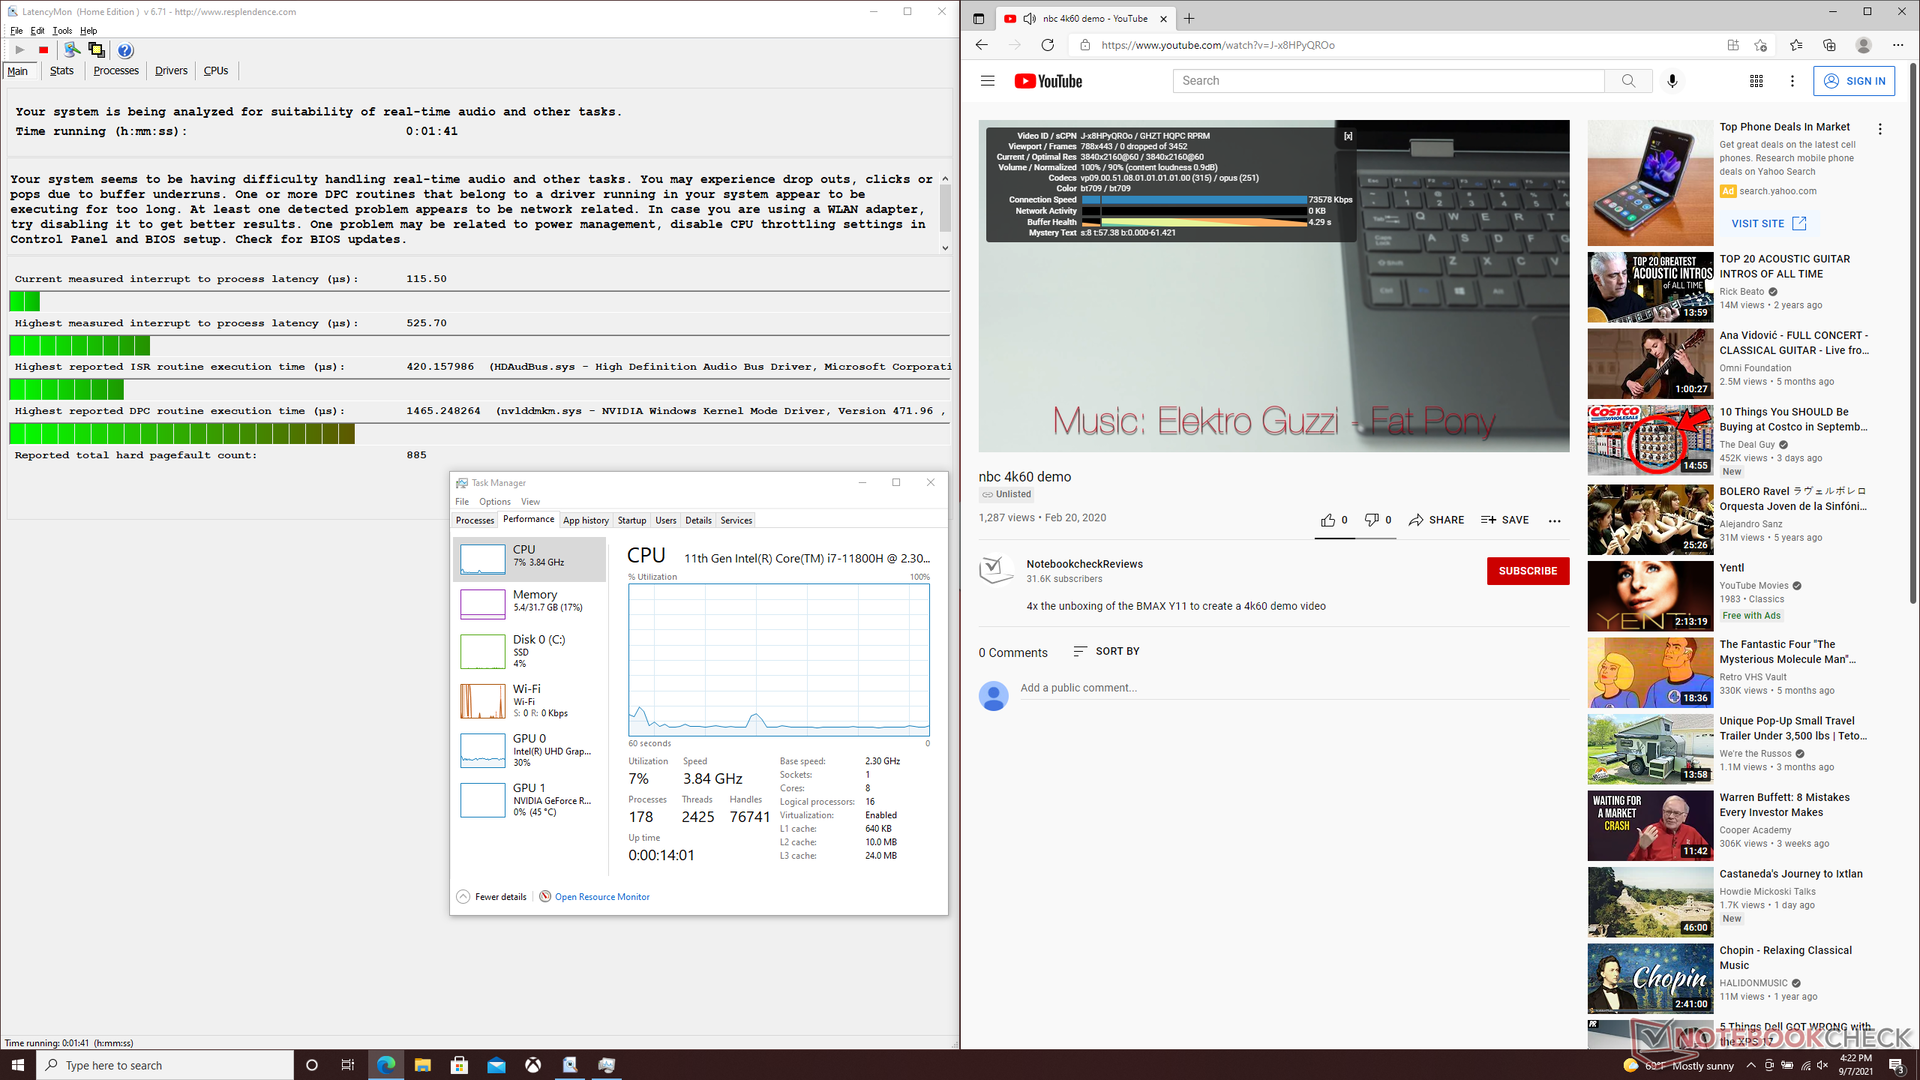
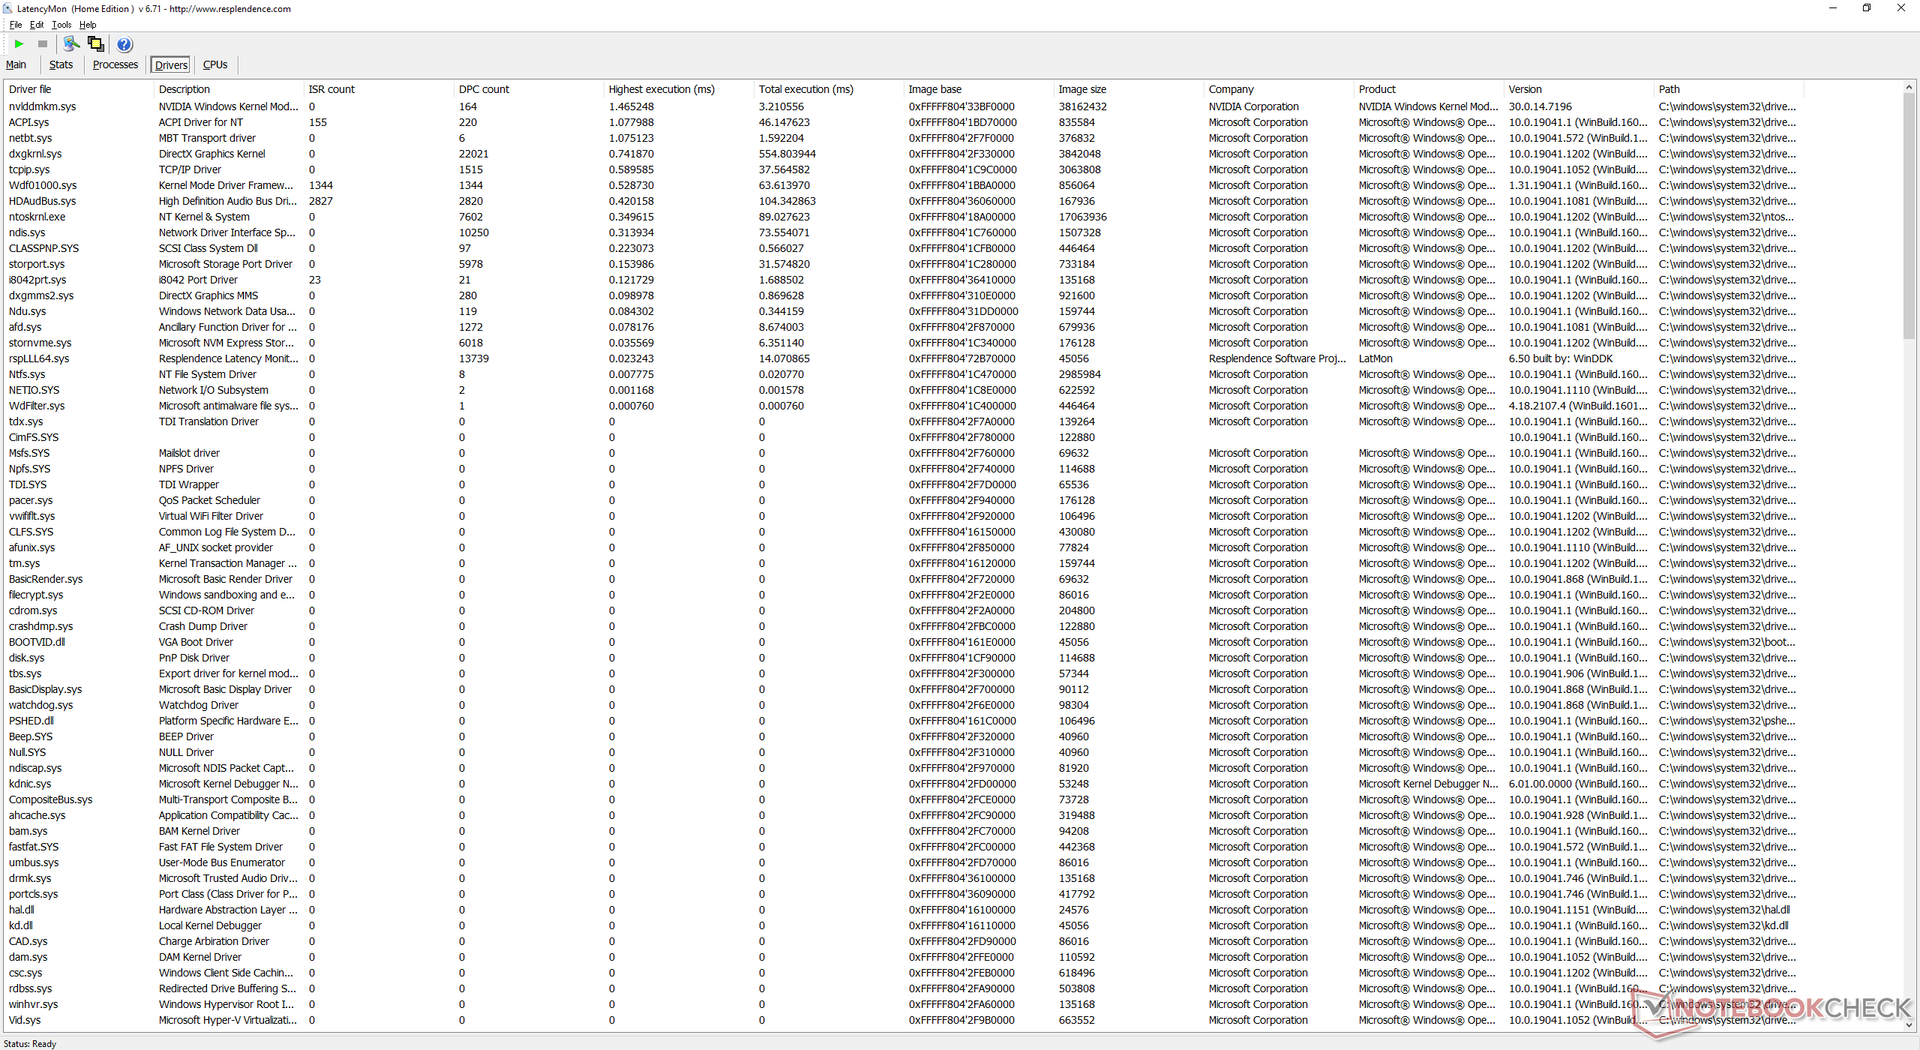
Latencia del CPD
LatencyMon muestra problemas menores de latencia del CPD al abrir varias pestañas del navegador en nuestra página de inicio. La reproducción de vídeo 4K a 60 FPS es, por lo demás, fluida y sin pérdida de fotogramas.
| DPC Latencies / LatencyMon - interrupt to process latency (max), Web, Youtube, Prime95 | |
| Schenker XMG Neo 17 (Early 2021, RTX 3070, 5800H) | |
| Asus ROG Zephyrus S17 GX703HSD | |
| Schenker XMG Core 17 (Early 2021) | |
| Schenker Compact 17 | |
| Maingear Vector Pro MG-VCP17 | |
| MSI GS75 10SF-609US | |
* ... más pequeño es mejor
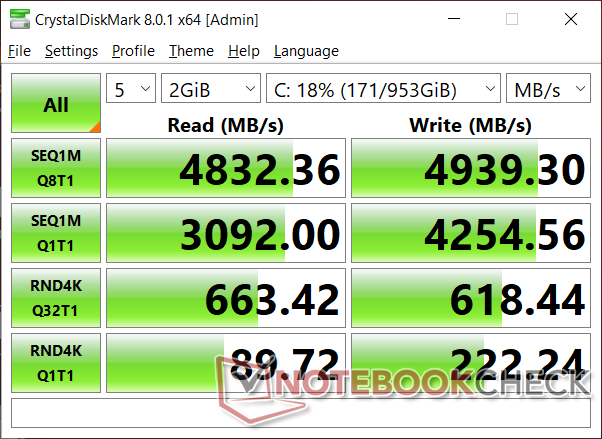
Dispositivos de almacenamiento
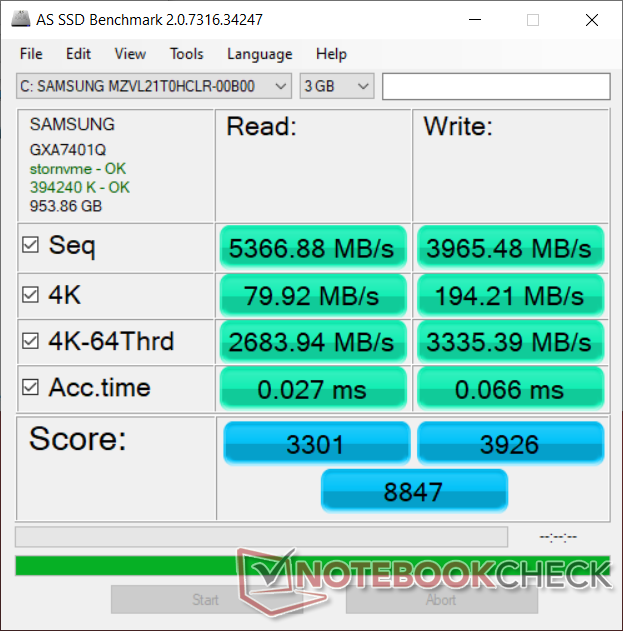
Nuestra unidad de prueba viene con un Samsung PM9A1 que es el principal SSD PCIe Gen4 NVMe del fabricante para consumidores. Las tasas de lectura y escritura secuencial se acercan a los 7000 MB/s y 5200 MB/s, respectivamente, para ser aproximadamente 2 veces más rápidas que en el Samsung PM981a que se suele encontrar en los portátiles emblemáticos de la generación anterior.
| Maingear Vector Pro MG-VCP17 Samsung PM9A1 MZVL21T0HCLR | Asus ROG Zephyrus S17 GX703HSD Samsung PM9A1 MZVL22T0HBLB | Schenker XMG Core 17 (Early 2021) Samsung SSD 970 EVO Plus 1TB | Schenker XMG Neo 17 (Early 2021, RTX 3070, 5800H) Samsung SSD 970 EVO Plus 500GB | Schenker Compact 17 Samsung SSD 970 EVO Plus 1TB | MSI GS75 10SF-609US WDC PC SN730 SDBPNTY-512G | |
|---|---|---|---|---|---|---|
| AS SSD | 7% | -38% | -28% | -28% | -50% | |
| Seq Read (MB/s) | 5367 | 5085 -5% | 2876 -46% | 3020 -44% | 2879 -46% | 2327 -57% |
| Seq Write (MB/s) | 3965 | 4434 12% | 2803 -29% | 2631 -34% | 2842 -28% | 2479 -37% |
| 4K Read (MB/s) | 79.9 | 80.3 1% | 55.3 -31% | 60.3 -25% | 51.6 -35% | 45.46 -43% |
| 4K Write (MB/s) | 194.2 | 214.7 11% | 106.9 -45% | 171.6 -12% | 142.5 -27% | 157.4 -19% |
| 4K-64 Read (MB/s) | 2684 | 2573 -4% | 1662 -38% | 1410 -47% | 1672 -38% | 1050 -61% |
| 4K-64 Write (MB/s) | 3335 | 2972 -11% | 2101 -37% | 2324 -30% | 2293 -31% | 938 -72% |
| Access Time Read * (ms) | 0.027 | 0.018 33% | 0.067 -148% | 0.045 -67% | 0.034 -26% | 0.076 -181% |
| Access Time Write * (ms) | 0.066 | 0.02 70% | 0.037 44% | 0.024 64% | 0.027 59% | 0.071 -8% |
| Score Read (Points) | 3301 | 3161 -4% | 2005 -39% | 1773 -46% | 2012 -39% | 1328 -60% |
| Score Write (Points) | 3926 | 3631 -8% | 2488 -37% | 2759 -30% | 2719 -31% | 1343 -66% |
| Score Total (Points) | 8847 | 8380 -5% | 5520 -38% | 5429 -39% | 5760 -35% | 3366 -62% |
| Copy ISO MB/s (MB/s) | 2579 | 3239 26% | 2029 -21% | 2383 -8% | 3092 20% | |
| Copy Program MB/s (MB/s) | 1133 | 899 -21% | 691 -39% | 603 -47% | 733 -35% | |
| Copy Game MB/s (MB/s) | 2161 | 2171 0% | 1513 -30% | 873 -60% | 1683 -22% | |
| CrystalDiskMark 5.2 / 6 | 1% | -32% | -28% | -31% | -37% | |
| Write 4K (MB/s) | 227.2 | 244.2 7% | 145.7 -36% | 206.1 -9% | 167.8 -26% | 177.9 -22% |
| Read 4K (MB/s) | 89 | 89.8 1% | 51.3 -42% | 53 -40% | 53.5 -40% | 47.42 -47% |
| Write Seq (MB/s) | 4256 | 3036 -29% | 3018 -29% | 3073 -28% | 2707 -36% | |
| Read Seq (MB/s) | 4364 | 2837 -35% | 2575 -41% | 2488 -43% | 2369 -46% | |
| Write 4K Q32T1 (MB/s) | 614 | 607 -1% | 511 -17% | 535 -13% | 524 -15% | 427.8 -30% |
| Read 4K Q32T1 (MB/s) | 659 | 658 0% | 582 -12% | 608 -8% | 595 -10% | 543 -18% |
| Write Seq Q32T1 (MB/s) | 5216 | 5270 1% | 3294 -37% | 3242 -38% | 3324 -36% | 2703 -48% |
| Read Seq Q32T1 (MB/s) | 7073 | 7091 0% | 3522 -50% | 3617 -49% | 3564 -50% | 3387 -52% |
| Write 4K Q8T8 (MB/s) | 2270 | |||||
| Read 4K Q8T8 (MB/s) | 2490 | |||||
| Media total (Programa/Opciones) | 4% /
5% | -35% /
-36% | -28% /
-28% | -30% /
-29% | -44% /
-46% |
* ... más pequeño es mejor

Disk Throttling: DiskSpd Read Loop, Queue Depth 8
Rendimiento de la GPU
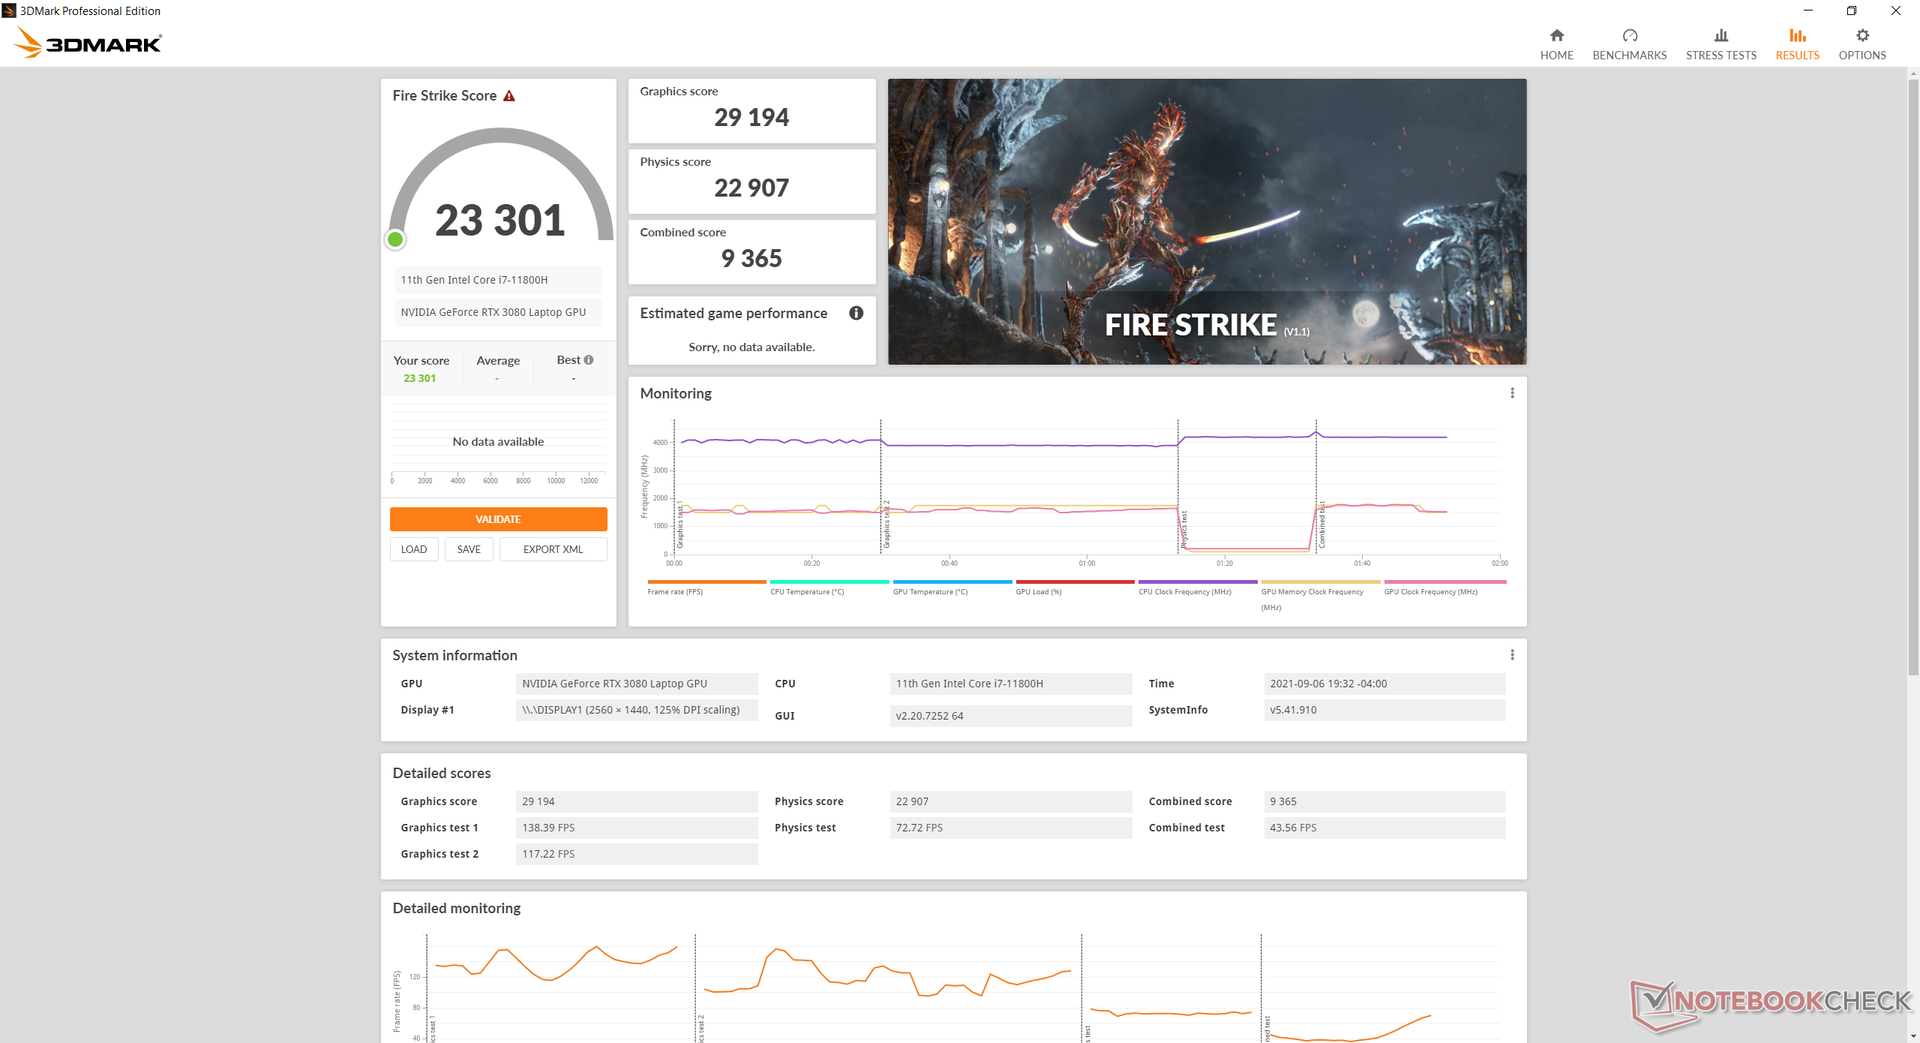
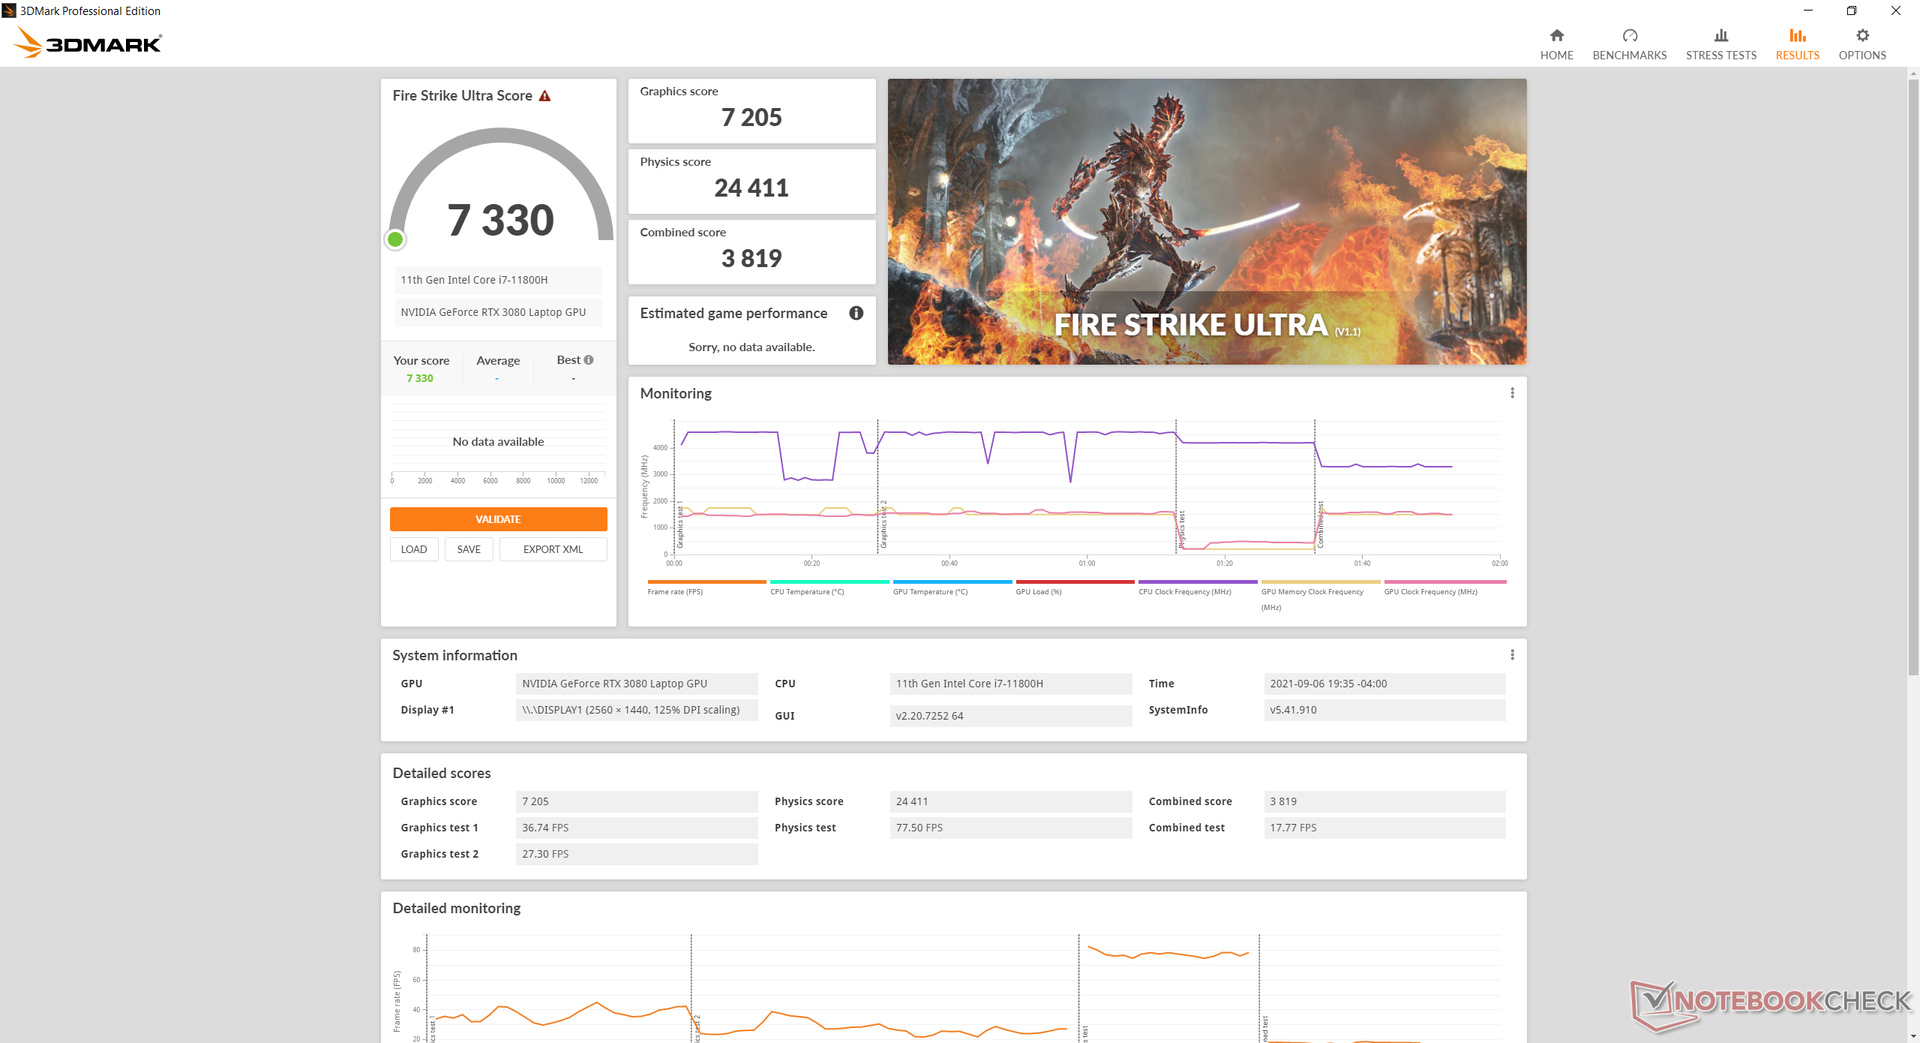
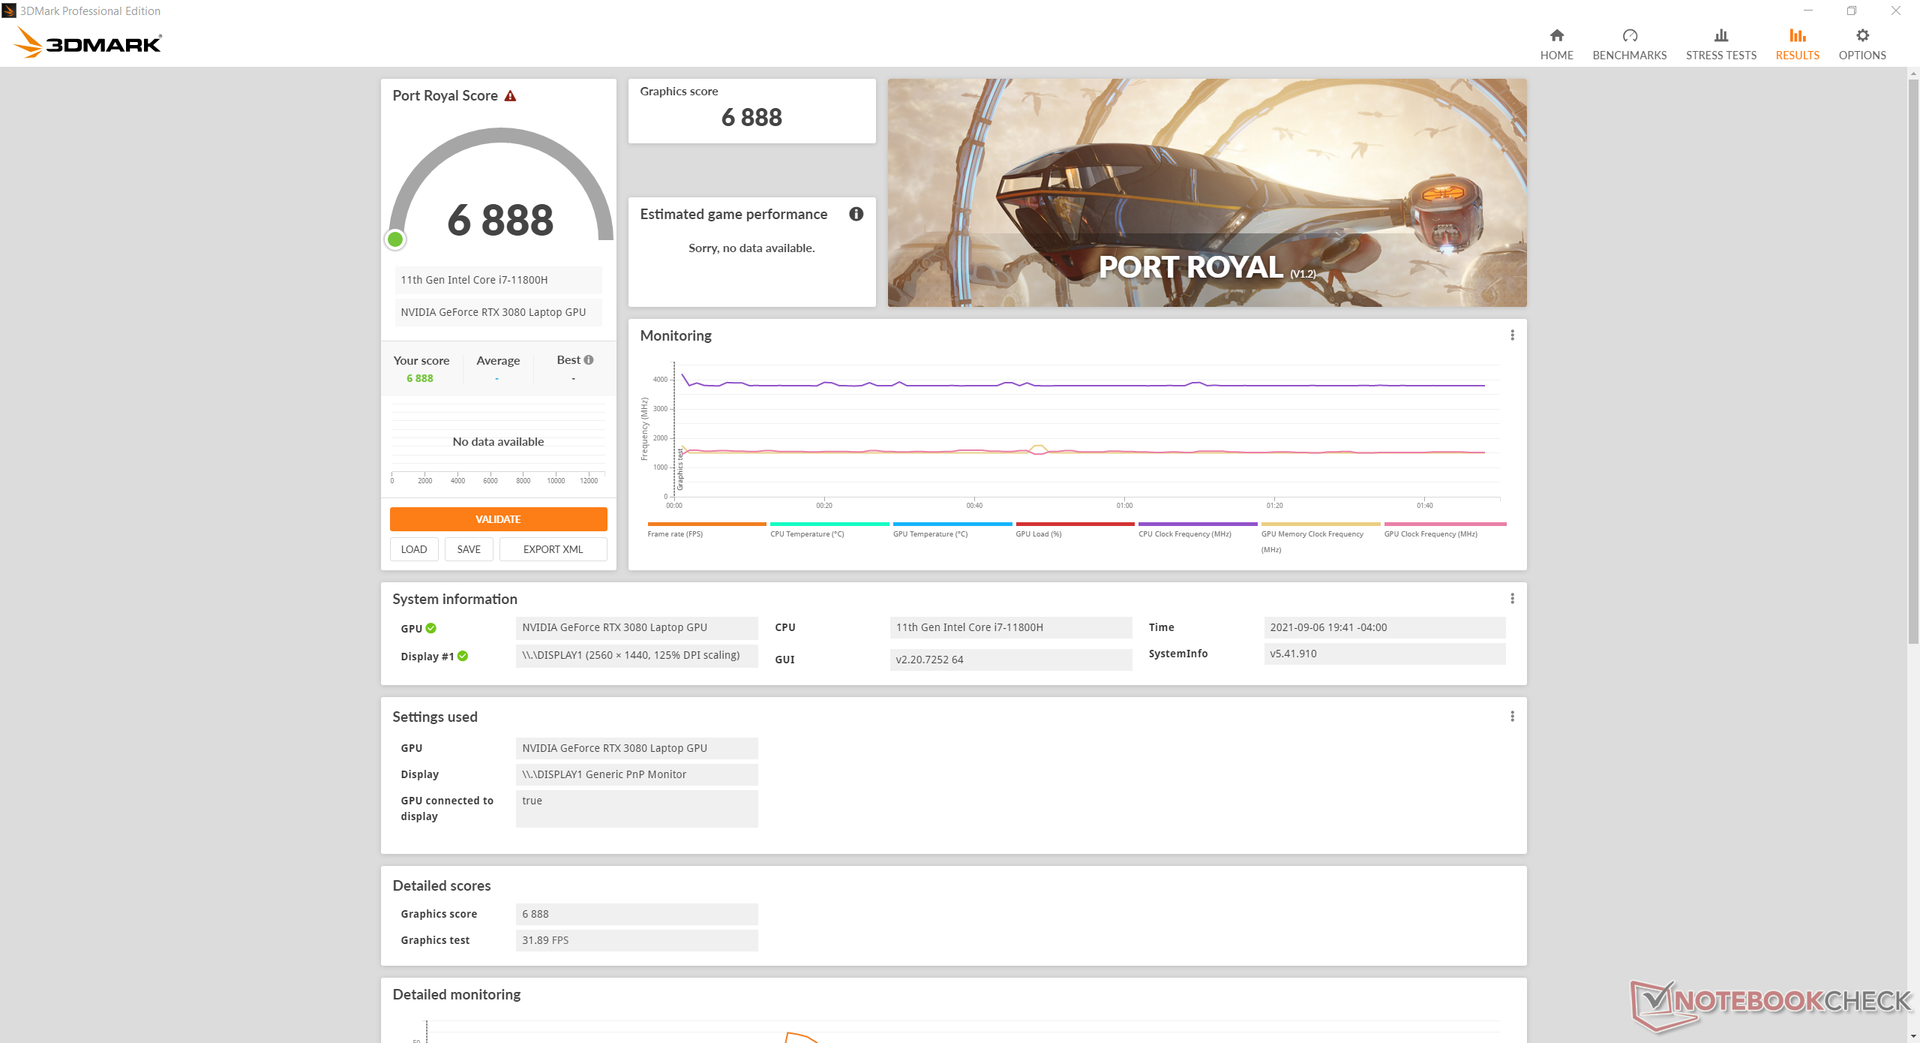
El rendimiento gráfico se queda corto en alrededor de un 15 por ciento en comparación con el Schenker Ultra 17 a pesar de que cada sistema viene con una TGP GeForce RTX 3080 de 165 W. Una RTX 3080 de rTX 3080 de sobremesa puede funcionar entre un 40 y un 60 por ciento más rápido que nuestra versión móvil. Aun así, nuestra GPU está más o menos donde esperamos que esté después de probar más de 30 Portátiles RTX 3080 hasta ahora.
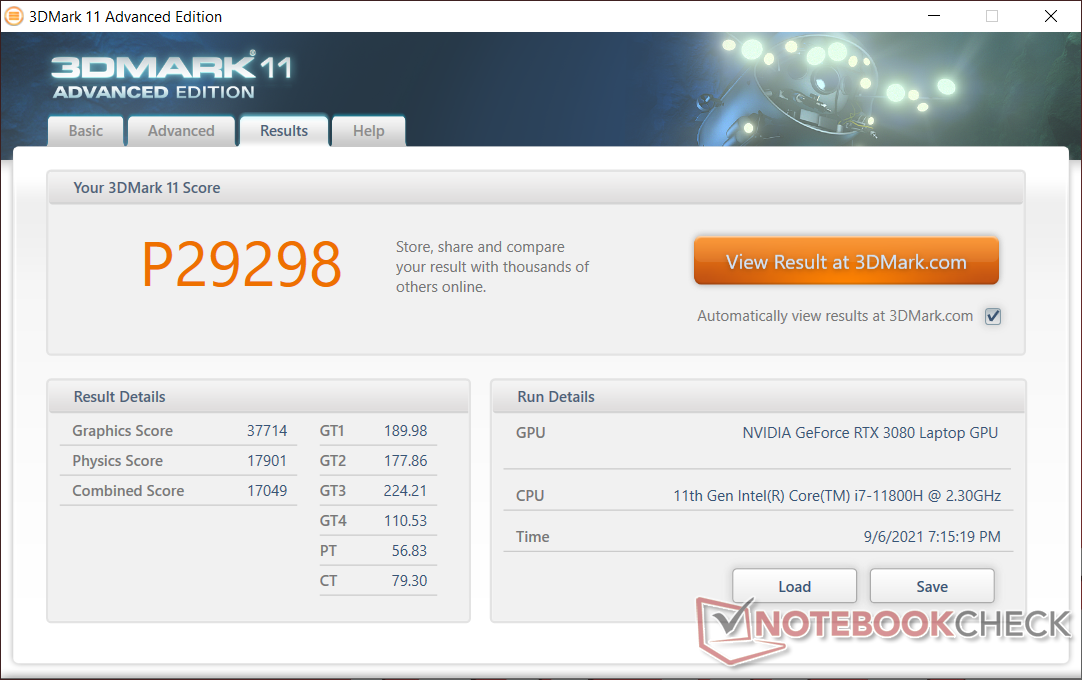
| 3DMark 11 Performance | 29298 puntos | |
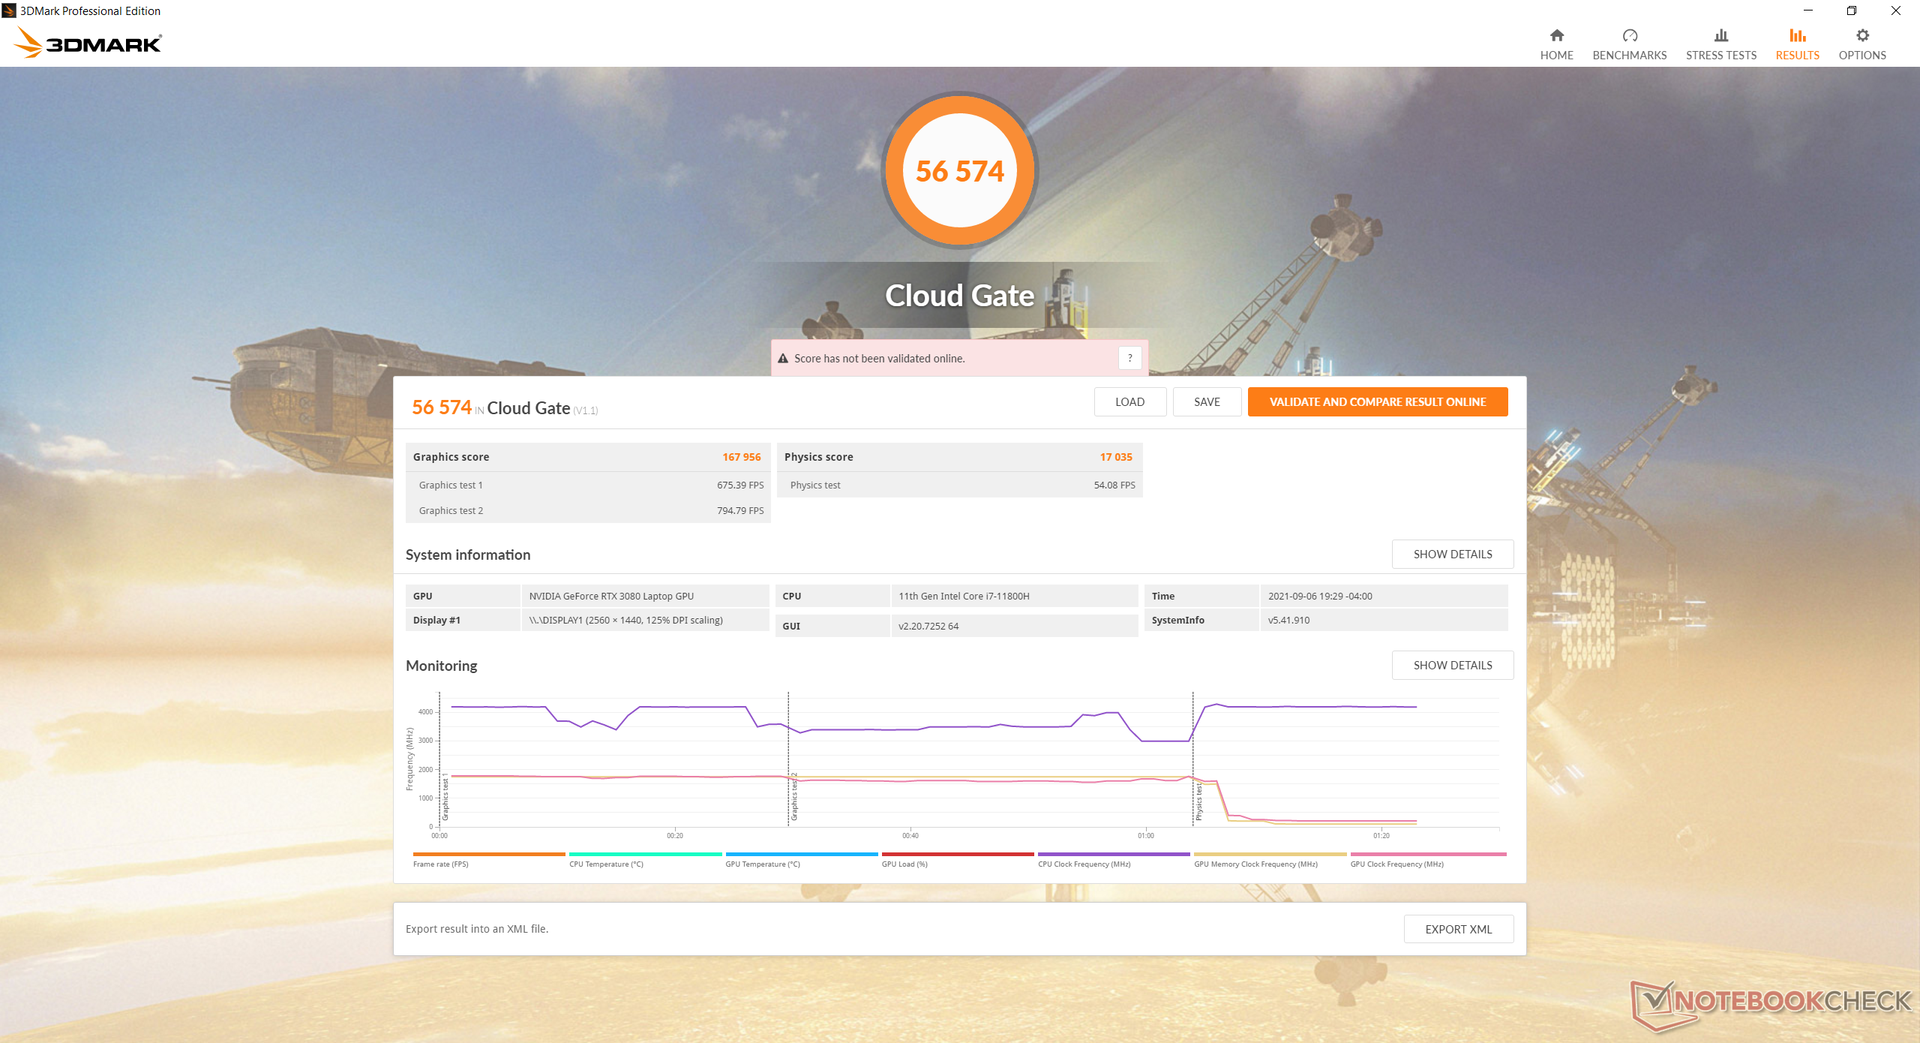
| 3DMark Cloud Gate Standard Score | 56574 puntos | |
| 3DMark Fire Strike Score | 23301 puntos | |
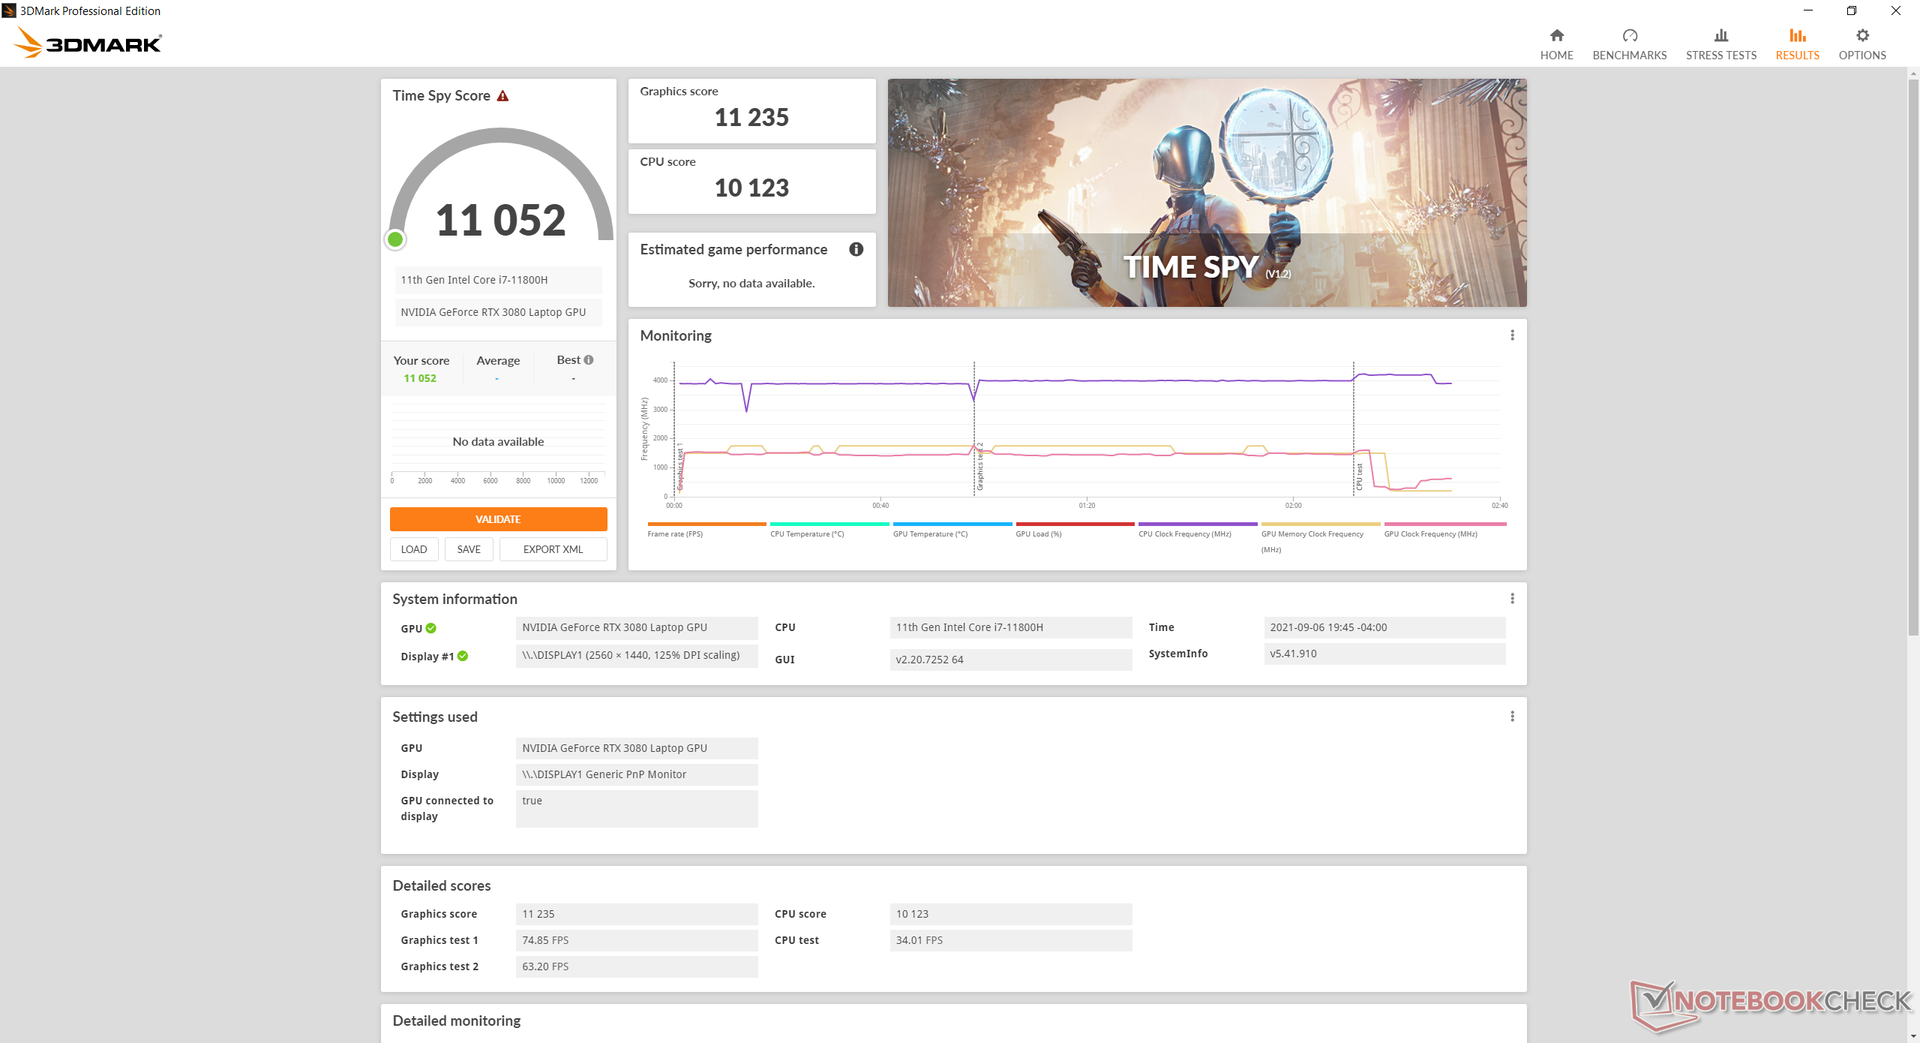
| 3DMark Time Spy Score | 11052 puntos | |
ayuda | ||
Witcher 3 FPS Chart
| bajo | medio | alto | ultra | QHD | |
|---|---|---|---|---|---|
| GTA V (2015) | 184 | 179 | 173 | 109 | 99.1 |
| The Witcher 3 (2015) | 439.6 | 321.2 | 212.9 | 108.6 | |
| Dota 2 Reborn (2015) | 164 | 145 | 142 | 127 | |
| Final Fantasy XV Benchmark (2018) | 184 | 144 | 108 | 83.5 | |
| X-Plane 11.11 (2018) | 126 | 114 | 85.7 | ||
| Far Cry 5 (2018) | 162 | 140 | 134 | 124 | 110 |
| Strange Brigade (2018) | 521 | 289 | 233 | 204 | 151 |
Emissions
Ruido del sistema
El ruido del ventilador es una mezcla. Cuando está en reposo en el escritorio o navegando por la web, el ruido del ventilador es generalmente silencioso, alcanzando sólo 28,7 dB(A) contra un fondo silencioso de 23,8 dB(A). Sin embargo, cuando se ejecuta la primera escena de 3DMark 06, el ruido del ventilador aumenta hasta 38 dB(A) en la mitad de la escena antes de volver a bajar a 28,7 dB(A) hacia el final. Se recomienda utilizar el modo Office en lugar del modo Turbo para evitar que los ventiladores pulsen con tanta frecuencia.
El ruido de los ventiladores cuando se juega es muy alto, casi 56 dB(A), lo que distrae si no se llevan auriculares. Activando el Fan Boost los ventiladores alcanzarán su máximo de 56 dB(A) independientemente de la carga de procesamiento, pero los usuarios alcanzarán este techo de todos modos cuando jueguen independientemente de la configuración del Fan Boost.
| Maingear Vector Pro MG-VCP17 GeForce RTX 3080 Laptop GPU, i7-11800H, Samsung PM9A1 MZVL21T0HCLR | Asus ROG Zephyrus S17 GX703HSD GeForce RTX 3080 Laptop GPU, i9-11900H, Samsung PM9A1 MZVL22T0HBLB | Schenker XMG Core 17 (Early 2021) GeForce RTX 3060 Laptop GPU, i7-10870H, Samsung SSD 970 EVO Plus 1TB | Schenker XMG Neo 17 (Early 2021, RTX 3070, 5800H) GeForce RTX 3070 Laptop GPU, R7 5800H, Samsung SSD 970 EVO Plus 500GB | Schenker Compact 17 GeForce RTX 2070 Super Mobile, i7-10875H, Samsung SSD 970 EVO Plus 1TB | MSI GS75 10SF-609US GeForce RTX 2070 Max-Q, i7-10875H, WDC PC SN730 SDBPNTY-512G | |
|---|---|---|---|---|---|---|
| Noise | 5% | -20% | -20% | -21% | -21% | |
| apagado / medio ambiente * (dB) | 23.8 | 23 3% | 25 -5% | 24 -1% | 25.4 -7% | 26.2 -10% |
| Idle Minimum * (dB) | 23.9 | 23 4% | 30 -26% | 29 -21% | 25.4 -6% | 31.2 -31% |
| Idle Average * (dB) | 23.9 | 23 4% | 32 -34% | 32 -34% | 25.4 -6% | 31.4 -31% |
| Idle Maximum * (dB) | 23.9 | 23 4% | 36 -51% | 38 -59% | 40 -67% | 34 -42% |
| Load Average * (dB) | 38 | 41 -8% | 53 -39% | 49 -29% | 54.6 -44% | 49.5 -30% |
| Witcher 3 ultra * (dB) | 55.9 | 45 19% | 51 9% | 53 5% | 50.6 9% | |
| Load Maximum * (dB) | 55.9 | 52 7% | 54 3% | 55 2% | 54.6 2% | 60.7 -9% |
* ... más pequeño es mejor
Ruido
| Ocioso |
| 23.9 / 23.9 / 23.9 dB(A) |
| Carga |
| 38 / 55.9 dB(A) |
 | ||
30 dB silencioso 40 dB(A) audible 50 dB(A) ruidosamente alto |
||
min: | ||
Temperatura
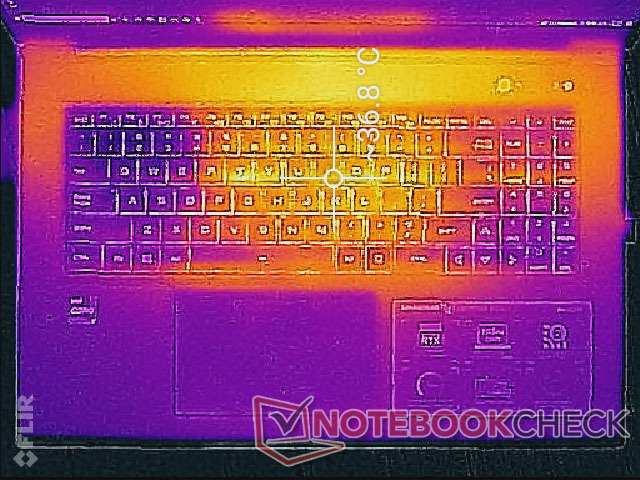
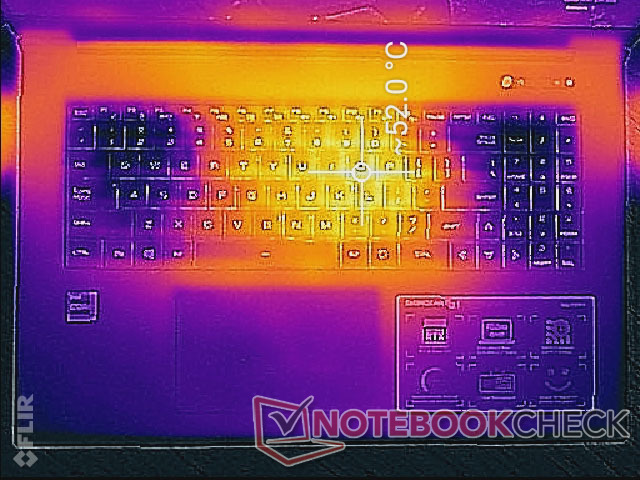
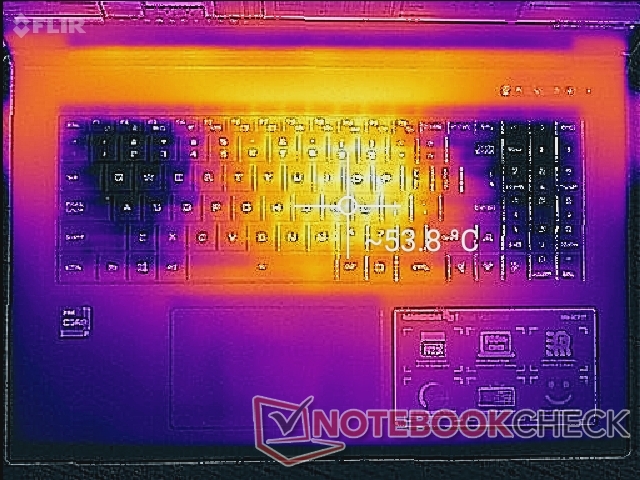
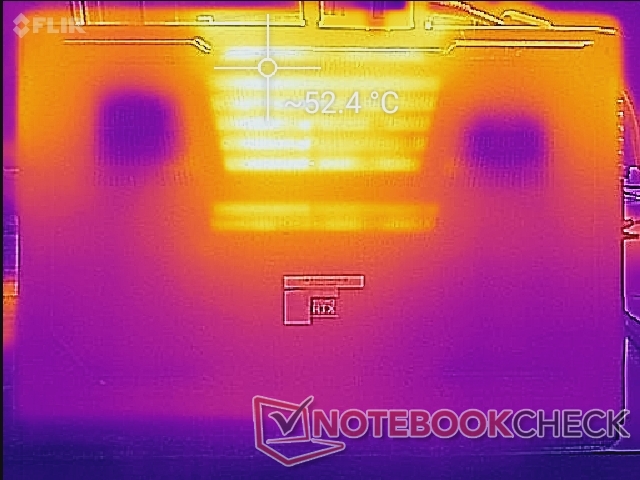
Las temperaturas de la superficie son más cálidas hacia el centro del teclado, mientras que son mucho más frías en las teclas WASD, el teclado numérico y los reposamanos. Esta distribución es deseable cuando se juega, ya que es más probable que los dedos y las palmas se apoyen en estas áreas más frías que en cualquier parte del centro del teclado. Hemos podido medir un punto caliente de más de 53 C en la tecla "J" cuando se juega, en comparación con sólo 26 C en la tecla "W", donde el aire frío es atraído.
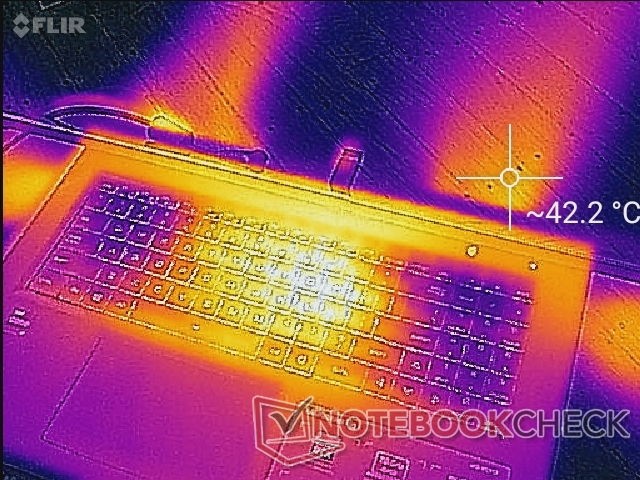
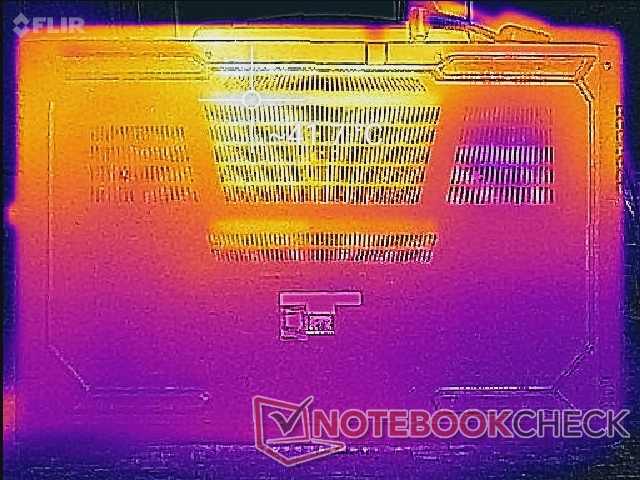
(-) La temperatura máxima en la parte superior es de 54.2 °C / 130 F, frente a la media de 40.4 °C / 105 F, que oscila entre 21.2 y 68.8 °C para la clase Gaming.
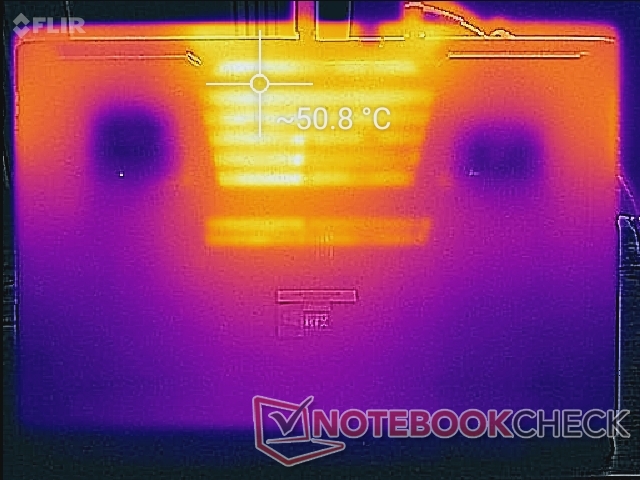
(-) El fondo se calienta hasta un máximo de 52.2 °C / 126 F, frente a la media de 43.2 °C / 110 F
(+) En reposo, la temperatura media de la parte superior es de 31.5 °C / 89# F, frente a la media del dispositivo de 33.9 °C / 93 F.
(±) Jugando a The Witcher 3, la temperatura media de la parte superior es de 36.1 °C / 97 F, frente a la media del dispositivo de 33.9 °C / 93 F.
(+) Los reposamanos y el panel táctil alcanzan como máximo la temperatura de la piel (32.6 °C / 90.7 F) y, por tanto, no están calientes.
(-) La temperatura media de la zona del reposamanos de dispositivos similares fue de 28.8 °C / 83.8 F (-3.8 °C / -6.9 F).
Prueba de esfuerzo
Cuando se estresa con Prime95, la CPU se dispara a 4,1 GHz durante los primeros segundos antes de caer y finalmente fluctuar en el rango de 3,2 GHz a 3,8 GHz. La temperatura del núcleo alcanzó algo más de 90 C en comparación con los 76 C del Ryzen 7 Asus ROG Strix G17 G713QE en condiciones similares.
La ejecución de Witcher 3 es más representativo del estrés de los juegos en el mundo real. Nuestra CPU y GPU se estabilizan a 80 C cada una con un consumo TGP estable de 130 W en vez del objetivo de 165 W. Este déficit podría explicar por qué nuestro Maingear queda por detrás del Schenker Ultra 17 aunque ambos estén equipados con GPUs RTX 3080 de 165 W. Activar el modo Fan Boost no parece mejorar el rendimiento gráfico o las temperaturas en absoluto ya que el modo simplemente pone las RPM del ventilador al máximo independientemente de la carga de procesado.
El uso de la batería limitará mucho el rendimiento, incluso cuando esté en modo Turbo. Una prueba de Fire Strike con baterías arrojaría puntuaciones de Física y Gráficos de sólo 6513 y 2345 puntos, respectivamente, en comparación con 22907 y 29194 puntos cuando está conectado a la red eléctrica.
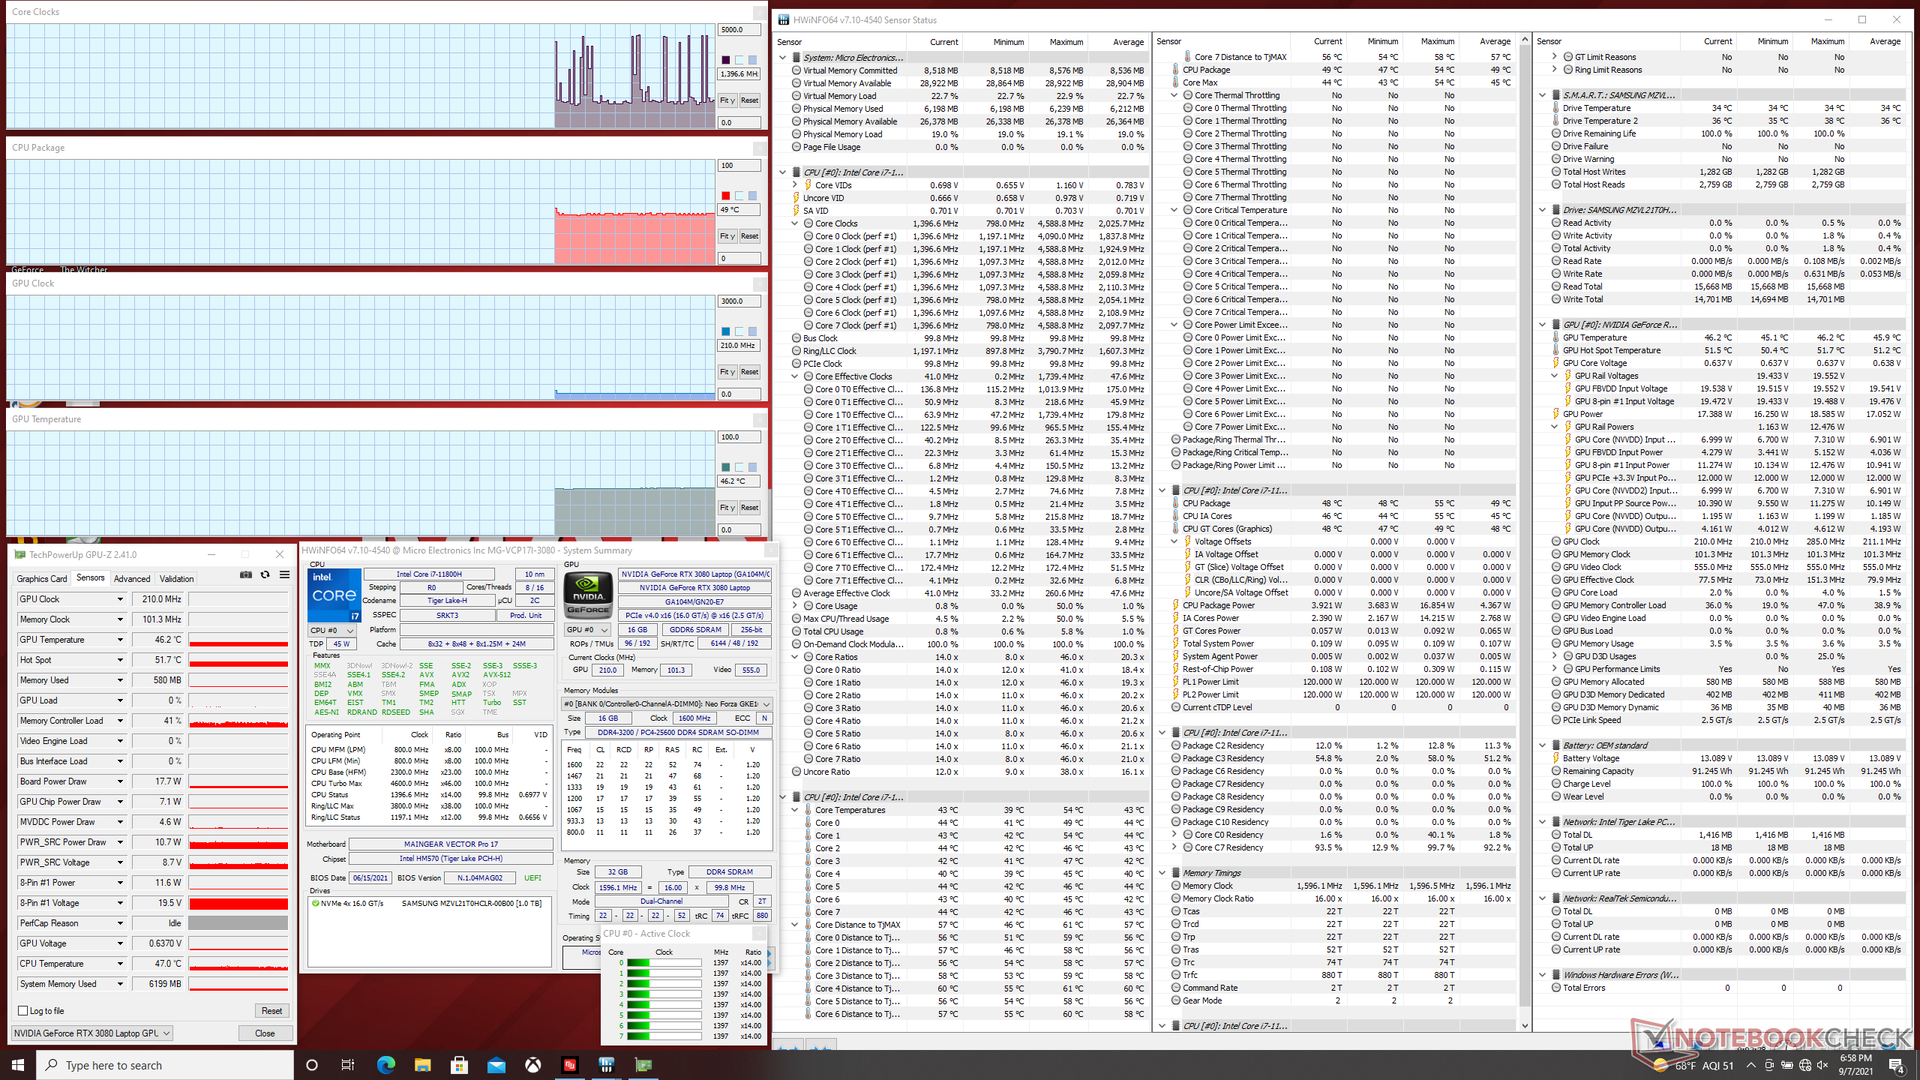
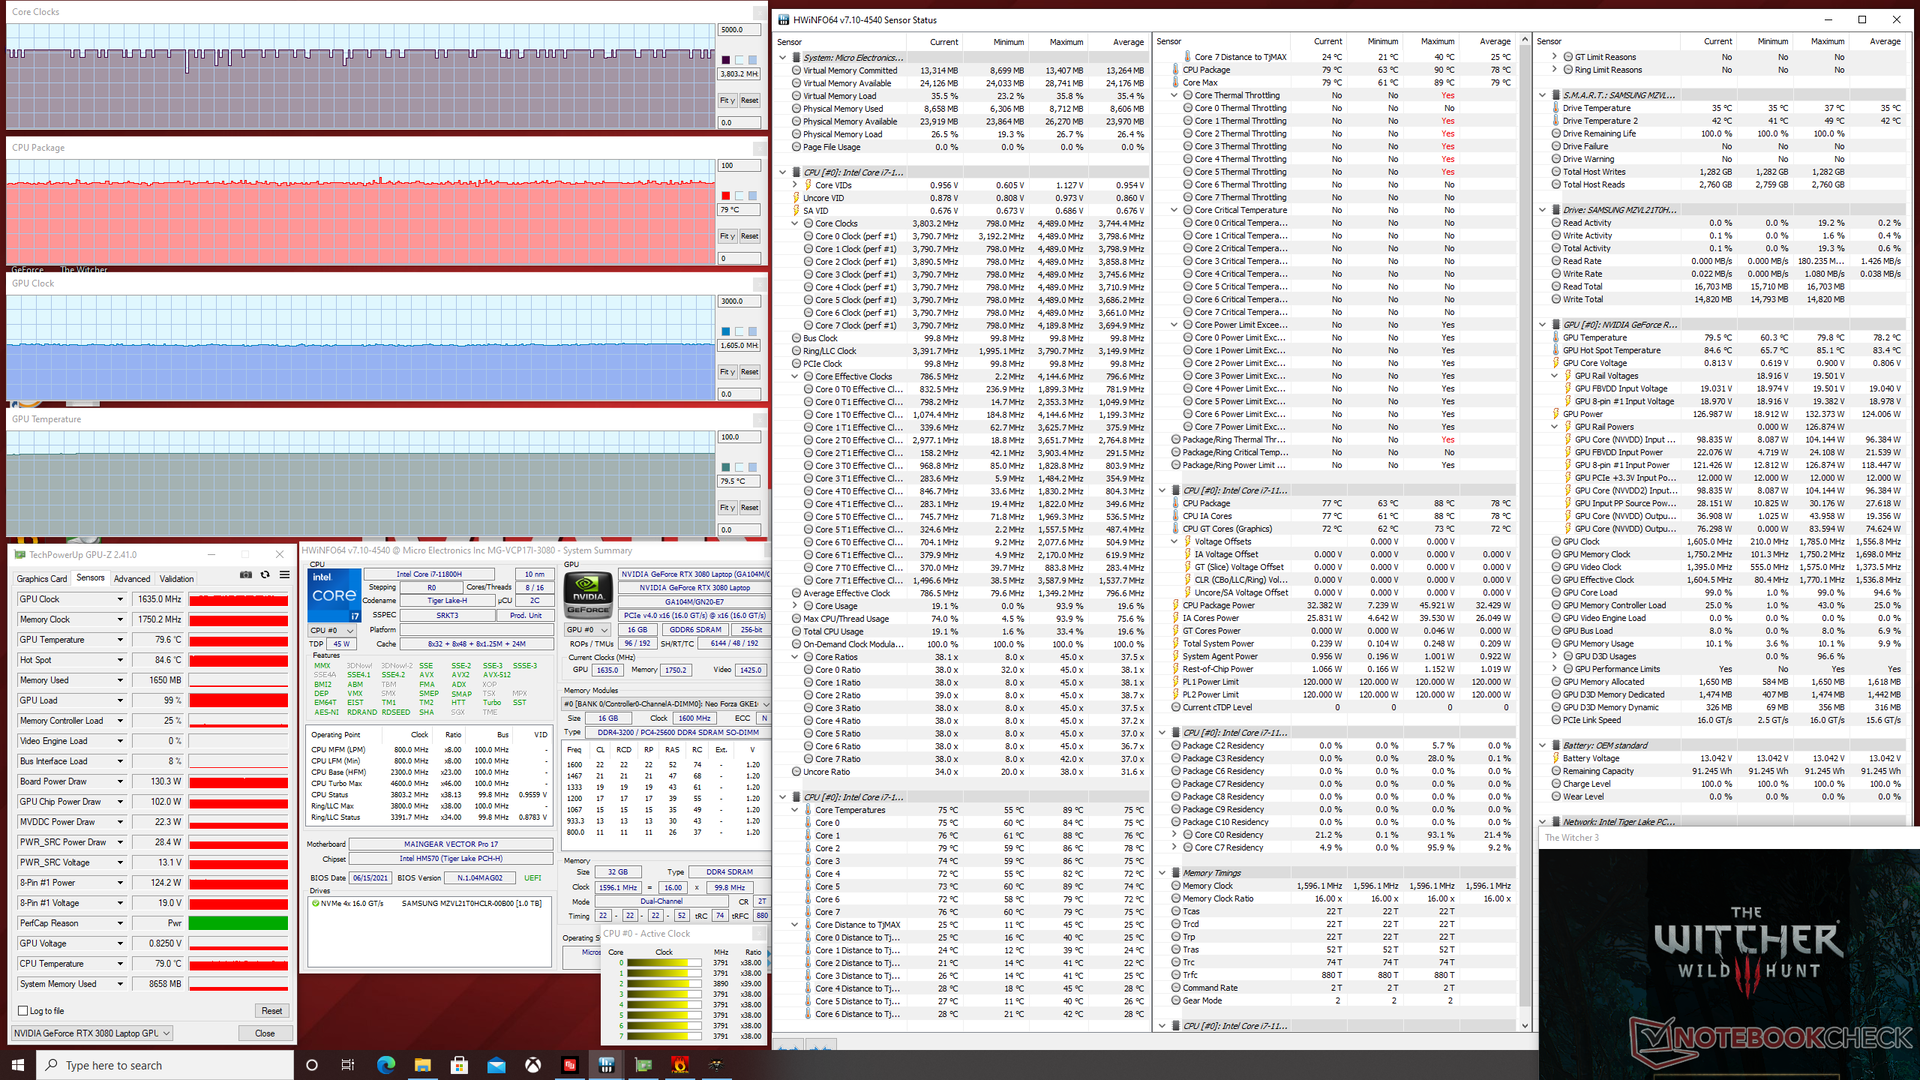
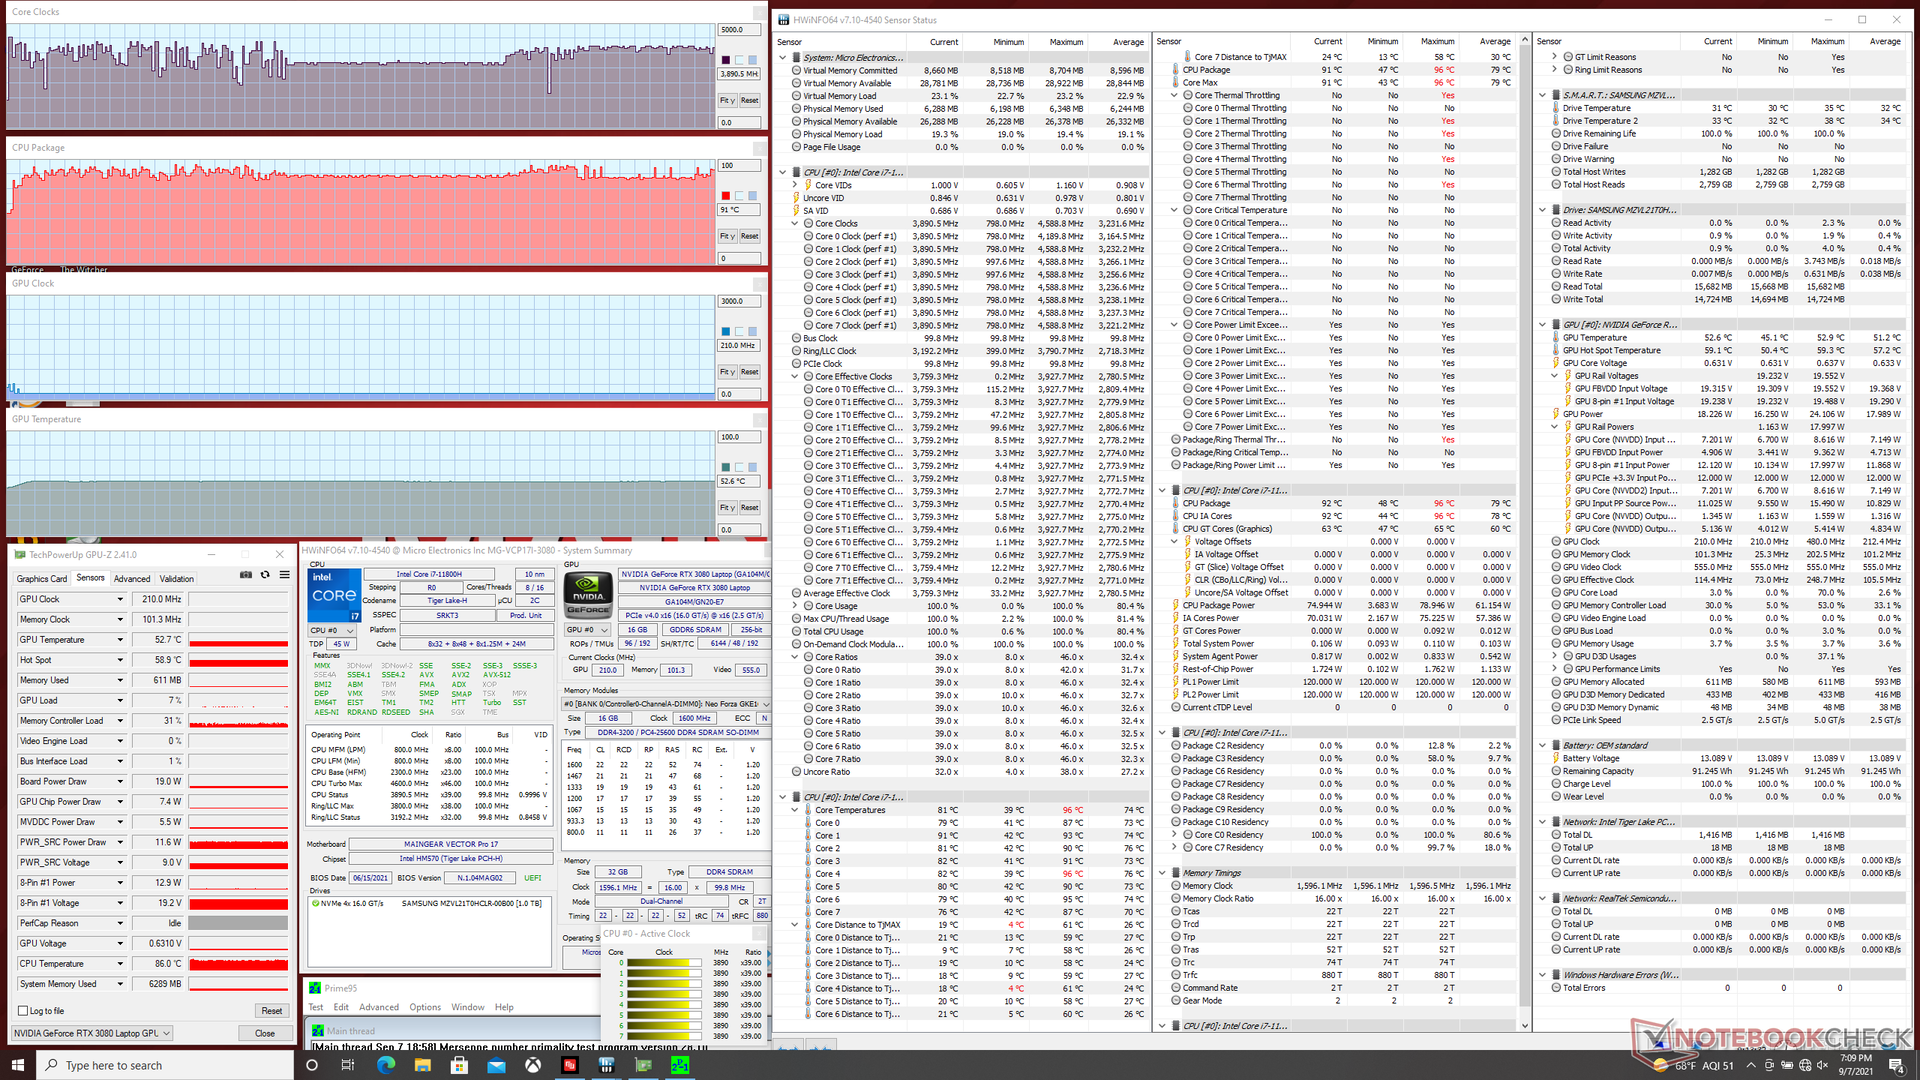
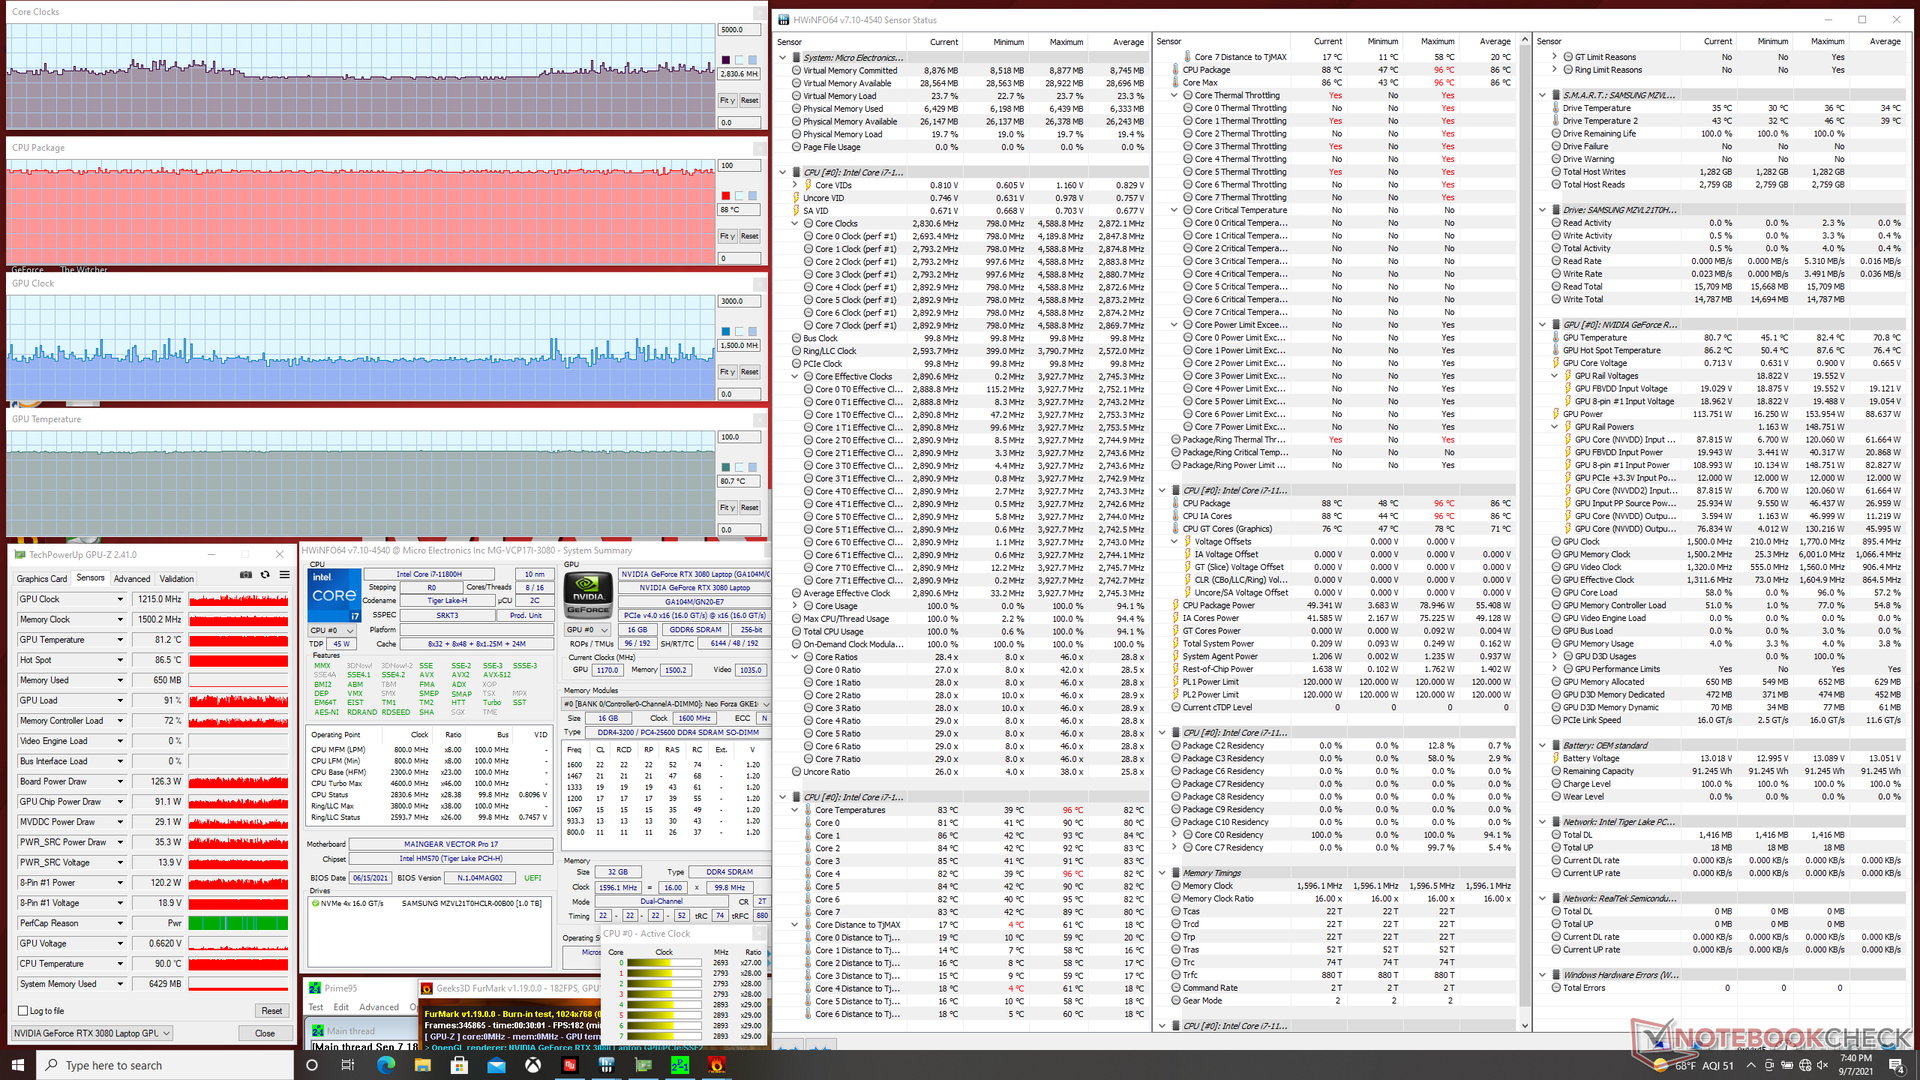
| Relojde la CPU(GHz) | Reloj dela GPU(MHz) | Temperatura media de la CPU (°C) | Temperaturamediade la GPU (°C) | |
| Sistema en reposo | 49 | 46 | ||
| EstrésPrime95 | 3,2 - 3,8 | -- | 91 | 53 |
| Estrés de Prime95+ FurMark | 2,8 - 3,2 | 1100 - 1770 | 88 | 81 |
| Witcher 3 Tensión | 3,4 - 3,8 | 1635 | 79 | 80 |
Altavoces


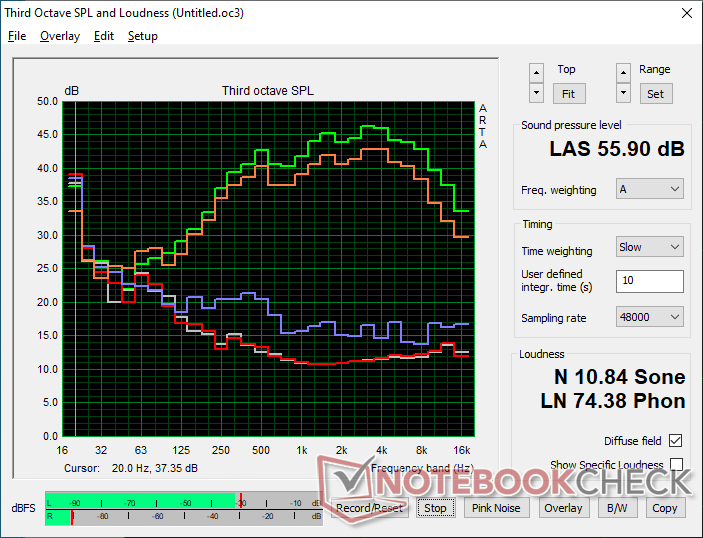
Maingear Vector Pro MG-VCP17 análisis de audio
(±) | la sonoridad del altavoz es media pero buena (75.5 dB)
Graves 100 - 315 Hz
(-) | casi sin bajos - de media 19.3% inferior a la mediana
(±) | la linealidad de los graves es media (11.7% delta a frecuencia anterior)
Medios 400 - 2000 Hz
(+) | medios equilibrados - a sólo 2.1% de la mediana
(+) | los medios son lineales (4.5% delta a la frecuencia anterior)
Altos 2 - 16 kHz
(+) | máximos equilibrados - a sólo 3.4% de la mediana
(+) | los máximos son lineales (6.6% delta a la frecuencia anterior)
Total 100 - 16.000 Hz
(±) | la linealidad del sonido global es media (17.5% de diferencia con la mediana)
En comparación con la misma clase
» 49% de todos los dispositivos probados de esta clase eran mejores, 12% similares, 39% peores
» El mejor tuvo un delta de 6%, la media fue 18%, el peor fue ###max##%
En comparación con todos los dispositivos probados
» 34% de todos los dispositivos probados eran mejores, 8% similares, 58% peores
» El mejor tuvo un delta de 4%, la media fue 23%, el peor fue ###max##%
Apple MacBook 12 (Early 2016) 1.1 GHz análisis de audio
(+) | los altavoces pueden reproducir a un volumen relativamente alto (#83.6 dB)
Graves 100 - 315 Hz
(±) | lubina reducida - en promedio 11.3% inferior a la mediana
(±) | la linealidad de los graves es media (14.2% delta a frecuencia anterior)
Medios 400 - 2000 Hz
(+) | medios equilibrados - a sólo 2.4% de la mediana
(+) | los medios son lineales (5.5% delta a la frecuencia anterior)
Altos 2 - 16 kHz
(+) | máximos equilibrados - a sólo 2% de la mediana
(+) | los máximos son lineales (4.5% delta a la frecuencia anterior)
Total 100 - 16.000 Hz
(+) | el sonido global es lineal (10.2% de diferencia con la mediana)
En comparación con la misma clase
» 7% de todos los dispositivos probados de esta clase eran mejores, 2% similares, 90% peores
» El mejor tuvo un delta de 5%, la media fue 18%, el peor fue ###max##%
En comparación con todos los dispositivos probados
» 5% de todos los dispositivos probados eran mejores, 1% similares, 94% peores
» El mejor tuvo un delta de 4%, la media fue 23%, el peor fue ###max##%
Energy Management
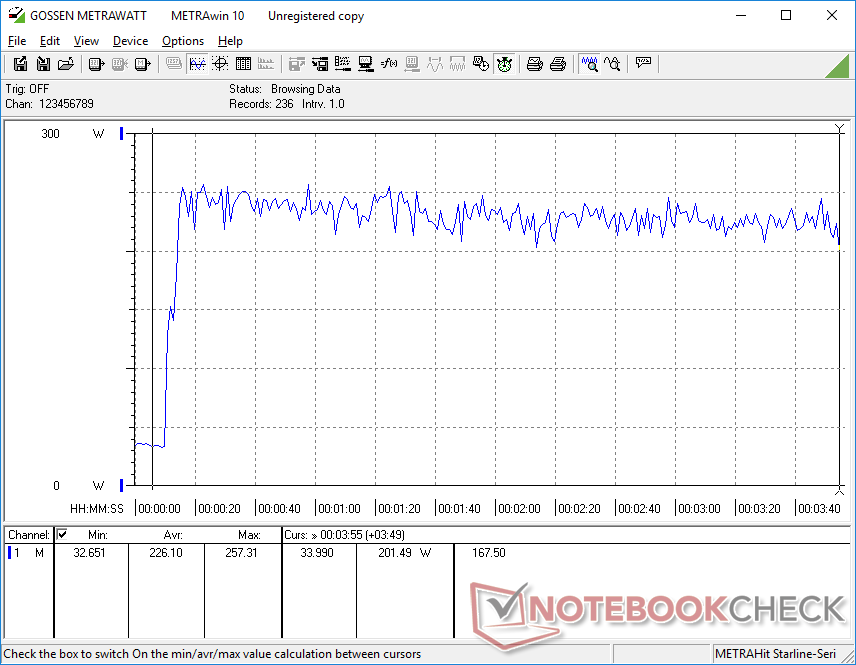
Consumo de energía
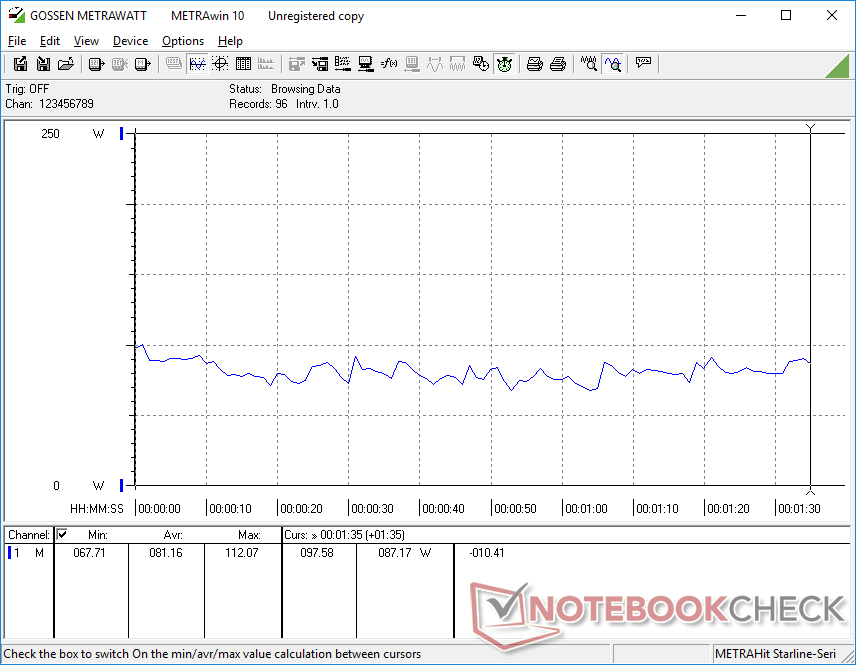
El ralentí en el escritorio en el modo Turbo y con la dGPU activa puede consumir hasta 34 W en comparación con sólo 16 W en el modo Optimus. Por tanto, merece la pena bajar el nivel de rendimiento si no se necesita la energía extra.
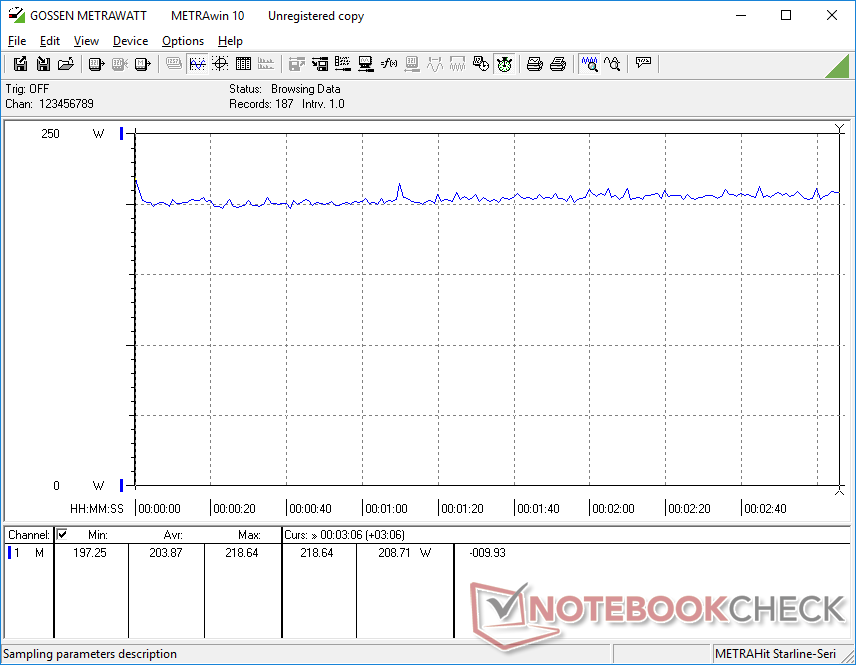
Si se ejecuta Witcher 3 consume un poco más de energía que en la mayoría de otros portátiles GeForce RTX de 17,3 pulgadas para correlacionar con el rendimiento gráfico más rápido de nuestro Maingear con RTX 3080. El Schenker XMG Core 17 con gráficos RTX 3060, por ejemplo, consume alrededor de un 15 por ciento menos de energía mientras ofrece un rendimiento gráfico un 25 por ciento más lento que nuestro RTX 3080.
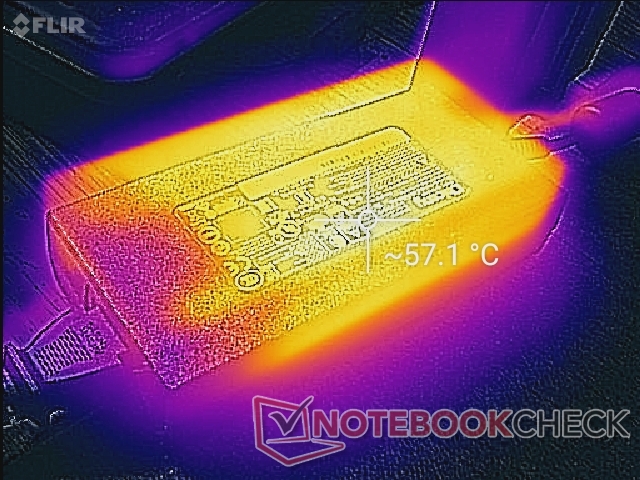
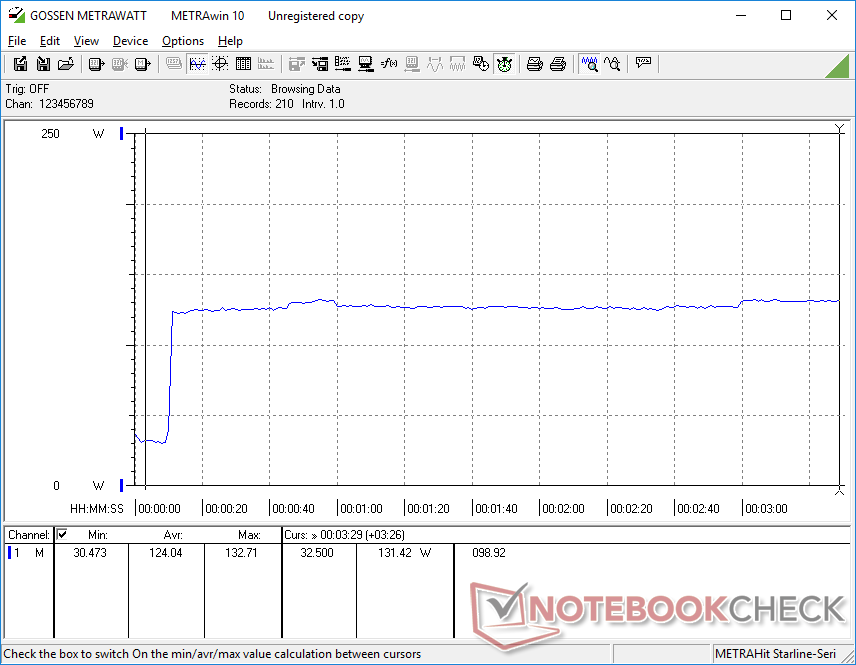
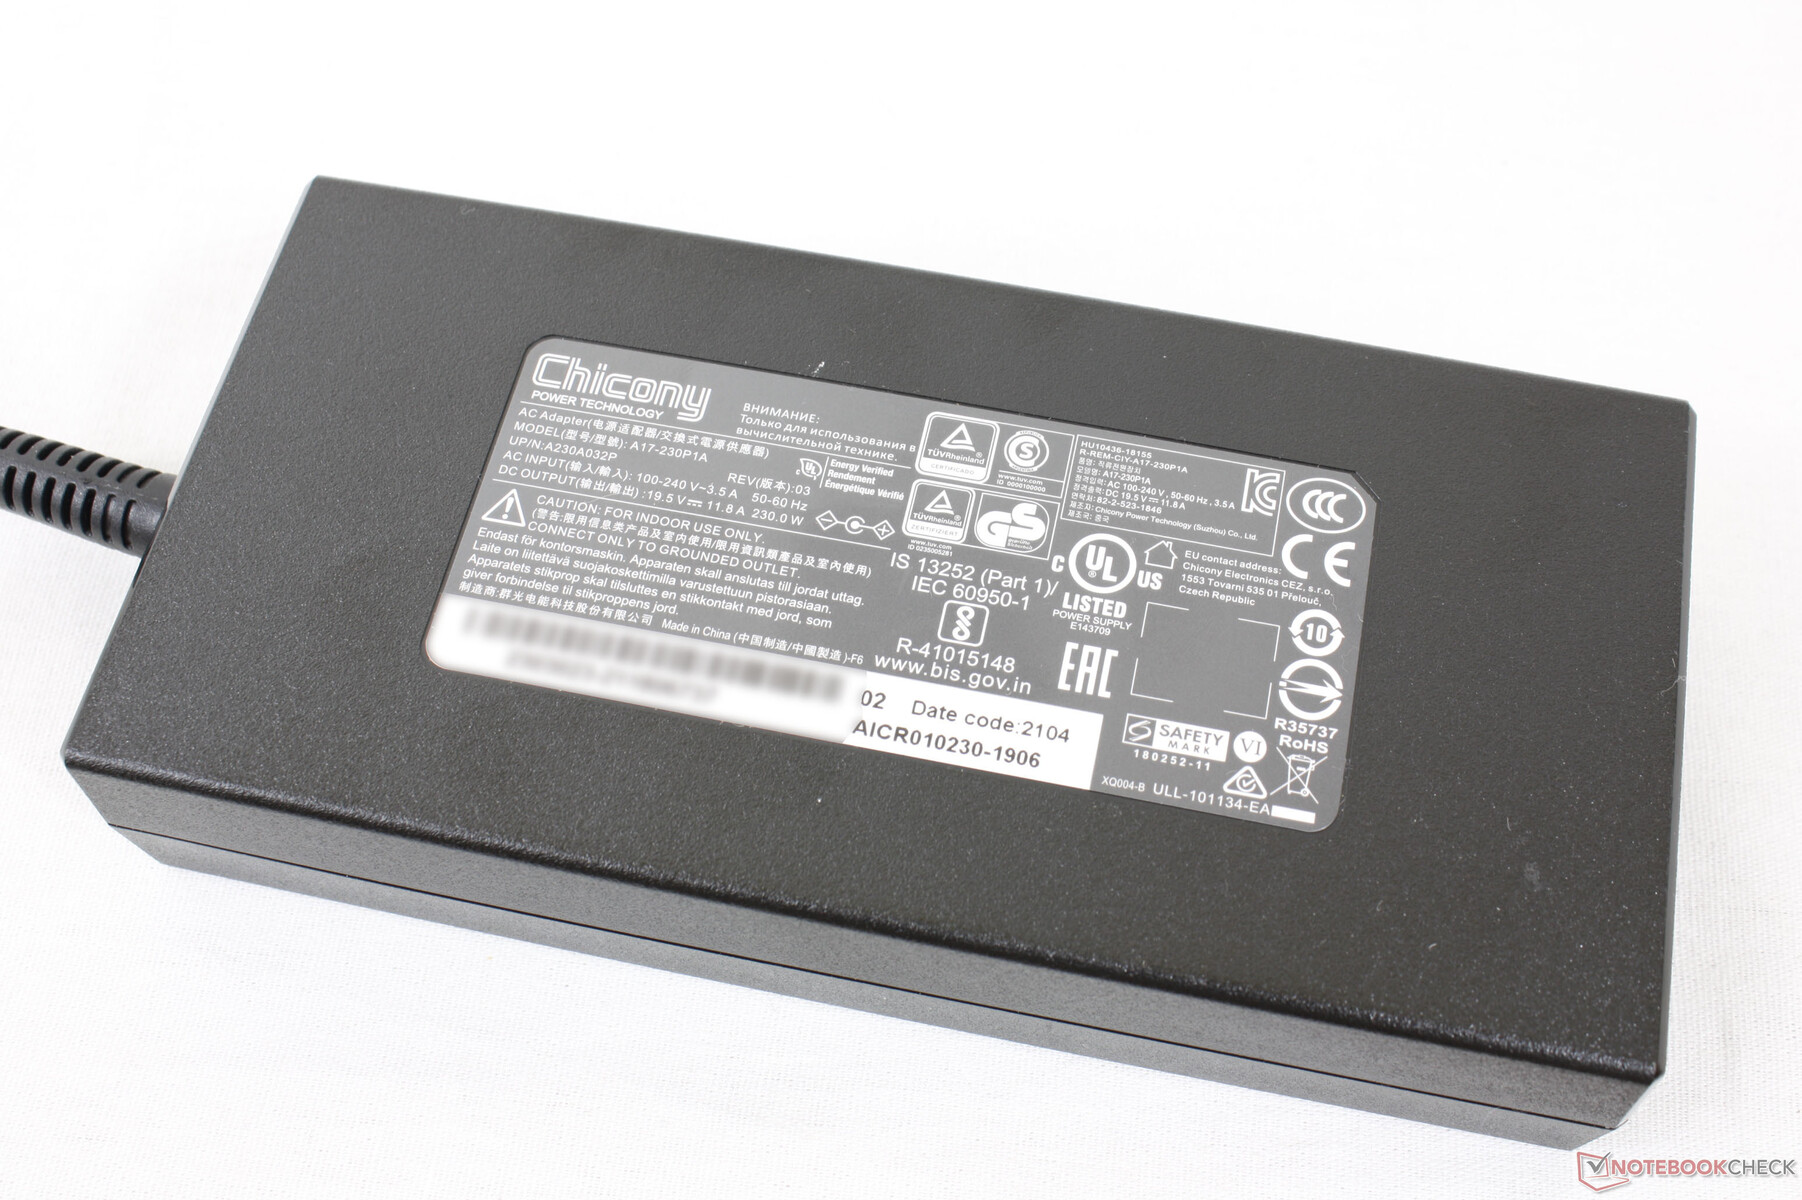
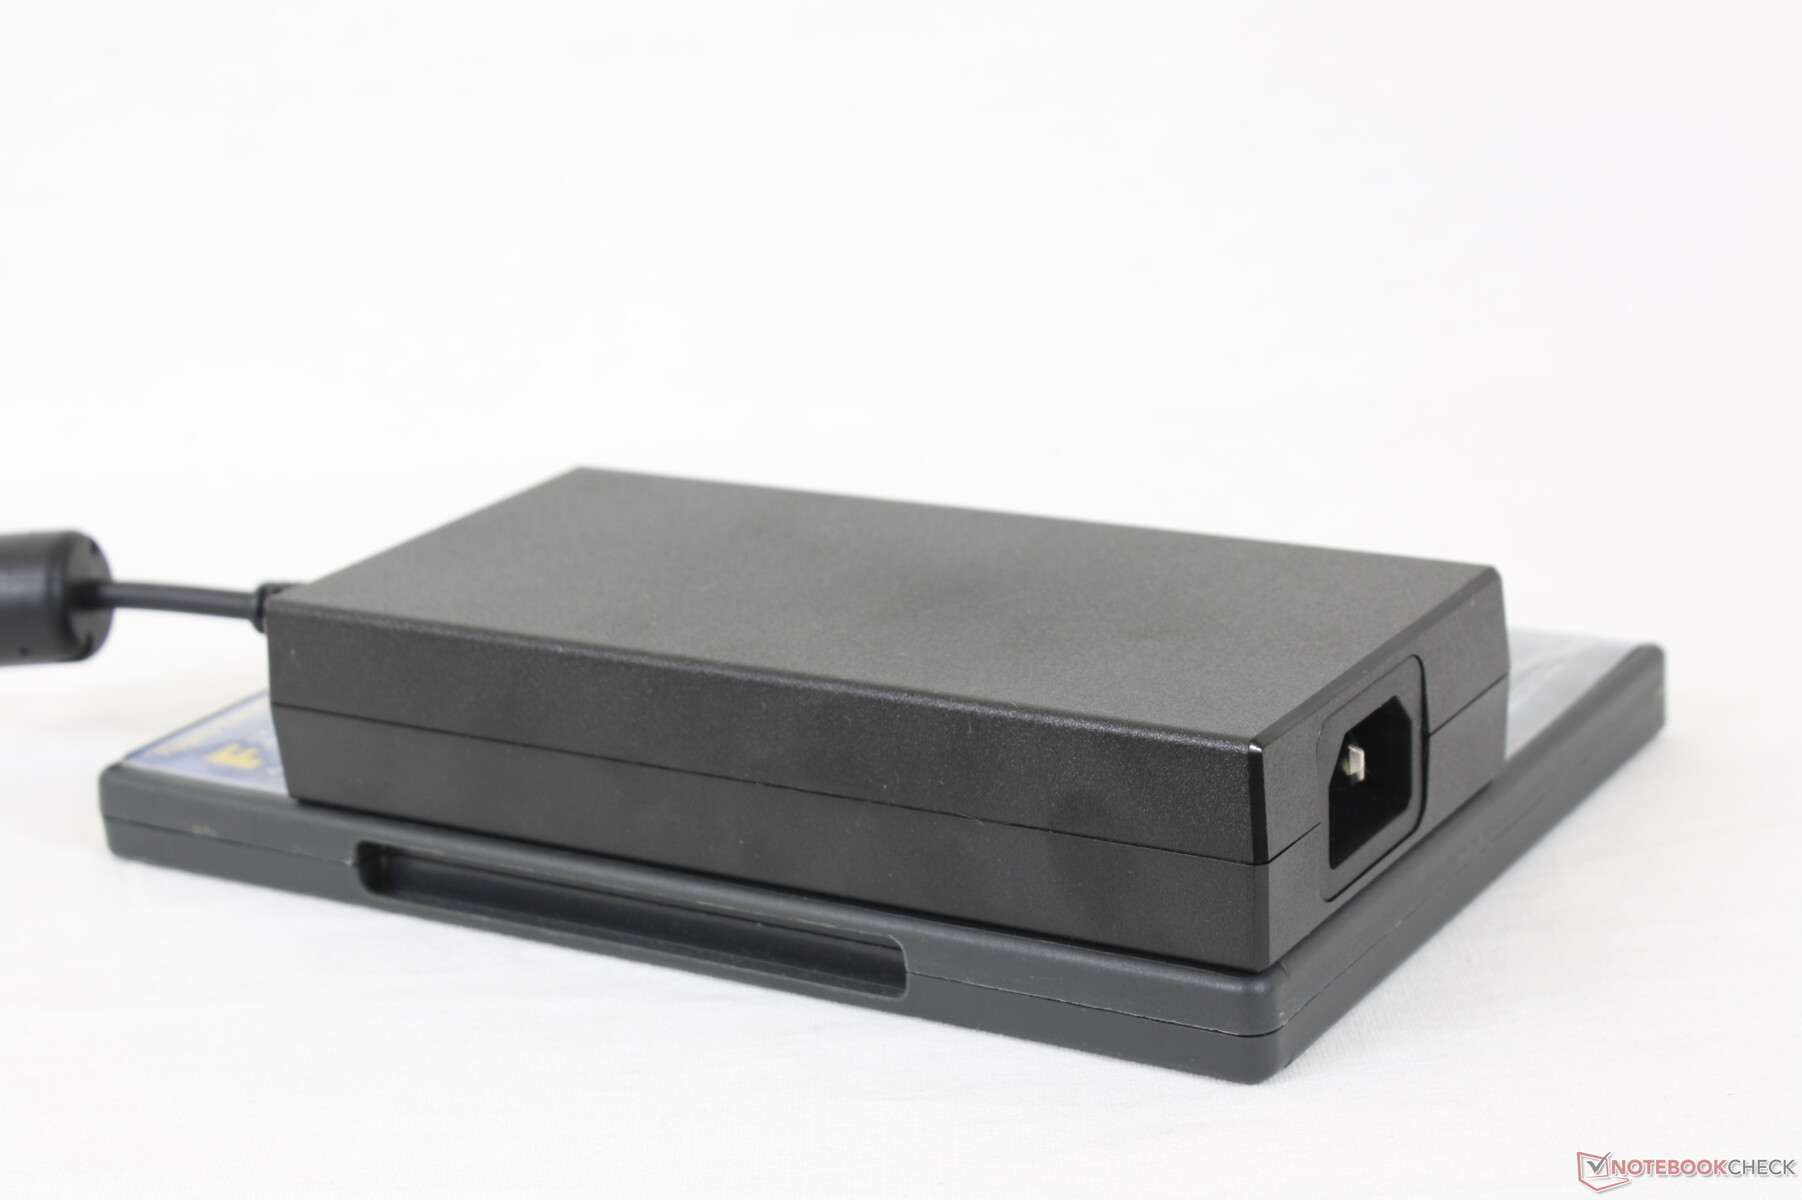
Registramos un consumo máximo de 257 W con el adaptador de CA de 240 W de tamaño medio (~15,3 x 7,4 x 3 cm) al ejecutar Prime95 y FurMark simultáneamente. Por lo tanto, el sistema podría haberse beneficiado de un adaptador de CA más grande y con mayor potencia. Afortunadamente, la ejecución de juegos no agota la batería cuando se conecta a una toma de corriente a diferencia de algunos de los primeros modelos de Dell XPS 17.
| Off / Standby | |
| Ocioso | |
| Carga |
|
Clave:
min: | |
| Maingear Vector Pro MG-VCP17 i7-11800H, GeForce RTX 3080 Laptop GPU, Samsung PM9A1 MZVL21T0HCLR, IPS, 2560x1440, 17.3" | Asus ROG Zephyrus S17 GX703HSD i9-11900H, GeForce RTX 3080 Laptop GPU, Samsung PM9A1 MZVL22T0HBLB, IPS, 2560x1440, 17.3" | Schenker XMG Core 17 (Early 2021) i7-10870H, GeForce RTX 3060 Laptop GPU, Samsung SSD 970 EVO Plus 1TB, IPS, 2560x1440, 17.3" | Schenker XMG Neo 17 (Early 2021, RTX 3070, 5800H) R7 5800H, GeForce RTX 3070 Laptop GPU, Samsung SSD 970 EVO Plus 500GB, IPS, 2560x1440, 17.3" | Schenker Compact 17 i7-10875H, GeForce RTX 2070 Super Mobile, Samsung SSD 970 EVO Plus 1TB, IPS, 3840x2160, 17.3" | MSI GS75 10SF-609US i7-10875H, GeForce RTX 2070 Max-Q, WDC PC SN730 SDBPNTY-512G, IPS, 1920x1080, 17.3" | |
|---|---|---|---|---|---|---|
| Power Consumption | -30% | 1% | -7% | -9% | -21% | |
| Idle Minimum * (Watt) | 11 | 21.7 -97% | 13 -18% | 13 -18% | 13.6 -24% | 19.2 -75% |
| Idle Average * (Watt) | 15.6 | 27 -73% | 16 -3% | 16 -3% | 19.8 -27% | 22.4 -44% |
| Idle Maximum * (Watt) | 34 | 33 3% | 29 15% | 26 24% | 23.5 31% | 34.7 -2% |
| Load Average * (Watt) | 81.2 | 108 -33% | 100 -23% | 125 -54% | 105 -29% | 106.7 -31% |
| Witcher 3 ultra * (Watt) | 204 | 195 4% | 173 15% | 187 8% | 160.5 21% | |
| Load Maximum * (Watt) | 257.3 | 210 18% | 213 17% | 259 -1% | 243 6% | 248.7 3% |
* ... más pequeño es mejor
Power Consumption Witcher 3 / Stresstest
Duración de la batería
La capacidad de la batería es grande, 91 Wh, a pesar del delgado diseño del chasis. Pudimos exprimir casi 7 horas de uso real de la WLAN con una carga completa cuando el sistema está en modo iGPU.
La carga desde el vacío hasta la capacidad total tarda algo menos de 2 horas.
| Maingear Vector Pro MG-VCP17 i7-11800H, GeForce RTX 3080 Laptop GPU, 91 Wh | Asus ROG Zephyrus S17 GX703HSD i9-11900H, GeForce RTX 3080 Laptop GPU, 90 Wh | Schenker XMG Core 17 (Early 2021) i7-10870H, GeForce RTX 3060 Laptop GPU, 62 Wh | Schenker XMG Neo 17 (Early 2021, RTX 3070, 5800H) R7 5800H, GeForce RTX 3070 Laptop GPU, 62 Wh | Schenker Compact 17 i7-10875H, GeForce RTX 2070 Super Mobile, 62 Wh | MSI GS75 10SF-609US i7-10875H, GeForce RTX 2070 Max-Q, 80.25 Wh | |
|---|---|---|---|---|---|---|
| Duración de Batería | 9% | -29% | -49% | -32% | -29% | |
| WiFi v1.3 (h) | 6.9 | 7.5 9% | 4.9 -29% | 3.5 -49% | 4.7 -32% | 4.9 -29% |
| Witcher 3 ultra (h) | 1 | |||||
| Load (h) | 2.7 | 1.3 | 0.7 | 4.1 | ||
| Reader / Idle (h) | 7.7 | 4.7 | 8.6 |
Pro
Contra
Veredicto - Excelente equilibrio entre peso y rendimiento
¿Puede realmente funcionar una GPU TGP de 165 W en un chasis del tamaño de un Razer Blade Pro con 500 gramos menos? Nuestras pruebas muestran que la GPU en el Maingear rondará los 130 W en cambio cuando se juega, lo que está en la media si se tienen en cuenta otros portátiles RTX 3080 que hay actualmente en el mercado. Si quieres maximizar el rendimiento de la RTX 3080, entonces tendrás que seguir considerando portátiles más voluminosos como el Schenker XMG Ultra 17
El sistema Maingear también podría utilizar algunas mejoras en cuanto a la rigidez de las bisagras. Mientras que su base se siente más robusta que la de un Asus Zephyrus S, sus bisagras podrían haber sido más rígidas para una mejor sensación de longevidad y calidad. Los ventiladores también son muy ruidosos cuando se juega, pero ese es un rasgo que comparten otros portátiles de juego ultradelgados, por lo que no podemos culpar al Vector Pro de forma exclusiva por su ruido
Potente y sorprendentemente ligero para su tamaño. Se han omitido algunas características menores, pero el núcleo del sistema, la pantalla, el rendimiento y la capacidad de expansión son sólidos.
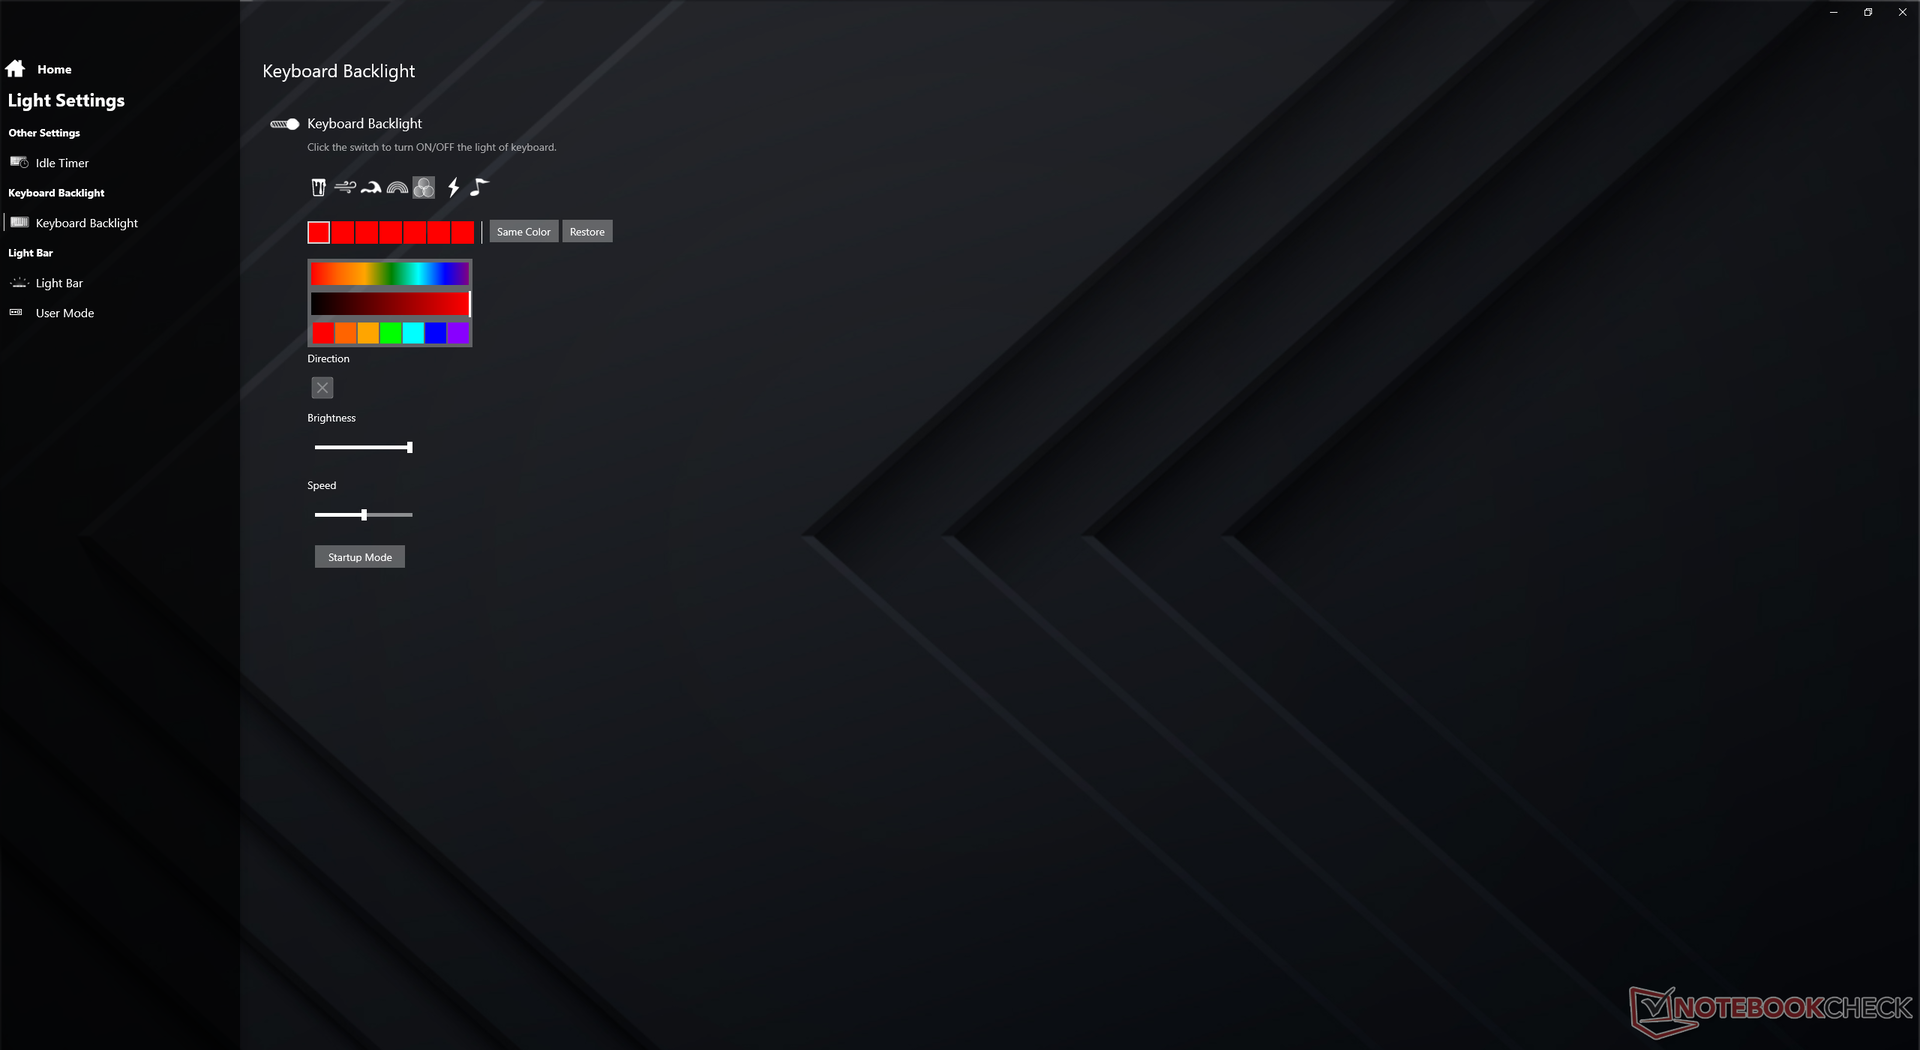
La larga duración de la batería y la facilidad de actualización son menciones dignas para un portátil de juegos ultradelgado. Para futuros modelos, nos encantaría ver iluminación RGB por tecla, USB-C PD, altavoces más potentes y un obturador de cámara web, todo lo cual se está convirtiendo en estándar en los modelos de gama alta.
Precio y disponibilidad
Nuestra configuración exacta se puede encontrar actualmente en Amazon por 2499 dólares, mientras que la RTX 3070 de menor tamaño se vende por 2099 dólares.
Maingear Vector Pro MG-VCP17
- 09/10/2021 v7 (old)
Allen Ngo
Price comparison

