Análisis para el AMD Ryzen 7 3750H procesador
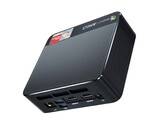
Análisis del mini PC Beelink SER3: El antiguo Ryzen 7 3750H tiene sus usos
Si Intel no es lo tuyo, el SER3 con tecnología AMD puede ofrecer un nivel de rendimiento similar al de la antigua serie Core-U de 8ª generación, pero con un coste algo inferior. También viene con opciones de almacenamiento y RAM duales para facilitar las actualizaciones en el futuro.
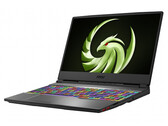
AMD Ryzen 7 3750H, Vega 10, 492 gReview del portátil MSI Alpha 15 A3DDK: Un portátil para juegos de gama media y hambriento de energía
El equipo de AMD del Alpha 15 ejecuta todos los juegos actuales sin problemas en la pantalla mate del dispositivo, FHD, IPS, 144 Hz y compatible con FreeSync de 15,6 pulgadas. Sin embargo, sus requisitos de potencia comparativamente altos pasan factura.
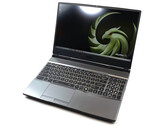
AMD Ryzen 7 3750H, Radeon RX 5500M, 15.6", 2.3 kgReview de MSI Alpha 15 Hands-On Gaming Laptop: Ryzen y Navi en lugar de Intel y NVIDIA
AMD regresó al negocio de la CPU con su serie Ryzen no sólo en ordenadores de sobremesa sino también en portátiles. La empresa realizó una incursión similar en el mercado de las GPU con sus tarjetas de sobremesa Navi a principios de este año, una iniciativa que está intentando replicar en los portátiles con sus GPU Navi 14. NVIDIA ha dominado la gama media superior de las GPU para portátiles durante un tiempo, pero AMD quiere cambiar esta situación y ofrecer a los consumidores más posibilidades de elección en el proceso. Siga leyendo para saber lo que pensamos de uno de los primeros portátiles de AMD.
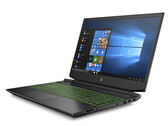
AMD Ryzen 7 3750H, Radeon RX 5500M, 15.6", 2.3 kgReview de HP Pavilion Gaming 15: El portátil de 15,6 pulgadas de HP combina destreza para juegos y resistencia
HP Pavilion Gaming 15 ejecuta todos los juegos actuales sin problemas y los muestra en su pantalla mate de 15,6 pulgadas (FHD, IPS). El portátil está bien equipado: 16 GB de RAM (modo de dos canales), NVMe SSD, HDD. Sorprendentemente, la duración de la batería es excelente.
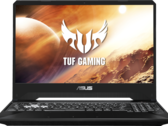
AMD Ryzen 7 3750H, NVIDIA GeForce GTX 1660 Ti Max-Q, 15.6", 2.3 kgNo se requiere información de Intel: Review del portátil Asus TUF FX505DT con Ryzen 7 y GeForce GTX 1650
Resulta que las GPUs Nvidia de gama media combinan muy bien con las últimas CPUs Ryzen H-series de AMD. Asus se está duplicando en aún más portátiles para juegos sin Intel que los jugadores con presupuestos ajustados deberían considerar.
AMD Ryzen 7 3750H, NVIDIA GeForce GTX 1650 Mobile, 15.6", 2.2 kgAsus ROG Zephyrus G15 GA502DU: NVIDIA GeForce GTX 1660 Ti Max-Q, 15.60", 2.1 kg
análise » Review del Asus ROG Zephyrus G GA502DU (Ryzen 7 3750H, GTX 1660 Ti Max-Q)
Asus TUF FX505DT-HN540: NVIDIA GeForce GTX 1650 Mobile, 15.60", 2.2 kg
análise externo » Asus TUF FX505DT-HN540
Asus TUF FX505DT-BQ613T: NVIDIA GeForce GTX 1650 Mobile, 15.60", 2.2 kg
análise externo » Asus TUF FX505DT-BQ613T
Asus TUF FX505DV-AL116: NVIDIA GeForce RTX 2060 Mobile, 15.60", 2.2 kg
análise externo » Asus TUF FX505DV-AL116
Asus TUF FX505DT-BQ600: NVIDIA GeForce GTX 1650 Mobile, 15.60", 2.2 kg
análise externo » Asus TUF FX505DT-BQ600
Asus TUF FX505DT-BQ208: NVIDIA GeForce GTX 1650 Mobile, 15.60", 2.2 kg
análise externo » Asus TUF FX505DT-BQ208
Acer Aspire 7 A715-41G-R3J5: NVIDIA GeForce GTX 1650 Mobile, 15.60", 2.4 kg
análise externo » Acer Aspire 7 A715-41G-R3J5
HP Pavilion Gaming 15-ec0012ng: NVIDIA GeForce GTX 1660 Ti Mobile, 15.60", 2.3 kg
análise externo » HP Pavilion Gaming 15-ec0012ng
HP Pavilion Gaming 15-ec0014nl: NVIDIA GeForce GTX 1650 Mobile, 15.60", 2.3 kg
análise externo » HP Pavilion Gaming 15-ec0014nl
HP Gaming Pavilion 15-ec0001ns: AMD Radeon RX Vega 10, 15.60", 2.3 kg
análise externo » HP Gaming Pavilion 15-ec0001ns
Asus TUF FX505DT-BQ121: NVIDIA GeForce GTX 1650 Mobile, 15.60", 2.2 kg
análise externo » Asus TUF FX505DT-BQ121
HP Pavilion Gaming 15-ec0003ns: NVIDIA GeForce GTX 1650 Mobile, 15.60", 2.3 kg
análise externo » HP Pavilion Gaming 15-ec0003ns
Asus ROG Zephyrus G15 GA502DU-BQ015T: NVIDIA GeForce GTX 1660 Ti Max-Q, 15.60", 2.1 kg
análise externo » Asus Zephyrus G15 GA502DU-BQ015T
MSI Alpha 15 A3DDK-007NL: AMD Radeon RX 5500M, 15.60", 2.3 kg
análise externo » MSI Alpha 15 A3DDK-007NL
Asus TUF Gaming FX505DV-AL014: NVIDIA GeForce RTX 2060 Mobile, 15.60", 2.2 kg
análise externo » Asus TUF Gaming FX505DV-AL014
HP Pavilion Gaming 15-ec0022ax: NVIDIA GeForce GTX 1660 Ti Mobile, 15.60", 2 kg
análise externo » HP Pavilion Gaming 15-ec0022ax
MSI Alpha 15 A3DDK-001XES: AMD Radeon RX 5500M, 15.60", 2.3 kg
análise externo » MSI Alpha 15 A3DDK-001XES
Asus TUF FX505DD: NVIDIA GeForce RTX 2060 Mobile, 15.60", 2.2 kg
análise externo » Asus TUF FX505DD
Asus TUF FX505DD-BQ067: NVIDIA GeForce GTX 1050 Mobile, 15.60", 2.2 kg
análise externo » Asus TUF FX505DD-BQ067
HP Pavilion Gaming 15-ec0017ng: NVIDIA GeForce GTX 1660 Ti Max-Q, 15.60", 2.3 kg
análise externo » HP Pavilion Gaming 15-ec0017ng
Asus TUF FX505DV-BQ099T: NVIDIA GeForce RTX 2060 Mobile, 15.60", 2.2 kg
análise externo » Asus TUF FX505DV-BQ099T
MSI Alpha 15 A3DDK: AMD Radeon RX 5500M, 15.60", 2.3 kg
análise externo » MSI Alpha 15 A3DDK
Asus TUF FX505DV-AL019: NVIDIA GeForce RTX 2060 Mobile, 15.60", 2.3 kg
análise externo » Asus TUF FX505DV-AL019
Asus ROG Zephyrus G15 GA502DU-BQ015: NVIDIA GeForce GTX 1660 Ti Mobile, 15.60", 2.1 kg
análise externo » Asus ROG Zephyrus G GA502DU-BQ015
Asus TUF Gaming FX505DU-AL085T: NVIDIA GeForce GTX 1660 Ti Mobile, 15.60", 2.2 kg
análise externo » Asus TUF Gaming FX505DU-AL085T
Asus TUF FX705DU-AU029T: NVIDIA GeForce GTX 1660 Ti Mobile, 17.30", 2.7 kg
análise externo » Asus TUF FX705DU-AU029T
Asus ROG Zephyrus G15 GA502DU-AL025T: NVIDIA GeForce GTX 1660 Ti Mobile, 15.60", 2.1 kg
análise externo » Asus Zephyrus G GA502DU-AL025T
Asus TUF FX705DT-AU028T: NVIDIA GeForce GTX 1650 Mobile, 17.30", 2.6 kg
análise externo » Asus TUF FX705DT-AU028T
Asus TUF FX505DT-EB73: NVIDIA GeForce GTX 1650 Mobile, 15.60", 2.2 kg
análise externo » Asus TUF FX505DT-EB73
Asus TUF FX505DU-BQ045: NVIDIA GeForce GTX 1660 Ti Mobile, 15.60", 2.2 kg
análise externo » Asus TUF FX505DU-BQ045
Asus TUF FX705DU-AU053T: NVIDIA GeForce GTX 1660 Ti Mobile, 17.30", 2.6 kg
análise externo » Asus TUF FX705DU-AU053T
Asus TUF FX705DU-AU019T: NVIDIA GeForce GTX 1660 Ti Mobile, 17.30", 2.6 kg
análise externo » Asus TUF FX705DU-AU019T
Asus TUF FX505DU-MB74: NVIDIA GeForce GTX 1660 Ti Mobile, 15.60", 2.2 kg
análise externo » Asus TUF FX505DU-MB74