Review del portátil Asus ROG Strix Scar 15 G532LWS: GeForce Supercharged

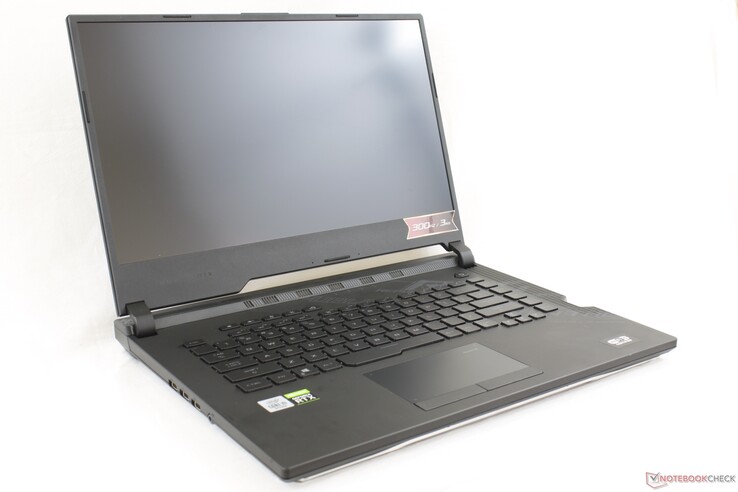
La serie ROG Strix Scar 15 G532 es la actualización de 2020 de la ROG Strix Scar 15 G531 del año pasado. Las diferencias son relativamente menores y en su mayoría internas con las esperadas actualizaciones de la CPU y la GPU de las opciones Comet Lake-H y GeForce RTX Super, respectivamente. El G532 es el hogar de los portátiles para juegos de gama media superior de Asus, directamente debajo de la serie insignia G703 pero muy por encima de la serie TUF. También hay disponible una versión de plástico menos equipada del G532, llamada G512 , y los usuarios que quieran algo más fino y ligero pueden optar por la serie Asus Zephyrus .
Las versiones van desde el CPU Core i7-10875H y la GPU GeForce RTX 2060 con pantalla de 240 Hz hasta el Core i9-10980HK y el RTX 2070 Super con pantalla de 300 Hz como la que se está revisando por 2800 dólares. Los competidores incluyen otras máquinas de juego de 15,6 pulgadas de alta gama como el MSI GE66, HP Omen X 2S, la serie Acer Predator o la serie Dell Alienware.
Más reviews Asus :
Valoración | Fecha | Modelo | Peso | Altura | Tamaño | Resolución | Precio |
|---|---|---|---|---|---|---|---|
| 84.4 % v7 (old) | 07/2020 | Asus ROG Strix Scar 15 G532LWS i9-10980HK, GeForce RTX 2070 Super Mobile | 2.4 kg | 24.9 mm | 15.60" | 1920x1080 | |
| 84.6 % v7 (old) | 12/2020 | MSI GE66 Raider 10SFS i9-10980HK, GeForce RTX 2070 Super Mobile | 2.4 kg | 23 mm | 15.60" | 1920x1080 | |
v (old) | 04/2020 | Acer Predator Triton 500 PT515-52-70N3 i7-10750H, GeForce RTX 2080 Super Max-Q | 2.1 kg | 18 mm | 15.60" | 1920x1080 | |
| 86 % v7 (old) | 05/2020 | Razer Blade 15 RZ09-0328 i7-10750H, GeForce RTX 2070 Max-Q | 2.1 kg | 19.9 mm | 15.60" | 3840x2160 | |
| 82.3 % v7 (old) | 09/2019 | HP Omen X 2S 15-dg0075cl i7-9750H, GeForce RTX 2070 Max-Q | 2.4 kg | 19.8 mm | 15.60" | 1920x1080 | |
| 82.1 % v7 (old) | 10/2019 | Asus Strix Scar III G531GW-AZ062T i7-9750H, GeForce RTX 2070 Mobile | 2.4 kg | 25 mm | 15.60" | 1920x1080 |
Top 10 Análisis
» Top 10 Portátiles Multimedia
» Top 10 Portátiles de Juego
» Top 10 Portátiles de Juego ligeros
» Top 10 Portátiles Asequibles de Oficina/Empresa
» Top 10 Portátiles de Juego Ligeros
» Top 10 Portátiles de Oficina/Empresa Premium
» Top 10 Estaciones de Trabajo
» Top 10 Subportátiles
» Top 10 Ultrabooks
» Top 10 Convertibles
» Top 10 Tablets
» Top 10 Tablets Windows
» Top 10 Tablets de menos de 250 Euros
» Top 10 Phablets (>5.5")
» Top 10 Smartphones
» Top 10 Smartphones (≤5")
» Top 10 Smartphones de menos de 300 Euros
» Top 10 Smartphones de menos de 120 Euros
» Top 10 Portátiles de menos de 1000 Euros
» Top 10 Portátiles de menos de 500 Euros
» Top 10 Portátiles de menos de 300 Euros
» Los Mejores Displays de Portátiles Analizados por Notebookcheck
Carcasa
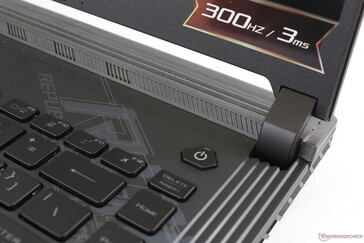
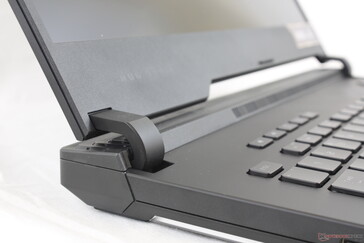
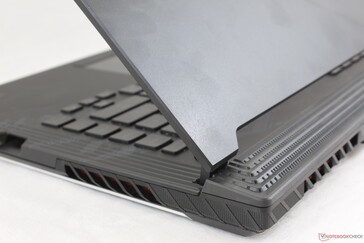
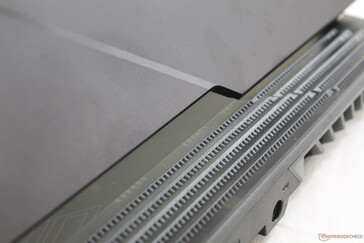
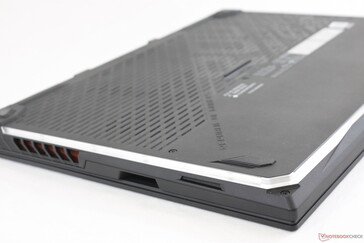
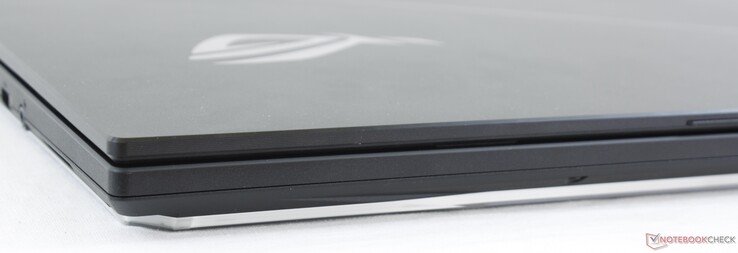
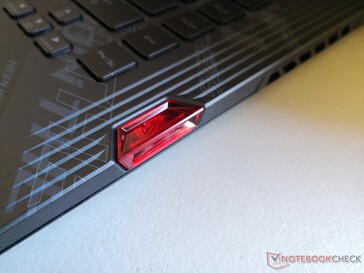
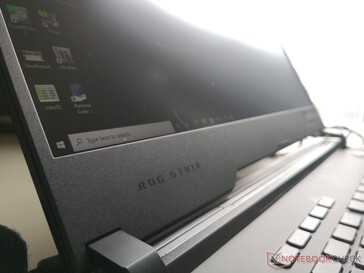
El diseño del chasis subyacente es el mismo que el de los Asus ROG G531, GL531 y G512, incluyendo la única barra de LED a lo largo de los bordes inferiores de la base. Las bisagras, el teclado, el estilo visual y la tapa de la pantalla sin cámara web son todos idénticos entre estos sistemas. Las únicas diferencias entre el G532 y el G531 son mayormente estéticas, como la nueva cubierta del teclado engomada y la tapa exterior mate, a diferencia del tablero de damas y las superficies de aluminio cepillado del modelo anterior. Los cambios hacen que el aspecto y la sensación sean más premium, aunque a costa de una acumulación más rápida de las huellas dactilares.
El tamaño y el peso del chasis se sitúan cómodamente entre el pequeño Zephyrus S GX531 y el grande ROG G703. Sin embargo, la parte trasera extendida hace que el G532 sea notablemente más grande que algunos de sus competidores más cercanos, incluyendo el MSI GE66 y el HP Omen X 2S.
Conectividad
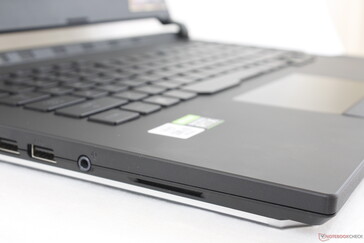
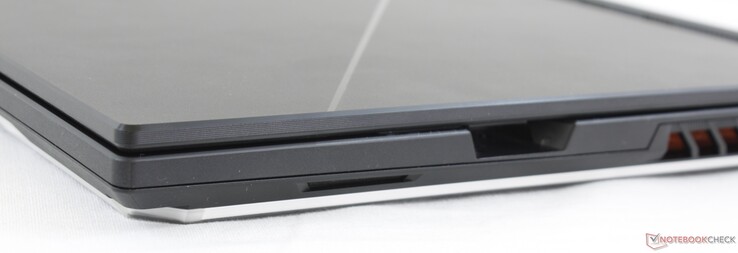
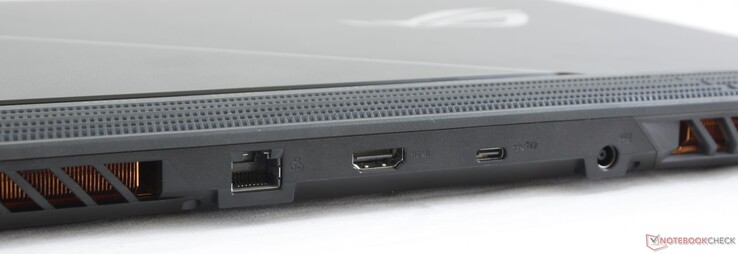
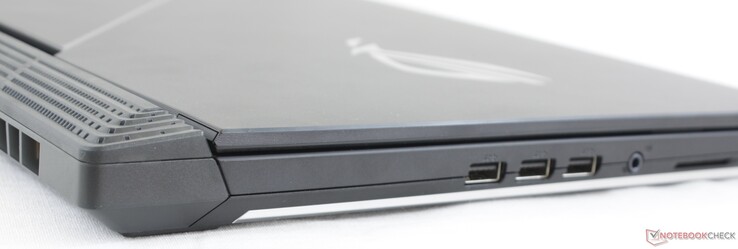
Las opciones de puerto y posicionamiento son idénticas a las del G532 o G512, incluyendo la falta de Thunderbolt 3. Al menos nos gustaría ver un puerto RJ-45 de 2,5 Gbps en un portátil de este precio, pero el sistema viene con el RJ-45 estándar de 1 Gbps solamente.
Comunicación
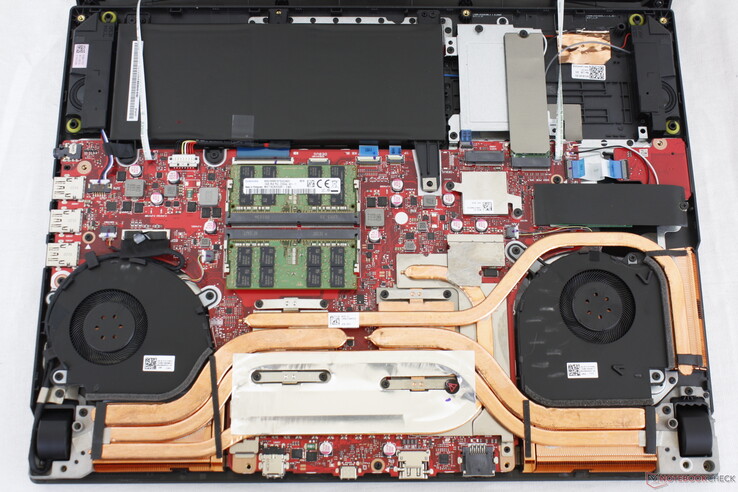
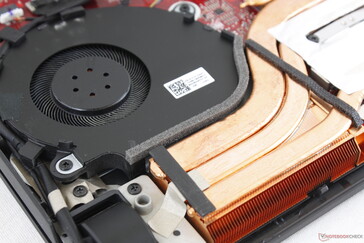
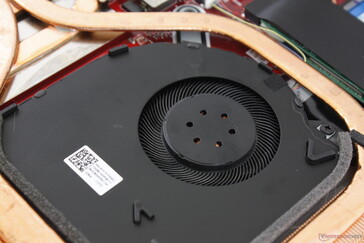
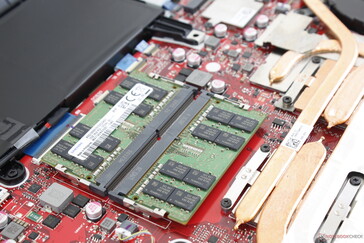
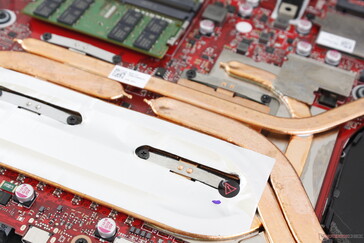
Mantenimiento
Accesorios y garantía
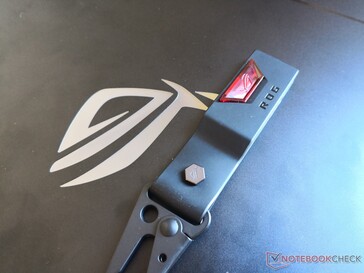
La caja incluye una clave Asus ROG Keystone para guardar configuraciones personalizadas de cajas de armadura y unidades de "sombra" ocultas entre sistemas compatibles. El problema es que muy pocos portátiles ROG soportan Keystone, lo que hace que la función no sea tan útil como podría haber sido. Nos gustaría ver esta tecnología patentada en todos los portátiles ROG para que Keystone realmente valga la pena.
Se aplica la garantía limitada estándar de un año.
Dispositivos de entrada
Teclado y Touchpad
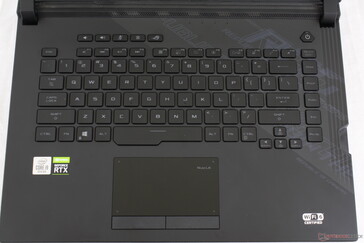
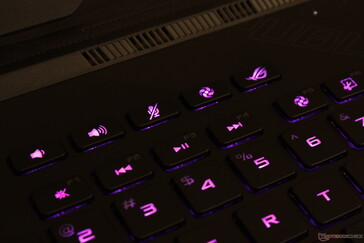
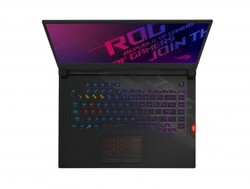
Si has escrito en el G531 o G512 antes, entonces sabrás qué esperar en el G532 ya que el teclado y el touchpad (10,9 x 6 cm) siguen siendo idénticos. Escribir es cómodo y las teclas táctiles son más lujosas que las de plástico. Sin embargo, Asus aún no ha abordado las letras de función sin iluminar como muestra nuestra imagen de abajo. La fuente gris oscura contrasta mal con las teclas negras, por lo que las teclas pueden ser difíciles de ver en un entorno con mucha luz.
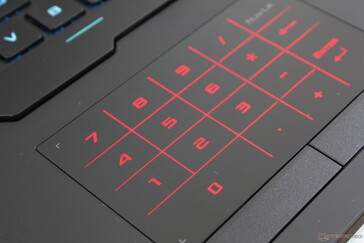
El NumPad virtual en el G531 hace un retorno. Aunque limpio, es más bien una novedad y los usuarios que confían en tener un NumPad estarán mejor con una solución USB dedicada en su lugar. Las teclas dedicadas del ratón son por lo demás excelentes con una retroalimentación adecuada, un recorrido relativamente profundo, y casi ningún clic audible cuando se presiona.
Display
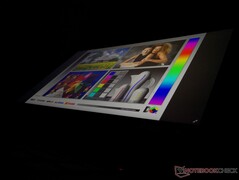
Todas las configuraciones del G532 vienen con un panel IPS de 240 Hz o 300 Hz 1080p. No hay muchas opciones de paneles de 300 Hz por ahí, así que no es sorprendente que nuestra configuración Asus utilice el mismo panel AU Optronics B156HAN12.0 que el MSI GS66 o el Acer Predator Triton 500. Por lo tanto, ciertas características como la cobertura de color, la relación de contraste y los tiempos de respuesta en blanco y negro son bastante similares entre estos sistemas. No podemos decir con certeza cuál es el panel exacto para la opción de 240 Hz hasta que podamos probar un modelo de primera mano, pero sospechamos que es el mismo que se utiliza para el G531GW.
| |||||||||||||||||||||||||
iluminación: 91 %
Brillo con batería: 307.2 cd/m²
Contraste: 1463:1 (Negro: 0.21 cd/m²)
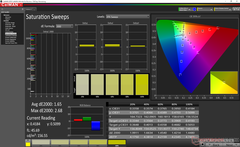
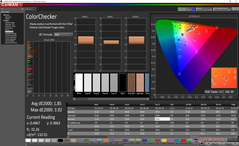
ΔE ColorChecker Calman: 1.85 | ∀{0.5-29.43 Ø4.76}
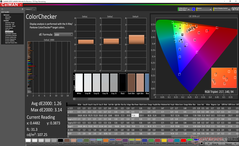
calibrated: 1.26
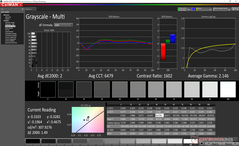
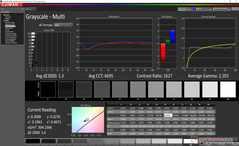
ΔE Greyscale Calman: 2 | ∀{0.09-98 Ø5}
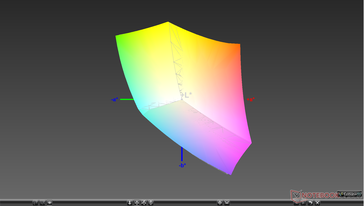
99.7% sRGB (Argyll 1.6.3 3D)
65% AdobeRGB 1998 (Argyll 1.6.3 3D)
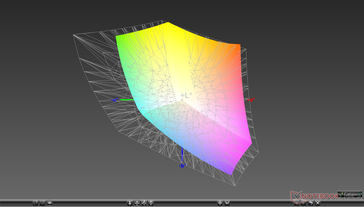
71.4% AdobeRGB 1998 (Argyll 3D)
99.6% sRGB (Argyll 3D)
69.9% Display P3 (Argyll 3D)
Gamma: 2.15
CCT: 6479 K
| Asus ROG Strix Scar 15 G532LWS AU Optronics B156HAN12.0, IPS, 15.6", 1920x1080 | MSI GE66 Raider 10SFS Sharp LQ156M1JW03 (SHP14C5), IPS-Level, 15.6", 1920x1080 | Acer Predator Triton 500 PT515-52-70N3 AUO B156HAN12.0 (AUO7A8C), IPS, 15.6", 1920x1080 | Razer Blade 15 RZ09-0328 Samsung SDCA029, AMOLED, 15.6", 3840x2160 | HP Omen X 2S 15-dg0075cl AU Optronics AUO82ED, IPS, 15.6", 1920x1080 | Asus Strix Scar III G531GW-AZ062T Sharp LQ156M1JW09 (SHP14D3), IPS, 15.6", 1920x1080 | |
|---|---|---|---|---|---|---|
| Display | -2% | 1% | 26% | -6% | -4% | |
| Display P3 Coverage (%) | 69.9 | 68 -3% | 70.3 1% | 99.9 43% | 66.2 -5% | 66.2 -5% |
| sRGB Coverage (%) | 99.6 | 99 -1% | 99.5 0% | 100 0% | 92.3 -7% | 97.1 -3% |
| AdobeRGB 1998 Coverage (%) | 71.4 | 69.8 -2% | 72.2 1% | 97.4 36% | 67.2 -6% | 67.6 -5% |
| Response Times | -14% | -7% | 77% | -12% | -1% | |
| Response Time Grey 50% / Grey 80% * (ms) | 14.4 ? | 16.4 ? -14% | 14.4 ? -0% | 2.7 ? 81% | 15.2 ? -6% | 15 ? -4% |
| Response Time Black / White * (ms) | 9.2 ? | 10.4 ? -13% | 10.4 ? -13% | 2.6 ? 72% | 10.8 ? -17% | 9 ? 2% |
| PWM Frequency (Hz) | 23580 ? | 59.5 ? | 250 ? | |||
| Screen | 1% | -38% | -26% | -59% | -50% | |
| Brightness middle (cd/m²) | 307.2 | 291 -5% | 320 4% | 366.7 19% | 324.8 6% | 309 1% |
| Brightness (cd/m²) | 301 | 278 -8% | 318 6% | 371 23% | 316 5% | 284 -6% |
| Brightness Distribution (%) | 91 | 91 0% | 88 -3% | 91 0% | 84 -8% | 88 -3% |
| Black Level * (cd/m²) | 0.21 | 0.25 -19% | 0.24 -14% | 0.26 -24% | 0.42 -100% | |
| Contrast (:1) | 1463 | 1164 -20% | 1333 -9% | 1249 -15% | 736 -50% | |
| Colorchecker dE 2000 * | 1.85 | 1.19 36% | 4.03 -118% | 5.21 -182% | 4.96 -168% | 3.99 -116% |
| Colorchecker dE 2000 max. * | 3.92 | 3.04 22% | 8.43 -115% | 7.92 -102% | 8.95 -128% | 8.3 -112% |
| Colorchecker dE 2000 calibrated * | 1.26 | 0.98 22% | 3.23 -156% | 1.12 11% | ||
| Greyscale dE 2000 * | 2 | 1.9 5% | 5.94 -197% | 2 -0% | 5 -150% | 5.43 -172% |
| Gamma | 2.15 102% | 2.216 99% | 2.42 91% | 2.17 101% | 2.21 100% | 2.57 86% |
| CCT | 6479 100% | 7018 93% | 6751 96% | 6514 100% | 7742 84% | 7767 84% |
| Color Space (Percent of AdobeRGB 1998) (%) | 65 | 70 8% | 66 2% | 86.6 33% | 59.8 -8% | 63 -3% |
| Color Space (Percent of sRGB) (%) | 99.7 | 92 -8% | 99 -1% | 100 0% | 91.8 -8% | 97 -3% |
| Media total (Programa/Opciones) | -5% /
-1% | -15% /
-27% | 26% /
2% | -26% /
-43% | -18% /
-36% |
* ... más pequeño es mejor
El espacio de color cubre todo el sRGB y cerca del 65 por ciento del AdobeRGB como muchos otros paneles de tasa de refresco rápido. Esto es definitivamente una mejora del panel de Panda en el mucho más barato Asus G512. Los portátiles con opciones OLED como el Razer Blade 15 o el Alienware m15 pueden ofrecer colores aún más profundos, pero estos paneles están limitados a sólo 60 Hz por el momento.
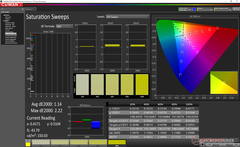
Las mediciones posteriores con un colorímetro X-Rite revelan una pantalla muy bien calibrada fuera de la caja. El promedio de los valores de escala de grises y color DeltaE se sitúa en sólo 2 y 1,85, respectivamente, lo que sugiere que no será necesaria una calibración adicional por parte del usuario final. Intentar calibrar el panel nosotros mismos resultaría, sin embargo, en ligeras mejoras.
Tiempos de respuesta del display
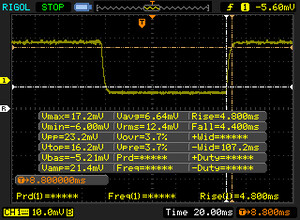
| ↔ Tiempo de respuesta de Negro a Blanco | ||
|---|---|---|
| 9.2 ms ... subida ↗ y bajada ↘ combinada | ↗ 4.8 ms subida | |
| ↘ 4.4 ms bajada | ||
| La pantalla mostró tiempos de respuesta rápidos en nuestros tests y debería ser adecuada para juegos. En comparación, todos los dispositivos de prueba van de ##min### (mínimo) a 240 (máximo) ms. » 25 % de todos los dispositivos son mejores. Esto quiere decir que el tiempo de respuesta medido es mejor que la media (20.1 ms) de todos los dispositivos testados. | ||
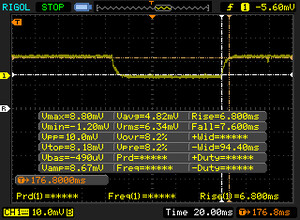
| ↔ Tiempo de respuesta 50% Gris a 80% Gris | ||
| 14.4 ms ... subida ↗ y bajada ↘ combinada | ↗ 6.8 ms subida | |
| ↘ 7.6 ms bajada | ||
| La pantalla mostró buenos tiempos de respuesta en nuestros tests pero podría ser demasiado lenta para los jugones competitivos. En comparación, todos los dispositivos de prueba van de ##min### (mínimo) a 636 (máximo) ms. » 27 % de todos los dispositivos son mejores. Esto quiere decir que el tiempo de respuesta medido es mejor que la media (31.5 ms) de todos los dispositivos testados. | ||
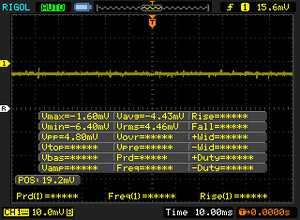
Parpadeo de Pantalla / PWM (Pulse-Width Modulation)
| Parpadeo de Pantalla / PWM no detectado | |||
Comparación: 53 % de todos los dispositivos testados no usaron PWM para atenuar el display. Si se usó, medimos una media de 8078 (mínimo: 5 - máxmo: 343500) Hz. | |||
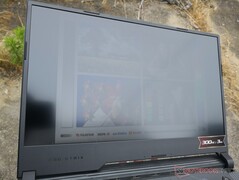
Por muy grande que sea la pantalla para los juegos, no está diseñada para su uso en exteriores. La luz ambiental abrumará la pantalla a menos que el sistema esté bajo sombra.
Rendimiento
No hay opciones para el Core i7-10750H ya que Asus está posicionando el G532 como un producto de gama media superior a alta. Los usuarios tendrán que buscar en la serie menor del G512 algo menos que el Core i7-10875H o la GPU GeForce RTX 2060. Es una pena que no haya opciones Ryzen 7 o Ryzen 9 para estos portátiles Strix o Scar en el momento de escribir este artículo.
Nvidia Optimus viene de serie y omite automáticamente el G-Sync en el monitor interno. Sin embargo, G-Sync es compatible con los monitores externos.
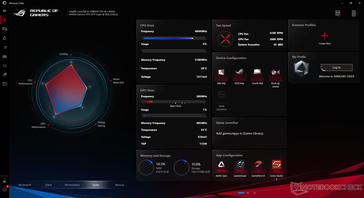
Todos los puntos de referencia de abajo fueron realizados en el modo Turbo de Asus para obtener las mayores puntuaciones posibles. Recomendamos familiarizarse con el software Asus Armoury Crate ya que sus opciones afectan directamente al rendimiento y al comportamiento del ruido del ventilador.
Procesador
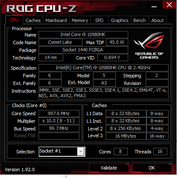
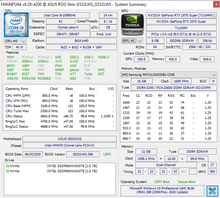
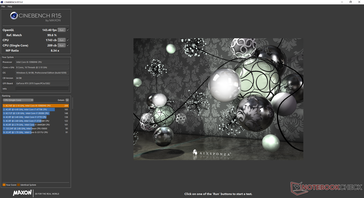
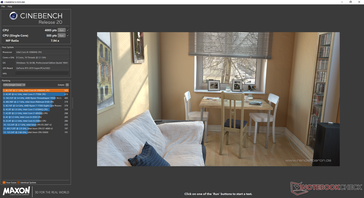
Como la octava computadora portátil de nuestra base de datos con el Core i9-10980HK, el rendimiento es el que esperamos que sea relativo al promedio. Sin embargo, la sostenibilidad de Turbo Boost no es perfecta, ya que el rendimiento bajaría alrededor de un 7 por ciento cuando se ejecuta el CineBench R15 Multi-Thread en un bucle. El rendimiento general es sólo unos pocos puntos porcentuales más rápido que el más barato Core i7-10875H de 8 núcleos, mientras que es aproximadamente un 25 por ciento más rápido que el Core i7-10750H de 6 núcleos. Como resultado, nos resulta más fácil recomendar el modelo Core i7-10750H que el Core i9.
Consulta nuestra página dedicada al Core i9-10980HK para obtener más información técnica y comparaciones de referencia.
Cinebench R15: CPU Multi 64Bit | CPU Single 64Bit
Blender: v2.79 BMW27 CPU
7-Zip 18.03: 7z b 4 -mmt1 | 7z b 4
Geekbench 5.5: Single-Core | Multi-Core
HWBOT x265 Benchmark v2.2: 4k Preset
LibreOffice : 20 Documents To PDF
R Benchmark 2.5: Overall mean
| Geekbench 5.5 / Single-Core | |
| Intel Core i9-10900K | |
| Eurocom Sky X4C i9-9900KS | |
| Asus ROG Strix Scar 15 G532LWS | |
| Gigabyte Aero 15 OLED XB-8DE51B0SP | |
| Medio Intel Core i9-10980HK (1283 - 1401, n=12) | |
| Lenovo Legion 5 15IMH05H | |
| Eluktronics RP-15 | |
| Asus ROG Strix G15 G512LI | |
| Acer Nitro 5 AN515-44-R5FT | |
| Geekbench 5.5 / Multi-Core | |
| Intel Core i9-10900K | |
| Eurocom Sky X4C i9-9900KS | |
| Eluktronics RP-15 | |
| Asus ROG Strix Scar 15 G532LWS | |
| Medio Intel Core i9-10980HK (7634 - 8666, n=12) | |
| Gigabyte Aero 15 OLED XB-8DE51B0SP | |
| Asus ROG Strix G15 G512LI | |
| Acer Nitro 5 AN515-44-R5FT | |
| Lenovo Legion 5 15IMH05H | |
| HWBOT x265 Benchmark v2.2 / 4k Preset | |
| Intel Core i9-10900K | |
| Eurocom Sky X4C i9-9900KS | |
| Eluktronics RP-15 | |
| Gigabyte Aero 15 OLED XB-8DE51B0SP | |
| Asus ROG Strix Scar 15 G532LWS | |
| Medio Intel Core i9-10980HK (12 - 14.6, n=13) | |
| Asus ROG Strix G15 G512LI | |
| Acer Nitro 5 AN515-44-R5FT | |
| Asus Strix Scar III G531GW-AZ062T | |
| Lenovo Legion 5 15IMH05H | |
| LibreOffice / 20 Documents To PDF | |
| Intel Core i9-10900K | |
| Acer Nitro 5 AN515-44-R5FT | |
| Eluktronics RP-15 | |
| Medio Intel Core i9-10980HK (44 - 89, n=13) | |
| Lenovo Legion 5 15IMH05H | |
| Gigabyte Aero 15 OLED XB-8DE51B0SP | |
| Asus ROG Strix G15 G512LI | |
| Asus ROG Strix Scar 15 G532LWS | |
| R Benchmark 2.5 / Overall mean | |
| Lenovo Legion 5 15IMH05H | |
| Acer Nitro 5 AN515-44-R5FT | |
| Asus ROG Strix G15 G512LI | |
| Medio Intel Core i9-10980HK (0.561 - 0.596, n=13) | |
| Eluktronics RP-15 | |
| Asus ROG Strix Scar 15 G532LWS | |
| Gigabyte Aero 15 OLED XB-8DE51B0SP | |
| Intel Core i9-10900K | |
* ... más pequeño es mejor
Rendimiento del sistema
Encontramos un error en nuestra unidad de prueba en el que el sistema no se despertaba del sueño sin importar los botones que intentáramos pulsar. Es difícil de reproducir de forma fiable, pero lo encontramos más de una vez. Un apagado forzado y un arranque en frío serían necesarios.
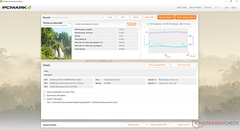
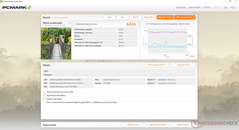
| PCMark 8 Home Score Accelerated v2 | 5020 puntos | |
| PCMark 8 Work Score Accelerated v2 | 6456 puntos | |
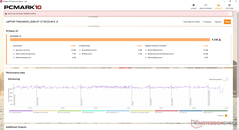
| PCMark 10 Score | 6236 puntos | |
ayuda | ||
Latencia DPC
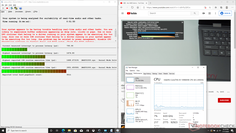
LatencyMon muestra los problemas de latencia del DPC relacionados con Wdf01000.sys. Somos capaces de grabar 105 dropped frames durante nuestro video de prueba de 4K60 de un minuto de duración en YouTube, lo que no debería estar sucediendo en un portátil tan potente como este. Curiosamente, el cambio a la GPU integrada resuelve el problema con "sólo" 10 fotogramas perdidos, pero los resultados son extraños. Tanto nuestros controladores de gráficos Nvidia como los de Intel estaban actualizados en el momento de la revisión.
| DPC Latencies / LatencyMon - interrupt to process latency (max), Web, Youtube, Prime95 | |
| Acer Predator Triton 500 PT515-52-70N3 | |
| Asus ROG Strix Scar 15 G532LWS | |
| MSI GE66 Raider 10SFS | |
| Razer Blade 15 RZ09-0328 | |
* ... más pequeño es mejor
Dispositivos de almacenamiento
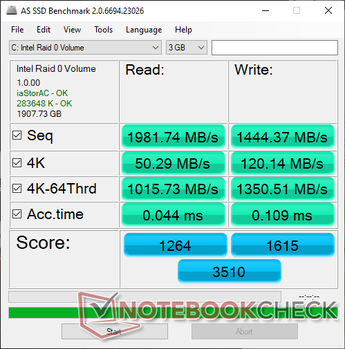
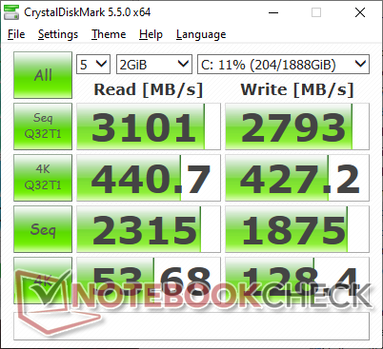
Nuestra unidad viene con dos SSDs Intel 660p M.2 de 1 TB en configuración RAID 0. Esta unidad en particular es un SSD NVMe de gama media con velocidades secuenciales de lectura y escritura de 1800 MB/s cada una. Un disco rápido y singular como el Samsung PM981a en el MSI Bravo 15 todavía puede igualar o superar nuestra configuración RAID 0 como resultado.
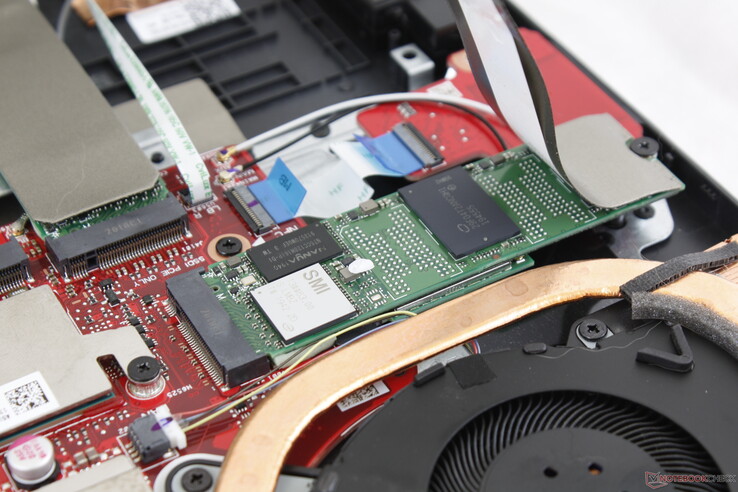
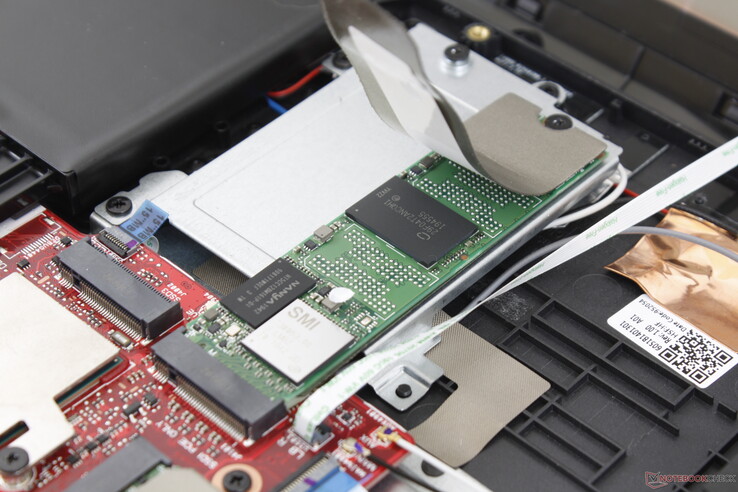
Una ventaja notable del sistema es que puede soportar hasta tres SSD M.2 2280 internos, mientras que la mayoría de los demás portátiles para juegos se limitan a sólo dos.
| Asus ROG Strix Scar 15 G532LWS 2x Intel SSD 660p 1TB SSDPEKNW010T8 (RAID 0) | MSI GE66 Raider 10SFS WDC PC SN730 SDBPNTY-1T00 | Razer Blade 15 RZ09-0328 Lite-On CA5-8D512 | Asus Strix Scar III G531GW-AZ062T Intel SSD 660p SSDPEKNW512G8 | MSI Bravo 15 A4DCR Samsung PM981a MZVLB1T0HBLR | |
|---|---|---|---|---|---|
| AS SSD | 47% | -11% | -70% | 44% | |
| Seq Read (MB/s) | 1982 | 2979 50% | 2021 2% | 1163 -41% | 2730 38% |
| Seq Write (MB/s) | 1444 | 2581 79% | 2090 45% | 919 -36% | 2513 74% |
| 4K Read (MB/s) | 50.3 | 47.33 -6% | 47.71 -5% | 48.88 -3% | 61.4 22% |
| 4K Write (MB/s) | 120.1 | 140 17% | 101.1 -16% | 90.1 -25% | 156.1 30% |
| 4K-64 Read (MB/s) | 1016 | 1710 68% | 856 -16% | 323.8 -68% | 1780 75% |
| 4K-64 Write (MB/s) | 1351 | 2188 62% | 1041 -23% | 403.8 -70% | 1920 42% |
| Access Time Read * (ms) | 0.044 | 0.05 -14% | 0.052 -18% | 0.24 -445% | 0.063 -43% |
| Access Time Write * (ms) | 0.109 | 0.026 76% | 0.111 -2% | 0.046 58% | 0.025 77% |
| Score Read (Points) | 1264 | 2055 63% | 1105 -13% | 489 -61% | 2114 67% |
| Score Write (Points) | 1615 | 2586 60% | 1351 -16% | 586 -64% | 2327 44% |
| Score Total (Points) | 3510 | 5673 62% | 3037 -13% | 1332 -62% | 5518 57% |
| Copy ISO MB/s (MB/s) | 3474 | 2474 -29% | 1269 -63% | ||
| Copy Program MB/s (MB/s) | 751 | 679 -10% | 452.8 -40% | ||
| Copy Game MB/s (MB/s) | 1684 | 1037 -38% | 755 -55% | ||
| CrystalDiskMark 5.2 / 6 | 11% | 5% | -32% | 8% | |
| Write 4K (MB/s) | 128.4 | 158.2 23% | 118.7 -8% | 133.3 4% | 118.3 -8% |
| Read 4K (MB/s) | 53.7 | 50.7 -6% | 52.4 -2% | 55.3 3% | 43.73 -19% |
| Write Seq (MB/s) | 1875 | 1790 -5% | 2247 20% | 980 -48% | 2854 52% |
| Read Seq (MB/s) | 2315 | 2469 7% | 2234 -3% | 1406 -39% | 2302 -1% |
| Write 4K Q32T1 (MB/s) | 427.2 | 503 18% | 515 21% | 286.3 -33% | 418.5 -2% |
| Read 4K Q32T1 (MB/s) | 440.7 | 579 31% | 584 33% | 331.5 -25% | 517 17% |
| Write Seq Q32T1 (MB/s) | 2793 | 3102 11% | 2235 -20% | 976 -65% | 3008 8% |
| Read Seq Q32T1 (MB/s) | 3101 | 3413 10% | 3171 2% | 1520 -51% | 3568 15% |
| Write 4K Q8T8 (MB/s) | 748 | ||||
| Read 4K Q8T8 (MB/s) | 344.6 | ||||
| Media total (Programa/Opciones) | 29% /
32% | -3% /
-5% | -51% /
-56% | 26% /
29% |
* ... más pequeño es mejor
Estrangulamiento del disco: DiskSpd Read Loop, Queue Depth 8
Rendimiento de la GPU
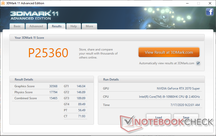
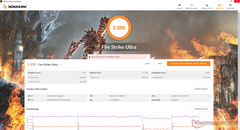
La GeForce RTX 2070 Super móvil es entre un 10 y un 15 por ciento más lenta que la GeForce RTX 2080 Super móvil o hasta un 10 por ciento más rápida que la RTX 2070 móvil normal. Optar por la opción de menor RTX 2060 resultará en una caída del rendimiento de alrededor del 25 por ciento. La línea de GPU para móviles de Nvidia se ha descontroladorecientemente, lo que significa que las diferencias de rendimiento entre muchas variantes de RTX 2070/2080 de gama alta se han vuelto marginales.
Más benchmarks y comparaciones del RTX 2070 Super se pueden encontrar en nuestra página aquí. Los usuarios que buscan altas velocidades de cuadro para explotar el panel de 1080p 300 Hz encontrarán el mayor valor en esta combinación de Core i9 y RTX 2070 Super.
| 3DMark 11 Performance | 25360 puntos | |
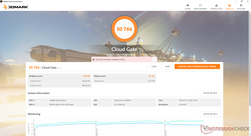
| 3DMark Cloud Gate Standard Score | 50766 puntos | |
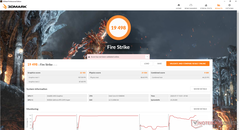
| 3DMark Fire Strike Score | 19498 puntos | |
| 3DMark Time Spy Score | 8531 puntos | |
ayuda | ||
| bajo | medio | alto | ultra | |
|---|---|---|---|---|
| The Witcher 3 (2015) | 368.7 | 256.5 | 168 | 85.7 |
| Dota 2 Reborn (2015) | 156 | 145 | 135 | 129 |
| X-Plane 11.11 (2018) | 118 | 103 | 86.5 | |
| Shadow of the Tomb Raider (2018) | 153 | 120 | 115 | 104 |
Emisiones
Ruido de sistema
Los ventiladores están casi siempre activos, sin importar el escenario. El ruido de los ventiladores puede llegar a ser tan alto como 34 dB(A), simplemente al estar parados en el escritorio o al navegar por la web. El comportamiento de los impulsos es aún peor si se configura en modos de alto rendimiento, por lo que recomendamos el modo de ahorro de energía o el modo silencioso para mantener las velocidades del ventilador lo más bajas posibles. Este es un comportamiento que hemos encontrado en todos los portátiles Strix y Scar hasta ahora.
El ruido del ventilador cuando se juega es muy fuerte incluso para un portátil para juegos. Somos capaces de grabar una constante de 57,5 dB(A) en el modo Turbo o 53,4 dB(A) en el modo Performance. En cualquier caso, los resultados son más altos que los que hemos grabado en muchos otros portátiles de alto rendimiento, incluyendo el Razer Blade 15 o el MSI GE66.
| Asus ROG Strix Scar 15 G532LWS GeForce RTX 2070 Super Mobile, i9-10980HK, 2x Intel SSD 660p 1TB SSDPEKNW010T8 (RAID 0) | MSI GE66 Raider 10SFS GeForce RTX 2070 Super Mobile, i9-10980HK, WDC PC SN730 SDBPNTY-1T00 | Acer Predator Triton 500 PT515-52-70N3 GeForce RTX 2080 Super Max-Q, i7-10750H, Samsung SSD PM981a MZVLB512HBJQ | Razer Blade 15 RZ09-0328 GeForce RTX 2070 Max-Q, i7-10750H, Lite-On CA5-8D512 | HP Omen X 2S 15-dg0075cl GeForce RTX 2070 Max-Q, i7-9750H, WDC PC SN720 SDAPNTW-1T00 | Asus Strix Scar III G531GW-AZ062T GeForce RTX 2070 Mobile, i7-9750H, Intel SSD 660p SSDPEKNW512G8 | |
|---|---|---|---|---|---|---|
| Noise | -7% | 0% | 7% | 4% | 3% | |
| apagado / medio ambiente * (dB) | 26.5 | 30 -13% | 30 -13% | 28.4 -7% | 29 -9% | 30 -13% |
| Idle Minimum * (dB) | 27.1 | 30 -11% | 30 -11% | 28.4 -5% | 30.5 -13% | 30.6 -13% |
| Idle Average * (dB) | 32.2 | 35 -9% | 33 -2% | 28.4 12% | 31.5 2% | 30.6 5% |
| Idle Maximum * (dB) | 34 | 44 -29% | 36 -6% | 31.7 7% | 31.5 7% | 37.7 -11% |
| Load Average * (dB) | 52.4 | 53 -1% | 50 5% | 47.7 9% | 40.6 23% | 36.5 30% |
| Witcher 3 ultra * (dB) | 57.5 | 53 8% | 48 17% | 47.5 17% | 49.5 14% | 52.1 9% |
| Load Maximum * (dB) | 57.5 | 55 4% | 50 13% | 49.5 14% | 53.4 7% | 48.1 16% |
* ... más pequeño es mejor
Ruido
| Ocioso |
| 27.1 / 32.2 / 34 dB(A) |
| Carga |
| 52.4 / 57.5 dB(A) |
 | ||
30 dB silencioso 40 dB(A) audible 50 dB(A) ruidosamente alto |
||
min: | ||
Temperatura
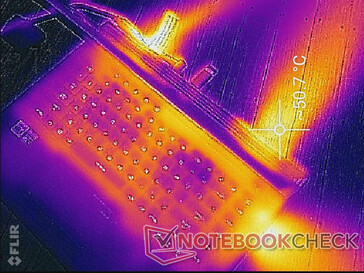
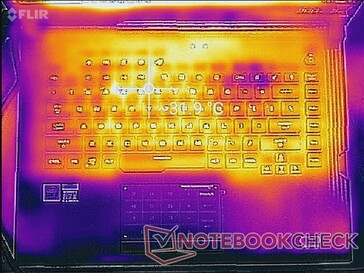
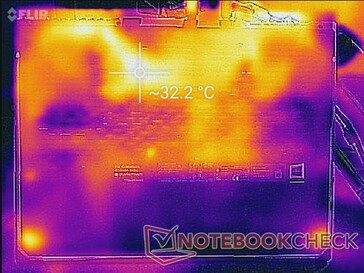
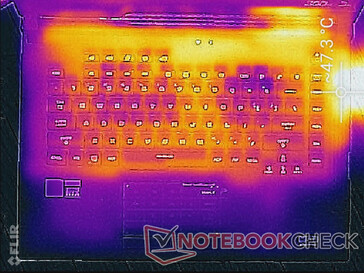
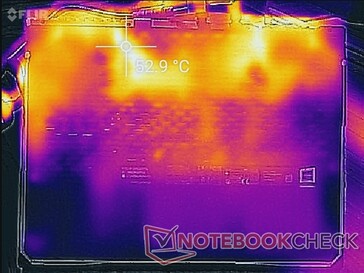
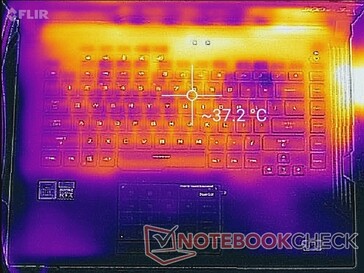
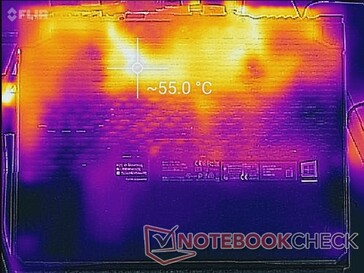
Es importante que los portátiles para juegos tengan superficies frías en las que las palmas y los dedos se apoyen. En este caso, las palmas de las manos y las teclas WASD nunca están incómodamente calientes sin importar la carga de la pantalla. El centro del teclado puede llegar a calentarse hasta 37 C cuando se juega, mientras que los puntos calientes reales a lo largo de los bordes exteriores del teclado pueden llegar a calentarse hasta 47 C. Afortunadamente, los puntos calientes se concentran en puntos muy específicos, a diferencia de las series más delgadas Razer Blade o MSI GS, en la que los gradientes de temperatura tienden a ser menos profundos.
(-) La temperatura máxima en la parte superior es de 46.2 °C / 115 F, frente a la media de 40.4 °C / 105 F, que oscila entre 21.2 y 68.8 °C para la clase Gaming.
(-) El fondo se calienta hasta un máximo de 55.2 °C / 131 F, frente a la media de 43.3 °C / 110 F
(+) En reposo, la temperatura media de la parte superior es de 29.1 °C / 84# F, frente a la media del dispositivo de 33.9 °C / 93 F.
(±) Jugando a The Witcher 3, la temperatura media de la parte superior es de 36.3 °C / 97 F, frente a la media del dispositivo de 33.9 °C / 93 F.
(+) El reposamanos y el panel táctil están a una temperatura inferior a la de la piel, con un máximo de 27.6 °C / 81.7 F y, por tanto, son fríos al tacto.
(±) La temperatura media de la zona del reposamanos de dispositivos similares fue de 28.8 °C / 83.8 F (+1.2 °C / 2.1 F).
Prueba de estrés
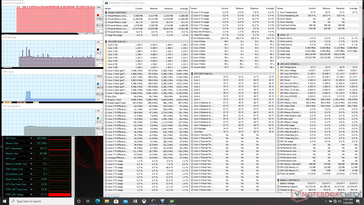
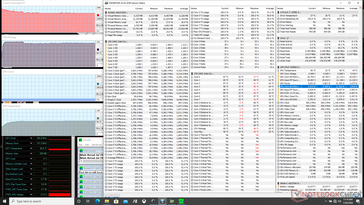
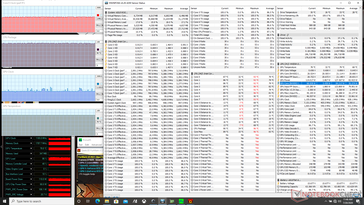
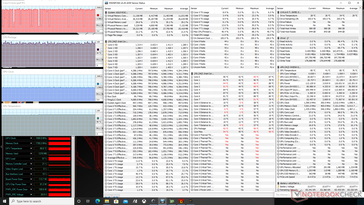
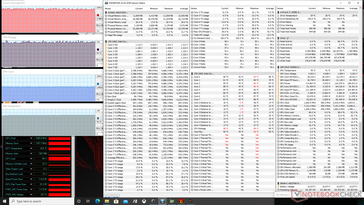
Stressing the CPU with Prime95 shows clock rates boosting to 4.4 GHz for a few seconds before reaching a core temperature of 95 C. Clock rates would then drop to 4 GHz for the next minute or so before finally stabilizing at 3.8 GHz and 90 C. When running Witcher 3 in Turbo mode, CPU and GPU temperature would stabilize at 94 C and 80 C, respectively, compared to 79 C and 69 C on our Razer Blade 15 Advanced Model.
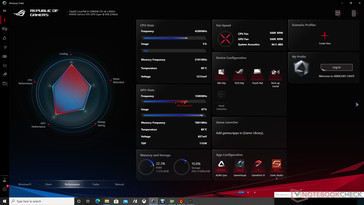
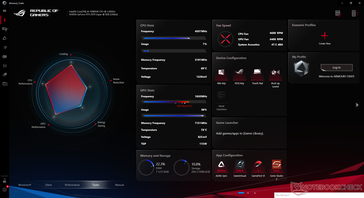
Note that GPU and memory clocks increase just marginally to 1590 to 1650 MHz and 1750 to 1788 MHz, respectively, when moving from Performance mode to Turbo mode. Meanwhile, fan speed would increase noticeably from ~5600 RPM to ~6500 RPM.
Running on battery power will limit performance. Fire Strike on batteries would return Physics and Graphics 13330 and 6433 points, respectively, compared to 21554 and 22183 points when on mains. Turbo mode is disabled when running on battery power.
| CPU Clock (GHz) | GPU Clock (MHz) | Average CPU Temperature (°C) | Average GPU Temperature (°C) | |
| System Idle | -- | -- | 34 | 32 |
| Prime95 Stress | 3.7 | -- | 90 | 56 |
| Prime95 + FurMark Stress | 2.9 - 3.0 | 1185 | 90 | 78 |
| Witcher 3 Stress (Performance mode) | ~4.4 | 1590 | ~94 | 80 |
| Witcher 3 Stress (Turbo mode) | ~4.4 | 1650 | ~94 | 78 |
Altavoces
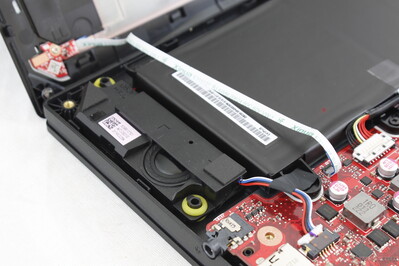
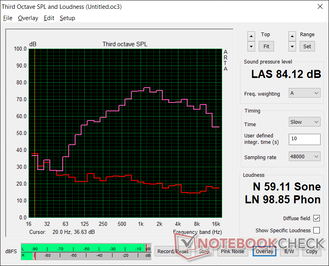
Asus ROG Strix Scar 15 G532LWS análisis de audio
(+) | los altavoces pueden reproducir a un volumen relativamente alto (#84.1 dB)
Graves 100 - 315 Hz
(±) | lubina reducida - en promedio 9.7% inferior a la mediana
(±) | la linealidad de los graves es media (7.8% delta a frecuencia anterior)
Medios 400 - 2000 Hz
(±) | medias más altas - de media 6.4% más altas que la mediana
(+) | los medios son lineales (4.8% delta a la frecuencia anterior)
Altos 2 - 16 kHz
(+) | máximos equilibrados - a sólo 1.9% de la mediana
(+) | los máximos son lineales (5.5% delta a la frecuencia anterior)
Total 100 - 16.000 Hz
(+) | el sonido global es lineal (14.4% de diferencia con la mediana)
En comparación con la misma clase
» 26% de todos los dispositivos probados de esta clase eran mejores, 7% similares, 67% peores
» El mejor tuvo un delta de 6%, la media fue 18%, el peor fue ###max##%
En comparación con todos los dispositivos probados
» 17% de todos los dispositivos probados eran mejores, 4% similares, 78% peores
» El mejor tuvo un delta de 4%, la media fue 24%, el peor fue ###max##%
Apple MacBook 12 (Early 2016) 1.1 GHz análisis de audio
(+) | los altavoces pueden reproducir a un volumen relativamente alto (#83.6 dB)
Graves 100 - 315 Hz
(±) | lubina reducida - en promedio 11.3% inferior a la mediana
(±) | la linealidad de los graves es media (14.2% delta a frecuencia anterior)
Medios 400 - 2000 Hz
(+) | medios equilibrados - a sólo 2.4% de la mediana
(+) | los medios son lineales (5.5% delta a la frecuencia anterior)
Altos 2 - 16 kHz
(+) | máximos equilibrados - a sólo 2% de la mediana
(+) | los máximos son lineales (4.5% delta a la frecuencia anterior)
Total 100 - 16.000 Hz
(+) | el sonido global es lineal (10.2% de diferencia con la mediana)
En comparación con la misma clase
» 7% de todos los dispositivos probados de esta clase eran mejores, 2% similares, 91% peores
» El mejor tuvo un delta de 5%, la media fue 18%, el peor fue ###max##%
En comparación con todos los dispositivos probados
» 4% de todos los dispositivos probados eran mejores, 1% similares, 94% peores
» El mejor tuvo un delta de 4%, la media fue 24%, el peor fue ###max##%
Gestión de la energía
Consumo de energía
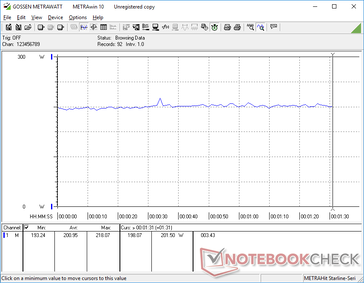
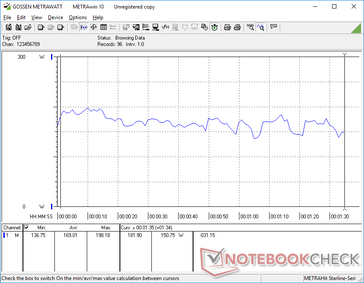
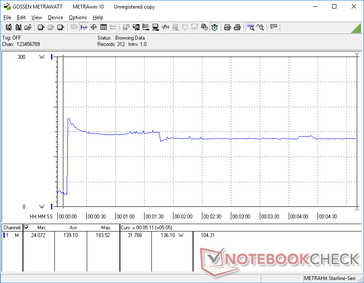
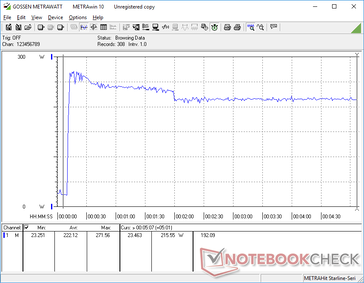
El consumo general de energía en los juegos es similar al que registramos en el MSI GE66. A 201 W, el sistema consume unos 40 W a 50 W más que un portátil para juegos equipado con la menor GeForce RTX 2070 Max-Q o sólo 15 W más que el G531 antiguo equipado con la GeForce RTX 2070 móvil normal. Si se considera que el móvil RTX 2070 Super ofrece un rendimiento gráfico entre un 9 y un 12 por ciento más rápido que el móvil RTX 2070, el aumento del 8 por ciento en el consumo de energía es más o menos una relación lineal.
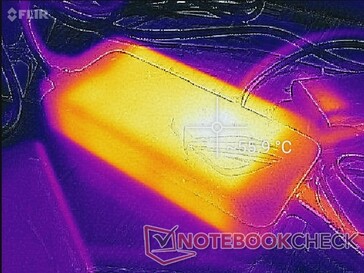
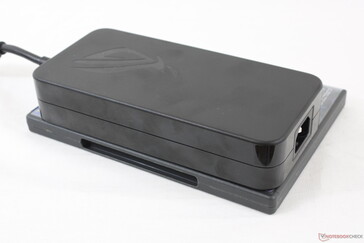
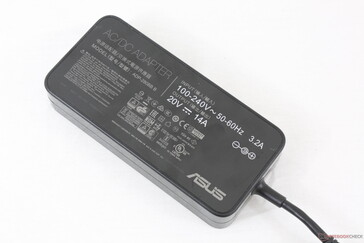
Se puede registrar un consumo máximo temporal de 271,6 W cuando se ejecutan simultáneamente Prime95 y FurMark. El gran (~18 x 8,5 x 3,6 cm) y pesado (~995 g) adaptador de CA con capacidad para empujar 280 W.
| Off / Standby | |
| Ocioso | |
| Carga |
|
Clave:
min: | |
| Asus ROG Strix Scar 15 G532LWS i9-10980HK, GeForce RTX 2070 Super Mobile, 2x Intel SSD 660p 1TB SSDPEKNW010T8 (RAID 0), IPS, 1920x1080, 15.6" | MSI GE66 Raider 10SFS i9-10980HK, GeForce RTX 2070 Super Mobile, WDC PC SN730 SDBPNTY-1T00, IPS-Level, 1920x1080, 15.6" | Acer Predator Triton 500 PT515-52-70N3 i7-10750H, GeForce RTX 2080 Super Max-Q, Samsung SSD PM981a MZVLB512HBJQ, IPS, 1920x1080, 15.6" | Razer Blade 15 RZ09-0328 i7-10750H, GeForce RTX 2070 Max-Q, Lite-On CA5-8D512, AMOLED, 3840x2160, 15.6" | HP Omen X 2S 15-dg0075cl i7-9750H, GeForce RTX 2070 Max-Q, WDC PC SN720 SDAPNTW-1T00, IPS, 1920x1080, 15.6" | Asus Strix Scar III G531GW-AZ062T i7-9750H, GeForce RTX 2070 Mobile, Intel SSD 660p SSDPEKNW512G8, IPS, 1920x1080, 15.6" | |
|---|---|---|---|---|---|---|
| Power Consumption | 4% | 1% | -4% | -175% | 1% | |
| Idle Minimum * (Watt) | 8 | 6 25% | 11 -38% | 11.1 -39% | 46 -475% | 11.4 -43% |
| Idle Average * (Watt) | 9.8 | 14 -43% | 15 -53% | 13.7 -40% | 59 -502% | 13.5 -38% |
| Idle Maximum * (Watt) | 25.8 | 25 3% | 25 3% | 33.4 -29% | 65.5 -154% | 21.6 16% |
| Load Average * (Watt) | 169 | 108 36% | 95 44% | 104.4 38% | 99.8 41% | 106 37% |
| Witcher 3 ultra * (Watt) | 201 | 195 3% | 140 30% | 159.9 20% | 154.1 23% | 186 7% |
| Load Maximum * (Watt) | 271.6 | 280 -3% | 211 22% | 203.8 25% | 222.7 18% | 196 28% |
* ... más pequeño es mejor
Duración de la batería
La batería interna de 66 Wh permanece sin cambios respecto a la G531 del año pasado para ser aproximadamente dos tercios de la capacidad de la batería en el MSI GE66. Somos capaces de registrar apenas 5 horas de uso de la WLAN en el mundo real antes del apagado automático cuando se ajusta al perfil de Balance con la iGPU activa.
La carga desde la capacidad vacía a la plena capacidad toma alrededor de 1,5 horas. El sistema no puede ser recargado a través de USB-C.
| Asus ROG Strix Scar 15 G532LWS i9-10980HK, GeForce RTX 2070 Super Mobile, 66 Wh | MSI GE66 Raider 10SFS i9-10980HK, GeForce RTX 2070 Super Mobile, 99.99 Wh | Acer Predator Triton 500 PT515-52-70N3 i7-10750H, GeForce RTX 2080 Super Max-Q, 84 Wh | Razer Blade 15 RZ09-0328 i7-10750H, GeForce RTX 2070 Max-Q, 65 Wh | HP Omen X 2S 15-dg0075cl i7-9750H, GeForce RTX 2070 Max-Q, 72 Wh | Asus Strix Scar III G531GW-AZ062T i7-9750H, GeForce RTX 2070 Mobile, 66 Wh | |
|---|---|---|---|---|---|---|
| Duración de Batería | 13% | 6% | -18% | -41% | 14% | |
| Reader / Idle (h) | 8.1 | 7.6 -6% | 8.3 2% | 3.7 -54% | ||
| WiFi v1.3 (h) | 4.9 | 6.1 24% | 6.3 29% | 4 -18% | 2.2 -55% | 5.6 14% |
| Load (h) | 1.5 | 1.8 20% | 1.3 -13% | 1.3 -13% |
Pro
Contra
Veredicto
Si valoras tener tres ranuras de almacenamiento M.2, entonces el Asus ROG G532 es uno de los pocos portátiles para juegos de 15,6 pulgadas disponibles con esta característica. Sin embargo, el sistema sigue sufriendo los mismos inconvenientes que el modelo del año pasado, ya que el chasis sigue siendo idéntico. El MSI GE66, que acaba de salir al mercado hace un par de meses para desafiar al ROG G532, es más pequeño y todavía se las arregla para llevar tanto una batería más grande como las mismas opciones de hardware del Core i9, el RTX 2070 Super y el 15,6 pulgadas 300 Hz. El rendimiento de nuestro Asus no debe ser subestimado, pero va a necesitar algo más que velocidad y soporte Keystone si quiere mantenerse al día con los últimos diseños de los competidores
Internamente, el Asus ROG Strix Scar 15 G532LWS viene equipado con algunos de los últimos procesadores y pantallas de velocidad de actualización rápida que puedes encontrar. Externamente, sin embargo, el grueso bisel inferior y el gran tamaño están empezando a mostrar su edad. Los diseños futuros deberían centrarse en reducir el ruido del ventilador cuando se juega para conseguir una ventaja única sobre la competencia o en reducir el chasis para adaptarse mejor a las alternativas.
Asus ROG Strix Scar 15 G532LWS
- 07/23/2020 v7 (old)
Allen Ngo


