Review del portátil Eurocom Nightsky RX15 (Clevo PB51RF, Core i9, 4K OLED)
")
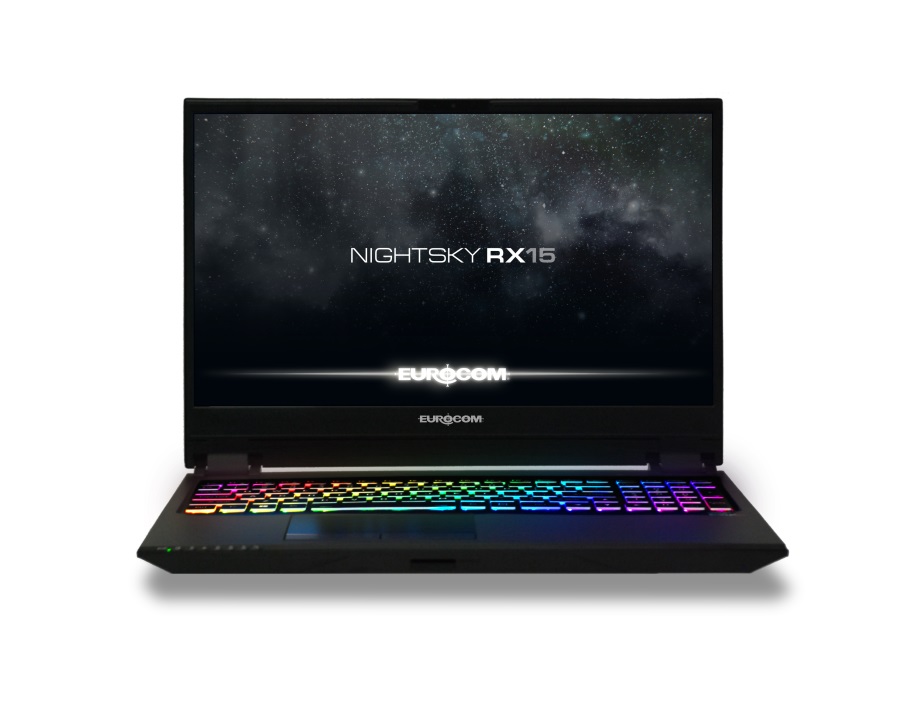
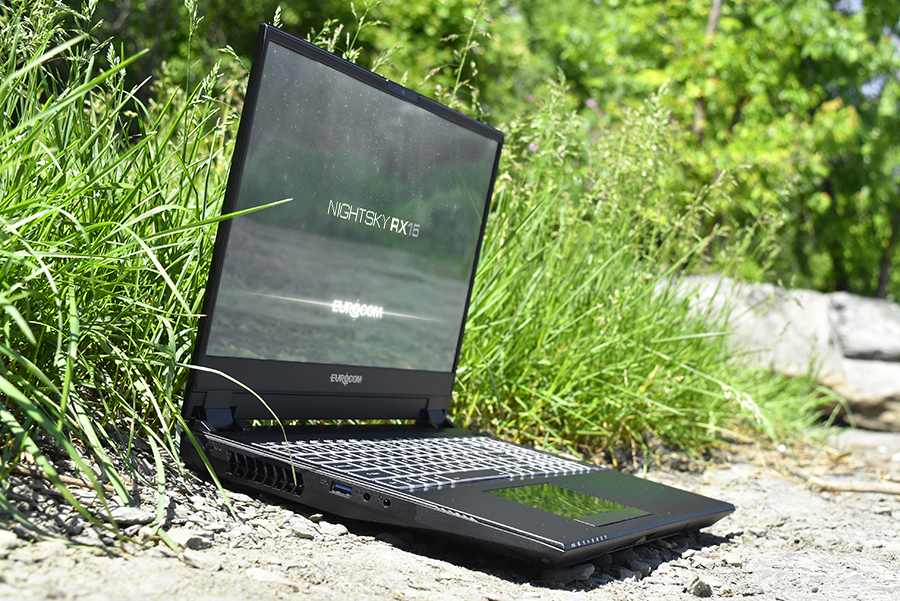
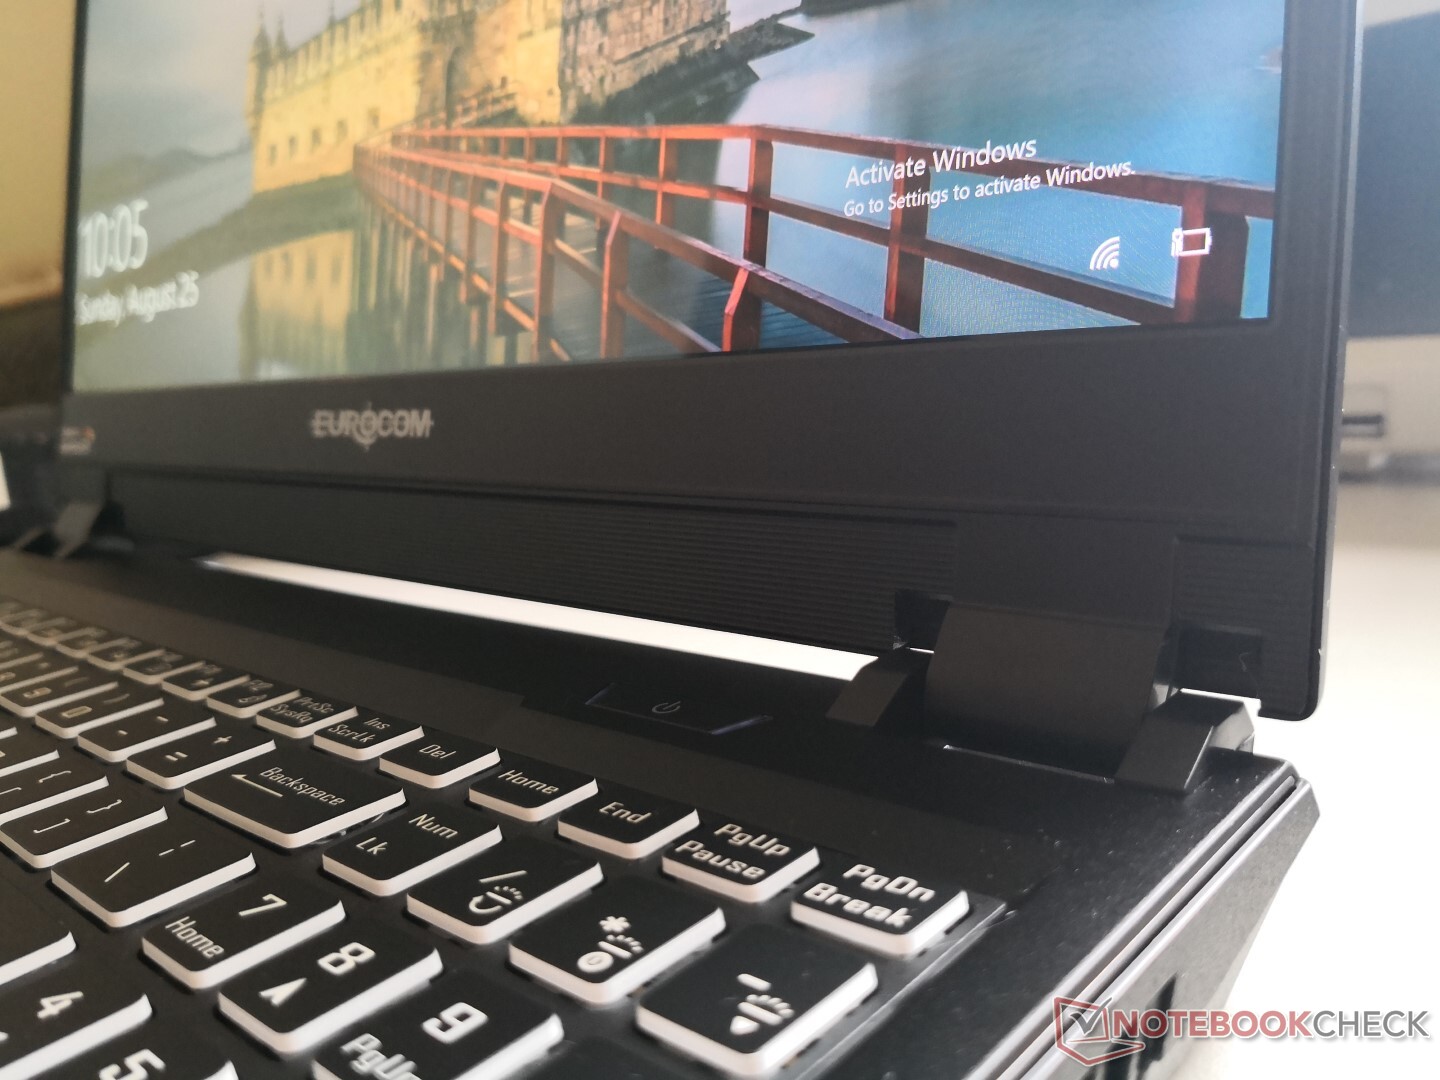
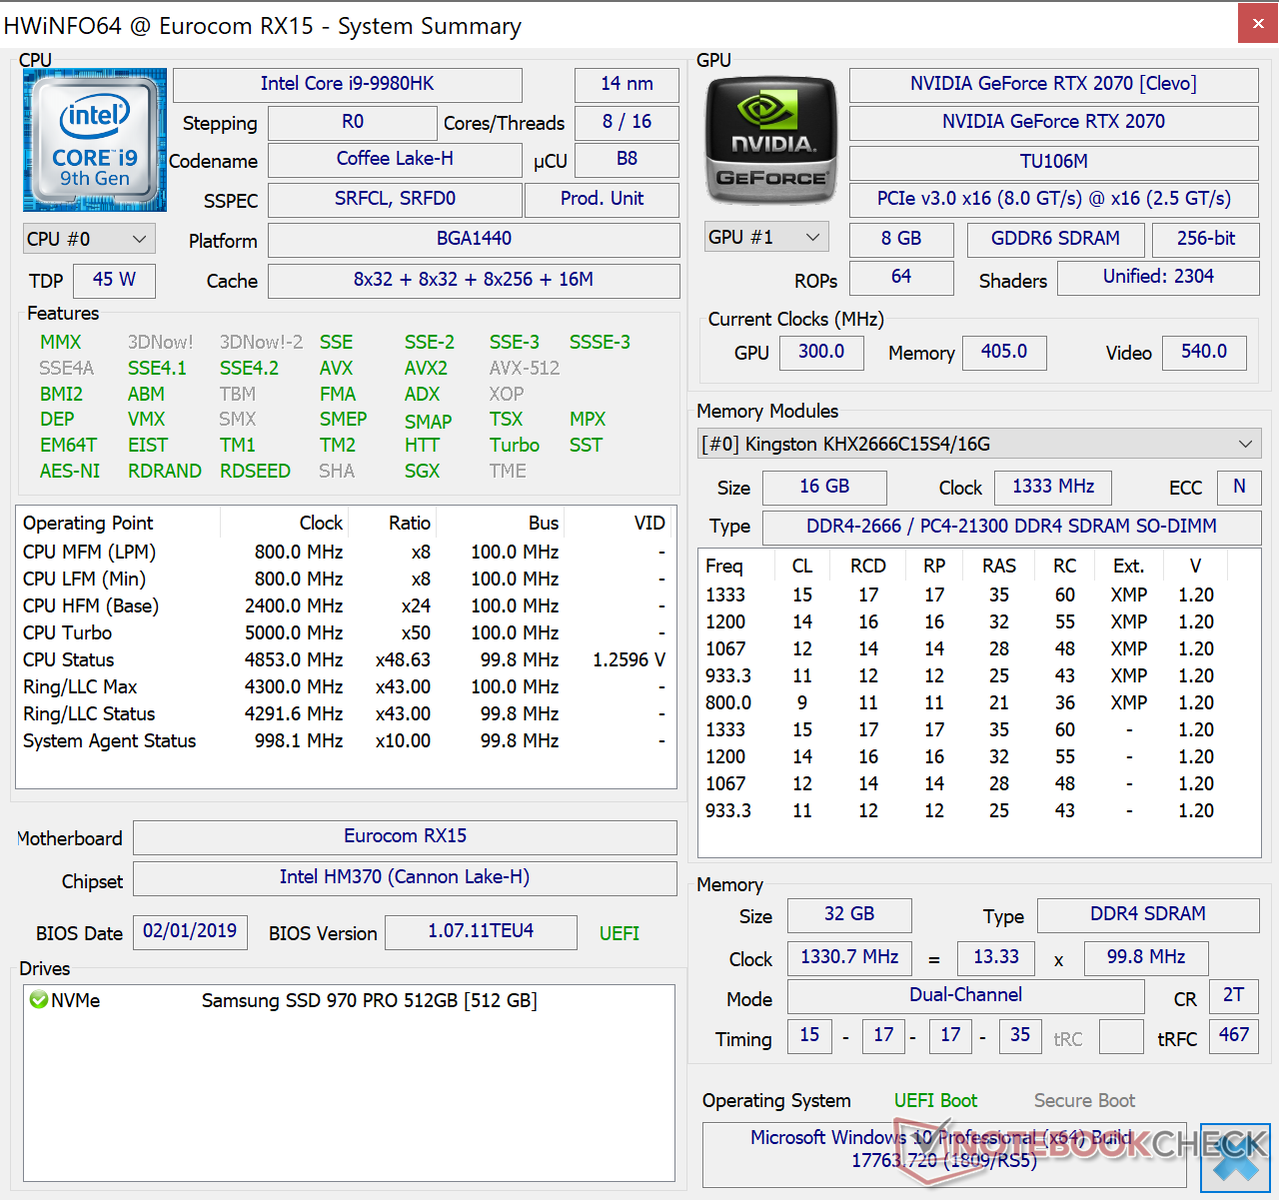
A diferencia de la mayor serie de recambios para ordenadores de sobremesa Eurocom Sky, la serie Nightsky de Eurocom está compuesta por portátiles para juegos más tradicionales con muchas funciones que los usuarios esperan de una oferta de gama alta que incluye iluminación RGB por tecla, biseles estrechos y gráficos GeForce RTX. Nuestra unidad de prueba actual es la configuración más avanzada de la Nightsky RX15 de 15,6 pulgadas equipada con una CPU Core i9-9980HK desbloqueada, una pantalla OLED de 4K UHD y gráficos GeForce RTX 2070.
El chasis de la Nightsky RX15 Clevo PB51RF es idéntico al de la Nightsky Ti15, por lo que le recomendamos que consulte nuestra revisión sobre la Nightsky Ti15 aquí para obtener más información sobre sus opciones de puerto, facilidad de uso, teclado, altavoces y otras características físicas. Para esta revisión, nos centraremos en el rendimiento y la pantalla OLED de la Nightsky RX15 para ver cómo se comparan con la configuración básica de la Nightsky Ti15. Entre los competidores directos en este espacio se incluyen otros portátiles para juegos de tamaño mediano de 15,6 pulgadas como el Lenovo Legion Y740, Dell Alienware m15, Asus ROG GL531 y HP Omen 15.
Consulte la página del producto de la Nightsky RX15 aquí para ver las opciones de configuración completas y la gama de precios.
Más reseñas de Eurocom:
Carcasa
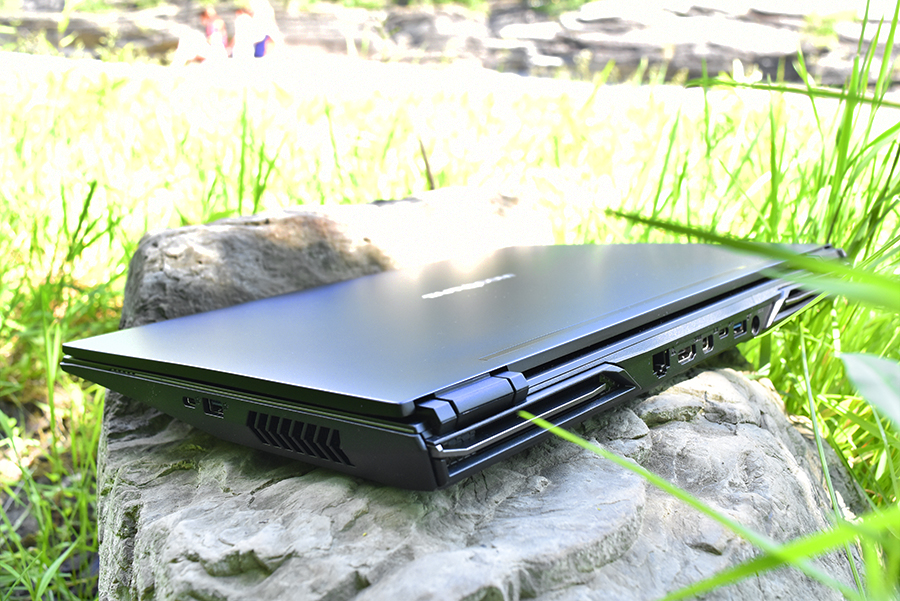
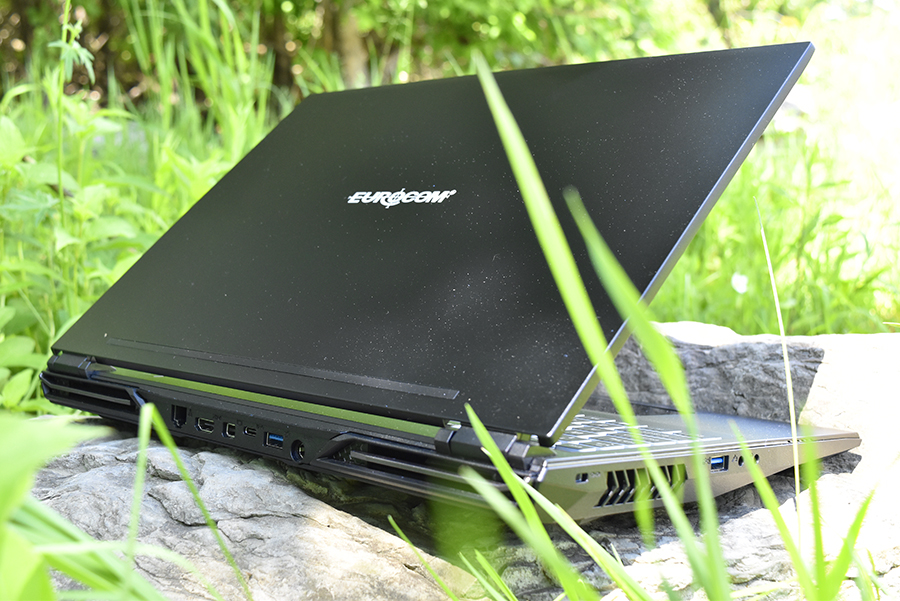
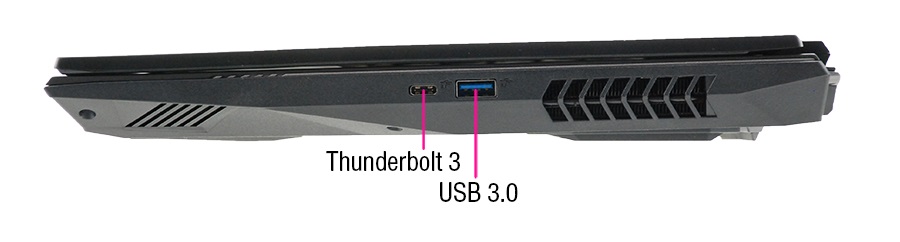
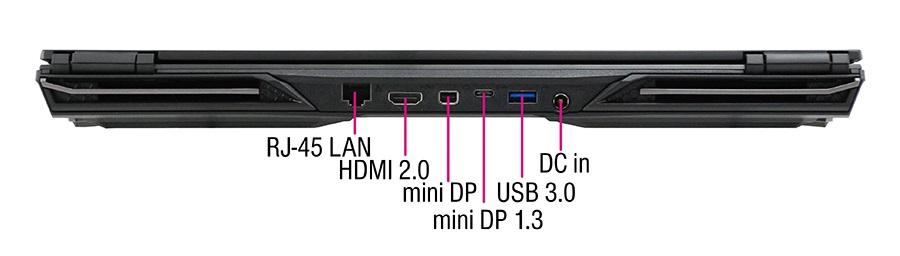
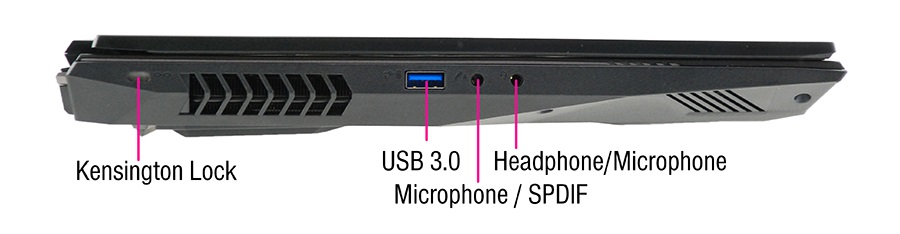
Conectividad
Lector de tarjetas SD
| SD Card Reader | |
| average JPG Copy Test (av. of 3 runs) | |
| Eurocom Sky X4C (Toshiba Exceria Pro SDXC 64 GB UHS-II) | |
| Eurocom Nightsky RX15 (Toshiba Exceria Pro SDXC 64 GB UHS-II) | |
| HP Omen 15-dc1303ng (Toshiba Exceria Pro SDXC 64 GB UHS-II) | |
| HP Gaming Pavilion 15-dk0009ng (Toshiba Exceria Pro SDXC 64 GB UHS-II) | |
| MSI GE63 Raider RGB 8RF-008 (Toshiba Exceria Pro SDXC 64 GB UHS-II) | |
| maximum AS SSD Seq Read Test (1GB) | |
| Eurocom Nightsky RX15 (Toshiba Exceria Pro SDXC 64 GB UHS-II) | |
| Eurocom Sky X4C (Toshiba Exceria Pro SDXC 64 GB UHS-II) | |
| HP Omen 15-dc1303ng (Toshiba Exceria Pro SDXC 64 GB UHS-II) | |
| HP Gaming Pavilion 15-dk0009ng (Toshiba Exceria Pro SDXC 64 GB UHS-II) | |
| MSI GE63 Raider RGB 8RF-008 (Toshiba Exceria Pro SDXC 64 GB UHS-II) | |
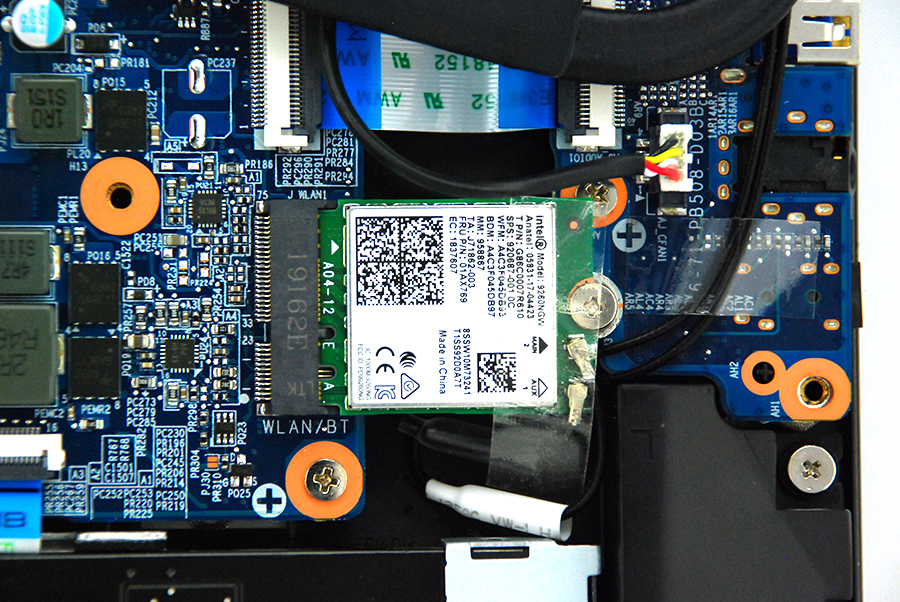
Comunicación
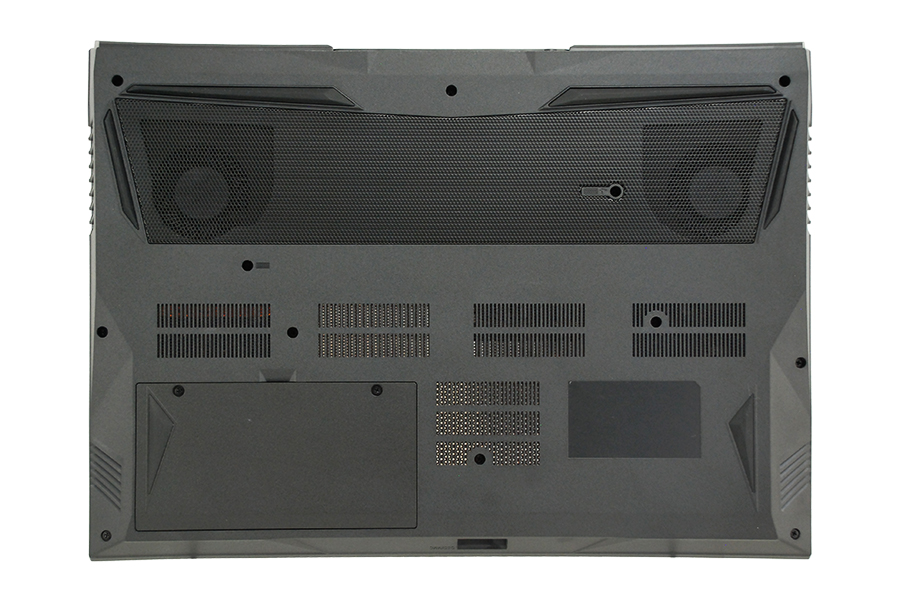
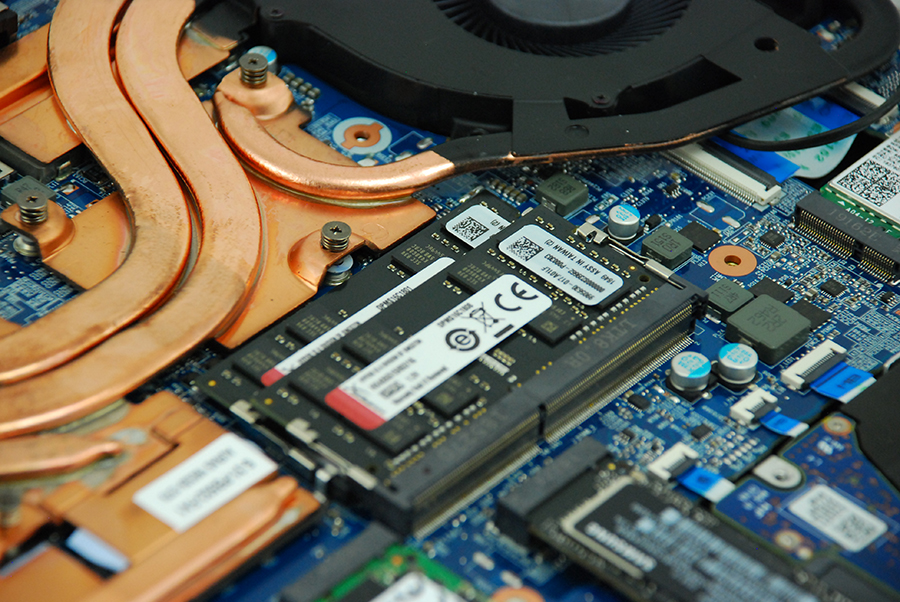
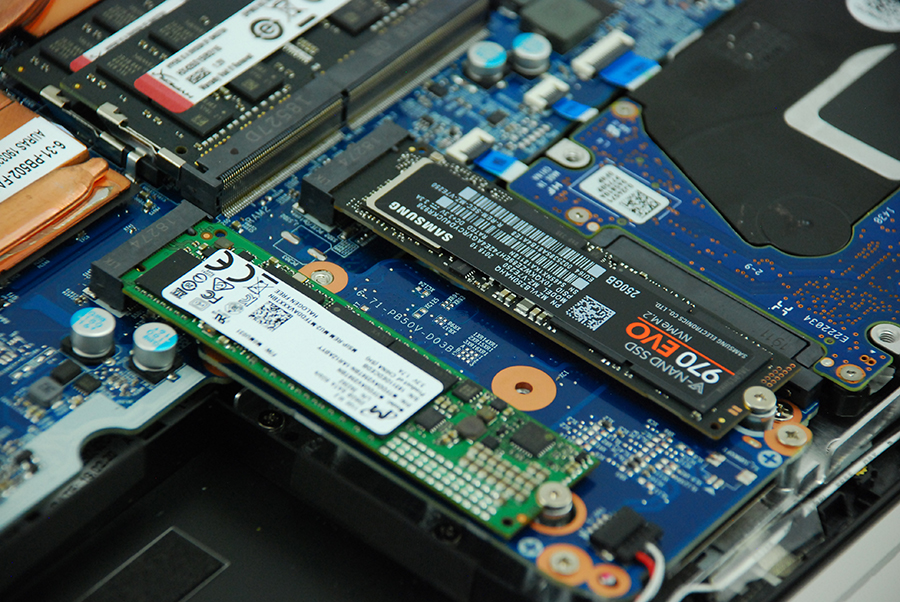
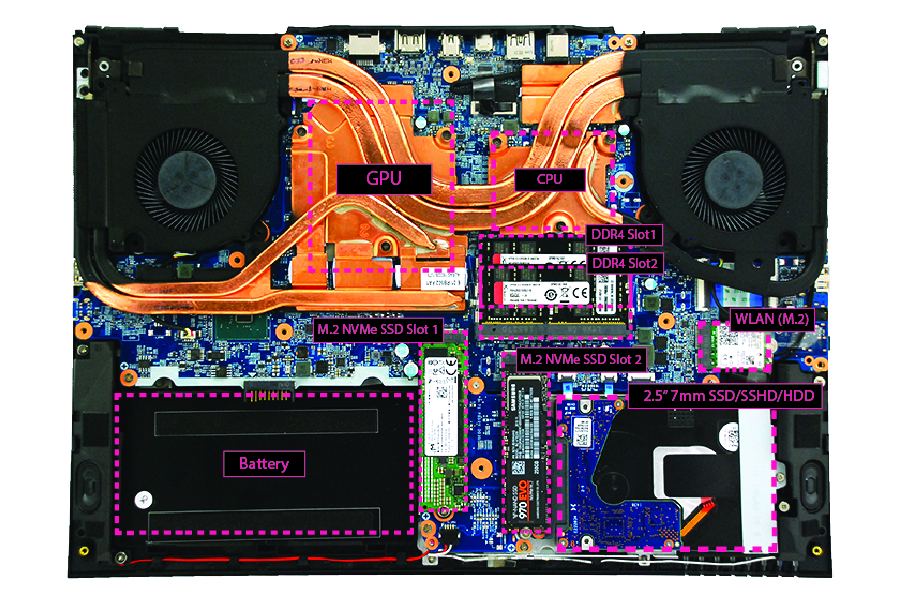
Mantenimiento
Display
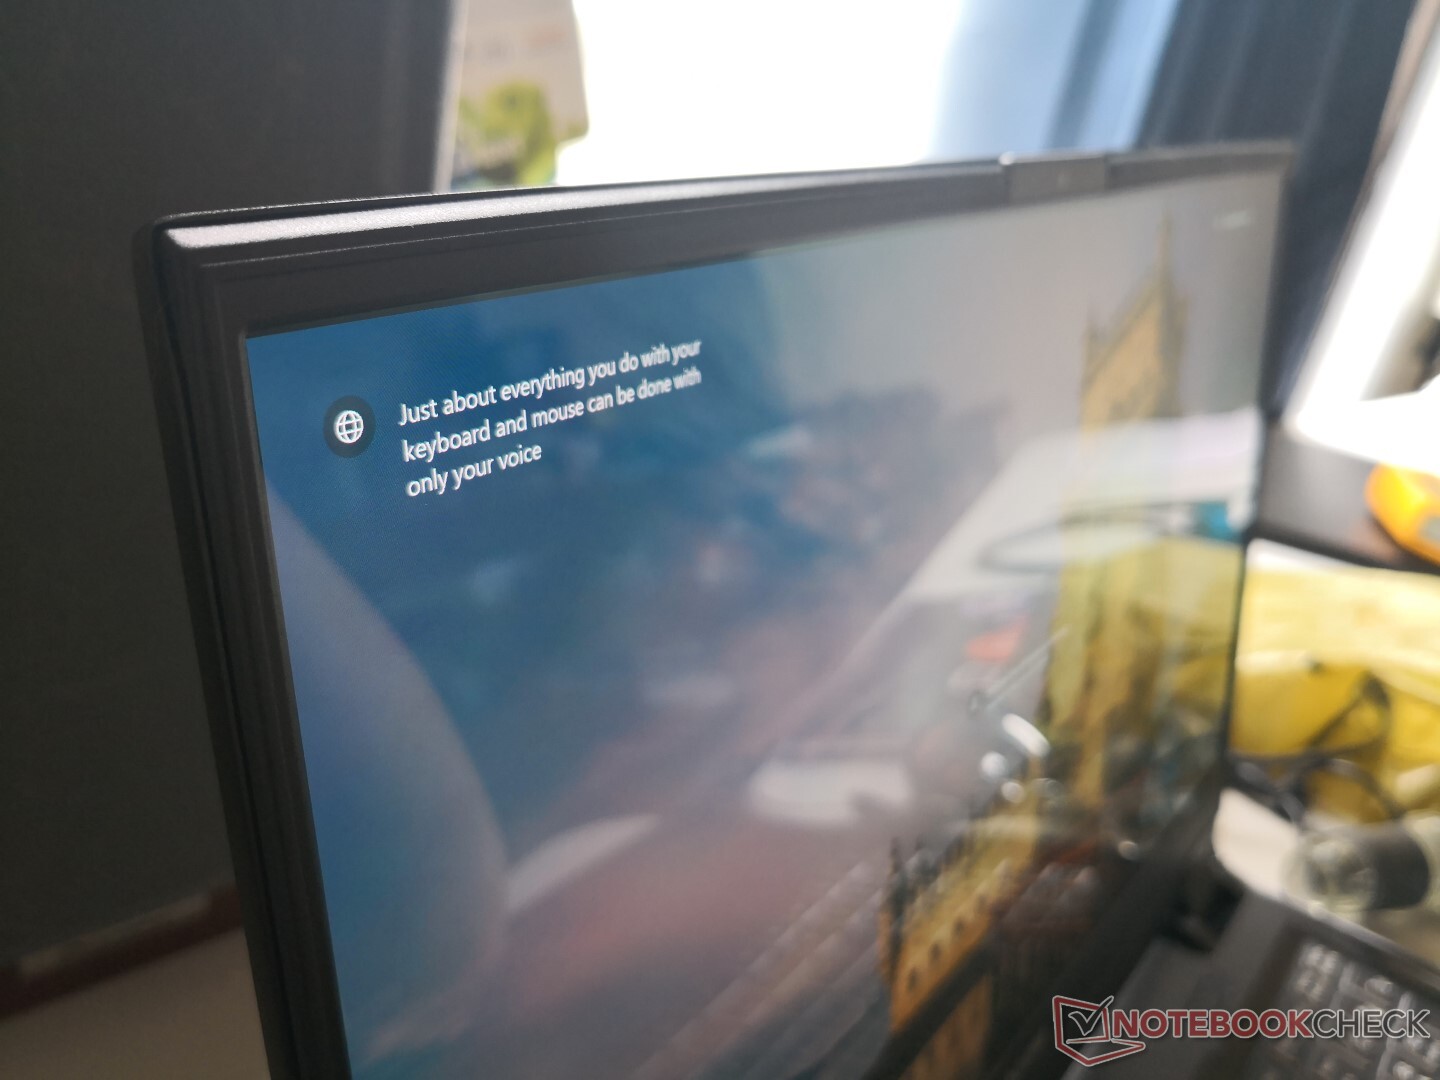
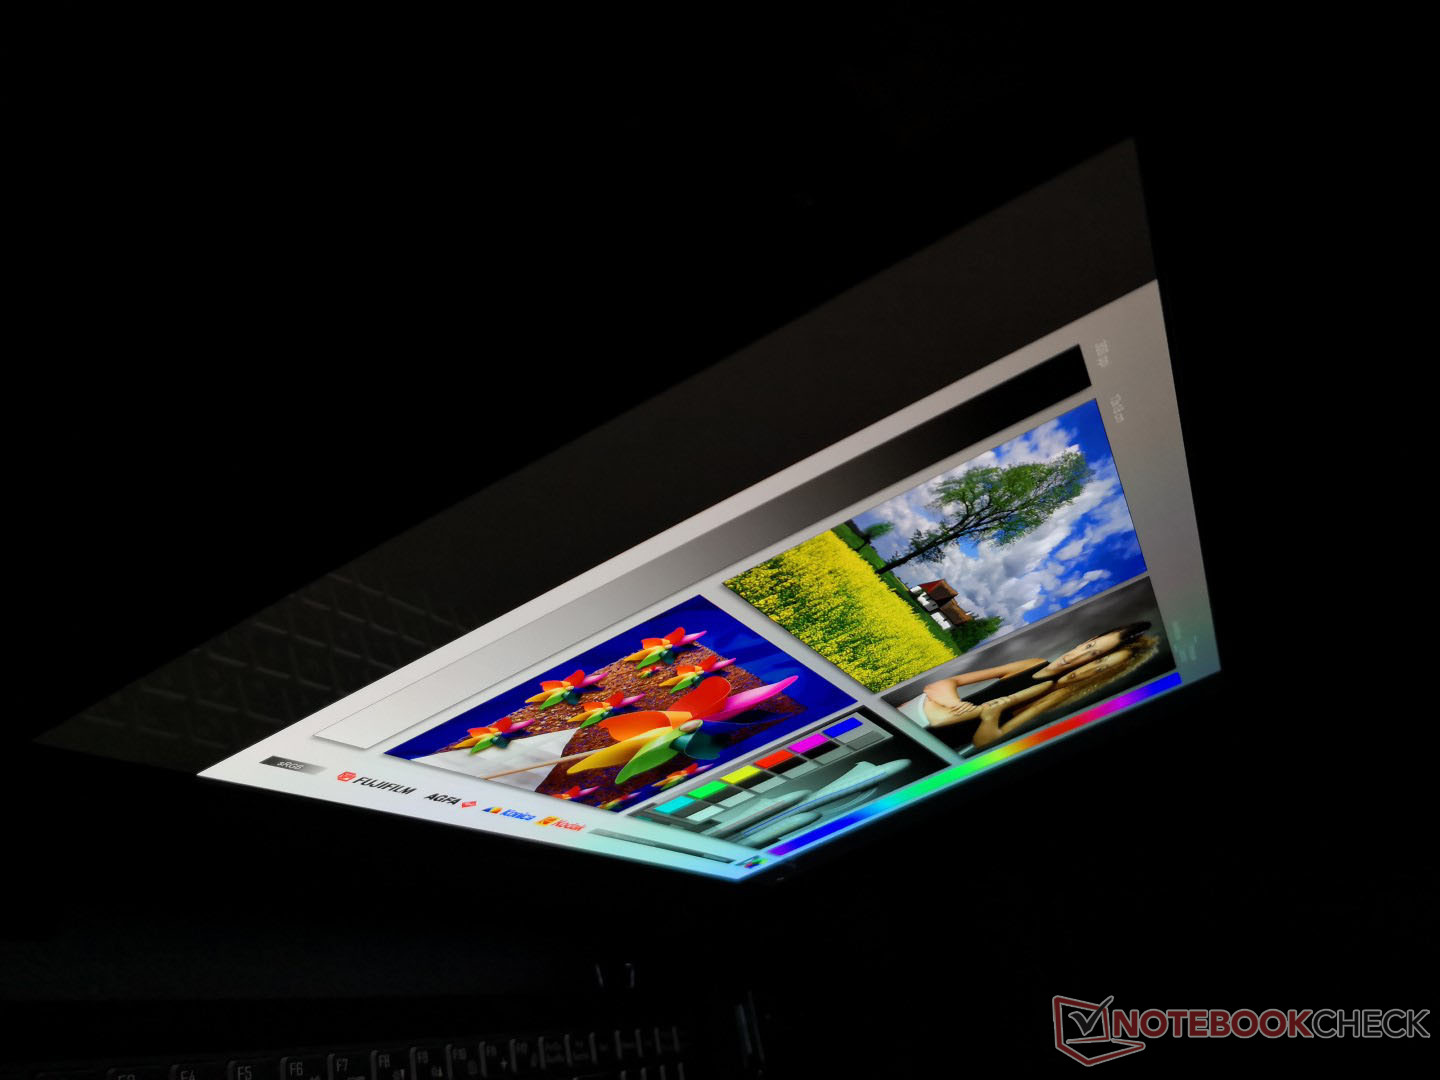
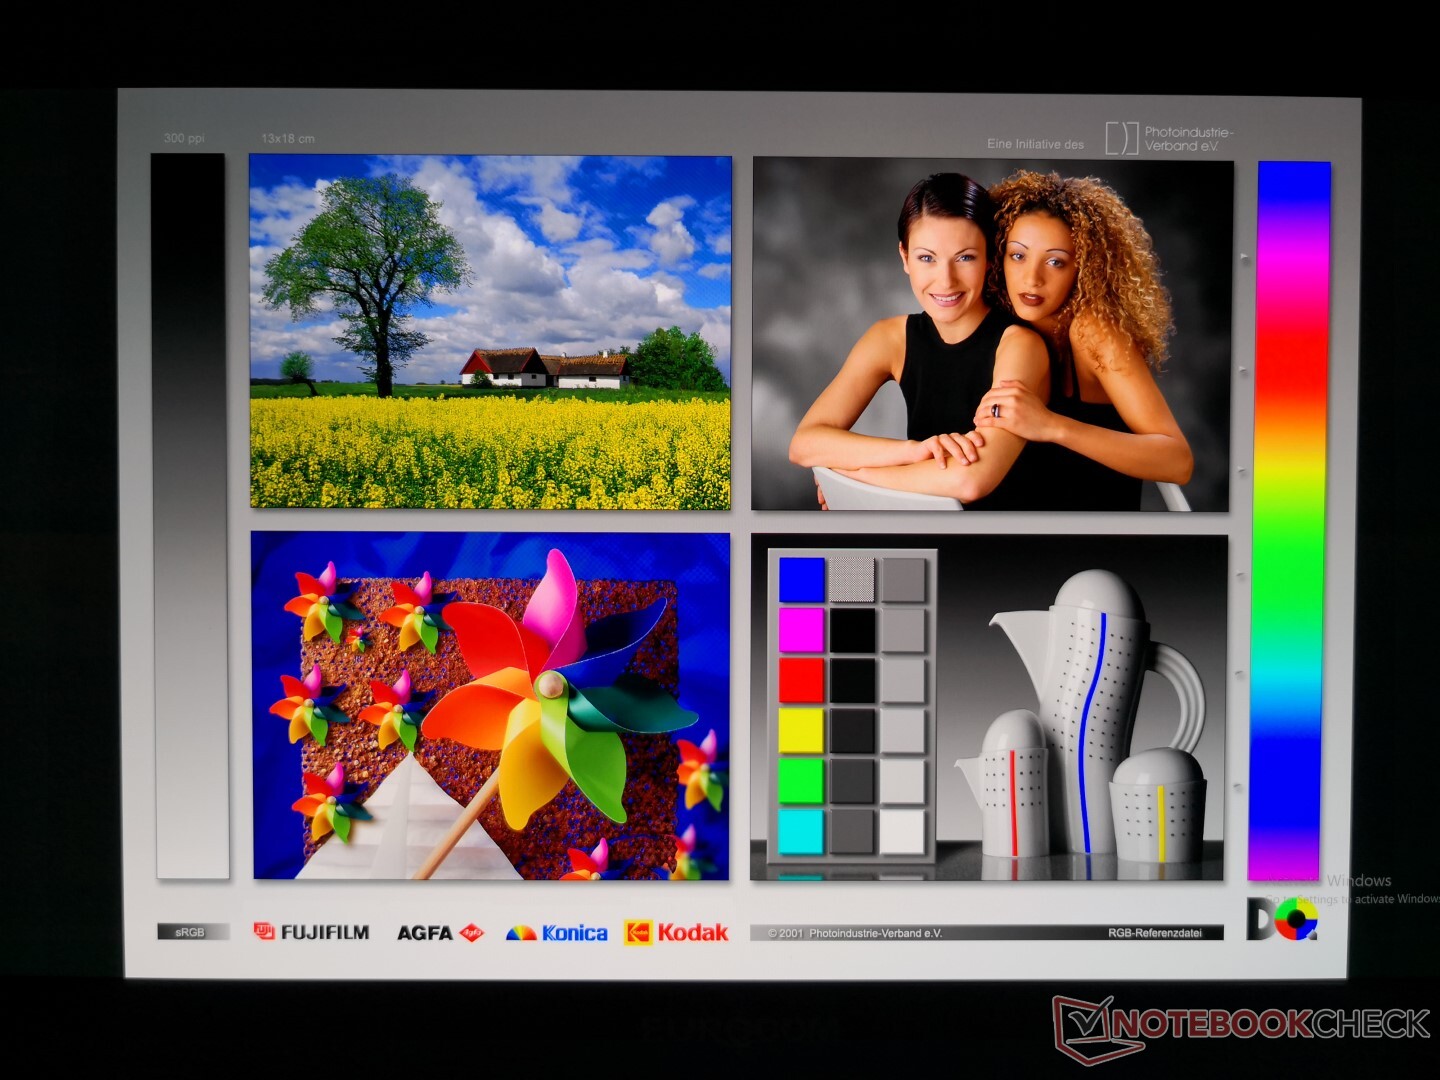
OLED ofrece una serie de ventajas - y desventajas - en comparación con la opción IPS de la serie Nightsky. Es un 20 por ciento más brillante con colores significativamente más profundos, negros oscuros, una resolución nativa más alta y casi sin fantasmas. Además, la superposición brillante permite obtener textos e imágenes más nítidos, especialmente si se compara con los paneles mate UHD IPS de 4K. El resultado es una calidad de imagen notablemente superior incluso a los mejores paneles IPS para portátiles de 15,6 pulgadas del mercado. Las diferencias son perceptibles a simple vista.
Una gran desventaja de los portátiles OLED en este momento es que el panel se limita a una frecuencia de actualización de sólo 60 Hz. Los últimos paneles IPS de 144 Hz y 240 Hz se sienten más suaves y con mayor capacidad de respuesta como resultado, especialmente cuando se juega a juegos de ritmo rápido.
Es importante señalar que Samsung es actualmente el único proveedor del mercado masivo de paneles UHD OLED de 15,6 pulgadas y 4K UHD para portátiles en el momento de escribir este artículo. Por lo tanto, este mismo controlador o panel Samsung SDCA029 también se puede encontrar en el XPS 15 7590, Gigabyte Aero 15, Alienware m15 y Razer Blade 15 para experiencias visuales muy similares entre ellos.

| |||||||||||||||||||||||||
iluminación: 88 %
Brillo con batería: 414.9 cd/m²
Contraste: ∞:1 (Negro: 0 cd/m²)
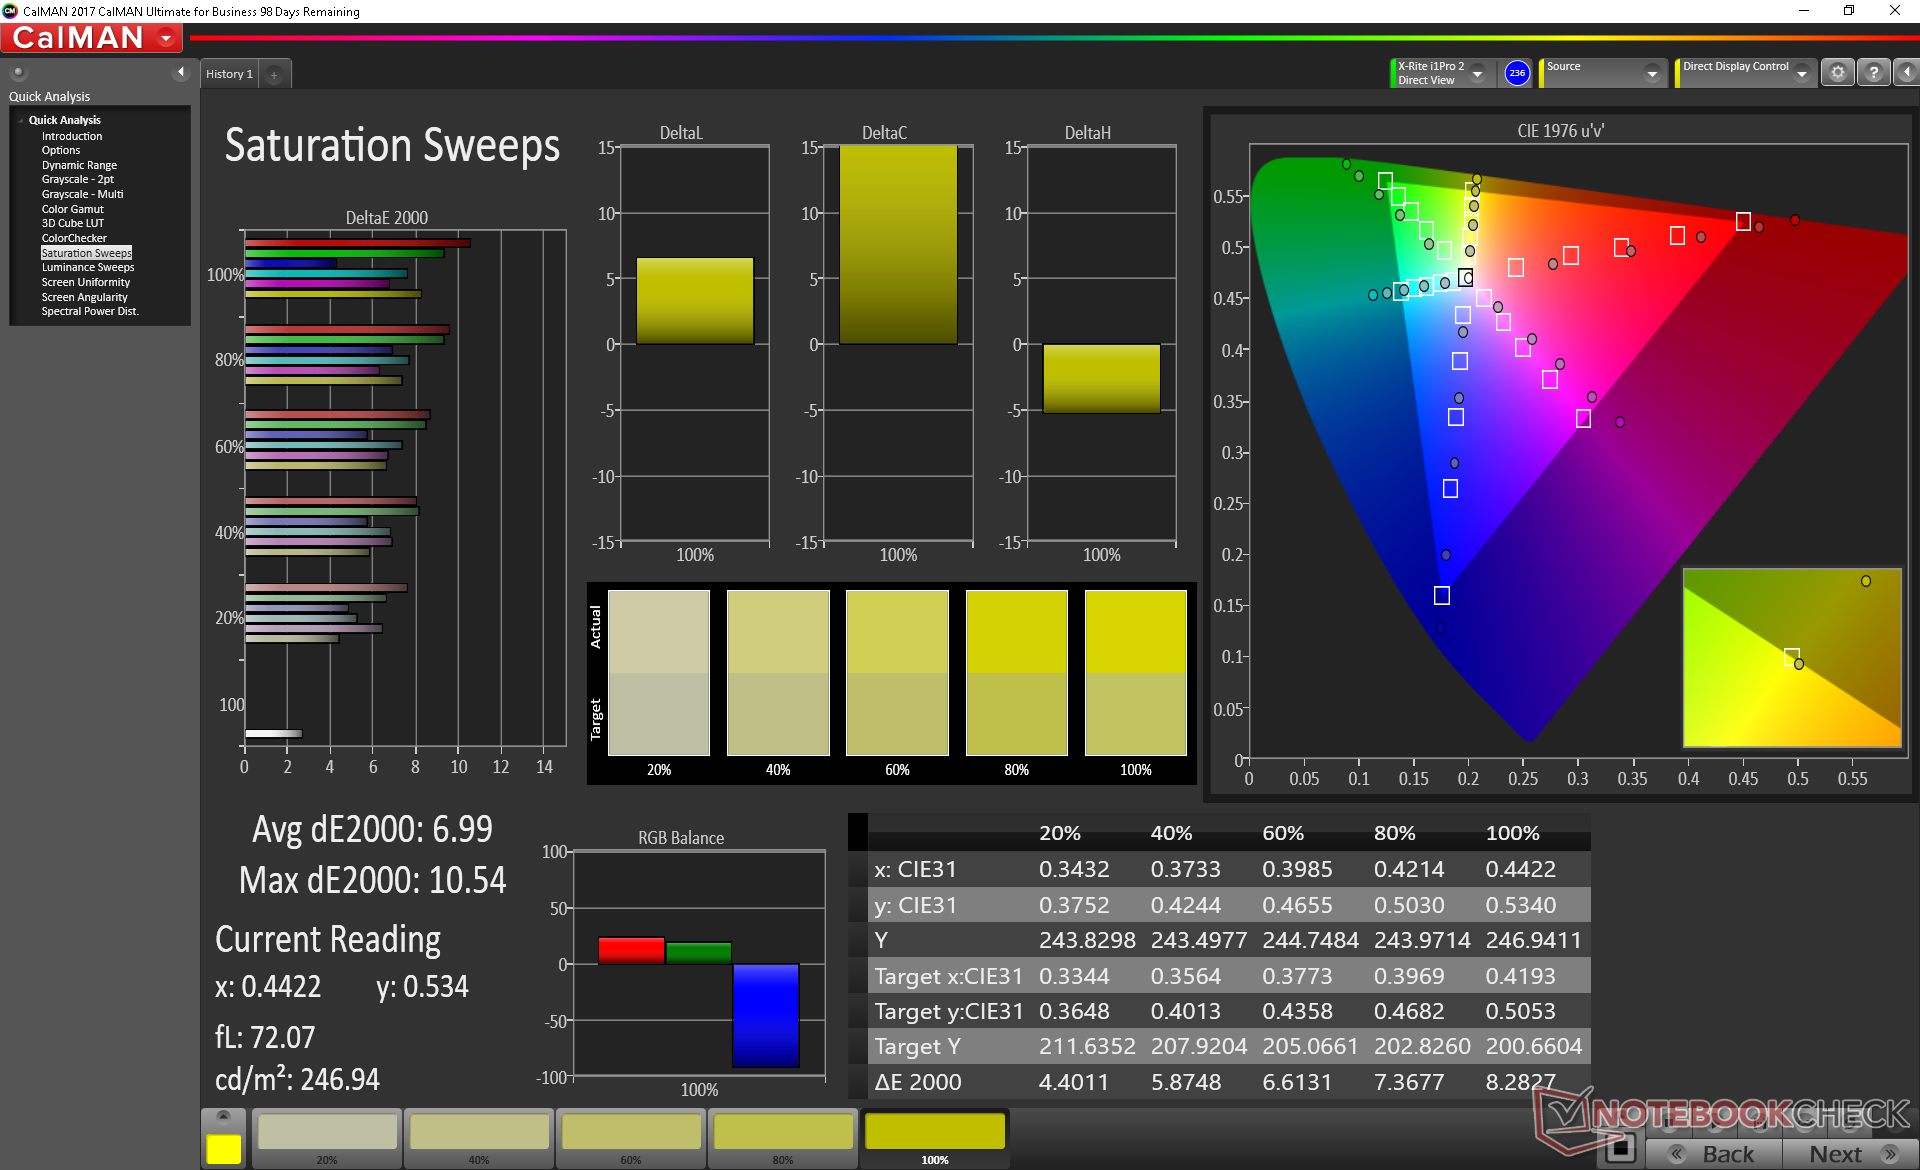
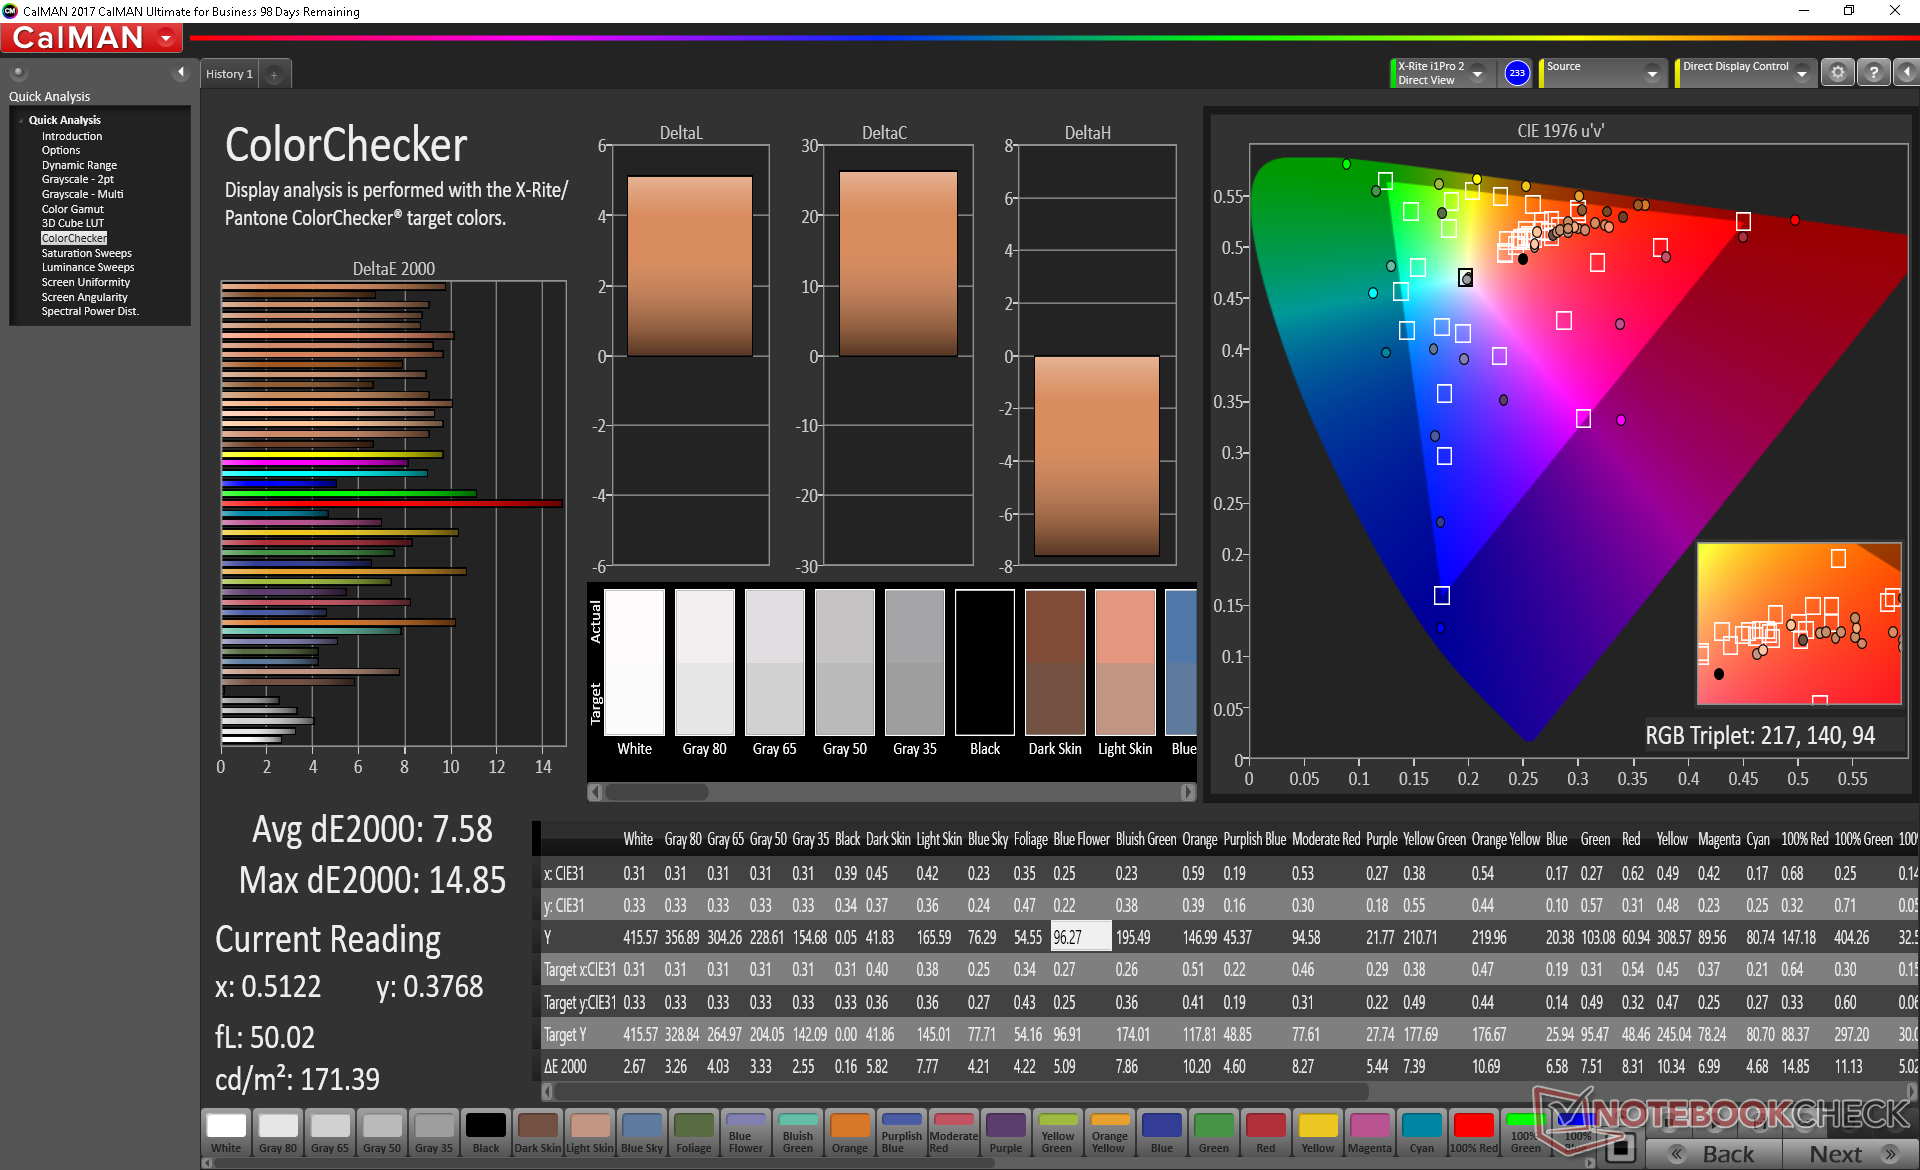
ΔE ColorChecker Calman: 7.58 | ∀{0.5-29.43 Ø4.71}
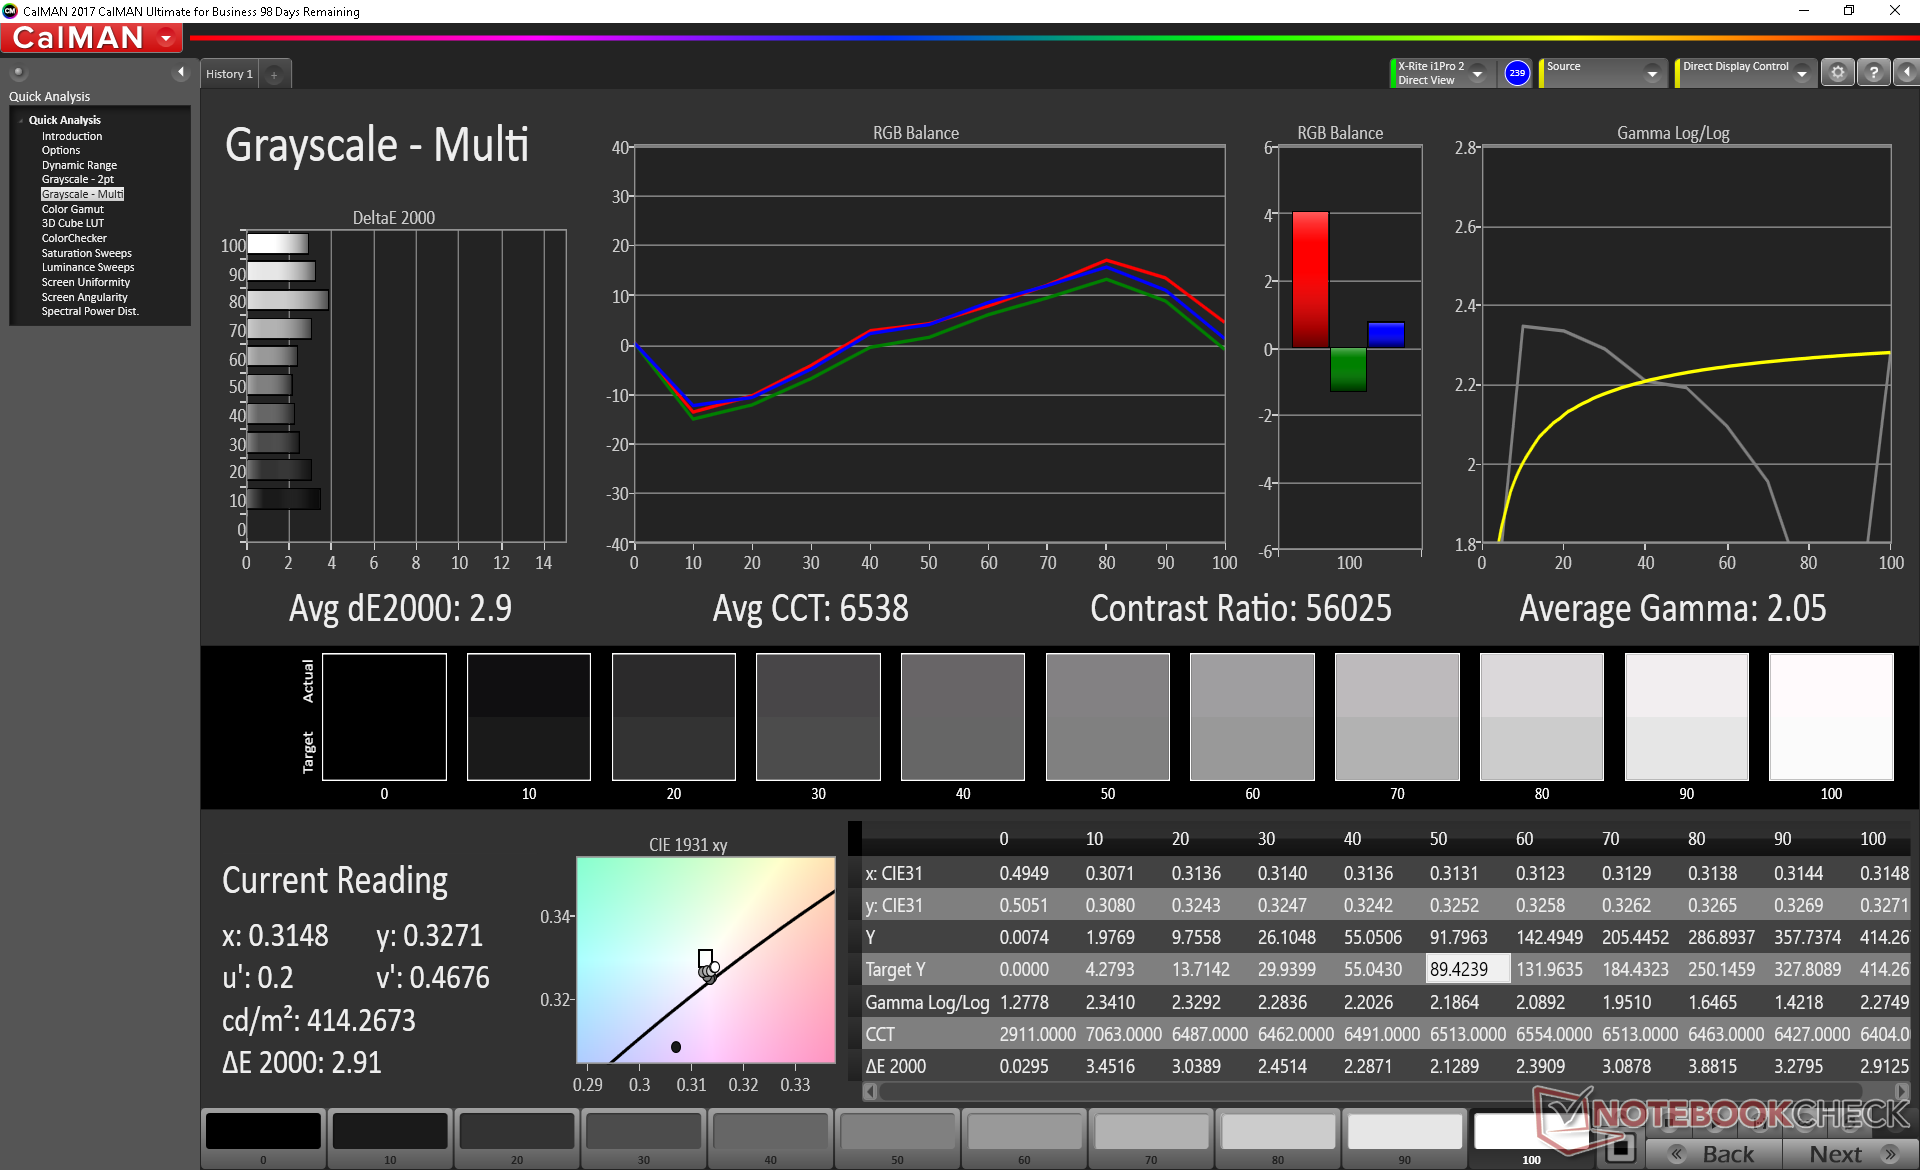
ΔE Greyscale Calman: 2.9 | ∀{0.09-98 Ø4.96}
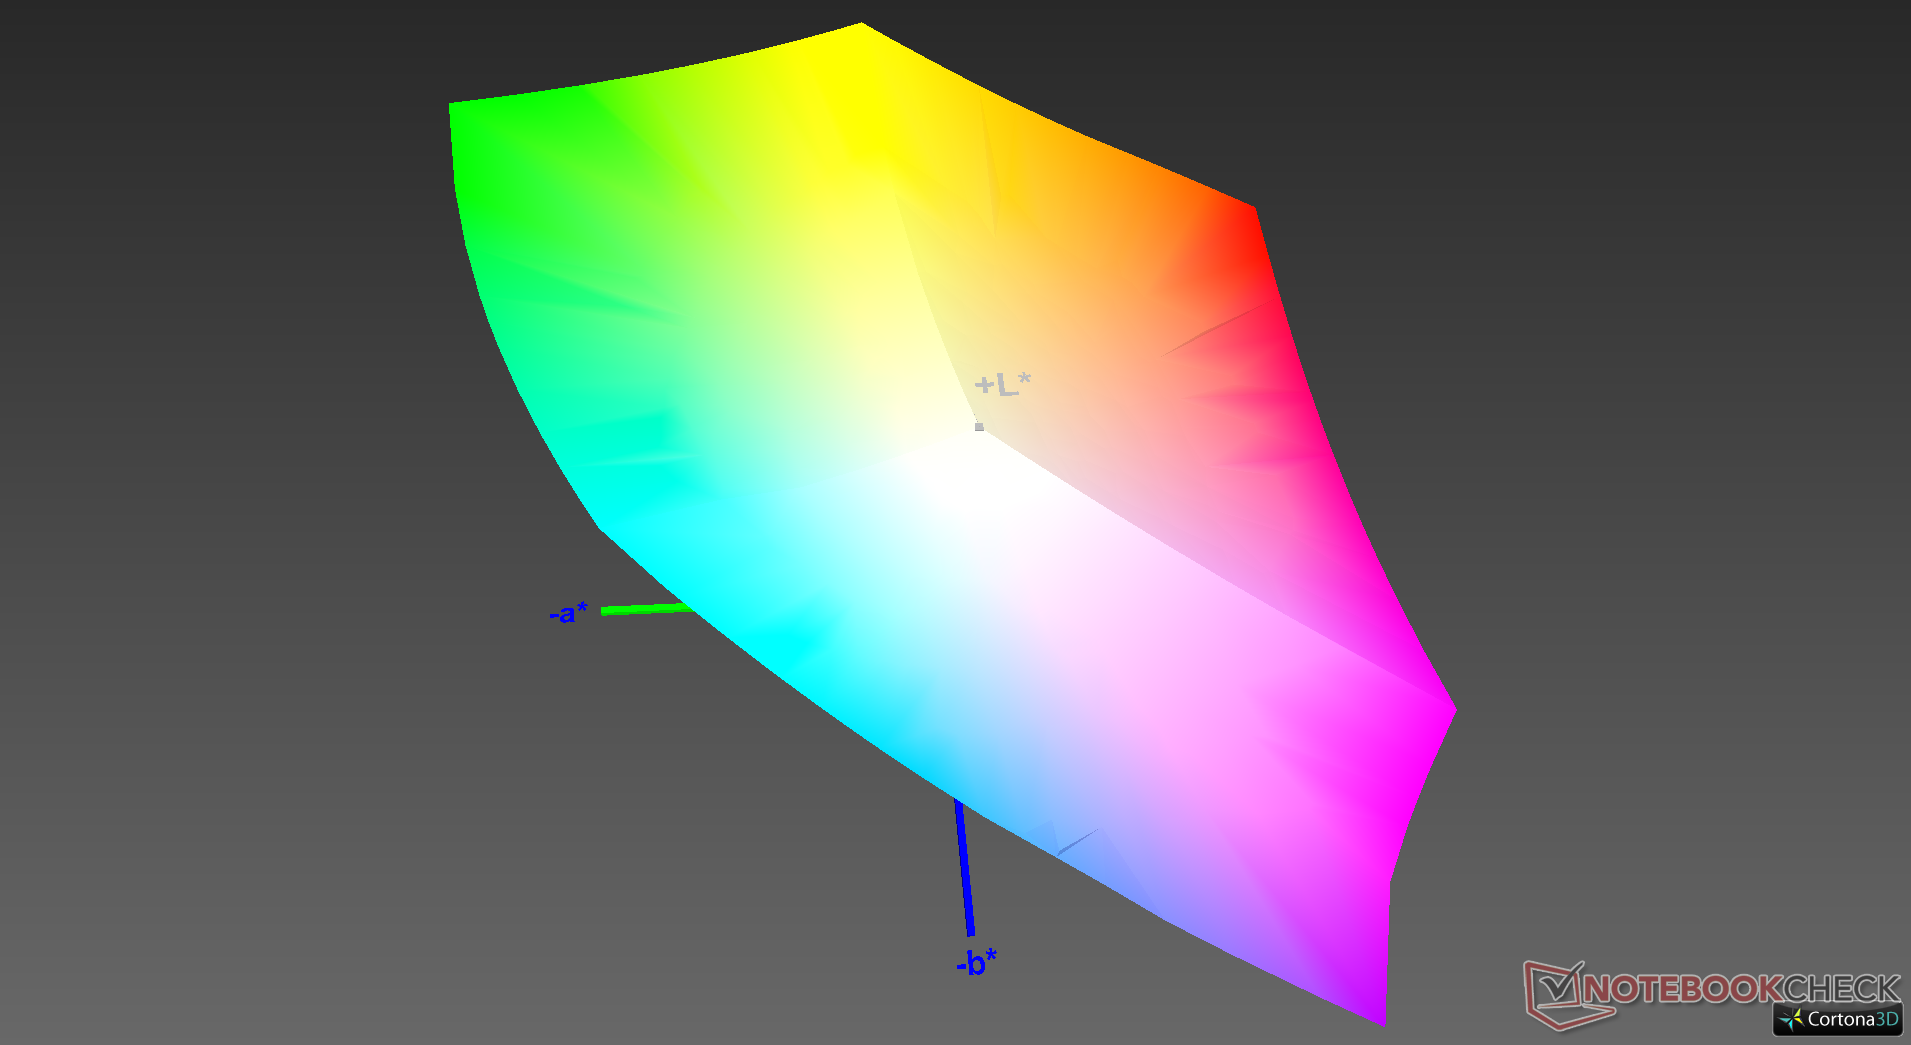
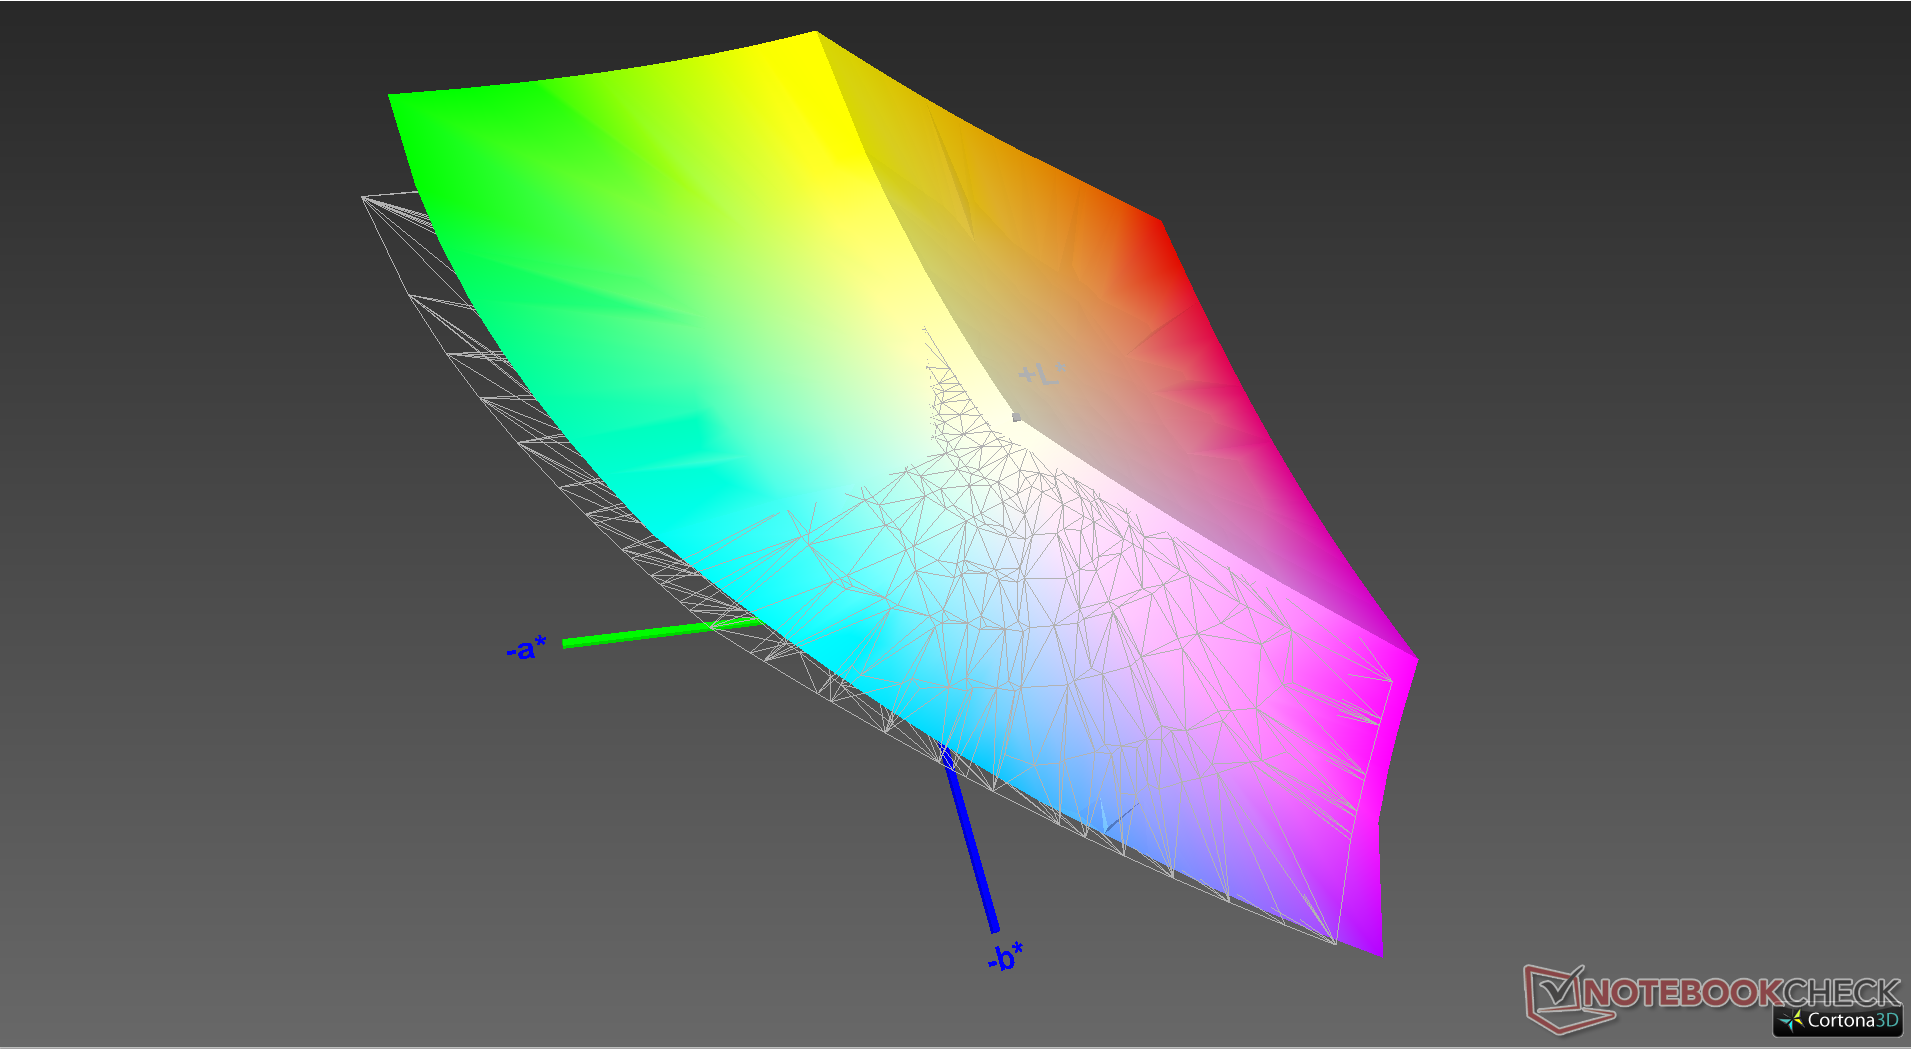
100% sRGB (Argyll 1.6.3 3D)
88.2% AdobeRGB 1998 (Argyll 1.6.3 3D)
99.1% AdobeRGB 1998 (Argyll 3D)
100% sRGB (Argyll 3D)
99.9% Display P3 (Argyll 3D)
Gamma: 2.05
CCT: 6538 K
| Eurocom Nightsky RX15 Samsung SDCA029, OLED, 15.6", 3840x2160 | Eurocom Nightsky Ti15 AU Optronics B156HAN, IPS, 15.6", 1920x1080 | Eurocom Sky X4C ID: SHP142A, Name: LQ156D1JX01B, IPS, 15.6", 3840x2160 | Dell XPS 15 7590 9980HK GTX 1650 Samsung 156WR04, SDCA029, OLED, 15.6", 3840x2160 | HP Omen 15-dc1303ng LG Philips LGD05C0, IPS, 15.6", 1920x1080 | MSI GE63 Raider RGB 8RF-008 CMN N156HHE-GA1 (CMN15F4), TN, 15.6", 1920x1080 | |
|---|---|---|---|---|---|---|
| Display | -26% | -23% | -6% | -26% | -8% | |
| Display P3 Coverage (%) | 99.9 | 65.2 -35% | 65.1 -35% | 88.1 -12% | 63.8 -36% | 90 -10% |
| sRGB Coverage (%) | 100 | 90.9 -9% | 96.5 -3% | 99.6 0% | 93.4 -7% | 100 0% |
| AdobeRGB 1998 Coverage (%) | 99.1 | 66.3 -33% | 67.2 -32% | 91.8 -7% | 65 -34% | 86 -13% |
| Response Times | -385% | -1239% | 6% | -403% | -713% | |
| Response Time Grey 50% / Grey 80% * (ms) | 2.4 ? | 14.4 ? -500% | 33.6 ? -1300% | 2.3 ? 4% | 14 ? -483% | 24.4 ? -917% |
| Response Time Black / White * (ms) | 2.6 ? | 9.6 ? -269% | 33.2 ? -1177% | 2.4 ? 8% | 11 ? -323% | 15.8 ? -508% |
| PWM Frequency (Hz) | 59.5 ? | 1000 ? | 59.5 ? | 25510 ? | ||
| Screen | -3% | -13% | 6% | 6% | -11% | |
| Brightness middle (cd/m²) | 414.9 | 331 -20% | 324.7 -22% | 421.2 2% | 316 -24% | 292 -30% |
| Brightness (cd/m²) | 404 | 327 -19% | 318 -21% | 417 3% | 295 -27% | 258 -36% |
| Brightness Distribution (%) | 88 | 83 -6% | 81 -8% | 94 7% | 84 -5% | 81 -8% |
| Black Level * (cd/m²) | 0.35 | 0.26 | 0.42 | 0.23 | ||
| Colorchecker dE 2000 * | 7.58 | 4.22 44% | 4.67 38% | 6.06 20% | 2.7 64% | 5.82 23% |
| Colorchecker dE 2000 max. * | 14.85 | 6.95 53% | 8.16 45% | 11.89 20% | 5.65 62% | 9.05 39% |
| Greyscale dE 2000 * | 2.9 | 3.9 -34% | 5.9 -103% | 2.8 3% | 2.35 19% | 4.61 -59% |
| Gamma | 2.05 107% | 2.26 97% | 2.14 103% | 2.15 102% | 2.41 91% | 2.65 83% |
| CCT | 6538 99% | 7392 88% | 7176 91% | 6235 104% | 6904 94% | 6950 94% |
| Color Space (Percent of AdobeRGB 1998) (%) | 88.2 | 59 -33% | 61.1 -31% | 81 -8% | 60 -32% | 76 -14% |
| Color Space (Percent of sRGB) (%) | 100 | 90.5 -9% | 96.1 -4% | 99.6 0% | 93 -7% | 100 0% |
| Contrast (:1) | 946 | 1249 | 752 | 1270 | ||
| Colorchecker dE 2000 calibrated * | 3.27 | 1.58 | 2.82 | |||
| Media total (Programa/Opciones) | -138% /
-67% | -425% /
-204% | 2% /
3% | -141% /
-64% | -244% /
-118% |
* ... más pequeño es mejor
Eurocom anuncia una cobertura del 100 por ciento de DCI-P3, a diferencia de otros portátiles OLED de 15,6 pulgadas del mercado con el mismo panel de Samsung. Nuestras propias mediciones muestran una cobertura 3D del 88% del estándar AdobeRGB con una gran parte del espacio de color que no se superpone a AdobeRGB, ya que DCI-P3 es más amplio que AdobeRGB.
Tiempos de respuesta del display
| ↔ Tiempo de respuesta de Negro a Blanco | ||
|---|---|---|
| 2.6 ms ... subida ↗ y bajada ↘ combinada | ↗ 1.3 ms subida | 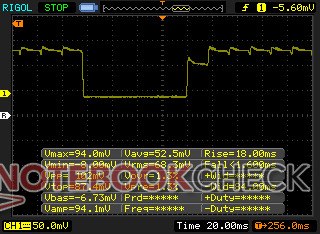 |
| ↘ 1.3 ms bajada | ||
| La pantalla mostró tiempos de respuesta muy rápidos en nuestros tests y debería ser adecuada para juegos frenéticos. En comparación, todos los dispositivos de prueba van de ##min### (mínimo) a 240 (máximo) ms. » 14 % de todos los dispositivos son mejores. Esto quiere decir que el tiempo de respuesta medido es mejor que la media (19.8 ms) de todos los dispositivos testados. | ||
| ↔ Tiempo de respuesta 50% Gris a 80% Gris | ||
| 2.4 ms ... subida ↗ y bajada ↘ combinada | ↗ 1.2 ms subida | 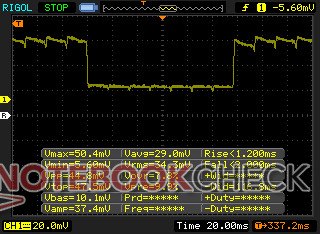 |
| ↘ 1.2 ms bajada | ||
| La pantalla mostró tiempos de respuesta muy rápidos en nuestros tests y debería ser adecuada para juegos frenéticos. En comparación, todos los dispositivos de prueba van de ##min### (mínimo) a 636 (máximo) ms. » 11 % de todos los dispositivos son mejores. Esto quiere decir que el tiempo de respuesta medido es mejor que la media (30.9 ms) de todos los dispositivos testados. | ||
Parpadeo de Pantalla / PWM (Pulse-Width Modulation)
| Parpadeo de Pantalla / PWM detectado | 59.5 Hz | ≤ 100 % de brillo | 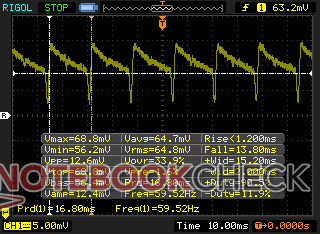 |
La retroiluminación del display parpadea a 59.5 Hz (seguramente usa PWM - Pulse-Width Modulation) a un brillo del 100 % e inferior. Sobre este nivel de brillo no debería darse parpadeo / PWM. La frecuencia de 59.5 Hz es bajísima, por lo que el parpadeo puede causar fatiga visual y cefaleas cuando se usa mucho tiempo. Comparación: 52 % de todos los dispositivos testados no usaron PWM para atenuar el display. Si se usó, medimos una media de 7748 (mínimo: 5 - máxmo: 343500) Hz. | |||
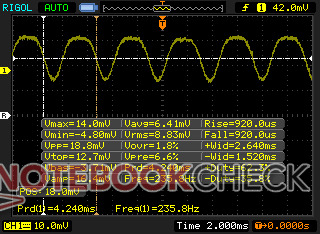
Al igual que lo que descubrimos en el XPS 15 7590 OLED y Razer Blade 15 OLED, el Nightsky RX15 OLED exhibe un comportamiento PWM similar que cambia dependiendo del nivel de brillo. Con un 49 por ciento de brillo y más, la frecuencia es estable a 59,52 Hz, mientras que la frecuencia cambia abruptamente a 235,8 Hz cuando se ajusta a 48 por ciento o menos. Este comportamiento no se observa en portátiles con paneles IPS.

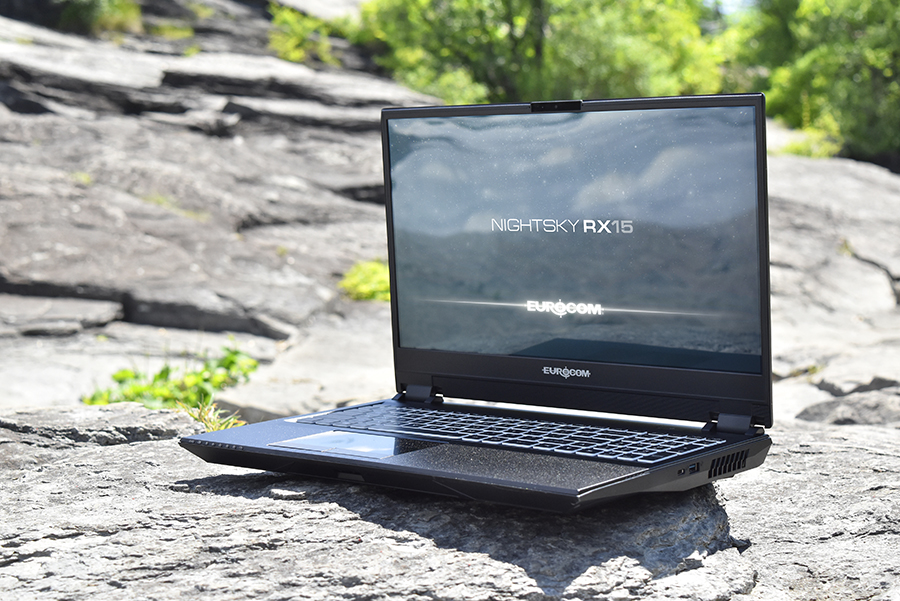
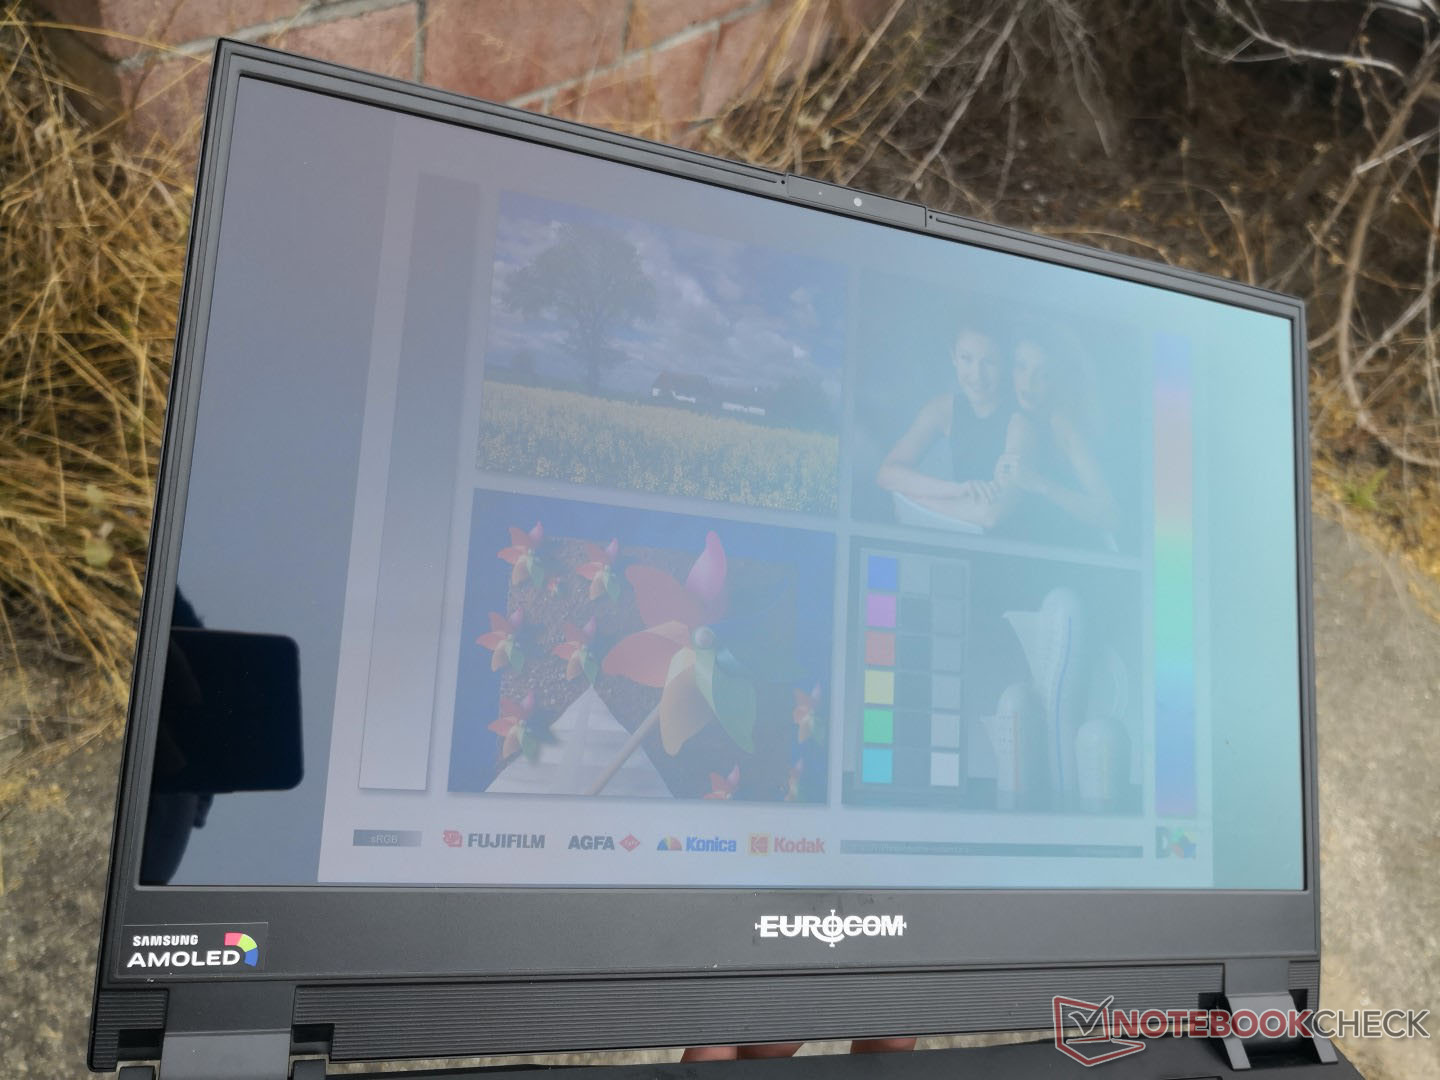
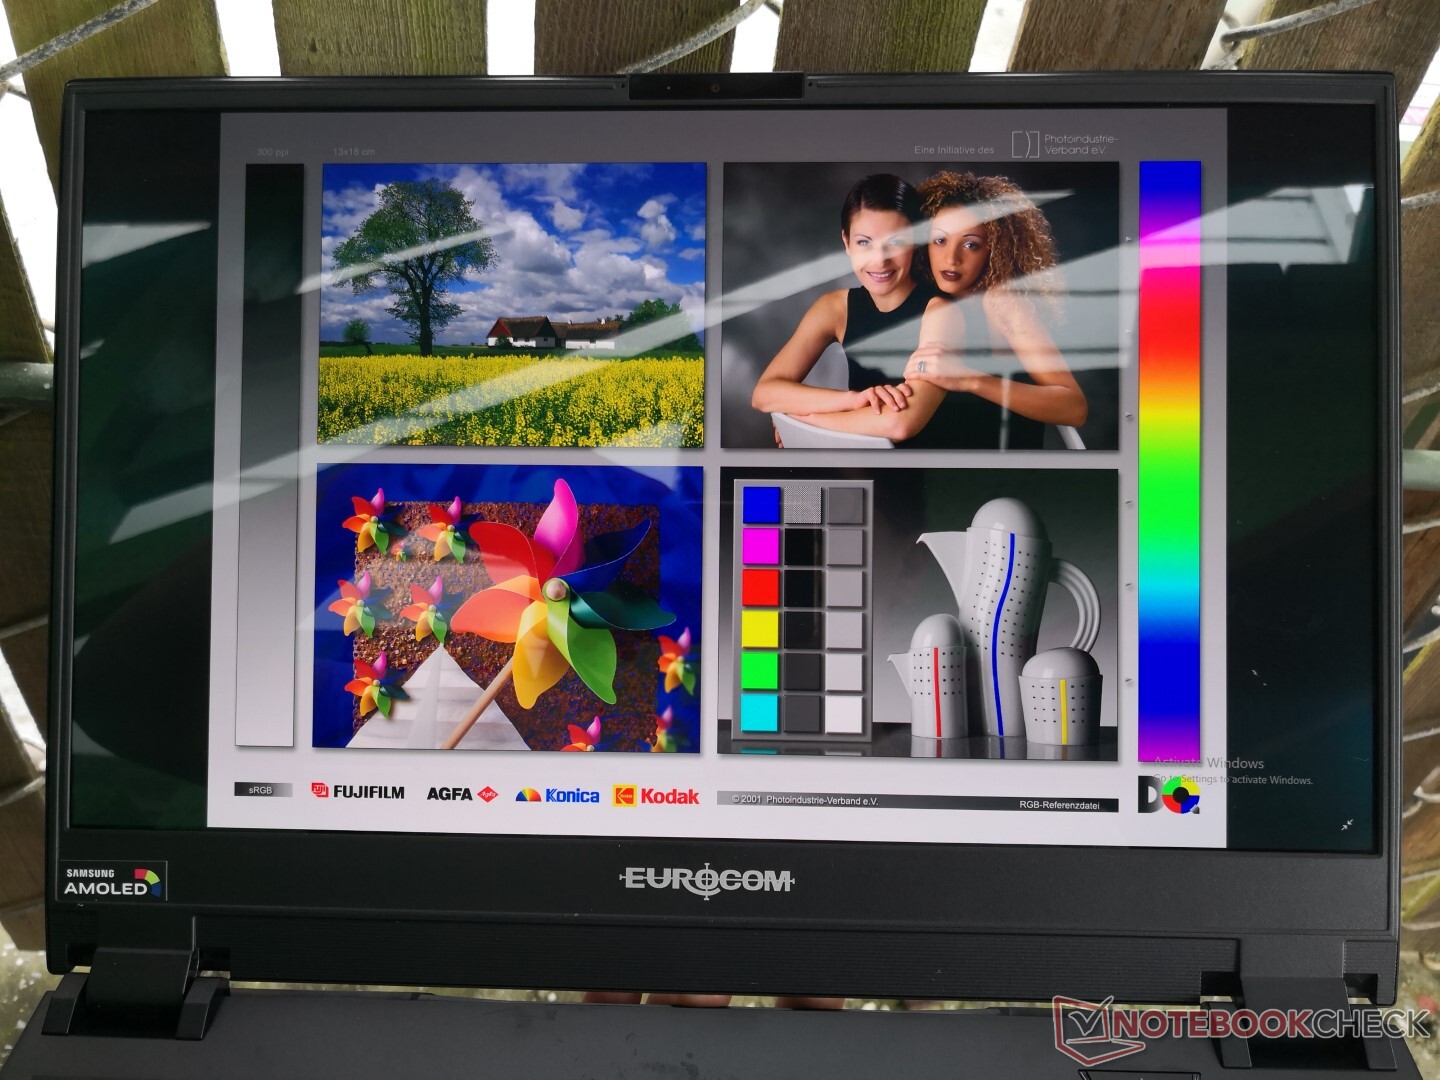
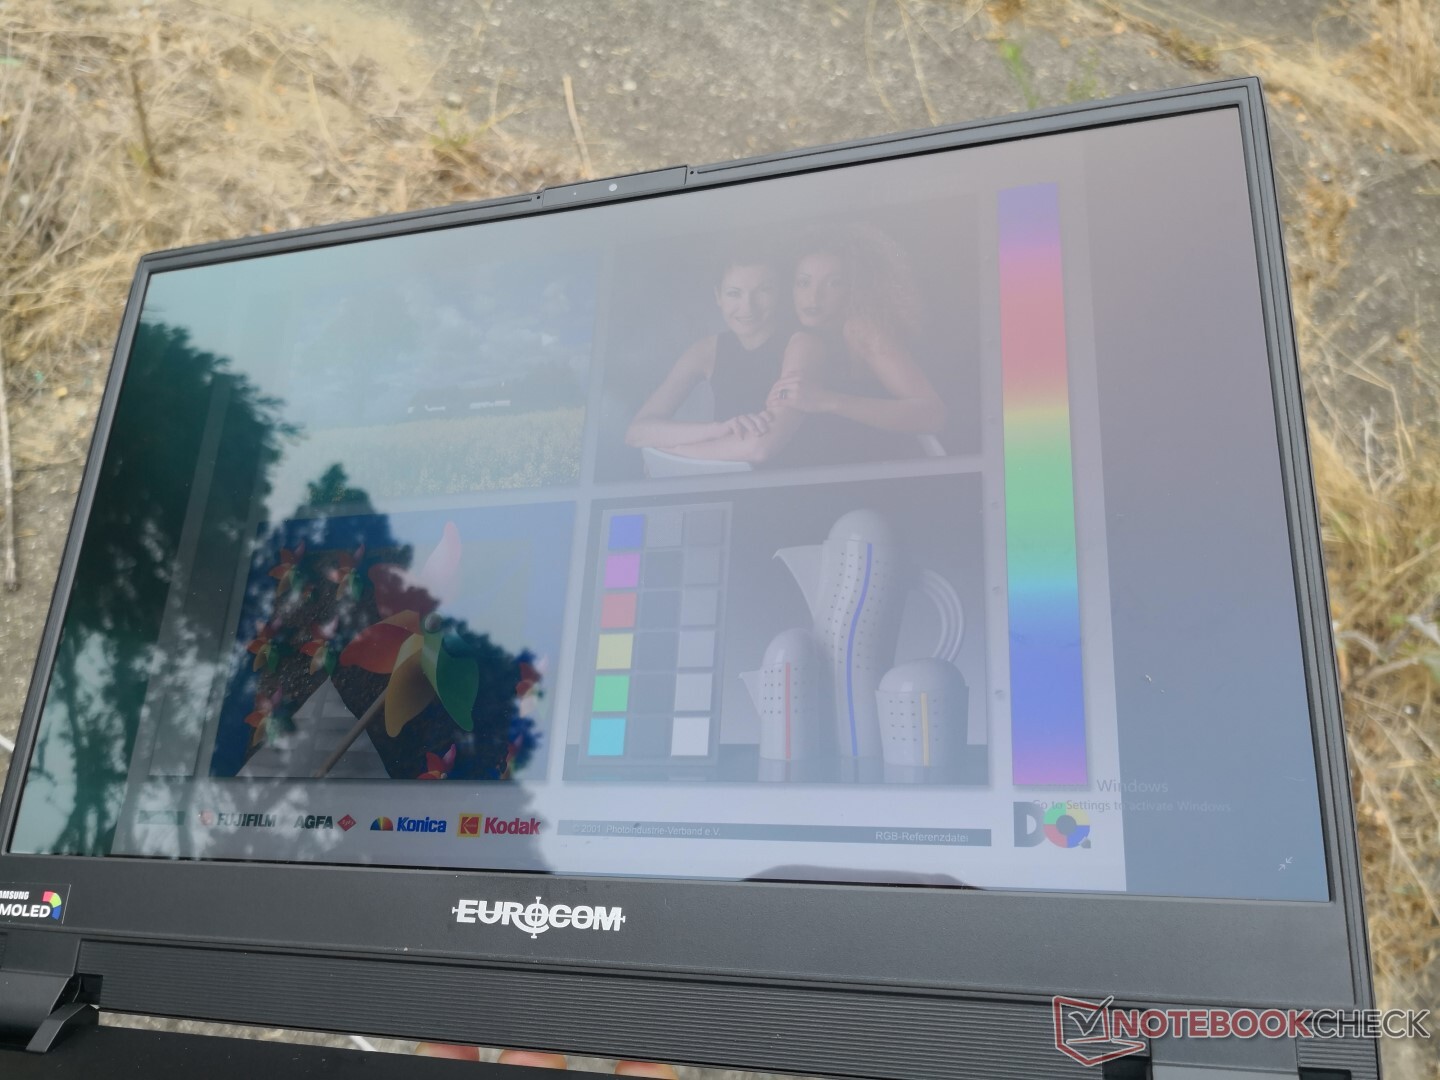
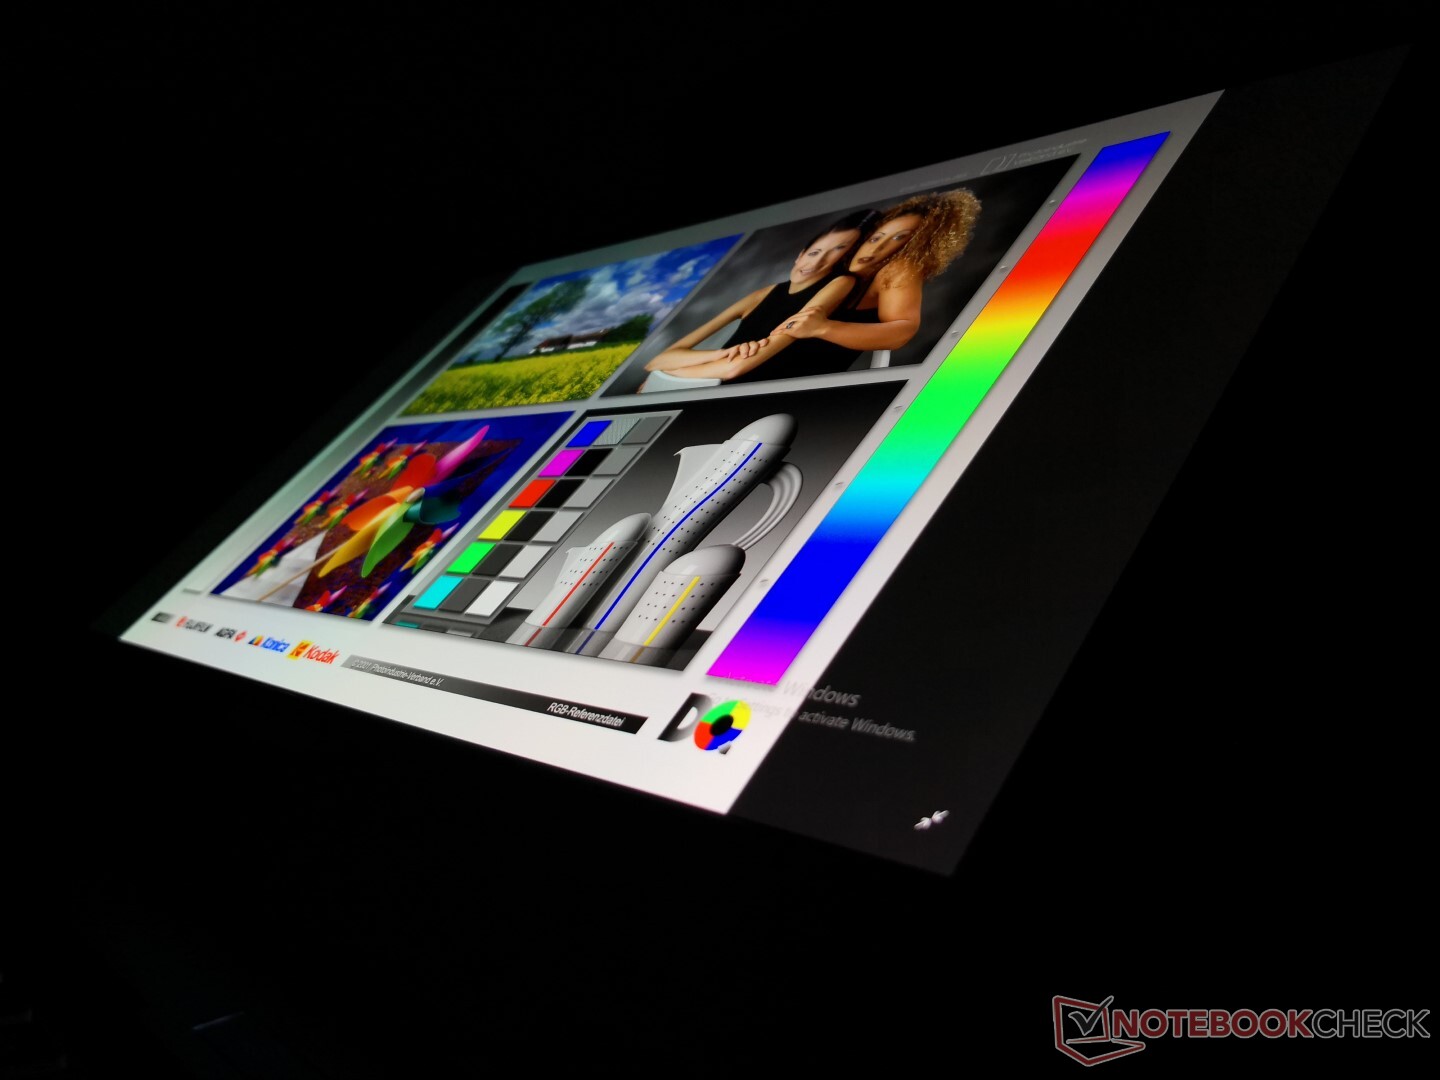
La visibilidad al aire libre es mejor que la del panel mate de IPS en el Nightsky Ti15 cuando está bajo sombra. Sin embargo, cuando está bajo la luz del sol o en un día nublado, la visibilidad al aire libre no es mejor ni peor que la mencionada Nightsky Ti15 debido al mayor resplandor de la pantalla OLED brillante. Los ángulos de visión amplios son idénticos a los de la Dell XPS 15 7590.
De forma molesta, el brillo de la pantalla a veces se reduce automáticamente al mínimo cuando el sistema se está despertando de un estado de reposo. Tendrás que ajustar manualmente el brillo cada vez para solucionar el problema.
Rendimiento
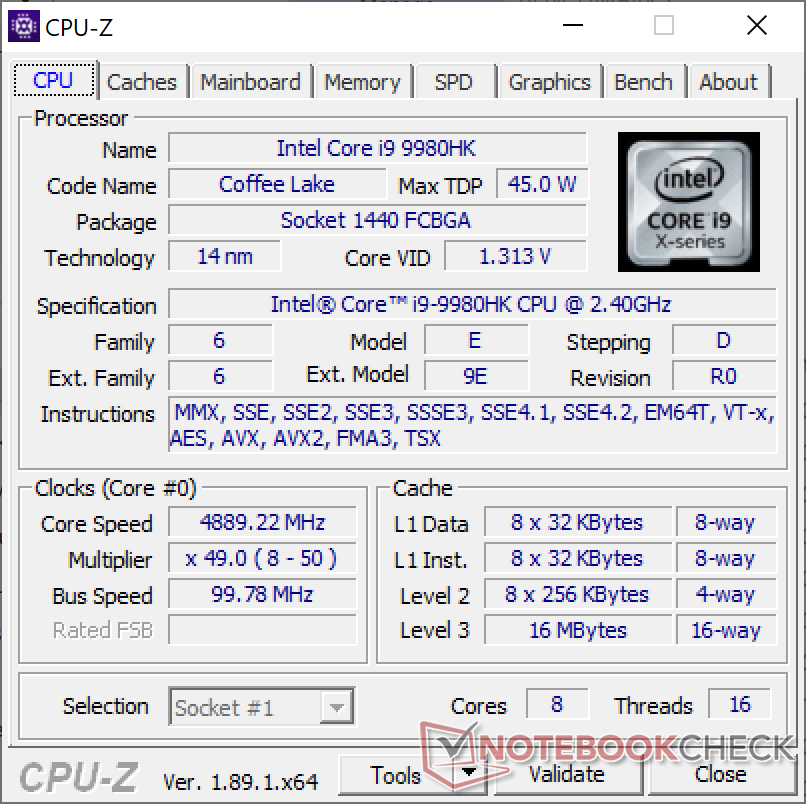
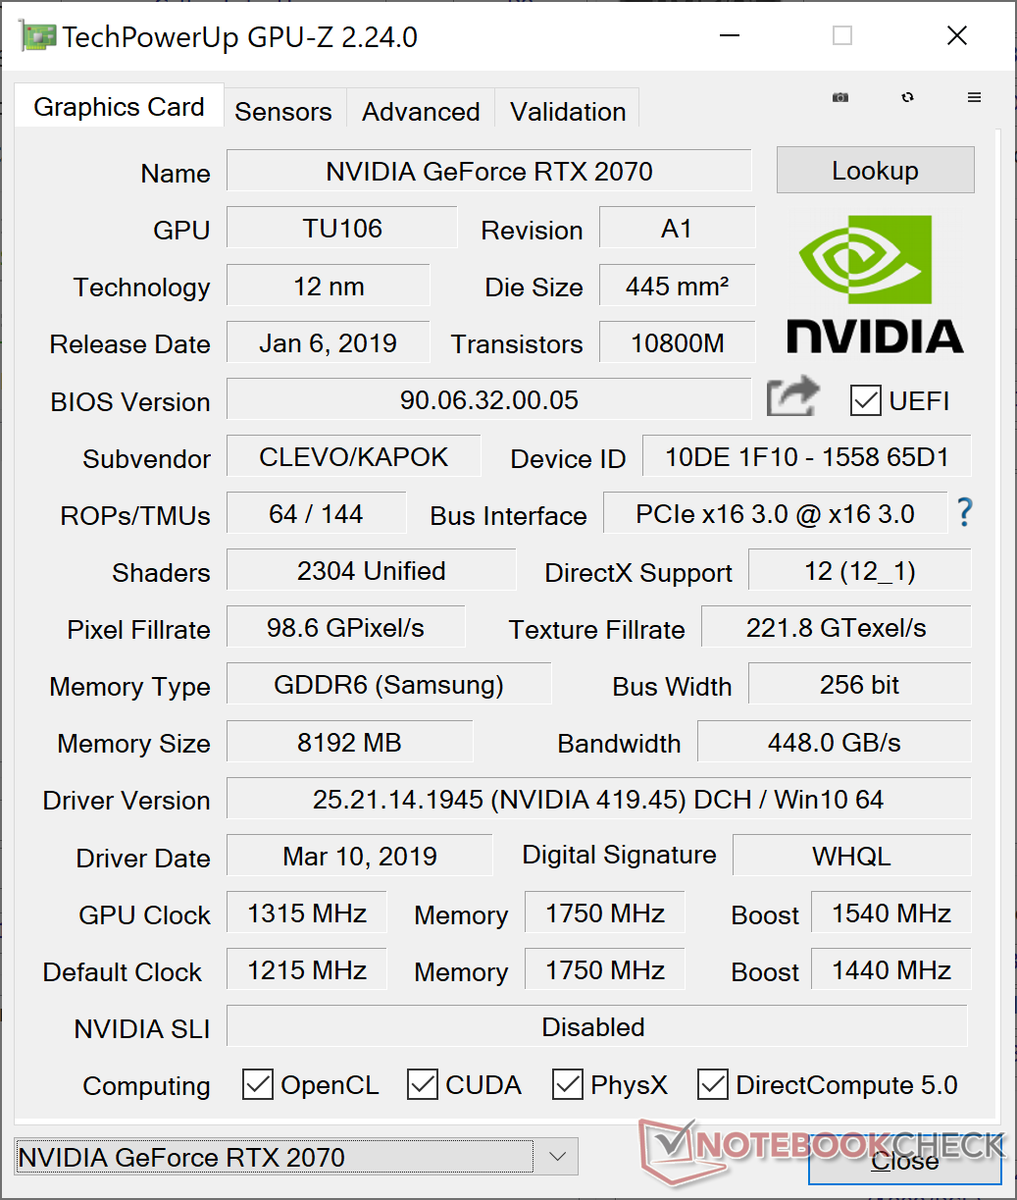
El Nightsky RX15 es uno de los pocos portátiles de 15,6 pulgadas con una opción Core i9-9980HK desbloqueada. Curiosamente, su GPU está al máximo en la actualidad con la GeForce RTX 2070 en lugar de la RTX 2080, a pesar de tener la CPU móvil Coffee Lake-H más rápida del mercado.
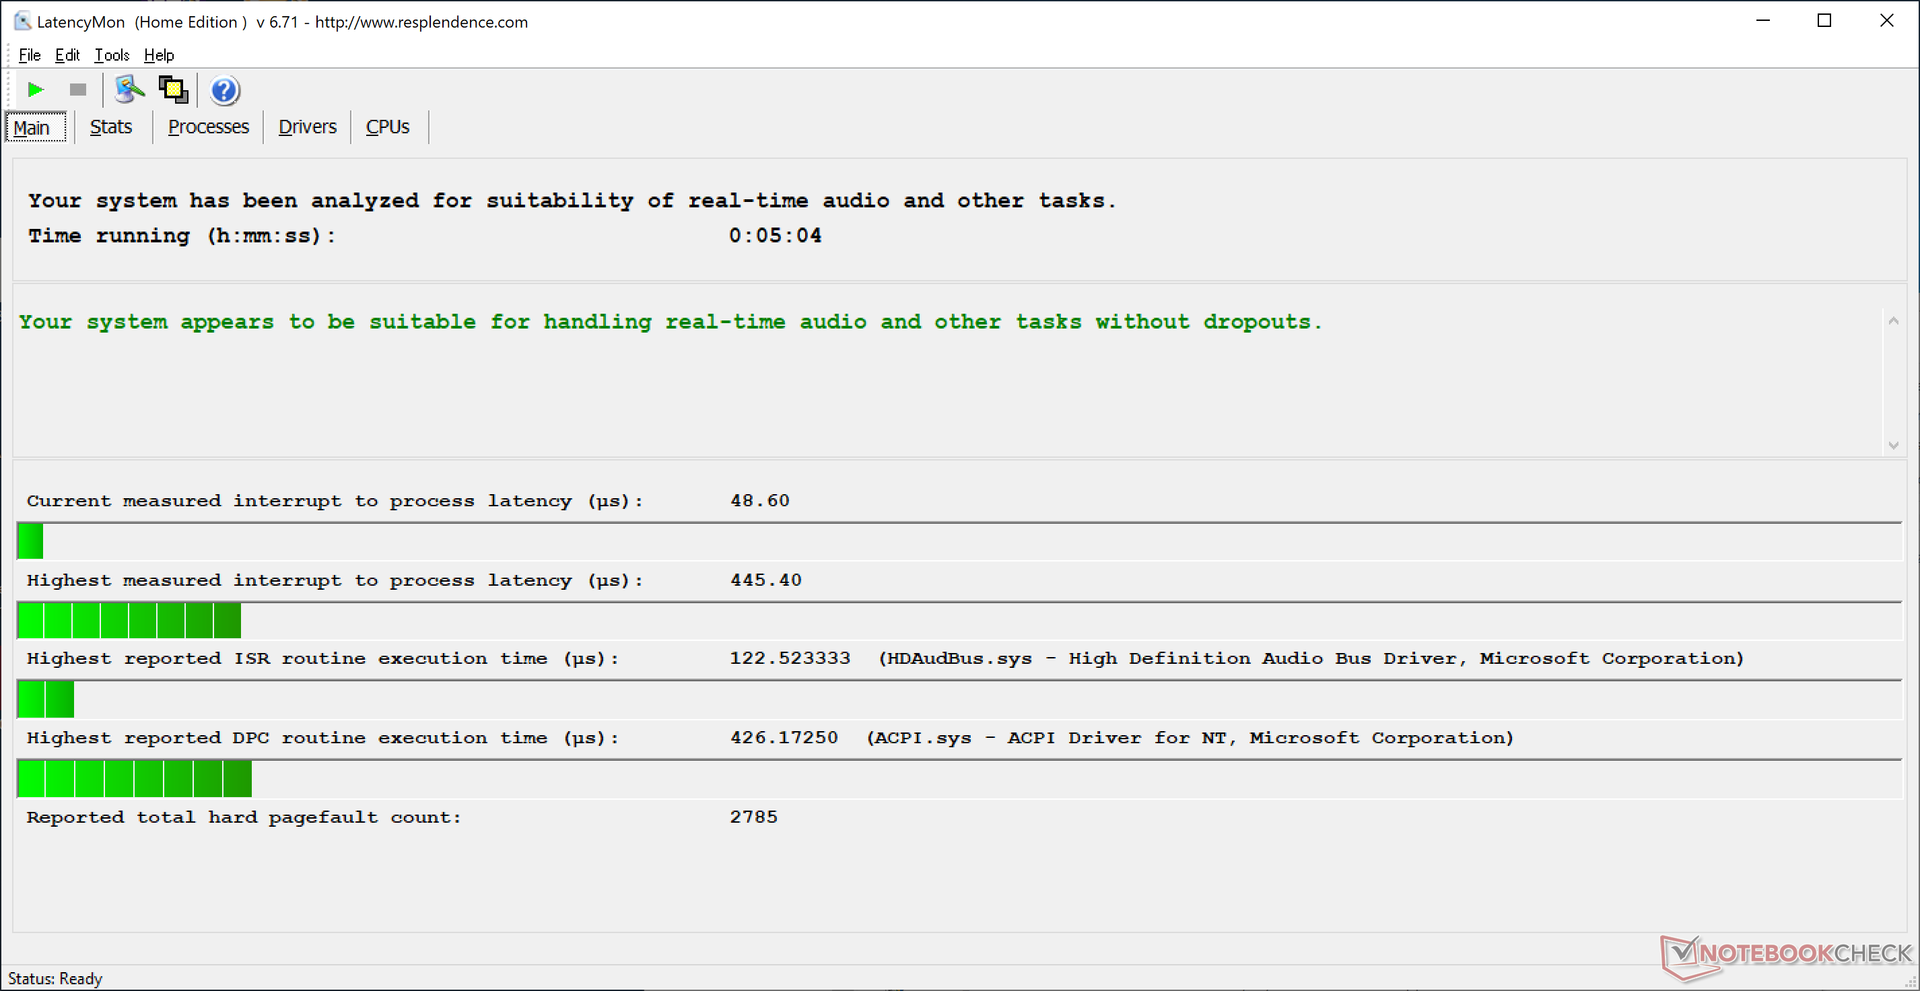
LatencyMon no muestra ningún problema de latencia de DPC como se espera de un sistema Clevo. Los equipos portátiles de los principales fabricantes de equipos originales como Dell, HP y otros tienen más probabilidades de tener una actividad de fondo y un software malicioso no deseados.
Procesador
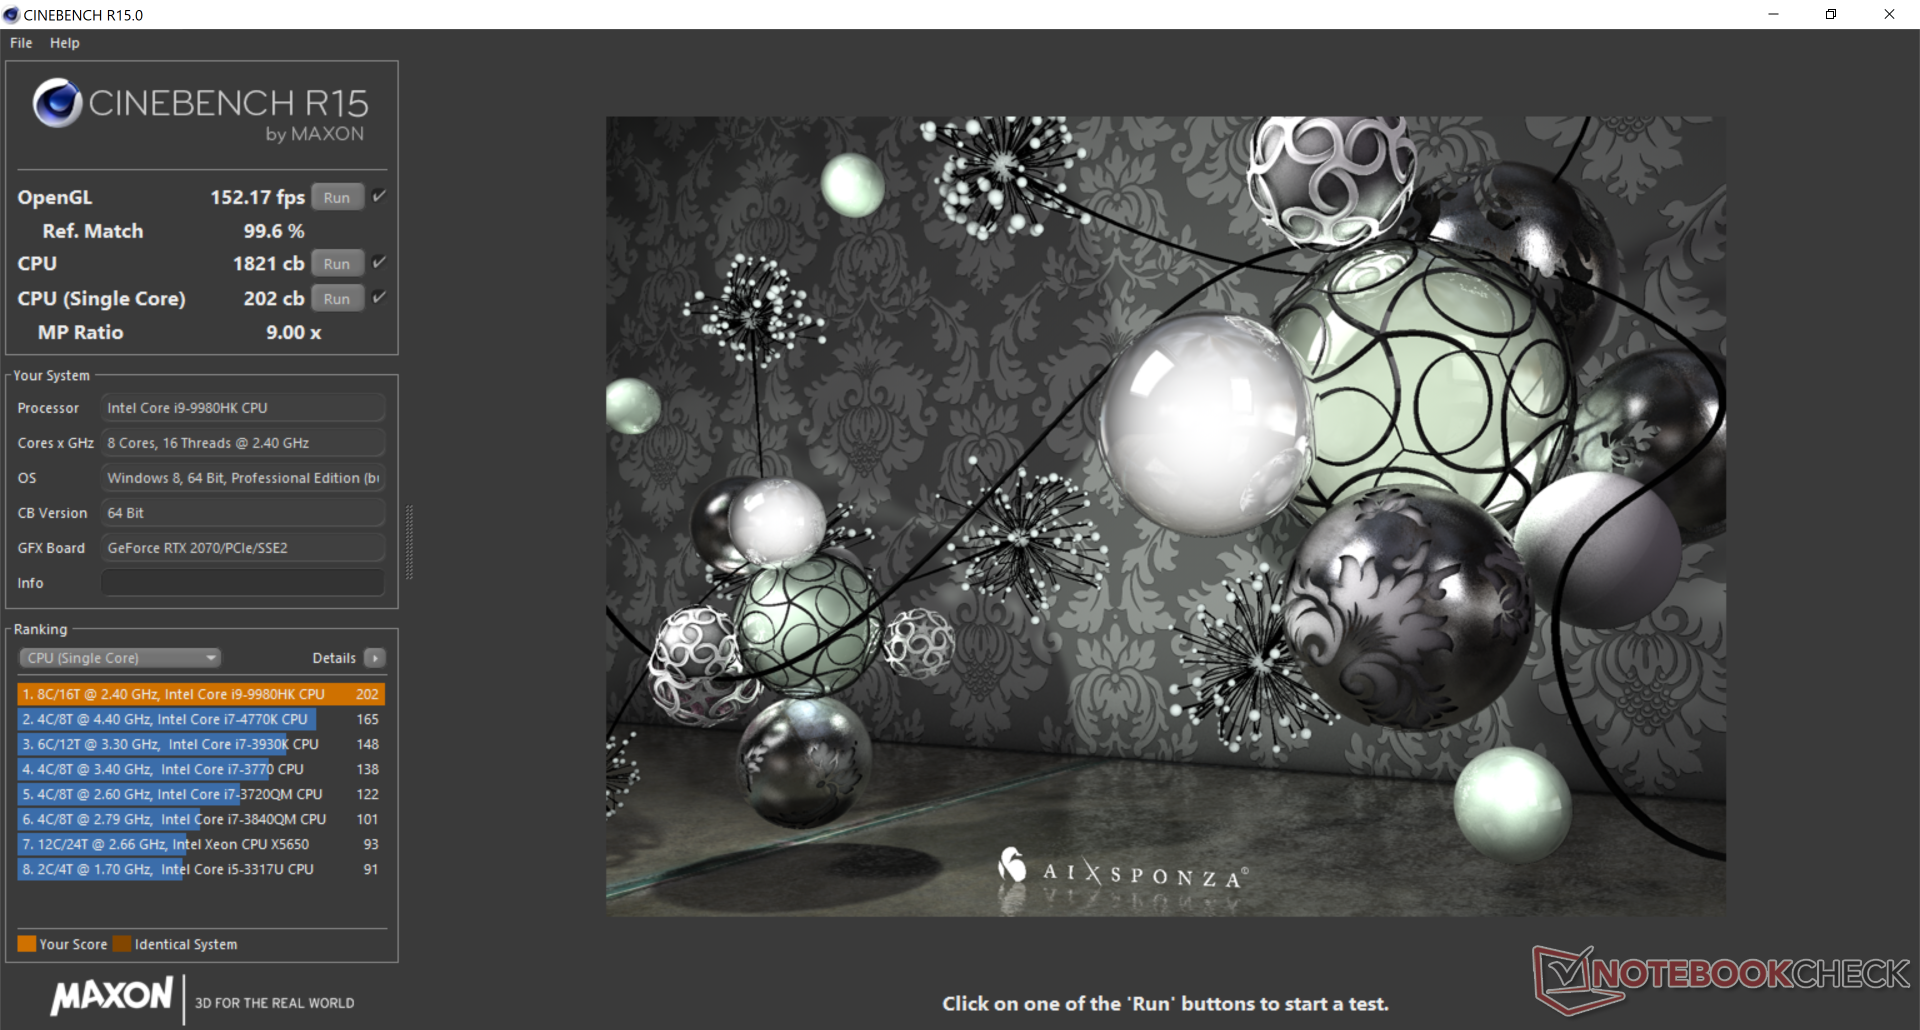
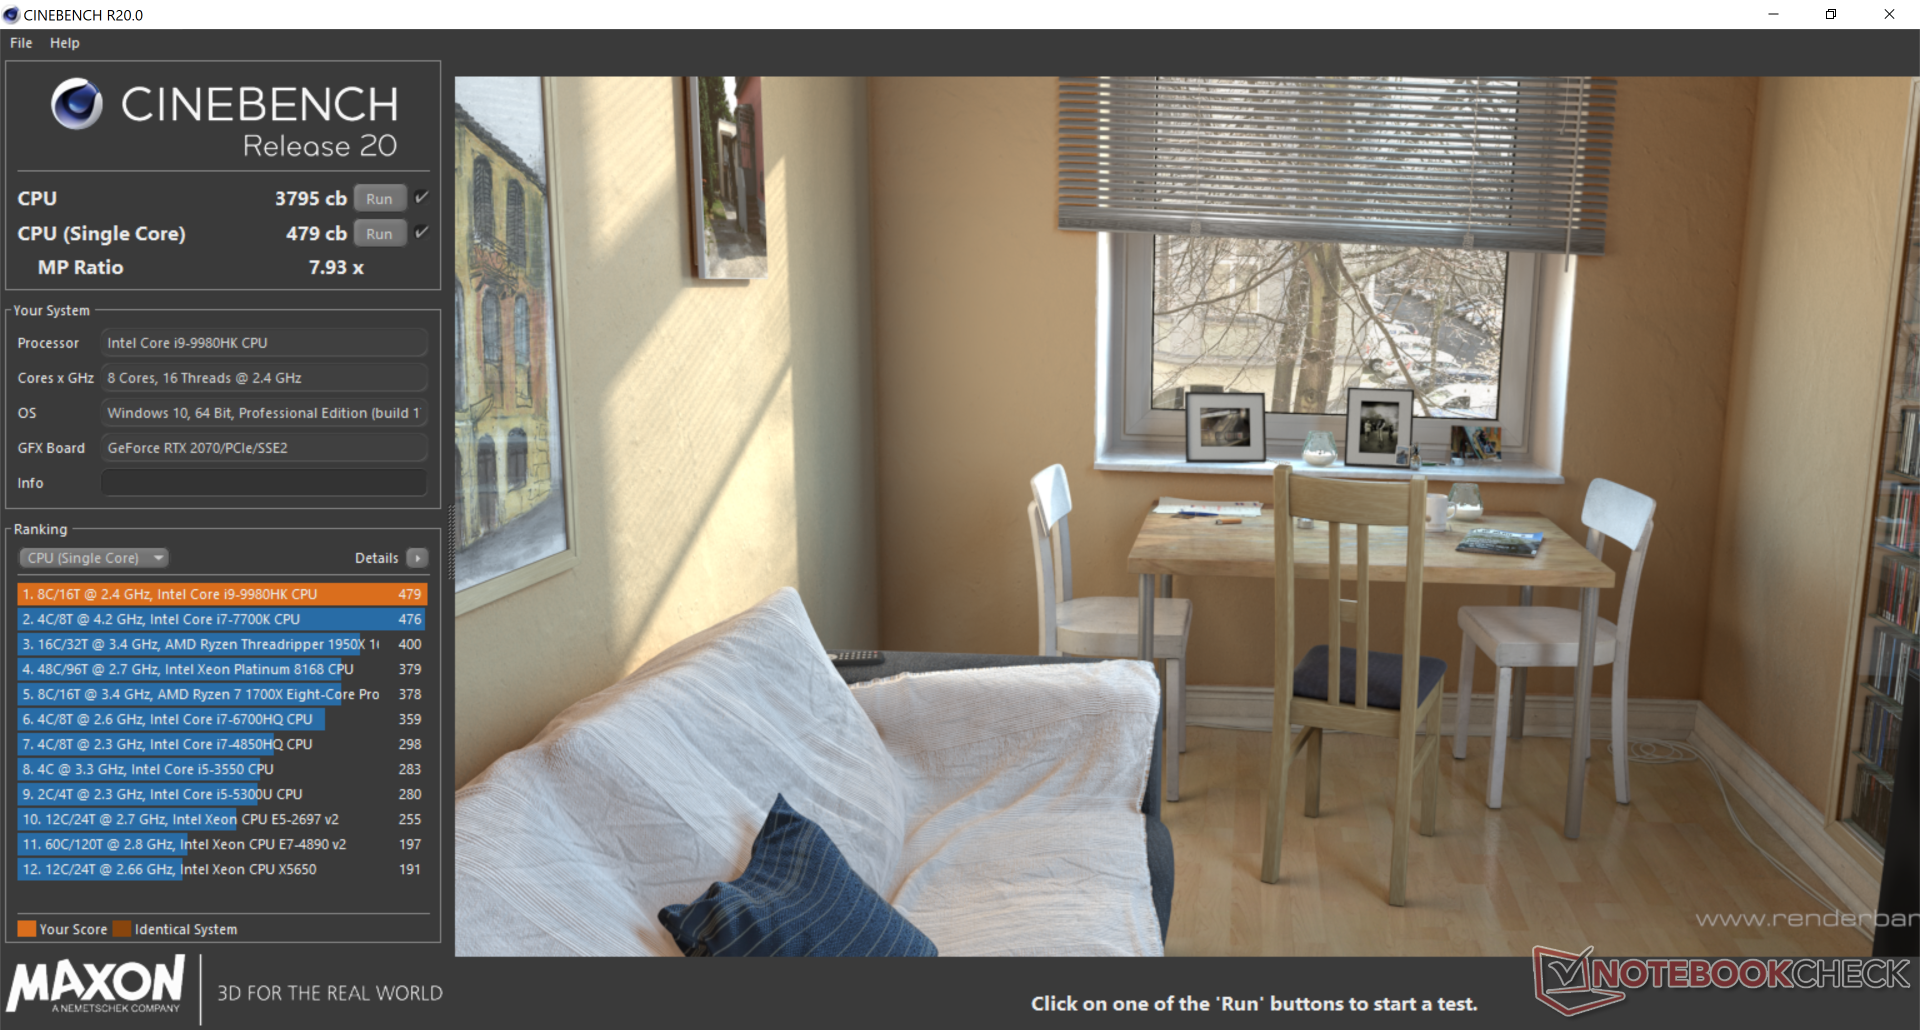
El Core i9-9980HK es incuestionablemente rápido, pero es una bolsa mixta en términos relativos debido a su fuerte caída en el rendimiento en bruto después de que finaliza el máximo Turbo Boost. Como se muestra en el gráfico del bucle multihilo CineBench R15 que se muestra a continuación, el rendimiento de la CPU cae un 18% después de los dos primeros bucles y nunca se recupera a partir de entonces. No obstante, el rendimiento sigue siendo mucho más rápido que el Core i7-9750H y el Core i9-9980HK en los modelos Nightsky Ti15 y Dell XPS 15 7590, respectivamente, incluso después de tener en cuenta el estrangulamiento.
Algunos portátiles con el Core i9-9880H "más lento", como el MSI GE75 9SG, pueden funcionar más rápido que el Core i9-9980HK si pueden mantener velocidades de reloj más rápidas durante más tiempo cuando están bajo tensión.
Consulte nuestra página dedicada al Core i9-9980HK para obtener más información técnica y referencias.
Rendimiento del sistema
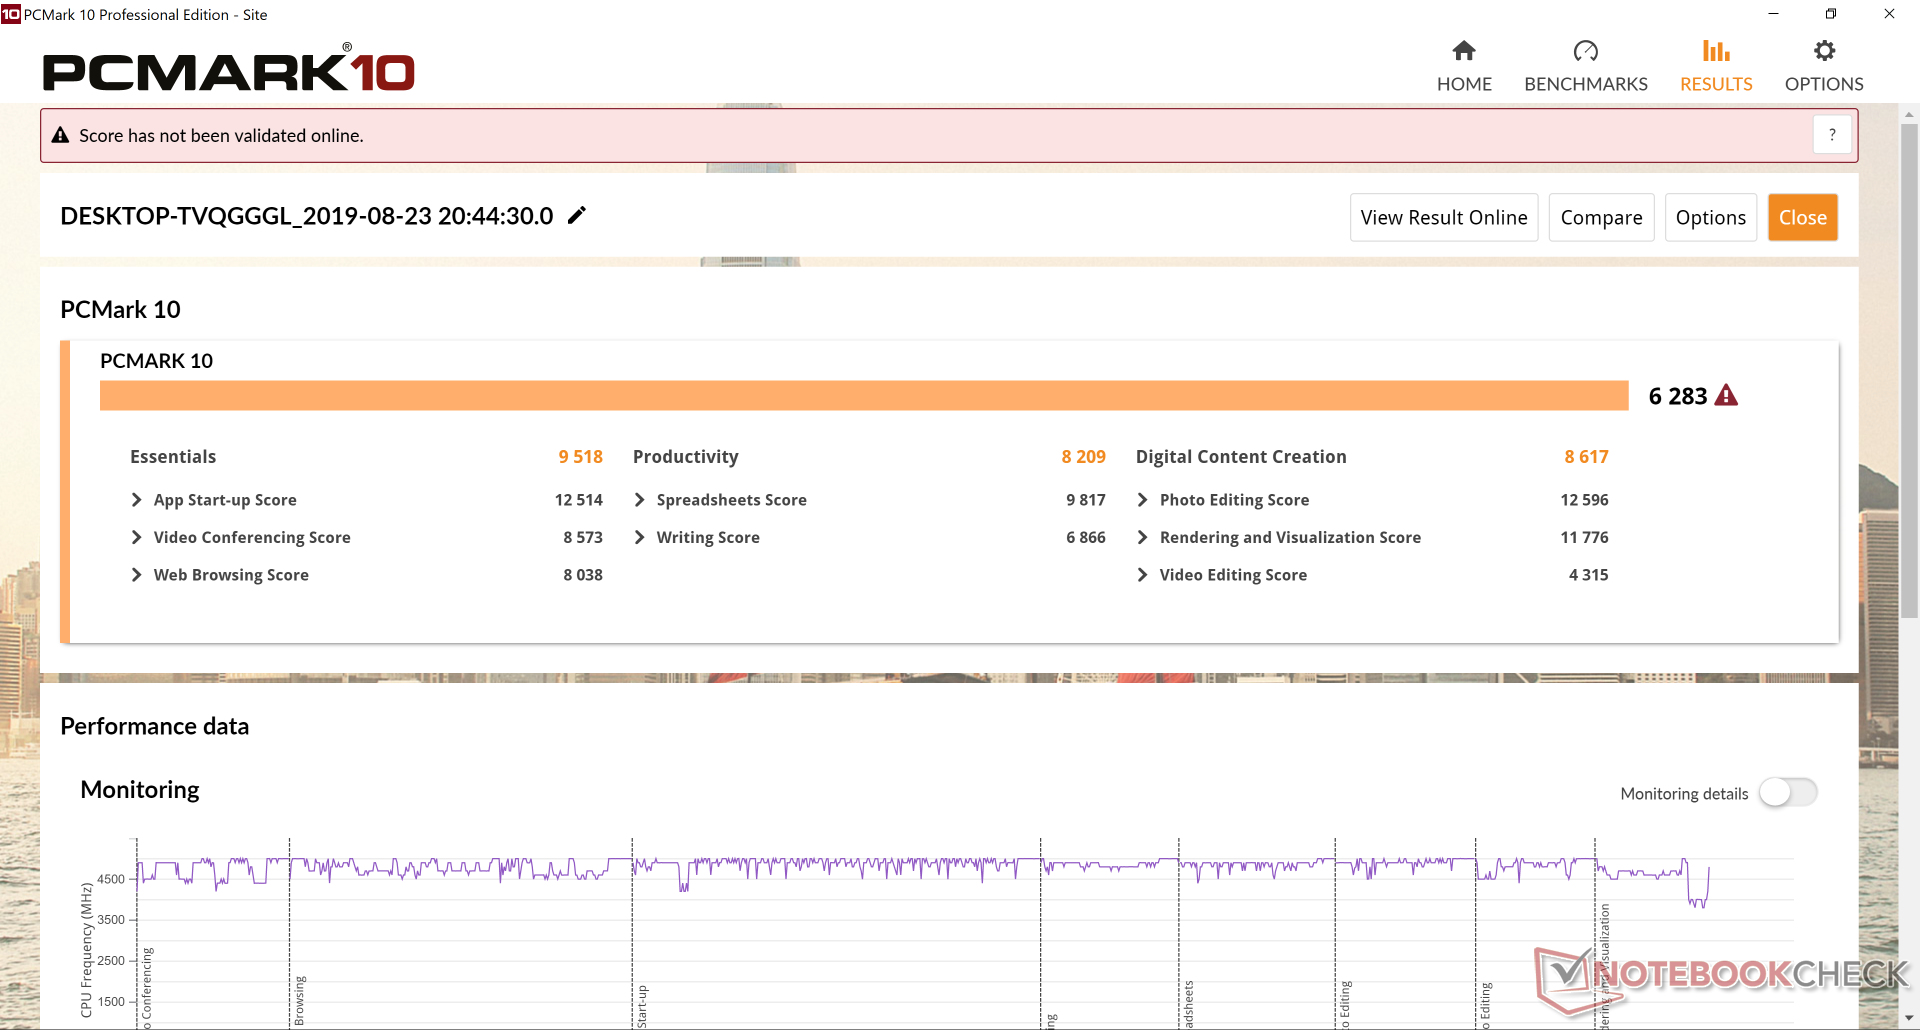
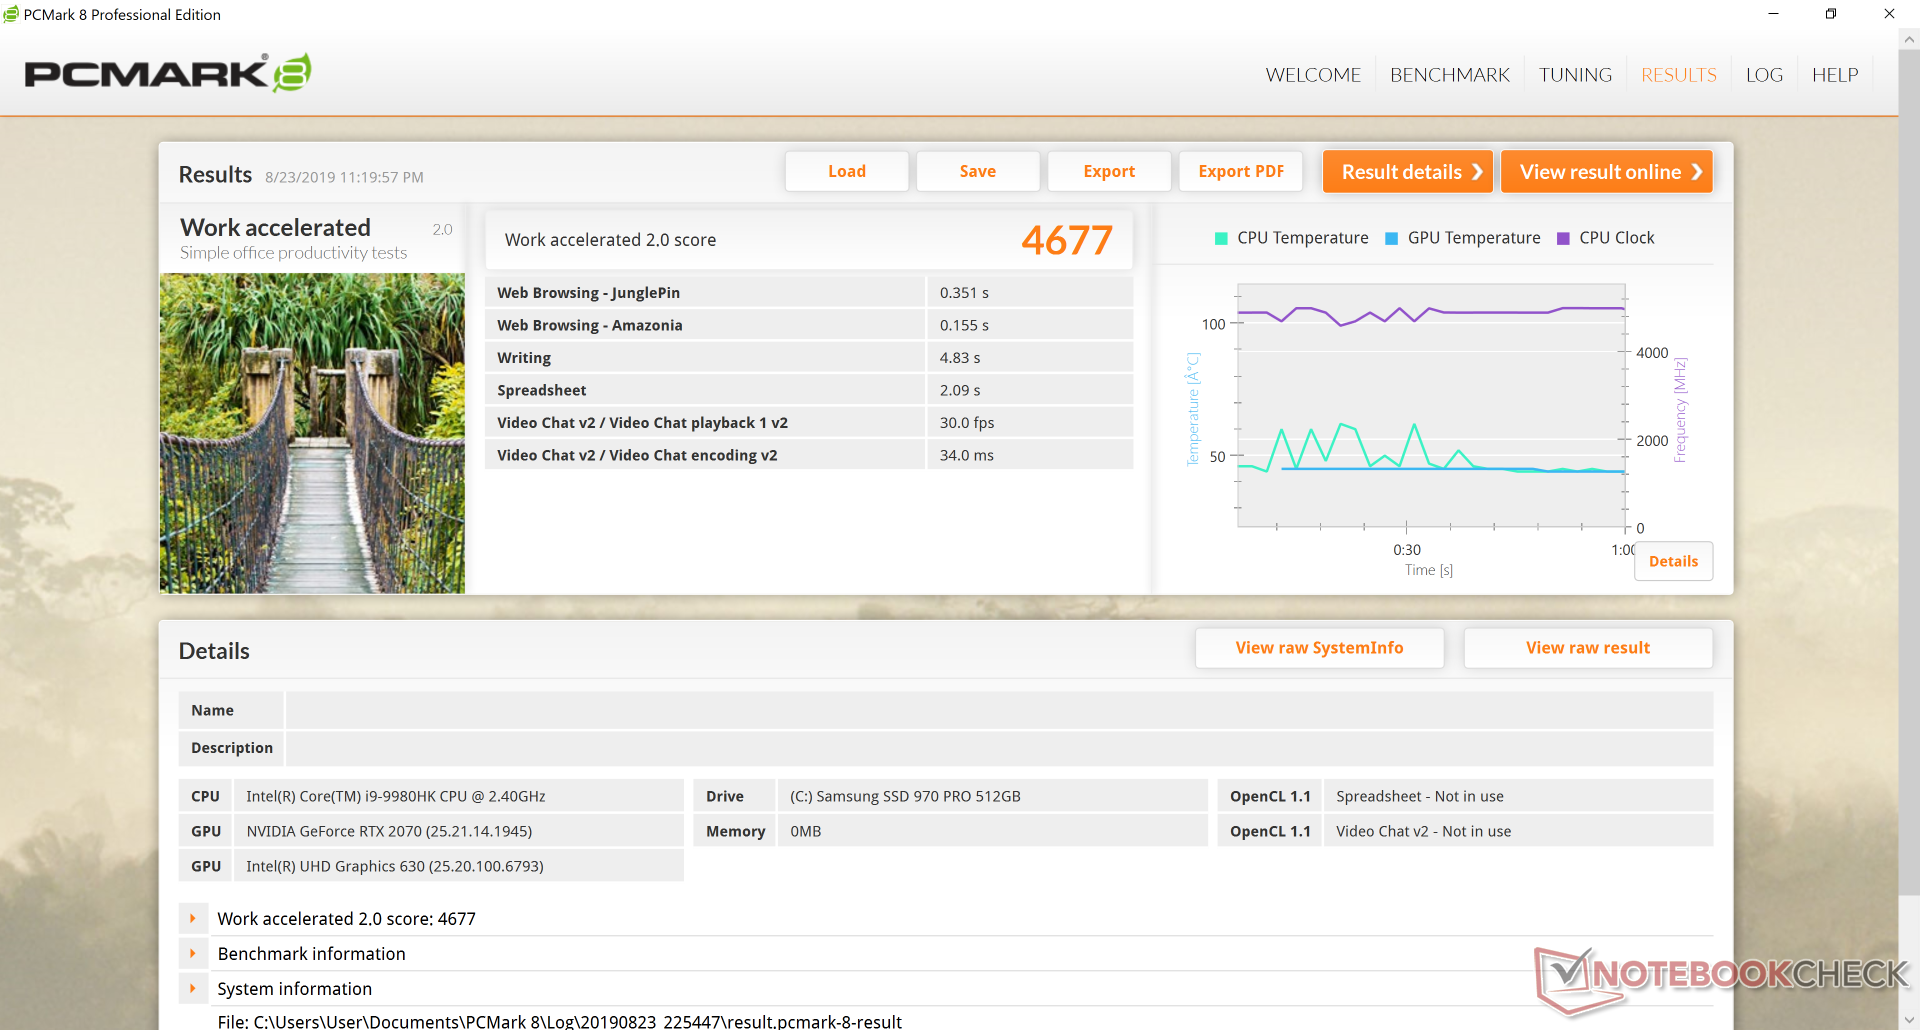
Los puntos de referencia de PCMark son consistentemente más altos que los de Nightsky Ti15, especialmente en Digital Content Creation, donde el RTX 2070 puede flexibilizar sus beneficios de rendimiento en comparación con el GTX 1660 Ti.
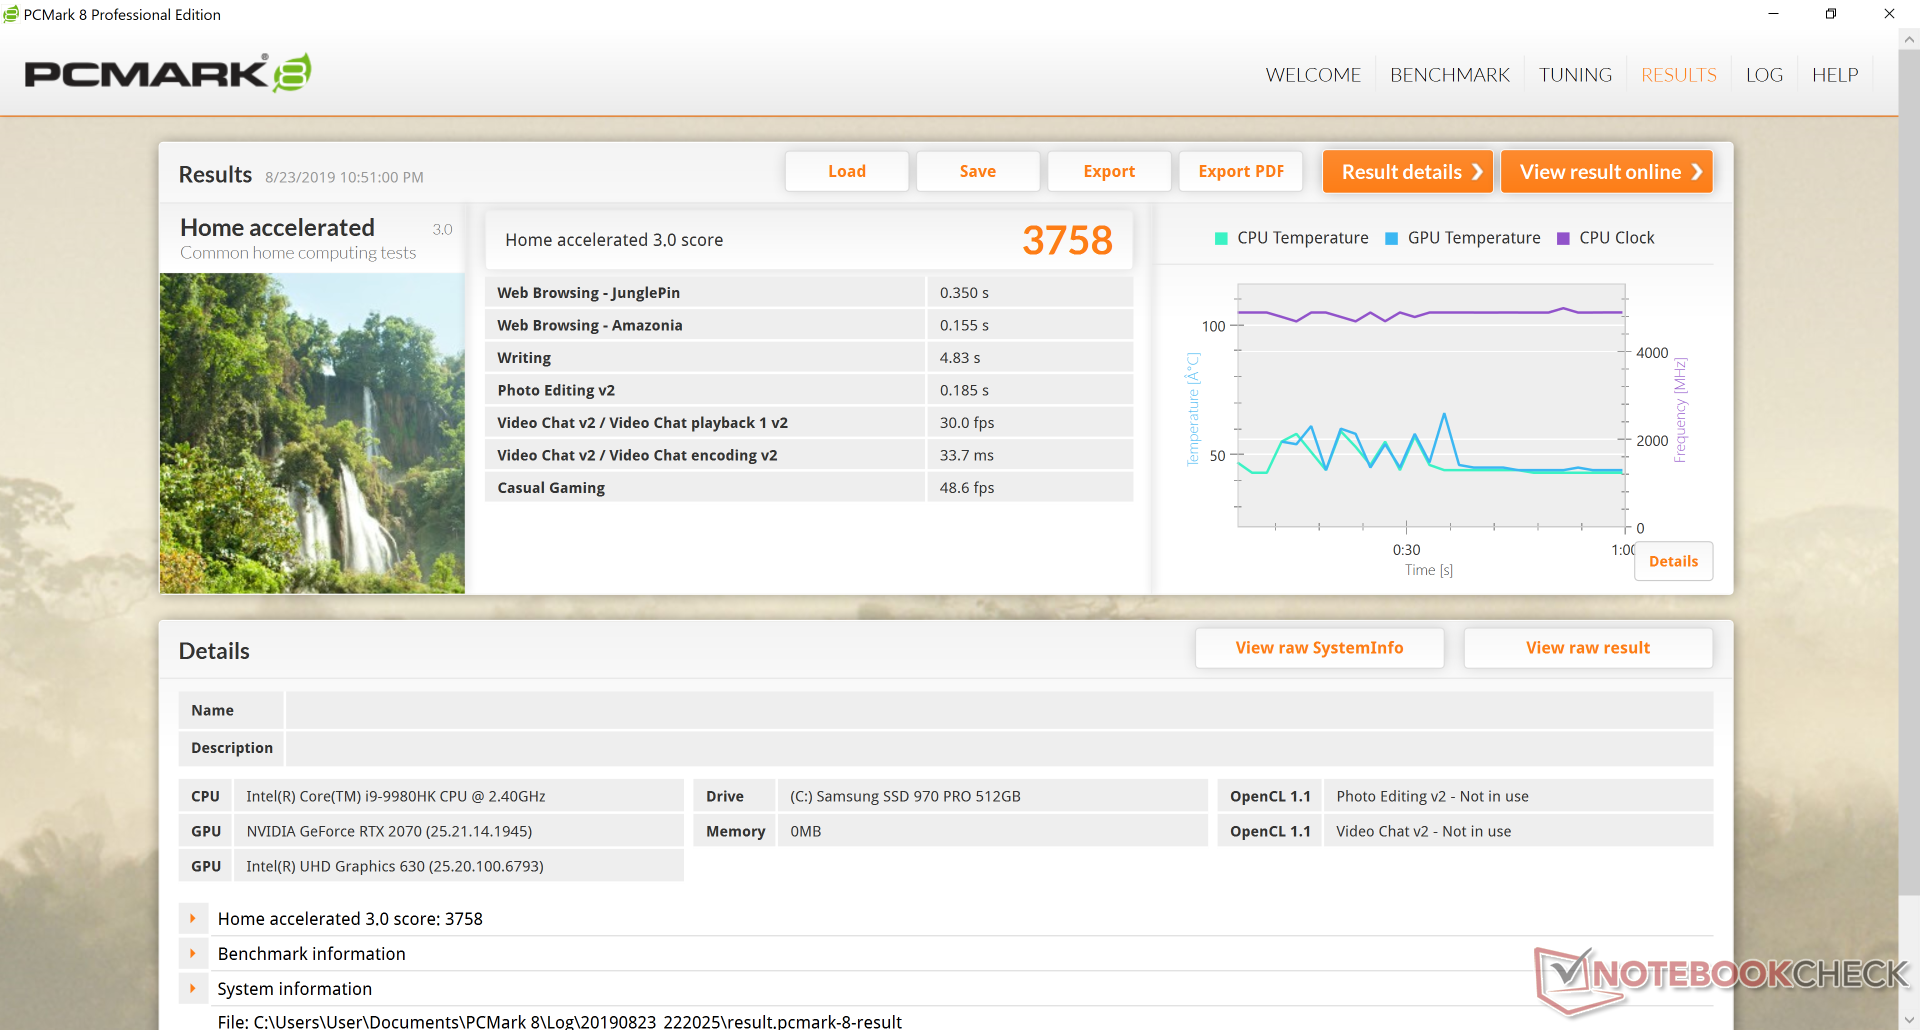
| PCMark 8 Home Score Accelerated v2 | 3758 puntos | |
| PCMark 8 Work Score Accelerated v2 | 4677 puntos | |
| PCMark 10 Score | 6283 puntos | |
ayuda | ||
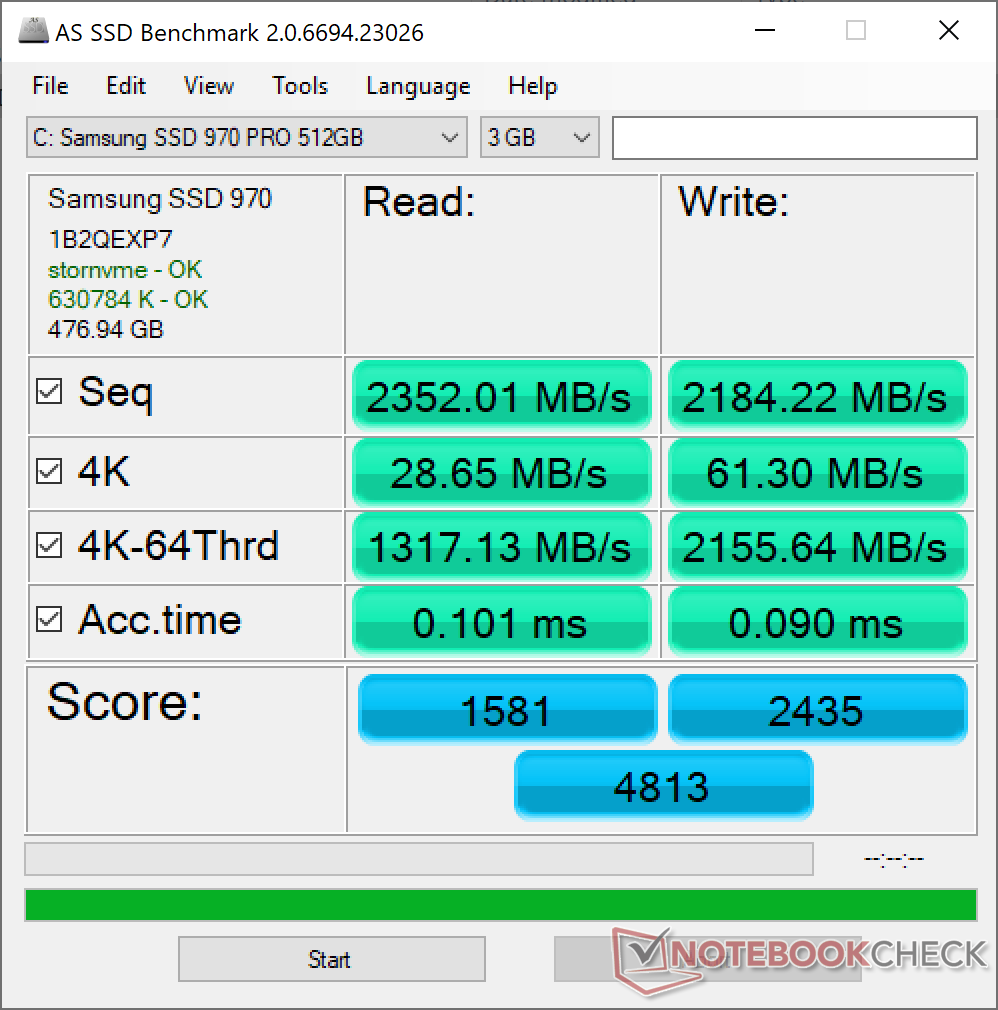
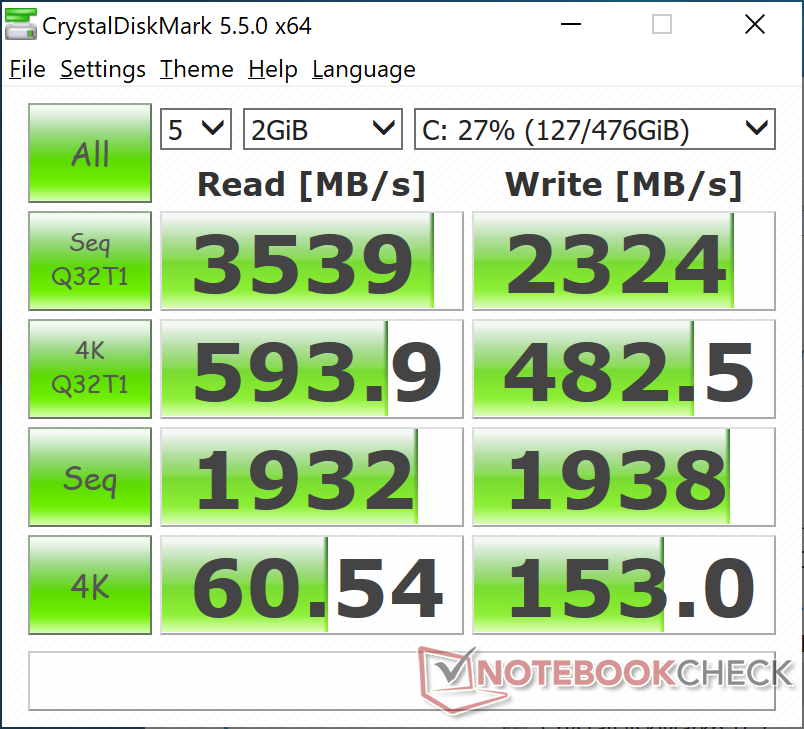
Dispositivos de almacenamiento
| Eurocom Nightsky RX15 Samsung SSD 970 Pro 512GB | Eurocom Sky X4C Samsung SSD 960 Pro 1TB m.2 NVMe | Razer Blade 15 RTX 2080 Max-Q Samsung SSD PM981 MZVLB512HAJQ | MSI GE63 Raider RGB 8RF-008 Samsung SSD PM871a MZNLN256HMHQ | Dell XPS 15 7590 9980HK GTX 1650 Toshiba XG6 KXG60ZNV1T02 | |
|---|---|---|---|---|---|
| AS SSD | 13% | 6% | -44% | 8% | |
| Seq Read (MB/s) | 2352 | 2541 8% | 1832 -22% | 512 -78% | 1723 -27% |
| Seq Write (MB/s) | 2184 | 1989 -9% | 1864 -15% | 462.8 -79% | 1386 -37% |
| 4K Read (MB/s) | 28.65 | 44.83 56% | 52.1 82% | 32.36 13% | 43.25 51% |
| 4K Write (MB/s) | 61.3 | 129.6 111% | 108.3 77% | 68.6 12% | 98.3 60% |
| 4K-64 Read (MB/s) | 1317 | 1646 25% | 1159 -12% | 348.6 -74% | 1078 -18% |
| 4K-64 Write (MB/s) | 2156 | 1375 -36% | 1807 -16% | 294.3 -86% | 1456 -32% |
| Access Time Read * (ms) | 0.101 | 0.032 68% | 0.05 50% | 0.101 -0% | 0.05 50% |
| Access Time Write * (ms) | 0.09 | 0.03 67% | 0.034 62% | 0.051 43% | 0.039 57% |
| Score Read (Points) | 1581 | 1945 23% | 1394 -12% | 432 -73% | 1294 -18% |
| Score Write (Points) | 2435 | 1703 -30% | 2102 -14% | 409 -83% | 1693 -30% |
| Score Total (Points) | 4813 | 4615 -4% | 4221 -12% | 1071 -78% | 3638 -24% |
| Copy ISO MB/s (MB/s) | 2705 | 1908 -29% | 2083 -23% | 3182 18% | |
| Copy Program MB/s (MB/s) | 666 | 467.2 -30% | 496.5 -25% | 984 48% | |
| Copy Game MB/s (MB/s) | 1583 | 1055 -33% | 977 -38% | 1824 15% |
* ... más pequeño es mejor

Rendimiento de la GPU
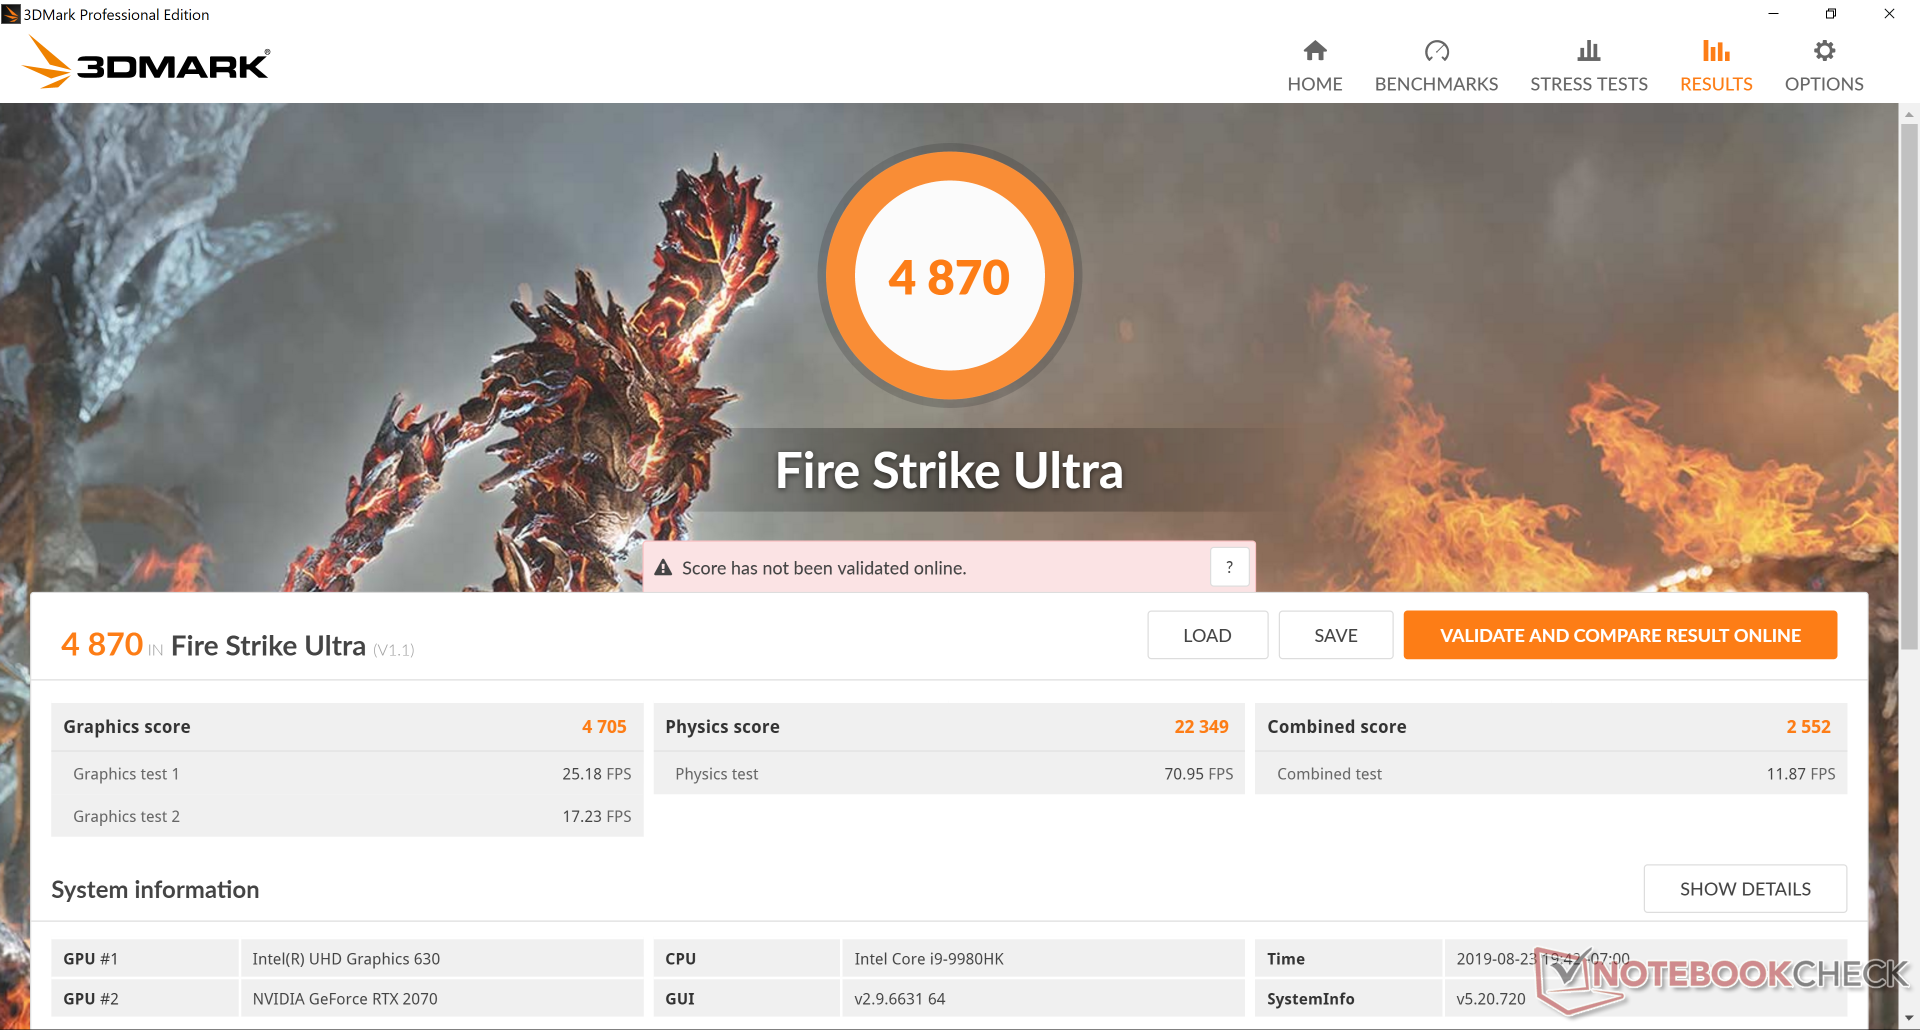
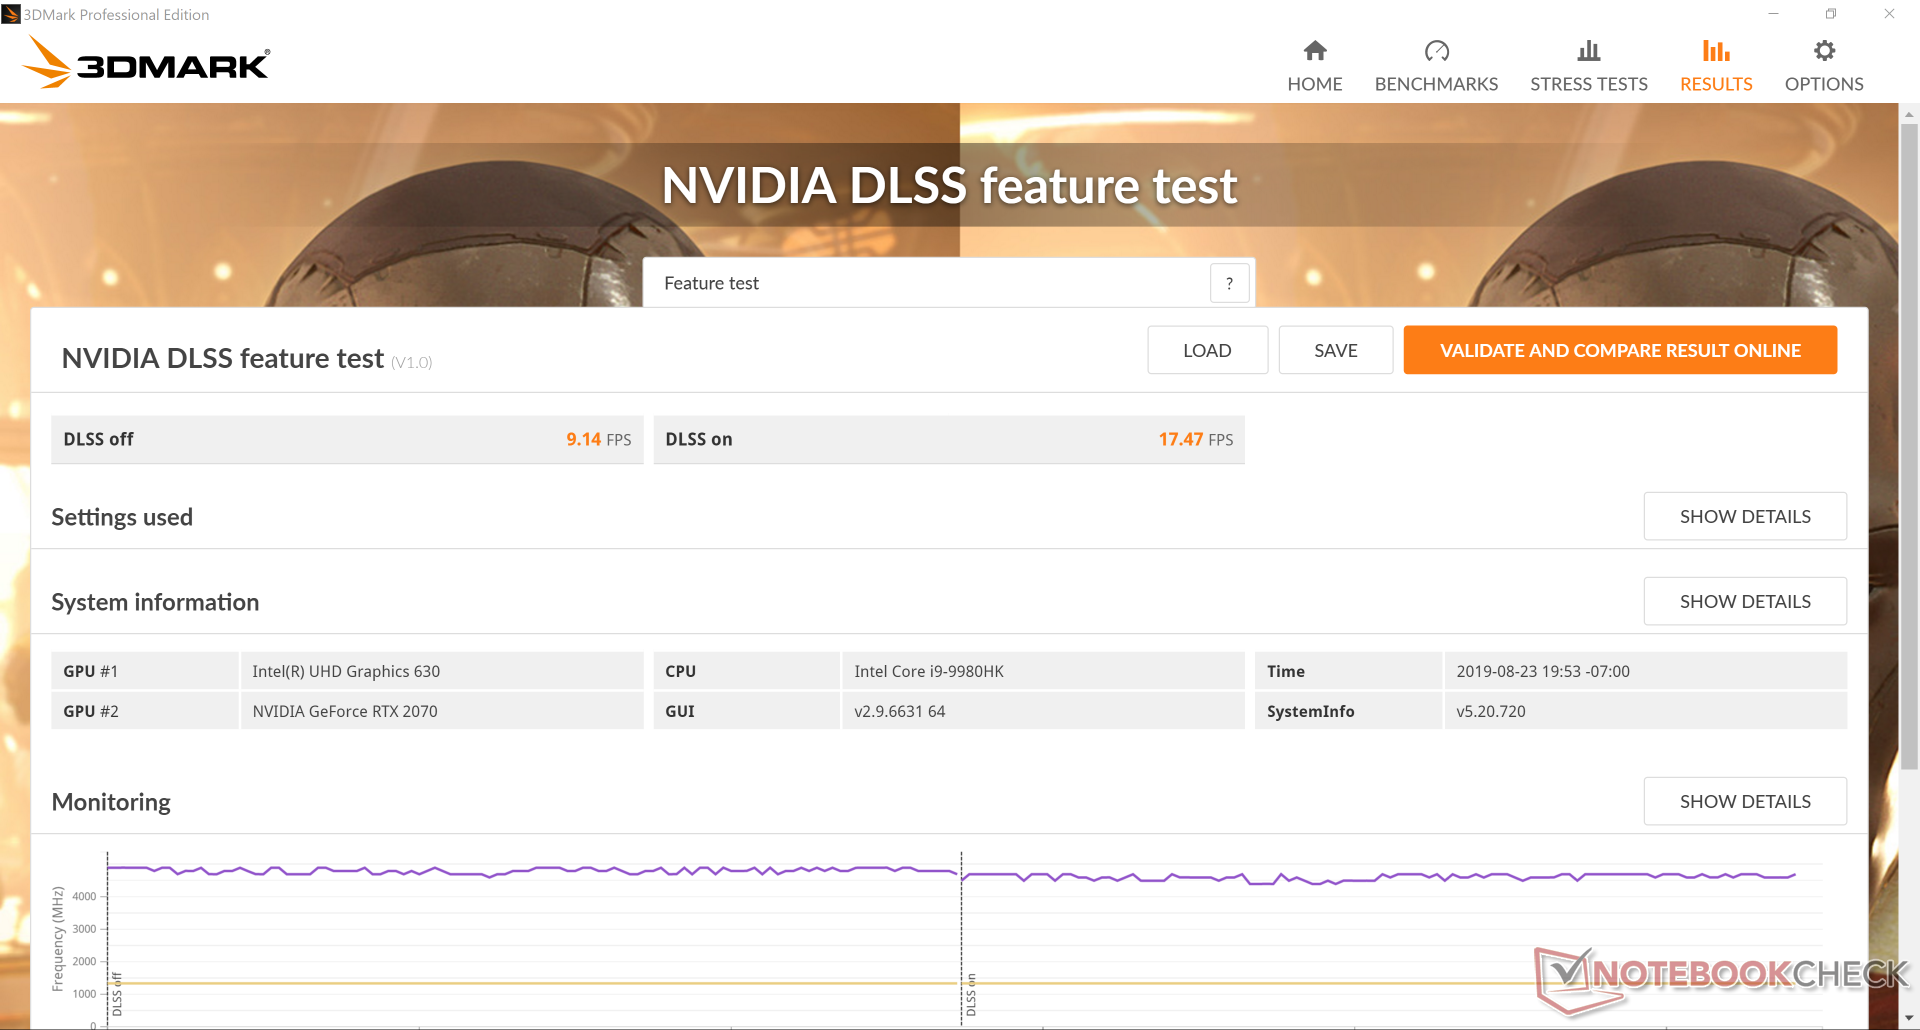
La GeForce RTX 2070 móvil funciona exactamente donde esperamos que funcione en comparación con otros portátiles para juegos con la misma GPU". Los usuarios pueden esperar que el rendimiento sea entre un 15 y un 20 por ciento más lento que el de la GeForce RTX 2070 de sobremesa. La actualización de la Nightsky Ti15 GTX 1660 Ti SKU supondrá un aumento del rendimiento bruto de alrededor del 36 por ciento. Hay suficiente potencia para reproducir cualquier título a 1080p60 con la mayoría o todos los ajustes al máximo. Los juegos de 4K también son posibles, aunque con la mayoría de los ajustes en Baja o Baja-Media.
Consulte nuestra página dedicada a la GeForce RTX 2070 móvil para obtener más información técnica y comparaciones de referencia.
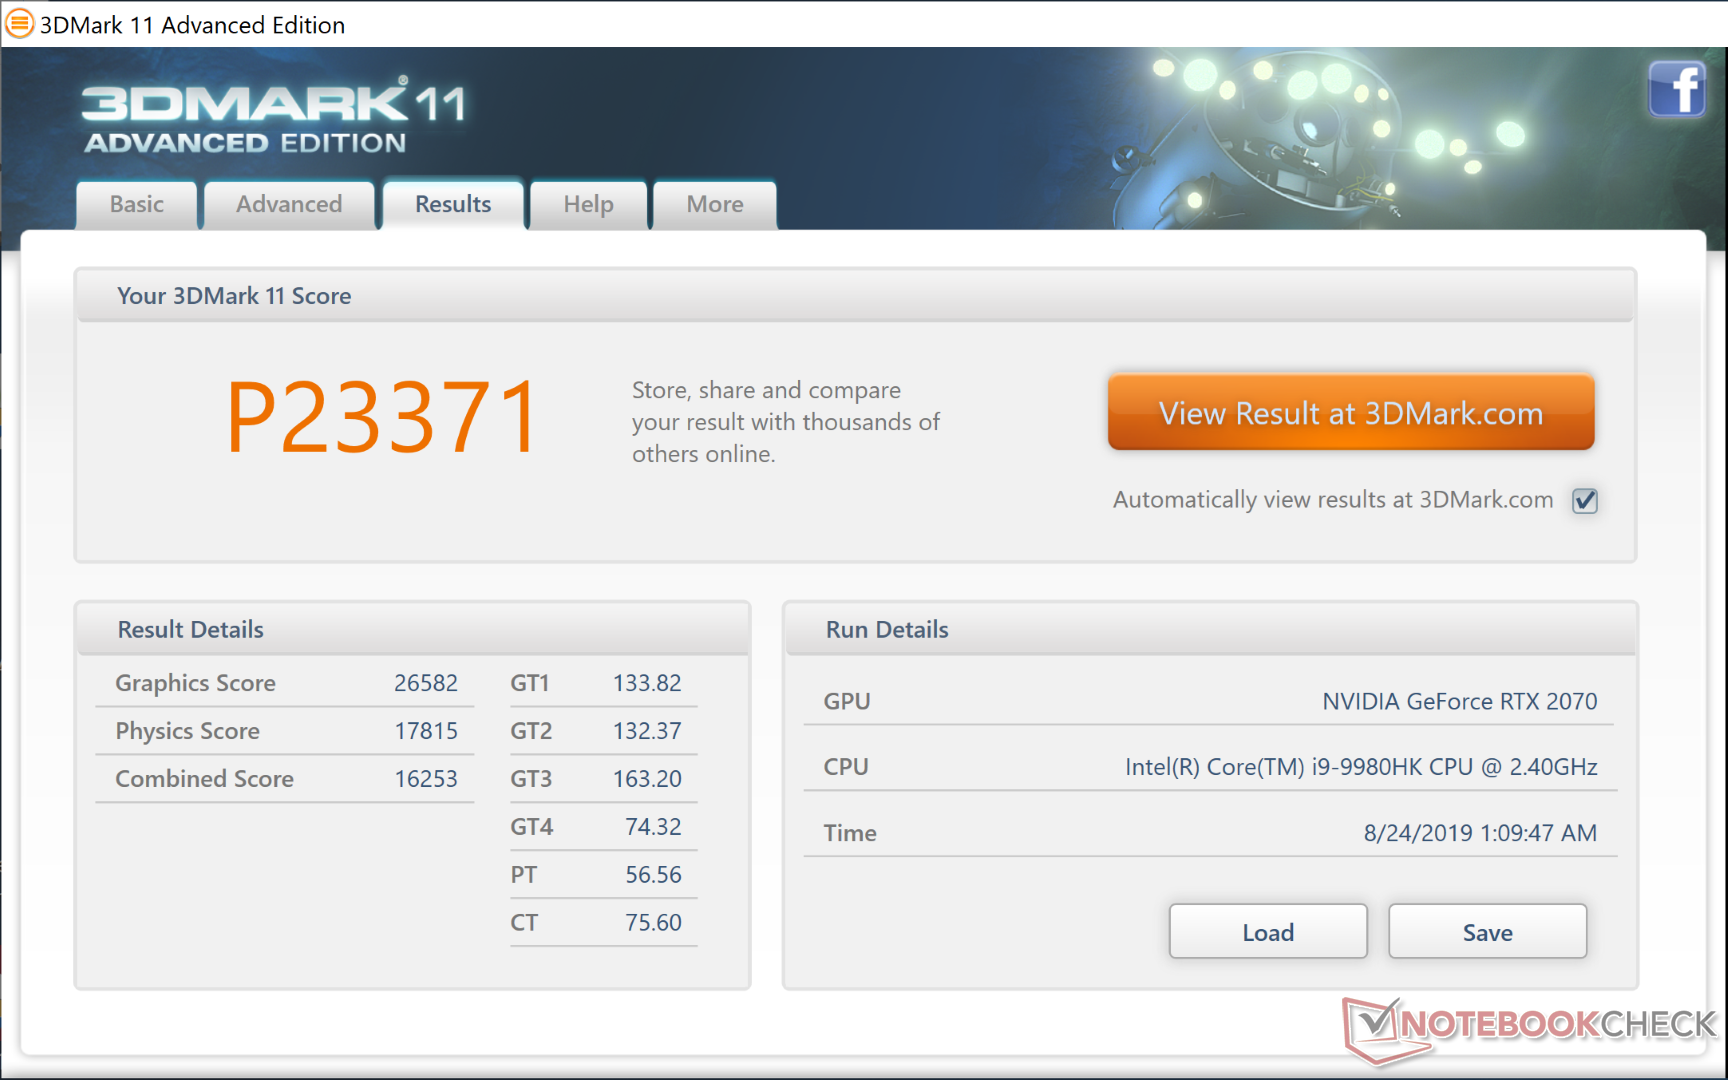
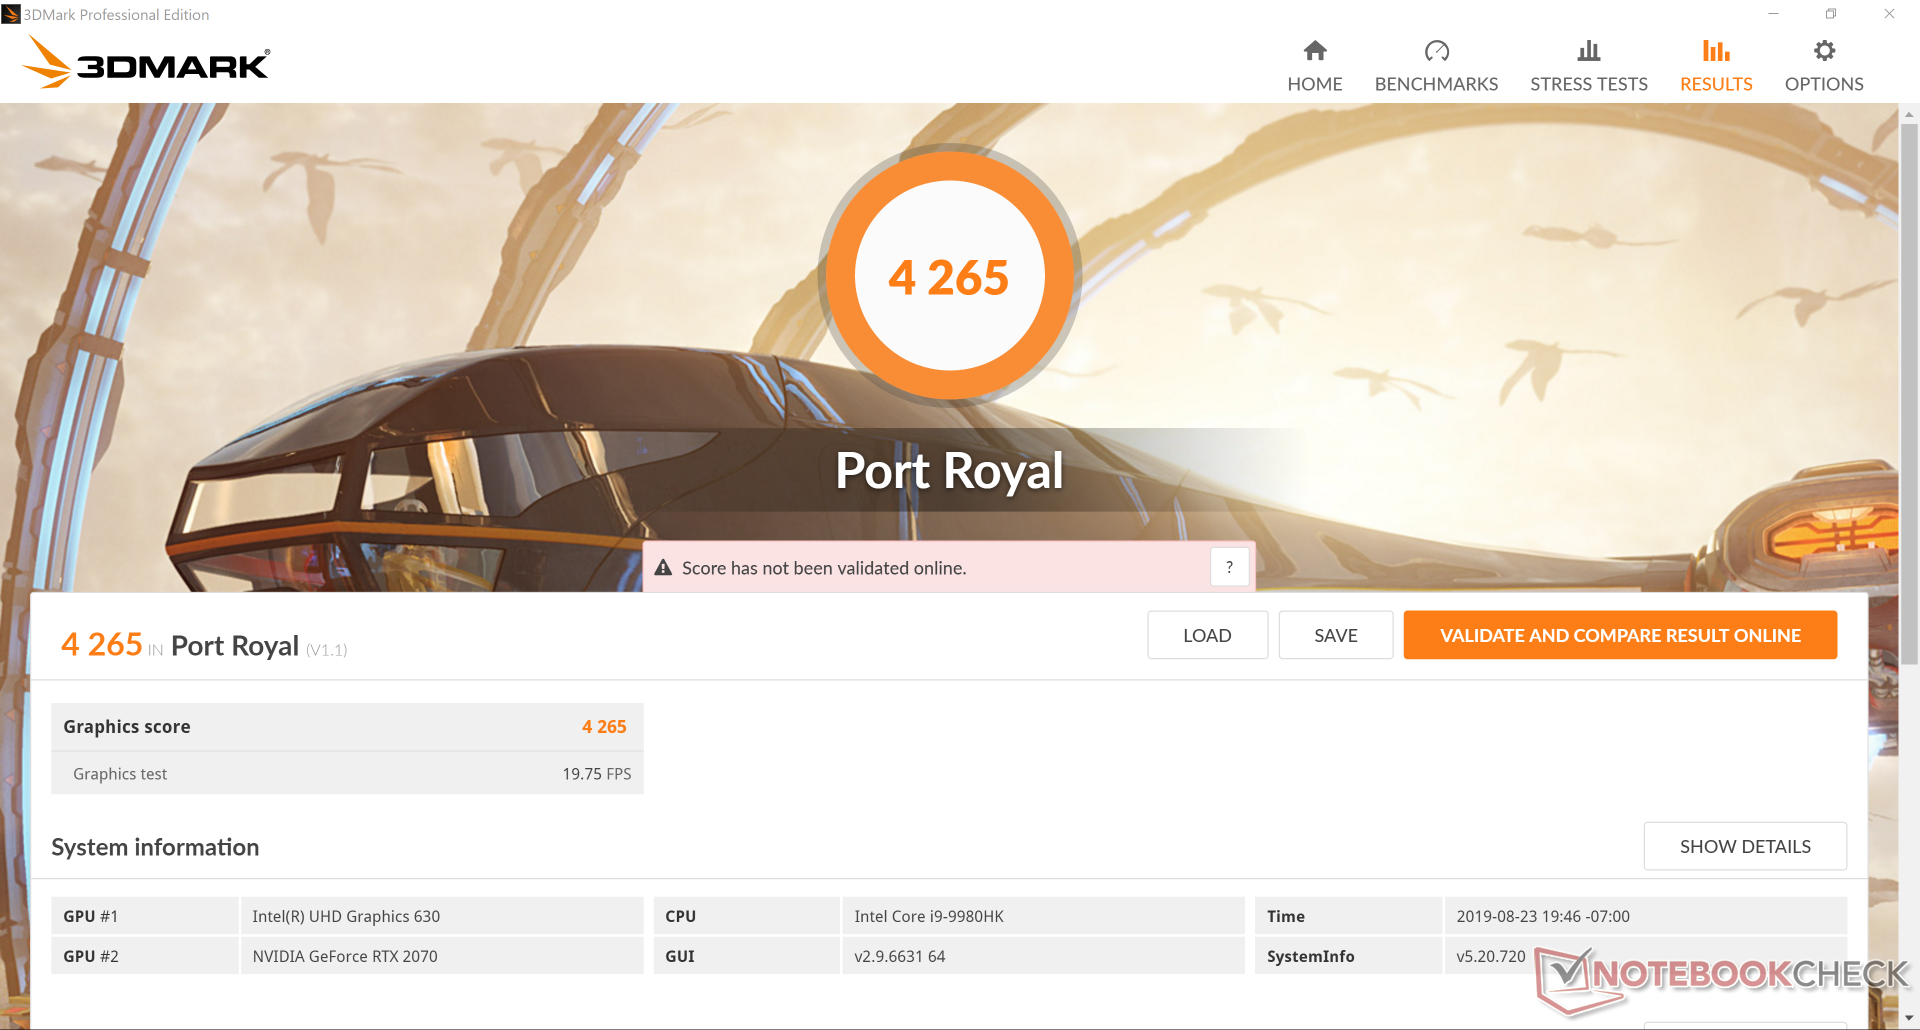
| 3DMark 11 Performance | 23371 puntos | |
| 3DMark Cloud Gate Standard Score | 40808 puntos | |
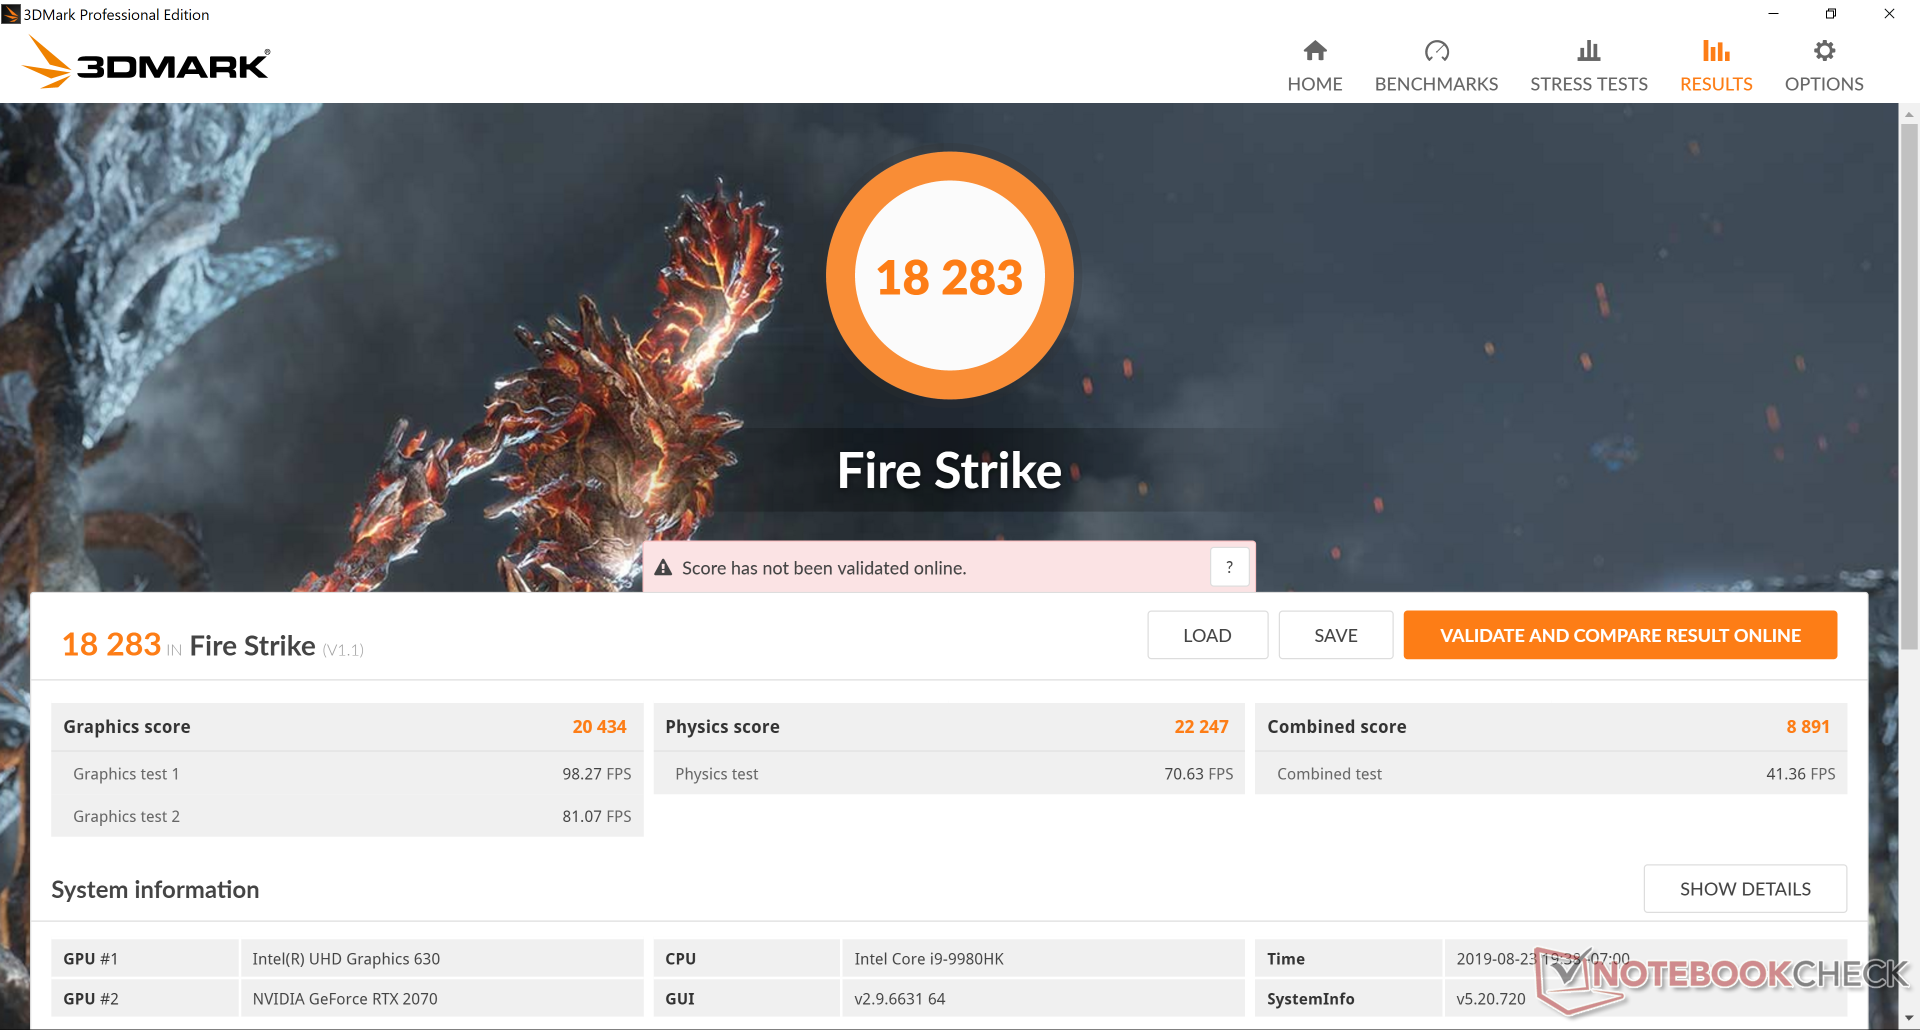
| 3DMark Fire Strike Score | 18283 puntos | |
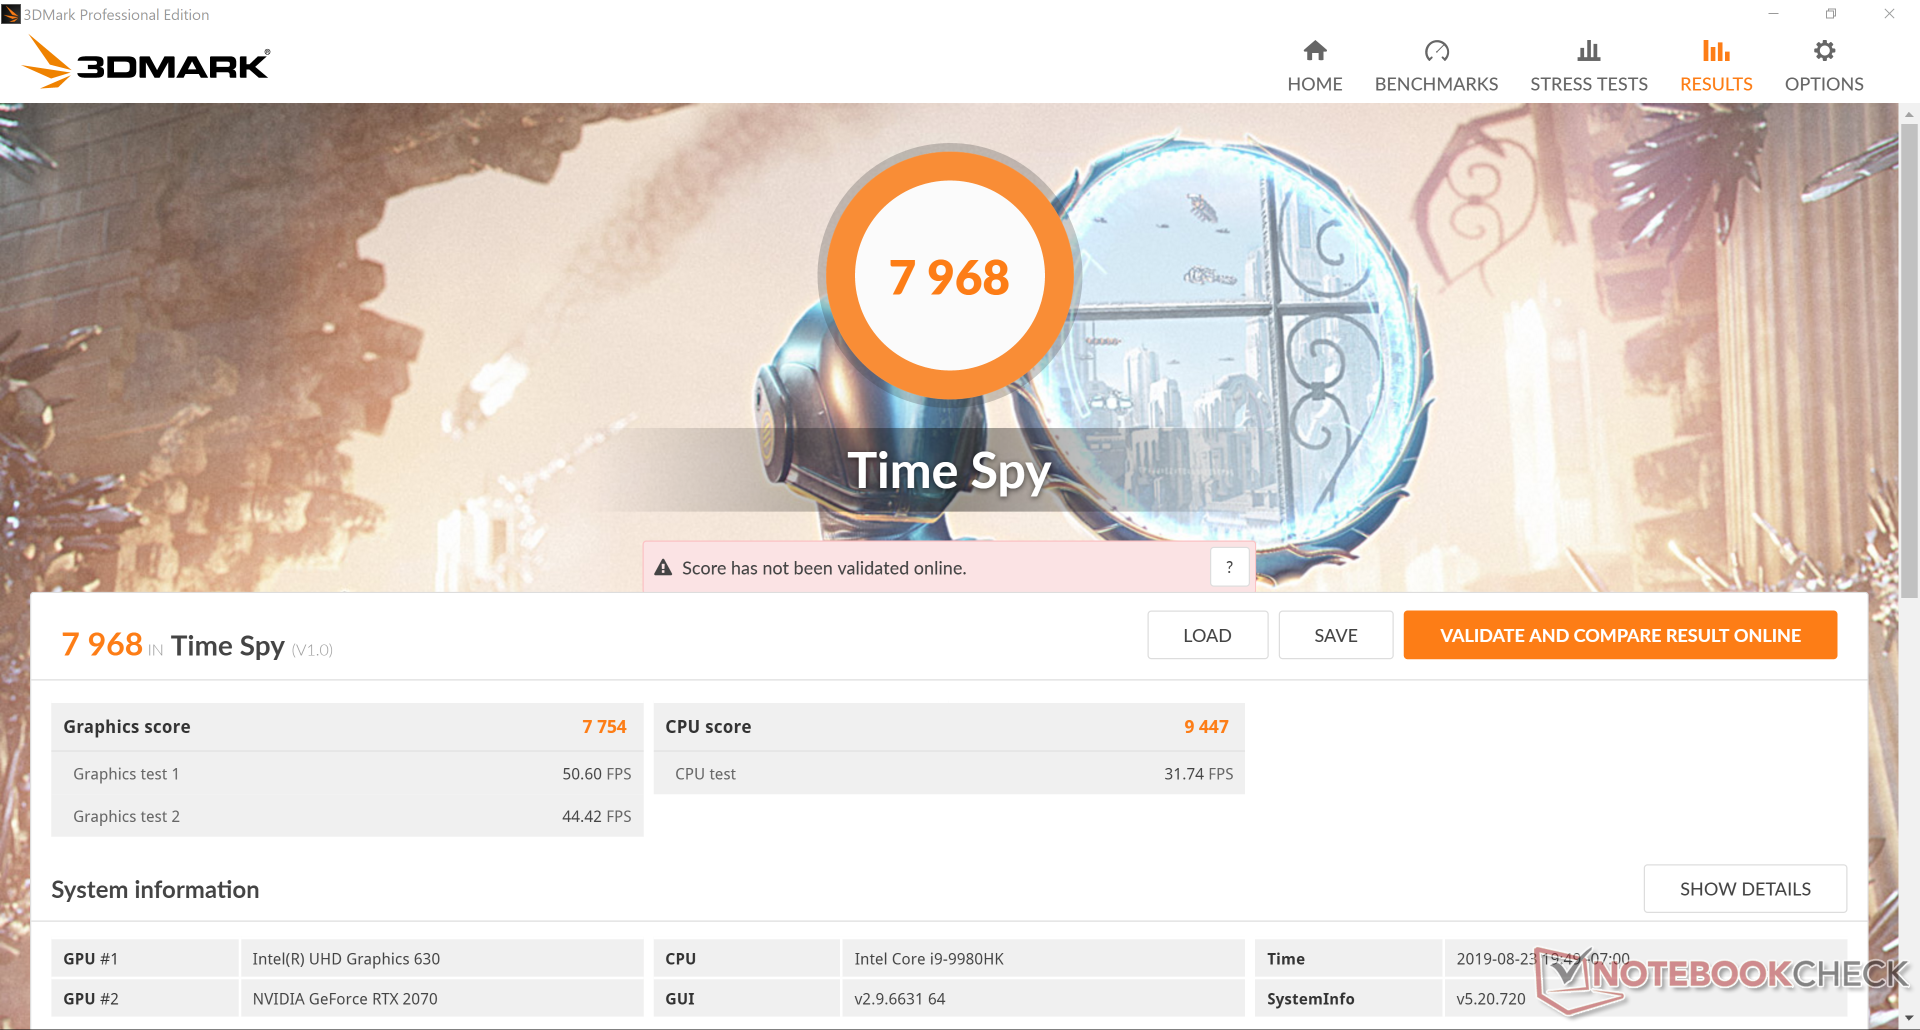
| 3DMark Time Spy Score | 7968 puntos | |
ayuda | ||
| Shadow of the Tomb Raider - 1920x1080 Highest Preset AA:T | |
| MSI GE75 9SG | |
| Asus ROG Strix RTX 2070 OC | |
| Eurocom Nightsky RX15 | |
| Origin PC EVO16-S i7-9750H RTX 2080 Max-Q | |
| AMD Radeon RX Vega 64 | |
| Medio NVIDIA GeForce RTX 2070 Mobile (74.2 - 97, n=11) | |
| Alienware m15 P79F | |
| Eurocom Nightsky Ti15 | |
| Dell XPS 15 7590 9980HK GTX 1650 | |
| bajo | medio | alto | ultra | 4K | |
|---|---|---|---|---|---|
| BioShock Infinite (2013) | 391.4 | 345.6 | 320.2 | 181.3 | |
| The Witcher 3 (2015) | 329.3 | 244.8 | 155.8 | 80.6 | 57.4 |
| Shadow of the Tomb Raider (2018) | 160 | 114 | 107 | 97 | 34 |
Emisiones
Ruido del sistema
El ruido de los ventiladores cuando el juego es idéntico al del Nightsky Ti15 significa que los usuarios obtienen un rendimiento gráfico más rápido del Nightsky RX15 sin necesidad de hacer más ruido. Los ventiladores, sin embargo, subirán más rápido para hacer ruido más rápido cuando se encuentren bajo un fuerte estrés de procesamiento. Con 53,7 dB(A), el Eurocom es más potente de lo que nos gustaría incluso para un portátil para juegos.
Recomendamos configurar el sistema en modo silencioso si no se está jugando para evitar que los ventiladores pulsen. El ruido del ventilador alcanza los 33,4 dB(A) cuando se ajusta a este modo.
| Eurocom Nightsky RX15 GeForce RTX 2070 Mobile, i9-9980HK, Samsung SSD 970 Pro 512GB | Eurocom Sky X4C GeForce GTX 1080 Mobile, i7-8700K, Samsung SSD 960 Pro 1TB m.2 NVMe | HP Omen 15-dc1303ng GeForce RTX 2070 Max-Q, i7-8750H, Samsung SSD PM981 MZVLB256HAHQ | Razer Blade 15 RTX 2080 Max-Q GeForce RTX 2080 Max-Q, i7-9750H, Samsung SSD PM981 MZVLB512HAJQ | MSI GE63 Raider RGB 8RF-008 GeForce GTX 1070 Mobile, i7-8750H, Samsung SSD PM871a MZNLN256HMHQ | Eurocom Nightsky Ti15 GeForce GTX 1660 Ti Mobile, i7-9750H, Samsung SSD 970 Pro 512GB | Dell XPS 15 7590 9980HK GTX 1650 GeForce GTX 1650 Mobile, i9-9980HK, Toshiba XG6 KXG60ZNV1T02 | |
|---|---|---|---|---|---|---|---|
| Noise | 4% | -2% | 11% | -5% | 3% | 7% | |
| apagado / medio ambiente * (dB) | 28.2 | 28.6 -1% | 30.5 -8% | 28.3 -0% | 30 -6% | 28.4 -1% | 28.2 -0% |
| Idle Minimum * (dB) | 28.2 | 28.6 -1% | 32.8 -16% | 28.8 -2% | 30 -6% | 28.6 -1% | 28.2 -0% |
| Idle Average * (dB) | 28.2 | 28.6 -1% | 32.8 -16% | 28.8 -2% | 35 -24% | 28.6 -1% | 28.2 -0% |
| Idle Maximum * (dB) | 31.7 | 31.1 2% | 32.8 -3% | 29 9% | 36 -14% | 28.6 10% | 30.4 4% |
| Load Average * (dB) | 53.7 | 42.2 21% | 42.5 21% | 33.5 38% | 42 22% | 47.8 11% | 43.8 18% |
| Witcher 3 ultra * (dB) | 53.7 | 53.8 -0% | 45 16% | 54 -1% | 53.7 -0% | 47.2 12% | |
| Load Maximum * (dB) | 53.7 | 50 7% | 47.5 12% | 45.2 16% | 56 -4% | 53.7 -0% | 47.2 12% |
* ... más pequeño es mejor
Ruido
| Ocioso |
| 28.2 / 28.2 / 31.7 dB(A) |
| HDD |
| 0 dB(A) |
| Carga |
| 53.7 / 53.7 dB(A) |
 | ||
30 dB silencioso 40 dB(A) audible 50 dB(A) ruidosamente alto |
||
min: | ||
Temperatura
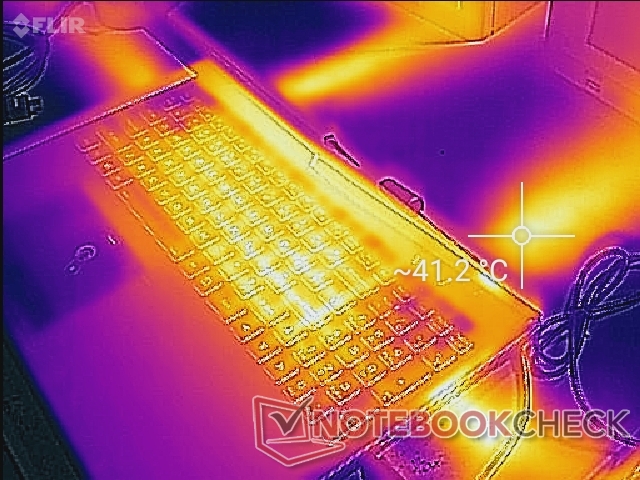
Las temperaturas de la superficie son casi las mismas que en el Nightsky Ti15. Cuando la tensión es máxima, las temperaturas de la superficie son en realidad ligeramente más frías de lo esperado, ya que las temperaturas del núcleo son más frías, como se verá en la siguiente sección. Las teclas WASD, el NumPad y los reposamanos permanecen fríos sin importar la carga, pero asegúrese de no bloquear ninguna de las muchas rejillas de ventilación en los lados o en la parte inferior.
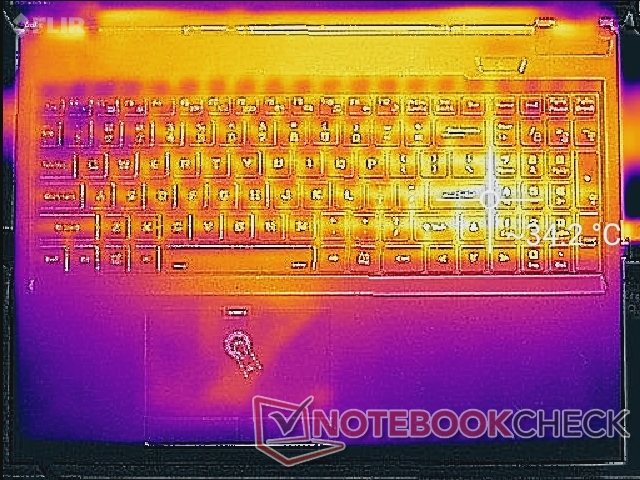
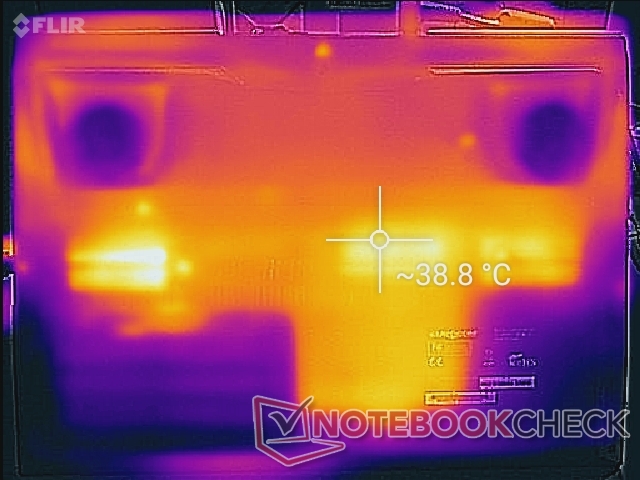
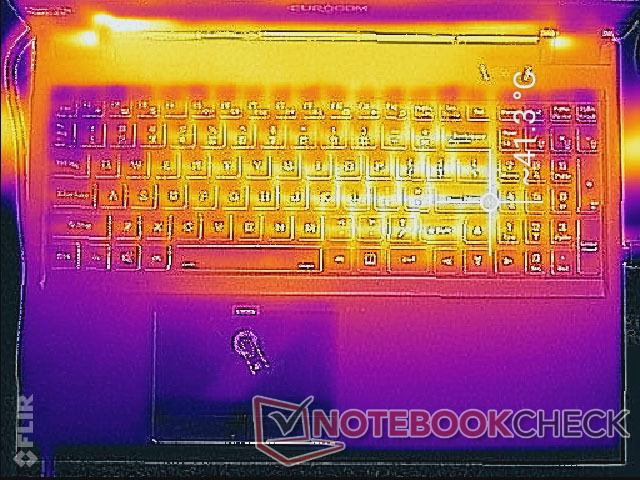
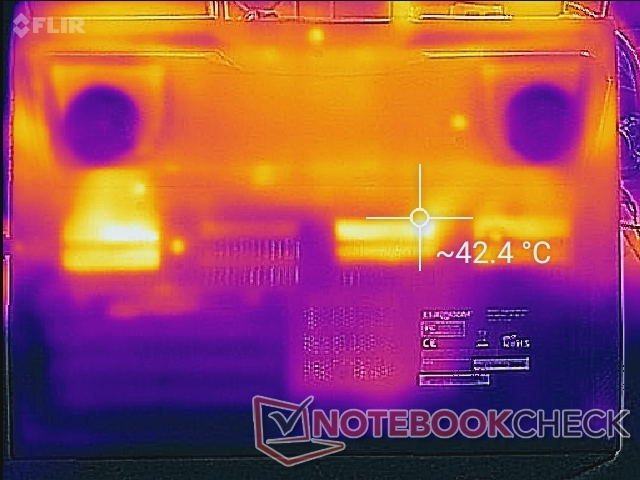
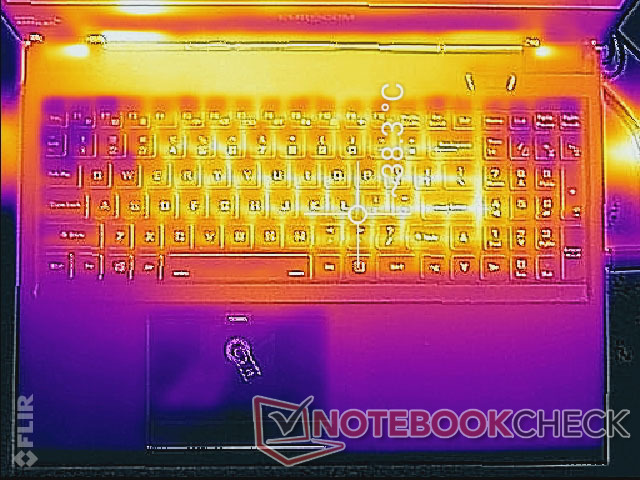
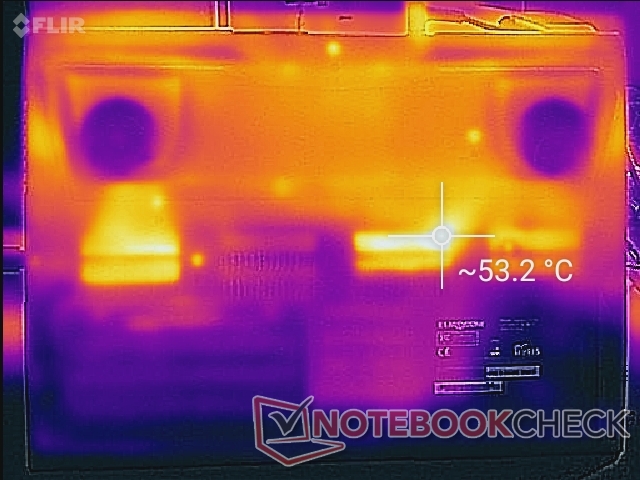
(±) La temperatura máxima en la parte superior es de 40.2 °C / 104 F, frente a la media de 40.4 °C / 105 F, que oscila entre 21.2 y 68.8 °C para la clase Gaming.
(-) El fondo se calienta hasta un máximo de 53 °C / 127 F, frente a la media de 43.2 °C / 110 F
(+) En reposo, la temperatura media de la parte superior es de 30.6 °C / 87# F, frente a la media del dispositivo de 33.9 °C / 93 F.
(±) Jugando a The Witcher 3, la temperatura media de la parte superior es de 34.9 °C / 95 F, frente a la media del dispositivo de 33.9 °C / 93 F.
(+) El reposamanos y el panel táctil están a una temperatura inferior a la de la piel, con un máximo de 29.4 °C / 84.9 F y, por tanto, son fríos al tacto.
(±) La temperatura media de la zona del reposamanos de dispositivos similares fue de 28.8 °C / 83.8 F (-0.6 °C / -1.1 F).
Prueba de esfuerzo
Hacemos hincapié en que el sistema debe identificarse para cualquier problema potencial de estrangulamiento o estabilidad. Cuando se ejecuta Prime95, la CPU se puede observar funcionando hasta 4.2 GHz durante el primer minuto más o menos hasta alcanzar una temperatura central de 83 C. A partir de entonces, la velocidad del reloj y la temperatura bajan a 3.3 GHz y 65 C, respectivamente, de forma muy similar a lo que observamos en el Nightsky Ti15 con el Core i7-9750H. Hay un margen de seguridad térmico para el overclocking si se desea.
Cuando se ejecuta tanto Prime95 como FurMark simultáneamente, las frecuencias de reloj de la CPU pueden ocasionalmente caer a sólo 2.4 GHz durante períodos muy cortos, lo que es inusual para una computadora portátil. La temperatura de la GPU también es curiosamente mucho más fría que en el Nightsky Ti15 en unos 12ºC para explicar las temperaturas más frías de la superficie.
Cuando se ejecuta Witcher 3, las velocidades de reloj de la CPU y la GPU se mantienen relativamente estables con temperaturas centrales similares a las del Nightsky Ti15, a pesar de que el hardware del Nightsky RX15 es más rápido. El Asus Strix G531GW con la misma GPU RTX 2070 se ejecuta ligeramente más caliente a 77 C cuando está bajo la misma carga de juego.
El funcionamiento con baterías limitará el rendimiento. Una ejecución de 3DMark Fire Strike con batería devuelve resultados de Física y Gráficos de 10148 y 5553 puntos, respectivamente, en comparación con los 22247 y 20434 puntos de la red eléctrica.
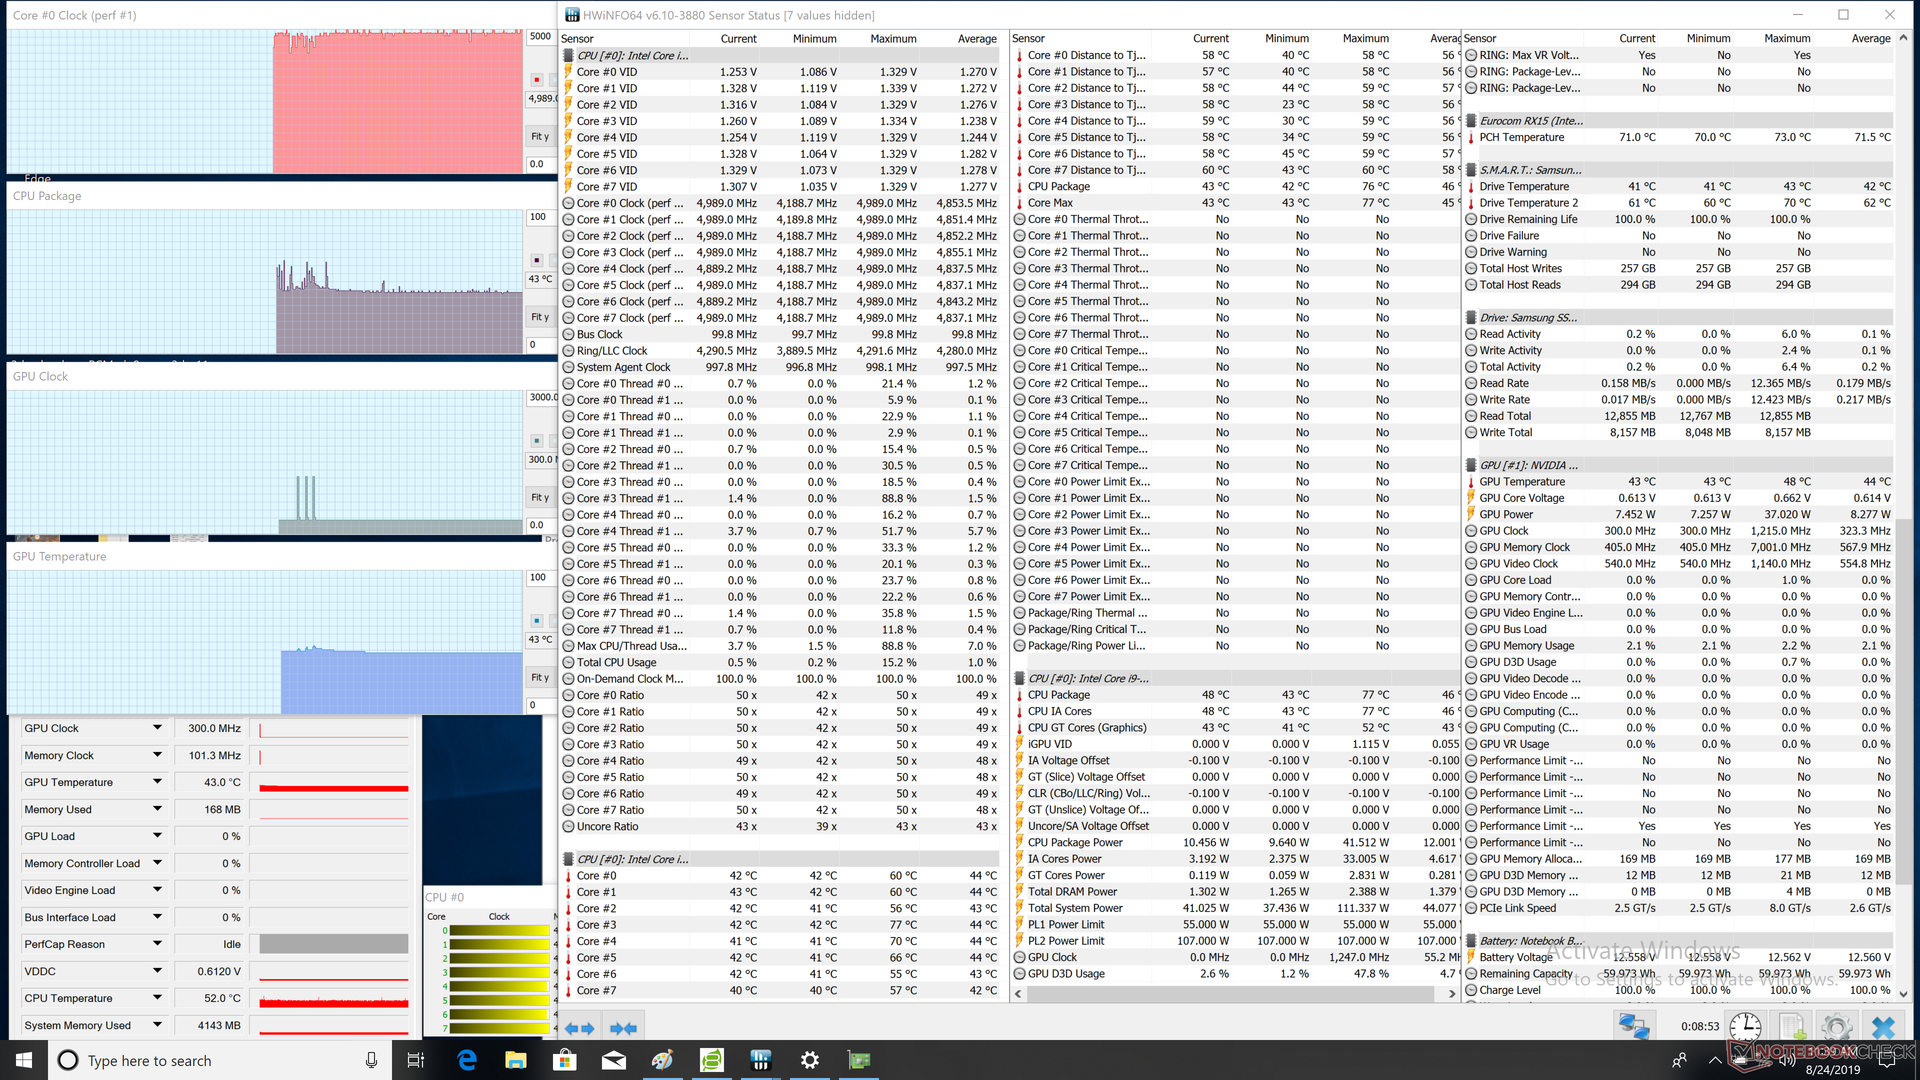
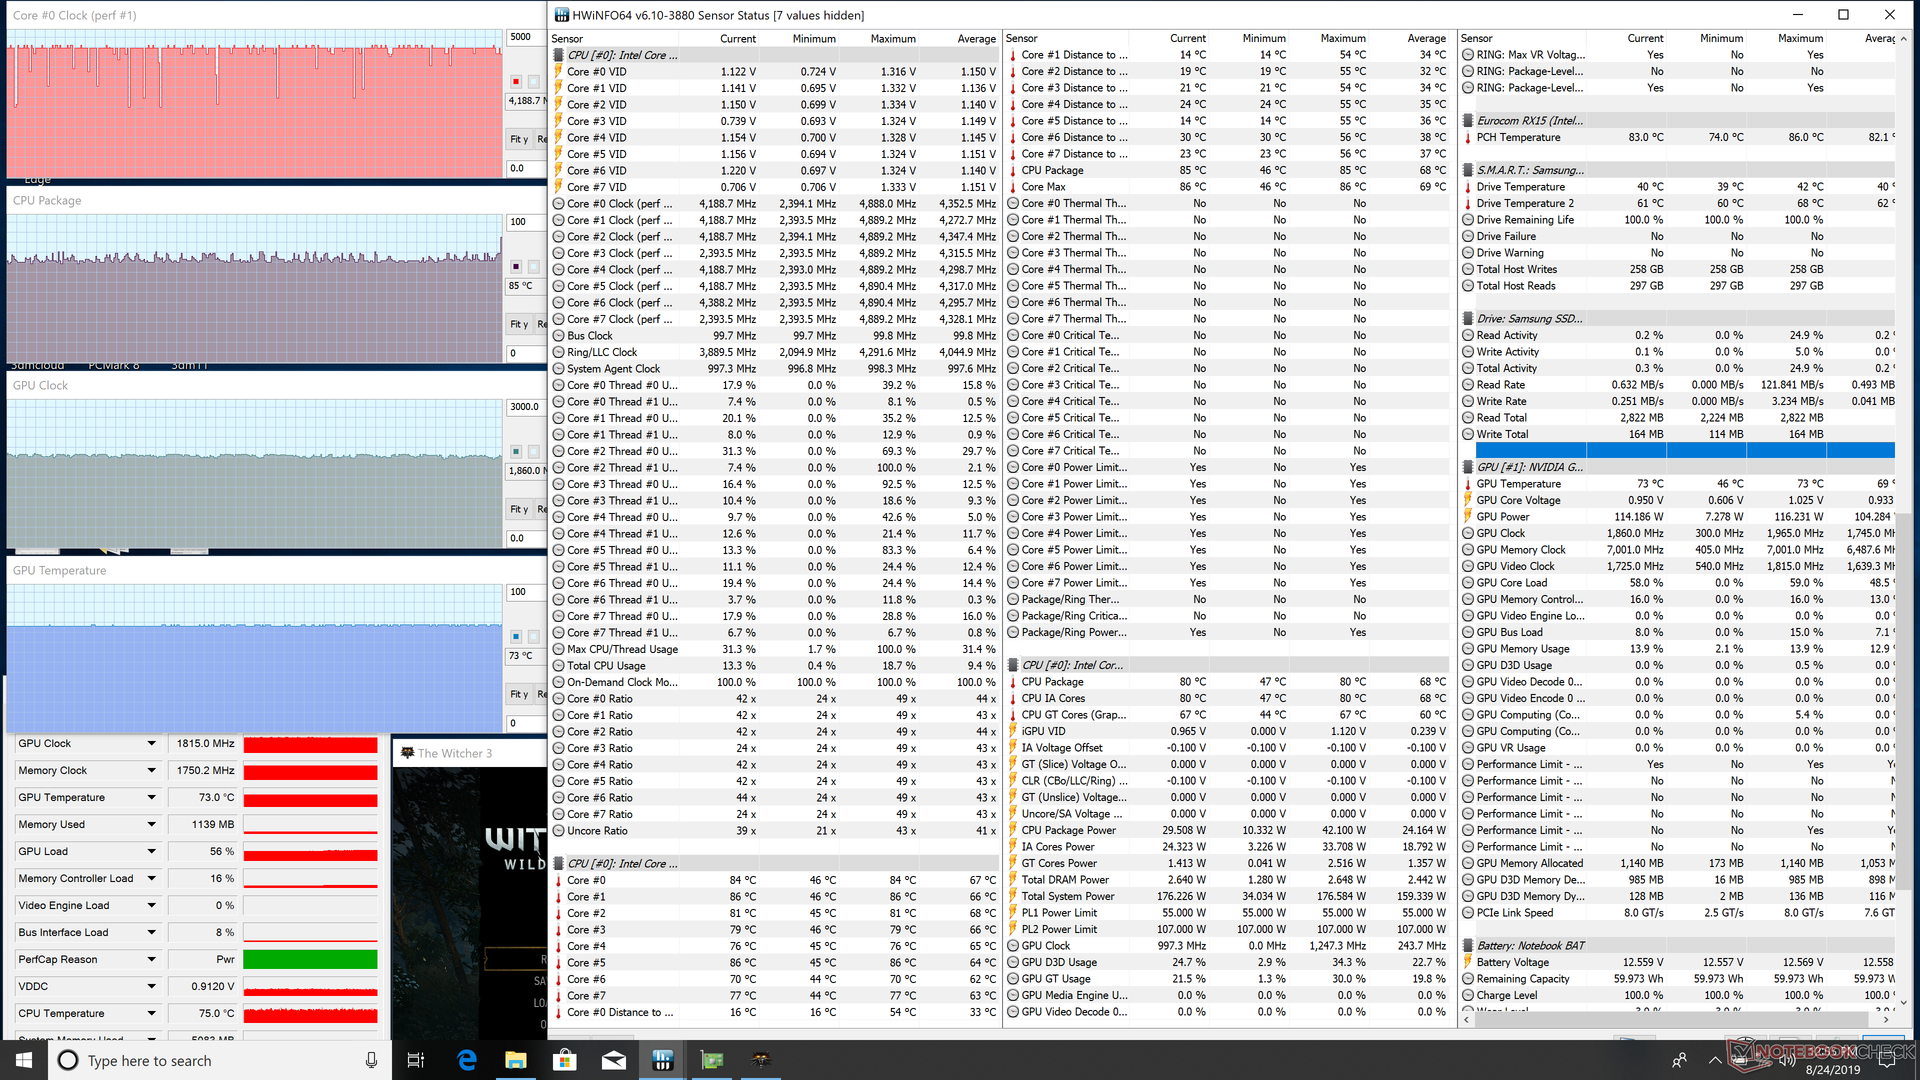
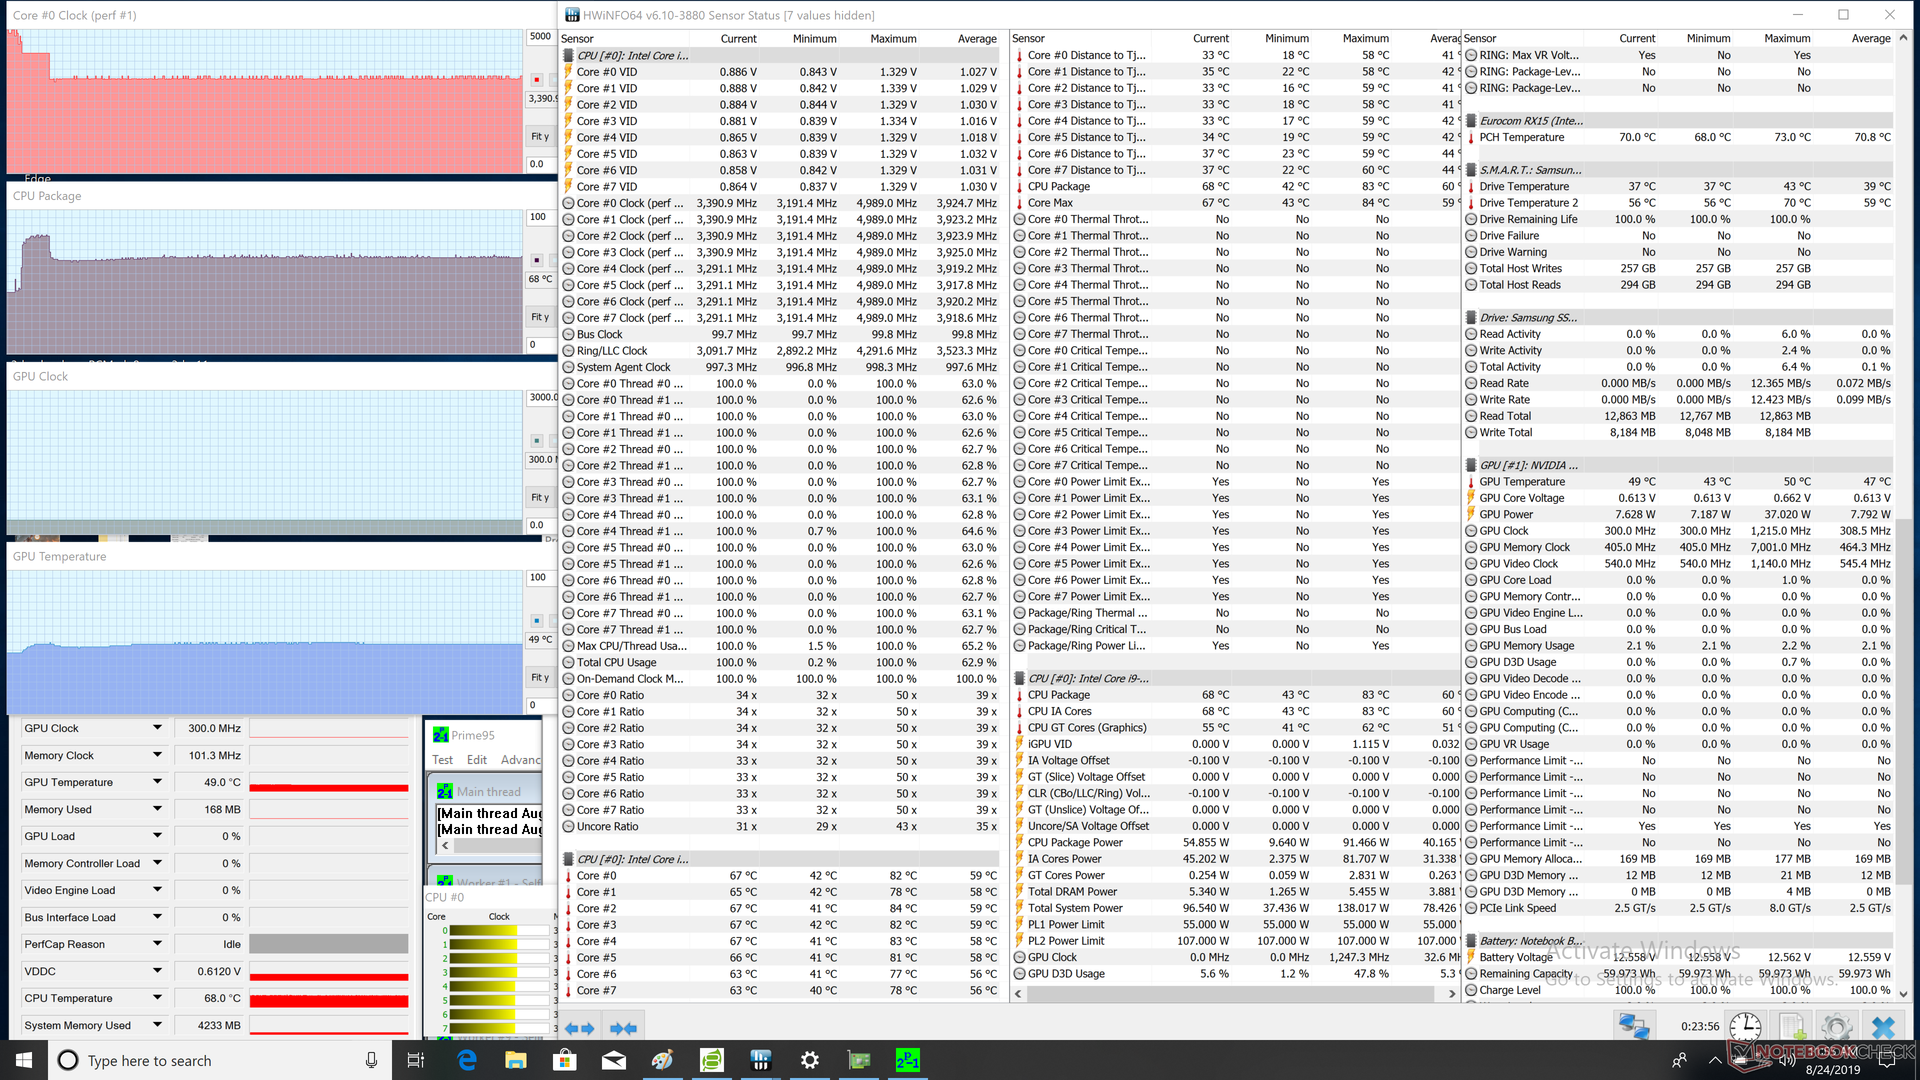
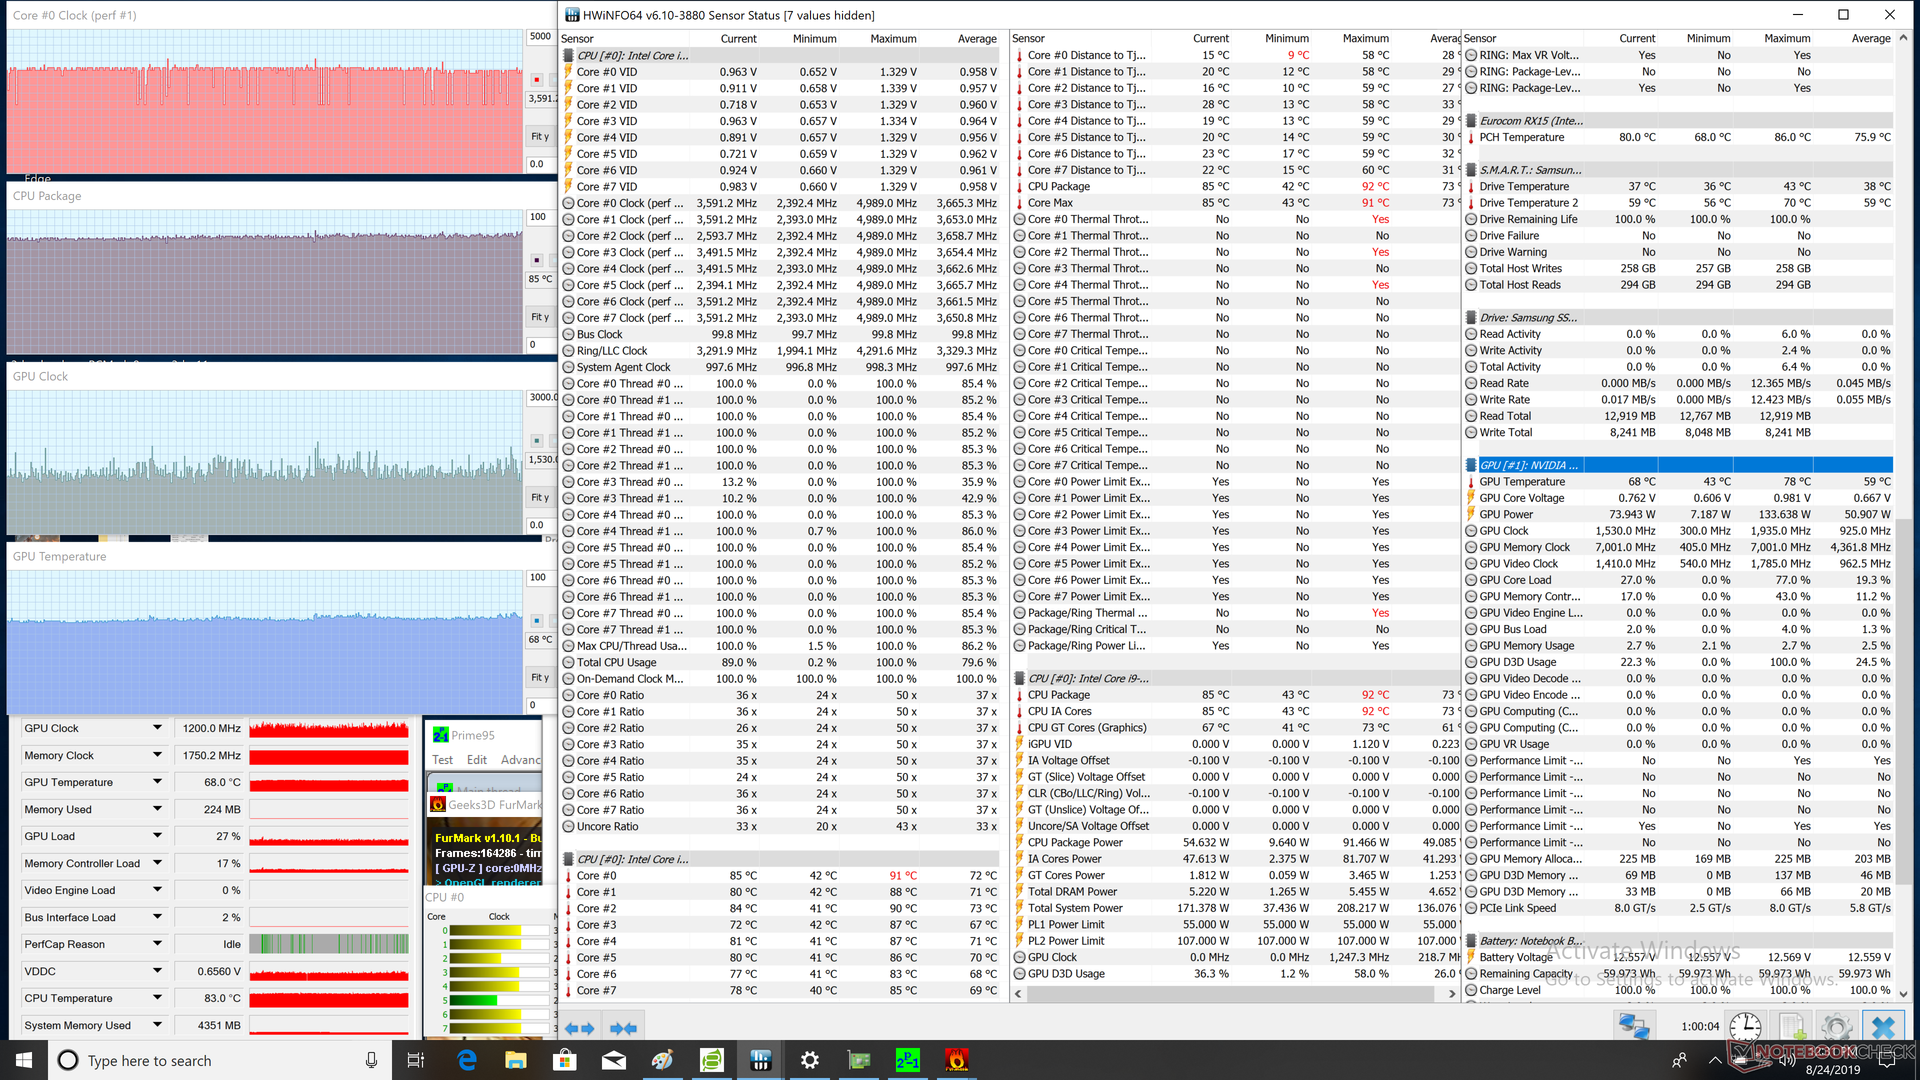
| CPU Clock (GHz) | GPU Clock (MHz) | Average CPU Temperature (°C) | Average GPU Temperature (°C) | |
| System Idle | -- | -- | 43 | 43 |
| Prime95 Stress | 3.3 - 3.4 | -- | 68 | -- |
| Prime95 + FurMark Stress | 2.4 - 3.6 | ~1200 | 85 | 68 |
| Witcher 3 Stress | ~4.2 | 1815 | ~79 | 73 |
Altavoces

Eurocom Nightsky RX15 análisis de audio
(+) | los altavoces pueden reproducir a un volumen relativamente alto (#85.6 dB)
Graves 100 - 315 Hz
(-) | casi sin bajos - de media 28.4% inferior a la mediana
(±) | la linealidad de los graves es media (12.4% delta a frecuencia anterior)
Medios 400 - 2000 Hz
(+) | medios equilibrados - a sólo 4.5% de la mediana
(±) | la linealidad de los medios es media (7% delta respecto a la frecuencia anterior)
Altos 2 - 16 kHz
(+) | máximos equilibrados - a sólo 1.6% de la mediana
(+) | los máximos son lineales (5.7% delta a la frecuencia anterior)
Total 100 - 16.000 Hz
(±) | la linealidad del sonido global es media (24.4% de diferencia con la mediana)
En comparación con la misma clase
» 88% de todos los dispositivos probados de esta clase eran mejores, 3% similares, 8% peores
» El mejor tuvo un delta de 6%, la media fue 18%, el peor fue ###max##%
En comparación con todos los dispositivos probados
» 74% de todos los dispositivos probados eran mejores, 6% similares, 20% peores
» El mejor tuvo un delta de 4%, la media fue 23%, el peor fue ###max##%
Apple MacBook 12 (Early 2016) 1.1 GHz análisis de audio
(+) | los altavoces pueden reproducir a un volumen relativamente alto (#83.6 dB)
Graves 100 - 315 Hz
(±) | lubina reducida - en promedio 11.3% inferior a la mediana
(±) | la linealidad de los graves es media (14.2% delta a frecuencia anterior)
Medios 400 - 2000 Hz
(+) | medios equilibrados - a sólo 2.4% de la mediana
(+) | los medios son lineales (5.5% delta a la frecuencia anterior)
Altos 2 - 16 kHz
(+) | máximos equilibrados - a sólo 2% de la mediana
(+) | los máximos son lineales (4.5% delta a la frecuencia anterior)
Total 100 - 16.000 Hz
(+) | el sonido global es lineal (10.2% de diferencia con la mediana)
En comparación con la misma clase
» 7% de todos los dispositivos probados de esta clase eran mejores, 2% similares, 90% peores
» El mejor tuvo un delta de 5%, la media fue 18%, el peor fue ###max##%
En comparación con todos los dispositivos probados
» 5% de todos los dispositivos probados eran mejores, 1% similares, 94% peores
» El mejor tuvo un delta de 4%, la media fue 23%, el peor fue ###max##%
Gestión de la energía
Consumo de energía
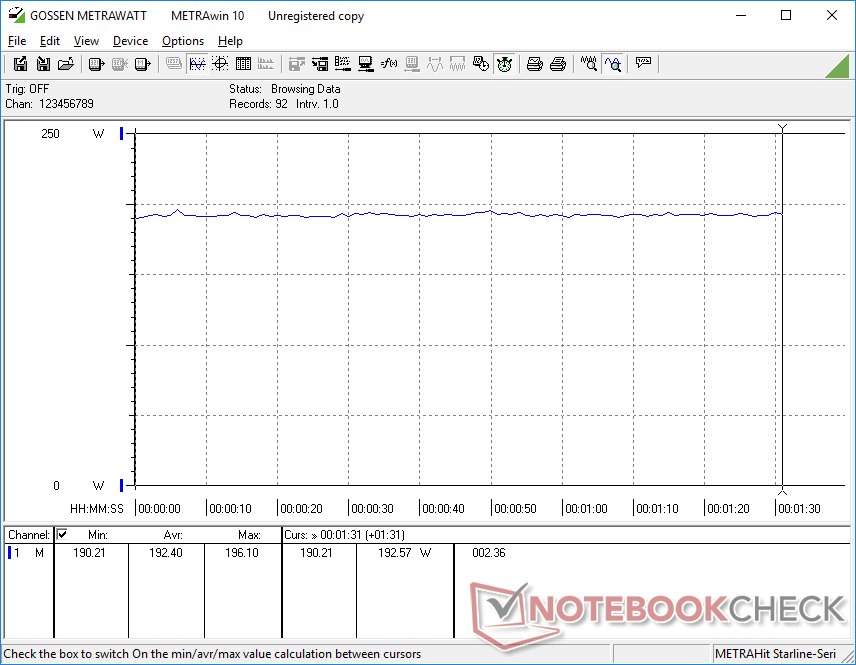
When gaming, power consumption is relatively steady at about 192 W to be 36 percent more demanding than the Nightsky Ti15 with GTX 1660 Ti graphics. Perhaps not coincidentally, the RTX 2070 outscores the GTX 1660 Ti by 36 percent in the 3DMark Time Spy benchmark.
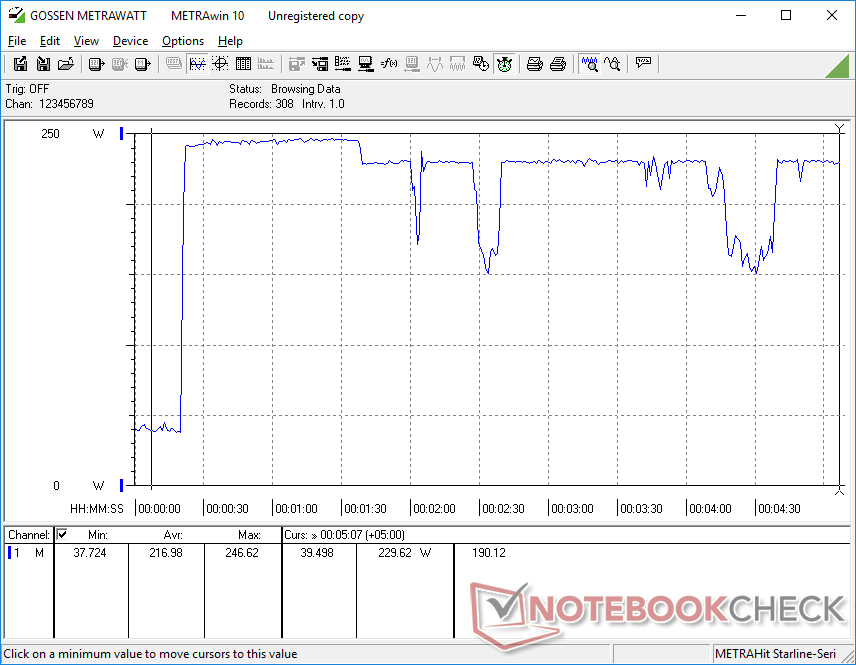
We're able to record a maximum consumption of 246 W from the medium-sized (~15 x 7.5 x 3 cm) 230 W AC adapter when running both Prime95 and FurMark simultaneously. After about 1 minute, consumption drops to the 150 W to 230 W range. Battery recharge rate becomes very slow when the CPU and GPU are at 100 percent utilization since power consumption can be so high relative to the output of the AC adapter. We would have preferred a higher watt output overhead since this system ships with an unlocked Core i9 CPU.
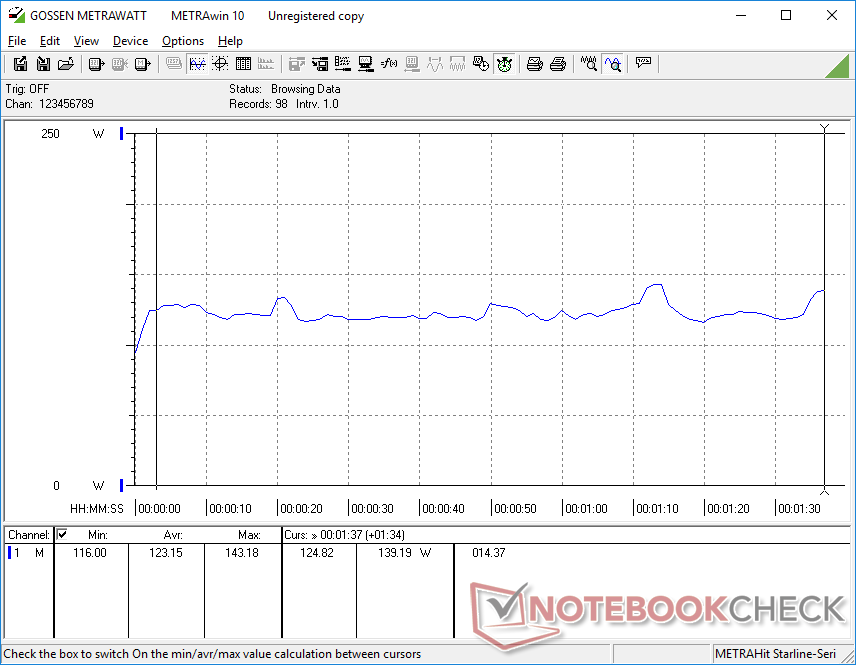
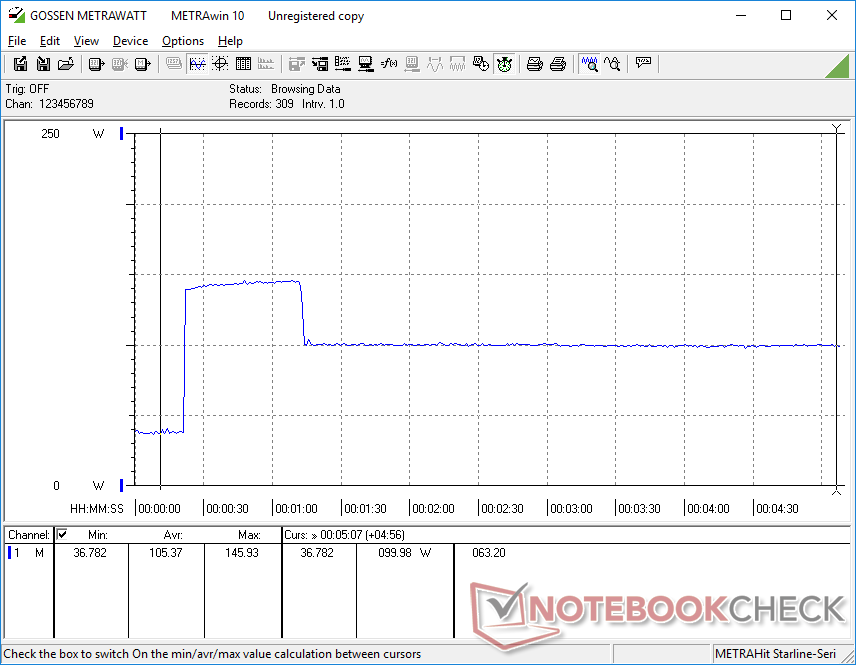
When running Prime95, consumption spikes to 145 W for the first minute before dropping and stabilizing at 100 W. This behavior mirrors our Turbo Boost clock rate observations and CineBench R15 graph above.
Note that the 230 W AC adapter here is larger than the 180 W AC adapter that ships with the less demanding Nightsky Ti15.
| Off / Standby | |
| Ocioso | |
| Carga |
|
Clave:
min: | |
| Eurocom Nightsky RX15 i9-9980HK, GeForce RTX 2070 Mobile, Samsung SSD 970 Pro 512GB, OLED, 3840x2160, 15.6" | Eurocom Sky X4C i7-8700K, GeForce GTX 1080 Mobile, Samsung SSD 960 Pro 1TB m.2 NVMe, IPS, 3840x2160, 15.6" | Razer Blade 15 RTX 2080 Max-Q i7-9750H, GeForce RTX 2080 Max-Q, Samsung SSD PM981 MZVLB512HAJQ, IPS, 1920x1080, 15.6" | MSI GE63 Raider RGB 8RF-008 i7-8750H, GeForce GTX 1070 Mobile, Samsung SSD PM871a MZNLN256HMHQ, TN, 1920x1080, 15.6" | Eurocom Nightsky Ti15 i7-9750H, GeForce GTX 1660 Ti Mobile, Samsung SSD 970 Pro 512GB, IPS, 1920x1080, 15.6" | Asus Strix Scar III G531GW i9-9880H, GeForce RTX 2070 Mobile, Intel SSD 660p 1TB SSDPEKNW010T8, IPS, 1920x1080, 15.6" | |
|---|---|---|---|---|---|---|
| Power Consumption | -33% | 21% | 24% | 3% | -32% | |
| Idle Minimum * (Watt) | 12.6 | 30.2 -140% | 12.5 1% | 9 29% | 16.8 -33% | 29 -130% |
| Idle Average * (Watt) | 21.4 | 34.7 -62% | 15.3 29% | 14 35% | 29 -36% | 32 -50% |
| Idle Maximum * (Watt) | 34.4 | 37.8 -10% | 20.7 40% | 19 45% | 30.8 10% | 37 -8% |
| Load Average * (Watt) | 123.2 | 130.3 -6% | 90.2 27% | 91 26% | 89.2 28% | 157 -27% |
| Witcher 3 ultra * (Watt) | 192.4 | 172.2 10% | 162 16% | 182 5% | 141.1 27% | 173 10% |
| Load Maximum * (Watt) | 246.6 | 217.7 12% | 209.3 15% | 238 3% | 192.3 22% | 217 12% |
* ... más pequeño es mejor
Duración de la batería
Los tiempos de ejecución de WLAN en el mundo real son casi idénticos a los del Nightsky Ti15 a unas 3,5 horas, aunque este último es el modelo menos equipado. Para esta prueba, fijamos ambos sistemas a 150 nits mientras se enlazan las mismas páginas web hasta el apagado automático. El mayor consumo de energía de OLED frente a IPS no entra en juego hasta que los ajustes de brillo son muy altos.
Vale la pena repetir que la batería de 62 Wh es extraíble y fácilmente reemplazable, a diferencia de la mayoría de los portátiles de hoy en día.
| Eurocom Nightsky RX15 i9-9980HK, GeForce RTX 2070 Mobile, 62 Wh | Eurocom Sky X4C i7-8700K, GeForce GTX 1080 Mobile, 82 Wh | HP Omen 15-dc1303ng i7-8750H, GeForce RTX 2070 Max-Q, 70 Wh | Razer Blade 15 RTX 2080 Max-Q i7-9750H, GeForce RTX 2080 Max-Q, 80 Wh | MSI GE63 Raider RGB 8RF-008 i7-8750H, GeForce GTX 1070 Mobile, 51 Wh | Eurocom Nightsky Ti15 i7-9750H, GeForce GTX 1660 Ti Mobile, 62 Wh | Dell XPS 15 7590 9980HK GTX 1650 i9-9980HK, GeForce GTX 1650 Mobile, 97 Wh | |
|---|---|---|---|---|---|---|---|
| Duración de Batería | -24% | -3% | 94% | 18% | 6% | 129% | |
| WiFi v1.3 (h) | 3.4 | 2.6 -24% | 3.3 -3% | 6.6 94% | 4 18% | 3.6 6% | 7.8 129% |
| Reader / Idle (h) | 3 | 5 | 15.9 | 5.7 | 15.2 | ||
| Load (h) | 1.4 | 1.2 | 1.7 | 0.8 | 3.3 |
Pro
Contra
Veredicto
Muchas de nuestras mismas conclusiones sobre el Nightsky Ti15 se aplican aquí para el Nightsky RX15, incluyendo la difícil facilidad de mantenimiento, la excelente retroalimentación del teclado, la duración media de la batería, el gran rendimiento y los ventiladores ruidosos cuando se juega. En su lugar, queremos responder a la pregunta: ¿Valen la pena las actualizaciones de Core i9 y OLED sobre Core i7 e IPS?
La versión más apropiada dependerá de su escenario de uso. Si planeas usar el Nightsky RX15 principalmente para juegos a 60 FPS, entonces el Core i7 con IPS u OLED hará el truco. Sin embargo, si su objetivo son frecuencias de cuadro superiores a 60 FPS, entonces la potencia adicional de la CPU del Core i9 y la velocidad de actualización nativa más rápida del panel IPS de 144 Hz o 240 Hz le servirán mejor. Para un escenario de uso mixto entre cargas de trabajo profesionales exigentes, reproducción multimedia y juegos, el Core i9 y OLED SKU como el que tenemos aquí sería óptimo. Es una lástima que el mantenimiento sea más difícil de lo que debe ser para un entusiasta de la oferta.
OLED ofrece colores notablemente más profundos, negros más profundos, menos fantasmas, píxeles más densos por pulgada, una imagen más brillante y una calidad de imagen más nítida que cualquier alternativa actual de 144 Hz o 240 Hz IPS. Sin embargo, para los jugadores de la competencia que valoran tasas de fotogramas muy altas, IPS sigue siendo la mejor opción.
Eurocom Nightsky RX15
- 08/27/2019 v6 (old)
Allen Ngo
Price comparison
