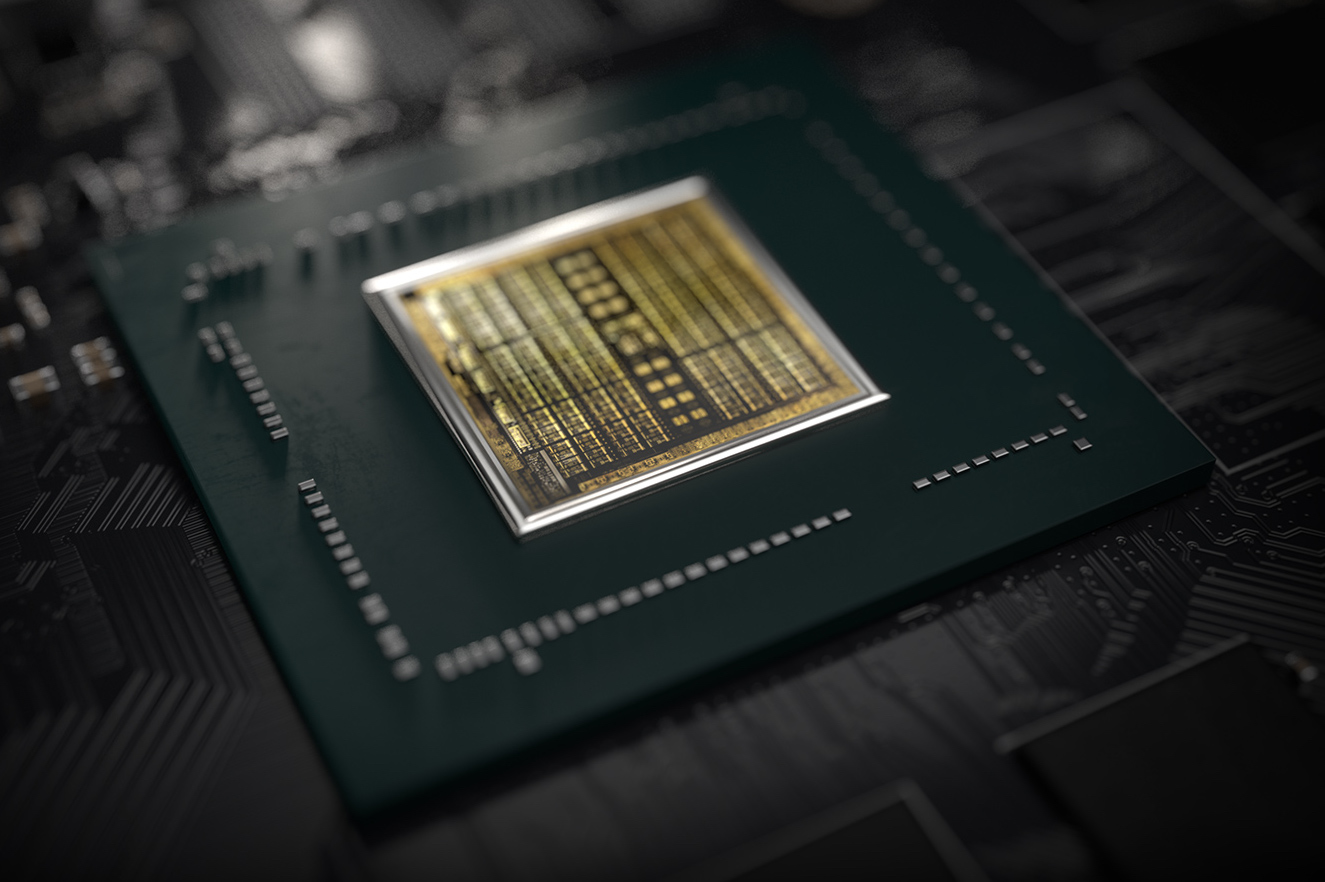
Análises de portátiles con NVIDIA GeForce GTX 1660 Ti Mobile tarjeta gráfica
Asus Zephyrus M15 GU502LU vs. GU502LW: ¿Cuál es la diferencia?
El modo turbo marca la diferencia si buscas maximizar el rendimiento de cualquiera de las dos máquinas. Repasamos lo que los usuarios pueden esperar de la serie de juegos de gama media de Asus.
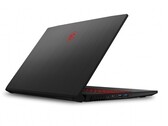
Intel Core i7-10750H, NVIDIA GeForce GTX 1660 Ti Mobile, 15.6", 2 kgReview del portátil MSI GF75 Thin 10SDR: Para jugadores con bajo presupuesto
Según MSI el GF75 10SDR-253 podría convertirse en uno de los portátiles más vendidos de esta temporada de vacaciones. Consigues una CPU de seis núcleos, un panel de 144 Hz y una GeForce GTX 1660 Ti por menos de 1.200 dólares. Naturalmente, teníamos que mirar más de cerca a este campeón de precio y rendimiento.
Intel Core i7-10750H, NVIDIA GeForce GTX 1660 Ti Mobile, 17.3", 2.2 kgReview del Nexoc GH7 (Clevo NH77DCQ): Un portátil para juegos con una batería reemplazable
Debido a su construcción más bien clásica, el GH7 de Nexoc, que se basa en un Clevo barebone, ofrece mucho espacio para las opciones de mantenimiento. Mientras que el sistema de refrigeración también es capaz de mantener un buen ritmo con la GTX 1660 Ti que se utiliza aquí, podría convertirse en un cuello de botella con las opciones de GPU más potentes. Nuestra revisión aclarará qué más pueden esperar los compradores.
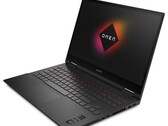
Intel Core i7-10750H, NVIDIA GeForce GTX 1660 Ti Mobile, 17.3", 2.5 kgHP Omen 15: Computadora portátil para juegos con buena duración de batería
Con la serie Omen, HP ofrece portátiles para juegos que están directamente dirigidos a los jugadores. HP no sólo cubre el segmento de gama alta aquí, sino que también ofrece atractivos dispositivos para el nivel de entrada. Con el actual Omen 15, ciertamente tenemos un dispositivo interesante en el mercado que no necesita esconderse en términos de relación calidad-precio.
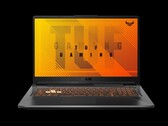
Intel Core i5-10300H, NVIDIA GeForce GTX 1660 Ti Mobile, 15.6", 2.1 kgReview del portátil Asus TUF A17 FA706IU Ryzen 7: Rendimiento del Core i9 por $1100 USD
Asus ha renovado completamente su serie TUF de arriba a abajo y los cambios son significativos. Si estabas considerando la antigua serie FX705/FX505, sáltatela y considera la nueva serie FA706/FA506 en su lugar.
AMD Ryzen 7 4800H, NVIDIA GeForce GTX 1660 Ti Mobile, 17.3", 2.6 kgSchenker XMG Core 15 GK5CP6V: Intel Core i7-9750H, 15.60", 2 kg
análise » Review del portátil Schenker XMG Core 15 (Tongfang GK5CP6V): Jugador de presupuesto
Maingear Vector 15: Intel Core i7-9750H, 15.60", 1.9 kg
análise » Review de Maingear Vector 15: Juegos polifacéticos
Acer Predator Helios 300 PH315-52-79TY: Intel Core i7-9750H, 15.60", 2.3 kg
análise » Review del portátil Acer Predator Helios 300: Un portátil moderno para juegos con una GPU Turing
Asus ROG Zephyrus M15 GU502GU-XB74: Intel Core i7-9750H, 15.60", 2 kg
análise » Review de la computadora portátil Asus Zephyrus M GU502GU: 1800 para RAM de un solo canal
MSI GF65 9SD: Intel Core i7-9750H, 15.60", 1.9 kg
análise » Review de portátiles MSI GF65 9SD: GeForce GTX 1660 Ti por menos de 1000 dólares
Razer Blade 15 GTX 1660 Ti: Intel Core i7-9750H, 15.60", 2.1 kg
análise » ¿No hay RTX? No hay problema - Review del portátil Razer Blade 15 GTX 1660 Ti Base Model
Acer Aspire Nitro 5 AN517-51-7887: Intel Core i7-9750H, 17.30", 2.8 kg
análise » Review del portátil Acer Aspire Nitro 5: Un portátil para juegos con una duración de batería decente
Eurocom Nightsky Ti15: Intel Core i7-9750H, 15.60", 2.5 kg
análise » Review del portátil Eurocom Nightsky Ti15 (Clevo PB51RF)
Lenovo Legion Y540-15IRH-81SX00B2GE: Intel Core i7-9750H, 15.60", 2.2 kg
análise » Review del portátil Lenovo Legion Y540-15IRH: Un buen portátil para juegos con una GPU GeForce GTX 1660 Ti
Lenovo Legion Y540-17IRH: Intel Core i5-9300H, 17.30", 2.8 kg
análise » Review de la Legión de Lenovo Y540-17IRH: Gamer de gama media hace pleno uso de su Core i5
Asus ROG Strix G GL731GU-RB74: Intel Core i7-9750H, 17.30", 2.9 kg
análise » Un espectáculo de luces LED: Review del portátil Asus ROG Strix G GL731GU
Schenker XMG Core 17: Intel Core i7-9750H, 17.30", 2.5 kg
análise » Schenker XMG Core 17 (Core i7-9750H, GeForce GTX 1660 Ti, pantalla de 144 Hz) Tongfang GK7CP6R Revisión del portátil
MSI GP75 Leopard 9SD: Intel Core i7-9750H, 17.30", 2.6 kg
análise » Review de la MSI GP75 Leopard 9SD: Portátil de bajo precio para juegos con un panel de 144 Hz
Aorus 15-SA: Intel Core i7-9750H, 15.60", 2.1 kg
análise » Review de portátiles Gigabyte Aorus 15-SA (Core i7-9750H, GTX 1660 Ti, 144 Hz FHD)
Medion Erazer Deputy P10-MD62132: Intel Core i5-10300H, 15.60", 2.3 kg
análise externo » Medion Erazer Deputy P10-MD62132
Dell G3 15 3500-WDP8D: Intel Core i7-10750H, 15.60", 2.6 kg
análise externo » Dell G3 15 3500-WDP8D
MSI GS66 Stealth 10SD-614NL: Intel Core i7-10750H, 15.60", 2.1 kg
análise externo » MSI GS66 Stealth 10SD-614NL
Acer Predator Helios 300 PH315-53-70M2: Intel Core i7-10750H, 15.60", 2.3 kg
análise externo » Acer Predator Helios 300 PH315-53-70M2
HP Omen 15-en0006na: AMD Ryzen 7 4800H, 15.60", 2.4 kg
análise externo » HP Omen 15-en0006na
Asus TUF Gaming F15 FX506LU-HN106: Intel Core i7-10870H, 15.60", 2.3 kg
análise externo » Asus TUF Gaming F15 FX506LU-HN106
MSI GP75 Leopard 9SD-822BE: Intel Core i7-9750H, 17.30"
análise externo » MSI GP75 Leopard 9SD-822BE
Acer Nitro 5 AN517-52-79W0: Intel Core i7-10750H, 17.30", 2.2 kg
análise externo » Acer Nitro 5 AN517-52-79W0
HP Omen 15-ek0015ns: Intel Core i7-10750H, 15.60", 2.4 kg
análise externo » HP Omen 15-ek0015ns
MSI GL75 Leopard 10SDR-271NL: Intel Core i7-10750H, 17.30", 2.6 kg
análise externo » MSI GL75 Leopard 10SDR-271NL
Lenovo Legion 5 15ARH05H-82B1000AUS: AMD Ryzen 7 4800H, 15.60", 2.5 kg
análise externo » Lenovo Legion 5 15ARH05H-82B1000AUS
Acer Aspire Nitro 5 AN515-55-74RJ: Intel Core i7-10750H, 15.60"
análise externo » Acer Aspire Nitro 5 AN515-55-74RJ
MSI GF75 Thin 10SDR: Intel Core i7-10750H, 17.30", 2.2 kg
análise externo » MSI GF75 Thin 10SDR
Gigabyte Aorus 5 SB-7UK1131SH : Intel Core i7-10750H, 15.60"
análise externo » Gigabyte Aorus 5 SB-7UK1131SH
Acer Nitro 5 AN517-52-746S: Intel Core i7-10750H, 17.30", 2.2 kg
análise externo » Acer Nitro 5 AN517-52-746S
HP Pavilion Gaming 15-ec1076ax: AMD Ryzen 7 4800H, 15.60", 2.2 kg
análise externo » HP Pavilion Gaming 15-ec1076ax
Asus TUF A17 FX706IU-H7081T: AMD Ryzen 7 4800H, 17.30", 2.6 kg
análise externo » Asus TUF A17 FX706IU-H7081T
Asus TUF A15 FA566IU-HN244T: AMD Ryzen 7 4800H, 15.60", 2.3 kg
análise externo » Asus TUF A15 FA566IU-HN244T
HP Omen 15-en0029nr: AMD Ryzen 7 4800H, 15.60", 2.5 kg
análise externo » HP Omen 15-en0029nr
Asus TUF A17 FX706: AMD Ryzen 7 4800H, 17.30", 2.6 kg
análise externo » Asus TUF A17 FX706
Asus Strix G17 G712LU-H7092T: Intel Core i7-10750H, 17.30", 2.9 kg
análise externo » Asus Strix G17 G712LU-H7092T
Asus ROG Zephyrus M15 GU502LU-BI7N4: Intel Core i7-10750H, 15.60", 2 kg
análise externo » Asus Zephyrus M15 GU502LU-BI7N4
MSI GF65 Thin 10SDR-1022XES: Intel Core i7-10750H, 15.60", 1.9 kg
análise externo » MSI GF65 Thin 10SDR-1022XES
MSI GF65 Thin 9SD-657XES: Intel Core i7-9750H, 15.60", 1.9 kg
análise externo » MSI GF65 Thin 9SD-657XES
Asus Zephyrus G14 GA401IU-HE103T: AMD Ryzen 7 4800HS, 14.00", 1.6 kg
análise externo » Asus Zephyrus G14 GA401IU-HE103T
Asus TUF Gaming A15 FA506IU-HN278: AMD Ryzen 7 4800H, 15.60"
análise externo » Asus TUF A15 FA506IU-HN278
MSI GP75 Leopard 10SDK-023PL: Intel Core i7-10750H, 17.30", 2.6 kg
análise externo » MSI GP75 Leopard 10SDK-023PL
Acer Aspire Nitro 5 AN515-54-53CU: Intel Core i5-9300H, 15.60", 2.5 kg
análise externo » Acer Aspire Nitro 5 AN515-54-53CU
HP Omen 15-ek0456ng: Intel Core i5-10300H, 15.60", 2.1 kg
análise externo » HP Omen 15-ek0456ng
Medion Erazer P15811-i7-1024F16: Intel Core i7-9750H, 15.60", 2.1 kg
análise externo » Medion Erazer P15811-i7-1024F16
Clevo NH55: unknown, 15.60", 2.7 kg
análise externo » Clevo NH55
HP Omen 15-en0263ng: AMD Ryzen 7 4800H, 15.60", 2.4 kg
análise externo » HP Omen 15-en0263ng
Lenovo Legion 5 15IMH05H-81Y60044GE: Intel Core i7-10750H, 15.60", 2.5 kg
análise externo » Lenovo Legion 5 15IMH05H-81Y60044GE
Asus ROG Strix G15 G512LU-HN093: Intel Core i7-10750H, 15.60", 2.3 kg
análise externo » Asus ROG Strix G15 G512LU-HN093
Acer Nitro 7 AN715, i5-10300H: Intel Core i5-10300H, 15.60", 2.5 kg
análise externo » Acer Nitro 7 AN715, i5-10300H
HP Omen 15-ek0071ng: Intel Core i7-10750H, 15.60", 2.4 kg
análise externo » HP Omen 15-ek0071ng
Dell G5 15 5500-FMD52: Intel Core i7-10750H, 15.60", 2.4 kg
análise externo » Dell G5 15 5500-FMD52
Acer Nitro 5 AN517-51-748R: Intel Core i7-9750H, 17.30", 2.7 kg
análise externo » Acer Nitro 5 AN517-51-748R
Acer Predator Triton 300 PT315-52-51U8: Intel Core i5-10300H, 15.60", 2.3 kg
análise externo » Acer Predator Triton 300 PT315-52-51U8
Acer Nitro 5 AN515-55-7800: Intel Core i7-10750H, 15.60", 2.3 kg
análise externo » Acer Nitro 5 AN515-55-7800
Aorus 5 SB-7US1130SH: Intel Core i7-10750H, 15.60", 2.2 kg
análise externo » Aorus 5 SB-7US1130SH
MSI GL65 10SDK-032XES: Intel Core i7-10750H, 15.60", 2.3 kg
análise externo » MSI GL65 10SDK-032XES
MSI GL75 10SDK-041XES: Intel Core i7-10750H, 17.30", 2.6 kg
análise externo » MSI GL75 10SDK-041XES
Asus TUF A17 FA706IU-AS76: AMD Ryzen 7 4800H, 17.30", 2.6 kg
análise externo » Asus TUF A17 FA706IU-AS76
Asus TUF Gaming F15 FX506IU-AL109T: AMD Ryzen 7 4800H, 15.60", 2.3 kg
análise externo » Asus TUF Gaming A15 FX506IU-AL109T
MSI GL75 10SDR-222: Intel Core i7-10750H, 17.30", 2.6 kg
análise externo » MSI GL75 10SDR-222
Asus TUF Gaming F15 FX506IU-BQ225: AMD Ryzen 7 4800H, 15.60", 2.3 kg
análise externo » Asus TUF Gaming A15 FX506IU-BQ225
MSI GL75 9SDK-268XES: Intel Core i7-9750H, 17.30", 2.5 kg
análise externo » MSI GL75 9SDK-268XES
Acer Predator Helios 300 PH315-52-796B: Intel Core i7-9750H, 15.60", 2.4 kg
análise externo » Acer Predator Helios 300 PH315-52-796B
HP Pavilion Gaming 15-ec0012ng: AMD Ryzen 7 3750H, 15.60", 2.3 kg
análise externo » HP Pavilion Gaming 15-ec0012ng
Acer Nitro 5 AN515-54-71P8: Intel Core i7-9750H, 15.60", 2.2 kg
análise externo » Acer Nitro 5 AN515-54-71P8
MSI GL75 9SD-032: Intel Core i7-9750H, 17.30", 2.5 kg
análise externo » MSI GL75 9SD-032
MSI GL65 9SD-007NL: Intel Core i7-9750H, 15.60", 2.3 kg
análise externo » MSI GL65 9SD-007NL
Asus ROG Strix G731GU-H7154: Intel Core i7-9750H, 17.30", 2.9 kg
análise externo » Asus ROG Strix G731GU-H7154
HP Pavilion Gaming 15-dk0760nd: Intel Core i7-9750H, 15.60", 2.3 kg
análise externo » HP Pavilion Gaming 15-dk0760nd
Lenovo Legion Y540-15IRH-81SX004UGE: Intel Core i5-9300H, 15.60", 2.3 kg
análise externo » Lenovo Legion Y540-15IRH-81SX004UGE
Acer Aspire Nitro 5 AN515-54-56MH: Intel Core i5-9300H, 15.60", 2.5 kg
análise externo » Acer Aspire Nitro 5 AN515-54-56MH
Lenovo Legion Y540-15-81SX0034TX: Intel Core i7-9750H, 15.60", 2.3 kg
análise externo » Lenovo Legion Y540-15-81SX0034TX
Acer Aspire Nitro 5 AN515-54-57M8: Intel Core i5-9300H, 15.60", 2.5 kg
análise externo » Acer Aspire Nitro 5 AN515-54-57M8
MSI GF65 10SDR-478 Thin: Intel Core i7-10750H, 15.60", 1.9 kg
análise externo » MSI GF65 10SDR-478 Thin
Asus ROG Strix GL531GU-AL061T: Intel Core i7-9750H, 15.60", 2.4 kg
análise externo » Asus ROG Strix GL531GU-AL061T
Dell G5 15 5590-YWTRF: Intel Core i7-9750H, 15.60", 2.9 kg
análise externo » Dell G5 15 5590-YWTRF
Asus TUF Gaming A15 FA506UI: AMD Ryzen 7 4800H, 15.60", 2.3 kg
análise externo » Asus TUF Gaming A15 FA506UI
Asus ROG Strix G731GU-EV038T: Intel Core i7-9750H, 17.30", 2.9 kg
análise externo » Asus ROG Strix G731GU-EV038T
HP Pavilion Gaming 15-dk0040nf: Intel Core i7-9750H, 15.60", 2.3 kg
análise externo » HP Pavilion Gaming 15-dk0040nf
Asus TUF Gaming A15 FA506, Ryzen 5 4600H: AMD Ryzen 5 4600H, 15.60", 2.3 kg
análise externo » Asus TUF Gaming A15 FA506, Ryzen 5 4600H
Acer Nitro 7 AN715-51-76LS: Intel Core i7-9750H, 15.60", 2.5 kg
análise externo » Acer Nitro 7 AN715-51-76LS
MSI Prestige P75 9SD Creator 625: Intel Core i7-9750H, 17.30", 2.3 kg
análise externo » MSI Prestige P75 9SD Creator 625
Lenovo Legion Y540-17IRH-81Q4002DGE: Intel Core i5-9300H, 17.30", 2.8 kg
análise externo » Lenovo Legion Y540-17IRH-81Q4002DGE
Acer Nitro 5 AN517-51-76B3: Intel Core i7-9750H, 17.30", 2.7 kg
análise externo » Acer Nitro 5 AN517-51-76B3
Razer Blade 15 GTX 1660 Ti: Intel Core i7-9750H, 15.60", 2.1 kg
análise externo » Razer Blade 15 GTX 1660 Ti
MSI GL63 9SD-1041IN: Intel Core i7-9750H, 15.60", 2.3 kg
análise externo » MSI GL63 9SD-1041IN
MSI GF65 Thin 9SD-072XES: Intel Core i7-9750H, 15.60", 0.2 kg
análise externo » MSI GF65 Thin 9SD-072XES
HP Omen 15-dc1036ns: Intel Core i7-9750H, 15.60", 2.3 kg
análise externo » HP Omen 15-dc1036ns
Schenker XMG Fusion 15-L19jby: Intel Core i7-9750H, 15.60", 1.9 kg
análise externo » Schenker XMG Fusion 15-L19jby
Asus ROG STRIX G531GU-AL003: Intel Core i7-9750H, 15.60", 2.4 kg
análise externo » Asus ROG STRIX G531GU-AL003
HP Pavilion Gaming 15-ec0022ax: AMD Ryzen 7 3750H, 15.60", 2 kg
análise externo » HP Pavilion Gaming 15-ec0022ax
Acer Predator Helios 300 PH317-53-75B4: Intel Core i7-9750H, 15.60", 3 kg
análise externo » Acer Predator Helios 300 PH317-53-75B4
HP Pavilion Gaming 15-dk0052tx: Intel Core i7-9750H, 15.60", 2.3 kg
análise externo » HP Pavilion Gaming 15-dk0052tx
MSI GL65 9SD-043IT: Intel Core i5-9300H, 15.60", 3 kg
análise externo » MSI GL65 9SD-043IT
Acer Predator Helios 300 PH315-52-52ZM: Intel Core i5-9300H, 15.60", 2.4 kg
análise externo » Acer Predator Helios 300 PH315-52-52ZM
Asus ROG Strix G531GU-AL018: Intel Core i7-9750H, 15.60", 2.4 kg
análise externo » Asus ROG Strix G531GU-AL018
MSI GL63 8SD-269ES: Intel Core i7-8750H, 15.60", 2.2 kg
análise externo » MSI GL63 8SD-269ES
Asus ROG Strix Scar III G731GU-EV044: Intel Core i7-9750H, 17.30", 2.9 kg
análise externo » Asus ROG Strix Scar III G731GU-EV044
MSI GP75 Leopard 9SD: Intel Core i7-9750H, 17.30", 2.6 kg
análise externo » MSI GP75 Leopard 9SD
Acer Predator Helios 300 PH315-52-NH.Q53EA.007: Intel Core i5-9300H, 15.60", 2.5 kg
análise externo » Acer Predator Helios 300 PH315-52-NH.Q53EA.007
Lenovo Legion Y7000 2019-81NSCTO1WW: Intel Core i7-9750H, 15.60", 2.3 kg
análise externo » Lenovo Legion Y7000 2019-81NSCTO1WW
Acer Aspire Nitro 7 AN715-51-70D6: Intel Core i7-9750H, 15.60", 2.7 kg
análise externo » Acer Aspire Nitro 7 AN715-51-70D6
Dell G3 15 3590-cn35907: Intel Core i5-9300H, 15.60", 2.4 kg
análise externo » Dell G3 15 3590-cn35907
HP Omen 15-dh0015ns: Intel Core i7-9750H, 15.60", 2.6 kg
análise externo » HP Omen 15-dh0015ns
Lenovo Legion Y545-15-81Q6CTO1WWENMY0: Intel Core i7-9750H, 15.60", 2.3 kg
análise externo » Lenovo Legion Y545-15-81Q6CTO1WWENMY0
HP Gaming Pavilion 15-dk0205ng: Intel Core i7-9750H, 15.60", 2.3 kg
análise externo » HP Gaming Pavilion 15-dk0205ng
Asus ROG Zephyrus G15 GA502DU-BQ015: AMD Ryzen 7 3750H, 15.60", 2.1 kg
análise externo » Asus ROG Zephyrus G GA502DU-BQ015
Acer Nitro 7 AN715-51-786X: Intel Core i7-9750H, 15.60", 2.7 kg
análise externo » Acer Nitro 7 AN715-51-786X
Dell G3 15 3590-G1DFD: Intel Core i7-9750H, 15.60", 2.3 kg
análise externo » Dell G3 15 3590-G1DFD
Asus ROG Strix G531GU-AL008T: Intel Core i7-9750H, 15.60", 2.4 kg
análise externo » Asus ROG Strix G531GU-AL008T
MSI GL63 8SD-270XES: Intel Core i7-8750H, 15.60", 2.3 kg
análise externo » MSI GL63 8SD-270XES
Acer Predator Helios 300 PH315-52-78VL: Intel Core i7-9750H, 15.60", 2.5 kg
análise externo » Acer Predator Helios 300 PH315-52-78VL
Aorus 15-SA: Intel Core i7-9750H, 15.60", 2.1 kg
análise externo » Aorus 15-SA
Lenovo Legion Y540-15IRH-81SX00B2GE: Intel Core i7-9750H, 15.60", 2.2 kg
análise externo » Lenovo Legion Y540-15IRH-81SX00B2GE
Asus ROG Zephyrus M15 GU502GU-XB74: Intel Core i7-9750H, 15.60", 2 kg
análise externo » Asus Zephyrus M GU502GU-XB74
Asus TUF Gaming FX505DU-AL085T: AMD Ryzen 7 3750H, 15.60", 2.2 kg
análise externo » Asus TUF Gaming FX505DU-AL085T
Acer Nitro 5 AN515-54-72T8: Intel Core i7-9750H, 15.60", 2.7 kg
análise externo » Acer Nitro 5 AN515-54-72T8
Asus TUF FX705DU-AU029T: AMD Ryzen 7 3750H, 17.30", 2.7 kg
análise externo » Asus TUF FX705DU-AU029T
Asus ROG Strix G G531GU-AL061T: Intel Core i7-9750H, 15.60", 2.4 kg
análise externo » Asus ROG Strix G G531GU-AL061T
Asus ROG Strix G G531GU-AL001: Intel Core i7-9750H, 15.60", 2.4 kg
análise externo » Asus ROG Strix G G531GU-AL001
Gigabyte Aorus 7 SA: Intel Core i7-9750H, 17.30", 2.5 kg
análise externo » Gigabyte Aorus 7 SA
MSI GS75 Stealth 9SD-604ES: Intel Core i7-9750H, 17.30", 2.3 kg
análise externo » MSI GS75 Stealth 9SD-604ES
Acer Predator Helios 300 PH315-52-79TY: Intel Core i7-9750H, 15.60", 2.3 kg
análise externo » Acer Predator Helios 300 PH315-52-79TY
Acer Aspire Nitro 5 AN517-51-754T: Intel Core i7-9750H, 17.30", 2.7 kg
análise externo » Acer Aspire Nitro 5 AN517-51-754T
Asus ROG Zephyrus G15 GA502DU-AL025T: AMD Ryzen 7 3750H, 15.60", 2.1 kg
análise externo » Asus Zephyrus G GA502DU-AL025T
Asus TUF FX505DU-BQ045: AMD Ryzen 7 3750H, 15.60", 2.2 kg
análise externo » Asus TUF FX505DU-BQ045
Asus ROG Strix G G731GU-EV032T: Intel Core i7-9750H, 17.30", 2.9 kg
análise externo » Asus ROG Strix G G731GU-EV032T
Lenovo Legion Y540-15IRH-81SX00B2GE: Intel Core i5-9300H, 15.60", 2.3 kg
análise externo » Lenovo Legion Y540-15IRH-81SX00B2GE
MSI GL73 8SD-044ES: Intel Core i7-8750H, 17.30", 2.9 kg
análise externo » MSI GL73 8SD-044ES
HP Pavilion 17-cd0228ng: Intel Core i7-9750H, 17.30", 2.8 kg
análise externo » HP Pavilion 17-cd0228ng
Asus TUF FX705DU-AU053T: AMD Ryzen 7 3750H, 17.30", 2.6 kg
análise externo » Asus TUF FX705DU-AU053T
MSI GL63 8SD-437ID: Intel Core i7-8750H, 15.60", 2.2 kg
análise externo » MSI GL63 8SD-437ID
Asus ROG Zephyrus M15 GU502GU-ES001T : Intel Core i7-9750H, 15.60", 2 kg
análise externo » Asus Zephyrus M GU502GU-ES001T
Asus TUF FX705DU-AU019T: AMD Ryzen 7 3750H, 17.30", 2.6 kg
análise externo » Asus TUF FX705DU-AU019T
Asus TUF FX505DU-MB74: AMD Ryzen 7 3750H, 15.60", 2.2 kg
análise externo » Asus TUF FX505DU-MB74
Gigabyte Aero 15 Classic-SA-F74ADW: Intel Core i7-9750H, 15.60", 2 kg
análise externo » Gigabyte Aero 15 Classic-SA-F74ADW
Acer Aspire Nitro 7 AN715-51-77D0: Intel Core i7-9750H, 15.60", 2.7 kg
análise externo » Acer Aspire Nitro 7 AN715-51-77D0
Acer Aspire Nitro 5 AN515-54-72B7: Intel Core i7-9750H, 15.60", 2.3 kg
análise externo » Acer Aspire Nitro 5 AN515-54-72B7