Análisis para el Intel Core i7-10510U procesador
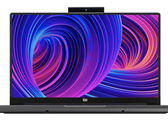
Análisis del portátil Xiaomi Mi NoteBook 14 Horizon Edition: La reducción de costes no está bien hecha
Con el Mi NoteBook 14 Horizon Edition, Xiaomi pretende rebajar el punto de entrada para un portátil multimedia capaz. Aunque el precio parece correcto para un dispositivo Core i7 Comet Lake con gráficos discretos Nvidia MX350, viene con varios compromisos. ¿Cómo afectan al uso general? Averigüémoslo.
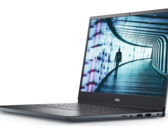
Intel Core i7-10510U, NVIDIA GeForce MX350, 14", 1.4 kgDell Vostro 14 5490: portátil de empresa con GPU dedicada en revisión
Con la serie Vostro, Dell se dirige principalmente a las pequeñas empresas que quieren ofrecer un buen compromiso entre rendimiento y coste. Nuestro Vostro 5490 de 14 pulgadas tiene incluso una tarjeta gráfica dedicada, pero el control del ventilador no está bien desarrollado.
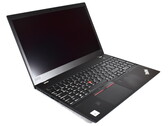
Intel Core i7-10510U, NVIDIA GeForce MX250, 14", 1.5 kgRevisión del portátil Lenovo ThinkPad P15s Gen 1: Estación de trabajo ultraportátil con una pantalla muy brillante de 4K
Ya estamos familiarizados con el Lenovo ThinkPad P15s Gen 1 aunque es la primera vez que lo tenemos en nuestras manos. Esto puede parecer una contradicción, sin embargo, estamos familiarizados con todos los aspectos del ThinkPad P15s Gen 1 excepto uno: La pantalla UHD calibrada de fábrica que se supone que es más brillante que todas las demás pantallas del ThinkPad.
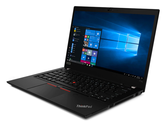
Intel Core i7-10510U, NVIDIA Quadro P520, 15.6", 1.8 kgRevisión del portátil Lenovo ThinkPad P14s Gen 1: Estación de trabajo de gama baja con desarrollo de calor de gama alta
El ThinkPad P14s Gen 1 de Lenovo toma prestado su diseño del ThinkPad T14 modelo T e incluye una GPU Nvidia Quadro como punto de venta único. Para la mayoría de los usuarios, esto probablemente sólo traerá ventajas menores, también porque su rendimiento es limitado en sí mismo. Sin embargo, el ThinkPad P14 puede ser una buena opción para una o dos aplicaciones CAD en movimiento.
Intel Core i7-10510U, NVIDIA Quadro P520, 14", 1.5 kgRevisión del portátil Huawei MateBook 14 2020: 3:2 clamshell convence a ambos con CPUs Intel y AMD
Huawei ofrece su MateBook 14 con procesadores AMD e Intel. Completamente idénticos por fuera, son portátiles muy diferentes por dentro. Hemos probado y comparado ambas versiones del dispositivo de gama media 3:2 de Huawei.
Intel Core i7-10510U, NVIDIA GeForce MX350, 14", 1.5 kgHP Envy 13-ba0001ng: NVIDIA GeForce MX350, 13.30", 1.3 kg
análise » HP Envy 13 Laptop Review: Elegante caja de metal y un sólido rendimiento
Lenovo ThinkPad E14-20RA001LGE: AMD Radeon RX 640, 14.00", 1.7 kg
análise » Review del portátil ThinkPad E14 de Lenovo: La CPU de Intel pierde contra AMD Ryzen, pero ¿qué más hay de nuevo?
Samsung Galaxy Book Ion Aura Silver: NVIDIA GeForce MX250, 15.60", 1.3 kg
análise » Review del portátil plateado Samsung Galaxy Book Ion Aura: Un gran Ultrabook de 15 pulgadas con problemas de conducción
Lenovo ThinkBook Plus 13 i7: Intel UHD Graphics 620, 13.30", 1.4 kg
análise » Review del portátil ThinkBook Plus de Lenovo: La única pantalla de tinta electrónica que cumple con el hardware promedio
Lenovo ThinkPad X13 Yoga 20SX0004GE: Intel UHD Graphics 620, 13.30", 1.3 kg
análise » Review del Lenovo ThinkPad X13 Yoga: Un convertible de negocios muy bien equipado
Acer Aspire 3 A317-51G-72MD: NVIDIA GeForce MX250, 17.30", 2.8 kg
análise » Review del Acer Aspire 3 A317-51G: El todoterreno de 17,3 pulgadas ofrece 2 TB de espacio de almacenamiento
Acer TravelMate P6 P614-51T-G2-72ZU: Intel UHD Graphics 620, 14.00", 1.2 kg
análise » Review de Acer TravelMate P6: Ligero portátil de negocios con batería de larga duración
Acer TravelMate P215-52: Intel UHD Graphics 620, 15.60", 1.8 kg
análise » Review del portátil Acer TravelMate P2 TMP215-52: Negocio asequible
HP ProBook 450 G7 8WC04UT: NVIDIA GeForce MX250, 15.60", 1.9 kg
análise » Review del portátil HP ProBook 450 G7 Core i7: ¿Es mejor que el Ryzen 7 ProBook 455 G7?
Lenovo ThinkPad X1 Carbon 2020-20U9003BGE: Intel UHD Graphics 620, 14.00", 1.1 kg
análise » Review del ThinkPad X1 Carbon 2020 Business-Laptop de Lenovo: La pantalla 4K cuesta el tiempo de funcionamiento de la batería
Lenovo ThinkPad X1 Yoga 2020-20UCS03S00: Intel UHD Graphics 620, 14.00", 1.3 kg
análise » Review del portátil Lenovo ThinkPad X1 Yoga 2020: Un convertible de negocios con pequeñas mejoras
Asus VivoBook S14 S433FL: NVIDIA GeForce MX250, 14.00", 1.4 kg
análise » Review del Asus VivoBook S14 S433FL: Un portátil de color con un maletín estable
Lenovo ThinkPad T15 Gen1-20S7S02U00: NVIDIA GeForce MX330, 15.60", 1.8 kg
análise » Review del portátil Lenovo ThinkPad T15 Gen 1: Frustrado por la falta de opción de AMD
Lenovo ThinkPad X1 Carbon 2020-20UAS04T00: Intel UHD Graphics 620, 14.00", 1.1 kg
análise » Review del ThinkPad X1 Carbon 2020: Un portátil de empresa familiar con un nuevo adaptador de corriente
Asus VivoBook 17 S712FA-DS76: Intel UHD Graphics 620, 17.30", 2.3 kg
análise » Review del portátil Asus VivoBook 17 S712FA: Bajo peso, bajo precio
HP Envy x360 15-dr1679cl: Intel UHD Graphics 620, 15.60", 2.1 kg
análise » Review del HP Envy x360 15 Core i7 Convertible 2 en 1: Un poco demasiado familiar
HP 470 G7 8VU24EA: AMD Radeon 530, 17.30", 2.4 kg
análise » Review del HP 470 G7: Reemplazo de la computadora de 17.3 pulgadas sin brillo
Huawei MateBook X Pro 2020 i7: NVIDIA GeForce MX250, 13.90", 1.3 kg
análise » Review del Huawei MateBook X Pro 2020 - Ordenador portátil compacto con problemas de rendimiento
HP ProBook 430 G7-8VU53EA: Intel UHD Graphics 620, 13.30", 1.4 kg
análise » Review del portátil HP ProBook 430 G7: No hay grandes mejoras con el Comet Lake
Asus ExpertBook B9450FA, i7-10510U: Intel UHD Graphics 620, 14.00", 1 kg
análise » Review de Asus ExpertBook B9450FA: Ultra ligero y de alta resistencia
Asus ZenBook Duo UX481FL: NVIDIA GeForce MX250, 14.00", 1.8 kg
análise » Como el Apple Touch Bar, pero mejor: Review del portátil Asus ZenBook Duo UX481
Lenovo ThinkPad X1 Yoga 20SA000GUS: Intel UHD Graphics 620, 14.00", 1.3 kg
análise » Review del ThinkPad X1 Yoga de Lenovo 4ª Gen Core i7 Convertible: Un ThinkPad X1 de carbono disfrazado
LG Gram 14T90N: Intel UHD Graphics 620, 14.00", 1.2 kg
análise » Review del convertible LG Gram 14T90N: Una bajada de la CPU
Lenovo ThinkPad X1 Carbon G7 20R1-000YUS: Intel UHD Graphics 620, 14.00", 1.2 kg
análise » Review del portátil Lenovo ThinkPad X1 Carbon G7 2020: El mismo aspecto, nuevo procesador
Asus ZenBook Flip 15 UX563FD-A1027T: NVIDIA GeForce GTX 1050 Max-Q, 15.60", 1.9 kg
análise » Review del Asus ZenBook Flip 15 UX563FD: Convertible multimedia para creadores de contenidos
Lenovo ThinkPad E15 20RD0011GE: AMD Radeon RX 640, 15.60", 1.8 kg
análise » Review del portátil Lenovo ThinkPad E15: Demasiado rendimiento con muy poca refrigeración
Asus ZenBook 15 UX534FTC-A8190T: NVIDIA GeForce GTX 1650 Max-Q, 15.60", 1.6 kg
análise » Review del Asus ZenBook 15 UX534FTC: Matte, el poderoso rey de la vida de la batería
MSI Prestige 14 A10RC: NVIDIA GeForce MX330, 14.00", 1.3 kg
análise » Review de Nvidia GeForce MX330 y MX350: Arquitectura conocida - Nuevo nombre
MSI Prestige 14 A10RD: NVIDIA GeForce MX350, 14.00"
análise » Review de Nvidia GeForce MX330 y MX350: Arquitectura conocida - Nuevo nombre
Lenovo ThinkPad T490 20RY0002US: Intel UHD Graphics 620, 14.00", 1.5 kg
análise » Review del portátil Lenovo ThinkPad T490: La actualización de Comet Lake-U
MSI Modern 15 A10RB: NVIDIA GeForce MX250, 15.60", 1.6 kg
análise » Review del portátil MSI Modern 15 A10RB: El Dell XPS 15 Lite
HP Spectre X360 15-5ZV31AV: NVIDIA GeForce MX250, 15.60", 2.1 kg
análise » Review del convertible HP Spectre X360 15 de finales de 2019: Comet Lake Core i7 con gráficos GeForce MX
Lenovo Yoga C740-15IML: Intel UHD Graphics 620, 15.60", 1.9 kg
análise » Review del portátil Lenovo Yoga C740-15IML: Batería fuerte, pantalla débil
HP Envy 17-ce1004ng: NVIDIA GeForce MX250, 17.30", 2.8 kg
análise » Review de HP Envy 17-ce1002ng Laptop: Una máquina delgada de 17 pulgadas con rendimiento mixto
MSI Modern 14 B10RBSW-257XFR: NVIDIA GeForce MX350, 14.00", 1.3 kg
análise externo » MSI Modern 14 B10RBSW-257XFR
HP 15s-du1031tx: NVIDIA GeForce MX250, 15.60", 1.8 kg
análise externo » HP 15s-du1031tx
Asus ZenBook Duo UX481FA-DB71T: Intel HD Graphics 620, 14.10", 1.5 kg
análise externo » Asus ZenBook Duo UX481FA-DB71T
Acer TravelMate P6 TMP614-51-G2-788Z: Intel UHD Graphics 620, 14.00", 1.1 kg
análise externo » Acer TravelMate P6 TMP614-51-G2-788Z
Asus ZenBook 14 UX434FAC-A5144T: Intel UHD Graphics 620, 14.00", 1.2 kg
análise externo » Asus ZenBook 14 UX434FAC-A5144T
Dynabook Portégé X50-G-10V: Intel UHD Graphics 620, 15.60", 1.4 kg
análise externo » Dynabook Portégé X50-G-10V
Honor MagicBook Pro, i5-10510U: Intel UHD Graphics 620, 16.10", 1.7 kg
análise externo » Honor MagicBook Pro, i5-10510U
LG Ultra 17U70N-J.AA78B: NVIDIA GeForce GTX 1650 Mobile, 17.30"
análise externo » LG Ultra 17U70N-J.AA78B
Asus VivoBook S15 S533FL-BQ057T: NVIDIA GeForce MX250, 15.60", 1.8 kg
análise externo » Asus VivoBook S15 S533FL-BQ057T
Lenovo ThinkPad X1 Carbon G8-20U90044UK: Intel UHD Graphics 620, 14.00", 1.1 kg
análise externo » Lenovo ThinkPad X1 Carbon G8-20U90044UK
Dell Latitude 14 3410, i7-10510U: Intel UHD Graphics 620, 14.00", 1.6 kg
análise externo » Dell Latitude 14 3410, i7-10510U
Lenovo ThinkPad X13 Yoga 20SX0004GE: Intel UHD Graphics 620, 13.30", 1.3 kg
análise externo » Lenovo ThinkPad X13 Yoga 20SX0004GE
HP EliteBook 830 G7, i7-10510U: Intel UHD Graphics 620, 13.30", 1.2 kg
análise externo » HP EliteBook 830 G7, i7-10510U
HP EliteBook x360 830 G7, i7-10510U: Intel UHD Graphics 620, 13.30", 1.3 kg
análise externo » HP EliteBook x360 830 G7, i7-10510U
Acer Enduro N3 EN314-51W-78KN: Intel UHD Graphics 620, 14.00", 2.5 kg
análise externo » Acer Enduro N3 EN314-51W-78KN
Asus Zenbook 15 UX534FTC-A8094T: Intel UHD Graphics 620, 15.60", 1.6 kg
análise externo » Asus Zenbook 15 UX534FTC-A8094T
MSI Modern 14 B10MW-050XES: Intel UHD Graphics 620, 14.00", 1.3 kg
análise externo » MSI Modern 14 B10MW-050XES
MSI Modern 14 B10MW-026XES: Intel UHD Graphics 620, 14.00", 1.3 kg
análise externo » MSI Modern 14 B10MW-026XES
MSI Modern 14 B10RBSW-064XES: NVIDIA GeForce MX350, 14.00", 1.3 kg
análise externo » MSI Modern 14 B10RBSW-064XES
Lenovo ThinkPad X1 Carbon 2020-20U9003BGE: Intel UHD Graphics 620, 14.00", 1.1 kg
análise externo » Lenovo ThinkPad X1 Carbon 2020-20U9003BGE
Lenovo ThinkPad X1 Carbon 2020-20UAS04T00: Intel UHD Graphics 620, 14.00", 1.1 kg
análise externo » Lenovo ThinkPad X1 Carbon 2020-20UAS04T00
Asus ExpertBook B9450FA-BM0367R: Intel UHD Graphics 620, 14.00", 0.9 kg
análise externo » Asus ExpertBook B9450FA-BM0367R
Huawei MateBook 14 2020 Intel: NVIDIA GeForce MX350, 14.00", 1.5 kg
análise externo » Huawei MateBook 14 2020 Intel
LG Ultra 17U70N-R.AAS8U1: NVIDIA GeForce GTX 1650 Mobile, 17.00", 2 kg
análise externo » LG Ultra 17U70N-R.AAS8U1
Asus VivoBook S14 S433FL-EB180T: NVIDIA GeForce MX250, 14.00", 1.5 kg
análise externo » Asus VivoBook S14 S433FL-EB180T
Lenovo ThinkBook 13s-IML-20RR0003GE: Intel UHD Graphics 620, 13.30", 1.3 kg
análise externo » Lenovo ThinkBook 13s-IML-20RR0003GE
MSI Modern 14 B10RBSW-063XES: Intel UHD Graphics 620, 14.00"
análise externo » MSI Modern 14 B10RBSW-063XES
Lenovo ThinkPad P15s G1-20T4000NGE: NVIDIA Quadro P520, 15.60"
análise externo » Lenovo ThinkPad P15s G1-20T4000NGE
MSI Modern 14 A10RAS-870XES: NVIDIA GeForce MX330, 14.00", 1.2 kg
análise externo » MSI Modern 14 A10RAS-870XES
HP EliteBook 850 G7, i7-10510U MX250: NVIDIA GeForce MX250, 15.60", 1.7 kg
análise externo » HP EliteBook 850 G7, i7-10510U MX250
HP Envy x360 15-ed0900ng: NVIDIA GeForce MX330, 15.60", 1.9 kg
análise externo » HP Envy x360 15-ed0900ng
Lenovo Yoga Duet 7 13IML05, i7-10510U: Intel UHD Graphics 620, 13.00", 0.8 kg
análise externo » Lenovo Yoga Duet 7 13IML05, i7-10510U
Asus VivoBook S14 S433FL-EB181: NVIDIA GeForce MX250, 14.00", 1.4 kg
análise externo » Asus VivoBook S14 S433FL-EB181
HP ZBook Firefly 14 G7, i7-10510U: NVIDIA Quadro P520, 14.00", 1.4 kg
análise externo » HP ZBook Firefly 14 G7, i7-10510U
Lenovo ThinkBook 13s-20RR0003GE: Intel UHD Graphics 620, 13.30", 1.3 kg
análise externo » Lenovo ThinkBook 13s-20RR0003GE
Huawei MateBook 13 2020 MX250 i7: NVIDIA GeForce MX250, 13.00", 1.3 kg
análise externo » Huawei MateBook 13 2020 MX250 i7
HP Envy 13-ba0004ns: NVIDIA GeForce MX350, 13.30", 1.3 kg
análise externo » HP Envy 13-ba0004ns
Lenovo ThinkPad L13 Yoga 20R5000SUK: Intel UHD Graphics 620, 13.30", 1.4 kg
análise externo » Lenovo ThinkPad L13 Yoga 20R5000SUK
Lenovo ThinkPad L13 20R3000GGE: Intel UHD Graphics 620, 13.30", 1.4 kg
análise externo » Lenovo ThinkPad L13 20R3000GGE
Lenovo Ideapad C340-14IMLI7: Intel UHD Graphics 620, 14.00", 1.7 kg
análise externo » Lenovo Ideapad C340-14IMLI7
Acer TravelMate P6 TMP614-51TG-G2: NVIDIA GeForce MX250, 14.00", 1.2 kg
análise externo » Acer TravelMate P6 TMP614-51TG-G2
Asus ExpertBook P2451FA, i7-10510U: Intel UHD Graphics 620, 14.00", 1.6 kg
análise externo » Asus ExpertBook P2451FA, i7-10510U
MSI Modern 14 A10RAS-1049XES: NVIDIA GeForce MX330, 14.00", 1.2 kg
análise externo » MSI Modern 14 A10RAS-1049XES
Asus VivoBook S15 S533FL-BQ024T: NVIDIA GeForce MX250, 15.60", 1.8 kg
análise externo » Asus VivoBook S15 S533FL-BQ024T
Lenovo ThinkPad X1 Yoga 2020-20UCS03S00: Intel UHD Graphics 620, 14.00", 1.3 kg
análise externo » Lenovo ThinkPad X1 Yoga 2020-20UCS03S00
Lenovo Ideapad C340-15IML-81TL002EMH: NVIDIA GeForce MX230, 15.60", 2 kg
análise externo » Lenovo Ideapad C340-15IML-81TL002EMH
Acer Aspire 5 A515-54-74MM: Intel UHD Graphics 620, 15.60", 1.8 kg
análise externo » Acer Aspire 5 A515-54-74MM
Asus VivoBook S14 S433FA-EB491: Intel UHD Graphics 620, 14.00", 1.5 kg
análise externo » Asus VivoBook S14 S433FA-EB491
Asus VivoBook S15 S533FA-BQ017T: Intel UHD Graphics 620, 15.60", 1.8 kg
análise externo » Asus VivoBook S15 S533FA-BQ017T
Fujitsu LifeBook U7410, i7-10510U: Intel UHD Graphics 620, 14.00", 1.5 kg
análise externo » Fujitsu LifeBook U7410, i7-10510U
Asus ZenBook 13 UX334FLC-A3167T: NVIDIA GeForce MX250, 13.30", 1.2 kg
análise externo » Asus ZenBook 13 UX334FLC-A3167T
Huawei MateBook 14 KLVC-WFE9L: NVIDIA GeForce MX350, 14.00", 1.5 kg
análise externo » Huawei MateBook 14 KLVC-WFE9L
Acer TravelMate P2 TMP215-52G-NX.VLUEX.005: NVIDIA GeForce MX230, 15.60", 1.8 kg
análise externo » Acer TravelMate P2 TMP215-52G-NX.VLUEX.005
Samsung Galaxy Book Ion 15 NP950XCJ-K01DE: Intel UHD Graphics 620, 15.60", 1.3 kg
análise externo » Samsung Galaxy Book Ion 15 NP950XCJ-K01DE
MSI Modern 14 A10RAS-871XES: NVIDIA GeForce MX330, 14.00"
análise externo » MSI Modern 14 A10RAS-871XES
HP Envy 13-ba0005ns: NVIDIA GeForce MX350, 13.30", 1.3 kg
análise externo » HP Envy 13-ba0005ns
MSI Modern 15 A10RB: NVIDIA GeForce MX250, 15.60", 1.6 kg
análise externo » MSI Modern 15 A10RB
Acer Aspire 5 A514-52G-7045: NVIDIA GeForce MX250, 14.00", 1.6 kg
análise externo » Acer Aspire 5 A514-52G-7045
Lenovo IdeaPad 3 17IML05-81WC0048GE: NVIDIA GeForce MX330, 17.30", 2.2 kg
análise externo » Lenovo IdeaPad 3 17IML05-81WC0048GE
Xiaomi Mi NoteBook 14 Horizon Edition: NVIDIA GeForce MX350, 14.00", 1.4 kg
análise externo » Xiaomi Mi NoteBook 14 Horizon, i7-10510U
Asus VivoBook S14 S433FA-EB123T: Intel UHD Graphics 620, 14.00", 1.5 kg
análise externo » Asus VivoBook S14 S433FA-EB123T
Asus ZenBook Duo UX481FL: NVIDIA GeForce MX250, 14.00", 1.8 kg
análise externo » Asus ZenBook Duo UX481FL
Dell Vostro 15 3590, i7-10510U: Intel UHD Graphics 620, 15.60", 2 kg
análise externo » Dell Vostro 15 3590, i7-10510U
Lenovo IdeaPad S540-15IML-81NG00A3GE: NVIDIA GeForce MX250, 15.60", 2 kg
análise externo » Lenovo IdeaPad S540-15IML-81NG00A3GE
Lenovo ThinkPad E14 20RA001BGE: Intel UHD Graphics 620, 14.00", 1.8 kg
análise externo » Lenovo ThinkPad E14 20RA001BGE
Huawei MateBook 13 2020: Intel UHD Graphics 620, 13.00", 1.3 kg
análise externo » Huawei MateBook 13 2020
Huawei MateBook X Pro 2020 i7: NVIDIA GeForce MX250, 13.90", 1.3 kg
análise externo » Huawei MateBook X Pro 2020 i7
LG Gram 14T90N-R.AAS8U1: Intel UHD Graphics 620, 14.00", 1.2 kg
análise externo » LG Gram 14T90N-R.AAS8U1
Dell Inspiron 14 7490-D0R43: NVIDIA GeForce MX250, 14.00", 1.3 kg
análise externo » Dell Inspiron 14 7490-D0R43
Asus ZenBook 14 UX434FAC-A5188T: Intel UHD Graphics 620, 14.00", 1.2 kg
análise externo » Asus ZenBook 14 UX434FAC-A5188T
Asus VivoBook S14 S433FL: NVIDIA GeForce MX250, 14.00", 1.4 kg
análise externo » Asus VivoBook S14 S433FL-EB029T
Lenovo Yoga C740-15IML-81TD002MMH: Intel UHD Graphics 620, 15.60", 1.9 kg
análise externo » Lenovo Yoga C740-15IML-81TD002MMH
Acer Aspire 5 A514-52-713B: Intel UHD Graphics 620, 14.00", 1.5 kg
análise externo » Acer Aspire 5 A514-52-713B
MSI Modern 15 A10M-028: Intel UHD Graphics 620, 15.60", 1.6 kg
análise externo » MSI Modern 15 A10M-028
Asus ZenBook Flip 14 UX463FL-AI025R: Intel UHD Graphics 620, 14.00", 1.4 kg
análise externo » Asus ZenBook Flip 14 UX463FL-AI025R
Lenovo Yoga C740-15IML: Intel UHD Graphics 620, 15.60", 1.9 kg
análise externo » Lenovo Yoga C740-15IML
HP Pavilion x360 14-dh1000ns: Intel UHD Graphics 620, 14.00", 1.6 kg
análise externo » HP Pavilion x360 14-dh1000ns
Asus ZenBook Flip 15 UX563FD-A1027T: NVIDIA GeForce GTX 1050 Max-Q, 15.60", 1.9 kg
análise externo » Asus ZenBook Flip 15 UX563FD-A1027T
Lenovo ThinkBook 14-20RV0000MX: Intel UHD Graphics 620, 14.00", 1.5 kg
análise externo » Lenovo ThinkBook 14-20RV0000MX
MSI Prestige 14 A10RC: NVIDIA GeForce MX330, 14.00", 1.3 kg
análise externo » MSI Prestige 14 A10RC
Lenovo ThinkBook Plus 13 i7: Intel UHD Graphics 620, 13.30", 1.4 kg
análise externo » Lenovo ThinkBook Plus 13 i7
Asus ExpertBook B9450FA, i7-10510U: Intel UHD Graphics 620, 14.00", 1 kg
análise externo » Asus ExpertBook B9450FA, i7-10510U
Dell Inspiron 13 7391 2-in-1, i5-10510U: Intel UHD Graphics 620, 13.30", 1.4 kg
análise externo » Dell Inspiron 13 7391 2-in-1, i5-10510U
Dell Inspiron 14 5490-6C55V: Intel UHD Graphics 620, 14.00", 1.5 kg
análise externo » Dell Inspiron 14 5490-6C55V
Asus VivoBook S15 S532FL-BN184T: NVIDIA GeForce MX250, 15.60", 1.8 kg
análise externo » Asus VivoBook S15 S532FL-BN184T
HP Envy x360 15-dr1038no: Intel UHD Graphics 620, 15.60", 2.1 kg
análise externo » HP Envy x360 15-dr1038no
Acer TravelMate P6 TP614-51-G2: Intel UHD Graphics 620, 14.00", 1.2 kg
análise externo » Acer TravelMate P6 TP614-51-G2
Acer Aspire 5 A515-54-735N: Intel UHD Graphics 620, 15.60", 1.8 kg
análise externo » Acer Aspire 5 A515-54-735N
Asus ZenBook 14 UX434FLC-A5131R: NVIDIA GeForce MX250, 14.00", 1.3 kg
análise externo » Asus ZenBook 14 UX434FLC-A5131R
Asus ZenBook 14 UX431FL-AM049T: NVIDIA GeForce MX250, 14.00", 1.4 kg
análise externo » Asus ZenBook 14 UX431FL-AM049T
MSI Modern 14 A10RB-663XES: NVIDIA GeForce MX250, 14.00", 1.2 kg
análise externo » MSI Modern 14 A10RB-663XES
MSI Modern 14 A10RB-665XES: NVIDIA GeForce MX250, 14.00", 1.2 kg
análise externo » MSI Modern 14 A10RB-665XES
Dell XPS 13 7390 Core i7-10510U: Intel UHD Graphics 620, 13.30", 1.2 kg
análise externo » Dell XPS 13 7390 Core i7-10510U
Lenovo ThinkBook 14-IML-20RV005WGE: Intel UHD Graphics 620, 14.00", 1.5 kg
análise externo » Lenovo ThinkBook 14-IML-20RV005WGE
Asus Zenbook Pro Duo UX481FL-BM044T: NVIDIA GeForce MX250, 14.00", 1.5 kg
análise externo » Asus Zenbook Pro Duo UX481FL-BM044T
Asus ZenBook Duo UX481FL-BM039R: NVIDIA GeForce MX250, 14.00", 1.5 kg
análise externo » Asus ZenBook Duo UX481FL-BM039R
Dell Vostro 14 5490: NVIDIA GeForce MX250, 14.00", 1.5 kg
análise externo » Dell Vostro 14 5490, i7-10510U, MX250
Asus ZenBook 15 UX534FTC-A8078R: NVIDIA GeForce GTX 1650 Max-Q, 15.60", 1.7 kg
análise externo » Asus ZenBook 15 UX534FTC-A8078R
HP Spectre x360 15-df1005ng: Intel UHD Graphics 620, 15.60", 2.1 kg
análise externo » HP Spectre x360 15-df1005ng
Acer Aspire 3 A317-51G-7604: NVIDIA GeForce MX250, 17.30", 2.7 kg
análise externo » Acer Aspire 3 A317-51G-7604
Lenovo Yoga C640-13IML-81UE0010GE: Intel UHD Graphics 620, 13.30", 1.4 kg
análise externo » Lenovo Yoga C640-13IML-81UE0010GE
Huawei MateBook 14 2020 Intel: NVIDIA GeForce MX350, 14.00", 1.5 kg
» El anticuado CPU Comet Lake en el MateBook 14 de Huawei sólo es convincente cuando se trata de la vida de la batería
» El anticuado CPU Comet Lake en el MateBook 14 de Huawei sólo es convincente cuando se trata de la vida de la batería
Acer TravelMate P215-52: Intel UHD Graphics 620, 15.60", 1.8 kg
» Humillantemente para Intel, un Core i7-10510U de bajo rendimiento funciona más lento que el Core i5-8250U de dos años.
HP ProBook 450 G7 8WC04UT: NVIDIA GeForce MX250, 15.60", 1.9 kg
» AMD avergüenza a Intel con el Ryzen 7 HP ProBook 455 G7 corriendo 150 por ciento más rápido que el más caro Core i7 ProBook 450 G7
Lenovo ThinkPad X1 Carbon 2020-20UAS04T00: Intel UHD Graphics 620, 14.00", 1.1 kg
» Lenovo ThinkPad X1 Carbon 2020: Sólo consigue el modelo 2019 y ahorra algo de dinero
Asus VivoBook 17 S712FA-DS76: Intel UHD Graphics 620, 17.30", 2.3 kg
» Cuando rápido significa lento: algunos portátiles Asus VivoBook 17 pueden estar sufriendo un gran problema de rendimiento