Review de la estación de trabajo Dell Precision 5750: El XPS 17 para profesionales
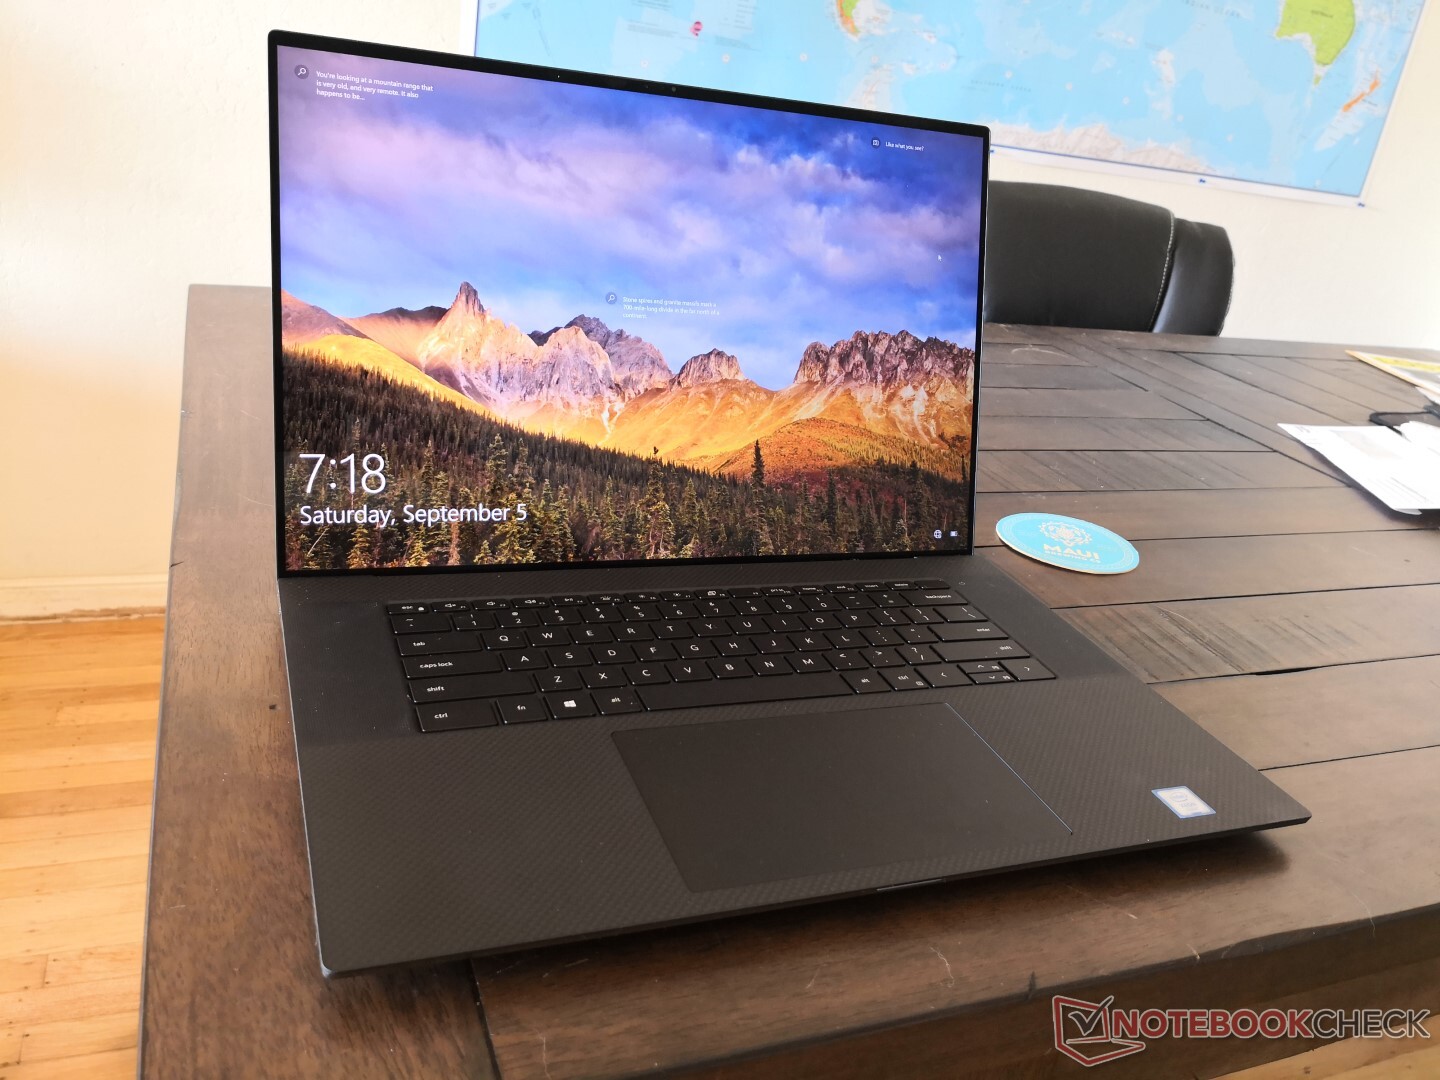
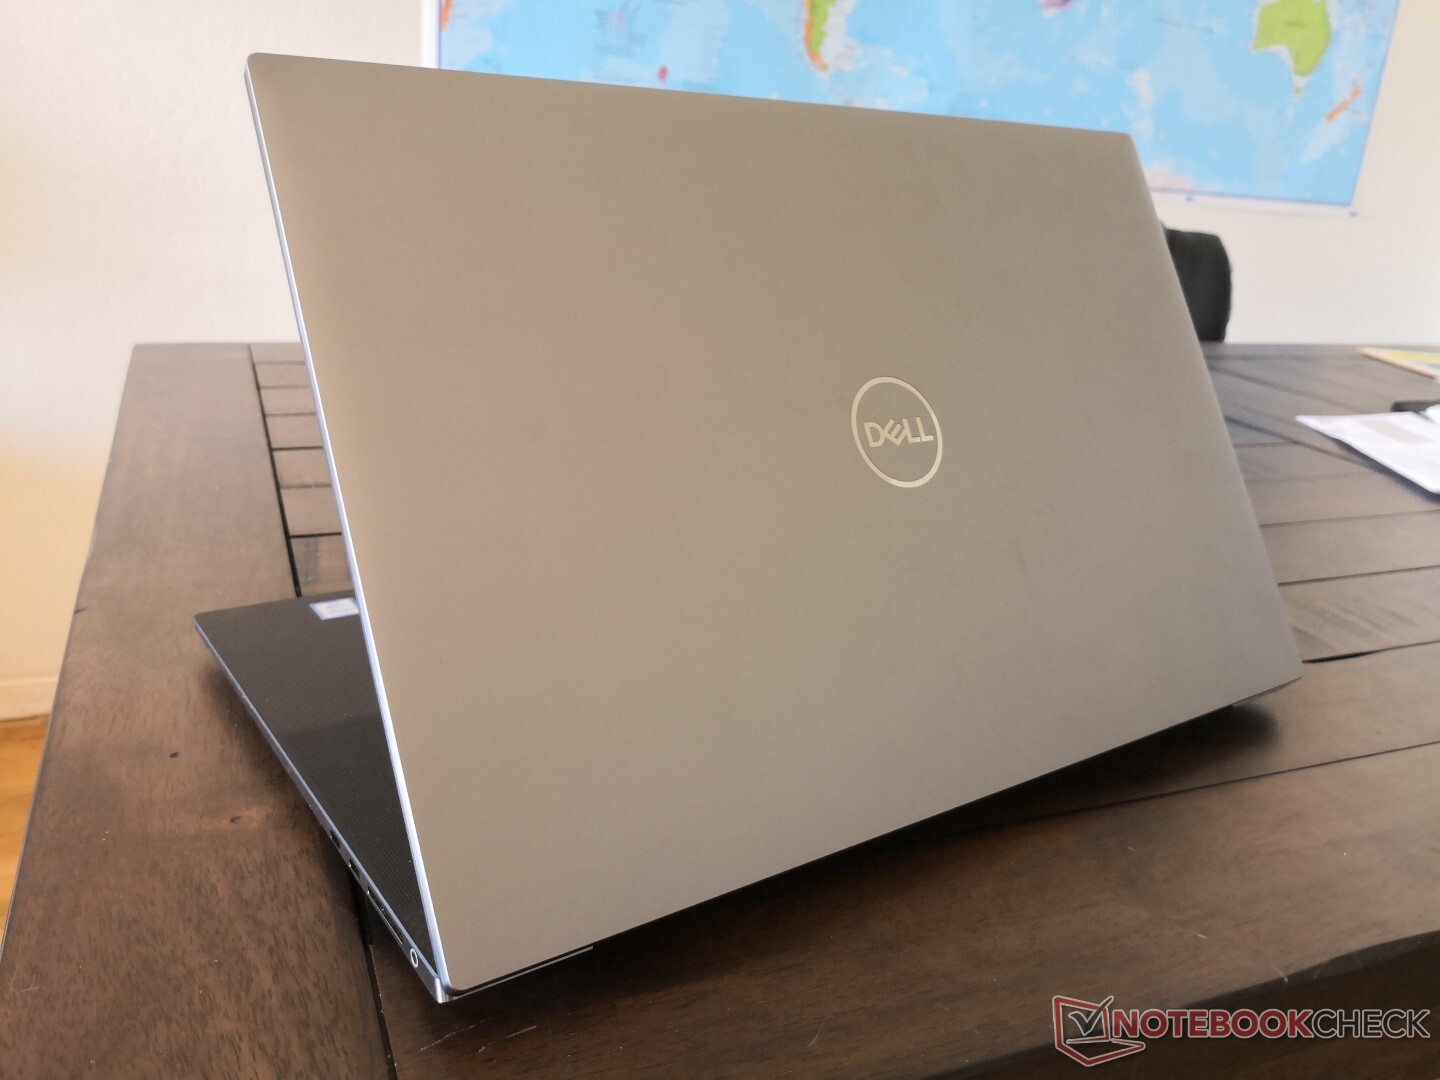
Al igual que la Precision 5550 de 15,6 pulgadas es la versión de estación de trabajo del XPS 15 9500, la Precision 5750 de 17,3 pulgadas es la versión de estación de trabajo del XPS 17 9700. Recomendamos revisar nuestra revisión del XPS 17 ya que todos nuestros comentarios sobre el chasis y sus características físicas también se aplican aquí en el Precision 5750.
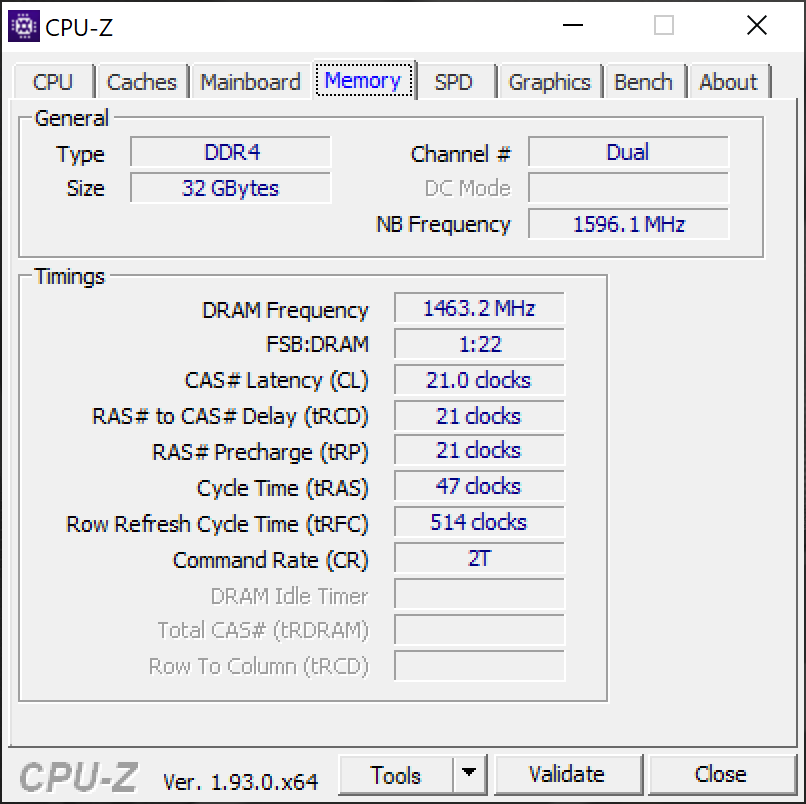
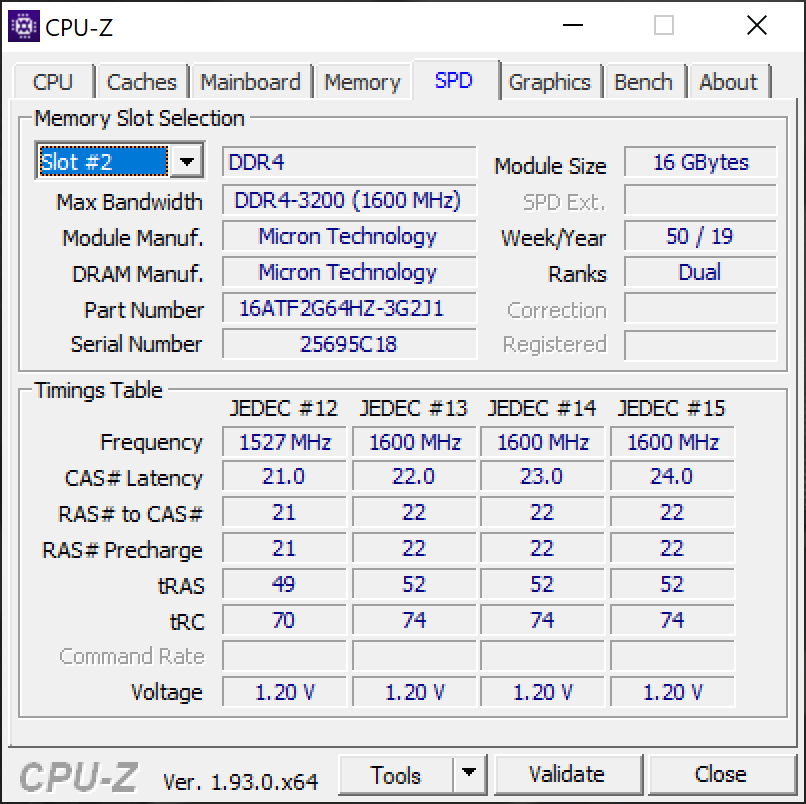
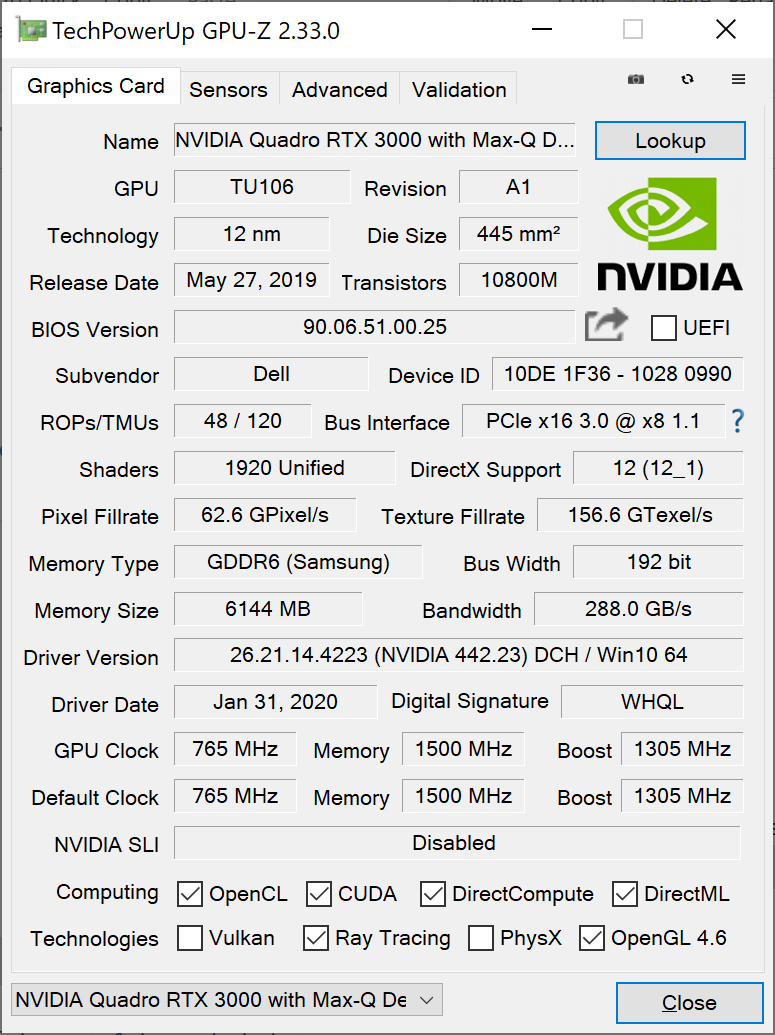
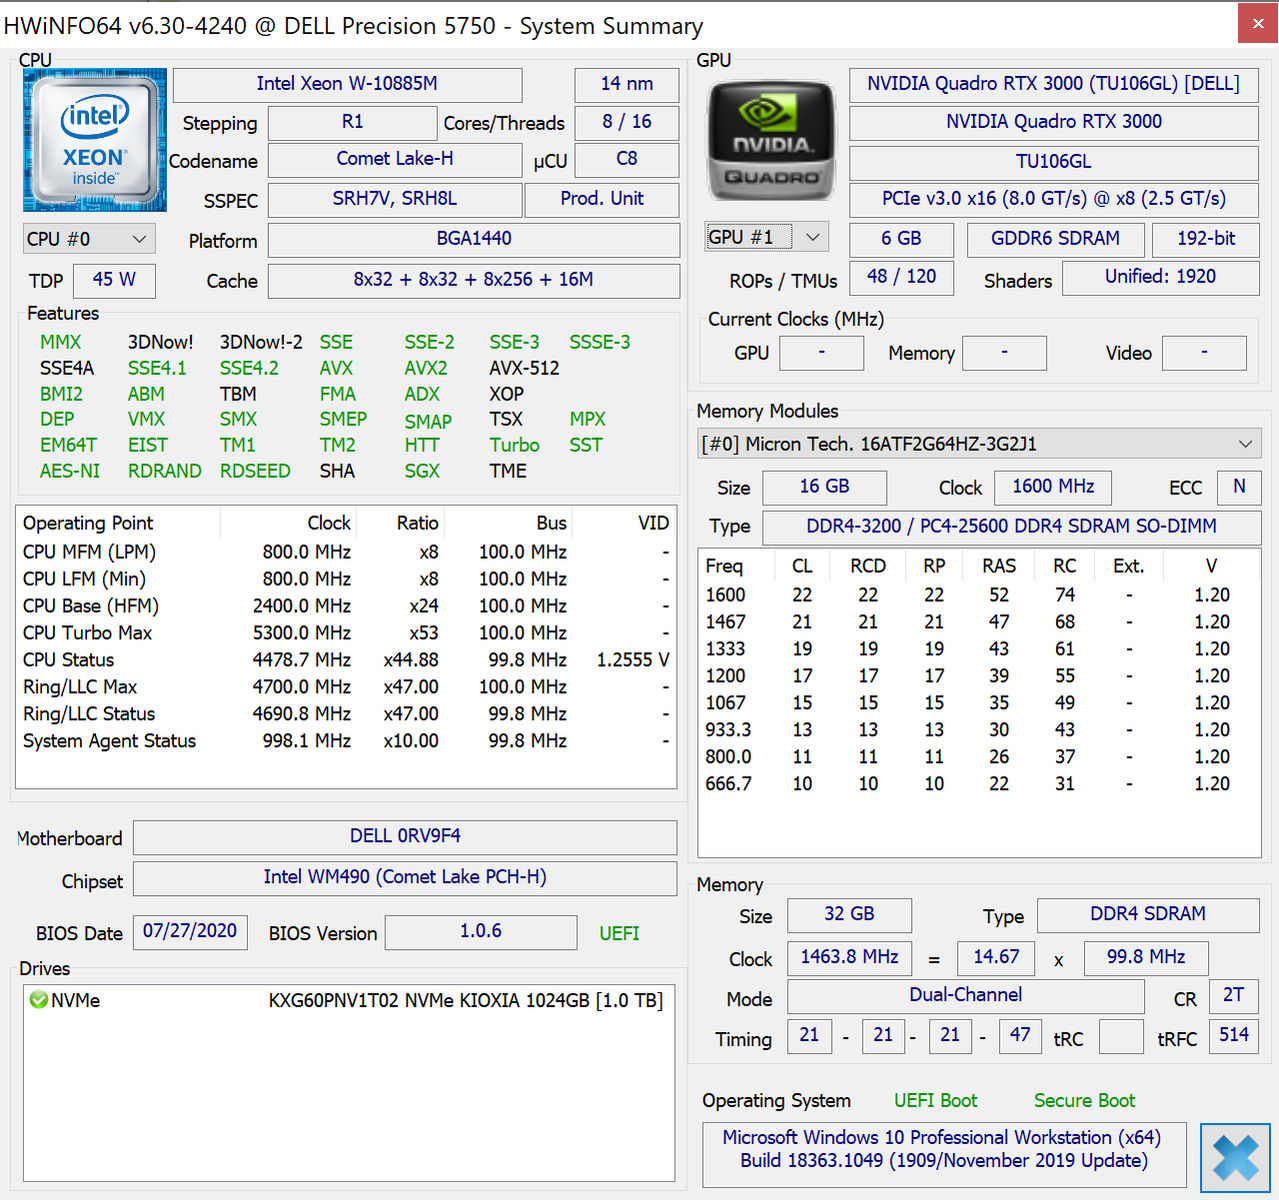
Nuestra unidad es una configuración de gama alta con la CPU Xeon W-10885M, la GPU Quadro RTX 3000 Max-Q, la pantalla táctil brillante de 16:10 2400p y 32 GB de RAM DDR4 por aproximadamente 3800 USD. modelos menores con el Core i5-10400H, UHD Graphics 630 integrado, pantalla mate de 1200p, y 8 GB de RAM también están disponibles por mucho menos.
El Precision 5750 compite con estaciones de trabajo ultrafinas de 17,3 pulgadas como el MSI WS75, Razer Blade Pro Studio, o la serie Asus ProArt StudioBook.
Más reviews de Dell:
Valoración | Fecha | Modelo | Peso | Altura | Tamaño | Resolución | Precio |
|---|---|---|---|---|---|---|---|
| 87 % v7 (old) | 09/2020 | Dell Precision 5000 5750 P92F W-10885M, Quadro RTX 3000 Max-Q | 2.5 kg | 19.5 mm | 17.00" | 3840x2400 | |
| 86.4 % v7 (old) | 03/2020 | Asus ProArt StudioBook Pro 17 W700G3T i7-9750H, Quadro RTX 3000 Max-Q | 2.5 kg | 18.4 mm | 17.00" | 1920x1200 | |
| 83.8 % v7 (old) | 06/2019 | MSI WS75 9TL-636 i7-9750H, Quadro RTX 4000 (Laptop) | 2.3 kg | 18.95 mm | 17.30" | 1920x1080 | |
| 85.7 % v7 (old) | 05/2019 | Dell Precision 7730 i7-8850H, Quadro P3200 | 3.3 kg | 30 mm | 17.30" | 1920x1080 | |
| 86.6 % v7 (old) | 12/2019 | Lenovo ThinkPad P73-20QR002DGE i7-9850H, Quadro RTX 3000 (Laptop) | 3.5 kg | 31 mm | 17.30" | 1920x1080 | |
| 84.8 % v7 (old) | 11/2019 | MSI WE75 9TK i7-9750H, Quadro RTX 3000 (Laptop) | 2.6 kg | 27.5 mm | 17.30" | 1920x1080 |
Carcasa
Conectividad
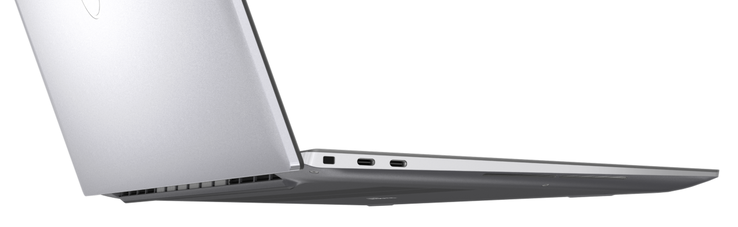
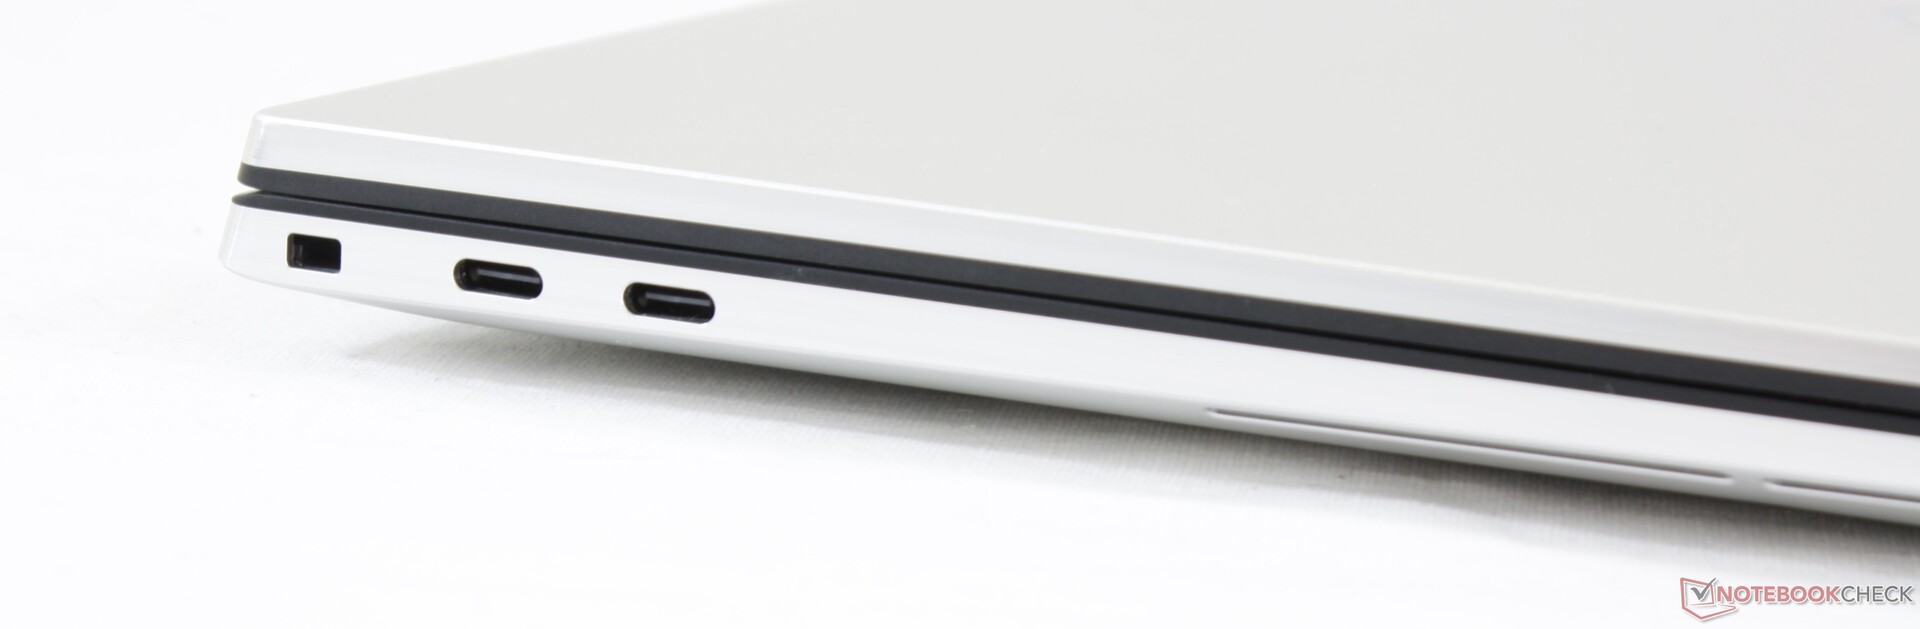
Las opciones de puerto son o bien decepcionantes o bien increíbles, dependiendo de lo que estés buscando. Si te gusta tener 4 Thunderbolt 3 puertos, entonces esta precisión te tiene cubierto. Si quieres HDMI, RJ-45 o USB-A, entonces prepárate para depender de adaptadores o estaciones de acoplamiento. Cualquier otra estación de trabajo de esta categoría de tamaño ofrece una mayor variedad de puertos integrados que la Precision 5750.
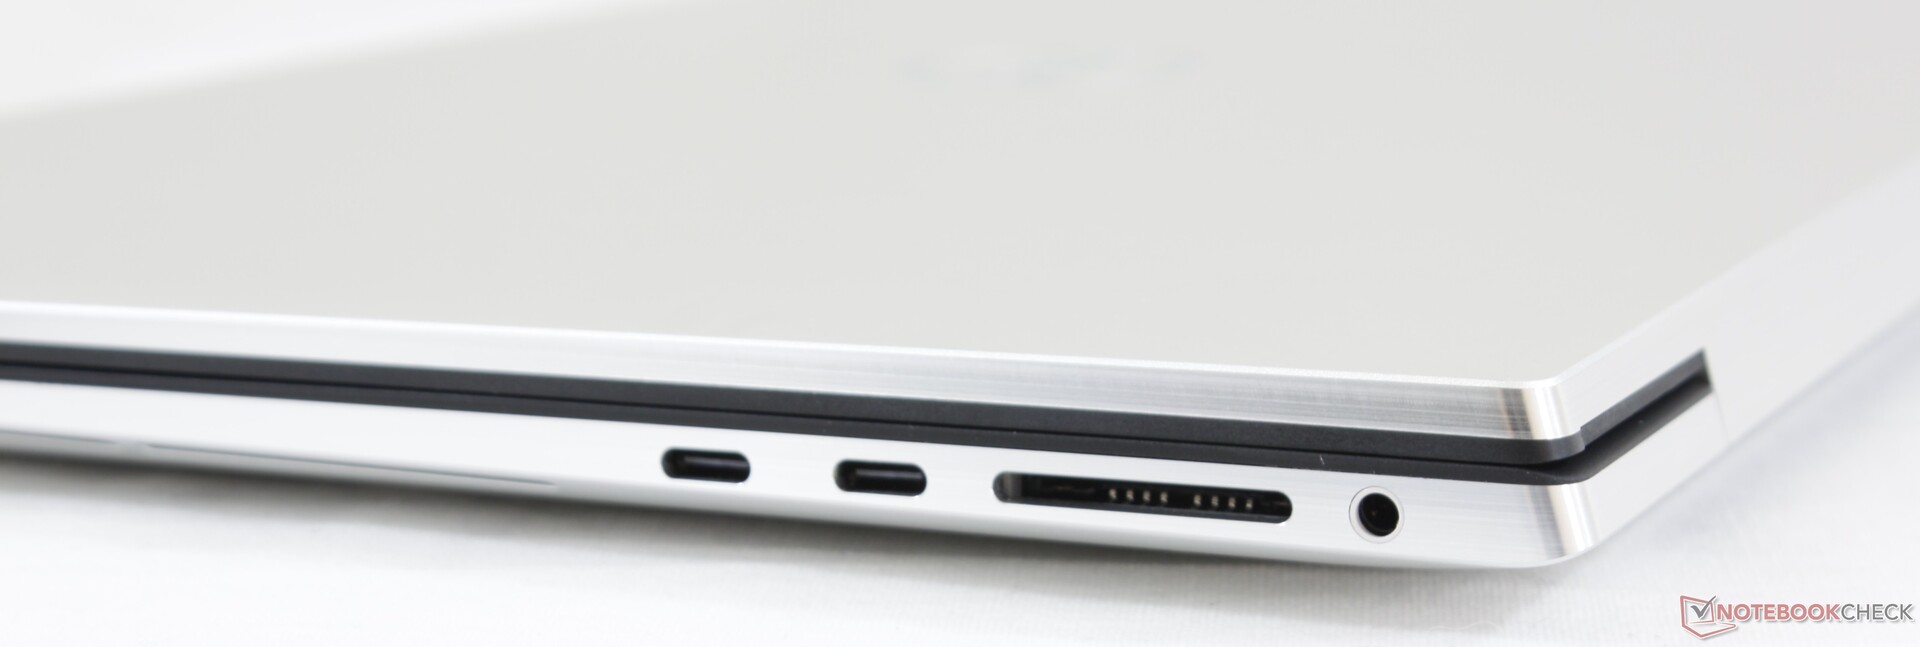
Lector de tarjetas SD
Las tasas de transferencia del lector de tarjetas SD integrado son muy rápidas. Mover 1 GB de imágenes de nuestra tarjeta de prueba UHS-II al escritorio lleva unos 7 segundos.
| SD Card Reader | |
| average JPG Copy Test (av. of 3 runs) | |
| Dell Precision 7730 (Toshiba Exceria Pro SDXC 64 GB UHS-II) | |
| Lenovo ThinkPad P73-20QR002DGE (Toshiba Exceria Pro SDXC 64 GB UHS-II) | |
| Asus ProArt StudioBook Pro 17 W700G3T (Toshiba Exceria Pro SDXC 64 GB UHS-II) | |
| MSI WS75 9TL-636 (Toshiba Exceria Pro M501 64 GB UHS-II) | |
| Dell Precision 5000 5750 P92F (Toshiba Exceria Pro SDXC 64 GB UHS-II) | |
| MSI WE75 9TK (Toshiba Exceria Pro SDXC 64 GB UHS-II) | |
| maximum AS SSD Seq Read Test (1GB) | |
| Asus ProArt StudioBook Pro 17 W700G3T (Toshiba Exceria Pro SDXC 64 GB UHS-II) | |
| Dell Precision 7730 (Toshiba Exceria Pro SDXC 64 GB UHS-II) | |
| MSI WS75 9TL-636 (Toshiba Exceria Pro M501 64 GB UHS-II) | |
| Lenovo ThinkPad P73-20QR002DGE (Toshiba Exceria Pro SDXC 64 GB UHS-II) | |
| Dell Precision 5000 5750 P92F (Toshiba Exceria Pro SDXC 64 GB UHS-II) | |
| MSI WE75 9TK (Toshiba Exceria Pro SDXC 64 GB UHS-II) | |
Comunicación
El Intel AX201 viene de serie para la conectividad Wi-Fi 6. No experimentamos ningún problema al conectarnos a nuestro enrutador de prueba Netgear RAX200.
Webcam


Seguridad
Las mismas características de seguridad disponibles en el Precision 5550 se pueden encontrar aquí en el Precision 5750 incluyendo el sensor de proximidad para el ExpressSign-in de manos libres. Todavía no hay ningún obturador de cámara web, lo que creemos que fue un descuido de Dell durante la fase de diseño del chasis del XPS 17/Precision 5750.
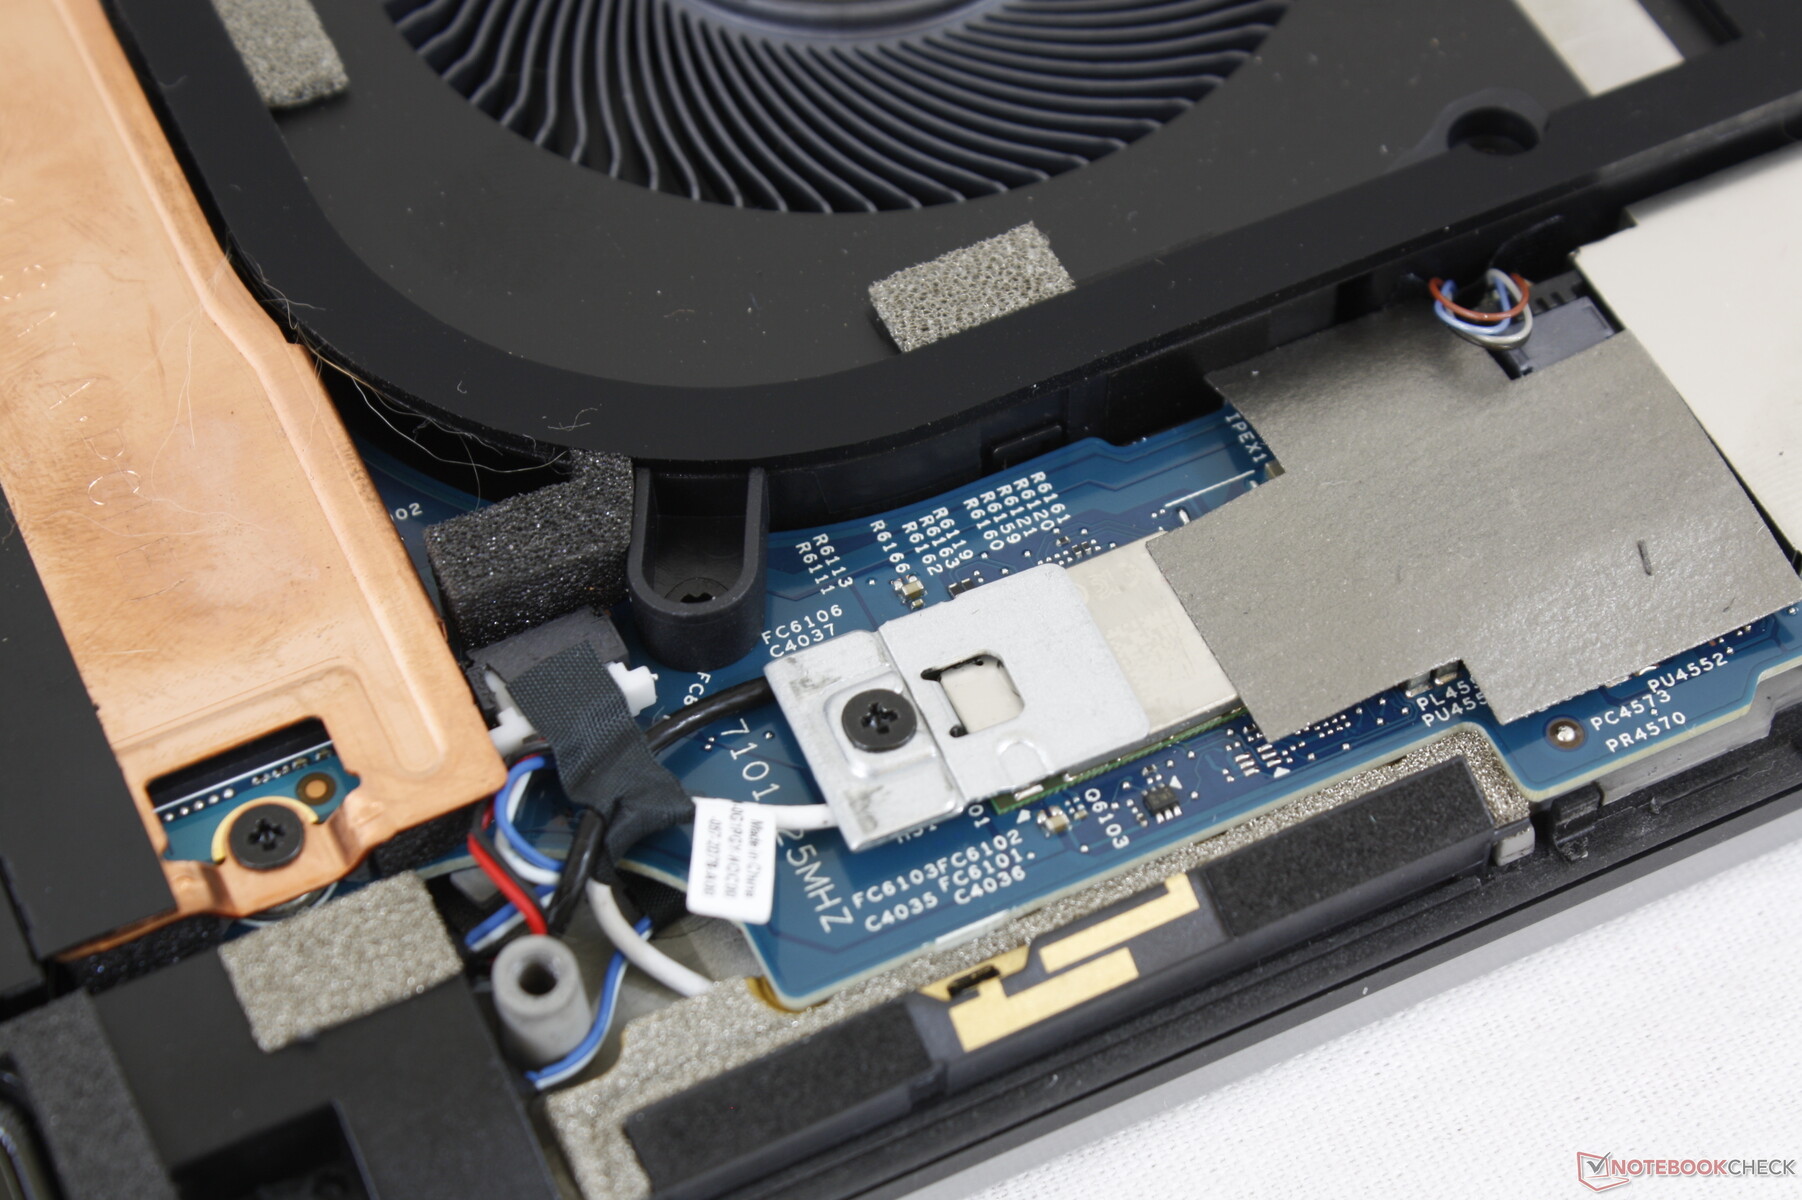
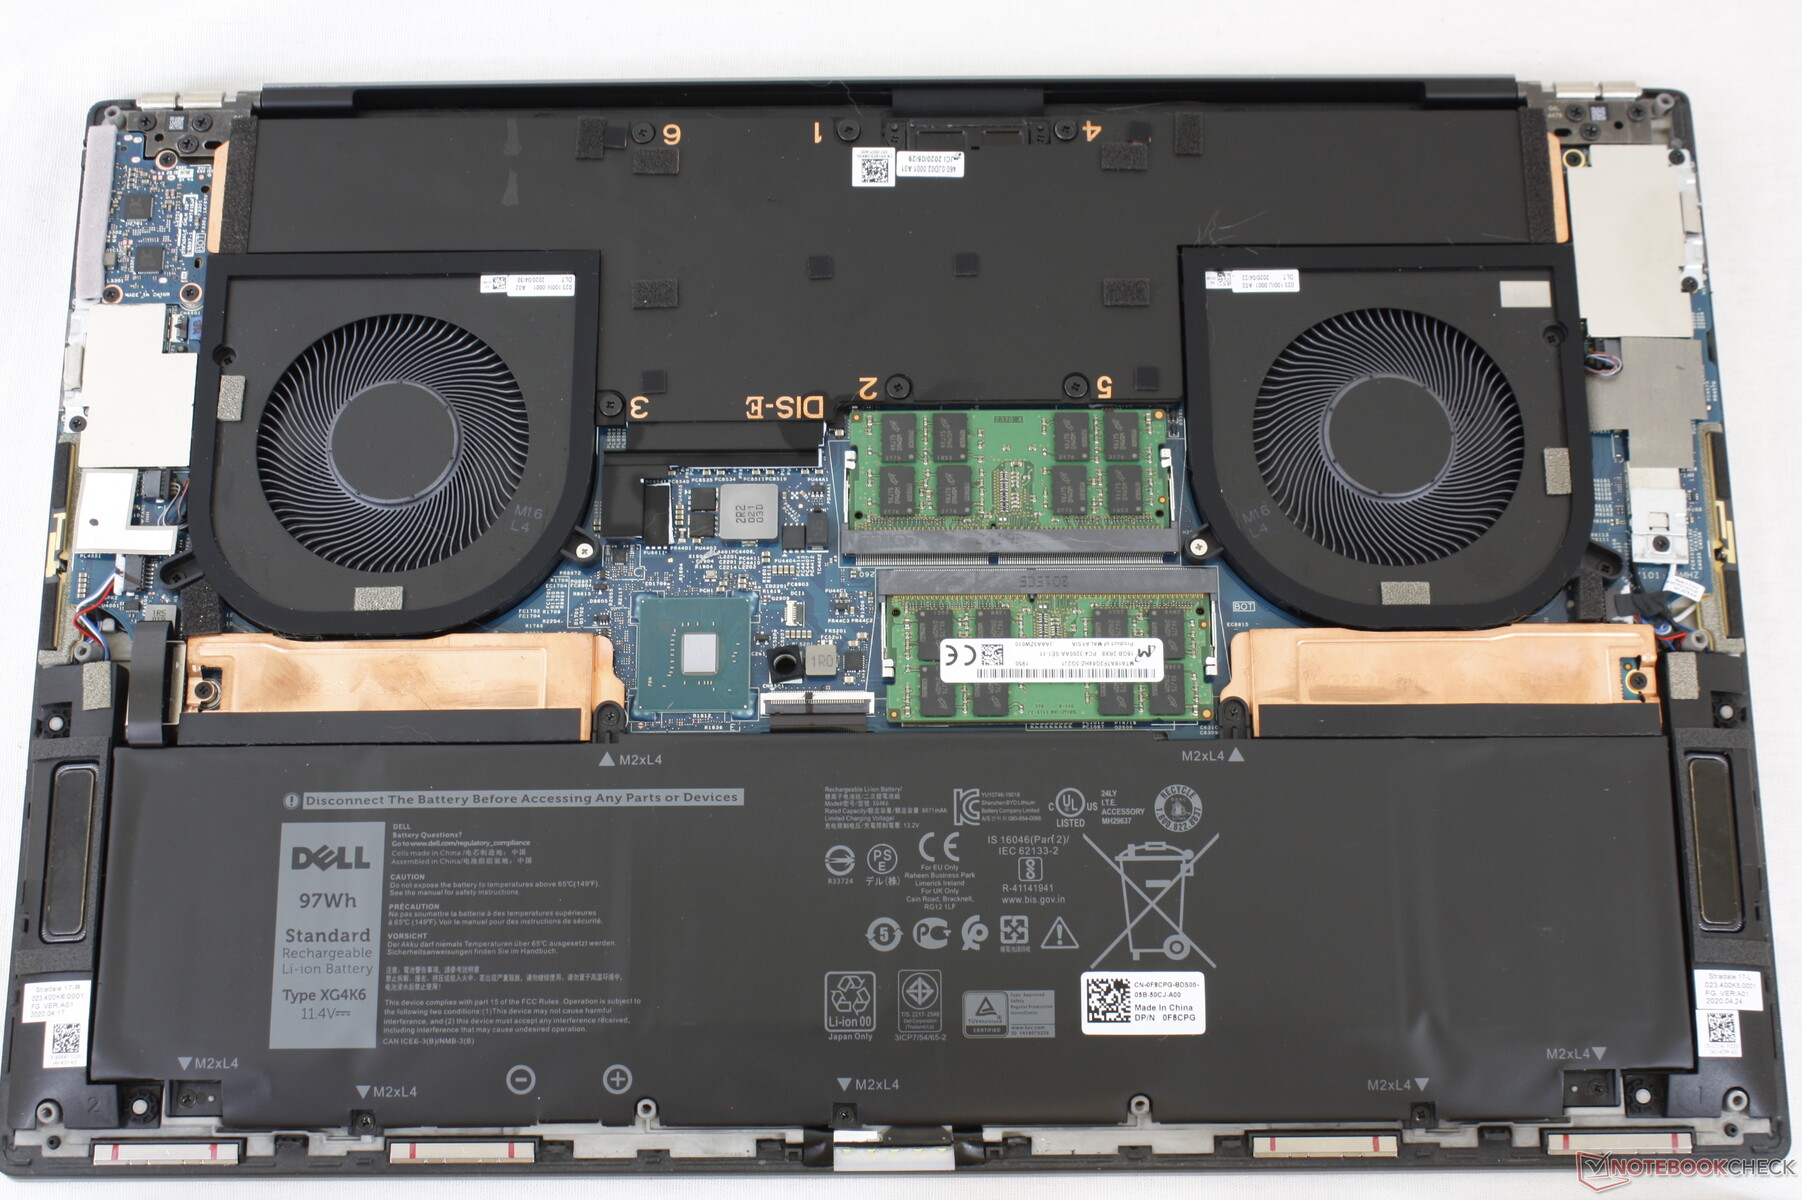
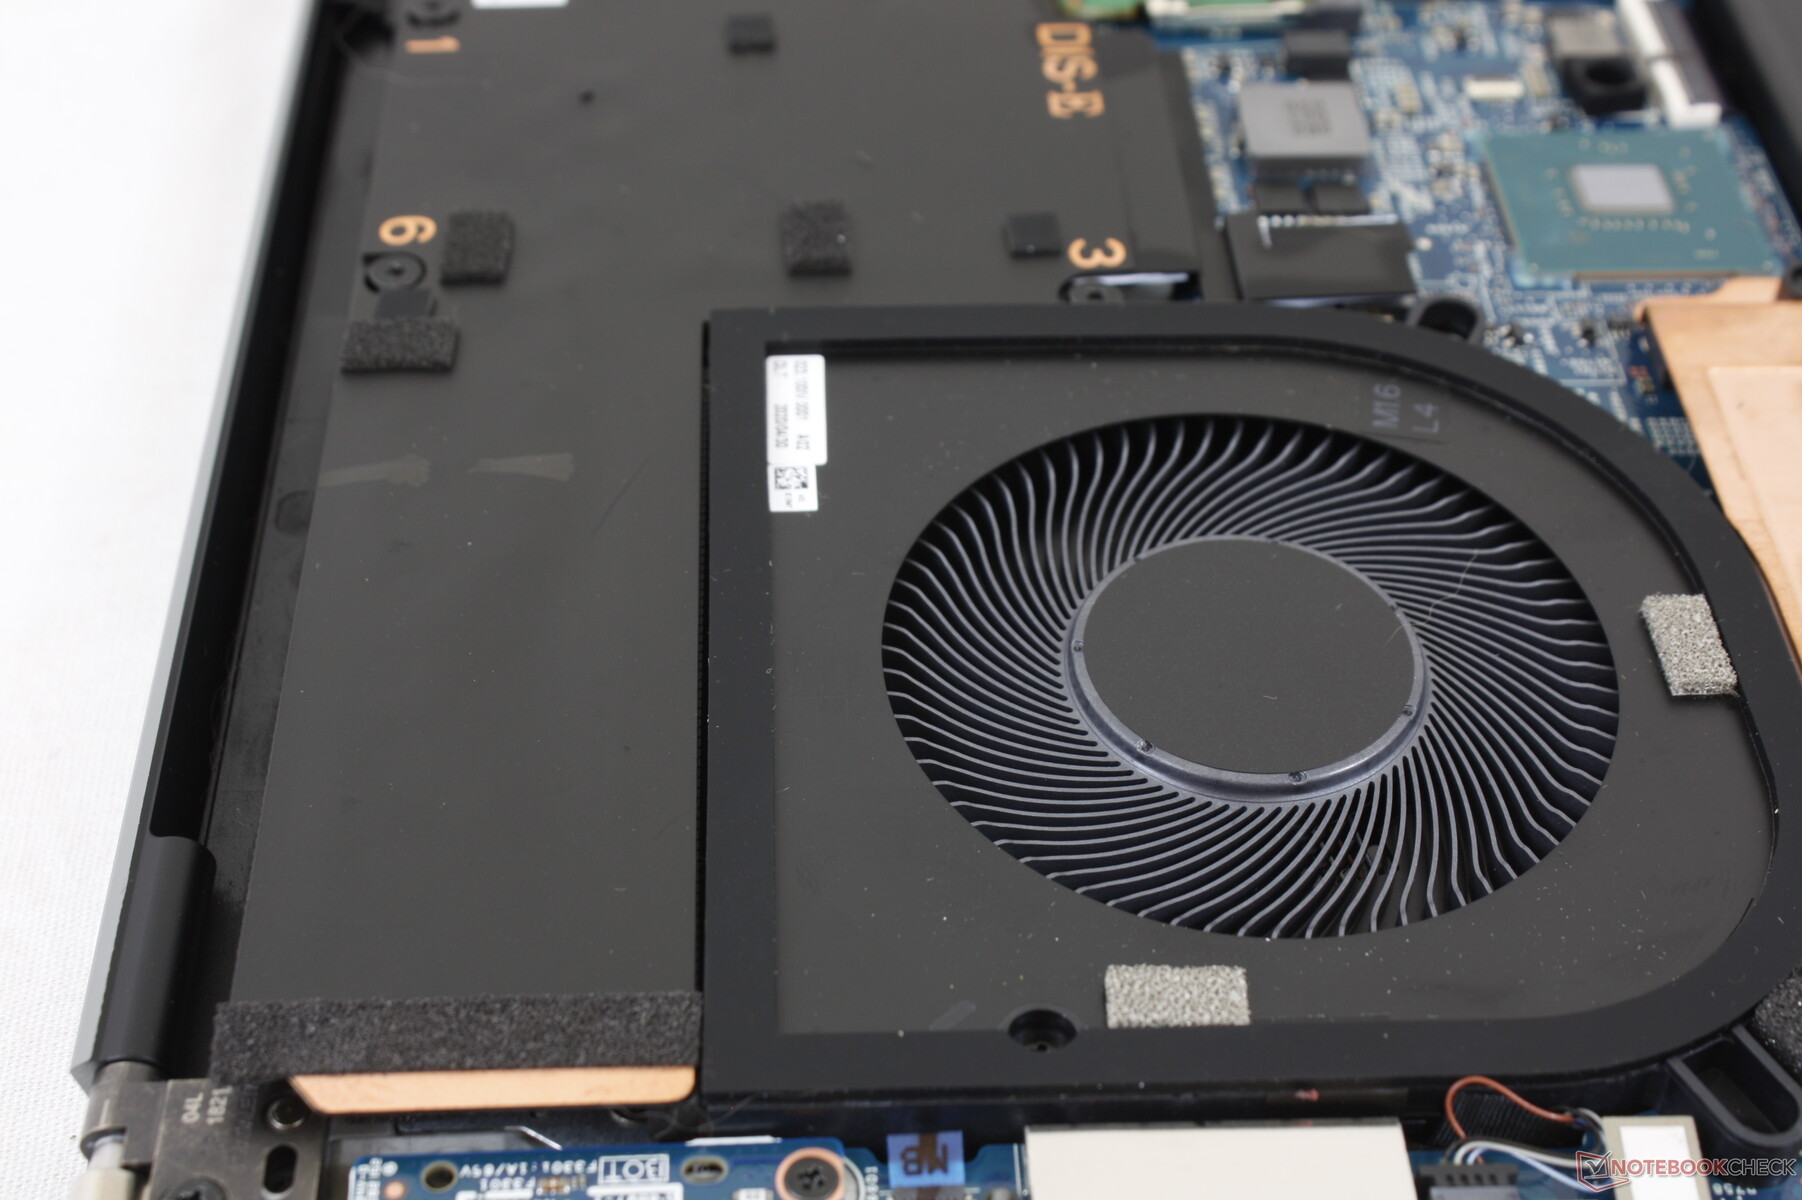
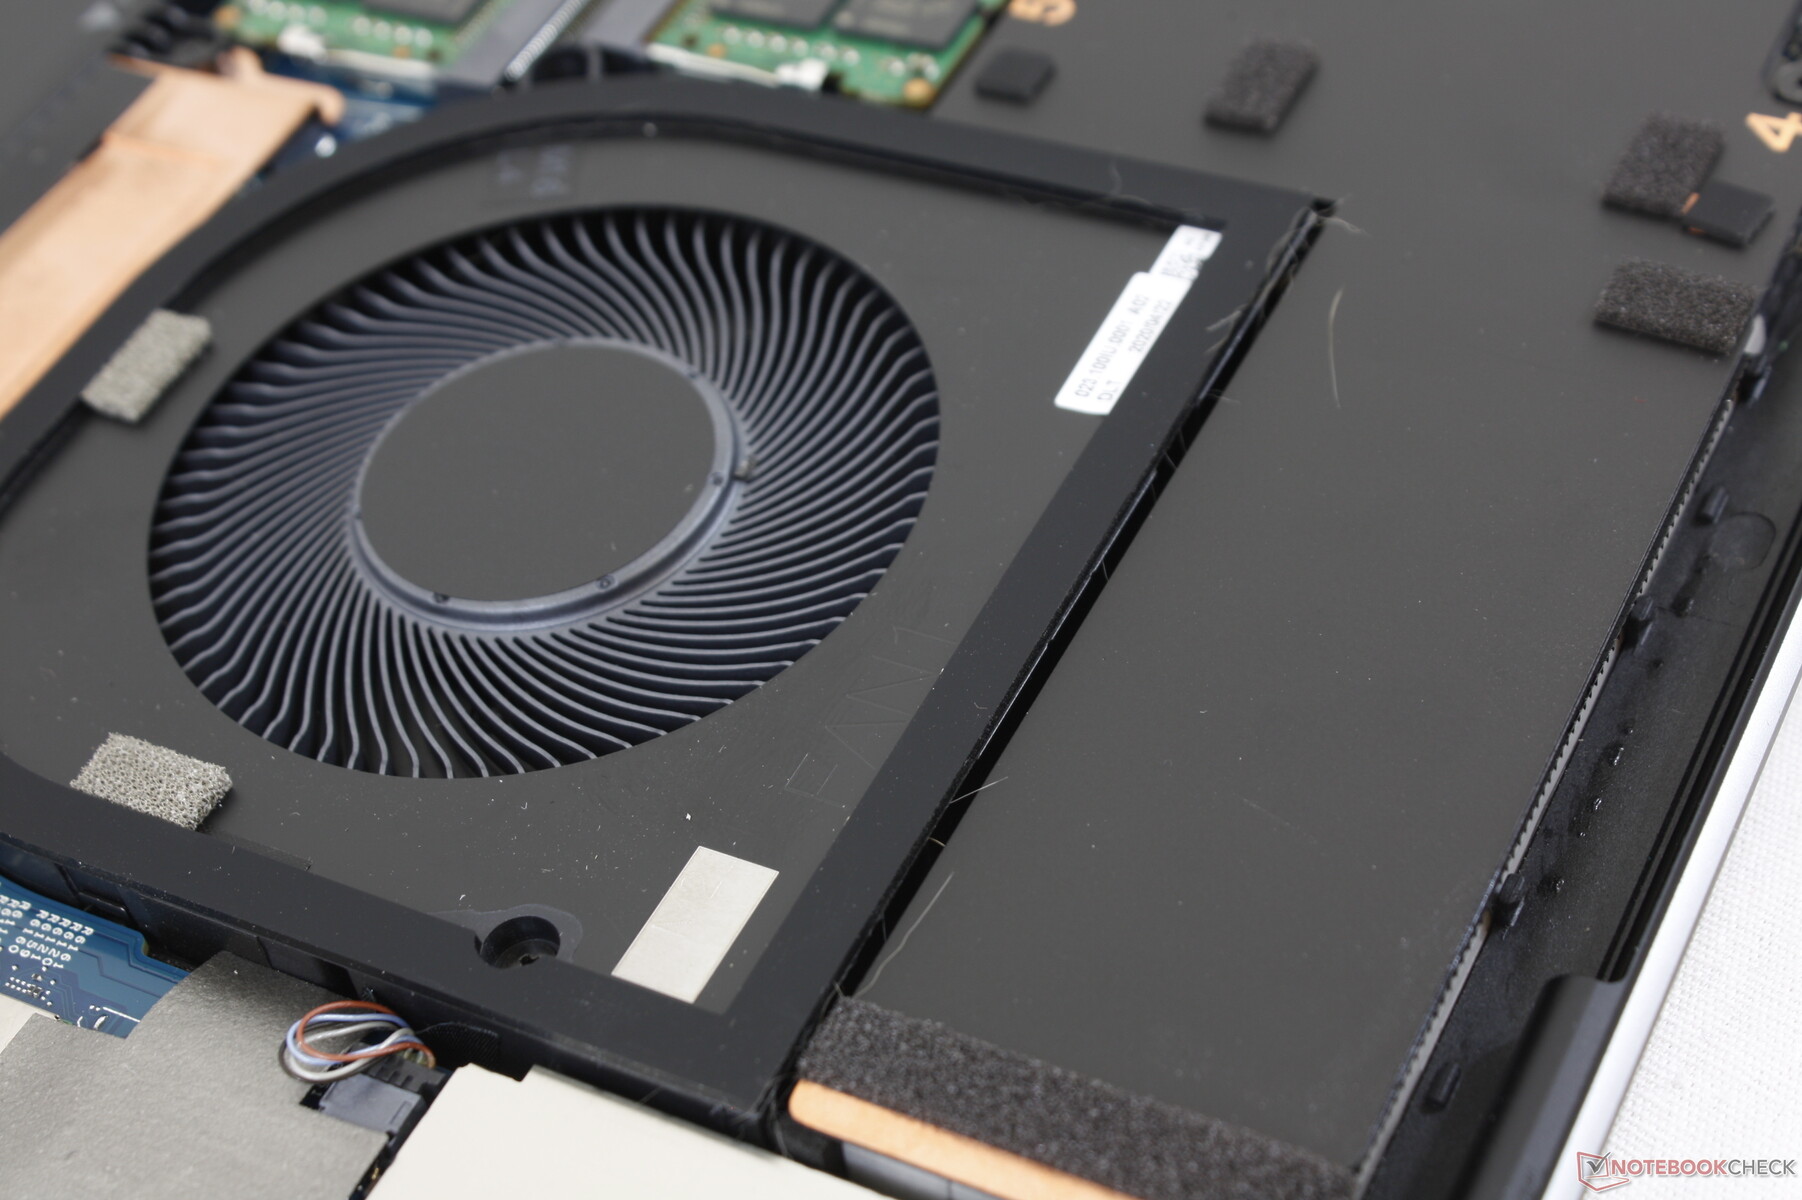
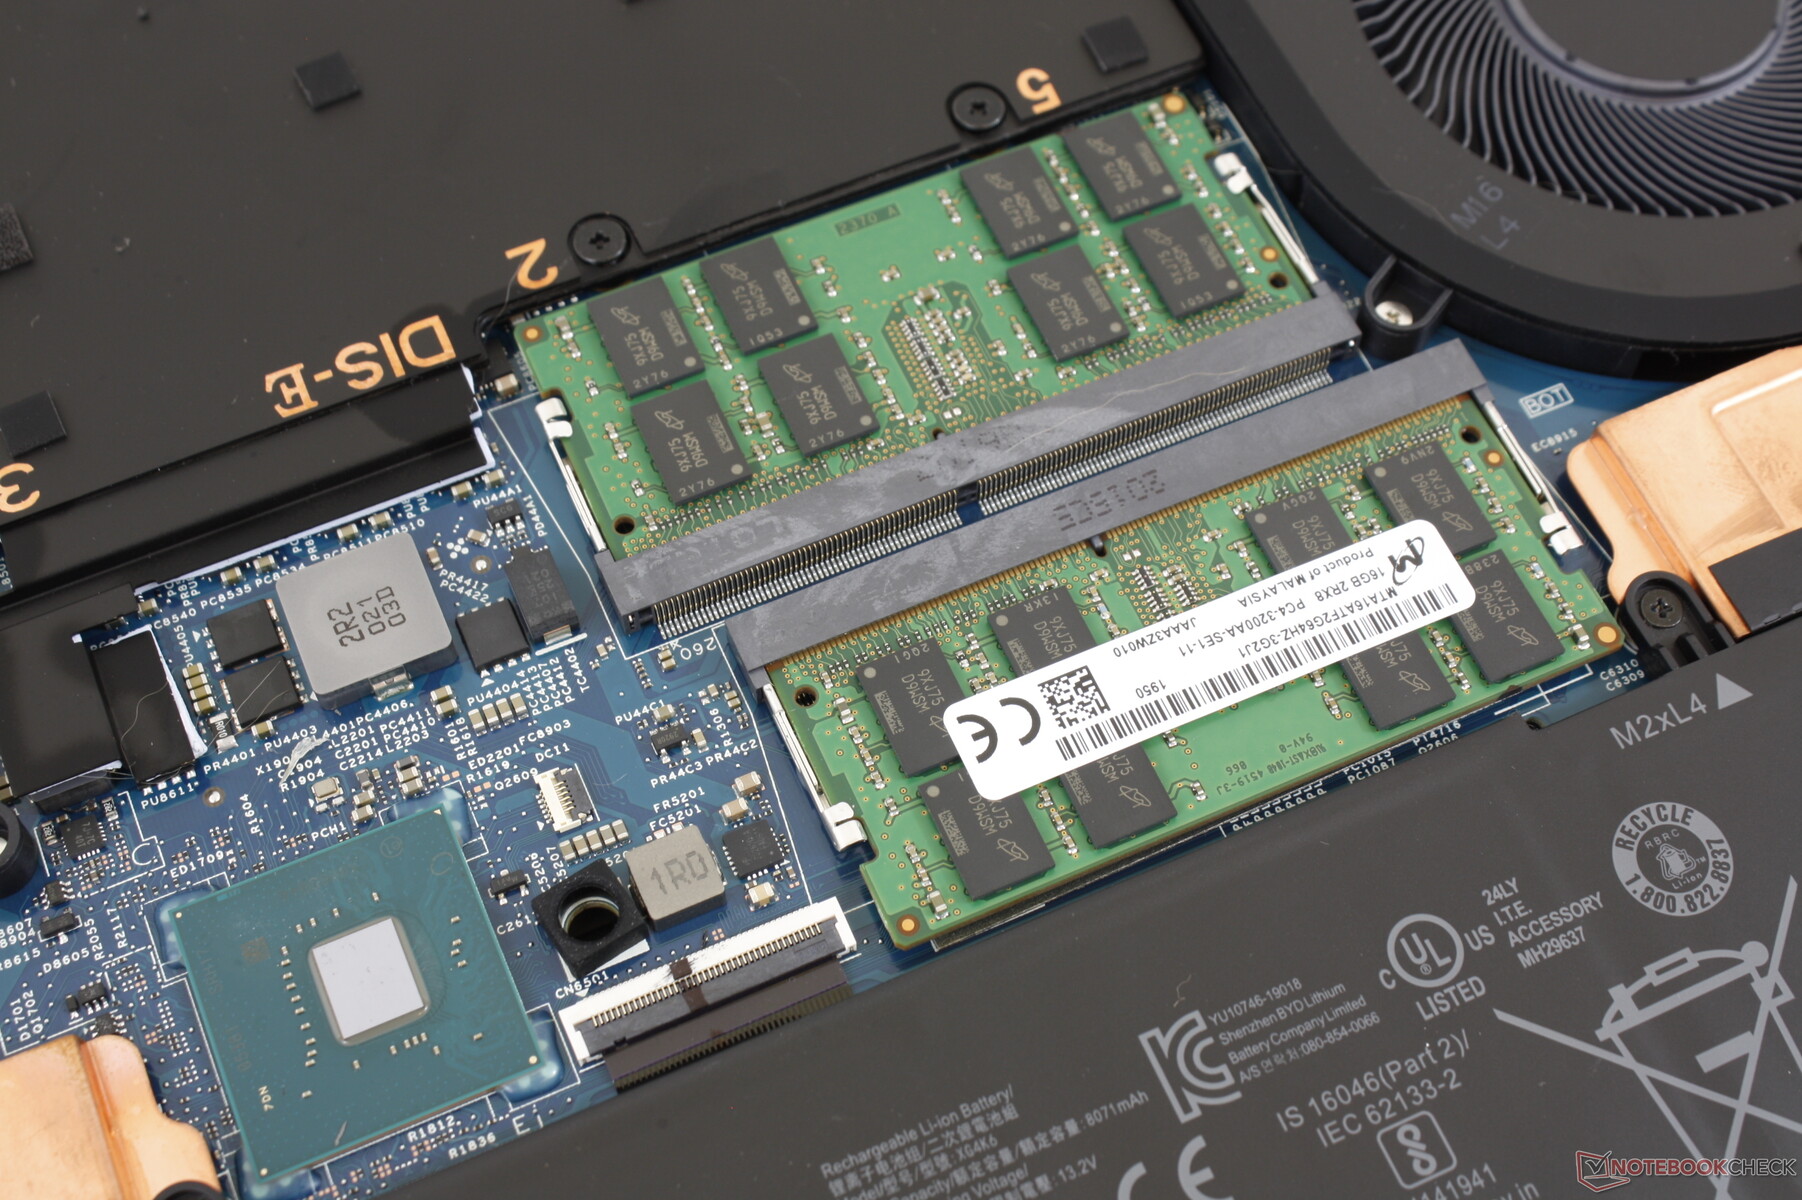
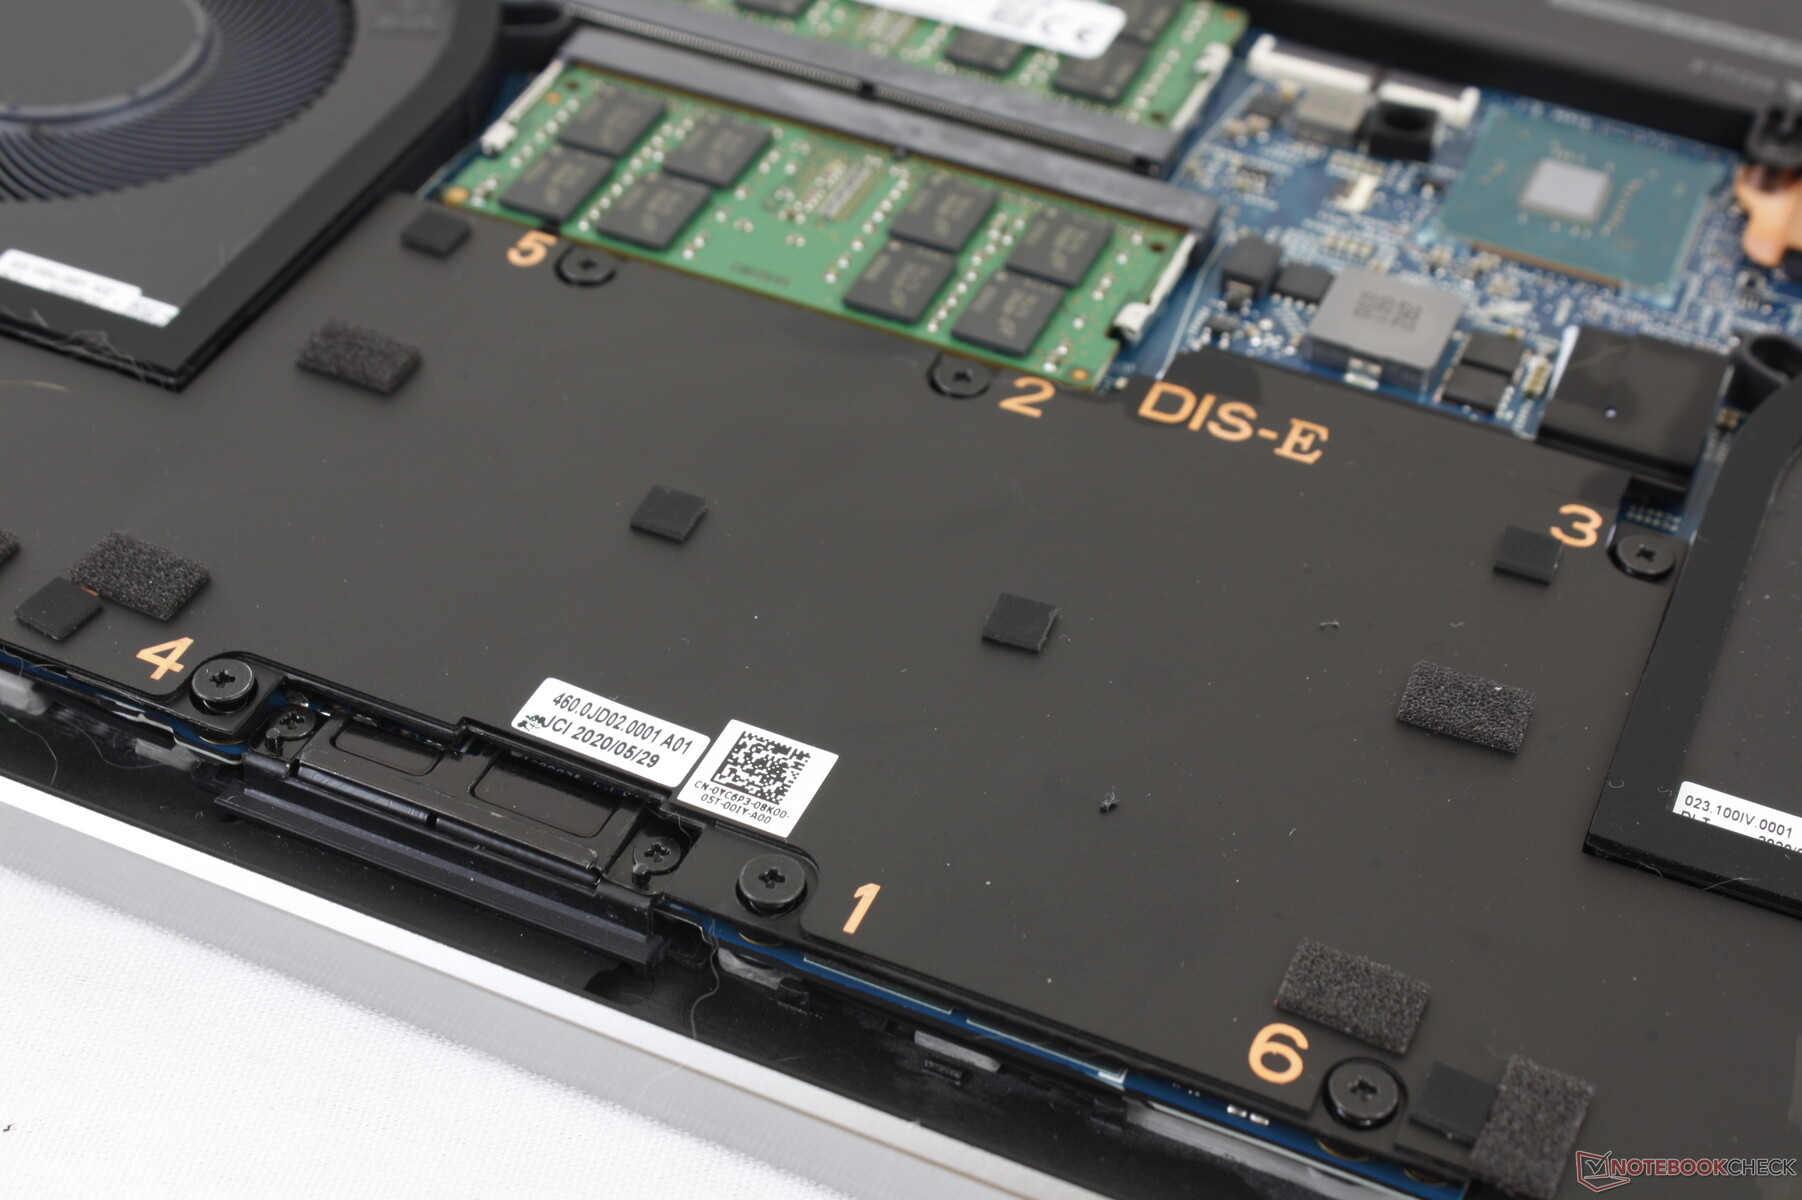
Mantenimiento
Accesorios y garantía
Un adaptador de USB-C a HDMI y USB-A está incluido en cada caja. La garantía estándar es de un año solamente, comparada con los tres años de las estaciones de trabajo tradicionales de tamaño completo como la Precision 7550.
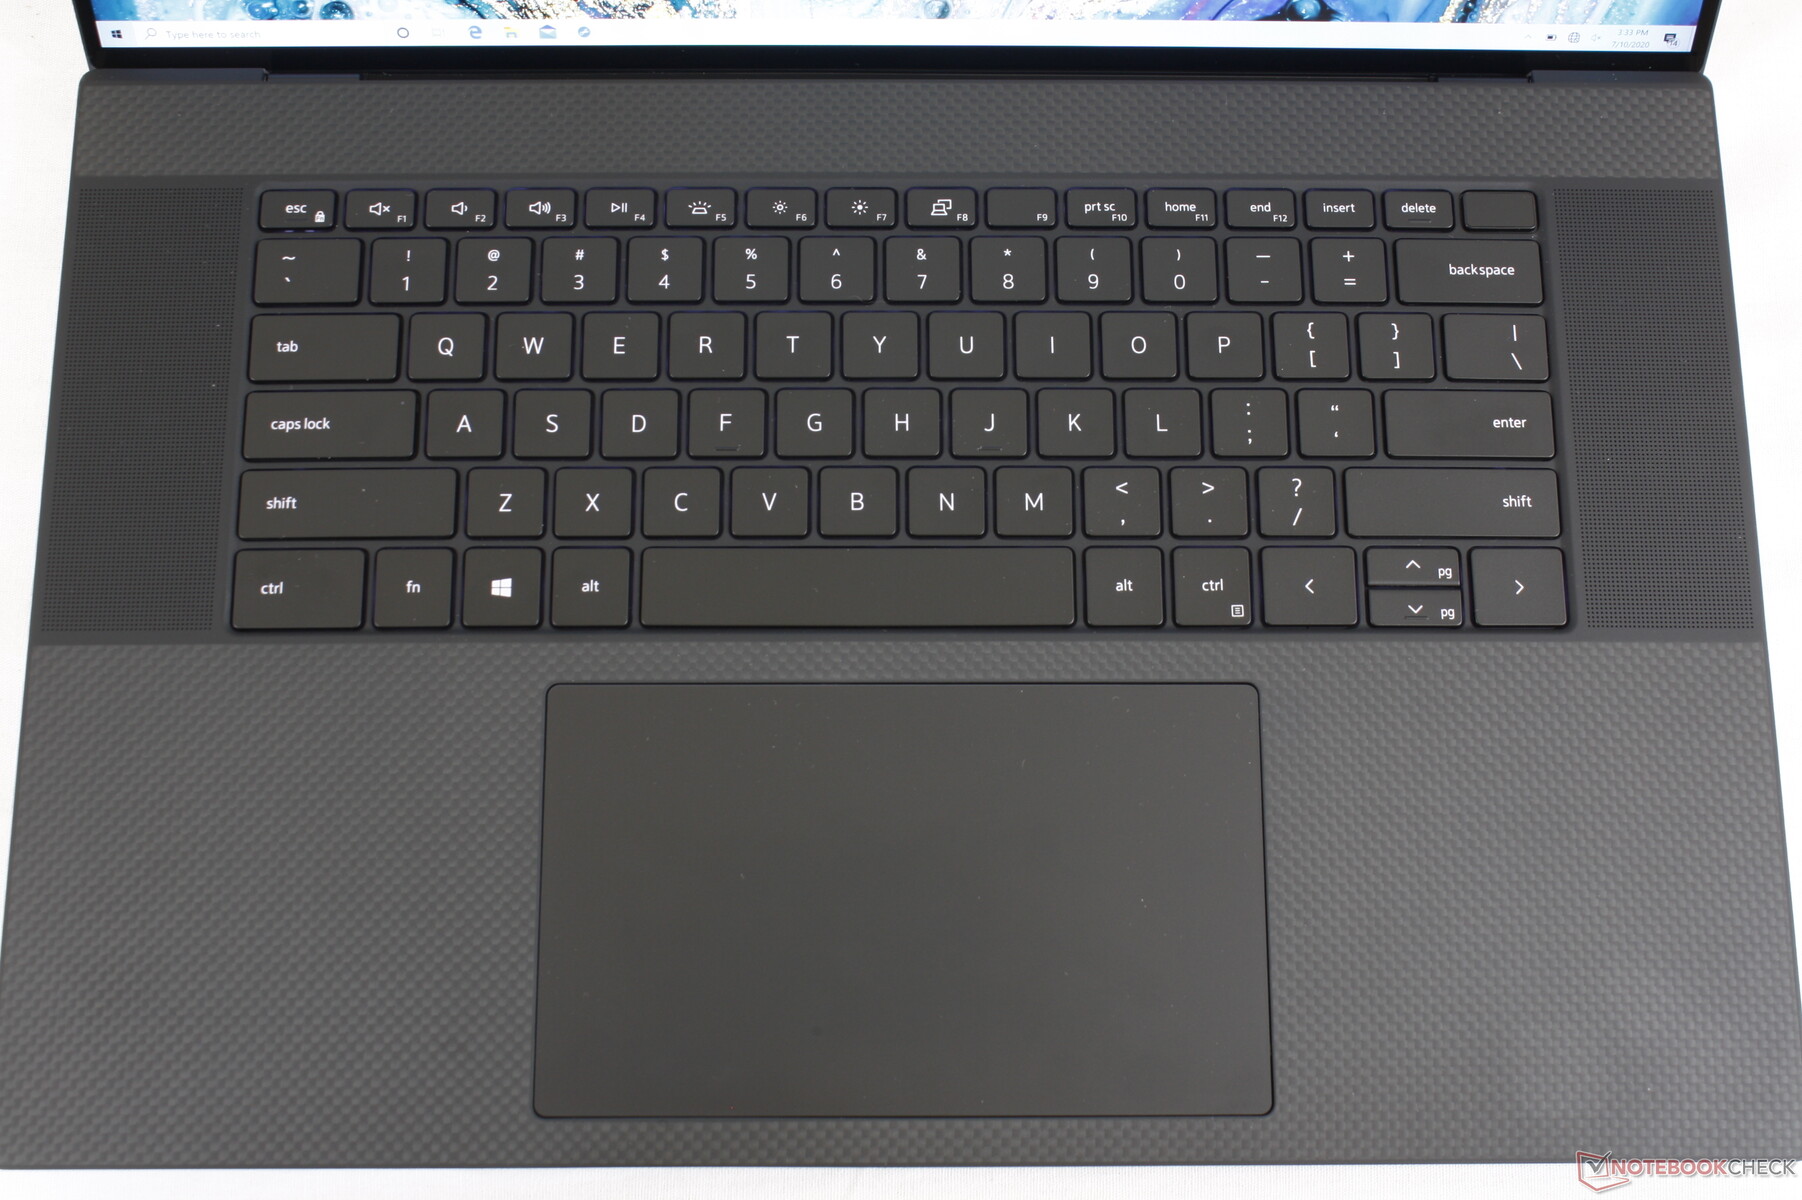
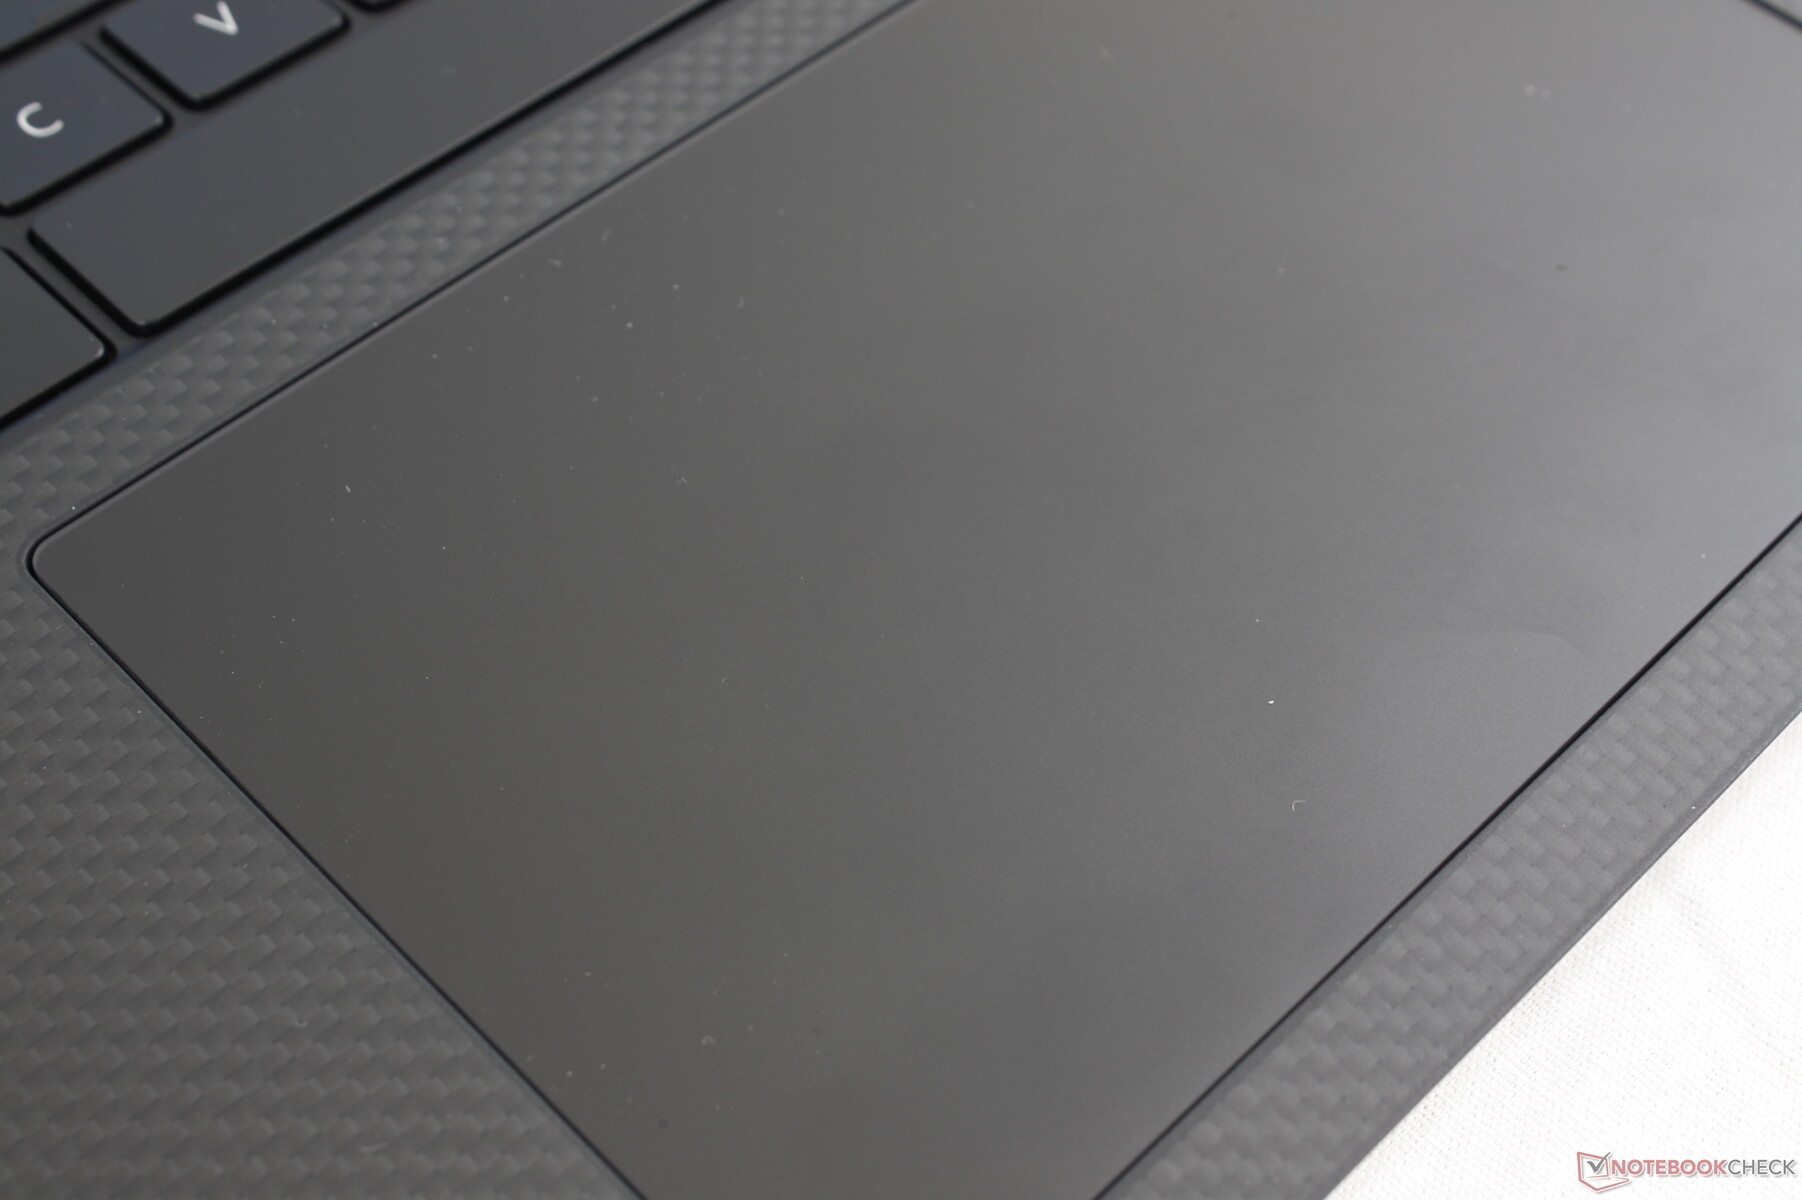
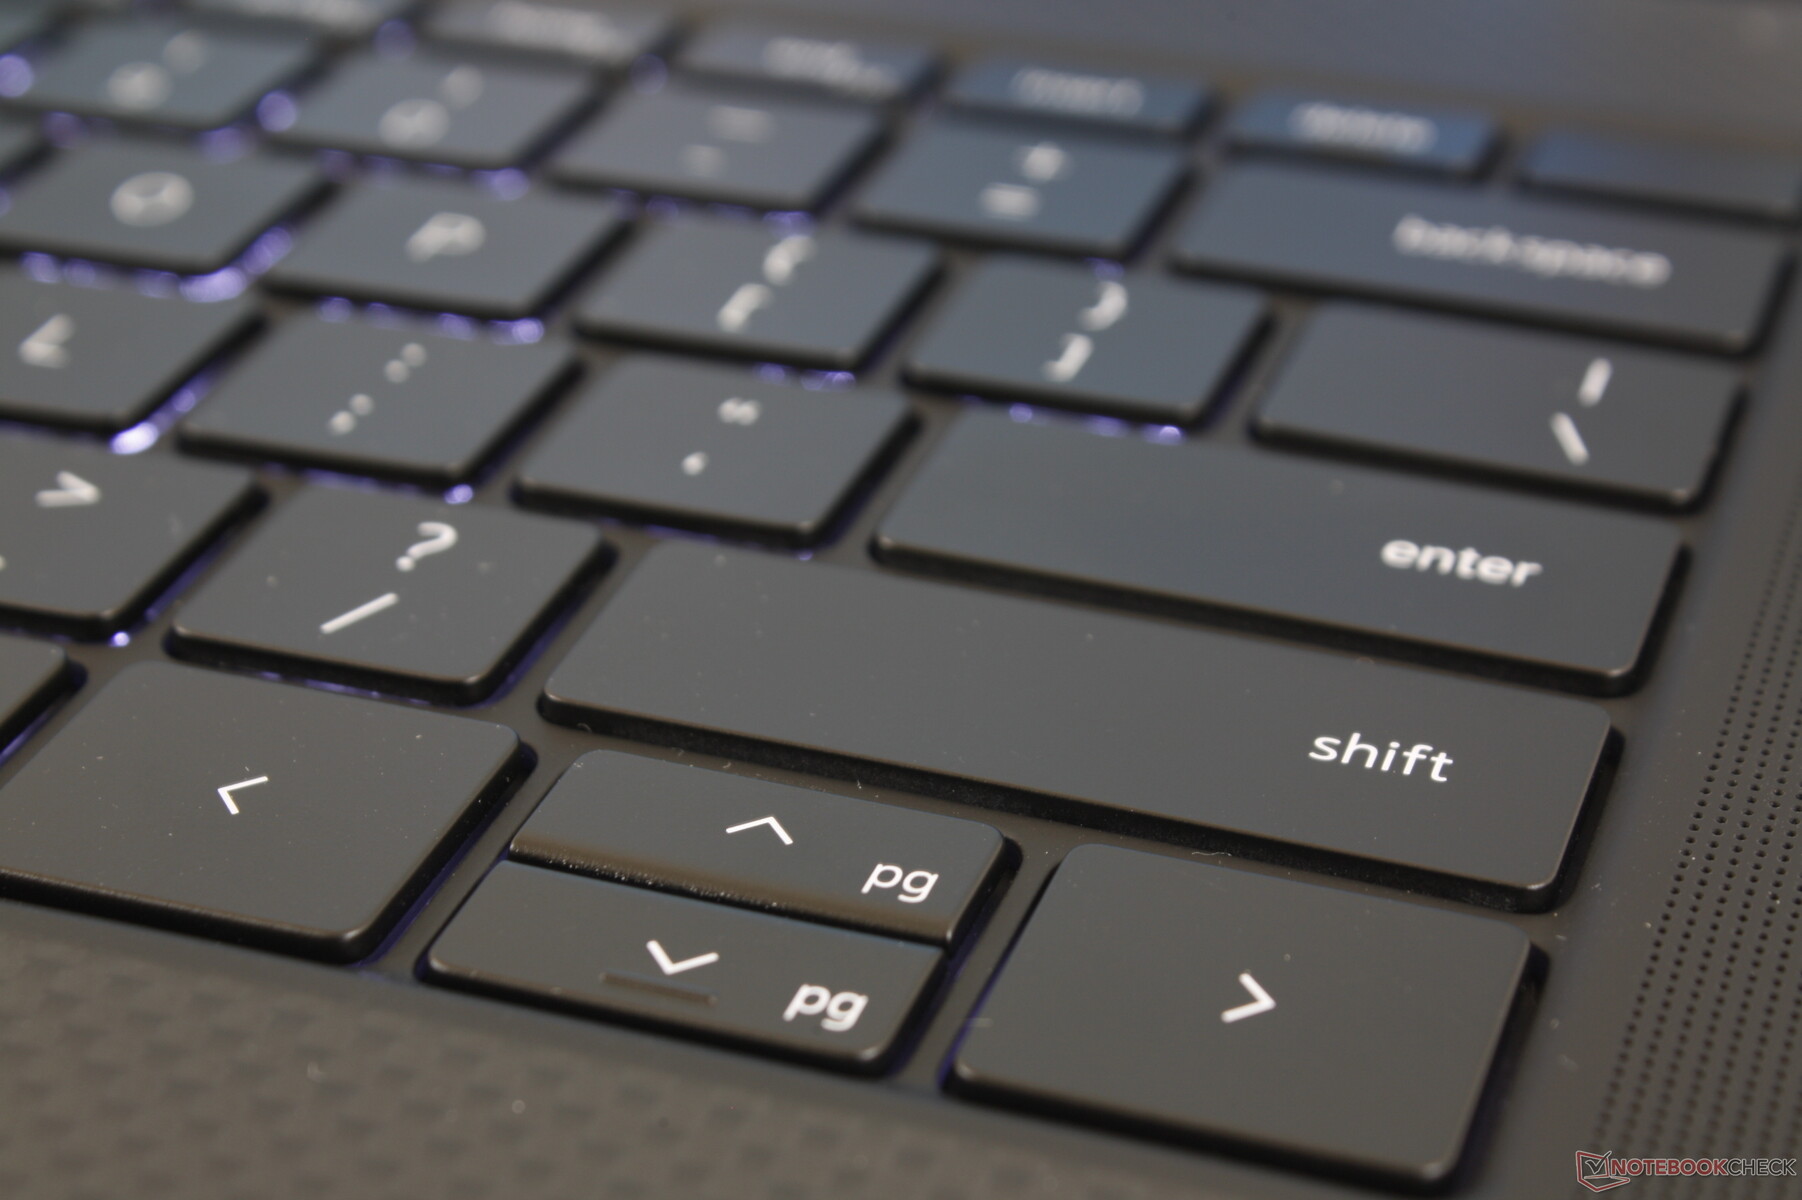
Dispositivos de entrada

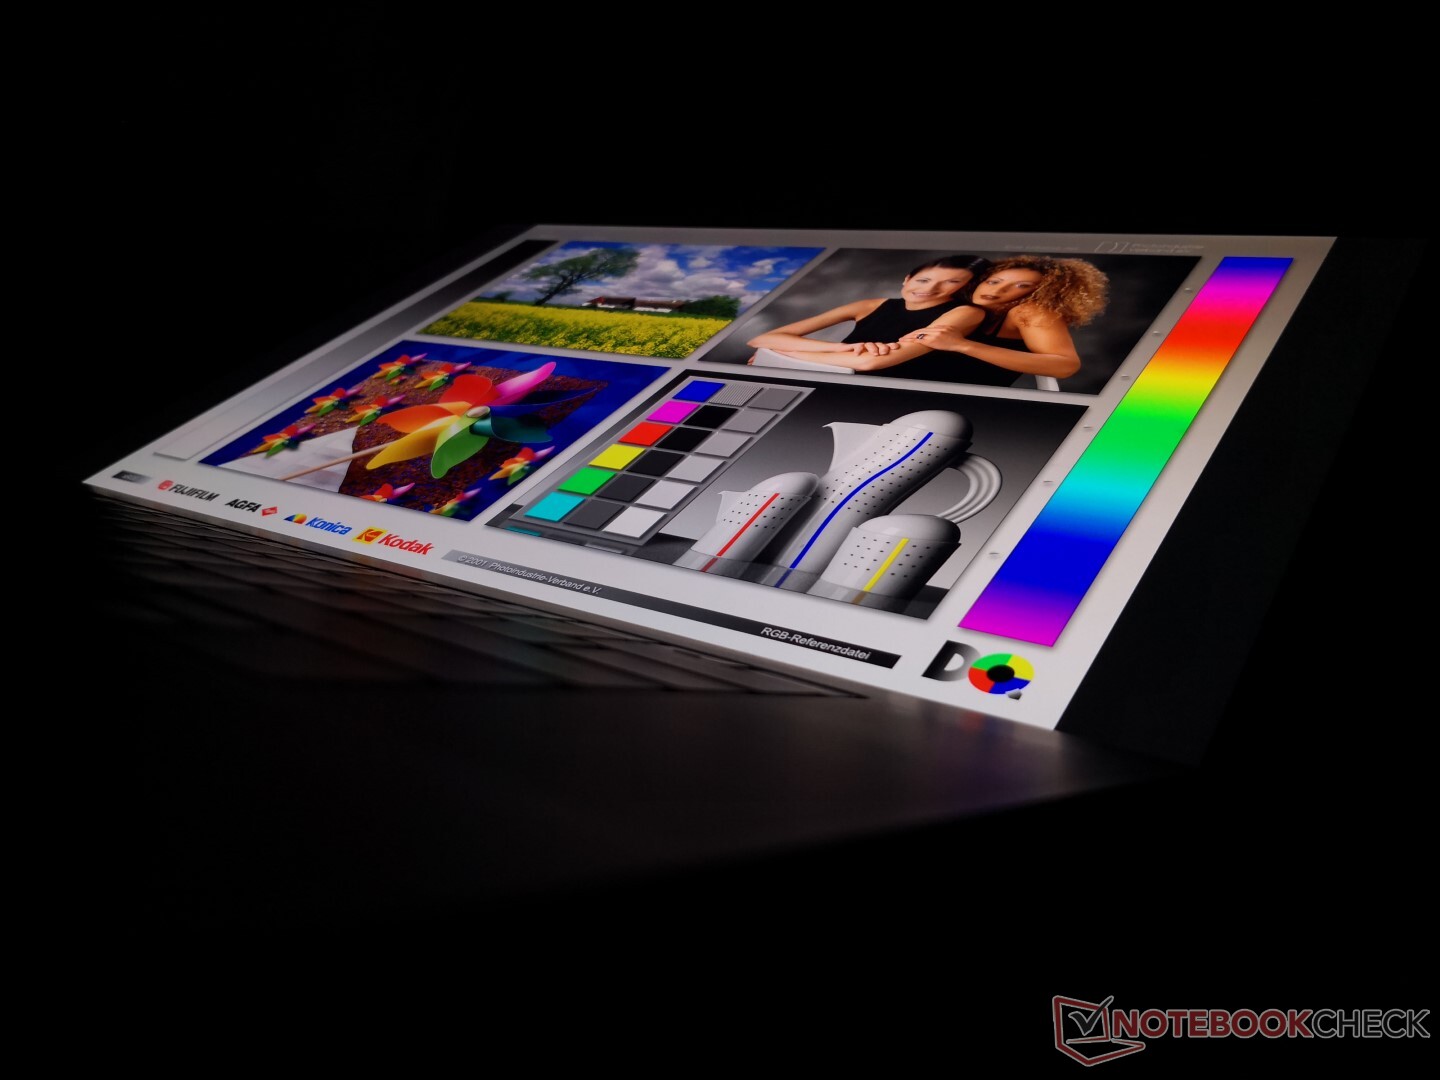
Display
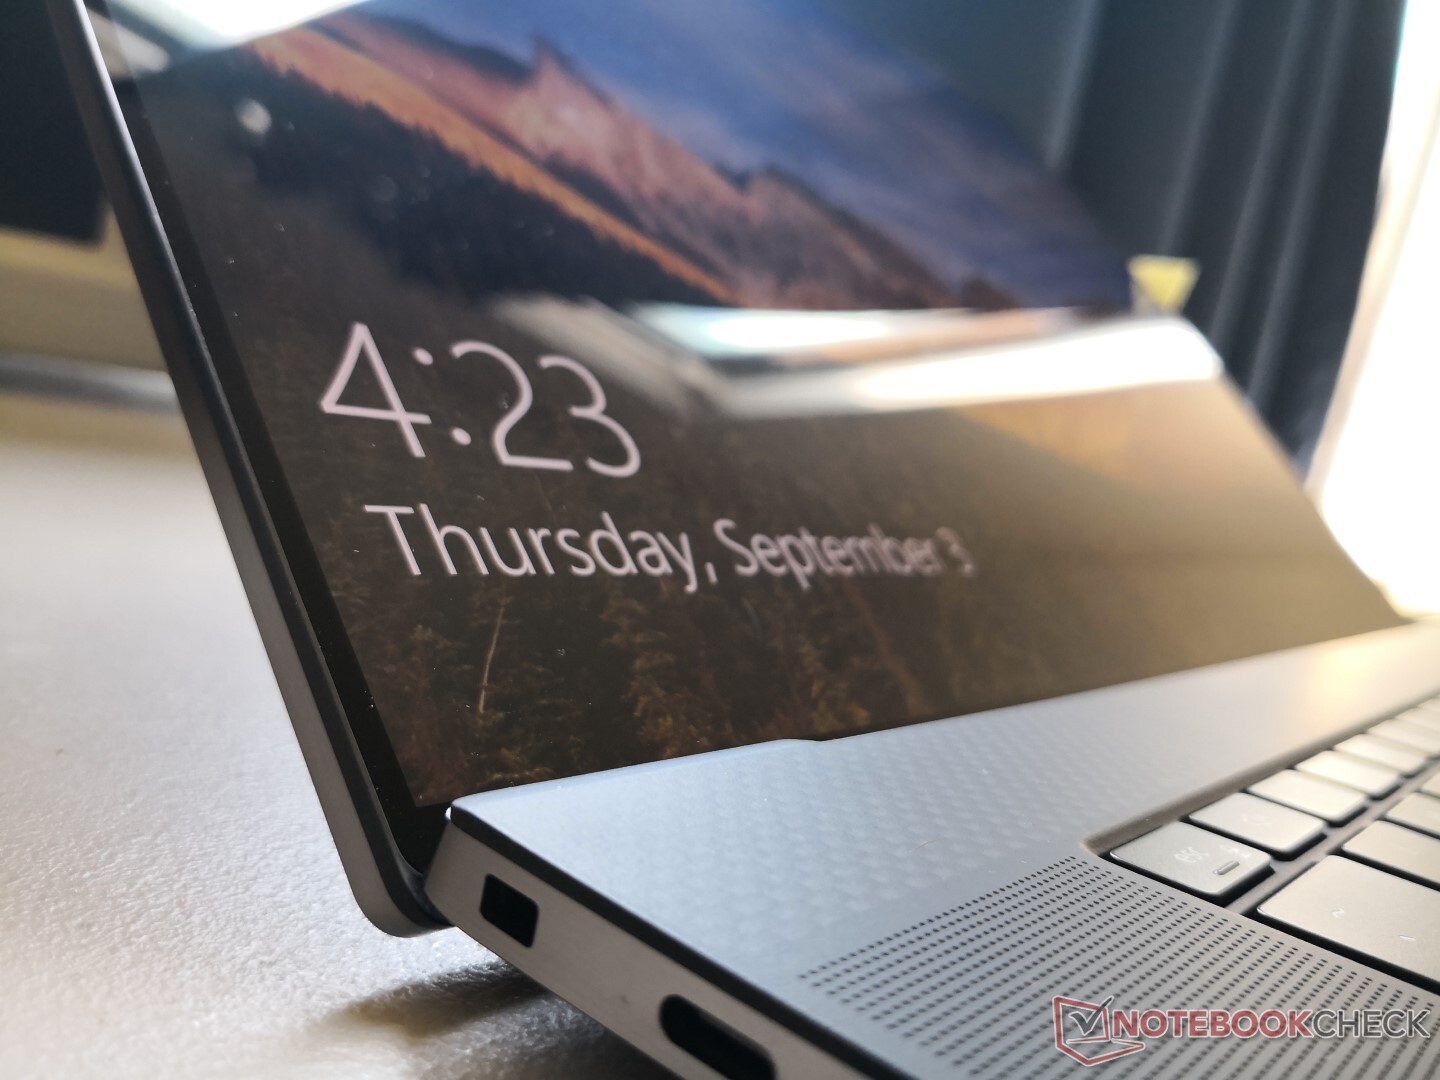
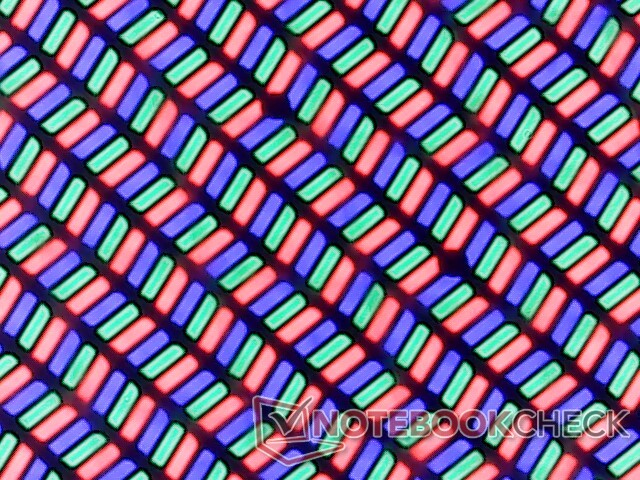
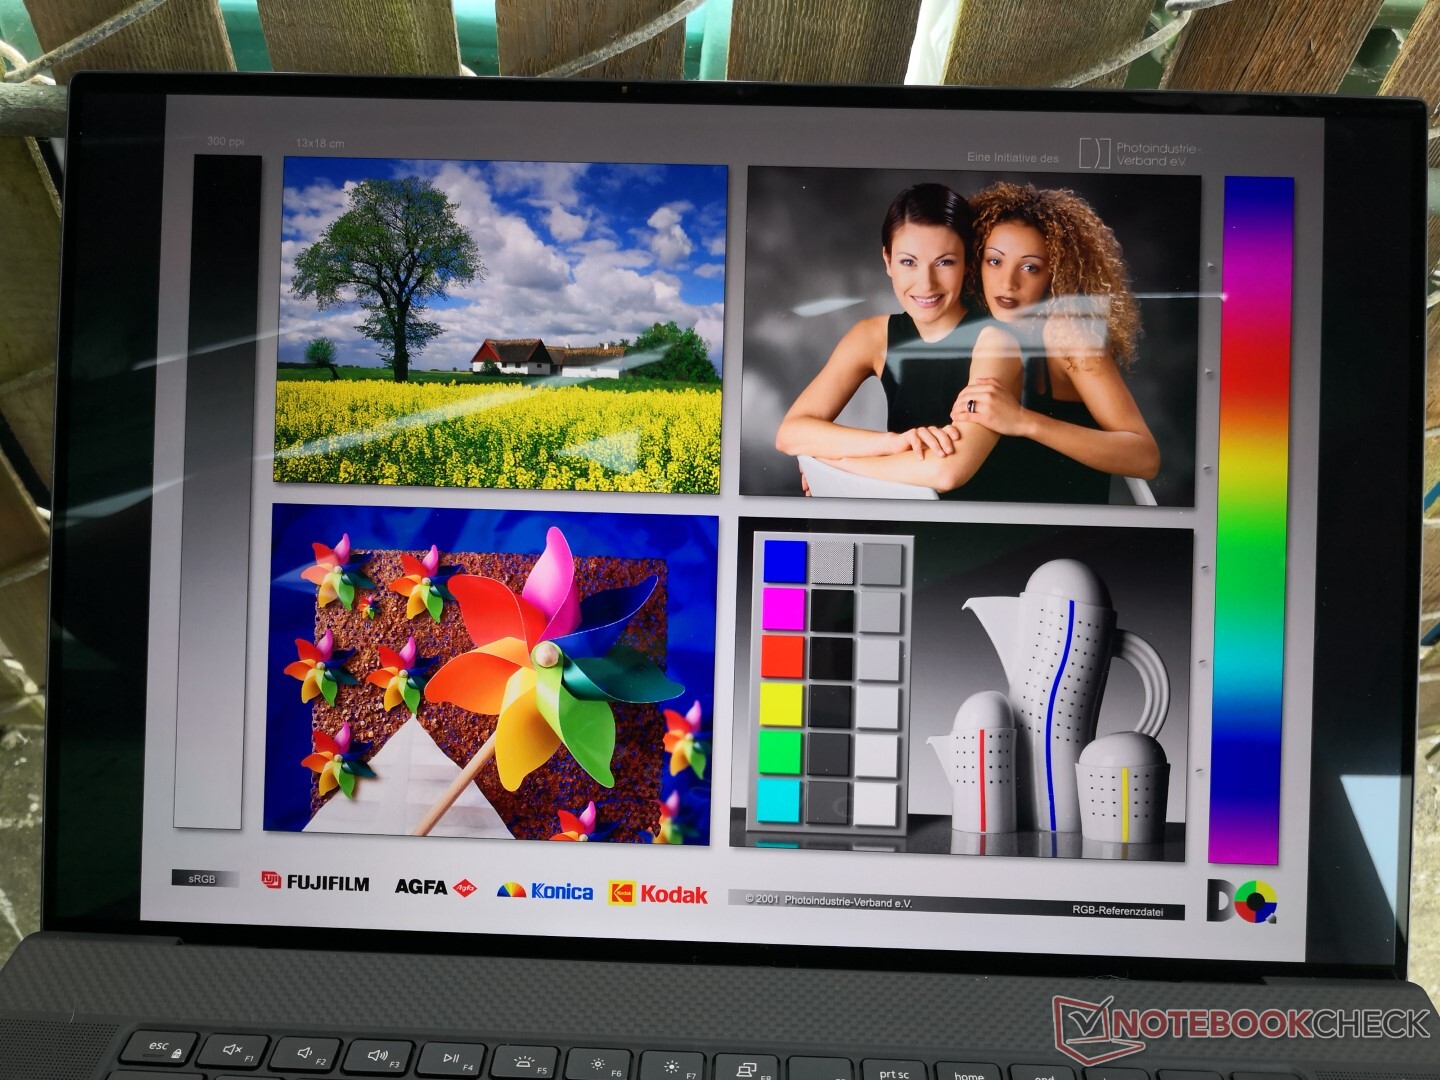
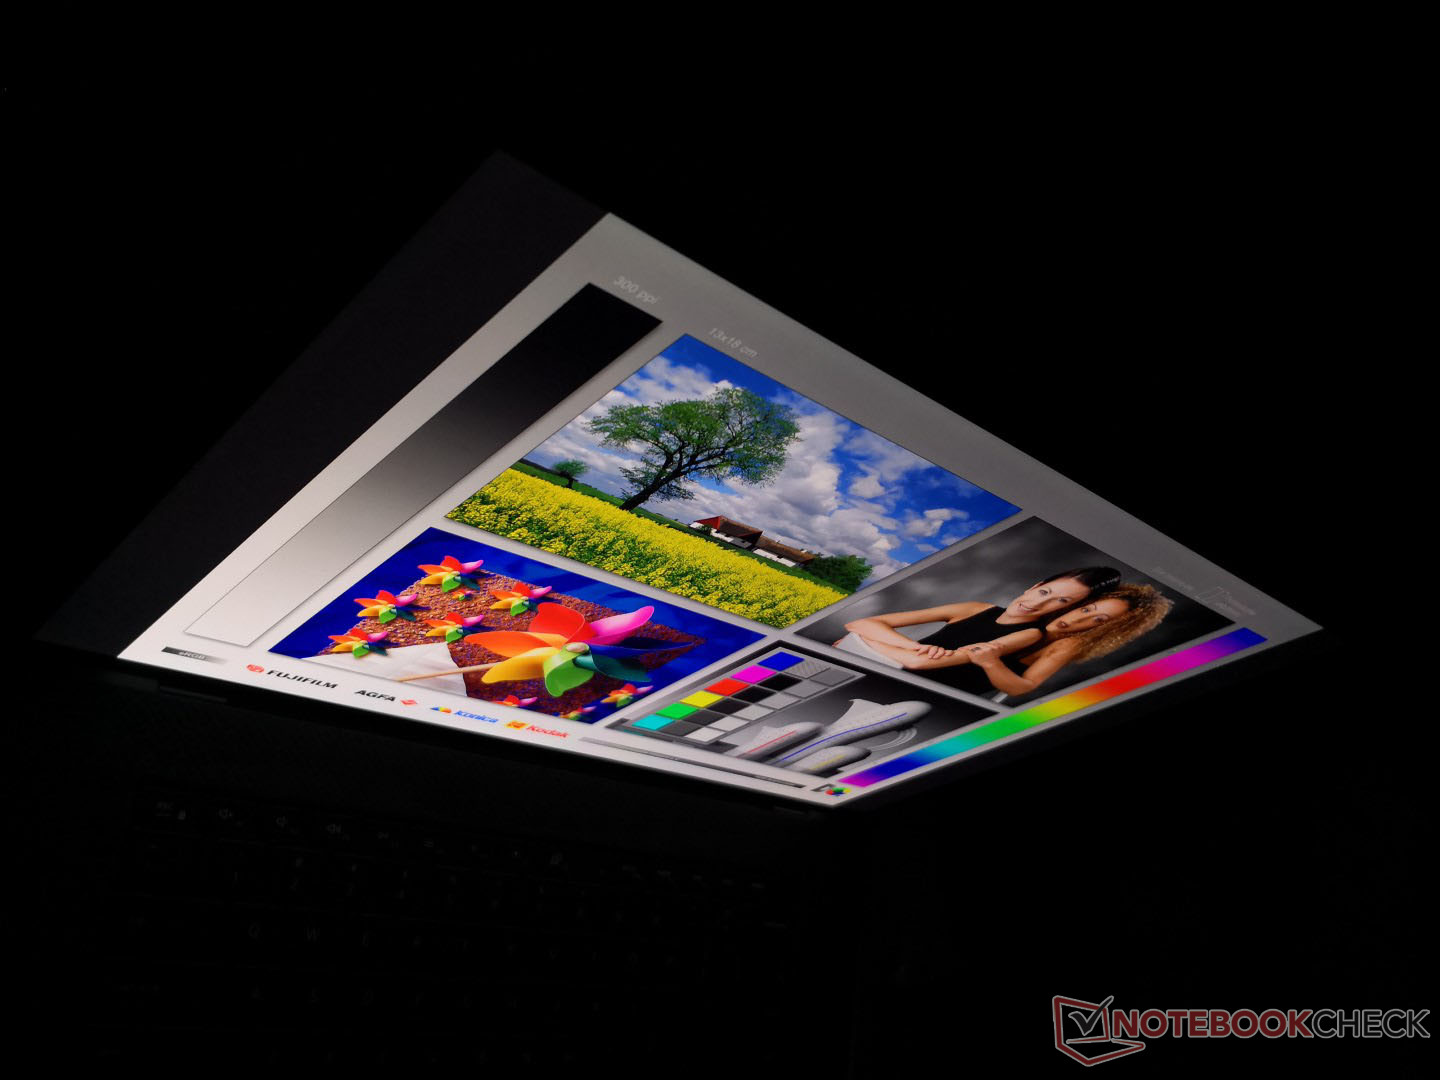
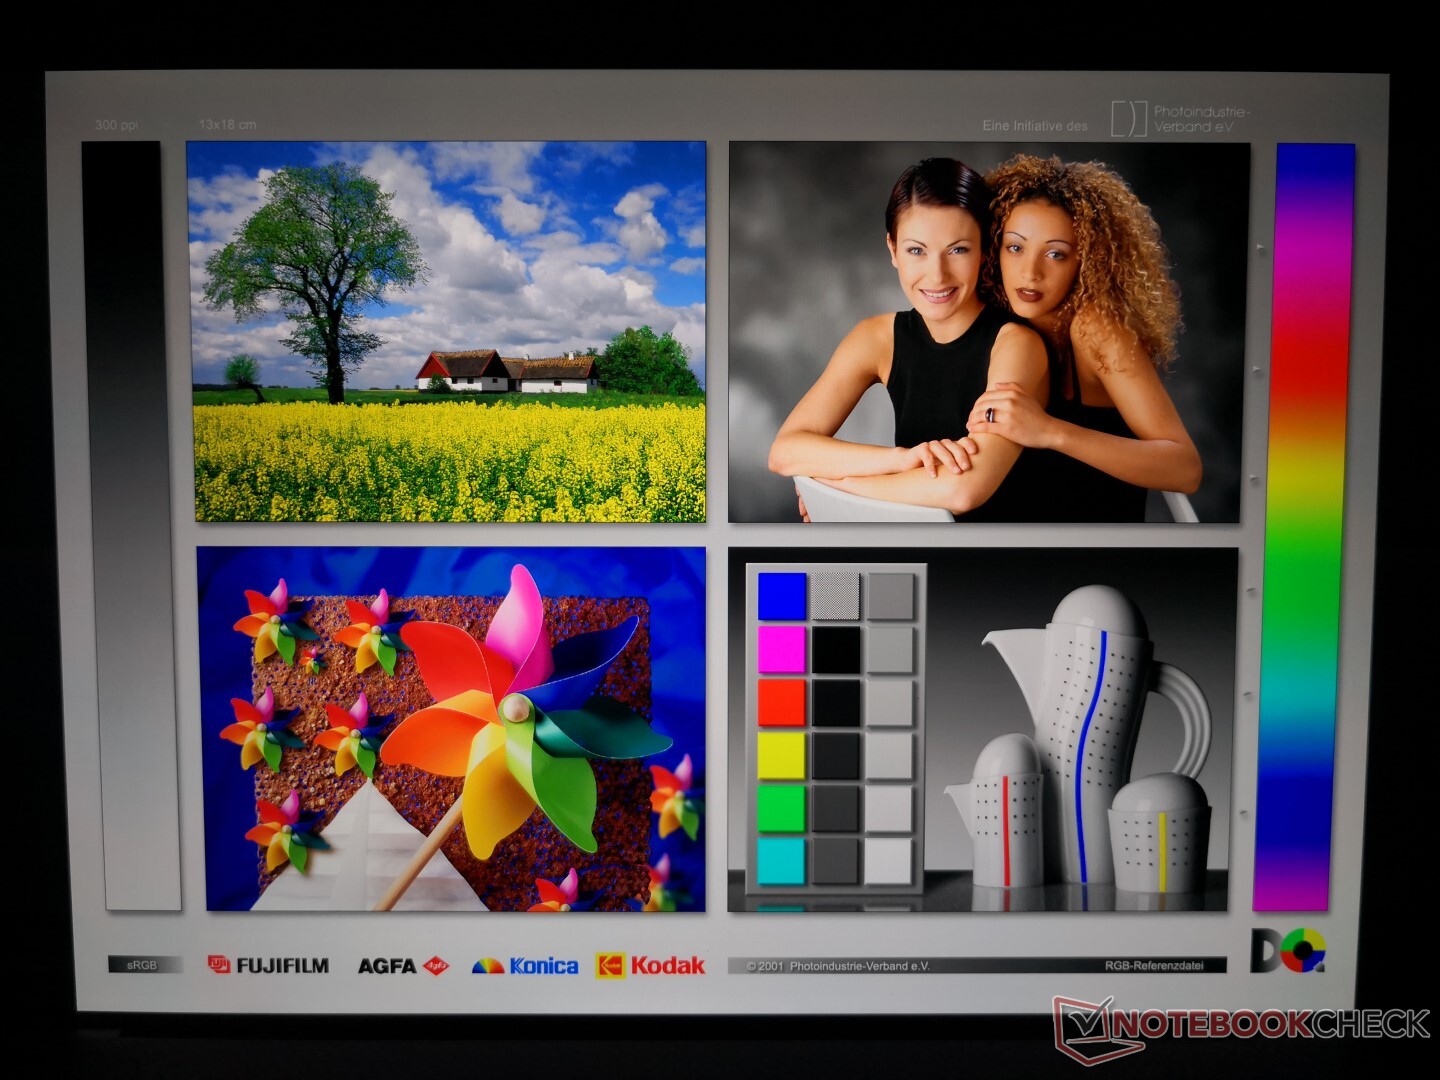
Dell utiliza el mismo panel Sharp LQ170R1 IPS y el controlador SHP14D6 para el XPS 17 y el Precision 5750 para la misma experiencia visual entre los dos modelos. Cuando se compara con las pantallas de la mayoría de las otras estaciones de trabajo, el XPS 17 ofrece una relación de aspecto 16:10 poco común, con pantalla táctil e imágenes más nítidas debido a la superposición brillante. También es más brillante a casi 500 nits comparado con el promedio de ~300 nits.
Los tiempos de respuesta son relativamente lentos para un notable efecto fantasma, pero eso es común en los paneles de los portátiles de 4K.

| |||||||||||||||||||||||||
iluminación: 90 %
Brillo con batería: 483.8 cd/m²
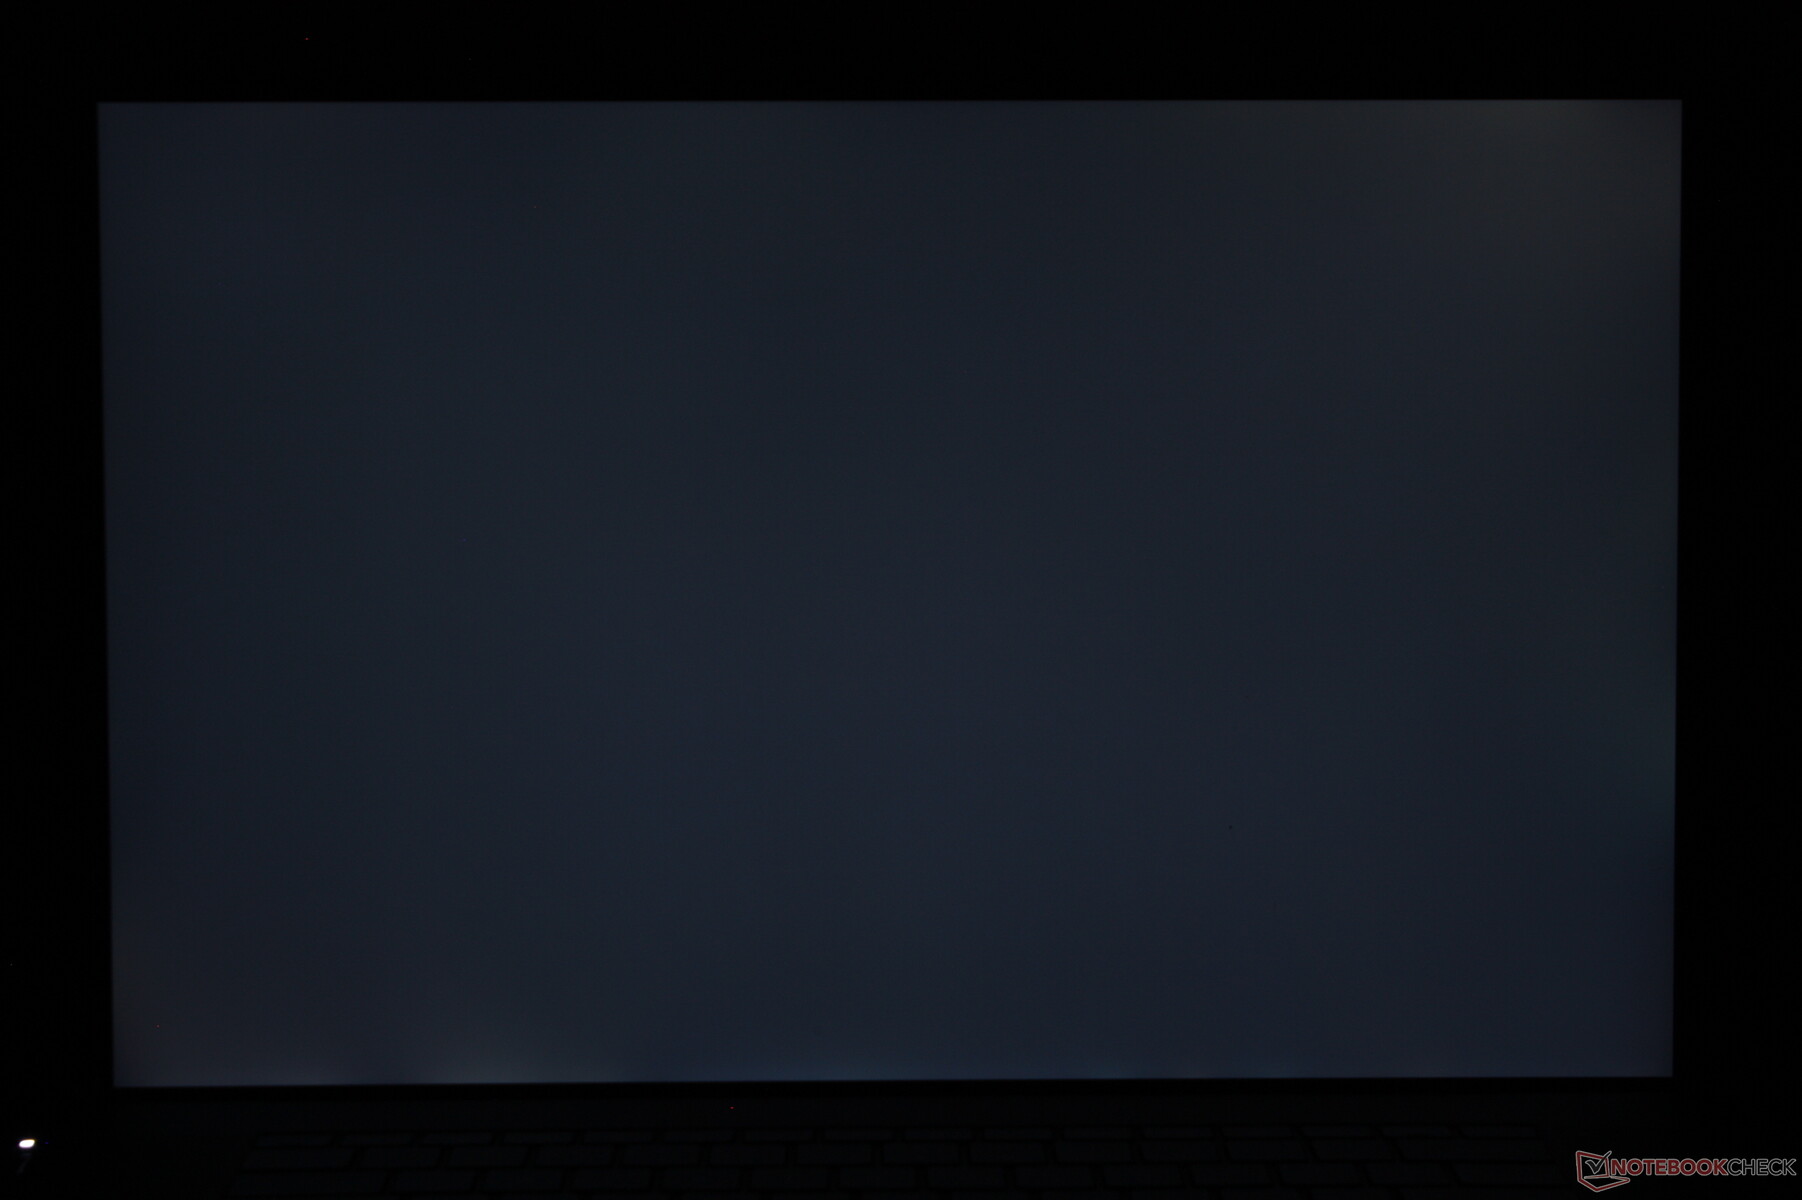
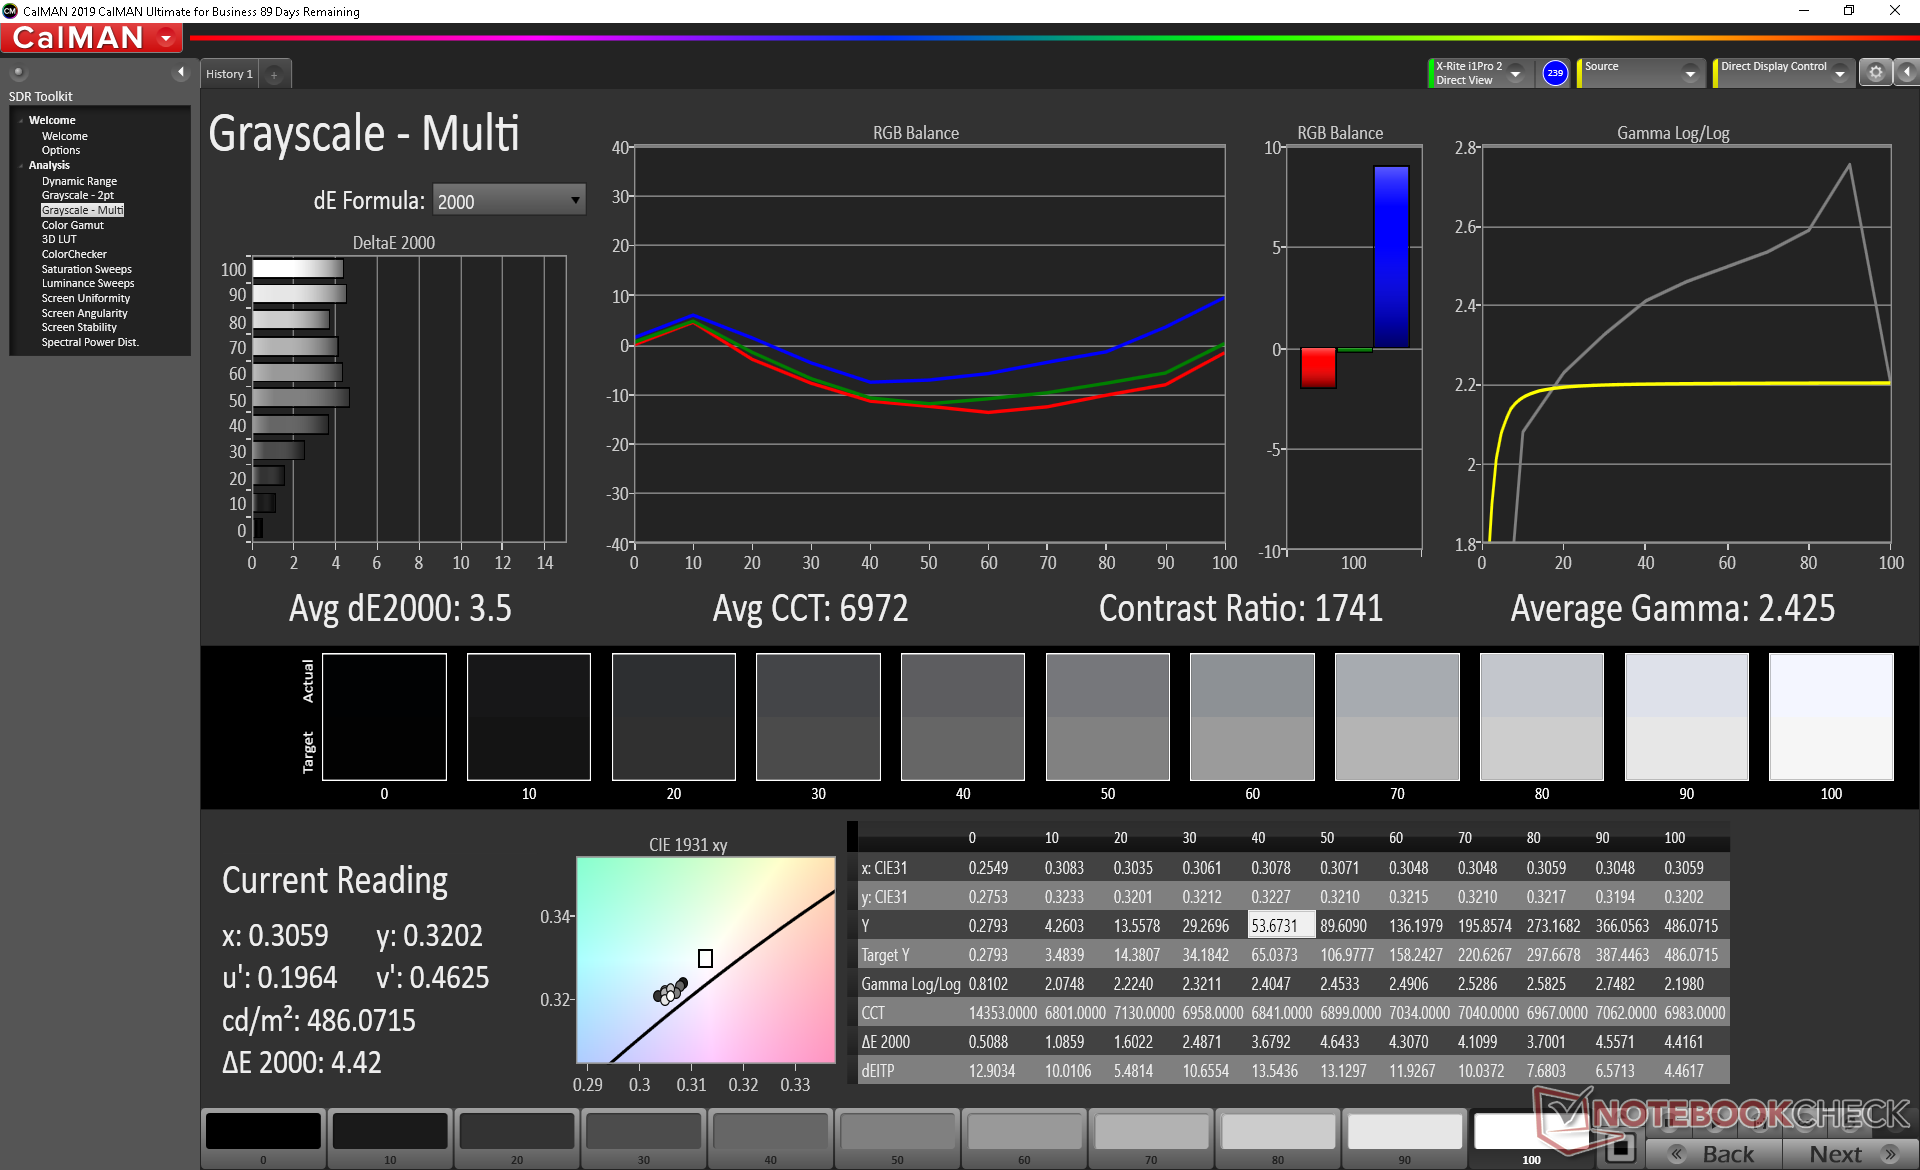
Contraste: 1308:1 (Negro: 0.37 cd/m²)
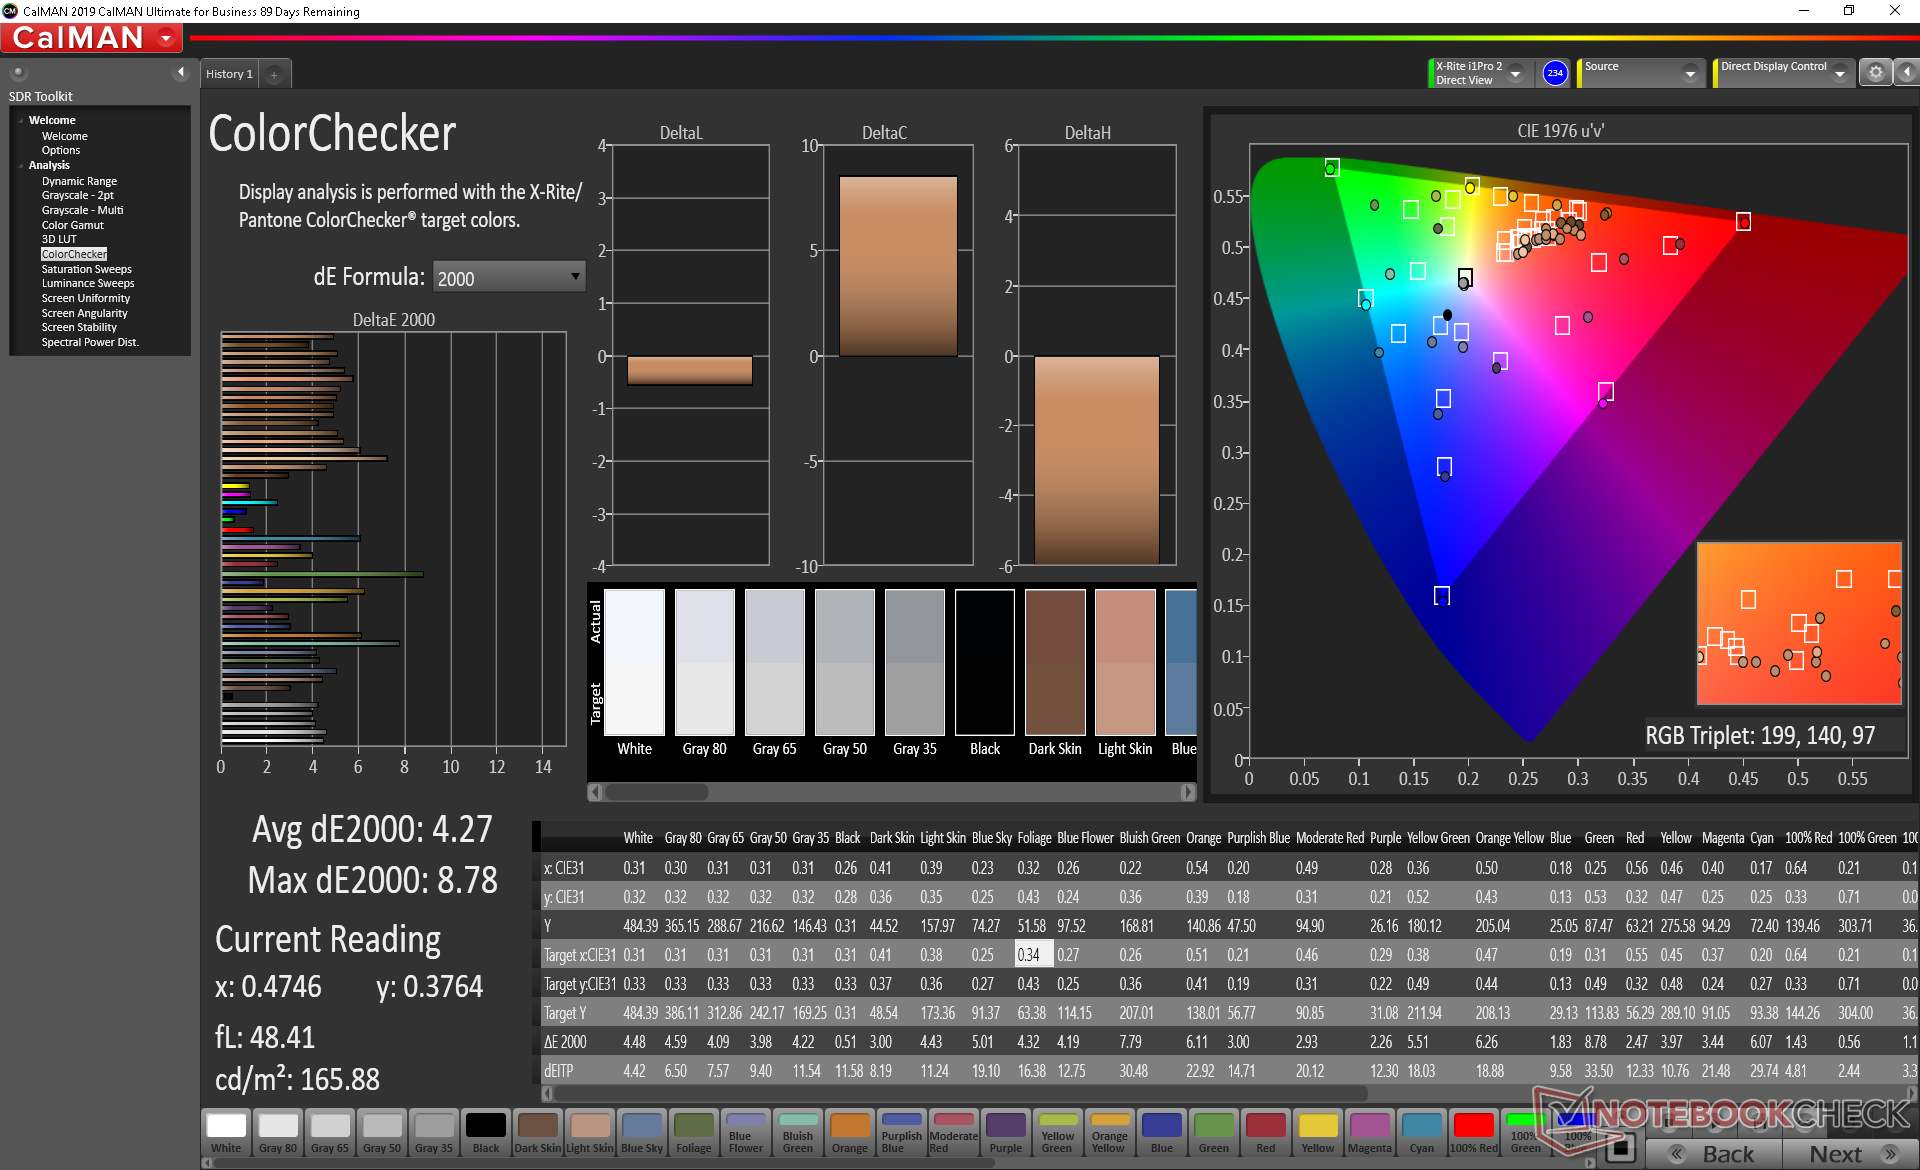
ΔE ColorChecker Calman: 4.27 | ∀{0.5-29.43 Ø4.72}
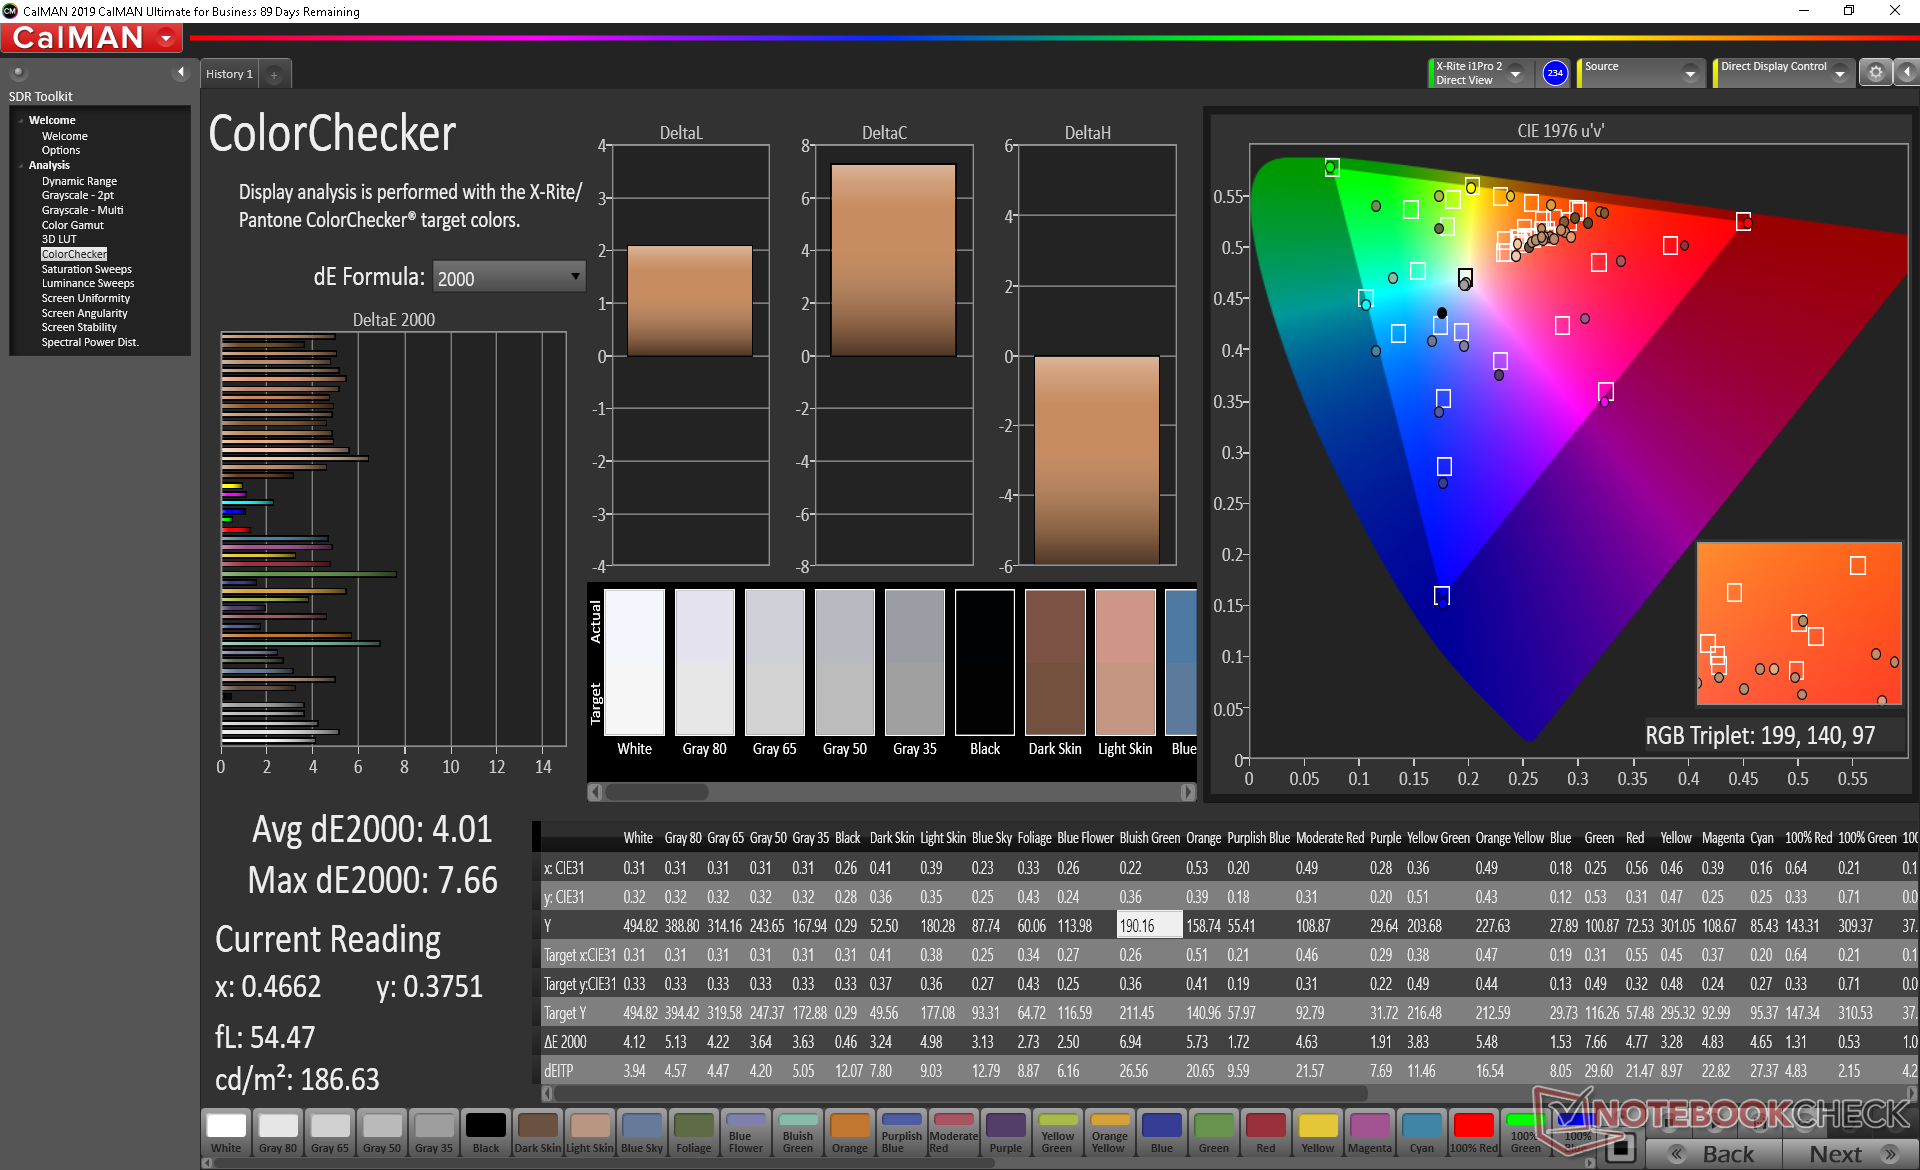
calibrated: 4.01
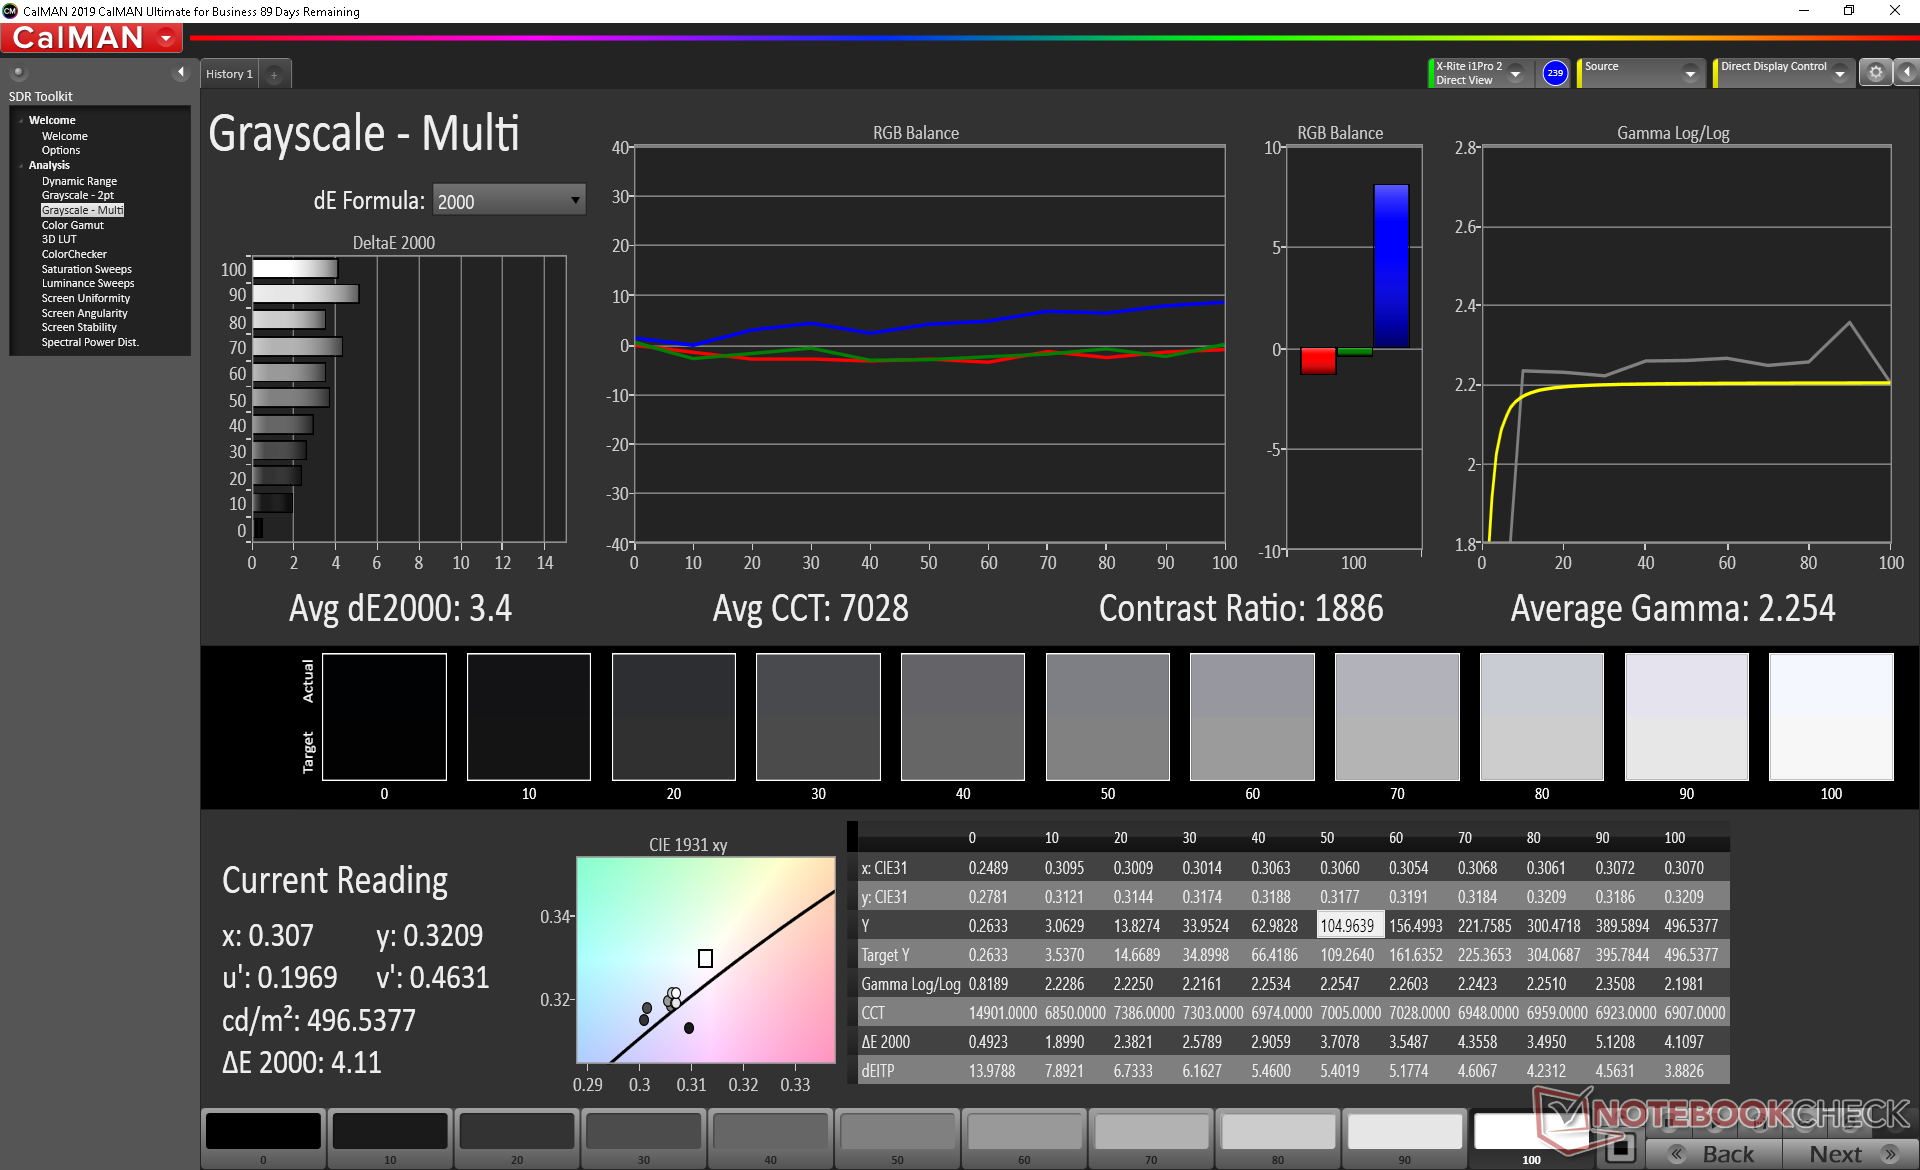
ΔE Greyscale Calman: 3.5 | ∀{0.09-98 Ø4.97}
99.9% sRGB (Argyll 1.6.3 3D)
86.7% AdobeRGB 1998 (Argyll 1.6.3 3D)
97.7% AdobeRGB 1998 (Argyll 3D)
99.7% sRGB (Argyll 3D)
83.6% Display P3 (Argyll 3D)
Gamma: 2.43
CCT: 1741 K
| Dell Precision 5000 5750 P92F Sharp LQ170R1, IPS, 17", 3840x2400 | Asus ProArt StudioBook Pro 17 W700G3T 170PUW1-A00, IPS, 17", 1920x1200 | MSI WS75 9TL-636 B173HAN04.2, IPS, 17.3", 1920x1080 | Dell Precision 7730 B173HAN01.3, IPS LED, 17.3", 1920x1080 | Lenovo ThinkPad P73-20QR002DGE N173HCE-E31, IPS LED, 17.3", 1920x1080 | MSI WE75 9TK AU Optronics B173HAN04.2, IPS, 17.3", 1920x1080 | |
|---|---|---|---|---|---|---|
| Display | 1% | -22% | -20% | -19% | -23% | |
| Display P3 Coverage (%) | 83.6 | 96.2 15% | 64.5 -23% | 65 -22% | 67.5 -19% | 63.2 -24% |
| sRGB Coverage (%) | 99.7 | 99.8 0% | 91.1 -9% | 93.4 -6% | 94.2 -6% | 89.9 -10% |
| AdobeRGB 1998 Coverage (%) | 97.7 | 84.7 -13% | 65.8 -33% | 66.3 -32% | 67.8 -31% | 64.3 -34% |
| Response Times | 7% | 11% | -7% | 11% | 17% | |
| Response Time Grey 50% / Grey 80% * (ms) | 41.2 ? | 41.2 ? -0% | 39.2 ? 5% | 48.8 ? -18% | 40 ? 3% | 30.8 ? 25% |
| Response Time Black / White * (ms) | 34 ? | 29.6 ? 13% | 28.4 ? 16% | 32.8 ? 4% | 28 ? 18% | 31.2 ? 8% |
| PWM Frequency (Hz) | 25000 ? | |||||
| Screen | 17% | -3% | 12% | -12% | 0% | |
| Brightness middle (cd/m²) | 483.8 | 323 -33% | 300 -38% | 322 -33% | 333 -31% | 287.3 -41% |
| Brightness (cd/m²) | 457 | 308 -33% | 288 -37% | 316 -31% | 310 -32% | 280 -39% |
| Brightness Distribution (%) | 90 | 88 -2% | 86 -4% | 84 -7% | 83 -8% | 89 -1% |
| Black Level * (cd/m²) | 0.37 | 0.36 3% | 0.25 32% | 0.24 35% | 0.39 -5% | 0.26 30% |
| Contrast (:1) | 1308 | 897 -31% | 1200 -8% | 1342 3% | 854 -35% | 1105 -16% |
| Colorchecker dE 2000 * | 4.27 | 1.1 74% | 3.9 9% | 2.2 48% | 4.4 -3% | 2.98 30% |
| Colorchecker dE 2000 max. * | 8.78 | 3.3 62% | 6 32% | 4.6 48% | 7.5 15% | 5.08 42% |
| Colorchecker dE 2000 calibrated * | 4.01 | 0.8 80% | 2.3 43% | 1.9 53% | 2 50% | 3.06 24% |
| Greyscale dE 2000 * | 3.5 | 0.8 77% | 4.3 -23% | 1.6 54% | 5.1 -46% | 3 14% |
| Gamma | 2.43 91% | 2.23 99% | 2.2 100% | 2.19 100% | 2.39 92% | 2.28 96% |
| CCT | 1741 373% | 6479 100% | 7391 88% | 6621 98% | 7061 92% | 6993 93% |
| Color Space (Percent of AdobeRGB 1998) (%) | 86.7 | 75.7 -13% | 59.2 -32% | 60.4 -30% | 61.1 -30% | 58.1 -33% |
| Color Space (Percent of sRGB) (%) | 99.9 | 99.8 0% | 91 -9% | 93.3 -7% | 94 -6% | 89.5 -10% |
| Media total (Programa/Opciones) | 8% /
12% | -5% /
-5% | -5% /
4% | -7% /
-10% | -2% /
-2% |
* ... más pequeño es mejor
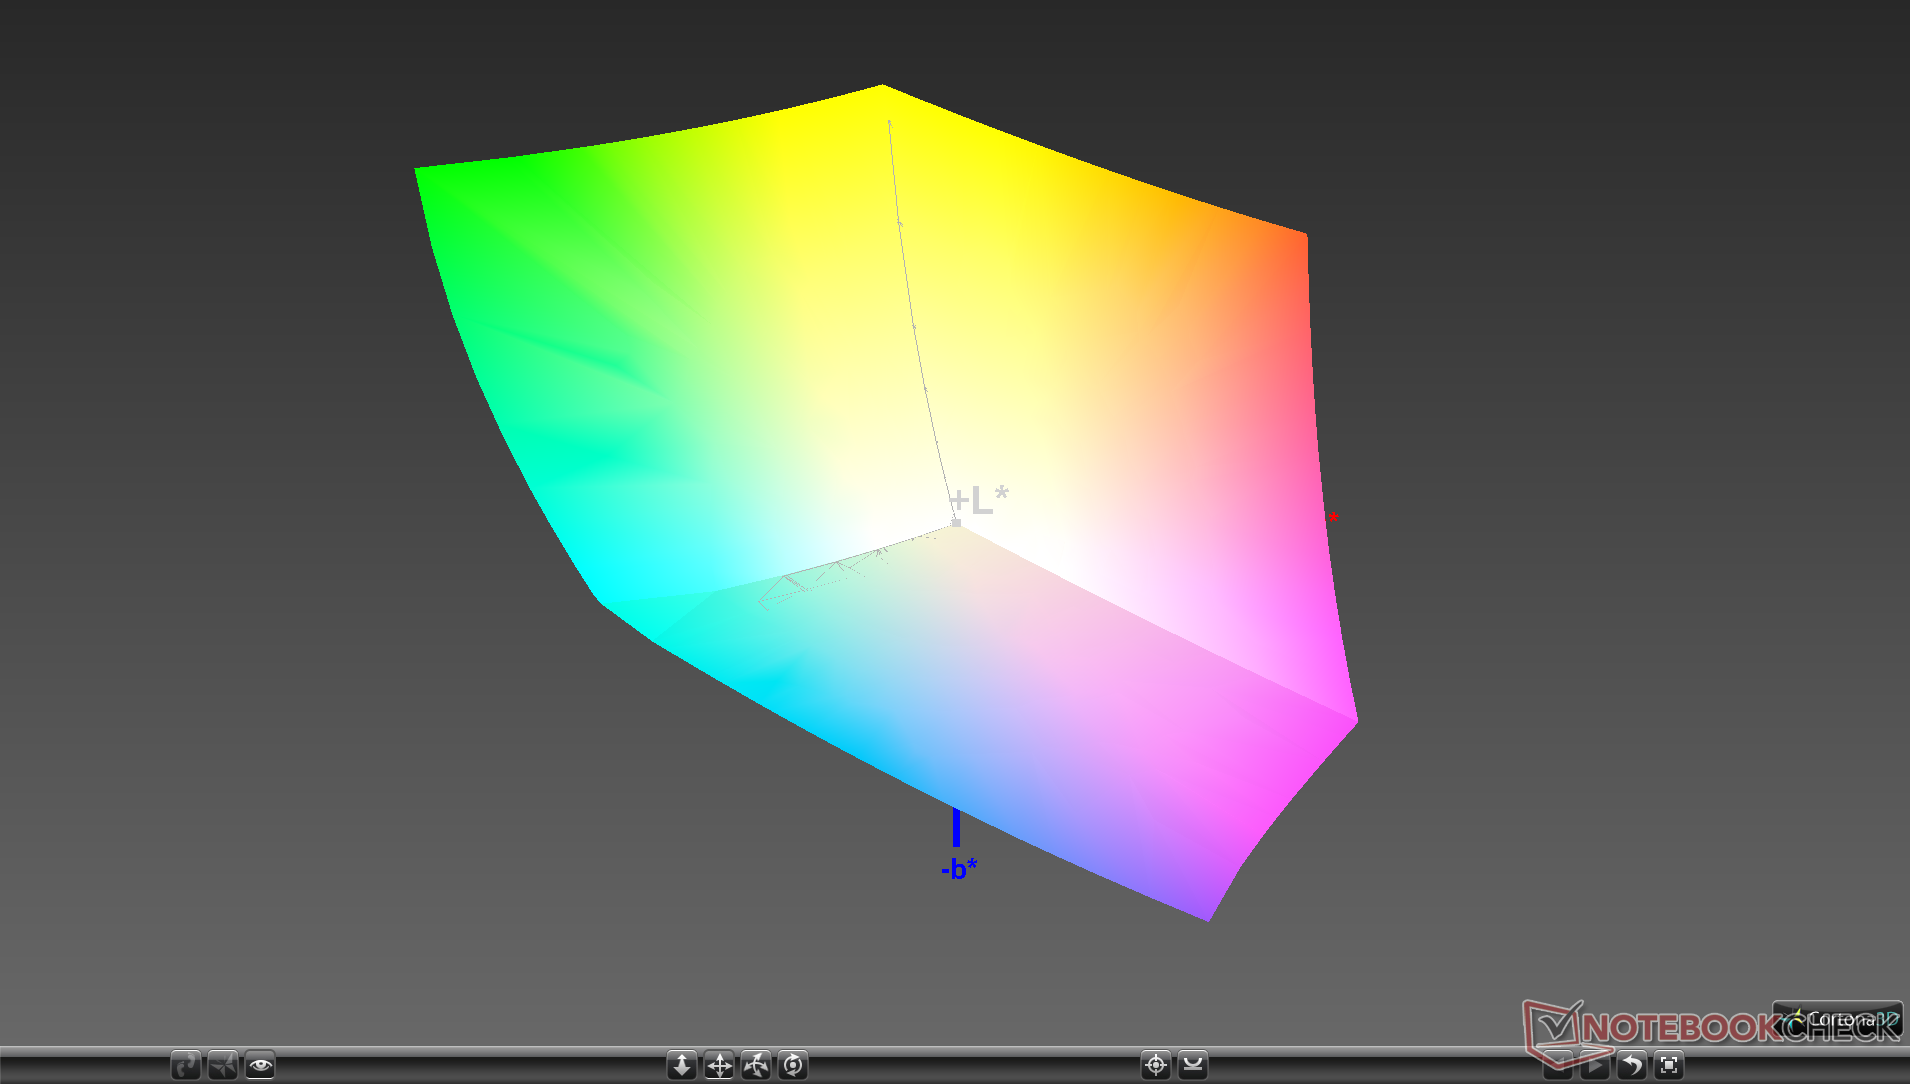
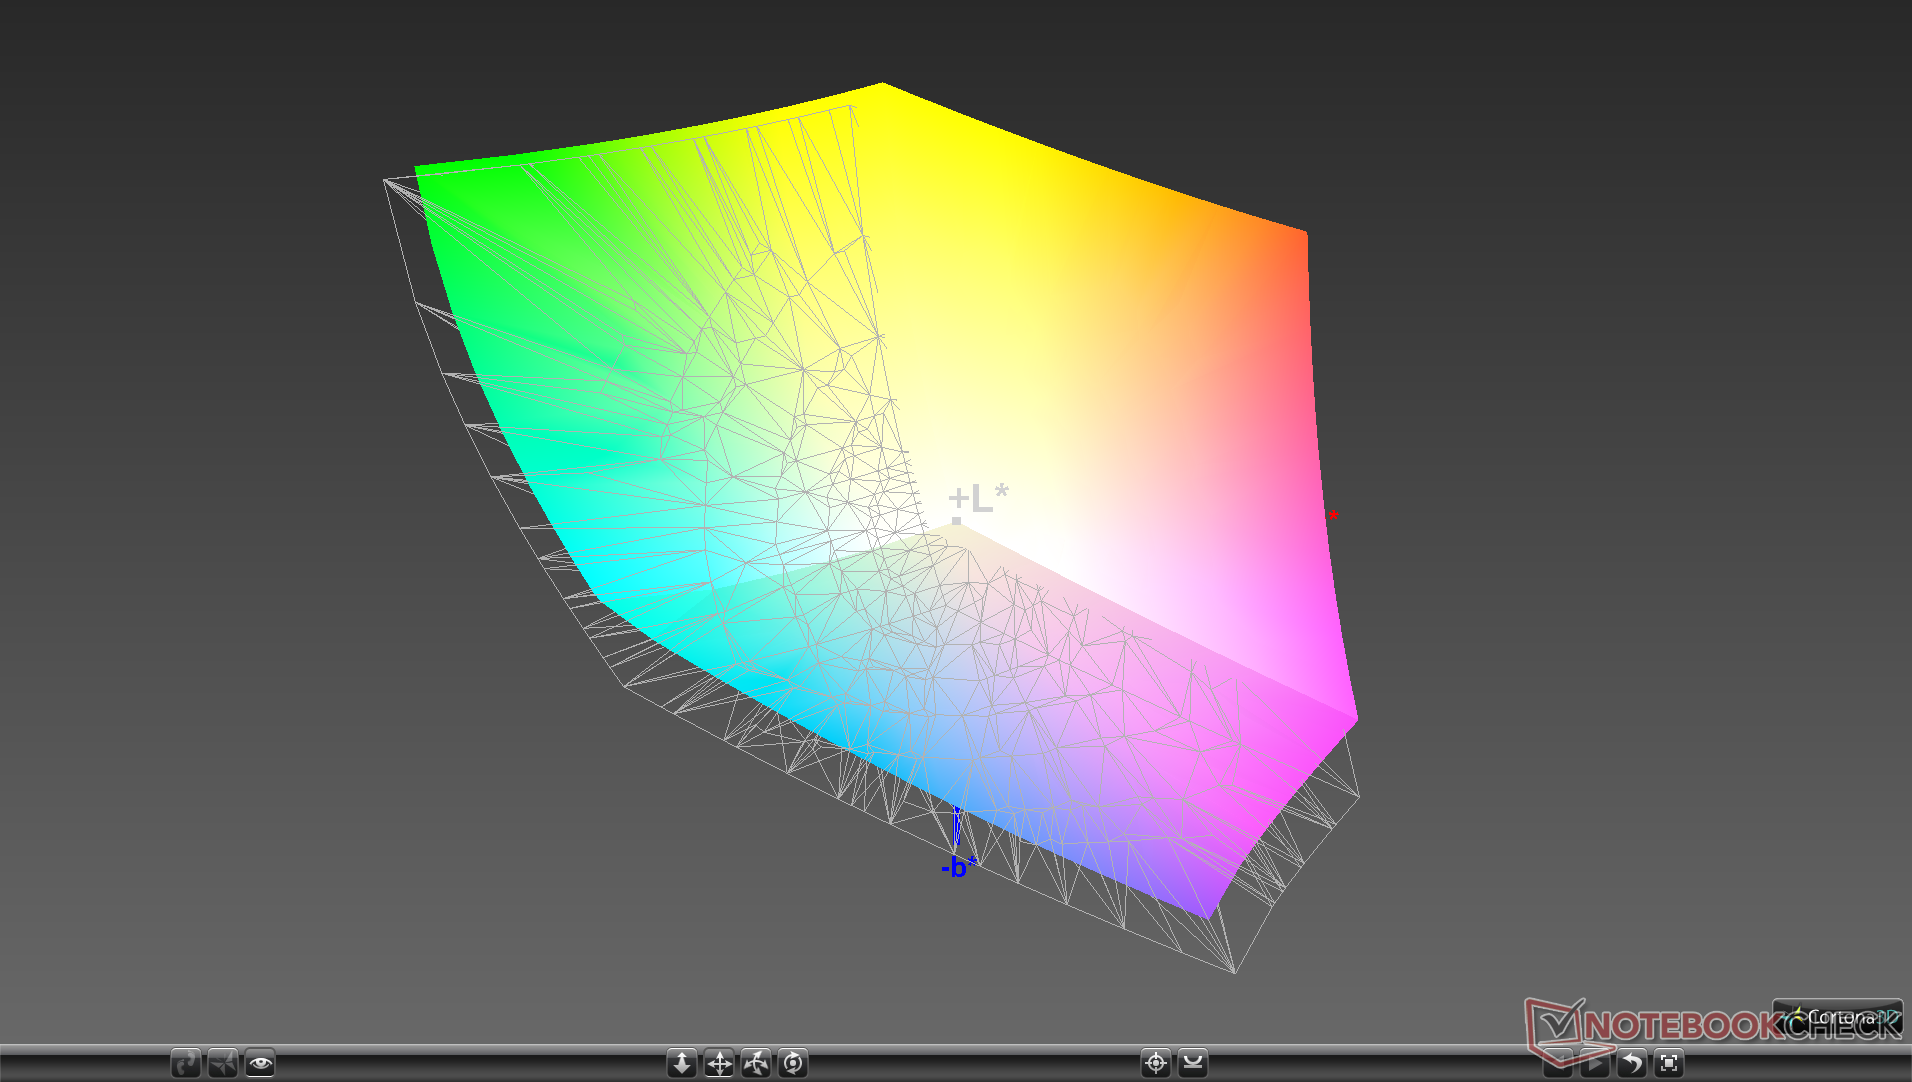
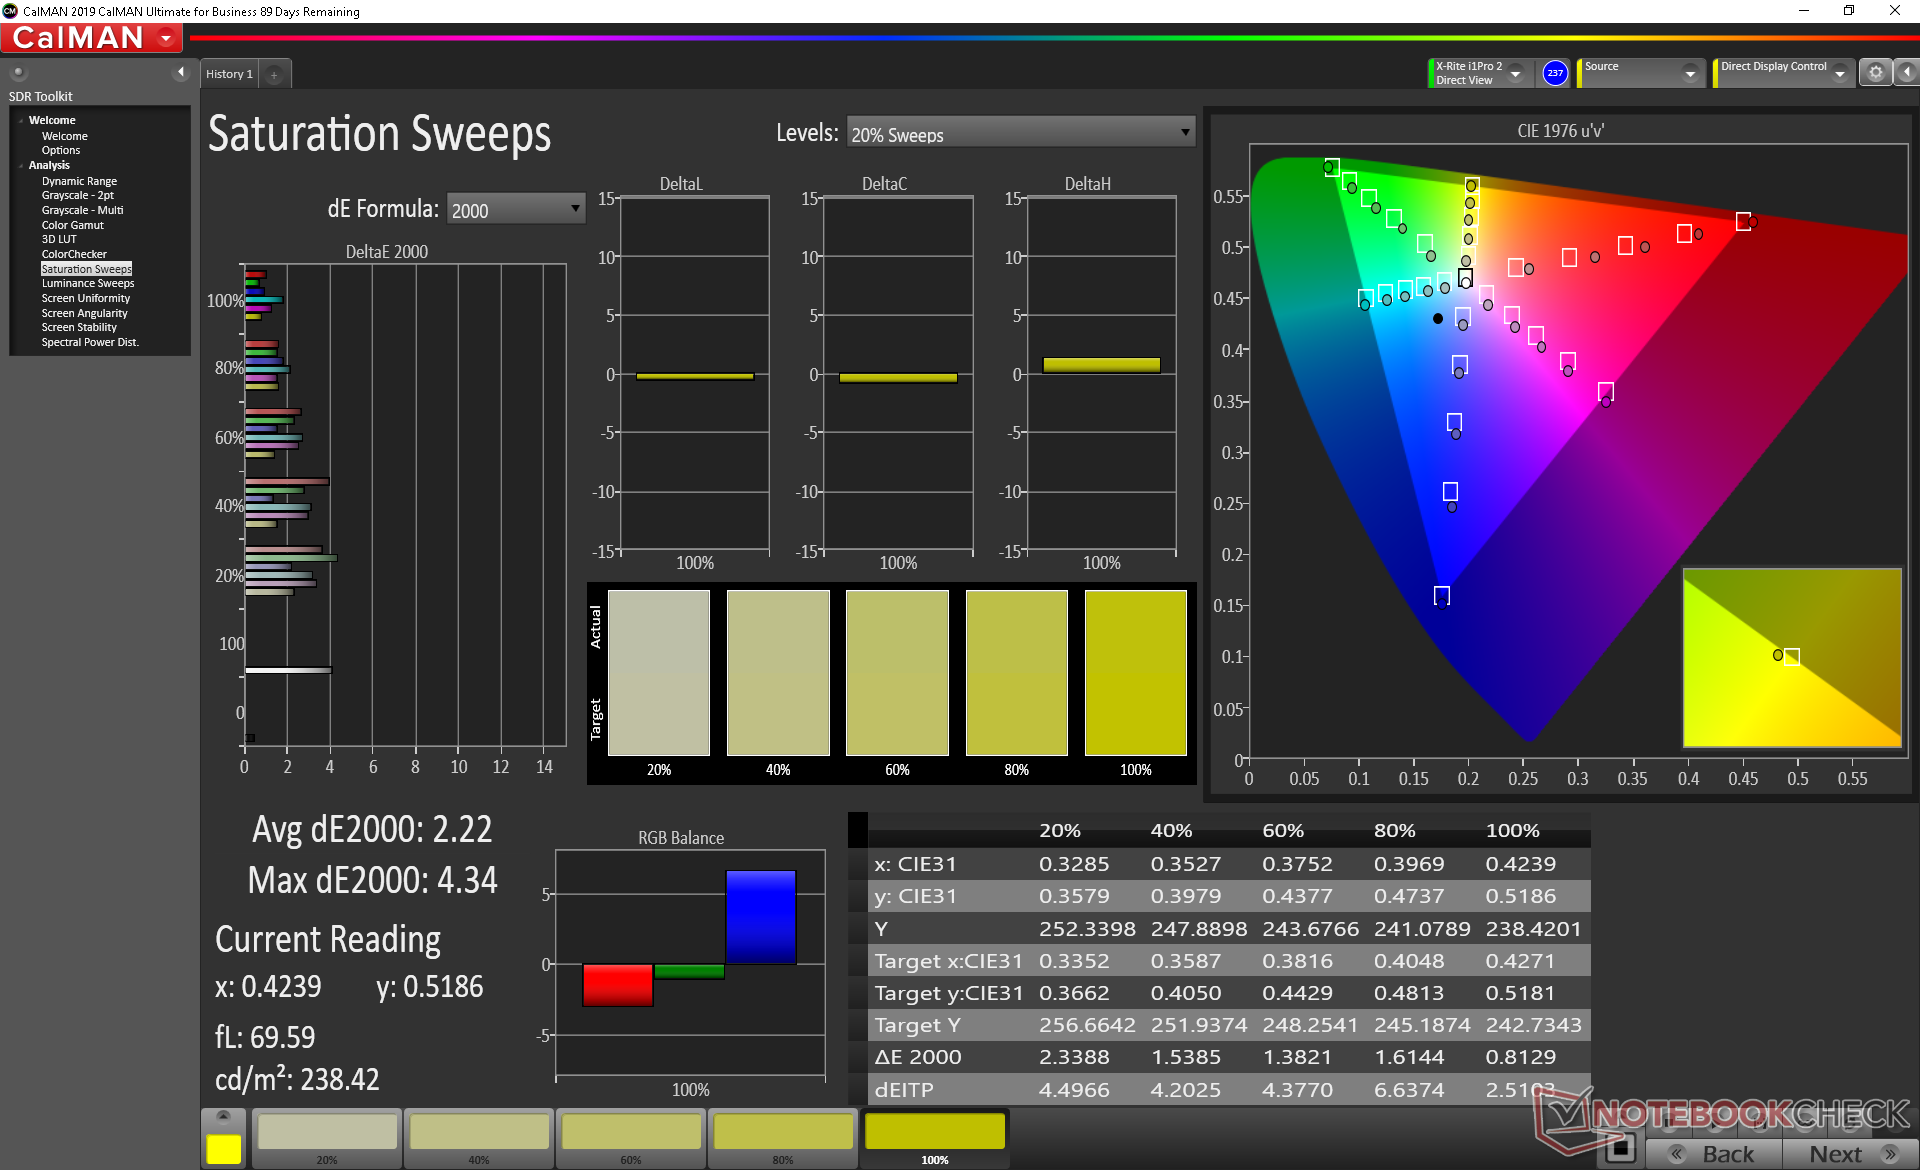
El espacio de color cubre todo el sRGB y aproximadamente el 87 por ciento del espacio 3D de AdobeRGB que es estándar para la mayoría de los paneles 4K UHD. Las opciones de FHD menor típicamente cubren alrededor del 60 por ciento de AdobeRGB solamente.
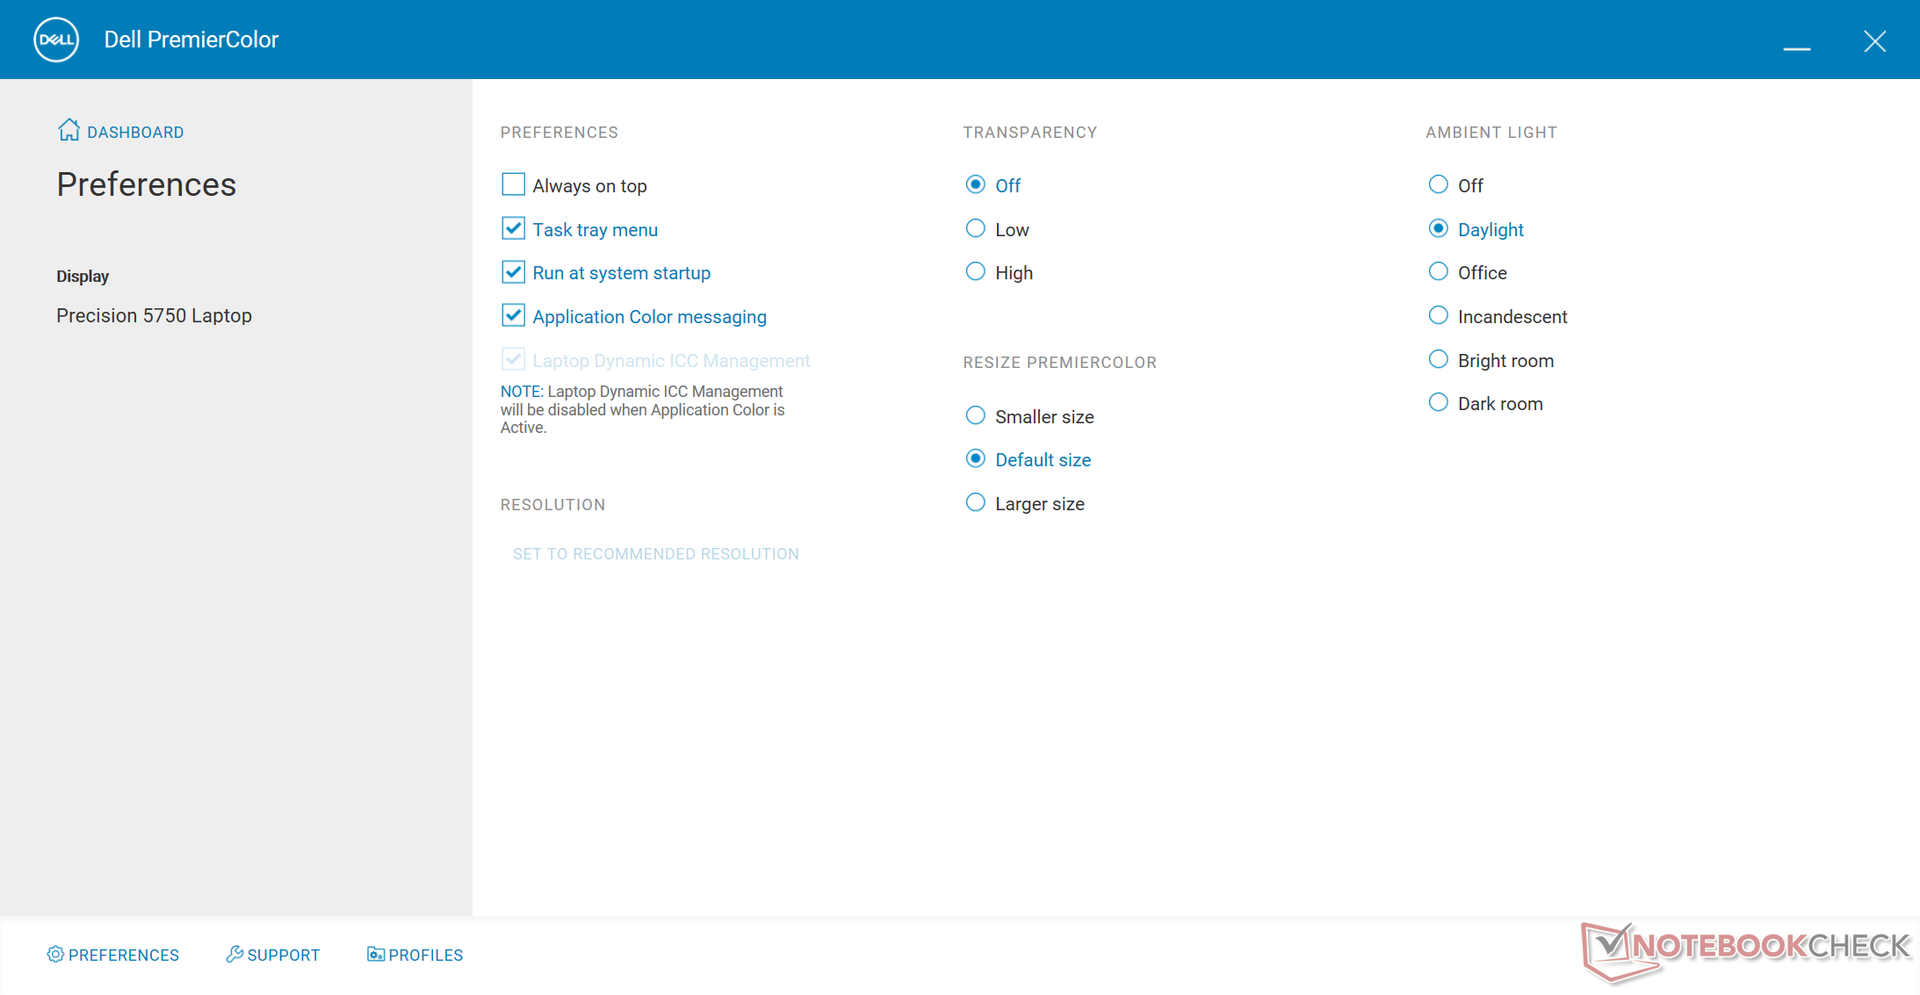
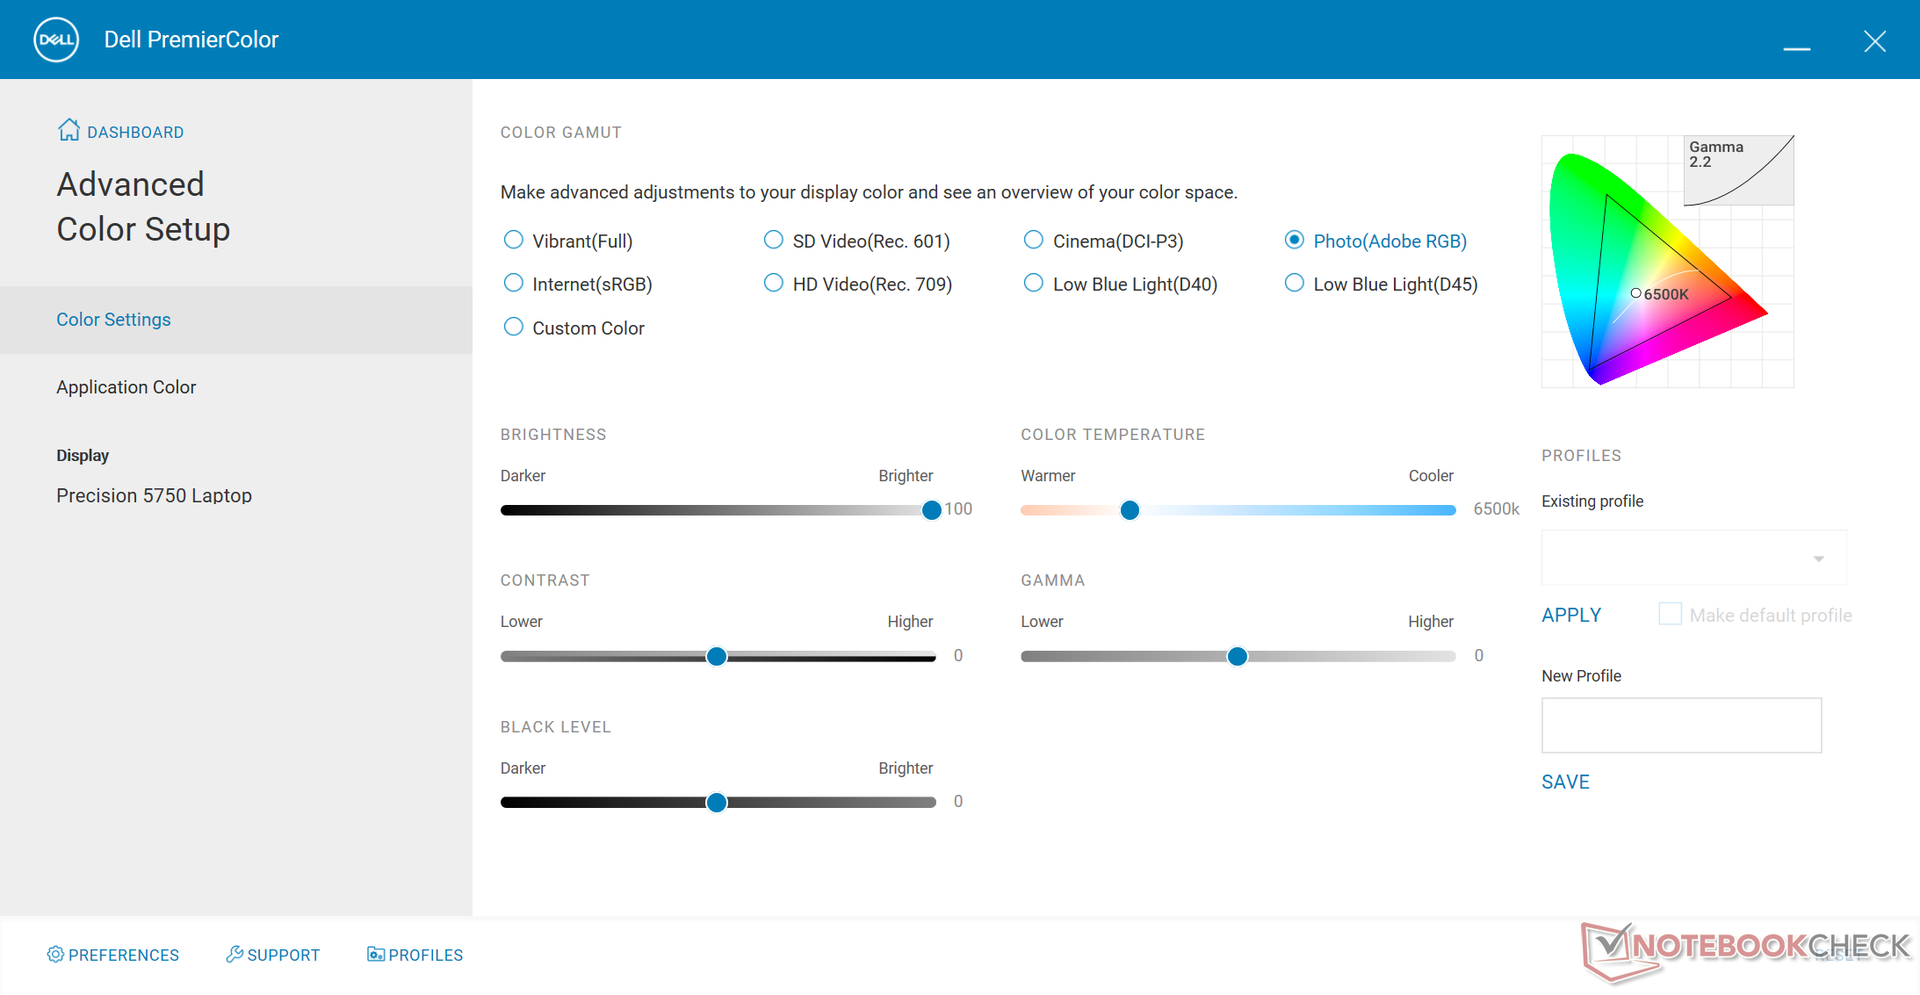
Las mediciones de X-Rite muestran una pantalla calibrada decentemente fuera de la caja. Calibrar el panel más allá nosotros mismos mejoraría los colores y el equilibrio RGB, pero sólo por pequeños márgenes.

Tiempos de respuesta del display
| ↔ Tiempo de respuesta de Negro a Blanco | ||
|---|---|---|
| 34 ms ... subida ↗ y bajada ↘ combinada | ↗ 20 ms subida | 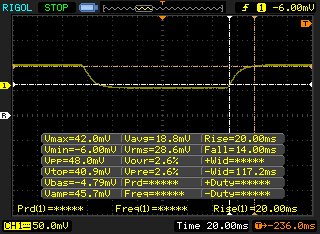 |
| ↘ 14 ms bajada | ||
| La pantalla mostró tiempos de respuesta lentos en nuestros tests y podría ser demasiado lenta para los jugones. En comparación, todos los dispositivos de prueba van de ##min### (mínimo) a 240 (máximo) ms. » 91 % de todos los dispositivos son mejores. Eso quiere decir que el tiempo de respuesta es peor que la media (19.8 ms) de todos los dispositivos testados. | ||
| ↔ Tiempo de respuesta 50% Gris a 80% Gris | ||
| 41.2 ms ... subida ↗ y bajada ↘ combinada | ↗ 18.4 ms subida | 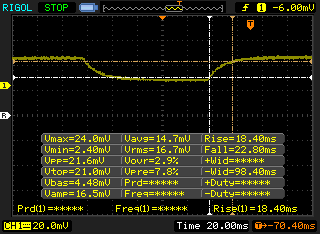 |
| ↘ 22.8 ms bajada | ||
| La pantalla mostró tiempos de respuesta lentos en nuestros tests y podría ser demasiado lenta para los jugones. En comparación, todos los dispositivos de prueba van de ##min### (mínimo) a 636 (máximo) ms. » 66 % de todos los dispositivos son mejores. Eso quiere decir que el tiempo de respuesta es peor que la media (31 ms) de todos los dispositivos testados. | ||
Parpadeo de Pantalla / PWM (Pulse-Width Modulation)
| Parpadeo de Pantalla / PWM no detectado | 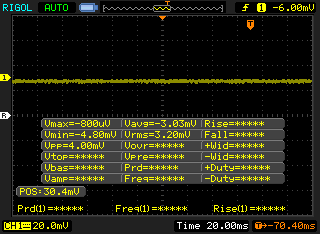 | ||
Comparación: 52 % de todos los dispositivos testados no usaron PWM para atenuar el display. Si se usó, medimos una media de 7769 (mínimo: 5 - máxmo: 343500) Hz. | |||
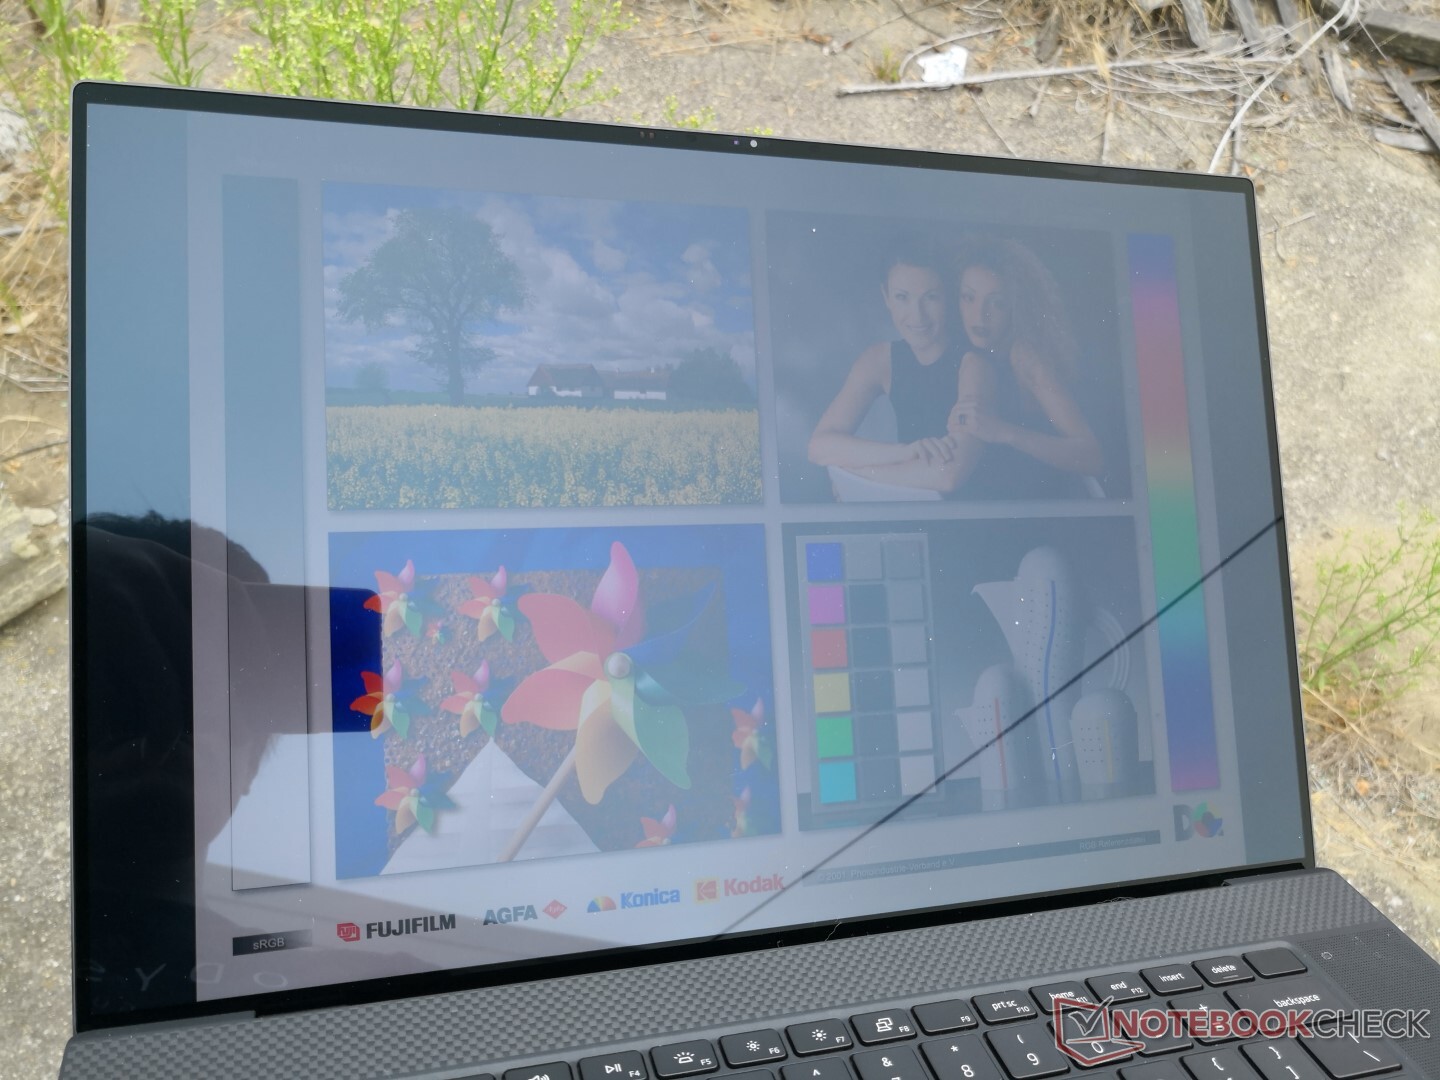
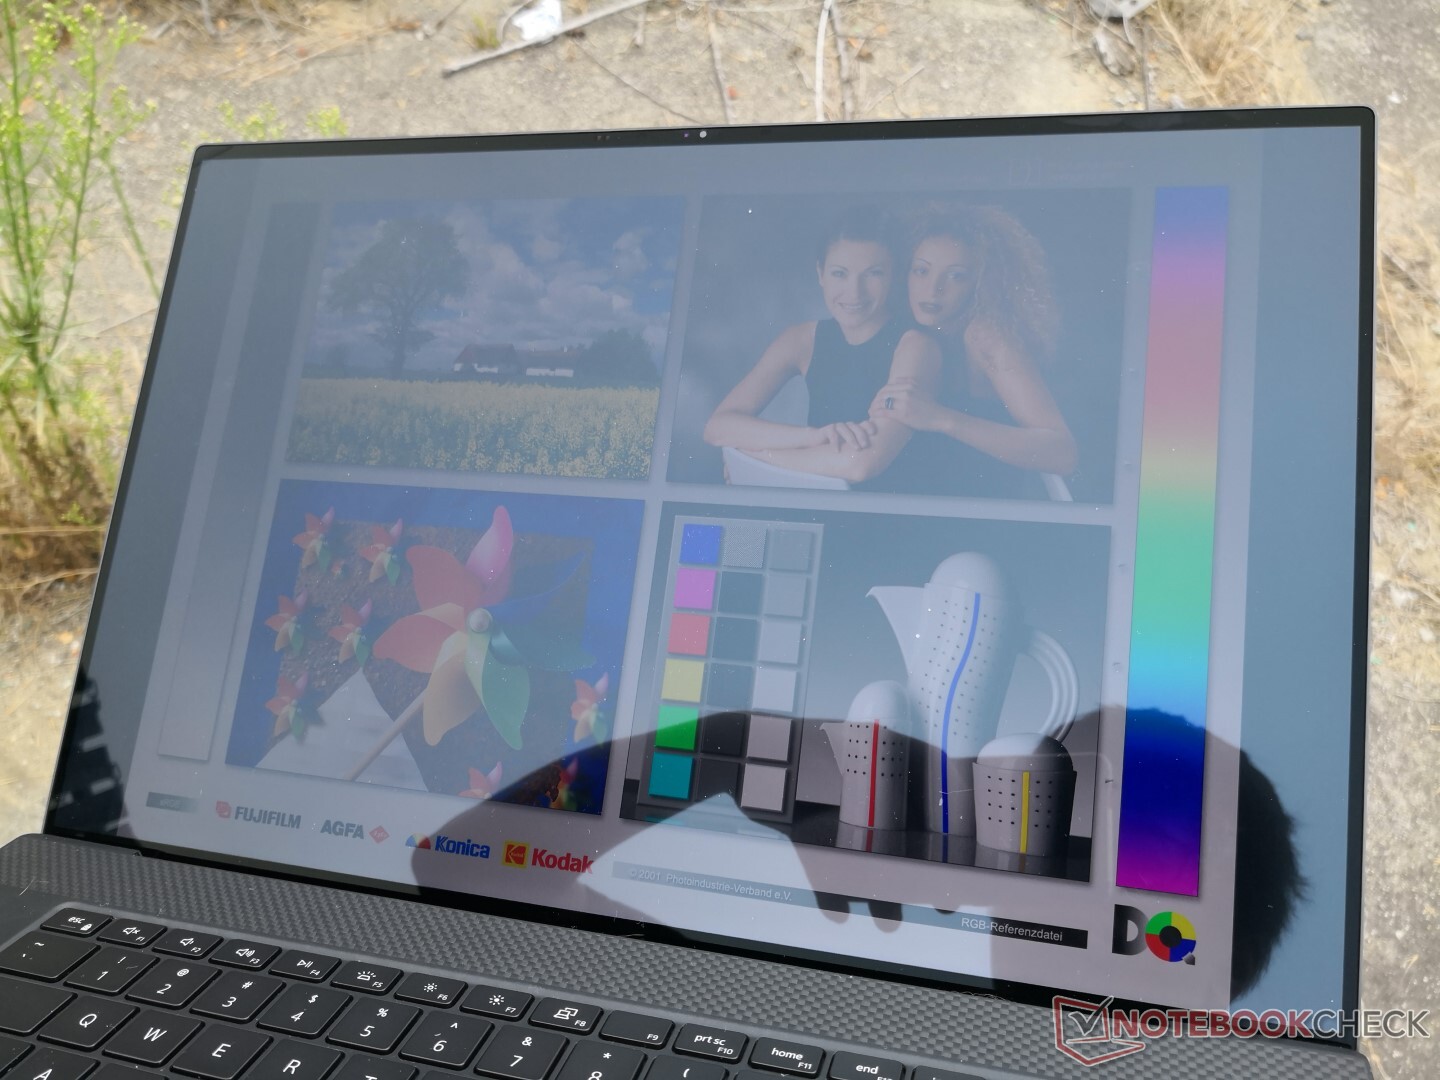
La visibilidad exterior es mejor que la de muchas otras estaciones de trabajo de 17 pulgadas debido a la luz de fondo más brillante. Sin embargo, el resplandor del panel brillante anula gran parte de esa ventaja. Los usuarios no pueden configurar simultáneamente el UHD mate y el 4K.
Rendimiento
Hay muchas opciones de CPU, incluyendo el Core i5-10400H, i7-10750H, i7-10850H, i7-10875H, i9-10885H, Xeon W-10855M, y Xeon W-10885M. Los usuarios que deseen soporte para vPro deben evitar el i7-10750H mientras que los usuarios que deseen soporte para RAM ECC deben considerar sólo las opciones Xeon.
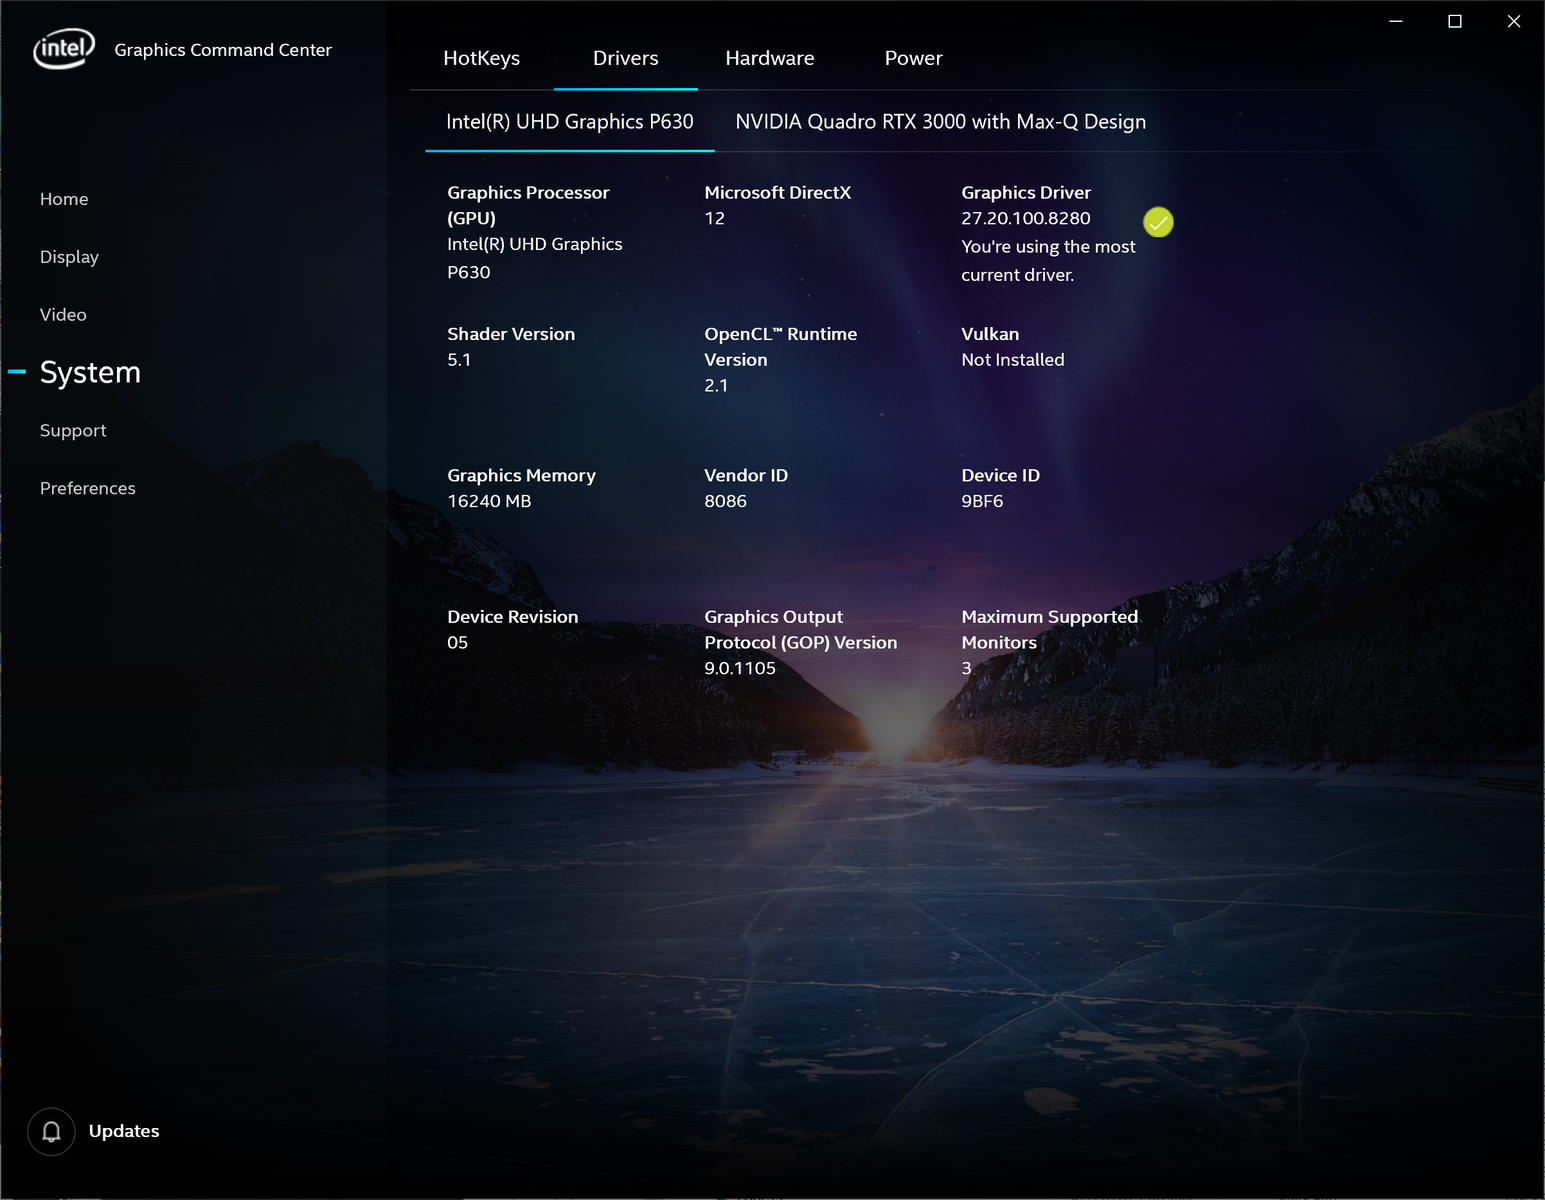
Las opciones gráficas incluyen sólo la gráfica integrada UHD 630 o la Quadro T2000 o Quadro RTX 3000 Max-Q con Optimus. La RAM puede ser configurada hasta 64 GB o sólo la mitad si se configura con ECC en su lugar.
A continuación, hemos ejecutado todos los puntos de referencia de rendimiento en el modo Ultra Performance de Dell para obtener las mejores puntuaciones posibles.
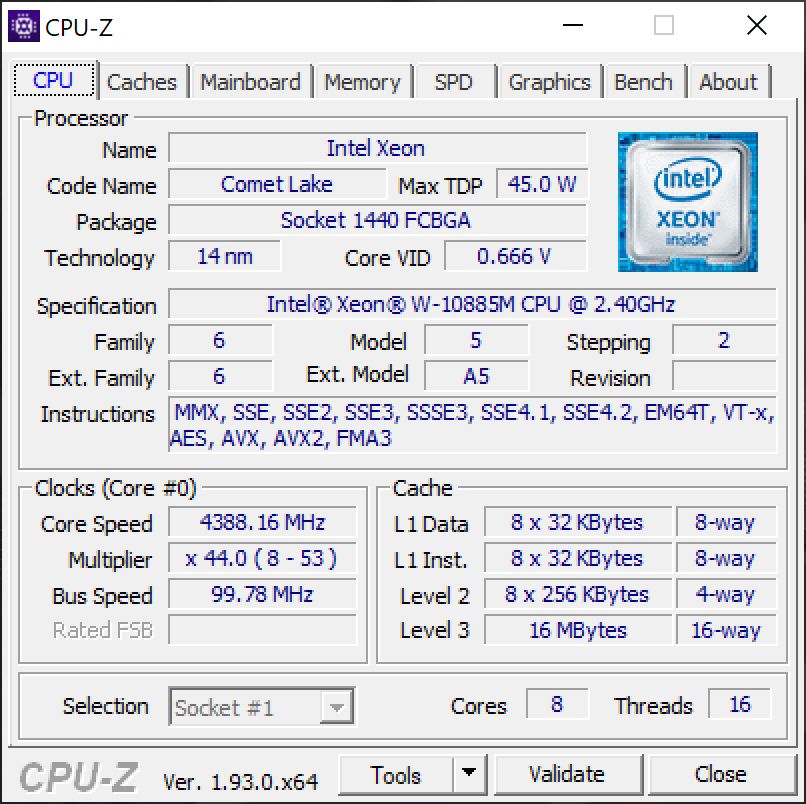

Procesador
El Xeon W-10885M en nuestras unidades de prueba de precisión 5750 y 7550 devuelve resultados similares al Core i9-10980HK en el MSI WS66. Ciertos portátiles con el Core i9 son capaces de funcionar más rápido como el Alienware m17 R3 de Dell, pero la diferencia es sólo de alrededor del 12 por ciento. Podemos observar una caída del rendimiento de alrededor del 9 por ciento a lo largo del tiempo cuando se ejecuta el CineBench R15 xT en un bucle debido a las limitaciones del sistema de refrigeración superpuesto.
Consulte nuestra página dedicada al Xeon W-10885M para obtener más información técnica y comparaciones de referencia. La actualización de la opción base de cuatro núcleos i5-10400H a nuestro Xeon W de ocho núcleos permitirá un rendimiento multihilo un 90 por ciento más rápido.
Cinebench R15: CPU Multi 64Bit | CPU Single 64Bit
Blender: v2.79 BMW27 CPU
7-Zip 18.03: 7z b 4 -mmt1 | 7z b 4
Geekbench 5.5: Single-Core | Multi-Core
HWBOT x265 Benchmark v2.2: 4k Preset
LibreOffice : 20 Documents To PDF
R Benchmark 2.5: Overall mean
| HWBOT x265 Benchmark v2.2 / 4k Preset | |
| Corsair One i160 | |
| Dell Precision 5000 5750 P92F | |
| Eluktronics RP-17 | |
| MSI WS66 10TMT-207US | |
| Medio Intel Xeon W-10885M (8.89 - 13.6, n=3) | |
| Dell Precision 5550 P91F | |
| MSI GS66 Stealth 10SE-045 | |
| Dell Precision 7730 | |
| Lenovo ThinkPad P73-20QR002DGE | |
| Acer ConceptD 3 Pro CN315-71P-73W1 | |
| Dell XPS 15 9500 Core i5 | |
| LibreOffice / 20 Documents To PDF | |
| Dell XPS 15 9500 Core i5 | |
| MSI GS66 Stealth 10SE-045 | |
| Eluktronics RP-17 | |
| Acer ConceptD 9 Pro | |
| Acer ConceptD 3 Pro CN315-71P-73W1 | |
| Medio Intel Xeon W-10885M (44.4 - 58.1, n=3) | |
| Dell Precision 5000 5750 P92F | |
| MSI WS66 10TMT-207US | |
| Dell Precision 5550 P91F | |
| R Benchmark 2.5 / Overall mean | |
| Acer ConceptD 3 Pro CN315-71P-73W1 | |
| Dell XPS 15 9500 Core i5 | |
| MSI GS66 Stealth 10SE-045 | |
| Dell Precision 5550 P91F | |
| Eluktronics RP-17 | |
| MSI WS66 10TMT-207US | |
| Dell Precision 5000 5750 P92F | |
| Medio Intel Xeon W-10885M (0.551 - 0.57, n=3) | |
* ... más pequeño es mejor
Rendimiento del sistema
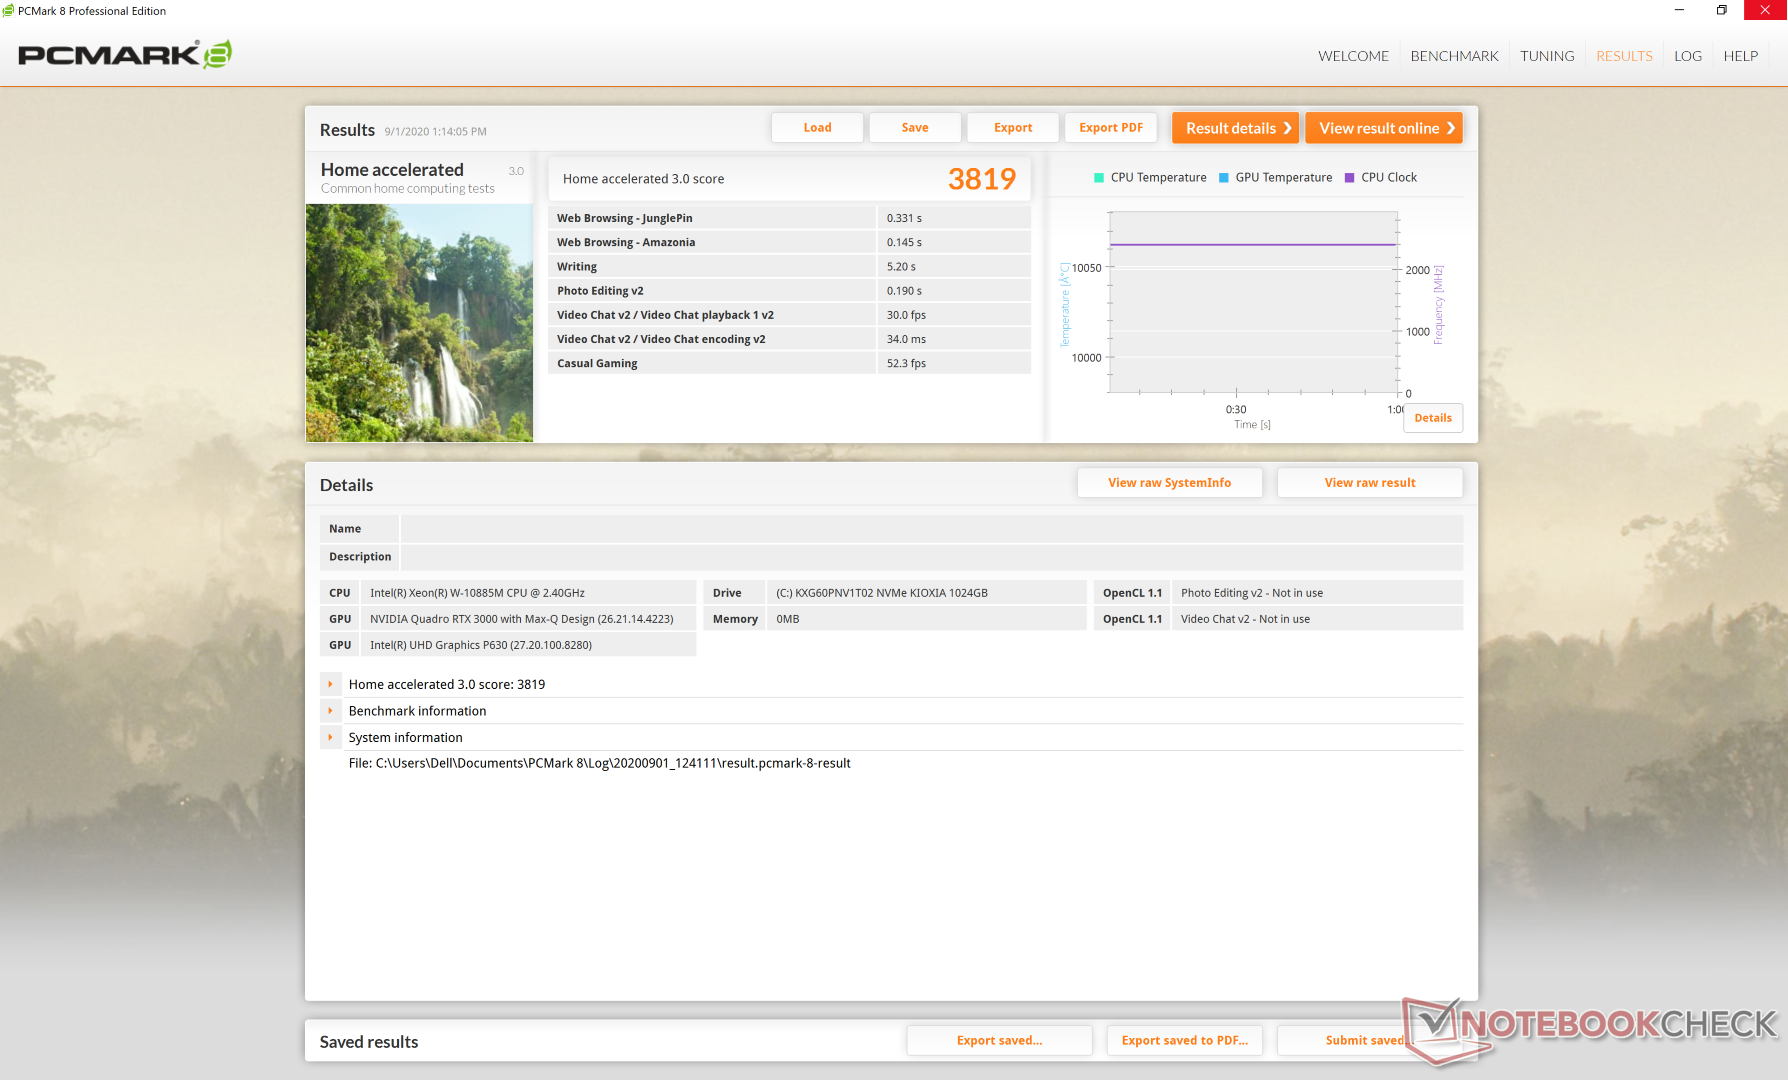
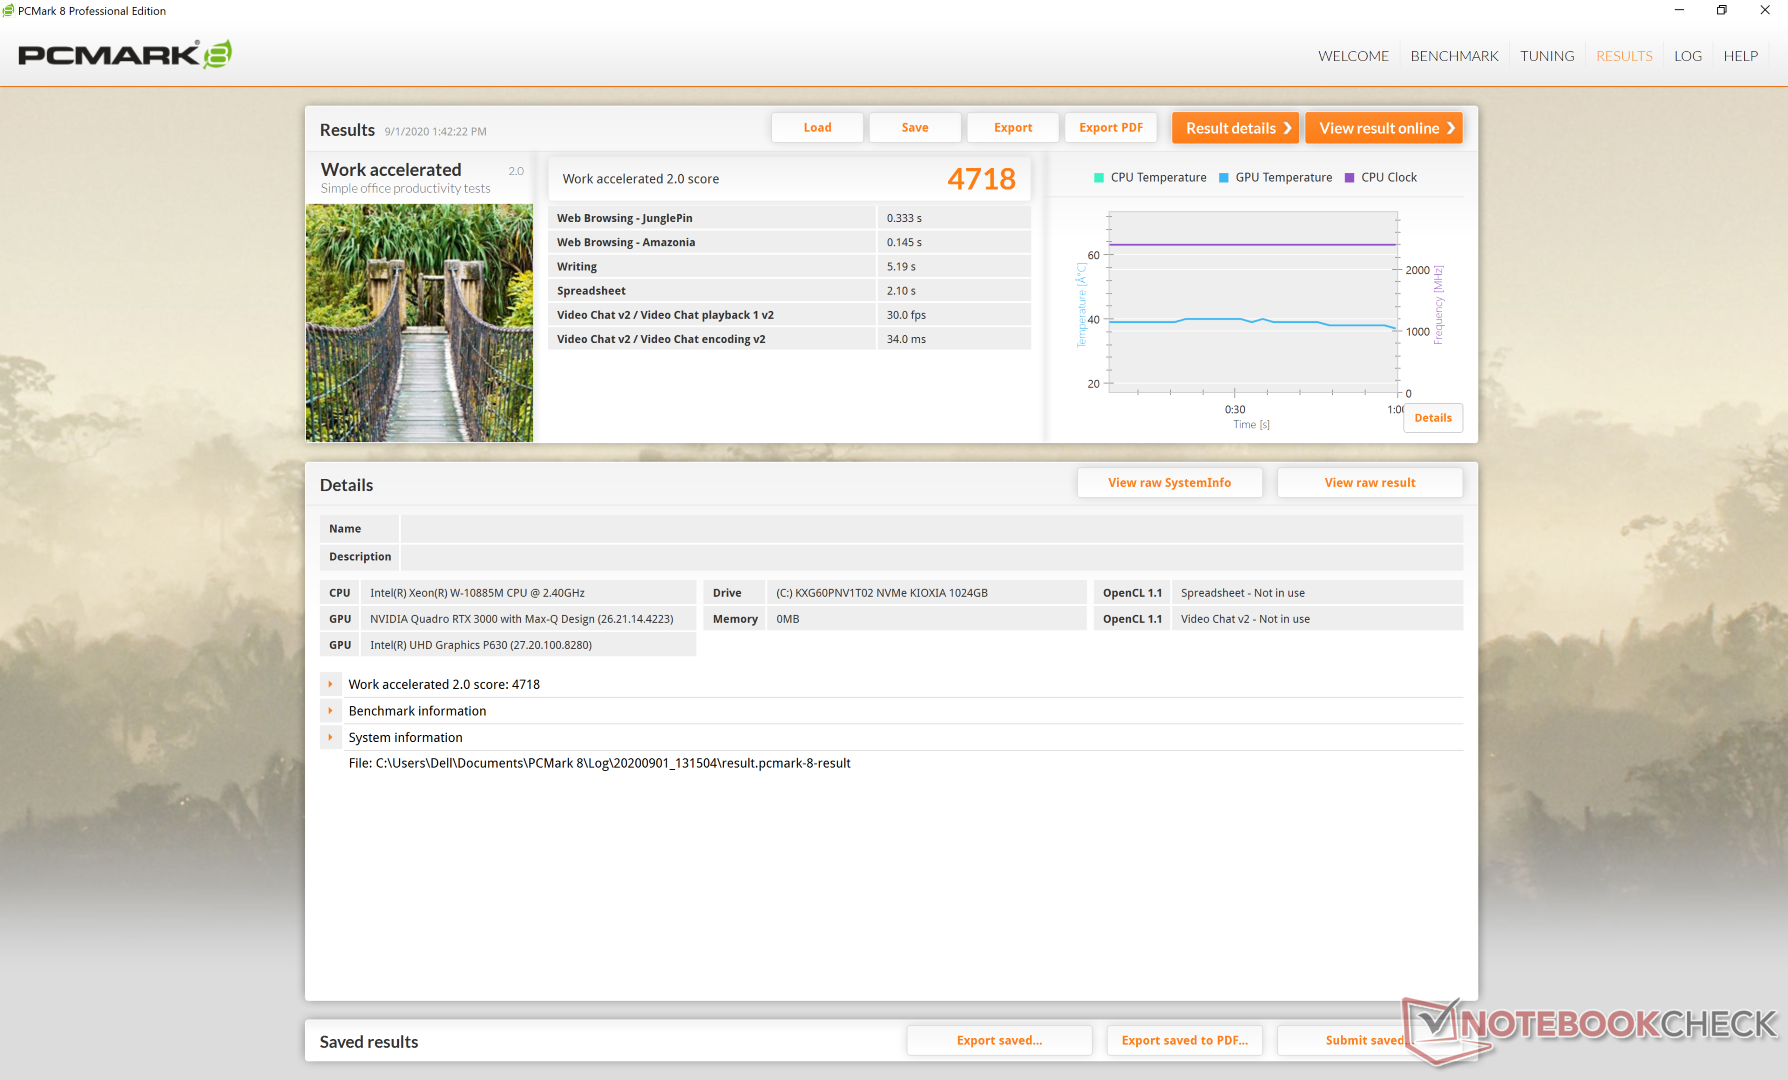
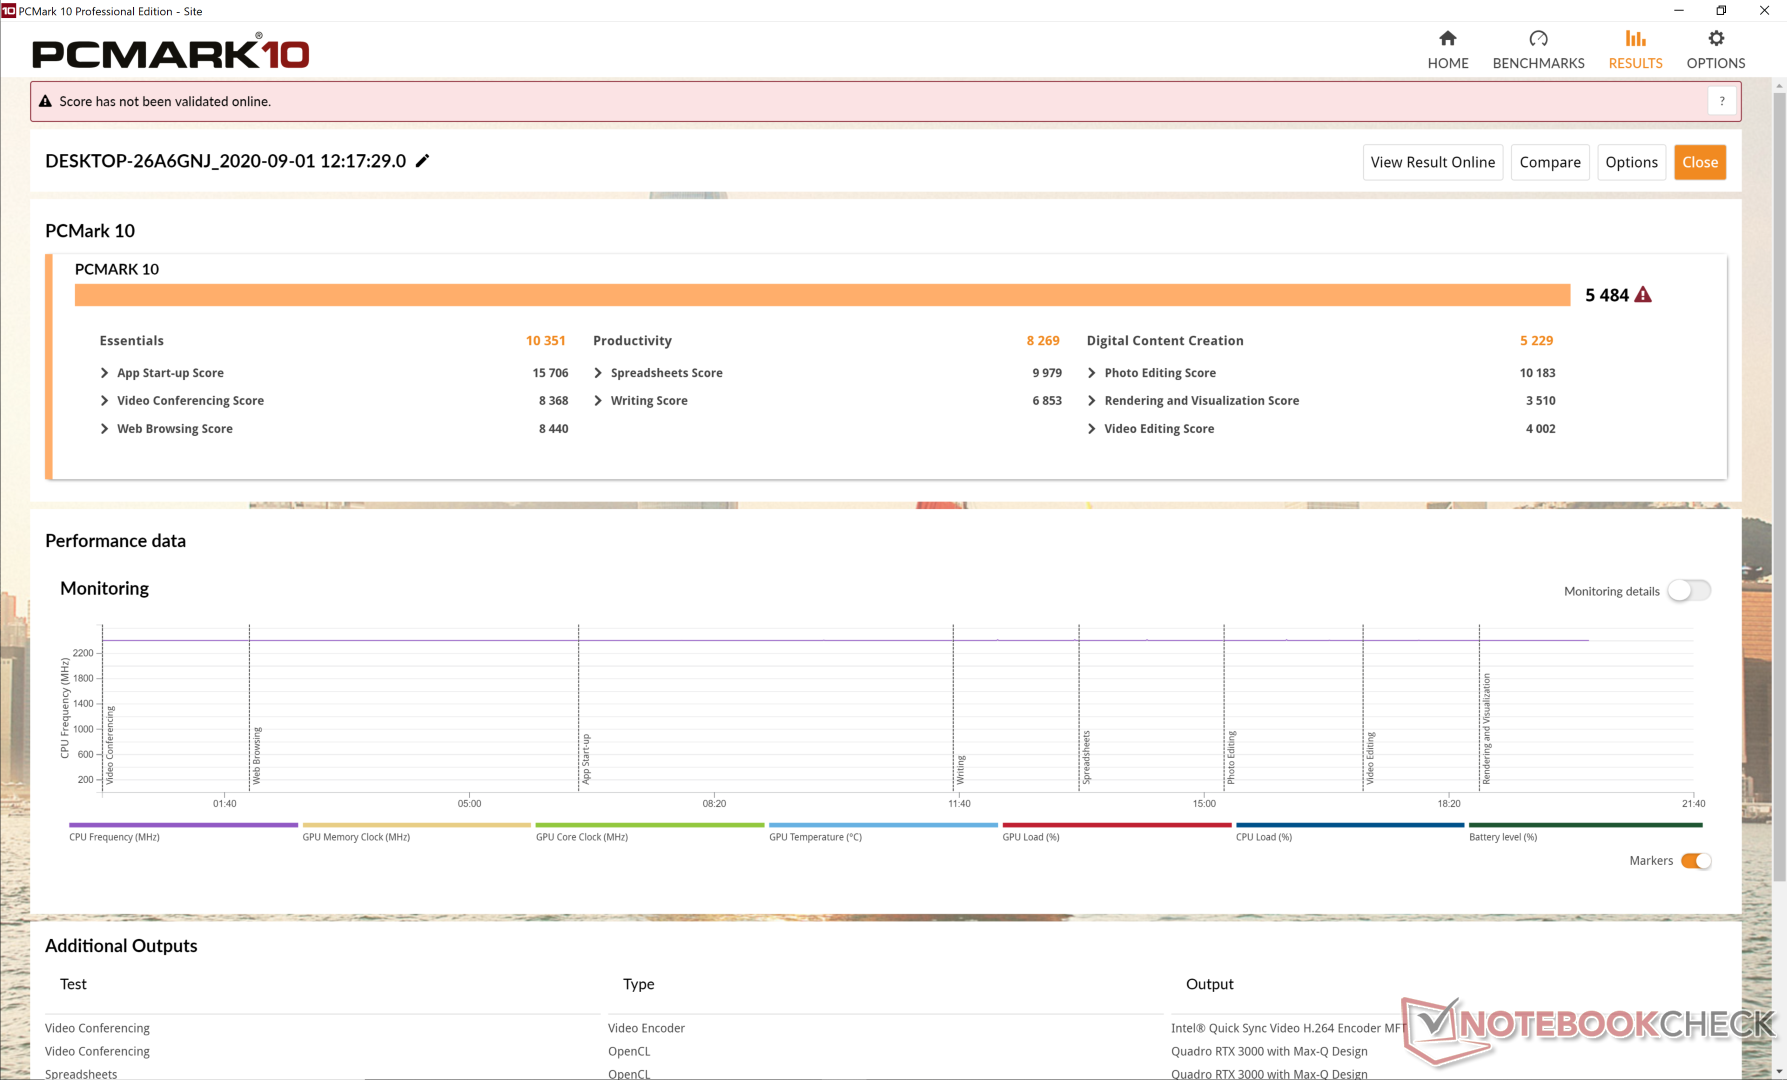
| PCMark 8 Home Score Accelerated v2 | 3819 puntos | |
| PCMark 8 Work Score Accelerated v2 | 4718 puntos | |
| PCMark 10 Score | 5484 puntos | |
ayuda | ||
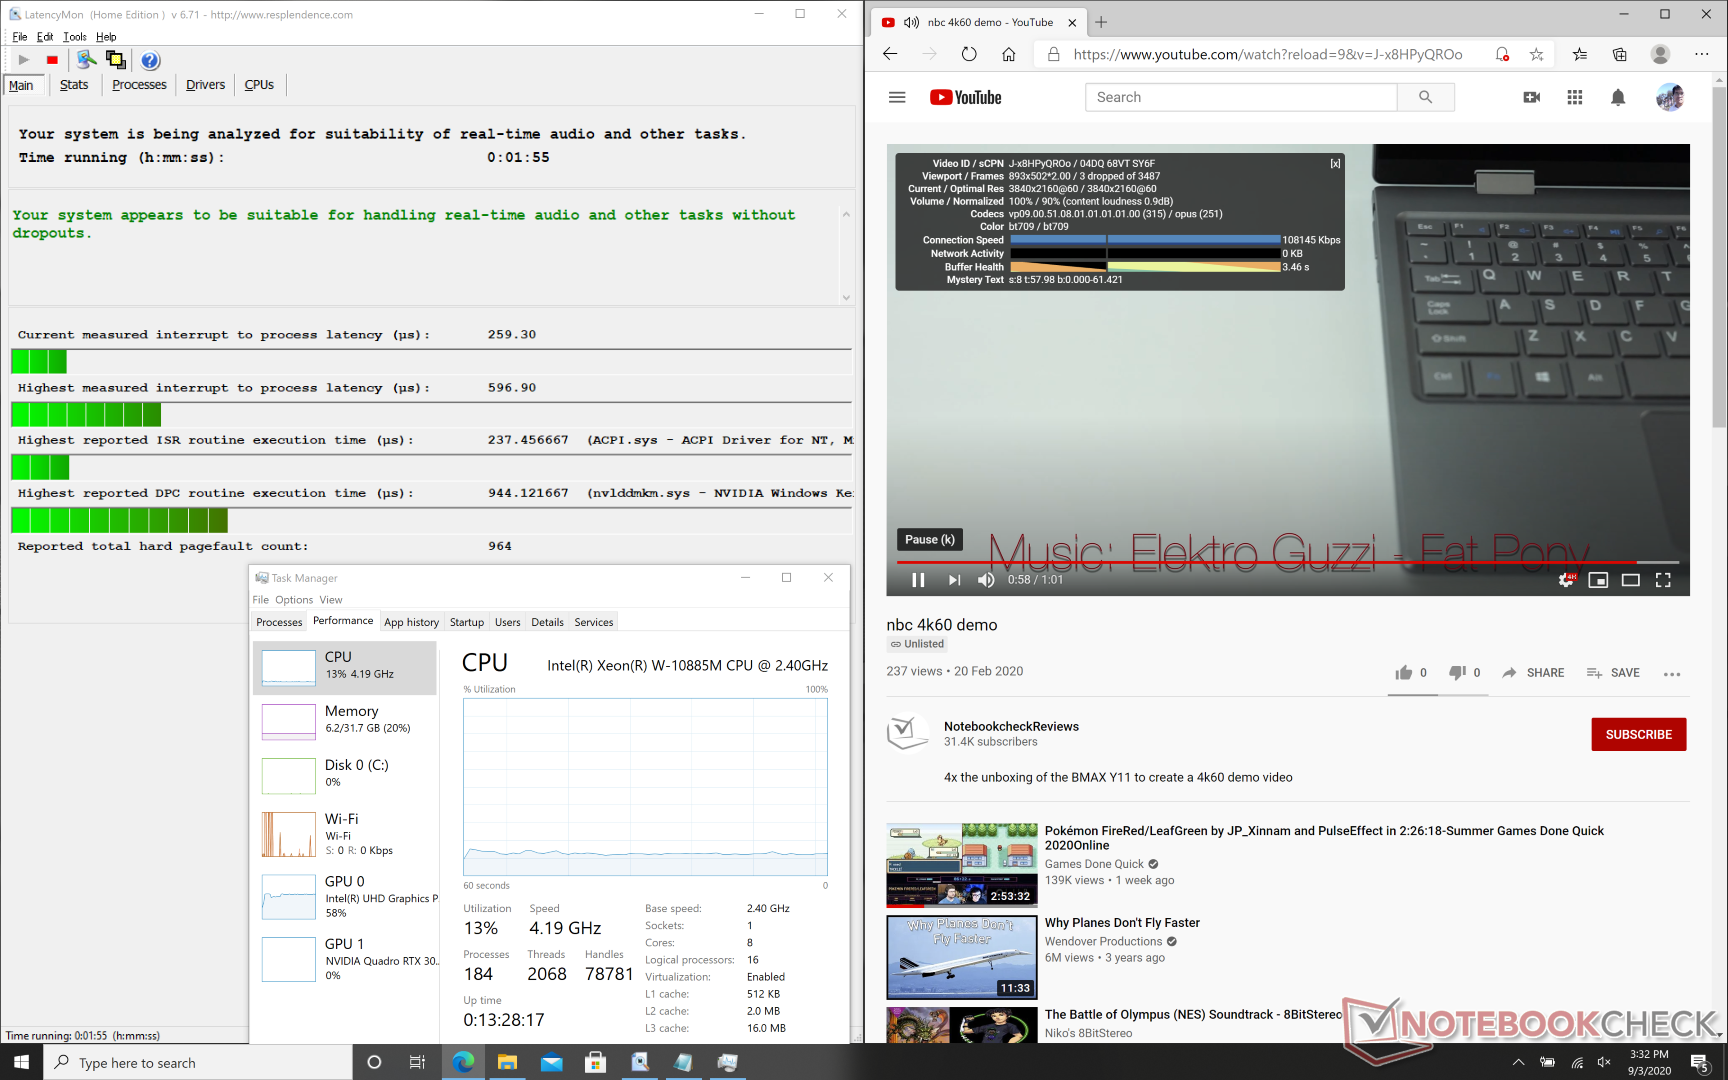
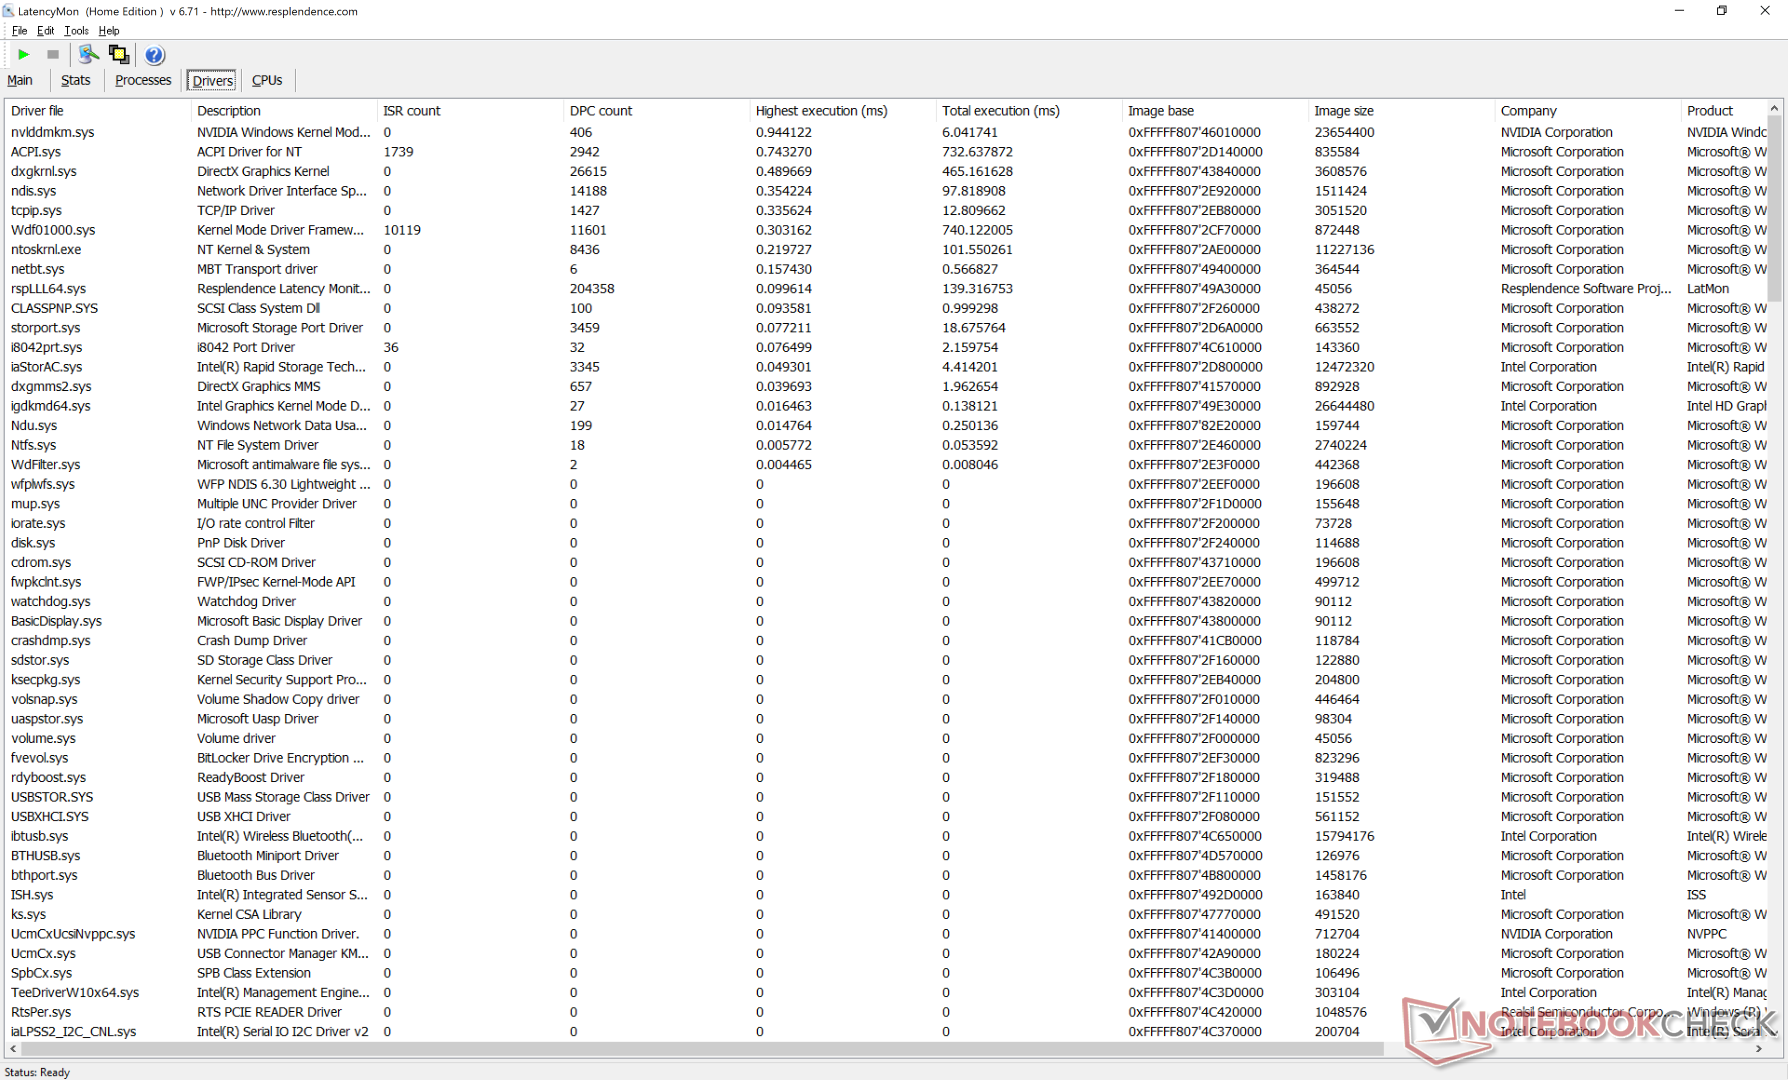
Latencia del DPC
LatencyMon no muestra grandes problemas de latencia DPC en contraste con lo que observamos en el Precision 7550. Curiosamente, grabamos tres fotogramas de caída durante nuestra prueba de vídeo de 4K60 de un minuto de duración.
| DPC Latencies / LatencyMon - interrupt to process latency (max), Web, Youtube, Prime95 | |
| Dell Precision 7550 | |
| MSI WS66 10TMT-207US | |
| Eluktronics RP-17 | |
| Acer ConceptD 3 Pro CN315-71P-73W1 | |
| Acer ConceptD 9 Pro | |
| Razer Blade 15 Studio Edition 2020 | |
| Dell Precision 5000 5750 P92F | |
| Dell Precision 5550 P91F | |
* ... más pequeño es mejor
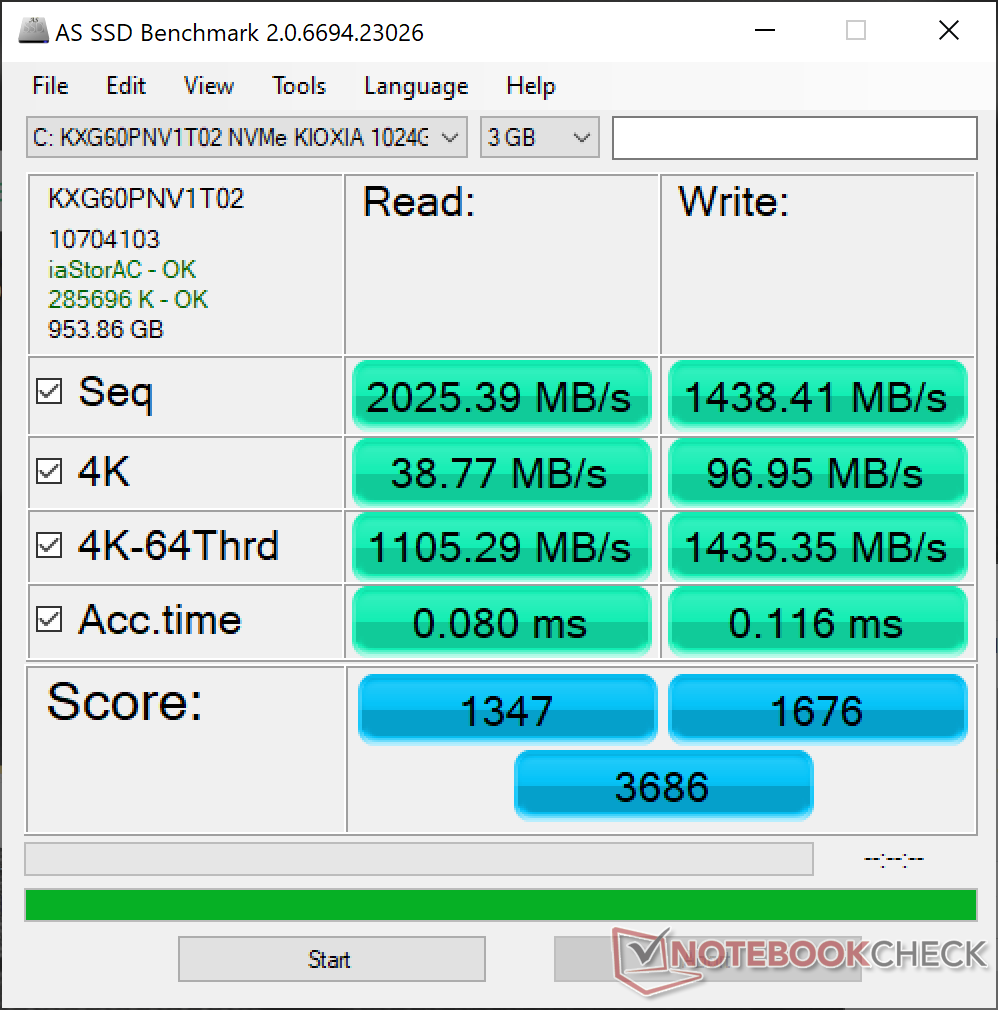
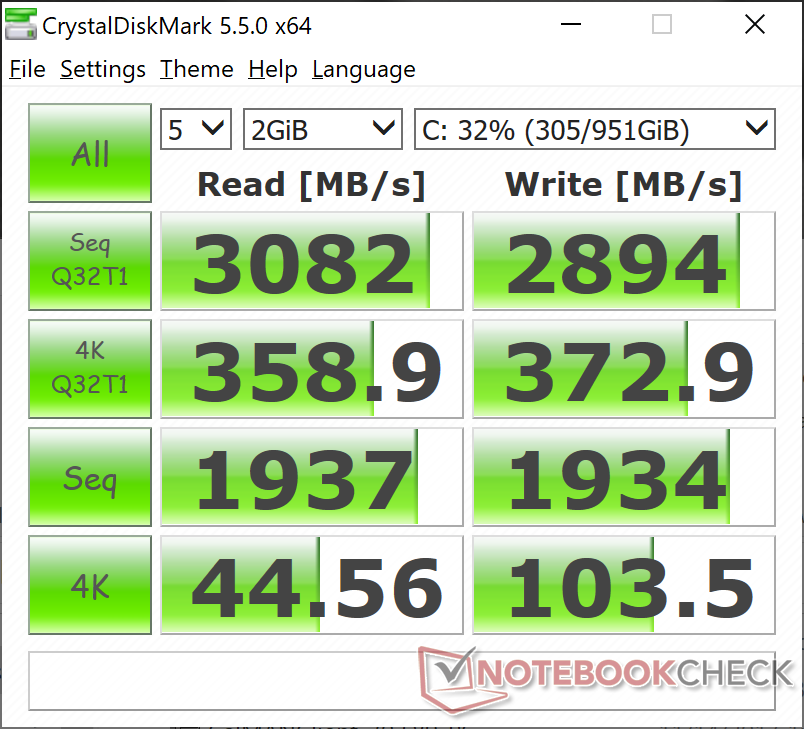
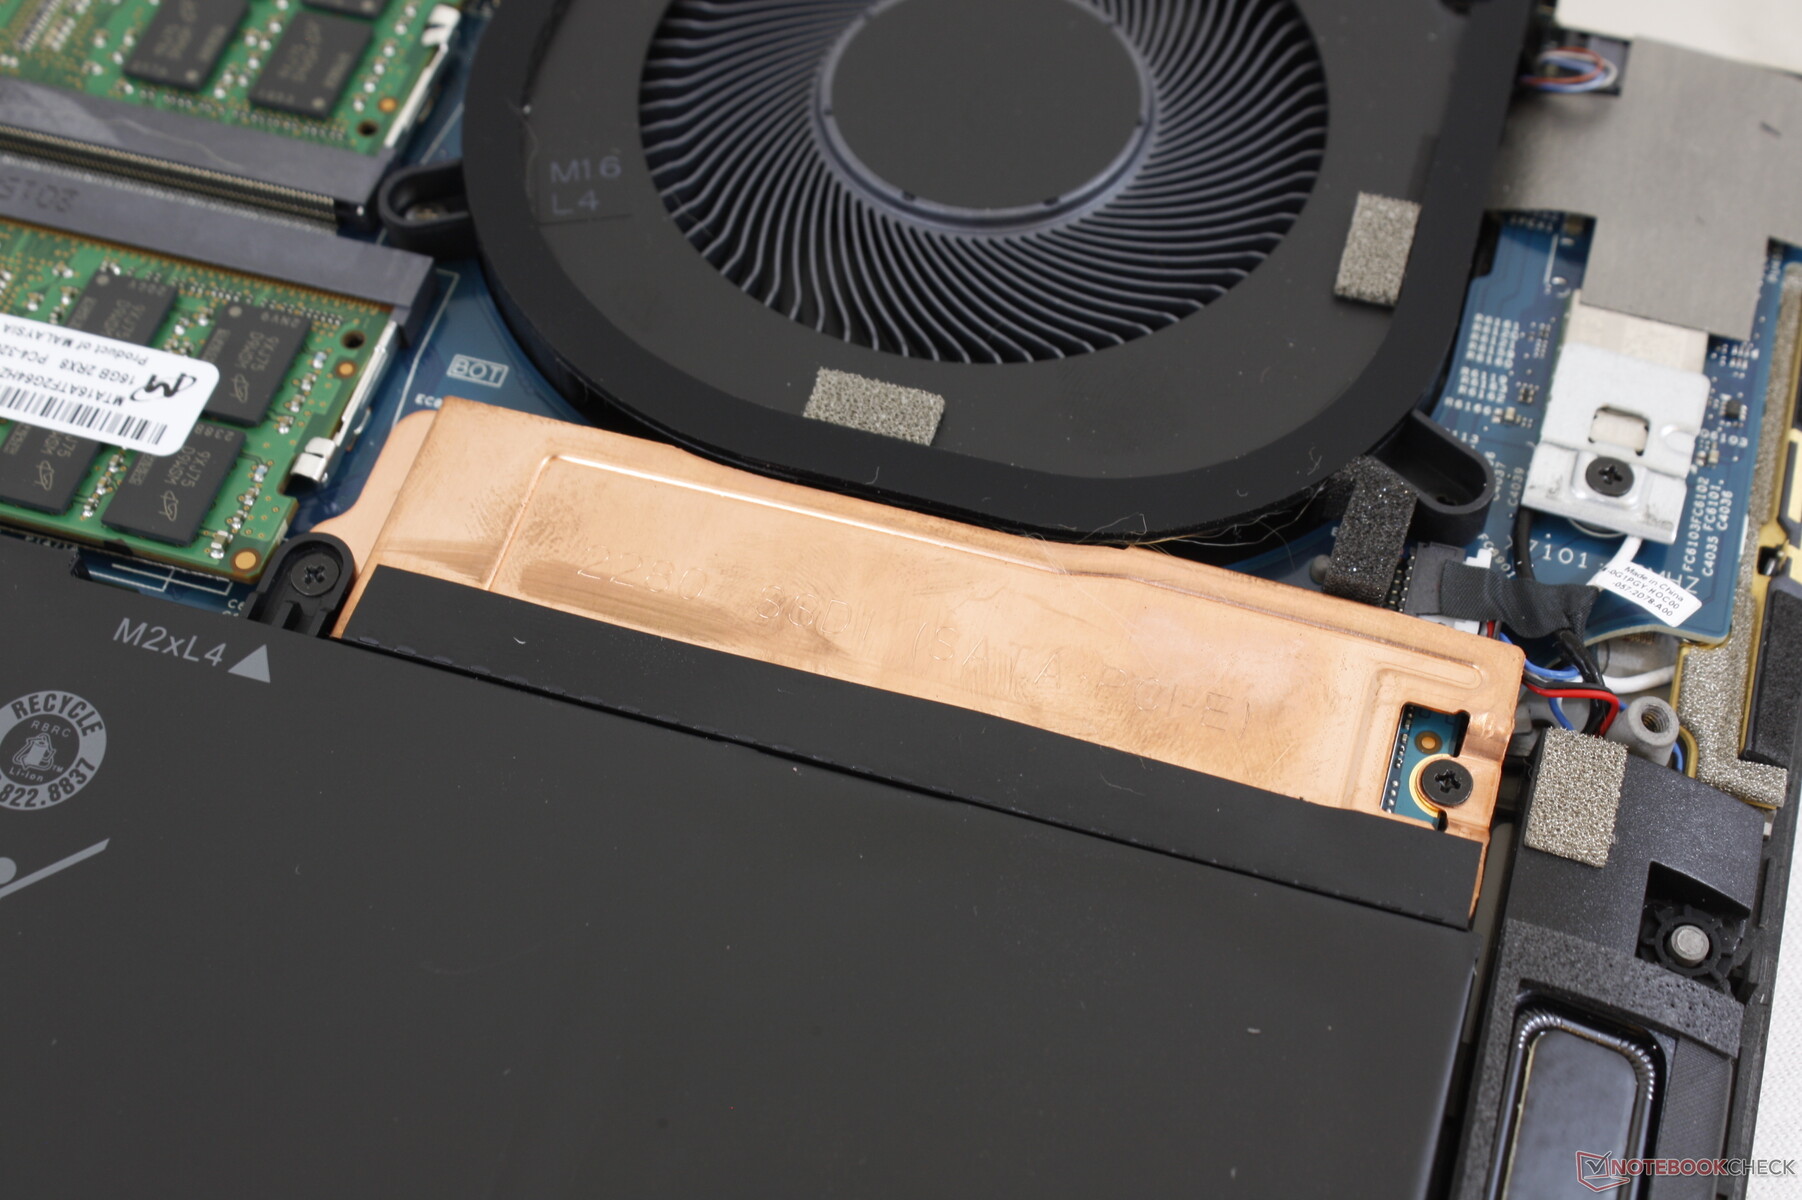
Dispositivos de almacenamiento
Nuestra unidad viene con un Toshiba Kioxia XG6 en lugar del Micron 2200S de nuestro XPS 17. A diferencia de la serie Razer Blade Studio que utiliza casi exclusivamente SSDs de Samsung, es más difícil saber qué se enviará con su Dell Precision ya que a Dell le gusta abastecerse de un puñado de fabricantes. Sin embargo, el Toshiba XG6 sigue siendo un SSD de gama alta con una velocidad de transferencia comparable a la del Samsung PM981.
Consulte nuestra tabla de HDDs ySSDs para obtener más información técnica y comparativa.
| Dell Precision 5000 5750 P92F Toshiba Kioxia XG6 KXG60PNV1T02 | Asus ProArt StudioBook Pro 17 W700G3T Samsung SSD PM981 MZVLB1T0HALR | MSI WS75 9TL-636 Samsung SSD PM981 MZVLB1T0HALR | Dell Precision 7730 Samsung SSD PM981 MZVLB512HAJQ | Lenovo ThinkPad P73-20QR002DGE Intel SSD Pro 7600p SSDPEKKF512G8L | MSI WE75 9TK Samsung SSD PM981 MZVLB512HAJQ | |
|---|---|---|---|---|---|---|
| AS SSD | 44% | 23% | 15% | 3% | 7% | |
| Seq Read (MB/s) | 2025 | 2958 46% | 870 -57% | 2697 33% | 2693 33% | 1308 -35% |
| Seq Write (MB/s) | 1438 | 2350 63% | 2247 56% | 1789 24% | 1542 7% | 1871 30% |
| 4K Read (MB/s) | 38.77 | 56.6 46% | 53.4 38% | 50.5 30% | 62.6 61% | 48.35 25% |
| 4K Write (MB/s) | 96.9 | 106.1 9% | 123.2 27% | 105.9 9% | 149.5 54% | 106.6 10% |
| 4K-64 Read (MB/s) | 1105 | 1836 66% | 1673 51% | 1139 3% | 871 -21% | 1510 37% |
| 4K-64 Write (MB/s) | 1435 | 1789 25% | 1826 27% | 1714 19% | 1006 -30% | 1715 20% |
| Access Time Read * (ms) | 0.08 | 0.061 24% | 0.05 37% | 0.061 24% | 0.058 27% | 0.103 -29% |
| Access Time Write * (ms) | 0.116 | 0.036 69% | 0.033 72% | 0.037 68% | 0.067 42% | 0.106 9% |
| Score Read (Points) | 1347 | 2189 63% | 1813 35% | 1460 8% | 1203 -11% | 1689 25% |
| Score Write (Points) | 1676 | 2130 27% | 2173 30% | 1999 19% | 1309 -22% | 2008 20% |
| Score Total (Points) | 3686 | 5411 47% | 4989 35% | 4168 13% | 3088 -16% | 4594 25% |
| Copy ISO MB/s (MB/s) | 2609 | 3154 21% | 3259 25% | 1716 -34% | 2343 -10% | |
| Copy Program MB/s (MB/s) | 740 | 533 -28% | 435.6 -41% | 542 -27% | 526 -29% | |
| Copy Game MB/s (MB/s) | 1624 | 1349 -17% | 1273 -22% | 1375 -15% | 1506 -7% | |
| CrystalDiskMark 5.2 / 6 | 19% | -1% | -7% | 16% | 19% | |
| Write 4K (MB/s) | 103.5 | 147.6 43% | 103.5 0% | 103.2 0% | 154.3 49% | 135.4 31% |
| Read 4K (MB/s) | 44.56 | 47.57 7% | 41.88 -6% | 41.39 -7% | 66.4 49% | 56.6 27% |
| Write Seq (MB/s) | 1934 | 2222 15% | 1931 0% | 1880 -3% | 1561 -19% | 1972 2% |
| Read Seq (MB/s) | 1937 | 2543 31% | 1286 -34% | 2350 21% | 2460 27% | 2101 8% |
| Write 4K Q32T1 (MB/s) | 372.9 | 459.2 23% | 414.3 11% | 282.3 -24% | 438 17% | 527 41% |
| Read 4K Q32T1 (MB/s) | 358.9 | 515 43% | 470.2 31% | 314.3 -12% | 568 58% | 578 61% |
| Write Seq Q32T1 (MB/s) | 2894 | 2167 -25% | 2393 -17% | 1881 -35% | 1581 -45% | 1985 -31% |
| Read Seq Q32T1 (MB/s) | 3082 | 3430 11% | 3425 11% | 3216 4% | 2724 -12% | 3358 9% |
| Write 4K Q8T8 (MB/s) | 1484 | 1000 | ||||
| Read 4K Q8T8 (MB/s) | 1536 | 928 | ||||
| Media total (Programa/Opciones) | 32% /
33% | 11% /
15% | 4% /
7% | 10% /
8% | 13% /
11% |
* ... más pequeño es mejor

Estrangulamiento del disco: DiskSpd Read Loop, Queue Depth 8
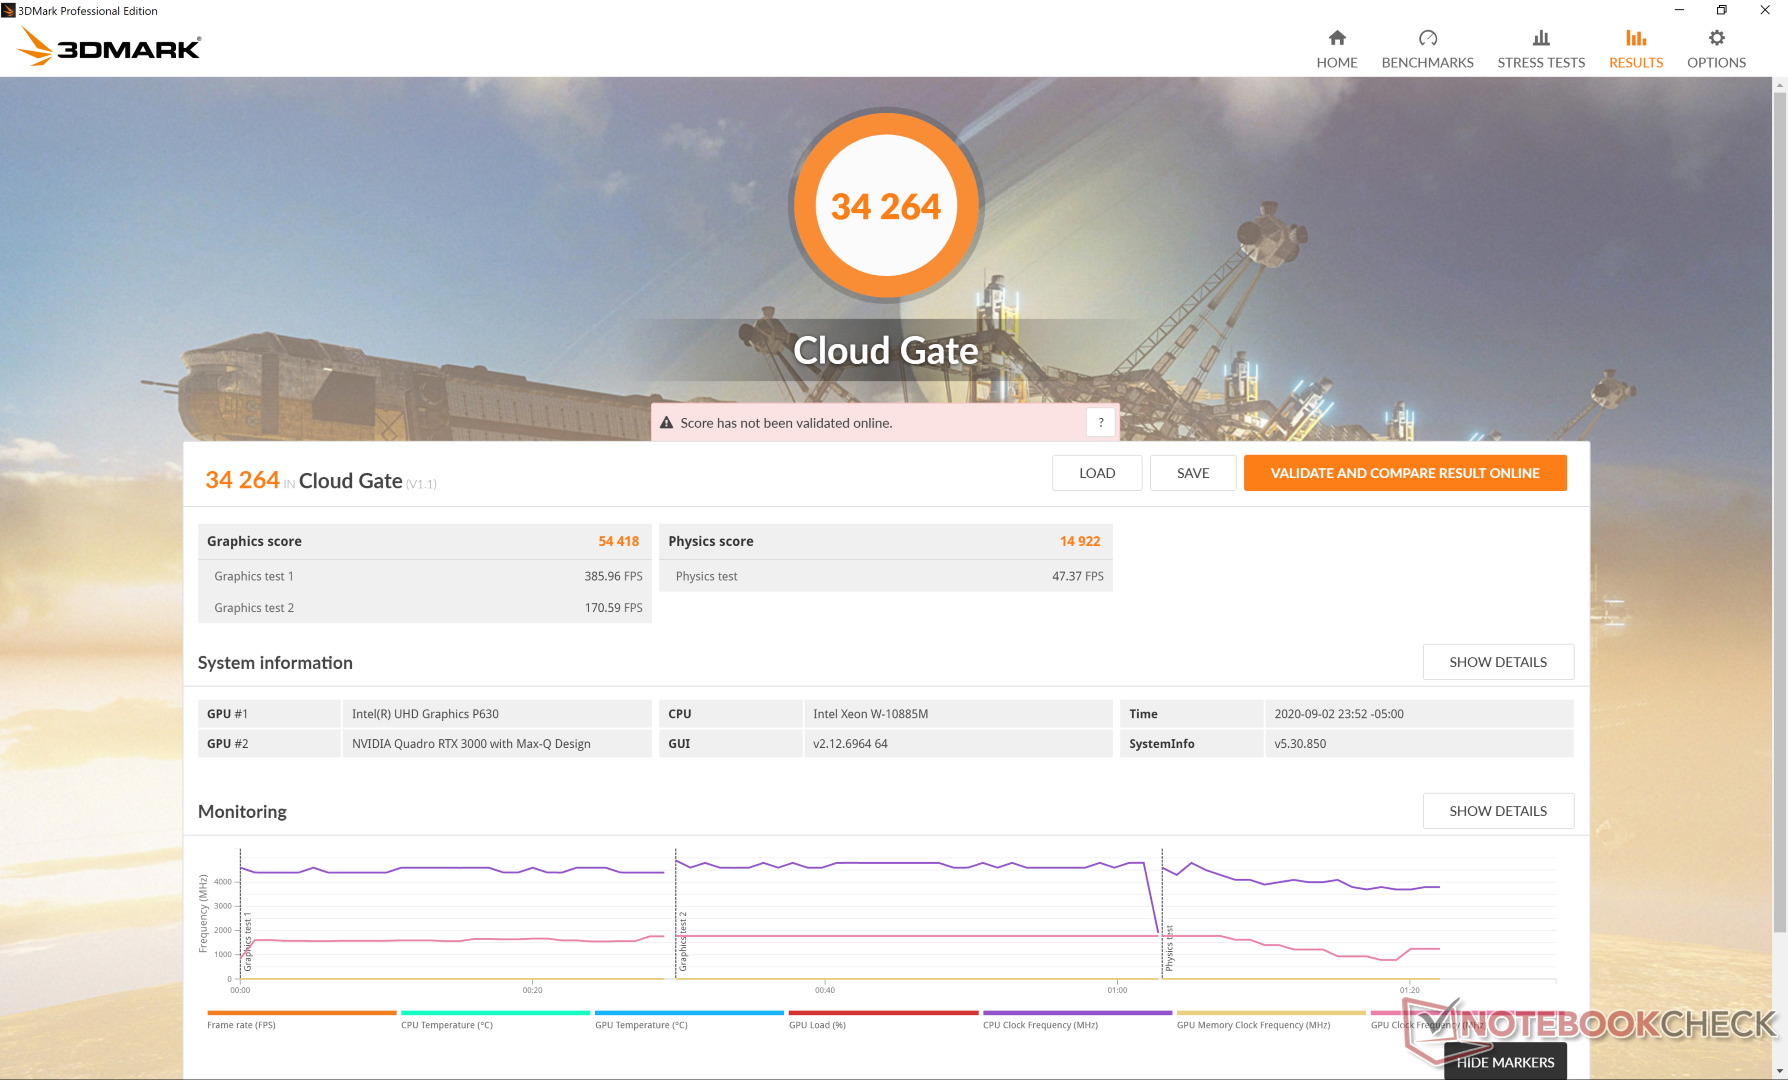
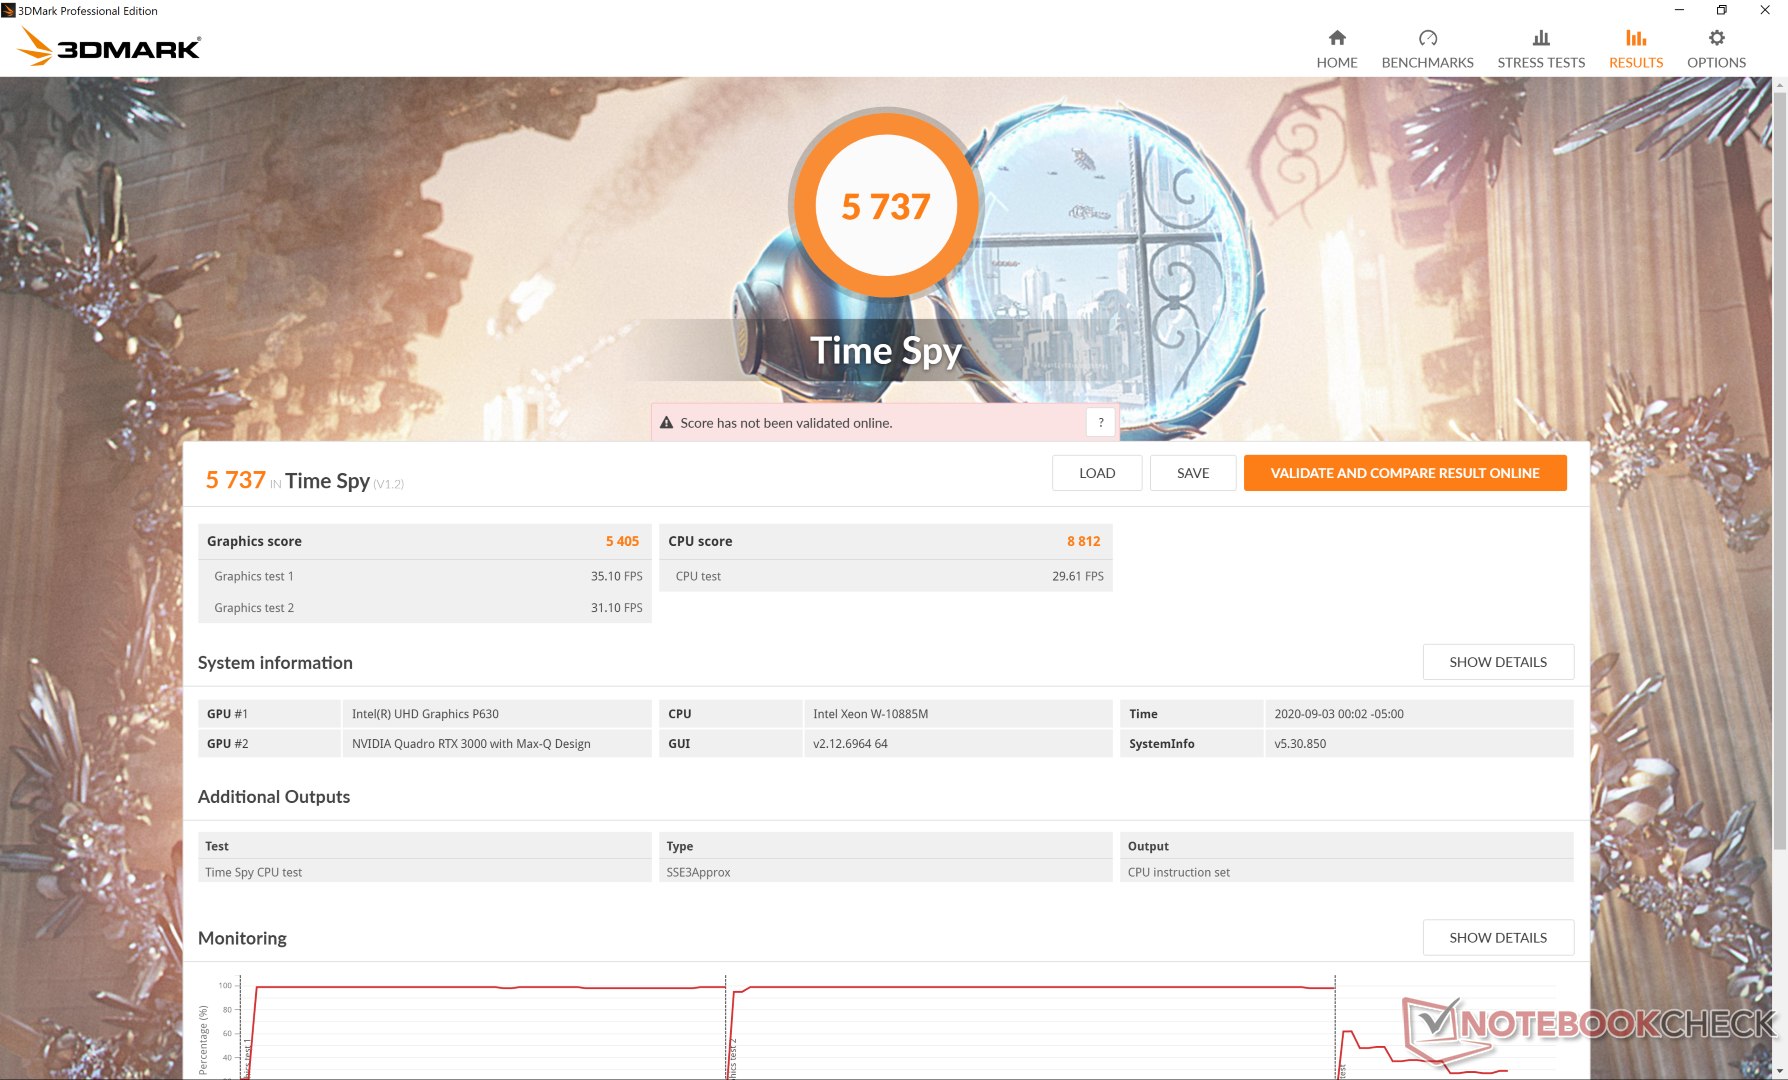
Rendimiento de la GPU
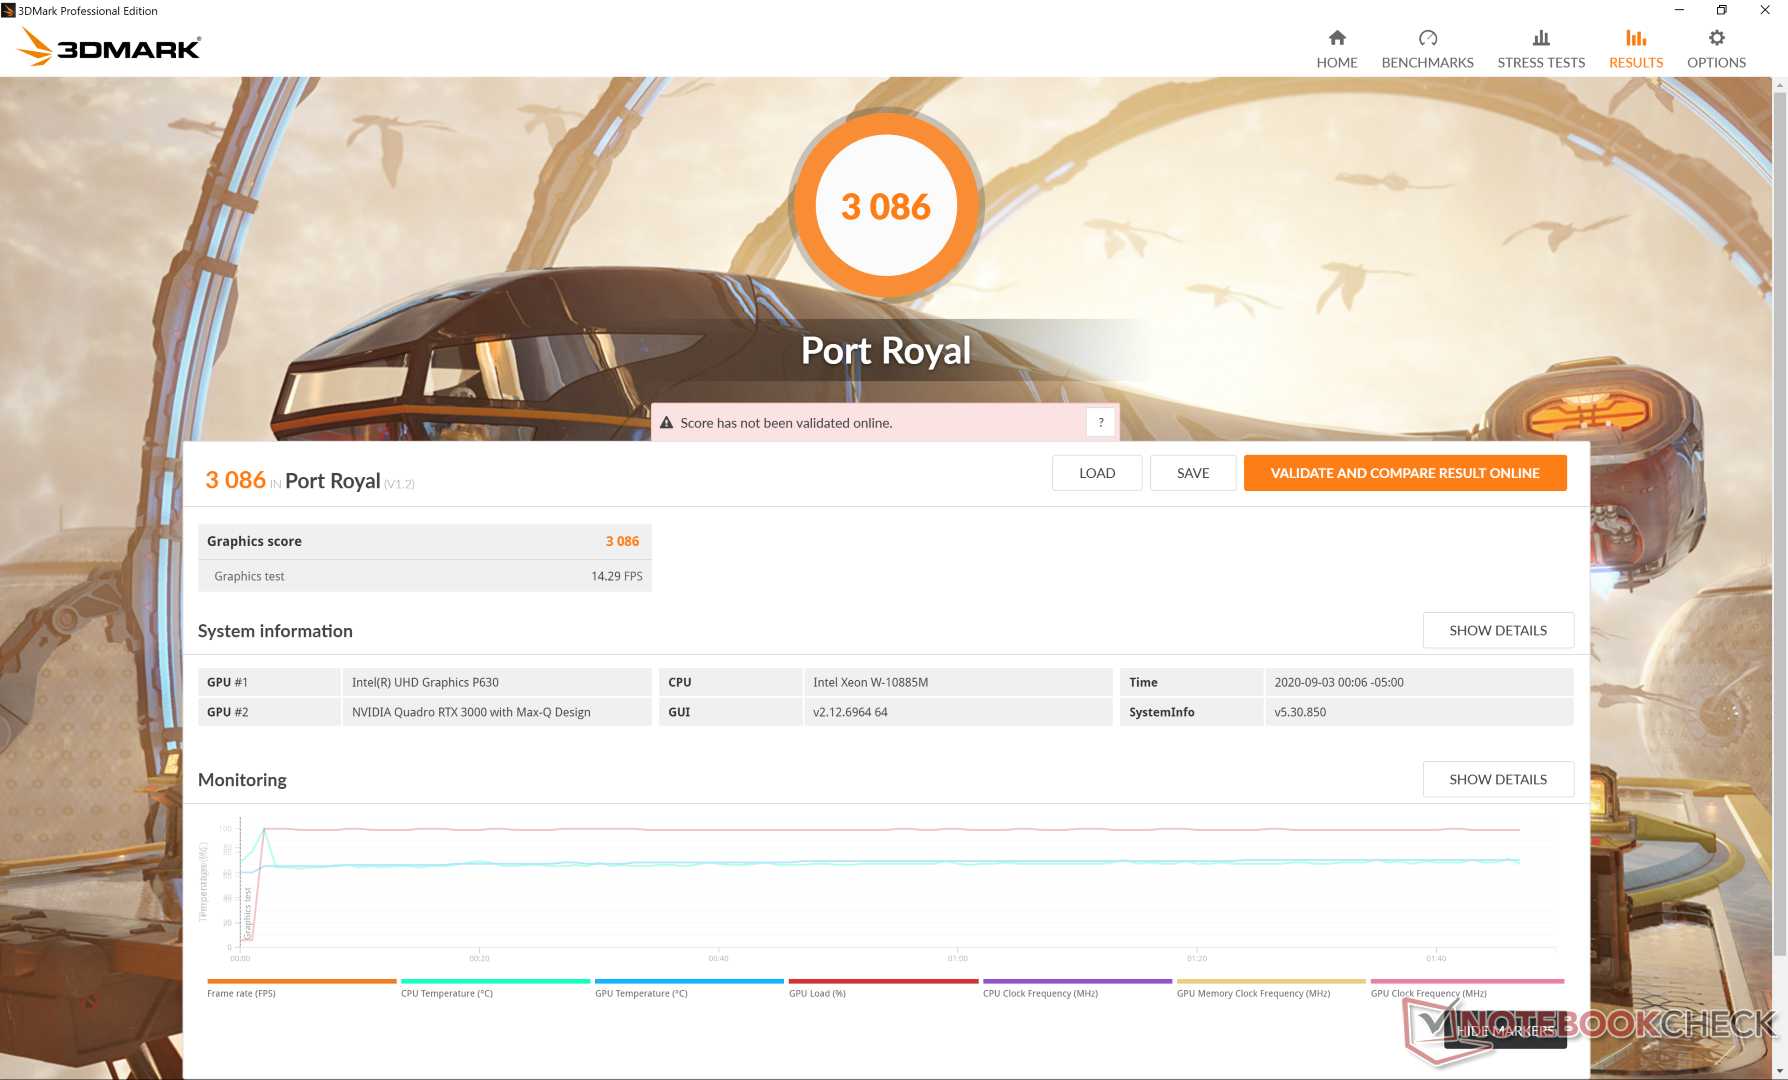
El rendimiento de los gráficos en bruto es muy similar al del GeForce GTX 1660 Ti móvil de consumo, pero con características RT aceleradas por hardware. Curiosamente, Specviewperf muestra que nuestra Quadro RTX 3000 Max-Q supera el rendimiento de la portátil estándar Quadro RTX 3000 en el Lenovo ThinkPad P73 en la mayoría de los casos. Optar por la configuración menor de Quadro T2000 resultará en una caída del 40 por ciento en el rendimiento gráfico. No podemos confirmar si la opción de menor T2000 será la Quadro T2000 estándar o la Quadro T2000 Max-Q.
Consulta nuestra página dedicada a la Quadro RTX 3000 Max-Q para obtener más información técnica y comparaciones de referencia.
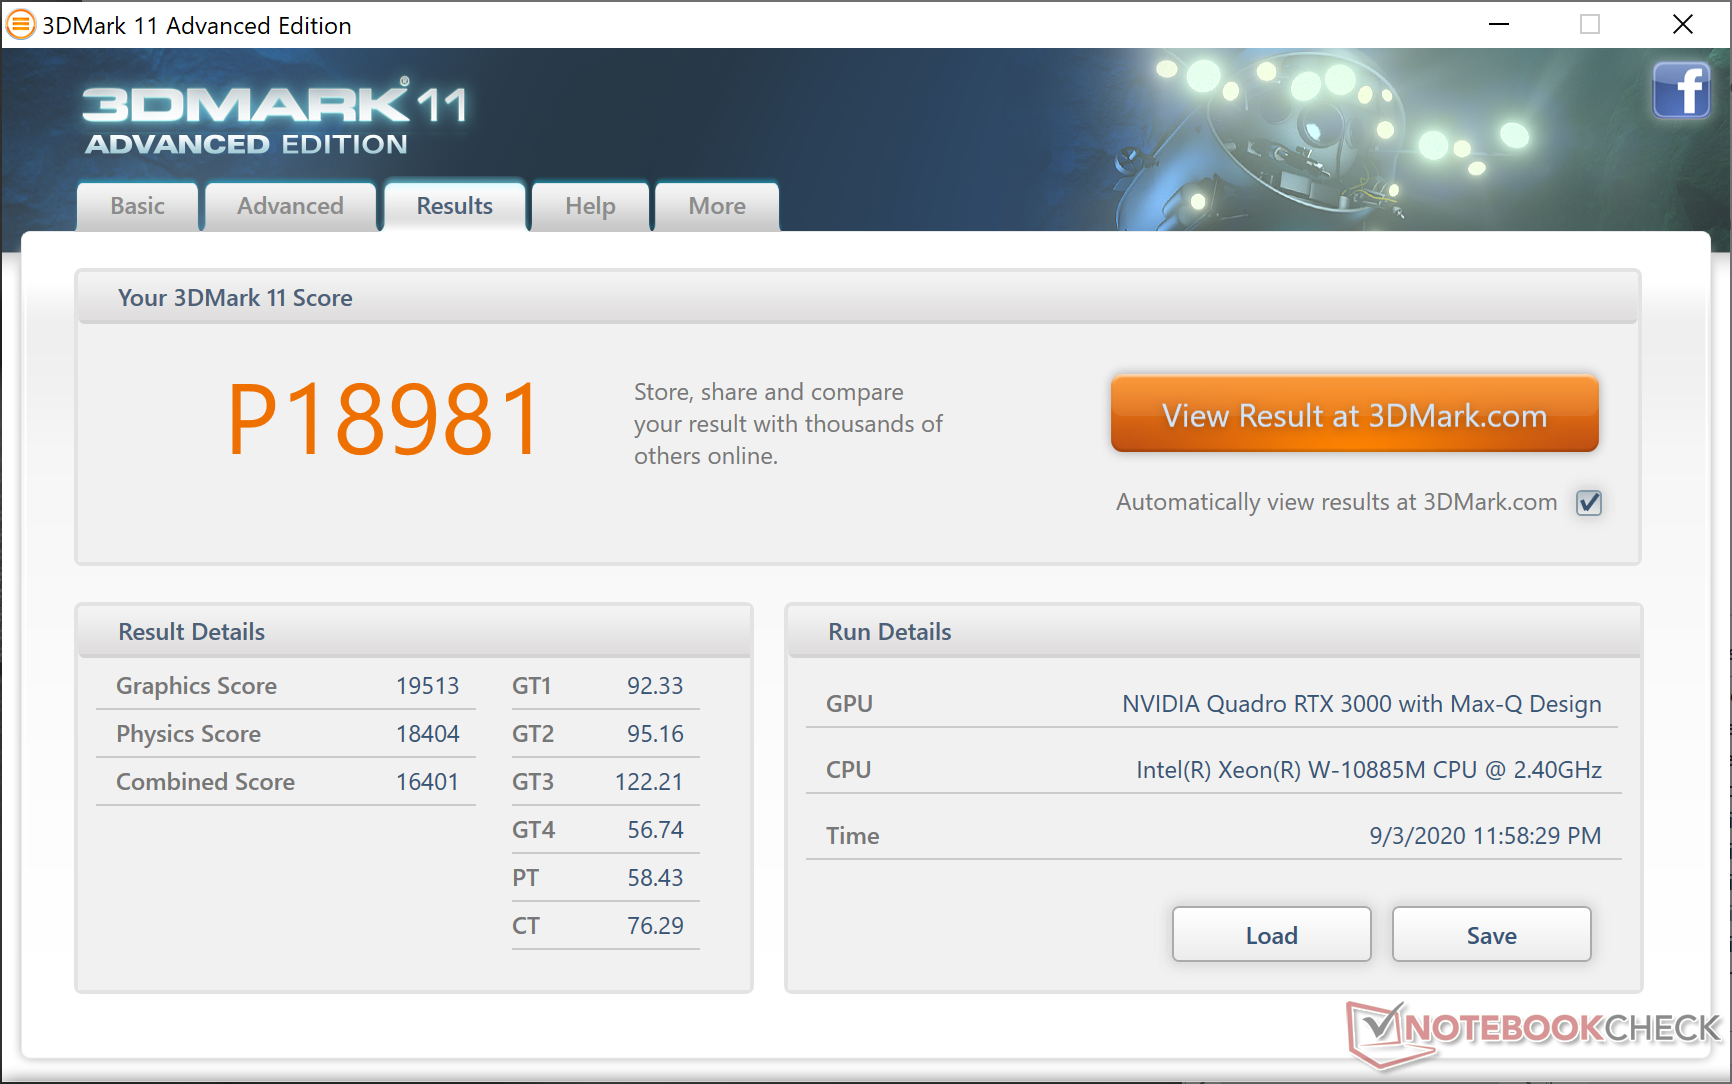
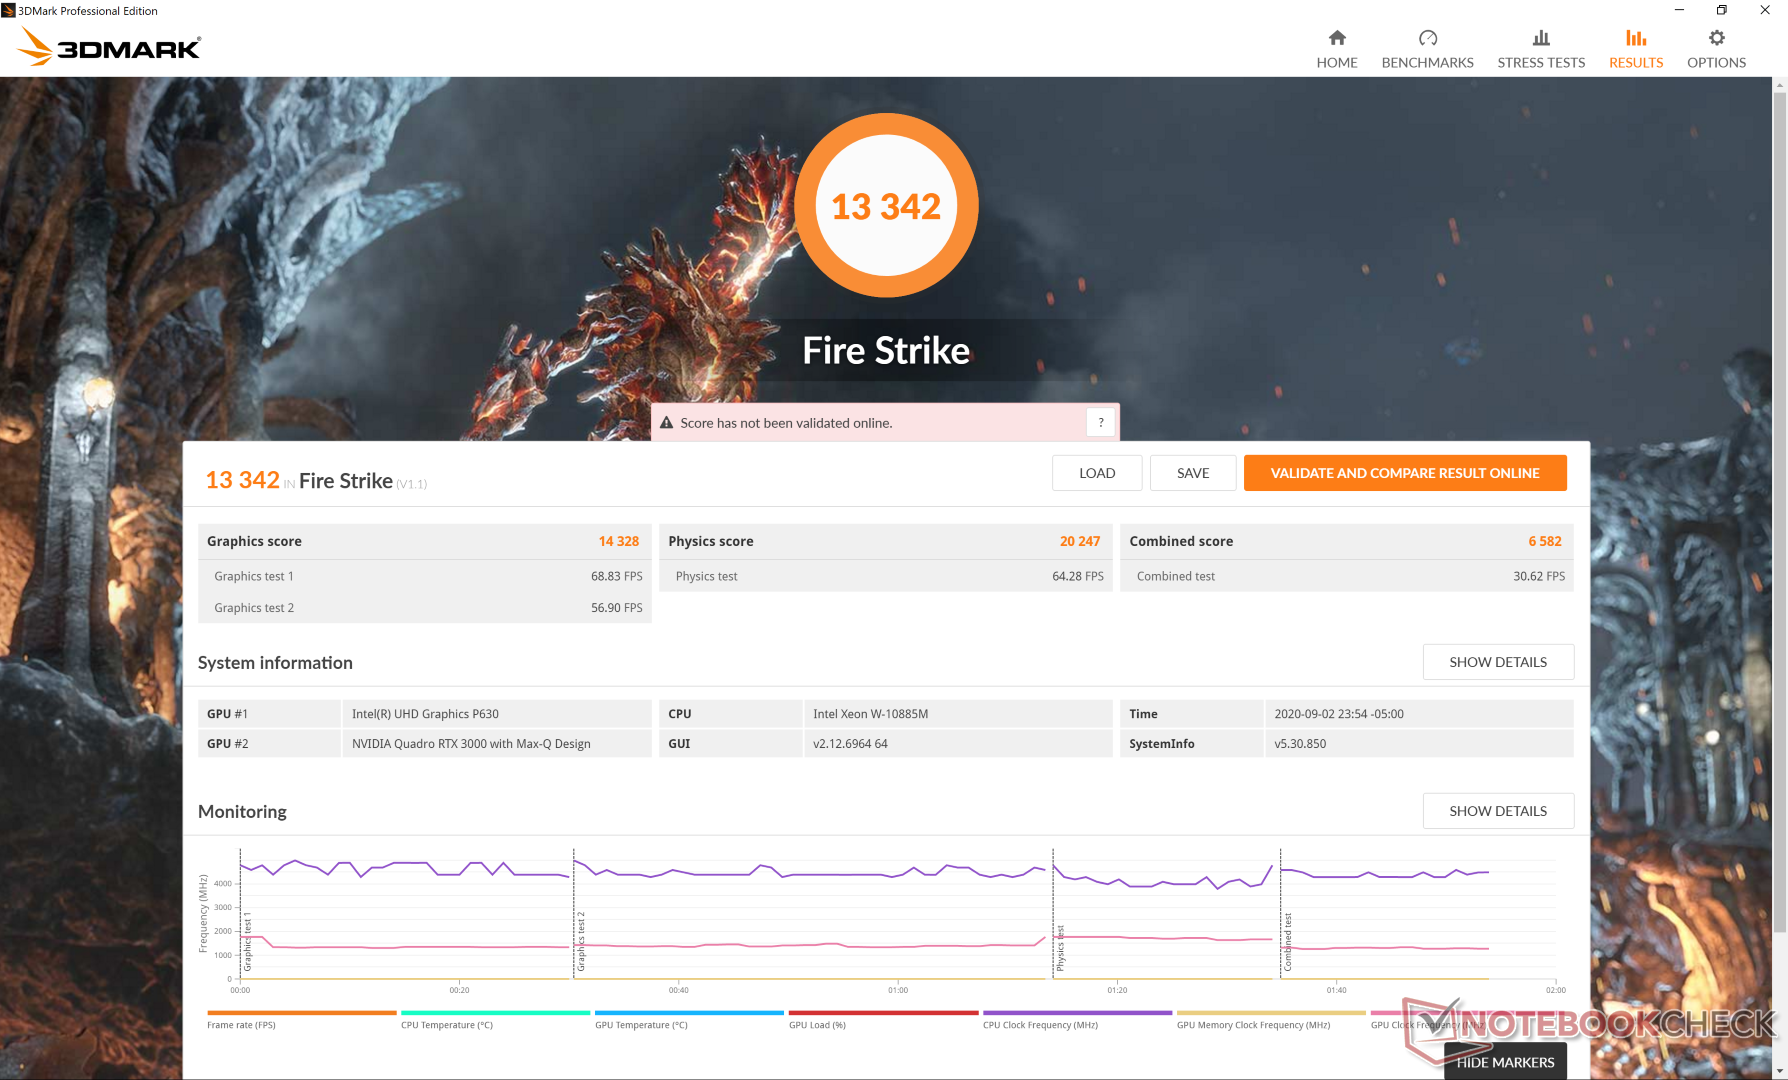
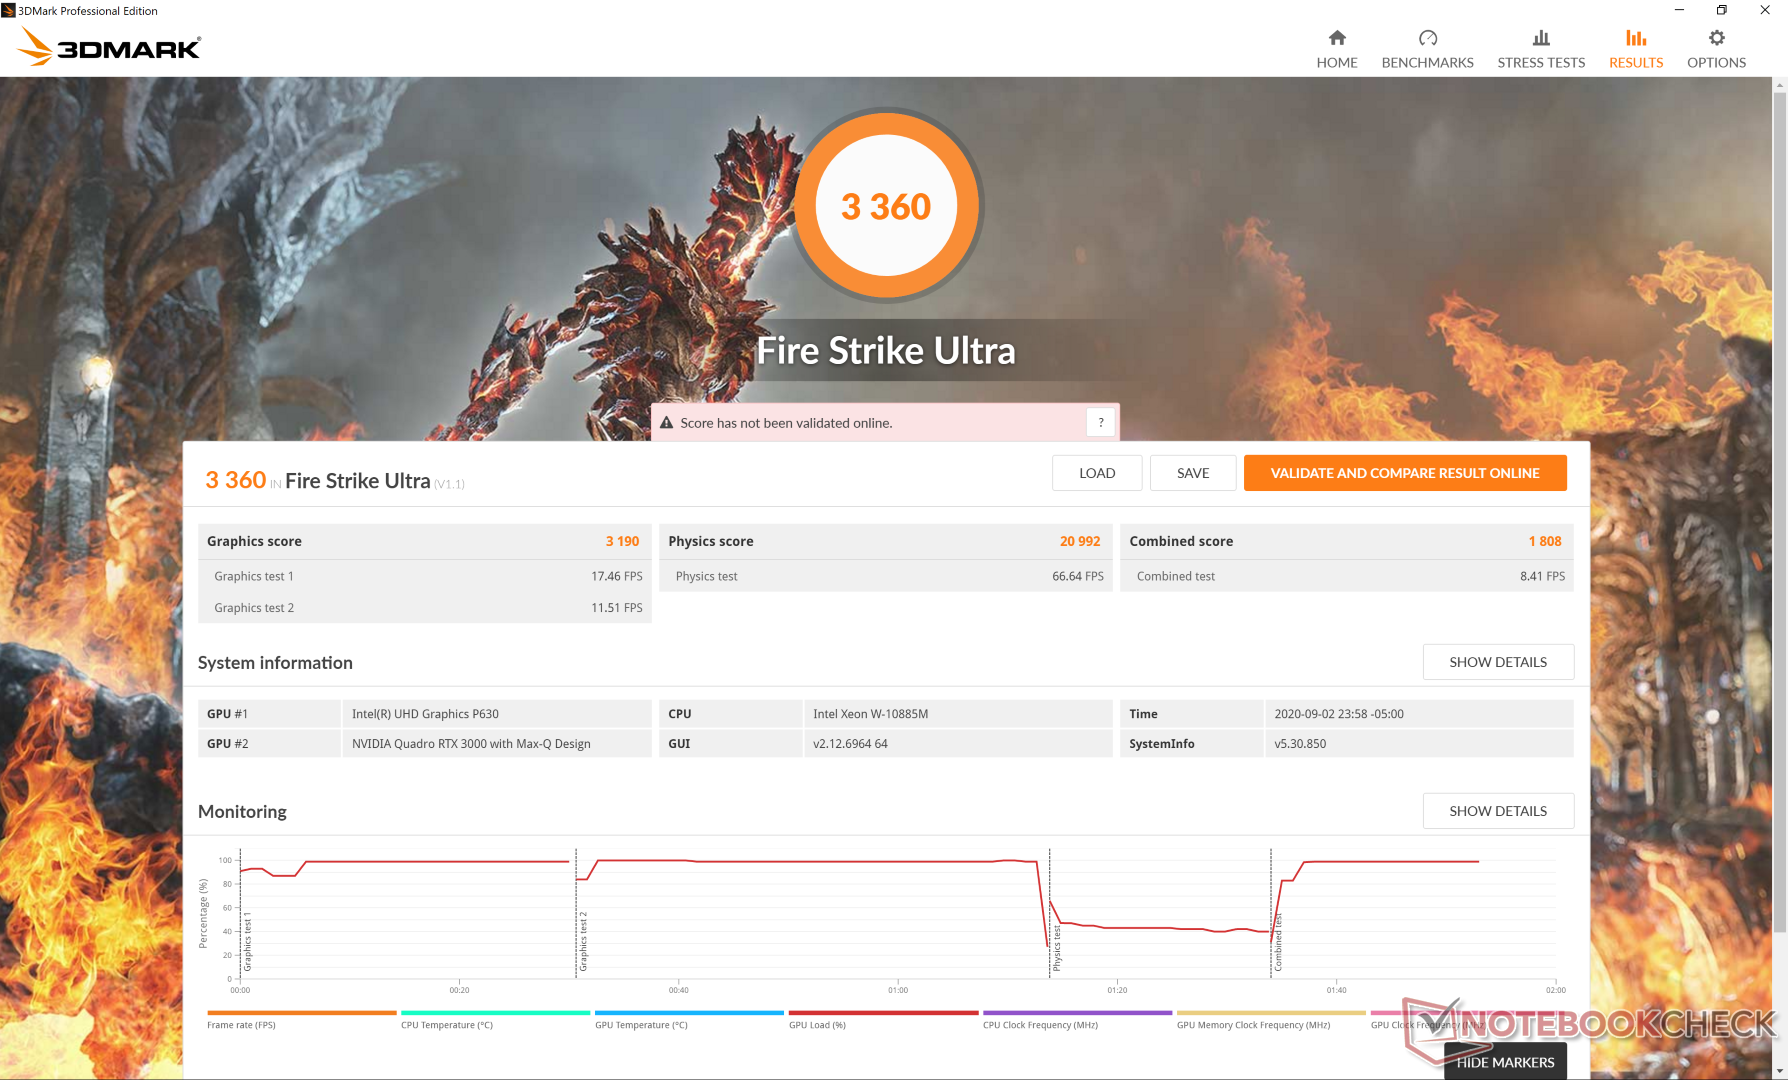
| 3DMark 11 Performance | 18981 puntos | |
| 3DMark Cloud Gate Standard Score | 34264 puntos | |
| 3DMark Fire Strike Score | 13342 puntos | |
| 3DMark Time Spy Score | 5737 puntos | |
ayuda | ||
| bajo | medio | alto | ultra | QHD | 4K | |
|---|---|---|---|---|---|---|
| The Witcher 3 (2015) | 304.7 | 189.4 | 107.4 | 57.2 | 36.5 | |
| Dota 2 Reborn (2015) | 145 | 133 | 126 | 120 | 77.6 | |
| Final Fantasy XV Benchmark (2018) | 149 | 79.1 | 59.5 | 43.8 | 25.9 | |
| X-Plane 11.11 (2018) | 117 | 106 | 85.8 | 67.6 |
Emisiones
Ruido de sistema
| Dell Precision 5000 5750 P92F Quadro RTX 3000 Max-Q, W-10885M, Toshiba Kioxia XG6 KXG60PNV1T02 | Asus ProArt StudioBook Pro 17 W700G3T Quadro RTX 3000 Max-Q, i7-9750H, Samsung SSD PM981 MZVLB1T0HALR | MSI WS75 9TL-636 Quadro RTX 4000 (Laptop), i7-9750H, Samsung SSD PM981 MZVLB1T0HALR | Dell Precision 7730 Quadro P3200, i7-8850H, Samsung SSD PM981 MZVLB512HAJQ | Lenovo ThinkPad P73-20QR002DGE Quadro RTX 3000 (Laptop), i7-9850H, Intel SSD Pro 7600p SSDPEKKF512G8L | MSI WE75 9TK Quadro RTX 3000 (Laptop), i7-9750H, Samsung SSD PM981 MZVLB512HAJQ | |
|---|---|---|---|---|---|---|
| Noise | 11% | 2% | 6% | 12% | 1% | |
| apagado / medio ambiente * (dB) | 27.5 | 29.4 -7% | 29.4 -7% | 29.7 -8% | 29.3 -7% | 28.5 -4% |
| Idle Minimum * (dB) | 27.5 | 29.4 -7% | 29.4 -7% | 29.7 -8% | 29.3 -7% | 29 -5% |
| Idle Average * (dB) | 27.5 | 29.9 -9% | 30.1 -9% | 29.7 -8% | 29.3 -7% | 29 -5% |
| Idle Maximum * (dB) | 27.5 | 29.9 -9% | 30.9 -12% | 29.7 -8% | 29.3 -7% | 31.5 -15% |
| Load Average * (dB) | 44.8 | 31.6 29% | 40.7 9% | 31.4 30% | 30.2 33% | 32 29% |
| Witcher 3 ultra * (dB) | 52.5 | 31.6 40% | 41.9 20% | 37.9 28% | 30.7 42% | 44.7 15% |
| Load Maximum * (dB) | 52.5 | 31.6 40% | 42.7 19% | 44.2 16% | 33.1 37% | 56.5 -8% |
* ... más pequeño es mejor
Ruido
| Ocioso |
| 27.5 / 27.5 / 27.5 dB(A) |
| Carga |
| 44.8 / 52.5 dB(A) |
 | ||
30 dB silencioso 40 dB(A) audible 50 dB(A) ruidosamente alto |
||
min: | ||
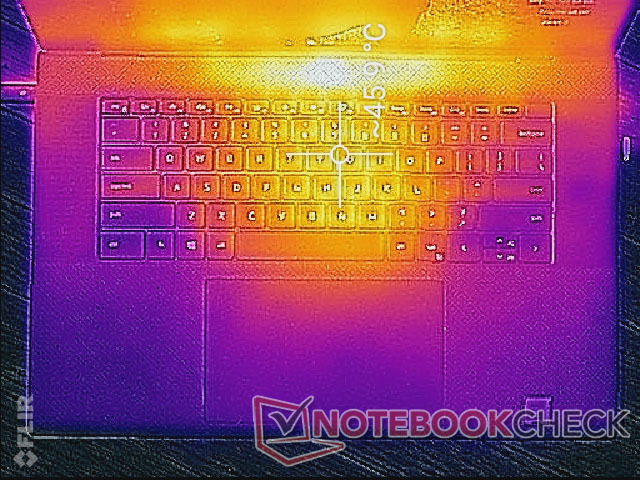
Temperatura
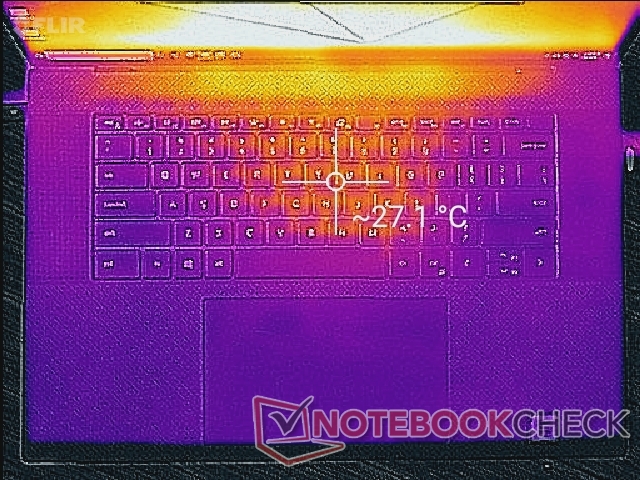
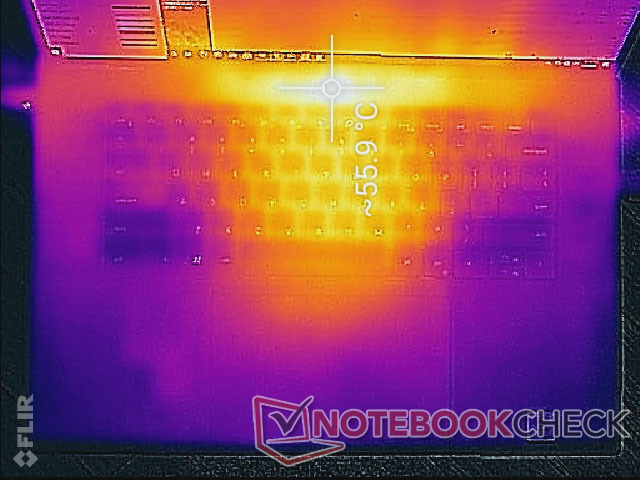
El desarrollo de la temperatura de la superficie es simétrico con puntos calientes cerca del centro del teclado y la parte posterior. Cuando está bajo altas cargas, el centro del teclado puede alcanzar más de 46 C que no es tan diferente de lo que observamos en el más grueso Asus ProArt StudioBook Pro 17. Sin embargo, el MSI WS66 10TMT es capaz de funcionar ligeramente más frío y con una Quadro RTX 5000 Max-Q mucho más potente.
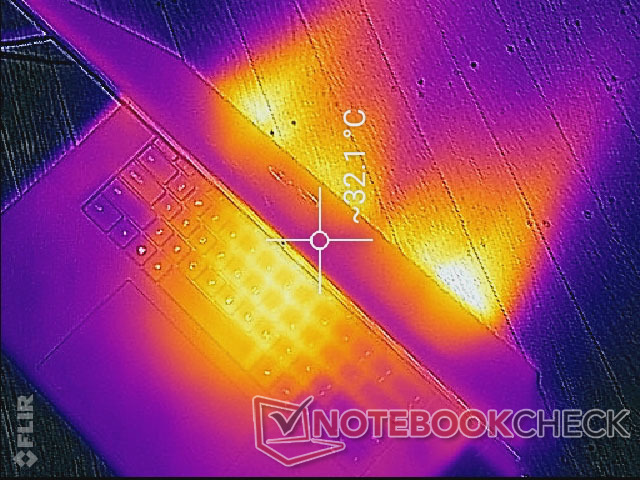
(-) La temperatura máxima en la parte superior es de 55.6 °C / 132 F, frente a la media de 38.2 °C / 101 F, que oscila entre 22.2 y 69.8 °C para la clase Workstation.
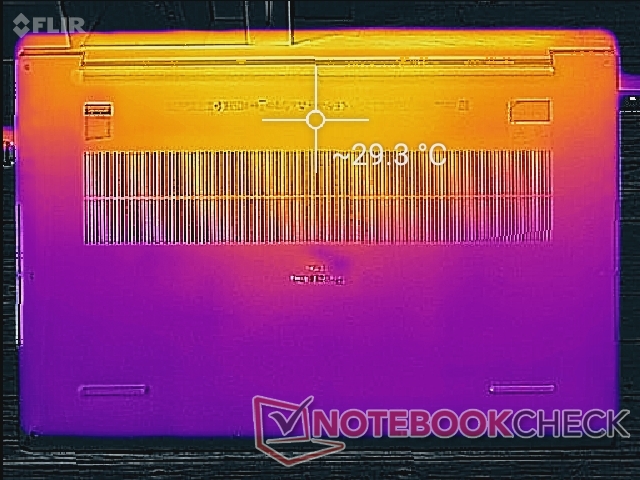
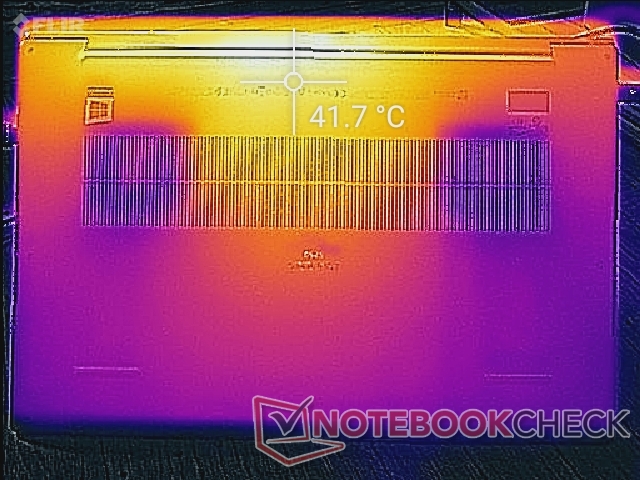
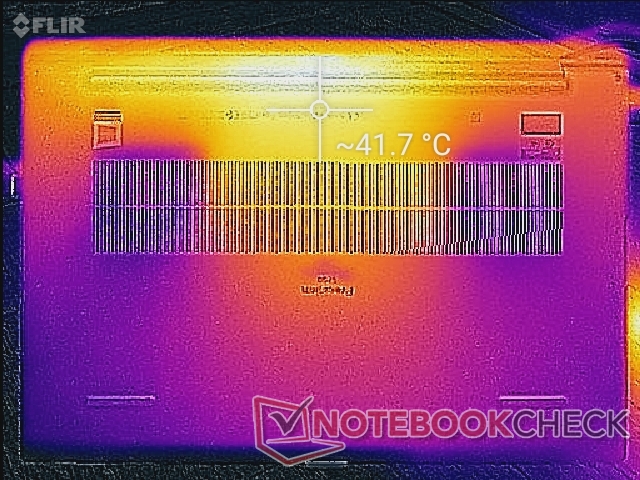
(±) El fondo se calienta hasta un máximo de 42 °C / 108 F, frente a la media de 41.1 °C / 106 F
(+) En reposo, la temperatura media de la parte superior es de 25.2 °C / 77# F, frente a la media del dispositivo de 32 °C / 90 F.
(±) Jugando a The Witcher 3, la temperatura media de la parte superior es de 36 °C / 97 F, frente a la media del dispositivo de 32 °C / 90 F.
(+) Los reposamanos y el panel táctil alcanzan como máximo la temperatura de la piel (33.6 °C / 92.5 F) y, por tanto, no están calientes.
(-) La temperatura media de la zona del reposamanos de dispositivos similares fue de 27.8 °C / 82 F (-5.8 °C / -10.5 F).
Prueba de estrés
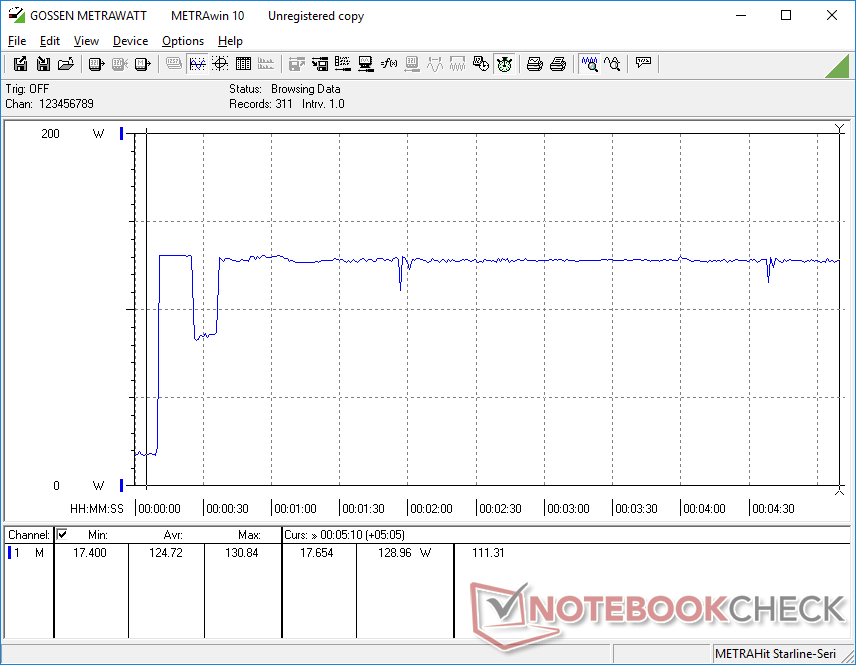
Cuando se ejecuta Prime95 para estresar la CPU, las velocidades se elevan a 4,3 GHz sólo durante los primeros segundos hasta que la temperatura del núcleo alcanza los 99 C. El procesador entonces cae a 3,5 GHz y 84 C temporalmente antes de volver a subir y estabilizarse a 3,7 a 3,8 GHz y 93 C. Las configuraciones XPS de gama alta no temen ejecutar sus procesadores a temperaturas mucho más cálidas que las de la competencia y el Precision 5750 no es diferente.
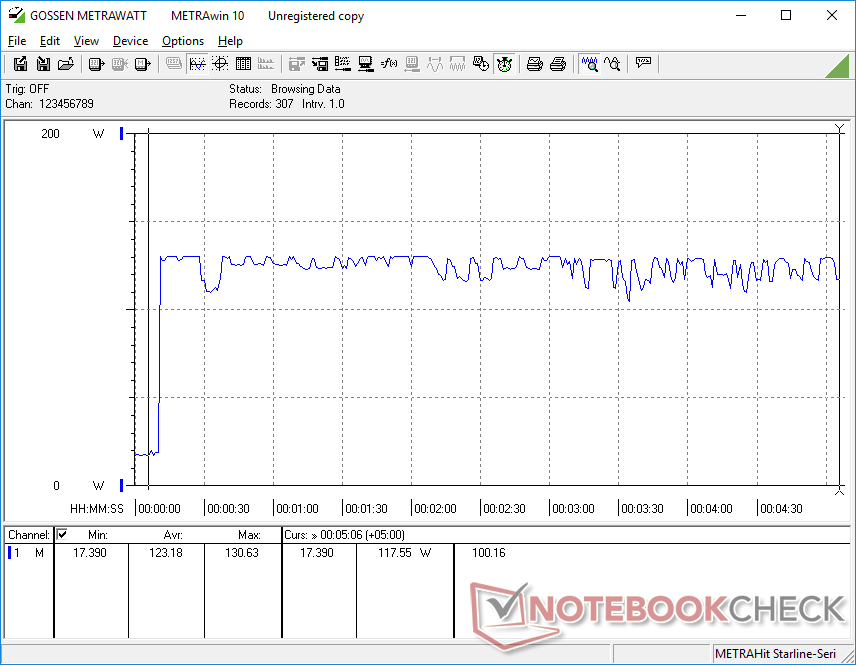
Cuando se ejecutan simultáneamente el Prime95 y el FurMark, las velocidades de la GPU fluctuarían salvajemente entre 930 y 1770 MHz, mientras que otros portátiles son más constantes. Sospechamos que esto se debe a que su rendimiento está siendo limitado por el adaptador de CA de 130 W como se detalla en nuestra sección de Consumo de Energía a continuación.
Funcionar con la energía de la batería limitará el rendimiento. Un test de Fuego en las baterías daría unos resultados de Física y Gráficos de 15189 y 4404 puntos, respectivamente, comparado con los 20247 y 14328 puntos cuando está en la red eléctrica.
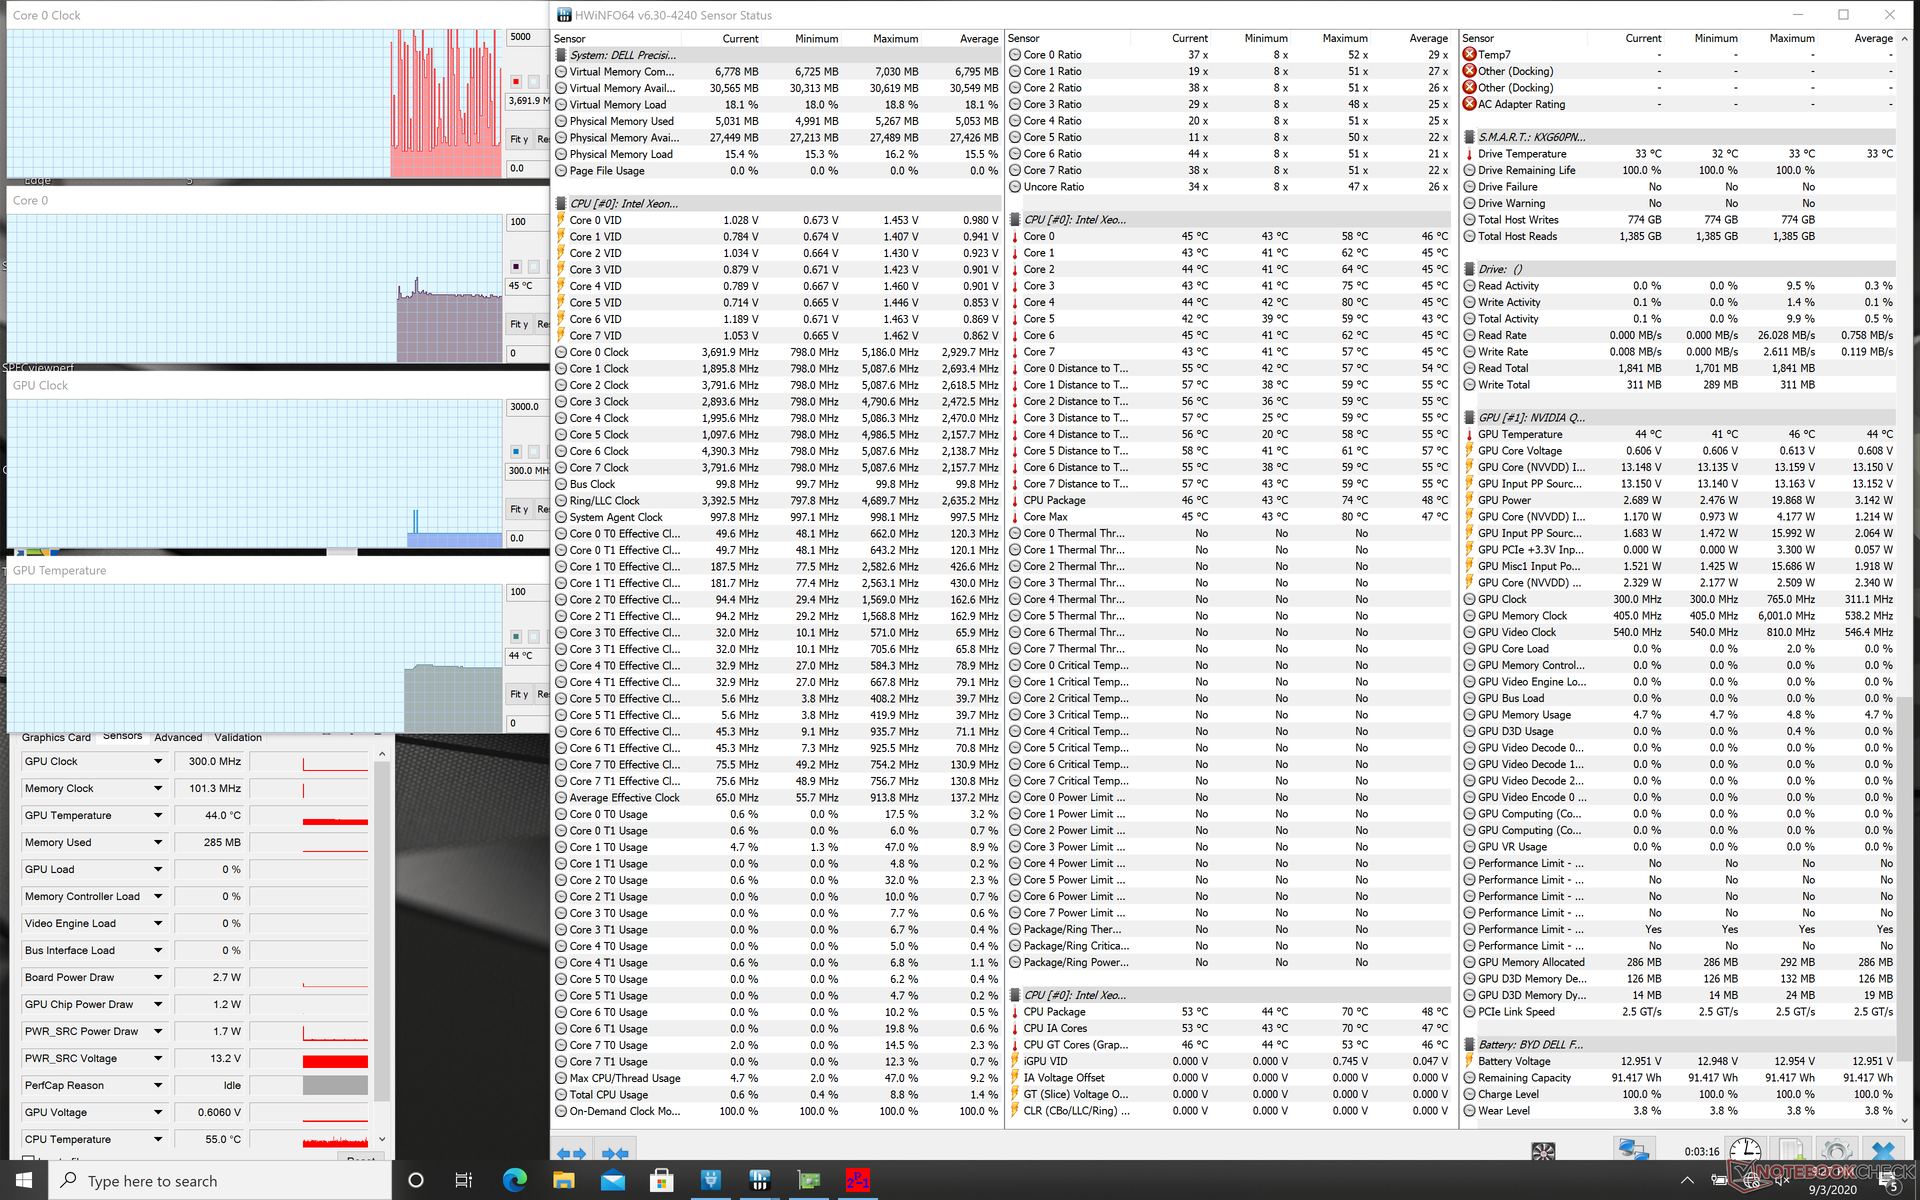
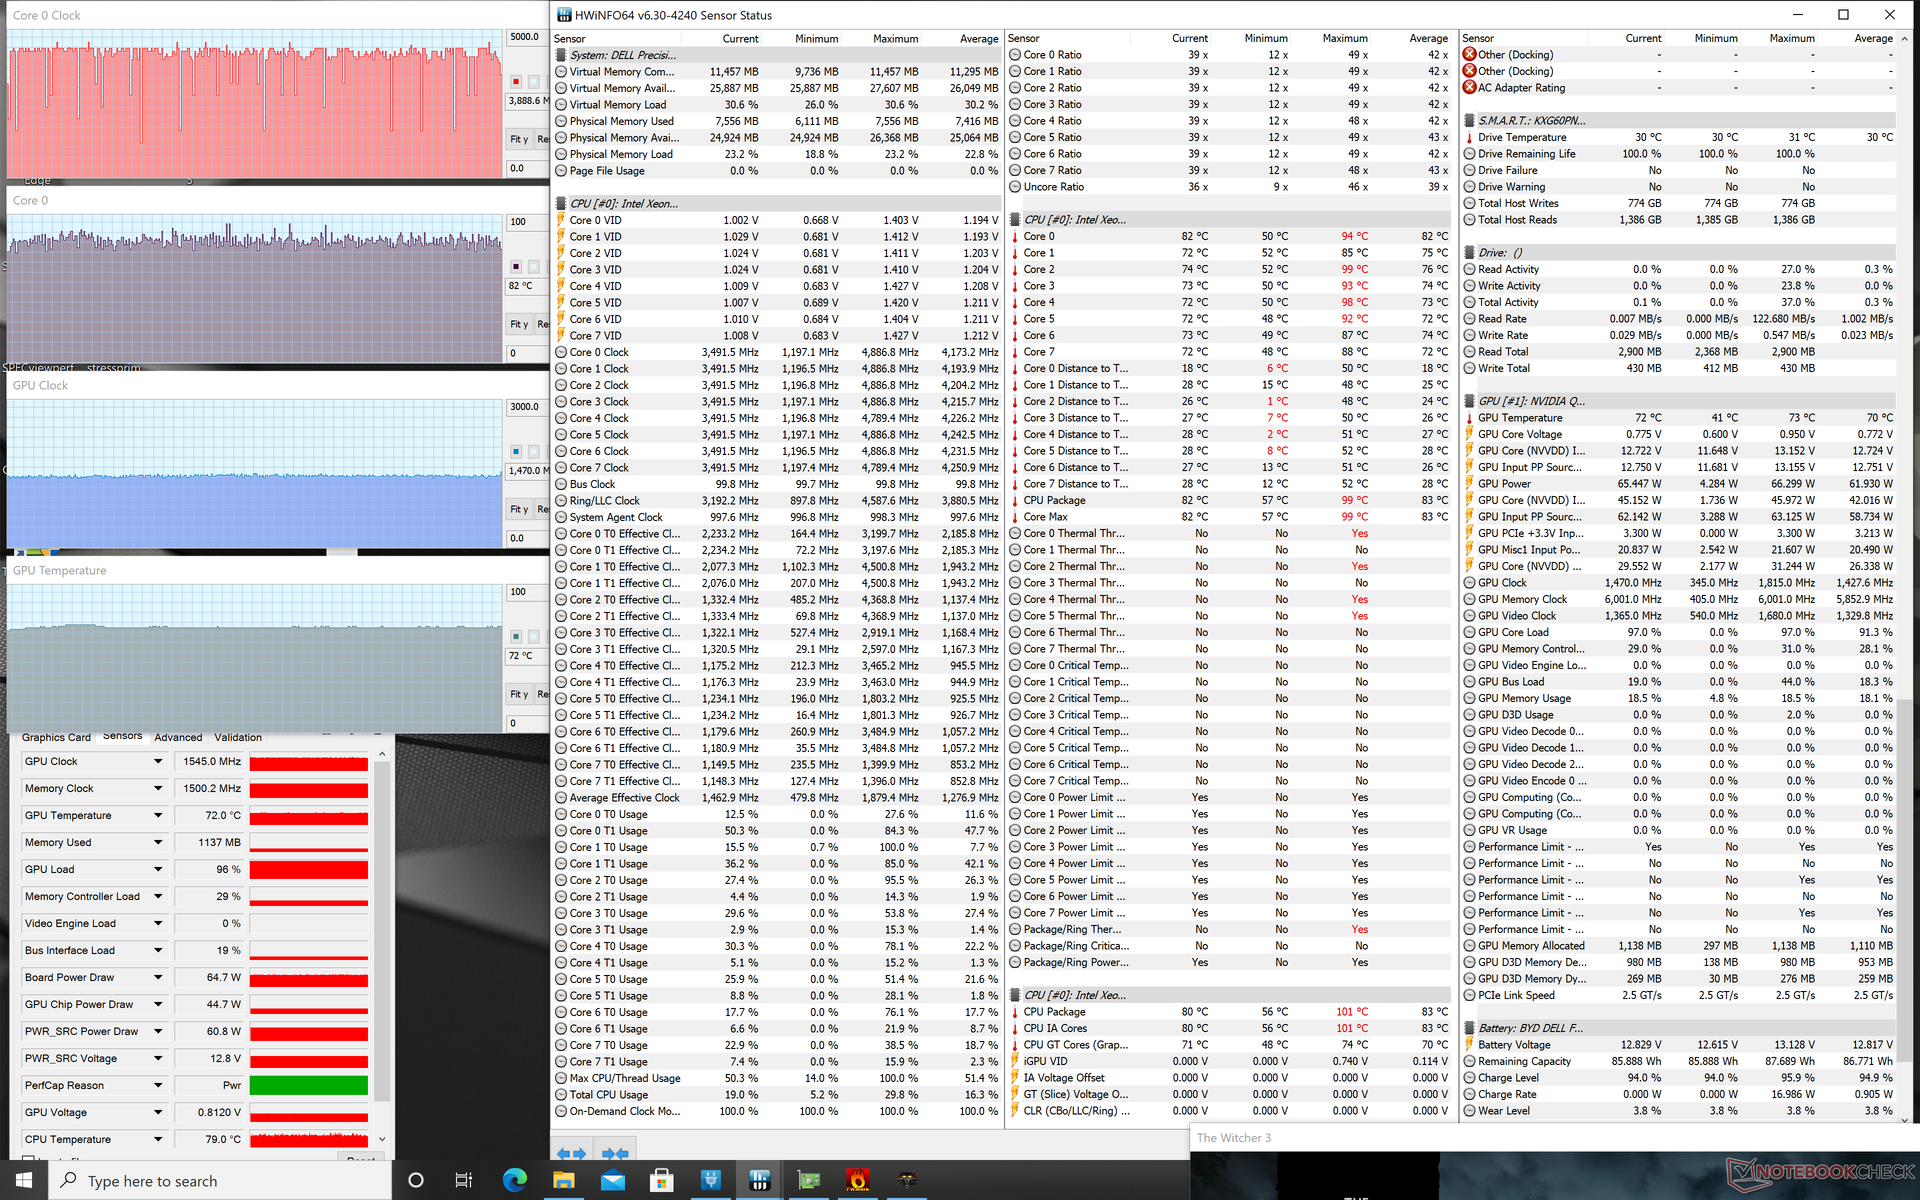
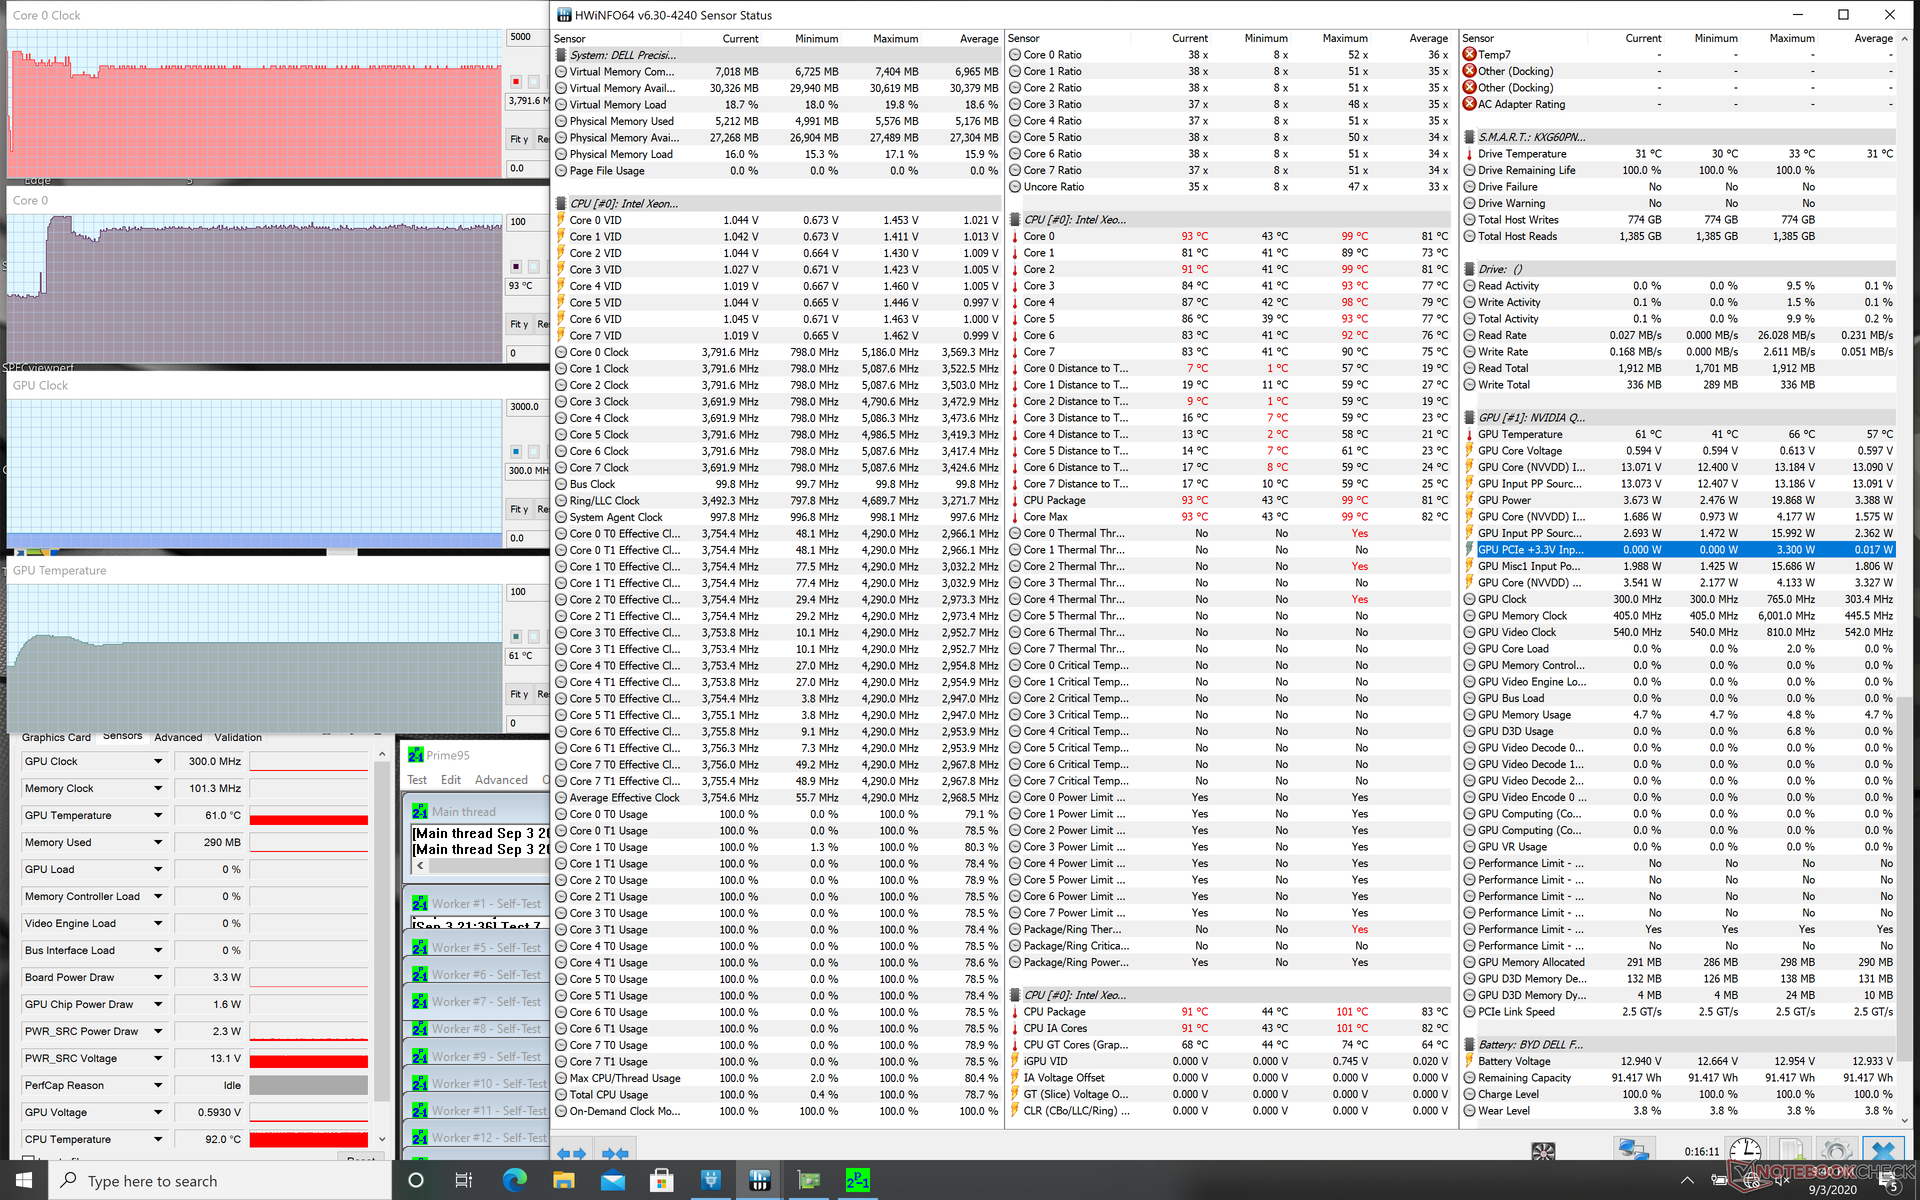
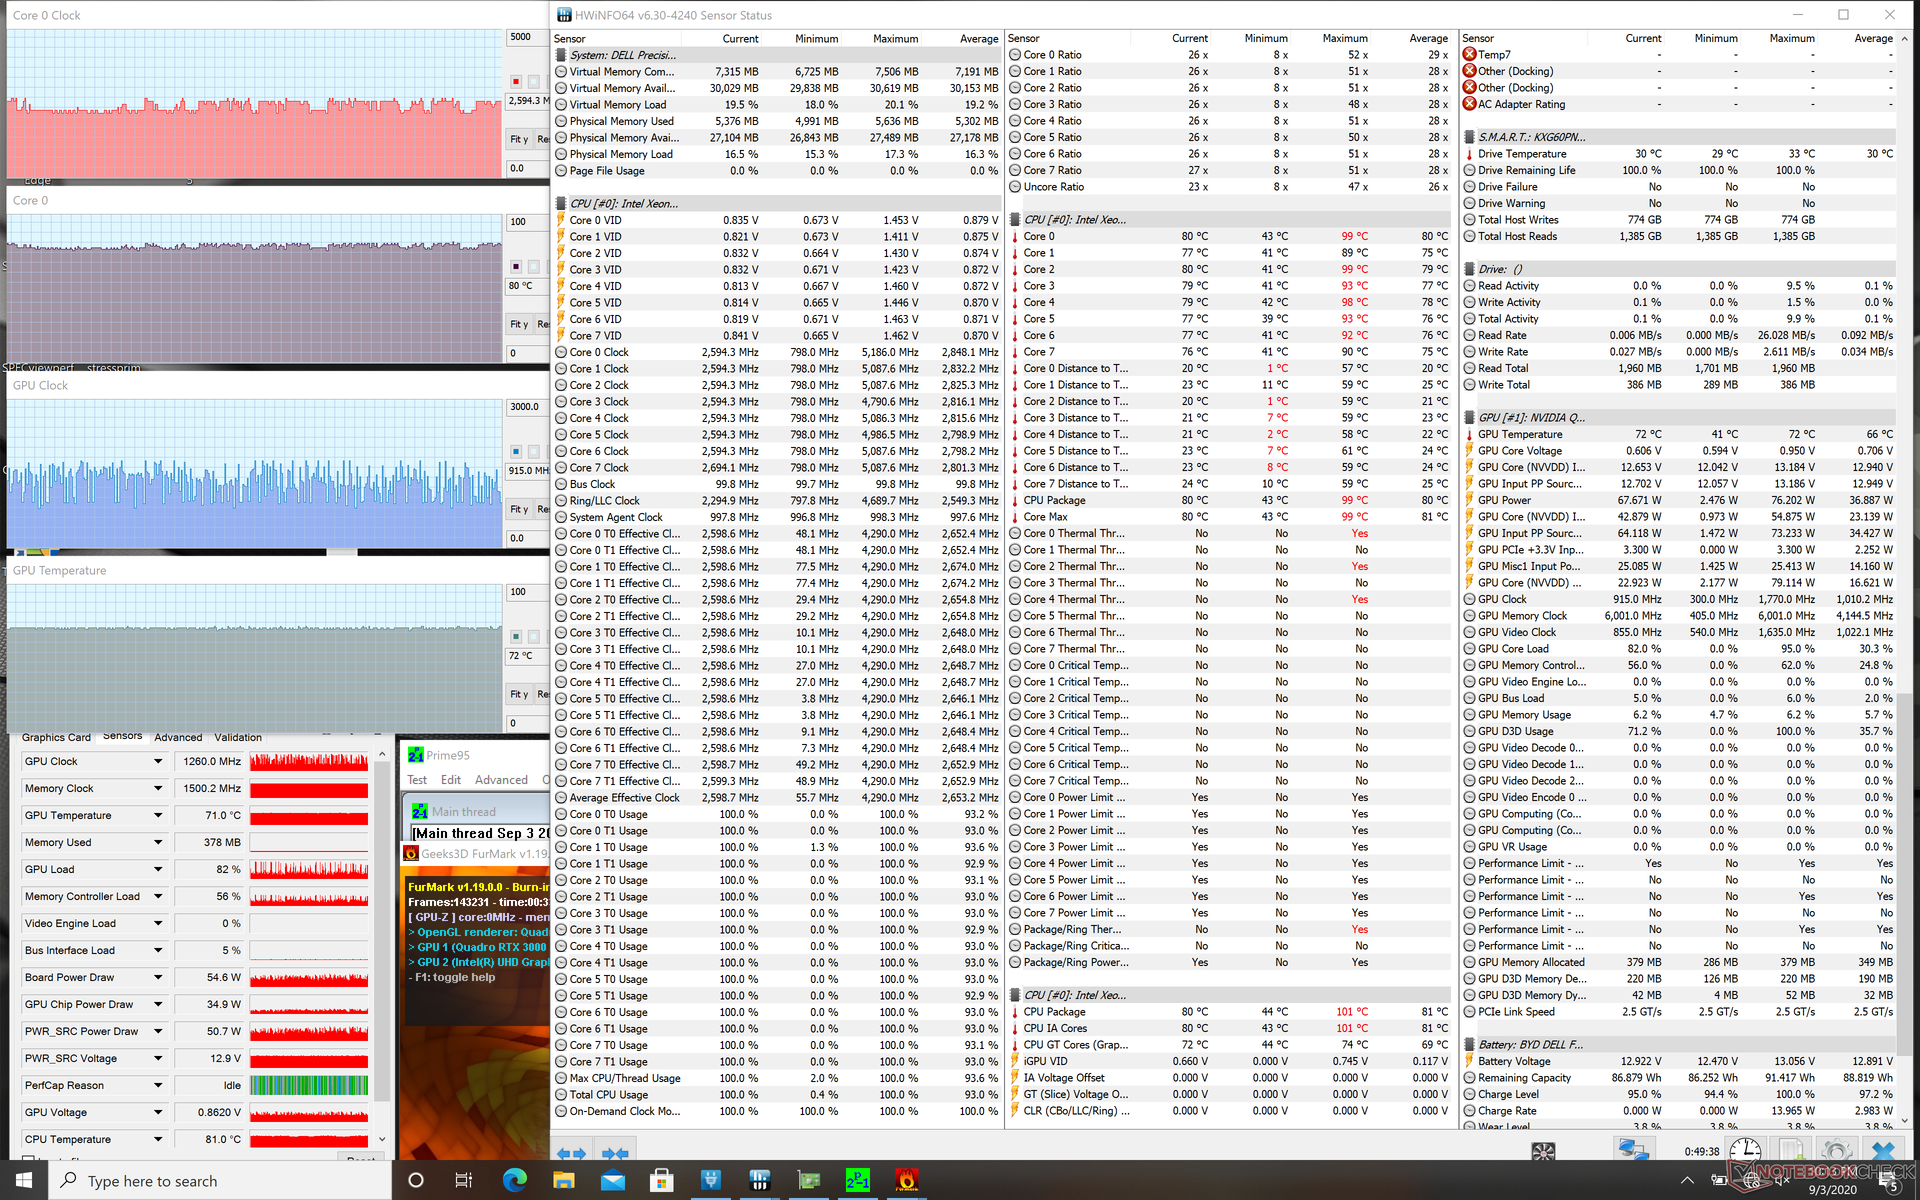
| CPU Clock (GHz) | GPU Clock (MHz) | Average CPU Temperature (°C) | Average GPU Temperature (°C) | |
| System Idle | -- | -- | 45 | 44 |
| Prime95 Stress | 3.7 - 3.8 | -- | 93 | 61 |
| Prime95 + FurMark Stress | 2.3 - 2.6 | 930 - 1770 | 78 - 81 | 70 |
| Witcher 3 Stress | ~4.2 | 1545 | ~82 | 72 |
Altavoces
")

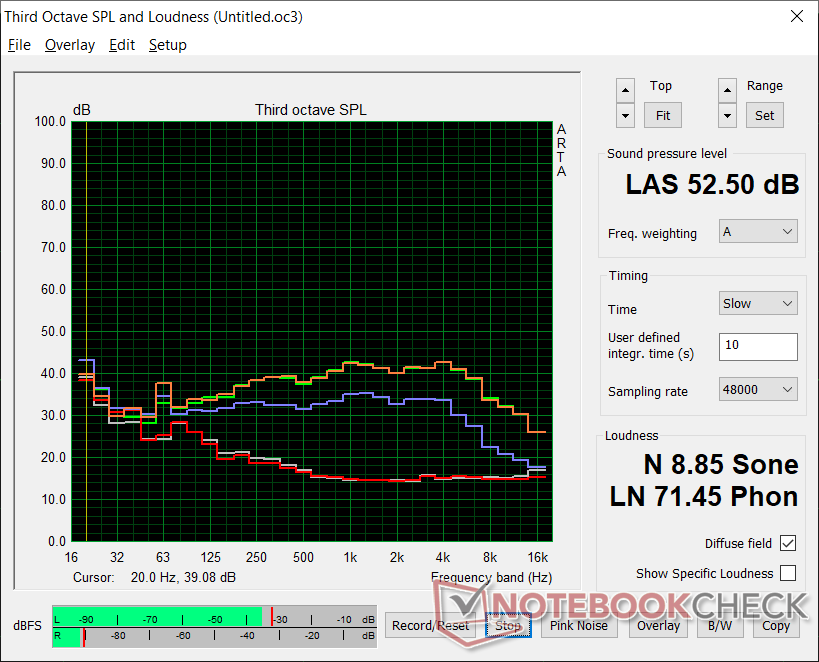
Dell Precision 5000 5750 P92F análisis de audio
(+) | los altavoces pueden reproducir a un volumen relativamente alto (#85.6 dB)
Graves 100 - 315 Hz
(±) | lubina reducida - en promedio 7.4% inferior a la mediana
(±) | la linealidad de los graves es media (8.7% delta a frecuencia anterior)
Medios 400 - 2000 Hz
(+) | medios equilibrados - a sólo 3.6% de la mediana
(+) | los medios son lineales (3.8% delta a la frecuencia anterior)
Altos 2 - 16 kHz
(±) | máximos más altos - de media 5.3% más altos que la mediana
(+) | los máximos son lineales (5.6% delta a la frecuencia anterior)
Total 100 - 16.000 Hz
(+) | el sonido global es lineal (10.5% de diferencia con la mediana)
En comparación con la misma clase
» 7% de todos los dispositivos probados de esta clase eran mejores, 6% similares, 87% peores
» El mejor tuvo un delta de 7%, la media fue 17%, el peor fue ###max##%
En comparación con todos los dispositivos probados
» 5% de todos los dispositivos probados eran mejores, 1% similares, 93% peores
» El mejor tuvo un delta de 4%, la media fue 24%, el peor fue ###max##%
Apple MacBook 12 (Early 2016) 1.1 GHz análisis de audio
(+) | los altavoces pueden reproducir a un volumen relativamente alto (#83.6 dB)
Graves 100 - 315 Hz
(±) | lubina reducida - en promedio 11.3% inferior a la mediana
(±) | la linealidad de los graves es media (14.2% delta a frecuencia anterior)
Medios 400 - 2000 Hz
(+) | medios equilibrados - a sólo 2.4% de la mediana
(+) | los medios son lineales (5.5% delta a la frecuencia anterior)
Altos 2 - 16 kHz
(+) | máximos equilibrados - a sólo 2% de la mediana
(+) | los máximos son lineales (4.5% delta a la frecuencia anterior)
Total 100 - 16.000 Hz
(+) | el sonido global es lineal (10.2% de diferencia con la mediana)
En comparación con la misma clase
» 7% de todos los dispositivos probados de esta clase eran mejores, 2% similares, 91% peores
» El mejor tuvo un delta de 5%, la media fue 18%, el peor fue ###max##%
En comparación con todos los dispositivos probados
» 5% de todos los dispositivos probados eran mejores, 1% similares, 94% peores
» El mejor tuvo un delta de 4%, la media fue 24%, el peor fue ###max##%
Gestión de la energía
Consumo de energía
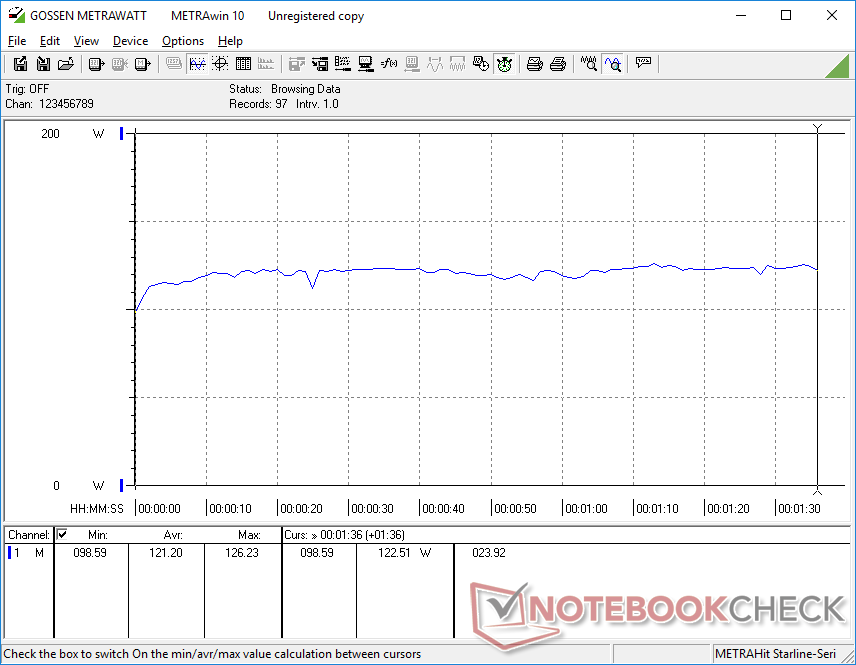
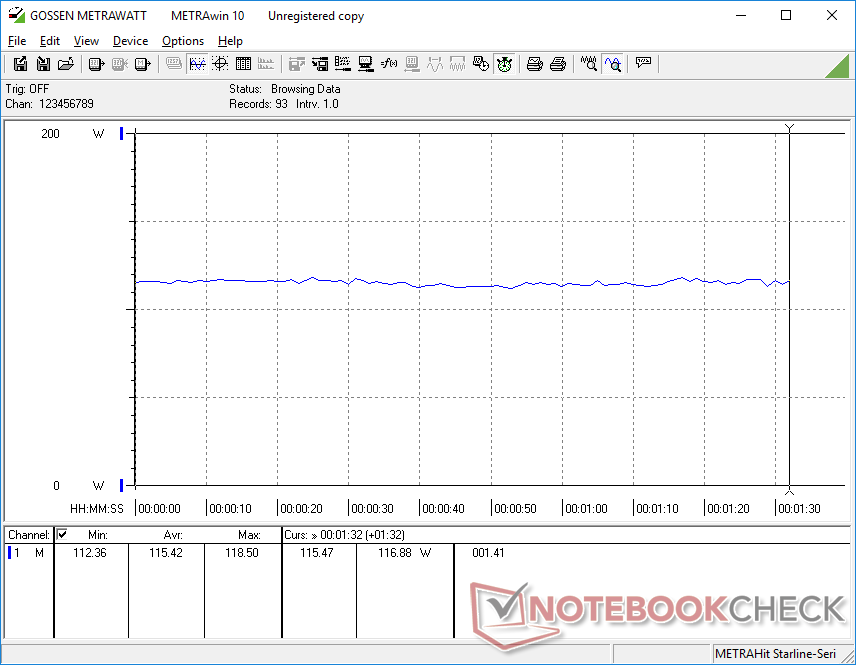
Inactivo en el escritorio consume alrededor de 6 W mínimo o hasta 17 W cuando en el perfil de alto rendimiento con la GPU Quadro activa. Cuando se ejecutan cargas elevadas como los juegos, el consumo medio es de unos 115 W o un 25 por ciento menos que el del ThinkPad P53 equipado con la potente Quadro RTX 3000.
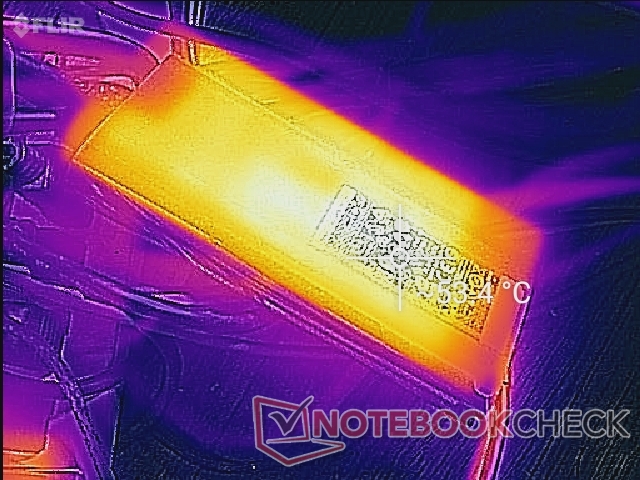
El consumo máximo cuando se ejecutan cargas extremas es menor de lo esperado debido al adaptador de CA relativamente pequeño (~14,3 x 6,5 x 2,3 cm) de 130 W. En comparación, el Asus ProArt StudioBook Pro 17 viene con la misma GPU y, sin embargo, es capaz de consumir más de 180 W gracias a su adaptador de CA más grande. Por lo tanto, el Precision 5750 no es muy adecuado para ejecutar cargas de procesamiento extremas durante largos periodos de tiempo, como lo demuestran las fluctuaciones de las tasas de la GPU en nuestra sección de Prueba de esfuerzo más arriba. La batería también se cargará muy lentamente cuando esté bajo tales cargas debido al bajo techo de 130 W. No experimentamos ningún problema importante de descarga de la batería cuando se conecta a una toma de corriente alterna, a diferencia de algunas de las primeras unidades XPS 17.
| Off / Standby | |
| Ocioso | |
| Carga |
|
Clave:
min: | |
| Dell Precision 5000 5750 P92F W-10885M, Quadro RTX 3000 Max-Q, Toshiba Kioxia XG6 KXG60PNV1T02, IPS, 3840x2400, 17" | Asus ProArt StudioBook Pro 17 W700G3T i7-9750H, Quadro RTX 3000 Max-Q, Samsung SSD PM981 MZVLB1T0HALR, IPS, 1920x1200, 17" | MSI WS75 9TL-636 i7-9750H, Quadro RTX 4000 (Laptop), Samsung SSD PM981 MZVLB1T0HALR, IPS, 1920x1080, 17.3" | Dell Precision 7730 i7-8850H, Quadro P3200, Samsung SSD PM981 MZVLB512HAJQ, IPS LED, 1920x1080, 17.3" | Lenovo ThinkPad P73-20QR002DGE i7-9850H, Quadro RTX 3000 (Laptop), Intel SSD Pro 7600p SSDPEKKF512G8L, IPS LED, 1920x1080, 17.3" | MSI WE75 9TK i7-9750H, Quadro RTX 3000 (Laptop), Samsung SSD PM981 MZVLB512HAJQ, IPS, 1920x1080, 17.3" | |
|---|---|---|---|---|---|---|
| Power Consumption | -17% | -47% | -25% | -13% | -30% | |
| Idle Minimum * (Watt) | 6.3 | 11.3 -79% | 16.4 -160% | 10.1 -60% | 8.9 -41% | 12.1 -92% |
| Idle Average * (Watt) | 14.2 | 16 -13% | 21.6 -52% | 18 -27% | 12.8 10% | 18.4 -30% |
| Idle Maximum * (Watt) | 17.3 | 16.8 3% | 22.9 -32% | 19.7 -14% | 16.4 5% | 18.8 -9% |
| Load Average * (Watt) | 121.2 | 93.6 23% | 88 27% | 89.6 26% | 108.4 11% | 95.1 22% |
| Witcher 3 ultra * (Watt) | 115.4 | 106 8% | 137 -19% | 134 -16% | 153 -33% | 135.5 -17% |
| Load Maximum * (Watt) | 130.7 | 186.6 -43% | 193 -48% | 204 -56% | 166 -27% | 203.7 -56% |
* ... más pequeño es mejor
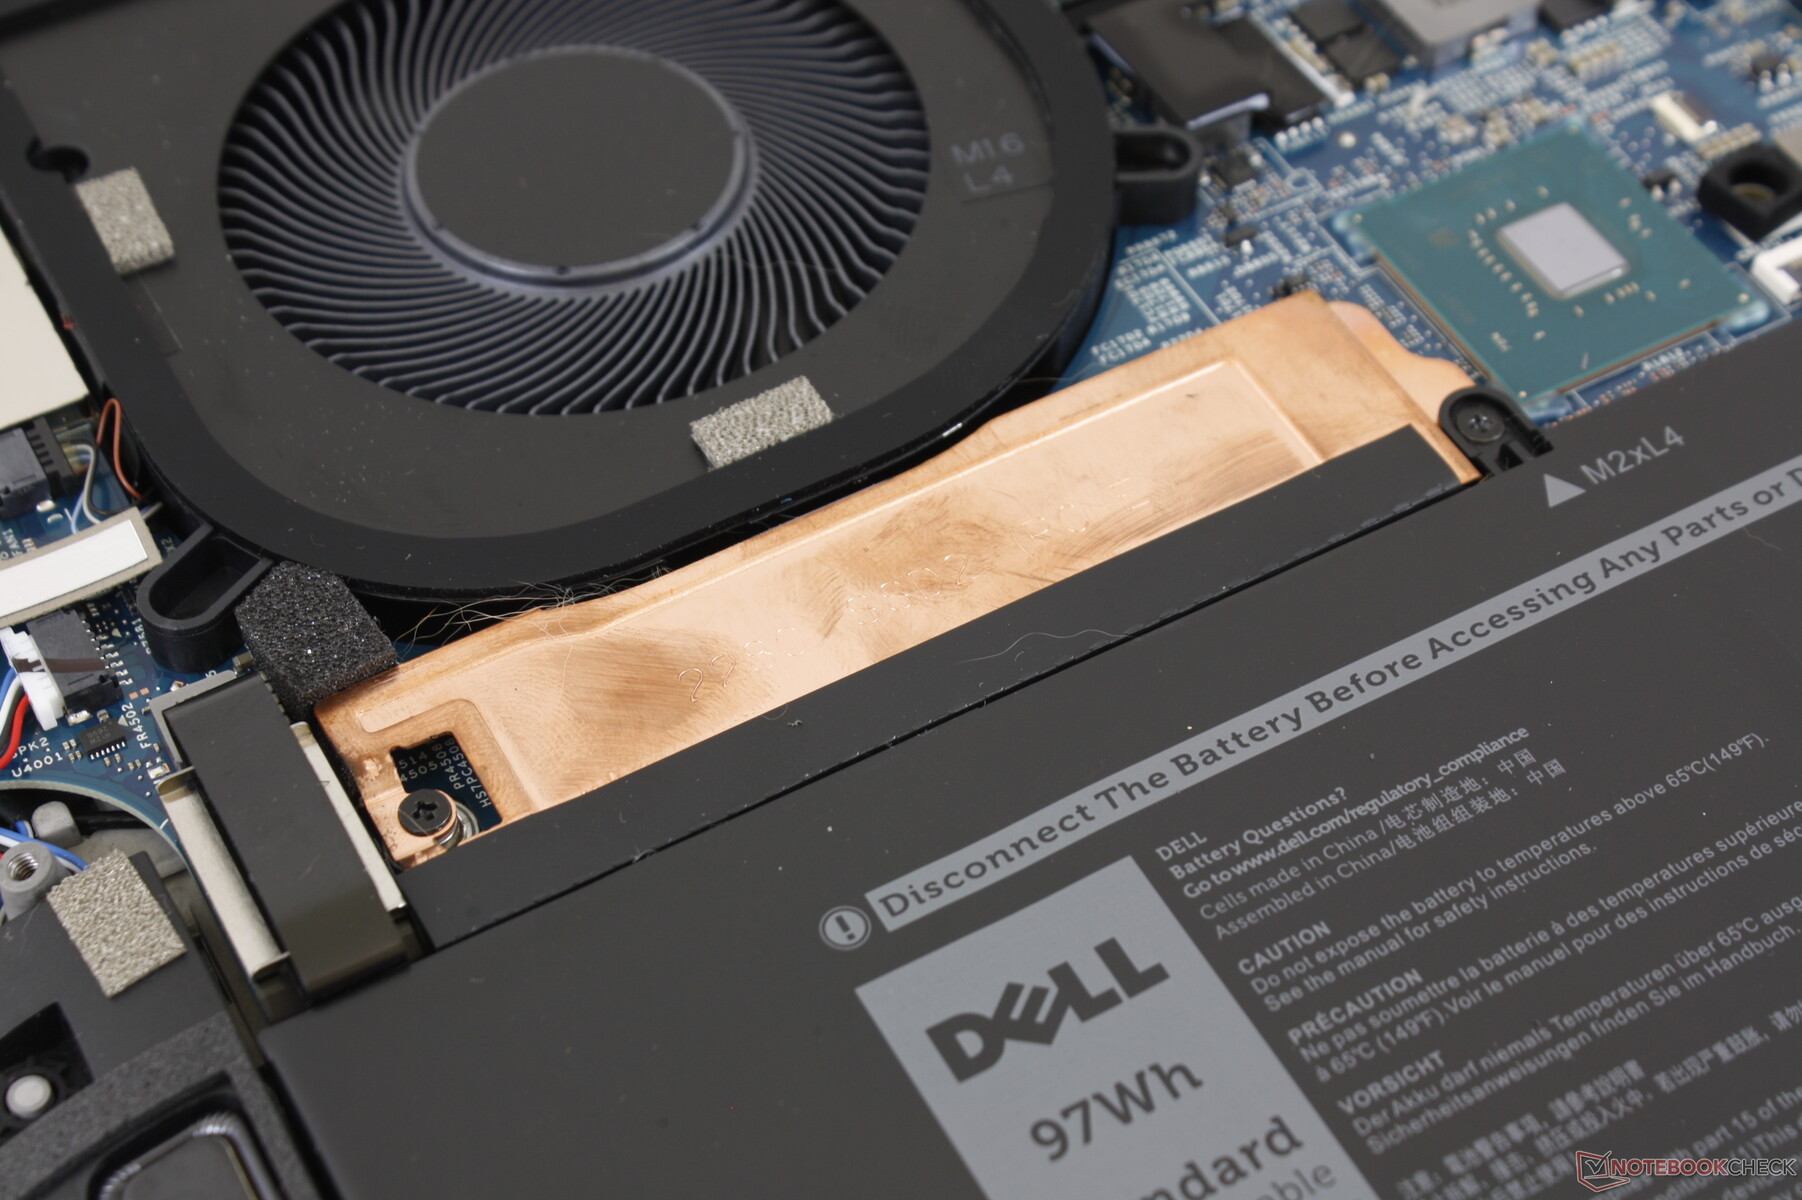
Duración de la batería
Los tiempos de funcionamiento son largos debido a la gran capacidad de la batería y el soporte de Optimus. Podemos registrar apenas 11 horas de uso de la WLAN en el mundo real cuando se navega por la web con un brillo de 150 nits en el perfil de potencia equilibrada.
La recarga desde la capacidad vacía a la plena capacidad toma alrededor de 2 horas.
| Dell Precision 5000 5750 P92F W-10885M, Quadro RTX 3000 Max-Q, 97 Wh | Asus ProArt StudioBook Pro 17 W700G3T i7-9750H, Quadro RTX 3000 Max-Q, 57 Wh | MSI WS75 9TL-636 i7-9750H, Quadro RTX 4000 (Laptop), 82 Wh | Dell Precision 7730 i7-8850H, Quadro P3200, 92 Wh | Lenovo ThinkPad P73-20QR002DGE i7-9850H, Quadro RTX 3000 (Laptop), 99 Wh | MSI WE75 9TK i7-9750H, Quadro RTX 3000 (Laptop), 65 Wh | |
|---|---|---|---|---|---|---|
| Duración de Batería | -35% | -38% | -41% | -17% | -50% | |
| Reader / Idle (h) | 18.2 | 12.6 -31% | 11 -40% | |||
| WiFi v1.3 (h) | 10.9 | 5.9 -46% | 6.6 -39% | 5.6 -49% | 11.1 2% | 4.9 -55% |
| Load (h) | 2.2 | 1.7 -23% | 1.2 -45% | 1.5 -32% | 1.4 -36% | 1 -55% |
Pro
Contra
Veredicto
El Precision 5750 es para usuarios que no necesitan ninguna de las características auxiliares del más grande Precision 7750 y prefieren omitirlas completamente en favor de un diseño más delgado, elegante y portátil. Si viajas mucho y no te importa un sistema de barebones que es parte Ultrabook y parte estación de trabajo, entonces esta Precision cumple ese papel. Se recomienda tener monitores Thunderbolt 3 y estaciones de acoplamiento para aprovechar al máximo el sistema.
Aparte de los sacrificios de hardware, hay algunos otros inconvenientes a tener en cuenta. En primer lugar, es desafortunado que la garantía base sea sólo de 12 meses, comparada con los 36 meses de la mayor Precision 7750, casi como si Dell viera la Precision 5550 como un modelo inferior. En segundo lugar, las temperaturas de la CPU serán bastante altas y con una tasa de recarga de la batería más lenta cuando se ejecuten cargas exigentes. Esto último se debe al pequeño adaptador de CA de 130 W que favorece la portabilidad en lugar de una mayor potencia. Es evidente que Dell ha diseñado el sistema para sobresalir en cargas de trabajo "explosivas", mientras que el más grande y potente Precision 7550/7570 lo hará mejor en cargas de trabajo sostenidas. Y por último, la falta de cualquier tipo de obturador de cámara web es extraña de ver en un diseño de chasis este nuevo.
El Precision 5750 es intencionalmente liviano en cuanto a las características del hardware en favor de un diseño más portátil. Si quieres una estación de trabajo de 17 pulgadas más fácil de transportar, entonces la Precision 5750 servirá.
Dell Precision 5000 5750 P92F
- 09/07/2020 v7 (old)
Allen Ngo
Price comparison
