
Veredicto - Galaxy Book6 Ultra es un portátil multimedia muy bueno
El nuevo Galaxy Book6 Ultra de Samsung es un muy buen portátil multimedia con una magnífica pantalla OLED, rendimiento suficiente con el procesador Panther Lake así como la GPU Nvidia Blackwell y un excelente sistema de altavoces. Sin embargo, el nuevo diseño del chasis es muy similar al del MacBook Pro de Apple y no nos sorprendería que muchos usuarios confundieran los dos sistemas. Esto también significa que Samsung se ha deshecho del teclado numérico, que puede ser un problema para algunos usuarios.
El rendimiento de los componentes es muy bueno para un portátil multimedia y la unidad de refrigeración funciona bien. Los ventiladores serán bastante audibles si estresa mucho el portátil en el modo de alto rendimiento, pero sigue siendo más silencioso que muchos rivales. Nos impresionó especialmente la nueva pantalla táctil OLED con su asombrosa calidad de imagen y sus precisos perfiles de color, pero el parpadeo PWM de gran amplitud es un problema.
La pantalla OLED con la frecuencia de actualización variable entre 30-120 Hz también es muy eficiente y da como resultado una excelente duración de la batería que supera claramente a todas las alternativas de Windows, a pesar de la menor capacidad de la batería. Sin embargo, si desea más rendimiento, pantallas aún mejores (paneles OLED en tándem) y teclados superiores, debería echar un vistazo al Asus ProArt P16 o Yoga Pro 9i 16 de Lenovo. Apple's MacBook Pro también es obviamente un rival y también ofrece una pantalla más brillante, más puertos y ventiladores más silenciosos. El rendimiento del M4 Pro o M4 Max también es mejor y los próximos modelos M5 Pro/M5 Max deberían aumentar aún más la diferencia.
Pro
Contra
Precio y disponibilidad
Aún no tenemos información sobre el precio o la disponibilidad en EE.UU.
Índice
- Veredicto - Galaxy Book6 Ultra es un portátil multimedia muy bueno
- Especificaciones
- Caja y conectividad
- Dispositivos de entrada
- Pantalla - Nueva pantalla táctil OLED
- Actuación - El lago Pantera se encuentra con Blackwell
- Emisiones y consumo de energía
- Valoración de Notebookcheck
- Competidores potenciales en comparación
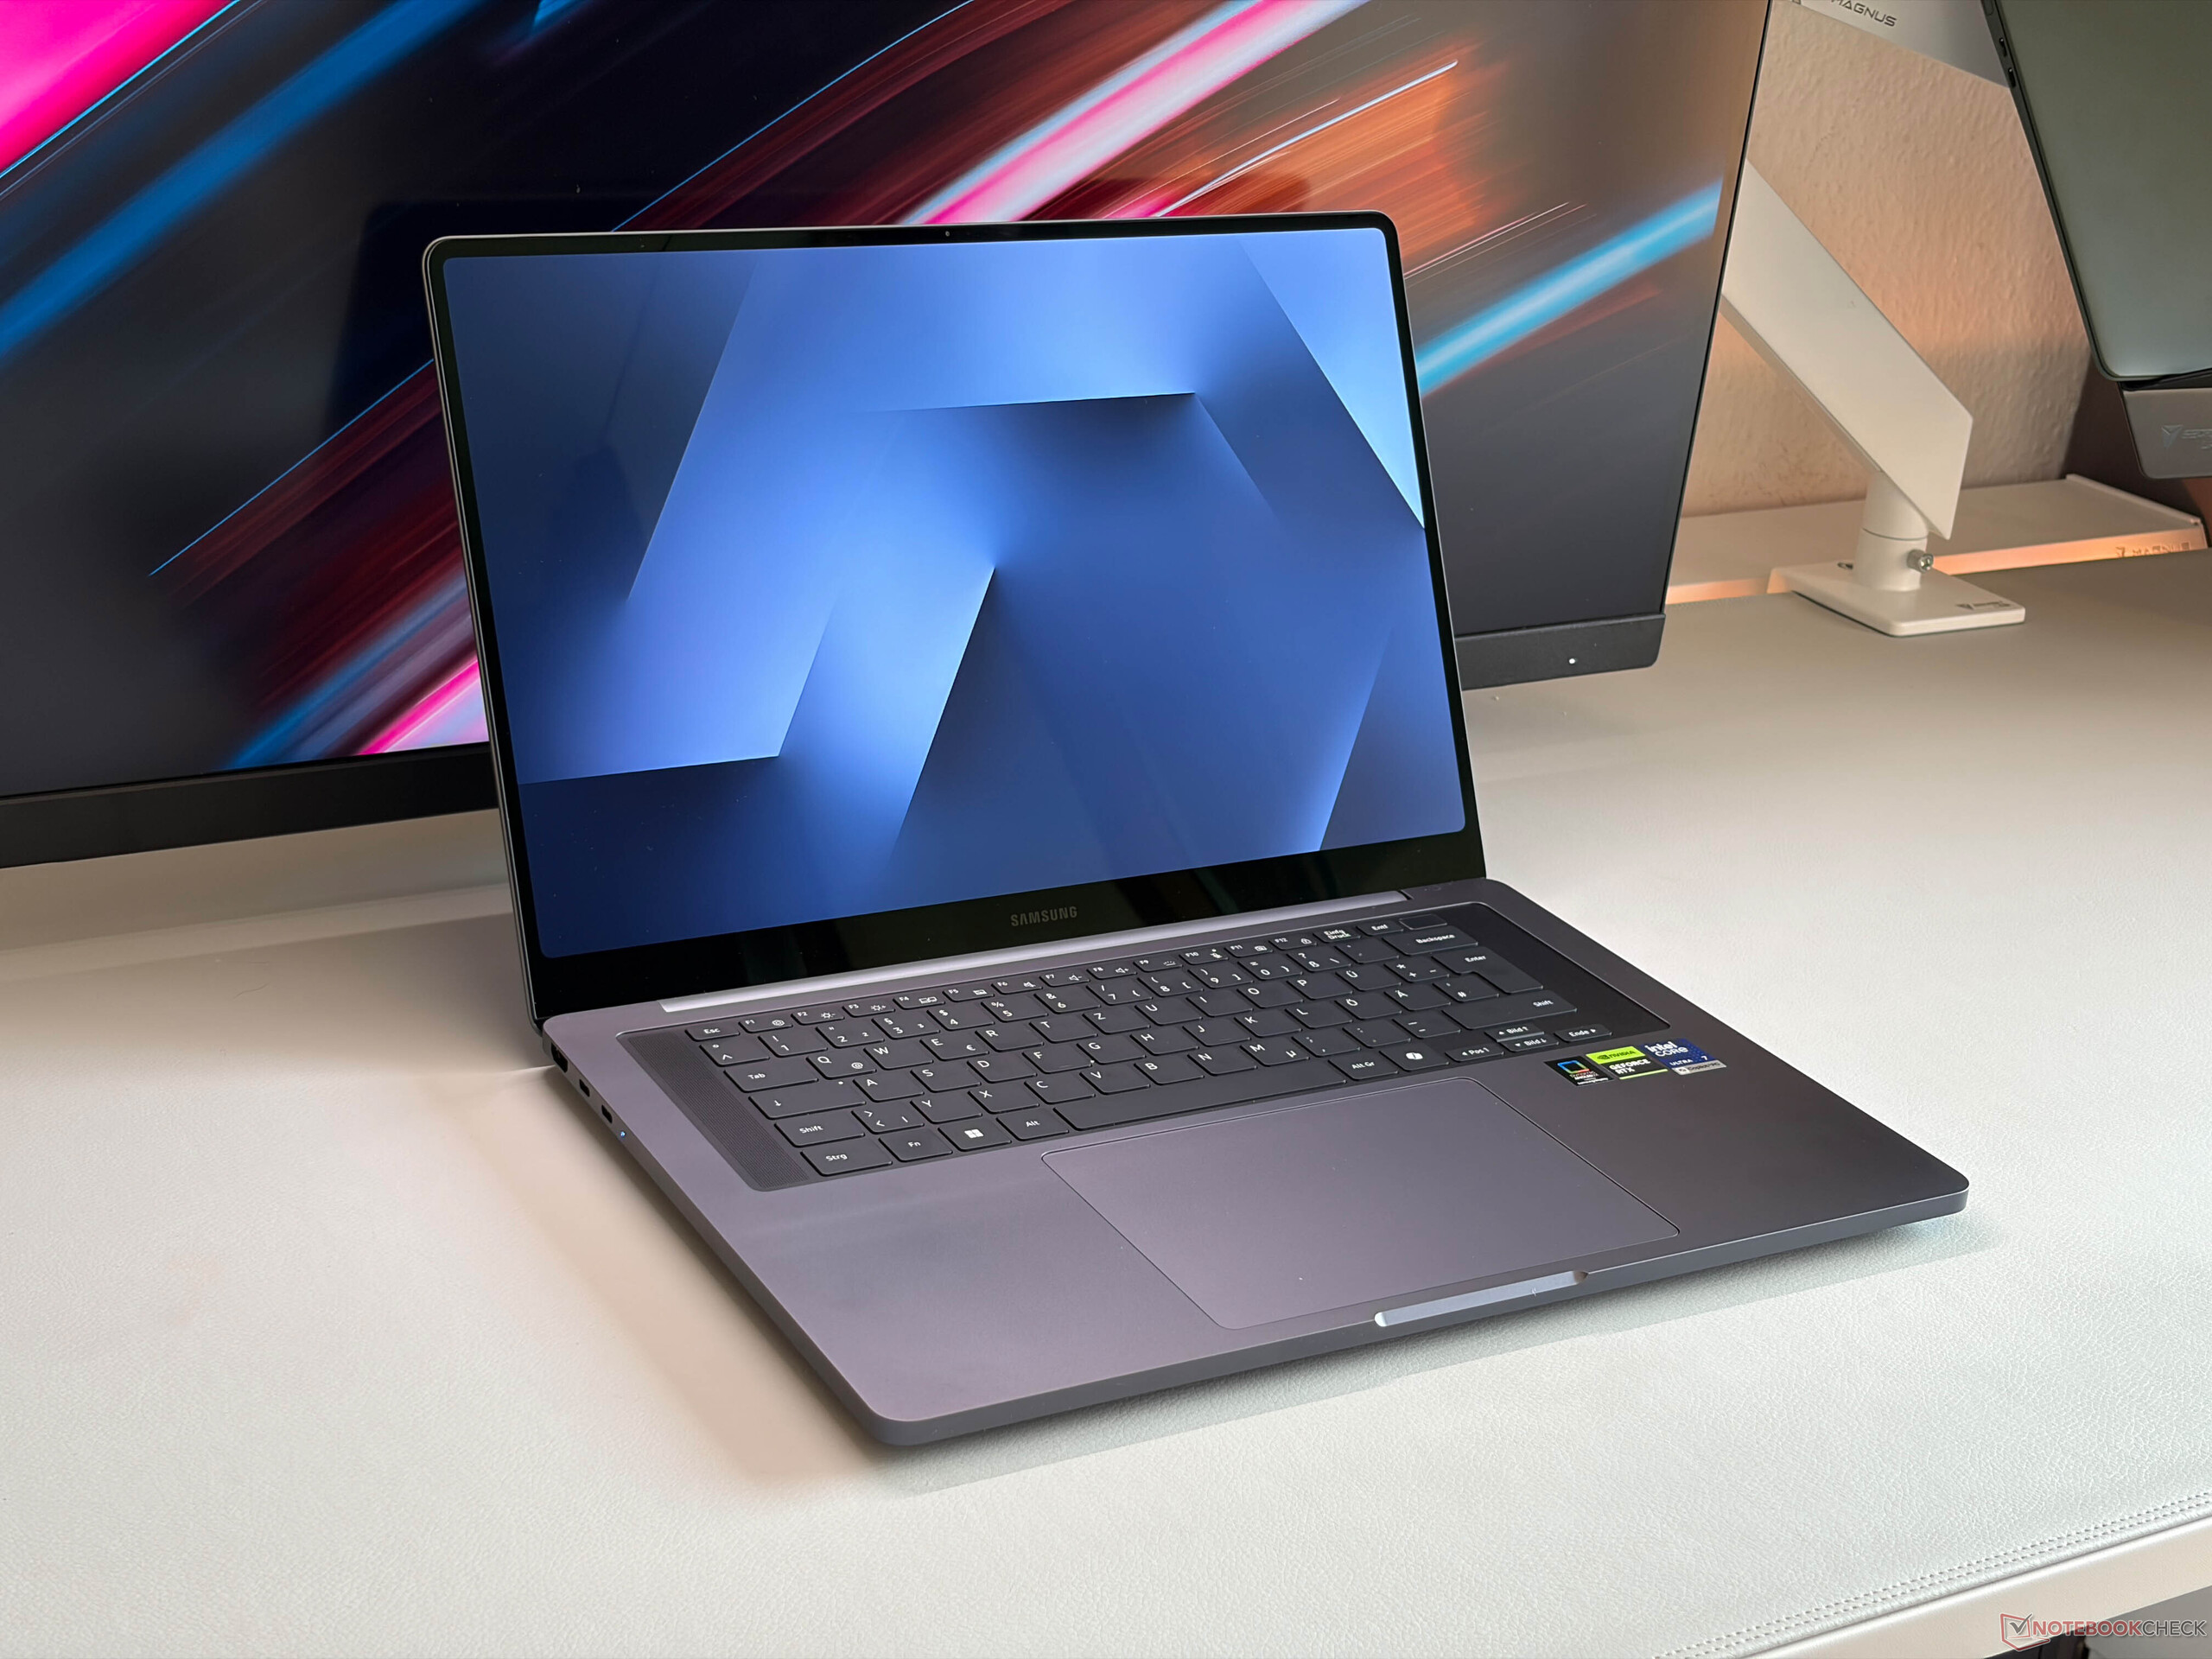
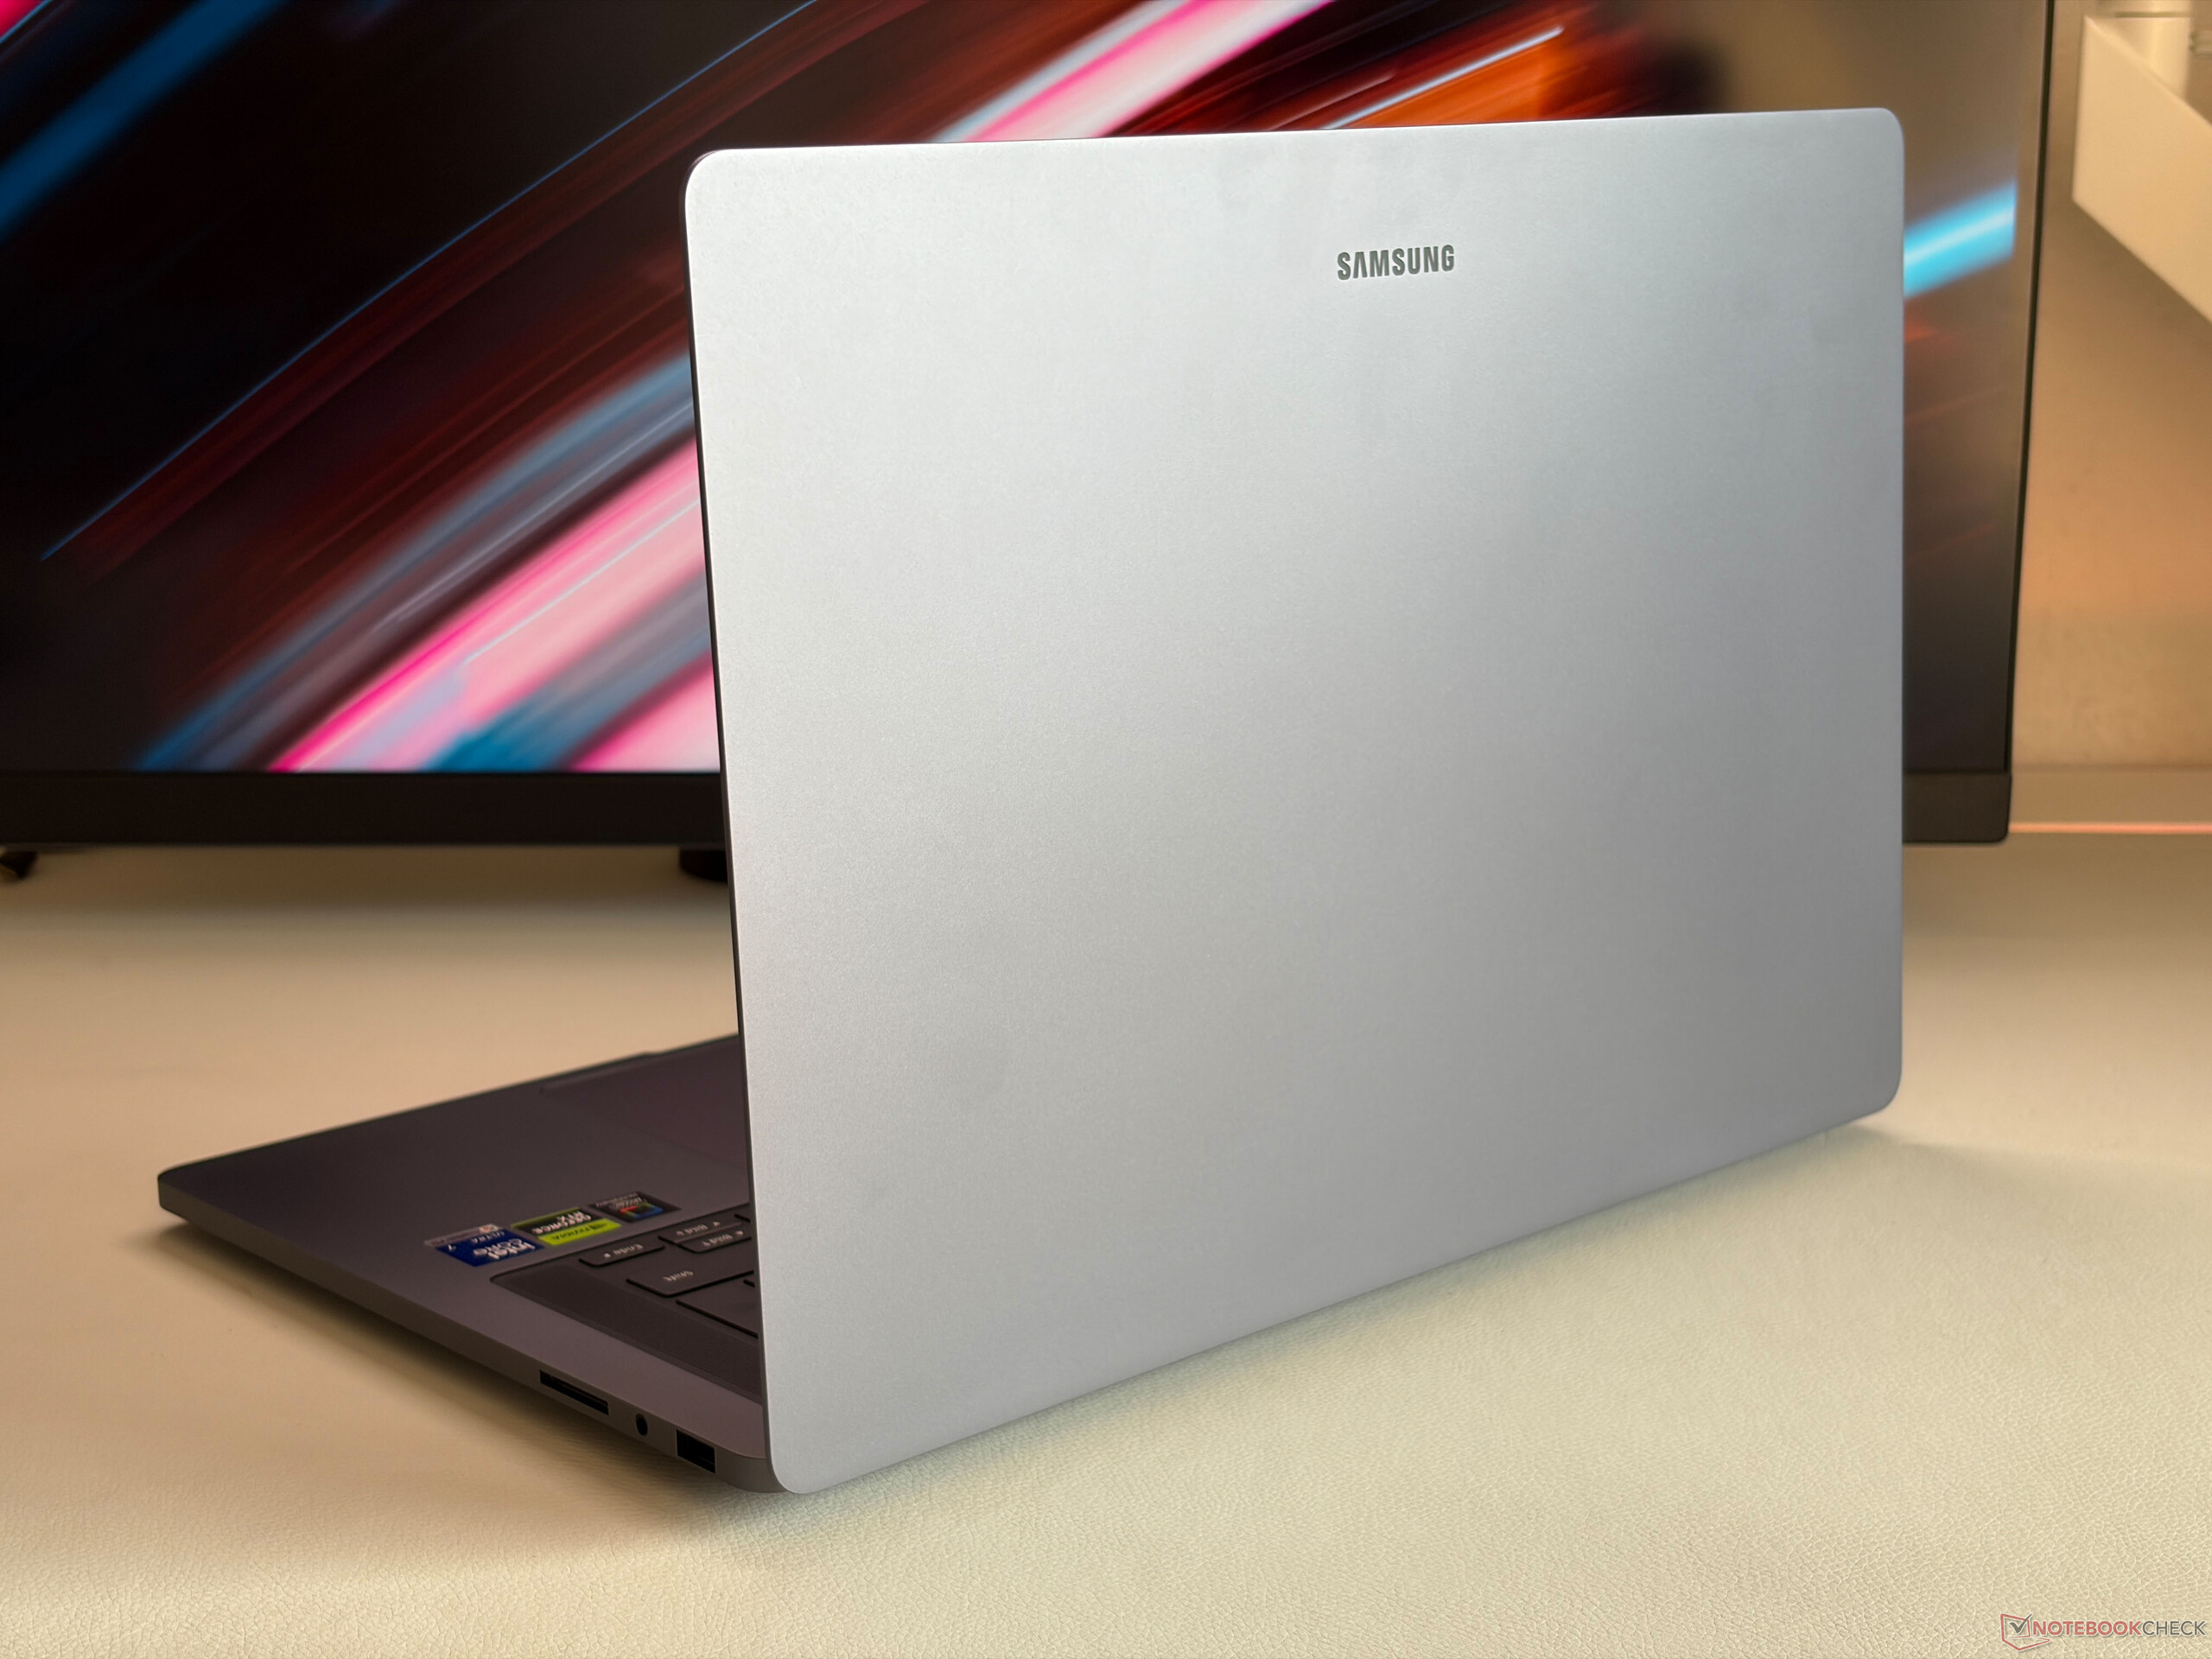
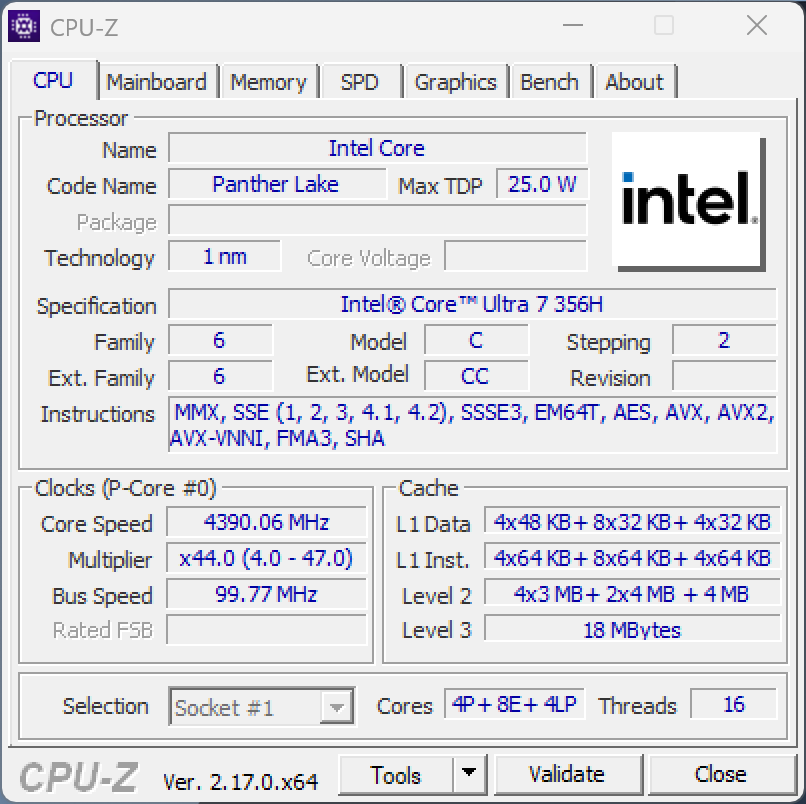
Samsung renueva su portátil más potente, el Galaxy Book6 Ultra. El dispositivo multimedia de 16 pulgadas incorpora ahora nuevos chips Intel Panther Lake, GPU Nvidia Blackwell opcionales, así como una nueva pantalla táctil OLED dentro de un chasis revisado. Analizamos el modelo con el Core Ultra 7 356H, GeForce RTX 5070, 32 GB de RAM y 1 TB de almacenamiento SSD.
Especificaciones
Caja y conectividad
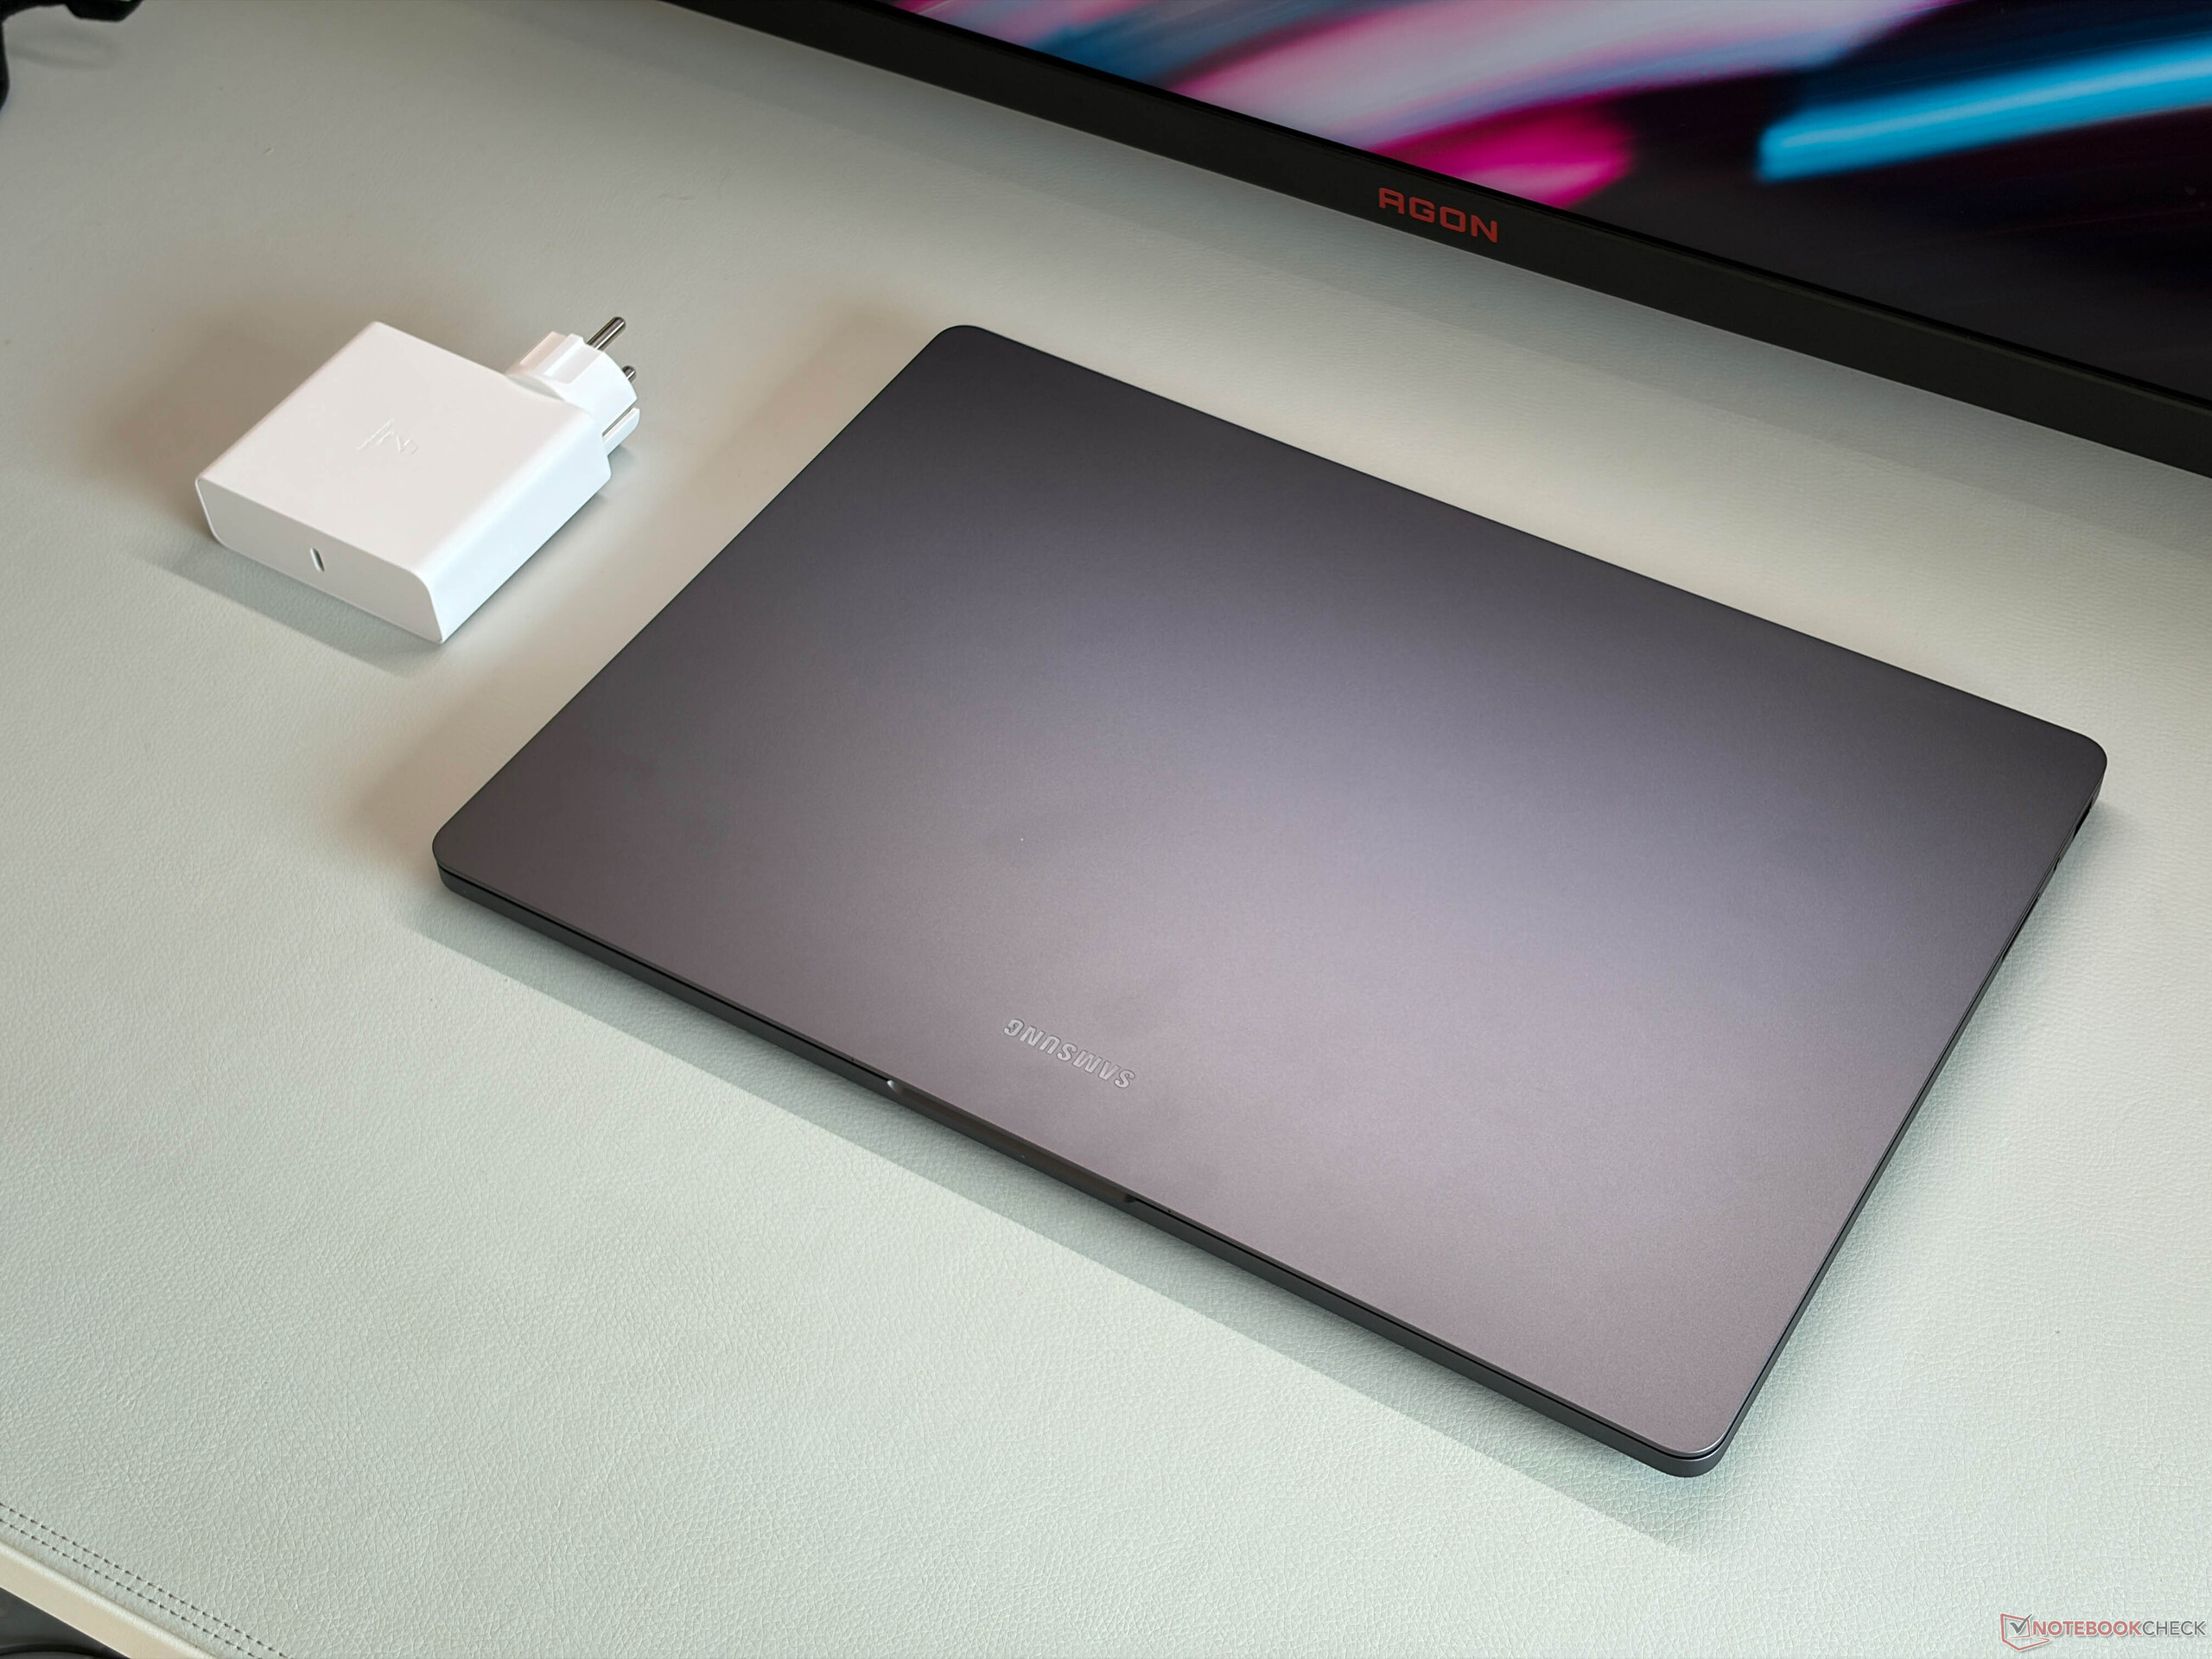
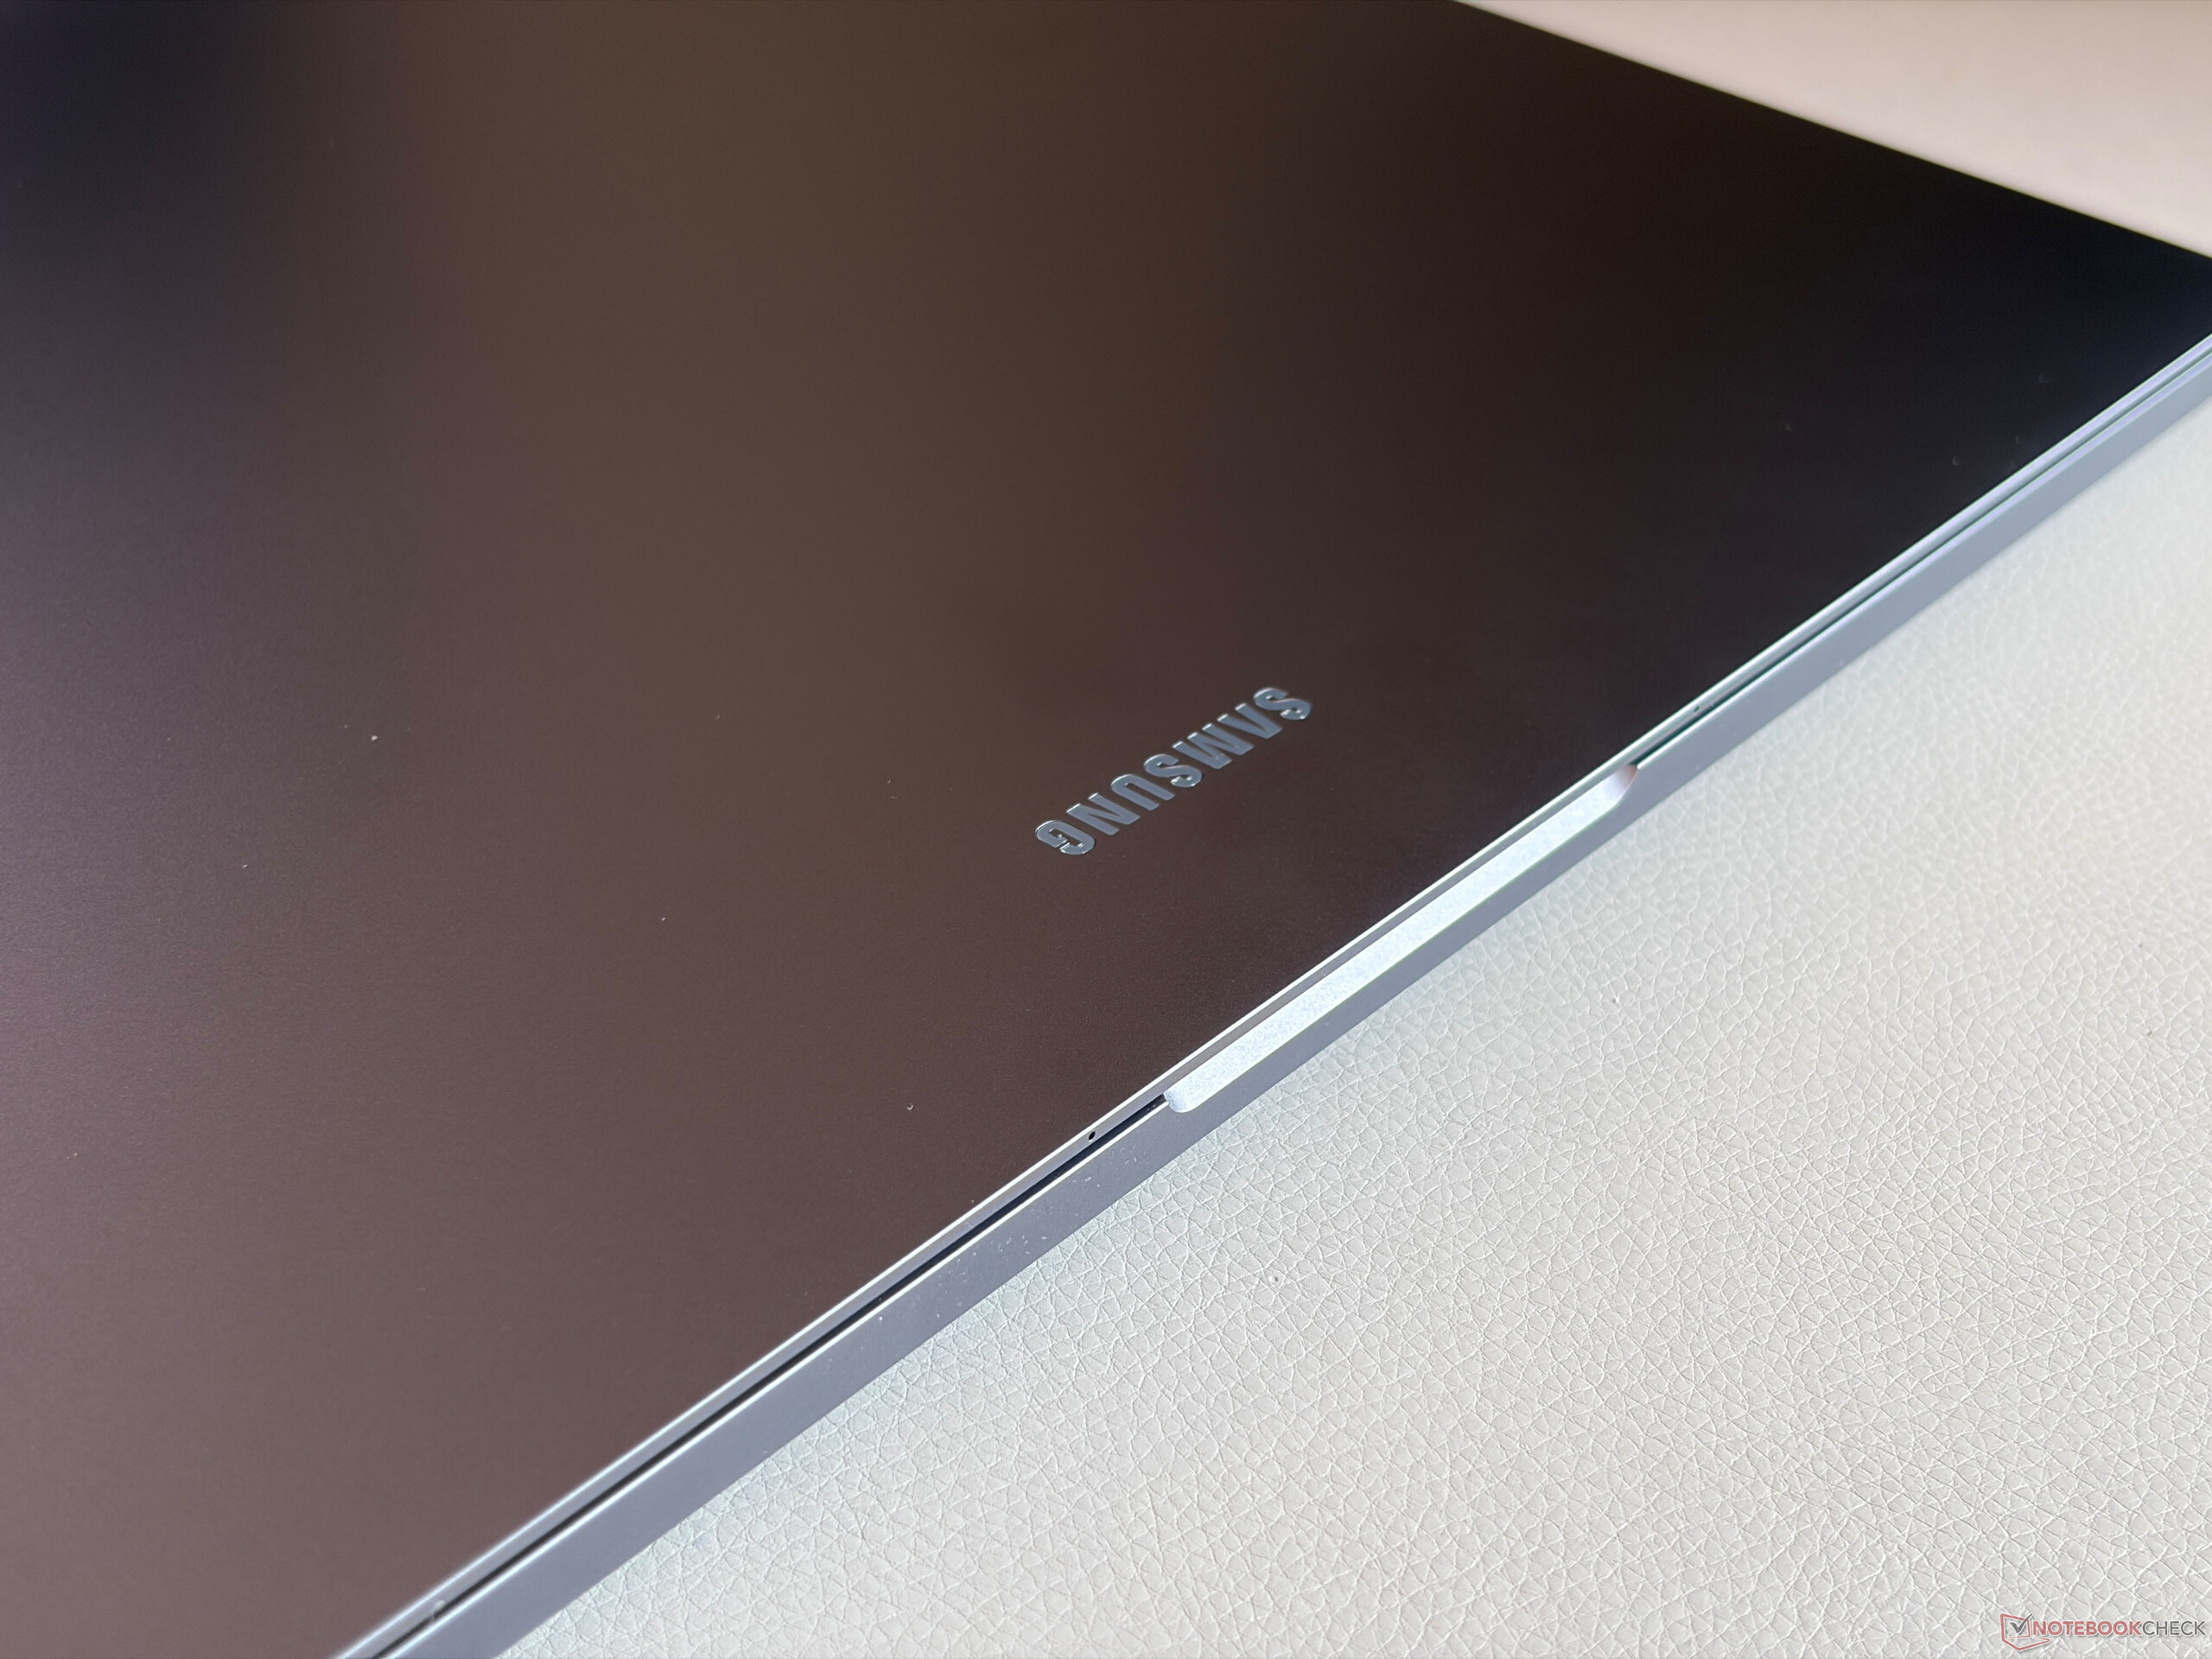
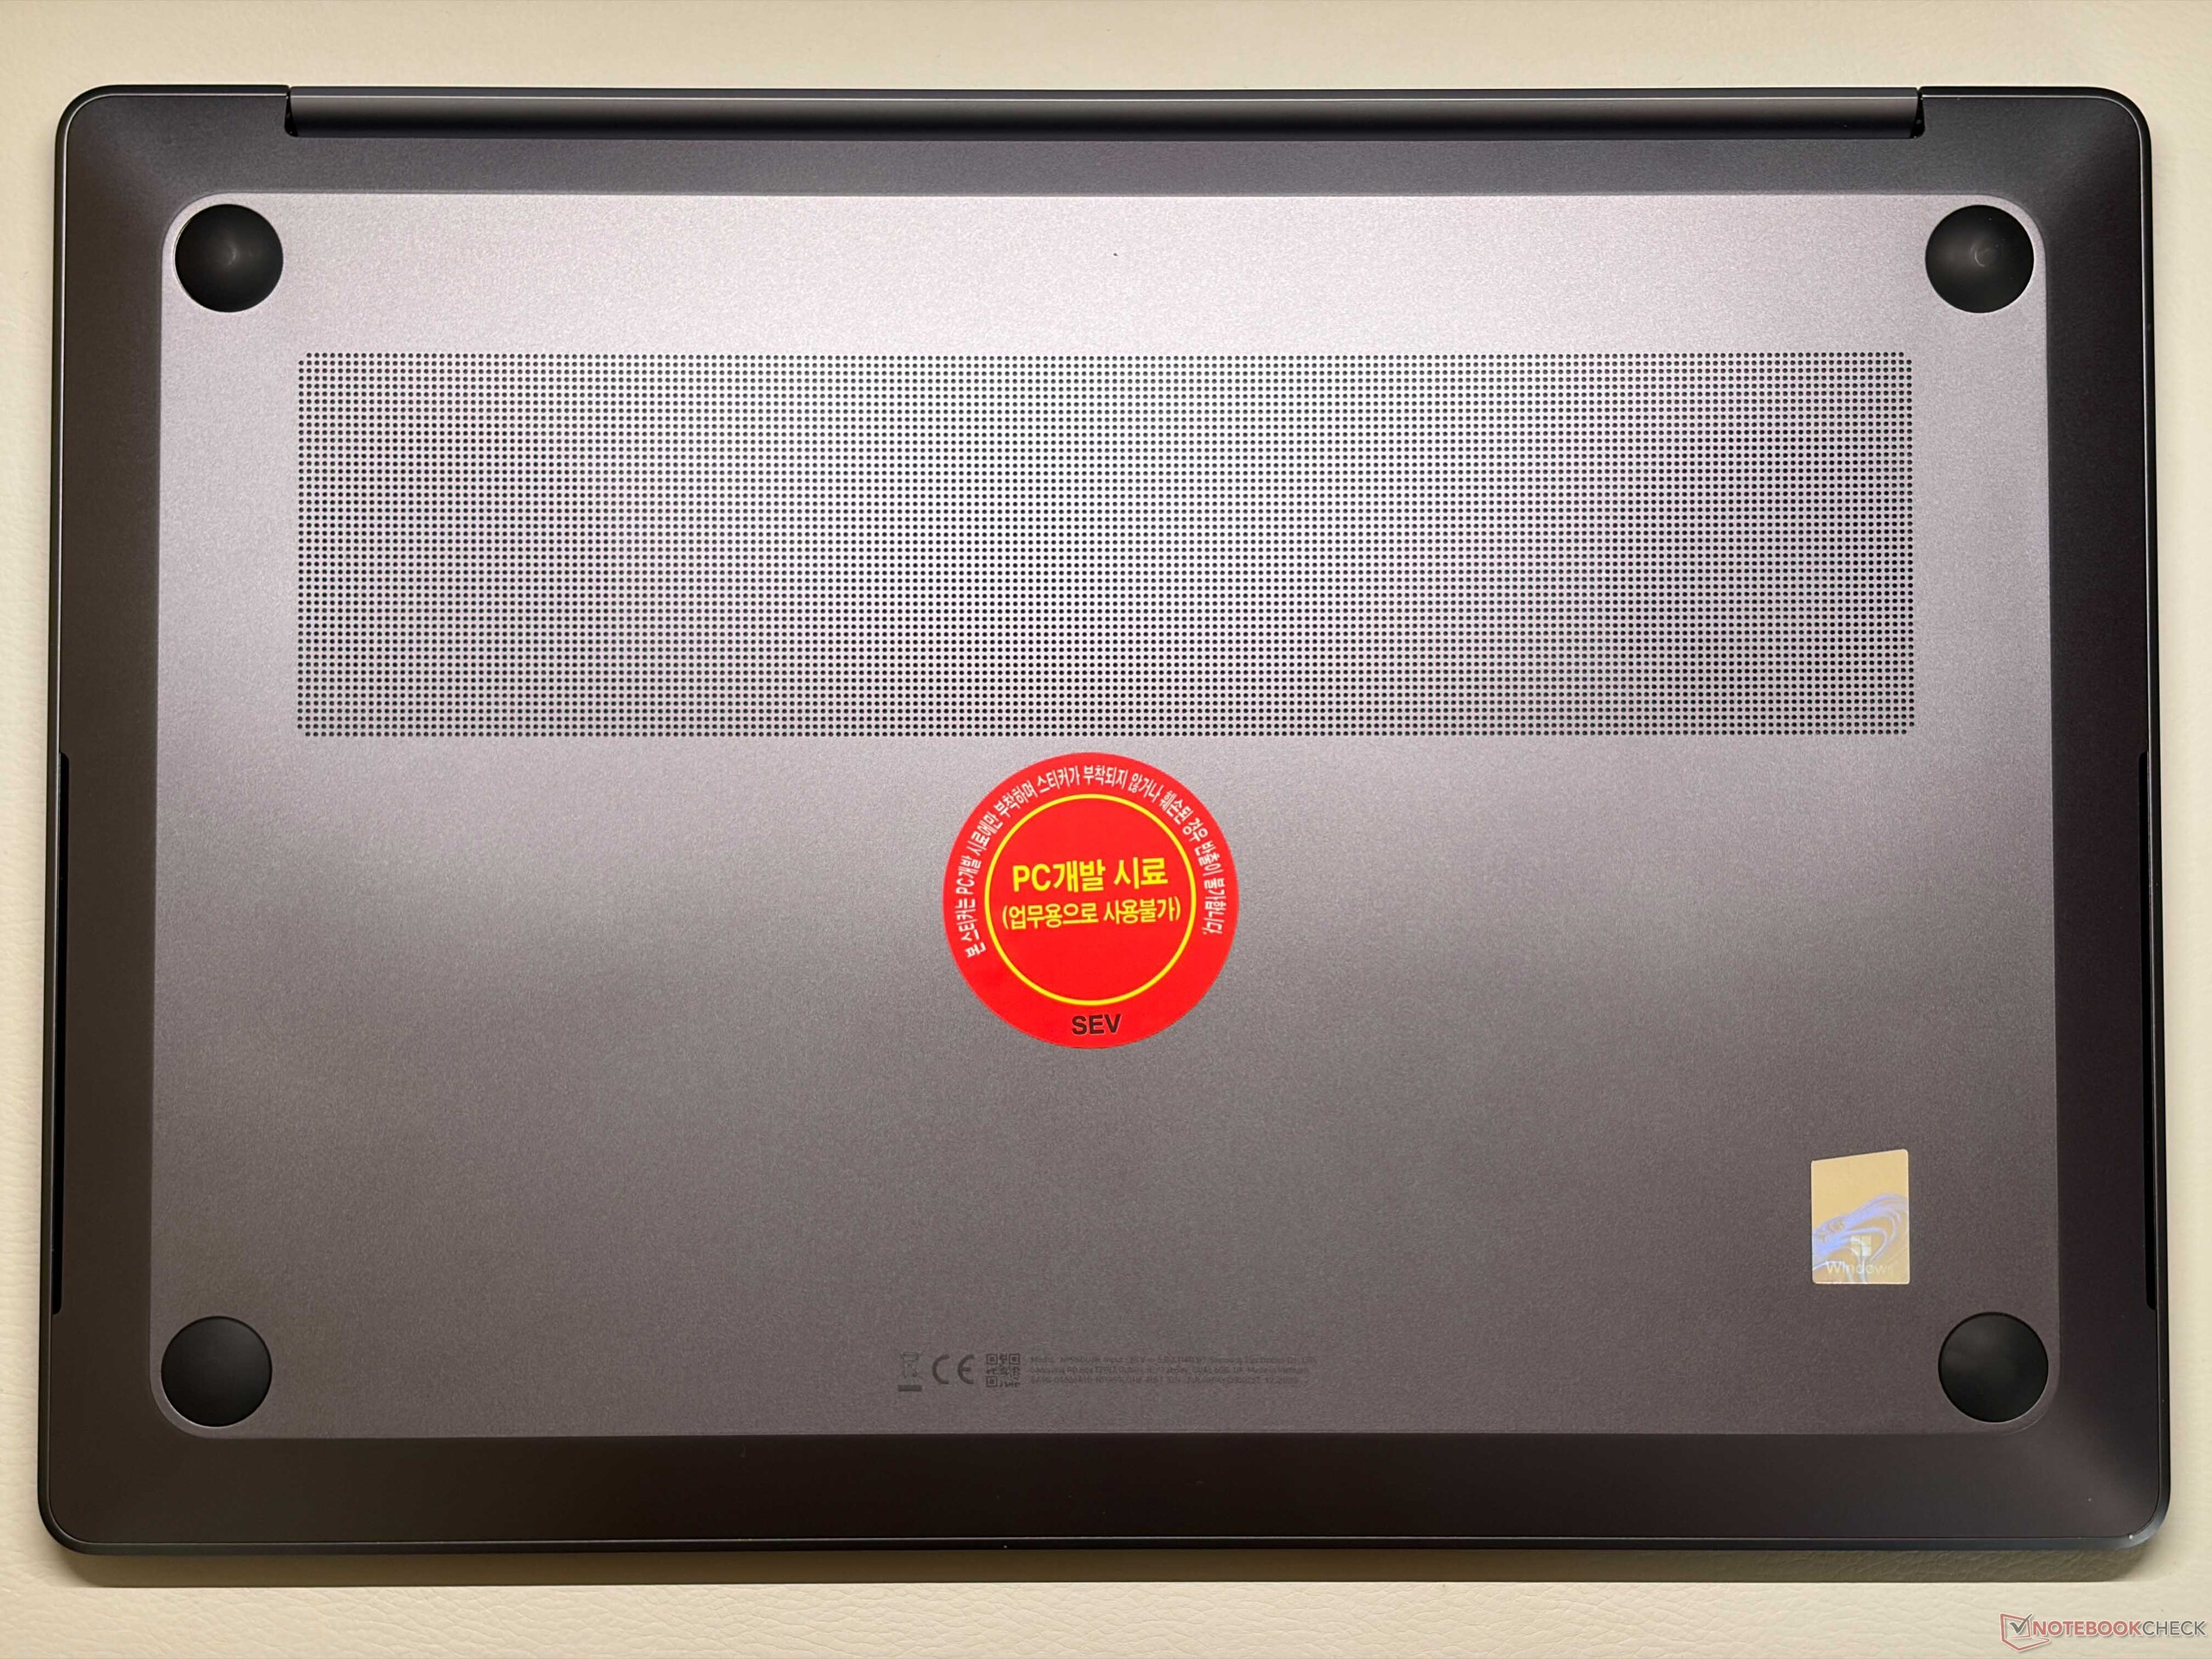
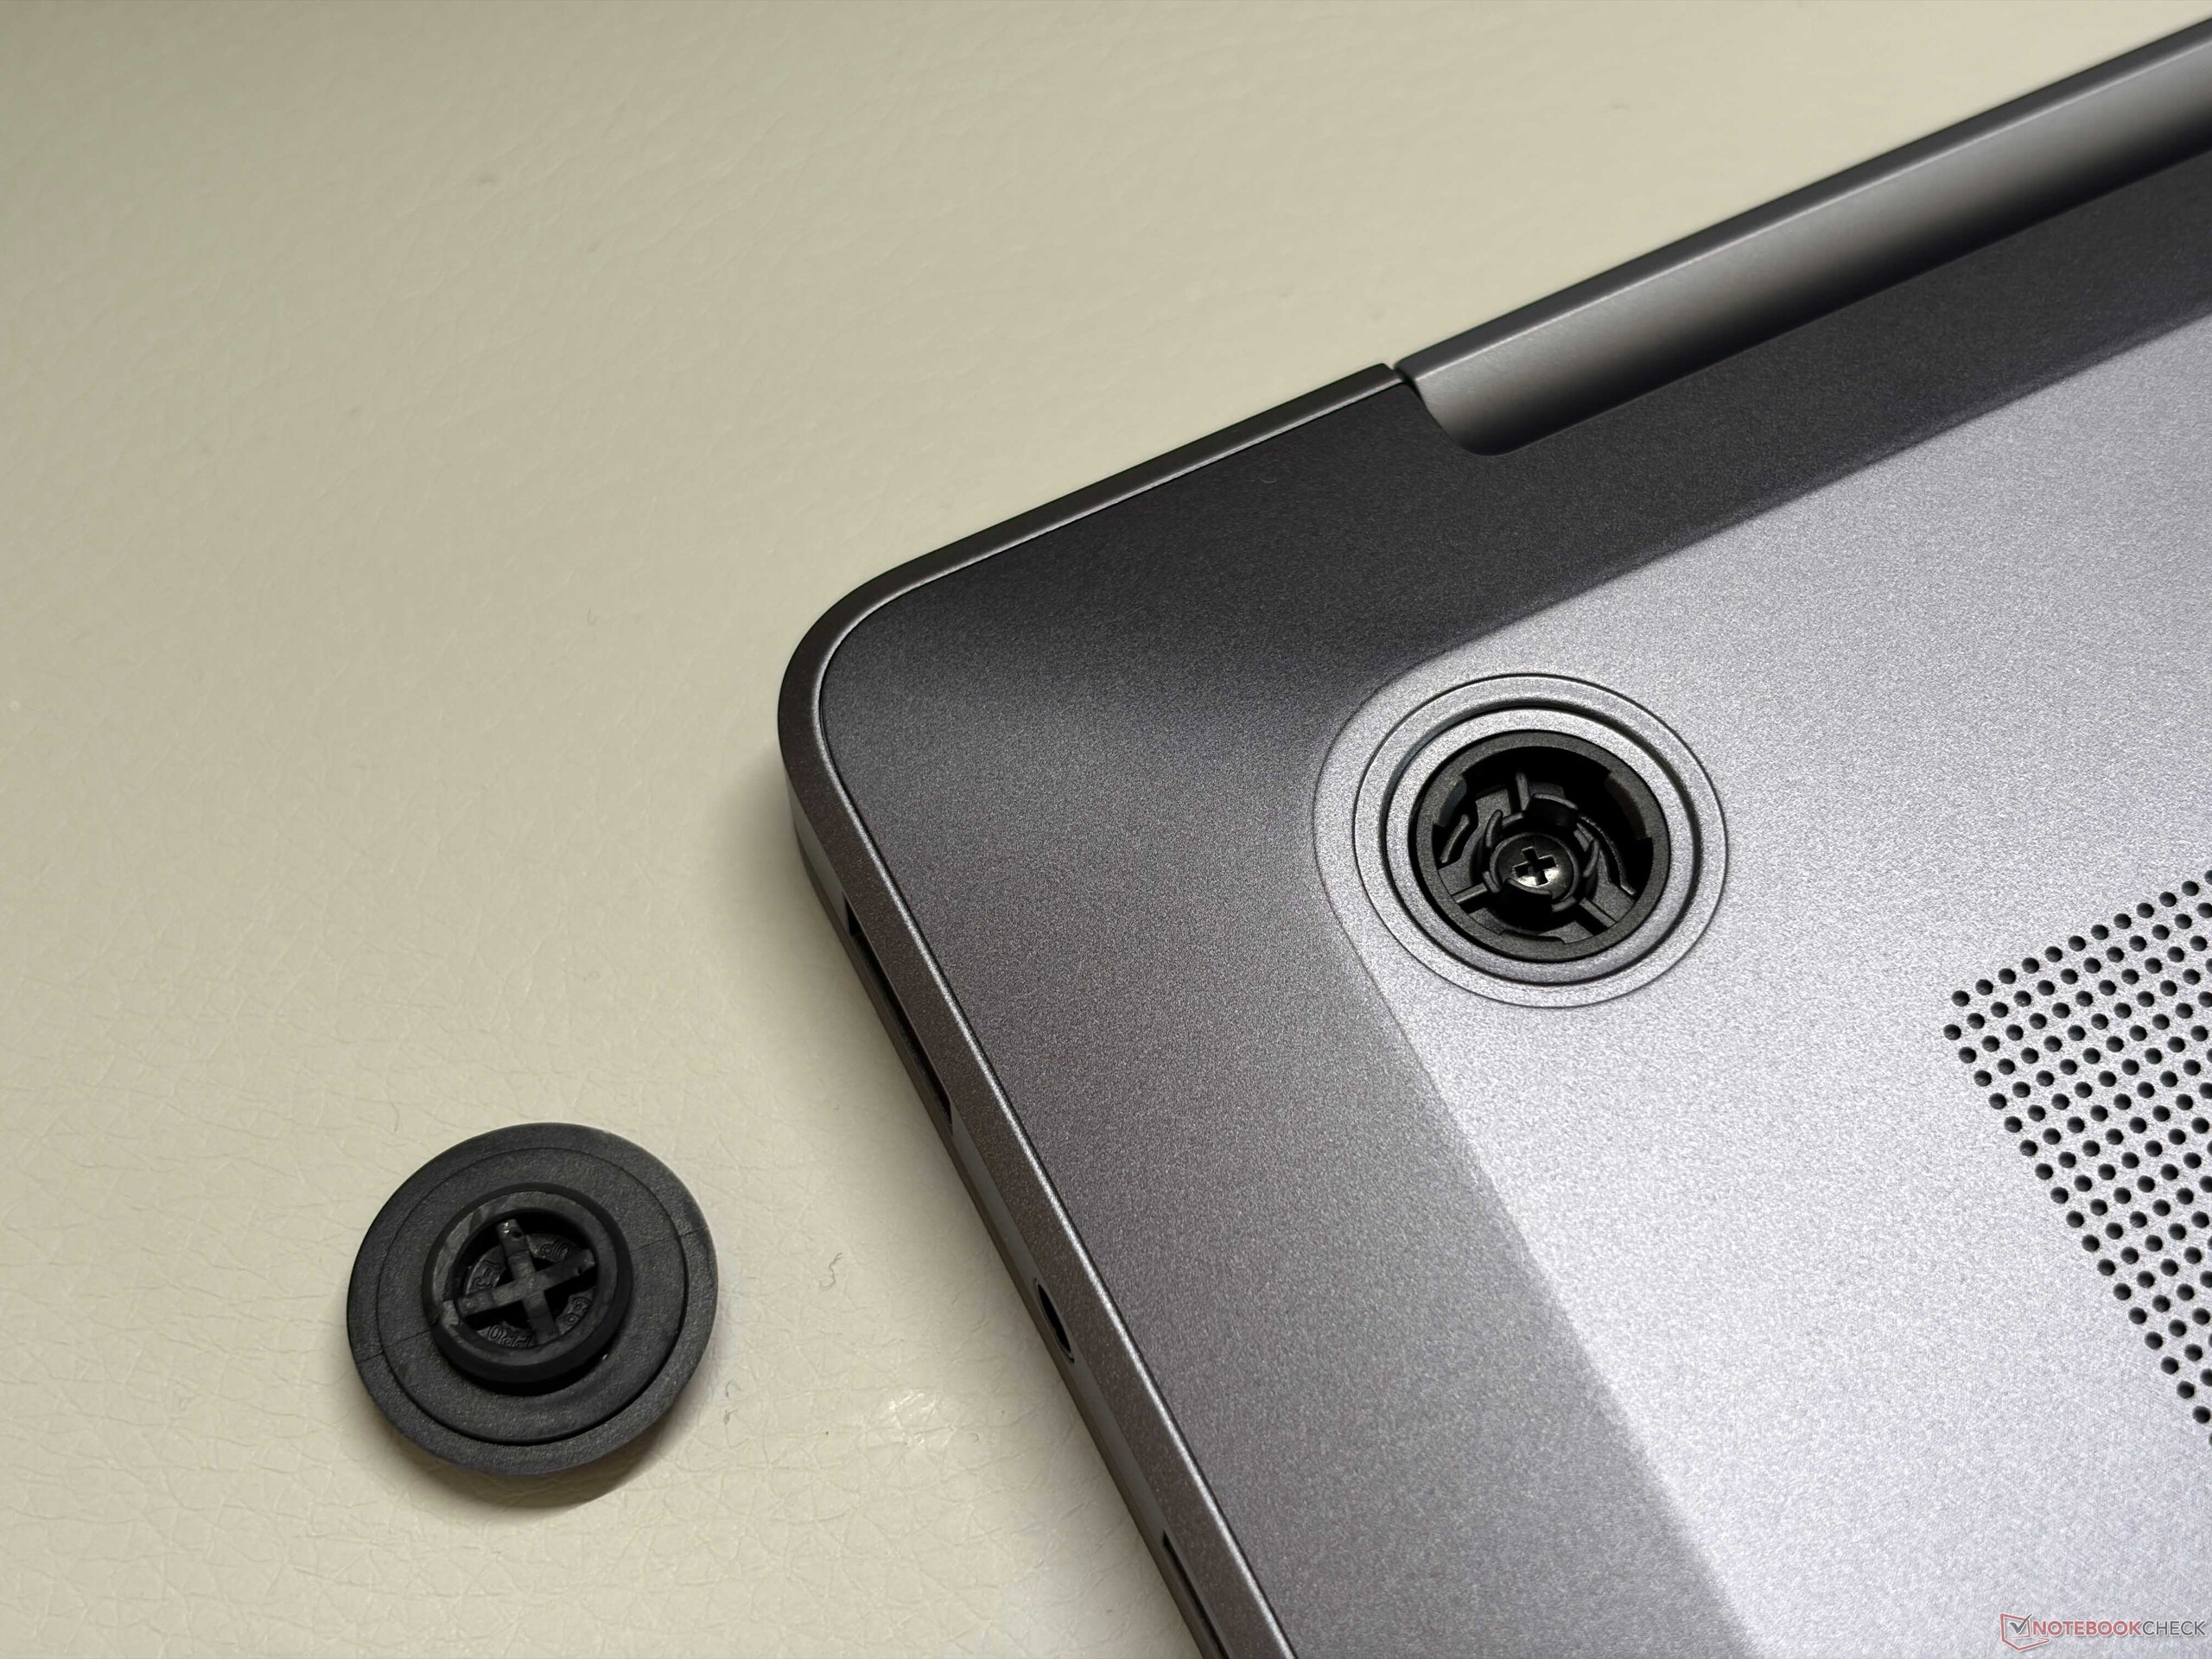
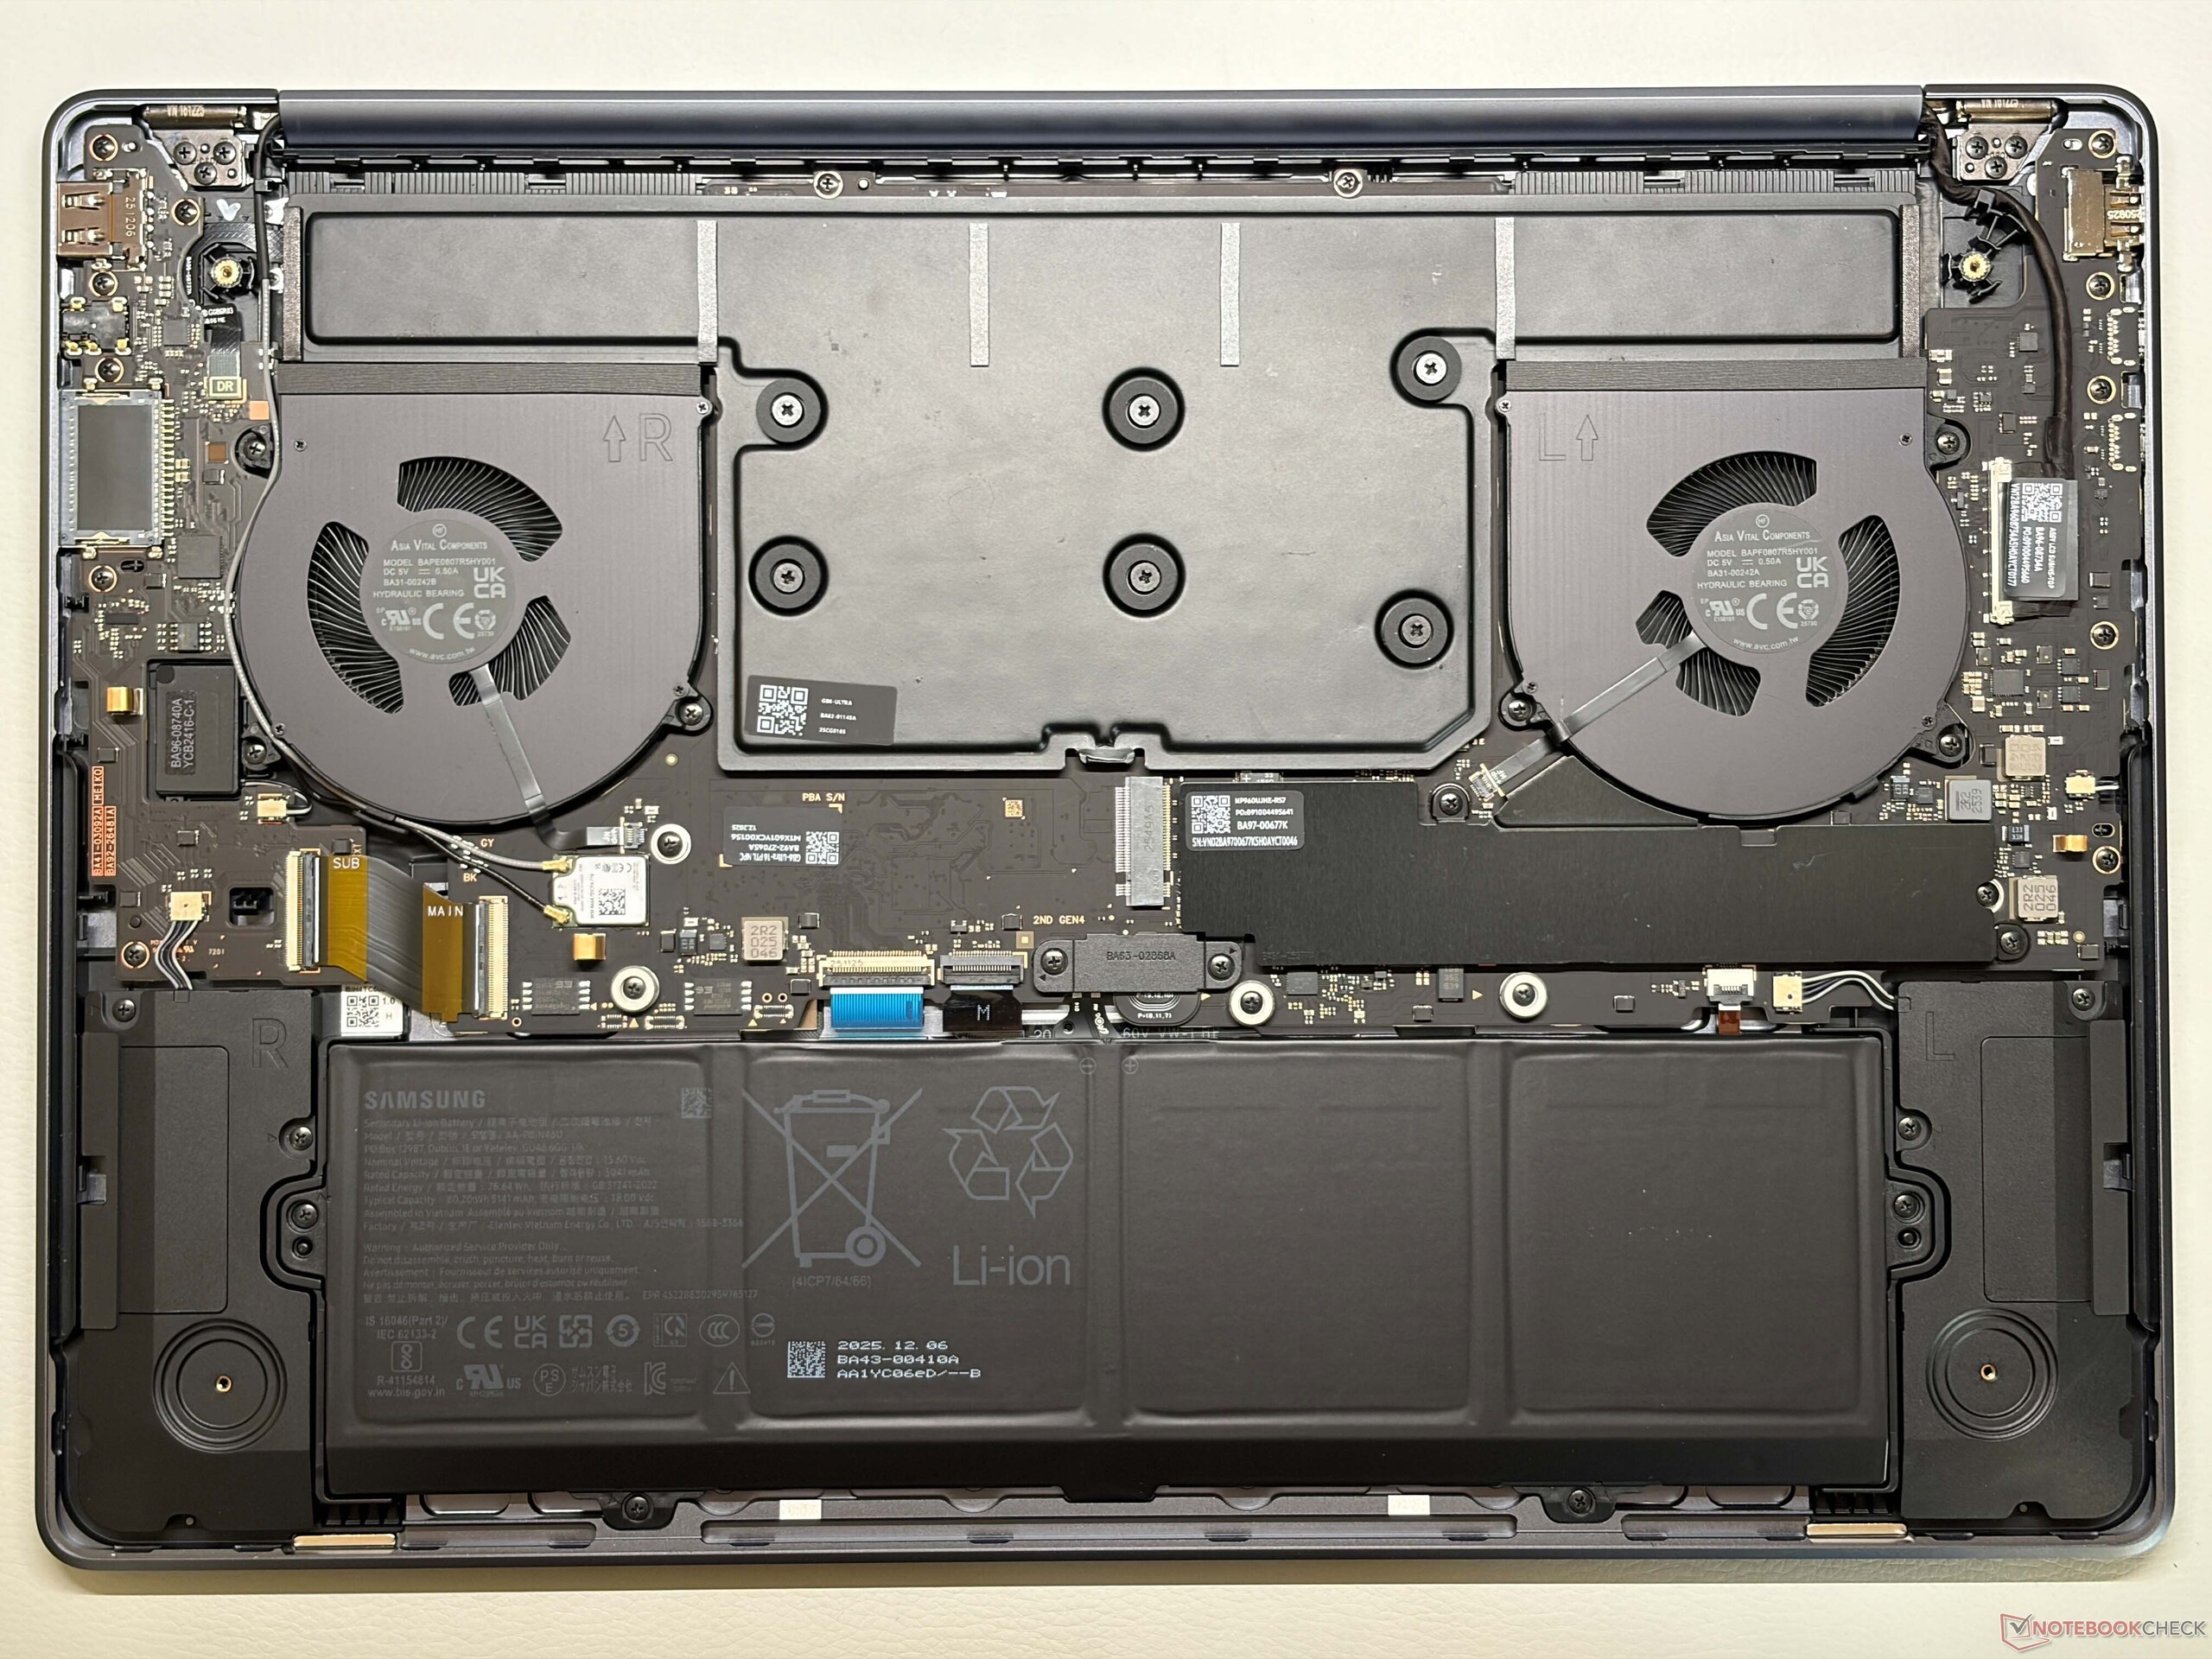
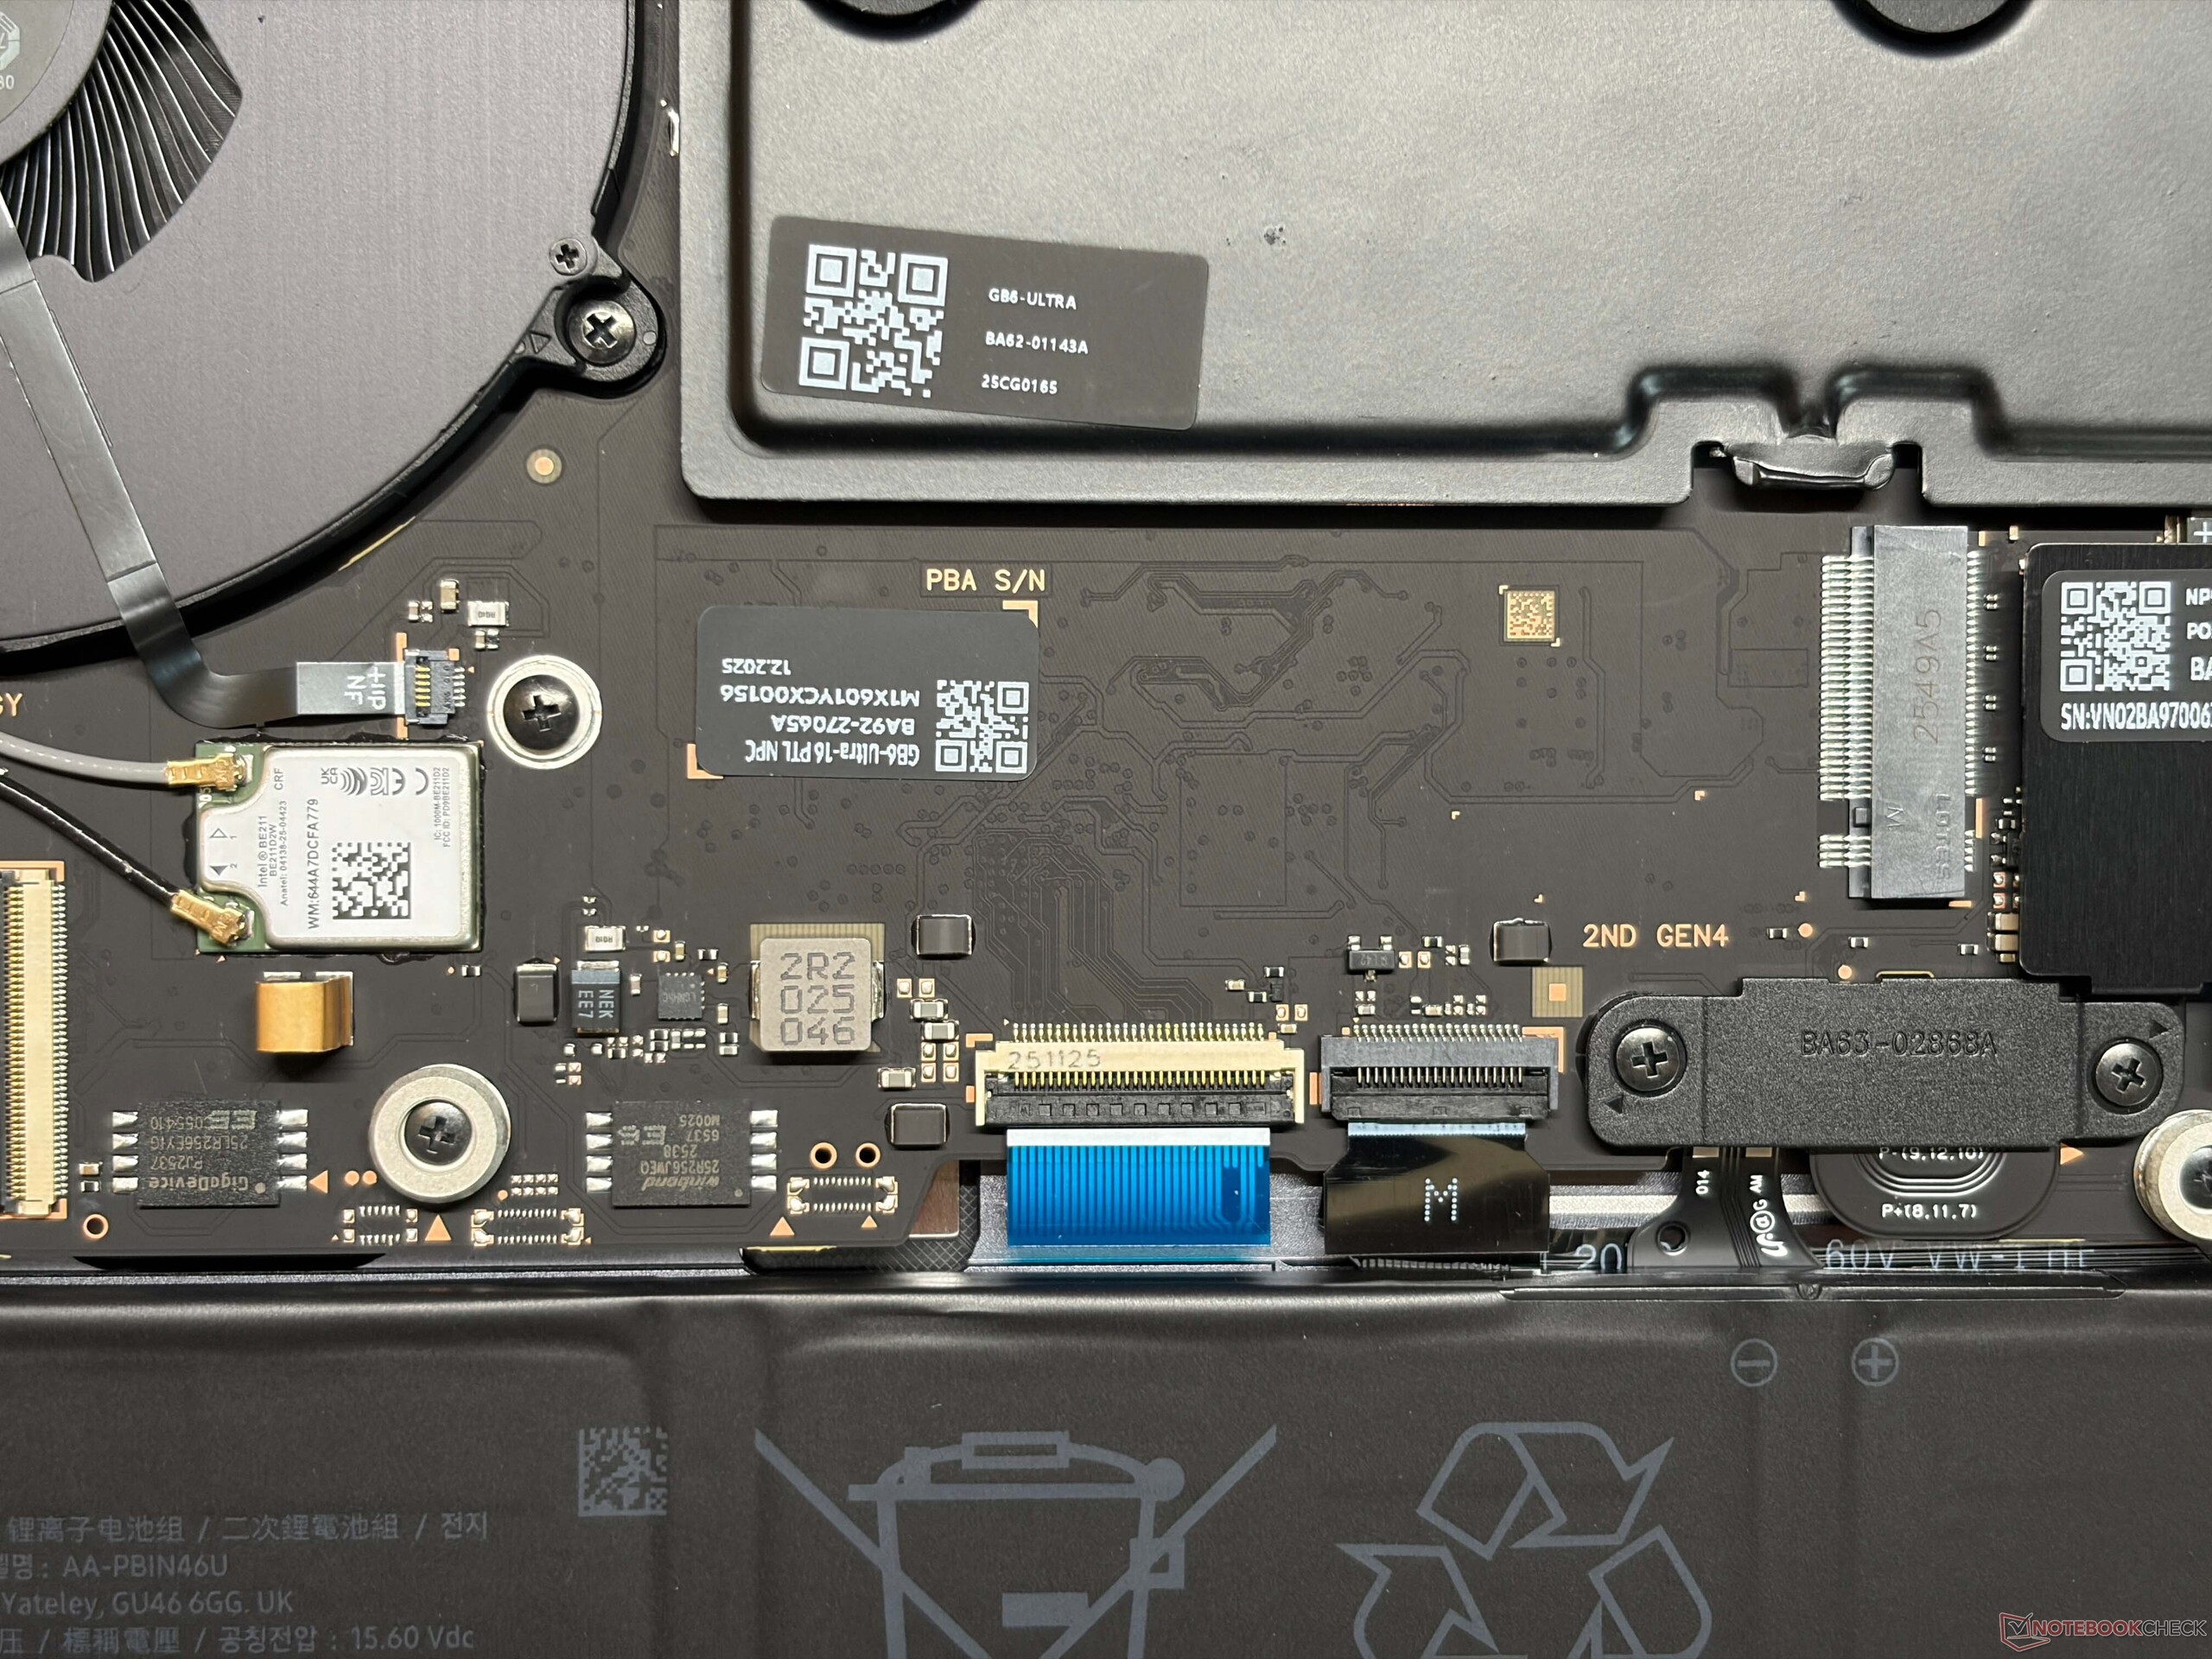
Samsung se deshizo del diseño anterior con la unidad base en forma de cuña (que se sigue utilizando para los otros modelos Galaxy Book6) y el nuevo Galaxy Book6 Ultra se parece y se siente mucho más como un MacBook Pro 16. Estamos bastante seguros de que a muchos usuarios les costaría diferenciar entre los dos modelos si se quitan los logotipos. La calidad general del Galaxy Book6 Ultra con el chasis de aluminio es excelente, tanto en términos de estabilidad como de calidad de construcción. Sin embargo, las huellas dactilares son un problema y las superficies no son fáciles de limpiar. No estamos contentos con las bisagras (ángulo máximo de apertura ~135 grados), porque la pantalla se tambalea bastante. El bisel inferior también es muy grueso. Puede retirar el panel inferior y acceder a las ranuras bot SSD, a la batería y a los ventiladores, pero la memoria y el módulo Wi-Fi no se pueden sustituir.
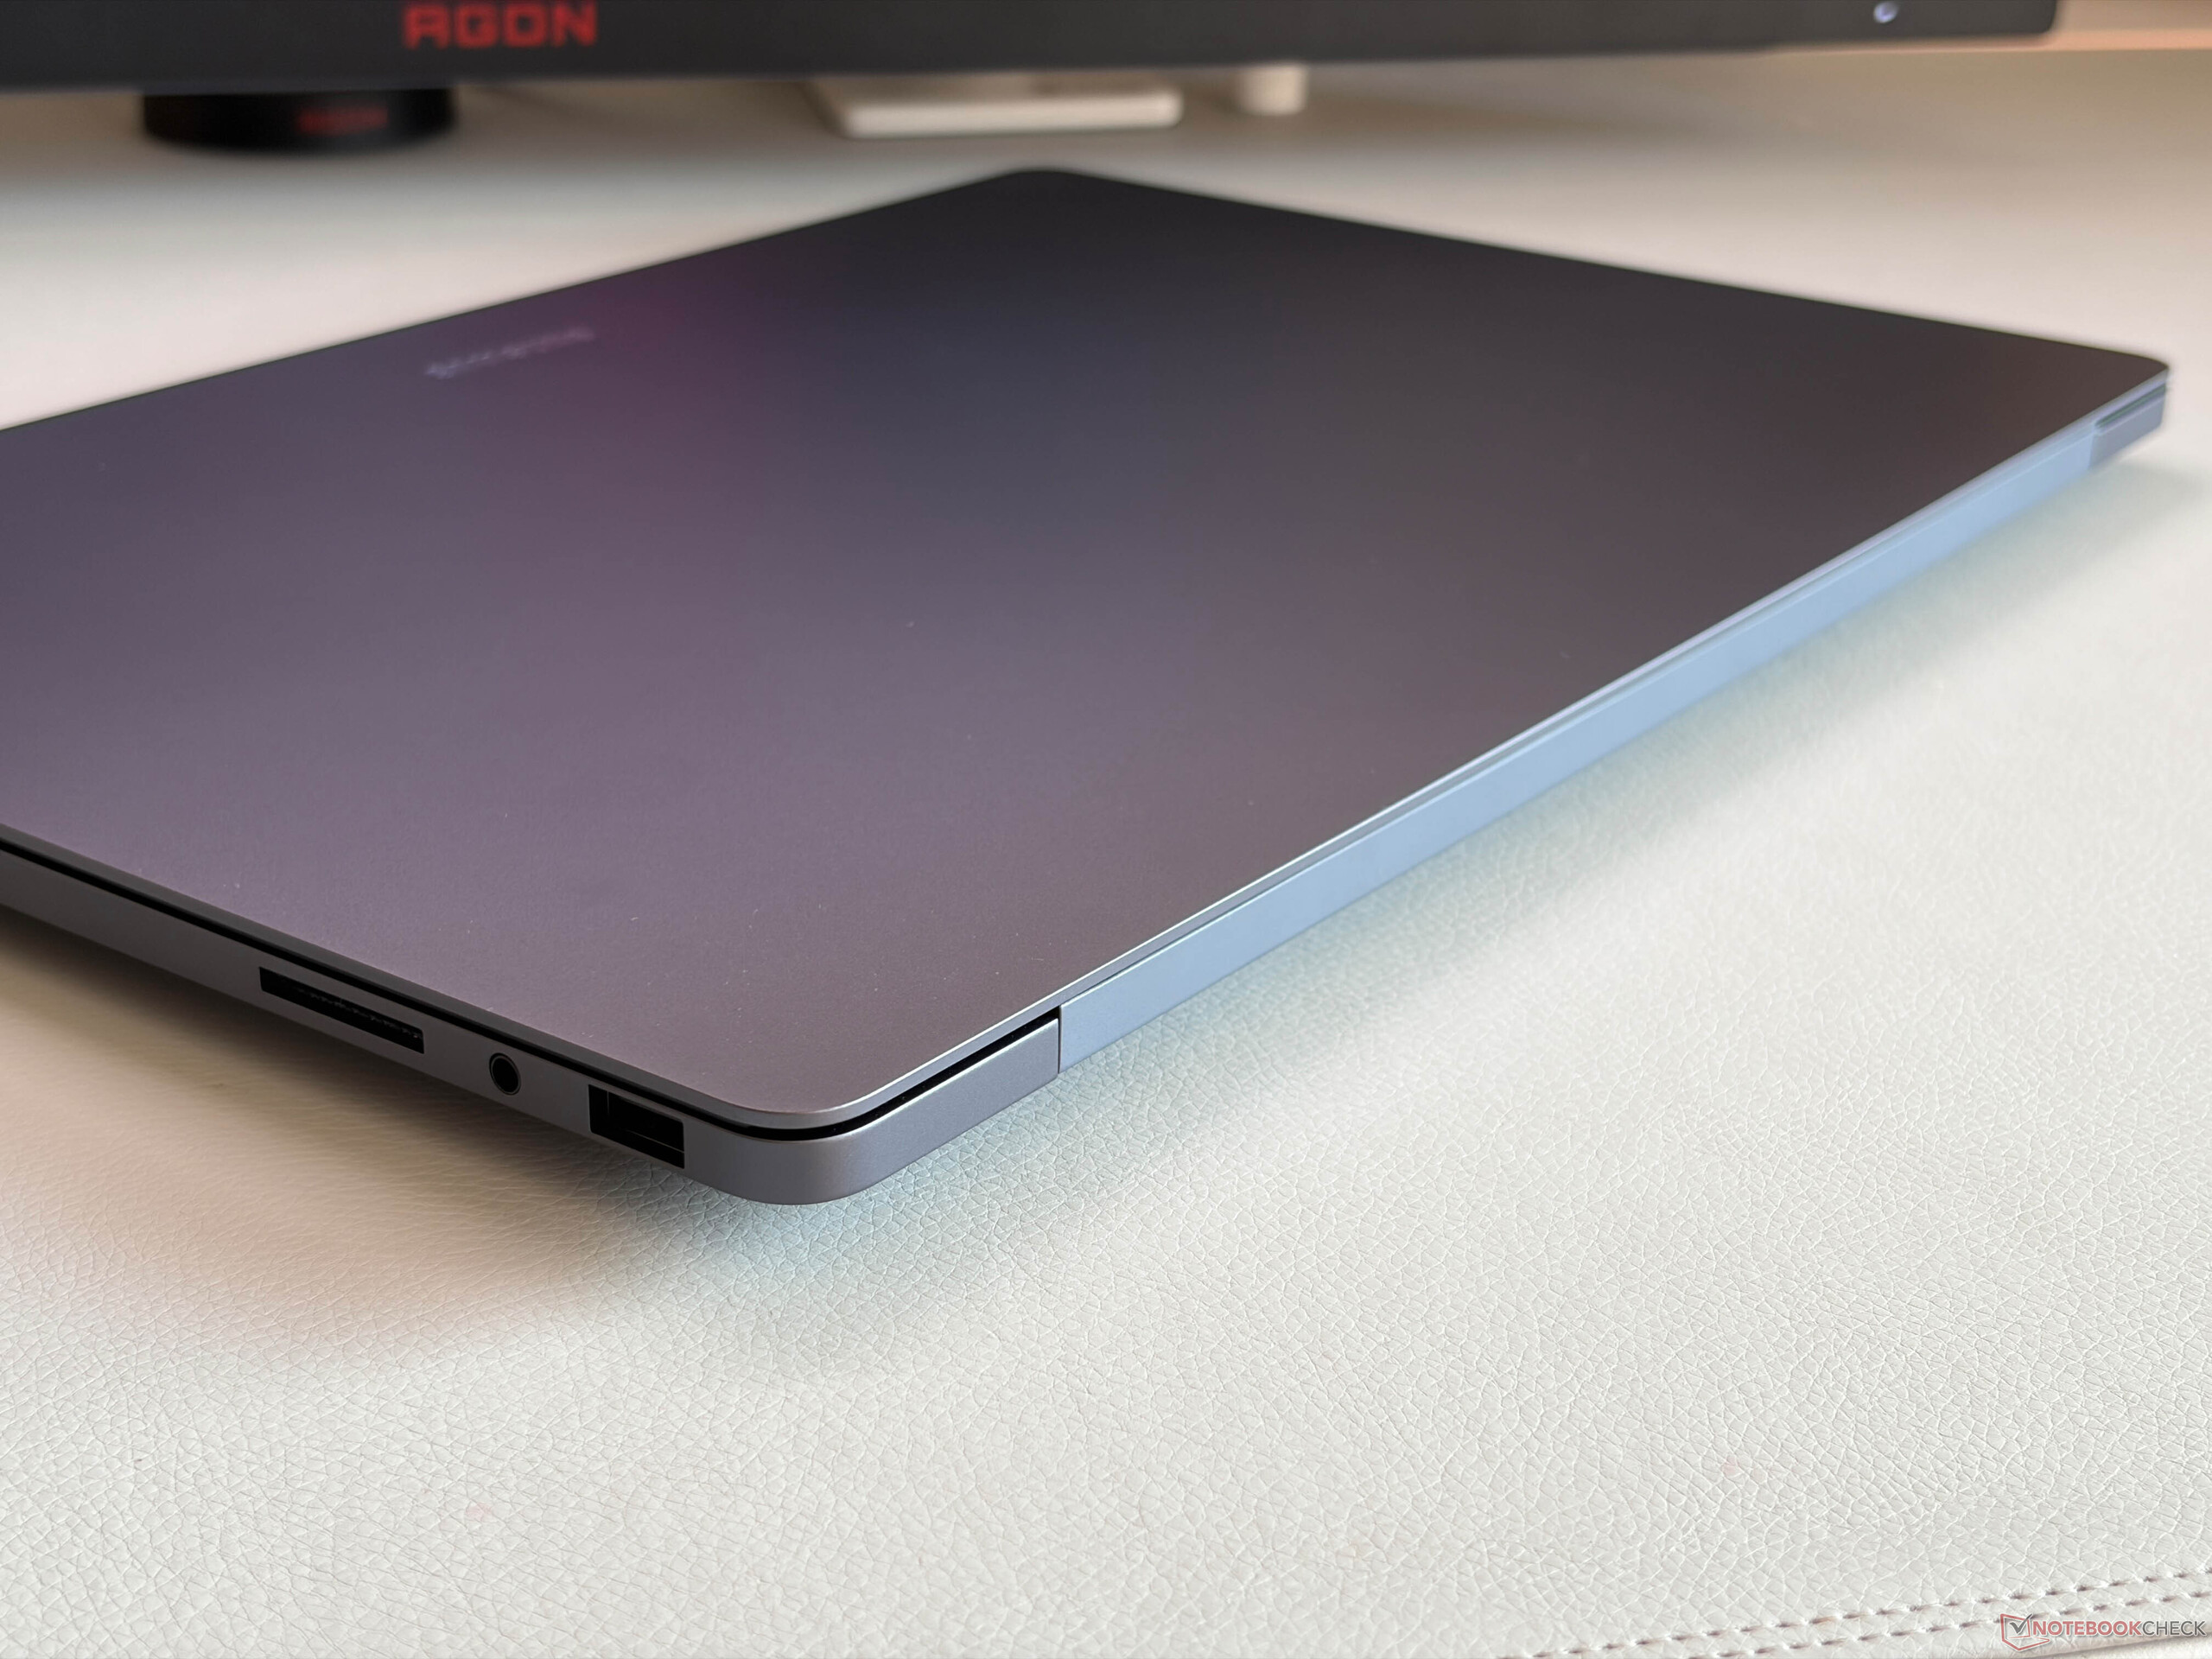
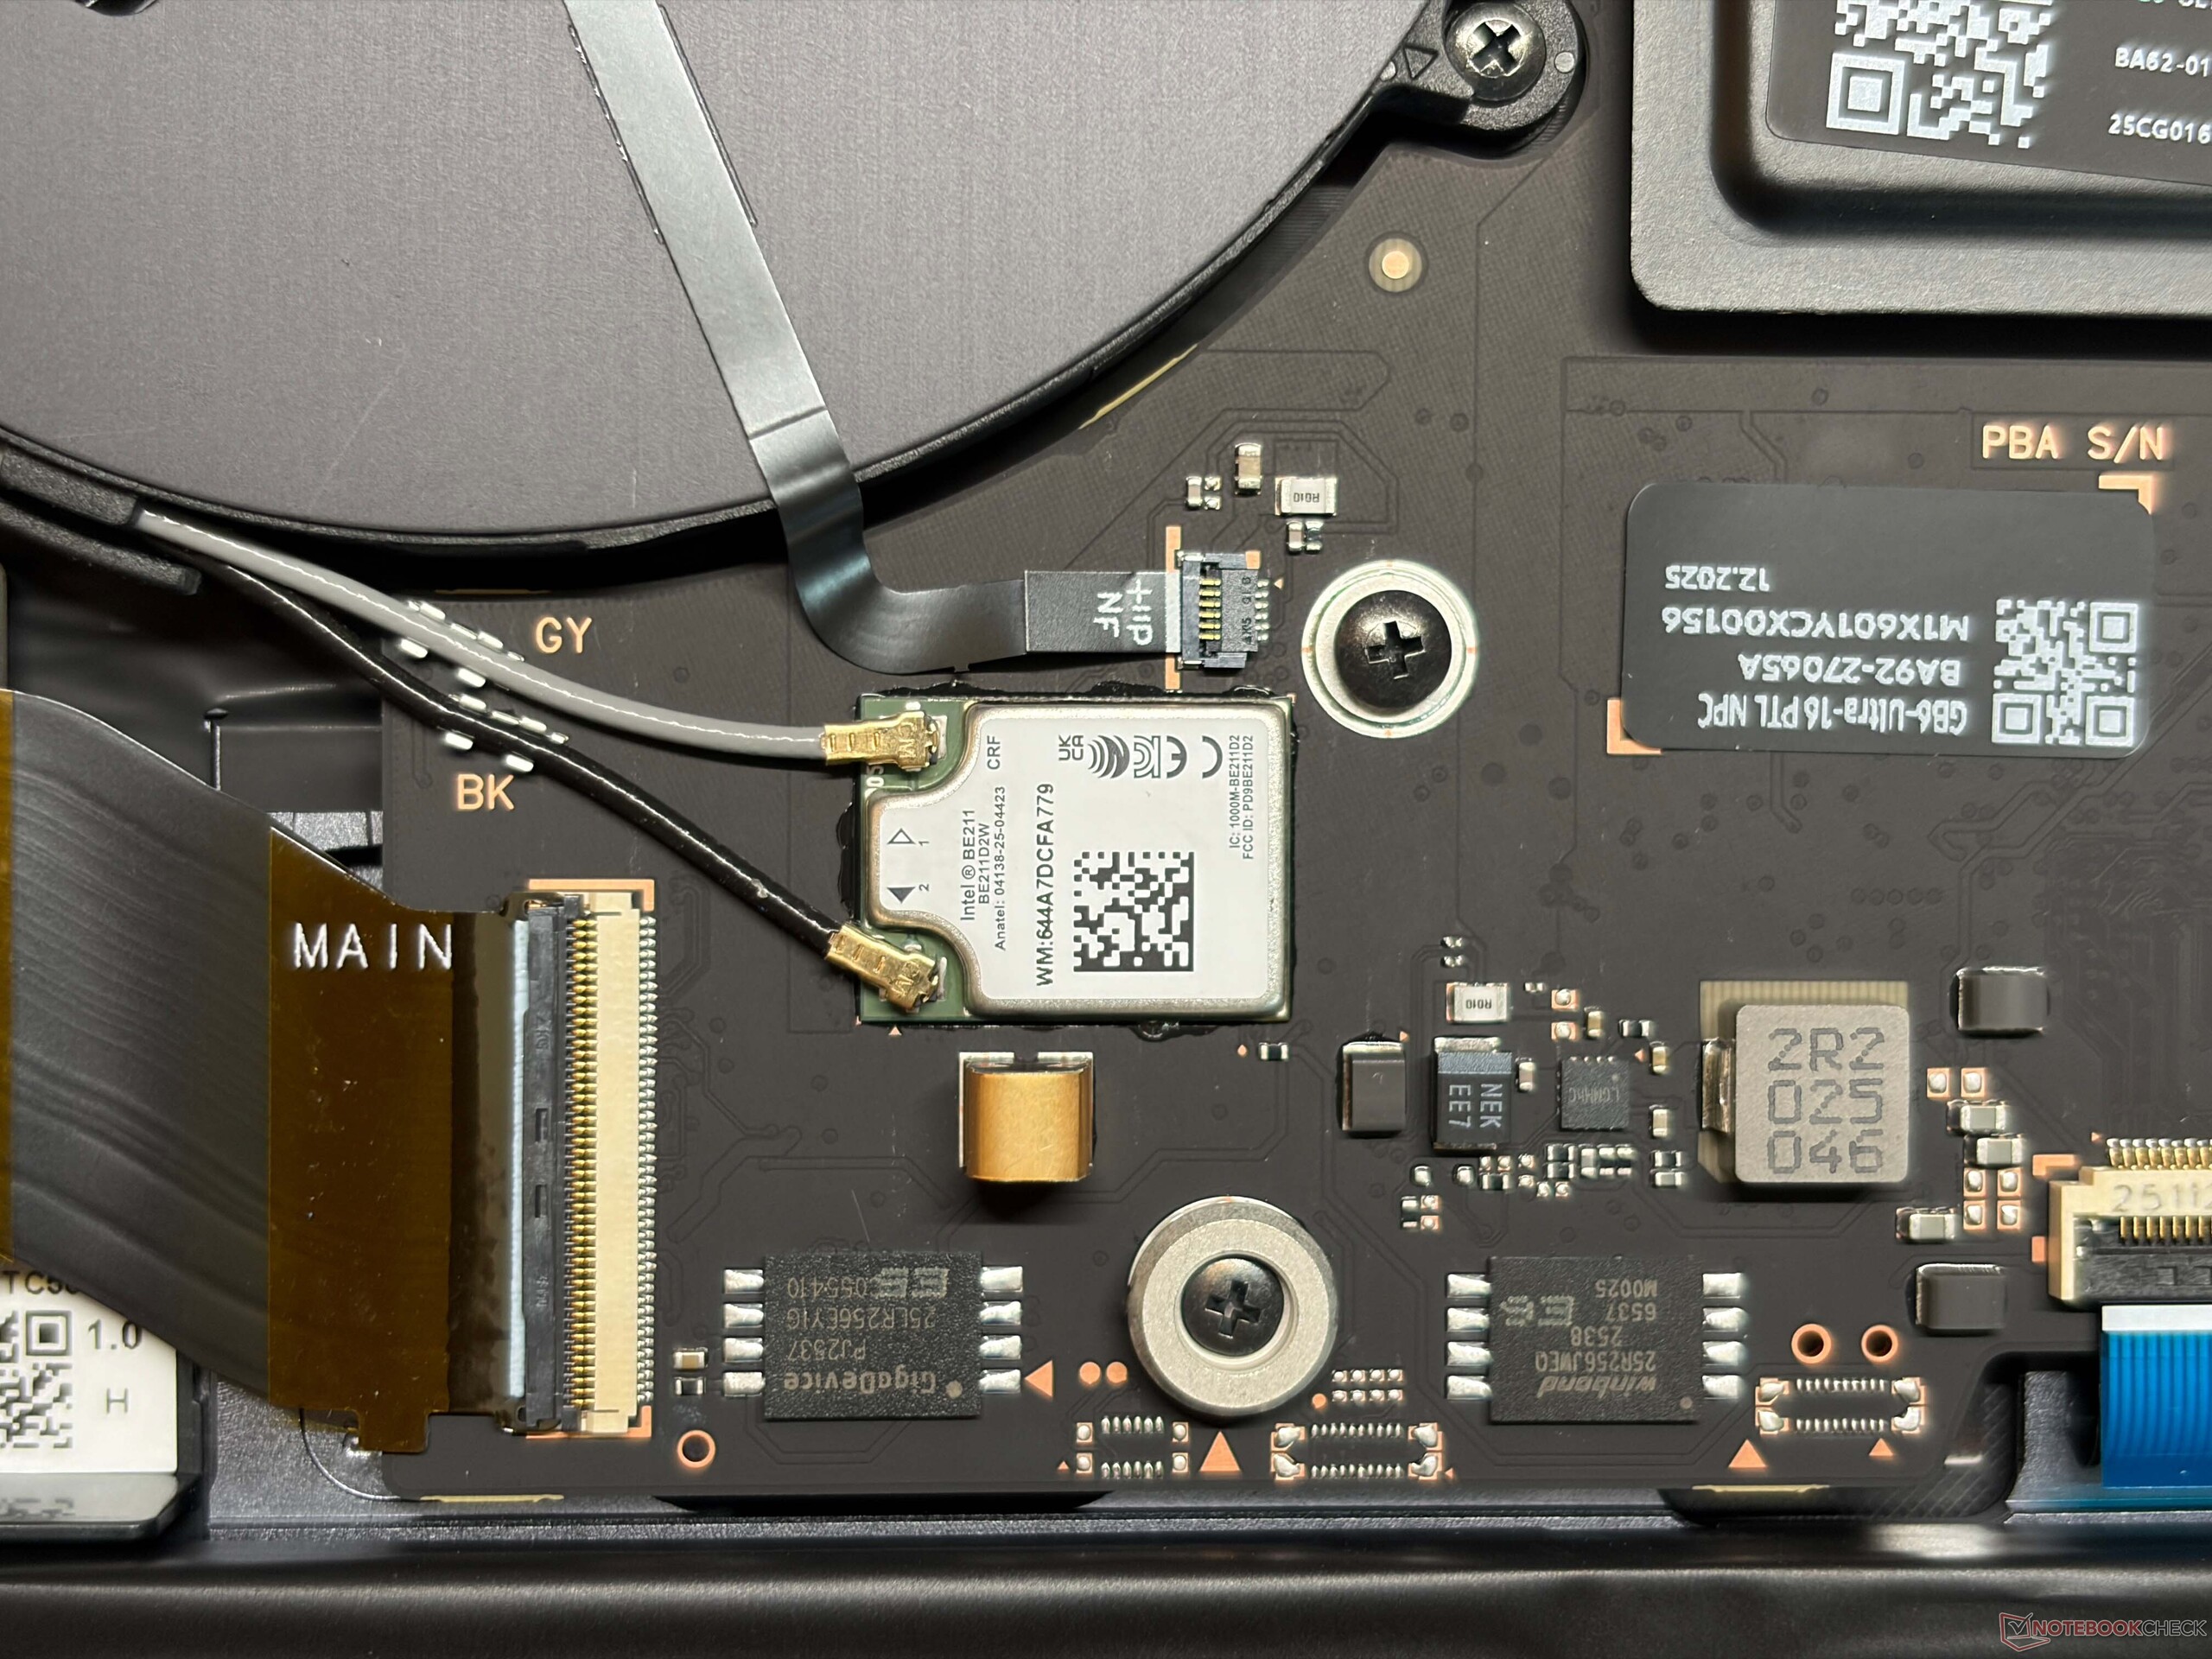
La situación de los puertos es limitada, con dos puertos USB-C y un puerto USB-A. Uno de los puertos USB-C también está ocupado por el adaptador de corriente, por lo que el número de puertos utilizables es limitado. El lector de tarjetas SD es bastante lento a unos 80-90 MB/s y no es compatible con la SD-Express. Dispone de un moderno módulo Wi-Fi 7 con Bluetooth 5.4 y las velocidades de transferencia son buenas. La cámara 1080p toma fotos medias y también es compatible con el reconocimiento facial, pero no tiene obturador.


| SD Card Reader | |
| average JPG Copy Test (av. of 3 runs) | |
| Lenovo ThinkPad T1g Gen 8 21TD003GE (ADATA SD8.0 Express 512 GBAV Pro V60) | |
| Lenovo ThinkPad T1g Gen 8 21TD003GE (Angelbird AV Pro V60) | |
| Asus ProArt P16 H7606WP (Angelbird AV Pro V60) | |
| Apple MacBook Pro 16 2024 M4 Pro (Angelbird AV Pro V60) | |
| Media de la clase Multimedia (23 - 531, n=41, últimos 2 años) | |
| Lenovo Yoga Pro 9i 16 RTX 5070 (Angelbird AV Pro V60) | |
| Samsung Galaxy Book6 Ultra (Angelbird AV Pro V60) | |
| maximum AS SSD Seq Read Test (1GB) | |
| Lenovo ThinkPad T1g Gen 8 21TD003GE (ADATA SD8.0 Express 512 GB) | |
| Lenovo ThinkPad T1g Gen 8 21TD003GE (Angelbird AV Pro V60) | |
| Asus ProArt P16 H7606WP (Angelbird AV Pro V60) | |
| Apple MacBook Pro 16 2024 M4 Pro (Angelbird AV Pro V60) | |
| Media de la clase Multimedia (37.3 - 1455, n=40, últimos 2 años) | |
| Lenovo Yoga Pro 9i 16 RTX 5070 (Angelbird AV Pro V60) | |
| Samsung Galaxy Book6 Ultra (Angelbird AV Pro V60) | |
| Networking | |
| Samsung Galaxy Book6 Ultra | |
| iperf3 transmit AXE11000 | |
| iperf3 receive AXE11000 | |
| Apple MacBook Pro 16 2024 M4 Pro | |
| iperf3 transmit AXE11000 | |
| iperf3 receive AXE11000 | |
| Lenovo Yoga Pro 9i 16 RTX 5070 | |
| iperf3 transmit AXE11000 | |
| iperf3 receive AXE11000 | |
| Dell 16 Premium DA16250 | |
| iperf3 transmit AXE11000 | |
| iperf3 receive AXE11000 | |
| iperf3 transmit AXE11000 6GHz | |
| iperf3 receive AXE11000 6GHz | |
| Lenovo ThinkPad T1g Gen 8 21TD003GE | |
| iperf3 transmit AXE11000 | |
| iperf3 receive AXE11000 | |
| Asus ProArt P16 H7606WP | |
| iperf3 transmit AXE11000 | |
| iperf3 receive AXE11000 | |


Dispositivos de entrada
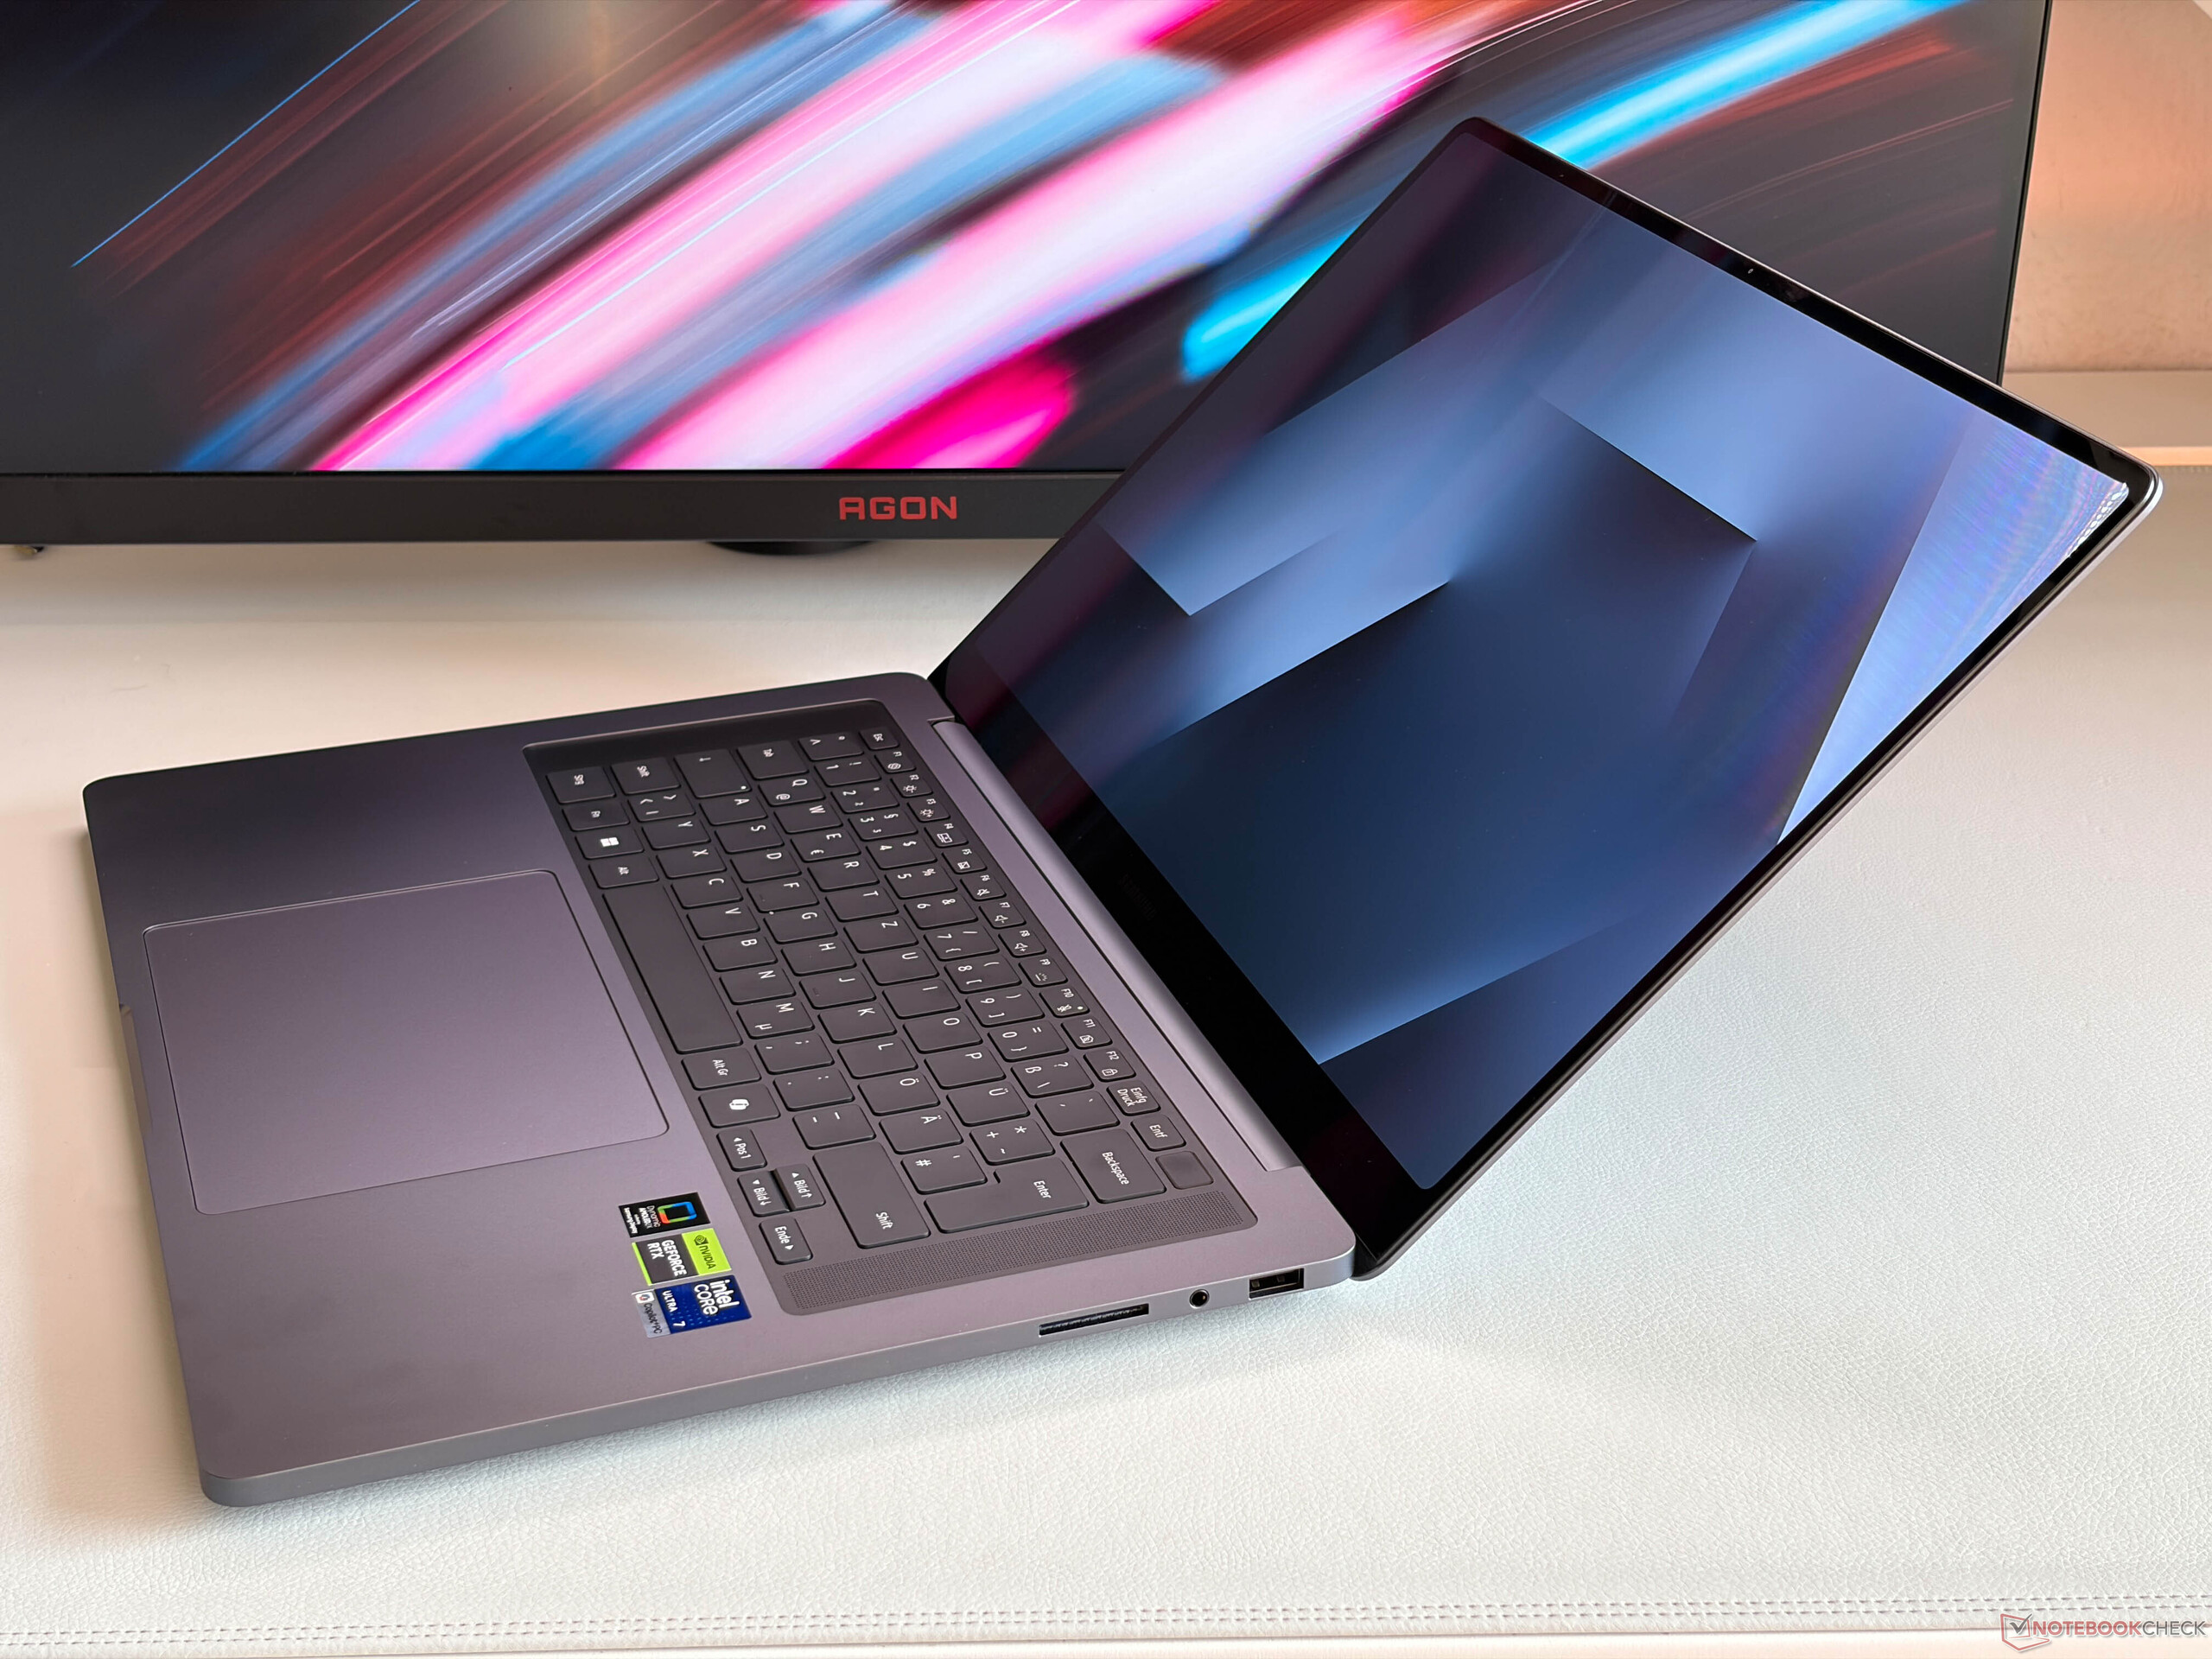
Samsung también ha intentado copiar el teclado del MacBook Pro y se ha deshecho del teclado numérico del modelo anterior. El recorrido de las teclas es bastante superficial y la experiencia de tecleo entre Samsung y Apple es realmente muy similar y buena en general, pero hay teclados más cómodos por ahí como en el Asus ProArt P16 o el Lenovo Yoga Pro 9i 16. El touchpad háptico funciona muy bien y también puede utilizar la pantalla táctil capacitiva para las entradas.


Pantalla - Nueva pantalla táctil OLED

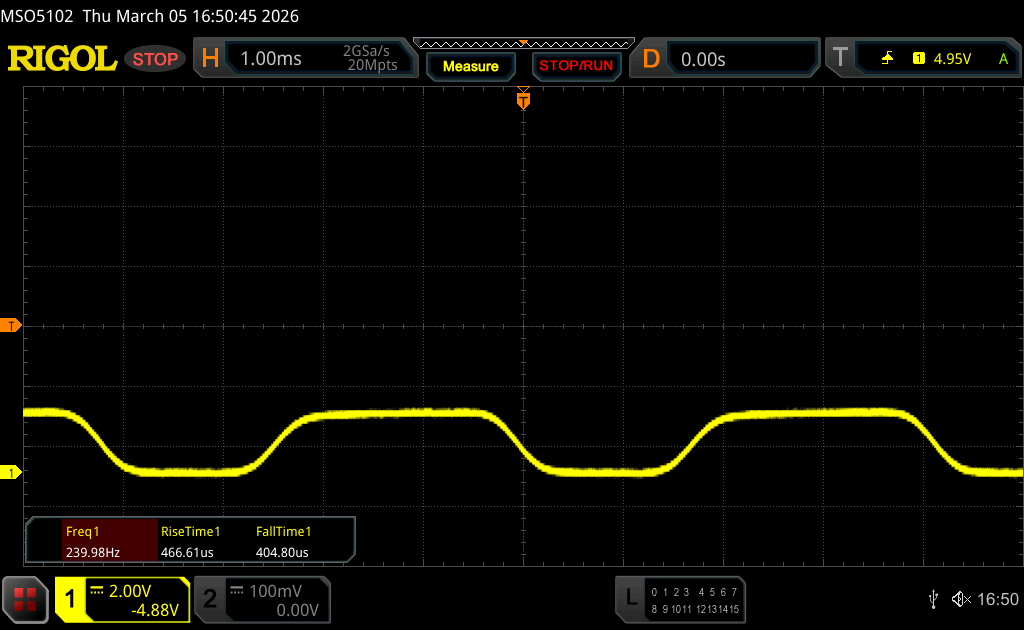
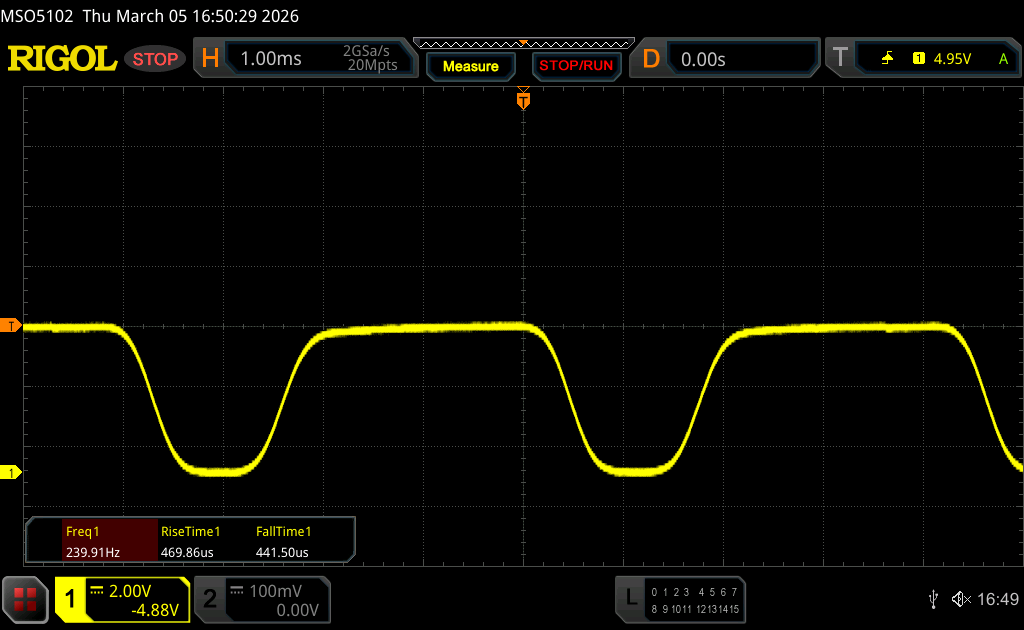
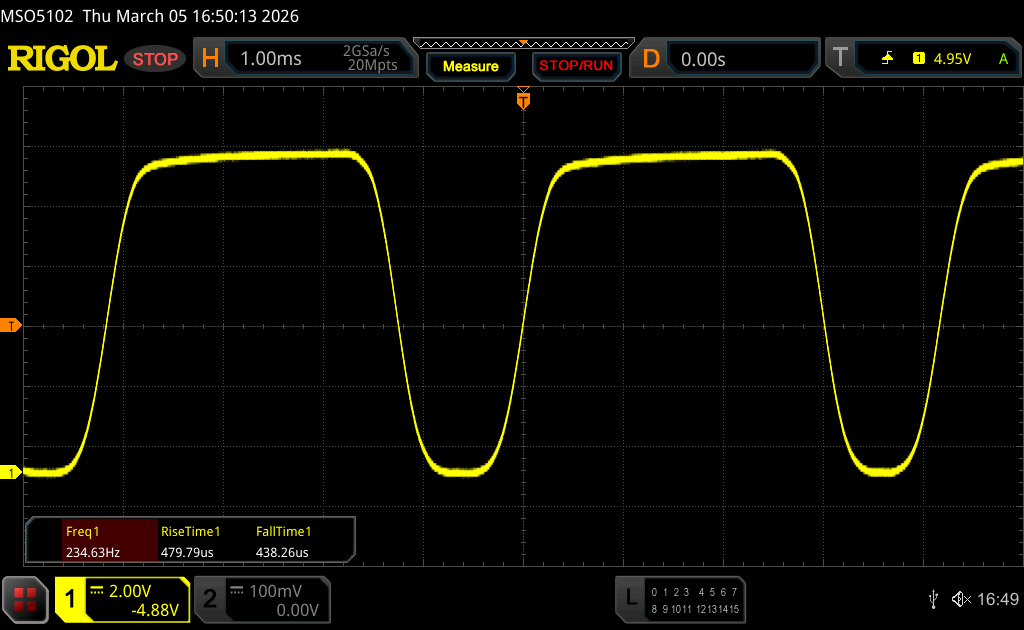
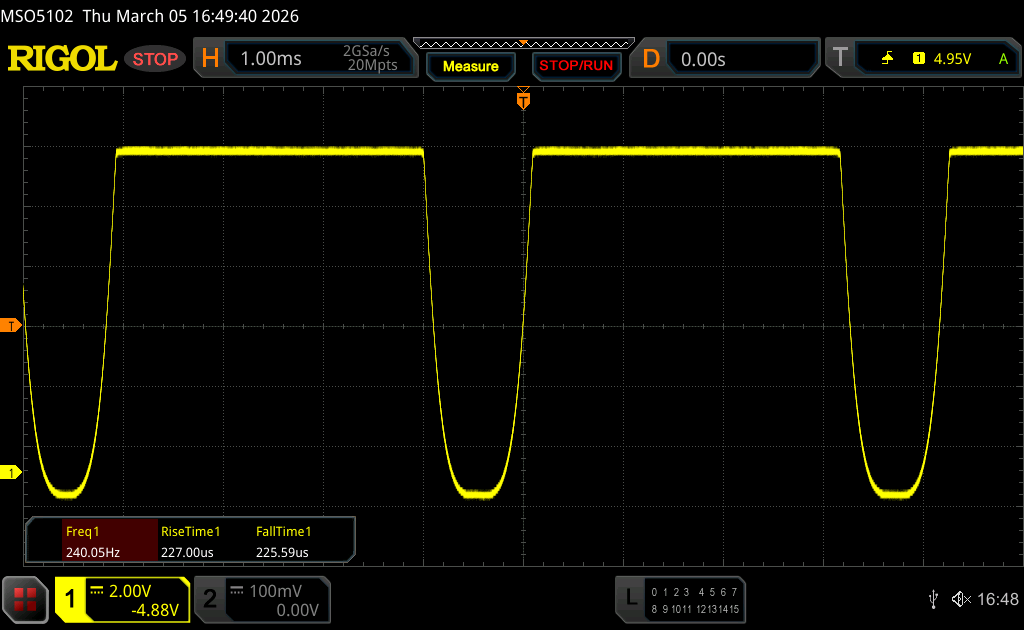
Samsung utiliza una nueva pantalla táctil OLED (2880 x 1800 píxeles) para el Galaxy Book6 Ultra y la calidad de imagen subjetiva es excelente con negros profundos, colores ricos, movimientos suaves gracias a los 120 Hz (adaptable entre 30-120 Hz) y los contenidos brillantes tampoco se ven afectados por la capa táctil. Los tiempos de respuesta son rápidos, pero podemos medir el parpadeo PWM a 240 Hz para cada nivel de brillo con una amplitud bastante grande, por lo que los usuarios sensibles deberían probar el panel primero.
El brillo también se ha mejorado y ahora medimos alrededor de 500 nits para SDR y hasta 1182 nits para contenidos HDR (645 nits para una imagen completamente blanca). Es una mejora, pero no está a la altura de las pantallas OLED en tándem o de la pantalla Mini-LED del MacBook. Samsung incluye varios perfiles de color, incluyendo P3 así como sRGB. Nuestro análisis con el software profesional CalMAN muestra que la precisión del color es muy buena y nuestra propia calibración no mejoró aún más la calidad de la imagen. El Galaxy Book6 Ultra es, por tanto, muy adecuado para la edición de imágenes.
| |||||||||||||||||||||||||
iluminación: 97 %
Brillo con batería: 499 cd/m²
Contraste: ∞:1 (Negro: 0 cd/m²)
ΔE ColorChecker Calman: 0.9 | ∀{0.5-29.43 Ø4.72}
ΔE Greyscale Calman: 1.6 | ∀{0.09-98 Ø4.97}
85.3% AdobeRGB 1998 (Argyll 3D)
99.9% sRGB (Argyll 3D)
97% Display P3 (Argyll 3D)
Gamma: 2.22
CCT: 6445 K
| Samsung Galaxy Book6 Ultra ATNA60HR05-0, OLED, 2880x1800, 16", 120 Hz | Apple MacBook Pro 16 2024 M4 Pro Mini-LED, 3456x2234, 16.2", 120 Hz | Lenovo Yoga Pro 9i 16 RTX 5070 ATNA60KA01-0, OLED, 3200x2000, 16", 120 Hz | Asus ProArt P16 RTX 5090 ATNA60HC03-0, OLED, 3840x2400, 16", 120 Hz | Dell 16 Premium DA16250 Samsung 163DU02, OLED, 3840x2400, 16.3", 120 Hz | Lenovo ThinkPad T1g Gen 8 21TD003GE ATNA60KA02-0, Tandem-OLED, 3200x2000, 16", 120 Hz | |
|---|---|---|---|---|---|---|
| Display | 2% | 4% | 2% | 2% | 2% | |
| Display P3 Coverage (%) | 97 | 99.7 3% | 97.4 0% | 98.9 2% | 99.7 3% | 98.8 2% |
| sRGB Coverage (%) | 99.9 | 100 0% | 100 0% | 100 0% | 100 0% | 100 0% |
| AdobeRGB 1998 Coverage (%) | 85.3 | 88.8 4% | 96.8 13% | 88.6 4% | 88.1 3% | 88.9 4% |
| Response Times | -6230% | 44% | 30% | -26% | 40% | |
| Response Time Grey 50% / Grey 80% * (ms) | 0.5 ? | 43 ? -8500% | 0.27 ? 46% | 0.3 ? 40% | 0.61 ? -22% | 0.26 ? 48% |
| Response Time Black / White * (ms) | 0.4 ? | 41.2 ? -10200% | 0.37 ? 7% | 0.45 ? -13% | 0.88 ? -120% | 0.42 ? -5% |
| PWM Frequency (Hz) | 240 ? | 14880 | 1200 | 480 ? | 490.8 ? | 1200 ? |
| PWM Amplitude * (%) | 100 | 90 10% | 22 78% | 38 62% | 35 65% | 22 78% |
| Screen | 29% | 38% | 34% | -19% | -37% | |
| Brightness middle (cd/m²) | 499 | 632 27% | 974 95% | 661 32% | 385.7 -23% | 578 16% |
| Brightness (cd/m²) | 505 | 616 22% | 979 94% | 663 31% | 387 -23% | 583 15% |
| Brightness Distribution (%) | 97 | 95 -2% | 98 1% | 99 2% | 98 1% | 98 1% |
| Black Level * (cd/m²) | ||||||
| Colorchecker dE 2000 * | 0.9 | 0.6 33% | 0.9 -0% | 0.5 44% | 1.36 -51% | 1.6 -78% |
| Colorchecker dE 2000 max. * | 2.1 | 1.2 43% | 1.7 19% | 1.4 33% | 2.85 -36% | 4.5 -114% |
| Greyscale dE 2000 * | 1.6 | 0.8 50% | 1.3 19% | 0.6 63% | 1.3 19% | 2.6 -63% |
| Gamma | 2.22 99% | 2.21 100% | 2.21 100% | 2.19 100% | 2.2 100% | 2.19 100% |
| CCT | 6445 101% | 6450 101% | 6751 96% | 6565 99% | 6282 103% | 6527 100% |
| Colorchecker dE 2000 calibrated * | 0.65 | |||||
| Media total (Programa/Opciones) | -2066% /
-1543% | 29% /
31% | 22% /
25% | -14% /
-15% | 2% /
-8% |
* ... más pequeño es mejor


Tiempos de respuesta del display
| ↔ Tiempo de respuesta de Negro a Blanco | ||
|---|---|---|
| 0.4 ms ... subida ↗ y bajada ↘ combinada | ↗ 0.2 ms subida | 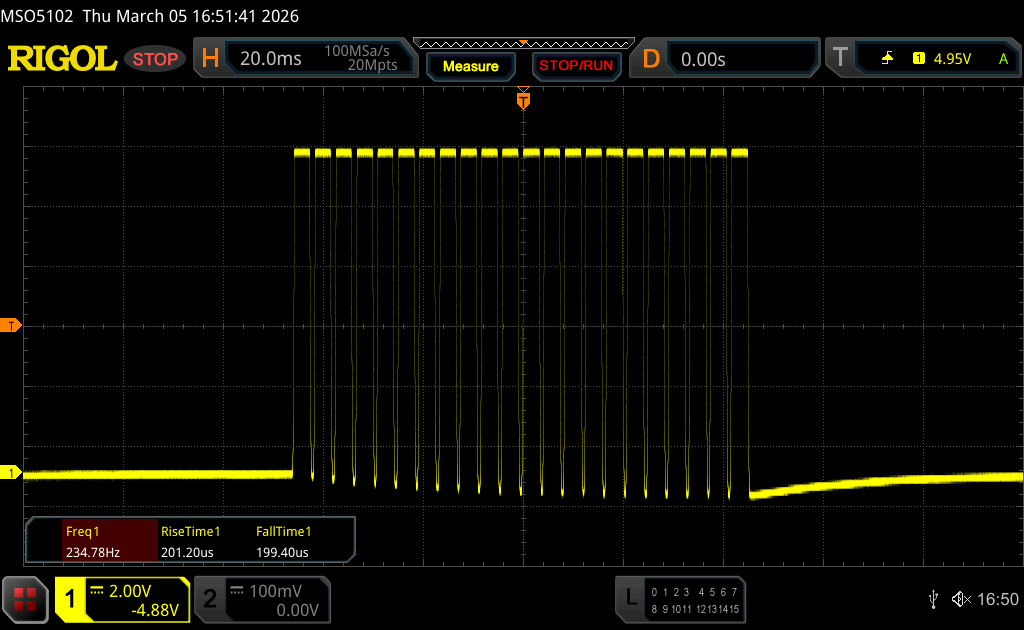 |
| ↘ 0.2 ms bajada | ||
| La pantalla mostró tiempos de respuesta muy rápidos en nuestros tests y debería ser adecuada para juegos frenéticos. En comparación, todos los dispositivos de prueba van de ##min### (mínimo) a 240 (máximo) ms. » 0 % de todos los dispositivos son mejores. Esto quiere decir que el tiempo de respuesta medido es mejor que la media (19.8 ms) de todos los dispositivos testados. | ||
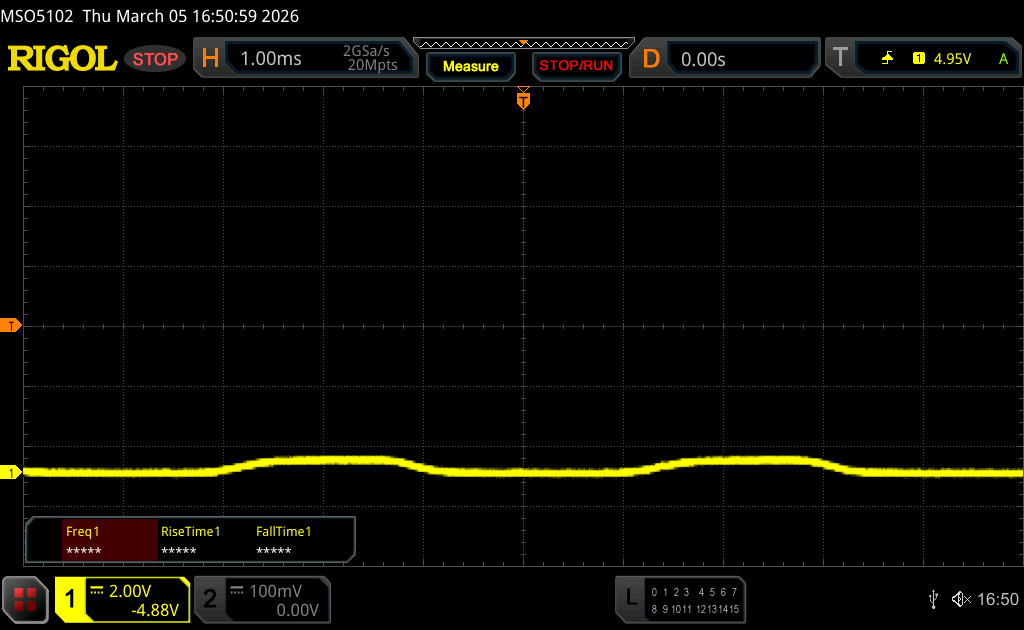
| ↔ Tiempo de respuesta 50% Gris a 80% Gris | ||
| 0.5 ms ... subida ↗ y bajada ↘ combinada | ↗ 0.25 ms subida | 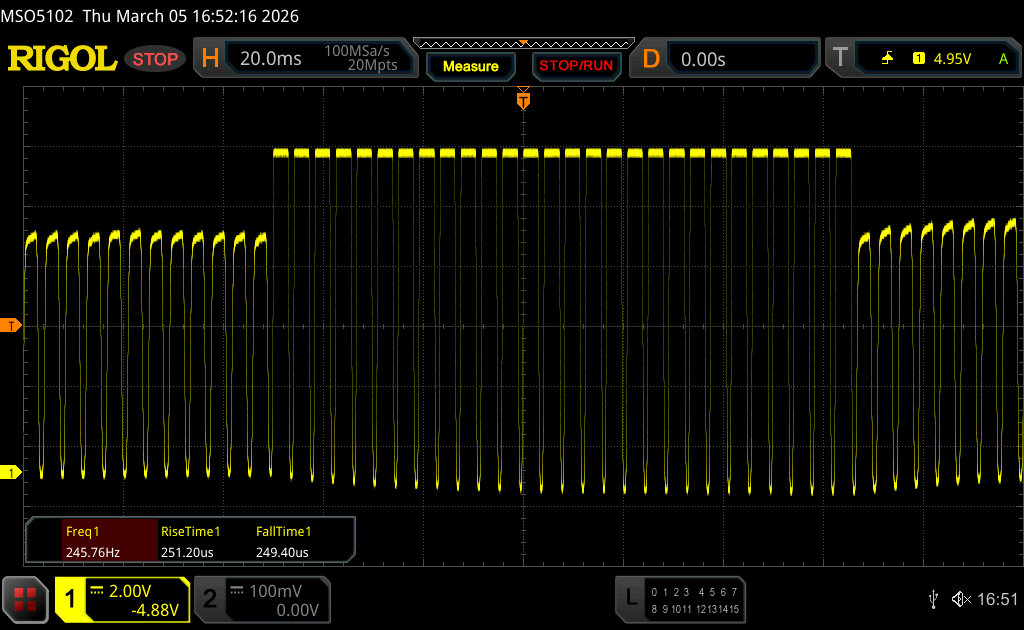 |
| ↘ 0.25 ms bajada | ||
| La pantalla mostró tiempos de respuesta muy rápidos en nuestros tests y debería ser adecuada para juegos frenéticos. En comparación, todos los dispositivos de prueba van de ##min### (mínimo) a 636 (máximo) ms. » 1 % de todos los dispositivos son mejores. Esto quiere decir que el tiempo de respuesta medido es mejor que la media (31 ms) de todos los dispositivos testados. | ||
Parpadeo de Pantalla / PWM (Pulse-Width Modulation)
| Parpadeo de Pantalla / PWM detectado | 240 Hz Amplitude: 100 % | ≤ 100 % de brillo | 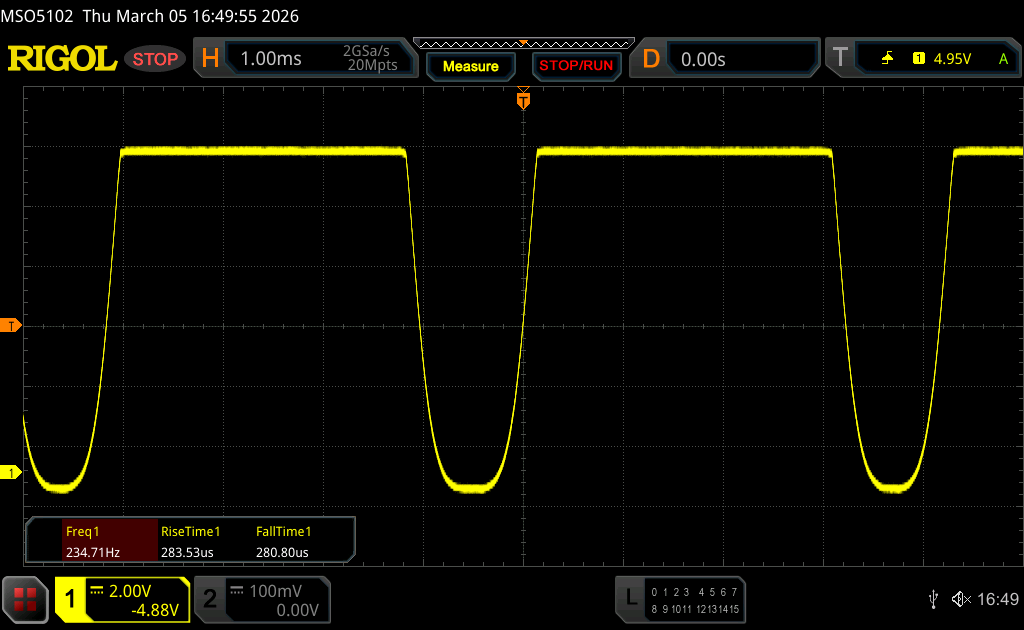 |
La retroiluminación del display parpadea a 240 Hz (seguramente usa PWM - Pulse-Width Modulation) a un brillo del 100 % e inferior. Sobre este nivel de brillo no debería darse parpadeo / PWM. La frecuencia de 240 Hz es relativamente baja, por lo que la gente sensible debería ver parpadeos y padecer fatiga visual por la pantalla (usado al brillo indicado a continuación). Comparación: 52 % de todos los dispositivos testados no usaron PWM para atenuar el display. Si se usó, medimos una media de 7747 (mínimo: 5 - máxmo: 343500) Hz. | |||


Actuación - El lago Pantera se encuentra con Blackwell
Condiciones de prueba
Samsung incluye varios perfiles de energía y se sincronizan con la configuración de Windows. Realizamos nuestras pruebas comparativas en el modo de alto rendimiento.
| Perfil | TDP (vatios) | CB R24 Multi (puntos) | TGP (vatios) | Time Sy Graphics (puntos) | Cyberpunk 2077 QHD Ultra (FPS) | ruido máx. del ventilador(dB(A)) |
|---|---|---|---|---|---|---|
| Silencioso | 45/30 | 916 | 22 | 3054 | 14,4 | 33,7 |
| Optimizado | 65/45/35 | 1002 | 60 | 9149 | 47,2 | 40,3 |
| Alto rendimiento | 65 | 1232 | 90 | 12027 | 57,4 | 48,5 |
| Batería | 65/50 | 1173 | 70 | 10258 | 49,7 | 48,2 |
Procesador
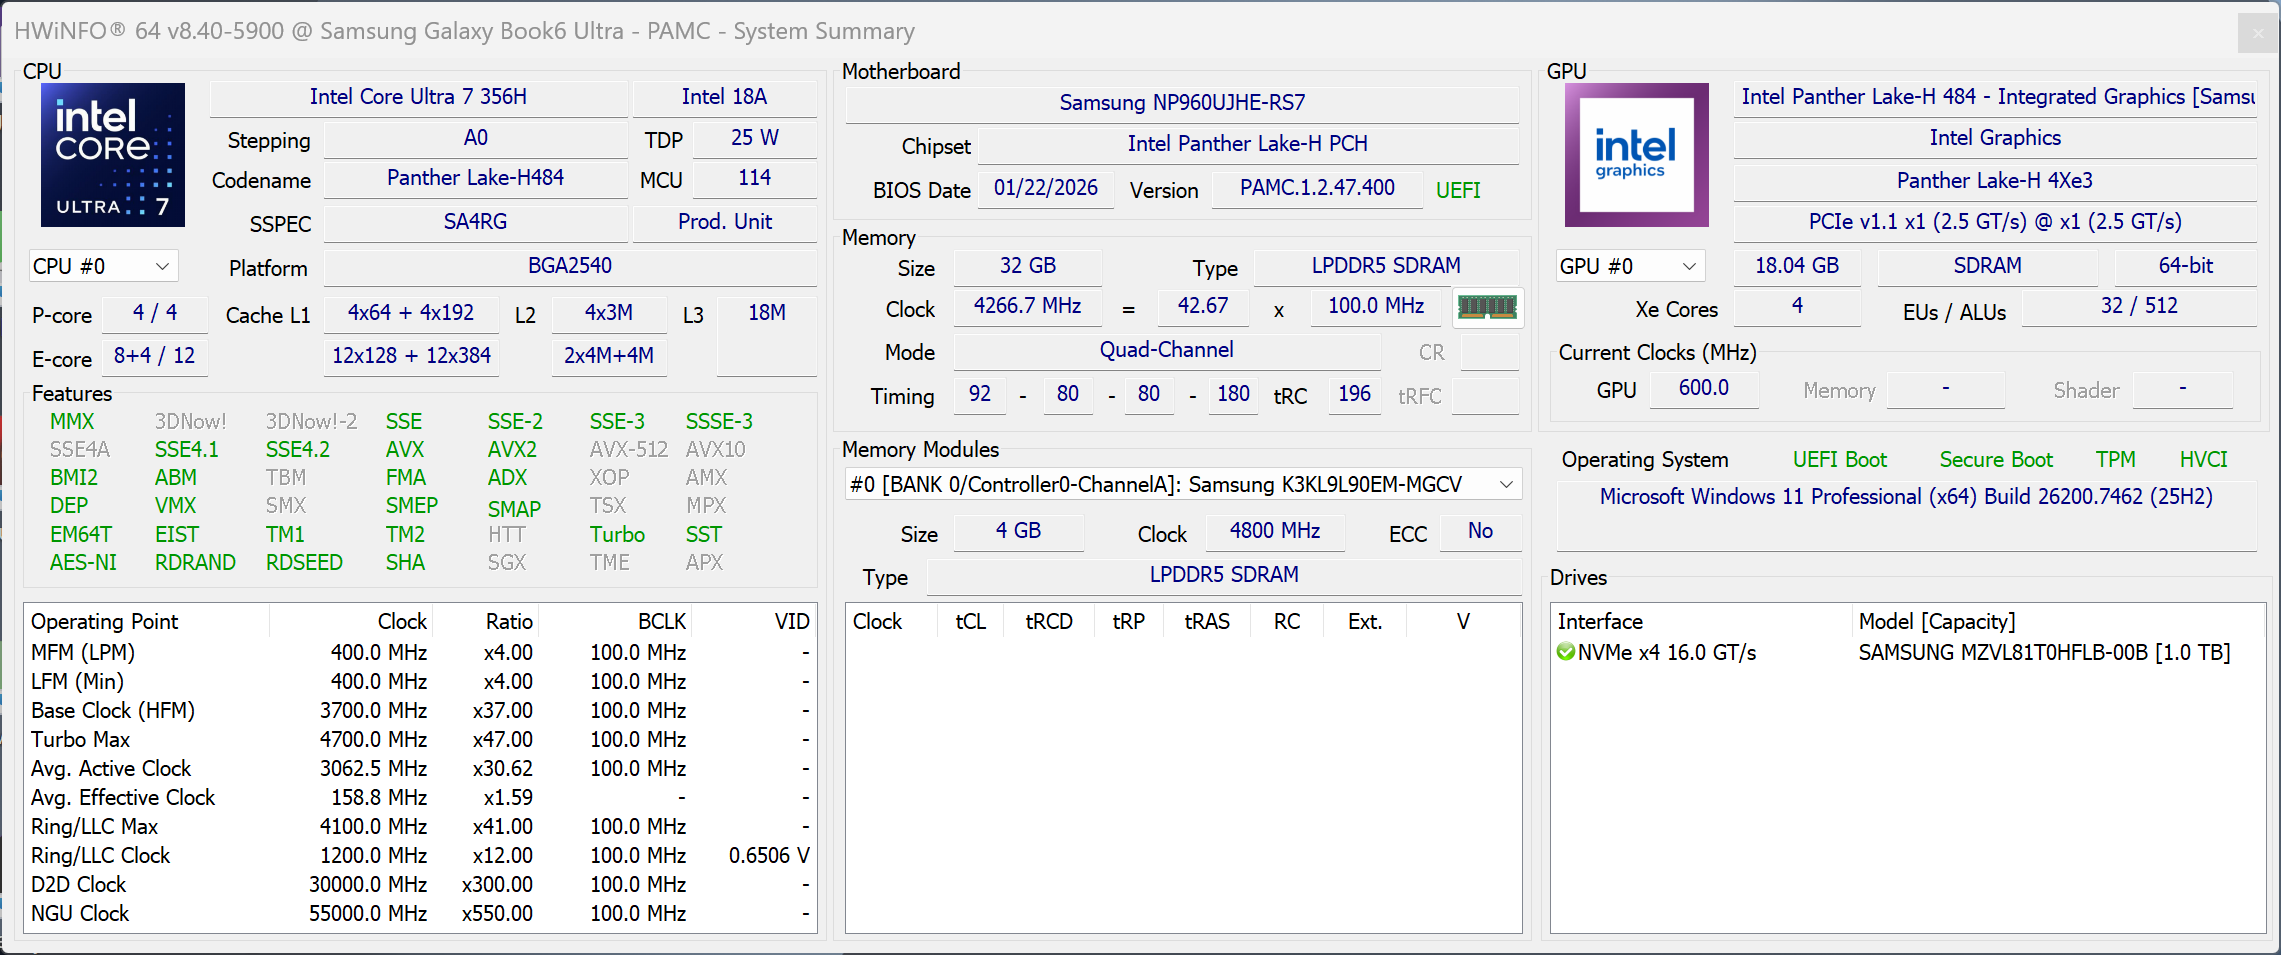
Nuestra unidad de revisión está equipada con el Core Ultra 7 356H (Panther Lake), que ofrece 16 núcleos y un reloj máximo de 4,7 GHz. Es casi idéntico al Core Ultra X7 (hasta 4,8 GHz), pero no incluye la rápida GPU Arc B390. El rendimiento de la CPU con el límite de potencia de 65 vatios es bueno y estable. Todos los dispositivos Windows están bastante cerca aquí, sólo el MacBook Pro con el M4 Pro es claramente superior tanto en escenarios multinúcleo como especialmente mononúcleo y el próximo modelo M5 Pro muy probablemente aumentará aún más la diferencia.
Bucle múltiple Cinebench R15
Cinebench 2024: CPU Multi Core | CPU Single Core
Cinebench R23: Multi Core | Single Core
Cinebench R20: CPU (Multi Core) | CPU (Single Core)
Cinebench R15: CPU Multi 64Bit | CPU Single 64Bit
Blender: v2.79 BMW27 CPU
7-Zip 18.03: 7z b 4 | 7z b 4 -mmt1
Geekbench 6.7: Multi-Core | Single-Core
Geekbench 5.5: Multi-Core | Single-Core
HWBOT x265 Benchmark v2.2: 4k Preset
LibreOffice : 20 Documents To PDF
R Benchmark 2.5: Overall mean
| CPU Performance rating | |
| Apple MacBook Pro 16 M4 Max -8! | |
| Apple MacBook Pro 16 2024 M4 Pro -12! | |
| Lenovo Yoga Pro 9i 16 RTX 5070 | |
| Lenovo ThinkPad T1g Gen 8 21TD003GE | |
| Asus ProArt P16 RTX 5090 | |
| Samsung Galaxy Book6 Ultra | |
| Dell 16 Premium DA16250 | |
| Medio Intel Core Ultra 7 356H | |
| Media de la clase Multimedia | |
| Cinebench 2024 / CPU Multi Core | |
| Apple MacBook Pro 16 M4 Max | |
| Apple MacBook Pro 16 M4 Max | |
| Apple MacBook Pro 16 2024 M4 Pro | |
| Asus ProArt P16 RTX 5090 | |
| Samsung Galaxy Book6 Ultra | |
| Lenovo Yoga Pro 9i 16 RTX 5070 | |
| Medio Intel Core Ultra 7 356H (1006 - 1232, n=3) | |
| Lenovo ThinkPad T1g Gen 8 21TD003GE | |
| Dell 16 Premium DA16250 | |
| Media de la clase Multimedia (327 - 2437, n=76, últimos 2 años) | |
| Cinebench 2024 / CPU Single Core | |
| Apple MacBook Pro 16 2024 M4 Pro | |
| Apple MacBook Pro 16 M4 Max | |
| Media de la clase Multimedia (72.5 - 201, n=60, últimos 2 años) | |
| Lenovo Yoga Pro 9i 16 RTX 5070 | |
| Lenovo ThinkPad T1g Gen 8 21TD003GE | |
| Samsung Galaxy Book6 Ultra | |
| Dell 16 Premium DA16250 | |
| Medio Intel Core Ultra 7 356H (116 - 122.4, n=3) | |
| Asus ProArt P16 RTX 5090 | |
| Cinebench R23 / Multi Core | |
| Apple MacBook Pro 16 M4 Max | |
| Asus ProArt P16 RTX 5090 | |
| Lenovo Yoga Pro 9i 16 RTX 5070 | |
| Apple MacBook Pro 16 2024 M4 Pro | |
| Lenovo ThinkPad T1g Gen 8 21TD003GE | |
| Dell 16 Premium DA16250 | |
| Samsung Galaxy Book6 Ultra | |
| Medio Intel Core Ultra 7 356H (18395 - 20650, n=2) | |
| Media de la clase Multimedia (4861 - 33362, n=77, últimos 2 años) | |
| Cinebench R23 / Single Core | |
| Apple MacBook Pro 16 2024 M4 Pro | |
| Apple MacBook Pro 16 M4 Max | |
| Lenovo Yoga Pro 9i 16 RTX 5070 | |
| Lenovo ThinkPad T1g Gen 8 21TD003GE | |
| Samsung Galaxy Book6 Ultra | |
| Medio Intel Core Ultra 7 356H (2040 - 2045, n=2) | |
| Asus ProArt P16 RTX 5090 | |
| Media de la clase Multimedia (1128 - 2459, n=69, últimos 2 años) | |
| Dell 16 Premium DA16250 | |
| Cinebench R20 / CPU (Multi Core) | |
| Asus ProArt P16 RTX 5090 | |
| Lenovo Yoga Pro 9i 16 RTX 5070 | |
| Lenovo ThinkPad T1g Gen 8 21TD003GE | |
| Dell 16 Premium DA16250 | |
| Samsung Galaxy Book6 Ultra | |
| Medio Intel Core Ultra 7 356H (7180 - 8074, n=2) | |
| Apple MacBook Pro 16 M4 Max | |
| Media de la clase Multimedia (1887 - 12912, n=60, últimos 2 años) | |
| Cinebench R20 / CPU (Single Core) | |
| Lenovo Yoga Pro 9i 16 RTX 5070 | |
| Lenovo ThinkPad T1g Gen 8 21TD003GE | |
| Asus ProArt P16 RTX 5090 | |
| Medio Intel Core Ultra 7 356H (773 - 774, n=2) | |
| Samsung Galaxy Book6 Ultra | |
| Dell 16 Premium DA16250 | |
| Media de la clase Multimedia (425 - 853, n=60, últimos 2 años) | |
| Apple MacBook Pro 16 M4 Max | |
| Cinebench R15 / CPU Multi 64Bit | |
| Apple MacBook Pro 16 M4 Max | |
| Asus ProArt P16 RTX 5090 | |
| Lenovo Yoga Pro 9i 16 RTX 5070 | |
| Lenovo ThinkPad T1g Gen 8 21TD003GE | |
| Dell 16 Premium DA16250 | |
| Samsung Galaxy Book6 Ultra | |
| Medio Intel Core Ultra 7 356H (2937 - 3201, n=2) | |
| Media de la clase Multimedia (856 - 5224, n=64, últimos 2 años) | |
| Cinebench R15 / CPU Single 64Bit | |
| Lenovo Yoga Pro 9i 16 RTX 5070 | |
| Lenovo ThinkPad T1g Gen 8 21TD003GE | |
| Apple MacBook Pro 16 M4 Max | |
| Samsung Galaxy Book6 Ultra | |
| Medio Intel Core Ultra 7 356H (303 - 306, n=2) | |
| Dell 16 Premium DA16250 | |
| Media de la clase Multimedia (184.8 - 326, n=62, últimos 2 años) | |
| Asus ProArt P16 RTX 5090 | |
| Blender / v2.79 BMW27 CPU | |
| Media de la clase Multimedia (100 - 557, n=61, últimos 2 años) | |
| Medio Intel Core Ultra 7 356H (163 - 196, n=2) | |
| Dell 16 Premium DA16250 | |
| Samsung Galaxy Book6 Ultra | |
| Lenovo ThinkPad T1g Gen 8 21TD003GE | |
| Lenovo Yoga Pro 9i 16 RTX 5070 | |
| Asus ProArt P16 RTX 5090 | |
| 7-Zip 18.03 / 7z b 4 | |
| Asus ProArt P16 RTX 5090 | |
| Lenovo Yoga Pro 9i 16 RTX 5070 | |
| Samsung Galaxy Book6 Ultra | |
| Lenovo ThinkPad T1g Gen 8 21TD003GE | |
| Dell 16 Premium DA16250 | |
| Medio Intel Core Ultra 7 356H (65579 - 69785, n=2) | |
| Media de la clase Multimedia (26062 - 130368, n=58, últimos 2 años) | |
| 7-Zip 18.03 / 7z b 4 -mmt1 | |
| Medio Intel Core Ultra 7 356H (6305 - 6375, n=2) | |
| Samsung Galaxy Book6 Ultra | |
| Lenovo Yoga Pro 9i 16 RTX 5070 | |
| Asus ProArt P16 RTX 5090 | |
| Lenovo ThinkPad T1g Gen 8 21TD003GE | |
| Media de la clase Multimedia (3666 - 7545, n=59, últimos 2 años) | |
| Dell 16 Premium DA16250 | |
| Geekbench 6.7 / Multi-Core | |
| Apple MacBook Pro 16 M4 Max | |
| Apple MacBook Pro 16 2024 M4 Pro | |
| Lenovo Yoga Pro 9i 16 RTX 5070 | |
| Lenovo ThinkPad T1g Gen 8 21TD003GE | |
| Dell 16 Premium DA16250 | |
| Samsung Galaxy Book6 Ultra | |
| Medio Intel Core Ultra 7 356H (15578 - 16676, n=3) | |
| Asus ProArt P16 RTX 5090 | |
| Media de la clase Multimedia (4983 - 29415, n=72, últimos 2 años) | |
| Geekbench 6.7 / Single-Core | |
| Apple MacBook Pro 16 M4 Max | |
| Apple MacBook Pro 16 2024 M4 Pro | |
| Lenovo Yoga Pro 9i 16 RTX 5070 | |
| Lenovo ThinkPad T1g Gen 8 21TD003GE | |
| Asus ProArt P16 RTX 5090 | |
| Media de la clase Multimedia (1534 - 4335, n=71, últimos 2 años) | |
| Samsung Galaxy Book6 Ultra | |
| Dell 16 Premium DA16250 | |
| Medio Intel Core Ultra 7 356H (2532 - 2851, n=3) | |
| Geekbench 5.5 / Multi-Core | |
| Lenovo Yoga Pro 9i 16 RTX 5070 | |
| Lenovo ThinkPad T1g Gen 8 21TD003GE | |
| Samsung Galaxy Book6 Ultra | |
| Medio Intel Core Ultra 7 356H (16721 - 16761, n=2) | |
| Dell 16 Premium DA16250 | |
| Asus ProArt P16 RTX 5090 | |
| Media de la clase Multimedia (4652 - 20422, n=59, últimos 2 años) | |
| Geekbench 5.5 / Single-Core | |
| Asus ProArt P16 RTX 5090 | |
| Lenovo Yoga Pro 9i 16 RTX 5070 | |
| Lenovo ThinkPad T1g Gen 8 21TD003GE | |
| Medio Intel Core Ultra 7 356H (2086 - 2098, n=2) | |
| Samsung Galaxy Book6 Ultra | |
| Media de la clase Multimedia (805 - 2974, n=59, últimos 2 años) | |
| Dell 16 Premium DA16250 | |
| HWBOT x265 Benchmark v2.2 / 4k Preset | |
| Asus ProArt P16 RTX 5090 | |
| Lenovo Yoga Pro 9i 16 RTX 5070 | |
| Lenovo ThinkPad T1g Gen 8 21TD003GE | |
| Samsung Galaxy Book6 Ultra | |
| Dell 16 Premium DA16250 | |
| Medio Intel Core Ultra 7 356H (20 - 25.1, n=2) | |
| Media de la clase Multimedia (5.26 - 36.1, n=59, últimos 2 años) | |
| LibreOffice / 20 Documents To PDF | |
| Medio Intel Core Ultra 7 356H (47.3 - 57.8, n=2) | |
| Media de la clase Multimedia (23.9 - 146.7, n=60, últimos 2 años) | |
| Asus ProArt P16 RTX 5090 | |
| Samsung Galaxy Book6 Ultra | |
| Lenovo Yoga Pro 9i 16 RTX 5070 | |
| Dell 16 Premium DA16250 | |
| Lenovo ThinkPad T1g Gen 8 21TD003GE | |
| R Benchmark 2.5 / Overall mean | |
| Media de la clase Multimedia (0.3604 - 0.947, n=59, últimos 2 años) | |
| Dell 16 Premium DA16250 | |
| Medio Intel Core Ultra 7 356H (0.4268 - 0.459, n=2) | |
| Samsung Galaxy Book6 Ultra | |
| Lenovo ThinkPad T1g Gen 8 21TD003GE | |
| Asus ProArt P16 RTX 5090 | |
| Lenovo Yoga Pro 9i 16 RTX 5070 | |
* ... más pequeño es mejor
AIDA64: FP32 Ray-Trace | FPU Julia | CPU SHA3 | CPU Queen | FPU SinJulia | FPU Mandel | CPU AES | CPU ZLib | FP64 Ray-Trace | CPU PhotoWorxx | CPU CheckMate
| Performance rating | |
| Asus ProArt P16 RTX 5090 -1! | |
| Lenovo Yoga Pro 9i 16 RTX 5070 -1! | |
| Lenovo ThinkPad T1g Gen 8 21TD003GE -1! | |
| Samsung Galaxy Book6 Ultra -1! | |
| Medio Intel Core Ultra 7 356H -1! | |
| Media de la clase Multimedia | |
| AIDA64 / FP32 Ray-Trace | |
| Asus ProArt P16 RTX 5090 (v6.92.6600) | |
| Lenovo Yoga Pro 9i 16 RTX 5070 (v6.92.6600) | |
| Lenovo ThinkPad T1g Gen 8 21TD003GE (v6.92.6600) | |
| Samsung Galaxy Book6 Ultra (v8.20.8100) | |
| Medio Intel Core Ultra 7 356H (16303 - 20528, n=2) | |
| Media de la clase Multimedia (2214 - 50388, n=56, últimos 2 años) | |
| AIDA64 / FPU Julia | |
| Asus ProArt P16 RTX 5090 (v6.92.6600) | |
| Lenovo Yoga Pro 9i 16 RTX 5070 (v6.92.6600) | |
| Lenovo ThinkPad T1g Gen 8 21TD003GE (v6.92.6600) | |
| Samsung Galaxy Book6 Ultra (v8.20.8100) | |
| Medio Intel Core Ultra 7 356H (81236 - 108092, n=2) | |
| Media de la clase Multimedia (12867 - 201874, n=57, últimos 2 años) | |
| AIDA64 / CPU SHA3 | |
| Lenovo Yoga Pro 9i 16 RTX 5070 (v6.92.6600) | |
| Lenovo ThinkPad T1g Gen 8 21TD003GE (v6.92.6600) | |
| Samsung Galaxy Book6 Ultra (v8.20.8100) | |
| Asus ProArt P16 RTX 5090 (v6.92.6600) | |
| Medio Intel Core Ultra 7 356H (4141 - 5284, n=2) | |
| Media de la clase Multimedia (626 - 8623, n=57, últimos 2 años) | |
| AIDA64 / CPU Queen | |
| Asus ProArt P16 RTX 5090 (v6.92.6600) | |
| Media de la clase Multimedia (13483 - 181505, n=44, últimos 2 años) | |
| Lenovo ThinkPad T1g Gen 8 21TD003GE (v6.92.6600) | |
| Lenovo Yoga Pro 9i 16 RTX 5070 (v6.92.6600) | |
| AIDA64 / FPU SinJulia | |
| Asus ProArt P16 RTX 5090 (v6.92.6600) | |
| Lenovo Yoga Pro 9i 16 RTX 5070 (v6.92.6600) | |
| Lenovo ThinkPad T1g Gen 8 21TD003GE (v6.92.6600) | |
| Media de la clase Multimedia (886 - 28794, n=57, últimos 2 años) | |
| Medio Intel Core Ultra 7 356H (6960 - 6965, n=2) | |
| Samsung Galaxy Book6 Ultra (v8.20.8100) | |
| AIDA64 / FPU Mandel | |
| Asus ProArt P16 RTX 5090 (v6.92.6600) | |
| Lenovo Yoga Pro 9i 16 RTX 5070 (v6.92.6600) | |
| Lenovo ThinkPad T1g Gen 8 21TD003GE (v6.92.6600) | |
| Samsung Galaxy Book6 Ultra (v8.20.8100) | |
| Medio Intel Core Ultra 7 356H (44538 - 58505, n=2) | |
| Media de la clase Multimedia (6395 - 105740, n=56, últimos 2 años) | |
| AIDA64 / CPU AES | |
| Asus ProArt P16 RTX 5090 (v6.92.6600) | |
| Lenovo Yoga Pro 9i 16 RTX 5070 (v6.92.6600) | |
| Lenovo ThinkPad T1g Gen 8 21TD003GE (v6.92.6600) | |
| Samsung Galaxy Book6 Ultra (v8.20.8100) | |
| Medio Intel Core Ultra 7 356H (64920 - 67037, n=2) | |
| Media de la clase Multimedia (8171 - 126790, n=57, últimos 2 años) | |
| AIDA64 / CPU ZLib | |
| Asus ProArt P16 RTX 5090 (v6.92.6600) | |
| Lenovo Yoga Pro 9i 16 RTX 5070 (v6.92.6600) | |
| Lenovo ThinkPad T1g Gen 8 21TD003GE (v6.92.6600) | |
| Samsung Galaxy Book6 Ultra (v8.20.8100) | |
| Medio Intel Core Ultra 7 356H (1086 - 1199, n=2) | |
| Media de la clase Multimedia (143.8 - 2022, n=57, últimos 2 años) | |
| AIDA64 / FP64 Ray-Trace | |
| Asus ProArt P16 RTX 5090 (v6.92.6600) | |
| Lenovo Yoga Pro 9i 16 RTX 5070 (v6.92.6600) | |
| Lenovo ThinkPad T1g Gen 8 21TD003GE (v6.92.6600) | |
| Samsung Galaxy Book6 Ultra (v8.20.8100) | |
| Medio Intel Core Ultra 7 356H (8201 - 11057, n=2) | |
| Media de la clase Multimedia (1014 - 26875, n=57, últimos 2 años) | |
| AIDA64 / CPU PhotoWorxx | |
| Medio Intel Core Ultra 7 356H (83099 - 83163, n=2) | |
| Samsung Galaxy Book6 Ultra (v8.20.8100) | |
| Lenovo Yoga Pro 9i 16 RTX 5070 (v6.92.6600) | |
| Lenovo ThinkPad T1g Gen 8 21TD003GE (v6.92.6600) | |
| Media de la clase Multimedia (8187 - 88154, n=57, últimos 2 años) | |
| Asus ProArt P16 RTX 5090 (v6.92.6600) | |
| AIDA64 / CPU CheckMate | |
| Samsung Galaxy Book6 Ultra (v8.20.8100) | |
| Medio Intel Core Ultra 7 356H (4196 - 4629, n=2) | |
| Media de la clase Multimedia (569 - 4742, n=16, últimos 2 años) | |
Rendimiento del sistema
La impresión subjetiva de rendimiento es excelente y las puntuaciones en los benchmarks son muy altas. No encontramos ningún problema de estabilidad durante nuestro periodo de revisión.
PCMark 10: Score | Essentials | Productivity | Digital Content Creation
CrossMark: Overall | Productivity | Creativity | Responsiveness
WebXPRT 3: Overall
WebXPRT 4: Overall
Mozilla Kraken 1.1: Total
| Performance rating | |
| Apple MacBook Pro 16 2024 M4 Pro -4! | |
| Lenovo ThinkPad T1g Gen 8 21TD003GE | |
| Lenovo Yoga Pro 9i 16 RTX 5070 | |
| Samsung Galaxy Book6 Ultra | |
| Medio Intel Core Ultra 7 356H, NVIDIA GeForce RTX 5070 Laptop | |
| Dell 16 Premium DA16250 -4! | |
| Media de la clase Multimedia | |
| Asus ProArt P16 RTX 5090 -4! | |
| PCMark 10 / Score | |
| Lenovo ThinkPad T1g Gen 8 21TD003GE | |
| Samsung Galaxy Book6 Ultra | |
| Medio Intel Core Ultra 7 356H, NVIDIA GeForce RTX 5070 Laptop (n=1) | |
| Lenovo Yoga Pro 9i 16 RTX 5070 | |
| Media de la clase Multimedia (4325 - 10386, n=55, últimos 2 años) | |
| PCMark 10 / Essentials | |
| Lenovo Yoga Pro 9i 16 RTX 5070 | |
| Media de la clase Multimedia (8025 - 11664, n=54, últimos 2 años) | |
| Lenovo ThinkPad T1g Gen 8 21TD003GE | |
| Samsung Galaxy Book6 Ultra | |
| Medio Intel Core Ultra 7 356H, NVIDIA GeForce RTX 5070 Laptop (n=1) | |
| PCMark 10 / Productivity | |
| Lenovo ThinkPad T1g Gen 8 21TD003GE | |
| Samsung Galaxy Book6 Ultra | |
| Medio Intel Core Ultra 7 356H, NVIDIA GeForce RTX 5070 Laptop (n=1) | |
| Media de la clase Multimedia (7323 - 18233, n=54, últimos 2 años) | |
| Lenovo Yoga Pro 9i 16 RTX 5070 | |
| PCMark 10 / Digital Content Creation | |
| Lenovo Yoga Pro 9i 16 RTX 5070 | |
| Lenovo ThinkPad T1g Gen 8 21TD003GE | |
| Samsung Galaxy Book6 Ultra | |
| Medio Intel Core Ultra 7 356H, NVIDIA GeForce RTX 5070 Laptop (n=1) | |
| Media de la clase Multimedia (3651 - 16240, n=54, últimos 2 años) | |
| CrossMark / Overall | |
| Lenovo ThinkPad T1g Gen 8 21TD003GE | |
| Apple MacBook Pro 16 2024 M4 Pro | |
| Lenovo Yoga Pro 9i 16 RTX 5070 | |
| Dell 16 Premium DA16250 | |
| Asus ProArt P16 RTX 5090 | |
| Samsung Galaxy Book6 Ultra | |
| Medio Intel Core Ultra 7 356H, NVIDIA GeForce RTX 5070 Laptop (n=1) | |
| Media de la clase Multimedia (866 - 2728, n=63, últimos 2 años) | |
| CrossMark / Productivity | |
| Lenovo ThinkPad T1g Gen 8 21TD003GE | |
| Apple MacBook Pro 16 2024 M4 Pro | |
| Lenovo Yoga Pro 9i 16 RTX 5070 | |
| Dell 16 Premium DA16250 | |
| Asus ProArt P16 RTX 5090 | |
| Media de la clase Multimedia (931 - 2489, n=63, últimos 2 años) | |
| Samsung Galaxy Book6 Ultra | |
| Medio Intel Core Ultra 7 356H, NVIDIA GeForce RTX 5070 Laptop (n=1) | |
| CrossMark / Creativity | |
| Apple MacBook Pro 16 2024 M4 Pro | |
| Lenovo ThinkPad T1g Gen 8 21TD003GE | |
| Lenovo Yoga Pro 9i 16 RTX 5070 | |
| Asus ProArt P16 RTX 5090 | |
| Samsung Galaxy Book6 Ultra | |
| Medio Intel Core Ultra 7 356H, NVIDIA GeForce RTX 5070 Laptop (n=1) | |
| Dell 16 Premium DA16250 | |
| Media de la clase Multimedia (907 - 3465, n=63, últimos 2 años) | |
| CrossMark / Responsiveness | |
| Lenovo ThinkPad T1g Gen 8 21TD003GE | |
| Dell 16 Premium DA16250 | |
| Lenovo Yoga Pro 9i 16 RTX 5070 | |
| Apple MacBook Pro 16 2024 M4 Pro | |
| Samsung Galaxy Book6 Ultra | |
| Medio Intel Core Ultra 7 356H, NVIDIA GeForce RTX 5070 Laptop (n=1) | |
| Media de la clase Multimedia (605 - 2024, n=63, últimos 2 años) | |
| Asus ProArt P16 RTX 5090 | |
| WebXPRT 3 / Overall | |
| Apple MacBook Pro 16 2024 M4 Pro | |
| Lenovo Yoga Pro 9i 16 RTX 5070 | |
| Media de la clase Multimedia (136.4 - 596, n=66, últimos 2 años) | |
| Dell 16 Premium DA16250 | |
| Lenovo ThinkPad T1g Gen 8 21TD003GE | |
| Samsung Galaxy Book6 Ultra | |
| Medio Intel Core Ultra 7 356H, NVIDIA GeForce RTX 5070 Laptop (n=1) | |
| Asus ProArt P16 RTX 5090 | |
| WebXPRT 4 / Overall | |
| Apple MacBook Pro 16 2024 M4 Pro | |
| Lenovo Yoga Pro 9i 16 RTX 5070 | |
| Lenovo ThinkPad T1g Gen 8 21TD003GE | |
| Dell 16 Premium DA16250 | |
| Samsung Galaxy Book6 Ultra | |
| Medio Intel Core Ultra 7 356H, NVIDIA GeForce RTX 5070 Laptop (n=1) | |
| Media de la clase Multimedia (167.3 - 402, n=68, últimos 2 años) | |
| Asus ProArt P16 RTX 5090 | |
| Mozilla Kraken 1.1 / Total | |
| Dell 16 Premium DA16250 | |
| Samsung Galaxy Book6 Ultra | |
| Medio Intel Core Ultra 7 356H, NVIDIA GeForce RTX 5070 Laptop (n=1) | |
| Media de la clase Multimedia (228 - 835, n=69, últimos 2 años) | |
| Lenovo ThinkPad T1g Gen 8 21TD003GE | |
| Lenovo Yoga Pro 9i 16 RTX 5070 | |
| Asus ProArt P16 RTX 5090 | |
| Apple MacBook Pro 16 2024 M4 Pro | |
* ... más pequeño es mejor
| PCMark 10 Score | 9383 puntos | |
ayuda | ||
| AIDA64 / Memory Copy | |
| Medio Intel Core Ultra 7 356H (116043 - 121055, n=2) | |
| Samsung Galaxy Book6 Ultra | |
| Lenovo Yoga Pro 9i 16 RTX 5070 | |
| Lenovo ThinkPad T1g Gen 8 21TD003GE | |
| Asus ProArt P16 RTX 5090 | |
| Media de la clase Multimedia (11299 - 132135, n=57, últimos 2 años) | |
| AIDA64 / Memory Read | |
| Medio Intel Core Ultra 7 356H (107881 - 112376, n=2) | |
| Samsung Galaxy Book6 Ultra | |
| Asus ProArt P16 RTX 5090 | |
| Lenovo Yoga Pro 9i 16 RTX 5070 | |
| Media de la clase Multimedia (11624 - 174586, n=57, últimos 2 años) | |
| Lenovo ThinkPad T1g Gen 8 21TD003GE | |
| AIDA64 / Memory Write | |
| Medio Intel Core Ultra 7 356H (120431 - 120449, n=2) | |
| Samsung Galaxy Book6 Ultra | |
| Asus ProArt P16 RTX 5090 | |
| Media de la clase Multimedia (11755 - 134998, n=57, últimos 2 años) | |
| Lenovo ThinkPad T1g Gen 8 21TD003GE | |
| Lenovo Yoga Pro 9i 16 RTX 5070 | |
| AIDA64 / Memory Latency | |
| Lenovo ThinkPad T1g Gen 8 21TD003GE | |
| Media de la clase Multimedia (7 - 535, n=56, últimos 2 años) | |
| Lenovo Yoga Pro 9i 16 RTX 5070 | |
| Asus ProArt P16 RTX 5090 | |
| Samsung Galaxy Book6 Ultra | |
| Medio Intel Core Ultra 7 356H (88.6 - 90, n=2) | |
* ... más pequeño es mejor
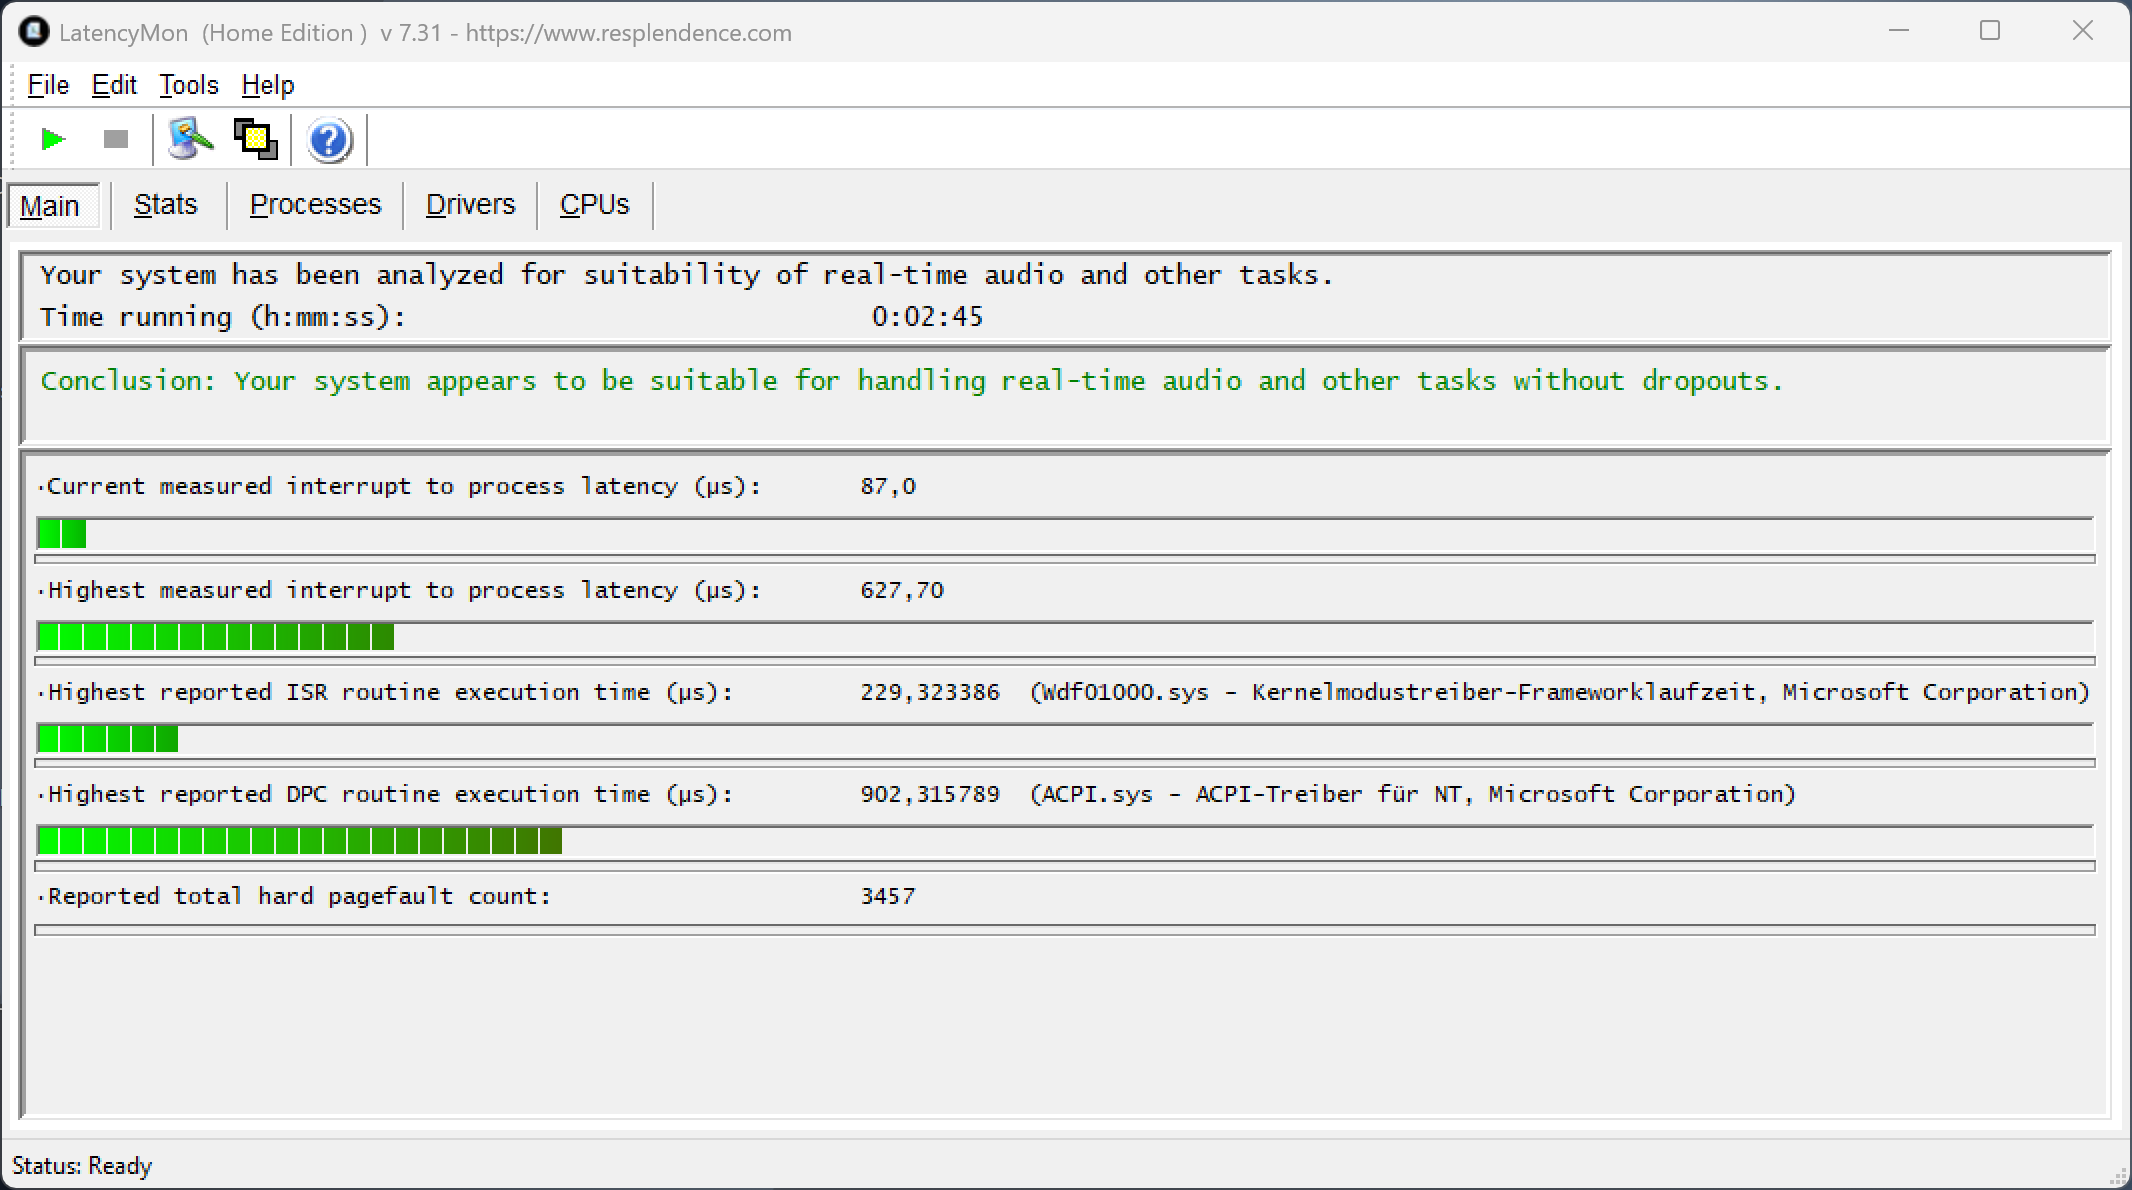
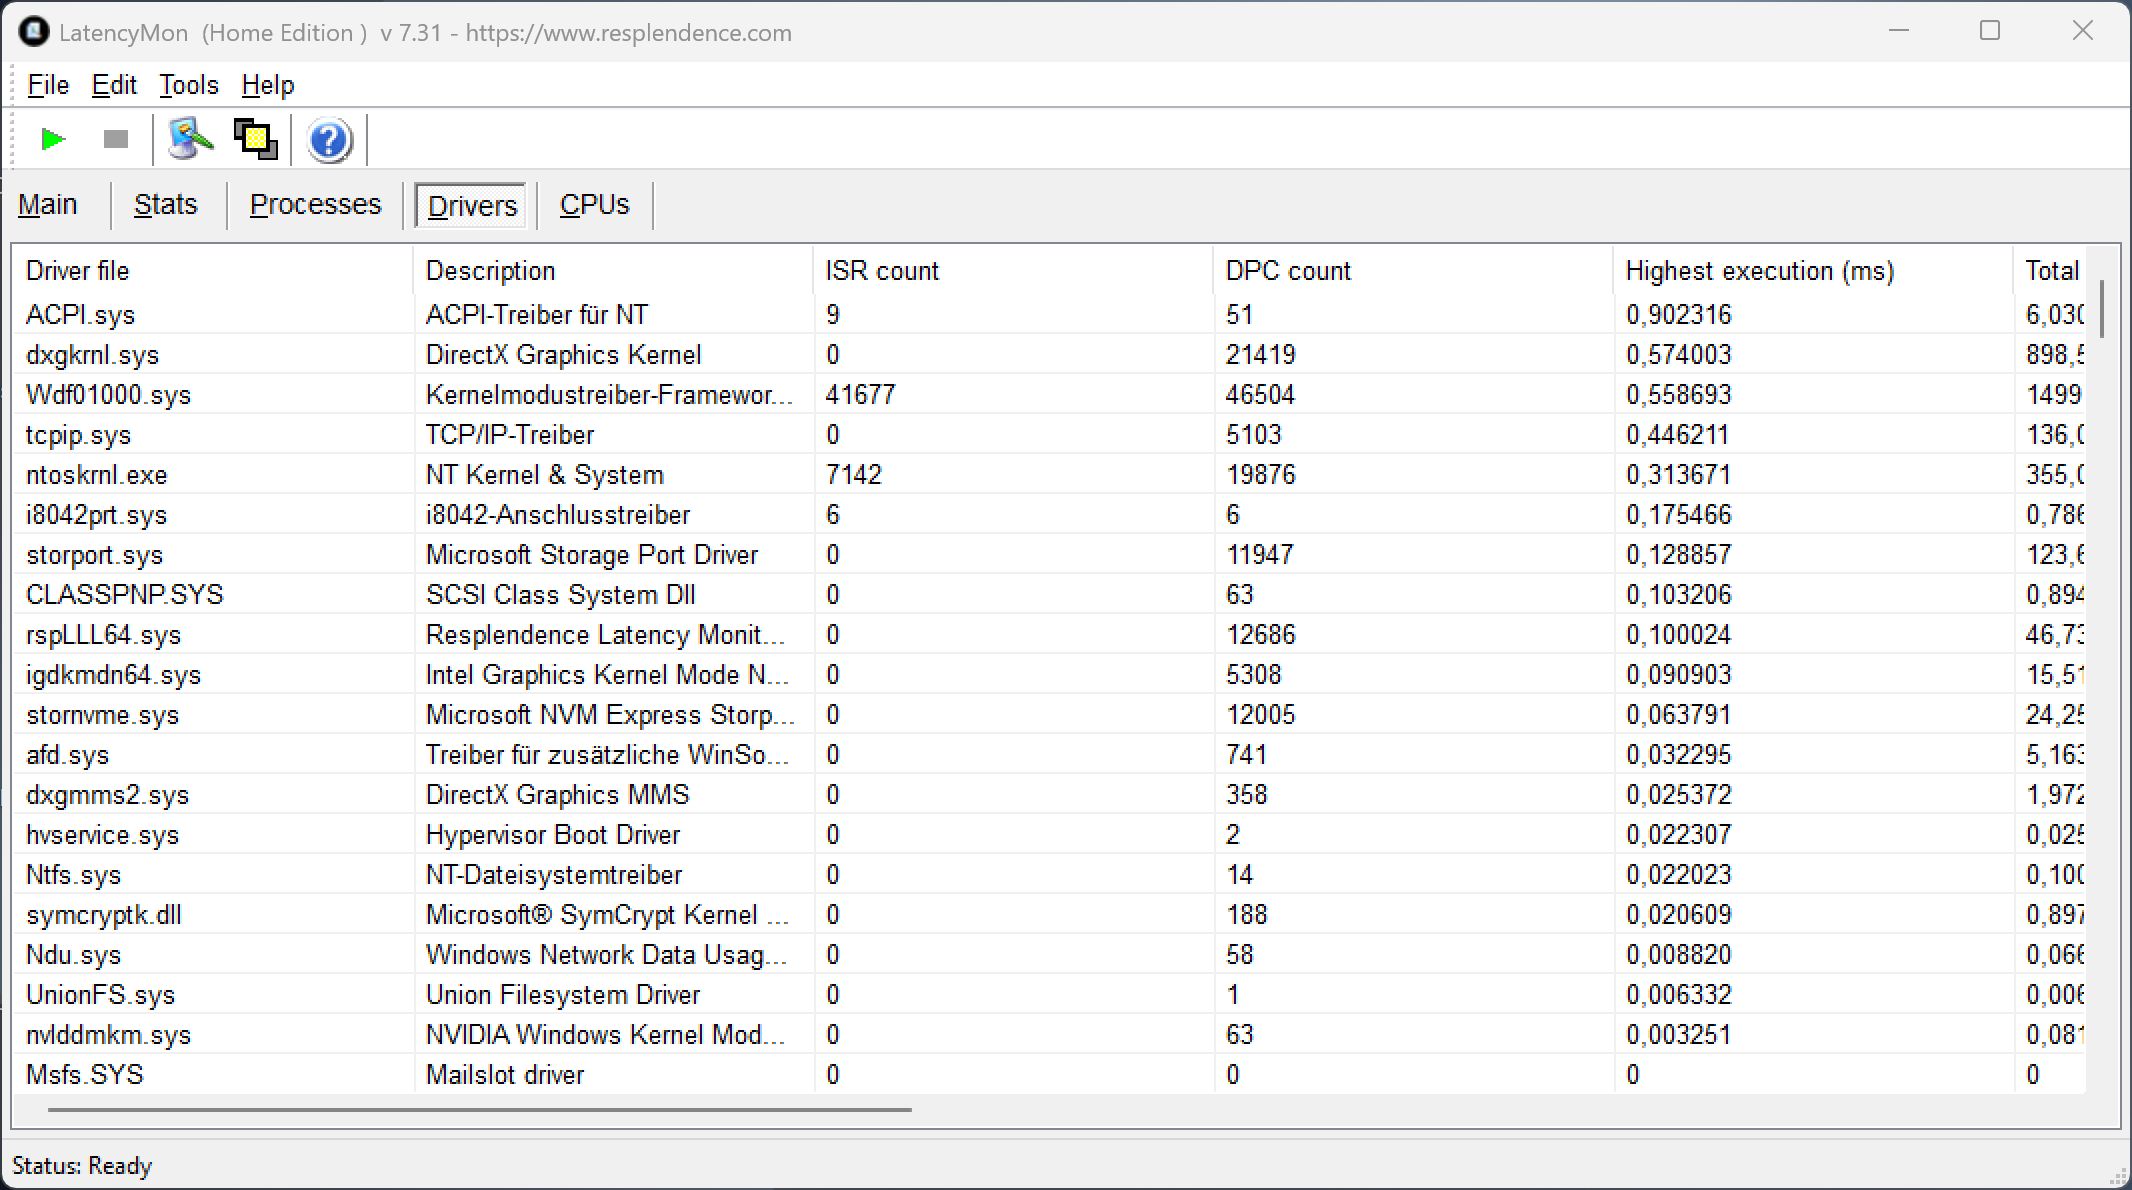
Latencia del CPD
La unidad de revisión no mostró ningún problema con las aplicaciones de audio en tiempo real durante nuestra prueba de latencia estandarizada (navegación web, reproducción 4K de YouTube, carga de la CPU).
| DPC Latencies / LatencyMon - interrupt to process latency (max), Web, Youtube, Prime95 | |
| Asus ProArt P16 RTX 5090 | |
| Lenovo ThinkPad T1g Gen 8 21TD003GE | |
| Lenovo Yoga Pro 9i 16 RTX 5070 | |
| Samsung Galaxy Book6 Ultra | |
| Dell 16 Premium DA16250 | |
* ... más pequeño es mejor
Dispositivos de almacenamiento
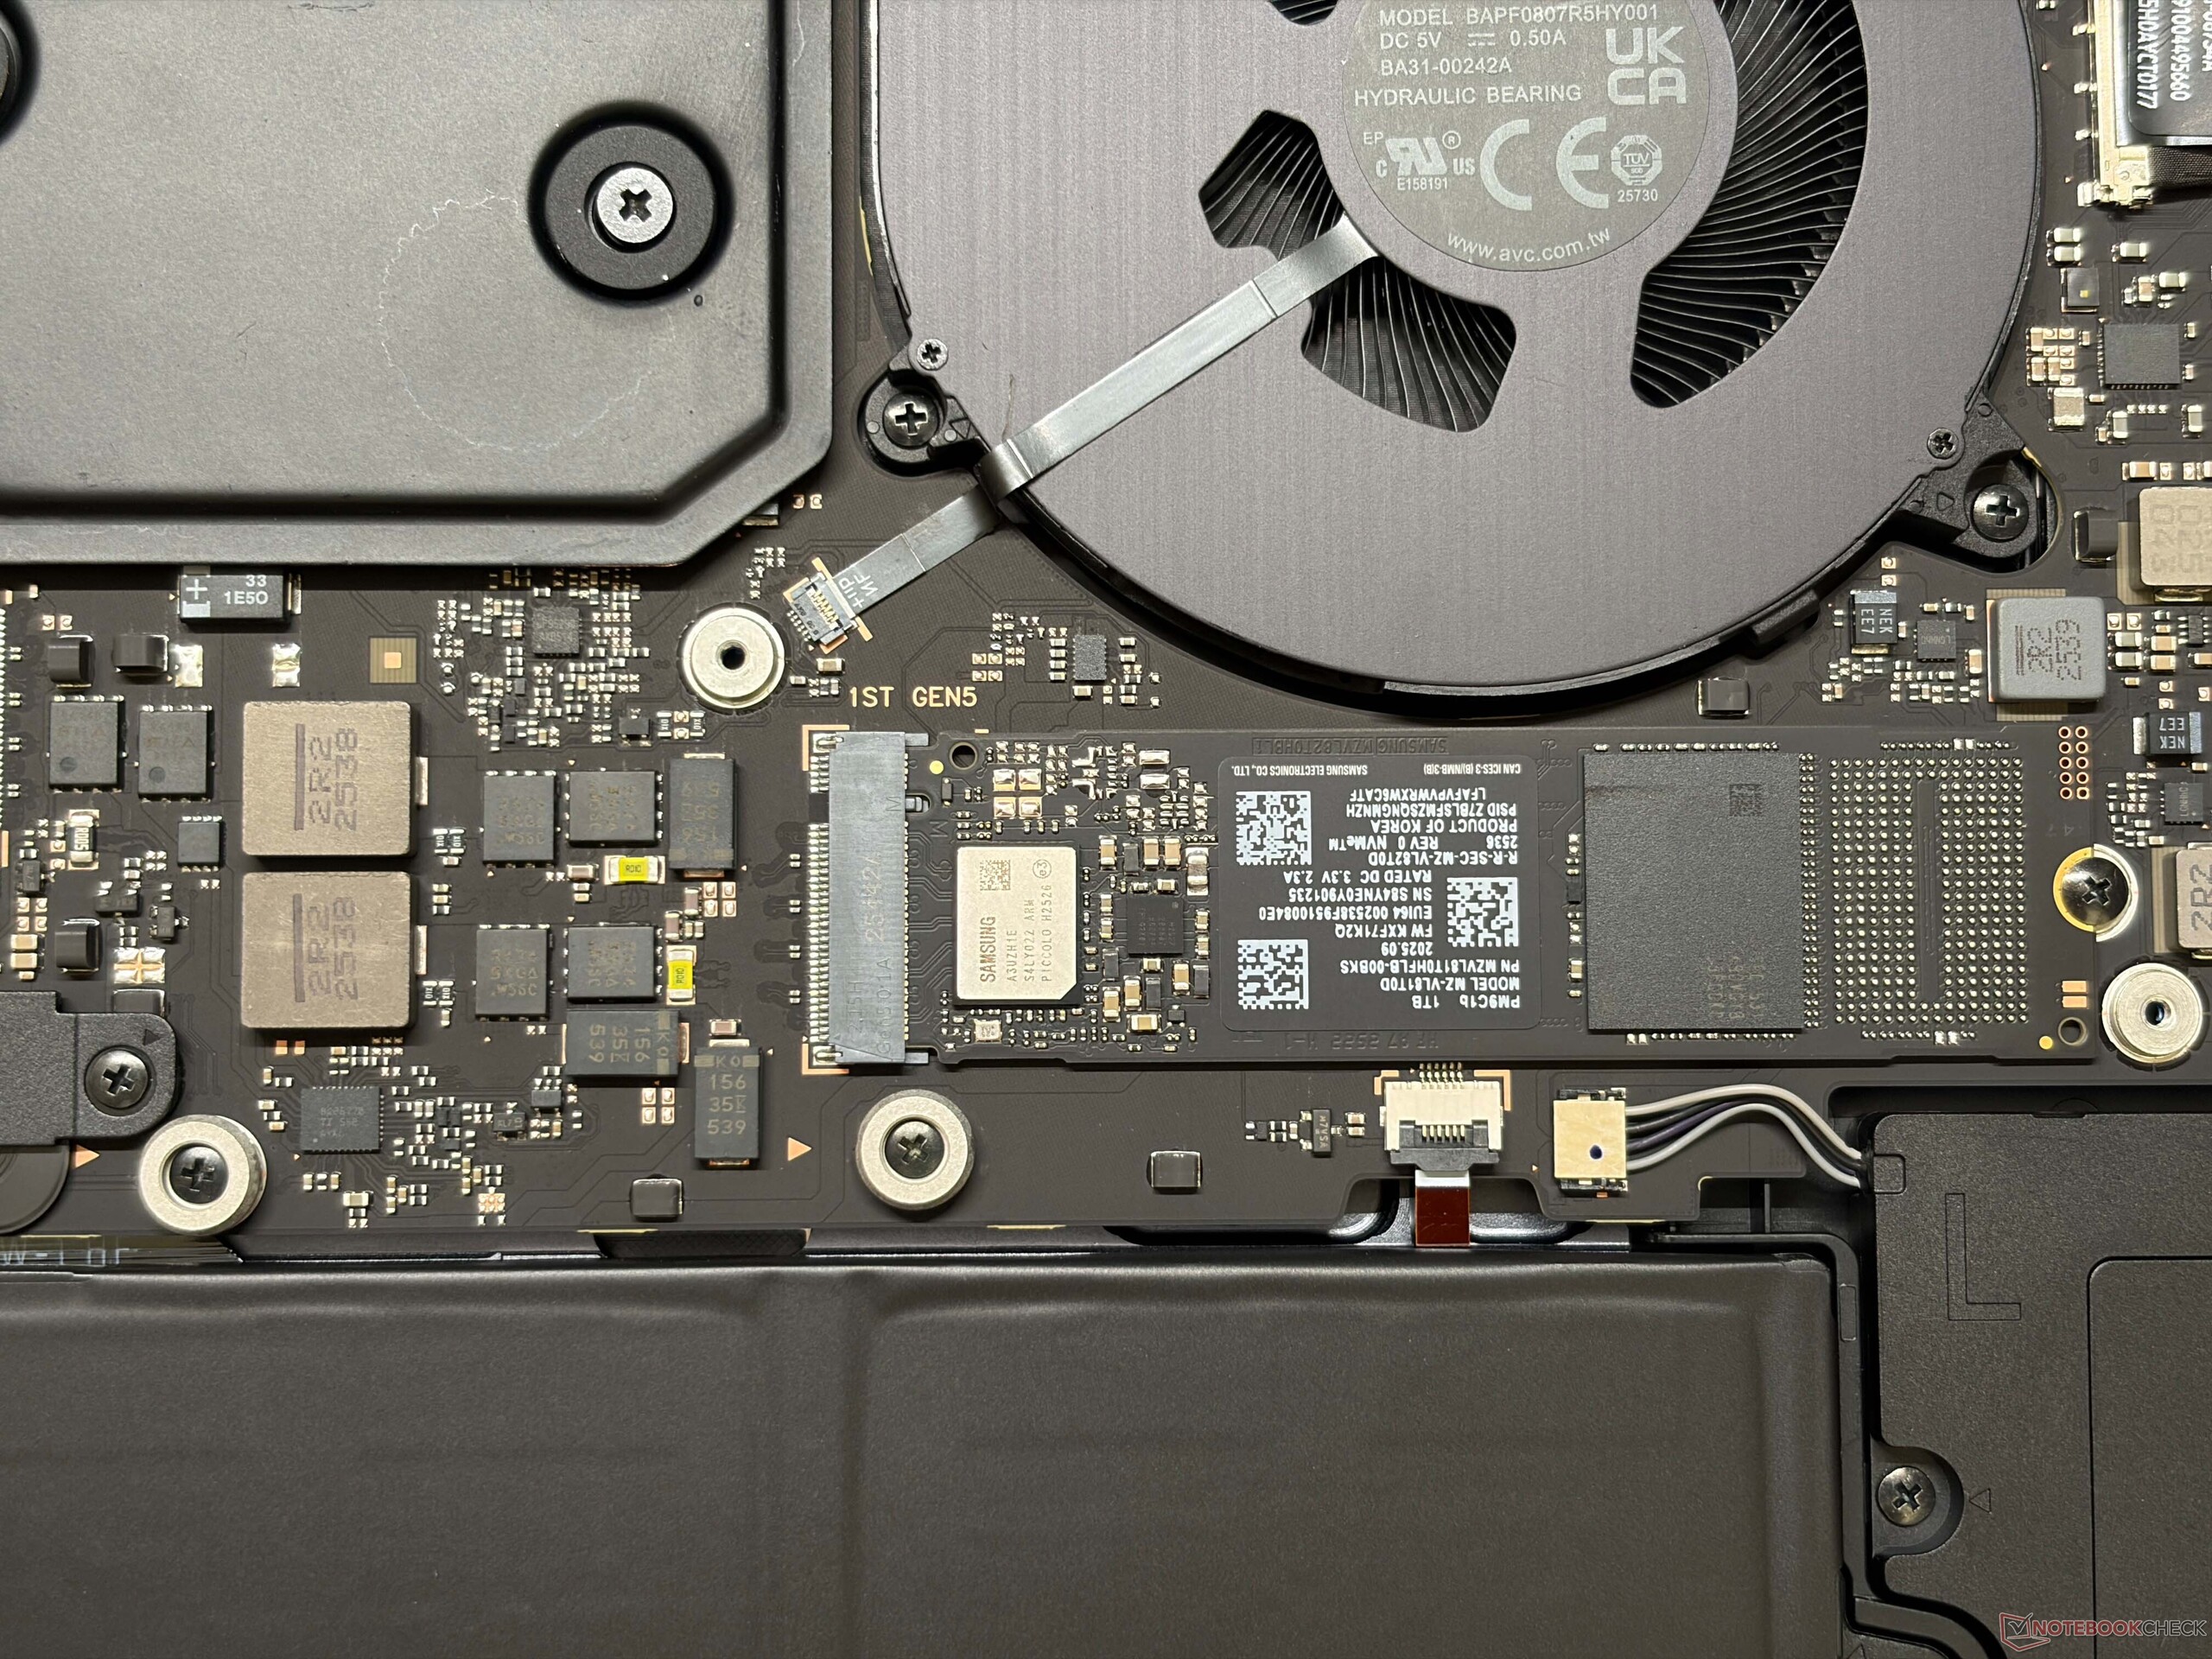
Nuestra unidad de pruebas está equipada con una unidad de 1 TB de Samsung (PM9C1b, 846 GB libres) con velocidades de transferencia decentes y estables. También hay una ranura secundaria M.2-2280 si desea añadir más almacenamiento, pero ambas ranuras están limitadas a PCIe 4.0.

* ... más pequeño es mejor
Estrangulamiento de disco: Bucle de lectura DiskSpd, profundidad de cola 8
Rendimiento de la GPU
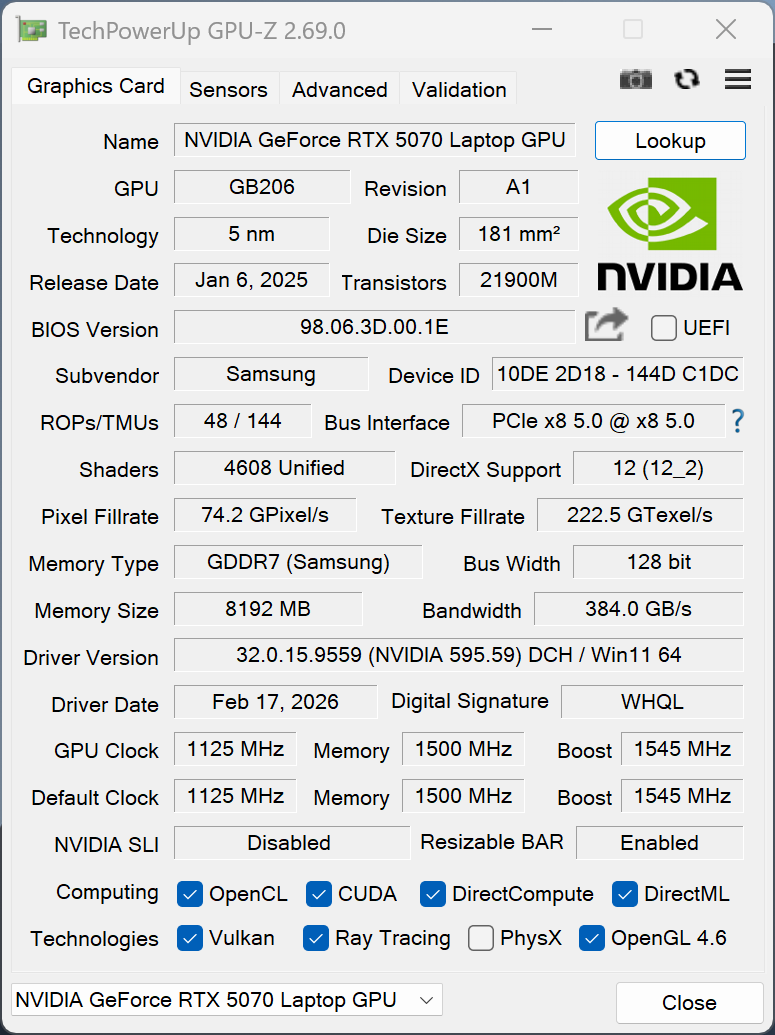
La GeForce RTX 5070 puede consumir hasta 90 vatios y ofrece buenas cifras de rendimiento para un portátil multimedia. El rendimiento en juegos también es bueno y estable, pero la cantidad limitada de VRAM (8 GB) puede ser una limitación en juegos exigentes. Consulte nuestro artículo dedicado para obtener más información.
| 3DMark 11 Performance | 33399 puntos | |
| 3DMark Fire Strike Score | 27336 puntos | |
| 3DMark Time Spy Score | 11467 puntos | |
| 3DMark Steel Nomad Score | 2784 puntos | |
| 3DMark Steel Nomad Light Score | 12271 puntos | |
ayuda | ||
| Blender / v3.3 Classroom OPTIX/RTX | |
| Media de la clase Multimedia (12 - 105, n=23, últimos 2 años) | |
| Lenovo Yoga Pro 9i 16 RTX 5070 | |
| Lenovo ThinkPad T1g Gen 8 21TD003GE | |
| Dell 16 Premium DA16250 | |
| Samsung Galaxy Book6 Ultra | |
| Medio NVIDIA GeForce RTX 5070 Laptop (17 - 24, n=28) | |
| Asus ProArt P16 RTX 5090 | |
| Blender / v3.3 Classroom CUDA | |
| Media de la clase Multimedia (20 - 186, n=23, últimos 2 años) | |
| Medio NVIDIA GeForce RTX 5070 Laptop (29 - 228, n=29) | |
| Lenovo ThinkPad T1g Gen 8 21TD003GE | |
| Dell 16 Premium DA16250 | |
| Lenovo Yoga Pro 9i 16 RTX 5070 | |
| Samsung Galaxy Book6 Ultra | |
| Asus ProArt P16 RTX 5090 | |
| Blender / v3.3 Classroom CPU | |
| Media de la clase Multimedia (134.5 - 1042, n=64, últimos 2 años) | |
| Dell 16 Premium DA16250 | |
| Samsung Galaxy Book6 Ultra | |
| Lenovo ThinkPad T1g Gen 8 21TD003GE | |
| Medio NVIDIA GeForce RTX 5070 Laptop (137 - 507, n=26) | |
| Lenovo Yoga Pro 9i 16 RTX 5070 | |
| Asus ProArt P16 RTX 5090 | |
* ... más pequeño es mejor
| GTA V - 1920x1080 Highest AA:4xMSAA + FX AF:16x | |
| Lenovo Yoga Pro 9i 16 RTX 5070 | |
| Samsung Galaxy Book6 Ultra | |
| Lenovo ThinkPad T1g Gen 8 21TD003GE | |
| Dell 16 Premium DA16250 | |
| Asus ProArt P16 RTX 5090 | |
| Media de la clase Multimedia (7.92 - 141.6, n=59, últimos 2 años) | |
| Final Fantasy XV Benchmark - 1920x1080 High Quality | |
| Asus ProArt P16 RTX 5090 | |
| Lenovo Yoga Pro 9i 16 RTX 5070 | |
| Lenovo ThinkPad T1g Gen 8 21TD003GE | |
| Samsung Galaxy Book6 Ultra | |
| Dell 16 Premium DA16250 | |
| Media de la clase Multimedia (7.61 - 144.4, n=61, últimos 2 años) | |
| Strange Brigade - 1920x1080 ultra AA:ultra AF:16 | |
| Asus ProArt P16 RTX 5090 | |
| Lenovo Yoga Pro 9i 16 RTX 5070 | |
| Samsung Galaxy Book6 Ultra | |
| Lenovo ThinkPad T1g Gen 8 21TD003GE | |
| Dell 16 Premium DA16250 | |
| Media de la clase Multimedia (13.3 - 303, n=61, últimos 2 años) | |
| Dota 2 Reborn - 1920x1080 ultra (3/3) best looking | |
| Lenovo Yoga Pro 9i 16 RTX 5070 | |
| Dell 16 Premium DA16250 | |
| Samsung Galaxy Book6 Ultra | |
| Lenovo ThinkPad T1g Gen 8 21TD003GE | |
| Asus ProArt P16 RTX 5090 | |
| Media de la clase Multimedia (29 - 179.9, n=63, últimos 2 años) | |
Cyberpunk 2077 ultra FPS Gráfico
| bajo | medio | alto | ultra | QHD DLSS | QHD | 4K | |
|---|---|---|---|---|---|---|---|
| GTA V (2015) | 137.1 | 111.9 | |||||
| Dota 2 Reborn (2015) | 173.3 | 155.4 | 149.3 | 139.7 | |||
| Final Fantasy XV Benchmark (2018) | 178.8 | 137.3 | 116.6 | 88.8 | 48.7 | ||
| X-Plane 11.11 (2018) | 109.6 | 102.4 | 76 | ||||
| Strange Brigade (2018) | 479 | 315 | 257 | 220 | 151.8 | ||
| Baldur's Gate 3 (2023) | 149.1 | 129.7 | 111.1 | 109.2 | 76.2 | ||
| Cyberpunk 2077 (2023) | 114.1 | 104 | 92.5 | 84.6 | 67.5 | 57.4 | |
| F1 24 (2024) | 257 | 217 | 77.5 | 77.2 | 49.5 |
Emisiones y consumo de energía
Ruido del sistema

Samsung utiliza una unidad de refrigeración de cámara de vapor con dos ventiladores y el Galaxy Book6 Ultra es un dispositivo muy silencioso en los escenarios cotidianos, incluso en el perfil de potencia de alto rendimiento. Cuando empiece a estresar los componentes, los ventiladores se harán audibles y medimos un ruido máximo del ventilador de 48,5 dB(A). Los otros perfiles de potencia son más silenciosos (33-40 dB(A)), pero también sacrificará algo de rendimiento. Nuestra unidad de prueba no tuvo problemas con otros ruidos electrónicos.
Ruido
| Ocioso |
| 25.1 / 25.1 / 25.1 dB(A) |
| Carga |
| 36.9 / 48.5 dB(A) |
 | ||
30 dB silencioso 40 dB(A) audible 50 dB(A) ruidosamente alto |
||
min: | ||
| Samsung Galaxy Book6 Ultra Ultra 7 356H, GeForce RTX 5070 Laptop | Apple MacBook Pro 16 2024 M4 Pro M4 Pro 14-Core, M4 Pro 20-Core GPU | Lenovo Yoga Pro 9i 16 RTX 5070 Ultra 9 285H, GeForce RTX 5070 Laptop | Asus ProArt P16 RTX 5090 Ryzen AI 9 HX 370, GeForce RTX 5090 Laptop | Dell 16 Premium DA16250 Ultra 7 255H, GeForce RTX 5070 Laptop | Lenovo ThinkPad T1g Gen 8 21TD003GE Ultra 9 285H, GeForce RTX 5070 Laptop | |
|---|---|---|---|---|---|---|
| Noise | 13% | -4% | -9% | 2% | -1% | |
| apagado / medio ambiente * (dB) | 25.1 | 24 4% | 24.1 4% | 24.2 4% | 23.2 8% | 25 -0% |
| Idle Minimum * (dB) | 25.1 | 24 4% | 24.1 4% | 24.2 4% | 23.2 8% | 25 -0% |
| Idle Average * (dB) | 25.1 | 24 4% | 24.1 4% | 27.6 -10% | 23.2 8% | 25 -0% |
| Idle Maximum * (dB) | 25.1 | 24 4% | 25.1 -0% | 32.6 -30% | 26.6 -6% | 27.3 -9% |
| Load Average * (dB) | 36.9 | 25.3 31% | 44.2 -20% | 42.6 -15% | 39.4 -7% | 37.3 -1% |
| Cyberpunk 2077 ultra * (dB) | 48.5 | 33.9 30% | 52.7 -9% | 51.2 -6% | 47.3 2% | 47.8 1% |
| Load Maximum * (dB) | 48.5 | 42.3 13% | 52.7 -9% | 53.2 -10% | 48.9 -1% | 47.8 1% |
* ... más pequeño es mejor
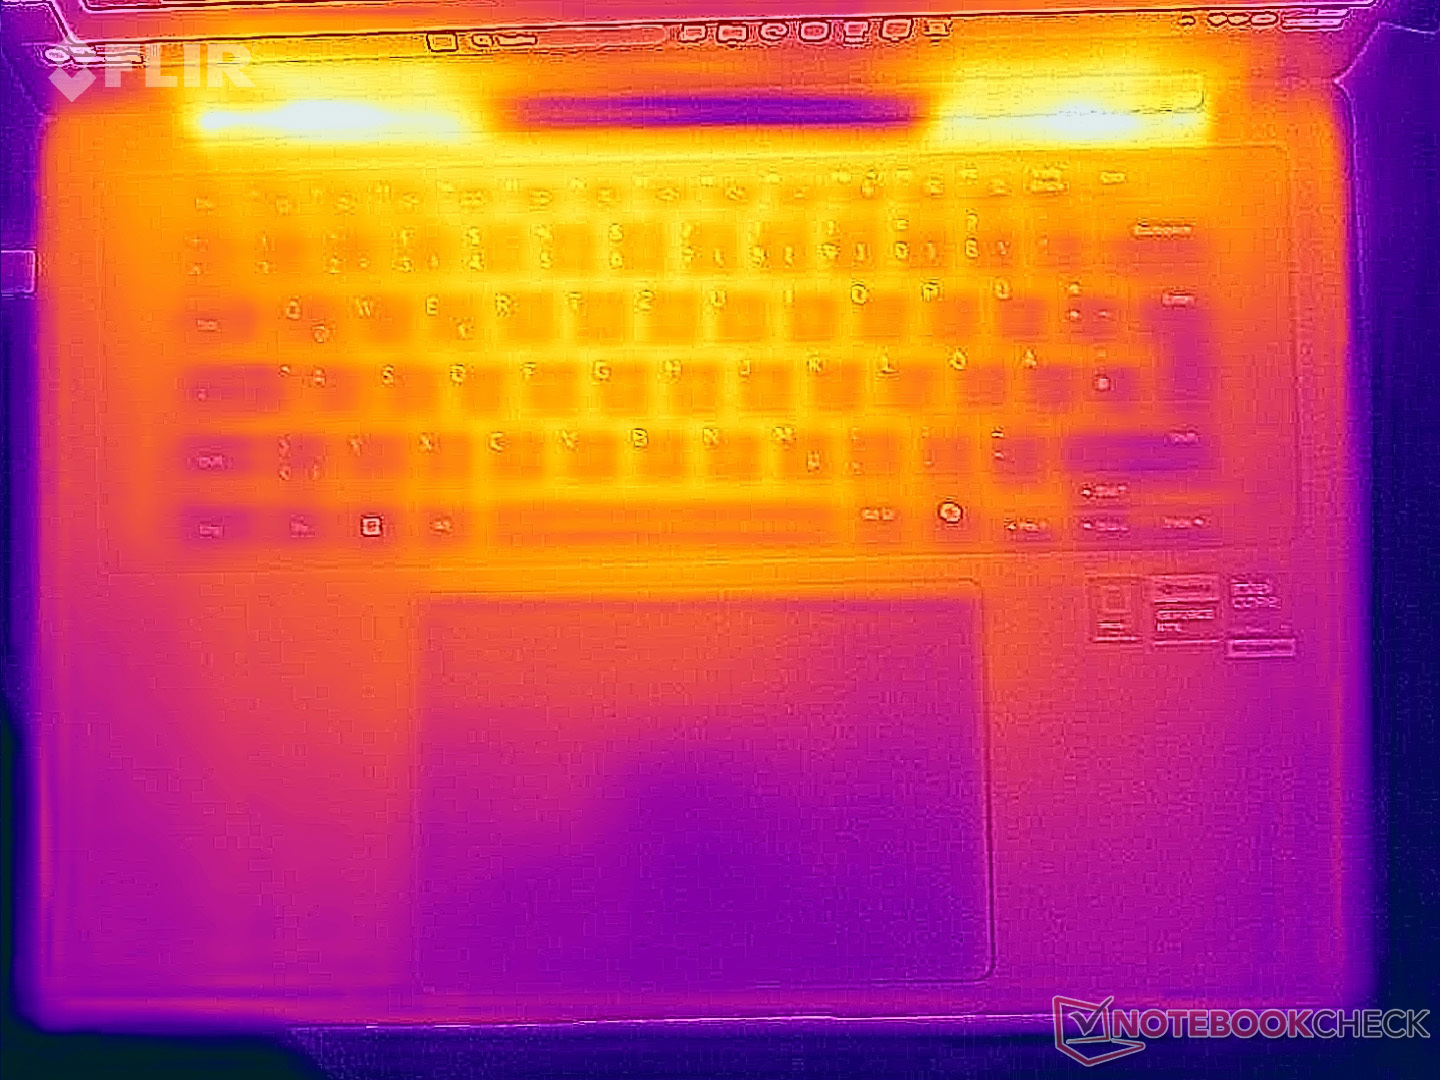
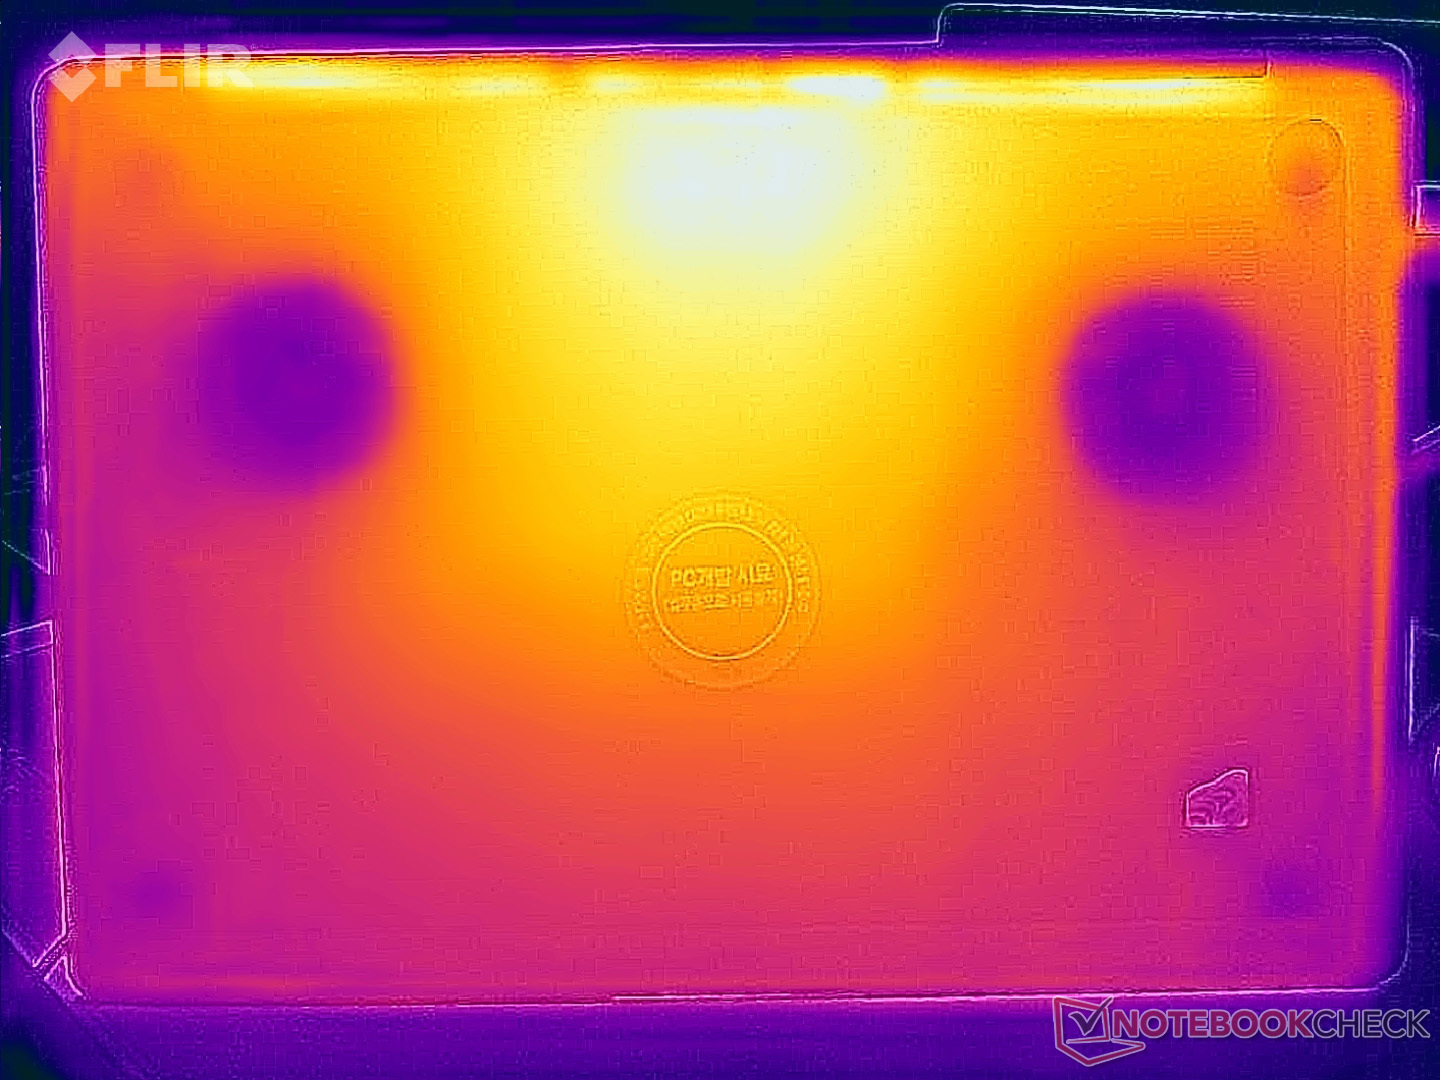
Temperatura
Las superficies de aluminio son muy frescas en situaciones cotidianas, pero algunos puntos se calientan bastante bajo carga. Medimos casi 50 °C en la sección central superior del panel inferior, por lo que debe evitar el contacto con la piel. Por lo demás, no hay limitaciones y el teclado sólo se calienta hasta ~40 °C, por lo que la escritura no se ve afectada. Durante la prueba de estrés, la CPU se estabiliza en sólo 20 vatios, mientras que la GPU mantiene 80 vatios.

(±) La temperatura máxima en la parte superior es de 42.7 °C / 109 F, frente a la media de 36.8 °C / 98 F, que oscila entre 21 y 71 °C para la clase Multimedia.
(-) El fondo se calienta hasta un máximo de 49.1 °C / 120 F, frente a la media de 39.1 °C / 102 F
(+) En reposo, la temperatura media de la parte superior es de 24.9 °C / 77# F, frente a la media del dispositivo de 31.3 °C / 88 F.
(-) 3: The average temperature for the upper side is 38.5 °C / 101 F, compared to the average of 31.3 °C / 88 F for the class Multimedia.
(+) Los reposamanos y el panel táctil alcanzan como máximo la temperatura de la piel (34.7 °C / 94.5 F) y, por tanto, no están calientes.
(-) La temperatura media de la zona del reposamanos de dispositivos similares fue de 28.7 °C / 83.7 F (-6 °C / -10.8 F).
| Samsung Galaxy Book6 Ultra Ultra 7 356H, GeForce RTX 5070 Laptop | Apple MacBook Pro 16 2024 M4 Pro M4 Pro 14-Core, M4 Pro 20-Core GPU | Lenovo Yoga Pro 9i 16 RTX 5070 Ultra 9 285H, GeForce RTX 5070 Laptop | Asus ProArt P16 RTX 5090 Ryzen AI 9 HX 370, GeForce RTX 5090 Laptop | Dell 16 Premium DA16250 Ultra 7 255H, GeForce RTX 5070 Laptop | Lenovo ThinkPad T1g Gen 8 21TD003GE Ultra 9 285H, GeForce RTX 5070 Laptop | |
|---|---|---|---|---|---|---|
| Heat | 11% | -2% | -3% | -0% | -1% | |
| Maximum Upper Side * (°C) | 42.7 | 42.7 -0% | 41.8 2% | 47 -10% | 36.8 14% | 44.7 -5% |
| Maximum Bottom * (°C) | 49.1 | 43.1 12% | 47.9 2% | 51.6 -5% | 34.8 29% | 42.8 13% |
| Idle Upper Side * (°C) | 25.4 | 21.5 15% | 26.3 -4% | 24.9 2% | 31.2 -23% | 26.9 -6% |
| Idle Bottom * (°C) | 25.5 | 21.5 16% | 27.6 -8% | 25.5 -0% | 30.8 -21% | 27.3 -7% |
* ... más pequeño es mejor
Altavoces
El sistema de audio de seis altavoces ofrece un rendimiento sonoro impresionante y no tiene por qué esconderse detrás de la competencia. Sin embargo, para ser justos, todos los dispositivos de la comparación ofrecen una gran calidad de sonido y será difícil oír la diferencia.
Samsung Galaxy Book6 Ultra análisis de audio
(+) | los altavoces pueden reproducir a un volumen relativamente alto (#85.6 dB)
Graves 100 - 315 Hz
(±) | lubina reducida - en promedio 5.9% inferior a la mediana
(±) | la linealidad de los graves es media (7.9% delta a frecuencia anterior)
Medios 400 - 2000 Hz
(+) | medios equilibrados - a sólo 3.7% de la mediana
(+) | los medios son lineales (4.3% delta a la frecuencia anterior)
Altos 2 - 16 kHz
(+) | máximos equilibrados - a sólo 2.2% de la mediana
(+) | los máximos son lineales (3.4% delta a la frecuencia anterior)
Total 100 - 16.000 Hz
(+) | el sonido global es lineal (7.3% de diferencia con la mediana)
En comparación con la misma clase
» 6% de todos los dispositivos probados de esta clase eran mejores, 1% similares, 94% peores
» El mejor tuvo un delta de 5%, la media fue 17%, el peor fue ###max##%
En comparación con todos los dispositivos probados
» 1% de todos los dispositivos probados eran mejores, 0% similares, 99% peores
» El mejor tuvo un delta de 4%, la media fue 23%, el peor fue ###max##%
Apple MacBook Pro 16 2024 M4 Pro análisis de audio
(+) | los altavoces pueden reproducir a un volumen relativamente alto (#84.6 dB)
Graves 100 - 315 Hz
(±) | lubina reducida - en promedio 5.1% inferior a la mediana
(+) | el bajo es lineal (5.6% delta a la frecuencia anterior)
Medios 400 - 2000 Hz
(+) | medios equilibrados - a sólo 1.4% de la mediana
(+) | los medios son lineales (2.4% delta a la frecuencia anterior)
Altos 2 - 16 kHz
(+) | máximos equilibrados - a sólo 1.6% de la mediana
(+) | los máximos son lineales (3% delta a la frecuencia anterior)
Total 100 - 16.000 Hz
(+) | el sonido global es lineal (4.8% de diferencia con la mediana)
En comparación con la misma clase
» 0% de todos los dispositivos probados de esta clase eran mejores, 0% similares, 99% peores
» El mejor tuvo un delta de 5%, la media fue 17%, el peor fue ###max##%
En comparación con todos los dispositivos probados
» 0% de todos los dispositivos probados eran mejores, 0% similares, 100% peores
» El mejor tuvo un delta de 4%, la media fue 23%, el peor fue ###max##%
Lenovo Yoga Pro 9i 16 RTX 5070 análisis de audio
(±) | la sonoridad del altavoz es media pero buena (81.4 dB)
Graves 100 - 315 Hz
(±) | lubina reducida - en promedio 5.5% inferior a la mediana
(±) | la linealidad de los graves es media (7.5% delta a frecuencia anterior)
Medios 400 - 2000 Hz
(+) | medios equilibrados - a sólo 1.7% de la mediana
(+) | los medios son lineales (3.1% delta a la frecuencia anterior)
Altos 2 - 16 kHz
(±) | máximos reducidos - de media 6.2% inferior a la mediana
(+) | los máximos son lineales (3.9% delta a la frecuencia anterior)
Total 100 - 16.000 Hz
(+) | el sonido global es lineal (9.7% de diferencia con la mediana)
En comparación con la misma clase
» 13% de todos los dispositivos probados de esta clase eran mejores, 1% similares, 85% peores
» El mejor tuvo un delta de 5%, la media fue 17%, el peor fue ###max##%
En comparación con todos los dispositivos probados
» 4% de todos los dispositivos probados eran mejores, 1% similares, 95% peores
» El mejor tuvo un delta de 4%, la media fue 23%, el peor fue ###max##%
Asus ProArt P16 RTX 5090 análisis de audio
(±) | la sonoridad del altavoz es media pero buena (80.8 dB)
Graves 100 - 315 Hz
(+) | buen bajo - sólo 3.3% lejos de la mediana
(±) | la linealidad de los graves es media (7.7% delta a frecuencia anterior)
Medios 400 - 2000 Hz
(+) | medios equilibrados - a sólo 2.9% de la mediana
(+) | los medios son lineales (1.9% delta a la frecuencia anterior)
Altos 2 - 16 kHz
(+) | máximos equilibrados - a sólo 4.1% de la mediana
(+) | los máximos son lineales (5.5% delta a la frecuencia anterior)
Total 100 - 16.000 Hz
(+) | el sonido global es lineal (8.3% de diferencia con la mediana)
En comparación con la misma clase
» 9% de todos los dispositivos probados de esta clase eran mejores, 2% similares, 89% peores
» El mejor tuvo un delta de 5%, la media fue 17%, el peor fue ###max##%
En comparación con todos los dispositivos probados
» 2% de todos los dispositivos probados eran mejores, 1% similares, 97% peores
» El mejor tuvo un delta de 4%, la media fue 23%, el peor fue ###max##%
Dell 16 Premium DA16250 análisis de audio
(+) | los altavoces pueden reproducir a un volumen relativamente alto (#84.2 dB)
Graves 100 - 315 Hz
(±) | lubina reducida - en promedio 6.1% inferior a la mediana
(+) | el bajo es lineal (4.2% delta a la frecuencia anterior)
Medios 400 - 2000 Hz
(+) | medios equilibrados - a sólo 1.4% de la mediana
(+) | los medios son lineales (3.6% delta a la frecuencia anterior)
Altos 2 - 16 kHz
(+) | máximos equilibrados - a sólo 1.5% de la mediana
(+) | los máximos son lineales (2.2% delta a la frecuencia anterior)
Total 100 - 16.000 Hz
(+) | el sonido global es lineal (5.1% de diferencia con la mediana)
En comparación con la misma clase
» 1% de todos los dispositivos probados de esta clase eran mejores, 0% similares, 99% peores
» El mejor tuvo un delta de 5%, la media fue 17%, el peor fue ###max##%
En comparación con todos los dispositivos probados
» 0% de todos los dispositivos probados eran mejores, 0% similares, 100% peores
» El mejor tuvo un delta de 4%, la media fue 23%, el peor fue ###max##%
Lenovo ThinkPad T1g Gen 8 21TD003GE análisis de audio
(+) | los altavoces pueden reproducir a un volumen relativamente alto (#85.6 dB)
Graves 100 - 315 Hz
(±) | lubina reducida - en promedio 9.3% inferior a la mediana
(±) | la linealidad de los graves es media (11.9% delta a frecuencia anterior)
Medios 400 - 2000 Hz
(+) | medios equilibrados - a sólo 2.5% de la mediana
(+) | los medios son lineales (4% delta a la frecuencia anterior)
Altos 2 - 16 kHz
(+) | máximos equilibrados - a sólo 3.4% de la mediana
(±) | la linealidad de los máximos es media (7.5% delta a frecuencia anterior)
Total 100 - 16.000 Hz
(+) | el sonido global es lineal (8.7% de diferencia con la mediana)
En comparación con la misma clase
» 11% de todos los dispositivos probados de esta clase eran mejores, 2% similares, 87% peores
» El mejor tuvo un delta de 5%, la media fue 17%, el peor fue ###max##%
En comparación con todos los dispositivos probados
» 3% de todos los dispositivos probados eran mejores, 1% similares, 97% peores
» El mejor tuvo un delta de 4%, la media fue 23%, el peor fue ###max##%
Consumo de energía

La Galaxy Book6 Ultra es sorprendentemente eficiente en reposo, con un consumo máximo de sólo 7,1 vatios a pleno brillo SDR. Durante la prueba de estrés, medimos en torno a 140-144 vatios durante los primeros 40 segundos, pero el consumo se nivela después en torno a 124 vatios y la batería no se agota, por lo que el adaptador de corriente de 140 vatios es suficiente.
| Off / Standby | |
| Ocioso | |
| Carga |
|
Clave:
min: | |
| Samsung Galaxy Book6 Ultra Ultra 7 356H, GeForce RTX 5070 Laptop, Samsung PM9C1b MZVL81T0HFLB-00BH1, OLED, 2880x1800, 16" | Apple MacBook Pro 16 2024 M4 Pro M4 Pro 14-Core, M4 Pro 20-Core GPU, Apple SSD AP2048Z, Mini-LED, 3456x2234, 16.2" | Lenovo Yoga Pro 9i 16 RTX 5070 Ultra 9 285H, GeForce RTX 5070 Laptop, WD PC SN7100S SDFPMSL-1T00-1101, OLED, 3200x2000, 16" | Asus ProArt P16 RTX 5090 Ryzen AI 9 HX 370, GeForce RTX 5090 Laptop, Micron 2500 2TB MTFDKBA2T0QGN-1BN1AABGA, OLED, 3840x2400, 16" | Dell 16 Premium DA16250 Ultra 7 255H, GeForce RTX 5070 Laptop, Kioxia BG6 KBG6AZNV1T02, OLED, 3840x2400, 16.3" | Lenovo ThinkPad T1g Gen 8 21TD003GE Ultra 9 285H, GeForce RTX 5070 Laptop, Samsung PM9E1 MZVLC2T0HBLD, Tandem-OLED, 3200x2000, 16" | Medio NVIDIA GeForce RTX 5070 Laptop | Media de la clase Multimedia | |
|---|---|---|---|---|---|---|---|---|
| Power Consumption | -38% | -73% | -82% | -66% | -48% | -122% | -32% | |
| Idle Minimum * (Watt) | 4.4 | 4.6 -5% | 8.8 -100% | 10.9 -148% | 6.5 -48% | 8.5 -93% | 10.8 ? -145% | 5.68 ? -29% |
| Idle Average * (Watt) | 6.4 | 16.8 -163% | 16.1 -152% | 12.1 -89% | 8.1 -27% | 13.6 -113% | 15.4 ? -141% | 10.2 ? -59% |
| Idle Maximum * (Watt) | 7.1 | 17.1 -141% | 16.5 -132% | 12.5 -76% | 33 -365% | 14.1 -99% | 21 ? -196% | 12.4 ? -75% |
| Load Average * (Watt) | 55.1 | 76.4 -39% | 89.3 -62% | 129.3 -135% | 88.9 -61% | 84.5 -53% | 98.7 ? -79% | 65.4 ? -19% |
| Cyberpunk 2077 ultra external monitor * (Watt) | 133 | 79.3 40% | 157.9 -19% | 172.8 -30% | 108.9 18% | 118.1 11% | ||
| Cyberpunk 2077 ultra * (Watt) | 134.3 | 83.4 38% | 160.6 -20% | 176.6 -31% | 108.7 19% | 120.3 10% | ||
| Load Maximum * (Watt) | 143.9 | 138.1 4% | 177.4 -23% | 233.9 -63% | 138.3 4% | 143 1% | 218 ? -51% | 113.3 ? 21% |
* ... más pequeño es mejor
Consumo de energía Cyberpunk / Prueba de estrés
Consumo de energía Monitor externo
Duración de las pilas
Aunque el Galaxy Book6 Ultra tiene la capacidad de batería más pequeña de nuestro grupo de comparación con sólo 80,2 Wh, consigue una autonomía impresionante incluso acercándose al MacBook Pro. A 150 nits, nuestra prueba Wi-Fi dura casi 17 horas y, por tanto, mucho más en comparación con cualquier otro rival de Windows. A pleno brillo, aún registramos casi 8,5 horas, lo que incluso supera al MacBook Pro (que es un poco más brillante) en alrededor de una hora.

Valoración de Notebookcheck
Samsung Galaxy Book6 Ultra
- 03/06/2026 v8
Andreas Osthoff
 Total Sustainability Score:
 Competidores potenciales en comparación
Imagen | Modelo | Precio | Peso | Altura | Pantalla |
|---|---|---|---|---|---|
1. 90.7%  | Samsung Galaxy Book6 Ultra Intel Core Ultra 7 356H ⎘ NVIDIA GeForce RTX 5070 Laptop ⎘ 32 GB Memoría, 1000 GB SSD | Amazon: Precio de catálogo: 3599€ | 1.9 kg | 15.4 mm | 16.00" 2880x1800 212 PPI OLED |
2. 93%  | Apple MacBook Pro 16 2024 M4 Pro Apple M4 Pro 14-Core ⎘ Apple M4 Pro 20-Core GPU ⎘ 48 GB Memoría, 2048 GB SSD | Amazon: Precio de catálogo: 4219€ | 2.1 kg | 16.8 mm | 16.20" 3456x2234 254 PPI Mini-LED |
3. 90.4%  | Lenovo Yoga Pro 9i 16 RTX 5070 Intel Core Ultra 9 285H ⎘ NVIDIA GeForce RTX 5070 Laptop ⎘ 64 GB Memoría, 1024 GB SSD | Amazon: Precio de catálogo: 2800€ | 1.9 kg | 17.9 mm | 16.00" 3200x2000 236 PPI OLED |
4. 89.7% 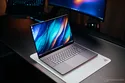 | Asus ProArt P16 RTX 5090 AMD Ryzen AI 9 HX 370 ⎘ NVIDIA GeForce RTX 5090 Laptop ⎘ 64 GB Memoría, 2048 GB SSD | Amazon: Precio de catálogo: 4799€ | 2 kg | 18.3 mm | 16.00" 3840x2400 283 PPI OLED |
5. 87.9%  | Dell 16 Premium DA16250 Intel Core Ultra 7 255H ⎘ NVIDIA GeForce RTX 5070 Laptop ⎘ 32 GB Memoría, 1024 GB SSD | Amazon: Precio de catálogo: 3300 USD | 2.3 kg | 18.7 mm | 16.30" 3840x2400 278 PPI OLED |
6. 92.4%  | Lenovo ThinkPad T1g Gen 8 21TD003GE Intel Core Ultra 9 285H ⎘ NVIDIA GeForce RTX 5070 Laptop ⎘ 64 GB Memoría, 2048 GB SSD | Amazon: Precio de catálogo: 4500€ | 1.9 kg | 15.8 mm | 16.00" 3200x2000 236 PPI Tandem-OLED |
Transparencia
La selección de los dispositivos que se van a reseñar corre a cargo de nuestro equipo editorial. La muestra de prueba fue proporcionada al autor en calidad de préstamo por el fabricante o el minorista a los efectos de esta reseña. El prestamista no tuvo ninguna influencia en esta reseña, ni el fabricante recibió una copia de la misma antes de su publicación. No había ninguna obligación de publicar esta reseña. Como empresa de medios independiente, Notebookcheck no está sujeta a la autoridad de fabricantes, minoristas o editores.
Así es como prueba Notebookcheck
Cada año, Notebookcheck revisa de forma independiente cientos de portátiles y smartphones utilizando procedimientos estandarizados para asegurar que todos los resultados son comparables. Hemos desarrollado continuamente nuestros métodos de prueba durante unos 20 años y hemos establecido los estándares de la industria en el proceso. En nuestros laboratorios de pruebas, técnicos y editores experimentados utilizan equipos de medición de alta calidad. Estas pruebas implican un proceso de validación en varias fases. Nuestro complejo sistema de clasificación se basa en cientos de mediciones y puntos de referencia bien fundamentados, lo que mantiene la objetividad.
