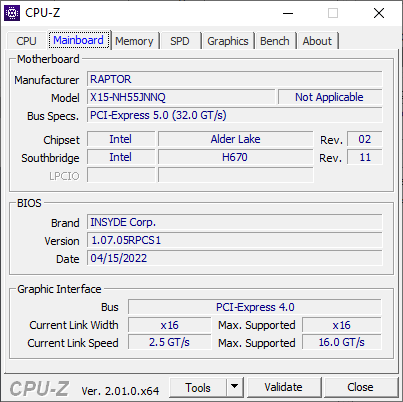
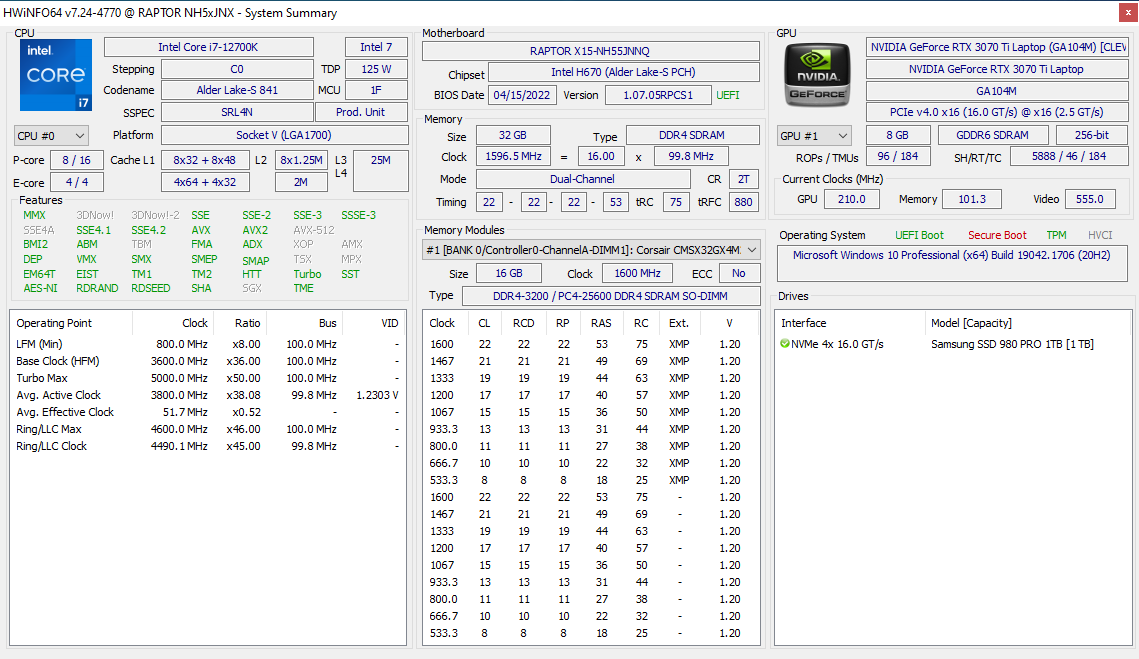
Análisis del Eurocom Raptor X15: LGA1700 Core i7-12700K en un portátil
El chasis del Raptor X15 es el Clevo NH57AF1 que Schenker también utiliza para su portátil XMG Apex 15. Por lo tanto, recomendamos consultar nuestra Página de análisis de Schenker ya que nuestros comentarios sobre los puertos y el diseño general del modelo se aplican aquí para el Raptor X15. Esta página se centrará, en cambio, en el rendimiento del Raptor X15 y en lo que los usuarios pueden esperar de la CPU Core i7-12700K de 12ª generación cuando se aplica a un formato de portátil.
El Raptor X15 compite con otros portátiles de juego de 15,6 pulgadas para entusiastas, como el MSI GE66, Gigabyte A5 X1, Asus TUF Gaming A15o Lenovo Legion 5 15. Sin embargo, un factor diferenciador clave es su uso de una CPU de escritorio con socket LGA1700 en lugar de un procesador móvil típico de la serie H.
Más opiniones de Eurocom:
Posibles contendientes en la comparación
Valoración | Fecha | Modelo | Peso | Altura | Tamaño | Resolución | Precio |
|---|---|---|---|---|---|---|---|
| 86.1 % v7 (old) | 06/2022 | Eurocom Raptor X15 i7-12700K, GeForce RTX 3070 Ti Laptop GPU | 2.7 kg | 32.5 mm | 15.60" | 1920x1080 | |
| 87.4 % v7 (old) | 06/2022 | MSI Raider GE66 12UHS i9-12900HK, GeForce RTX 3080 Ti Laptop GPU | 2.4 kg | 23.4 mm | 15.60" | 3840x2160 | |
| 88.3 % v7 (old) | 05/2022 | Razer Blade 15 Advanced Model Early 2022 i7-12800H, GeForce RTX 3080 Ti Laptop GPU | 2.1 kg | 16.99 mm | 15.60" | 1920x1080 | |
| 85.2 % v7 (old) | 03/2022 | Eurocom RX315 NH57AF1 i7-11800H, GeForce RTX 3070 Laptop GPU | 2 kg | 20 mm | 15.60" | 1920x1080 | |
| 84.1 % v7 (old) | 01/2022 | Gigabyte A5 X1 R9 5900HX, GeForce RTX 3070 Laptop GPU | 2.2 kg | 25.3 mm | 15.60" | 1920x1080 | |
| 85 % v7 (old) | 07/2021 | Asus TUF Gaming A15 FA506QR-AZ061T R7 5800H, GeForce RTX 3070 Laptop GPU | 2.3 kg | 24 mm | 15.60" | 1920x1080 |
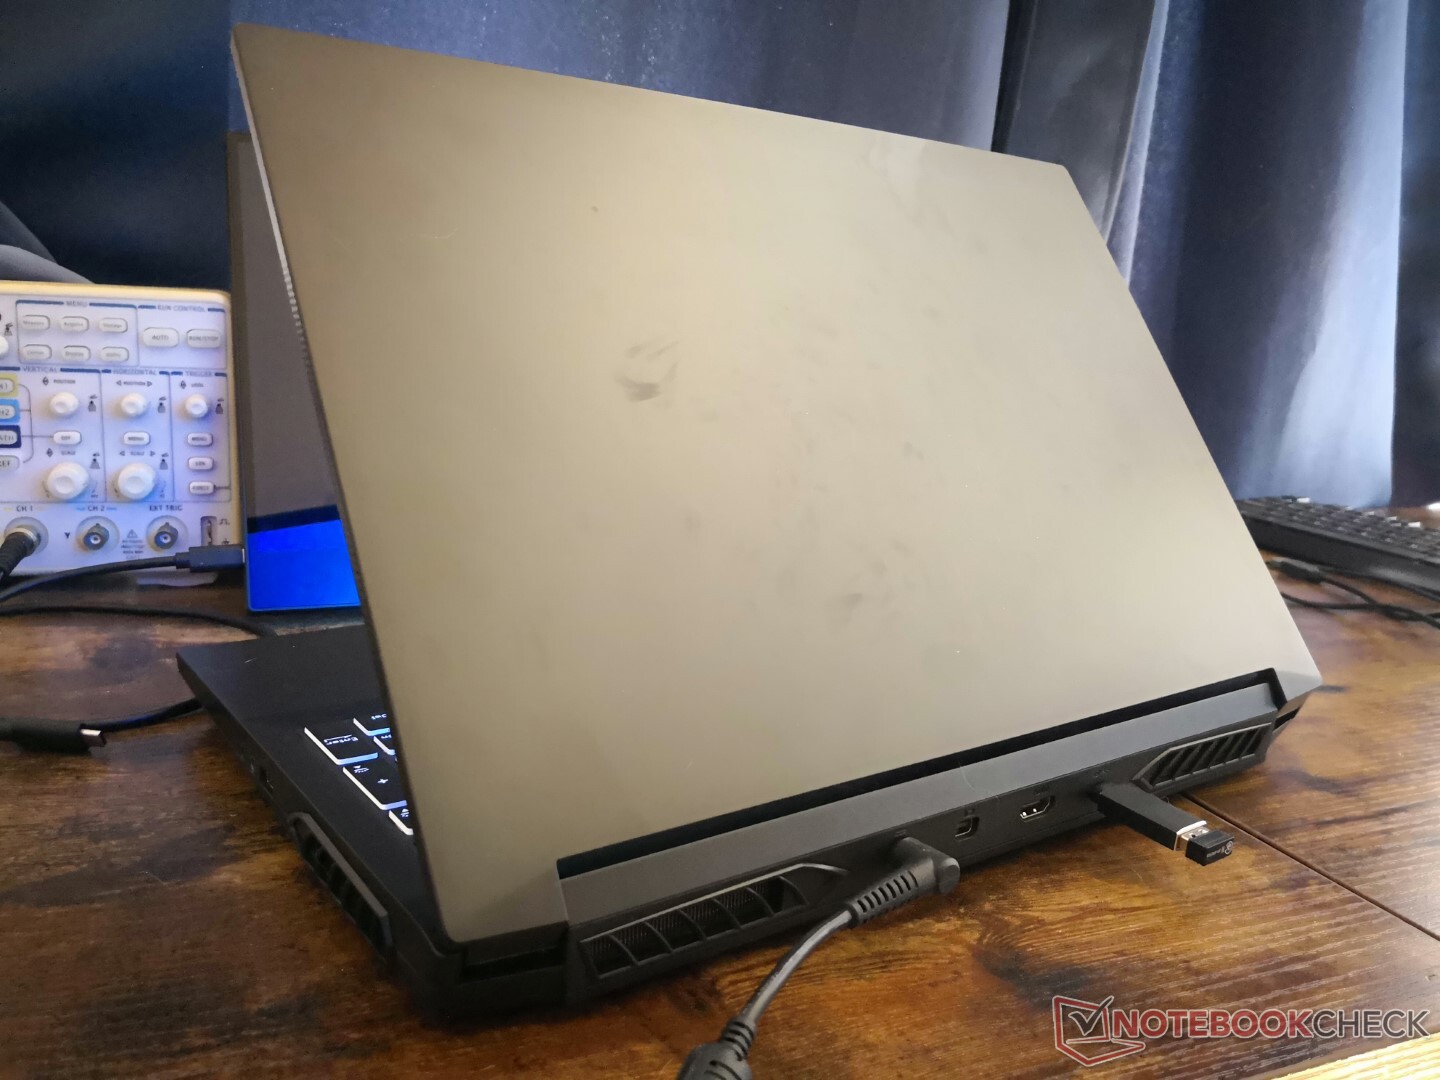
Caso
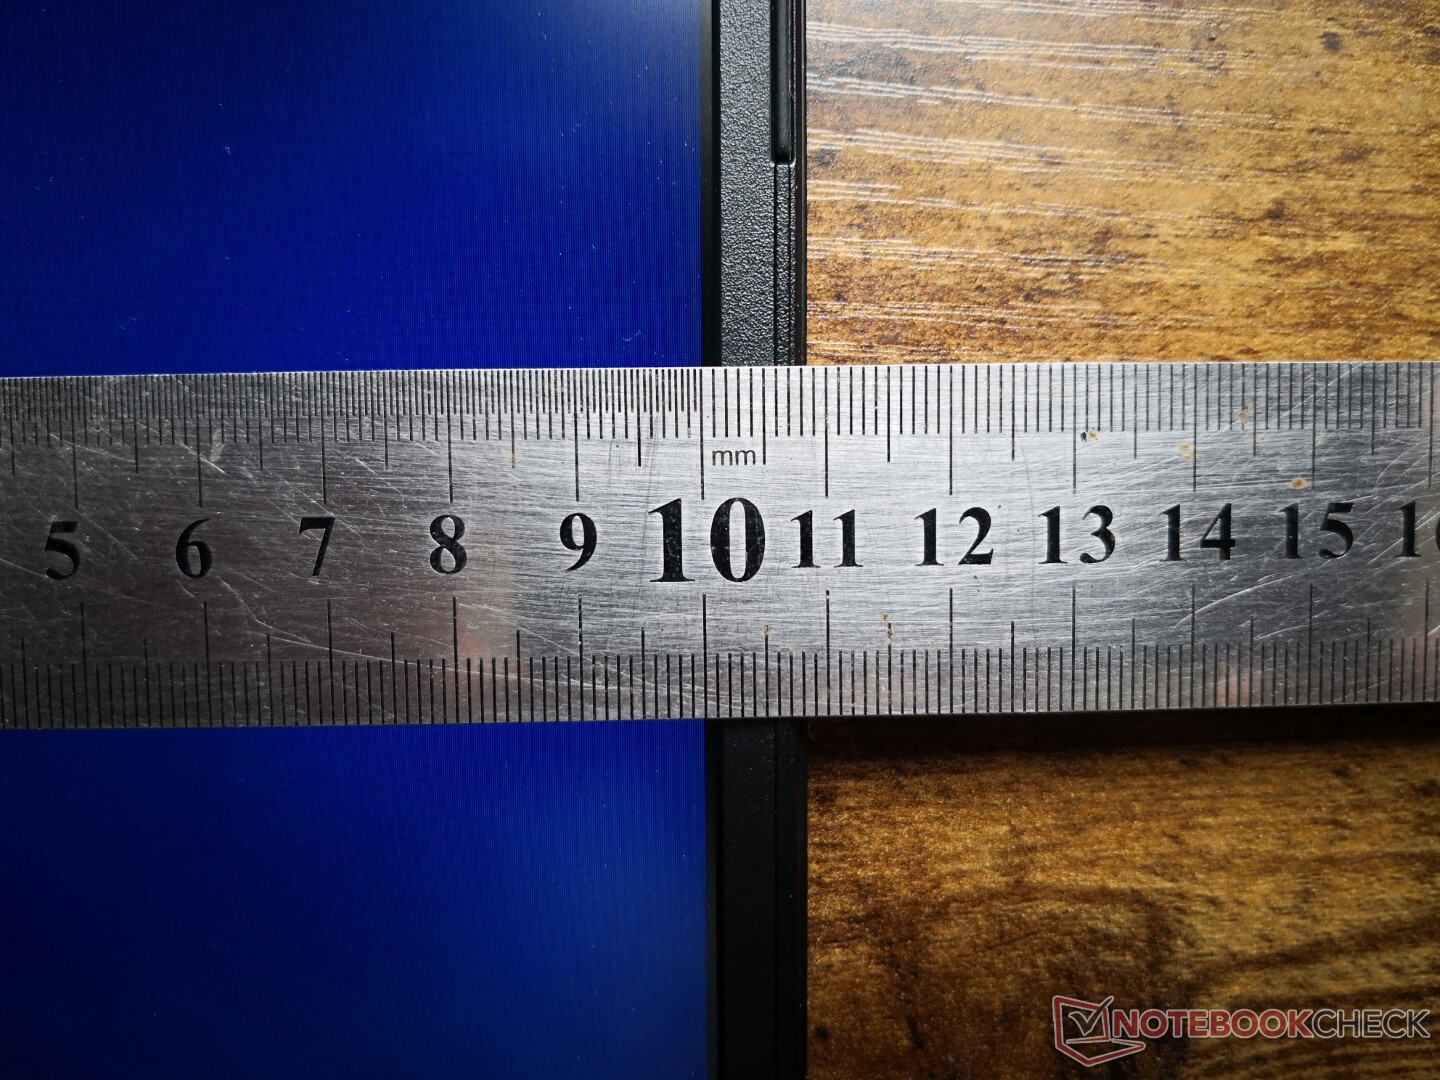
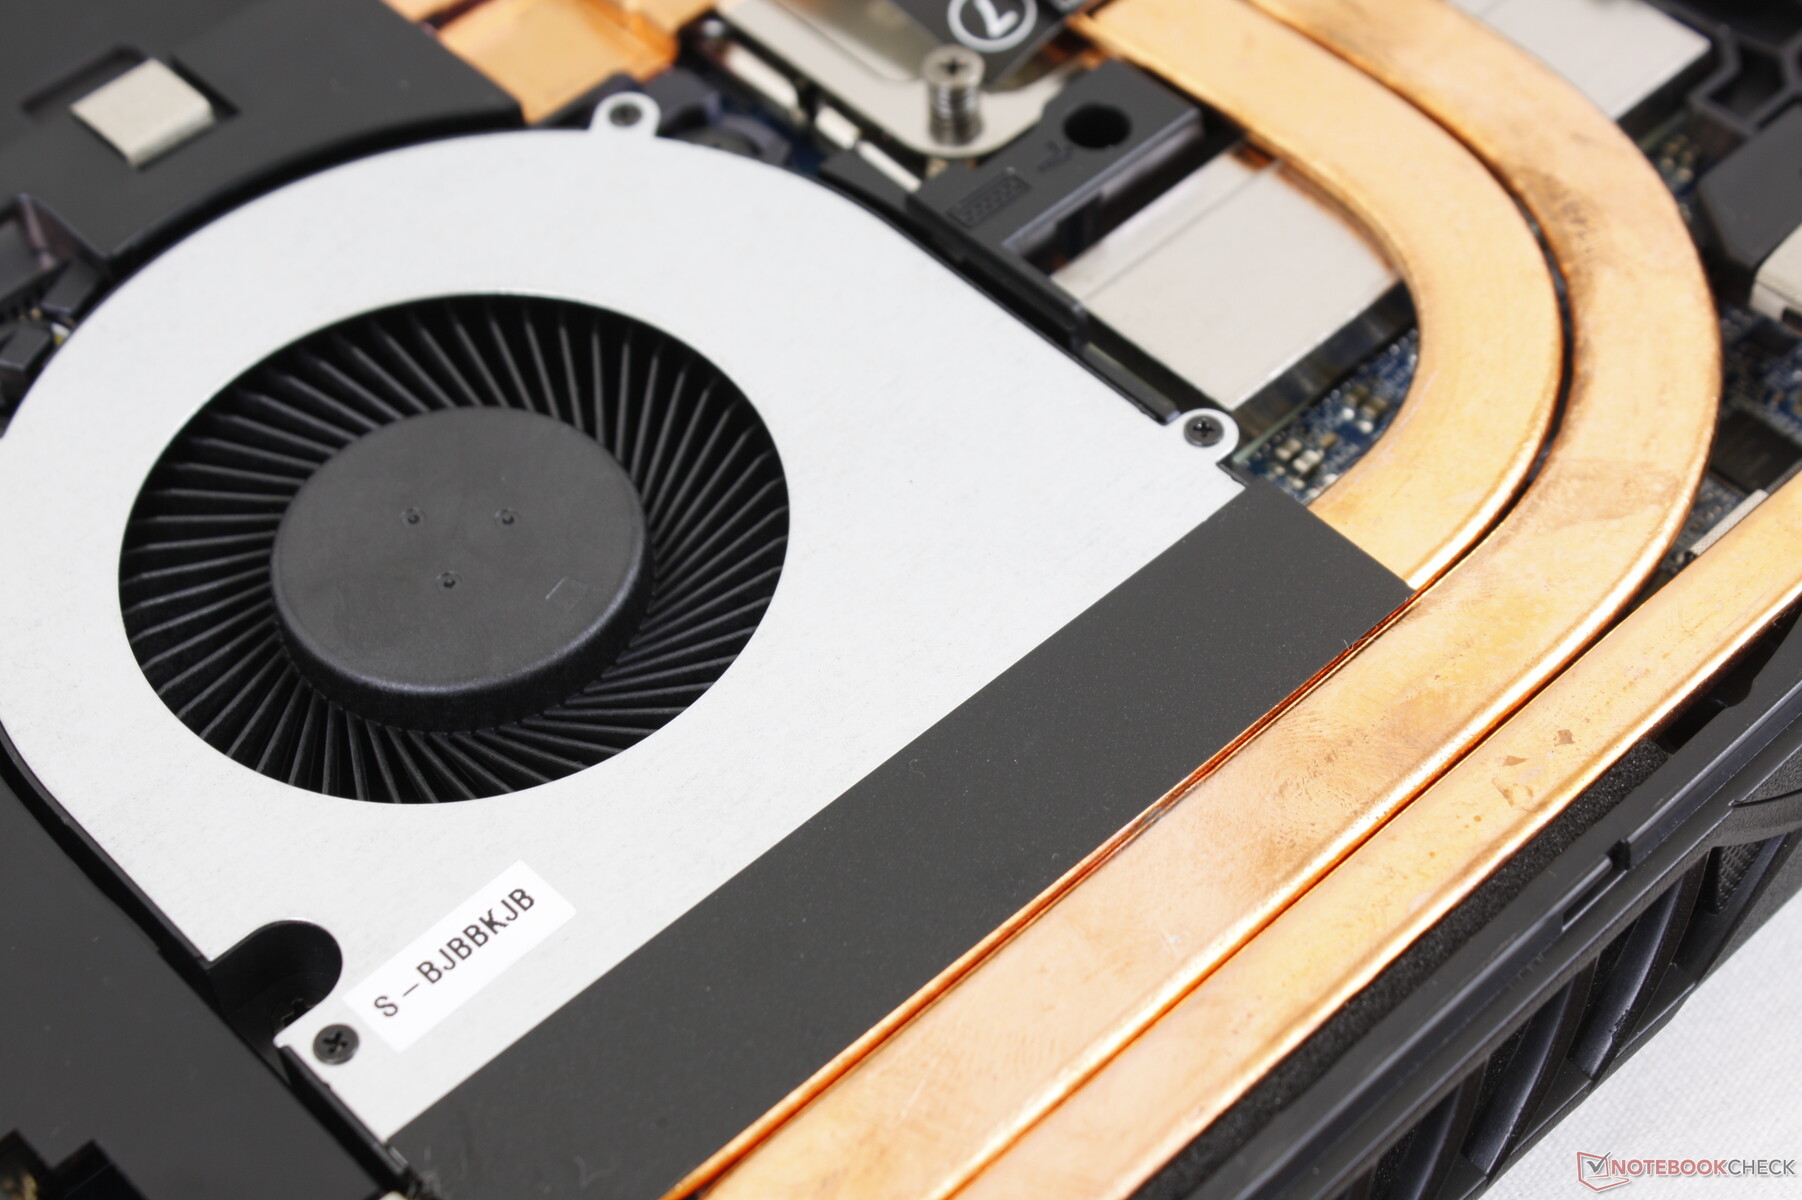
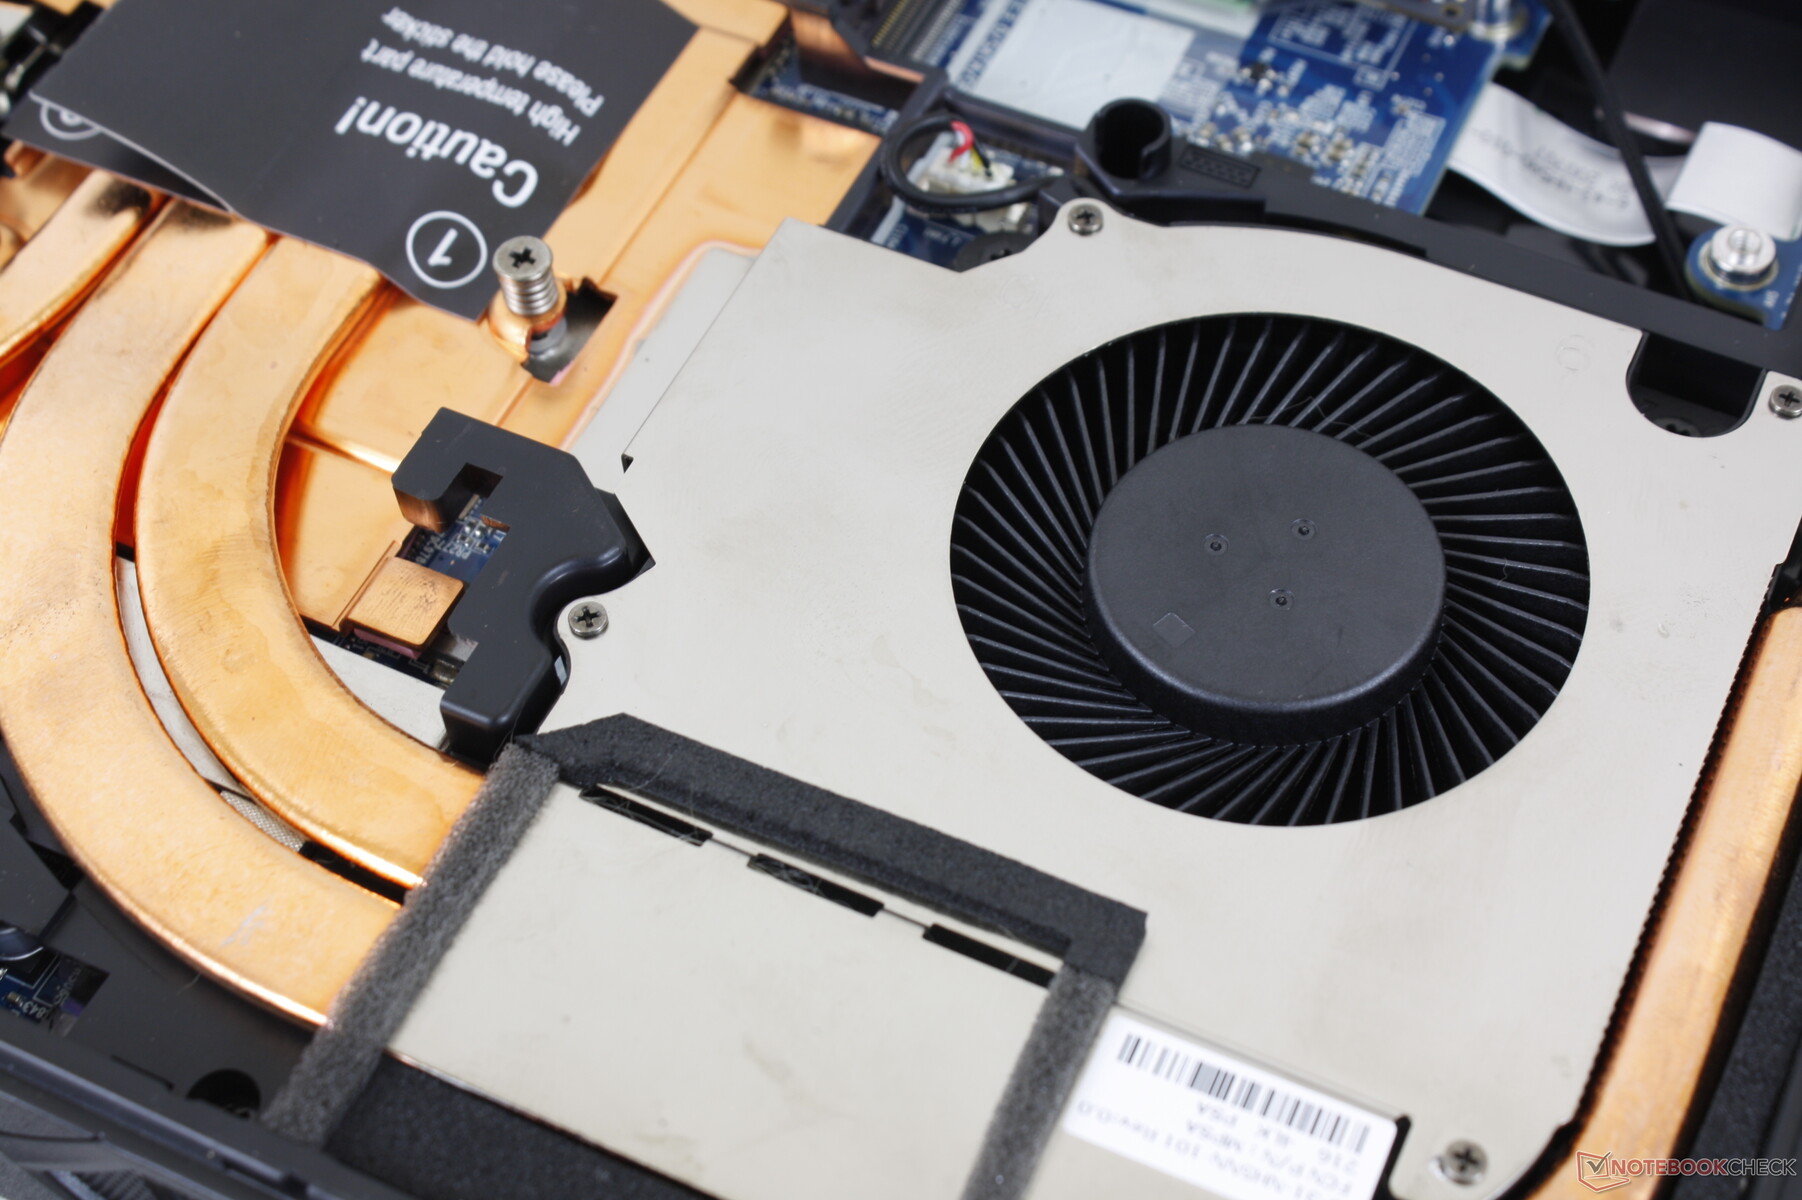
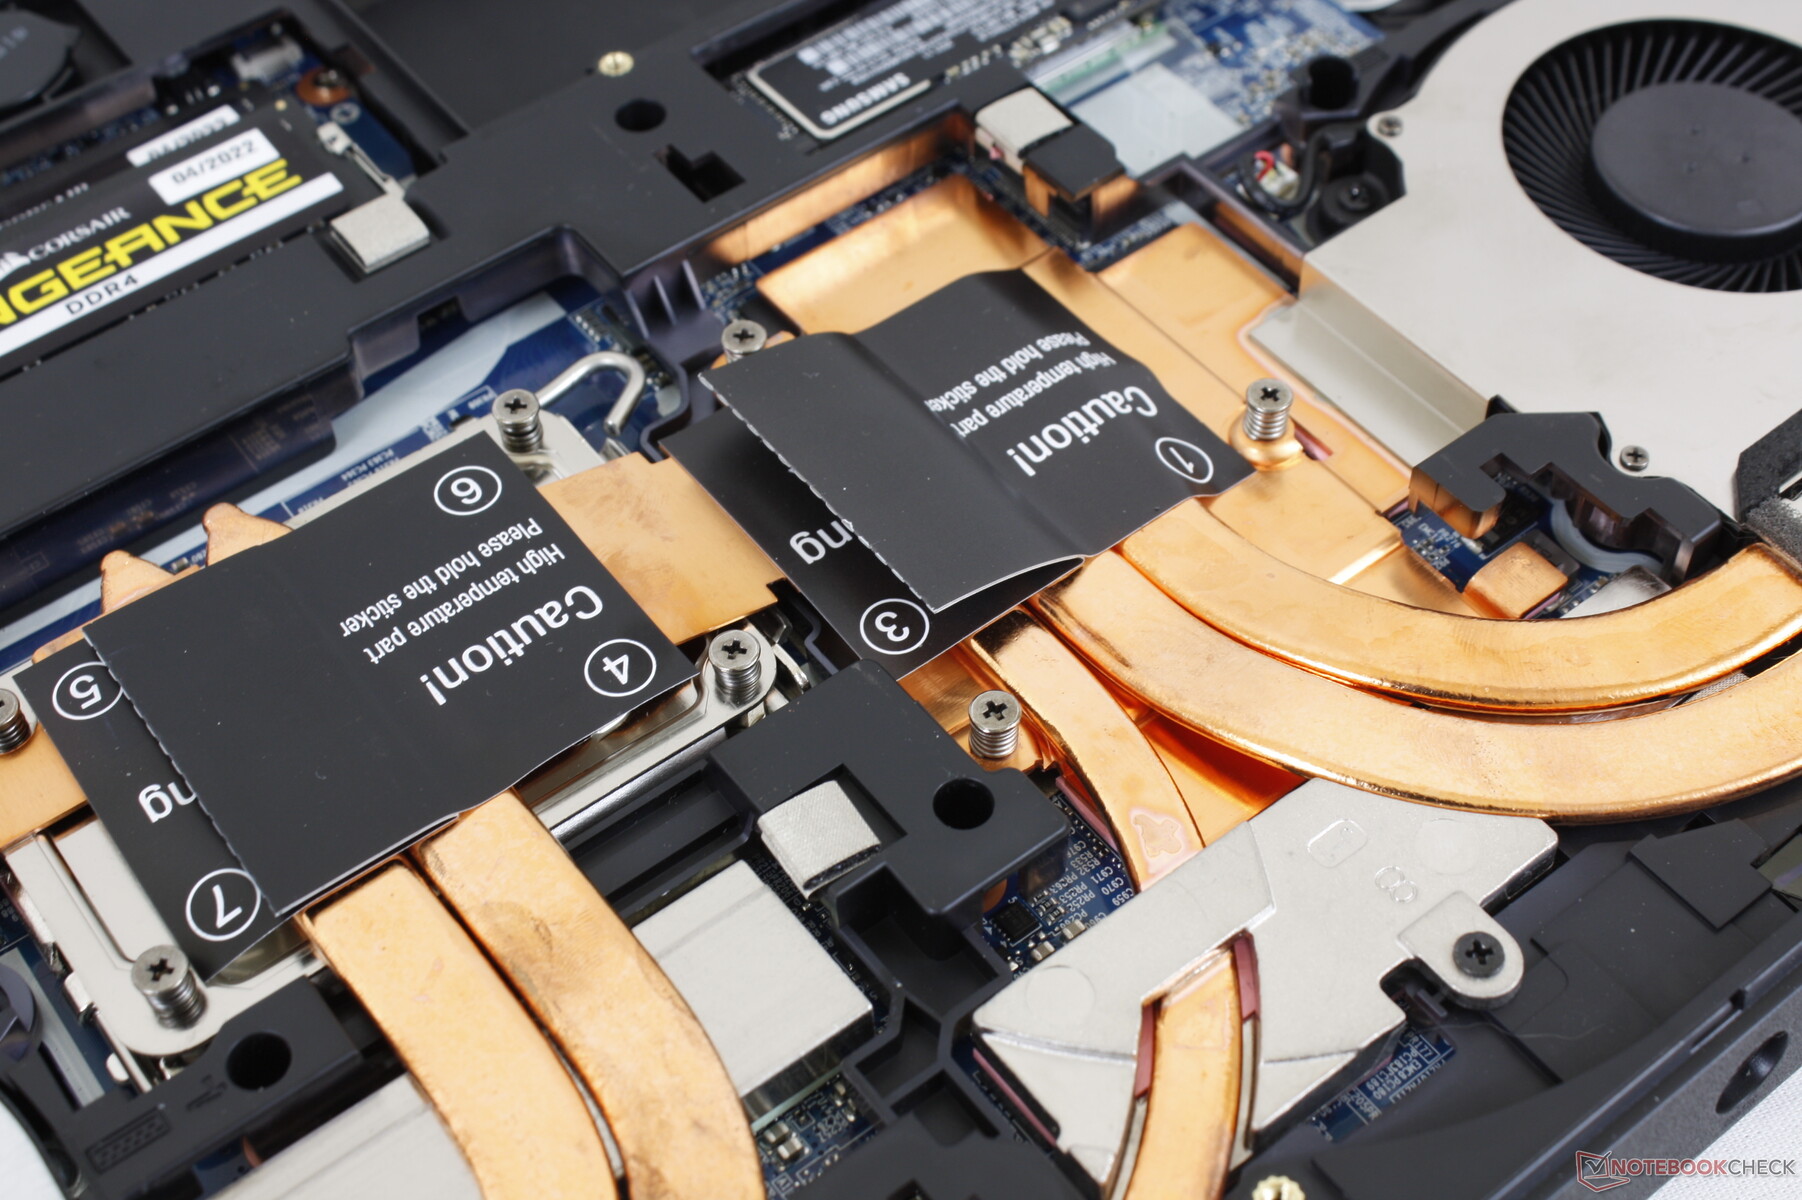
Con 2,7 kg y 32,5 mm de grosor, el Raptor X15 es más pesado y grueso que la mayoría de los portátiles para juegos de 15,6 pulgadas, incluidos el MSI GE66 o el Asus TUF Gaming A15. El peso extra puede atribuirse en parte a la solución de refrigeración más voluminosa que se necesita para alojar y refrigerar adecuadamente el zócalo LGA1700 y el procesador.
Conectividad
Las opciones de puertos son variadas e idénticas a las del Schenker XMG Apex 15. Hay que tener en cuenta que sólo hay un puerto USB-C con soporte para DisplayPort pero no Thunderbolt o Power Delivery a diferencia de muchos otros portátiles de juego con tecnología Intel como la serie Razer Blade o la serie MSI GS.
Lector de tarjetas SD
Extrañamente, el modelo integra un lector de tarjetas microSD en lugar de uno de tamaño completo, a pesar del factor de forma grande y relativamente grueso. Las tasas de transferencia son sólo medias, con menos de la mitad de la velocidad del lector de tarjetas del Dell XPS 15.
| SD Card Reader | |
| average JPG Copy Test (av. of 3 runs) | |
| Dell XPS 15 9510 i5 11400H FHD (AV Pro V60) | |
| Asus ZenBook Flip 14 UN5401QA-KN085W (AV Pro SD microSD 128 GB V60) | |
| Asus Zenbook Pro 15 OLED UM535Q (Toshiba Exceria Pro SDXC 64 GB UHS-II) | |
| Eurocom Raptor X15 (AV Pro V60) | |
| Asus ZenBook 14X OLED UX5400EA-L7154W | |
| maximum AS SSD Seq Read Test (1GB) | |
| Dell XPS 15 9510 i5 11400H FHD (AV Pro V60) | |
| Eurocom Raptor X15 (AV Pro V60) | |
| Asus ZenBook Flip 14 UN5401QA-KN085W (AV Pro SD microSD 128 GB V60) | |
| Asus Zenbook Pro 15 OLED UM535Q (Toshiba Exceria Pro SDXC 64 GB UHS-II) | |
| Asus ZenBook 14X OLED UX5400EA-L7154W | |
Comunicación
El Intel AX200/201 está disponible como la opción de gama más alta para la conectividad Wi-Fi 6 y Bluetooth 5.2. No experimentamos ningún problema al emparejarlo con nuestro router de pruebas Asus GT-AXE11000.
Desgraciadamente, el Wi-Fi 6E no es compatible.
| Networking | |
| iperf3 transmit AX12 | |
| Gigabyte A5 X1 | |
| Asus TUF Gaming A15 FA506QR-AZ061T | |
| Eurocom RX315 NH57AF1 | |
| iperf3 receive AX12 | |
| Asus TUF Gaming A15 FA506QR-AZ061T | |
| Gigabyte A5 X1 | |
| Eurocom RX315 NH57AF1 | |
| iperf3 receive AXE11000 | |
| Razer Blade 15 Advanced Model Early 2022 | |
| MSI Raider GE66 12UHS | |
| Eurocom Raptor X15 | |
| iperf3 transmit AXE11000 | |
| Razer Blade 15 Advanced Model Early 2022 | |
| MSI Raider GE66 12UHS | |
| Eurocom Raptor X15 | |
Cámara web
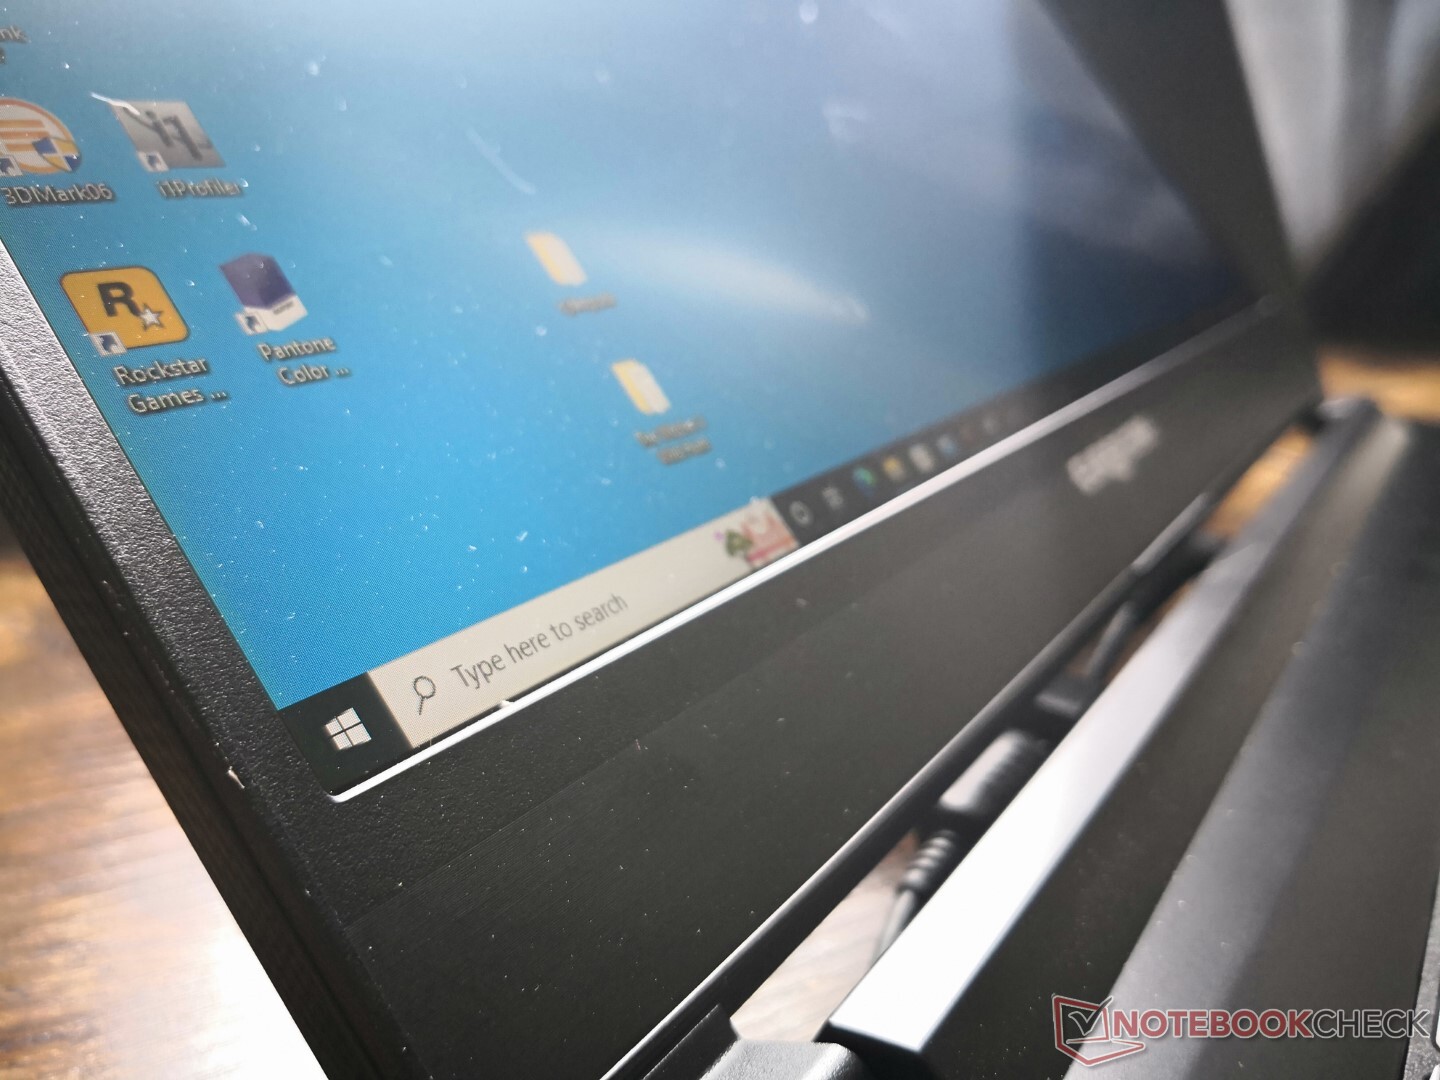
La cámara web es pobre con sólo 720p en comparación con los 1080p de otros portátiles para juegos como el Razer Blade 15. Tampoco hay soporte para Windows Hello. La cámara puede desactivarse electrónicamente mediante la tecla F10 en lugar de un obturador físico.


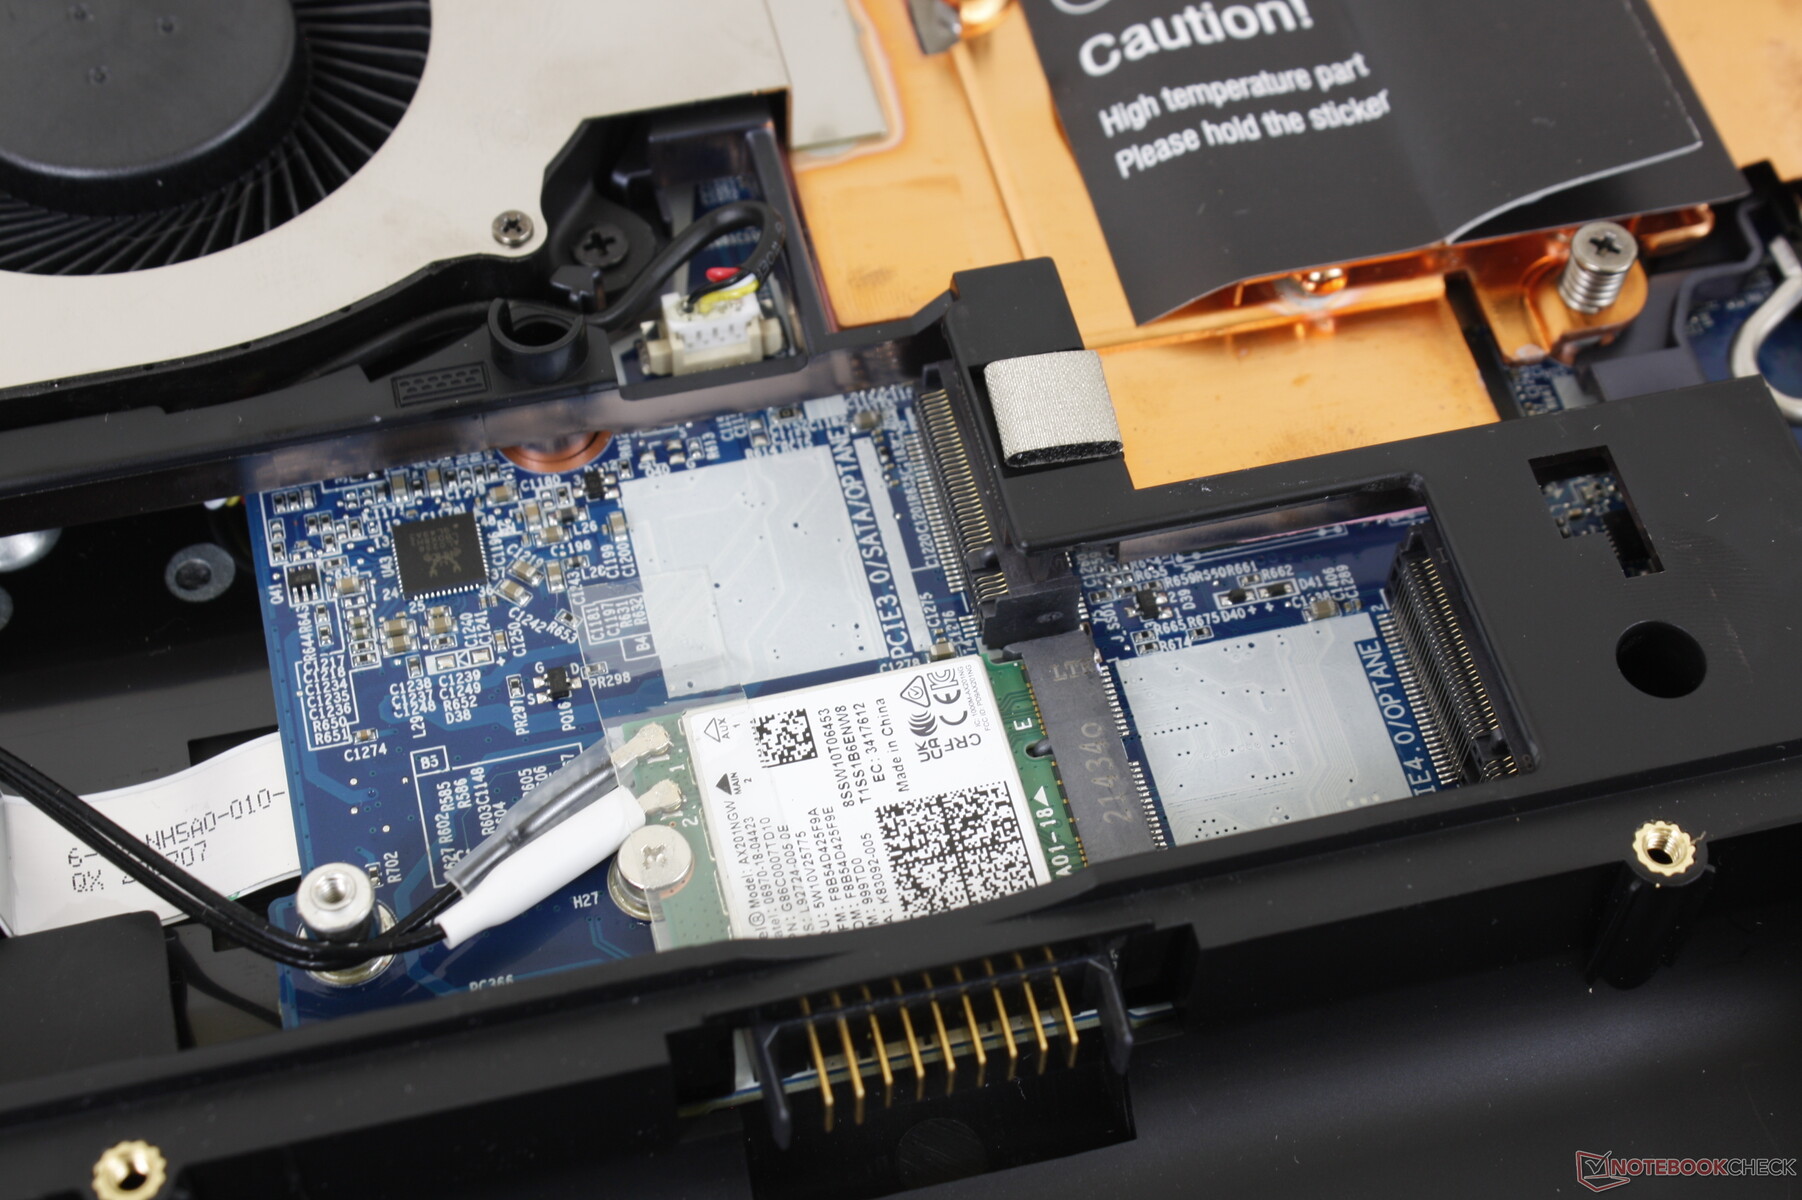
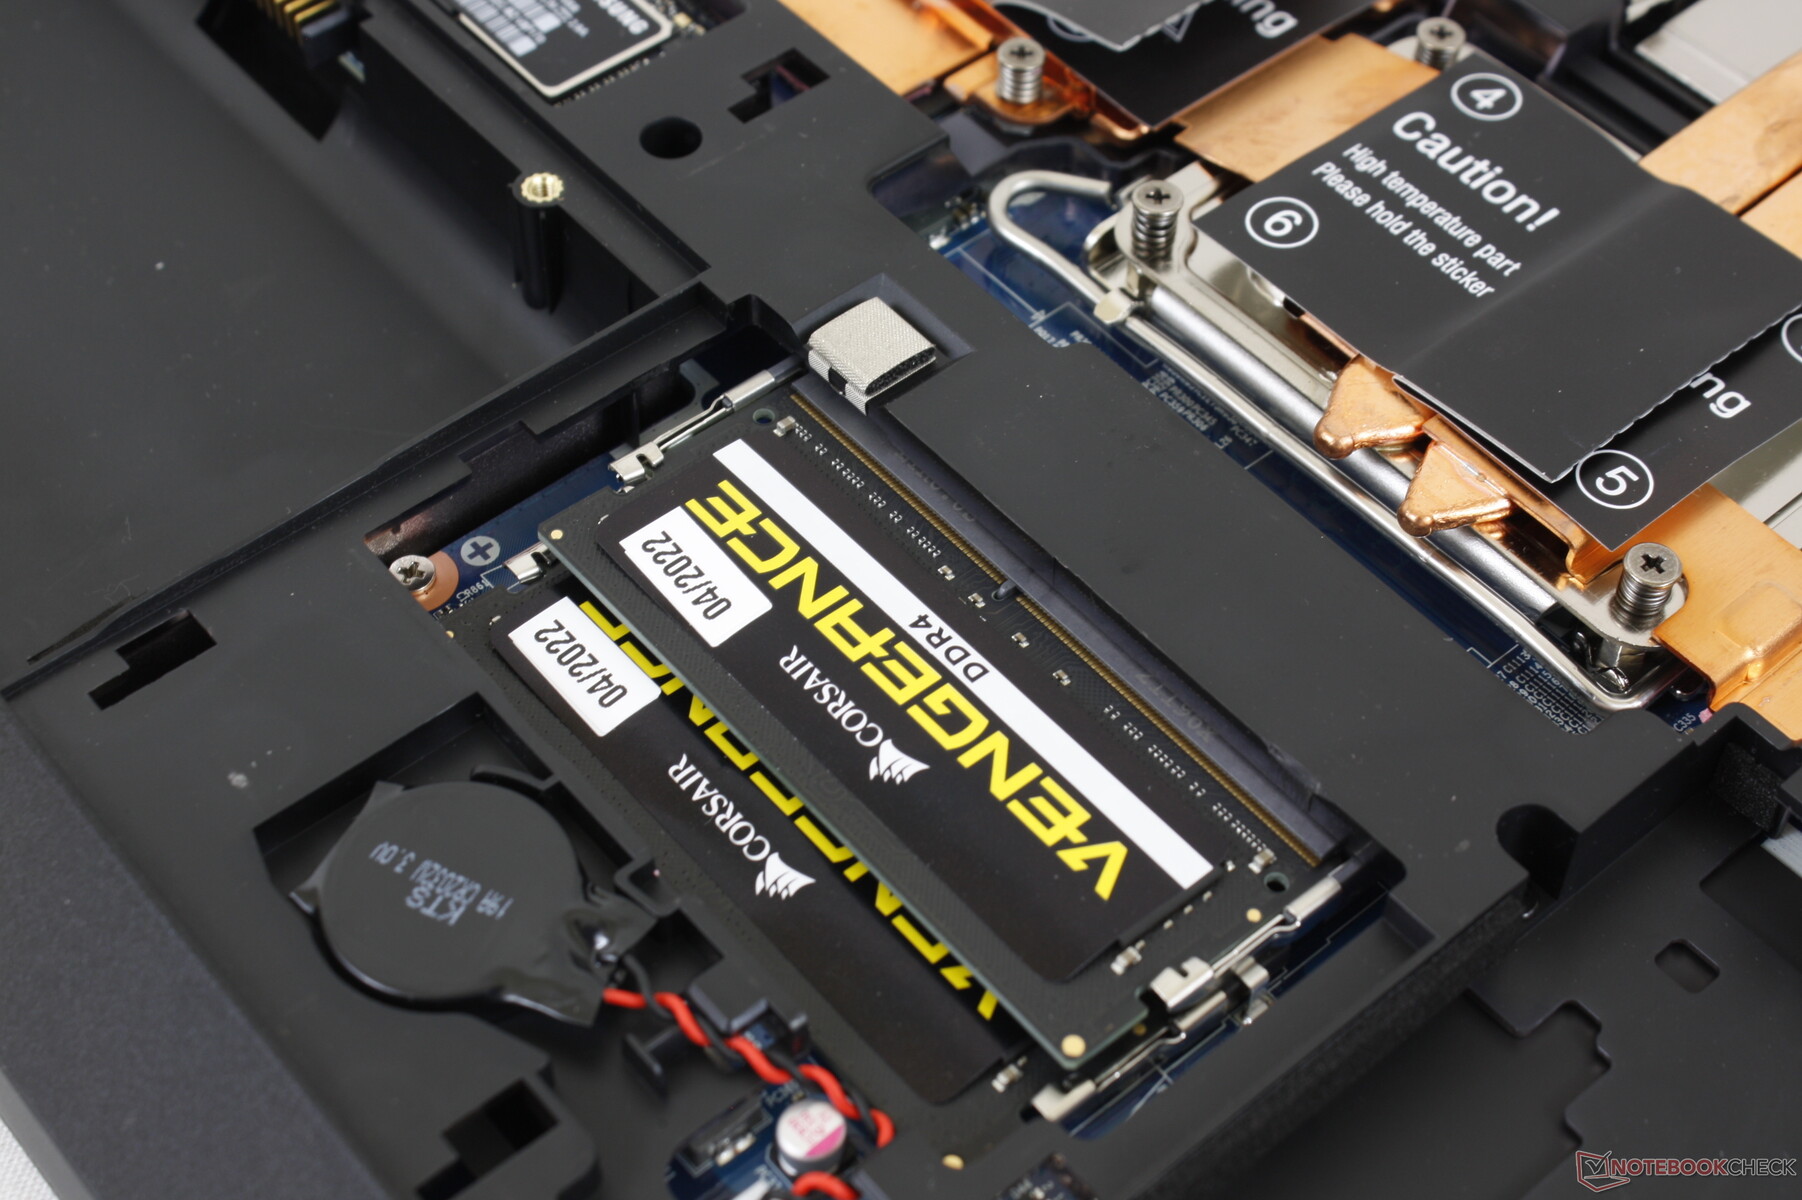
Mantenimiento
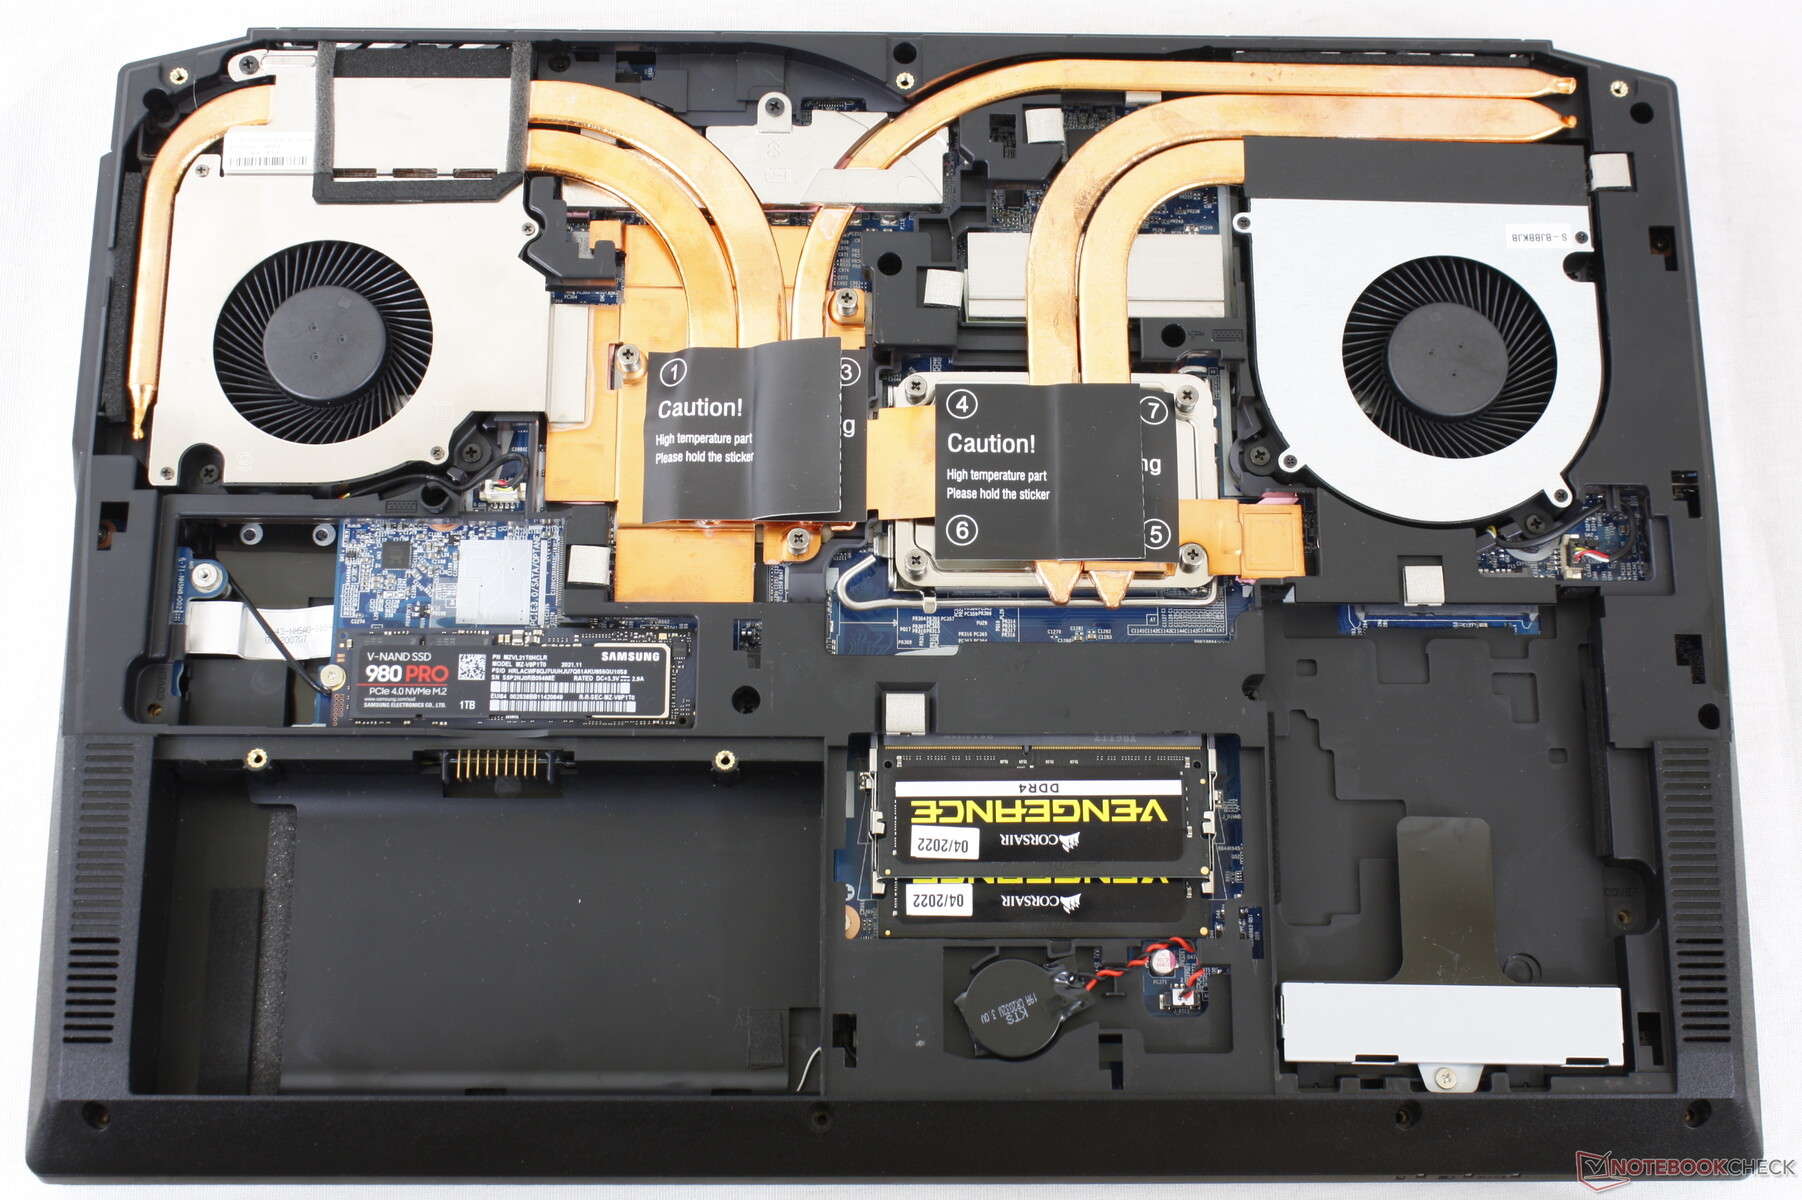
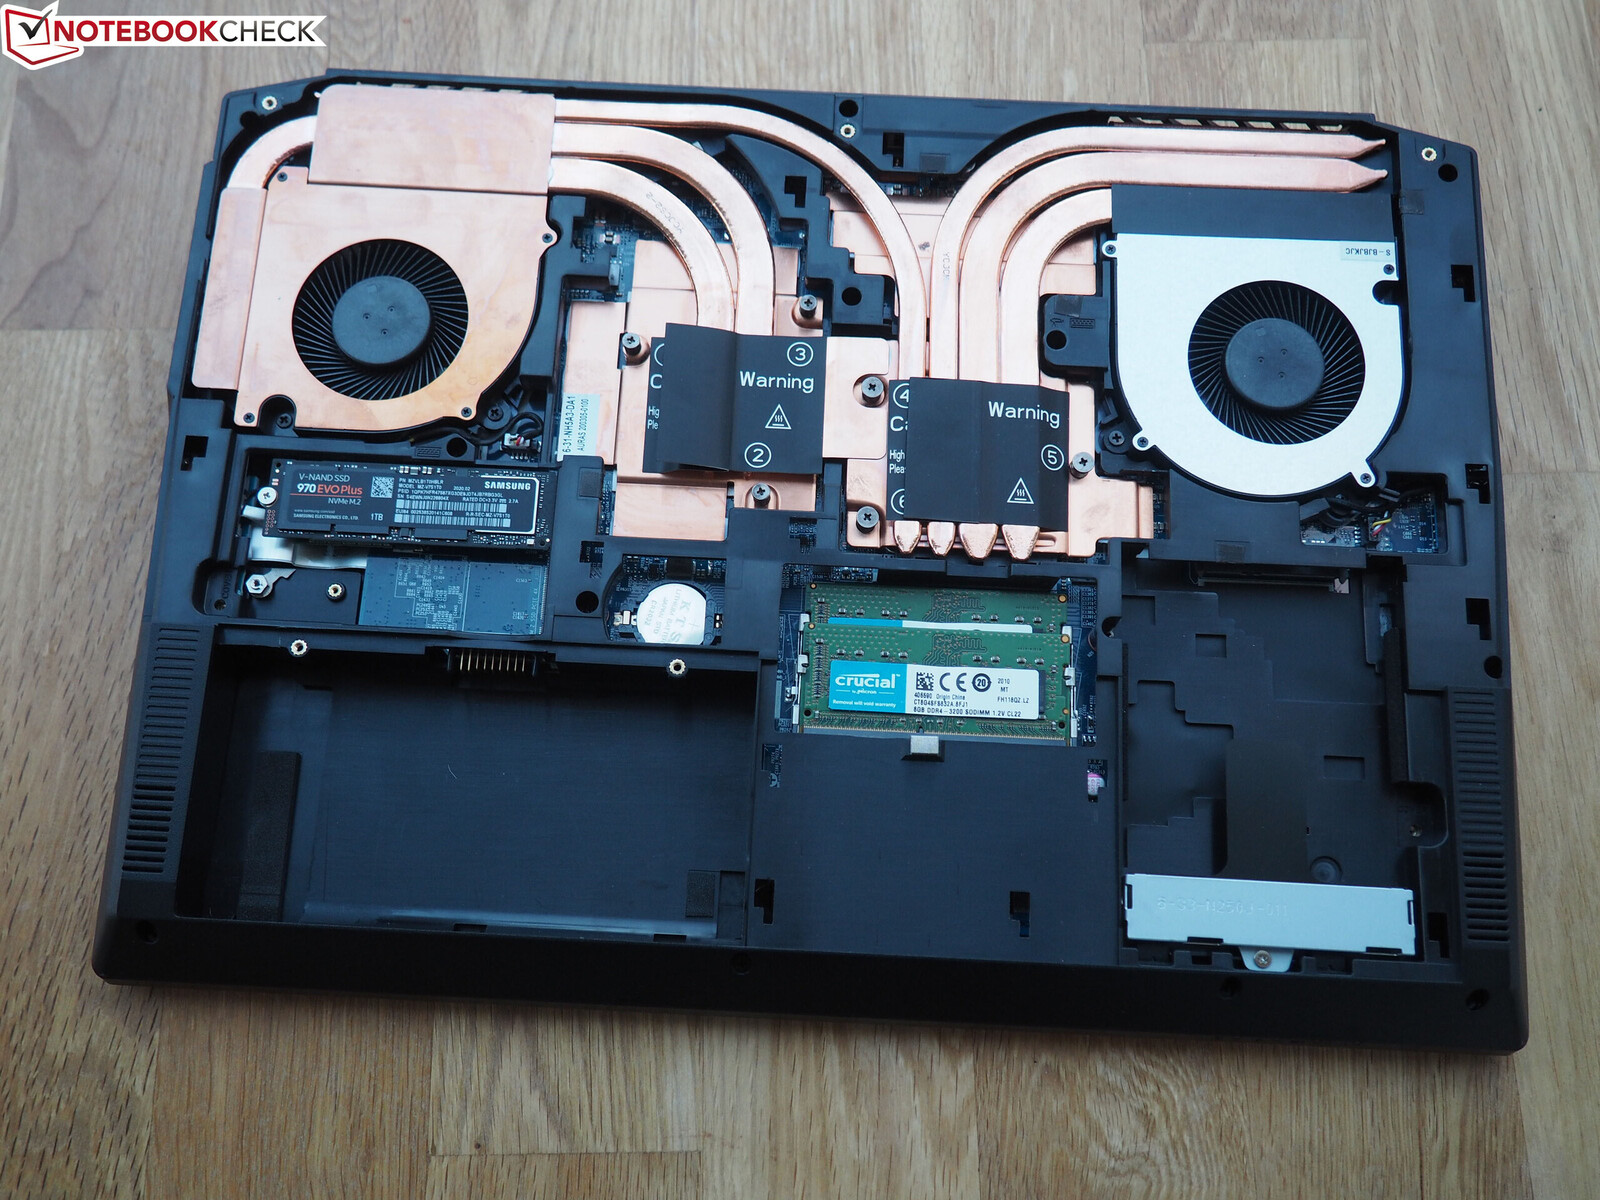
Accesorios y garantía
La caja de venta incluye tornillos y almohadillas para instalar SSD adicionales y un disco de controladores. La pasta térmica para la CPU no está incluida.
La garantía limitada estándar de un año se aplica cuando se adquiere en los Estados Unidos, con extensiones opcionales de dos y tres años.
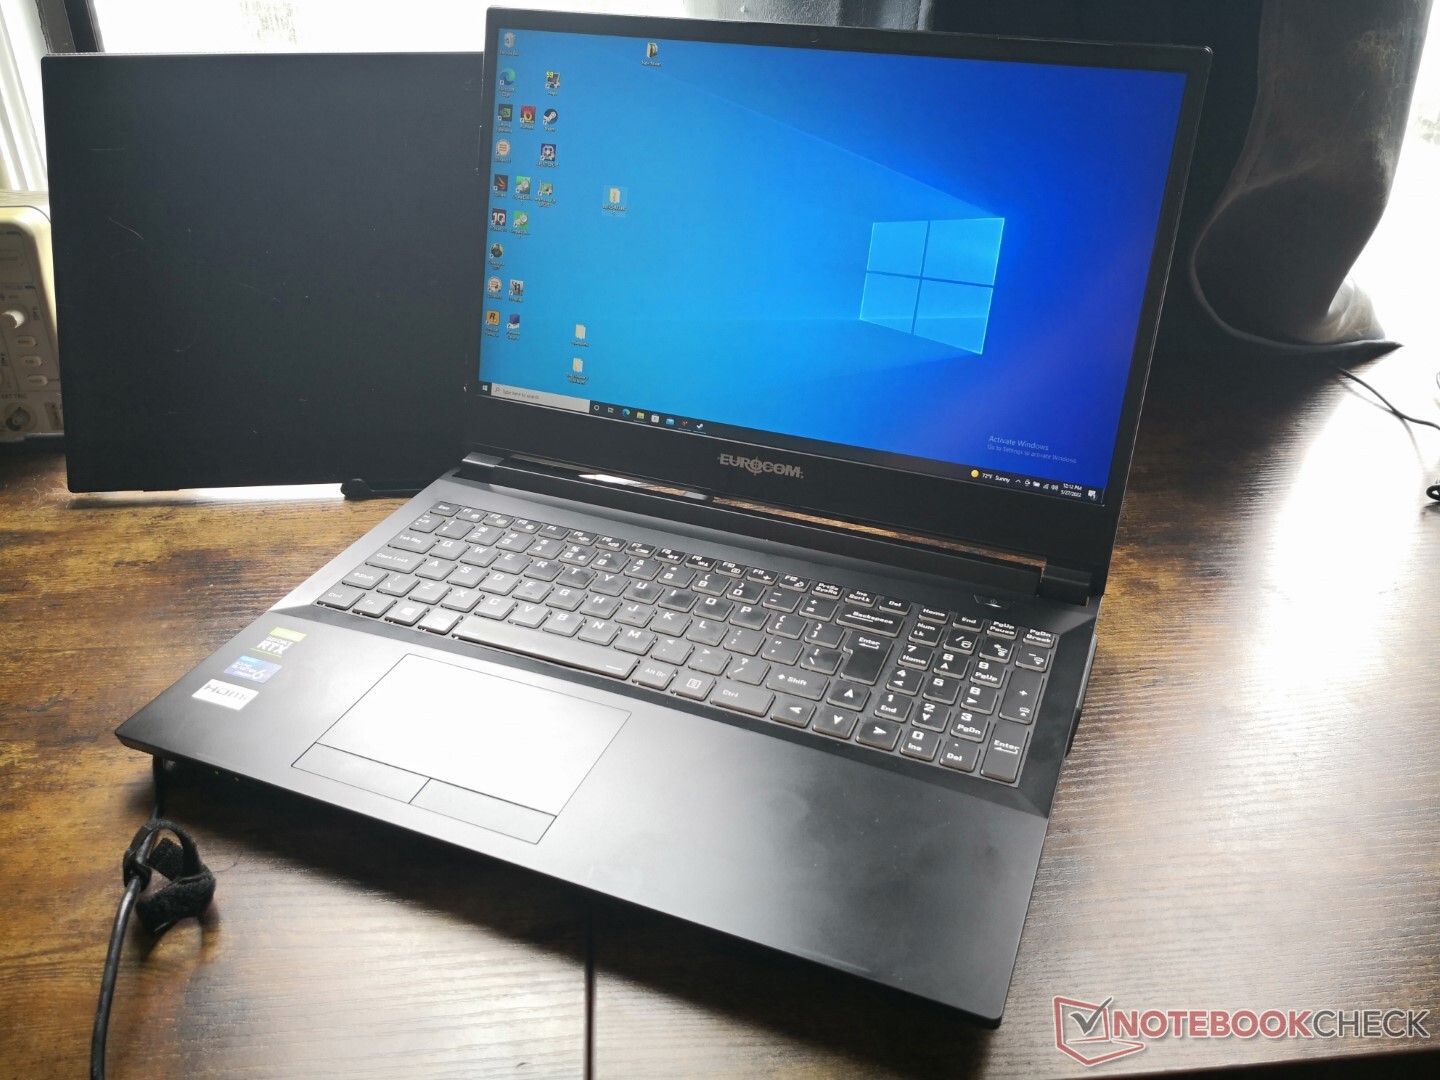
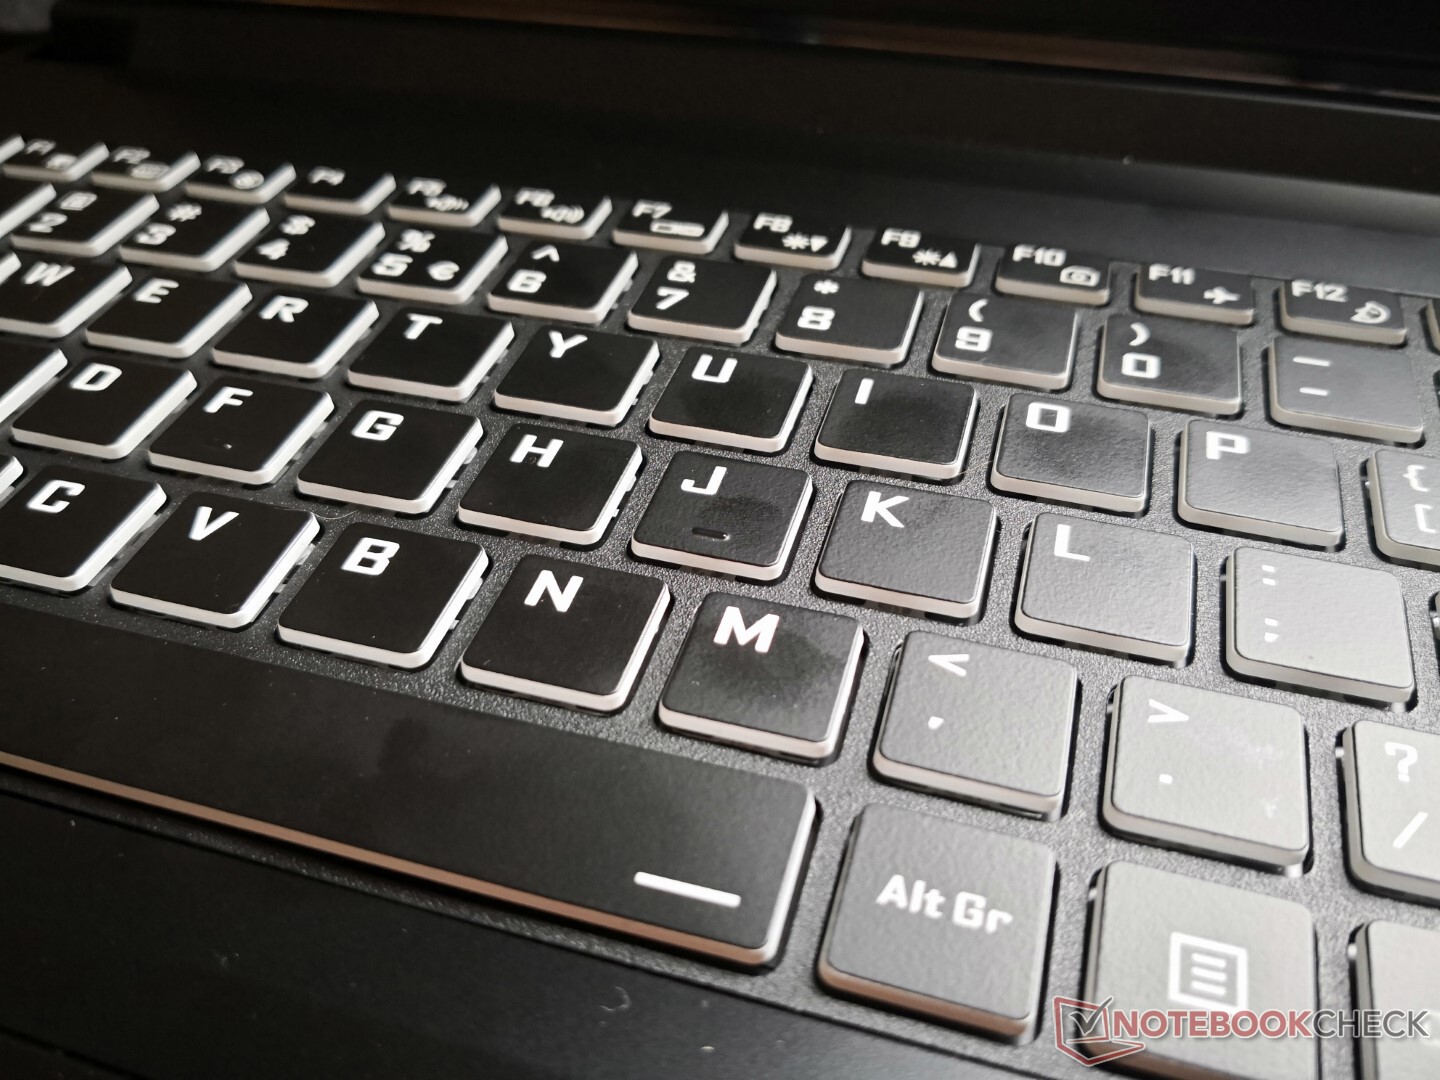
Dispositivos de entrada
La experiencia de tecleo es cómoda, con una respuesta más firme pero con un ruido más fuerte que el que estamos acostumbrados en otros portátiles para juegos.
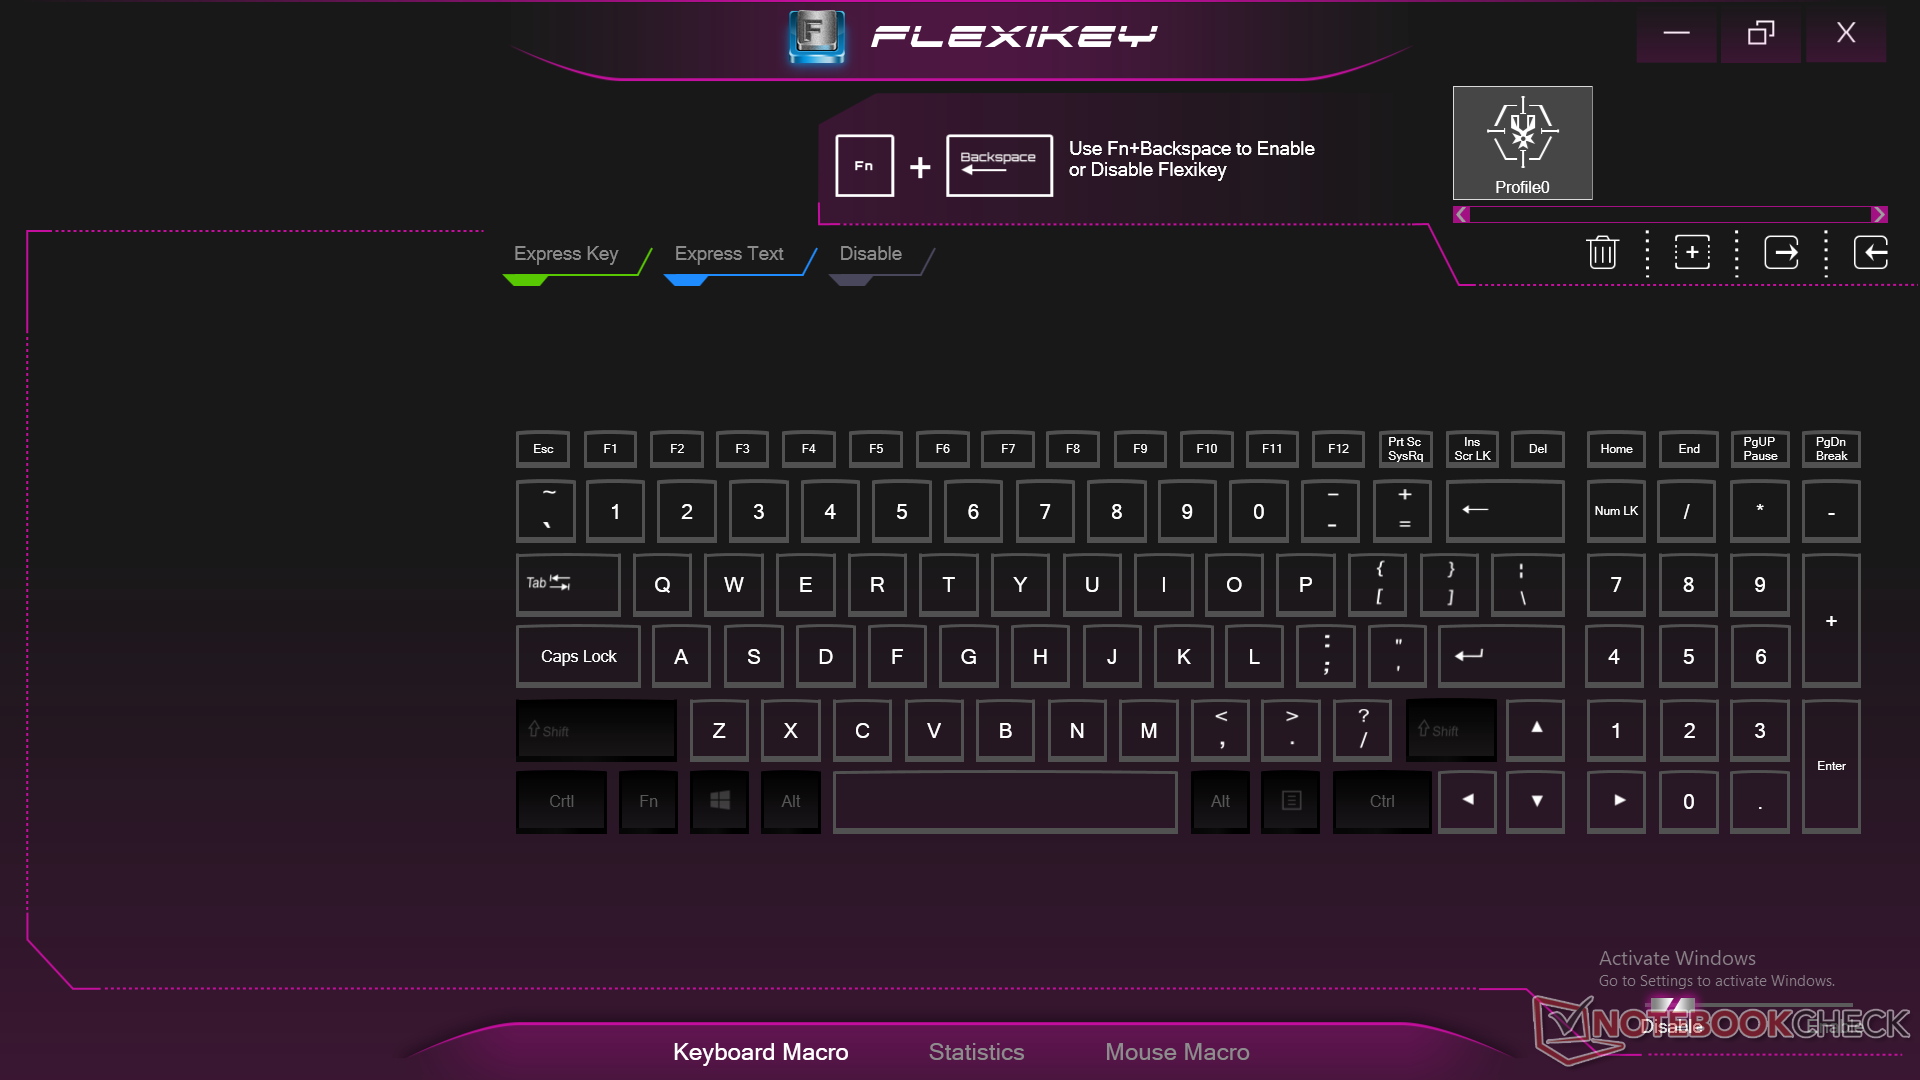
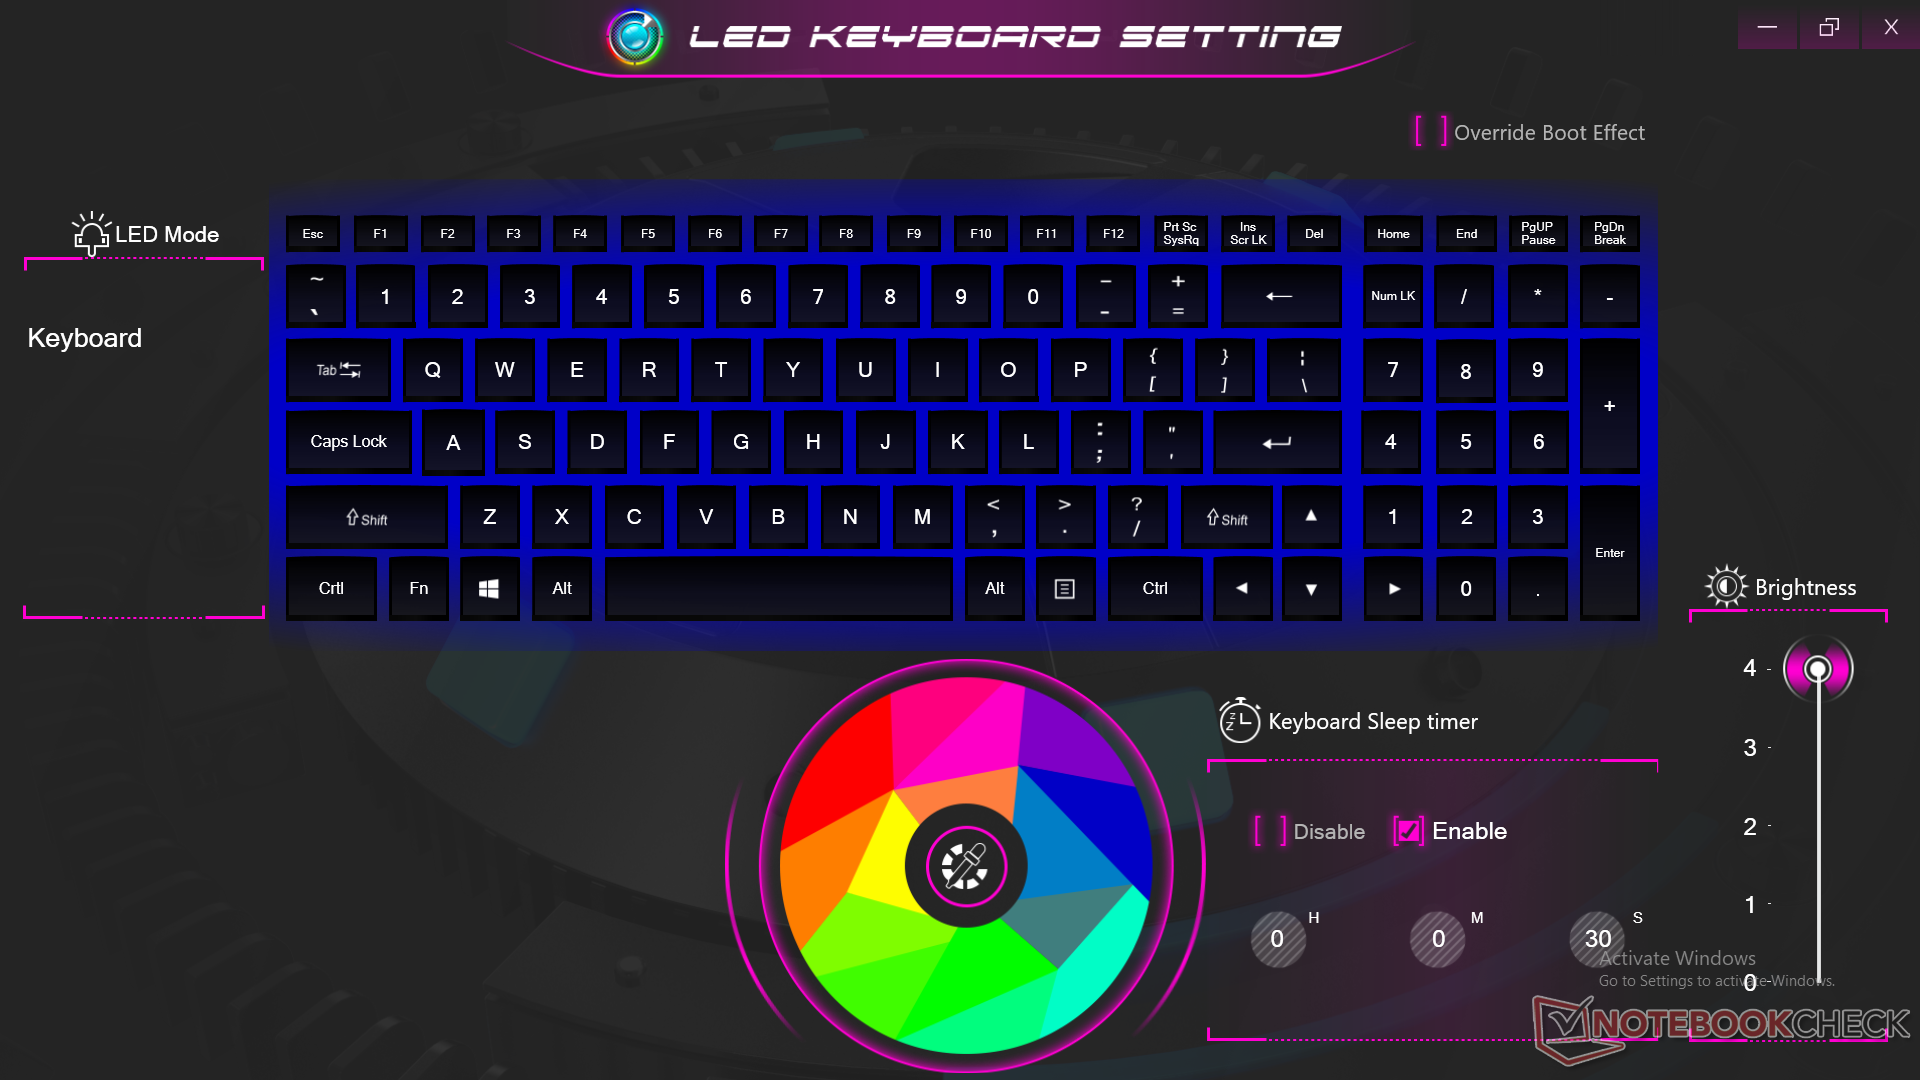
La iluminación del teclado es, por desgracia, de una sola zona en comparación con la iluminación RGB de cuatro zonas o por tecla en la mayoría de los otros portátiles de rendimiento. Sin embargo, apreciamos los botones dedicados del ratón para facilitar las entradas multitáctiles.
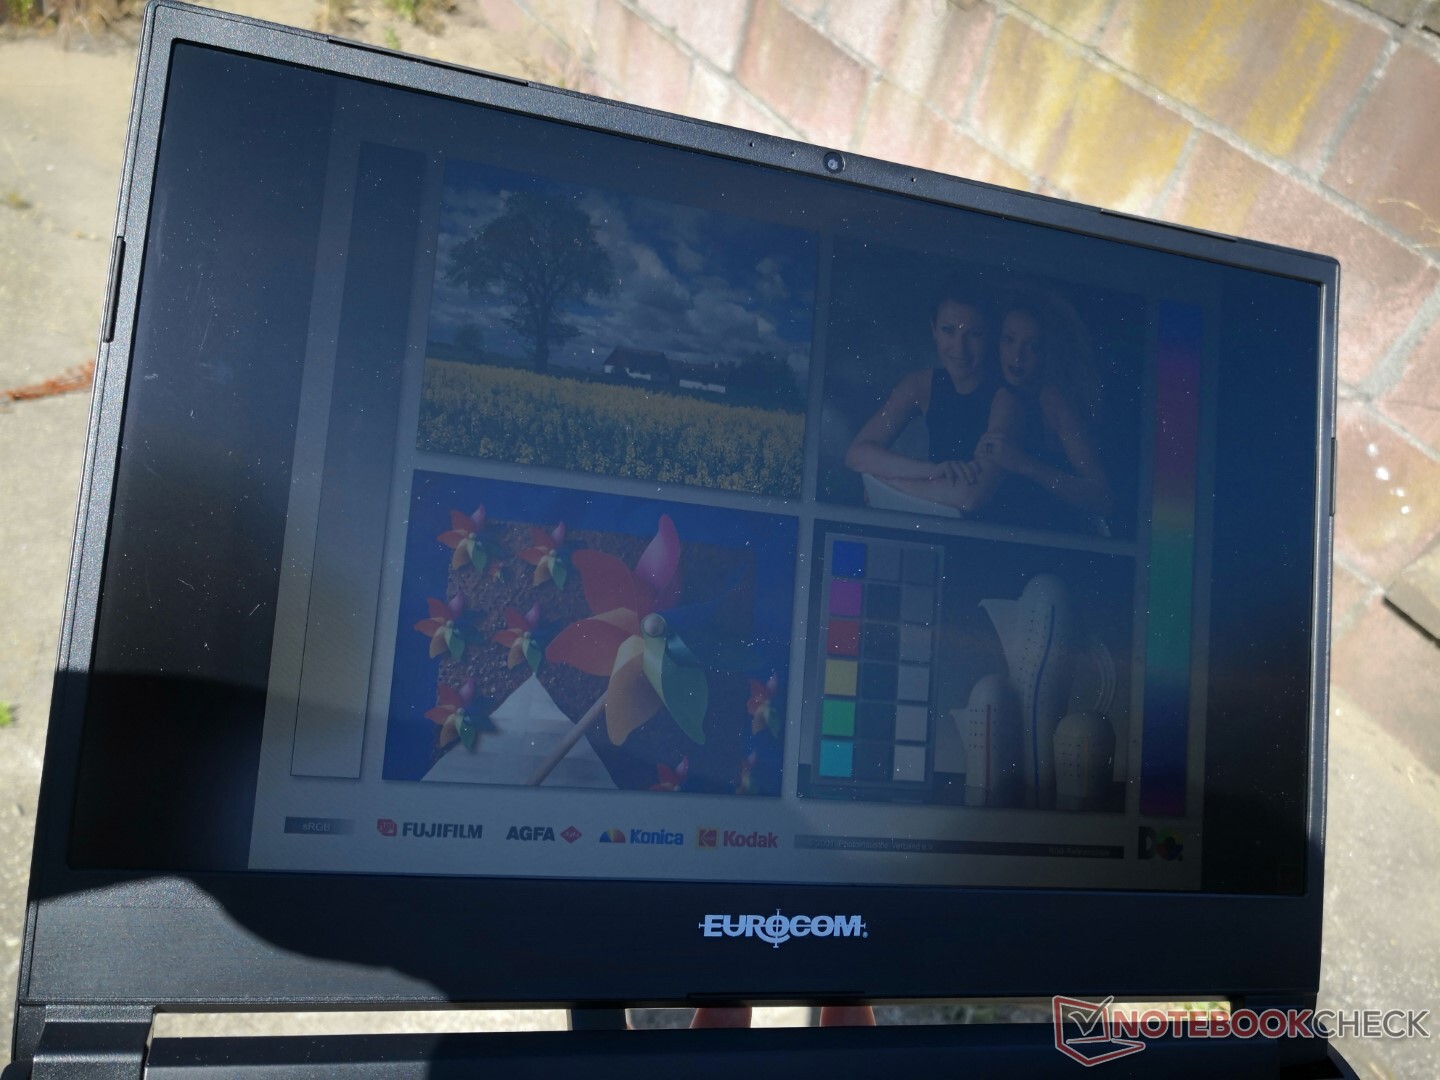
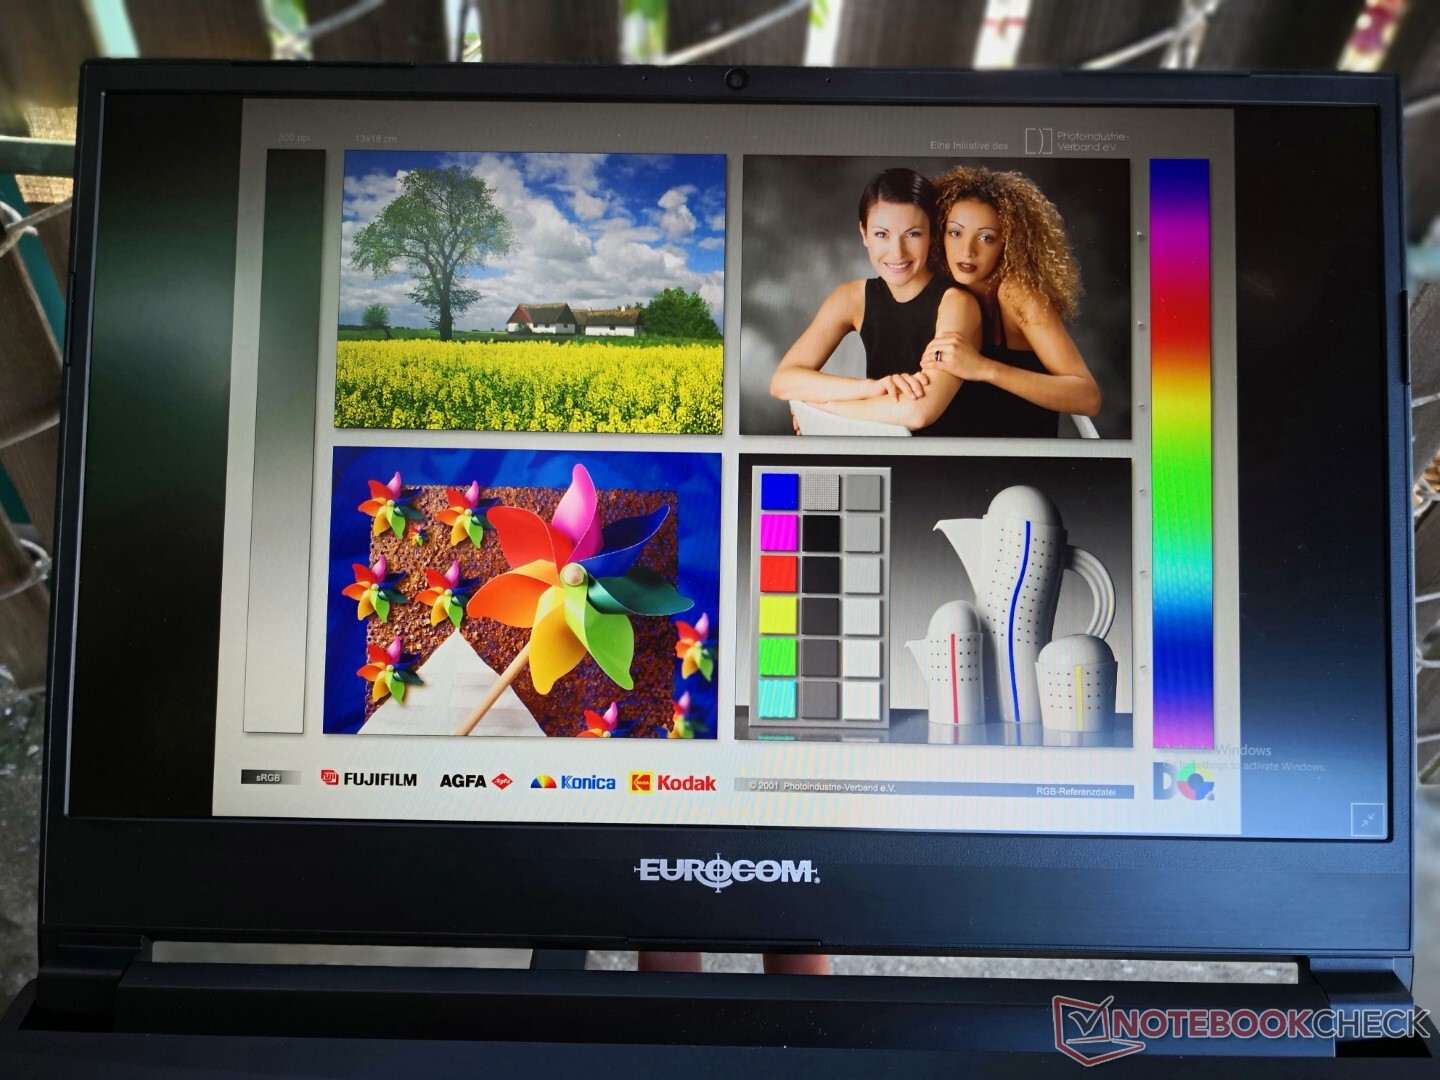
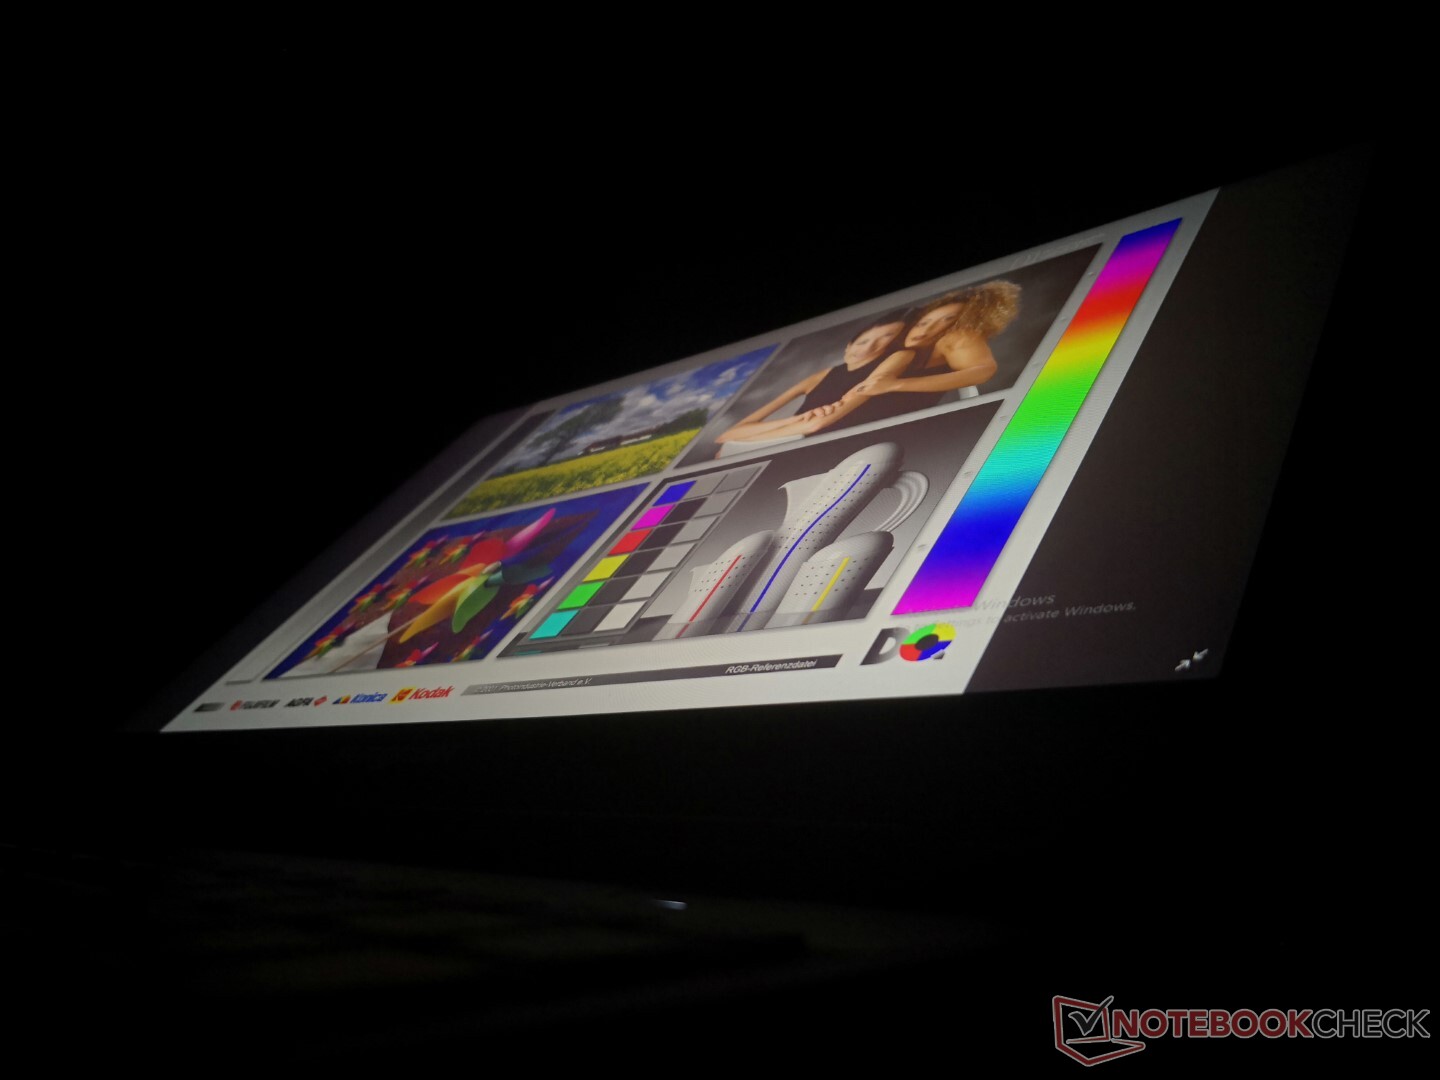
Mostrar
Nuestra unidad viene configurada con el mismo panel IPS Sharp LQ156M1JW03 que se encuentra en elEurocom RX315. Este panel destaca por su rapidísima tasa de refresco de 240 Hz, sus rápidos tiempos de respuesta y su completa cobertura sRGB para ser apto tanto para los juegos como para la mayoría de la edición de gráficos. También hay disponible un panel QHD de mayor resolución que promete una cobertura DCI-P3 completa, aunque con una frecuencia de actualización más lenta de 165 Hz.

| |||||||||||||||||||||||||
iluminación: 91 %
Brillo con batería: 299.2 cd/m²
Contraste: 997:1 (Negro: 0.3 cd/m²)
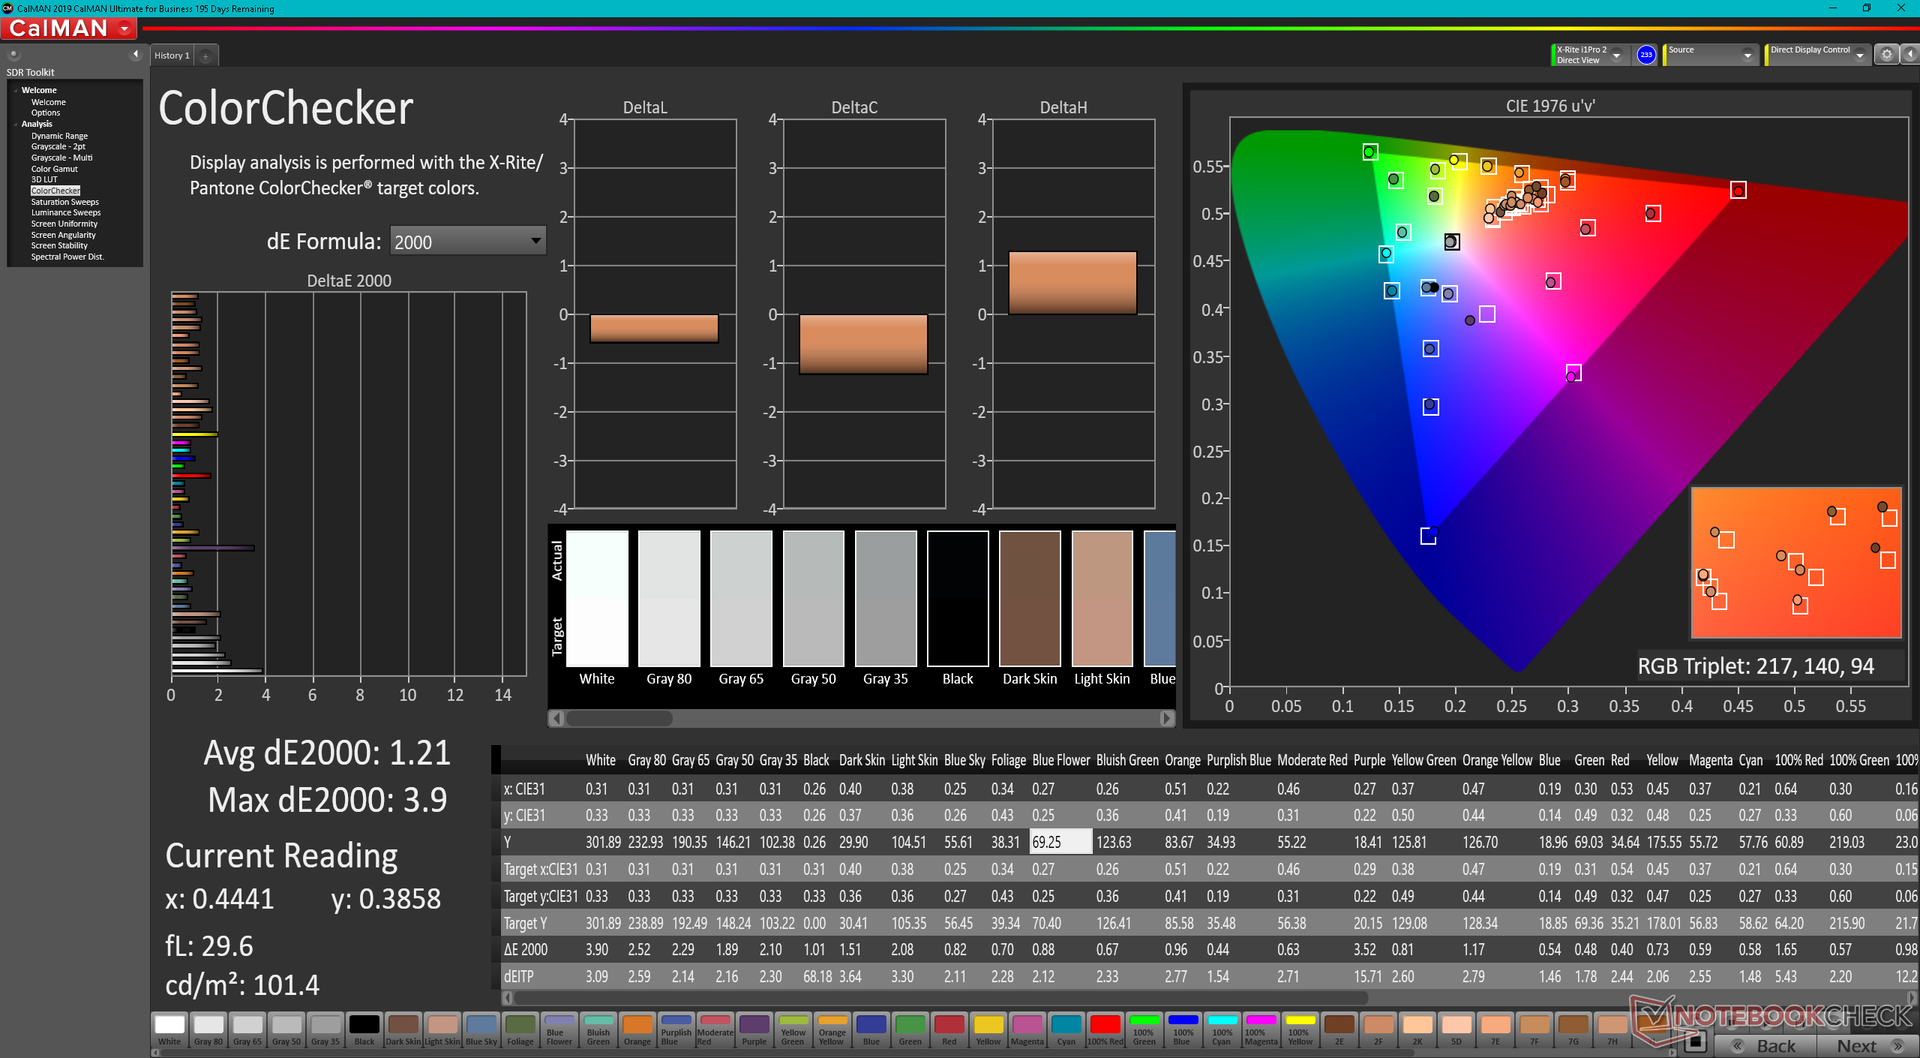
ΔE ColorChecker Calman: 2.35 | ∀{0.5-29.43 Ø4.71}
calibrated: 1.21
ΔE Greyscale Calman: 3.1 | ∀{0.09-98 Ø4.96}
67.7% AdobeRGB 1998 (Argyll 3D)
97.3% sRGB (Argyll 3D)
66.5% Display P3 (Argyll 3D)
Gamma: 2.25
CCT: 6843 K
| Eurocom Raptor X15 Sharp LQ156M1JW03, IPS, 1920x1080, 15.6" | MSI Raider GE66 12UHS AUO51EB, IPS, 3840x2160, 15.6" | Razer Blade 15 Advanced Model Early 2022 TL156VDXP02-0, IPS, 1920x1080, 15.6" | Eurocom RX315 NH57AF1 Sharp LQ156M1JW03, IPS, 1920x1080, 15.6" | Gigabyte A5 X1 AU Optronics B156HAN12.0, IPS, 1920x1080, 15.6" | Asus TUF Gaming A15 FA506QR-AZ061T Sharp SHP1532, IPS, 1920x1080, 15.6" | |
|---|---|---|---|---|---|---|
| Display | 21% | -5% | 1% | 4% | ||
| Display P3 Coverage (%) | 66.5 | 80.4 21% | 65.3 -2% | 67.5 2% | 69.6 5% | |
| sRGB Coverage (%) | 97.3 | 98.4 1% | 85.1 -13% | 98 1% | 98.6 1% | |
| AdobeRGB 1998 Coverage (%) | 67.7 | 94.7 40% | 67.4 0% | 68.5 1% | 70.8 5% | |
| Response Times | -35% | 33% | 4% | 28% | 15% | |
| Response Time Grey 50% / Grey 80% * (ms) | 12.8 ? | 18.8 ? -47% | 4.3 ? 66% | 10.4 ? 19% | 4.8 ? 63% | 12 ? 6% |
| Response Time Black / White * (ms) | 10.4 ? | 12.8 ? -23% | 10.5 ? -1% | 11.6 ? -12% | 11.2 ? -8% | 8 ? 23% |
| PWM Frequency (Hz) | 23810 ? | 22730 ? | 1250 ? | |||
| Screen | -7% | 27% | -23% | -13% | 18% | |
| Brightness middle (cd/m²) | 299.2 | 351 17% | 330 10% | 291.3 -3% | 335 12% | 297 -1% |
| Brightness (cd/m²) | 282 | 347 23% | 315 12% | 273 -3% | 325 15% | 268 -5% |
| Brightness Distribution (%) | 91 | 90 -1% | 89 -2% | 91 0% | 90 -1% | 84 -8% |
| Black Level * (cd/m²) | 0.3 | 0.35 -17% | 0.24 20% | 0.35 -17% | 0.4 -33% | 0.22 27% |
| Contrast (:1) | 997 | 1003 1% | 1375 38% | 832 -17% | 838 -16% | 1350 35% |
| Colorchecker dE 2000 * | 2.35 | 2.54 -8% | 1.47 37% | 2.39 -2% | 2.63 -12% | 1.36 42% |
| Colorchecker dE 2000 max. * | 4.39 | 8.36 -90% | 2.73 38% | 8.05 -83% | 7.71 -76% | 3.82 13% |
| Colorchecker dE 2000 calibrated * | 1.21 | 0.67 45% | 0.63 48% | 1.49 -23% | 0.97 20% | |
| Greyscale dE 2000 * | 3.1 | 4.1 -32% | 1.8 42% | 4.8 -55% | 4 -29% | 1.88 39% |
| Gamma | 2.25 98% | 2.089 105% | 2.282 96% | 2.25 98% | 2.129 103% | 2.48 89% |
| CCT | 6843 95% | 7036 92% | 6499 100% | 7124 91% | 7434 87% | 6768 96% |
| Color Space (Percent of AdobeRGB 1998) (%) | 63 | |||||
| Color Space (Percent of sRGB) (%) | 99 | |||||
| Media total (Programa/Opciones) | -7% /
-5% | 18% /
21% | -6% /
-14% | 6% /
-4% | 17% /
17% |
* ... más pequeño es mejor
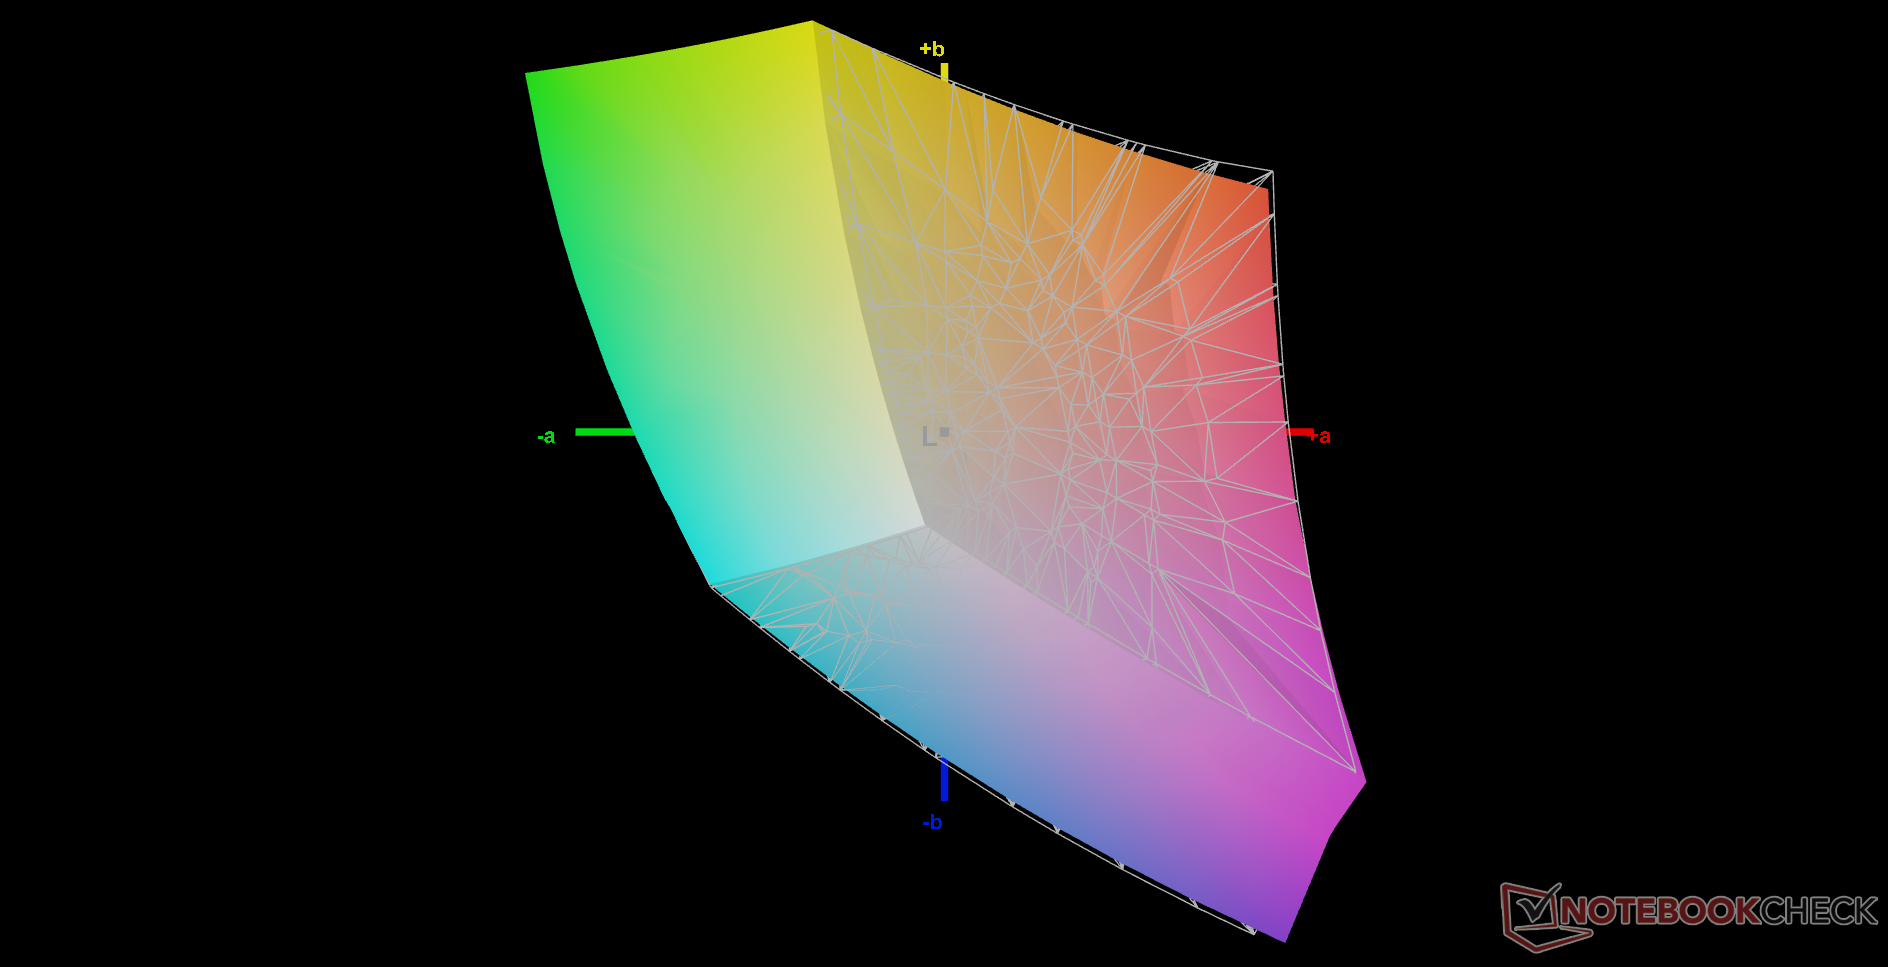
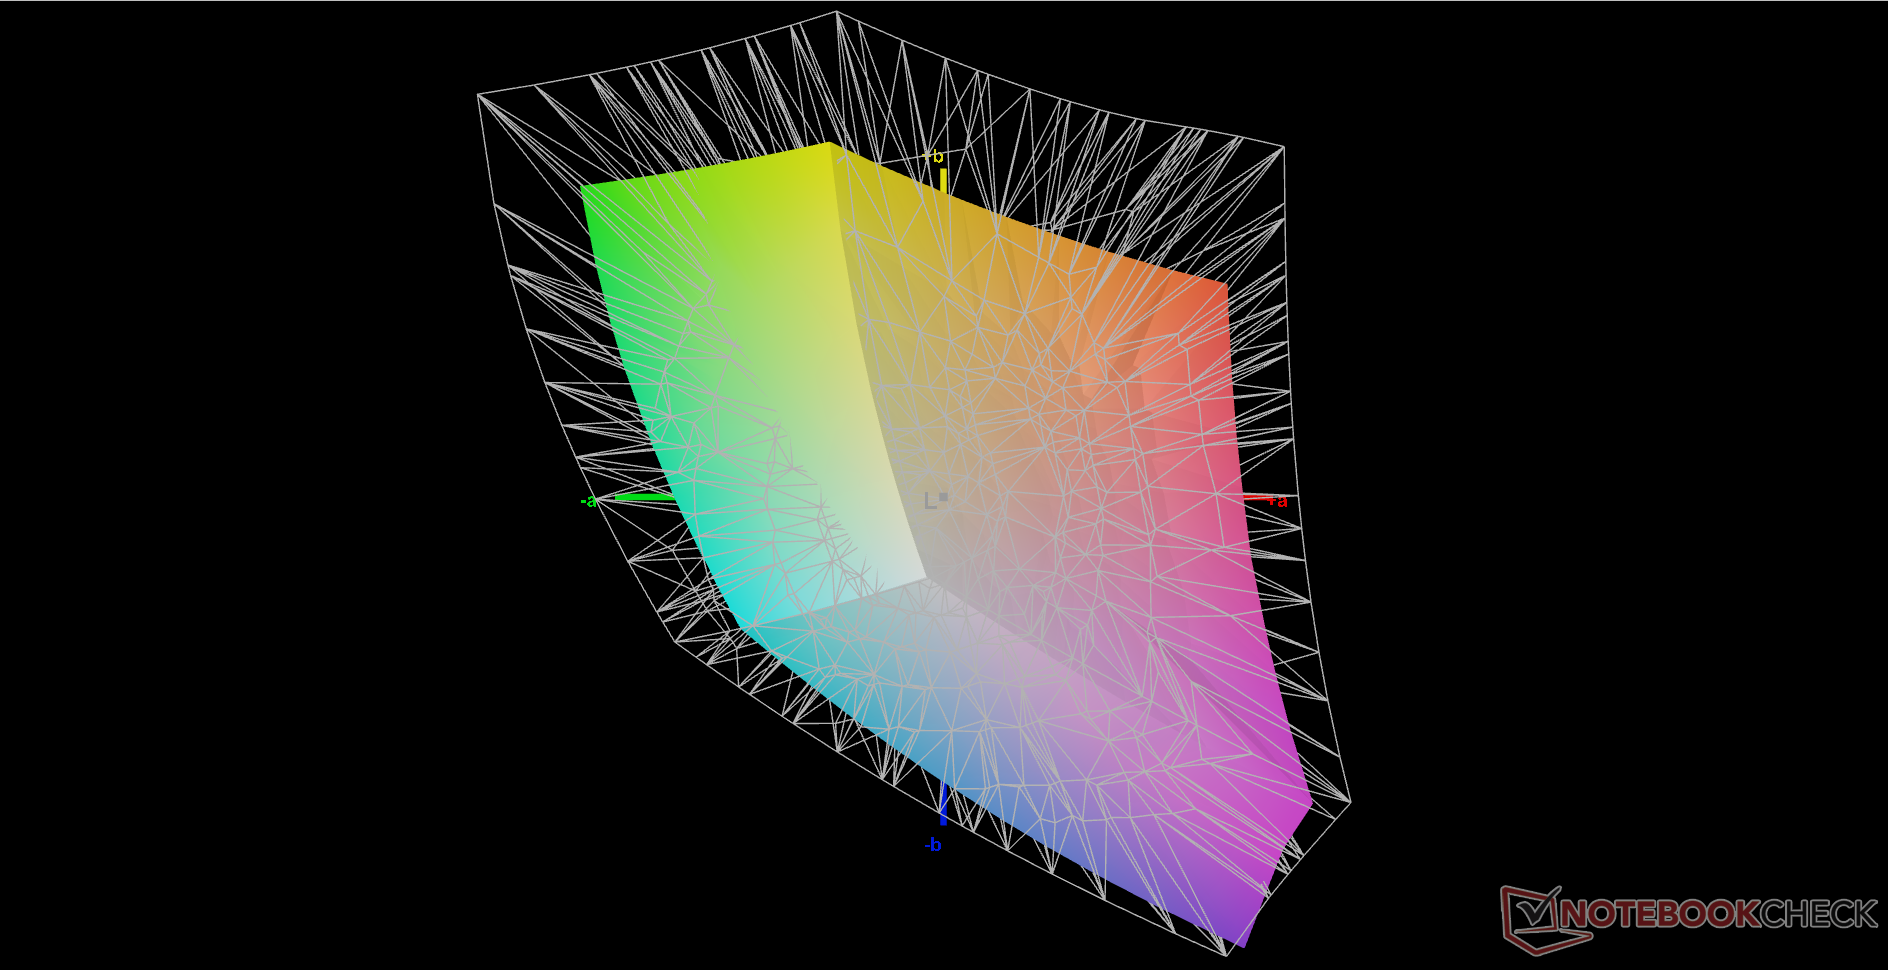
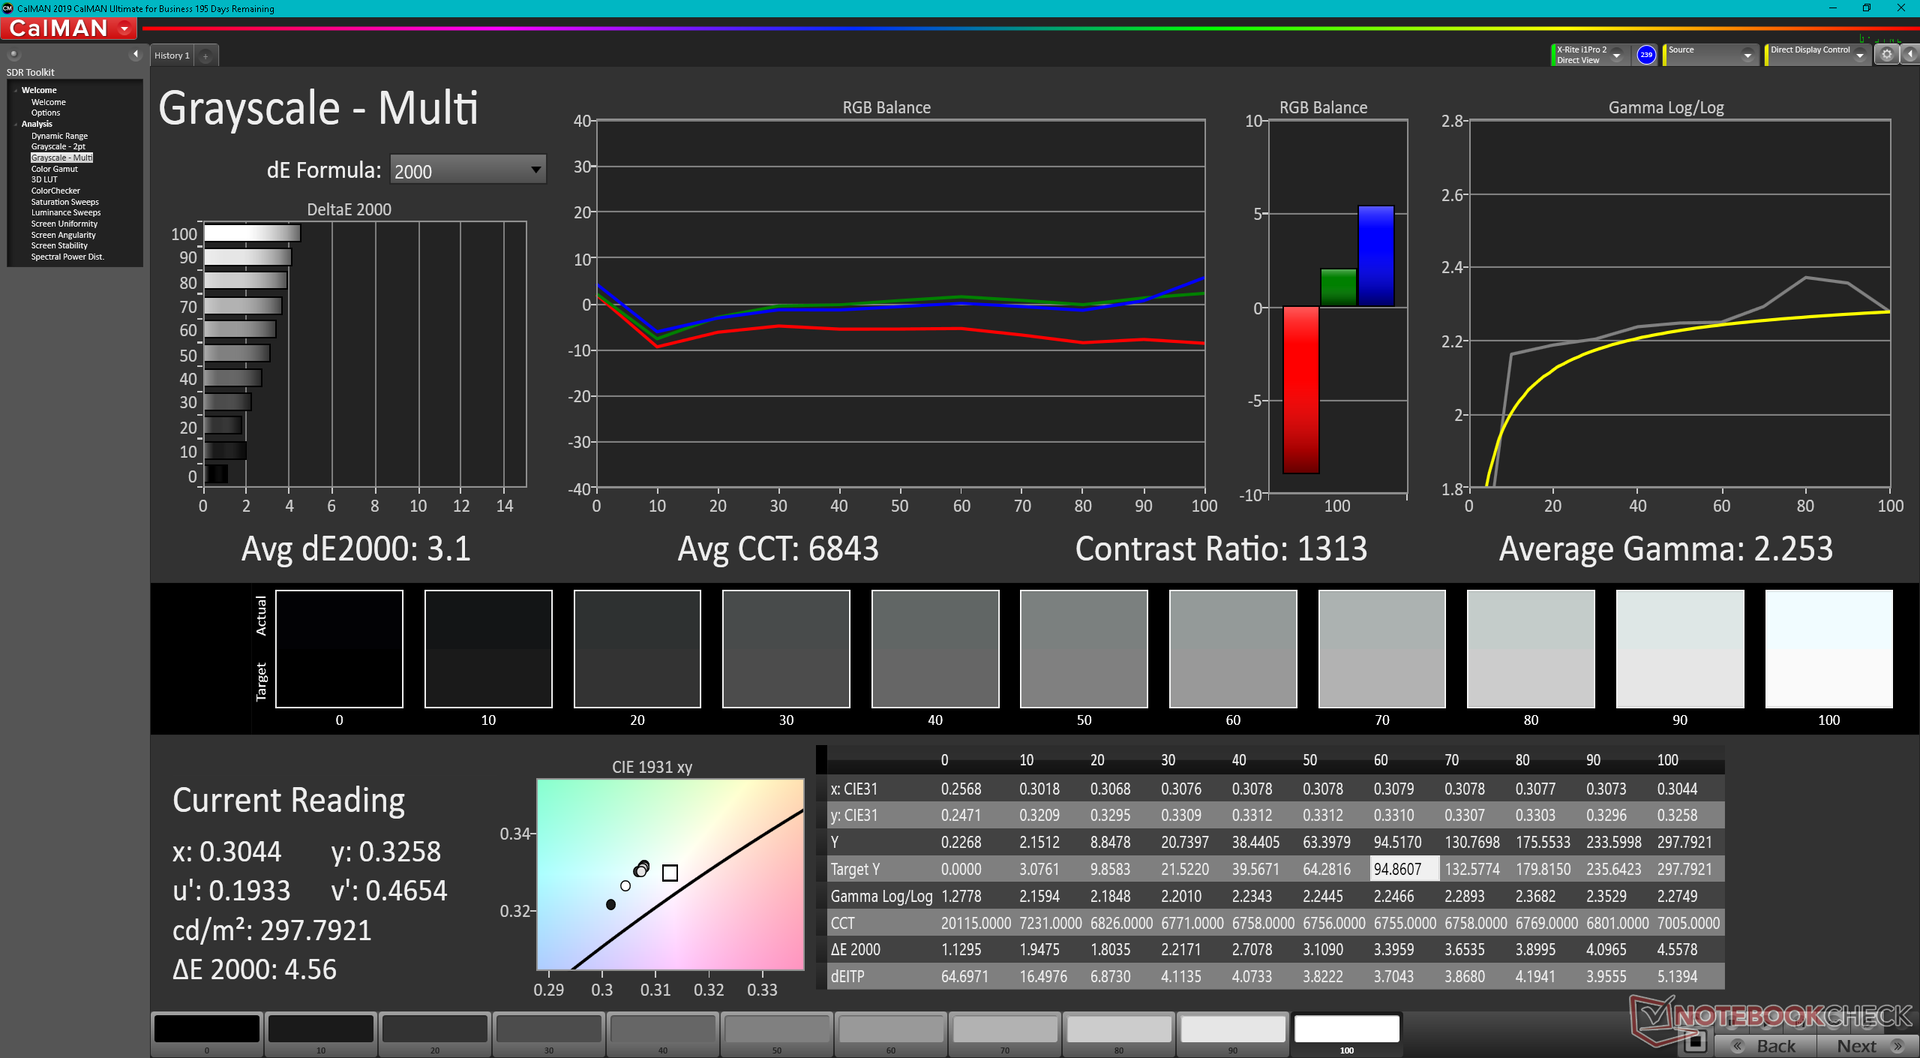
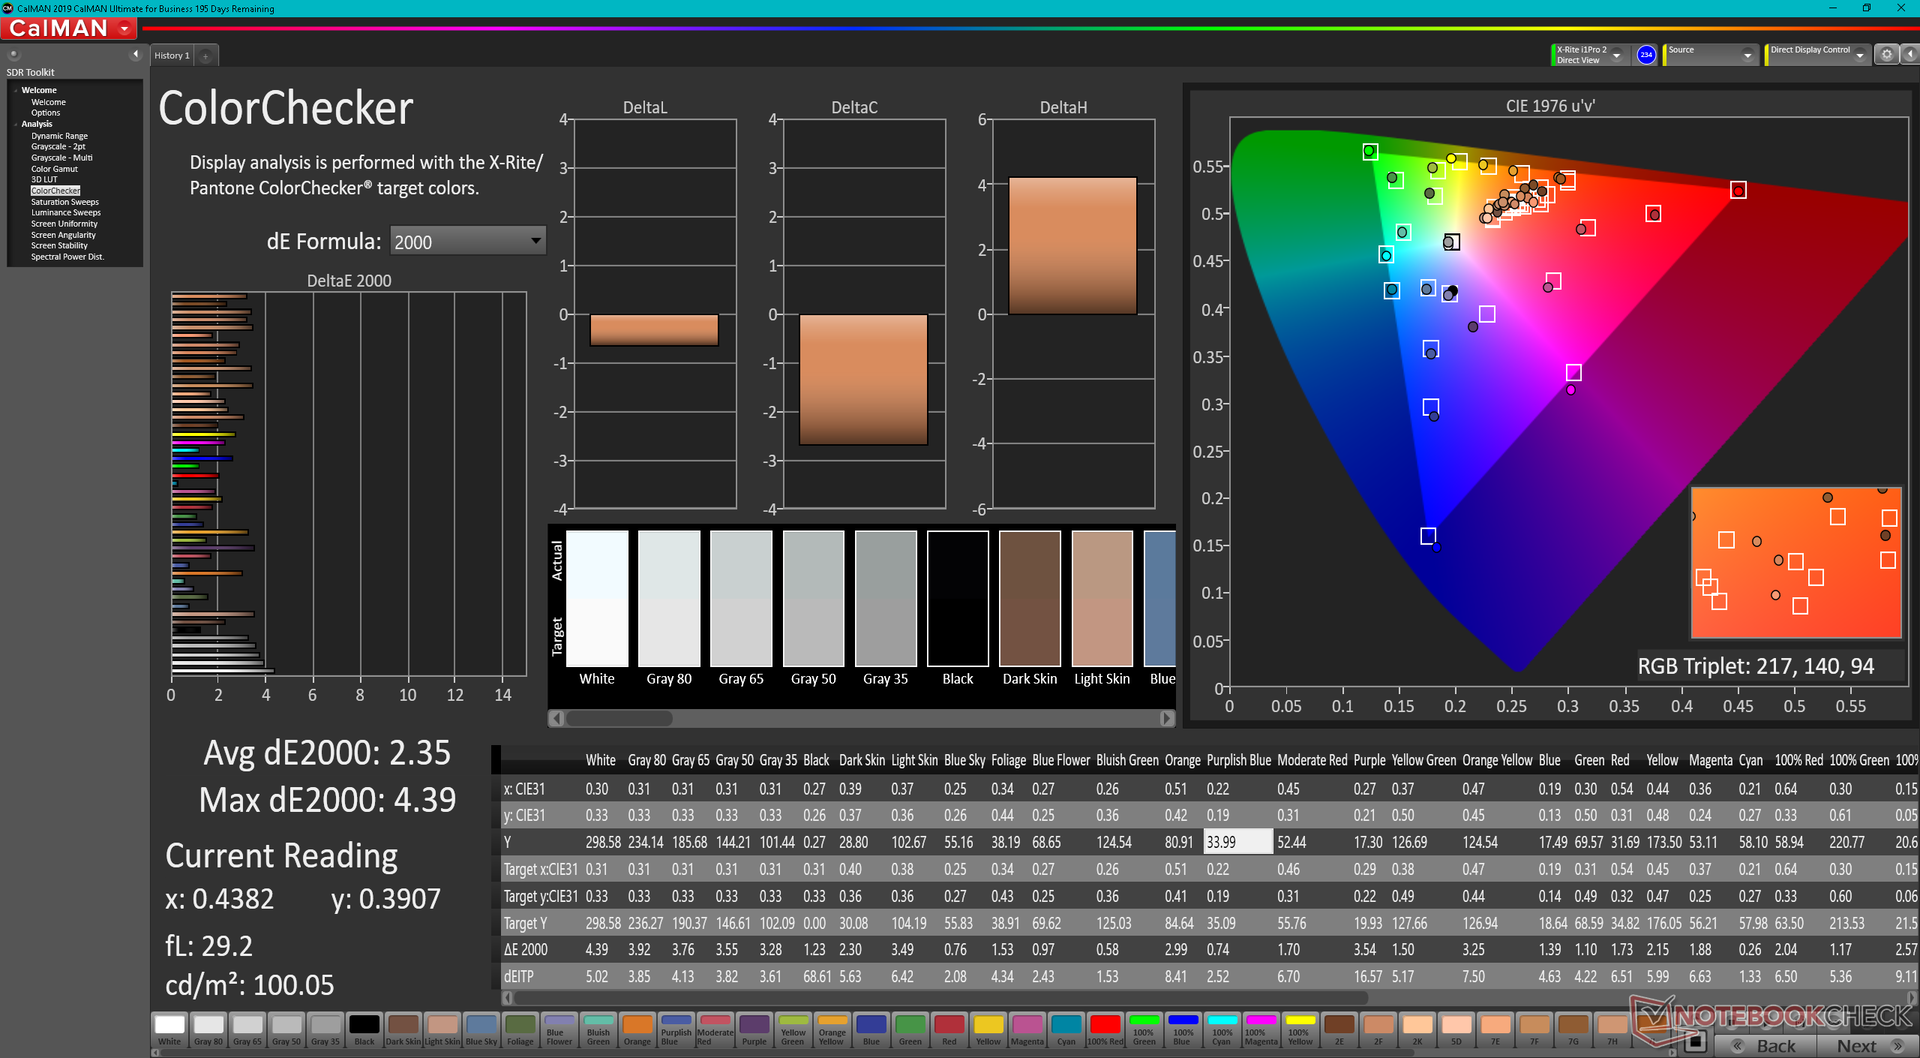
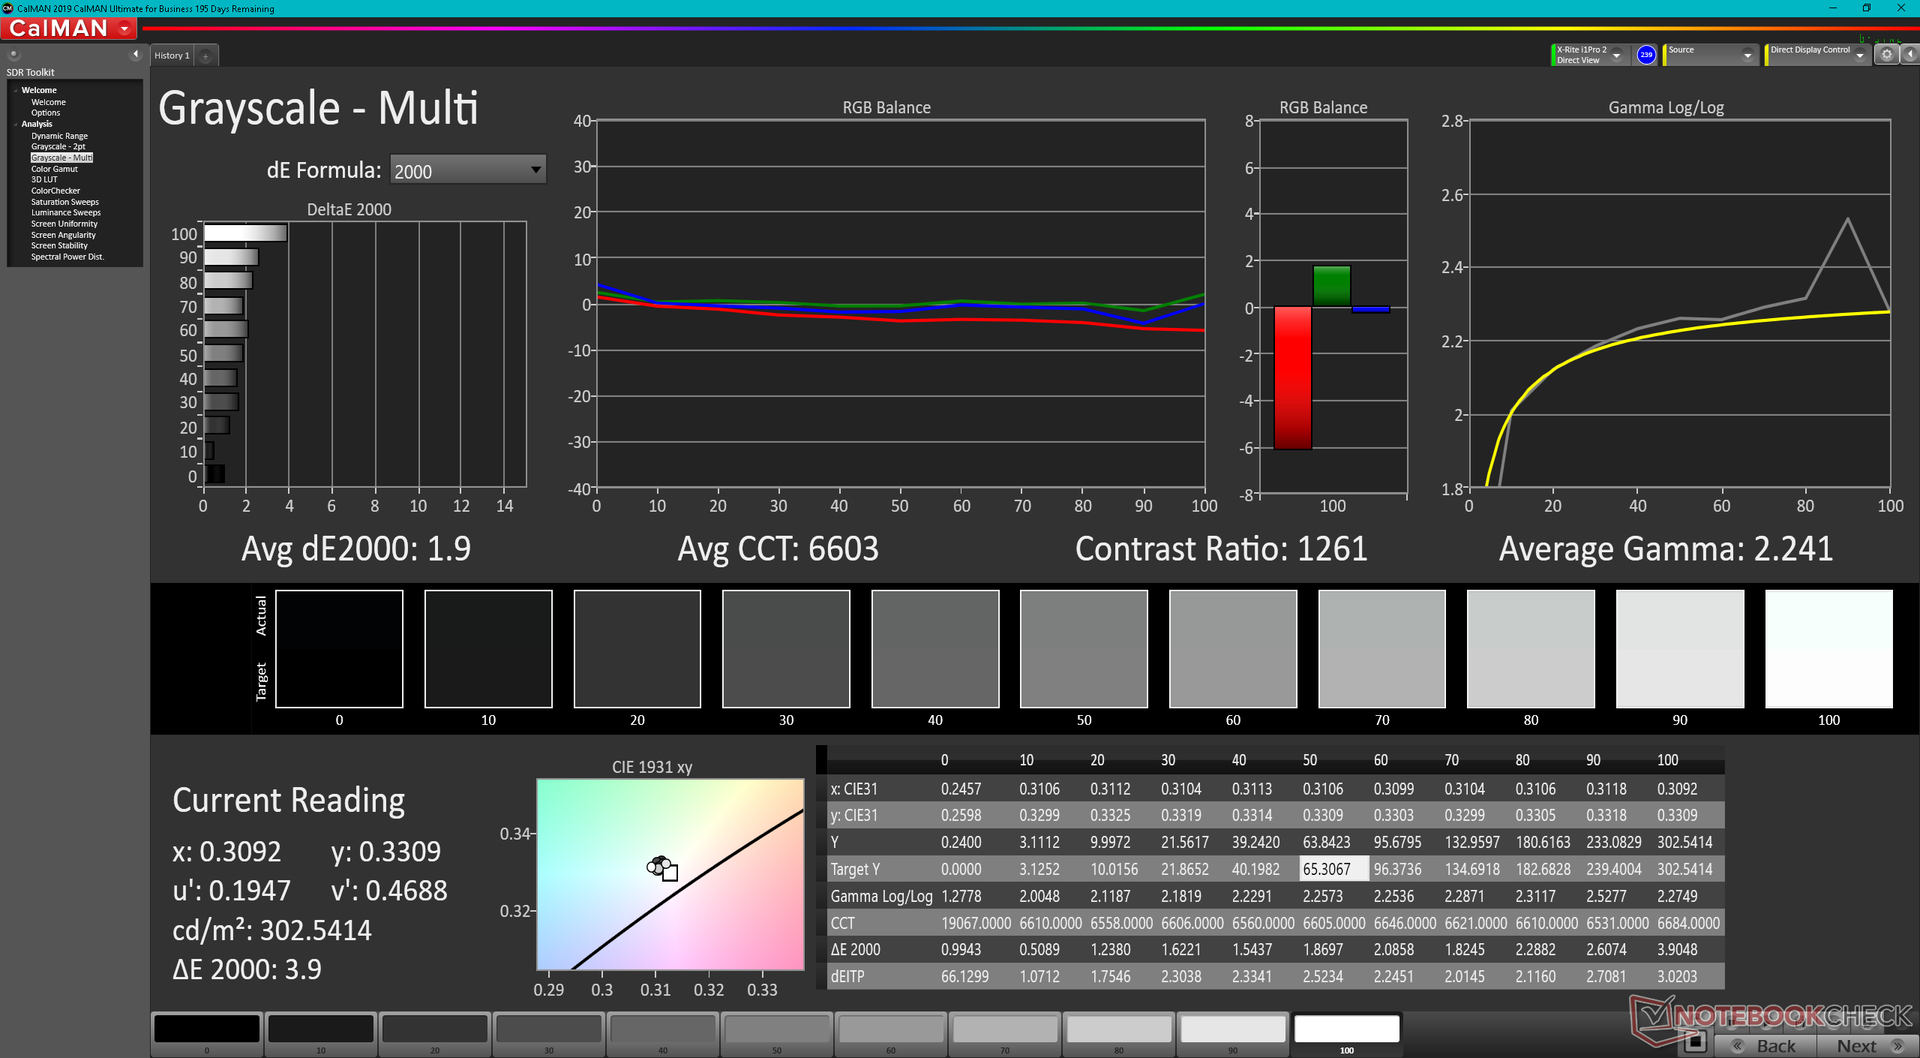
La pantalla está decentemente calibrada desde el principio, con valores medios de escala de grises y DeltaE de ColorChecker de sólo 3,1 y 2,35, respectivamente. Podemos mejorar el DeltaE aún más con nuestro colorímetro X-Rite, como muestran nuestras capturas de pantalla a continuación.

Tiempos de respuesta del display
| ↔ Tiempo de respuesta de Negro a Blanco | ||
|---|---|---|
| 10.4 ms ... subida ↗ y bajada ↘ combinada | ↗ 5.2 ms subida | 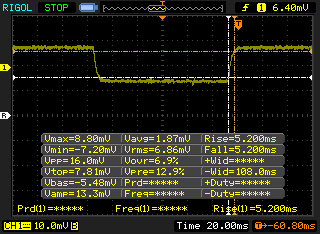 |
| ↘ 5.2 ms bajada | ||
| La pantalla mostró buenos tiempos de respuesta en nuestros tests pero podría ser demasiado lenta para los jugones competitivos. En comparación, todos los dispositivos de prueba van de ##min### (mínimo) a 240 (máximo) ms. » 28 % de todos los dispositivos son mejores. Esto quiere decir que el tiempo de respuesta medido es mejor que la media (19.8 ms) de todos los dispositivos testados. | ||
| ↔ Tiempo de respuesta 50% Gris a 80% Gris | ||
| 12.8 ms ... subida ↗ y bajada ↘ combinada | ↗ 4.8 ms subida | 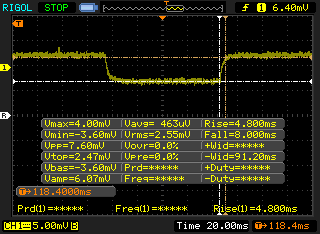 |
| ↘ 8 ms bajada | ||
| La pantalla mostró buenos tiempos de respuesta en nuestros tests pero podría ser demasiado lenta para los jugones competitivos. En comparación, todos los dispositivos de prueba van de ##min### (mínimo) a 636 (máximo) ms. » 26 % de todos los dispositivos son mejores. Esto quiere decir que el tiempo de respuesta medido es mejor que la media (31 ms) de todos los dispositivos testados. | ||
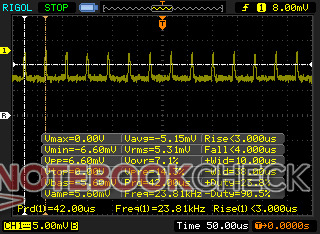
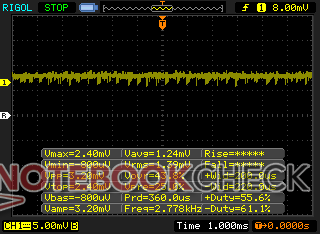
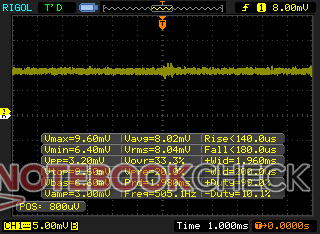
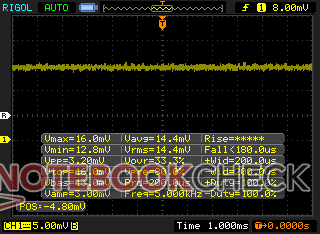
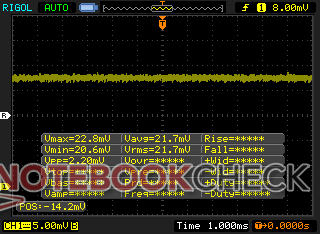
Parpadeo de Pantalla / PWM (Pulse-Width Modulation)
| Parpadeo de Pantalla / PWM detectado | 23810 Hz | ≤ 25 % de brillo | 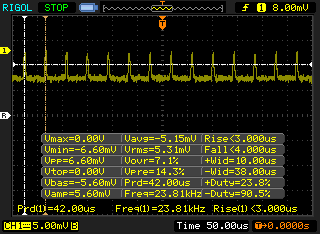 |
La retroiluminación del display parpadea a 23810 Hz (seguramente usa PWM - Pulse-Width Modulation) a un brillo del 25 % e inferior. Sobre este nivel de brillo no debería darse parpadeo / PWM. La frecuencia de 23810 Hz es bastante alta, por lo que la mayoría de gente sensible al parpadeo no debería ver parpadeo o tener fatiga visual. Comparación: 52 % de todos los dispositivos testados no usaron PWM para atenuar el display. Si se usó, medimos una media de 7751 (mínimo: 5 - máxmo: 343500) Hz. | |||

Rendimiento
Condiciones de la prueba
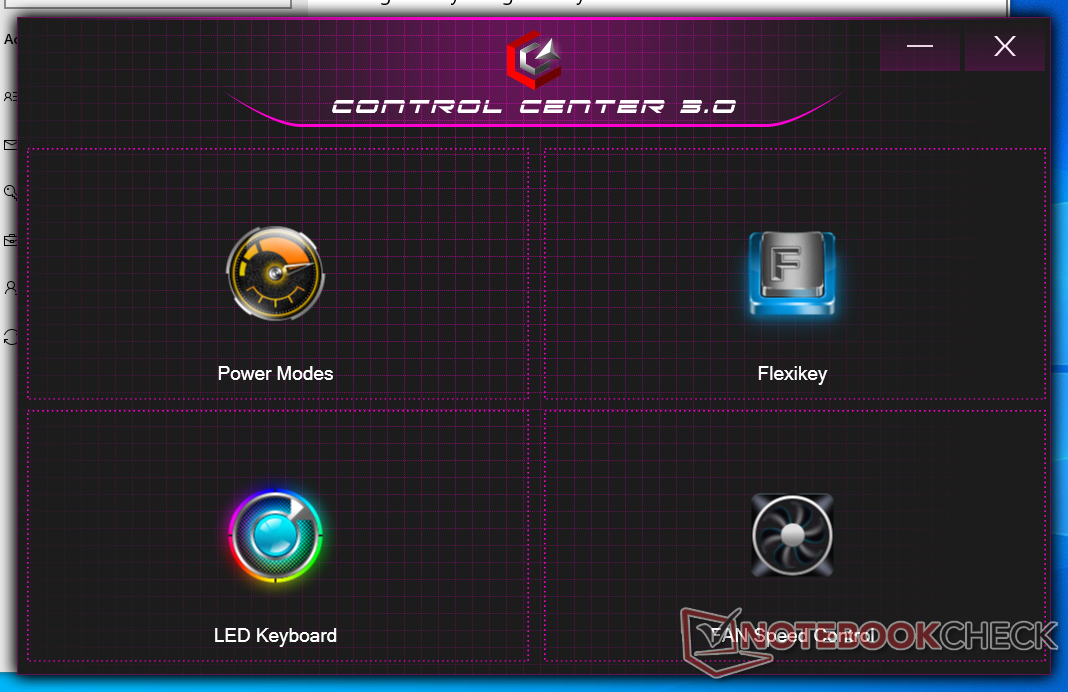
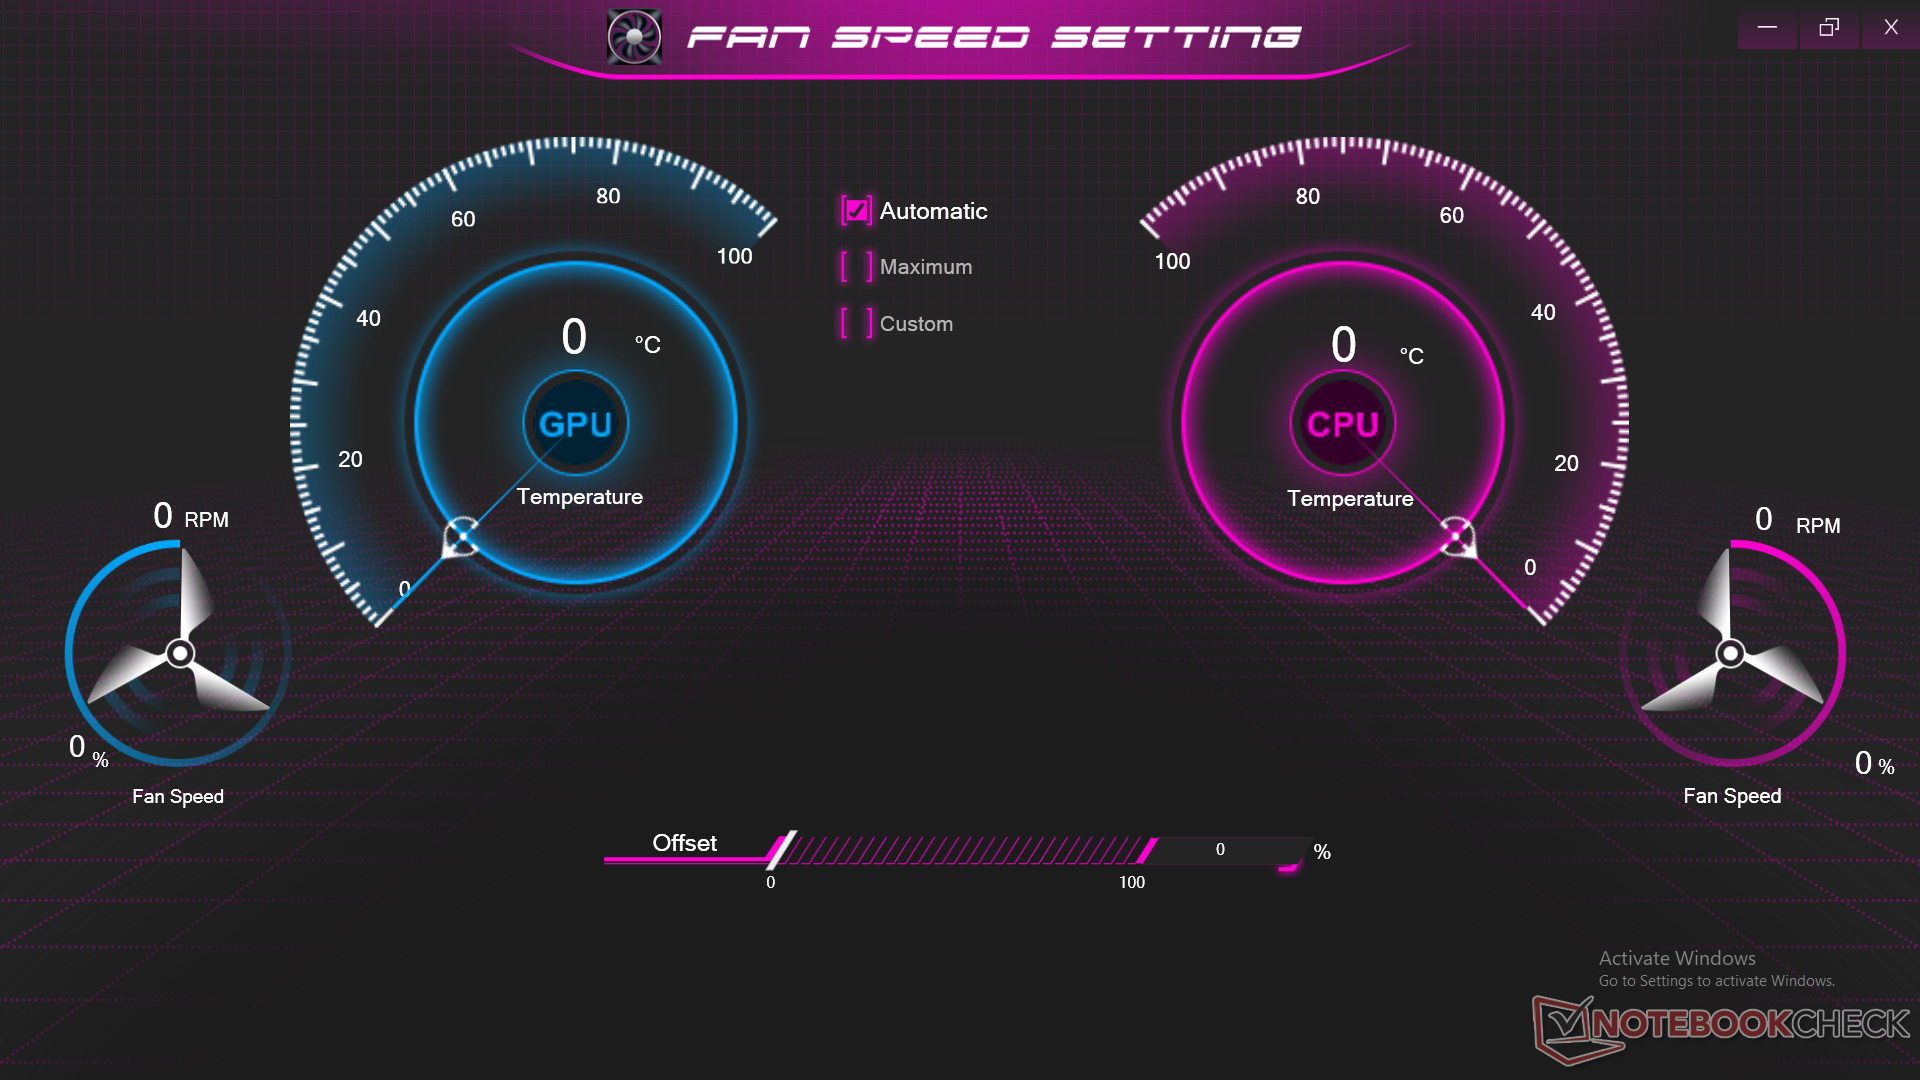
Nuestra unidad fue configurada en el modo de rendimiento a través de Windows y el software del Centro de Control 3.0 antes de ejecutar cualquier punto de referencia de rendimiento a continuación para obtener las puntuaciones más altas posibles sin overclocking del usuario final. Se recomienda que los propietarios se familiaricen con el Centro de Control 3.0, ya que los controles de los ventiladores, los modos de energía y las características de los LEDs y las macros se pueden cambiar aquí.
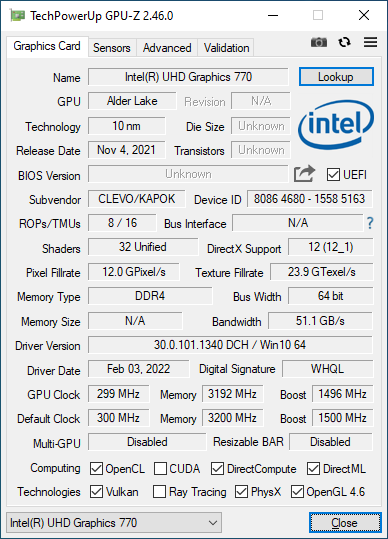
No hay interruptor MUX, por lo que sólo hay soporte para Optimus 1.0. Eurocom dice que el Raptor X15 no fue diseñado con un interruptor MUX en mente.
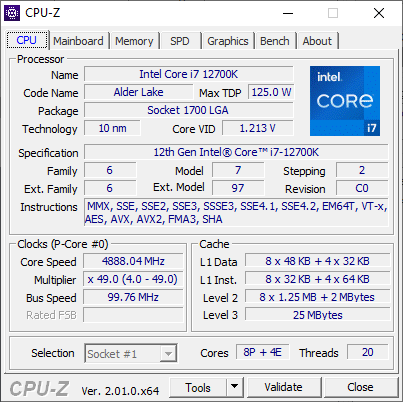
Procesador
Lamentablemente, nuestra unidad presentaba fallos de rendimiento cuando se ejecutaba CineBench R15, lo que nos impedía registrar puntuaciones adecuadas con el benchmark. Eurocom nos ha confirmado que el fallo es reproducible en varias unidades Raptor X15. Afortunadamente, todos los demás benchmarks se ejecutan sin problemas. Cuando se compara con nuestro escritorio de referencia con el mismo Core i7-12700K El i7-12700K en nuestro Eurocom sería entre un 20 y un 25 por ciento más lento en las cargas de trabajo multihilo para un nivel de rendimiento general que es más similar al del Core i7-12700H.
Cinebench R15 Multi Loop
Cinebench R23: Multi Core | Single Core
Cinebench R15: CPU Multi 64Bit | CPU Single 64Bit
Blender: v2.79 BMW27 CPU
7-Zip 18.03: 7z b 4 | 7z b 4 -mmt1
Geekbench 5.5: Multi-Core | Single-Core
HWBOT x265 Benchmark v2.2: 4k Preset
LibreOffice : 20 Documents To PDF
R Benchmark 2.5: Overall mean
| Cinebench R20 / CPU (Multi Core) | |
| Intel Core i7-12700K | |
| Medio Intel Core i7-12700K (6953 - 8648, n=2) | |
| Eurocom Raptor X15 | |
| MSI Vector GP76 12UGS-434 | |
| Schenker XMG Apex 15 NH57AF1 | |
| MSI Raider GE66 12UHS | |
| Razer Blade 15 2022 | |
| Razer Blade 14 Ryzen 9 6900HX | |
| Gigabyte A5 X1 | |
| Eurocom Nightsky ARX315 | |
| Schenker XMG Apex 15 NH57E PS | |
| Eurocom RX315 NH57AF1 | |
| Aorus 15P XC | |
| Lenovo Legion C7 15IMH05 82EH0030GE | |
| Cinebench R20 / CPU (Single Core) | |
| Eurocom Raptor X15 | |
| Medio Intel Core i7-12700K (731 - 740, n=2) | |
| Intel Core i7-12700K | |
| MSI Raider GE66 12UHS | |
| Razer Blade 15 2022 | |
| MSI Vector GP76 12UGS-434 | |
| Razer Blade 14 Ryzen 9 6900HX | |
| Eurocom Nightsky ARX315 | |
| Gigabyte A5 X1 | |
| Eurocom RX315 NH57AF1 | |
| Schenker XMG Apex 15 NH57E PS | |
| Schenker XMG Apex 15 NH57AF1 | |
| Lenovo Legion C7 15IMH05 82EH0030GE | |
| Aorus 15P XC | |
| Cinebench R23 / Multi Core | |
| Intel Core i7-12700K | |
| Medio Intel Core i7-12700K (17003 - 22565, n=2) | |
| MSI Vector GP76 12UGS-434 | |
| Eurocom Raptor X15 | |
| MSI Raider GE66 12UHS | |
| Razer Blade 15 2022 | |
| Razer Blade 14 Ryzen 9 6900HX | |
| Gigabyte A5 X1 | |
| Eurocom Nightsky ARX315 | |
| Schenker XMG Apex 15 NH57E PS | |
| Eurocom RX315 NH57AF1 | |
| Aorus 15P XC | |
| Lenovo Legion C7 15IMH05 82EH0030GE | |
| Cinebench R23 / Single Core | |
| Intel Core i7-12700K | |
| MSI Raider GE66 12UHS | |
| Medio Intel Core i7-12700K (1806 - 1895, n=2) | |
| Eurocom Raptor X15 | |
| Razer Blade 15 2022 | |
| MSI Vector GP76 12UGS-434 | |
| Eurocom Nightsky ARX315 | |
| Razer Blade 14 Ryzen 9 6900HX | |
| Eurocom RX315 NH57AF1 | |
| Gigabyte A5 X1 | |
| Schenker XMG Apex 15 NH57E PS | |
| Lenovo Legion C7 15IMH05 82EH0030GE | |
| Aorus 15P XC | |
| Cinebench R15 / CPU Multi 64Bit | |
| Intel Core i7-12700K | |
| Medio Intel Core i7-12700K (n=1) | |
| MSI Vector GP76 12UGS-434 | |
| Schenker XMG Apex 15 NH57AF1 | |
| MSI Raider GE66 12UHS | |
| Razer Blade 14 Ryzen 9 6900HX | |
| Eurocom Nightsky ARX315 | |
| Razer Blade 15 2022 | |
| Gigabyte A5 X1 | |
| Schenker XMG Apex 15 NH57E PS | |
| Eurocom RX315 NH57AF1 | |
| Aorus 15P XC | |
| Lenovo Legion C7 15IMH05 82EH0030GE | |
| Cinebench R15 / CPU Single 64Bit | |
| Intel Core i7-12700K | |
| Medio Intel Core i7-12700K (n=1) | |
| MSI Raider GE66 12UHS | |
| Razer Blade 15 2022 | |
| MSI Vector GP76 12UGS-434 | |
| Eurocom Nightsky ARX315 | |
| Razer Blade 14 Ryzen 9 6900HX | |
| Gigabyte A5 X1 | |
| Schenker XMG Apex 15 NH57E PS | |
| Eurocom RX315 NH57AF1 | |
| Lenovo Legion C7 15IMH05 82EH0030GE | |
| Aorus 15P XC | |
| Schenker XMG Apex 15 NH57AF1 | |
| Blender / v2.79 BMW27 CPU | |
| Lenovo Legion C7 15IMH05 82EH0030GE | |
| Aorus 15P XC | |
| Eurocom RX315 NH57AF1 | |
| Schenker XMG Apex 15 NH57E PS | |
| Gigabyte A5 X1 | |
| Razer Blade 15 2022 | |
| Razer Blade 14 Ryzen 9 6900HX | |
| Eurocom Nightsky ARX315 | |
| MSI Vector GP76 12UGS-434 | |
| MSI Raider GE66 12UHS | |
| Eurocom Raptor X15 | |
| Schenker XMG Apex 15 NH57AF1 | |
| Medio Intel Core i7-12700K (152.3 - 193.9, n=2) | |
| Intel Core i7-12700K | |
| 7-Zip 18.03 / 7z b 4 -mmt1 | |
| Eurocom Nightsky ARX315 | |
| Eurocom Raptor X15 | |
| Medio Intel Core i7-12700K (6117 - 6422, n=2) | |
| Intel Core i7-12700K | |
| MSI Raider GE66 12UHS | |
| Razer Blade 14 Ryzen 9 6900HX | |
| Razer Blade 15 2022 | |
| Gigabyte A5 X1 | |
| Schenker XMG Apex 15 NH57E PS | |
| MSI Vector GP76 12UGS-434 | |
| Lenovo Legion C7 15IMH05 82EH0030GE | |
| Eurocom RX315 NH57AF1 | |
| Aorus 15P XC | |
| Schenker XMG Apex 15 NH57AF1 | |
| Geekbench 5.5 / Multi-Core | |
| Intel Core i7-12700K | |
| Medio Intel Core i7-12700K (12475 - 15557, n=2) | |
| MSI Raider GE66 12UHS | |
| Eurocom Raptor X15 | |
| Razer Blade 15 2022 | |
| MSI Vector GP76 12UGS-434 | |
| Schenker XMG Apex 15 NH57AF1 | |
| Eurocom Nightsky ARX315 | |
| Razer Blade 14 Ryzen 9 6900HX | |
| Eurocom RX315 NH57AF1 | |
| Gigabyte A5 X1 | |
| Schenker XMG Apex 15 NH57E PS | |
| Lenovo Legion C7 15IMH05 82EH0030GE | |
| Aorus 15P XC | |
| Geekbench 5.5 / Single-Core | |
| Eurocom Raptor X15 | |
| Medio Intel Core i7-12700K (1890 - 1933, n=2) | |
| Intel Core i7-12700K | |
| MSI Raider GE66 12UHS | |
| MSI Vector GP76 12UGS-434 | |
| Razer Blade 15 2022 | |
| Eurocom Nightsky ARX315 | |
| Razer Blade 14 Ryzen 9 6900HX | |
| Eurocom RX315 NH57AF1 | |
| Gigabyte A5 X1 | |
| Schenker XMG Apex 15 NH57E PS | |
| Lenovo Legion C7 15IMH05 82EH0030GE | |
| Aorus 15P XC | |
| Schenker XMG Apex 15 NH57AF1 | |
| HWBOT x265 Benchmark v2.2 / 4k Preset | |
| Intel Core i7-12700K | |
| Medio Intel Core i7-12700K (14.9 - 26.1, n=2) | |
| MSI Vector GP76 12UGS-434 | |
| Schenker XMG Apex 15 NH57AF1 | |
| MSI Raider GE66 12UHS | |
| Razer Blade 14 Ryzen 9 6900HX | |
| Eurocom Nightsky ARX315 | |
| Razer Blade 15 2022 | |
| Gigabyte A5 X1 | |
| Schenker XMG Apex 15 NH57E PS | |
| Eurocom RX315 NH57AF1 | |
| Eurocom Raptor X15 | |
| Aorus 15P XC | |
| Lenovo Legion C7 15IMH05 82EH0030GE | |
| LibreOffice / 20 Documents To PDF | |
| Gigabyte A5 X1 | |
| Schenker XMG Apex 15 NH57AF1 | |
| Lenovo Legion C7 15IMH05 82EH0030GE | |
| Schenker XMG Apex 15 NH57E PS | |
| Aorus 15P XC | |
| Razer Blade 15 2022 | |
| Razer Blade 14 Ryzen 9 6900HX | |
| Eurocom RX315 NH57AF1 | |
| Eurocom Nightsky ARX315 | |
| MSI Vector GP76 12UGS-434 | |
| Intel Core i7-12700K | |
| Medio Intel Core i7-12700K (37.8 - 39.8, n=2) | |
| Eurocom Raptor X15 | |
| MSI Raider GE66 12UHS | |
| R Benchmark 2.5 / Overall mean | |
| Aorus 15P XC | |
| Lenovo Legion C7 15IMH05 82EH0030GE | |
| Eurocom RX315 NH57AF1 | |
| Schenker XMG Apex 15 NH57AF1 | |
| Schenker XMG Apex 15 NH57E PS | |
| Gigabyte A5 X1 | |
| Eurocom Nightsky ARX315 | |
| Razer Blade 14 Ryzen 9 6900HX | |
| Razer Blade 15 2022 | |
| MSI Vector GP76 12UGS-434 | |
| MSI Raider GE66 12UHS | |
| Intel Core i7-12700K | |
| Medio Intel Core i7-12700K (0.412 - 0.423, n=2) | |
| Eurocom Raptor X15 | |
Cinebench R23: Multi Core | Single Core
Cinebench R15: CPU Multi 64Bit | CPU Single 64Bit
Blender: v2.79 BMW27 CPU
7-Zip 18.03: 7z b 4 | 7z b 4 -mmt1
Geekbench 5.5: Multi-Core | Single-Core
HWBOT x265 Benchmark v2.2: 4k Preset
LibreOffice : 20 Documents To PDF
R Benchmark 2.5: Overall mean
* ... más pequeño es mejor
AIDA64: FP32 Ray-Trace | FPU Julia | CPU SHA3 | CPU Queen | FPU SinJulia | FPU Mandel | CPU AES | CPU ZLib | FP64 Ray-Trace | CPU PhotoWorxx
| Performance rating | |
| Gigabyte A5 X1 | |
| Eurocom RX315 NH57AF1 | |
| Asus TUF Gaming A15 FA506QR-AZ061T | |
| MSI Raider GE66 12UHS | |
| Eurocom Raptor X15 | |
| Medio Intel Core i7-12700K | |
| Razer Blade 15 Advanced Model Early 2022 | |
| AIDA64 / FP32 Ray-Trace | |
| Gigabyte A5 X1 | |
| Eurocom RX315 NH57AF1 | |
| Asus TUF Gaming A15 FA506QR-AZ061T | |
| MSI Raider GE66 12UHS | |
| Eurocom Raptor X15 | |
| Medio Intel Core i7-12700K (n=1) | |
| Razer Blade 15 Advanced Model Early 2022 | |
| AIDA64 / FPU Julia | |
| Gigabyte A5 X1 | |
| Asus TUF Gaming A15 FA506QR-AZ061T | |
| Eurocom RX315 NH57AF1 | |
| Eurocom Raptor X15 | |
| Medio Intel Core i7-12700K (n=1) | |
| MSI Raider GE66 12UHS | |
| Razer Blade 15 Advanced Model Early 2022 | |
| AIDA64 / CPU SHA3 | |
| Eurocom RX315 NH57AF1 | |
| Gigabyte A5 X1 | |
| Eurocom Raptor X15 | |
| Medio Intel Core i7-12700K (n=1) | |
| MSI Raider GE66 12UHS | |
| Asus TUF Gaming A15 FA506QR-AZ061T | |
| Razer Blade 15 Advanced Model Early 2022 | |
| AIDA64 / CPU Queen | |
| MSI Raider GE66 12UHS | |
| Gigabyte A5 X1 | |
| Eurocom Raptor X15 | |
| Medio Intel Core i7-12700K (n=1) | |
| Asus TUF Gaming A15 FA506QR-AZ061T | |
| Eurocom RX315 NH57AF1 | |
| Razer Blade 15 Advanced Model Early 2022 | |
| AIDA64 / FPU SinJulia | |
| Gigabyte A5 X1 | |
| Asus TUF Gaming A15 FA506QR-AZ061T | |
| Eurocom Raptor X15 | |
| Medio Intel Core i7-12700K (n=1) | |
| Eurocom RX315 NH57AF1 | |
| MSI Raider GE66 12UHS | |
| Razer Blade 15 Advanced Model Early 2022 | |
| AIDA64 / FPU Mandel | |
| Gigabyte A5 X1 | |
| Eurocom RX315 NH57AF1 | |
| Asus TUF Gaming A15 FA506QR-AZ061T | |
| MSI Raider GE66 12UHS | |
| Eurocom Raptor X15 | |
| Medio Intel Core i7-12700K (n=1) | |
| Razer Blade 15 Advanced Model Early 2022 | |
| AIDA64 / CPU AES | |
| Eurocom RX315 NH57AF1 | |
| Gigabyte A5 X1 | |
| MSI Raider GE66 12UHS | |
| Eurocom Raptor X15 | |
| Medio Intel Core i7-12700K (n=1) | |
| Asus TUF Gaming A15 FA506QR-AZ061T | |
| Razer Blade 15 Advanced Model Early 2022 | |
| AIDA64 / CPU ZLib | |
| Eurocom Raptor X15 | |
| Medio Intel Core i7-12700K (n=1) | |
| MSI Raider GE66 12UHS | |
| Gigabyte A5 X1 | |
| Eurocom RX315 NH57AF1 | |
| Asus TUF Gaming A15 FA506QR-AZ061T | |
| Razer Blade 15 Advanced Model Early 2022 | |
| AIDA64 / FP64 Ray-Trace | |
| Eurocom RX315 NH57AF1 | |
| Gigabyte A5 X1 | |
| Asus TUF Gaming A15 FA506QR-AZ061T | |
| MSI Raider GE66 12UHS | |
| Eurocom Raptor X15 | |
| Medio Intel Core i7-12700K (n=1) | |
| Razer Blade 15 Advanced Model Early 2022 | |
| AIDA64 / CPU PhotoWorxx | |
| MSI Raider GE66 12UHS | |
| Razer Blade 15 Advanced Model Early 2022 | |
| Eurocom Raptor X15 | |
| Medio Intel Core i7-12700K (n=1) | |
| Eurocom RX315 NH57AF1 | |
| Gigabyte A5 X1 | |
| Asus TUF Gaming A15 FA506QR-AZ061T | |
Rendimiento del sistema
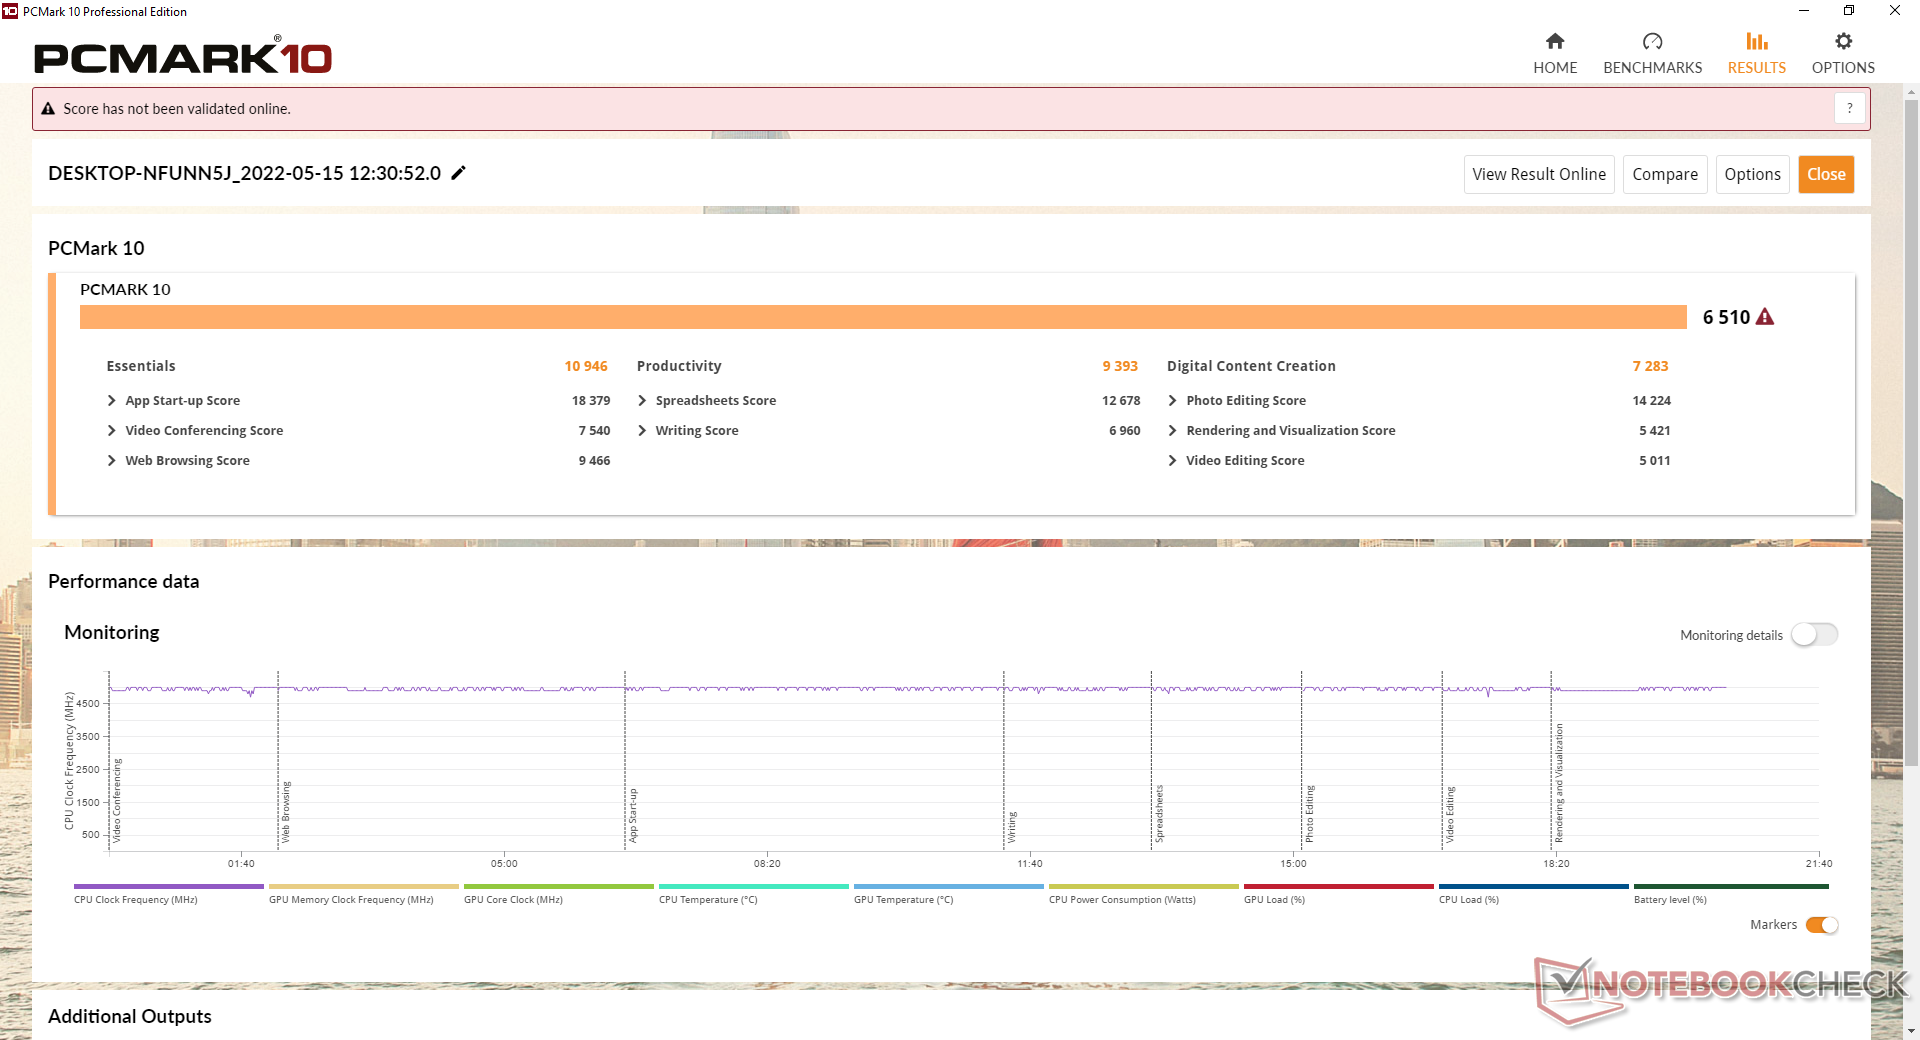
Las puntuaciones de PCMark 10 son comparables a las de los portátiles para juegos de gama alta equipados con CPU móviles "normales", como el MSI GE66 i9-12900HK o el Razer Blade 15 i7-12800H. La puntuación de la subprueba de Creación de Contenido Digital, sin embargo, es más baja de lo esperado.
CrossMark: Overall | Productivity | Creativity | Responsiveness
| PCMark 10 / Score | |
| MSI Raider GE66 12UHS | |
| Razer Blade 15 Advanced Model Early 2022 | |
| Eurocom RX315 NH57AF1 | |
| Asus TUF Gaming A15 FA506QR-AZ061T | |
| Gigabyte A5 X1 | |
| Eurocom Raptor X15 | |
| Medio Intel Core i7-12700K, NVIDIA GeForce RTX 3070 Ti Laptop GPU (n=1) | |
| PCMark 10 / Essentials | |
| MSI Raider GE66 12UHS | |
| Eurocom Raptor X15 | |
| Medio Intel Core i7-12700K, NVIDIA GeForce RTX 3070 Ti Laptop GPU (n=1) | |
| Razer Blade 15 Advanced Model Early 2022 | |
| Eurocom RX315 NH57AF1 | |
| Asus TUF Gaming A15 FA506QR-AZ061T | |
| Gigabyte A5 X1 | |
| PCMark 10 / Productivity | |
| MSI Raider GE66 12UHS | |
| Razer Blade 15 Advanced Model Early 2022 | |
| Asus TUF Gaming A15 FA506QR-AZ061T | |
| Eurocom Raptor X15 | |
| Medio Intel Core i7-12700K, NVIDIA GeForce RTX 3070 Ti Laptop GPU (n=1) | |
| Gigabyte A5 X1 | |
| Eurocom RX315 NH57AF1 | |
| PCMark 10 / Digital Content Creation | |
| MSI Raider GE66 12UHS | |
| Razer Blade 15 Advanced Model Early 2022 | |
| Eurocom RX315 NH57AF1 | |
| Gigabyte A5 X1 | |
| Asus TUF Gaming A15 FA506QR-AZ061T | |
| Eurocom Raptor X15 | |
| Medio Intel Core i7-12700K, NVIDIA GeForce RTX 3070 Ti Laptop GPU (n=1) | |
| CrossMark / Overall | |
| Eurocom Raptor X15 | |
| Medio Intel Core i7-12700K, NVIDIA GeForce RTX 3070 Ti Laptop GPU (n=1) | |
| Razer Blade 15 Advanced Model Early 2022 | |
| CrossMark / Productivity | |
| Eurocom Raptor X15 | |
| Medio Intel Core i7-12700K, NVIDIA GeForce RTX 3070 Ti Laptop GPU (n=1) | |
| Razer Blade 15 Advanced Model Early 2022 | |
| CrossMark / Creativity | |
| Eurocom Raptor X15 | |
| Medio Intel Core i7-12700K, NVIDIA GeForce RTX 3070 Ti Laptop GPU (n=1) | |
| Razer Blade 15 Advanced Model Early 2022 | |
| CrossMark / Responsiveness | |
| Eurocom Raptor X15 | |
| Medio Intel Core i7-12700K, NVIDIA GeForce RTX 3070 Ti Laptop GPU (n=1) | |
| Razer Blade 15 Advanced Model Early 2022 | |
| PCMark 10 Score | 6510 puntos | |
ayuda | ||
| AIDA64 / Memory Copy | |
| MSI Raider GE66 12UHS | |
| Razer Blade 15 Advanced Model Early 2022 | |
| Eurocom Raptor X15 | |
| Medio Intel Core i7-12700K (n=1) | |
| Eurocom RX315 NH57AF1 | |
| Gigabyte A5 X1 | |
| Asus TUF Gaming A15 FA506QR-AZ061T | |
| AIDA64 / Memory Read | |
| MSI Raider GE66 12UHS | |
| Razer Blade 15 Advanced Model Early 2022 | |
| Eurocom Raptor X15 | |
| Medio Intel Core i7-12700K (n=1) | |
| Eurocom RX315 NH57AF1 | |
| Gigabyte A5 X1 | |
| Asus TUF Gaming A15 FA506QR-AZ061T | |
| AIDA64 / Memory Write | |
| Razer Blade 15 Advanced Model Early 2022 | |
| MSI Raider GE66 12UHS | |
| Eurocom Raptor X15 | |
| Medio Intel Core i7-12700K (n=1) | |
| Eurocom RX315 NH57AF1 | |
| Gigabyte A5 X1 | |
| Asus TUF Gaming A15 FA506QR-AZ061T | |
| AIDA64 / Memory Latency | |
| Razer Blade 15 Advanced Model Early 2022 | |
| MSI Raider GE66 12UHS | |
| Eurocom RX315 NH57AF1 | |
| Asus TUF Gaming A15 FA506QR-AZ061T | |
| Gigabyte A5 X1 | |
| Eurocom Raptor X15 | |
| Medio Intel Core i7-12700K (n=1) | |
* ... más pequeño es mejor
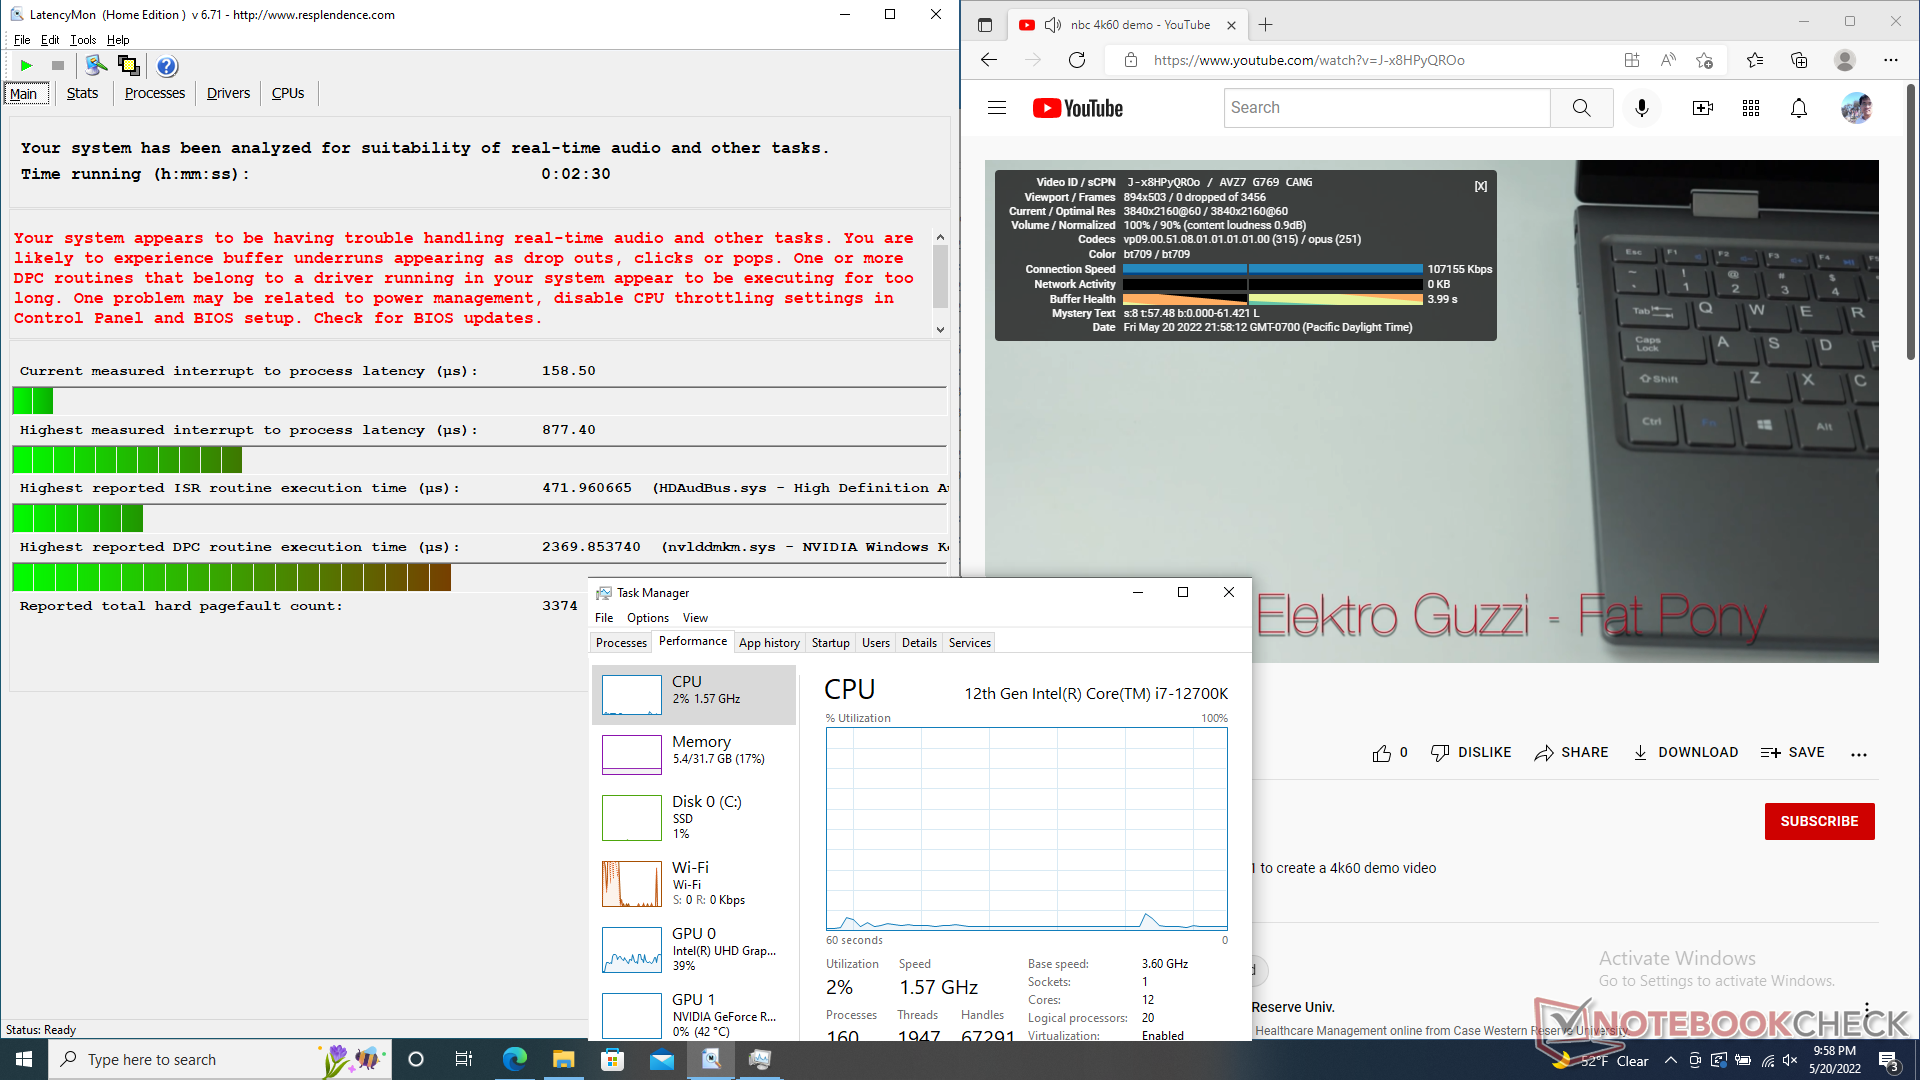
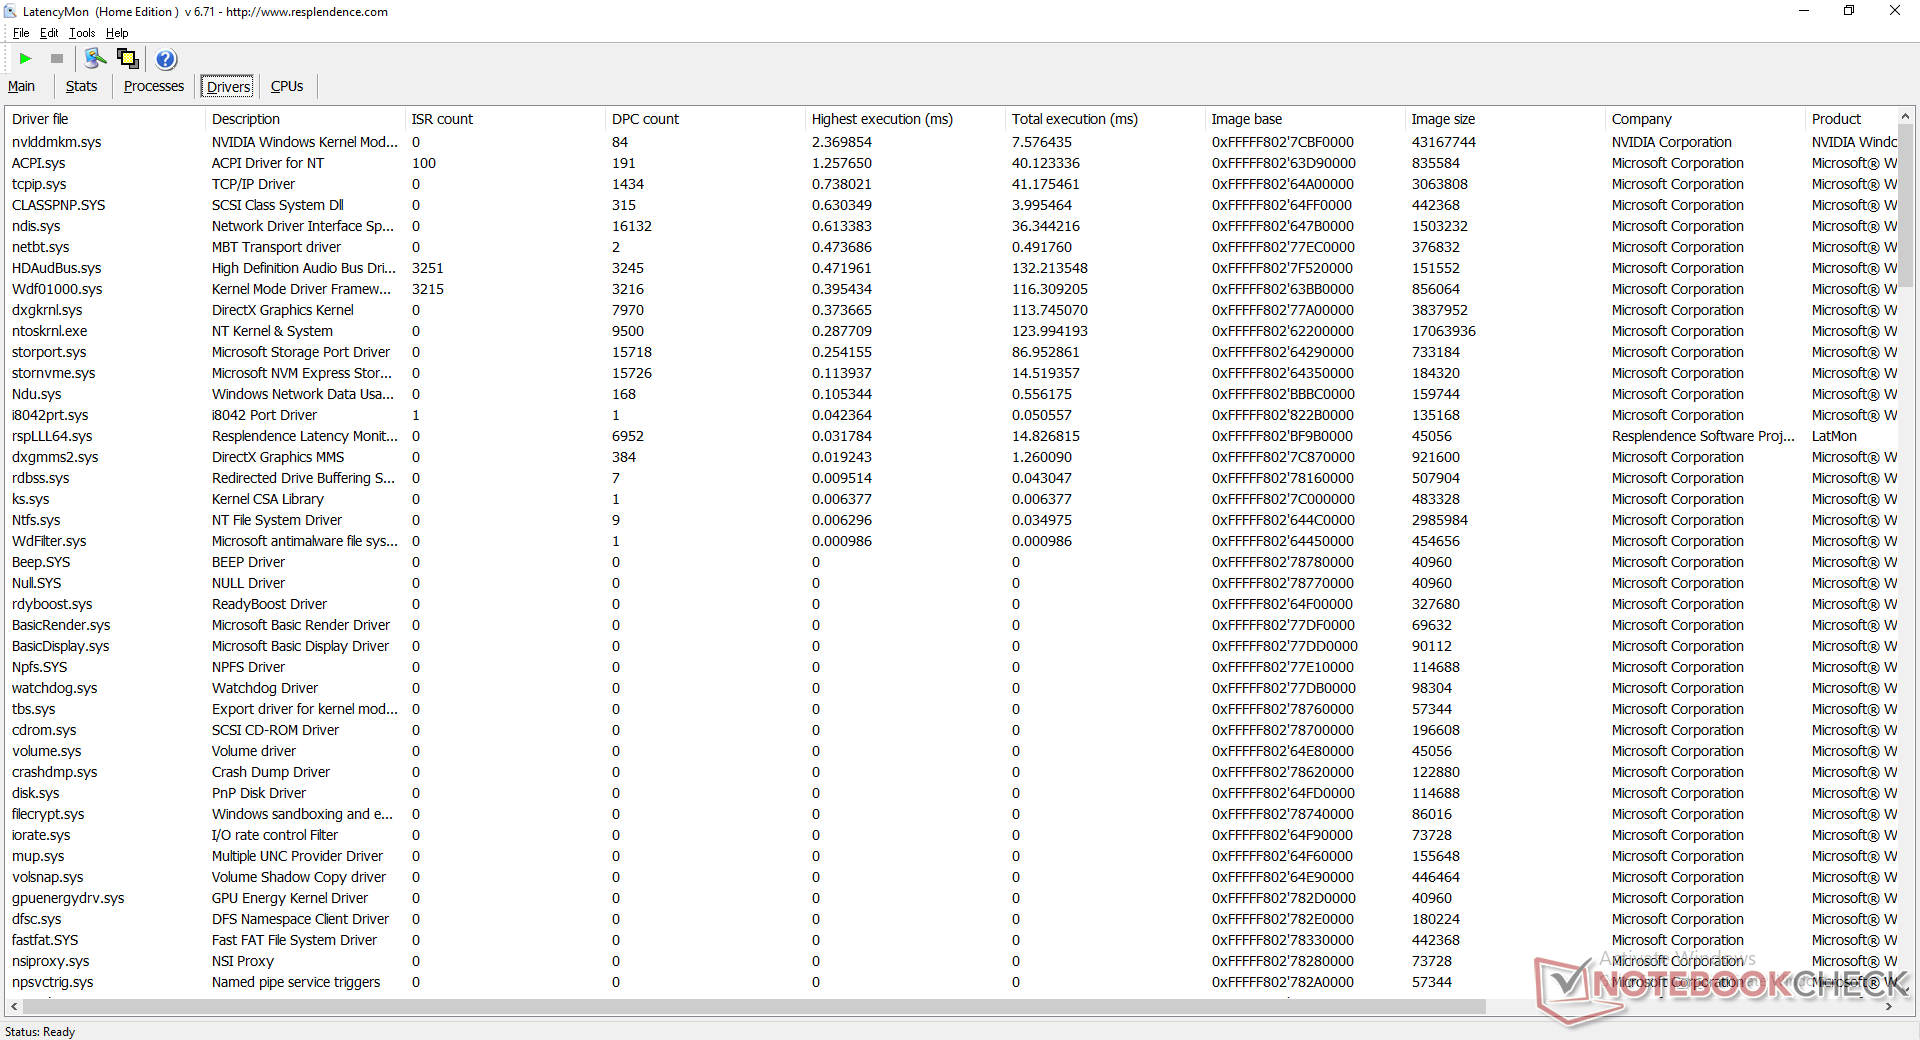
Latencia del CPD
LatencyMon revela problemas de CPD al abrir varias pestañas del navegador de nuestra página web. la reproducción de vídeo 4K a 60 FPS es, por lo demás, perfecta y sin pérdida de fotogramas cuando se ajusta a la GPU integrada.
| DPC Latencies / LatencyMon - interrupt to process latency (max), Web, Youtube, Prime95 | |
| MSI Raider GE66 12UHS | |
| Razer Blade 15 Advanced Model Early 2022 | |
| Eurocom RX315 NH57AF1 | |
| Asus TUF Gaming A15 FA506QR-AZ061T | |
| Eurocom Raptor X15 | |
| Gigabyte A5 X1 | |
* ... más pequeño es mejor
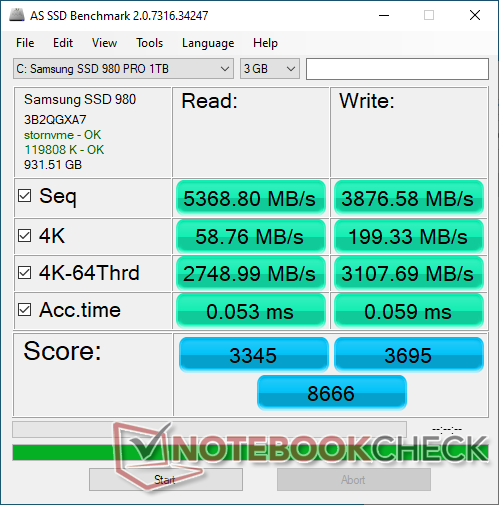
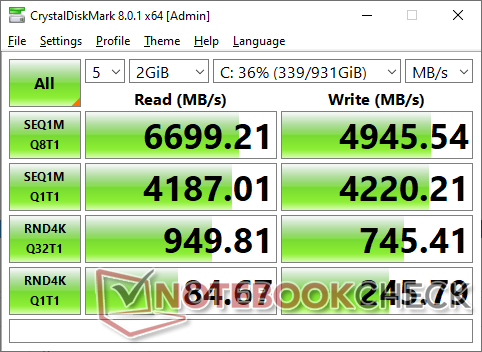
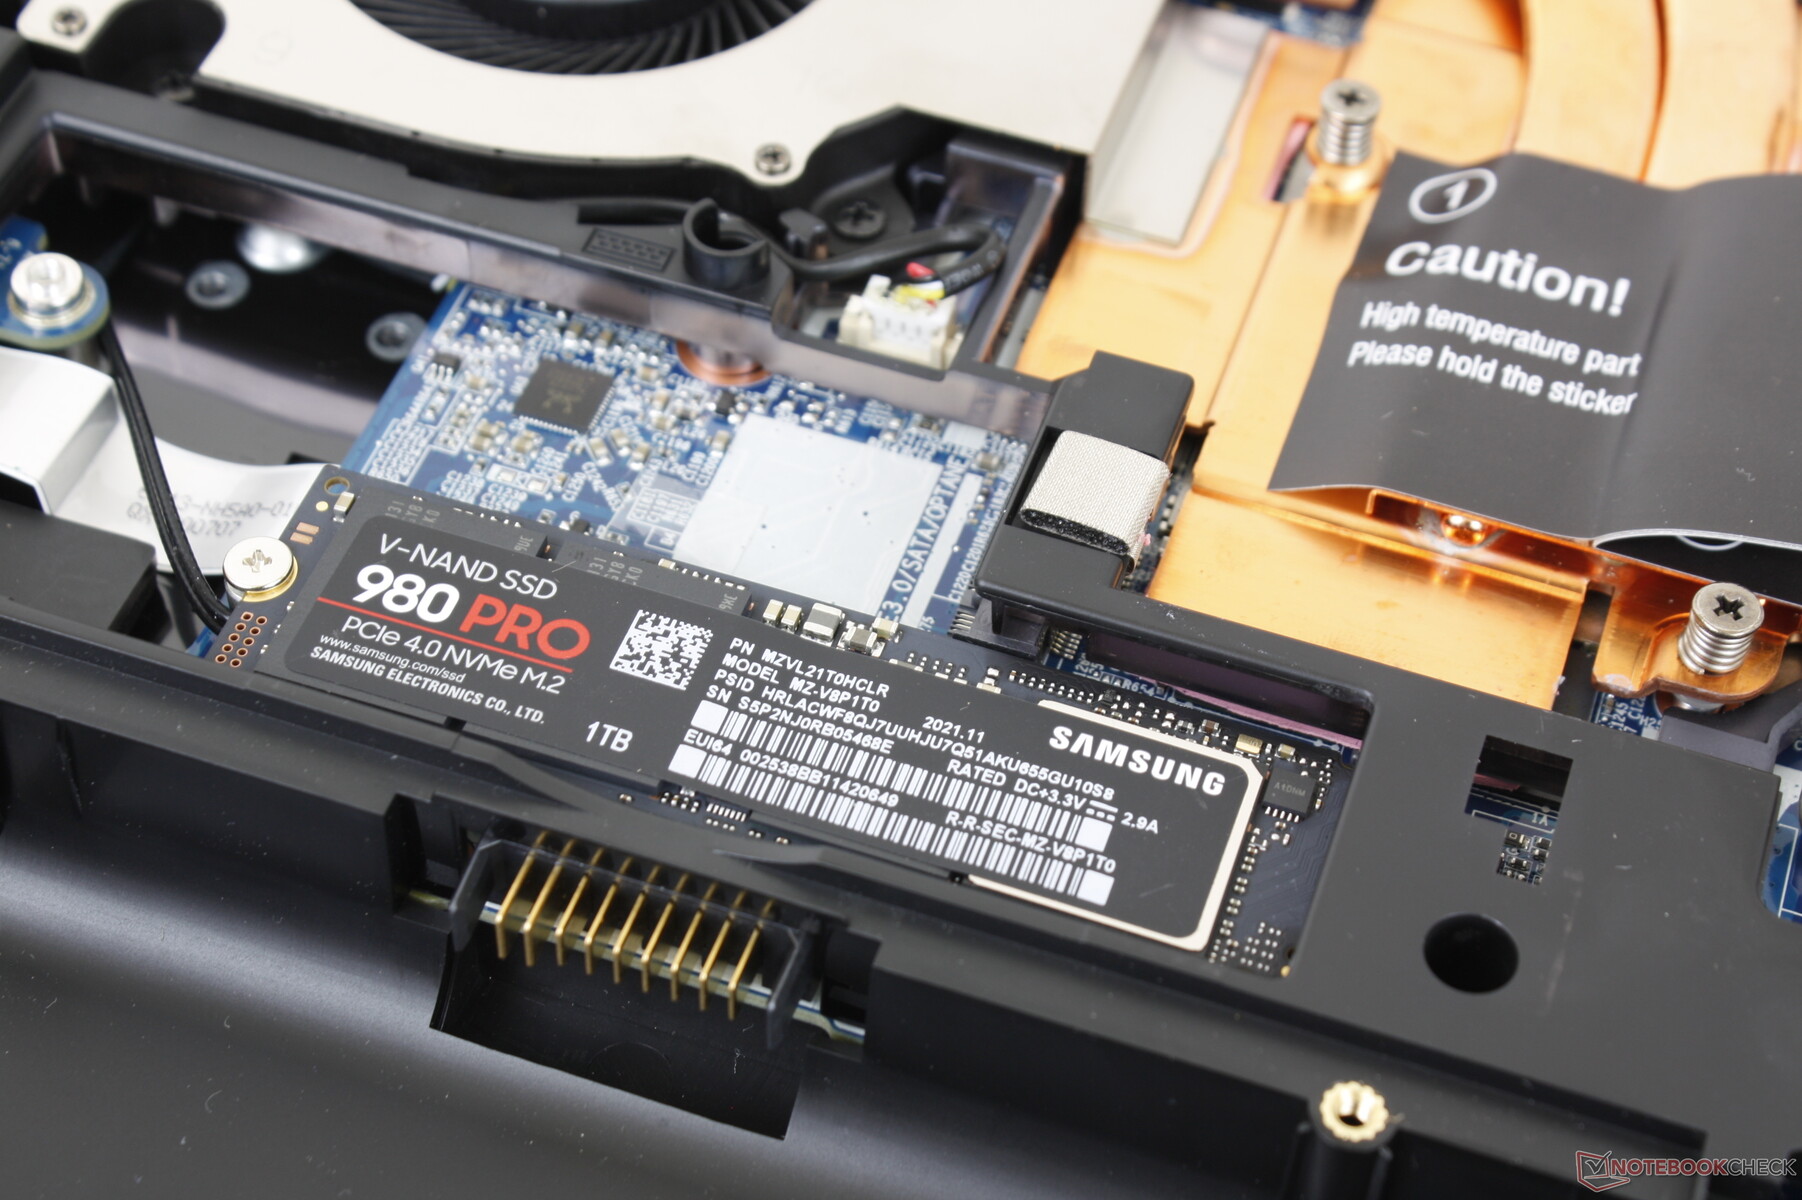
Dispositivos de almacenamiento
La sostenibilidad del rendimiento es pobre cuando se instala una unidad PCIe4. Como muestra nuestro gráfico siguiente, elSamsung SSD 980 Pro tiene problemas para mantener su tasa de transferencia máxima incluso durante periodos cortos. El rendimiento se ralentiza pronto debido a las limitaciones térmicas derivadas de la falta de un disipador de calor incluido.

| Drive Performance rating - Percent | |
| MSI Raider GE66 12UHS | |
| Razer Blade 15 Advanced Model Early 2022 | |
| Eurocom Raptor X15 | |
| Eurocom RX315 NH57AF1 | |
| Asus TUF Gaming A15 FA506QR-AZ061T | |
| Gigabyte A5 X1 | |
* ... más pequeño es mejor
Disk Throttling: DiskSpd Read Loop, Queue Depth 8
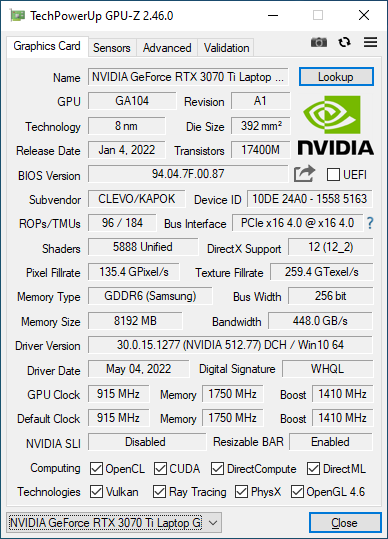
Rendimiento de la GPU
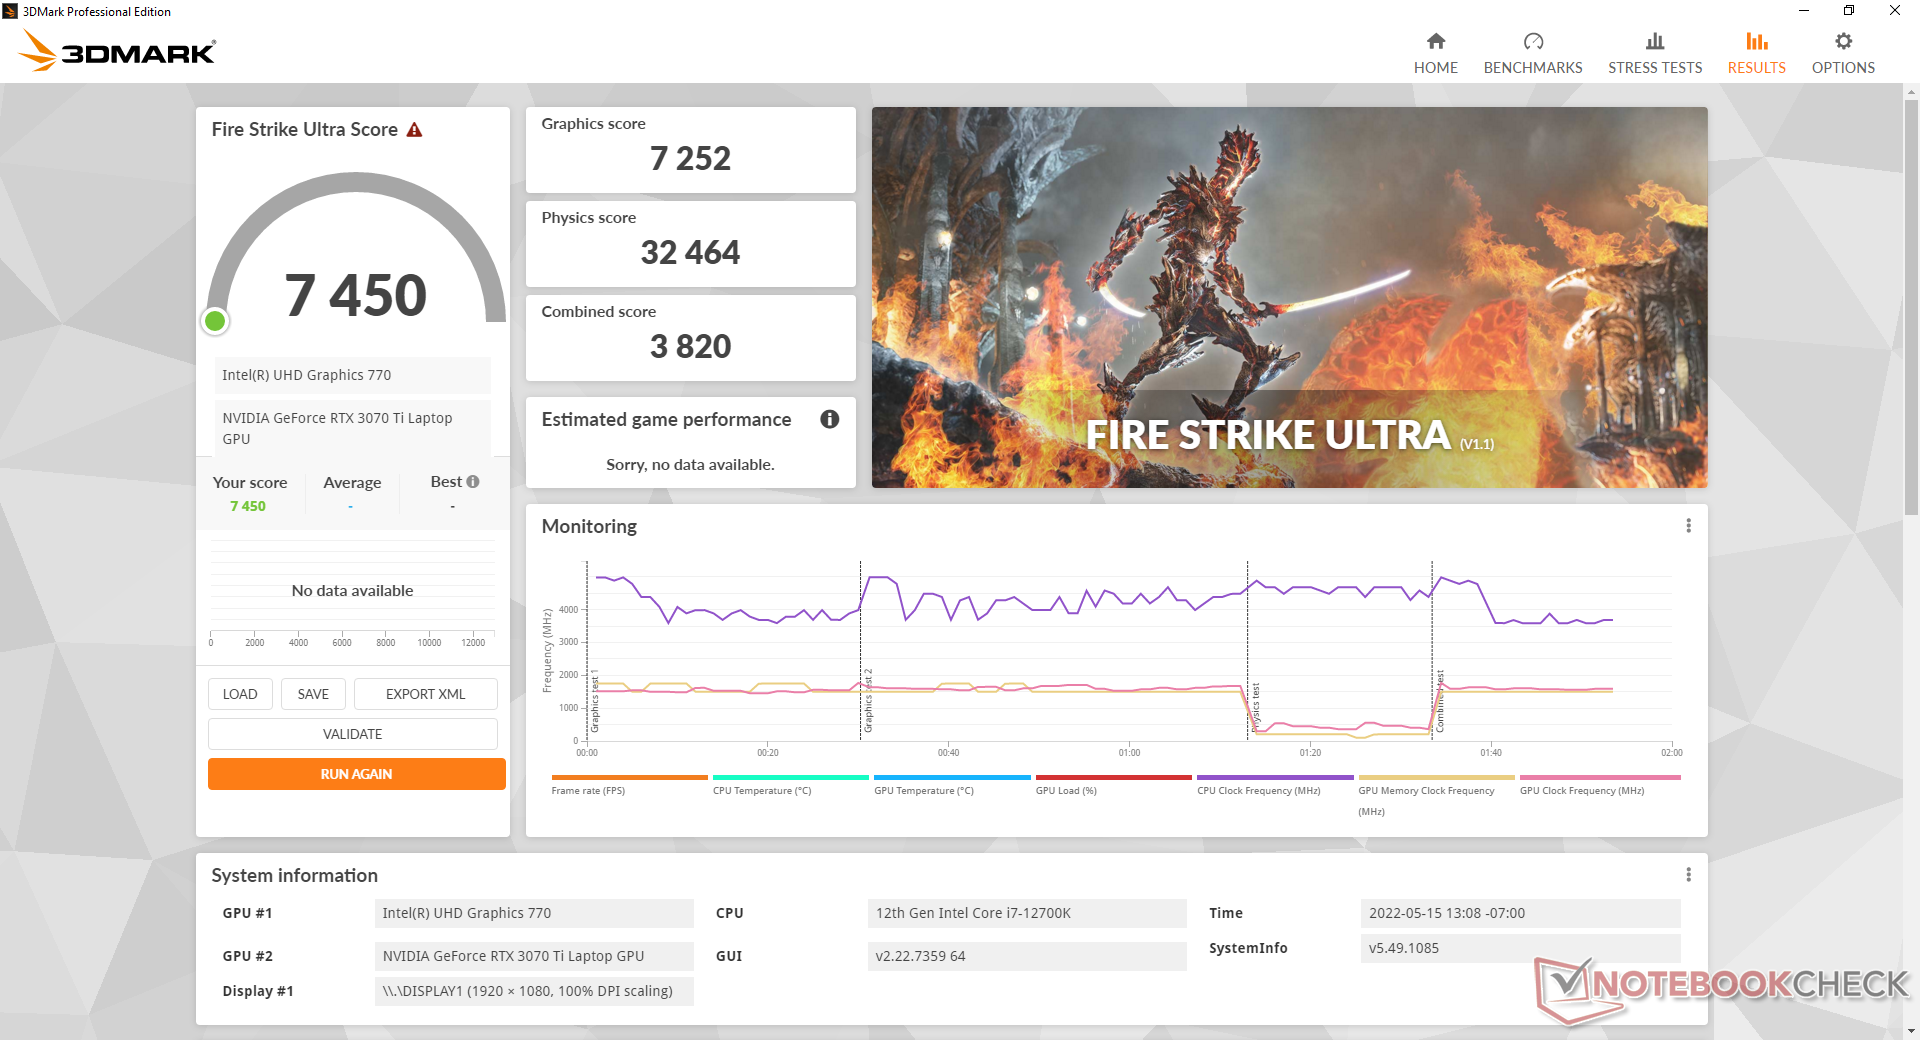
El rendimiento gráfico es excelente, hasta un 10 por ciento más rápido que la media de los portátiles de nuestra base de datos equipados con la misma GeForce RTX 3070 Ti GPU. El chasis relativamente grueso ha permitido un objetivo TGP superior a la media de 140 W en comparación con sólo 105 W o menos como en el MSI GS66. El rendimiento es apenas inferior al de la GeForce RTX 3070 para ordenadores de sobremesa.
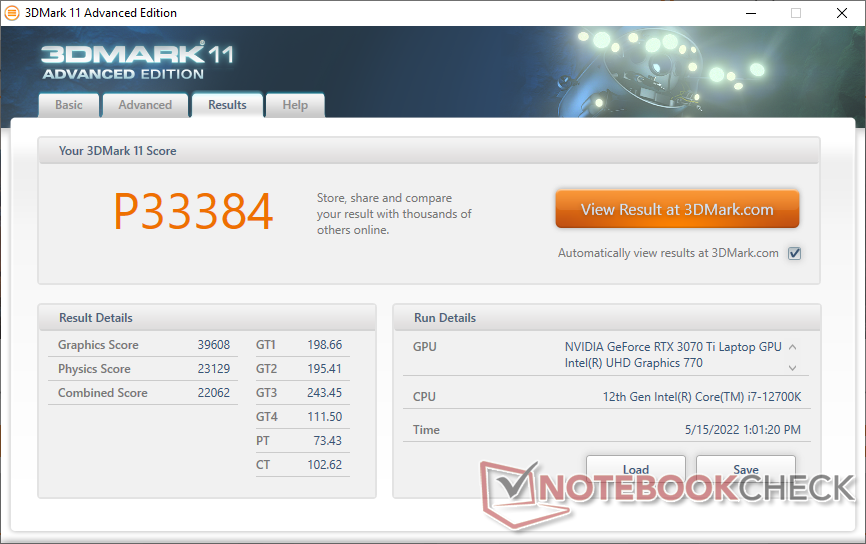
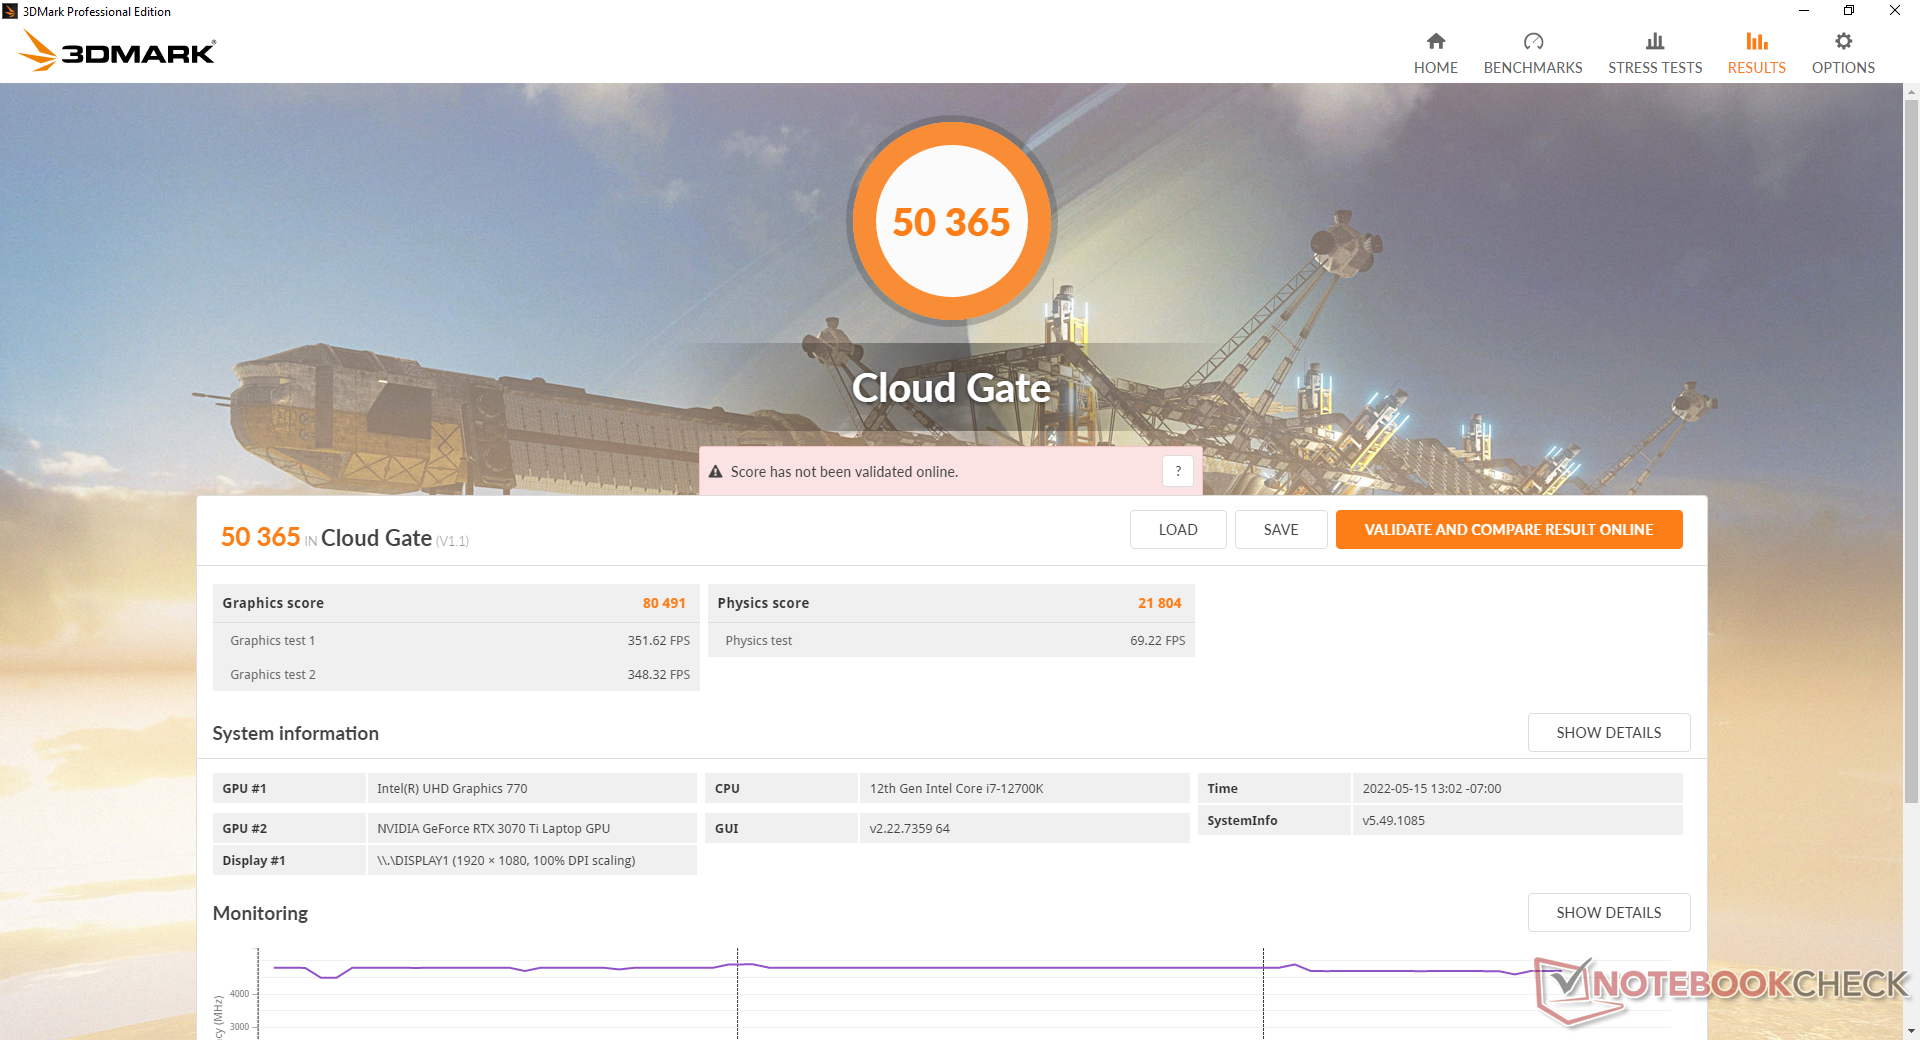
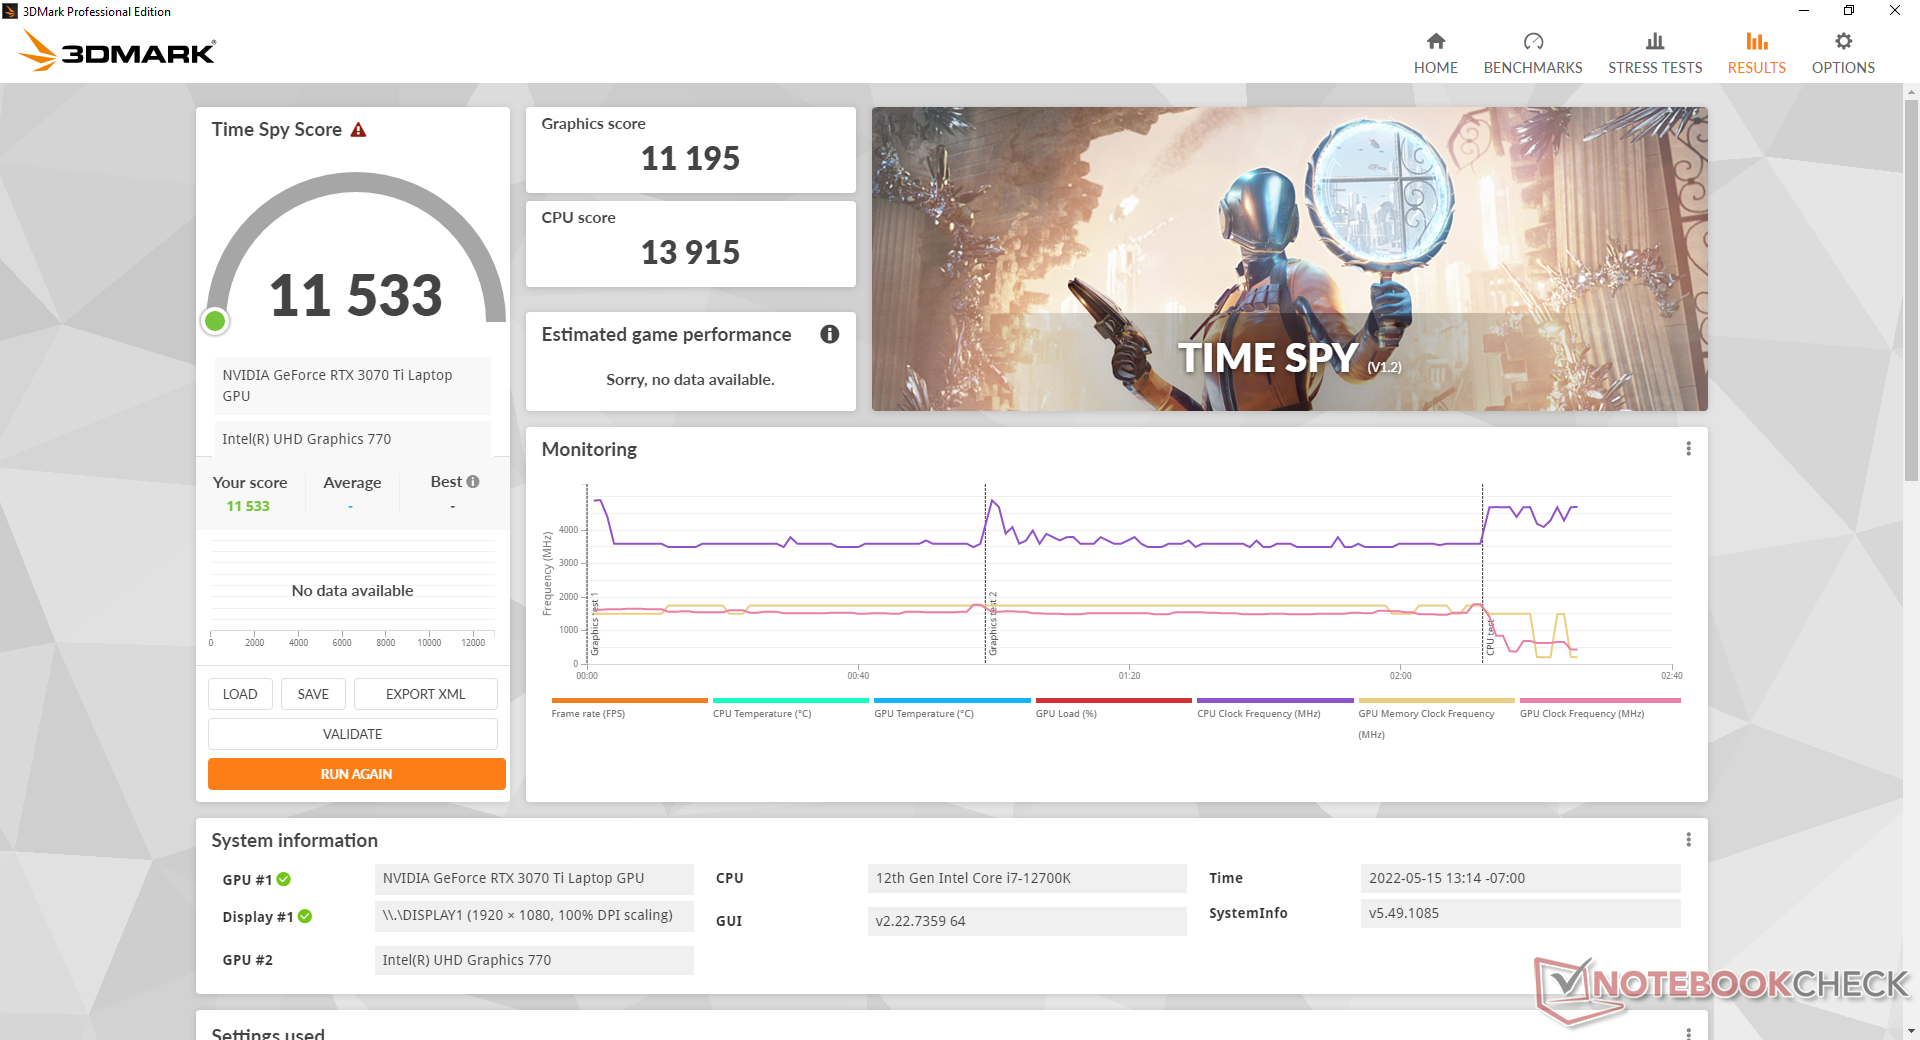
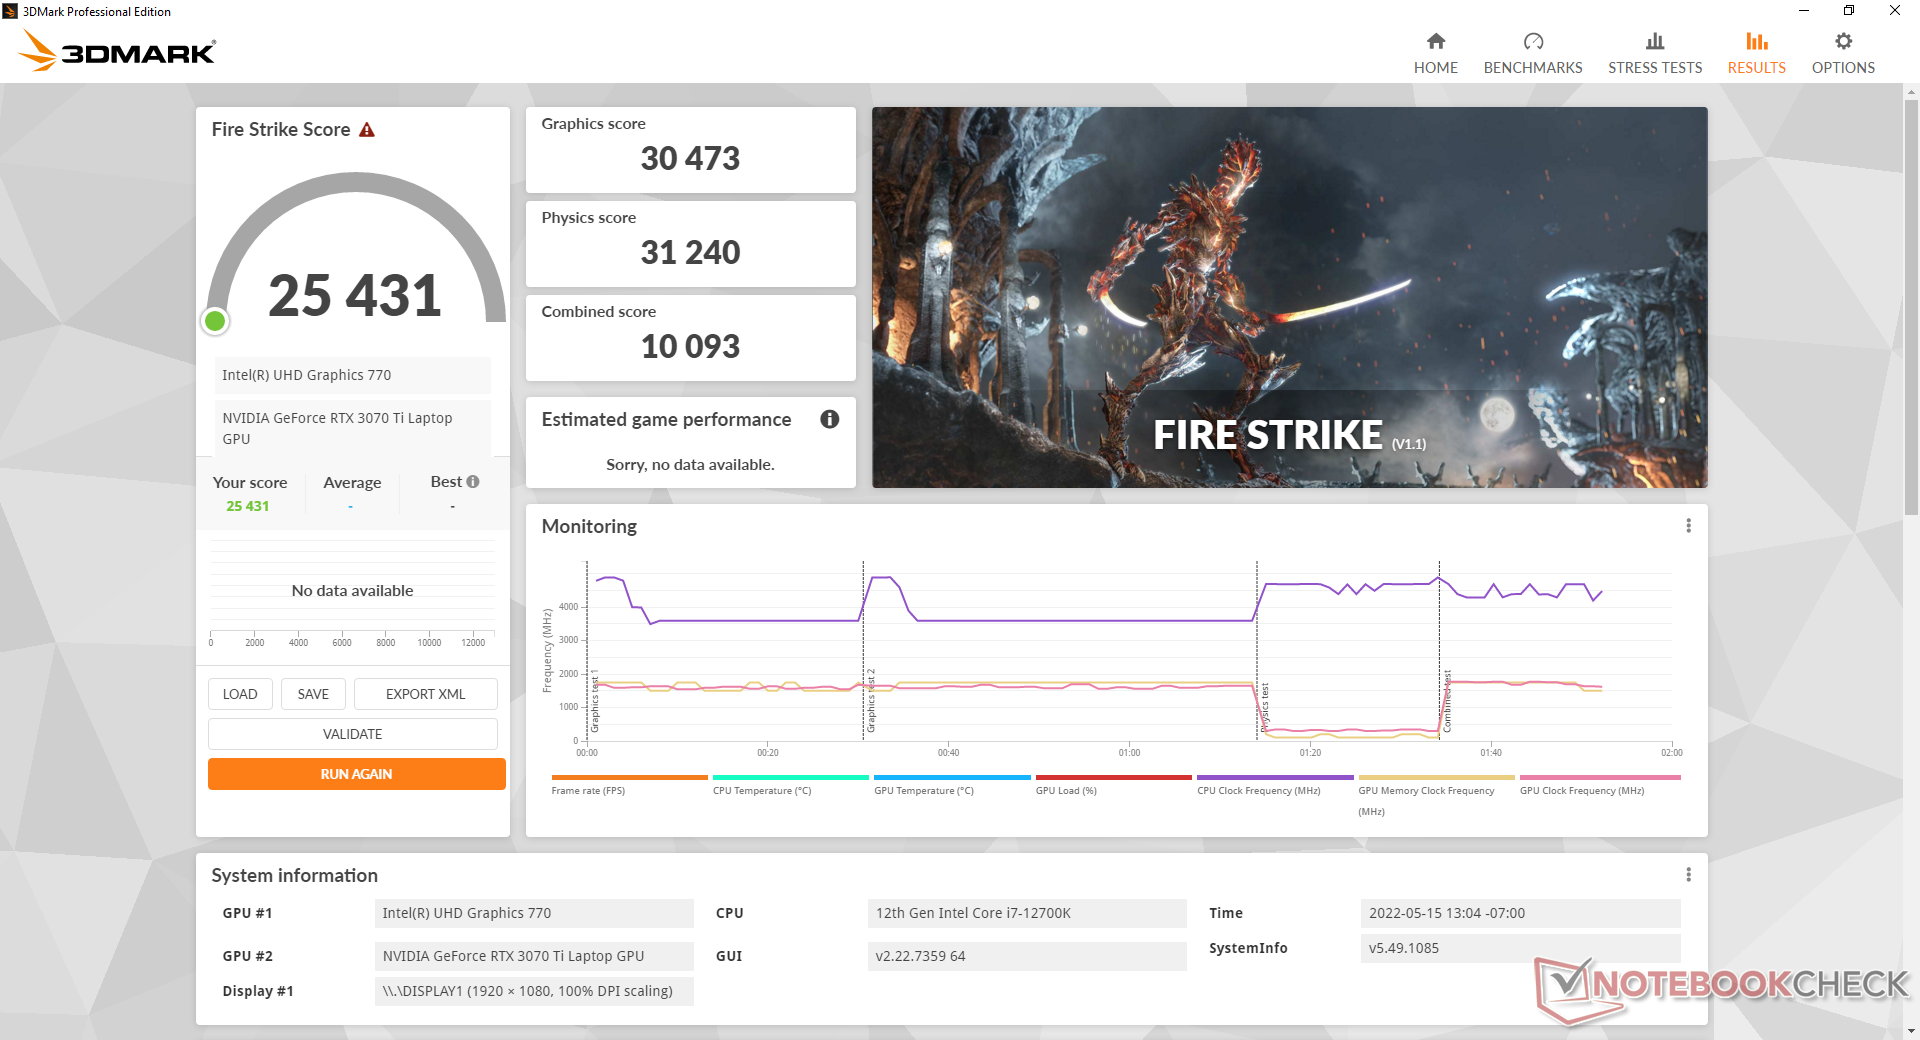
| 3DMark 11 Performance | 33384 puntos | |
| 3DMark Cloud Gate Standard Score | 50365 puntos | |
| 3DMark Fire Strike Score | 25431 puntos | |
| 3DMark Time Spy Score | 11533 puntos | |
ayuda | ||
Witcher 3 FPS Chart
| bajo | medio | alto | ultra | |
|---|---|---|---|---|
| GTA V (2015) | 186.6 | 182.8 | 174.6 | 116.5 |
| The Witcher 3 (2015) | 429 | 329.2 | 213.9 | 111.4 |
| Dota 2 Reborn (2015) | 199 | 178.4 | 166.3 | 155.6 |
| Final Fantasy XV Benchmark (2018) | 202 | 145.8 | 109.5 | |
| X-Plane 11.11 (2018) | 160.9 | 137.6 | 109.9 | |
| Strange Brigade (2018) | 490 | 271 | 223 | 194 |
| Cyberpunk 2077 1.6 (2022) | 140.4 | 124.6 | 132.3 | 81.8 |
Emisiones
Ruido del sistema
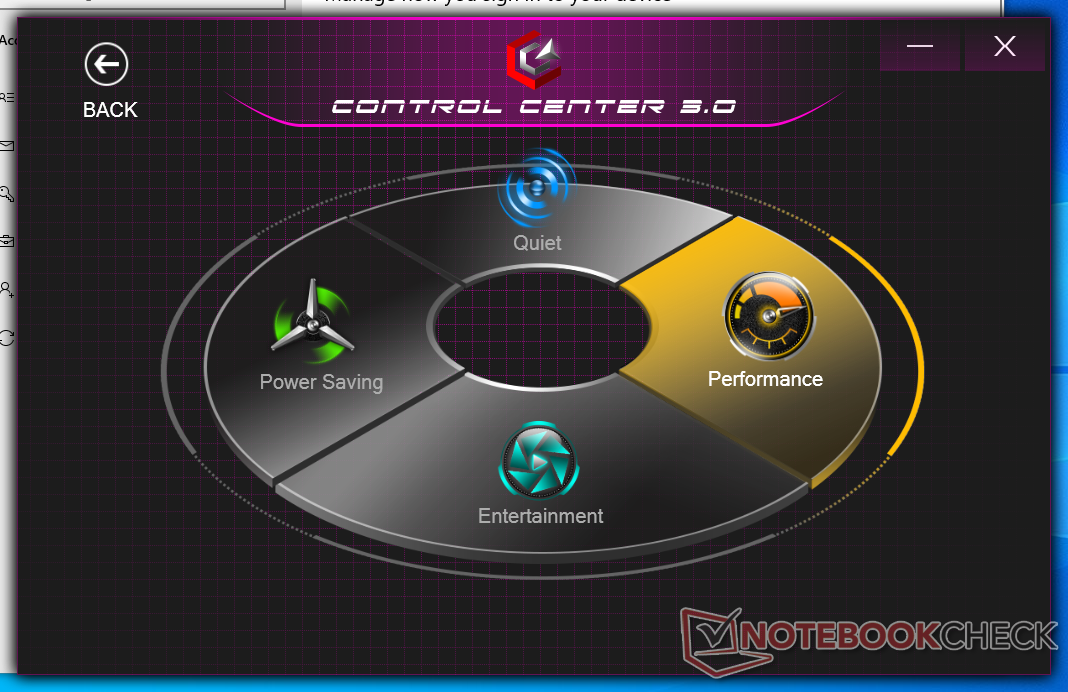
El ruido del ventilador depende de los cinco ajustes del modo de energía del Centro de Control: Ahorro de energía, Silencio, Entretenimiento, Rendimiento y Modo de ventilador máximo. Se recomiendan los modos Silencio o Ahorro de energía cuando simplemente se navega o se transmite vídeo para mantener el ruido del ventilador al mínimo. De lo contrario, los ventiladores pulsarán con más frecuencia cuando se ejecuten aplicaciones poco exigentes en los modos Entretenimiento o Rendimiento
El ruido de los ventiladores se sitúa en el rango de los 50 dB(A) cuando se juega y es más fuerte que el de muchos otros portátiles para juegos en condiciones similares. Si el modo Rendimiento y el modo Ventilador Máximo están activos, el ruido del ventilador puede llegar a los 55 dB(A).
Ruido
| Ocioso |
| 23.8 / 23.8 / 30.1 dB(A) |
| Carga |
| 31.1 / 55.1 dB(A) |
 | ||
30 dB silencioso 40 dB(A) audible 50 dB(A) ruidosamente alto |
||
min: | ||
| Eurocom Raptor X15 GeForce RTX 3070 Ti Laptop GPU, i7-12700K, Samsung SSD 980 Pro 1TB MZ-V8P1T0BW | MSI Raider GE66 12UHS GeForce RTX 3080 Ti Laptop GPU, i9-12900HK, Samsung PM9A1 MZVL22T0HBLB | Razer Blade 15 Advanced Model Early 2022 GeForce RTX 3080 Ti Laptop GPU, i7-12800H, Samsung PM9A1 MZVL21T0HCLR | Eurocom RX315 NH57AF1 GeForce RTX 3070 Laptop GPU, i7-11800H, Samsung SSD 980 Pro 1TB MZ-V8P1T0BW | Gigabyte A5 X1 GeForce RTX 3070 Laptop GPU, R9 5900HX, ADATA XPG SX8200 Pro (ASX8200PNP-512GT) | Asus TUF Gaming A15 FA506QR-AZ061T GeForce RTX 3070 Laptop GPU, R7 5800H, SK Hynix HFM001TD3JX013N | |
|---|---|---|---|---|---|---|
| Noise | -14% | -2% | -18% | -21% | -10% | |
| apagado / medio ambiente * (dB) | 23.3 | 26 -12% | 26 -12% | 26.3 -13% | 25 -7% | 26 -12% |
| Idle Minimum * (dB) | 23.8 | 27 -13% | 26 -9% | 26.4 -11% | 27 -13% | 26 -9% |
| Idle Average * (dB) | 23.8 | 30 -26% | 27 -13% | 31 -30% | 29 -22% | 26 -9% |
| Idle Maximum * (dB) | 30.1 | 39 -30% | 29 4% | 34 -13% | 32 -6% | 27.4 9% |
| Load Average * (dB) | 31.1 | 45 -45% | 37 -19% | 47.8 -54% | 57 -83% | 46.6 -50% |
| Witcher 3 ultra * (dB) | 51.3 | 45 12% | 44 14% | 51.7 -1% | 56 -9% | |
| Load Maximum * (dB) | 55.1 | 47 15% | 45 18% | 57.1 -4% | 58 -5% | 49.3 11% |
* ... más pequeño es mejor
Temperatura
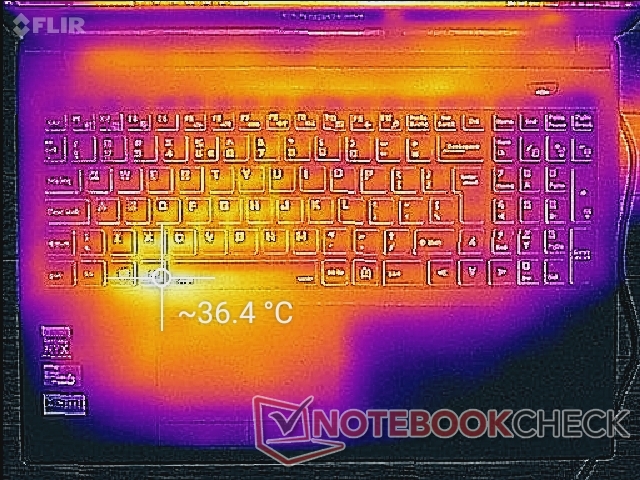
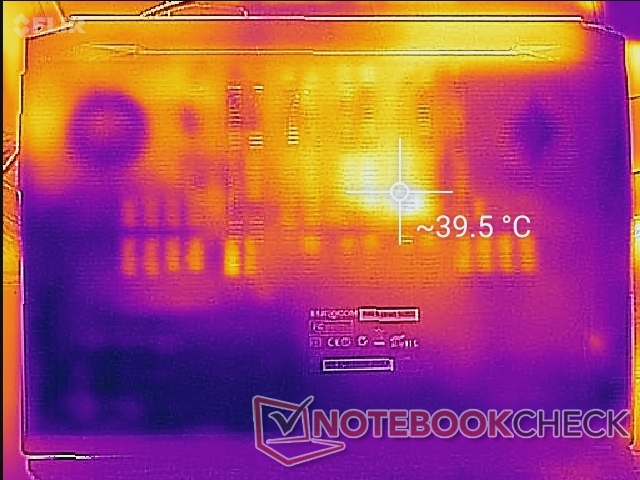
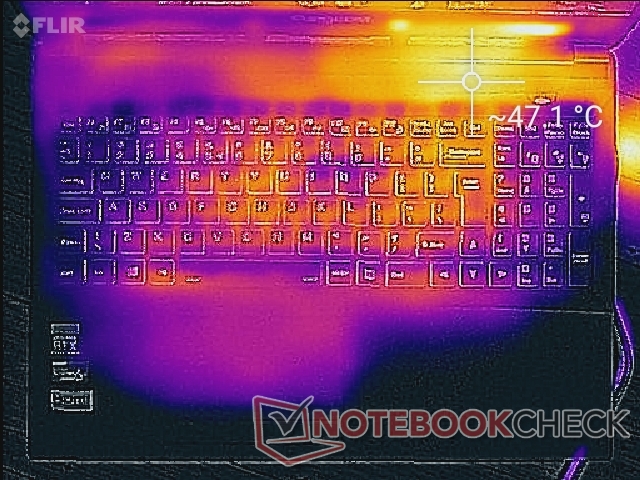
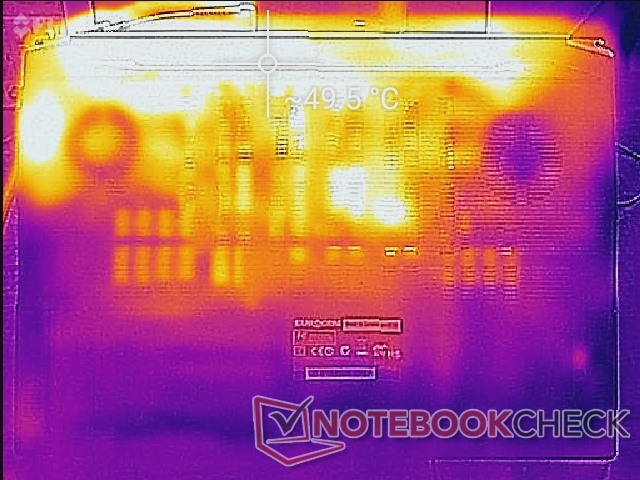
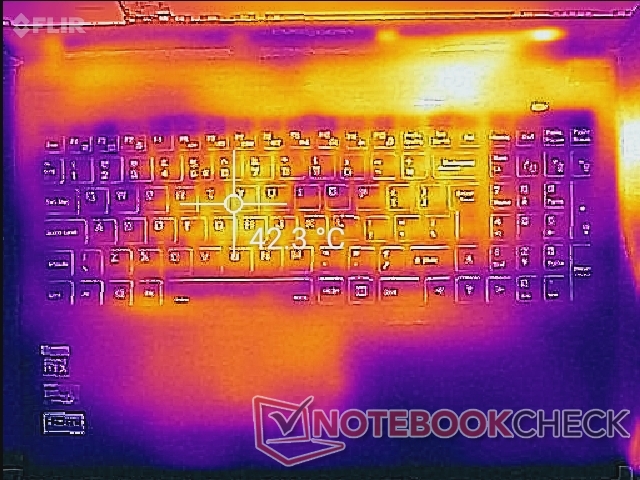
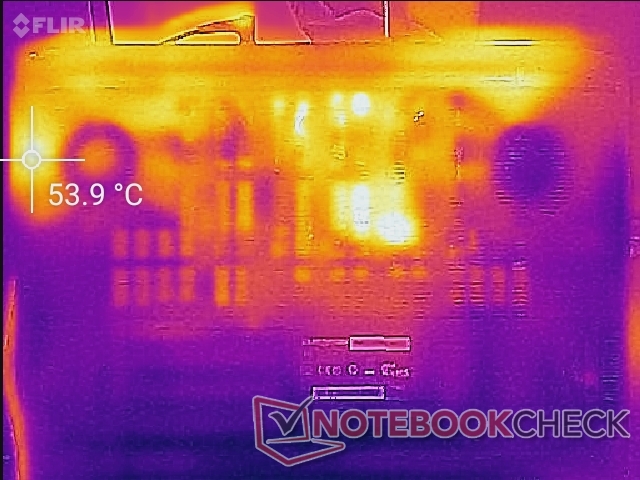
Los puntos calientes de temperatura de la superficie están más cerca del reposamanos izquierdo y del centro del teclado cuando se ejecutan aplicaciones exigentes. El reposamanos izquierdo suele estar más caliente que el derecho ya que el SSD PCIe4 NVMe está situado debajo. Los puntos calientes pueden alcanzar unos 50 C en las zonas superior e inferior como muestran los mapas de temperatura de abajo.
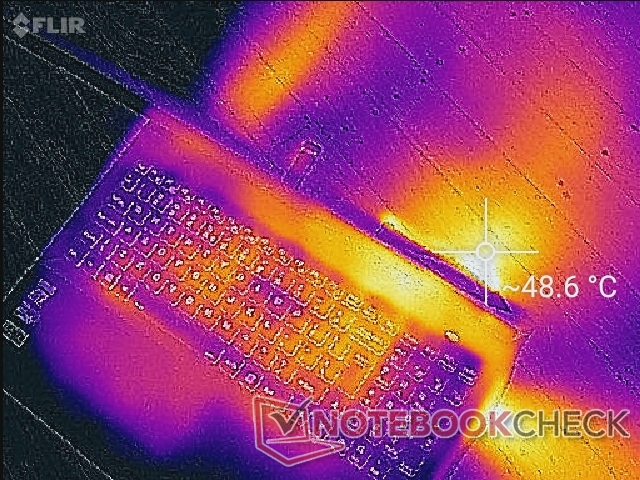
(-) La temperatura máxima en la parte superior es de 48.8 °C / 120 F, frente a la media de 40.4 °C / 105 F, que oscila entre 21.2 y 68.8 °C para la clase Gaming.
(-) El fondo se calienta hasta un máximo de 57.8 °C / 136 F, frente a la media de 43.2 °C / 110 F
(+) En reposo, la temperatura media de la parte superior es de 30.2 °C / 86# F, frente a la media del dispositivo de 33.9 °C / 93 F.
(±) Jugando a The Witcher 3, la temperatura media de la parte superior es de 34.3 °C / 94 F, frente a la media del dispositivo de 33.9 °C / 93 F.
(±) El reposamanos y el touchpad pueden calentarse mucho al tacto con un máximo de 37.2 °C / 99 F.
(-) La temperatura media de la zona del reposamanos de dispositivos similares fue de 28.8 °C / 83.8 F (-8.4 °C / -15.2 F).
| Eurocom Raptor X15 Intel Core i7-12700K, NVIDIA GeForce RTX 3070 Ti Laptop GPU | MSI Raider GE66 12UHS Intel Core i9-12900HK, NVIDIA GeForce RTX 3080 Ti Laptop GPU | Razer Blade 15 Advanced Model Early 2022 Intel Core i7-12800H, NVIDIA GeForce RTX 3080 Ti Laptop GPU | Eurocom RX315 NH57AF1 Intel Core i7-11800H, NVIDIA GeForce RTX 3070 Laptop GPU | Gigabyte A5 X1 AMD Ryzen 9 5900HX, NVIDIA GeForce RTX 3070 Laptop GPU | Asus TUF Gaming A15 FA506QR-AZ061T AMD Ryzen 7 5800H, NVIDIA GeForce RTX 3070 Laptop GPU | |
|---|---|---|---|---|---|---|
| Heat | 2% | 2% | 14% | 17% | 3% | |
| Maximum Upper Side * (°C) | 48.8 | 54 -11% | 53 -9% | 36 26% | 47 4% | 46.7 4% |
| Maximum Bottom * (°C) | 57.8 | 65 -12% | 53 8% | 46 20% | 51 12% | 55.9 3% |
| Idle Upper Side * (°C) | 36.6 | 30 18% | 36 2% | 35.6 3% | 27 26% | 37.1 -1% |
| Idle Bottom * (°C) | 40.2 | 35 13% | 38 5% | 36.8 8% | 30 25% | 38.1 5% |
* ... más pequeño es mejor
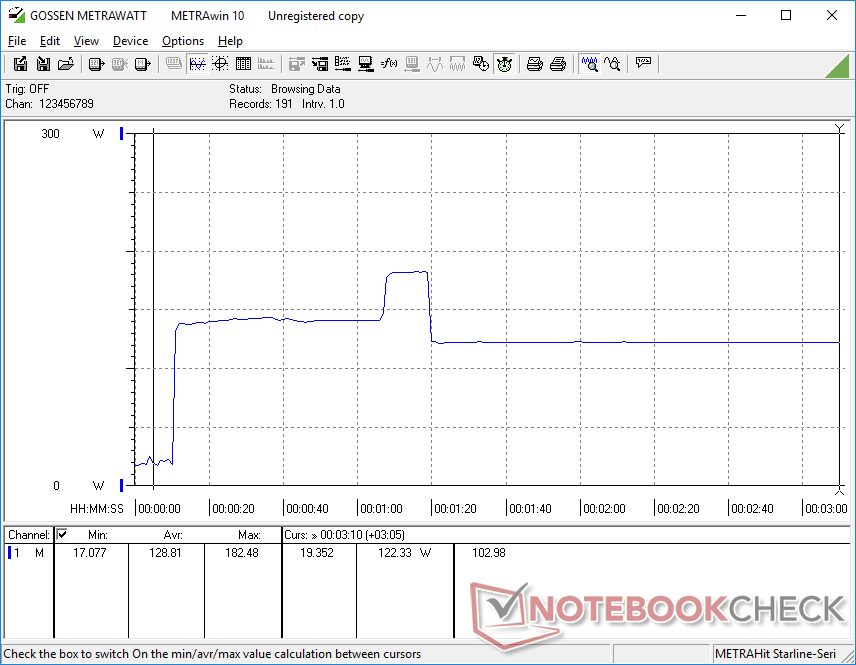
Prueba de esfuerzo
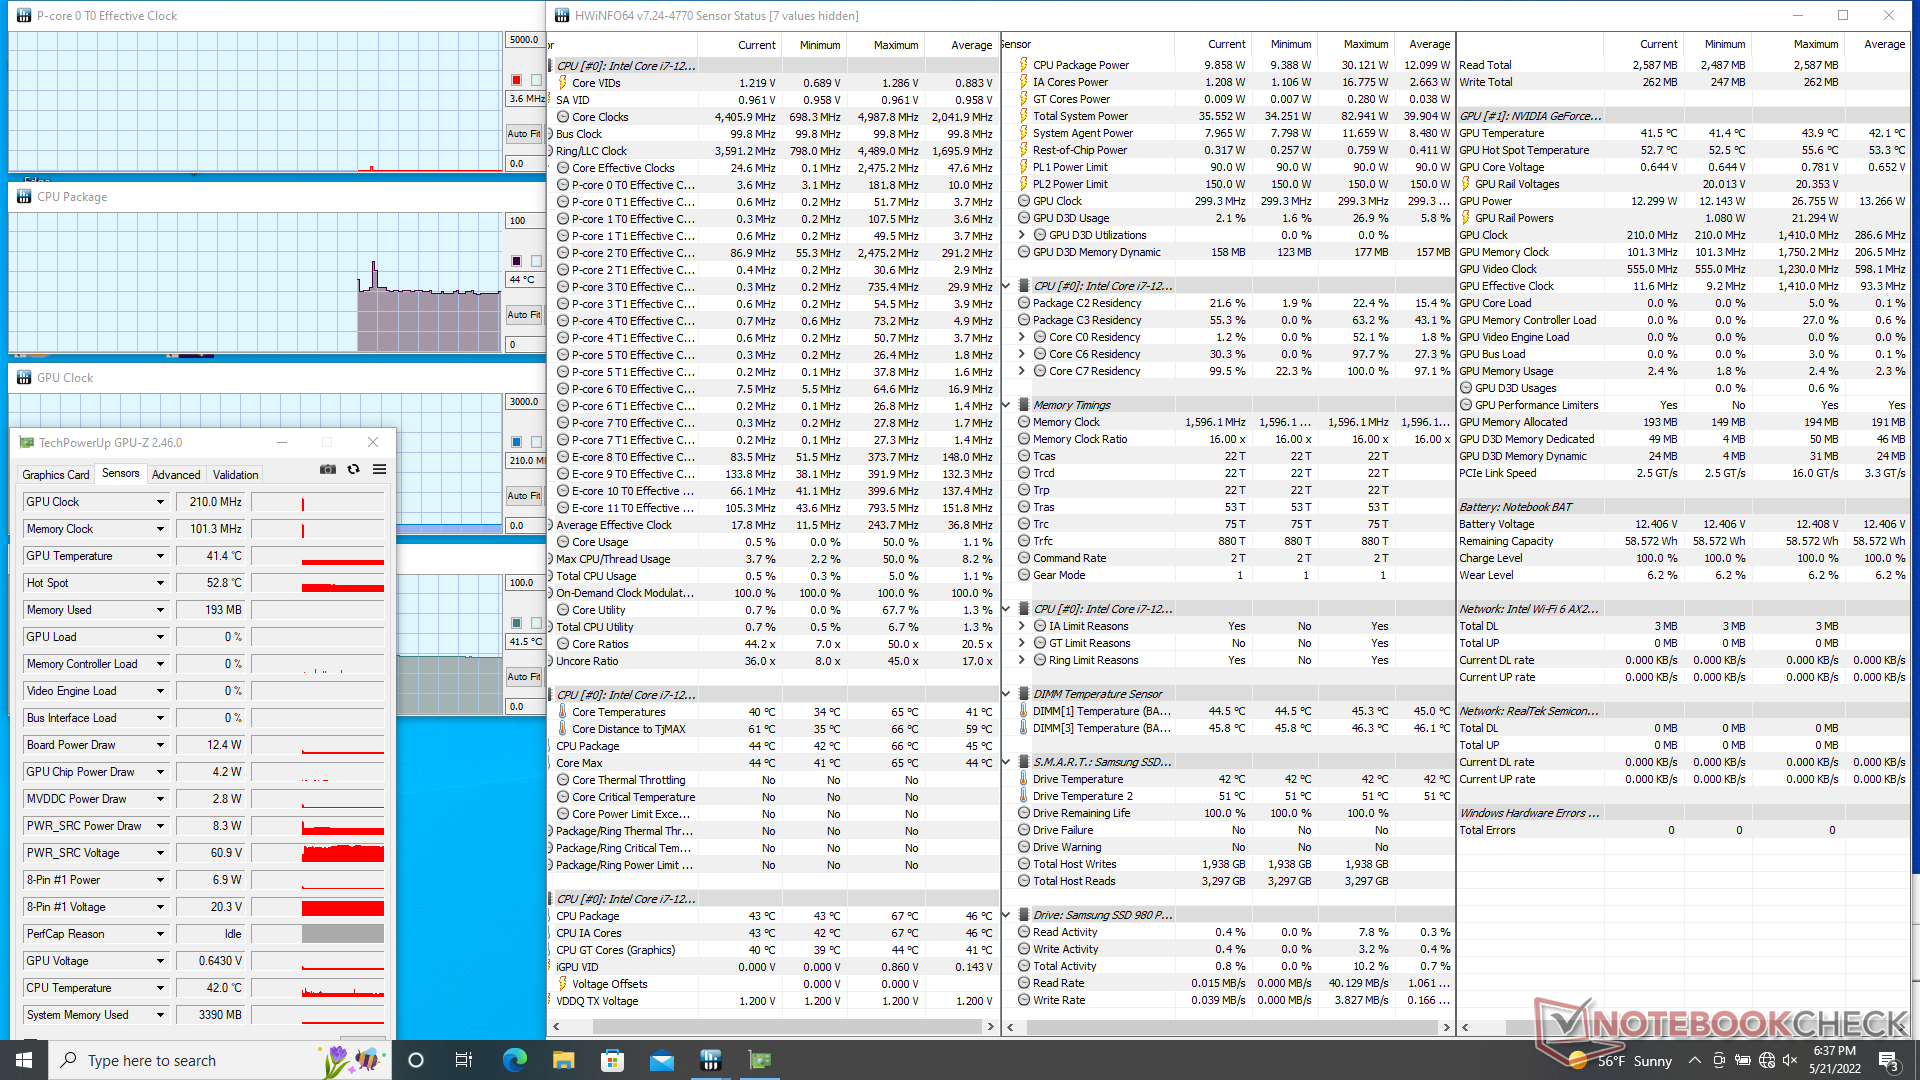
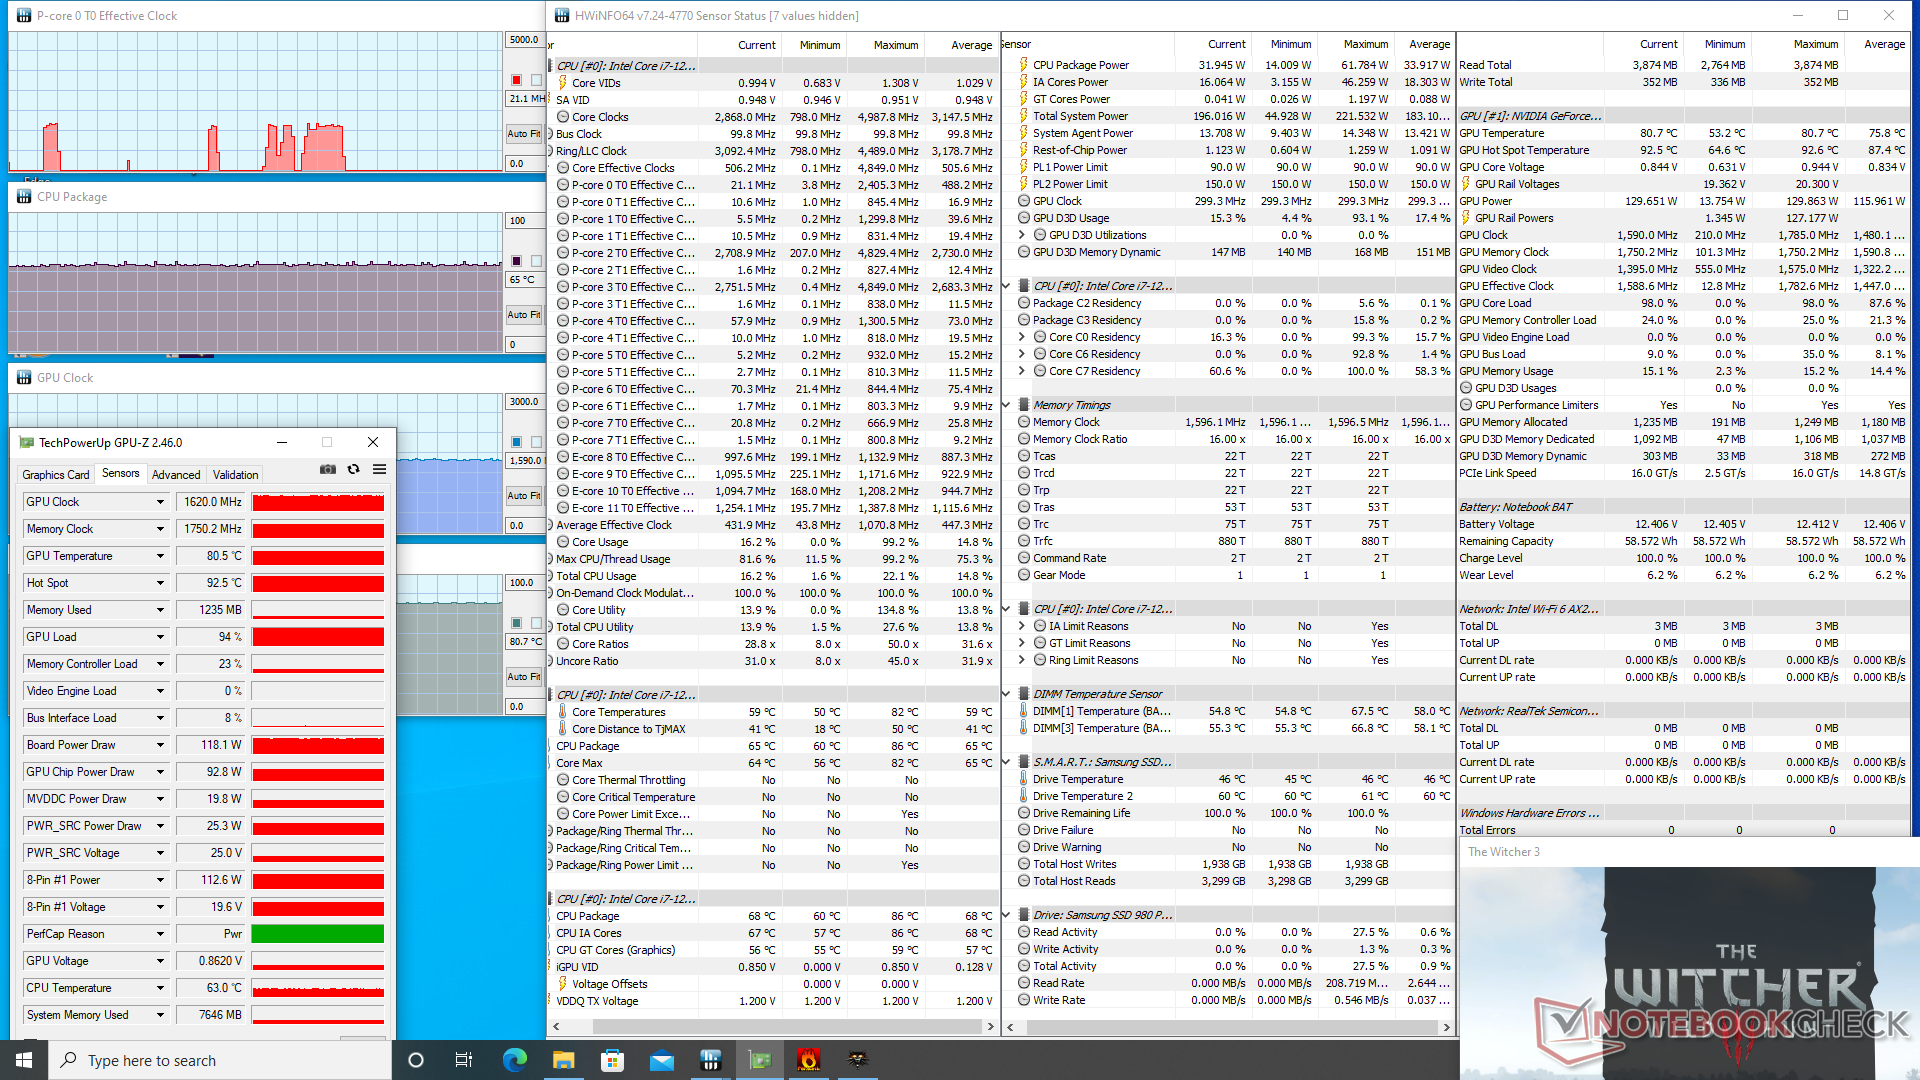
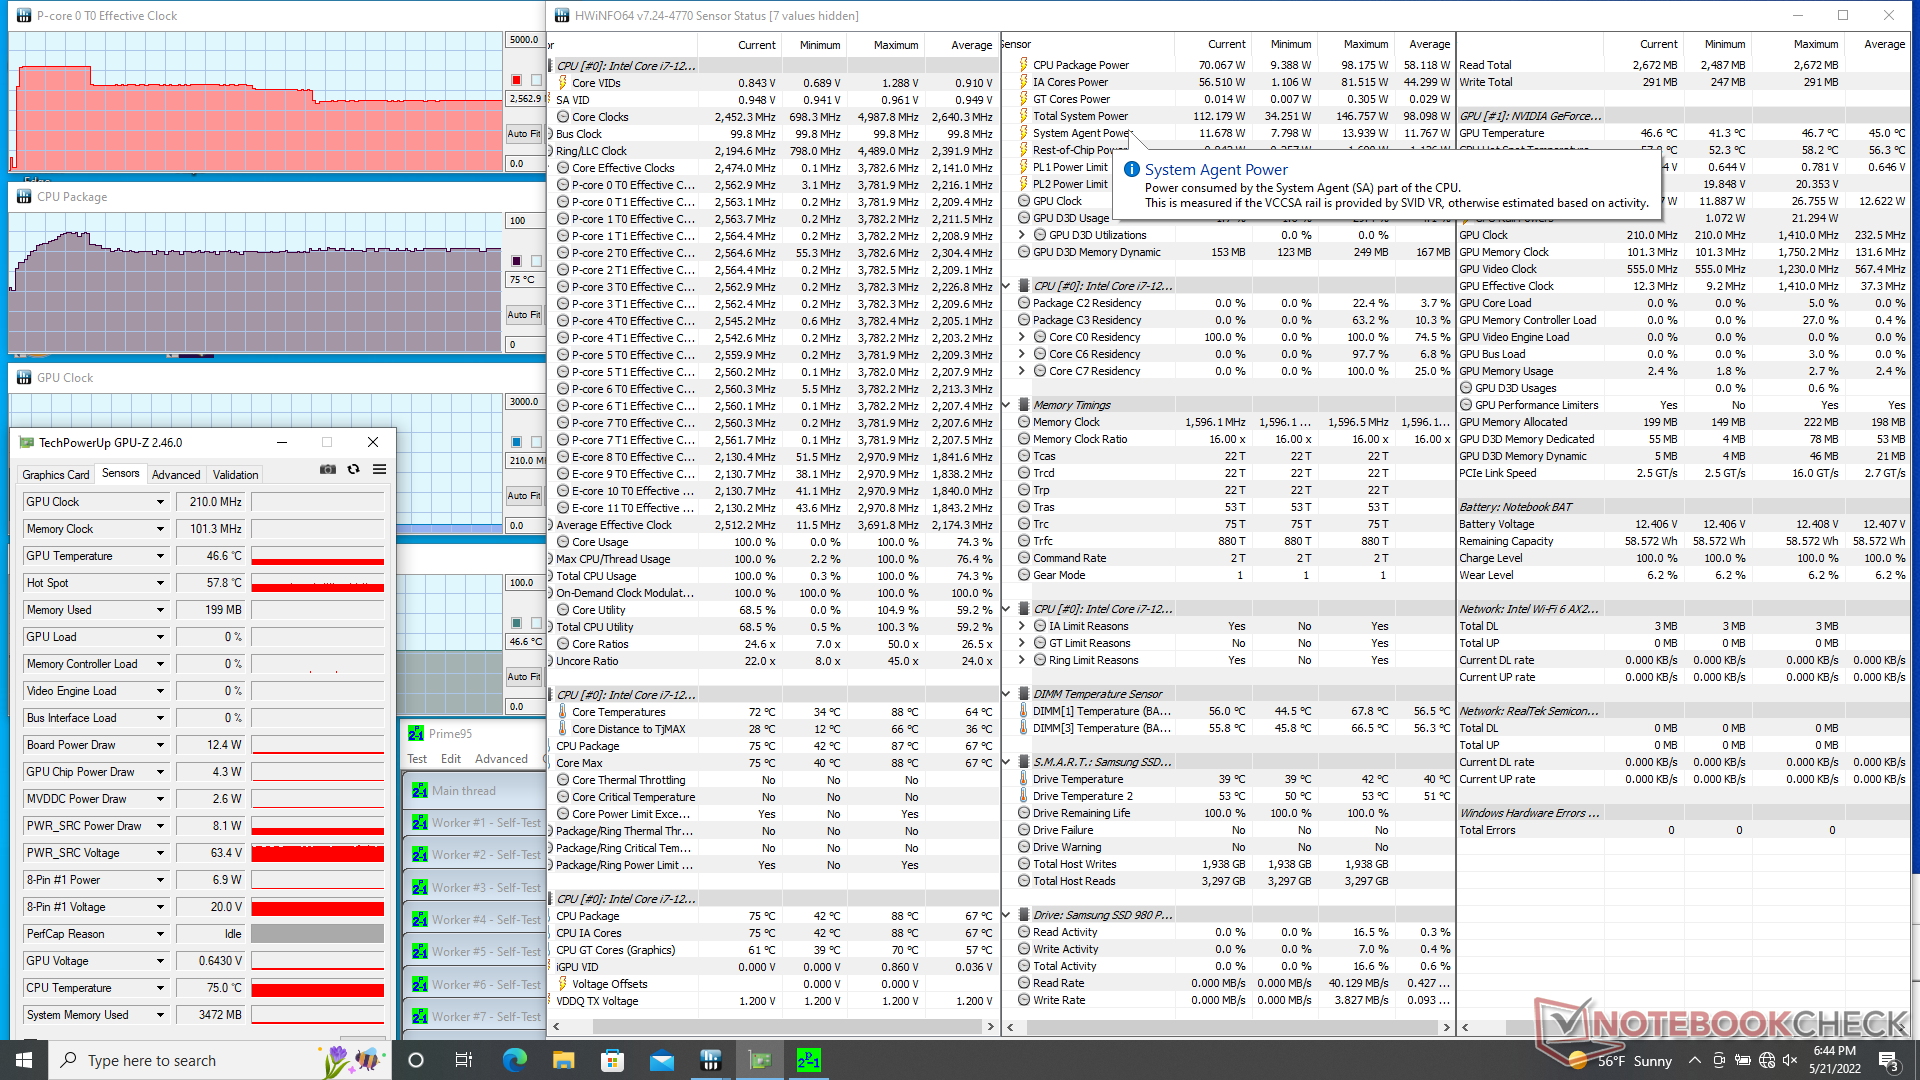
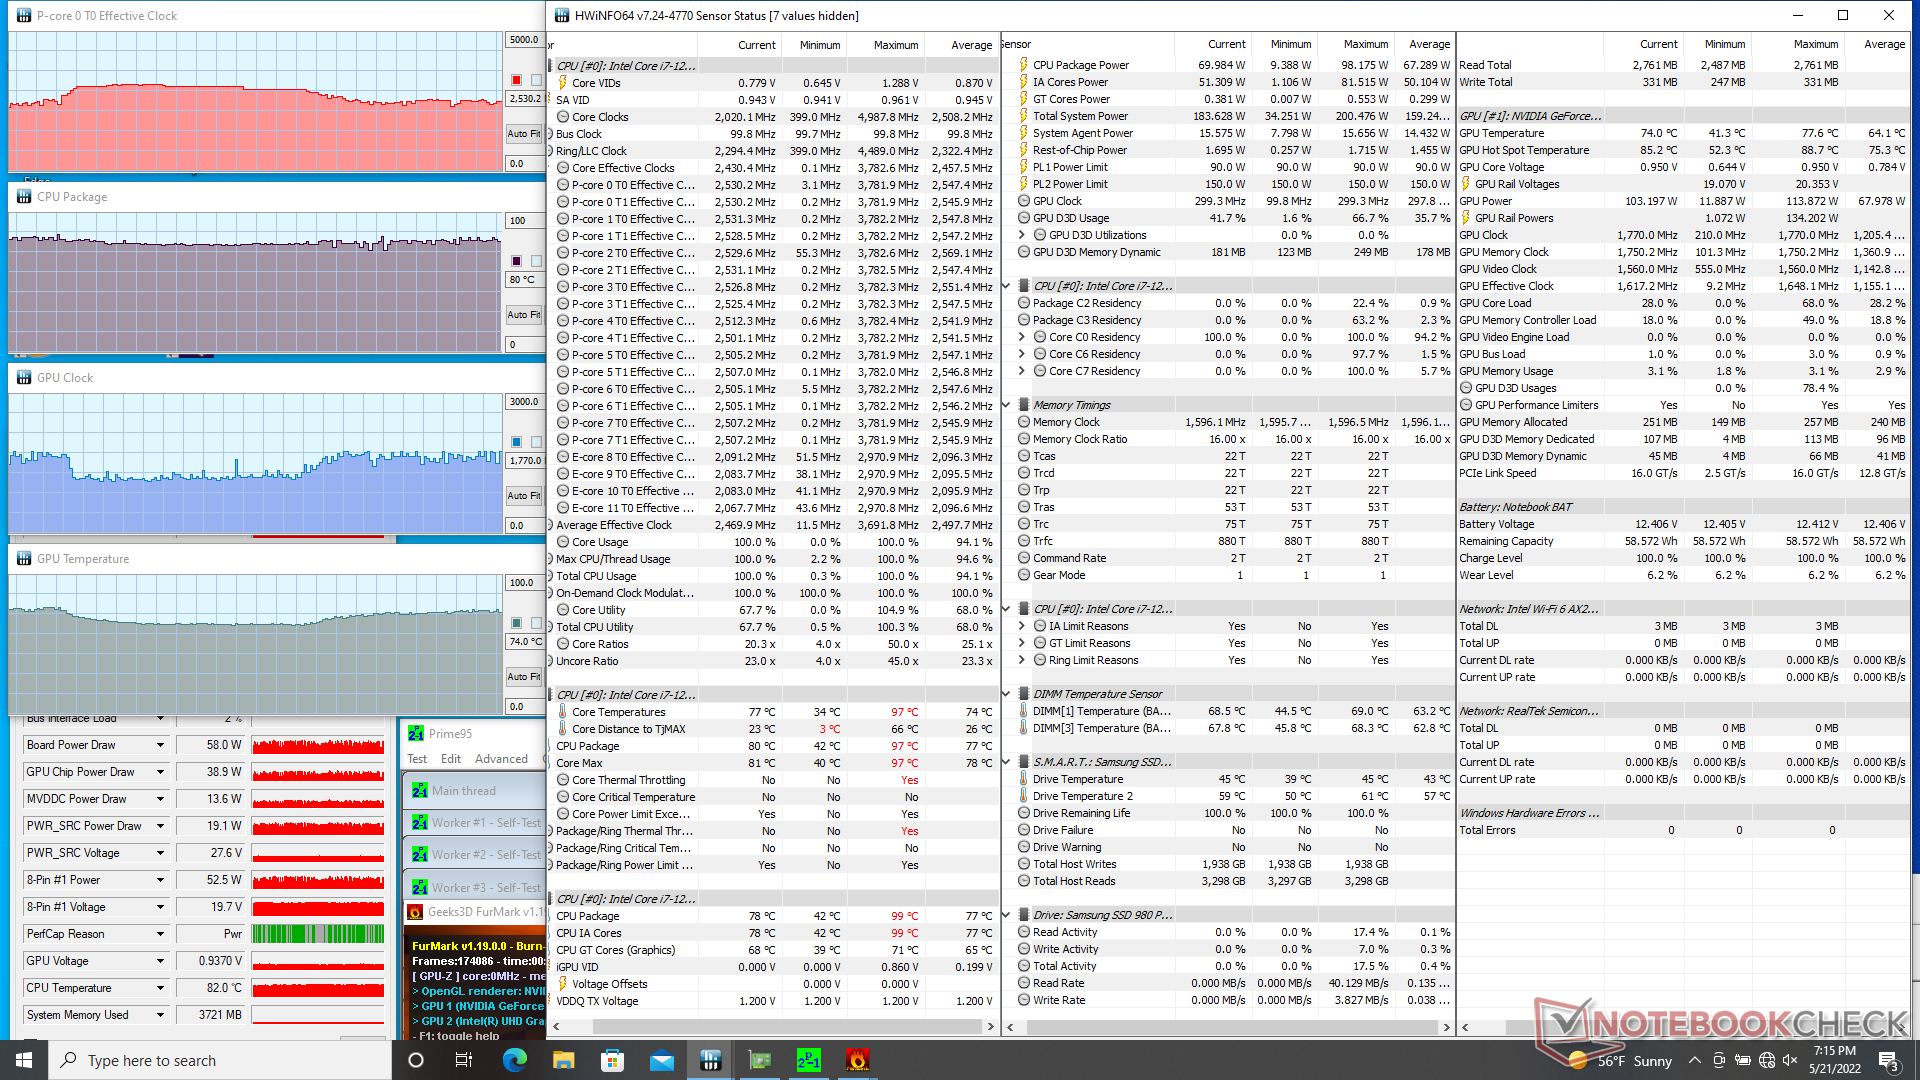
Cuando se estresa bajo Prime95, la CPU aumenta a 3,8 GHz y 100 W durante casi un minuto completo antes de alcanzar una temperatura del núcleo de 86 C. A partir de entonces, las velocidades de reloj caen constantemente antes de estabilizarse en sólo 2,6 GHz y 70 W para alcanzar una temperatura del núcleo más estable de 75 C. En otras palabras, la CPU es incapaz de mantener el consumo total de 100 W durante períodos prolongados debido a las limitaciones térmicas.
Hay un ligero aumento del rendimiento gráfico cuando se cambia al modo Rendimiento desde el modo Entretenimiento. El consumo de energía y la velocidad de reloj de la GPU se estabilizan en 118 W y 1620 MHz, respectivamente, cuando se ejecuta Witcher 3 en modo Rendimiento, frente a 113 W y 1530 MHz cuando se ejecuta el mismo juego en modo Entretenimiento. Si se activa el modo de ventilador máximo, la velocidad de reloj de la GPU y el consumo de energía de la placa se estabilizarían en valores aún más altos, de 1725 MHz y 130 W, respectivamente. Resulta decepcionante que la GPU no pueda acercarse al objetivo de 140 W, como se afirma en el panel de control de Nvidia, y que los usuarios deban activar el modo Ventilador Máximo para exprimir el nivel de rendimiento esperado de la GPU.
El uso de la batería limita el rendimiento. Una prueba de Fire Strike con baterías arrojaría unas puntuaciones de Física y Gráficos de 12708 y 3419 puntos, respectivamente, frente a 31240 y 30473 puntos con la red eléctrica.
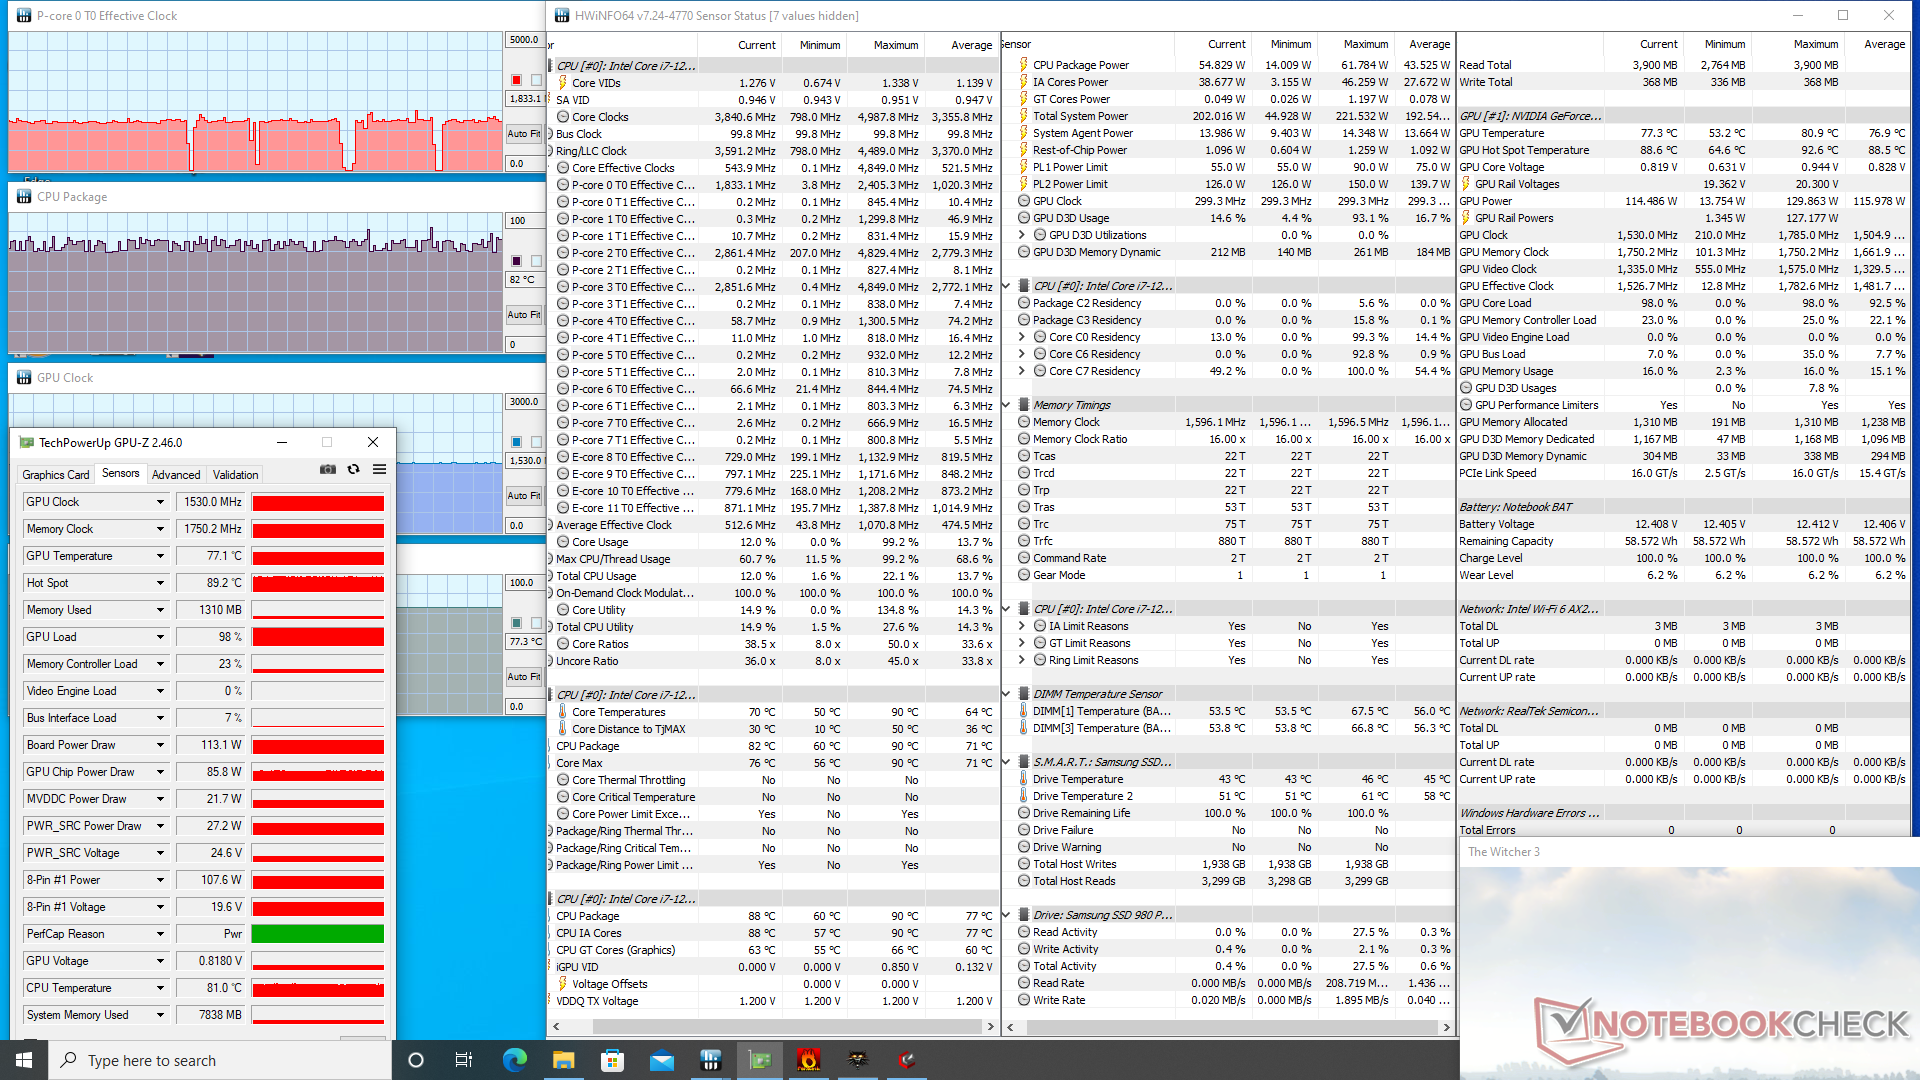
| Reloj dela CPU (GHz) | Reloj de la GPU (MHz) | Temperatura media dela CPU (°C) | Temperatura media de la GPU (°C) | |
| Sistema en reposo | -- | -- | 44 | 41 |
| EstrésdePrime95 | 2,6 | -- | 75 | 47 |
| Prime95+ FurMarkStress | ~2,5 | ~1770 | 80 | 74 |
| Witcher 3 Estrés(modo de entretenimiento) | -- | 1530 | ~82 | 77 |
| Witcher 3 Estrés (modo Rendimiento) | -- | 1620 | 65 | 81 |
Altavoces
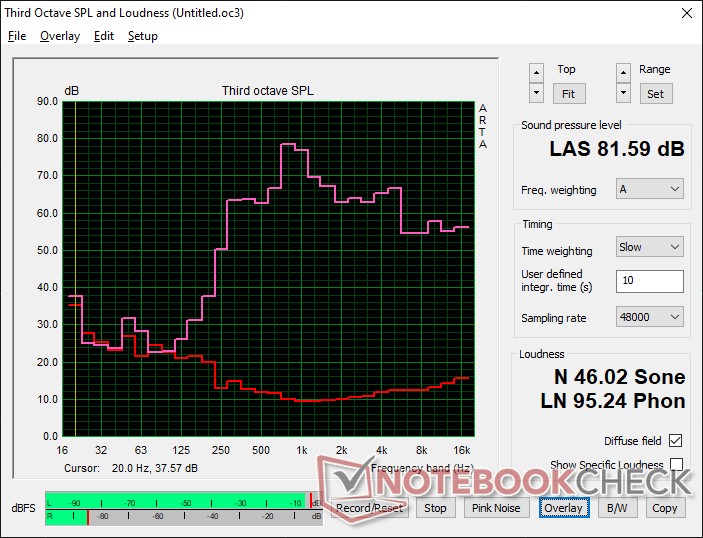
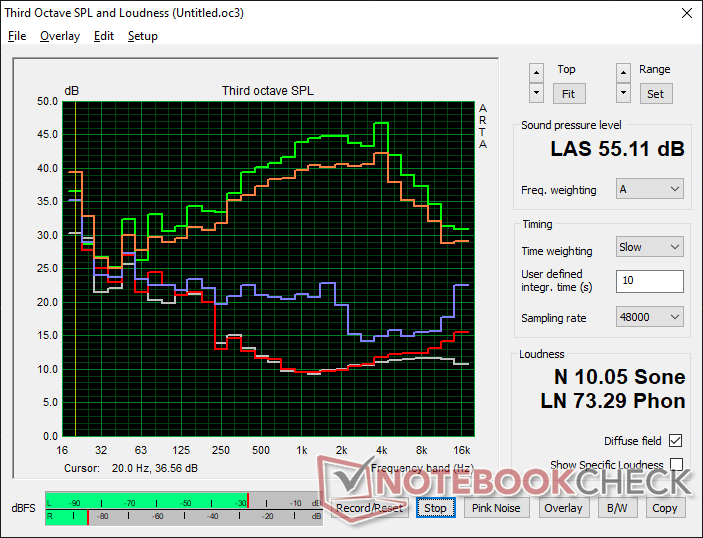
Eurocom Raptor X15 análisis de audio
(±) | la sonoridad del altavoz es media pero buena (81.6 dB)
Graves 100 - 315 Hz
(-) | casi sin bajos - de media 24.6% inferior a la mediana
(±) | la linealidad de los graves es media (13.4% delta a frecuencia anterior)
Medios 400 - 2000 Hz
(±) | medias más altas - de media 5.6% más altas que la mediana
(±) | la linealidad de los medios es media (8.1% delta respecto a la frecuencia anterior)
Altos 2 - 16 kHz
(+) | máximos equilibrados - a sólo 4.2% de la mediana
(+) | los máximos son lineales (6% delta a la frecuencia anterior)
Total 100 - 16.000 Hz
(±) | la linealidad del sonido global es media (21.5% de diferencia con la mediana)
En comparación con la misma clase
» 77% de todos los dispositivos probados de esta clase eran mejores, 5% similares, 18% peores
» El mejor tuvo un delta de 6%, la media fue 18%, el peor fue ###max##%
En comparación con todos los dispositivos probados
» 61% de todos los dispositivos probados eran mejores, 7% similares, 32% peores
» El mejor tuvo un delta de 4%, la media fue 23%, el peor fue ###max##%
Apple MacBook Pro 16 2021 M1 Pro análisis de audio
(+) | los altavoces pueden reproducir a un volumen relativamente alto (#84.7 dB)
Graves 100 - 315 Hz
(+) | buen bajo - sólo 3.8% lejos de la mediana
(+) | el bajo es lineal (5.2% delta a la frecuencia anterior)
Medios 400 - 2000 Hz
(+) | medios equilibrados - a sólo 1.3% de la mediana
(+) | los medios son lineales (2.1% delta a la frecuencia anterior)
Altos 2 - 16 kHz
(+) | máximos equilibrados - a sólo 1.9% de la mediana
(+) | los máximos son lineales (2.7% delta a la frecuencia anterior)
Total 100 - 16.000 Hz
(+) | el sonido global es lineal (4.6% de diferencia con la mediana)
En comparación con la misma clase
» 0% de todos los dispositivos probados de esta clase eran mejores, 0% similares, 100% peores
» El mejor tuvo un delta de 5%, la media fue 17%, el peor fue ###max##%
En comparación con todos los dispositivos probados
» 0% de todos los dispositivos probados eran mejores, 0% similares, 100% peores
» El mejor tuvo un delta de 4%, la media fue 23%, el peor fue ###max##%
Gestión de la energía
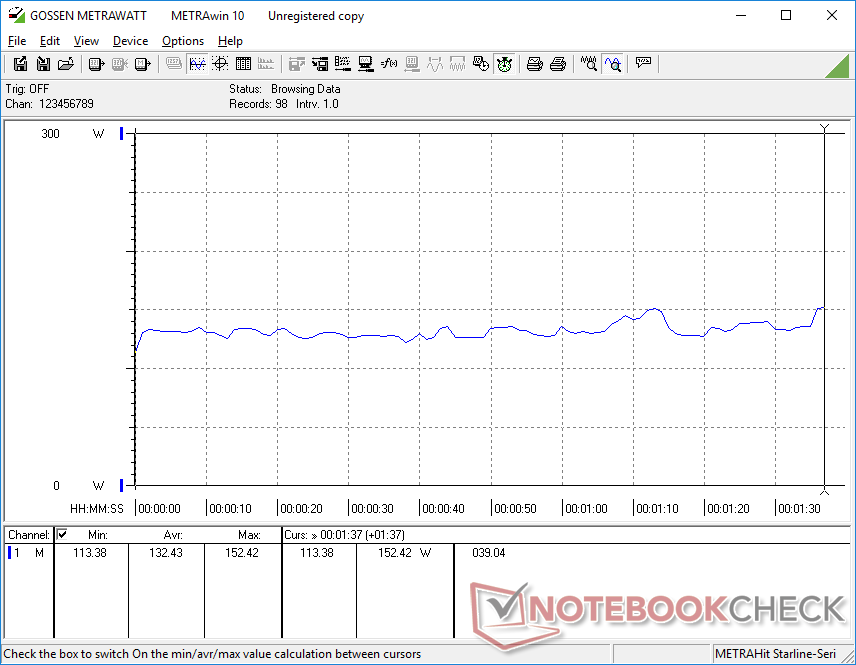
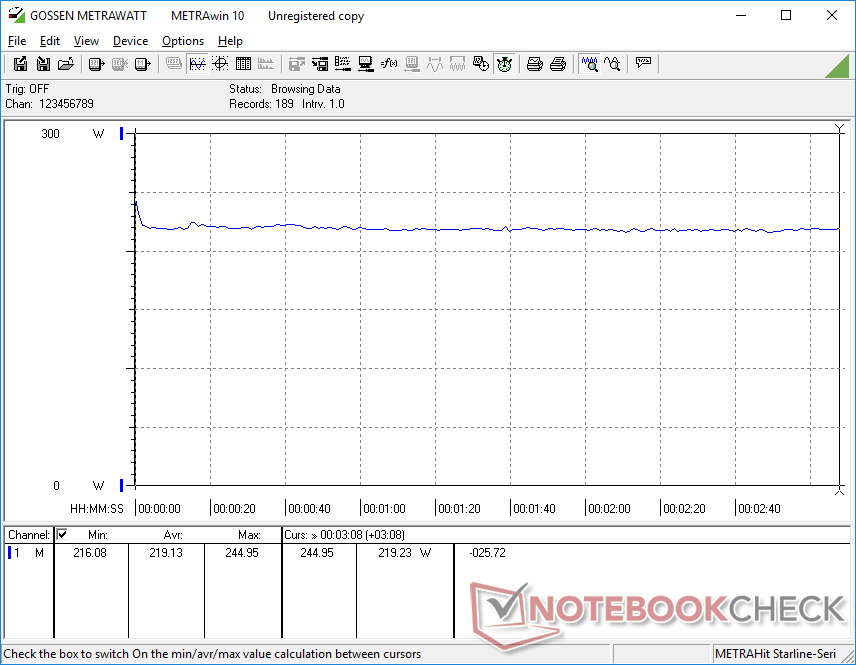
Consumo de energía
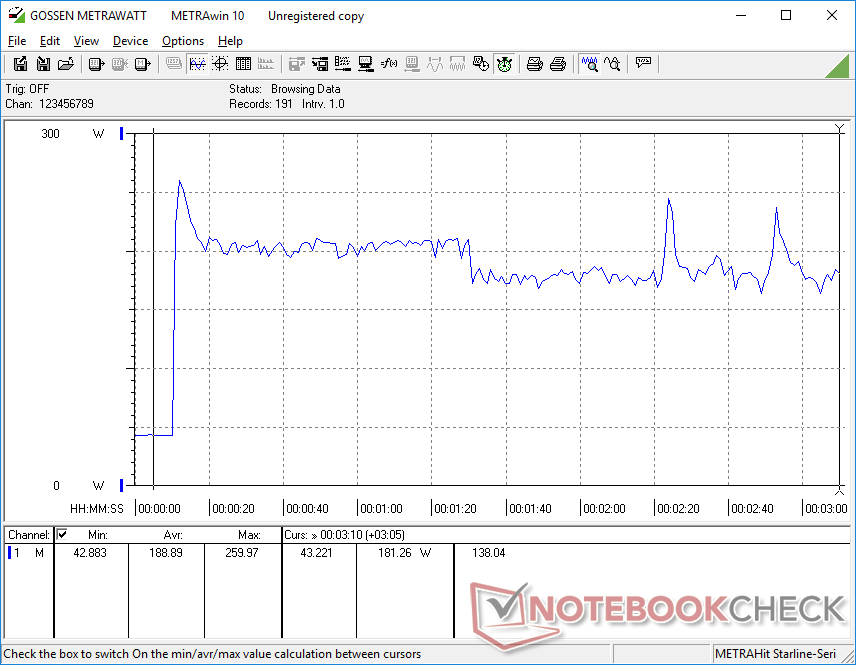
El consumo de energía es razonablemente bajo cuando está en reposo en el escritorio. Nuestra unidad consumía entre 12 W y 22 W cuando estaba en reposo en el escritorio, en comparación con los 33 W a 44 W del Eurocom Sky X4C, mucho más antiguo, con una CPU de escritorio Intel de 9ª generación. Sin embargo, el consumo sigue siendo muy alto cuando se ejecutan aplicaciones más exigentes. La ejecución de Witcher 3por ejemplo, exige más energía que la mayoría de los portátiles con una CPU Intel o AMD de la serie H y una GPU similar de la clase GeForce RTX 3070.
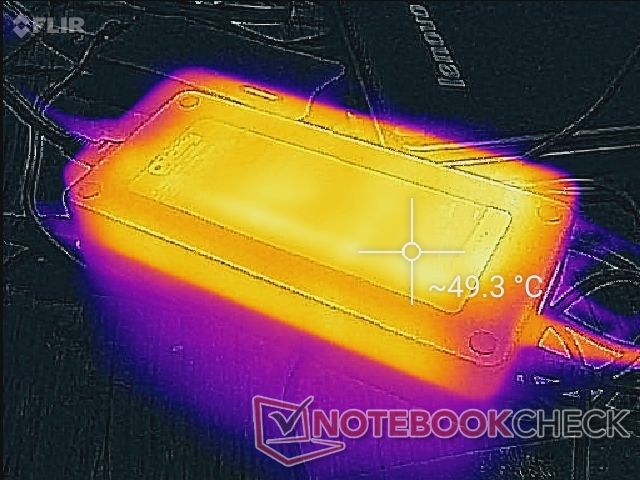
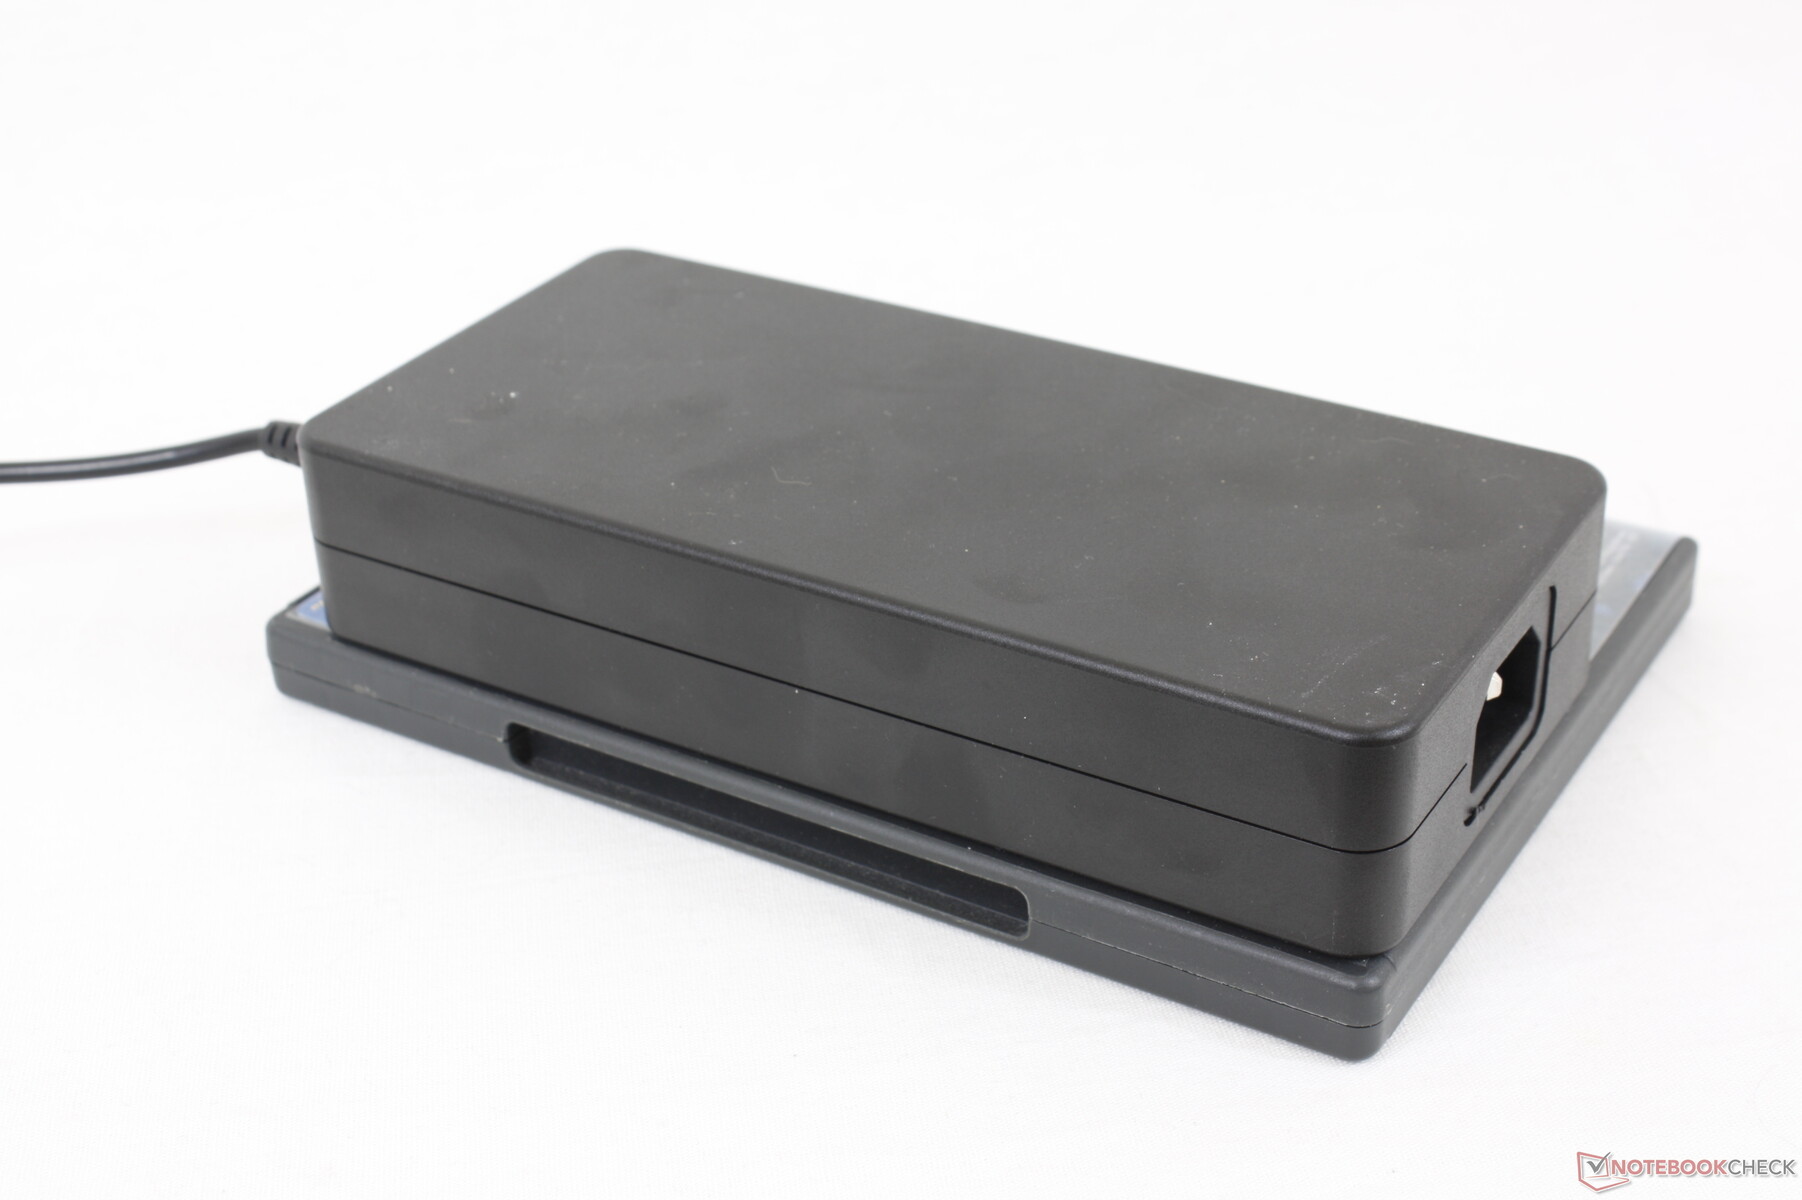
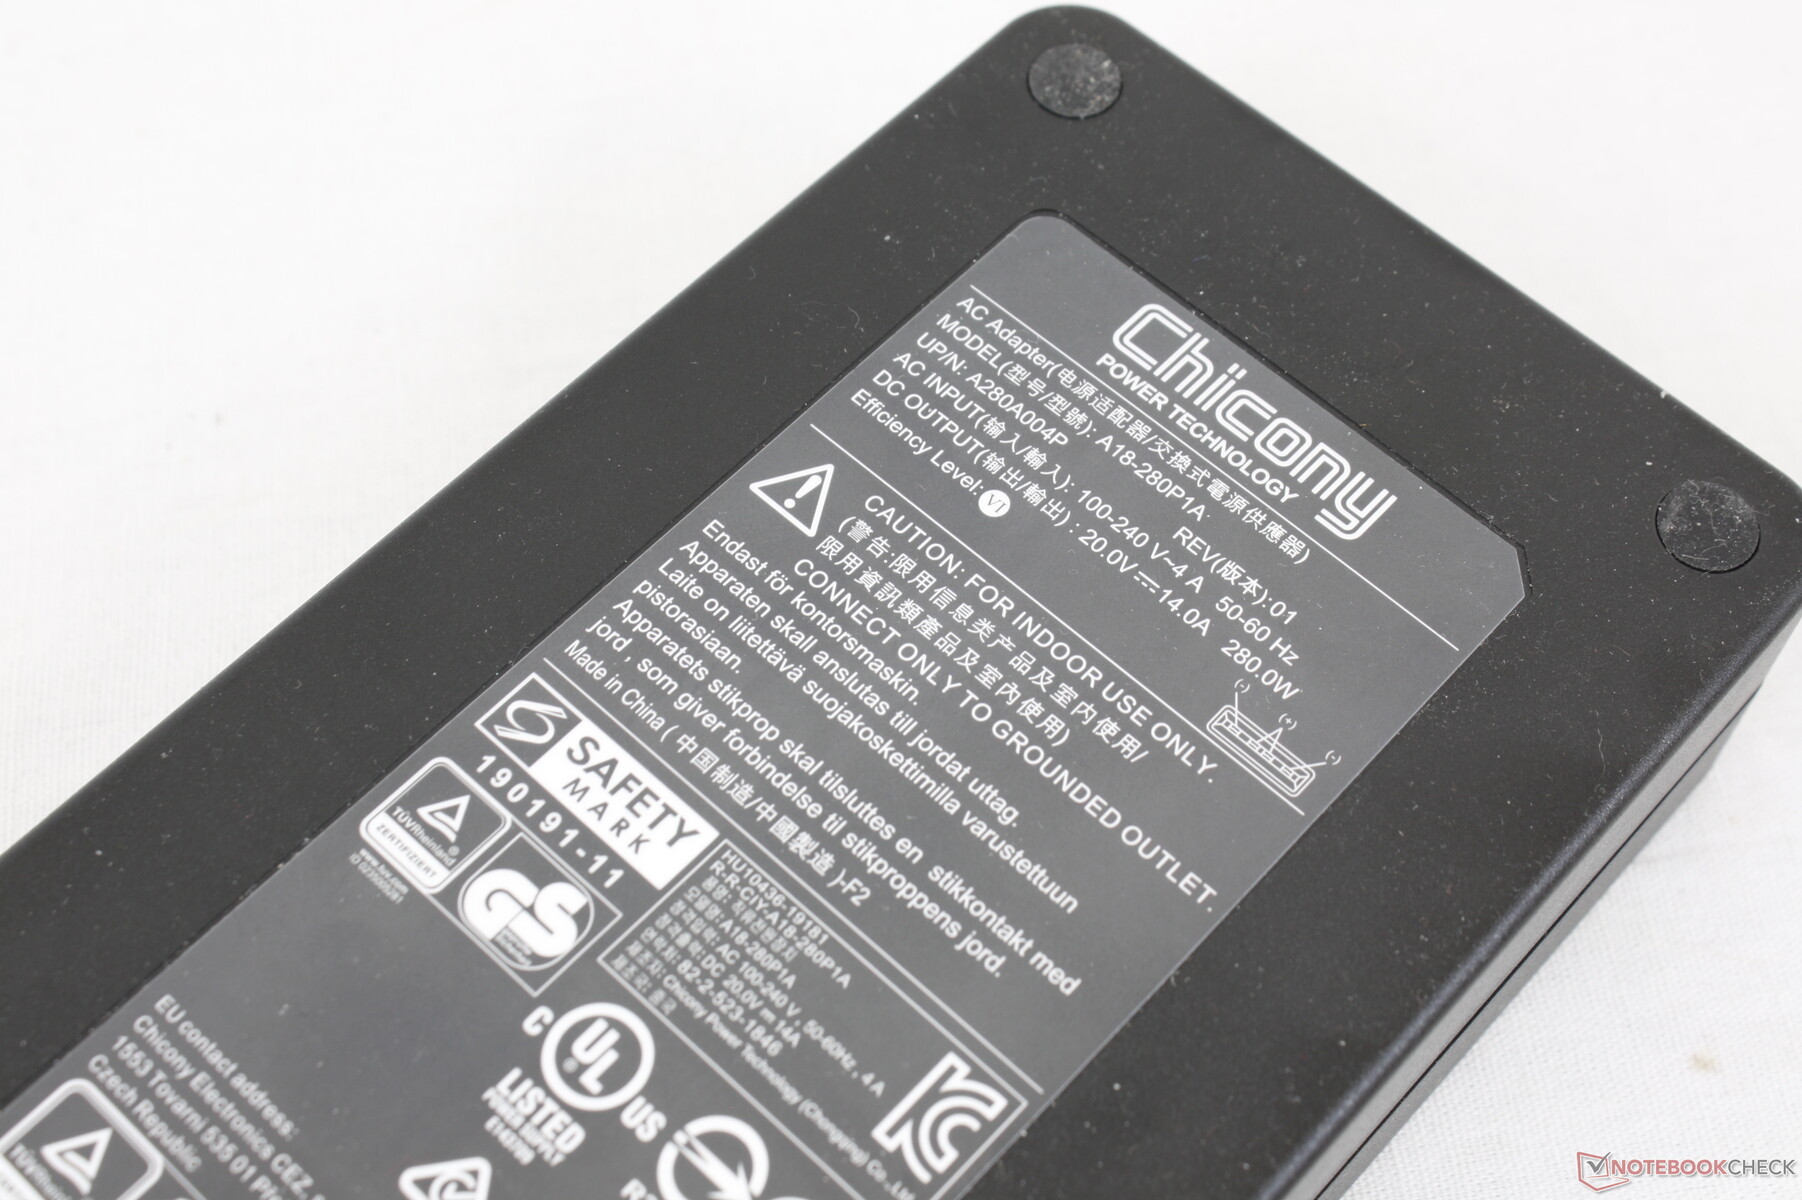
El adaptador de CA de 280 W puede ser grande, pero es necesario para ejecutar el sistema a plena potencia. Podemos alcanzar un consumo de 260 W cuando tanto la CPU como la GPU están al máximo.
| Off / Standby | |
| Ocioso | |
| Carga |
|
Clave:
min: | |
| Eurocom Raptor X15 i7-12700K, GeForce RTX 3070 Ti Laptop GPU, Samsung SSD 980 Pro 1TB MZ-V8P1T0BW, IPS, 1920x1080, 15.6" | MSI Raider GE66 12UHS i9-12900HK, GeForce RTX 3080 Ti Laptop GPU, Samsung PM9A1 MZVL22T0HBLB, IPS, 3840x2160, 15.6" | Razer Blade 15 Advanced Model Early 2022 i7-12800H, GeForce RTX 3080 Ti Laptop GPU, Samsung PM9A1 MZVL21T0HCLR, IPS, 1920x1080, 15.6" | Eurocom RX315 NH57AF1 i7-11800H, GeForce RTX 3070 Laptop GPU, Samsung SSD 980 Pro 1TB MZ-V8P1T0BW, IPS, 1920x1080, 15.6" | Gigabyte A5 X1 R9 5900HX, GeForce RTX 3070 Laptop GPU, ADATA XPG SX8200 Pro (ASX8200PNP-512GT), IPS, 1920x1080, 15.6" | Asus TUF Gaming A15 FA506QR-AZ061T R7 5800H, GeForce RTX 3070 Laptop GPU, SK Hynix HFM001TD3JX013N, IPS, 1920x1080, 15.6" | |
|---|---|---|---|---|---|---|
| Power Consumption | 0% | 8% | 3% | 17% | 27% | |
| Idle Minimum * (Watt) | 12.8 | 16 -25% | 17 -33% | 12.7 1% | 10 22% | 10.2 20% |
| Idle Average * (Watt) | 21.7 | 19 12% | 19 12% | 16.4 24% | 12 45% | 12.8 41% |
| Idle Maximum * (Watt) | 21.8 | 26 -19% | 25 -15% | 36.1 -66% | 16 27% | 15 31% |
| Load Average * (Watt) | 132.4 | 110 17% | 108 18% | 101.5 23% | 124 6% | 130 2% |
| Witcher 3 ultra * (Watt) | 219 | 202 8% | 150 32% | 197 10% | 204 7% | 137 37% |
| Load Maximum * (Watt) | 260 | 242 7% | 179 31% | 196.1 25% | 272 -5% | 184 29% |
* ... más pequeño es mejor
Power Consumption Witcher 3 / Stresstest
Power Consumption external Monitor
Duración de la batería
La duración es corta, con algo menos de 4 horas de uso real de la WLAN en el perfil de energía equilibrado y con la GPU integrada activa. La velocidad de carga es decente, de 2 a 2,5 horas desde que se vacía hasta que se llena. Apreciamos que la batería sea fácilmente extraíble, sin embargo, a diferencia de la mayoría de otros portátiles.
| Eurocom Raptor X15 i7-12700K, GeForce RTX 3070 Ti Laptop GPU, 62 Wh | MSI Raider GE66 12UHS i9-12900HK, GeForce RTX 3080 Ti Laptop GPU, 99 Wh | Razer Blade 15 Advanced Model Early 2022 i7-12800H, GeForce RTX 3080 Ti Laptop GPU, 80 Wh | Eurocom RX315 NH57AF1 i7-11800H, GeForce RTX 3070 Laptop GPU, 71 Wh | Gigabyte A5 X1 R9 5900HX, GeForce RTX 3070 Laptop GPU, 48.96 Wh | Asus TUF Gaming A15 FA506QR-AZ061T R7 5800H, GeForce RTX 3070 Laptop GPU, 90 Wh | |
|---|---|---|---|---|---|---|
| Duración de Batería | 43% | 23% | 20% | 60% | 185% | |
| WiFi v1.3 (h) | 4 | 5.7 43% | 4.9 23% | 4.8 20% | 6.4 60% | 11.4 185% |
| H.264 (h) | 7.1 | 5.9 | 7.3 | |||
| Load (h) | 1.7 | 2 | 1.3 | 2.4 | ||
| Reader / Idle (h) | 8.1 | 10.1 | 17.4 |
Pro
Contra
Veredicto
El Raptor X15 utiliza las últimas CPUs de Intel y GPUs de Nvidia atrapadas en un chasis envejecido. El modelo carece de características que suelen encontrarse en otros portátiles de juego de 15,6 pulgadas de gama alta, como la iluminación RGB por tecla, DisplayPort-sobre-USB, Thunderbolt, compatibilidad con Wi-Fi 6E y mejor refrigeración de SSD NVMe. Cuando modelos de la competencia como el MSI GE66 o Gigabyte A5 X1 pueden ser más delgados y ligeros a la vez que ofrecen objetivos TGP similares a los del Raptor, puede ser difícil recomendar el Eurocom por encima de esas alternativas.
Hay que tener en cuenta que el rendimiento máximo está ligado al modo de ventilador máximo. Por lo tanto, los usuarios deben ajustar manualmente el perfil del sistema al modo de Ventilador Máximo y soportar ventiladores fuertes para obtener el máximo rendimiento del sistema.
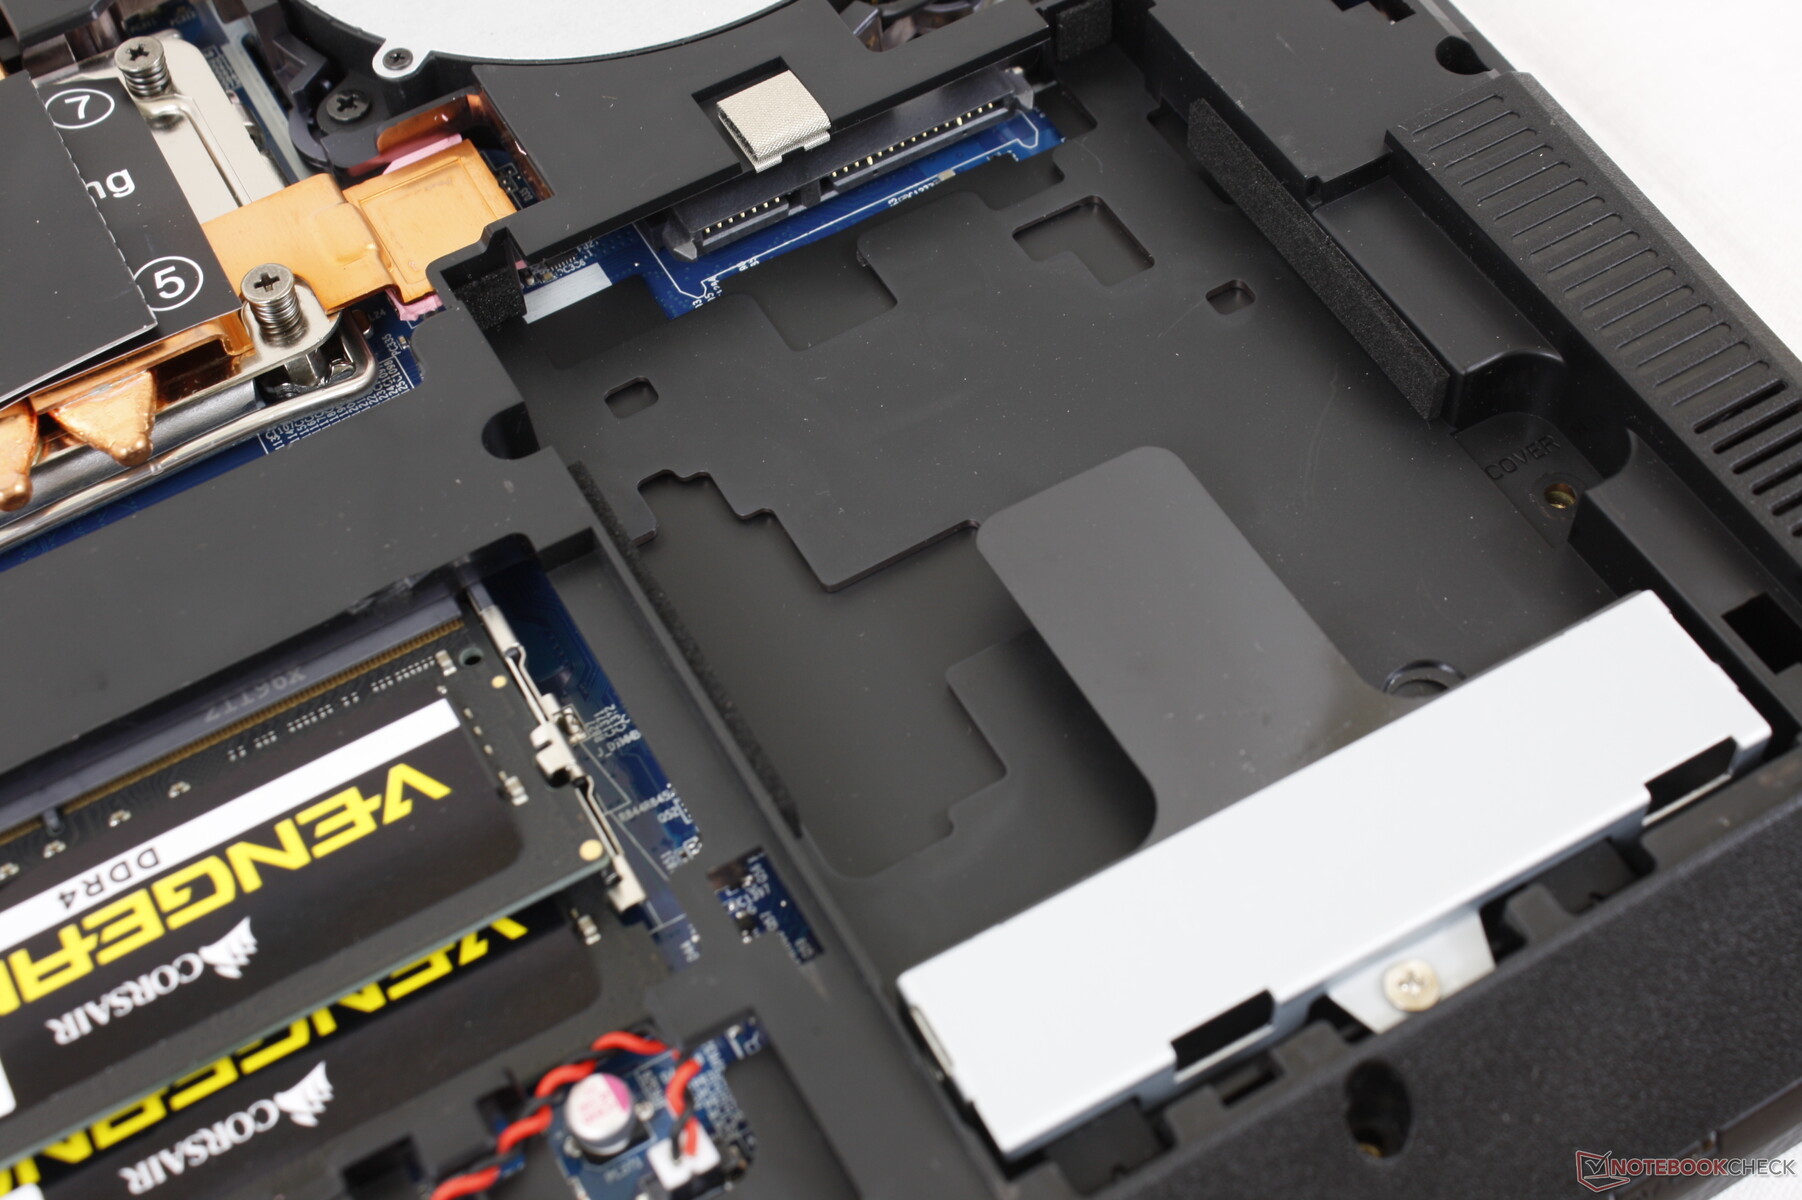
El Raptor X15 tiene una CPU LGA1700 extraíble con muchas opciones de almacenamiento, pero el diseño general de su chasis podría mejorar.
No obstante, hay algunas características notables que merecen ser alabadas. El modelo admite unidades SATA III de 2,5 pulgadas y una batería fácilmente extraíble, por ejemplo, que ahora son rarezas en los portátiles de juego modernos. Sin embargo, si no crees que vas a aprovechar su zócalo LGA1700, el mayor punto de venta del Raptor X15 se vuelve discutible.
Precio y disponibilidad
Eurocom ya está distribuyendo el Raptor X15 a partir de 2.000 dólares para la configuración básica o aproximadamente 3.500 dólares como está configurado en nuestra revisión.
Eurocom Raptor X15
- 06/09/2022 v7 (old)
Allen Ngo
Price comparison

