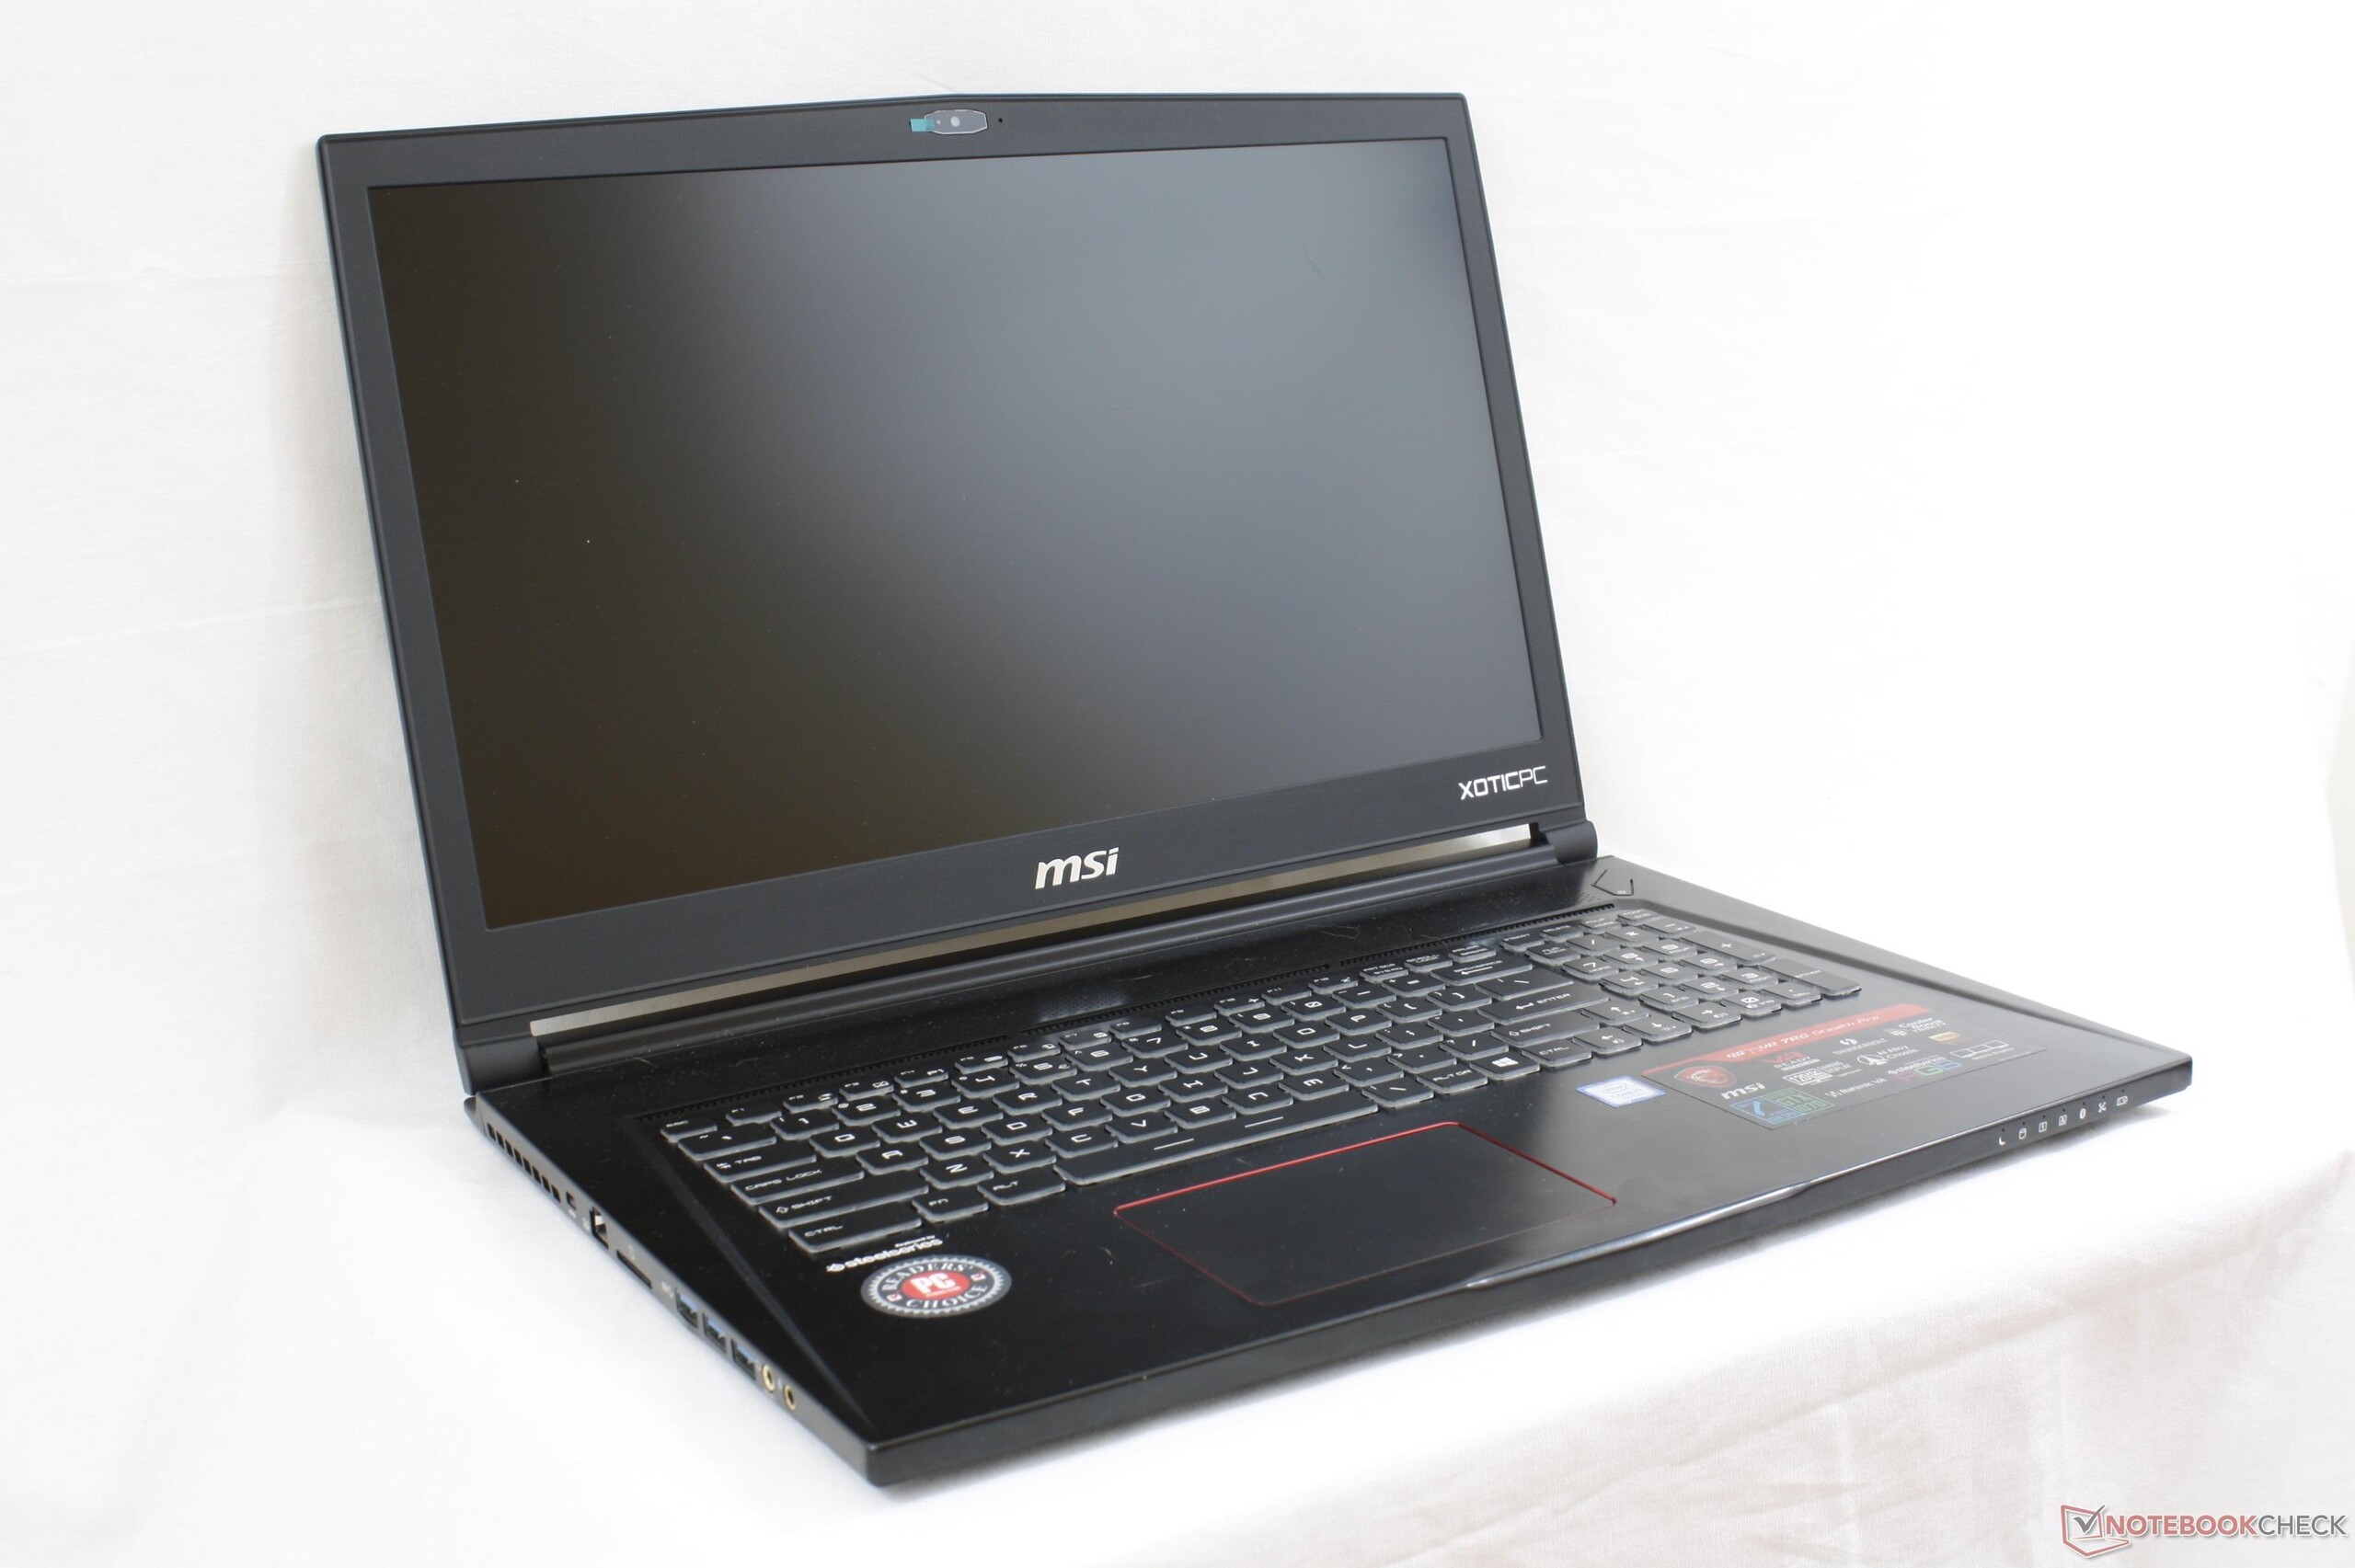
Breve análisis del MSI GS73VR 7RG (i7-7700HQ, GTX 1070 Max-Q, FHD)


| SD Card Reader | |
| average JPG Copy Test (av. of 3 runs) | |
| MSI GS73VR 7RG | |
| Eurocom Sky X7E2 | |
| MSI GS73VR 7RF | |
| maximum AS SSD Seq Read Test (1GB) | |
| Eurocom Sky X7E2 | |
| MSI GS73VR 7RG | |
| MSI GS73VR 7RF | |
| Networking | |
| iperf3 transmit AX12 | |
| MSI GT73VR 7RF-296 | |
| Aorus X7 v7 | |
| MSI GS73VR 7RG | |
| iperf3 receive AX12 | |
| MSI GT73VR 7RF-296 | |
| MSI GS73VR 7RG | |
| Aorus X7 v7 | |
| |||||||||||||||||||||||||
iluminación: 79 %
Brillo con batería: 350.9 cd/m²
Contraste: 1063:1 (Negro: 0.33 cd/m²)
ΔE ColorChecker Calman: 7.7 | ∀{0.5-29.43 Ø4.71}
ΔE Greyscale Calman: 11.1 | ∀{0.09-98 Ø4.96}
100% sRGB (Argyll 1.6.3 3D)
77.74% AdobeRGB 1998 (Argyll 1.6.3 3D)
86.9% AdobeRGB 1998 (Argyll 3D)
100% sRGB (Argyll 3D)
89.6% Display P3 (Argyll 3D)
Gamma: 2.11
CCT: 11813 K
| MSI GS73VR 7RG ID: CMN1747, Name: Chi Mei N173HHE-G32, TN LED, 17.3", 1920x1080 | Lenovo Legion Y920-17IKB LP173WF4-SPF5, IPS, 17.3", 1920x1080 | Aorus X7 v7 AU Optronics B173QTN01.4 (AUO1496), TN LED, 17.3", 2560x1440 | Gigabyte P57X v7 SHP145E, IPS, 17.3", 3840x2160 | EVGA SC17 GTX 1070 Sharp LQ173D1JW31, IPS, 17.3", 3840x2160 | |
|---|---|---|---|---|---|
| Display | -24% | -23% | 4% | 4% | |
| Display P3 Coverage (%) | 89.6 | 66.4 -26% | 63 -30% | 87.8 -2% | 87.3 -3% |
| sRGB Coverage (%) | 100 | 84 -16% | 87.1 -13% | 100 0% | 100 0% |
| AdobeRGB 1998 Coverage (%) | 86.9 | 61.4 -29% | 63.7 -27% | 98.9 14% | 98.8 14% |
| Response Times | -99% | 14% | -297% | -206% | |
| Response Time Grey 50% / Grey 80% * (ms) | 23.6 ? | 28.8 ? -22% | 24 ? -2% | 55.6 ? -136% | 45.6 ? -93% |
| Response Time Black / White * (ms) | 8.4 ? | 23.2 ? -176% | 6 ? 29% | 46.8 ? -457% | 35.2 ? -319% |
| PWM Frequency (Hz) | 26040 ? | 20000 | 1000 ? | 1042 ? | |
| Screen | 9% | -3% | 17% | 17% | |
| Brightness middle (cd/m²) | 350.9 | 422.3 20% | 375 7% | 441.3 26% | 399.1 14% |
| Brightness (cd/m²) | 311 | 378 22% | 353 14% | 408 31% | 360 16% |
| Brightness Distribution (%) | 79 | 81 3% | 85 8% | 86 9% | 81 3% |
| Black Level * (cd/m²) | 0.33 | 0.48 -45% | 0.58 -76% | 0.44 -33% | 0.4 -21% |
| Contrast (:1) | 1063 | 880 -17% | 647 -39% | 1003 -6% | 998 -6% |
| Colorchecker dE 2000 * | 7.7 | 4.4 43% | 6.06 21% | 5.1 34% | 4.78 38% |
| Colorchecker dE 2000 max. * | 14.4 | 9.2 36% | 10.54 27% | 9.8 32% | 7.65 47% |
| Greyscale dE 2000 * | 11.1 | 2.8 75% | 5.68 49% | 4.3 61% | 3.8 66% |
| Gamma | 2.11 104% | 2.22 99% | 2.3 96% | 2.08 106% | 2.03 108% |
| CCT | 11813 55% | 6403 102% | 7998 81% | 7345 88% | 7288 89% |
| Color Space (Percent of AdobeRGB 1998) (%) | 77.74 | 55 -29% | 57 -27% | 87 12% | 86.9 12% |
| Color Space (Percent of sRGB) (%) | 100 | 84 -16% | 87 -13% | 100 0% | 100 0% |
| Media total (Programa/Opciones) | -38% /
-12% | -4% /
-5% | -92% /
-28% | -62% /
-15% |
* ... más pequeño es mejor
Tiempos de respuesta del display
| ↔ Tiempo de respuesta de Negro a Blanco | ||
|---|---|---|
| 8.4 ms ... subida ↗ y bajada ↘ combinada | ↗ 6 ms subida | 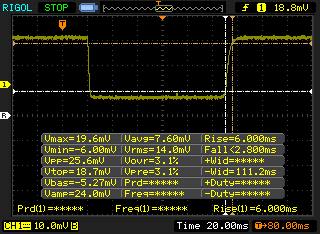 |
| ↘ 2.4 ms bajada | ||
| La pantalla mostró tiempos de respuesta rápidos en nuestros tests y debería ser adecuada para juegos. En comparación, todos los dispositivos de prueba van de ##min### (mínimo) a 240 (máximo) ms. » 24 % de todos los dispositivos son mejores. Esto quiere decir que el tiempo de respuesta medido es mejor que la media (19.8 ms) de todos los dispositivos testados. | ||
| ↔ Tiempo de respuesta 50% Gris a 80% Gris | ||
| 23.6 ms ... subida ↗ y bajada ↘ combinada | ↗ 13.6 ms subida | 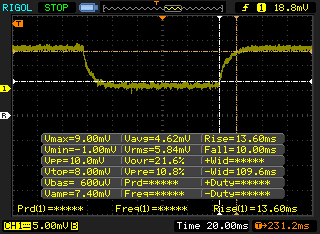 |
| ↘ 10 ms bajada | ||
| La pantalla mostró buenos tiempos de respuesta en nuestros tests pero podría ser demasiado lenta para los jugones competitivos. En comparación, todos los dispositivos de prueba van de ##min### (mínimo) a 636 (máximo) ms. » 34 % de todos los dispositivos son mejores. Esto quiere decir que el tiempo de respuesta medido es mejor que la media (31 ms) de todos los dispositivos testados. | ||
Parpadeo de Pantalla / PWM (Pulse-Width Modulation)
| Parpadeo de Pantalla / PWM detectado | 26040 Hz | ≤ 10 % de brillo | 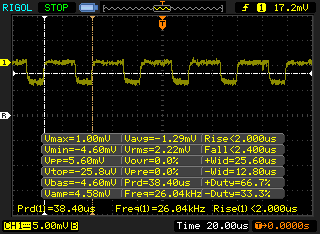 |
La retroiluminación del display parpadea a 26040 Hz (seguramente usa PWM - Pulse-Width Modulation) a un brillo del 10 % e inferior. Sobre este nivel de brillo no debería darse parpadeo / PWM. La frecuencia de 26040 Hz es bastante alta, por lo que la mayoría de gente sensible al parpadeo no debería ver parpadeo o tener fatiga visual. Comparación: 52 % de todos los dispositivos testados no usaron PWM para atenuar el display. Si se usó, medimos una media de 7754 (mínimo: 5 - máxmo: 343500) Hz. | |||
| wPrime 2.10 - 1024m | |
| Asus Zephyrus GX501VS | |
| MSI GS73VR 7RG | |
| Coffee Lake: Análisis completo de i7-8700K y i5-8400 | |
| Eurocom Tornado F5 | |
| no name | |
* ... más pequeño es mejor
| PCMark 8 | |
| Home Score Accelerated v2 | |
| Lenovo Legion Y920-17IKB | |
| EVGA SC17 GTX 1070 | |
| MSI GS73VR 7RG | |
| MSI GF72VR 7RF | |
| Work Score Accelerated v2 | |
| Lenovo Legion Y920-17IKB | |
| MSI GS73VR 7RG | |
| MSI GF72VR 7RF | |
| EVGA SC17 GTX 1070 | |
| Creative Score Accelerated v2 | |
| Lenovo Legion Y920-17IKB | |
| EVGA SC17 GTX 1070 | |
| MSI GS73VR 7RG | |
| MSI GF72VR 7RF | |
| PCMark 10 | |
| Digital Content Creation | |
| Lenovo Legion Y920-17IKB | |
| MSI GS73VR 7RG | |
| MSI GF72VR 7RF | |
| Productivity | |
| Lenovo Legion Y920-17IKB | |
| MSI GF72VR 7RF | |
| MSI GS73VR 7RG | |
| Essentials | |
| Lenovo Legion Y920-17IKB | |
| MSI GS73VR 7RG | |
| MSI GF72VR 7RF | |
| Score | |
| Lenovo Legion Y920-17IKB | |
| MSI GS73VR 7RG | |
| MSI GF72VR 7RF | |
| PCMark 8 Home Score Accelerated v2 | 4394 puntos | |
| PCMark 8 Creative Score Accelerated v2 | 5491 puntos | |
| PCMark 8 Work Score Accelerated v2 | 5215 puntos | |
| PCMark 10 Score | 4891 puntos | |
ayuda | ||
| MSI GS73VR 7RG Samsung SSD PM871 MZNLN512HMJP | Lenovo Legion Y920-17IKB Samsung SM961 MZVKW512HMJP m.2 PCI-e | Gigabyte P57X v7 Transcend MTS800 256GB M.2 (TS256GMTS800) | EVGA SC17 GTX 1070 Samsung SM951 MZVPV256 m.2 | MSI GT73VR 7RF-296 2x Samsung SM951 MZVPV256HDGL (RAID 0) | |
|---|---|---|---|---|---|
| AS SSD | 179% | -34% | 107% | 184% | |
| Copy Game MB/s (MB/s) | 381.5 | 1117 193% | 389.8 2% | 1034 171% | |
| Copy Program MB/s (MB/s) | 229.8 | 407.8 77% | 206.1 -10% | 470 105% | |
| Copy ISO MB/s (MB/s) | 423.5 | 1975 366% | 392.2 -7% | 1337 216% | |
| Score Total (Points) | 1064 | 3080 189% | 721 -32% | 2328 119% | 3310 211% |
| Score Write (Points) | 417 | 1506 261% | 249 -40% | 487 17% | 1054 153% |
| Score Read (Points) | 421 | 1072 155% | 314 -25% | 1238 194% | 1511 259% |
| Access Time Write * (ms) | 0.032 | 0.029 9% | 0.055 -72% | 0.033 -3% | 0.03 6% |
| Access Time Read * (ms) | 0.051 | 0.044 14% | 0.11 -116% | 0.049 4% | 0.035 31% |
| 4K-64 Write (MB/s) | 273.6 | 1220 346% | 151.4 -45% | 260.9 -5% | 697 155% |
| 4K-64 Read (MB/s) | 337.7 | 747 121% | 241.4 -29% | 999 196% | 1165 245% |
| 4K Write (MB/s) | 96.8 | 127.1 31% | 72 -26% | 112.1 16% | 123.8 28% |
| 4K Read (MB/s) | 33.69 | 48.23 43% | 23.65 -30% | 45.64 35% | 46.75 39% |
| Seq Write (MB/s) | 465.1 | 1589 242% | 260.9 -44% | 1144 146% | 2332 401% |
| Seq Read (MB/s) | 497.9 | 2768 456% | 491.9 -1% | 1934 288% | 2988 500% |
* ... más pequeño es mejor

| 3DMark 11 Performance | 14903 puntos | |
| 3DMark Ice Storm Standard Score | 128787 puntos | |
| 3DMark Cloud Gate Standard Score | 27498 puntos | |
| 3DMark Fire Strike Score | 12077 puntos | |
| 3DMark Fire Strike Extreme Score | 6394 puntos | |
ayuda | ||
| Rise of the Tomb Raider - 1920x1080 Very High Preset AA:FX AF:16x | |
| Alienware 17 R4 | |
| Asus Zephyrus GX501 | |
| Nvidia GeForce GTX 1070 Founders Edition | |
| MSI GE73VR 7RF Raider | |
| Asus Zephyrus GX501VS | |
| MSI GS73VR 7RG | |
| MSI GS43VR 7RE-069US | |
| EVGA SC17 | |
| HP Omen 15-ce002ng | |
| Zotac ZBOX Magnus EN51050 | |
| BioShock Infinite - 1920x1080 Ultra Preset, DX11 (DDOF) | |
| Alienware 17 R4 | |
| Nvidia GeForce GTX 1070 Founders Edition | |
| MSI GE73VR 7RF Raider | |
| Asus Zephyrus GX501VS | |
| MSI GS73VR 7RG | |
| MSI GS43VR 7RE-069US | |
| EVGA SC17 | |
| Lenovo Legion Y520-15IKBN 80WK0042GE | |
| Zotac ZBOX Magnus EN51050 | |
| The Witcher 3 - 1920x1080 Ultra Graphics & Postprocessing (HBAO+) | |
| Alienware 17 R4 | |
| Nvidia GeForce GTX 1070 Founders Edition | |
| Asus Zephyrus GX501 | |
| MSI GE73VR 7RF Raider | |
| MSI GS73VR 7RG | |
| Asus Zephyrus GX501VS | |
| MSI GS43VR 7RE-069US | |
| HP Omen 15-ce002ng | |
| Lenovo Legion Y520-15IKBN 80WK0042GE | |
| Zotac ZBOX Magnus EN51050 | |
| bajo | medio | alto | ultra | |
|---|---|---|---|---|
| BioShock Infinite (2013) | 127.6 | |||
| Metro: Last Light (2013) | 96.1 | |||
| Thief (2014) | 93.3 | |||
| The Witcher 3 (2015) | 98.2 | 51.3 | ||
| Batman: Arkham Knight (2015) | 106 | 56 | ||
| Metal Gear Solid V (2015) | 60 | 60 | ||
| Fallout 4 (2015) | 88.3 | |||
| Rise of the Tomb Raider (2016) | 97.7 | 83.5 | ||
| Ashes of the Singularity (2016) | 67.5 | 63.5 | ||
| Overwatch (2016) | 138.1 | |||
| Mafia 3 (2016) | 55.1 | |||
| Prey (2017) | 132 | |||
| Dirt 4 (2017) | 115.4 | 72.8 | ||
| F1 2017 (2017) | 125 | 81 |
Ruido
| Ocioso |
| 29.4 / 30.7 / 34 dB(A) |
| Carga |
| 42 / 45.8 dB(A) |
 | ||
30 dB silencioso 40 dB(A) audible 50 dB(A) ruidosamente alto |
||
min: | ||
| MSI GS73VR 7RG GeForce GTX 1070 Max-Q, i7-7700HQ, Samsung SSD PM871 MZNLN512HMJP | MSI GS73VR 6RF GeForce GTX 1060 Mobile, 6700HQ, SanDisk SD8SN8U1T001122 | Gigabyte P57X v7 GeForce GTX 1070 Mobile, i7-7700HQ, Transcend MTS800 256GB M.2 (TS256GMTS800) | EVGA SC17 GTX 1070 GeForce GTX 1070 Mobile, 6820HK, Samsung SM951 MZVPV256 m.2 | Alienware 17 R4 GeForce GTX 1080 Mobile, i7-7820HK, SK Hynix PC300 NVMe 512 GB | HP Omen 15-ce002ng GeForce GTX 1060 Max-Q, i7-7700HQ, Samsung PM961 MZVLW256HEHP | |
|---|---|---|---|---|---|---|
| Noise | -6% | -5% | -8% | -12% | -3% | |
| apagado / medio ambiente * (dB) | 28 | 28.4 -1% | 29 -4% | 29.2 -4% | 28.2 -1% | 30 -7% |
| Idle Minimum * (dB) | 29.4 | 31.9 -9% | 30.4 -3% | 33.9 -15% | 35.6 -21% | 30 -2% |
| Idle Average * (dB) | 30.7 | 32 -4% | 32.1 -5% | 33.9 -10% | 35.6 -16% | 33 -7% |
| Idle Maximum * (dB) | 34 | 34 -0% | 32.1 6% | 33.9 -0% | 35.7 -5% | 37 -9% |
| Load Average * (dB) | 42 | 47 -12% | 45.6 -9% | 43.8 -4% | 50.2 -20% | 41 2% |
| Witcher 3 ultra * (dB) | 45.8 | 50.2 -10% | 42 8% | |||
| Load Maximum * (dB) | 45.8 | 49.4 -8% | 51.5 -12% | 53.4 -17% | 50.2 -10% | 50 -9% |
* ... más pequeño es mejor
(-) La temperatura máxima en la parte superior es de 52.2 °C / 126 F, frente a la media de 40.4 °C / 105 F, que oscila entre 21.2 y 68.8 °C para la clase Gaming.
(-) El fondo se calienta hasta un máximo de 46.6 °C / 116 F, frente a la media de 43.2 °C / 110 F
(+) En reposo, la temperatura media de la parte superior es de 28.7 °C / 84# F, frente a la media del dispositivo de 33.9 °C / 93 F.
(-) Jugando a The Witcher 3, la temperatura media de la parte superior es de 38.4 °C / 101 F, frente a la media del dispositivo de 33.9 °C / 93 F.
(+) Los reposamanos y el panel táctil alcanzan como máximo la temperatura de la piel (33.6 °C / 92.5 F) y, por tanto, no están calientes.
(-) La temperatura media de la zona del reposamanos de dispositivos similares fue de 28.8 °C / 83.8 F (-4.8 °C / -8.7 F).
MSI GS73VR 7RG análisis de audio
(-) | altavoces no muy altos (#71.6 dB)
Graves 100 - 315 Hz
(-) | casi sin bajos - de media 20.4% inferior a la mediana
(+) | el bajo es lineal (5.7% delta a la frecuencia anterior)
Medios 400 - 2000 Hz
(±) | medias más altas - de media 10% más altas que la mediana
(±) | la linealidad de los medios es media (13.2% delta respecto a la frecuencia anterior)
Altos 2 - 16 kHz
(+) | máximos equilibrados - a sólo 3.4% de la mediana
(±) | la linealidad de los máximos es media (14.9% delta a frecuencia anterior)
Total 100 - 16.000 Hz
(-) | el sonido global no es lineal (34.7% de diferencia con la mediana)
En comparación con la misma clase
» 99% de todos los dispositivos probados de esta clase eran mejores, 1% similares, 1% peores
» El mejor tuvo un delta de 6%, la media fue 18%, el peor fue ###max##%
En comparación con todos los dispositivos probados
» 93% de todos los dispositivos probados eran mejores, 1% similares, 6% peores
» El mejor tuvo un delta de 4%, la media fue 23%, el peor fue ###max##%
Apple MacBook 12 (Early 2016) 1.1 GHz análisis de audio
(+) | los altavoces pueden reproducir a un volumen relativamente alto (#83.6 dB)
Graves 100 - 315 Hz
(±) | lubina reducida - en promedio 11.3% inferior a la mediana
(±) | la linealidad de los graves es media (14.2% delta a frecuencia anterior)
Medios 400 - 2000 Hz
(+) | medios equilibrados - a sólo 2.4% de la mediana
(+) | los medios son lineales (5.5% delta a la frecuencia anterior)
Altos 2 - 16 kHz
(+) | máximos equilibrados - a sólo 2% de la mediana
(+) | los máximos son lineales (4.5% delta a la frecuencia anterior)
Total 100 - 16.000 Hz
(+) | el sonido global es lineal (10.2% de diferencia con la mediana)
En comparación con la misma clase
» 7% de todos los dispositivos probados de esta clase eran mejores, 2% similares, 90% peores
» El mejor tuvo un delta de 5%, la media fue 18%, el peor fue ###max##%
En comparación con todos los dispositivos probados
» 5% de todos los dispositivos probados eran mejores, 1% similares, 94% peores
» El mejor tuvo un delta de 4%, la media fue 23%, el peor fue ###max##%
| Off / Standby | |
| Ocioso | |
| Carga |
|
Clave:
min: | |
| MSI GS73VR 7RG i7-7700HQ, GeForce GTX 1070 Max-Q, Samsung SSD PM871 MZNLN512HMJP, TN LED, 1920x1080, 17.3" | MSI GF72VR 7RF i7-7700HQ, GeForce GTX 1060 Mobile, Samsung PM961 MZVLW256HEHP, TN LED, 1920x1080, 17.3" | Gigabyte Aero 15X i7-7700HQ, GeForce GTX 1070 Max-Q, Samsung SM961 MZVKW512HMJP m.2 PCI-e, IPS, 1920x1080, 15.6" | Alienware 17 R4 i7-7820HK, GeForce GTX 1080 Mobile, SK Hynix PC300 NVMe 512 GB, TN LED, 2560x1440, 17.3" | MSI GE73VR 7RF Raider i7-7700HQ, GeForce GTX 1070 Mobile, Toshiba HG6 THNSNJ256G8NY, TN WLED, 1920x1080, 17.3" | |
|---|---|---|---|---|---|
| Power Consumption | -13% | 8% | -102% | -20% | |
| Idle Minimum * (Watt) | 10.1 | 15.7 -55% | 10 1% | 37.5 -271% | 10 1% |
| Idle Average * (Watt) | 18.3 | 21.4 -17% | 13 29% | 37.6 -105% | 18 2% |
| Idle Maximum * (Watt) | 19.6 | 21.9 -12% | 20 -2% | 37.6 -92% | 26 -33% |
| Load Average * (Watt) | 87.6 | 83.9 4% | 79 10% | 122.4 -40% | 97 -11% |
| Witcher 3 ultra * (Watt) | 136.3 | 130.2 4% | 120 12% | 180.3 -32% | 183 -34% |
| Load Maximum * (Watt) | 160.7 | 159.6 1% | 165 -3% | 277.4 -73% | 230 -43% |
* ... más pequeño es mejor
| MSI GS73VR 7RG i7-7700HQ, GeForce GTX 1070 Max-Q, 51 Wh | Aorus X7 v7 i7-7820HK, GeForce GTX 1070 Mobile, 94 Wh | MSI GF72VR 7RF i7-7700HQ, GeForce GTX 1060 Mobile, 43 Wh | Gigabyte Aero 15X i7-7700HQ, GeForce GTX 1070 Max-Q, 94.2 Wh | Alienware 17 R4 i7-7820HK, GeForce GTX 1080 Mobile, 99 Wh | Lenovo Legion Y920-17IKB i7-7820HK, GeForce GTX 1070 Mobile, 90 Wh | |
|---|---|---|---|---|---|---|
| Duración de Batería | -1% | -32% | 147% | -2% | 50% | |
| Reader / Idle (h) | 5.8 | 3.7 -36% | 3.4 -41% | 13 124% | 4.6 -21% | 5.9 2% |
| WiFi v1.3 (h) | 3.2 | 3 -6% | 2.4 -25% | 8.2 156% | 3 -6% | 4.7 47% |
| Load (h) | 1 | 1.4 40% | 0.7 -30% | 2.6 160% | 1.2 20% | 2 100% |
Pro
Contra

La renovación Max-Q del GS73VR lo convierte en la mejor iteración de la serie hasta ahora. No sólo es más rápido que la vieja configuración GTX 1060 SKU bajo una envoltura de potencia muy similar, pero también va más quedo y fresco. Son exactamente los tipos de pasos que la serie GS debería tomar para derrotar a los demás portátiles gaming superdelgados del mercado.
Aunque el GS73VR 7RG ha mejorado notablemente respecto a los GS73VR 7RF y 6RF, aún tiene mucho camino que andar. El 7RG es uno de los portátiles Max-Q más ruidosos que hemos testados junto con el reciente Eurocom Q5. No es ni de lejos tan ruidoso como el Alienware 17 o el Eurocom Tornado F5, pero queda a medio camino entre "GTX Max-Q " y "GTX estándar", demasiado para nuestro gusto. El Asus Zephyrus es un portátil más pequeño pero sigue pudiendo albergar y enfriar una GTX 1080 Max-Q con ventiladores mucho más quedos.
Aparte de las mencionadas mejoras, todos los pros y contras de las anteriores iteraciones del GS73VR permanecen. El chasis podría ser más rígido, el trackpad más firme, y la calidad de construcción en general puede ser algo imperfecta en los bordes. Nos sigue pasmando por qué sacar la bandeja inferior anularía la garantía automáticamente cuando cambiar el HDD en realidad es un proceso muy sencillo. El display de 120 Hz y el teclado SteelSeries por lo demás están muy bien.
Es la versión más queda y potente del GS73VR que existe. En general, empero, hay portáitles Max-Q más quedos y potentes, en particular en el espacio de 15" en el que el Zephyrus GX501 y el Predator Triton son actualmente los reinantes.
Ésta es una versión acortada del análisis original. Puedes leer el análisis completo en inglés aquí.
MSI GS73VR 7RG
- 10/19/2017 v6 (old)
Allen Ngo
Price comparison
