Verdict - Recién optimizado para oficinas y minoristas
Puede que no lo parezca a primera vista, pero el Cubi NUC AI+ 3MG es un salto significativo con respecto al Cubi NUC AI+ 2MG del año pasado. Hay muchos cambios bajo el capó, incluida una placa base revisada con RAM extraíble, un procedimiento de mantenimiento aún más sencillo, más puertos útiles y un diseño mucho más pequeño y discreto para integrarse mejor en entornos más profesionales. De hecho, se trata de uno de los mini PC Intel más pequeños que admite hasta 128 GB de memoria extraíble. El significativo aumento del rendimiento de la CPU también aborda una de las principales preocupaciones sobre el modelo Lunar Lake más antiguo.
Por el contrario, el menor tamaño conlleva ciertos compromisos. El lector MicroSD del modelo del año pasado ha desaparecido y no hay altavoz integrado, lo que habría hecho el sistema más versátil. Las temperaturas del núcleo son en general más cálidas y el ruido de los ventiladores no es necesariamente ni mejor ni peor que antes. El ladrillo de alimentación relativamente grande, que pesa casi tanto como el propio mini PC, puede ser difícil de guardar dependiendo del entorno. Y por último, aunque la gran capacidad de RAM es una característica destacada, otros aspectos han pasado a un segundo plano, como el almacenamiento local y el rendimiento de la GPU, ya que modelos de la competencia como el GMK EVO-X1 o Asus NUC 15 Pro+ son cada uno de ellos máquinas más rápidas y con más opciones de almacenamiento.
Pro
Contra
Precio y disponibilidad
Newegg está enviando actualmente el MSI Cubi NUC AI+ 3MG barebones con CPU Core Ultra 9 por 830 dólares. Si se configura con 32 GB de RAM, el precio salta hasta los 1220 $.
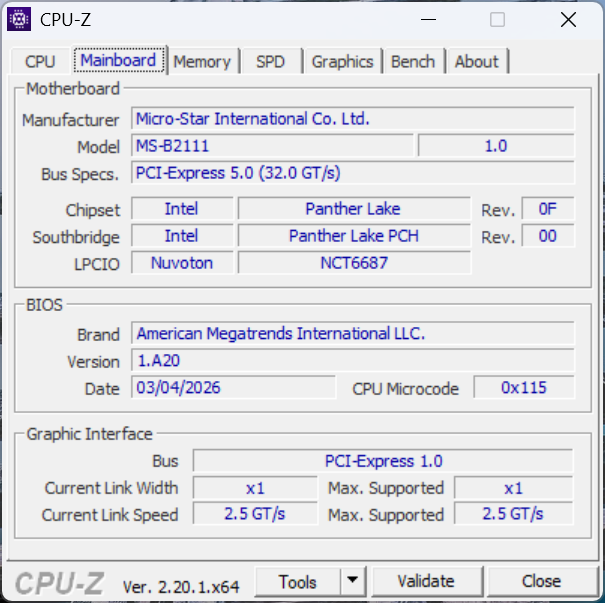
El Cubi NUC AI+ 3MG sucede al del año pasado Cubi NUC AI+ 2MG cambiando la CPU Intel Lunar Lake por las nuevas opciones Panther Lake. El diseño externo también ha cambiado para ser notablemente más pequeño y ligero que antes.
Nuestra unidad de prueba es una configuración de gama alta con la CPU Core Ultra 9 386H por aproximadamente 1.100 dólares si se configura con RAM y almacenamiento. Afortunadamente, las opciones básicas están disponibles a precios iniciales más bajos. También hay disponibles SKU con Core Ultra 5 y Core Ultra 7 de nivel básico.
El Cubi NUC AI+ 3MG compite con otros mini PC centrados en la empresa y en la venta al por menor/oficina como la Serie GMK EVO, Asus NUC 15 Pro+o el HP EliteBoard G1a AI.
Más reseñas de MSI:
Especificaciones
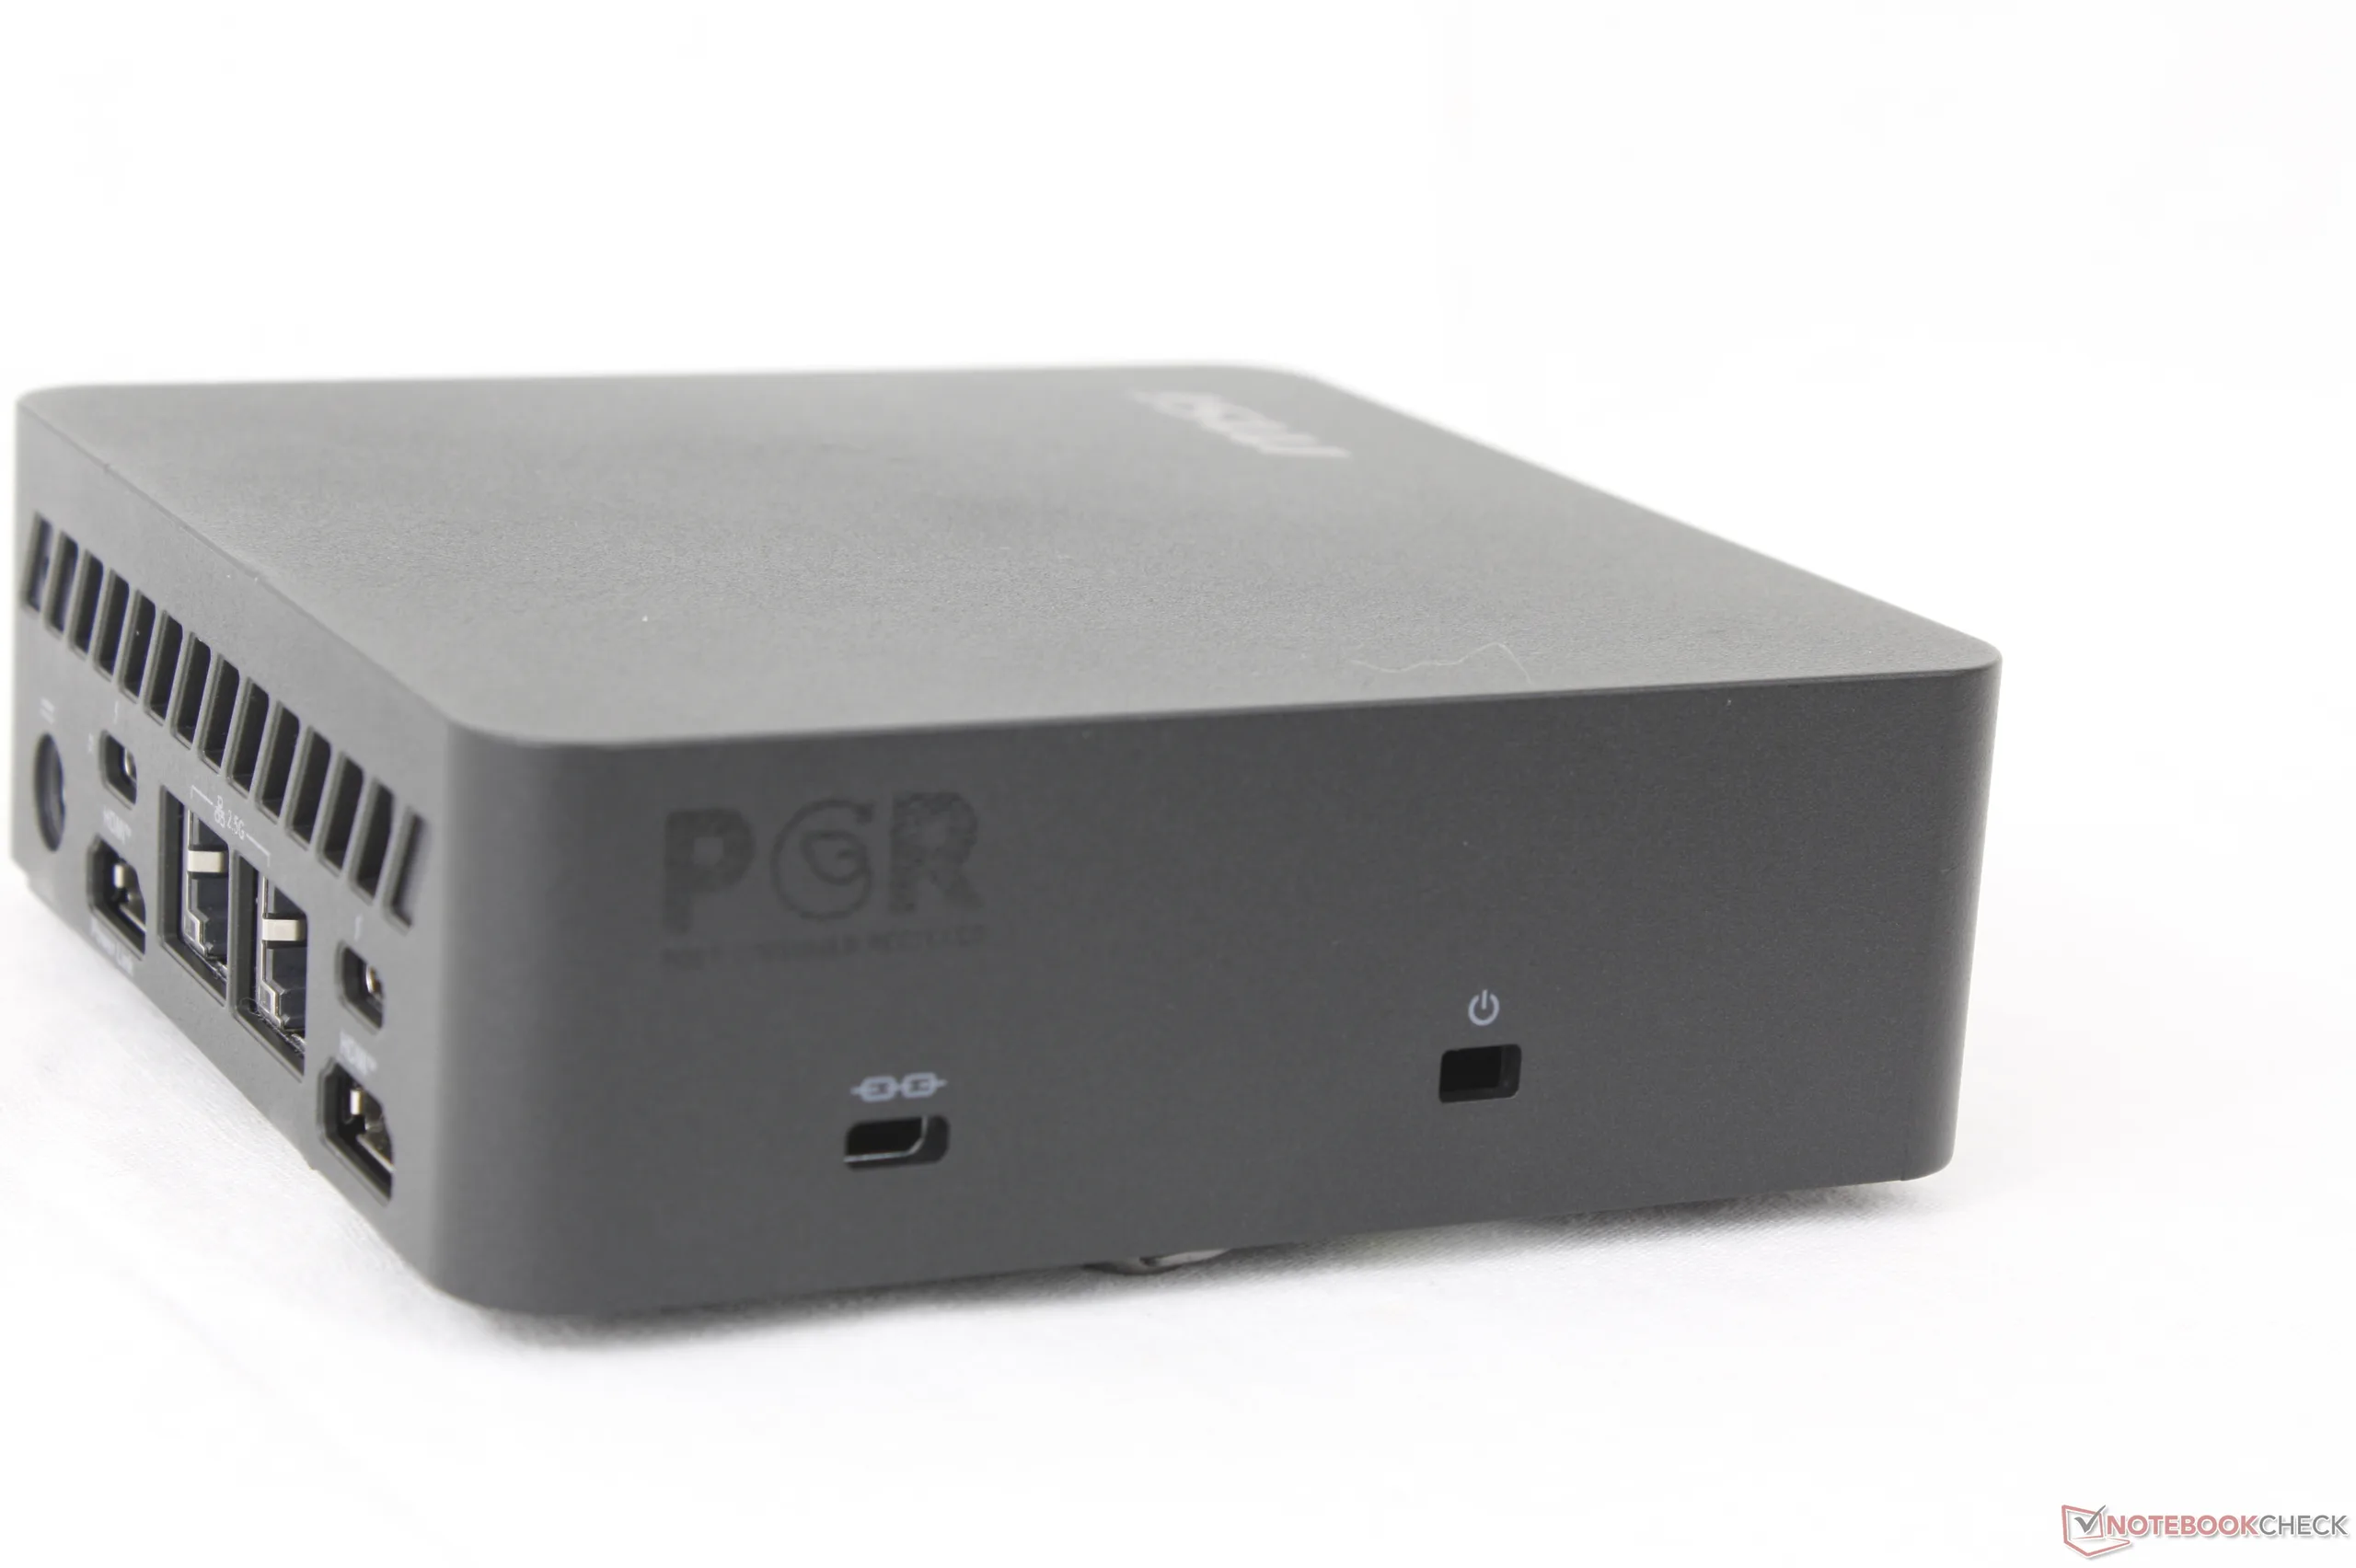
Caso
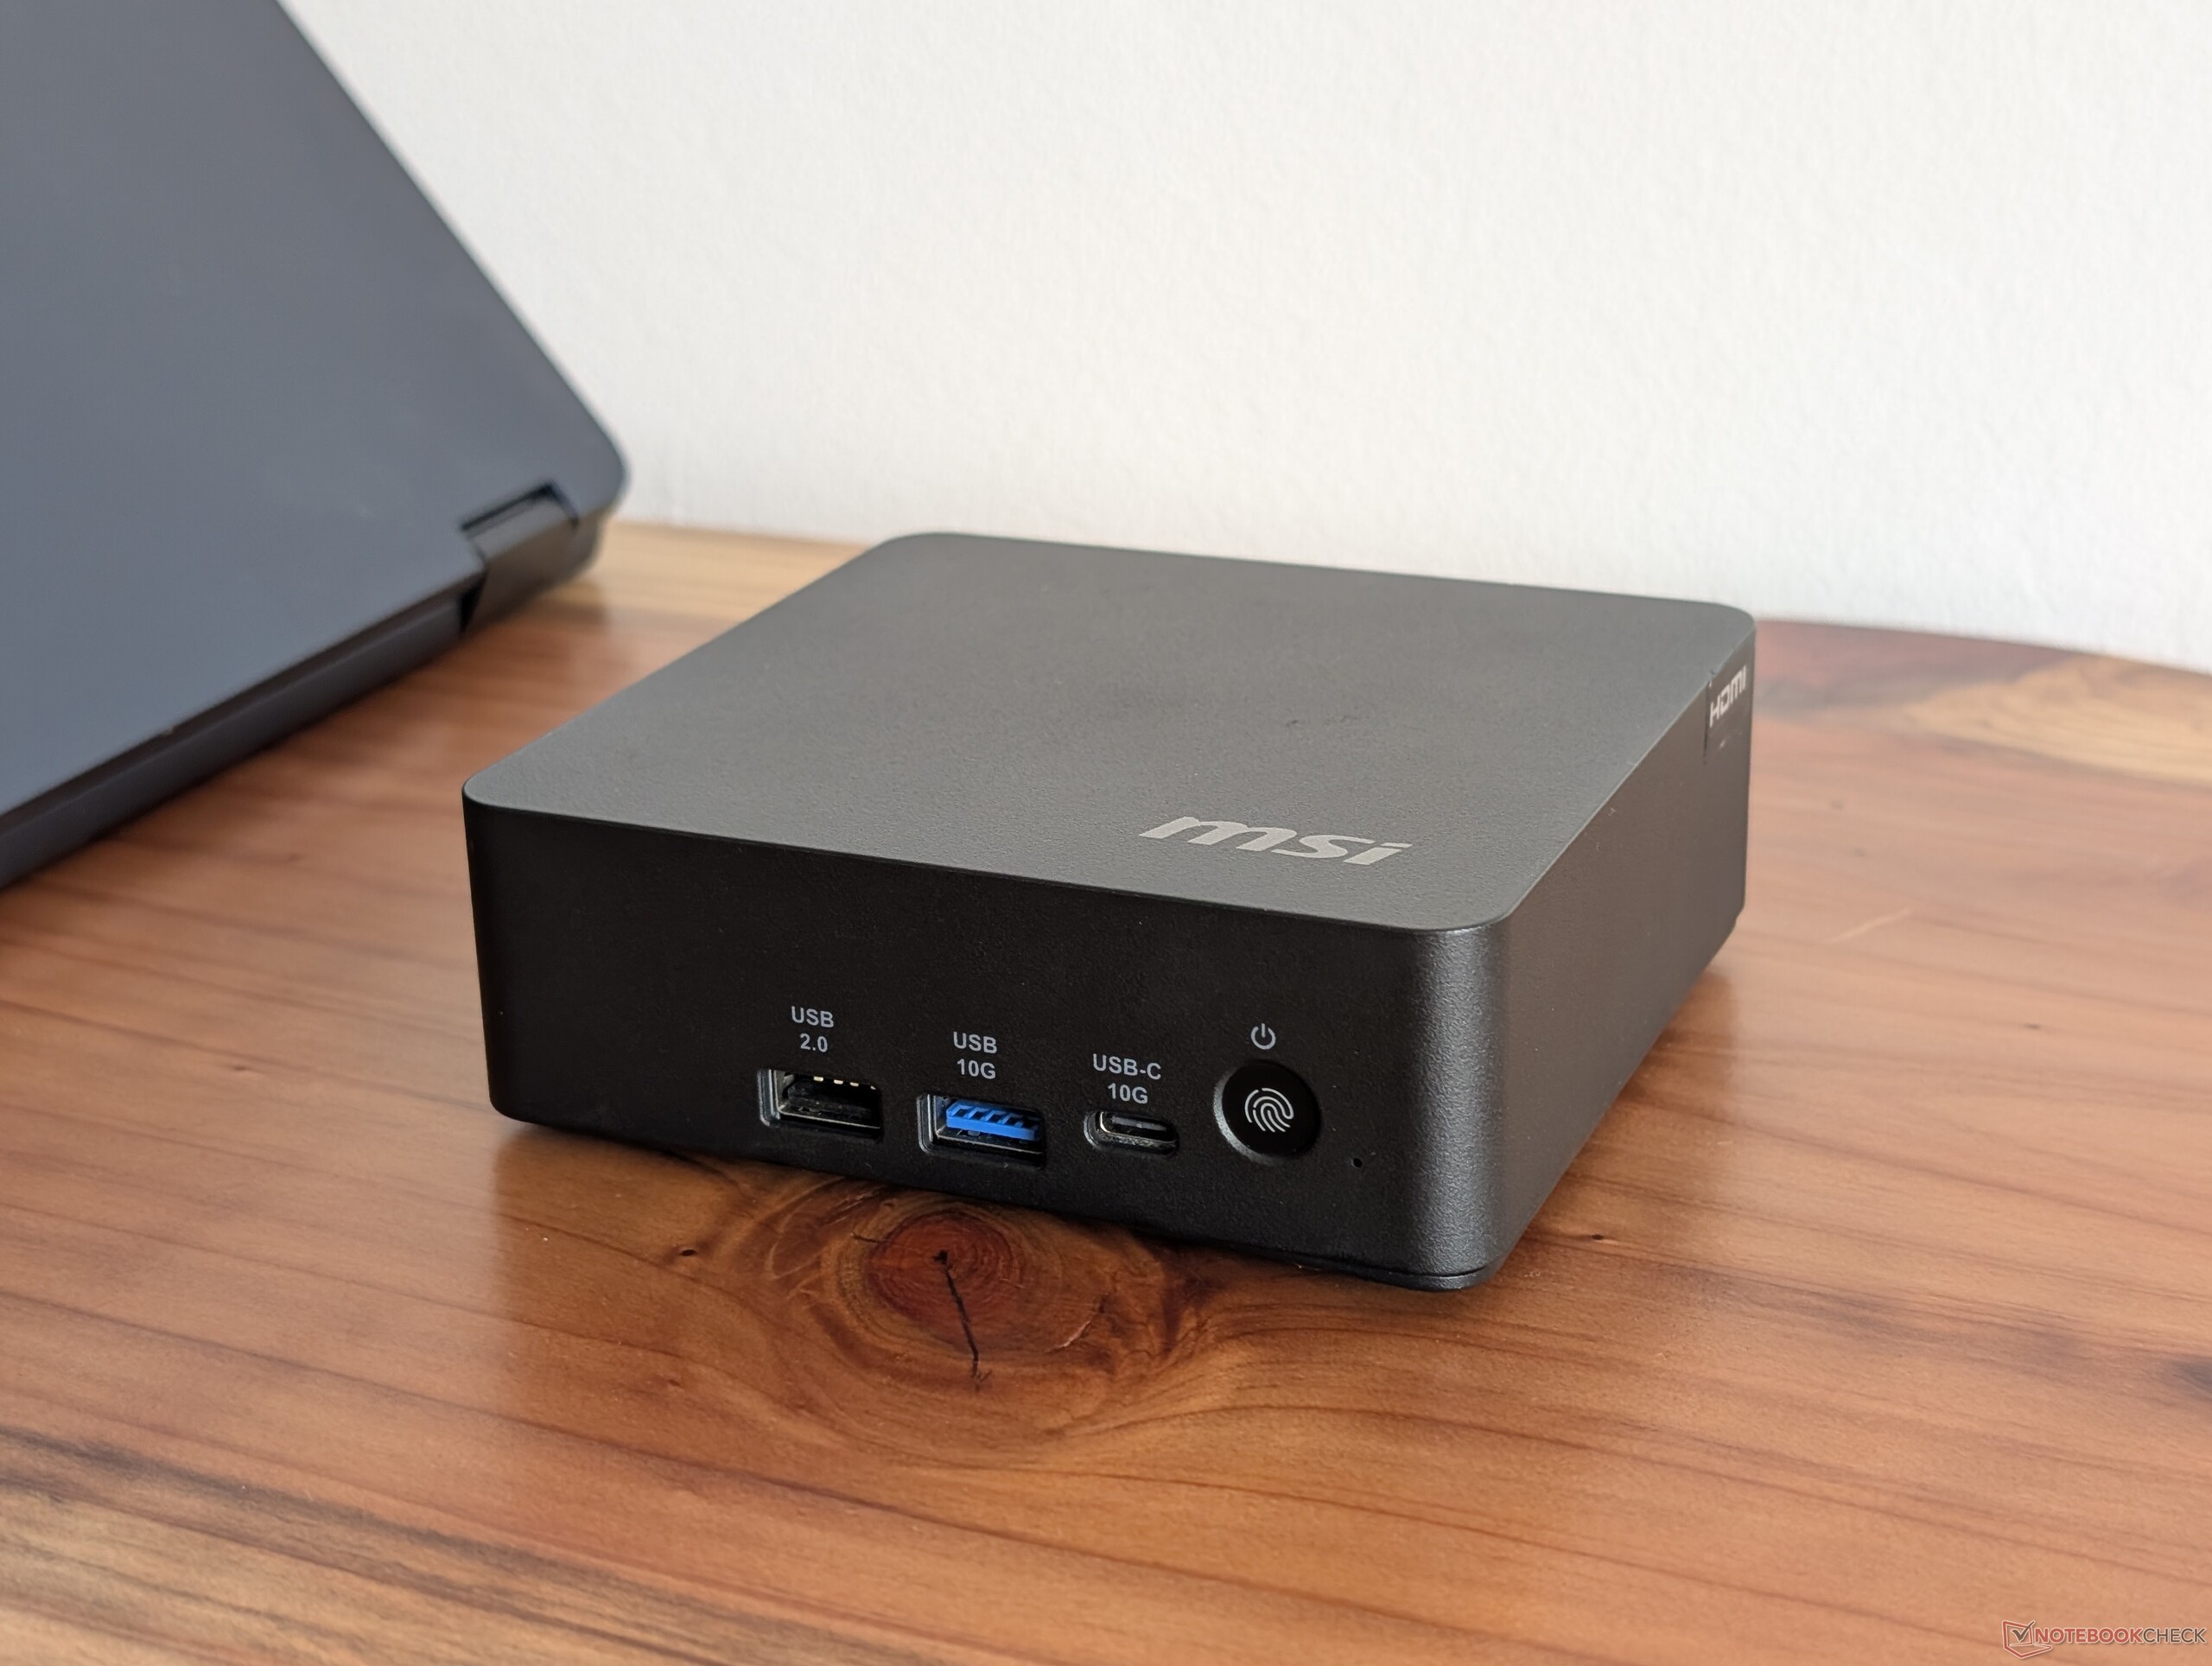
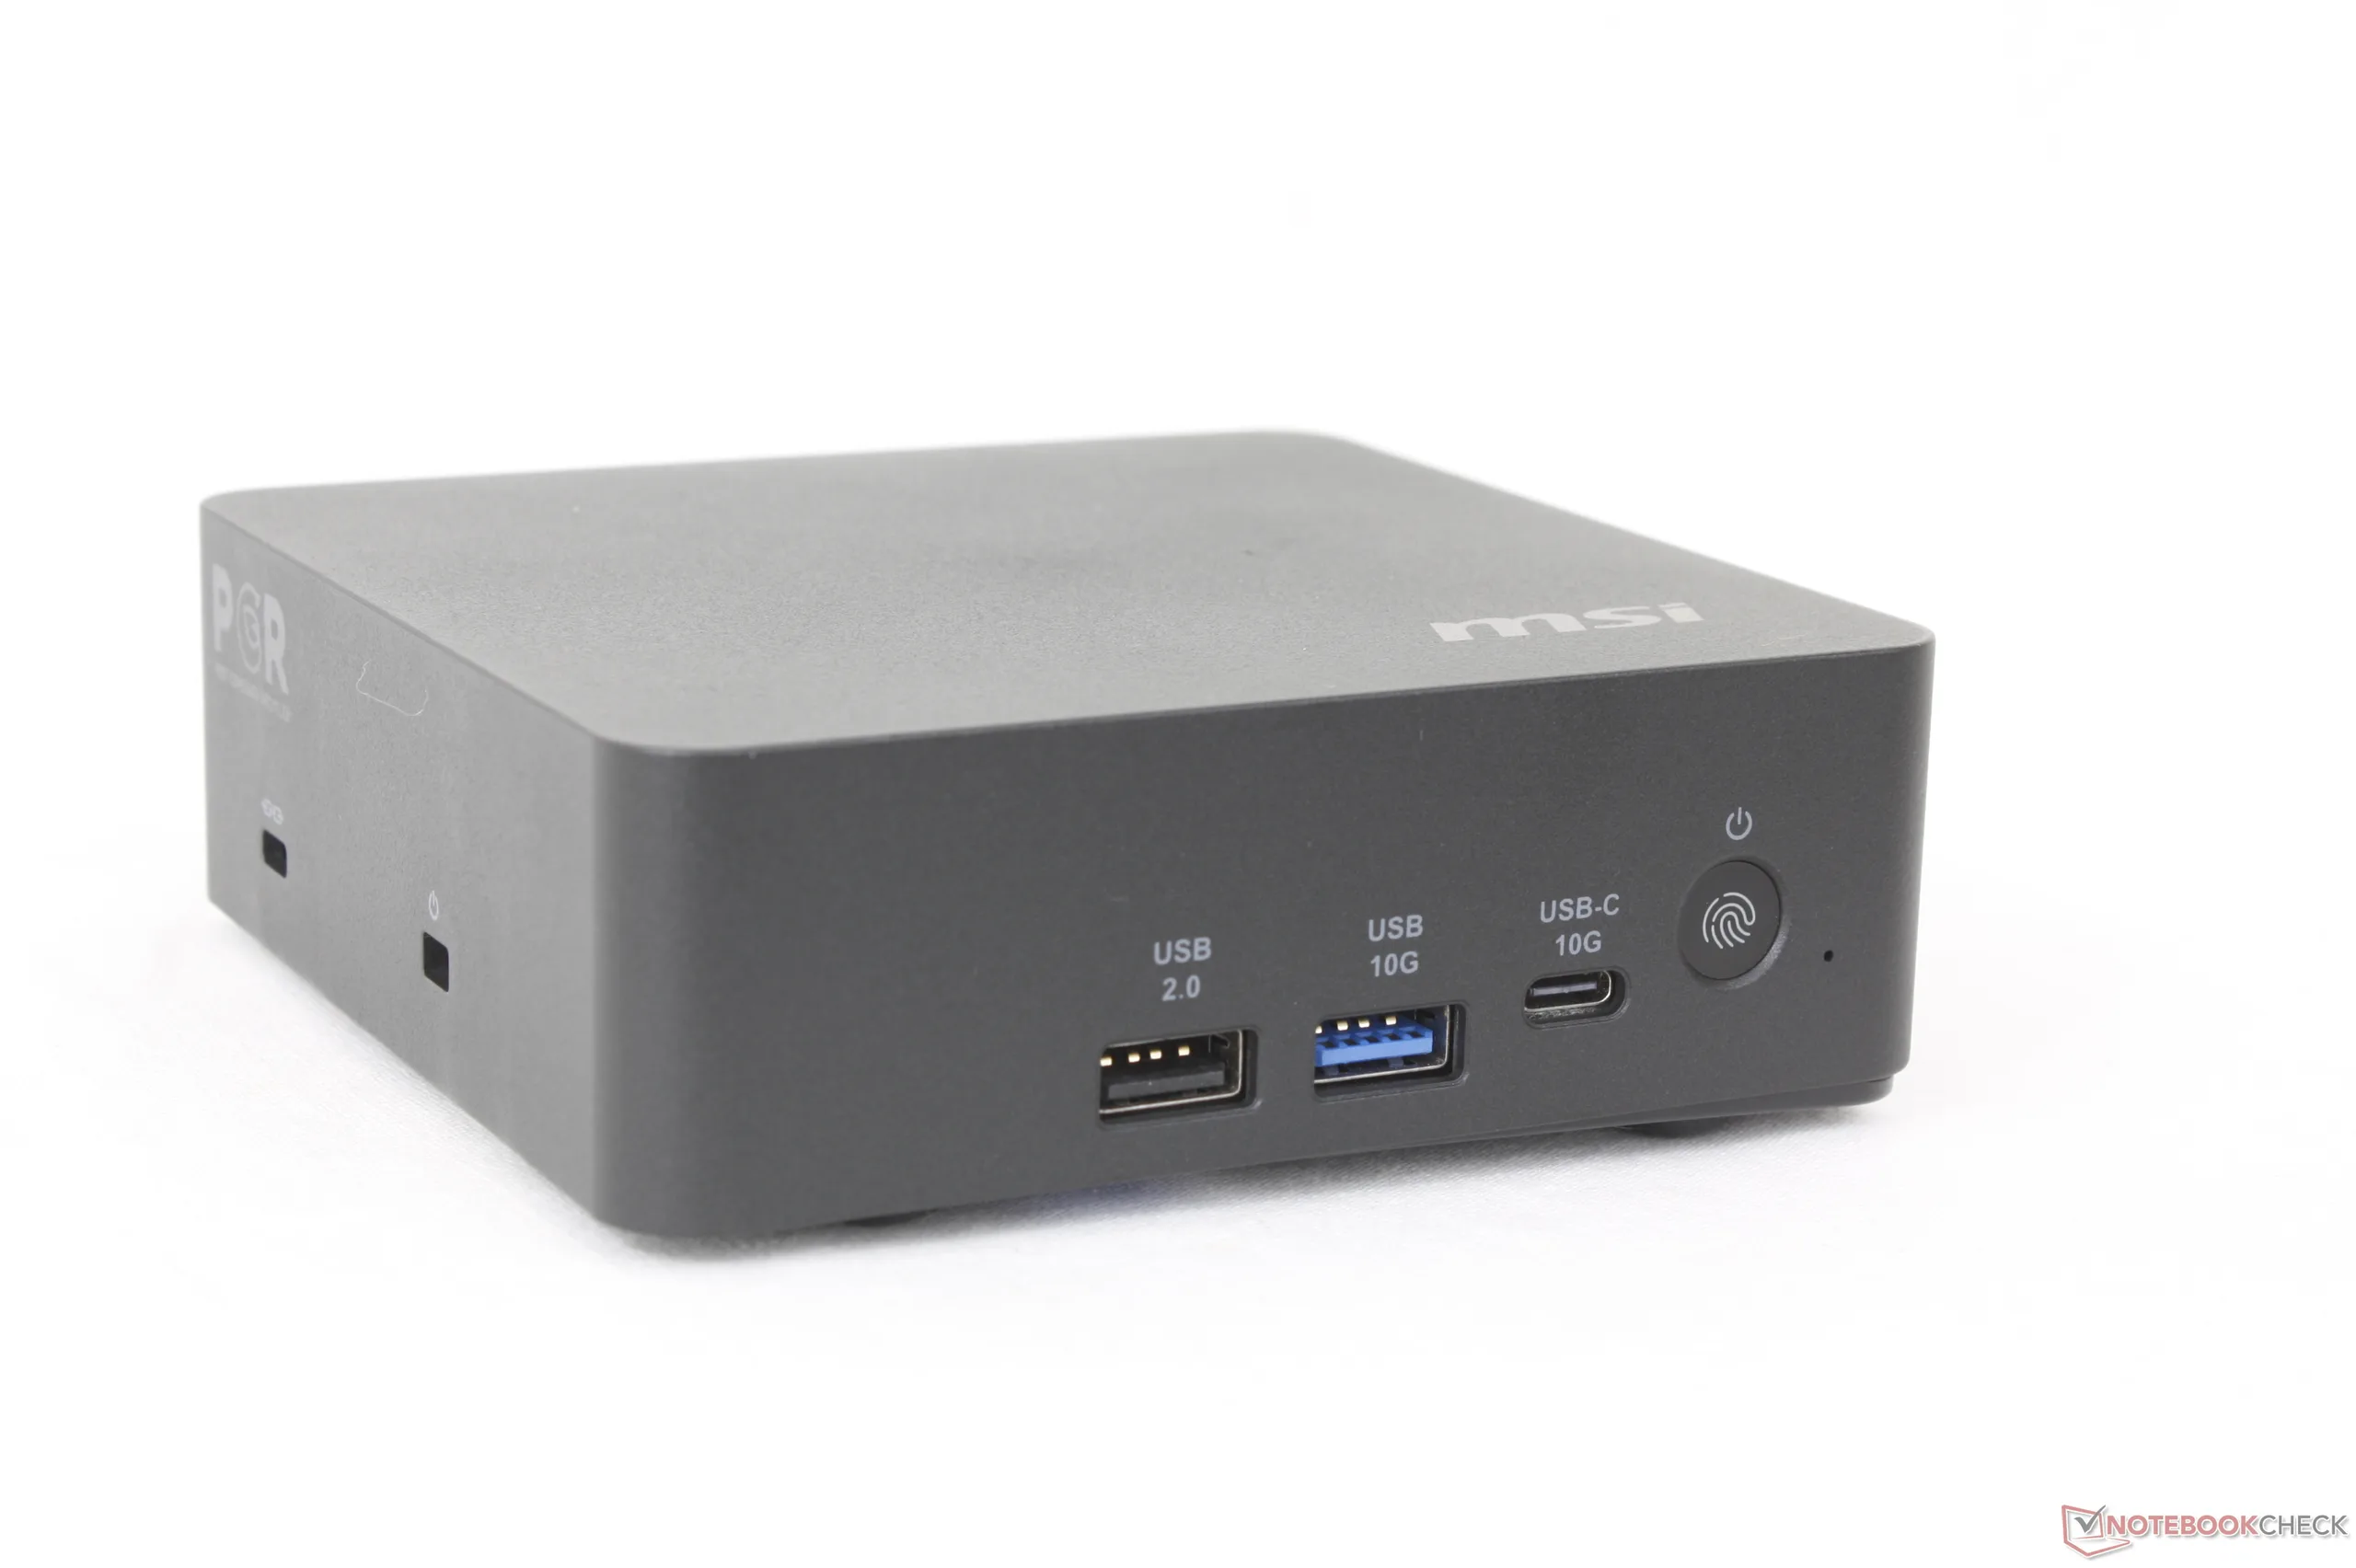
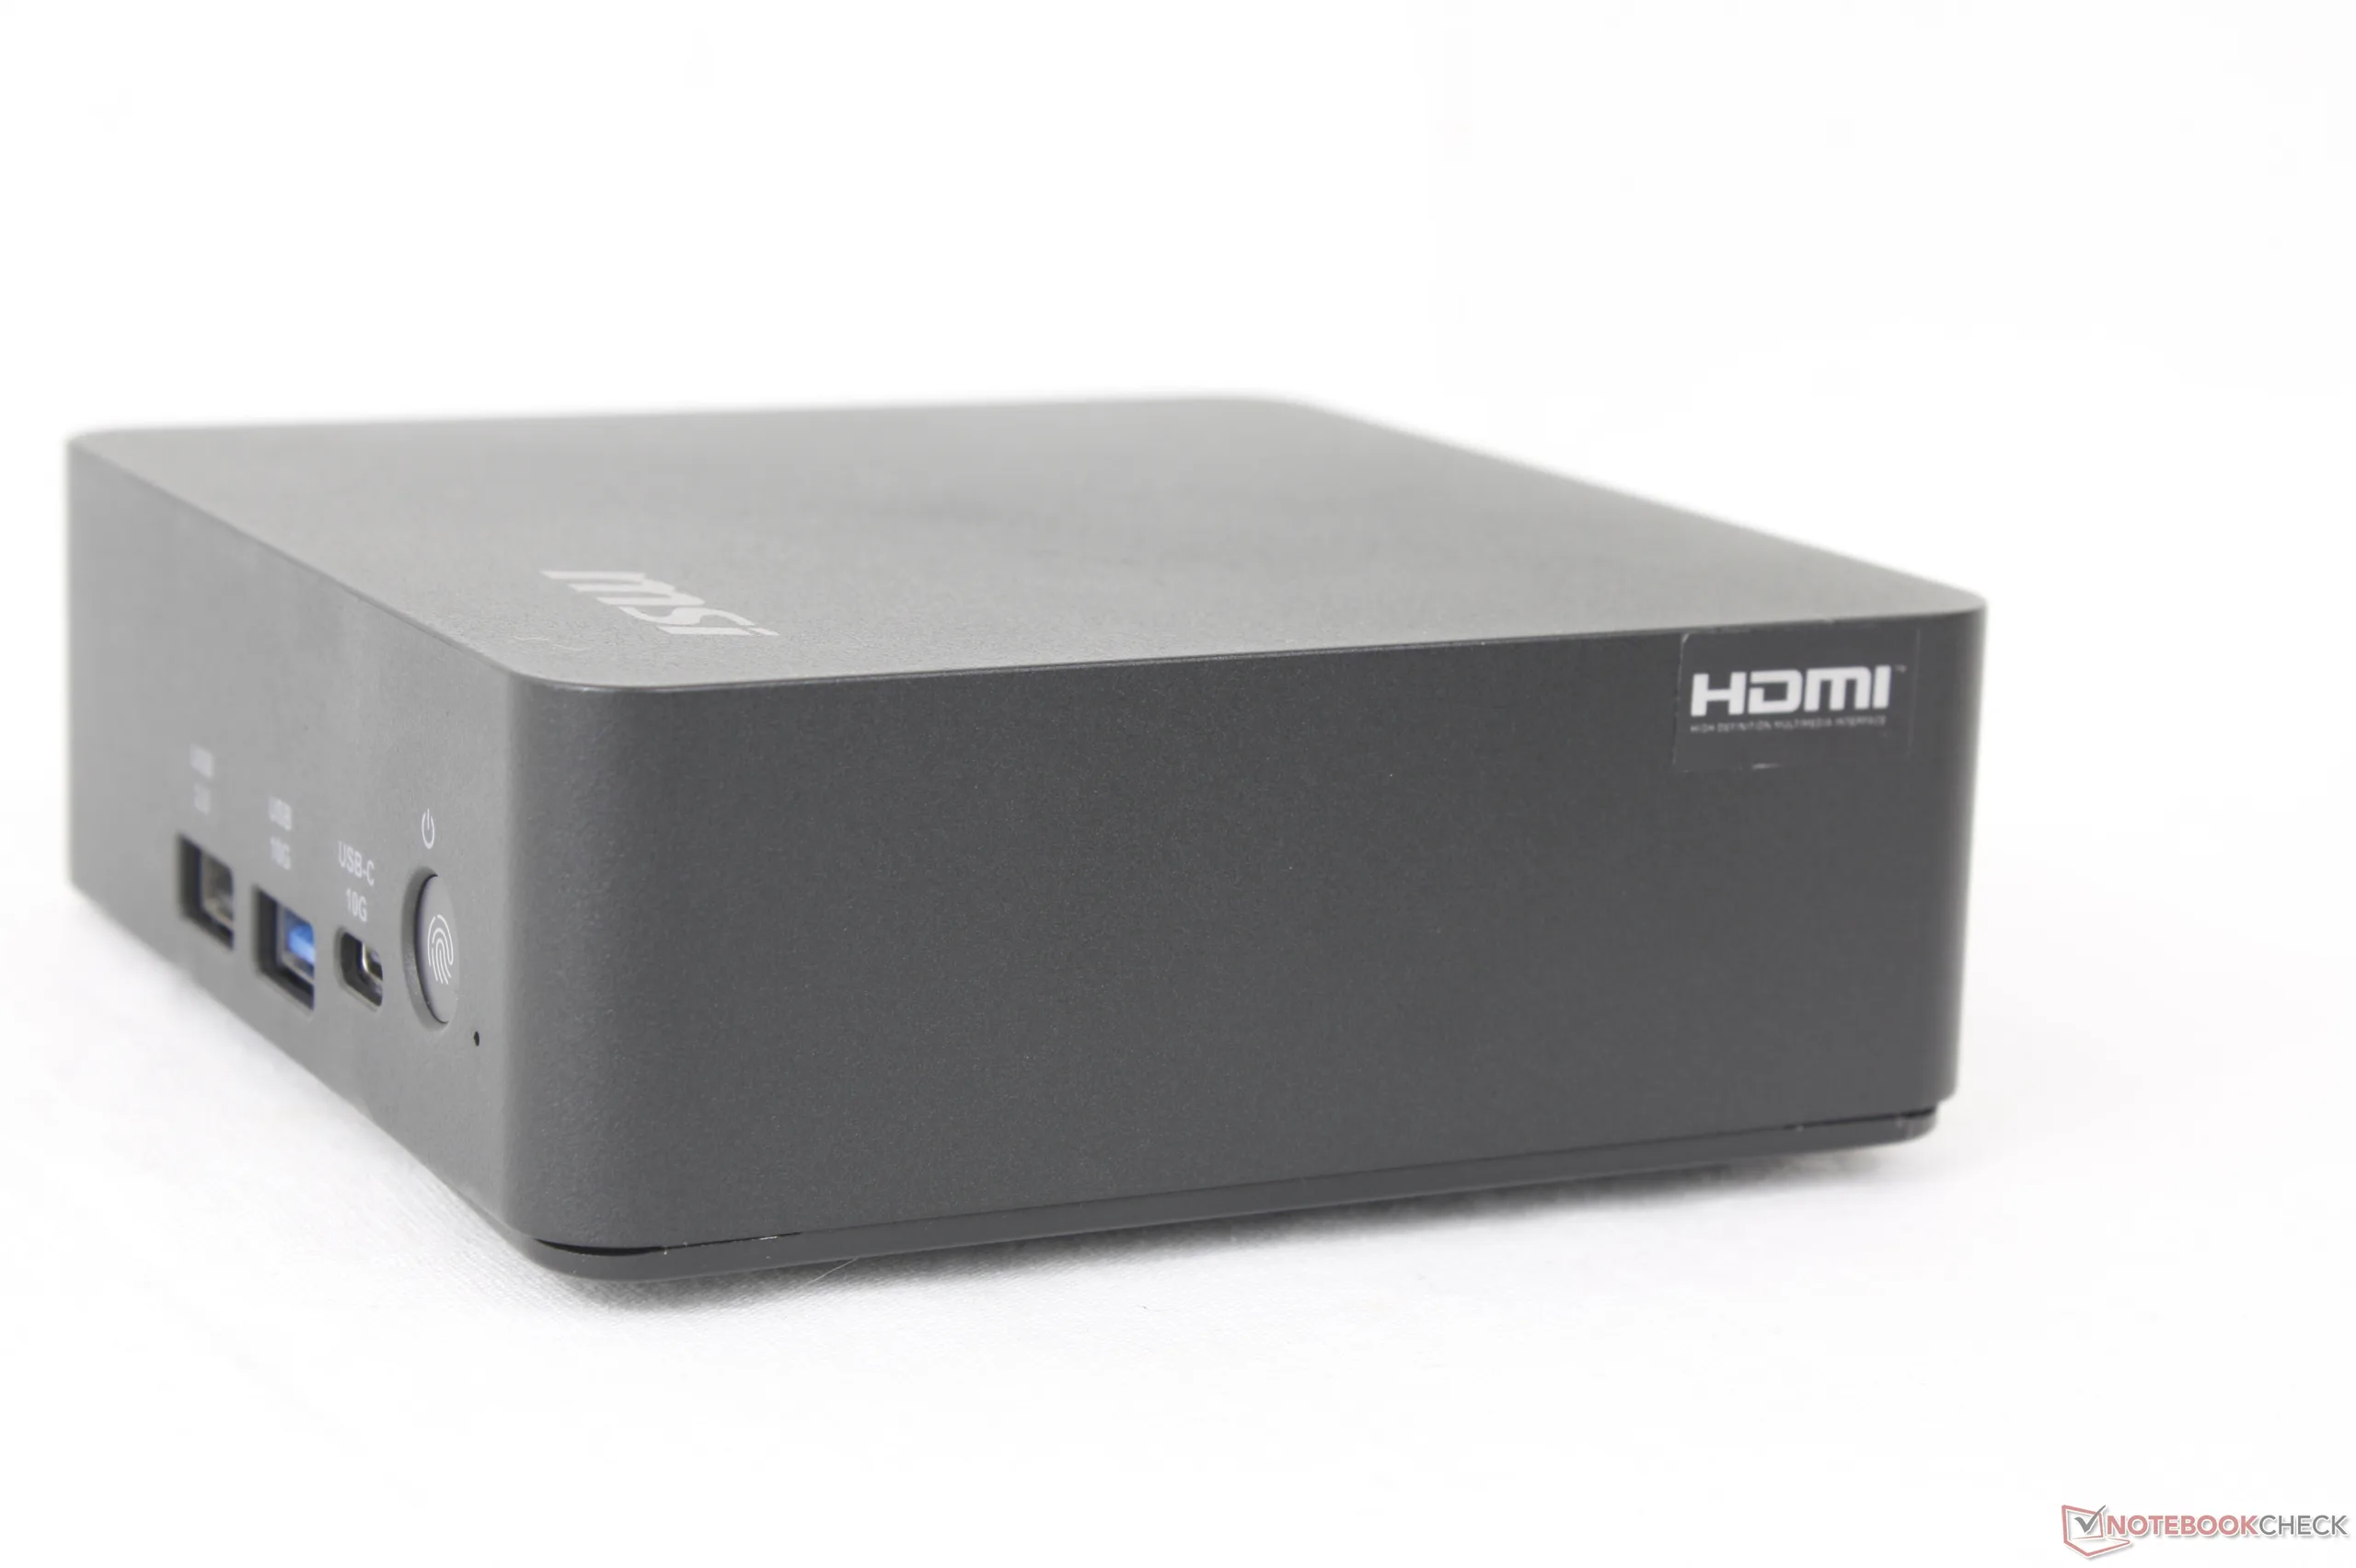
El chasis utiliza los mismos materiales de plástico negro para obtener impresiones similares a las de antes, aunque en un volumen un 17% más ligero y un 43% más pequeño. Quizás lo más impresionante es que el diseño más pequeño no implica más rejillas de ventilación ni ninguna revisión externa importante.
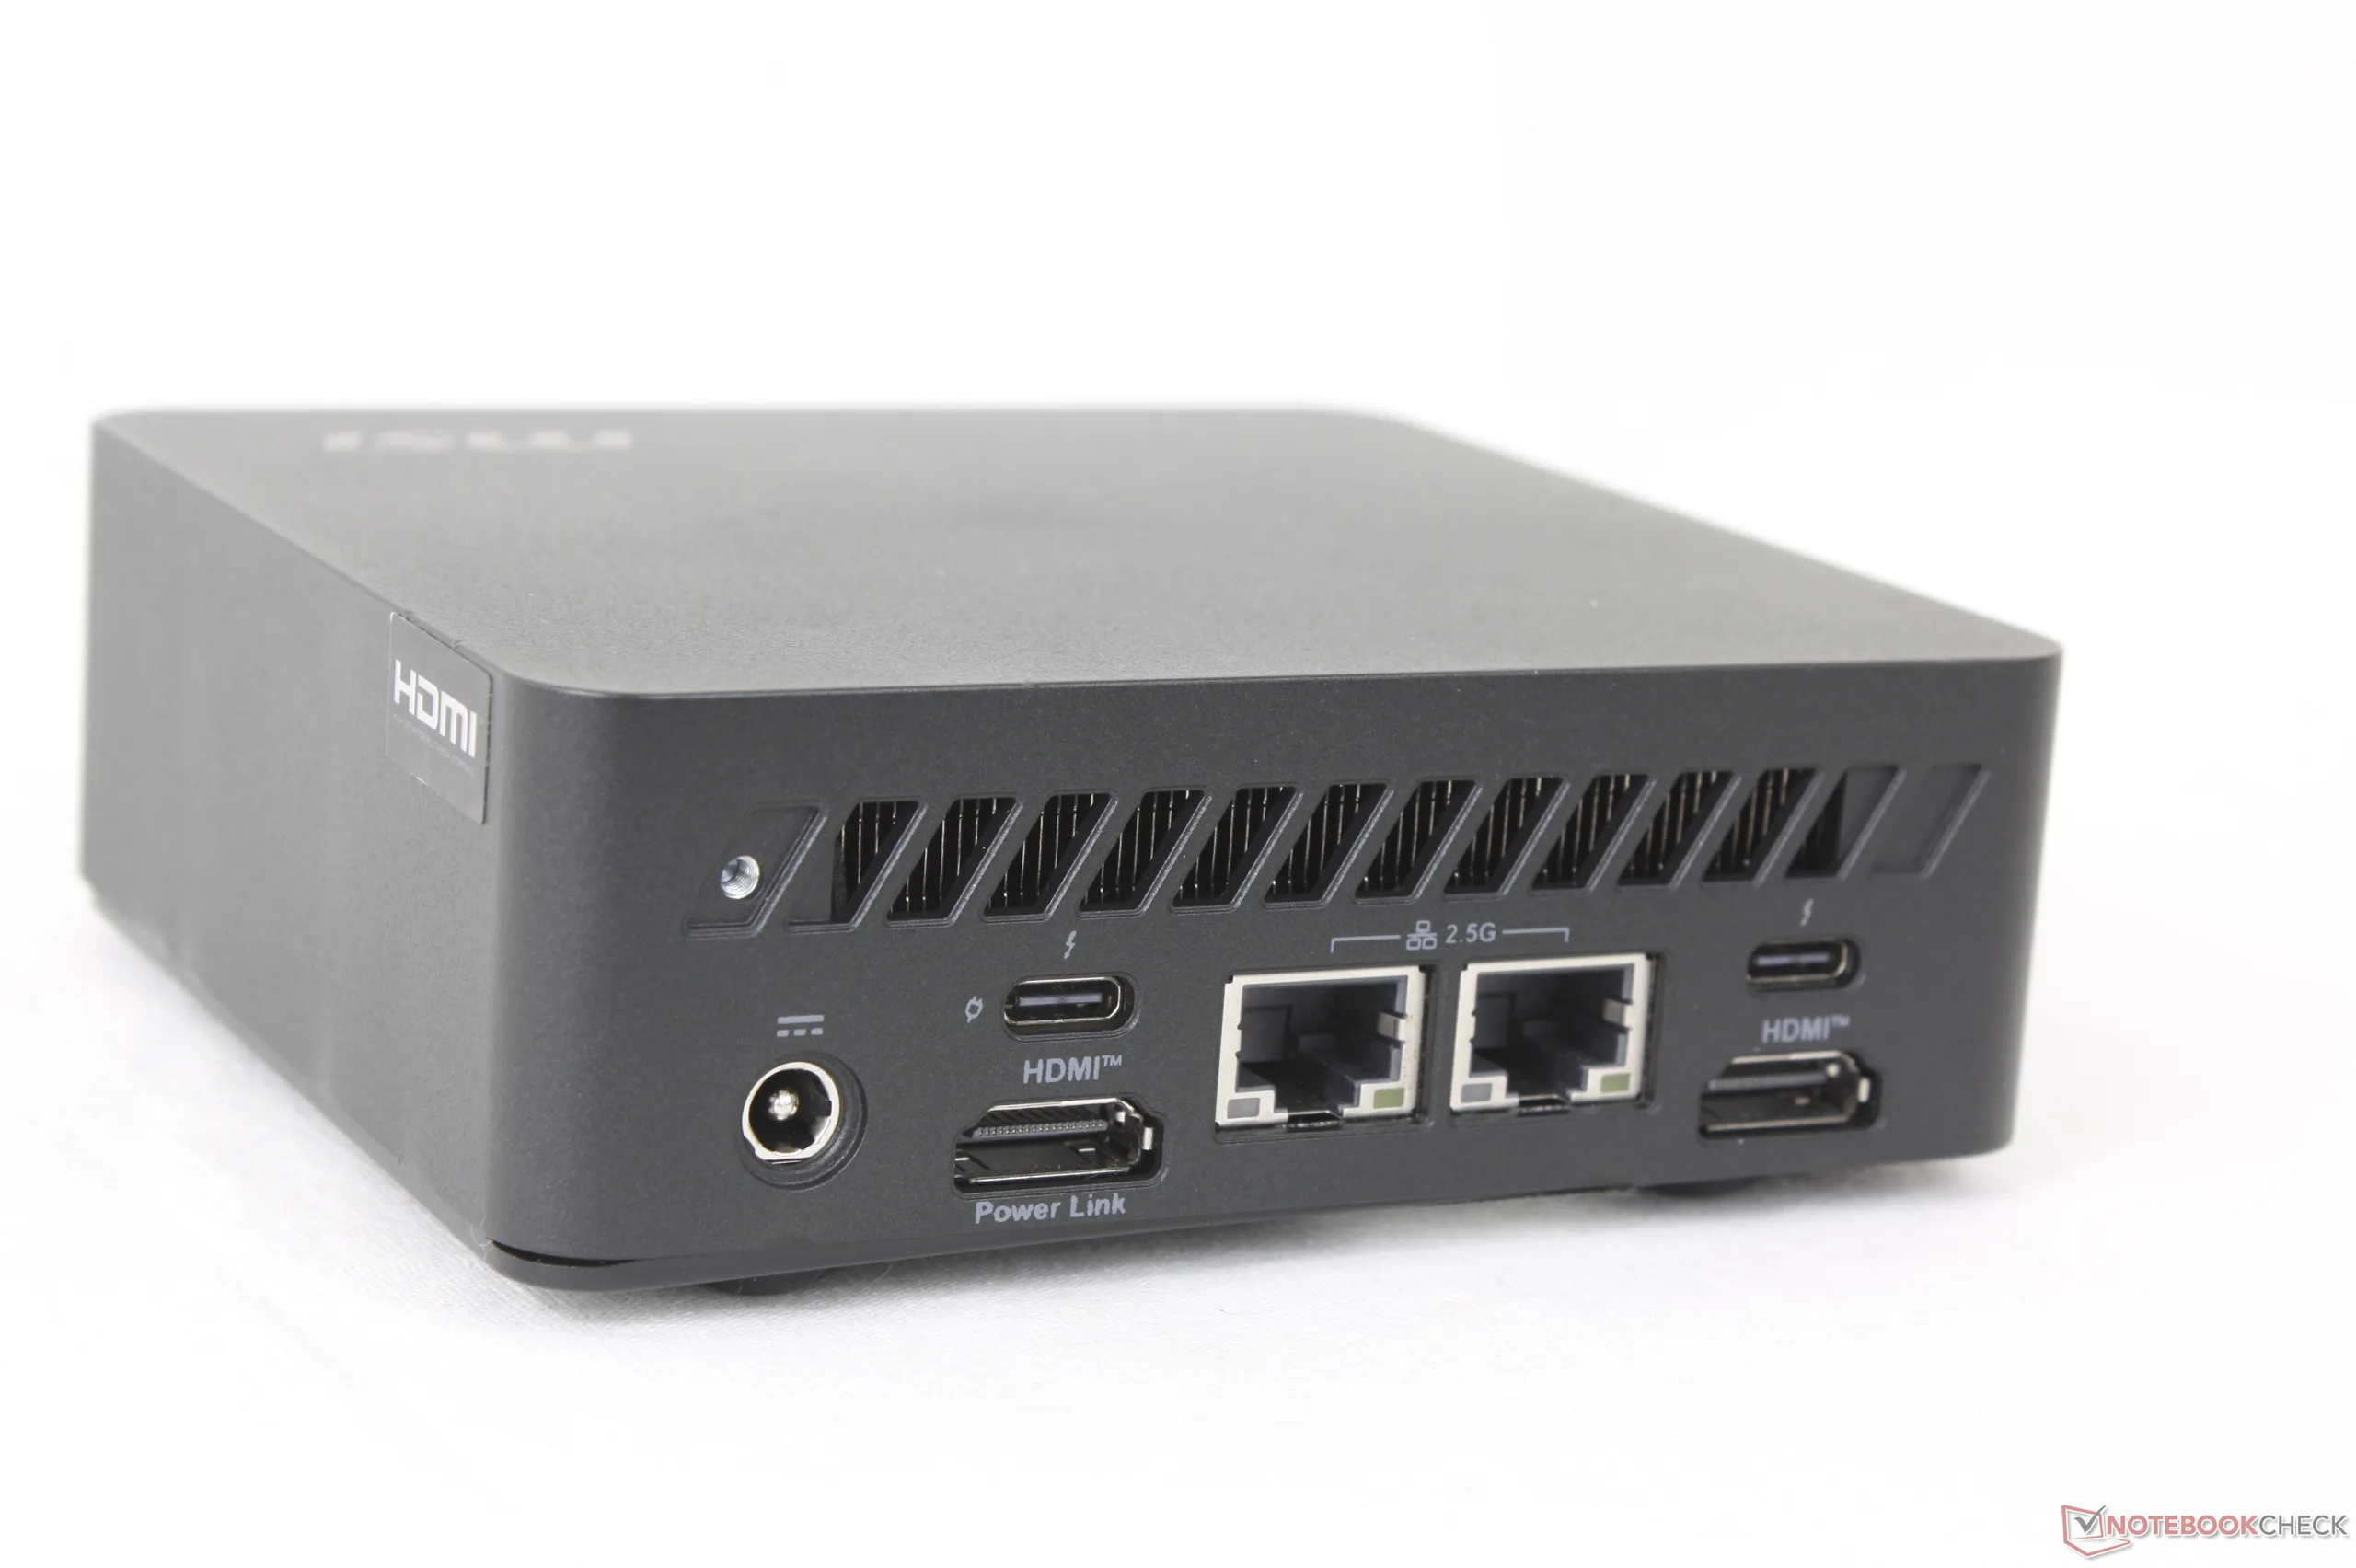
Conectividad
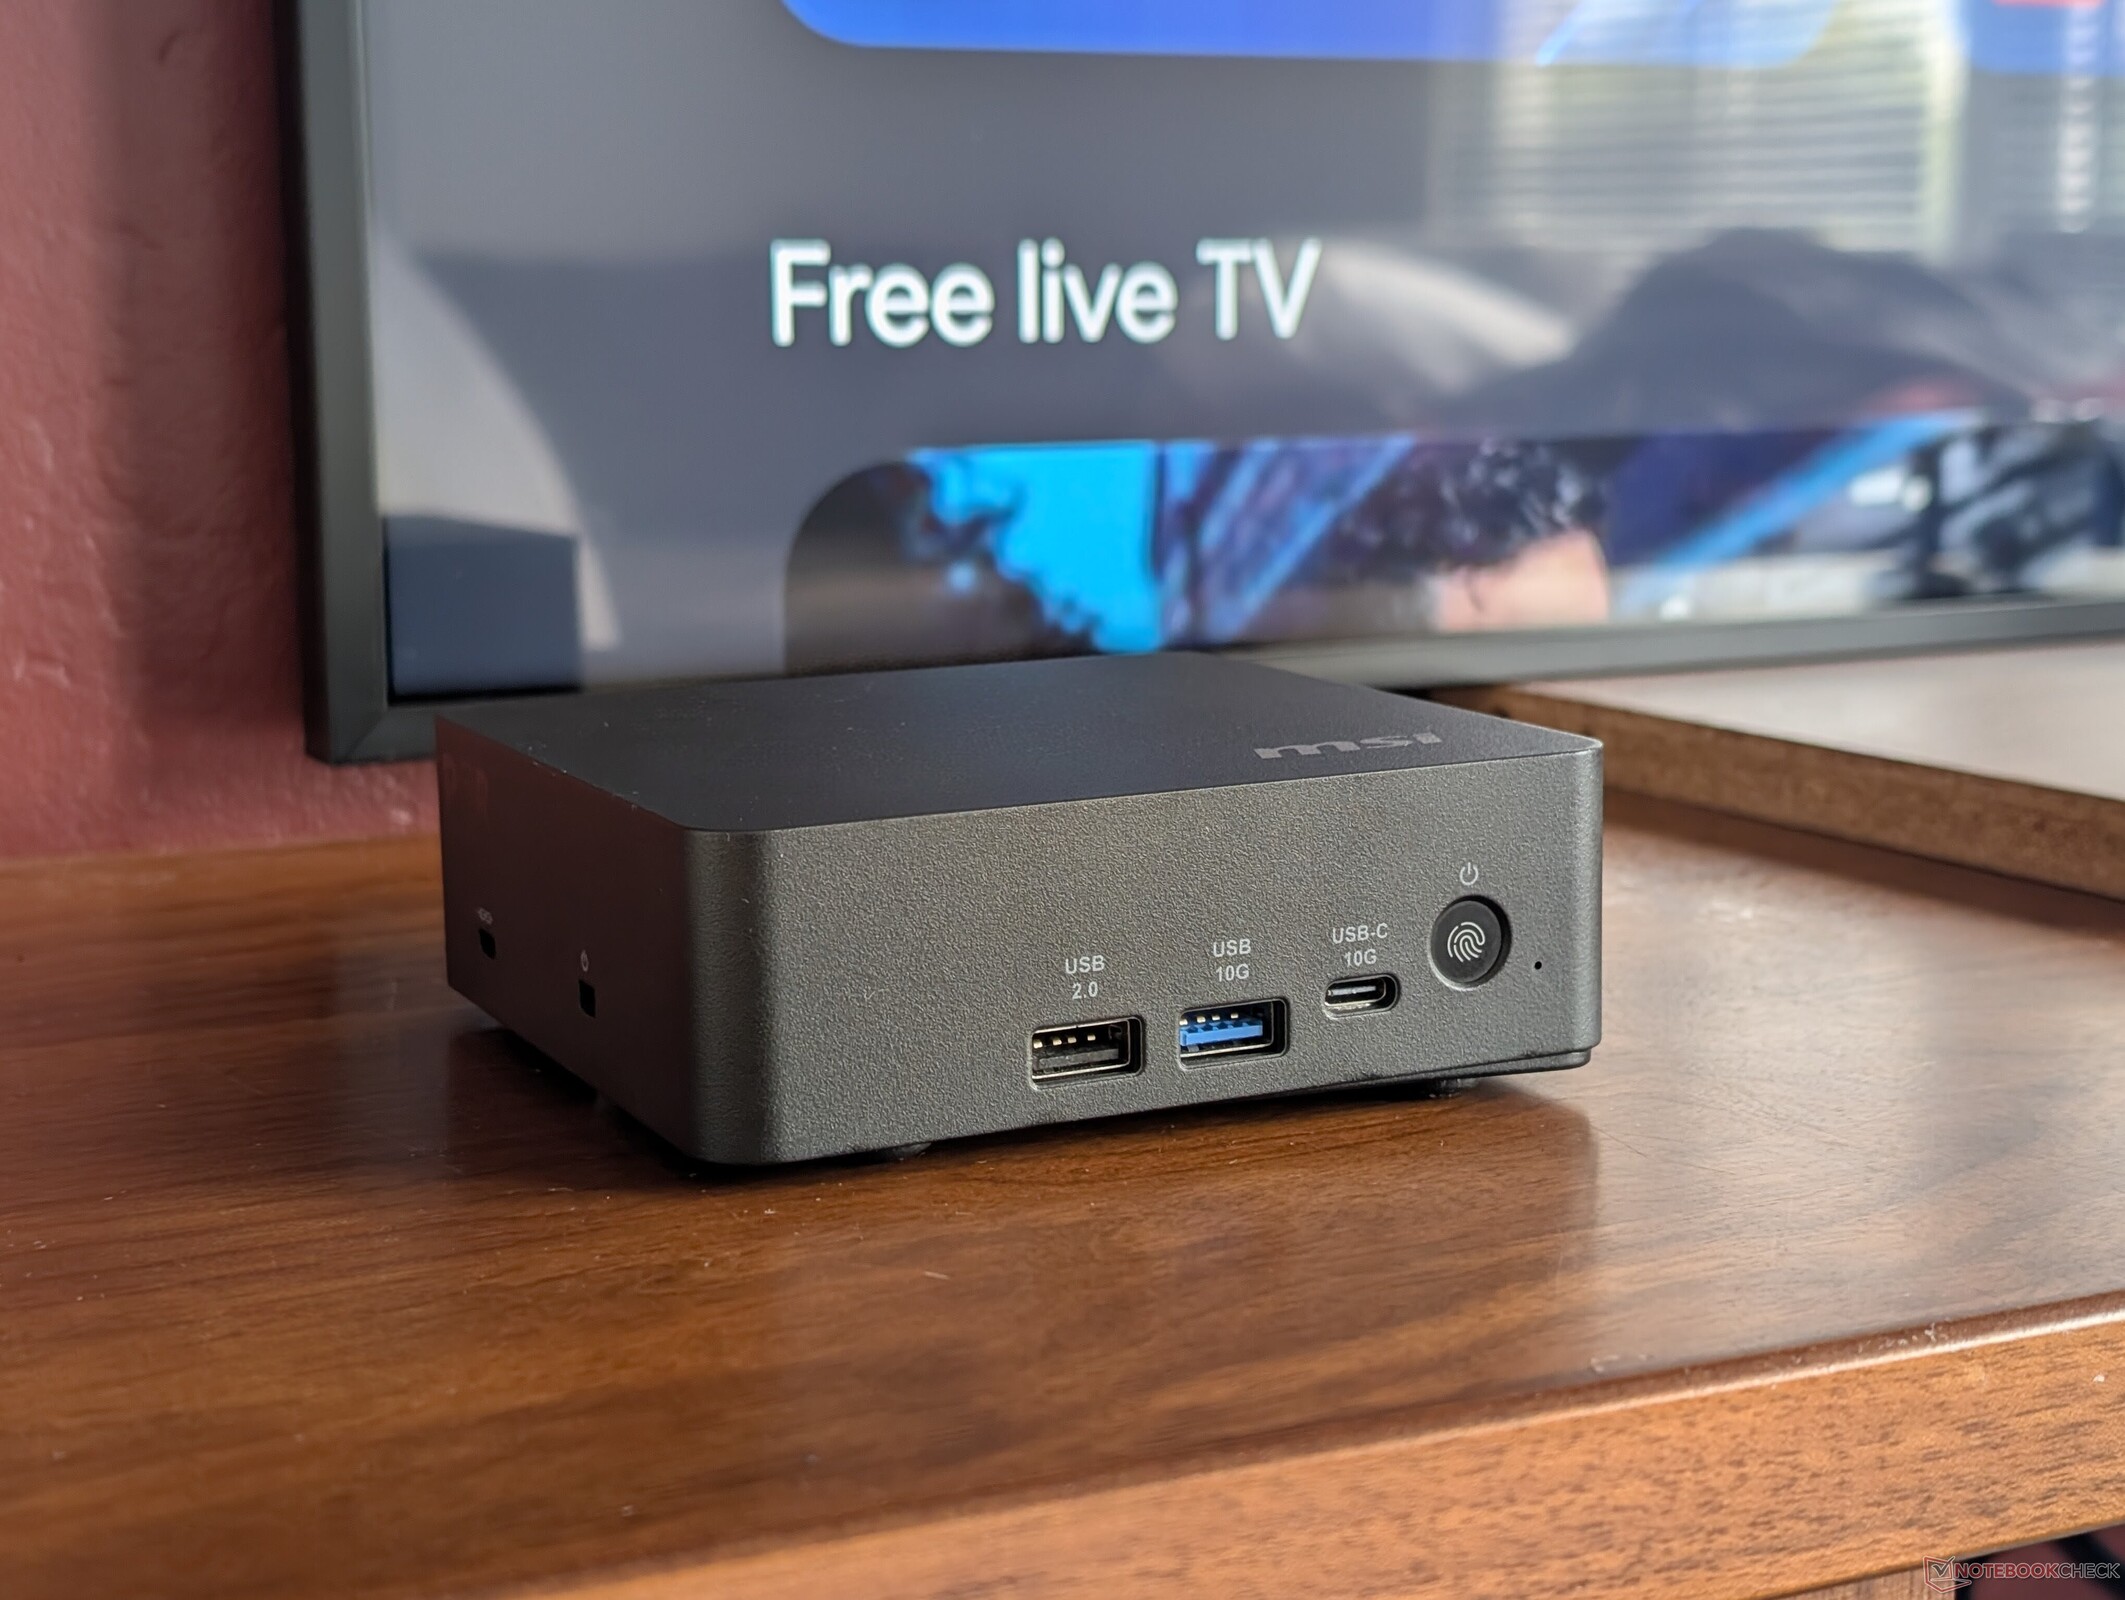
La característica de conectividad más notable del Cubi 3MG es su clavija de interruptor de alimentación externa en el lateral de la unidad. El puerto permite utilizar un botón de encendido cableado para encender o apagar fácilmente el sistema en caso de que el mini PC esté colocado en algún lugar de difícil acceso, como debajo de una mesa de oficina o detrás de una mesa o monitor.
Las opciones de puertos se han revisado significativamente en comparación con el modelo del año pasado. Ahora hay menos puertos USB-A y ya no hay lector de tarjetas SD ni toma de audio en favor de más puertos HDMI y puertos USB-C.
Tenga en cuenta que sólo uno de los dos puertos Thunderbolt 4 es compatible con Power Delivery. Este puerto puede utilizarse para alimentar el mini PC si dispone de un adaptador de CA USB-C compatible en lugar del adaptador de CA de barril incluido.
Comunicación
El módulo WLAN se ha actualizado de Wi-Fi 6E a Wi-Fi 7 con compatibilidad Bluetooth 6.0.
| Networking | |
| iperf3 transmit AXE11000 | |
| MSI Cubi NUC AI+ 3MG | |
| Asus NUC 15 Pro+ | |
| GMK EVO-T1 | |
| MSI Cubi NUC AI+ 2MG | |
| GMK NucBox K16 | |
| Geekom A5 Pro | |
| MSI Cubi NUC 1M | |
| iperf3 receive AXE11000 | |
| Asus NUC 15 Pro+ | |
| GMK EVO-T1 | |
| MSI Cubi NUC AI+ 3MG | |
| MSI Cubi NUC AI+ 2MG | |
| Geekom A5 Pro | |
| GMK NucBox K16 | |
| MSI Cubi NUC 1M | |
| iperf3 transmit AXE11000 6GHz | |
| GMK NucBox K16 | |
| MSI Cubi NUC AI+ 3MG | |
| Asus NUC 15 Pro+ | |
| MSI Cubi NUC 1M | |
| MSI Cubi NUC AI+ 2MG | |
| iperf3 receive AXE11000 6GHz | |
| GMK NucBox K16 | |
| MSI Cubi NUC AI+ 3MG | |
| MSI Cubi NUC AI+ 2MG | |
| Asus NUC 15 Pro+ | |
| MSI Cubi NUC 1M | |
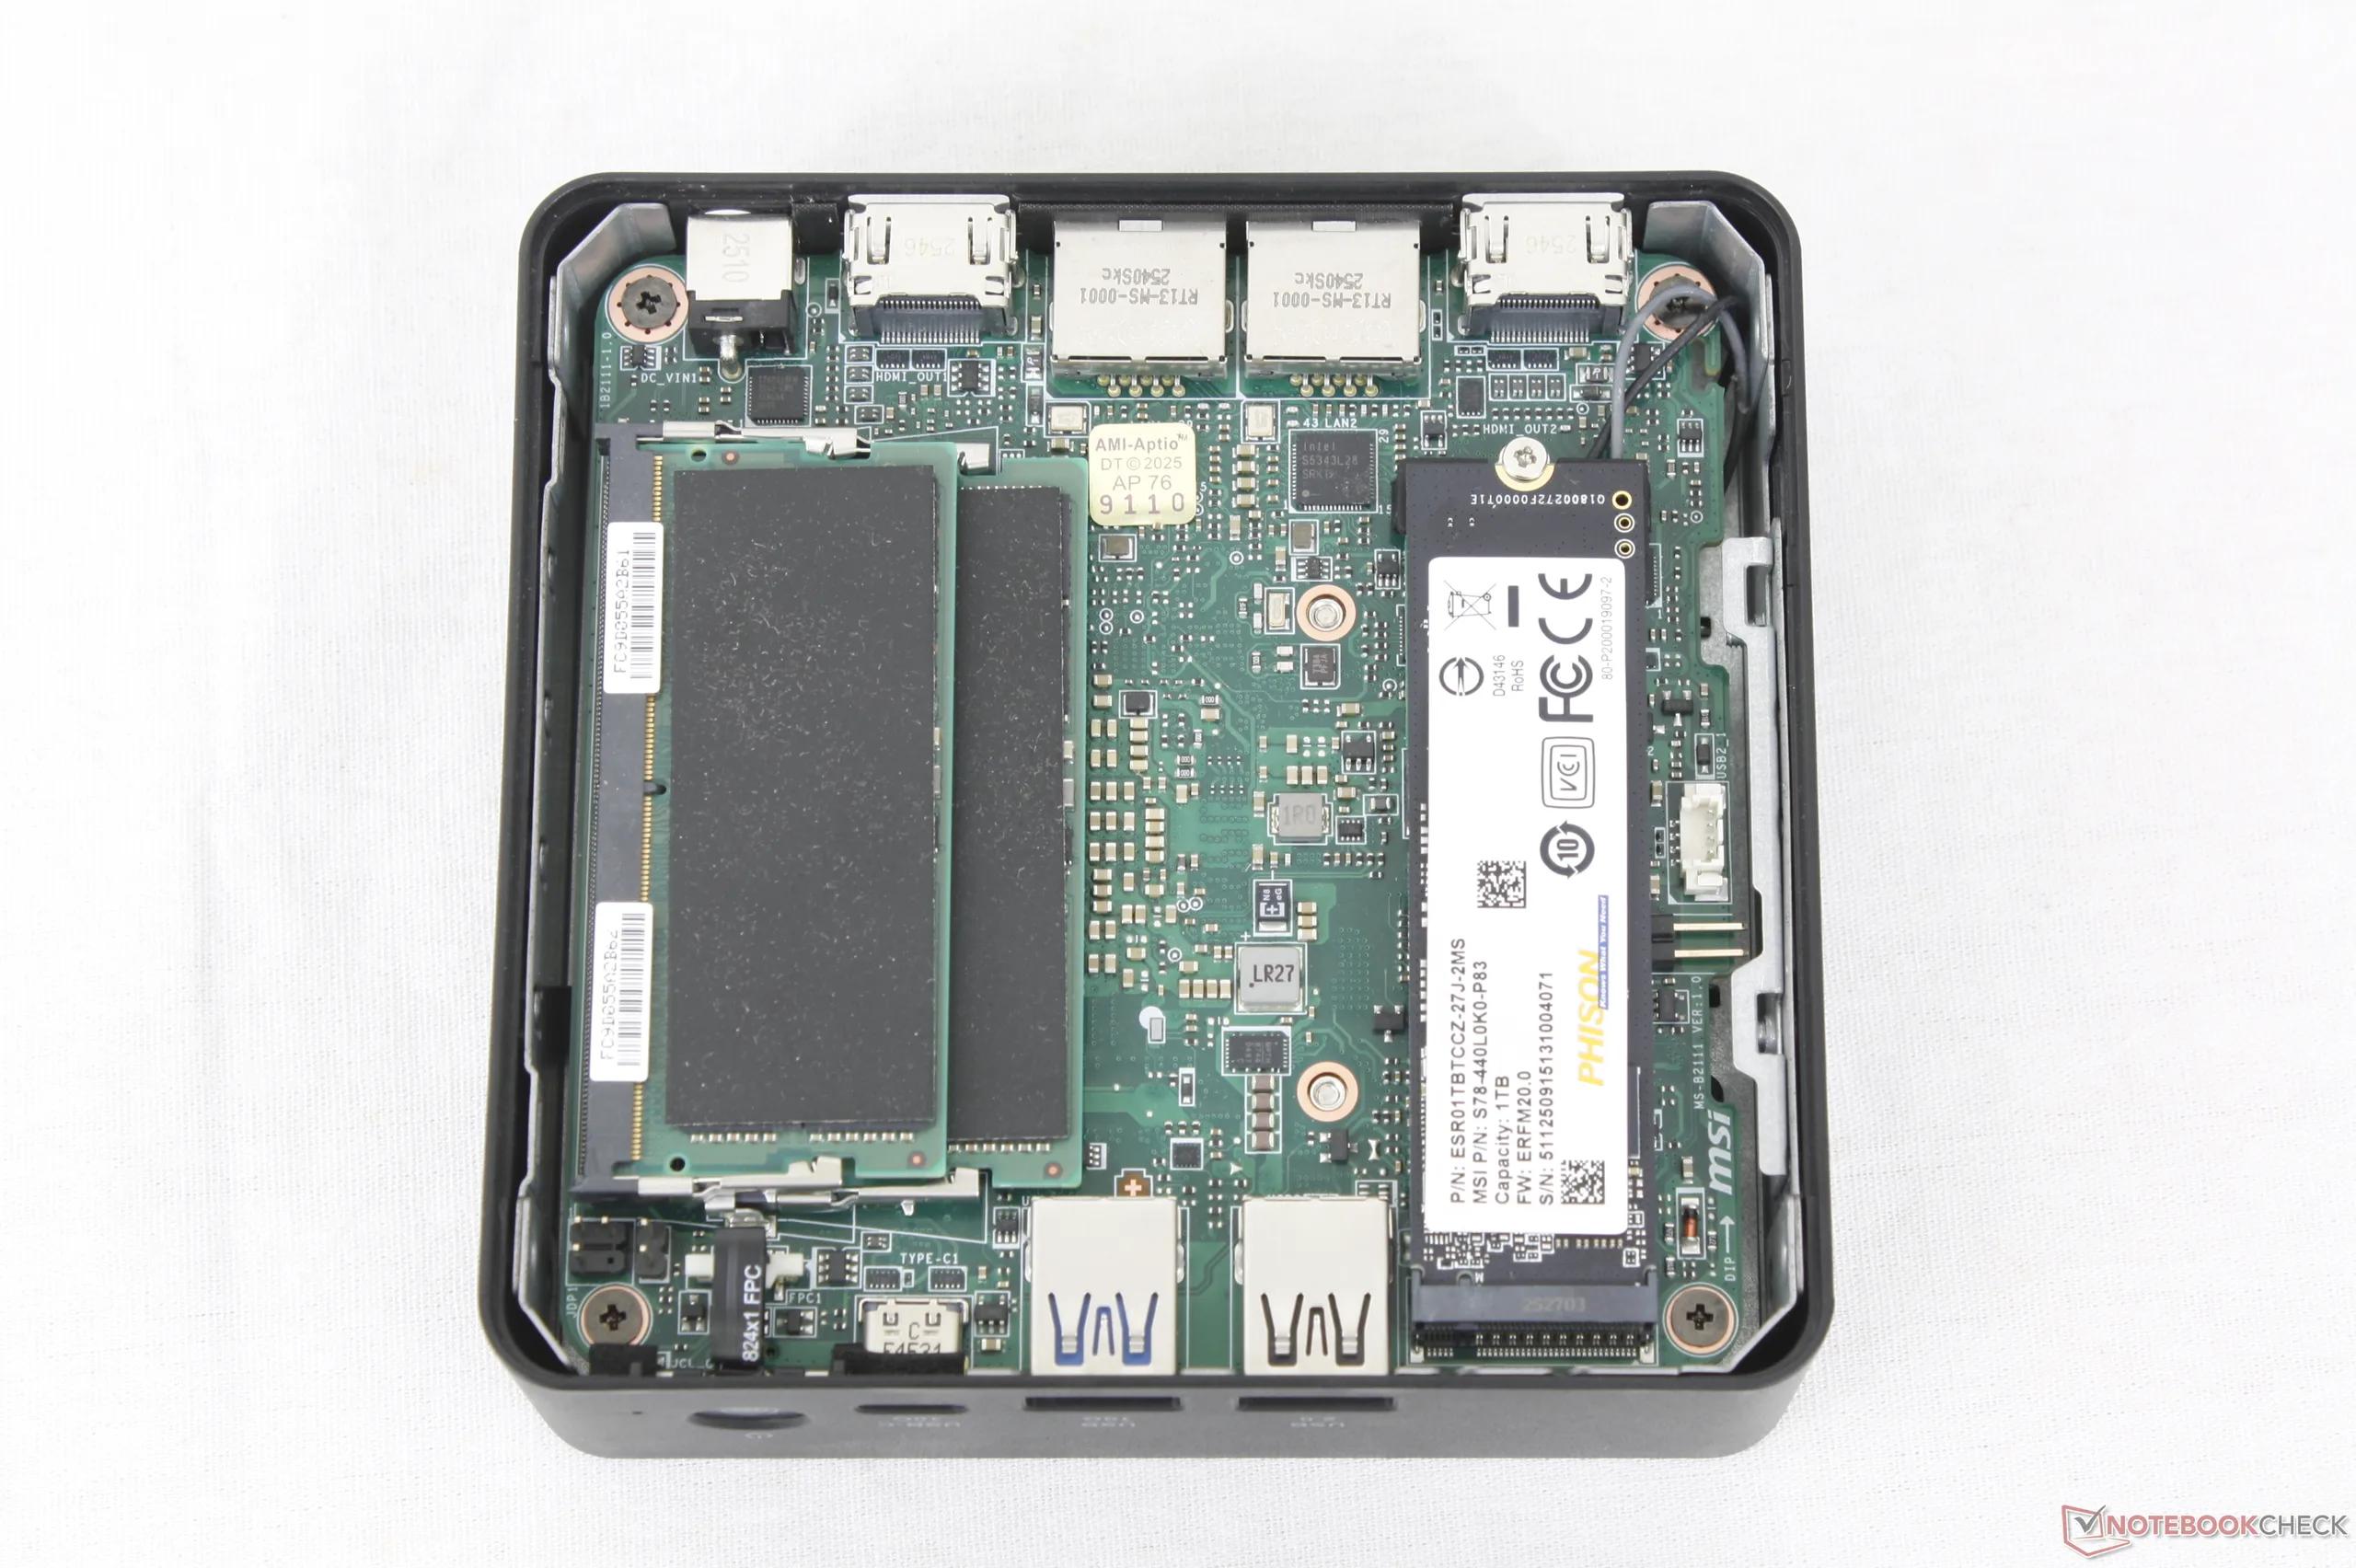
Mantenimiento
El panel inferior está asegurado por un simple tornillo de mariposa para facilitar el mantenimiento sin necesidad de herramientas. Una vez dentro, los usuarios tienen acceso directo a la ranura para SSD M.2 2280, al módulo WLAN M.2 extraíble y a dos ranuras SODIMM DDR5.
Accesorios y garantía
La caja de venta incluye el interruptor de alimentación externo para conectarlo a la clavija del interruptor de alimentación mencionada anteriormente. Sin embargo, el interruptor externo no es muy largo, con sólo ~47 cm.
Rendimiento
Condiciones de prueba
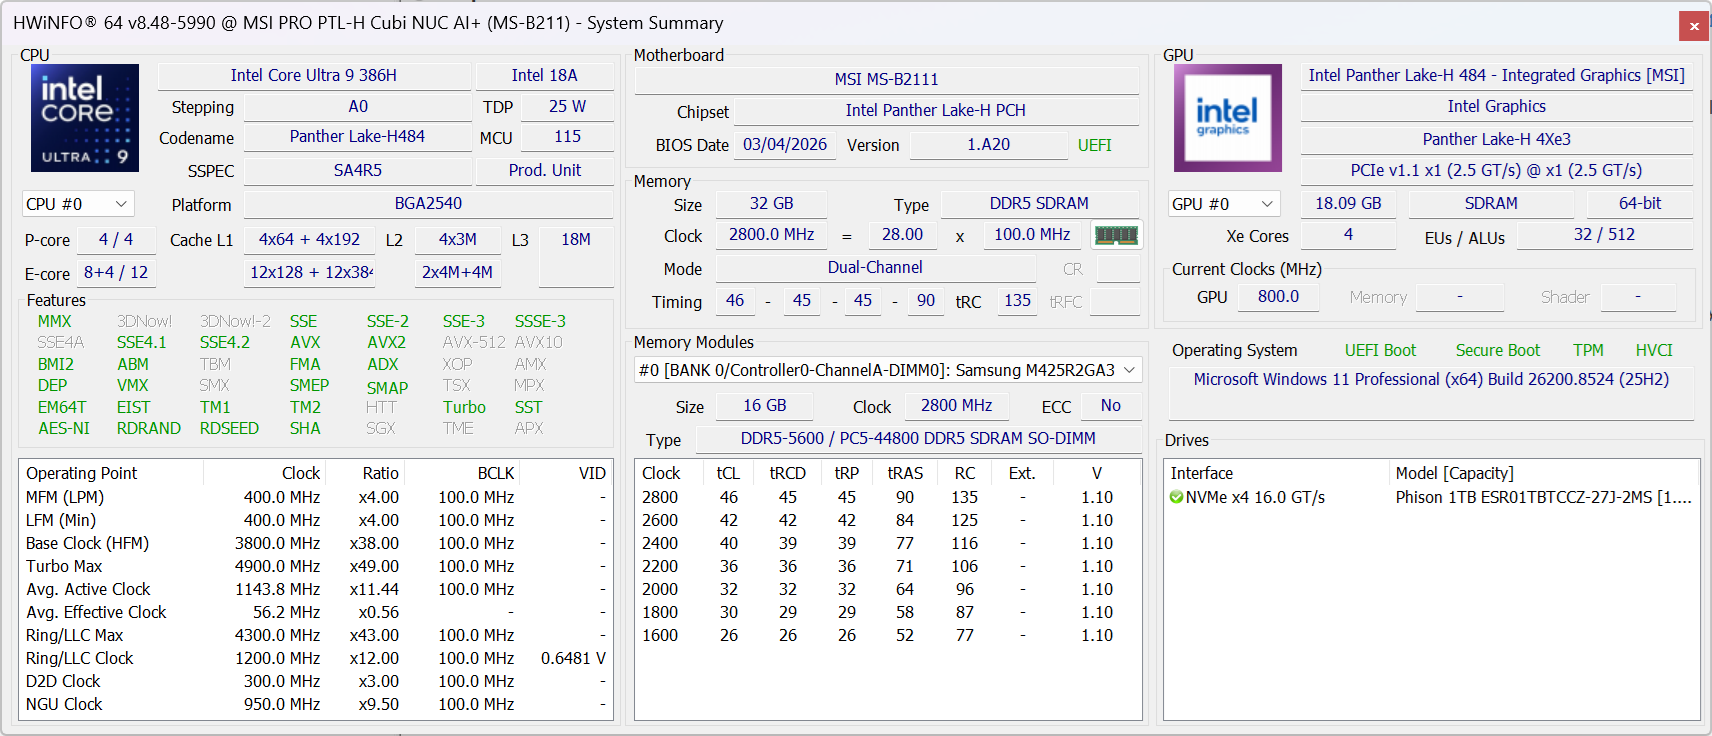
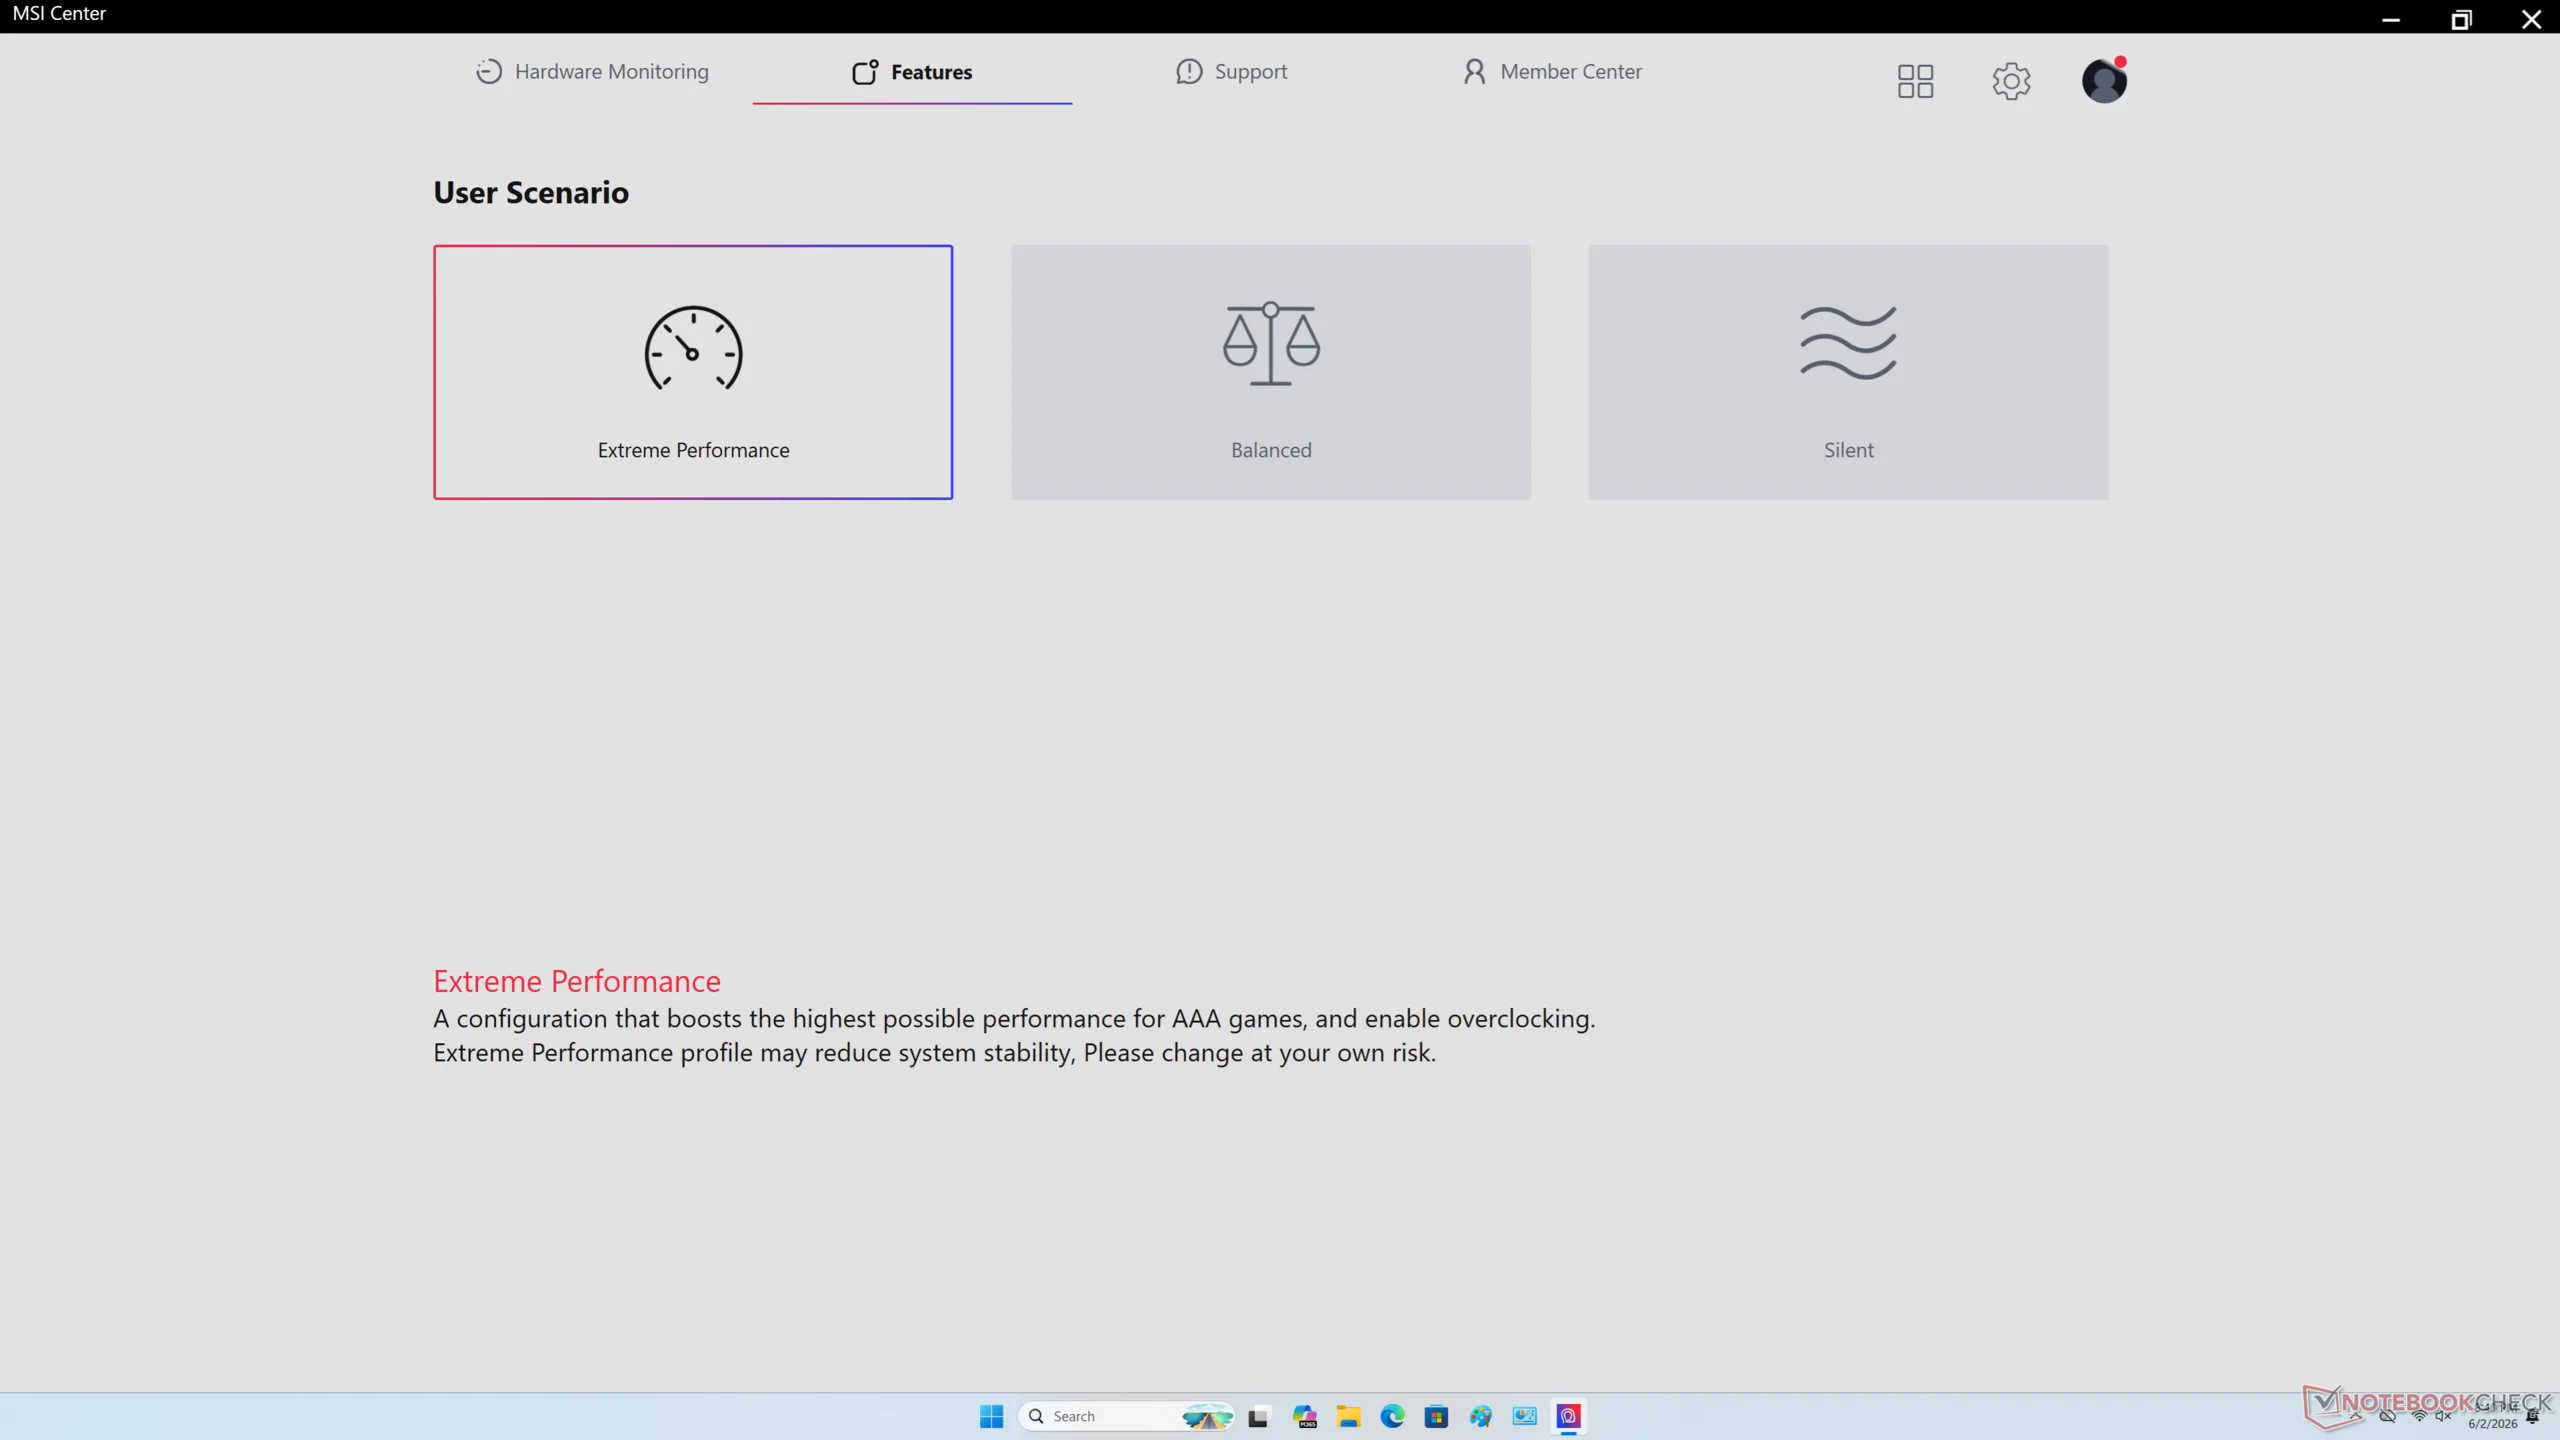
Pusimos el Centro MSI en modo Rendimiento antes de ejecutar los benchmarks que se muestran a continuación.
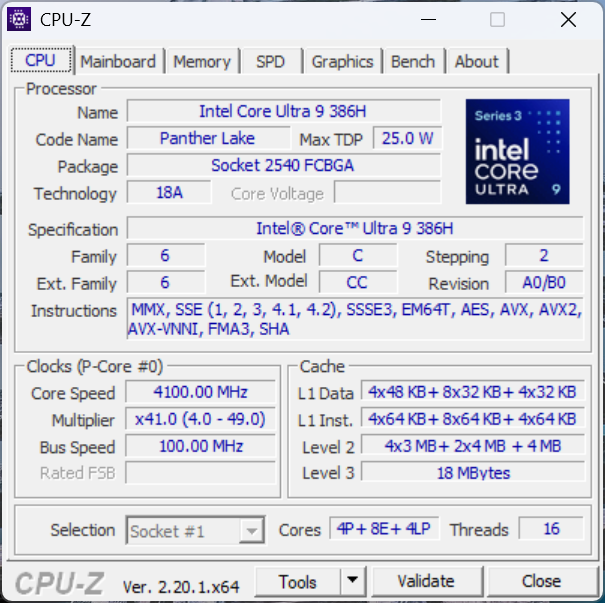
Procesador
La Cubi AI 3MG se entrega con el mismo Core Ultra 9 386H Que se encuentra en el último Razer Blade 16. Sin embargo, el rendimiento multihilo en bruto es aproximadamente un 18 por ciento más lento en el MSI debido al limitado potencial Turbo Boost. Al ejecutar CineBench R15 xT en bucle, por ejemplo, la puntuación inicial de 2792 puntos caería a 2380 puntos después de sólo un par de rondas, como se muestra en nuestro gráfico de comparación a continuación.
No obstante, el rendimiento bruto es mucho más rápido que el de la Cubi AI+ 2MG del año pasado, entre un 50 y un 60 por ciento, incluso después de tener en cuenta cualquier ralentización.
Bucle múltiple Cinebench R15
Cinebench R23: Multi Core | Single Core
Cinebench R20: CPU (Multi Core) | CPU (Single Core)
Cinebench R15: CPU Multi 64Bit | CPU Single 64Bit
Blender: v2.79 BMW27 CPU
7-Zip 18.03: 7z b 4 | 7z b 4 -mmt1
Geekbench 6.7: Multi-Core | Single-Core
Geekbench 5.5: Multi-Core | Single-Core
HWBOT x265 Benchmark v2.2: 4k Preset
LibreOffice : 20 Documents To PDF
R Benchmark 2.5: Overall mean
| CPU Performance rating | |
| Minisforum AI X1 Pro, HX 470 | |
| Asus NUC 15 Pro+ | |
| GMK EVO-T1 | |
| Medio Intel Core Ultra 9 386H | |
| Peladn HO5, AI 9 HX 370 | |
| MSI Cubi NUC AI+ 3MG | |
| HP EliteBoard G1a AI | |
| GMK NucBox K13 | |
| MSI Cubi NUC AI+ 2MG | |
| GMK NucBox K16 | |
| MSI Cubi NUC 1M | |
| Minix Elite EU512-AI -2! | |
| Geekom A5 Pro | |
| Cinebench R23 / Multi Core | |
| Minisforum AI X1 Pro, HX 470 | |
| Asus NUC 15 Pro+ | |
| GMK EVO-T1 | |
| Peladn HO5, AI 9 HX 370 | |
| Medio Intel Core Ultra 9 386H (12144 - 21186, n=8) | |
| MSI Cubi NUC AI+ 3MG | |
| Minix Elite EU512-AI | |
| GMK NucBox K16 | |
| HP EliteBoard G1a AI | |
| GMK NucBox K13 | |
| MSI Cubi NUC AI+ 2MG | |
| MSI Cubi NUC 1M | |
| Geekom A5 Pro | |
| Cinebench R23 / Single Core | |
| Asus NUC 15 Pro+ | |
| GMK EVO-T1 | |
| Minisforum AI X1 Pro, HX 470 | |
| Medio Intel Core Ultra 9 386H (2010 - 2101, n=8) | |
| MSI Cubi NUC AI+ 3MG | |
| Peladn HO5, AI 9 HX 370 | |
| MSI Cubi NUC AI+ 2MG | |
| GMK NucBox K13 | |
| MSI Cubi NUC 1M | |
| HP EliteBoard G1a AI | |
| Minix Elite EU512-AI | |
| GMK NucBox K16 | |
| Geekom A5 Pro | |
| Cinebench R20 / CPU (Multi Core) | |
| Minisforum AI X1 Pro, HX 470 | |
| Asus NUC 15 Pro+ | |
| GMK EVO-T1 | |
| Peladn HO5, AI 9 HX 370 | |
| Medio Intel Core Ultra 9 386H (4757 - 8405, n=8) | |
| MSI Cubi NUC AI+ 3MG | |
| Minix Elite EU512-AI | |
| GMK NucBox K16 | |
| HP EliteBoard G1a AI | |
| GMK NucBox K13 | |
| MSI Cubi NUC AI+ 2MG | |
| MSI Cubi NUC 1M | |
| Geekom A5 Pro | |
| Cinebench R20 / CPU (Single Core) | |
| Asus NUC 15 Pro+ | |
| Minisforum AI X1 Pro, HX 470 | |
| GMK EVO-T1 | |
| Medio Intel Core Ultra 9 386H (762 - 796, n=8) | |
| MSI Cubi NUC AI+ 3MG | |
| MSI Cubi NUC AI+ 2MG | |
| Peladn HO5, AI 9 HX 370 | |
| GMK NucBox K13 | |
| MSI Cubi NUC 1M | |
| HP EliteBoard G1a AI | |
| Minix Elite EU512-AI | |
| GMK NucBox K16 | |
| Geekom A5 Pro | |
| Cinebench R15 / CPU Multi 64Bit | |
| Minisforum AI X1 Pro, HX 470 | |
| Asus NUC 15 Pro+ | |
| GMK EVO-T1 | |
| Peladn HO5, AI 9 HX 370 | |
| Medio Intel Core Ultra 9 386H (2197 - 3347, n=8) | |
| MSI Cubi NUC AI+ 3MG | |
| Minix Elite EU512-AI | |
| GMK NucBox K16 | |
| HP EliteBoard G1a AI | |
| GMK NucBox K13 | |
| MSI Cubi NUC AI+ 2MG | |
| Geekom A5 Pro | |
| MSI Cubi NUC 1M | |
| Cinebench R15 / CPU Single 64Bit | |
| Asus NUC 15 Pro+ | |
| Minisforum AI X1 Pro, HX 470 | |
| GMK EVO-T1 | |
| Peladn HO5, AI 9 HX 370 | |
| MSI Cubi NUC AI+ 2MG | |
| Medio Intel Core Ultra 9 386H (249 - 314, n=8) | |
| GMK NucBox K13 | |
| HP EliteBoard G1a AI | |
| MSI Cubi NUC AI+ 3MG | |
| MSI Cubi NUC 1M | |
| GMK NucBox K16 | |
| Minix Elite EU512-AI | |
| Geekom A5 Pro | |
| Blender / v2.79 BMW27 CPU | |
| MSI Cubi NUC 1M | |
| Geekom A5 Pro | |
| MSI Cubi NUC AI+ 2MG | |
| GMK NucBox K13 | |
| HP EliteBoard G1a AI | |
| GMK NucBox K16 | |
| Minix Elite EU512-AI | |
| MSI Cubi NUC AI+ 3MG | |
| Medio Intel Core Ultra 9 386H (156 - 299, n=8) | |
| GMK EVO-T1 | |
| Asus NUC 15 Pro+ | |
| Peladn HO5, AI 9 HX 370 | |
| Minisforum AI X1 Pro, HX 470 | |
| 7-Zip 18.03 / 7z b 4 -mmt1 | |
| Minisforum AI X1 Pro, HX 470 | |
| Medio Intel Core Ultra 9 386H (5488 - 6493, n=8) | |
| Asus NUC 15 Pro+ | |
| GMK EVO-T1 | |
| Peladn HO5, AI 9 HX 370 | |
| MSI Cubi NUC 1M | |
| MSI Cubi NUC AI+ 2MG | |
| GMK NucBox K13 | |
| HP EliteBoard G1a AI | |
| MSI Cubi NUC AI+ 3MG | |
| Geekom A5 Pro | |
| GMK NucBox K16 | |
| Minix Elite EU512-AI | |
| Geekbench 6.7 / Multi-Core | |
| Asus NUC 15 Pro+ | |
| Medio Intel Core Ultra 9 386H (13776 - 17405, n=10) | |
| GMK EVO-T1 | |
| MSI Cubi NUC AI+ 3MG | |
| Peladn HO5, AI 9 HX 370 | |
| Minisforum AI X1 Pro, HX 470 | |
| HP EliteBoard G1a AI | |
| GMK NucBox K13 | |
| MSI Cubi NUC AI+ 2MG | |
| MSI Cubi NUC 1M | |
| Geekom A5 Pro | |
| GMK NucBox K16 | |
| Geekbench 6.7 / Single-Core | |
| Minisforum AI X1 Pro, HX 470 | |
| GMK EVO-T1 | |
| Medio Intel Core Ultra 9 386H (2778 - 2919, n=10) | |
| Peladn HO5, AI 9 HX 370 | |
| MSI Cubi NUC AI+ 3MG | |
| GMK NucBox K13 | |
| MSI Cubi NUC AI+ 2MG | |
| Asus NUC 15 Pro+ | |
| MSI Cubi NUC 1M | |
| HP EliteBoard G1a AI | |
| Geekom A5 Pro | |
| GMK NucBox K16 | |
| Geekbench 5.5 / Multi-Core | |
| Medio Intel Core Ultra 9 386H (13098 - 17557, n=8) | |
| Asus NUC 15 Pro+ | |
| GMK EVO-T1 | |
| Peladn HO5, AI 9 HX 370 | |
| MSI Cubi NUC AI+ 3MG | |
| Minisforum AI X1 Pro, HX 470 | |
| HP EliteBoard G1a AI | |
| Minix Elite EU512-AI | |
| GMK NucBox K13 | |
| MSI Cubi NUC 1M | |
| MSI Cubi NUC AI+ 2MG | |
| GMK NucBox K16 | |
| Geekom A5 Pro | |
| Geekbench 5.5 / Single-Core | |
| Medio Intel Core Ultra 9 386H (1992 - 2162, n=8) | |
| Peladn HO5, AI 9 HX 370 | |
| GMK EVO-T1 | |
| MSI Cubi NUC AI+ 2MG | |
| GMK NucBox K13 | |
| MSI Cubi NUC AI+ 3MG | |
| Minisforum AI X1 Pro, HX 470 | |
| HP EliteBoard G1a AI | |
| MSI Cubi NUC 1M | |
| Asus NUC 15 Pro+ | |
| Minix Elite EU512-AI | |
| Geekom A5 Pro | |
| GMK NucBox K16 | |
| HWBOT x265 Benchmark v2.2 / 4k Preset | |
| Asus NUC 15 Pro+ | |
| Peladn HO5, AI 9 HX 370 | |
| Minisforum AI X1 Pro, HX 470 | |
| GMK EVO-T1 | |
| Medio Intel Core Ultra 9 386H (13.2 - 25.1, n=8) | |
| MSI Cubi NUC AI+ 3MG | |
| HP EliteBoard G1a AI | |
| Minix Elite EU512-AI | |
| GMK NucBox K13 | |
| MSI Cubi NUC AI+ 2MG | |
| GMK NucBox K16 | |
| Geekom A5 Pro | |
| MSI Cubi NUC 1M | |
| LibreOffice / 20 Documents To PDF | |
| Minix Elite EU512-AI | |
| HP EliteBoard G1a AI | |
| Minisforum AI X1 Pro, HX 470 | |
| GMK NucBox K16 | |
| Geekom A5 Pro | |
| Peladn HO5, AI 9 HX 370 | |
| Asus NUC 15 Pro+ | |
| GMK EVO-T1 | |
| MSI Cubi NUC AI+ 3MG | |
| GMK NucBox K13 | |
| Medio Intel Core Ultra 9 386H (38.5 - 56.1, n=8) | |
| MSI Cubi NUC AI+ 2MG | |
| MSI Cubi NUC 1M | |
| R Benchmark 2.5 / Overall mean | |
| Minix Elite EU512-AI | |
| GMK NucBox K16 | |
| Geekom A5 Pro | |
| MSI Cubi NUC AI+ 2MG | |
| HP EliteBoard G1a AI | |
| GMK NucBox K13 | |
| MSI Cubi NUC 1M | |
| GMK EVO-T1 | |
| Asus NUC 15 Pro+ | |
| MSI Cubi NUC AI+ 3MG | |
| Medio Intel Core Ultra 9 386H (0.4055 - 0.4384, n=8) | |
| Peladn HO5, AI 9 HX 370 | |
| Minisforum AI X1 Pro, HX 470 | |
Cinebench R23: Multi Core | Single Core
Cinebench R20: CPU (Multi Core) | CPU (Single Core)
Cinebench R15: CPU Multi 64Bit | CPU Single 64Bit
Blender: v2.79 BMW27 CPU
7-Zip 18.03: 7z b 4 | 7z b 4 -mmt1
Geekbench 6.7: Multi-Core | Single-Core
Geekbench 5.5: Multi-Core | Single-Core
HWBOT x265 Benchmark v2.2: 4k Preset
LibreOffice : 20 Documents To PDF
R Benchmark 2.5: Overall mean
* ... más pequeño es mejor
AIDA64: FP32 Ray-Trace | FPU Julia | CPU SHA3 | CPU Queen | FPU SinJulia | FPU Mandel | CPU AES | CPU ZLib | FP64 Ray-Trace | CPU PhotoWorxx | CPU CheckMate
| Performance rating | |
| Asus NUC 15 Pro+ -1! | |
| Medio Intel Core Ultra 9 386H -1! | |
| GMK EVO-T1 | |
| MSI Cubi NUC AI+ 3MG -1! | |
| GMK NucBox K16 -1! | |
| MSI Cubi NUC AI+ 2MG -1! | |
| Geekom A5 Pro | |
| MSI Cubi NUC 1M -1! | |
| AIDA64 / FP32 Ray-Trace | |
| Asus NUC 15 Pro+ (v6.92.6600) | |
| GMK EVO-T1 (v6.92.6600) | |
| GMK EVO-T1 (v8.20.8100) | |
| Medio Intel Core Ultra 9 386H (10001 - 21727, n=8) | |
| GMK NucBox K16 (v8.20.8100) | |
| MSI Cubi NUC AI+ 3MG (v8.20.8100) | |
| MSI Cubi NUC AI+ 2MG (v6.92.6600) | |
| Geekom A5 Pro (v8.20.8100) | |
| Geekom A5 Pro (v6.92.6600) | |
| MSI Cubi NUC 1M (v6.92.6600) | |
| AIDA64 / FPU Julia | |
| Asus NUC 15 Pro+ (v6.92.6600) | |
| GMK EVO-T1 (v6.92.6600) | |
| GMK EVO-T1 (v8.20.8100) | |
| Medio Intel Core Ultra 9 386H (53370 - 113595, n=8) | |
| GMK NucBox K16 (v8.20.8100) | |
| MSI Cubi NUC AI+ 3MG (v8.20.8100) | |
| MSI Cubi NUC AI+ 2MG (v6.92.6600) | |
| Geekom A5 Pro (v8.20.8100) | |
| Geekom A5 Pro (v6.92.6600) | |
| MSI Cubi NUC 1M (v6.92.6600) | |
| AIDA64 / CPU SHA3 | |
| Asus NUC 15 Pro+ (v6.92.6600) | |
| GMK EVO-T1 (v6.92.6600) | |
| GMK EVO-T1 (v8.20.8100) | |
| Medio Intel Core Ultra 9 386H (2776 - 5604, n=8) | |
| MSI Cubi NUC AI+ 3MG (v8.20.8100) | |
| GMK NucBox K16 (v8.20.8100) | |
| MSI Cubi NUC AI+ 2MG (v6.92.6600) | |
| MSI Cubi NUC 1M (v6.92.6600) | |
| Geekom A5 Pro (v6.92.6600) | |
| Geekom A5 Pro (v8.20.8100) | |
| AIDA64 / CPU Queen | |
| Asus NUC 15 Pro+ (v6.92.6600) | |
| Geekom A5 Pro (v6.92.6600) | |
| MSI Cubi NUC 1M (v6.92.6600) | |
| GMK EVO-T1 (v6.92.6600) | |
| MSI Cubi NUC AI+ 2MG (v6.92.6600) | |
| AIDA64 / FPU SinJulia | |
| GMK NucBox K16 (v8.20.8100) | |
| Asus NUC 15 Pro+ (v6.92.6600) | |
| GMK EVO-T1 (v6.92.6600) | |
| GMK EVO-T1 (v8.20.8100) | |
| Geekom A5 Pro (v6.92.6600) | |
| Geekom A5 Pro (v8.20.8100) | |
| Medio Intel Core Ultra 9 386H (5314 - 7332, n=8) | |
| MSI Cubi NUC AI+ 3MG (v8.20.8100) | |
| MSI Cubi NUC AI+ 2MG (v6.92.6600) | |
| MSI Cubi NUC 1M (v6.92.6600) | |
| AIDA64 / FPU Mandel | |
| GMK EVO-T1 (v6.92.6600) | |
| GMK EVO-T1 (v8.20.8100) | |
| Asus NUC 15 Pro+ (v6.92.6600) | |
| GMK NucBox K16 (v8.20.8100) | |
| Medio Intel Core Ultra 9 386H (28414 - 61578, n=8) | |
| MSI Cubi NUC AI+ 3MG (v8.20.8100) | |
| MSI Cubi NUC AI+ 2MG (v6.92.6600) | |
| Geekom A5 Pro (v6.92.6600) | |
| Geekom A5 Pro (v8.20.8100) | |
| MSI Cubi NUC 1M (v6.92.6600) | |
| AIDA64 / CPU AES | |
| Asus NUC 15 Pro+ (v6.92.6600) | |
| GMK EVO-T1 (v6.92.6600) | |
| GMK EVO-T1 (v8.20.8100) | |
| Medio Intel Core Ultra 9 386H (46362 - 72112, n=8) | |
| GMK NucBox K16 (v8.20.8100) | |
| MSI Cubi NUC AI+ 3MG (v8.20.8100) | |
| MSI Cubi NUC AI+ 2MG (v6.92.6600) | |
| Geekom A5 Pro (v6.92.6600) | |
| Geekom A5 Pro (v8.20.8100) | |
| MSI Cubi NUC 1M (v6.92.6600) | |
| AIDA64 / CPU ZLib | |
| Asus NUC 15 Pro+ (v6.92.6600) | |
| GMK EVO-T1 (v6.92.6600) | |
| GMK EVO-T1 (v8.20.8100) | |
| Medio Intel Core Ultra 9 386H (669 - 1271, n=8) | |
| MSI Cubi NUC AI+ 3MG (v8.20.8100) | |
| GMK NucBox K16 (v8.20.8100) | |
| MSI Cubi NUC AI+ 2MG (v6.92.6600) | |
| MSI Cubi NUC 1M (v6.92.6600) | |
| Geekom A5 Pro (v6.92.6600) | |
| Geekom A5 Pro (v8.20.8100) | |
| AIDA64 / FP64 Ray-Trace | |
| Asus NUC 15 Pro+ (v6.92.6600) | |
| GMK EVO-T1 (v6.92.6600) | |
| GMK EVO-T1 (v8.20.8100) | |
| Medio Intel Core Ultra 9 386H (5138 - 11627, n=8) | |
| GMK NucBox K16 (v8.20.8100) | |
| MSI Cubi NUC AI+ 3MG (v8.20.8100) | |
| MSI Cubi NUC AI+ 2MG (v6.92.6600) | |
| Geekom A5 Pro (v8.20.8100) | |
| Geekom A5 Pro (v6.92.6600) | |
| MSI Cubi NUC 1M (v6.92.6600) | |
| AIDA64 / CPU PhotoWorxx | |
| Medio Intel Core Ultra 9 386H (54042 - 89891, n=8) | |
| GMK EVO-T1 (v8.20.8100) | |
| GMK EVO-T1 (v6.92.6600) | |
| Asus NUC 15 Pro+ (v6.92.6600) | |
| MSI Cubi NUC AI+ 2MG (v6.92.6600) | |
| MSI Cubi NUC AI+ 3MG (v8.20.8100) | |
| MSI Cubi NUC 1M (v6.92.6600) | |
| Geekom A5 Pro (v6.92.6600) | |
| Geekom A5 Pro (v8.20.8100) | |
| GMK NucBox K16 (v8.20.8100) | |
| AIDA64 / CPU CheckMate | |
| Medio Intel Core Ultra 9 386H (4051 - 4858, n=7) | |
| MSI Cubi NUC AI+ 3MG (v8.20.8100) | |
| GMK EVO-T1 (v8.20.8100) | |
| GMK NucBox K16 (v8.20.8100) | |
| Geekom A5 Pro (v8.20.8100) | |
Rendimiento del sistema
Geekbench AI: Quantized GPU 1.7 | Half Precision GPU 1.7 | Single Precision GPU 1.7
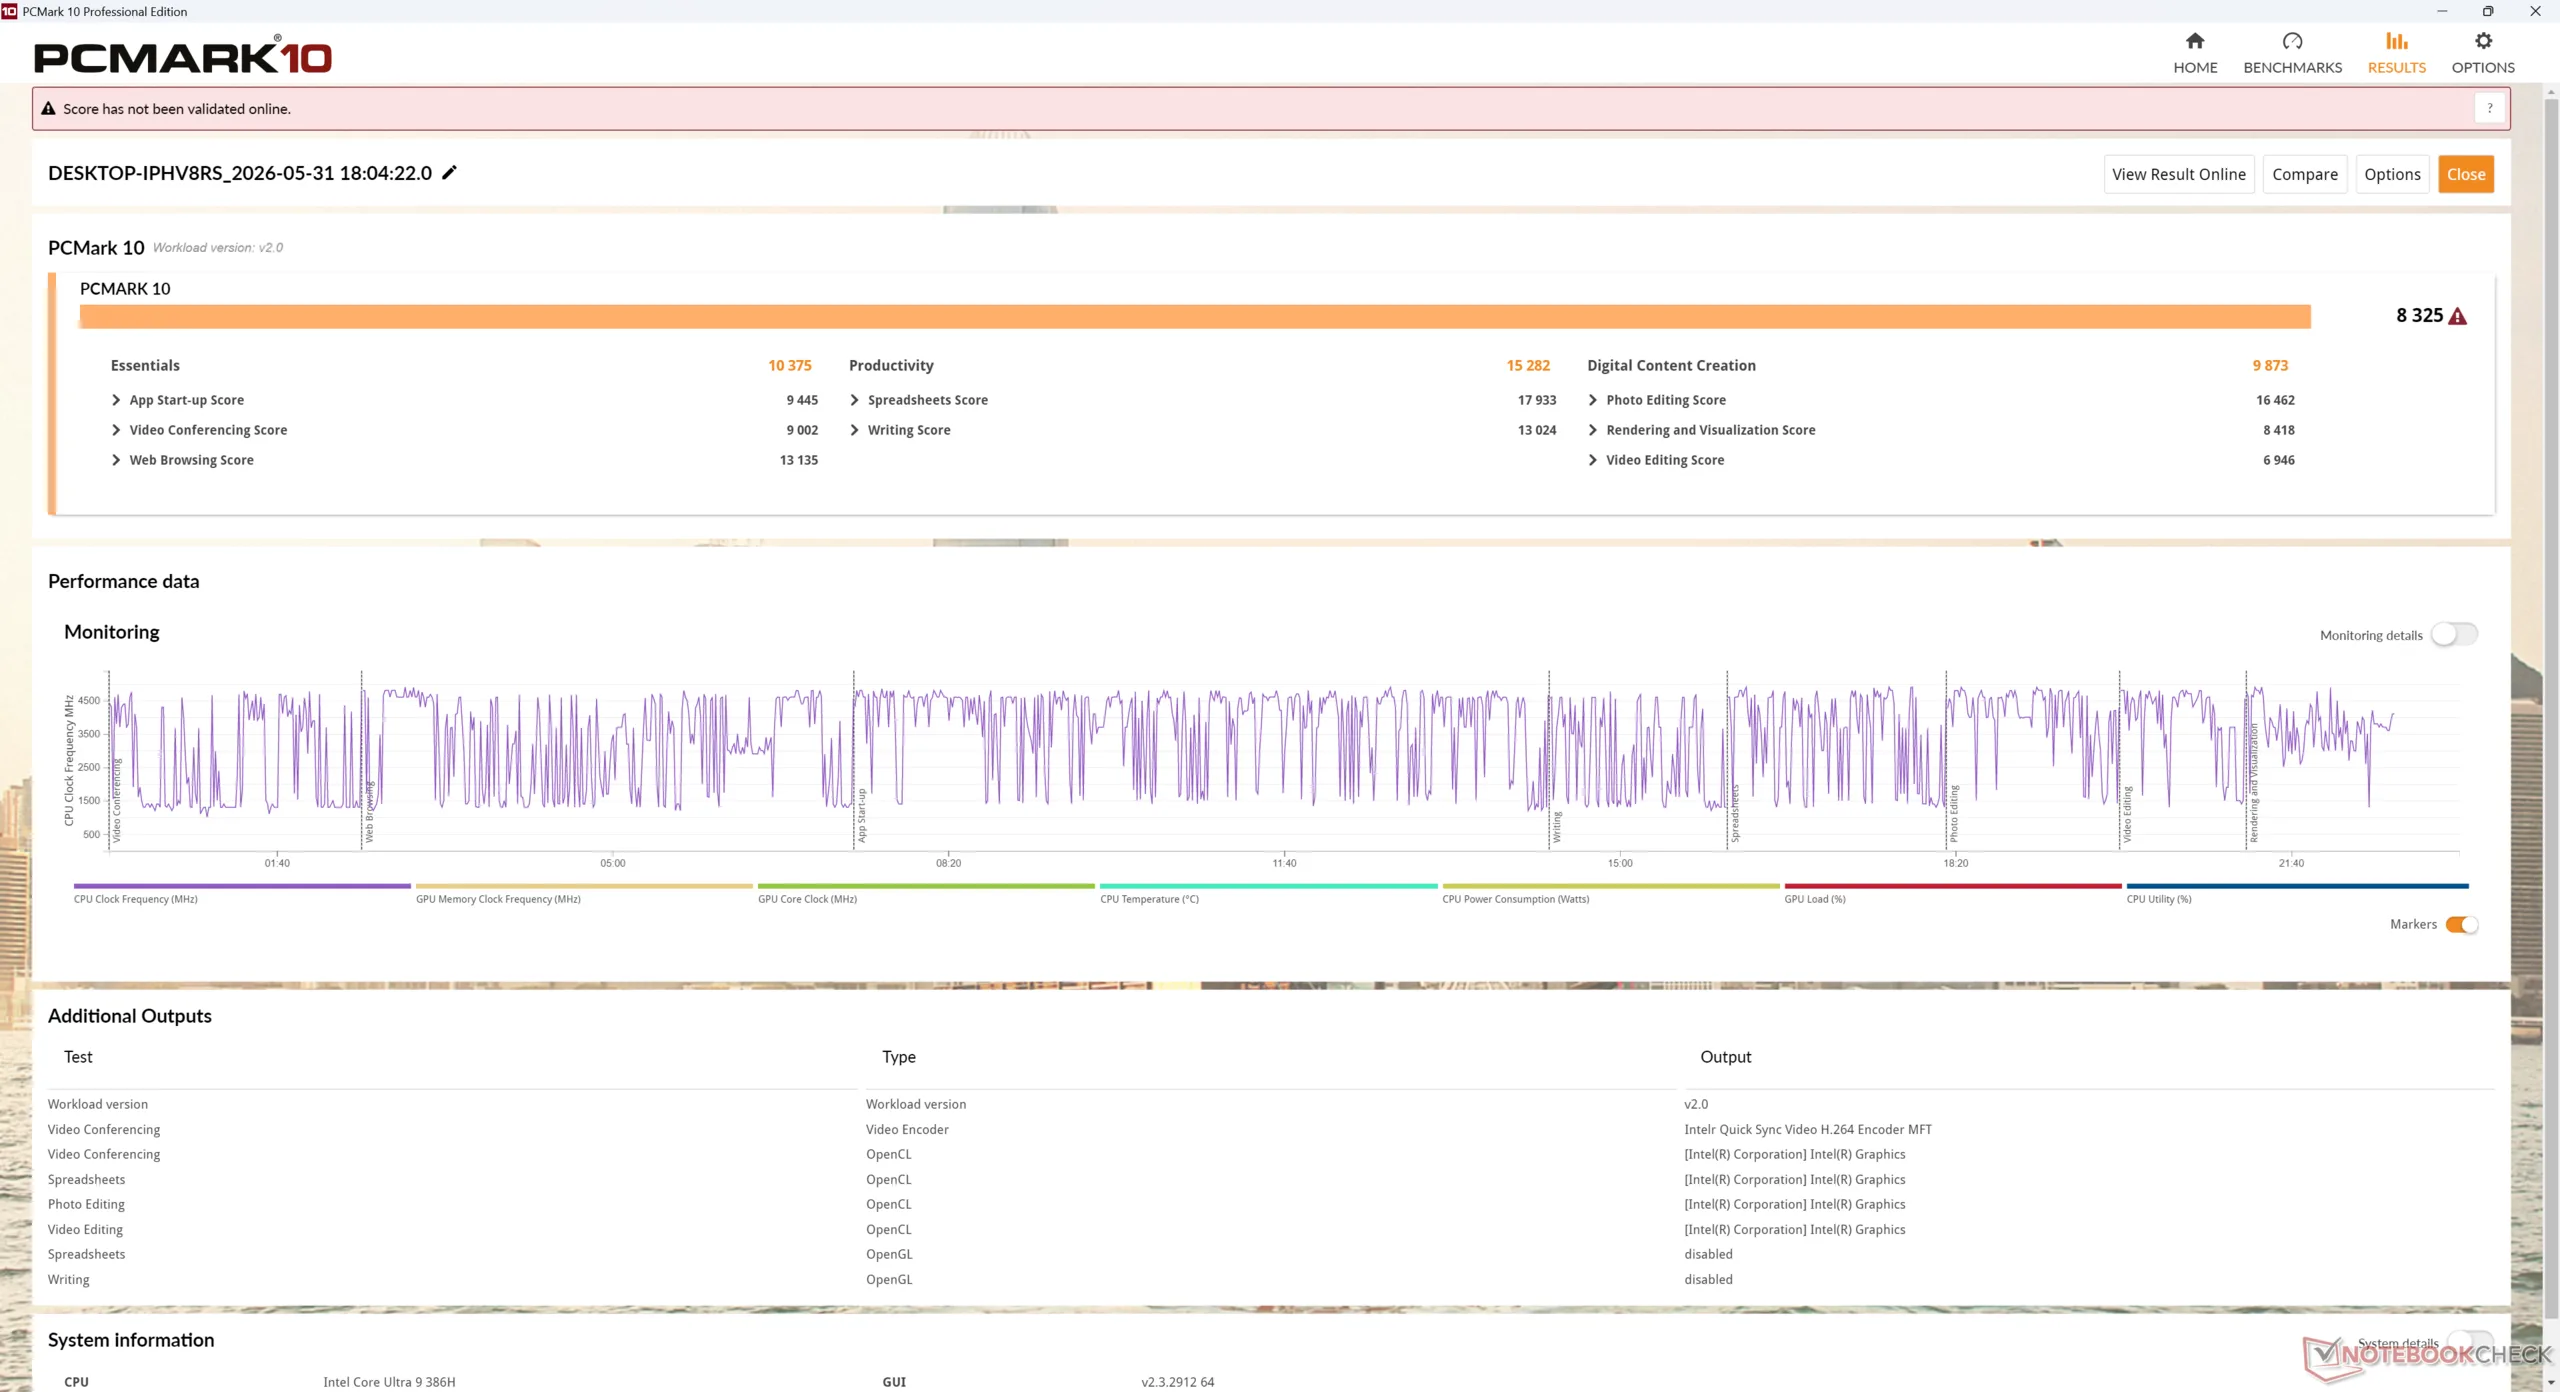
PCMark 10: Score | Essentials | Productivity | Digital Content Creation
CrossMark: Overall | Productivity | Creativity | Responsiveness
WebXPRT 3: Overall
WebXPRT 4: Overall
Mozilla Kraken 1.1: Total
| Performance rating | |
| GMK EVO-T1 | |
| MSI Cubi NUC AI+ 3MG | |
| MSI Cubi NUC AI+ 2MG | |
| Asus NUC 15 Pro+ | |
| MSI Cubi NUC 1M -3! | |
| GMK NucBox K16 -3! | |
| Geekom A5 Pro | |
| Geekbench AI / Quantized GPU 1.7 | |
| MSI Cubi NUC AI+ 2MG | |
| Asus NUC 15 Pro+ | |
| GMK EVO-T1 | |
| MSI Cubi NUC AI+ 3MG | |
| Geekom A5 Pro | |
| Geekbench AI / Half Precision GPU 1.7 | |
| MSI Cubi NUC AI+ 2MG | |
| MSI Cubi NUC AI+ 3MG | |
| GMK EVO-T1 | |
| Asus NUC 15 Pro+ | |
| Geekom A5 Pro | |
| Geekbench AI / Single Precision GPU 1.7 | |
| MSI Cubi NUC AI+ 2MG | |
| Asus NUC 15 Pro+ | |
| GMK EVO-T1 | |
| MSI Cubi NUC AI+ 3MG | |
| Geekom A5 Pro | |
| PCMark 10 / Score | |
| MSI Cubi NUC AI+ 3MG | |
| GMK EVO-T1 | |
| Asus NUC 15 Pro+ | |
| MSI Cubi NUC AI+ 2MG | |
| GMK NucBox K16 | |
| Geekom A5 Pro | |
| MSI Cubi NUC 1M | |
| PCMark 10 / Essentials | |
| MSI Cubi NUC 1M | |
| MSI Cubi NUC AI+ 3MG | |
| GMK EVO-T1 | |
| MSI Cubi NUC AI+ 2MG | |
| Asus NUC 15 Pro+ | |
| Geekom A5 Pro | |
| GMK NucBox K16 | |
| PCMark 10 / Productivity | |
| MSI Cubi NUC AI+ 3MG | |
| Geekom A5 Pro | |
| GMK NucBox K16 | |
| GMK EVO-T1 | |
| MSI Cubi NUC AI+ 2MG | |
| Asus NUC 15 Pro+ | |
| MSI Cubi NUC 1M | |
| PCMark 10 / Digital Content Creation | |
| GMK EVO-T1 | |
| Asus NUC 15 Pro+ | |
| MSI Cubi NUC AI+ 3MG | |
| MSI Cubi NUC AI+ 2MG | |
| GMK NucBox K16 | |
| MSI Cubi NUC 1M | |
| Geekom A5 Pro | |
| CrossMark / Overall | |
| GMK EVO-T1 | |
| MSI Cubi NUC AI+ 3MG | |
| Asus NUC 15 Pro+ | |
| MSI Cubi NUC 1M | |
| MSI Cubi NUC AI+ 2MG | |
| GMK NucBox K16 | |
| Geekom A5 Pro | |
| CrossMark / Productivity | |
| GMK EVO-T1 | |
| MSI Cubi NUC AI+ 3MG | |
| MSI Cubi NUC 1M | |
| Asus NUC 15 Pro+ | |
| MSI Cubi NUC AI+ 2MG | |
| GMK NucBox K16 | |
| Geekom A5 Pro | |
| CrossMark / Creativity | |
| MSI Cubi NUC AI+ 3MG | |
| GMK EVO-T1 | |
| Asus NUC 15 Pro+ | |
| MSI Cubi NUC AI+ 2MG | |
| MSI Cubi NUC 1M | |
| GMK NucBox K16 | |
| Geekom A5 Pro | |
| CrossMark / Responsiveness | |
| GMK EVO-T1 | |
| MSI Cubi NUC AI+ 3MG | |
| MSI Cubi NUC 1M | |
| Asus NUC 15 Pro+ | |
| MSI Cubi NUC AI+ 2MG | |
| GMK NucBox K16 | |
| Geekom A5 Pro | |
| WebXPRT 3 / Overall | |
| GMK EVO-T1 | |
| MSI Cubi NUC AI+ 2MG | |
| MSI Cubi NUC 1M | |
| MSI Cubi NUC AI+ 3MG | |
| Geekom A5 Pro | |
| Asus NUC 15 Pro+ | |
| GMK NucBox K16 | |
| WebXPRT 4 / Overall | |
| GMK EVO-T1 | |
| MSI Cubi NUC AI+ 3MG | |
| MSI Cubi NUC AI+ 2MG | |
| MSI Cubi NUC 1M | |
| Asus NUC 15 Pro+ | |
| Geekom A5 Pro | |
| GMK NucBox K16 | |
| Mozilla Kraken 1.1 / Total | |
| GMK NucBox K16 | |
| Geekom A5 Pro | |
| MSI Cubi NUC 1M | |
| MSI Cubi NUC AI+ 2MG | |
| Asus NUC 15 Pro+ | |
| GMK EVO-T1 | |
| MSI Cubi NUC AI+ 3MG | |
* ... más pequeño es mejor
| PCMark 10 Score | 8325 puntos | |
ayuda | ||
| AIDA64 / Memory Copy | |
| Medio Intel Core Ultra 9 386H (75437 - 129946, n=8) | |
| MSI Cubi NUC AI+ 2MG | |
| Asus NUC 15 Pro+ | |
| GMK EVO-T1 | |
| GMK EVO-T1 | |
| MSI Cubi NUC AI+ 3MG | |
| MSI Cubi NUC 1M | |
| Geekom A5 Pro | |
| Geekom A5 Pro | |
| GMK NucBox K16 | |
| AIDA64 / Memory Read | |
| Medio Intel Core Ultra 9 386H (81021 - 118858, n=8) | |
| Asus NUC 15 Pro+ | |
| MSI Cubi NUC AI+ 2MG | |
| MSI Cubi NUC AI+ 3MG | |
| GMK EVO-T1 | |
| GMK EVO-T1 | |
| MSI Cubi NUC 1M | |
| Geekom A5 Pro | |
| Geekom A5 Pro | |
| GMK NucBox K16 | |
| AIDA64 / Memory Write | |
| MSI Cubi NUC AI+ 2MG | |
| Medio Intel Core Ultra 9 386H (75959 - 135096, n=8) | |
| Asus NUC 15 Pro+ | |
| GMK EVO-T1 | |
| GMK EVO-T1 | |
| MSI Cubi NUC AI+ 3MG | |
| MSI Cubi NUC 1M | |
| GMK NucBox K16 | |
| Geekom A5 Pro | |
| Geekom A5 Pro | |
| AIDA64 / Memory Latency | |
| GMK EVO-T1 | |
| GMK EVO-T1 | |
| MSI Cubi NUC AI+ 3MG | |
| GMK NucBox K16 | |
| Asus NUC 15 Pro+ | |
| Medio Intel Core Ultra 9 386H (87.2 - 116.9, n=8) | |
| Geekom A5 Pro | |
| Geekom A5 Pro | |
| MSI Cubi NUC AI+ 2MG | |
| MSI Cubi NUC 1M | |
* ... más pequeño es mejor
Latencia del CPD
Dispositivos de almacenamiento
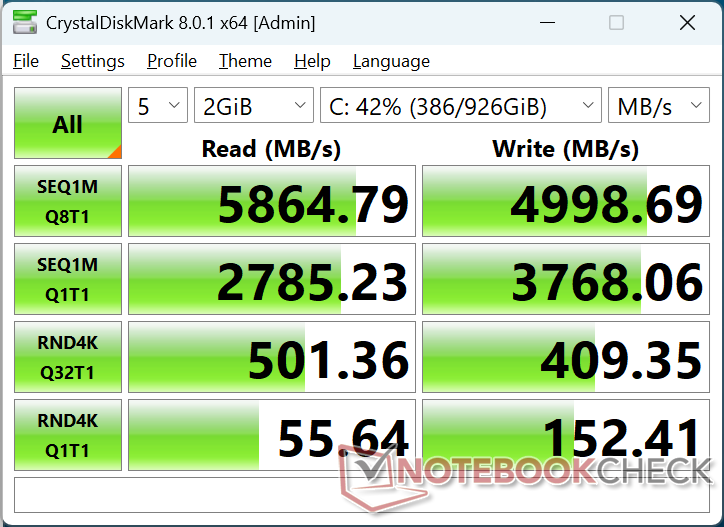
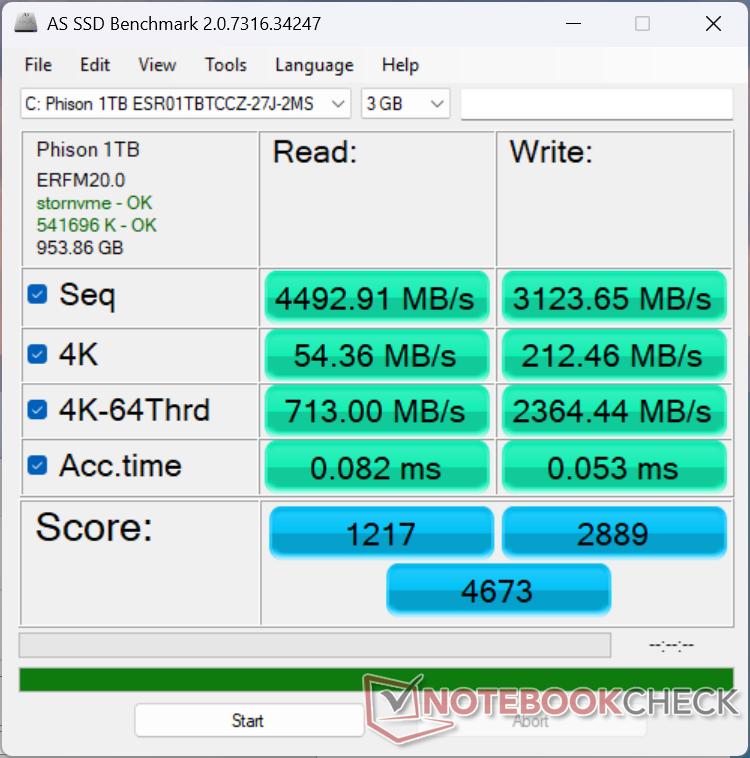
El sistema se entrega con el mismo Phison ESR01TBTCCZ de 1 TB SSD PCIe4 NVMe que se encuentra en el Cubi 2MG del año pasado.

| Drive Performance rating - Percent | |
| GMK EVO-T1 | |
| Asus NUC 15 Pro+ | |
| MSI Cubi NUC AI+ 3MG | |
| MSI Cubi NUC 1M | |
| Geekom A5 Pro | |
| MSI Cubi NUC AI+ 2MG | |
| GMK NucBox K16 | |
* ... más pequeño es mejor
Estrangulamiento de disco: Bucle de lectura DiskSpd, profundidad de cola 8
Rendimiento de la GPU
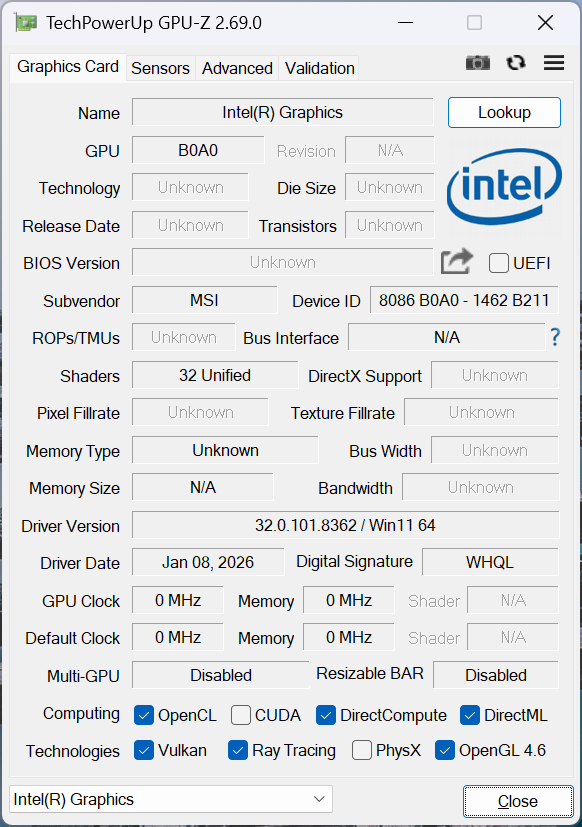
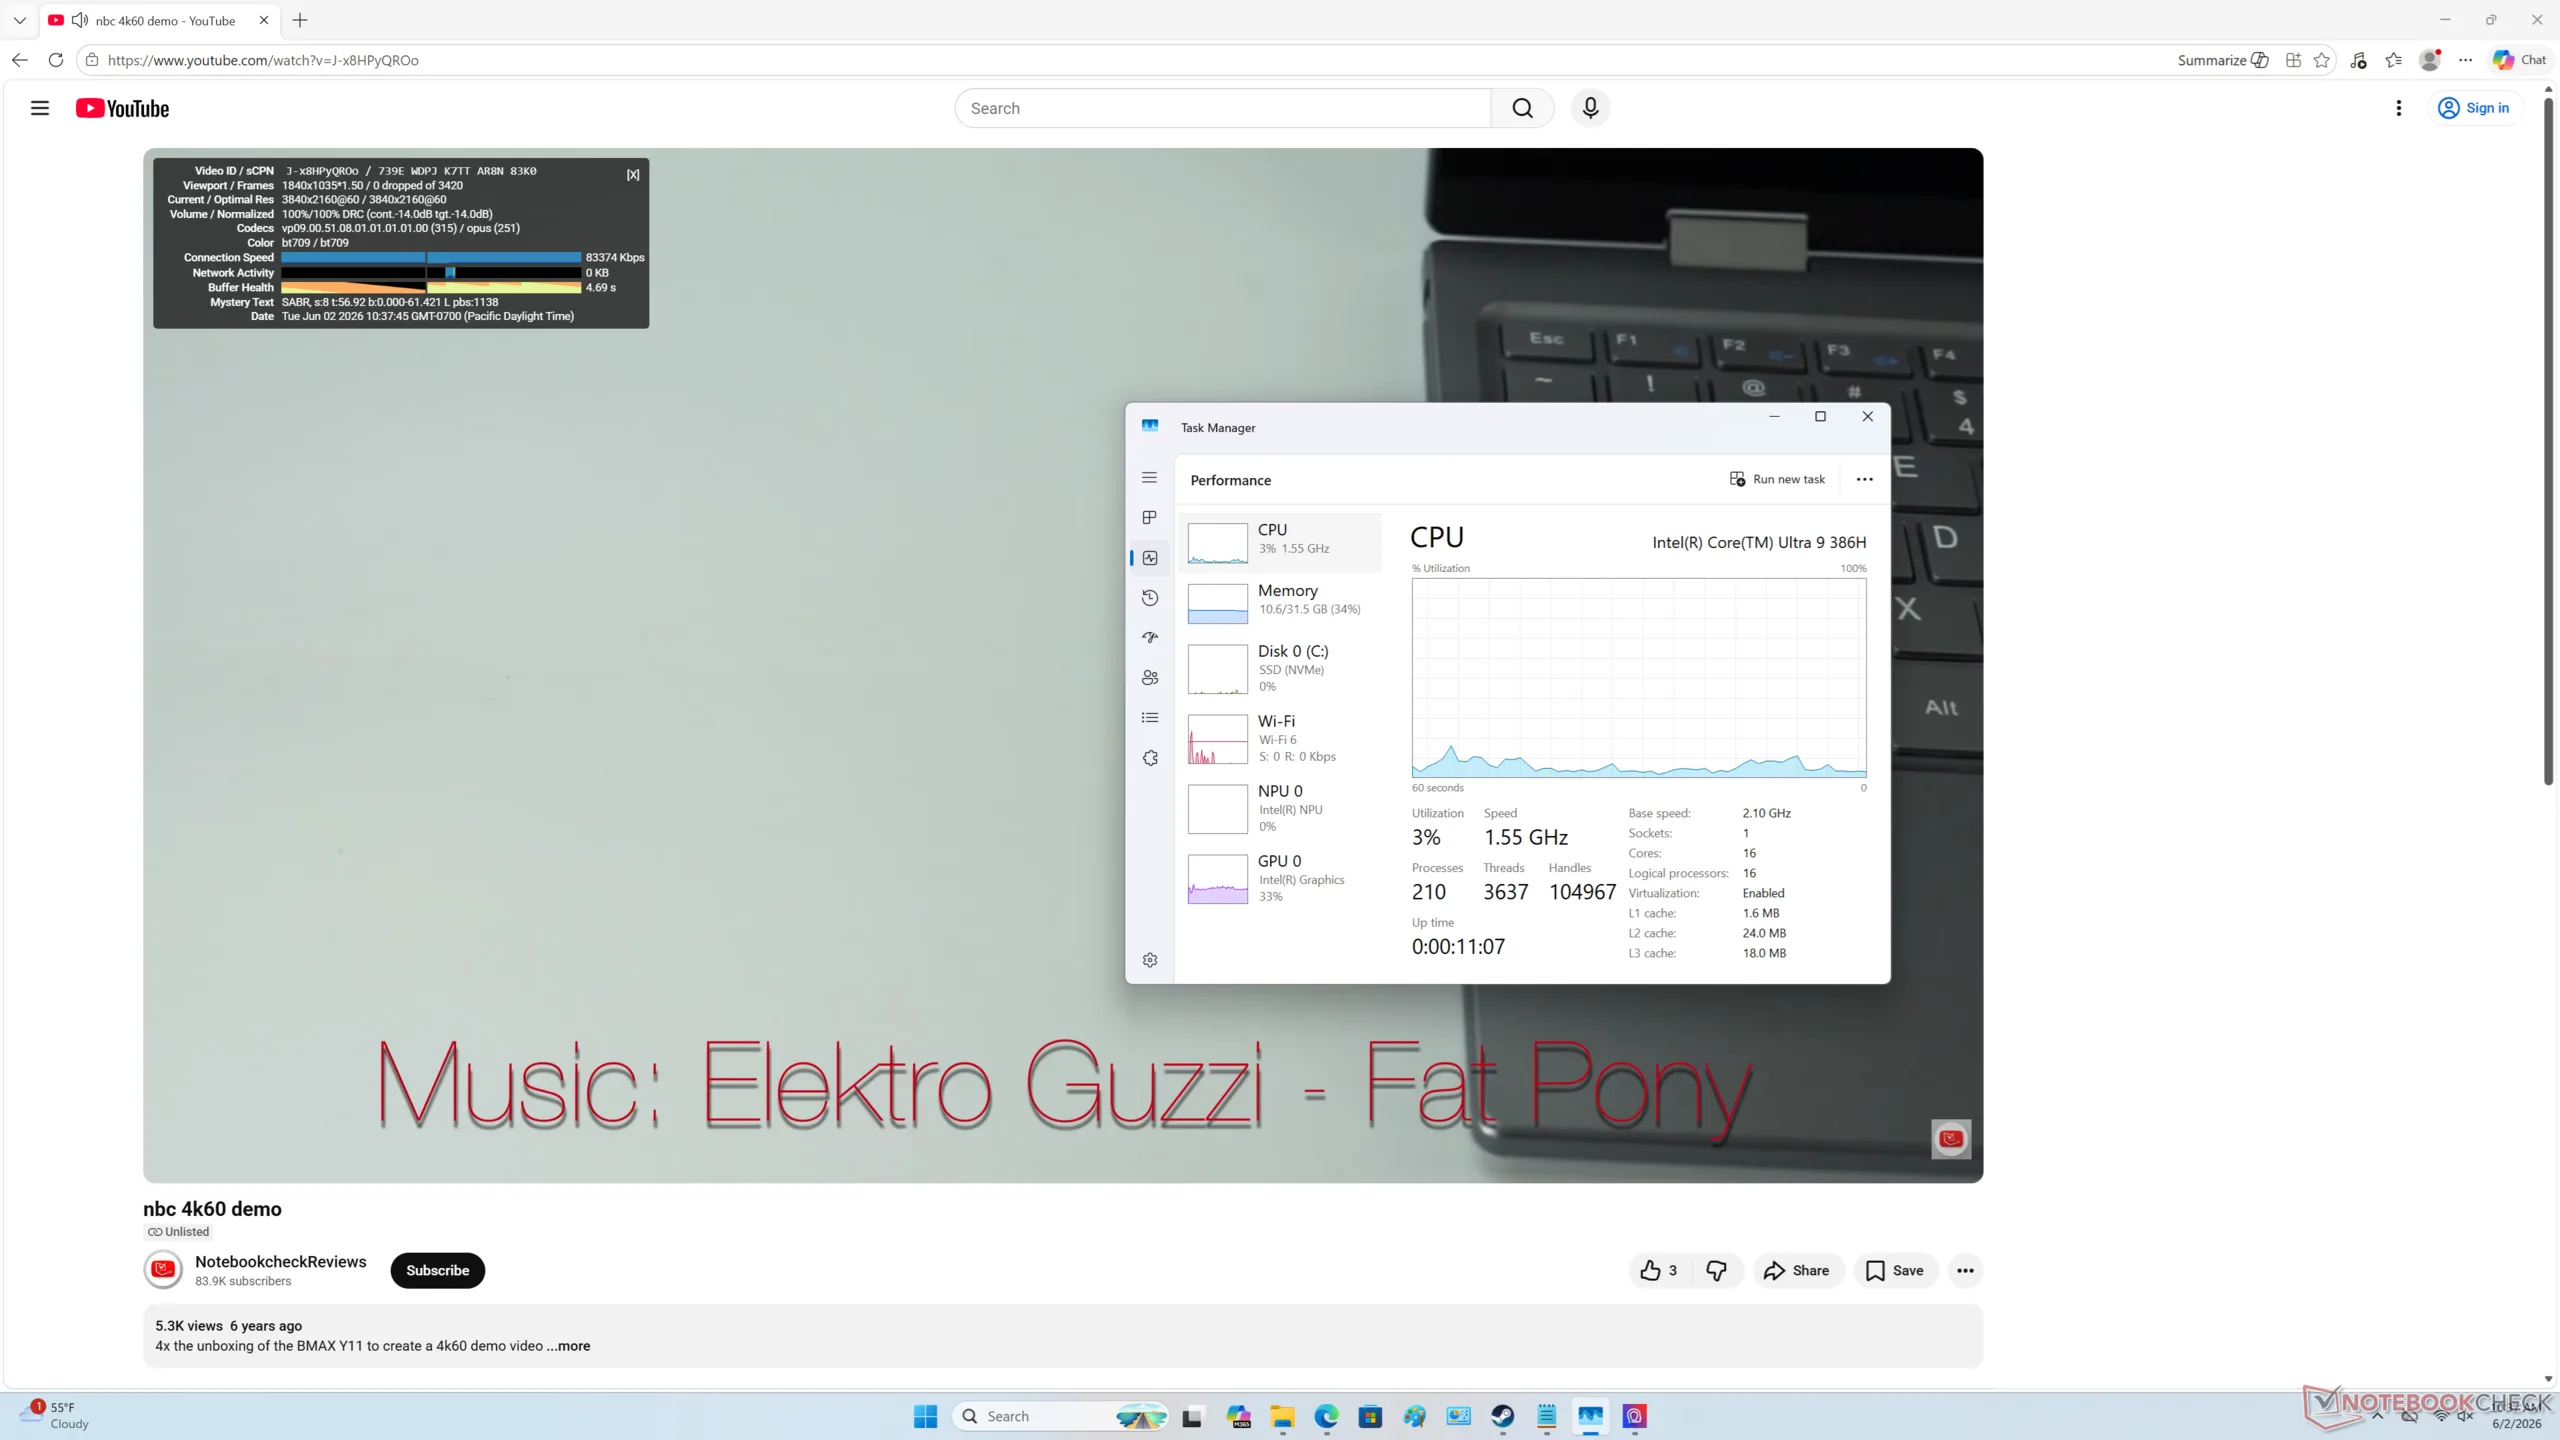
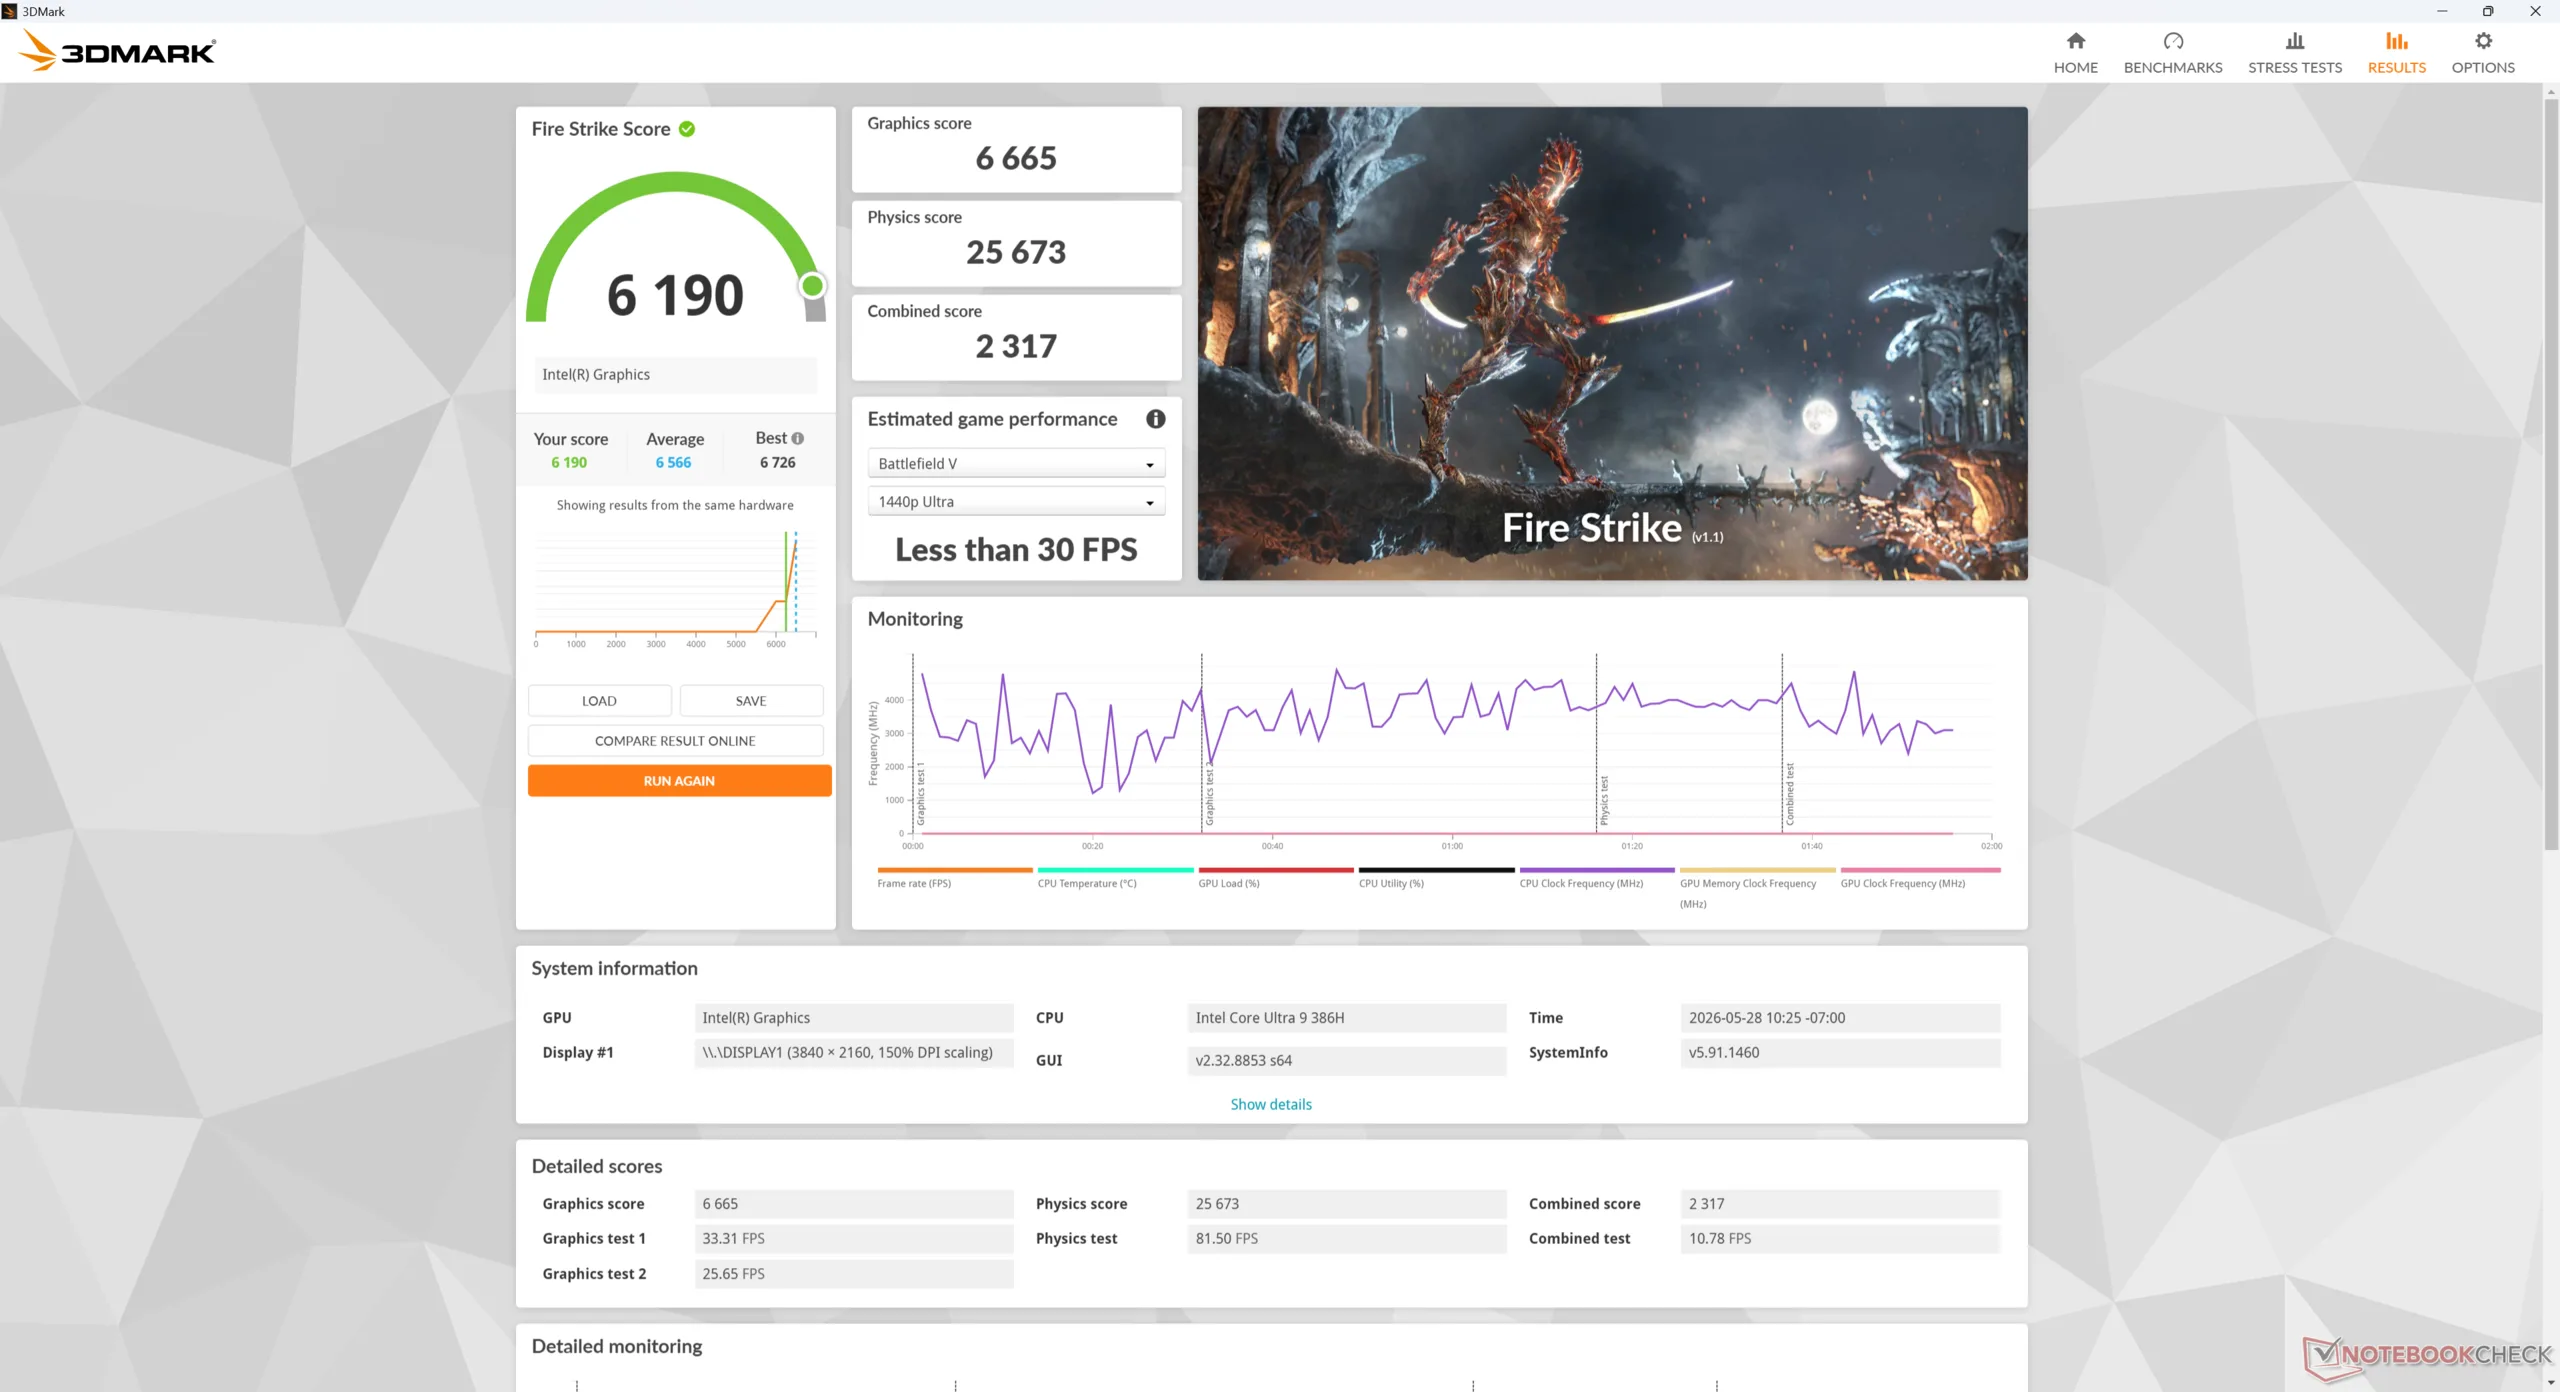
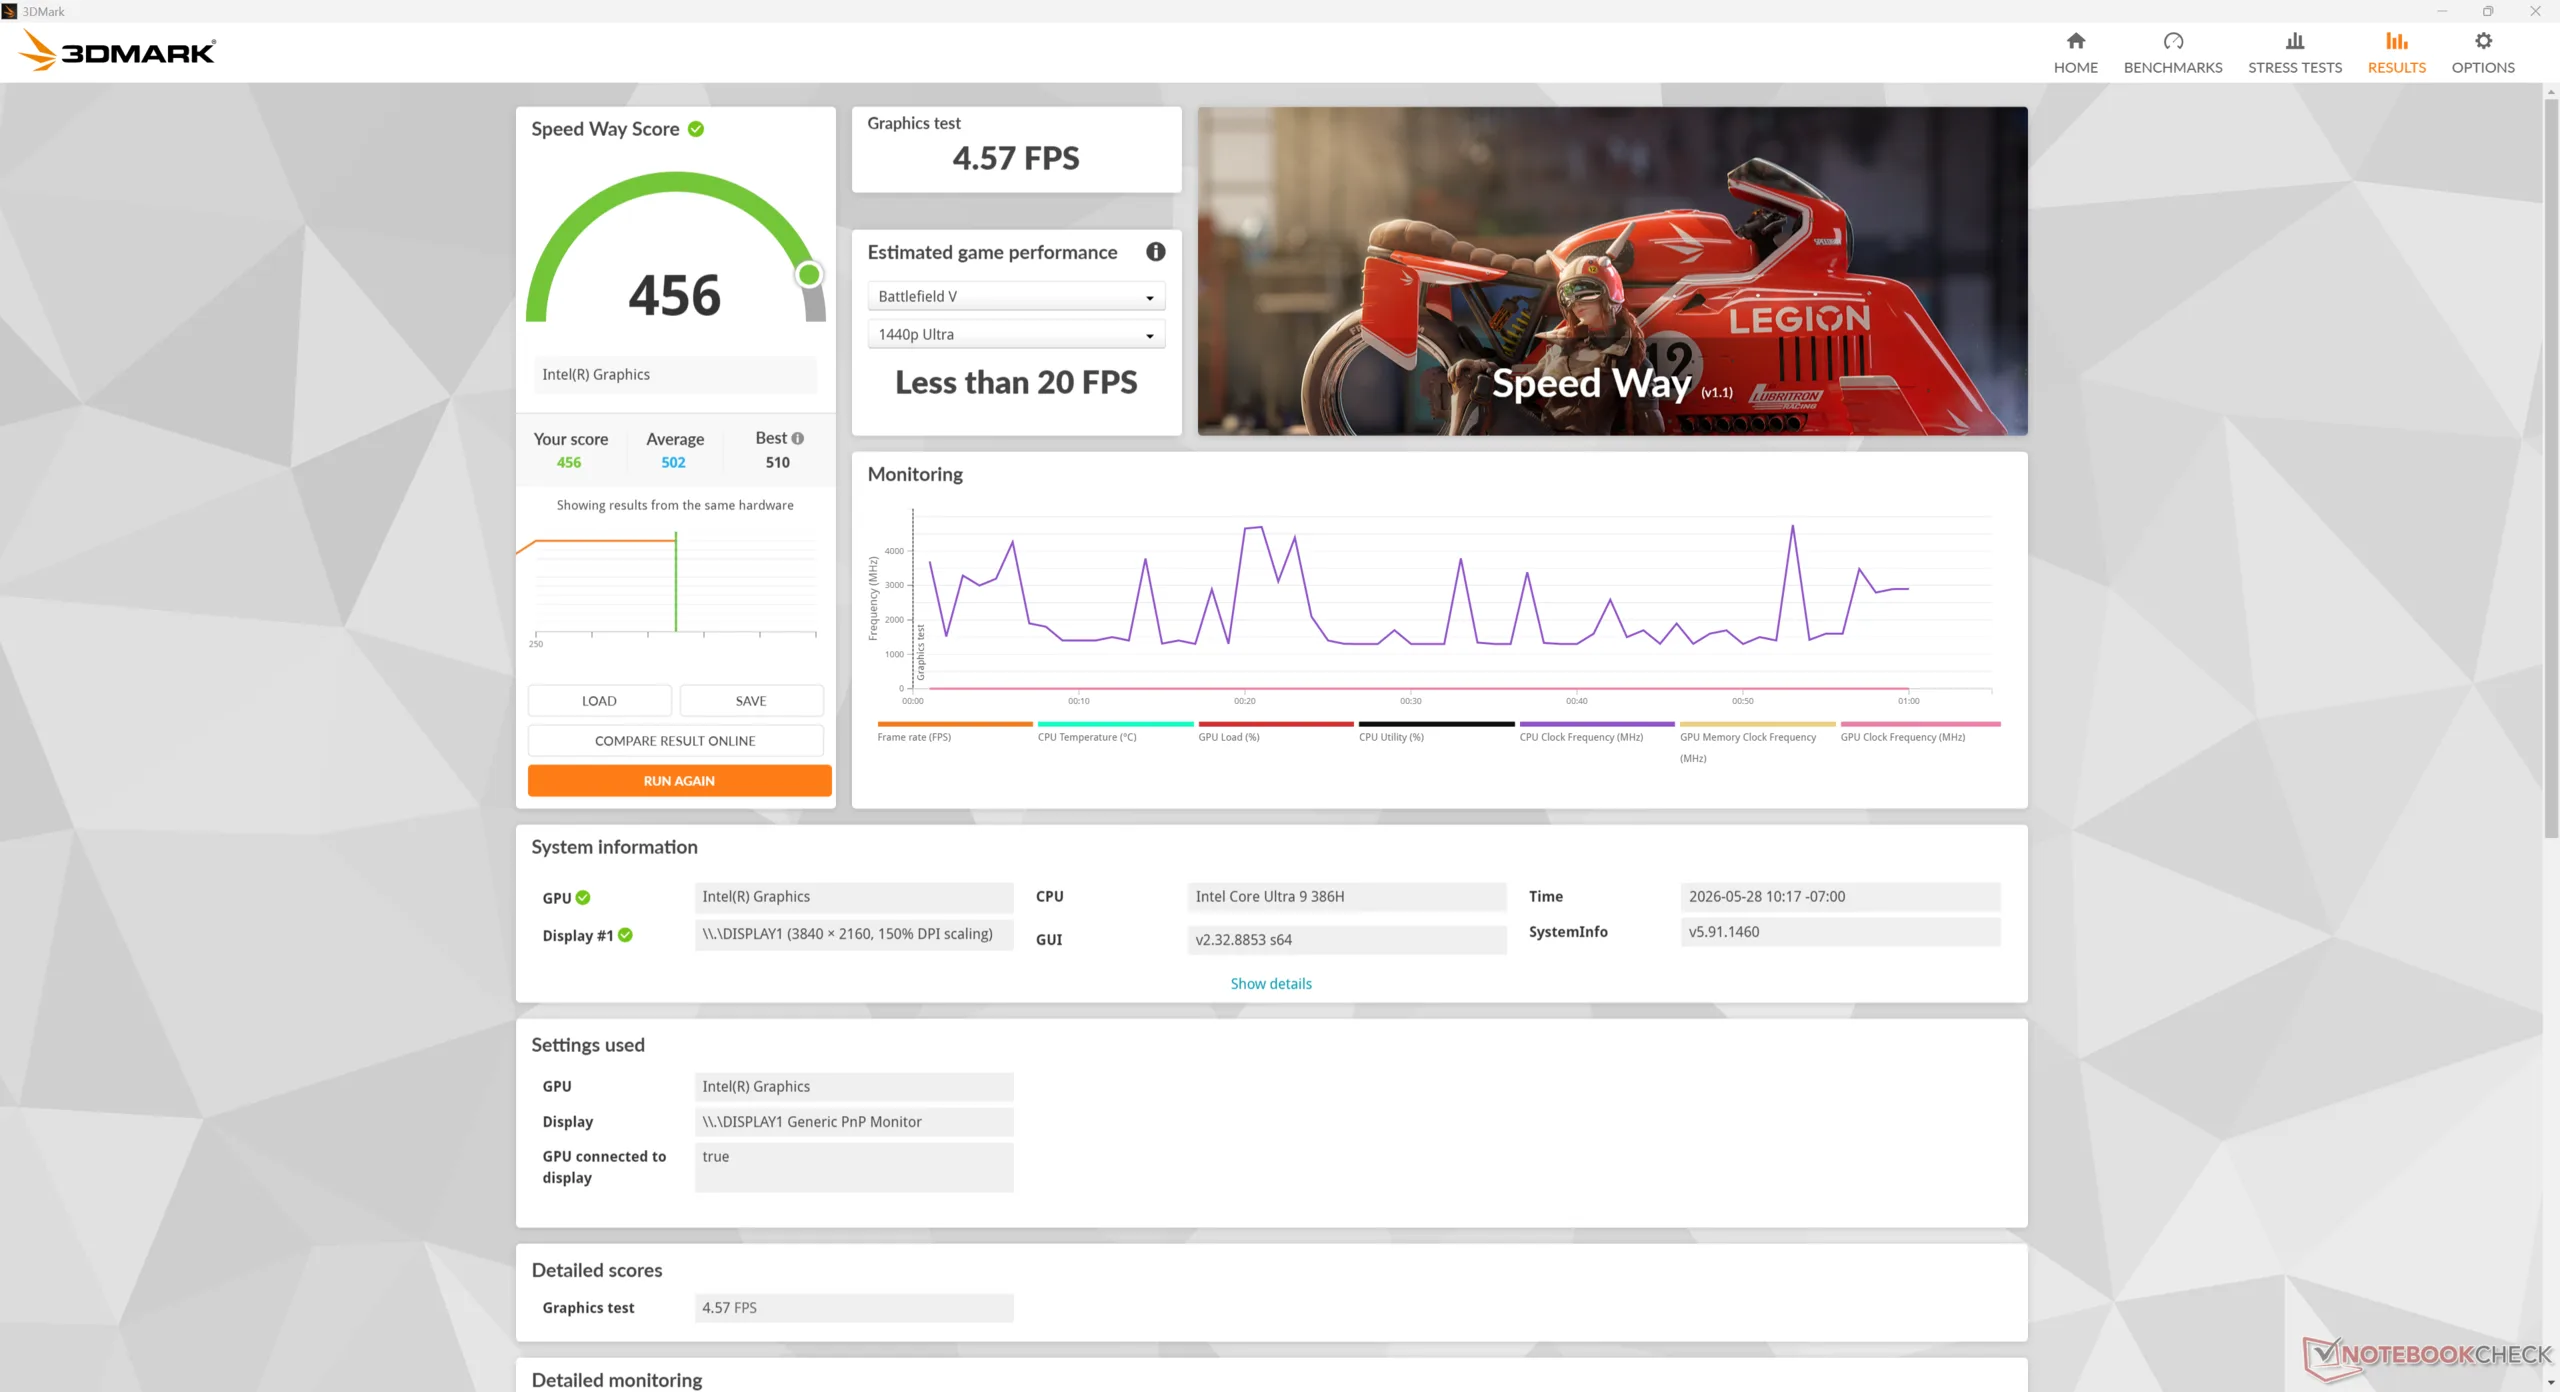
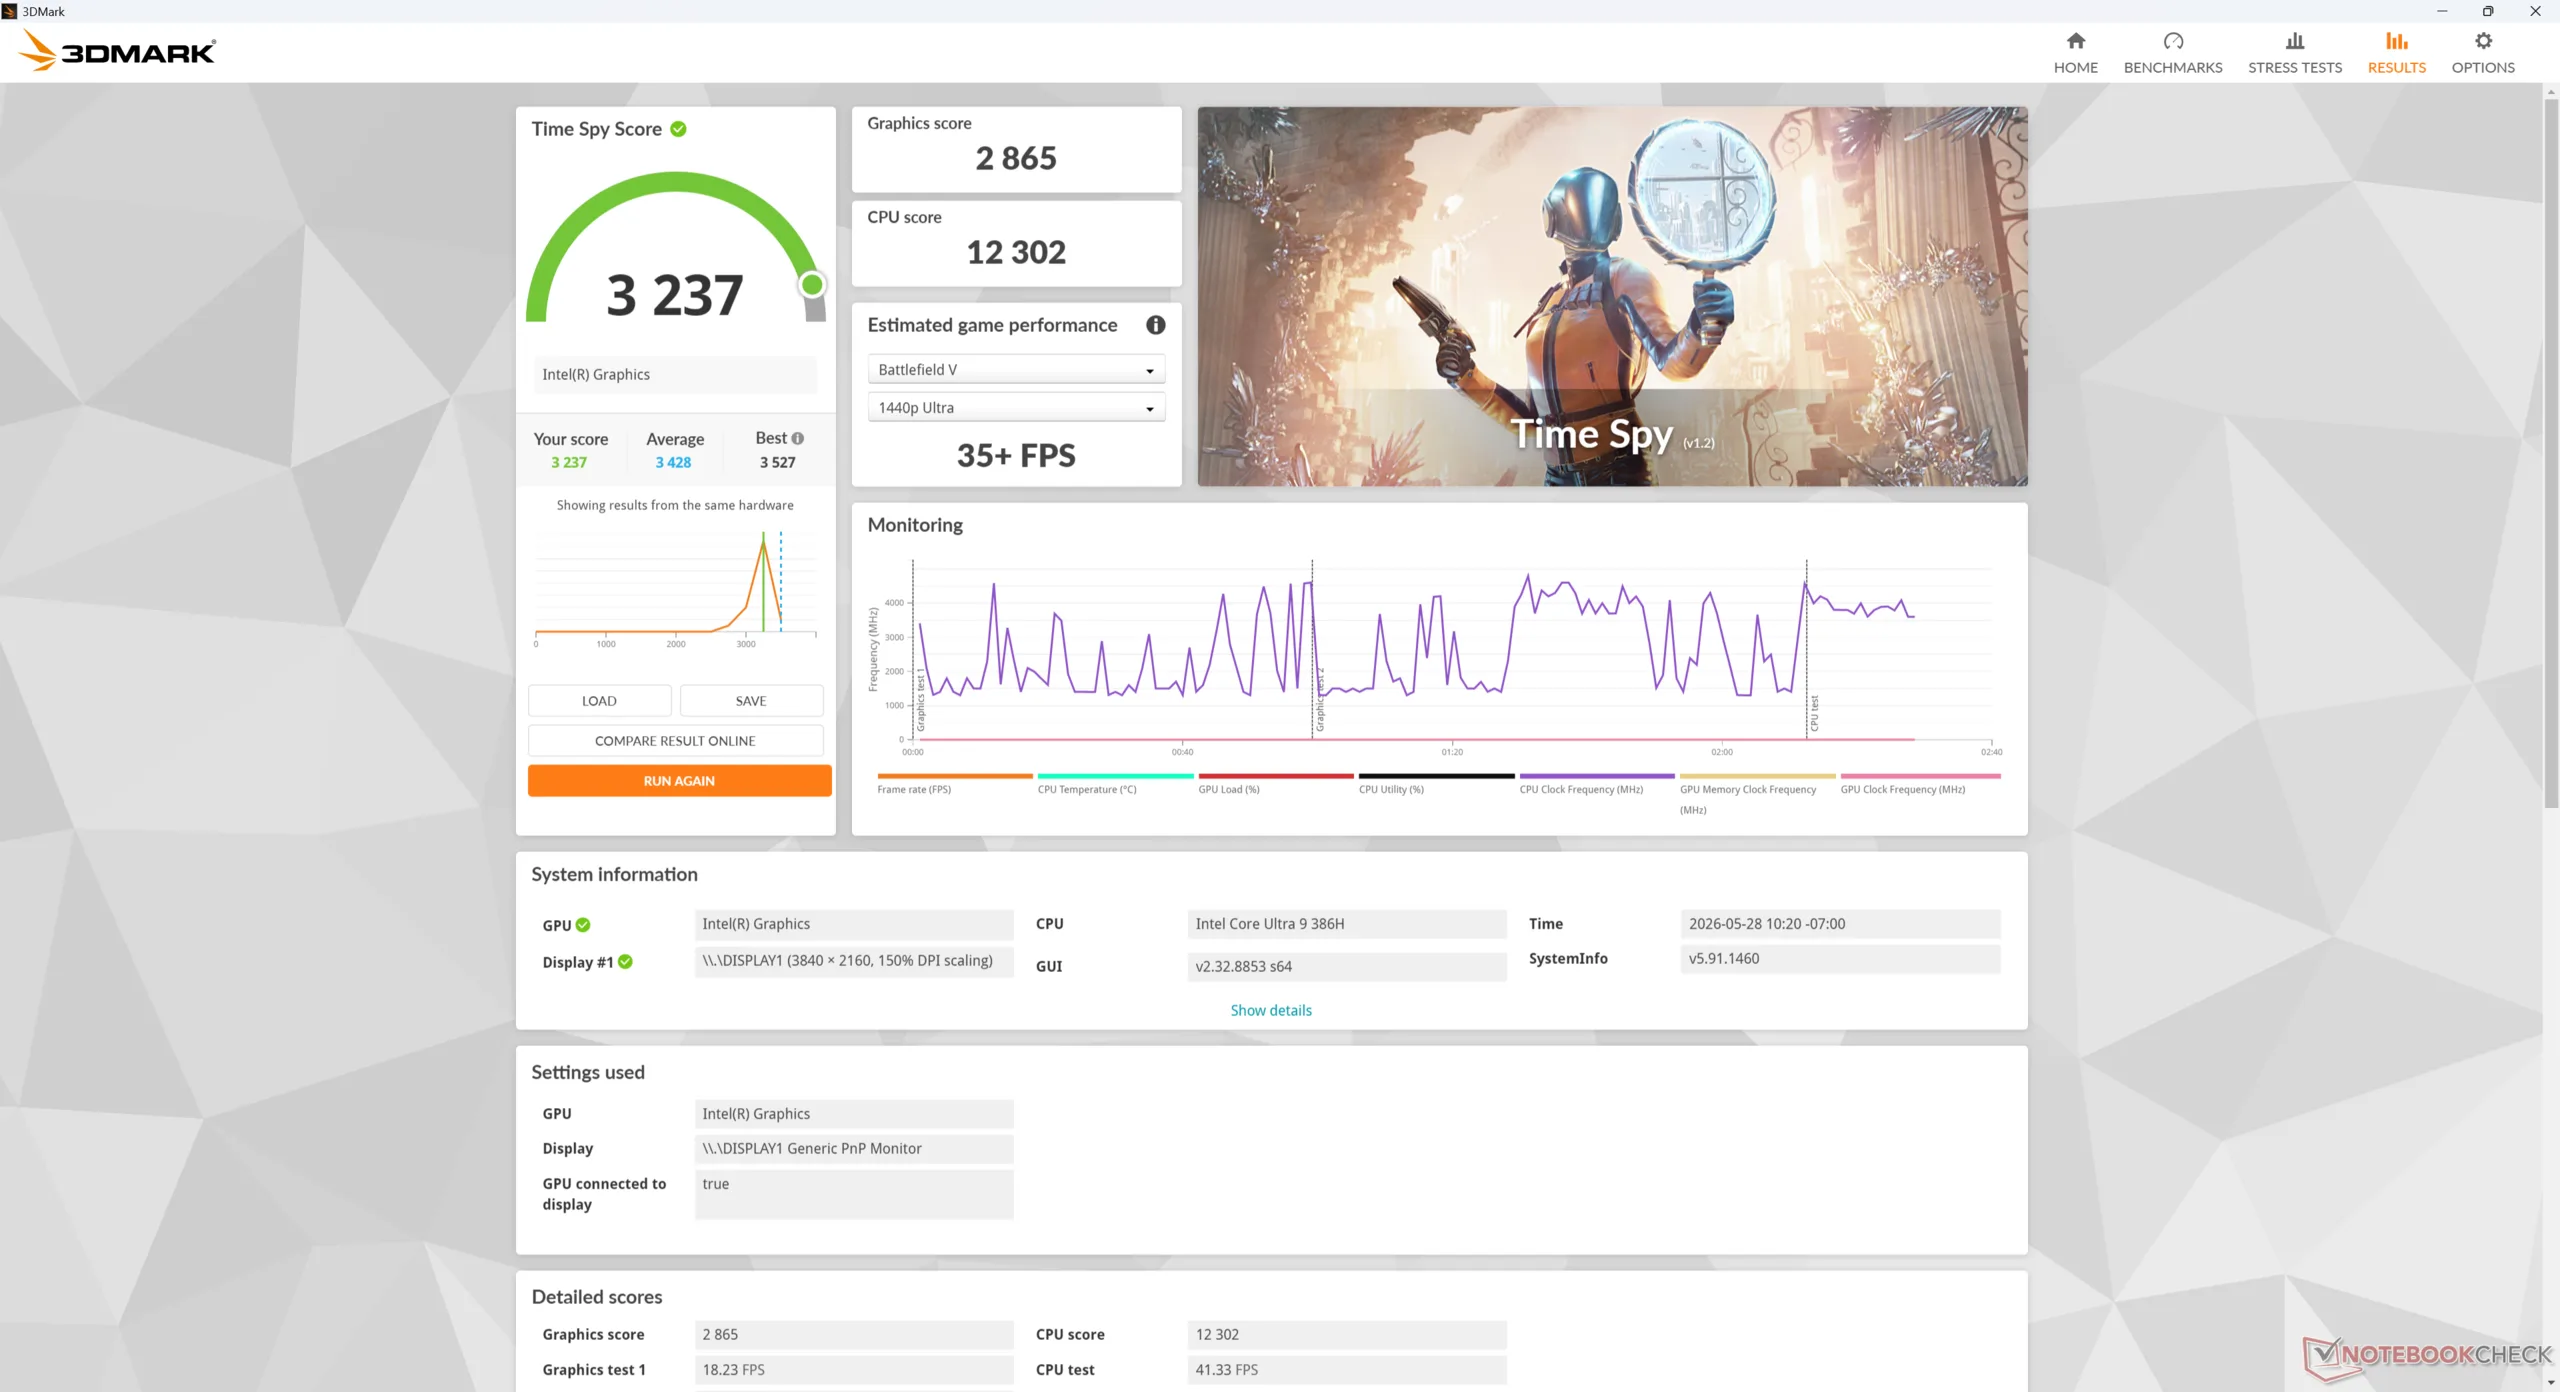
Los gráficos integrados Gráficos 4 Xe3 tiene un rendimiento muy similar al del Arc 140V si no ligeramente más rápido por unos pocos puntos porcentuales de media. El Core Ultra 9 386H no cuenta con la élite Arc B390 de la serie Panther Lake X7, por lo que el rendimiento gráfico no es una característica principal del MSI Cubi.
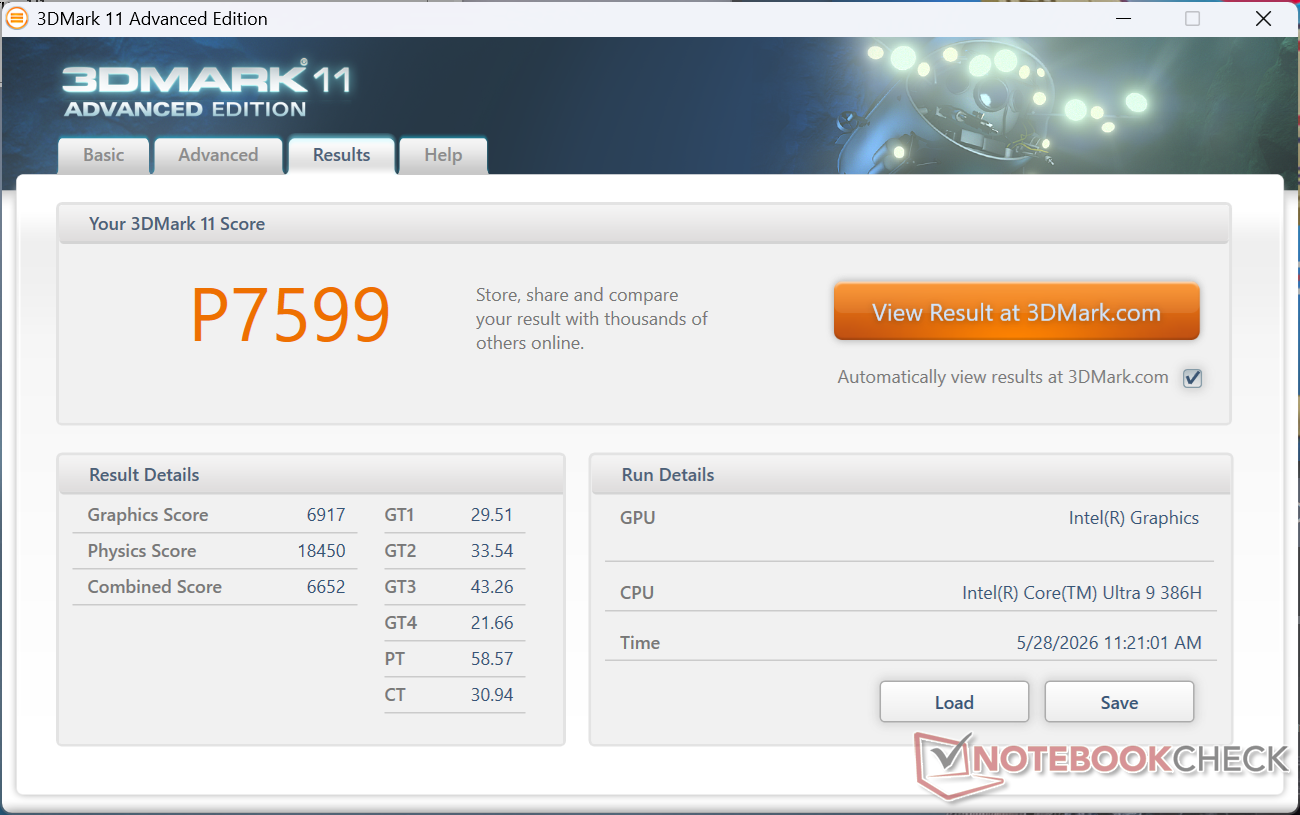
| 3DMark 11 Performance | 7599 puntos | |
| 3DMark Cloud Gate Standard Score | 30367 puntos | |
| 3DMark Fire Strike Score | 6190 puntos | |
| 3DMark Time Spy Score | 3237 puntos | |
ayuda | ||
* ... más pequeño es mejor
| Performance rating - Percent | |
| Asus NUC 15 Pro+ | |
| GMK EVO-T1 -1! | |
| MSI Cubi NUC AI+ 2MG | |
| MSI Cubi NUC AI+ 3MG | |
| GMK NucBox K16 | |
| MSI Cubi NUC 1M -2! | |
| Geekom A5 Pro -2! | |
| Cyberpunk 2077 - 1920x1080 Ultra Preset (FSR off) | |
| Asus NUC 15 Pro+ | |
| GMK EVO-T1 | |
| MSI Cubi NUC AI+ 3MG | |
| MSI Cubi NUC AI+ 2MG | |
| GMK NucBox K16 | |
| MSI Cubi NUC 1M | |
| Geekom A5 Pro | |
| Baldur's Gate 3 - 1920x1080 Ultra Preset AA:T | |
| MSI Cubi NUC AI+ 2MG | |
| Asus NUC 15 Pro+ | |
| GMK EVO-T1 | |
| MSI Cubi NUC AI+ 3MG | |
| GMK NucBox K16 | |
| GTA V - 1920x1080 Highest AA:4xMSAA + FX AF:16x | |
| MSI Cubi NUC AI+ 2MG | |
| MSI Cubi NUC AI+ 3MG | |
| Asus NUC 15 Pro+ | |
| GMK EVO-T1 | |
| GMK NucBox K16 | |
| MSI Cubi NUC 1M | |
| Geekom A5 Pro | |
| Final Fantasy XV Benchmark - 1920x1080 High Quality | |
| GMK EVO-T1 | |
| Asus NUC 15 Pro+ | |
| MSI Cubi NUC AI+ 2MG | |
| MSI Cubi NUC AI+ 3MG | |
| MSI Cubi NUC 1M | |
| GMK NucBox K16 | |
| Geekom A5 Pro | |
| Strange Brigade - 1920x1080 ultra AA:ultra AF:16 | |
| MSI Cubi NUC AI+ 2MG | |
| Asus NUC 15 Pro+ | |
| MSI Cubi NUC AI+ 3MG | |
| GMK NucBox K16 | |
| MSI Cubi NUC 1M | |
| Dota 2 Reborn - 1920x1080 ultra (3/3) best looking | |
| Asus NUC 15 Pro+ | |
| GMK EVO-T1 | |
| MSI Cubi NUC AI+ 3MG | |
| MSI Cubi NUC AI+ 2MG | |
| MSI Cubi NUC 1M | |
| GMK NucBox K16 | |
| Geekom A5 Pro | |
| X-Plane 11.11 - 1920x1080 high (fps_test=3) | |
| Asus NUC 15 Pro+ | |
| GMK EVO-T1 | |
| MSI Cubi NUC AI+ 2MG | |
| GMK NucBox K16 | |
| MSI Cubi NUC AI+ 3MG | |
| Geekom A5 Pro | |
| F1 24 | |
| 1920x1080 Low Preset AA:T AF:16x | |
| GMK EVO-T1 | |
| Asus NUC 15 Pro+ | |
| MSI Cubi NUC AI+ 2MG | |
| MSI Cubi NUC AI+ 3MG | |
| Medio Intel Graphics 4 Xe3 Panther Lake iGPU (55.6 - 69.3, n=7) | |
| GMK NucBox K16 | |
| Geekom A5 Pro | |
| 1920x1080 Medium Preset AA:T AF:16x | |
| GMK EVO-T1 | |
| Asus NUC 15 Pro+ | |
| MSI Cubi NUC AI+ 3MG | |
| Medio Intel Graphics 4 Xe3 Panther Lake iGPU (52.7 - 64.3, n=7) | |
| GMK NucBox K16 | |
| Geekom A5 Pro | |
| 1920x1080 High Preset AA:T AF:16x | |
| GMK EVO-T1 | |
| Asus NUC 15 Pro+ | |
| MSI Cubi NUC AI+ 2MG | |
| MSI Cubi NUC AI+ 3MG | |
| Medio Intel Graphics 4 Xe3 Panther Lake iGPU (40.8 - 48, n=7) | |
| GMK NucBox K16 | |
| Geekom A5 Pro | |
| 1920x1080 Ultra High Preset AA:T AF:16x | |
| GMK EVO-T1 | |
| Asus NUC 15 Pro+ | |
| MSI Cubi NUC AI+ 2MG | |
| Medio Intel Graphics 4 Xe3 Panther Lake iGPU (13.2 - 15.1, n=7) | |
| MSI Cubi NUC AI+ 3MG | |
| GMK NucBox K16 | |
Cyberpunk 2077 ultra FPS Gráfico
| bajo | medio | alto | ultra | |
|---|---|---|---|---|
| GTA V (2015) | 157.9 | 149.5 | 51.1 | 20.4 |
| Dota 2 Reborn (2015) | 104.1 | 80.3 | 81.2 | 79.9 |
| Final Fantasy XV Benchmark (2018) | 64.3 | 34.6 | 25.1 | |
| X-Plane 11.11 (2018) | 41.7 | 33.2 | 28.6 | |
| Strange Brigade (2018) | 172.6 | 68 | 56.9 | 48.5 |
| Baldur's Gate 3 (2023) | 31.6 | 26.3 | 23.1 | 22.8 |
| Cyberpunk 2077 (2023) | 37.1 | 28.4 | 24.5 | 21.1 |
| F1 24 (2024) | 66.9 | 61.5 | 45.8 | 14.2 |
Emisiones
Ruido del sistema
El ventilador interno está siempre activo sin importar la carga en pantalla, muy parecido a lo que observamos en modelos Cubi más antiguos. Es lo suficientemente silencioso, sin grandes problemas de ralentización, como para pasar desapercibido en un entorno de oficina o de venta al por menor, pero puede elevarse hasta los 40 dB(A) cuando se ejecutan cargas más exigentes durante periodos prolongados y ser tan ruidoso como algunos portátiles para juegos.
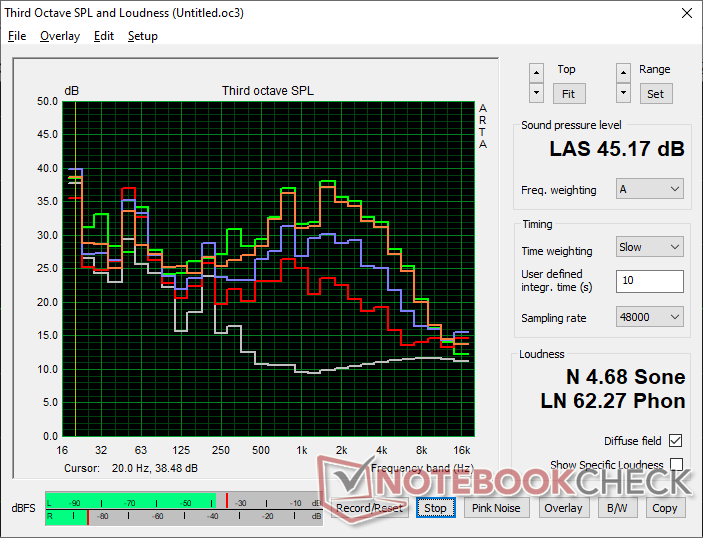
Ruido
| Ocioso |
| 28 / 33.2 / 33.5 dB(A) |
| Carga |
| 39.1 / 45.2 dB(A) |
 | ||
30 dB silencioso 40 dB(A) audible 50 dB(A) ruidosamente alto |
||
min: | ||
| MSI Cubi NUC AI+ 3MG Ultra 9 386H, Intel Graphics 4 Xe3 PTL | GMK NucBox K16 R7 7735HS, Radeon 680M | GMK EVO-T1 Ultra 9 285H, Arc 140T | Geekom A5 Pro R5 7530U, Vega 7 | Asus NUC 15 Pro+ Ultra 9 285H, Arc 140T | MSI Cubi NUC AI+ 2MG Core Ultra 7 258V, Arc 140V | MSI Cubi NUC 1M Core 7 150U, Iris Xe G7 96EUs | |
|---|---|---|---|---|---|---|---|
| Noise | -6% | -20% | 15% | -3% | -2% | 6% | |
| apagado / medio ambiente * (dB) | 23.6 | 23.6 -0% | 24.7 -5% | 25 -6% | 25.3 -7% | 24.8 -5% | 23.5 -0% |
| Idle Minimum * (dB) | 28 | 30.9 -10% | 38.7 -38% | 26.6 5% | 25.4 9% | 28 -0% | 29.9 -7% |
| Idle Average * (dB) | 33.2 | 31.6 5% | 38.8 -17% | 26.6 20% | 25.5 23% | 36.1 -9% | 29.9 10% |
| Idle Maximum * (dB) | 33.5 | 31.6 6% | 38.9 -16% | 26.7 20% | 37.3 -11% | 36.1 -8% | 32 4% |
| Load Average * (dB) | 39.1 | 45.3 -16% | 51.6 -32% | 33.5 14% | 44.4 -14% | 38.9 1% | 33.5 14% |
| Cyberpunk 2077 ultra * (dB) | 44.4 | 49.2 -11% | 52 -17% | 31.2 30% | 46.2 -4% | 37 17% | 39.1 12% |
| Load Maximum * (dB) | 45.2 | 51.7 -14% | 51.6 -14% | 33.8 25% | 52.7 -17% | 49.2 -9% | 40.5 10% |
| Witcher 3 ultra * (dB) | 38.7 | 31.2 | 47.7 |
* ... más pequeño es mejor
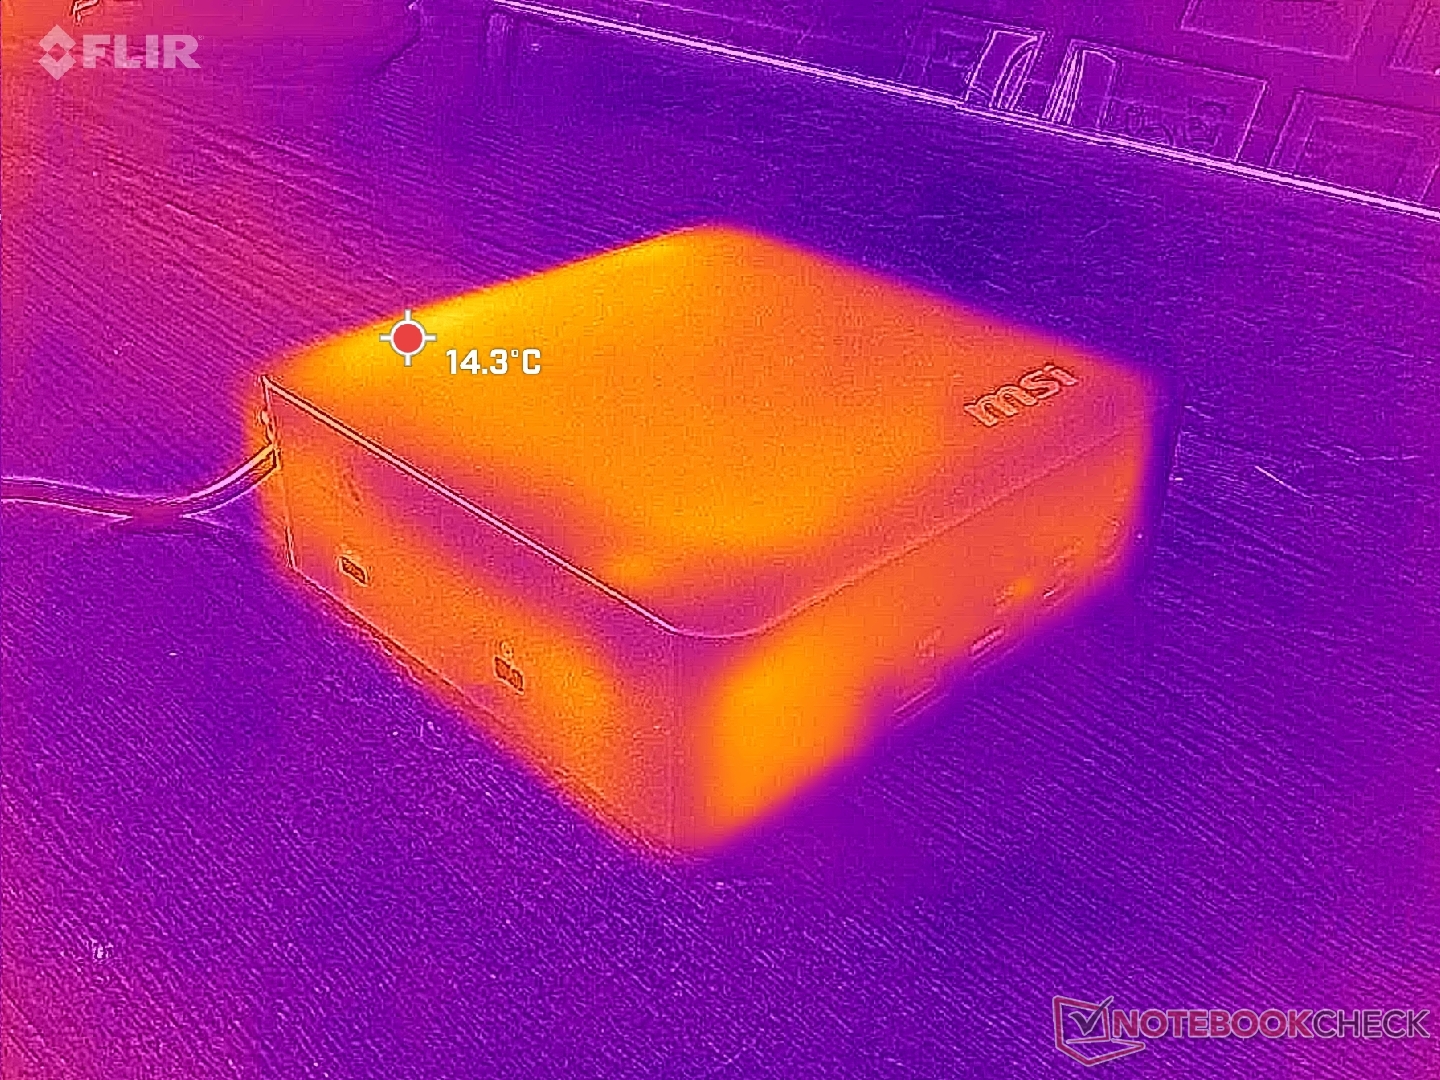
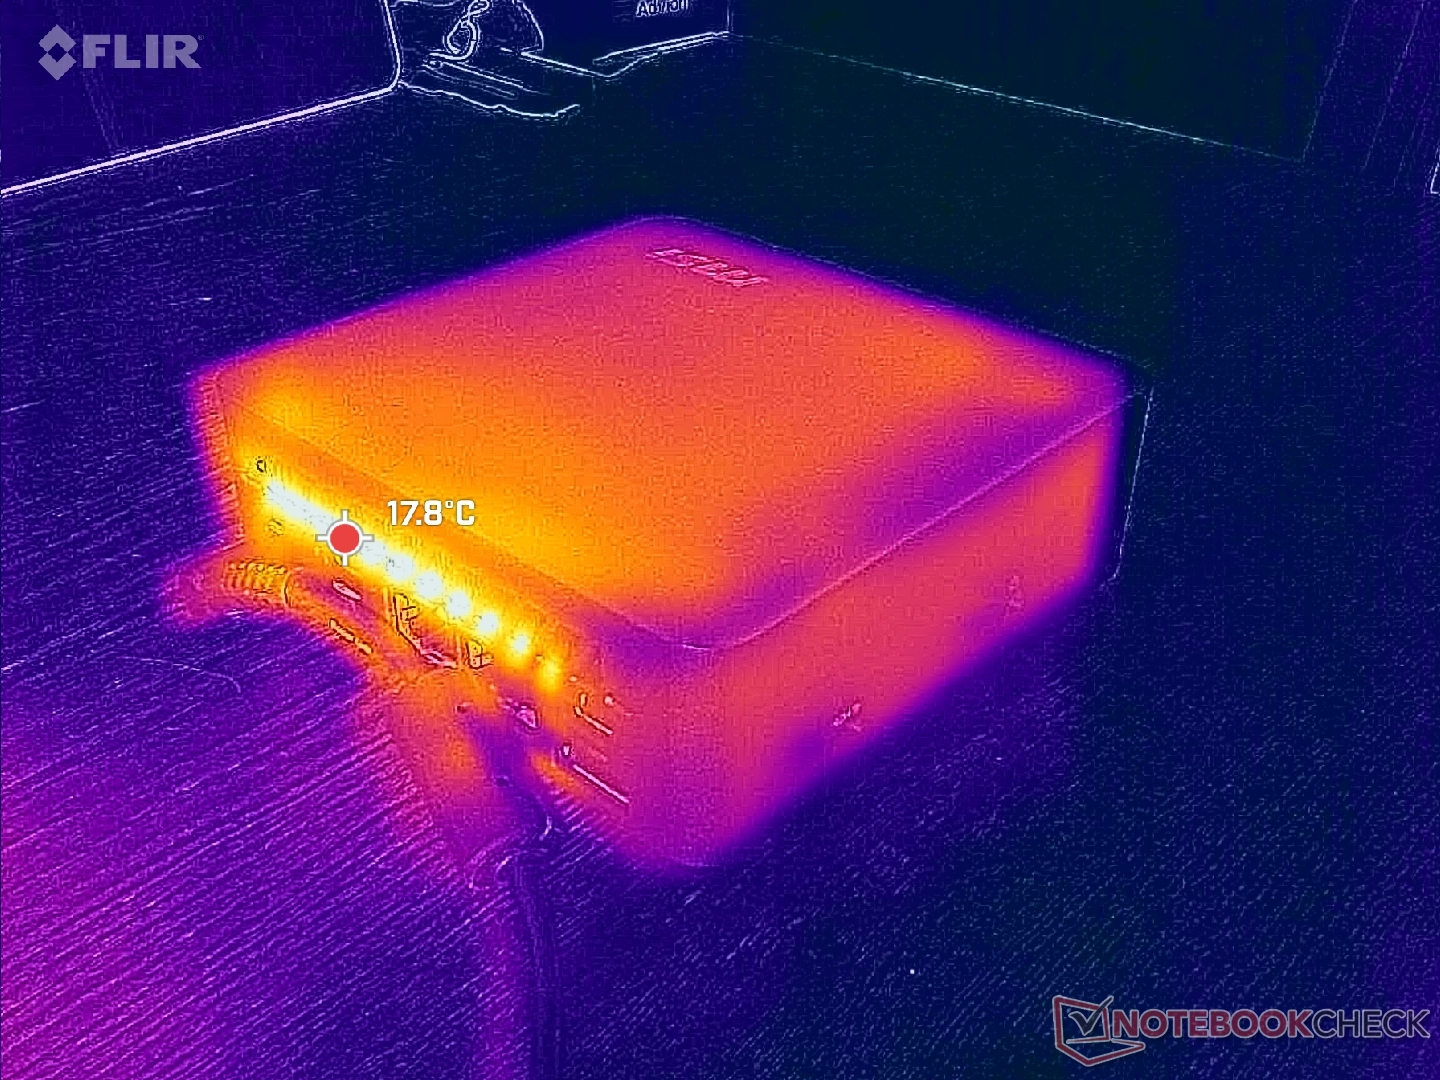
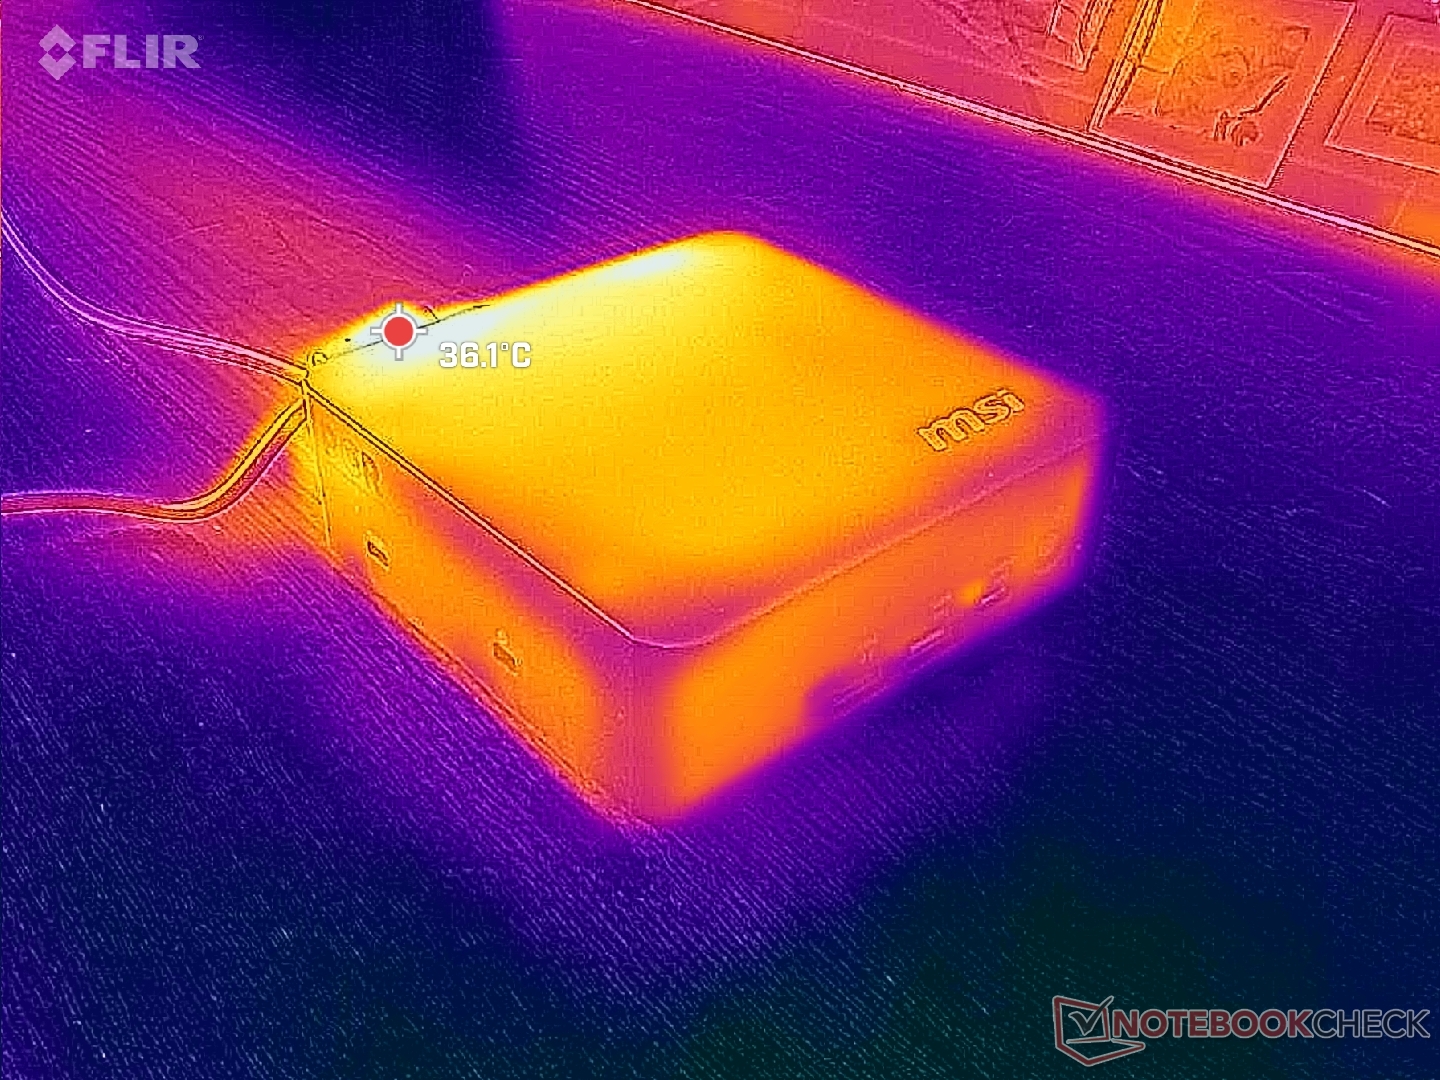
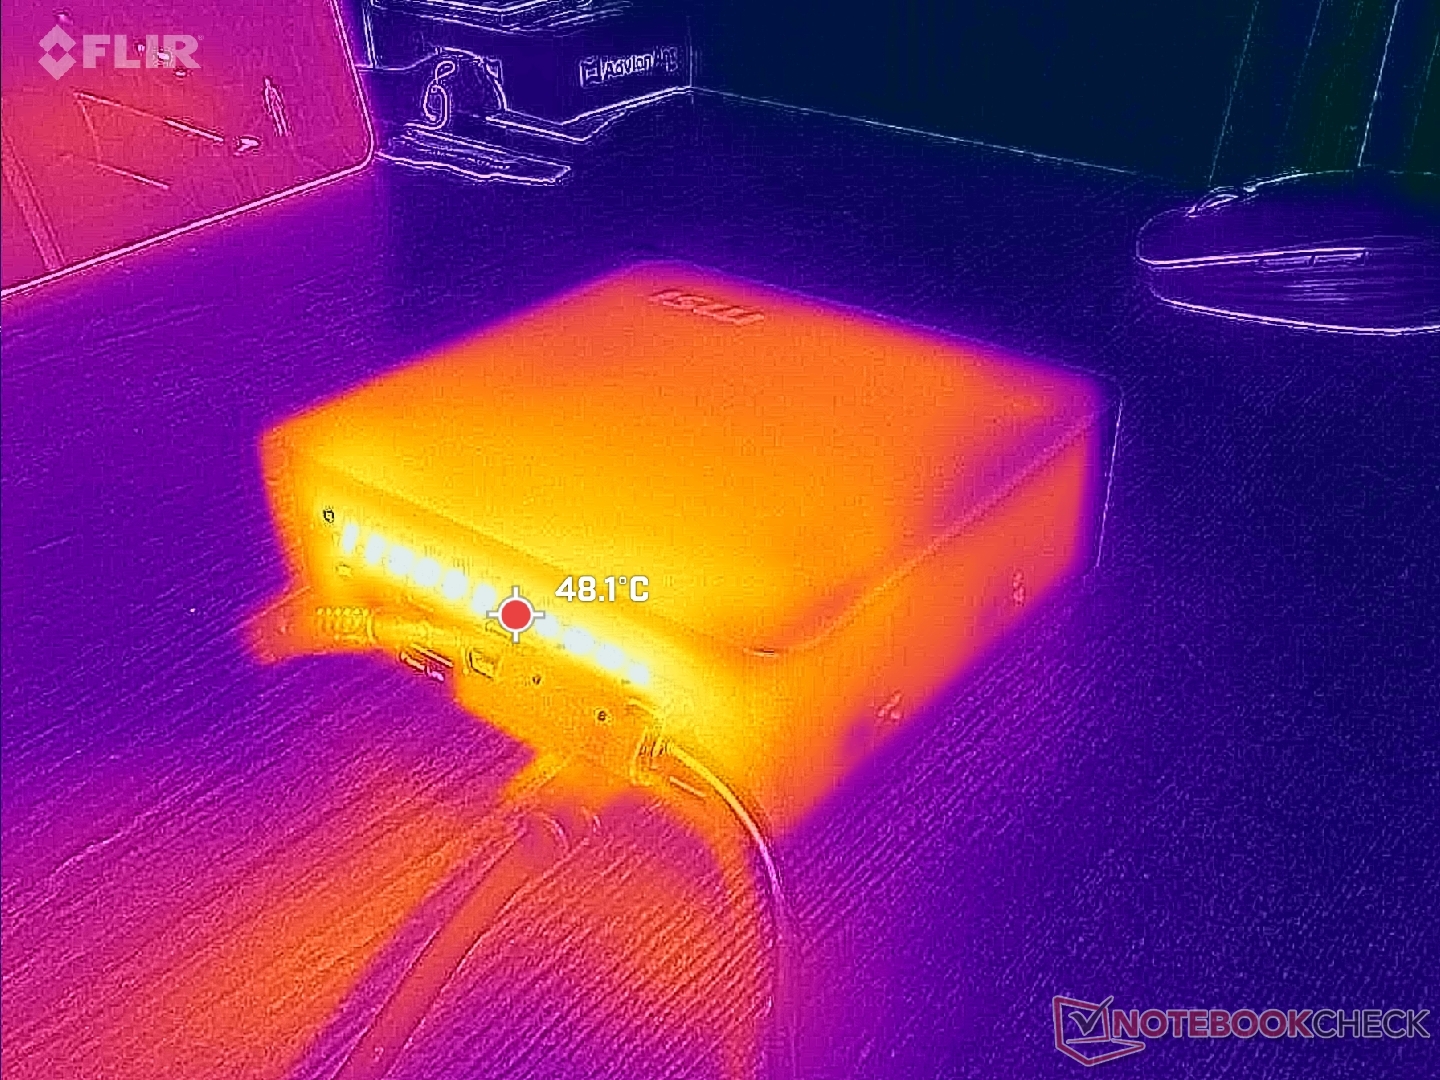
Temperatura
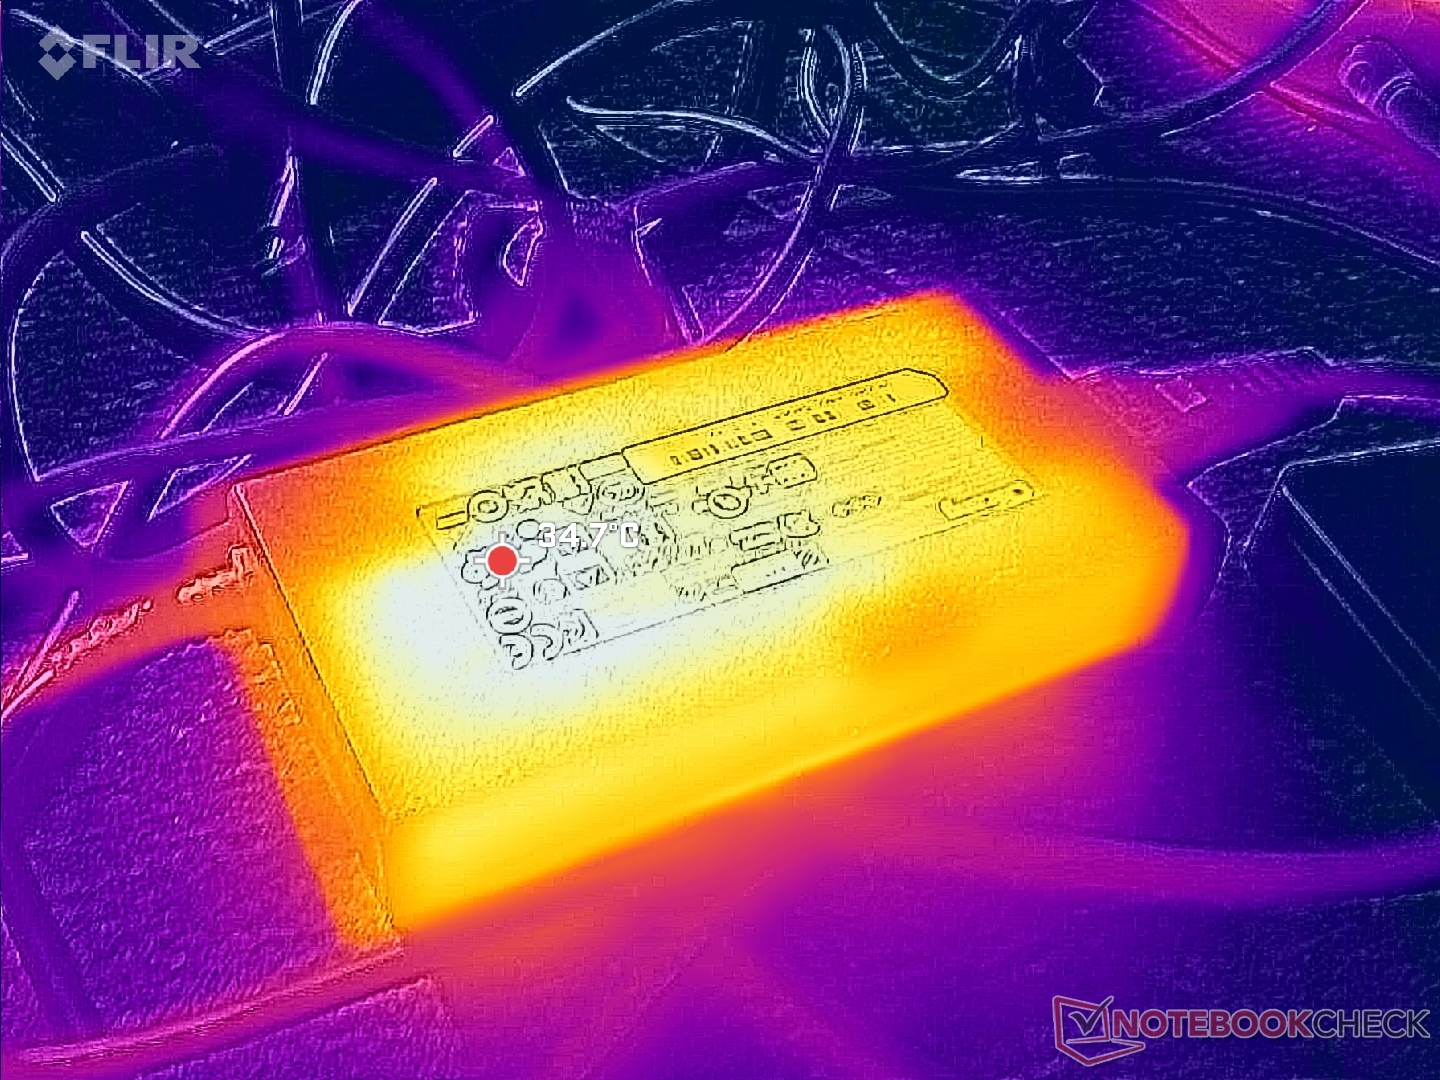
Las temperaturas superficiales son relativamente frescas debido en parte al chasis de plástico y a la eficiente CPU. La parte trasera se calienta ligeramente más que la delantera como era de esperar.
Las rejillas de ventilación se mantienen al mínimo a diferencia de algunas alternativas como la Serie GMK EVO.
(+) La temperatura máxima en la parte superior es de 36.2 °C / 97 F, frente a la media de 35.4 °C / 96 F, que oscila entre 20.6 y 69.5 °C para la clase Mini PC.
(+) El fondo se calienta hasta un máximo de 34.6 °C / 94 F, frente a la media de 36.1 °C / 97 F
(+) En reposo, la temperatura media de la parte superior es de 22.8 °C / 73# F, frente a la media del dispositivo de 32.1 °C / 90 F.
| MSI Cubi NUC AI+ 3MG Ultra 9 386H, Intel Graphics 4 Xe3 PTL | GMK NucBox K16 R7 7735HS, Radeon 680M | GMK EVO-T1 Ultra 9 285H, Arc 140T | Geekom A5 Pro R5 7530U, Vega 7 | Asus NUC 15 Pro+ Ultra 9 285H, Arc 140T | MSI Cubi NUC AI+ 2MG Core Ultra 7 258V, Arc 140V | |
|---|---|---|---|---|---|---|
| Heat | 8% | -26% | -8% | -25% | 3% | |
| Maximum Upper Side * (°C) | 36.2 | 28.4 22% | 36.4 -1% | 36.7 -1% | 42.2 -17% | 30.8 15% |
| Maximum Bottom * (°C) | 34.6 | 29.4 15% | 48.5 -40% | 40.5 -17% | 31.3 10% | 26.4 24% |
| Idle Upper Side * (°C) | 23.2 | 23.4 -1% | 29.6 -28% | 23.1 -0% | 34.9 -50% | 26.4 -14% |
| Idle Bottom * (°C) | 22.4 | 23.6 -5% | 30 -34% | 25.1 -12% | 32.2 -44% | 25.4 -13% |
* ... más pequeño es mejor
Prueba de estrés
La CPU aumentaría a 3 GHz, 61 W y 92 C al iniciar el estrés Prime95. Después de 20 segundos, sin embargo, bajaría a sólo 2,1 GHz y 30 W para mantener una temperatura del núcleo de 88 C. El limitado potencial Turbo Boost respalda nuestras observaciones de consumo de energía y CineBench R15.
La temperatura del núcleo se estabilizaría en 80 C al ejecutar Cyberpunk 2077 en comparación con sólo 63 C en el NUC 2MG del año pasado.
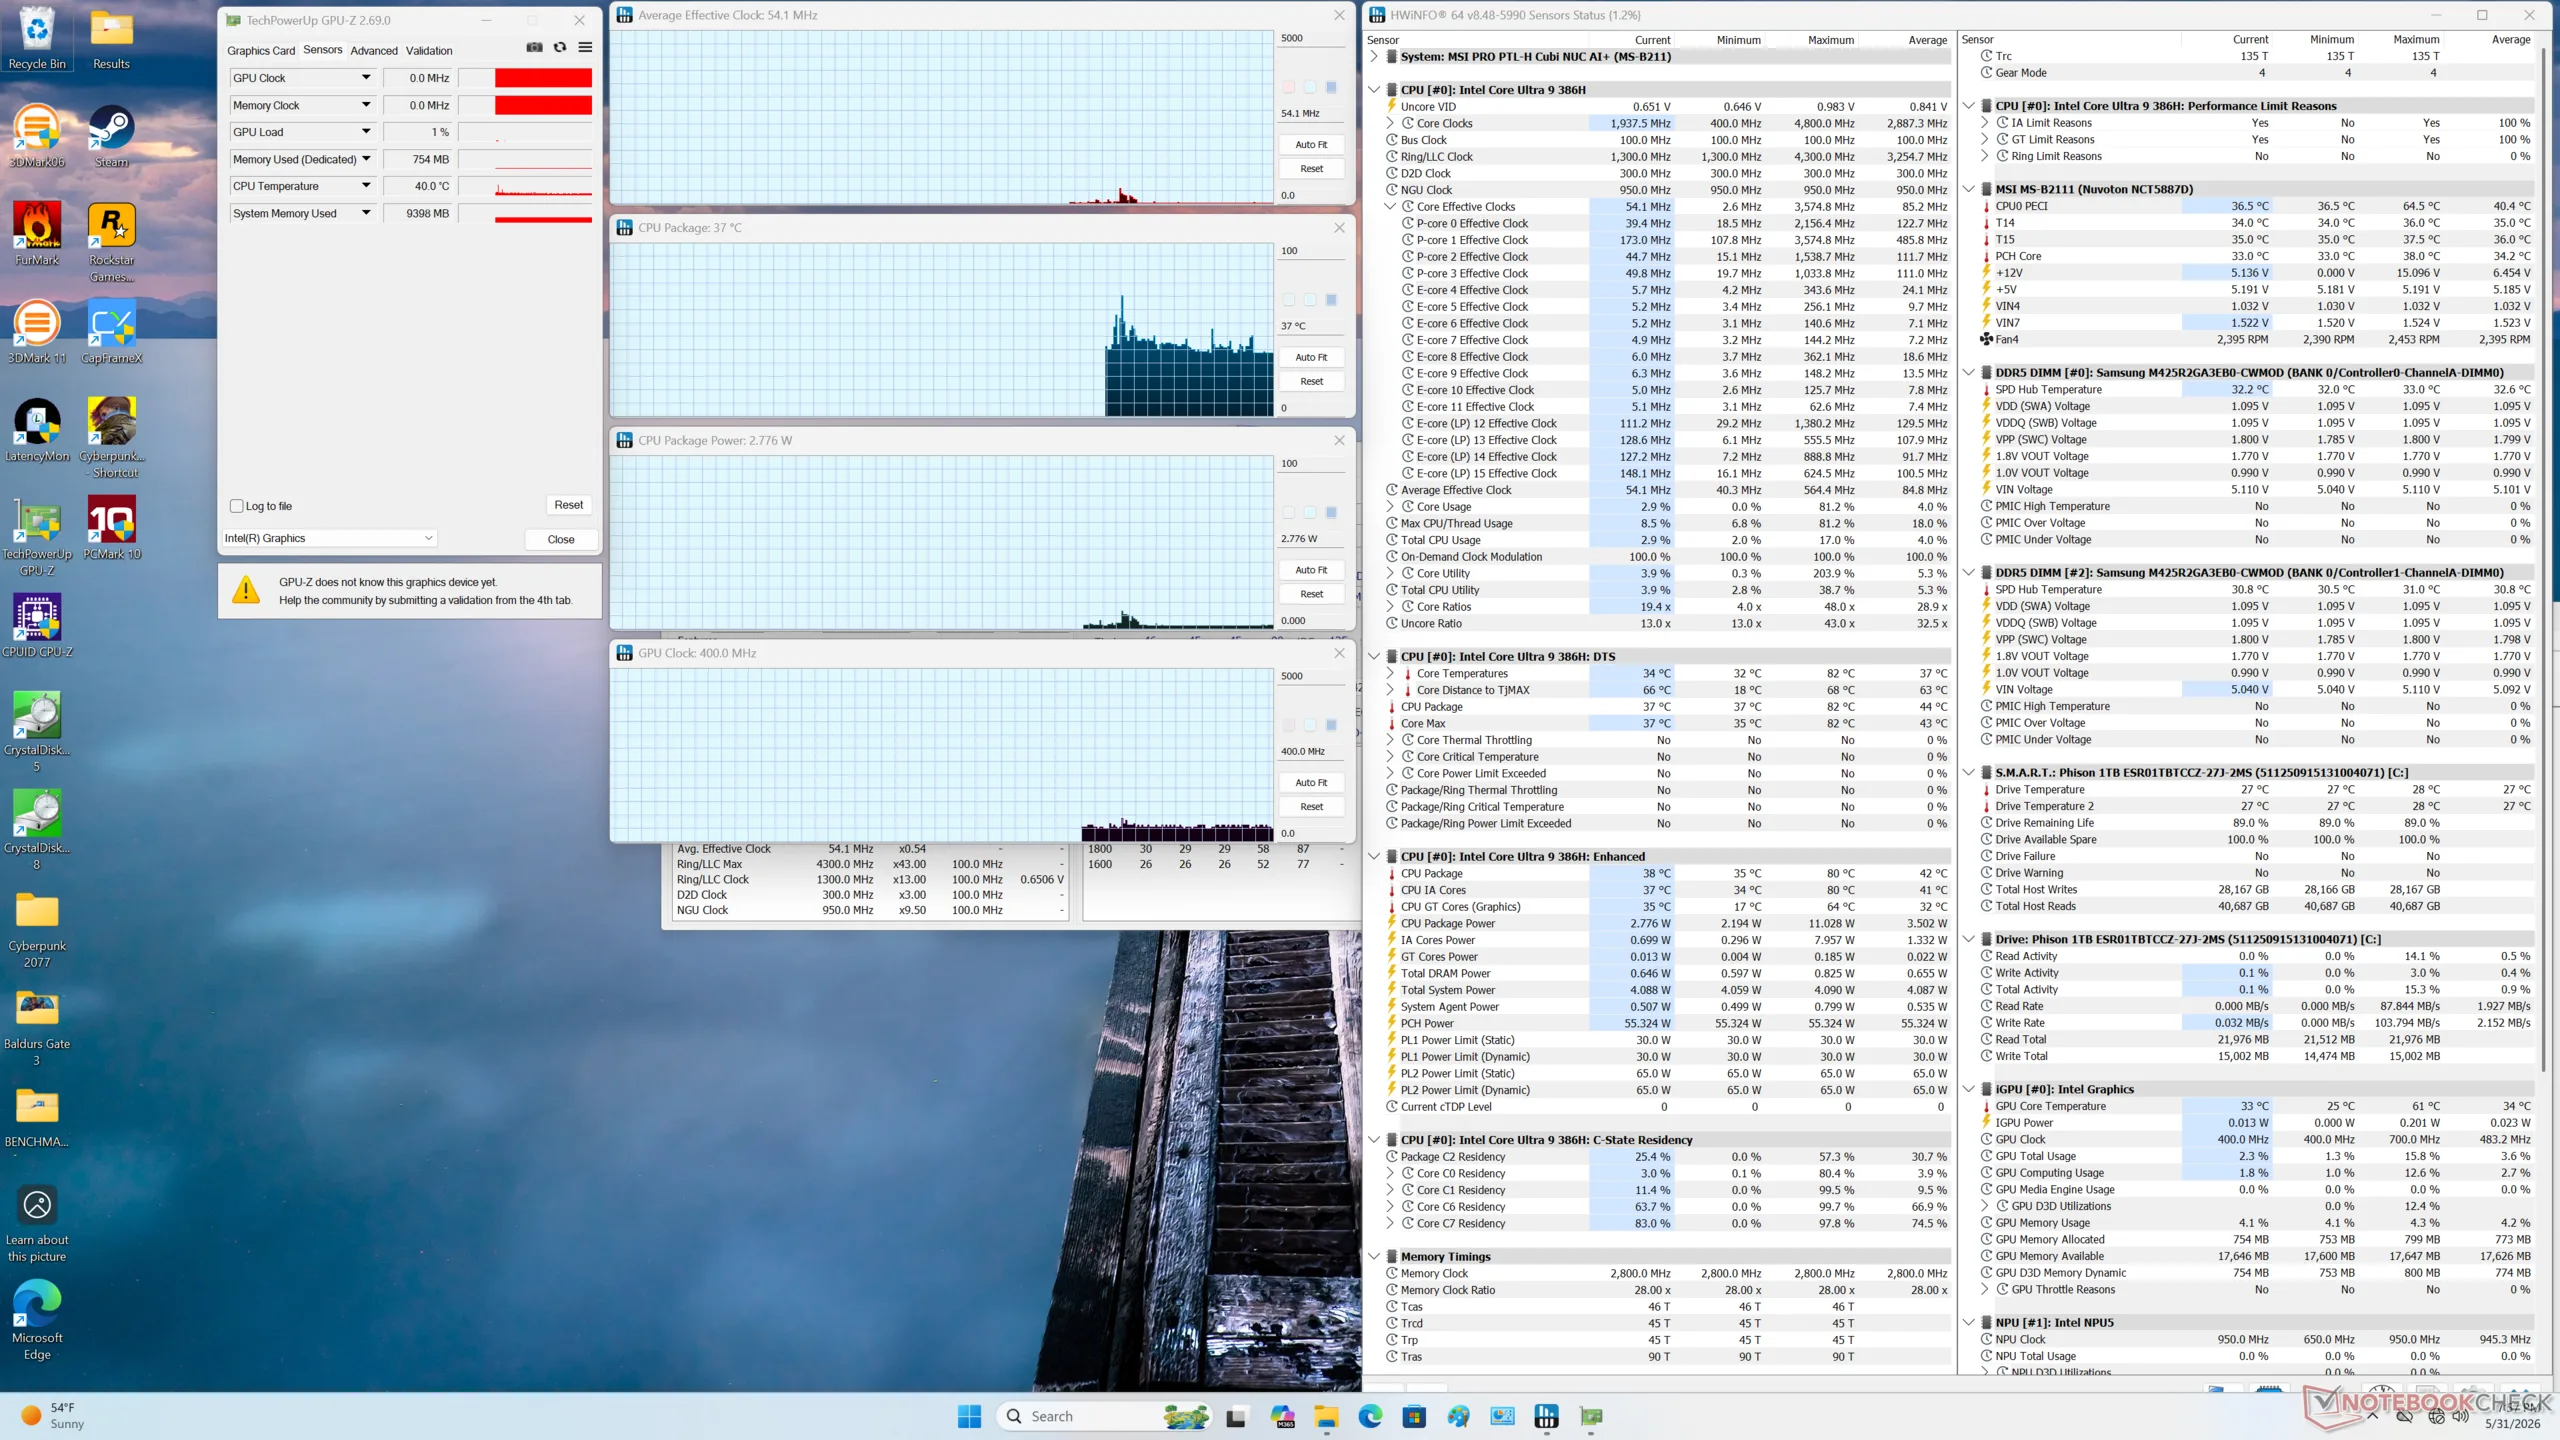
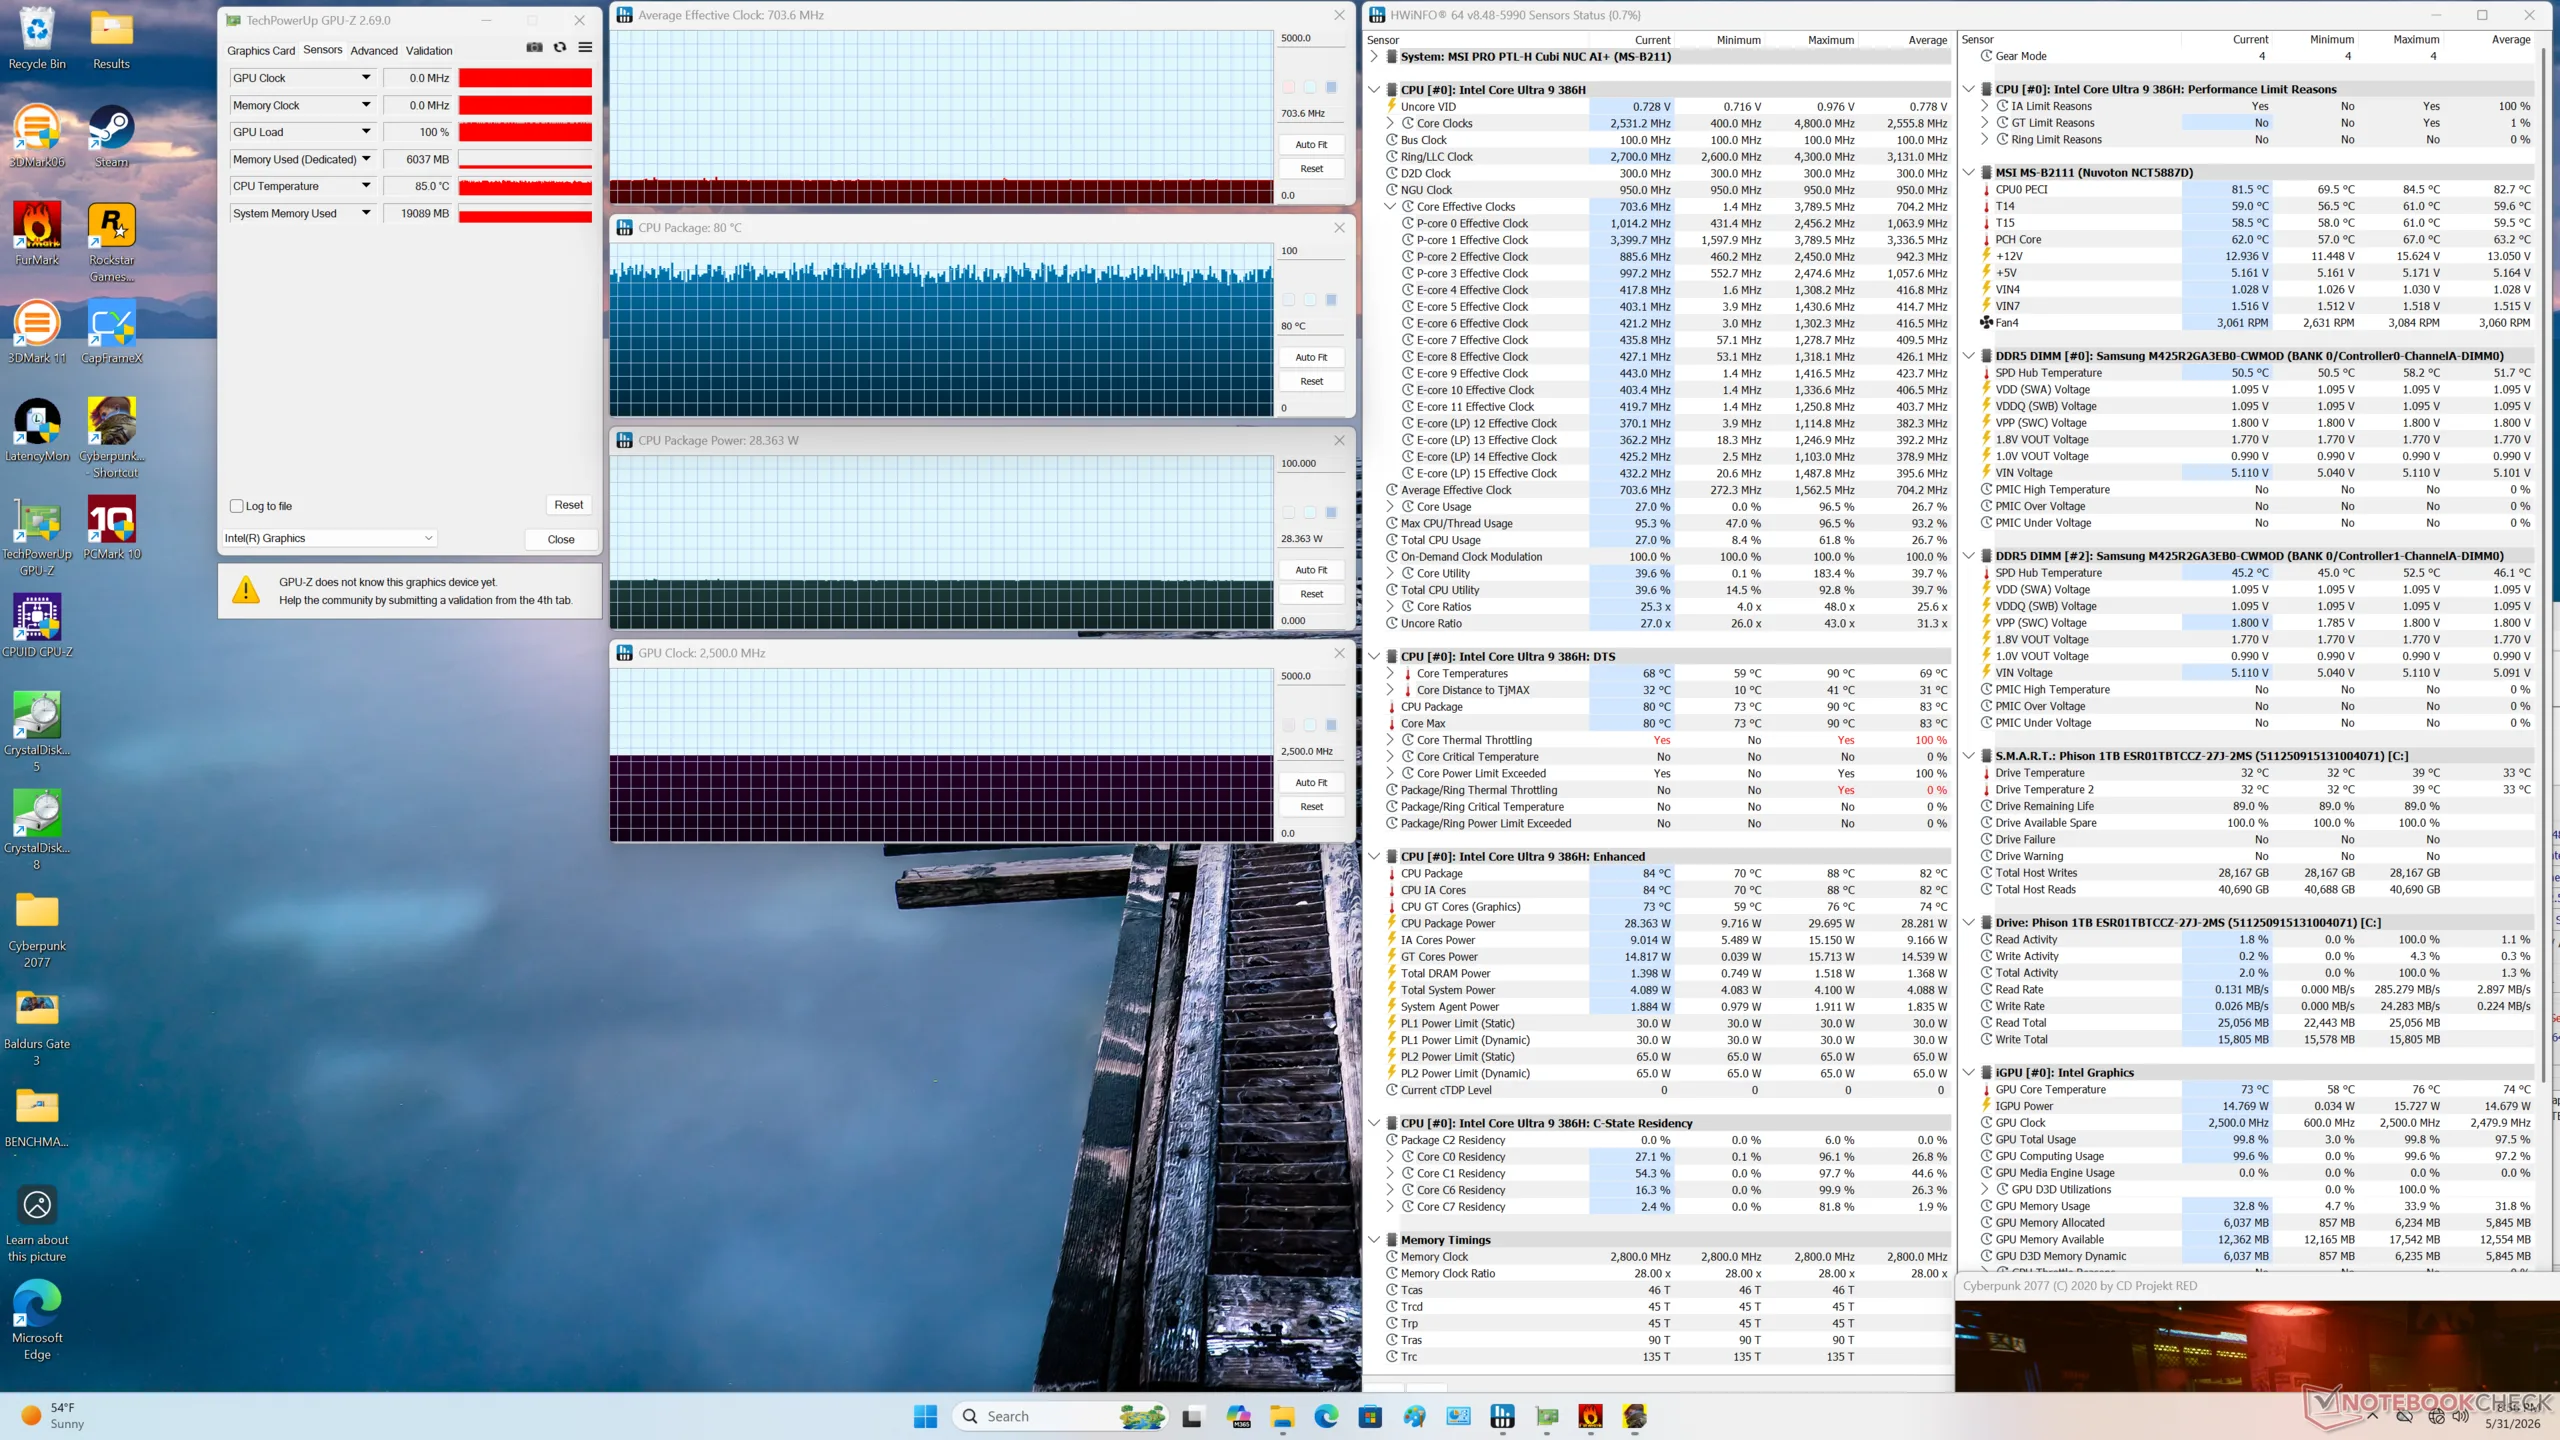

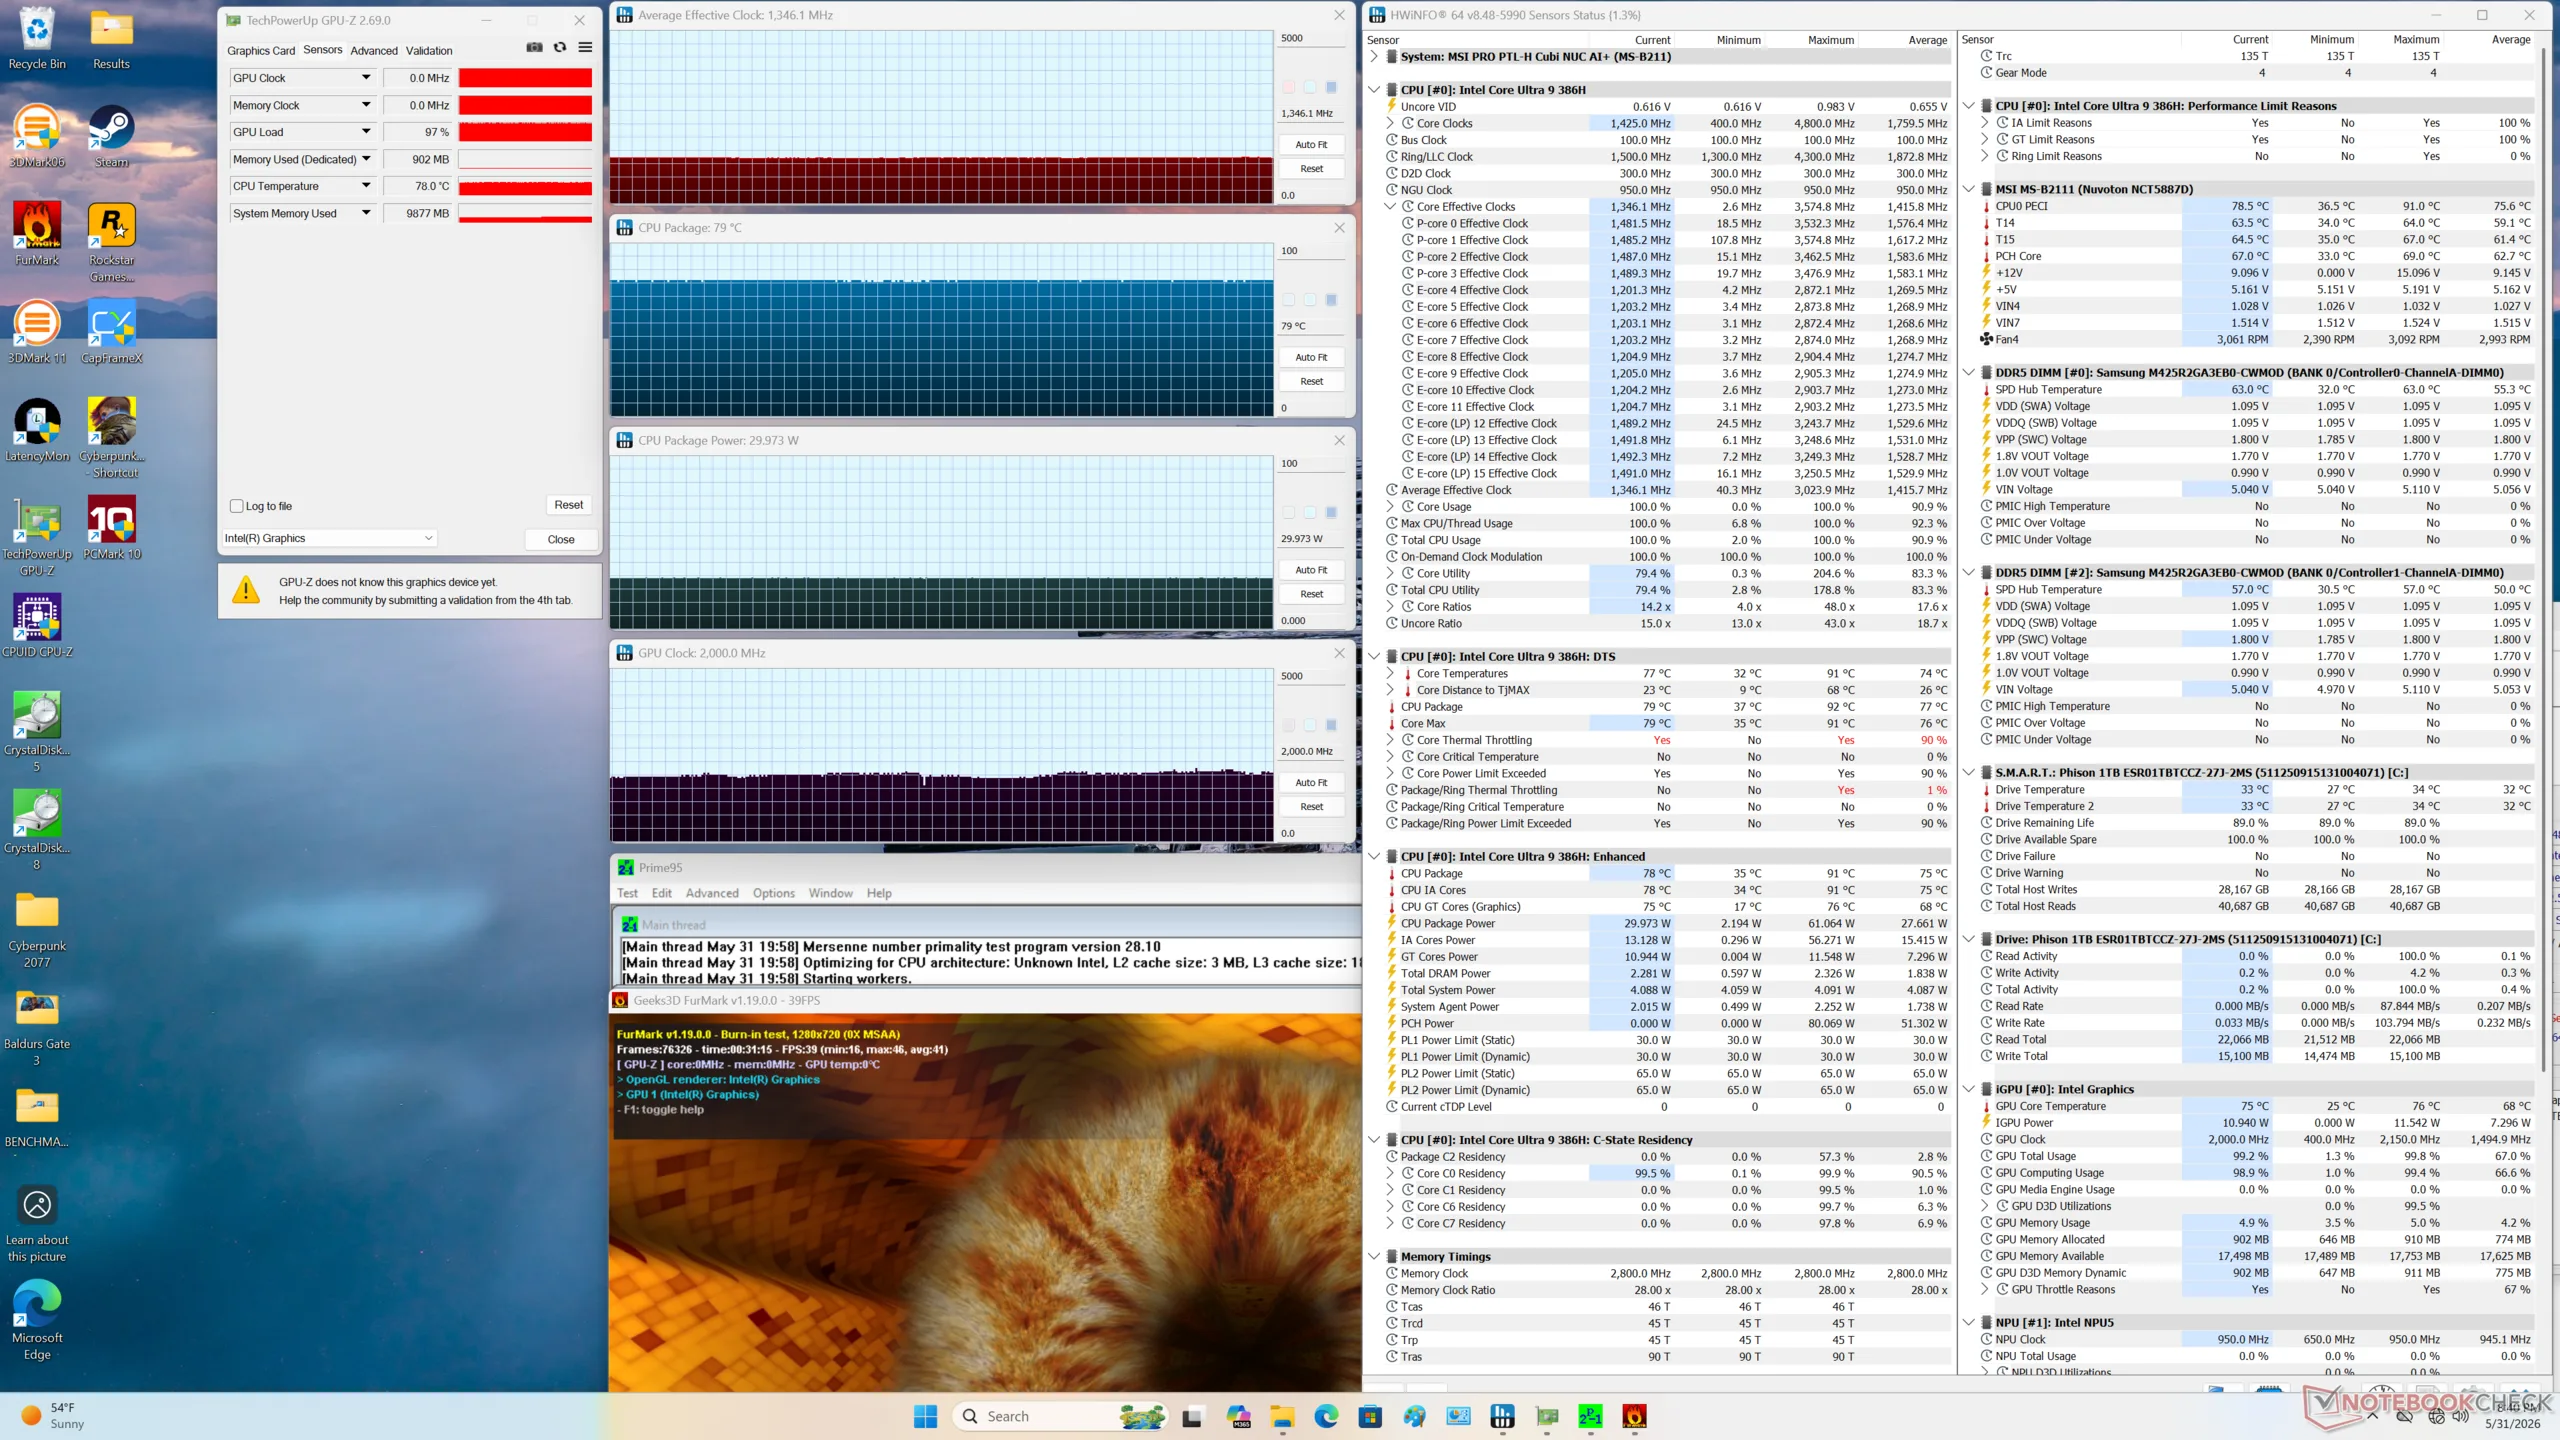
| Reloj medio de la CPU (GHz) | Reloj de la GPU (MHz) | Temperatura media de la CPU (°C) | |
| Sistema en reposo | -- | -- | 37 |
| Prime95 Stress | 2.1 | -- | 88 |
| Prime95 + FurMark Stress | 1.4 | 2000 | 79 |
| Cyberpunk 2077 Estrés | 0,7 | 2500 | ~80 |
Gestión de la energía
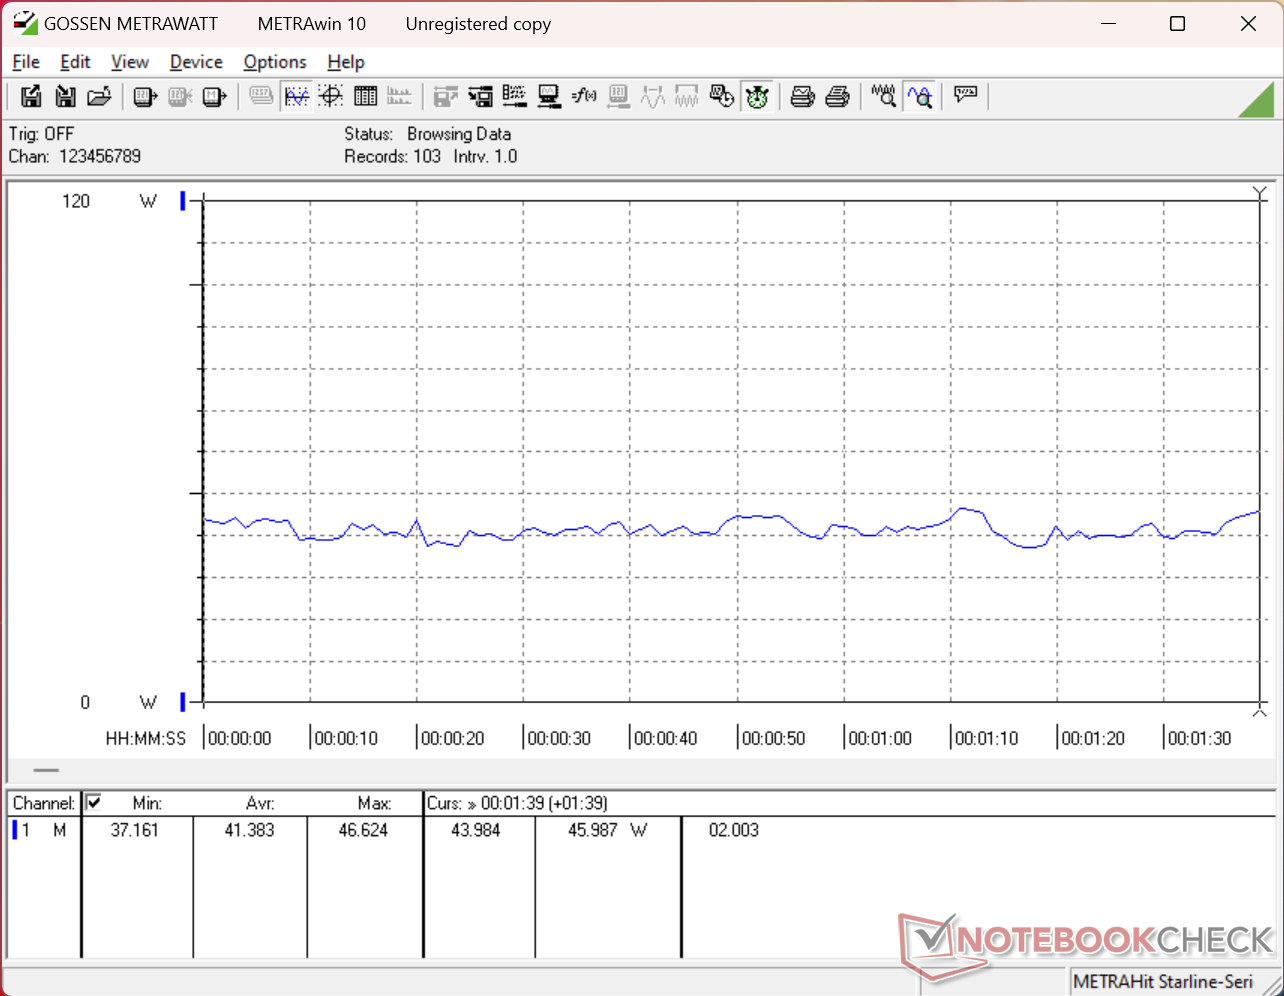
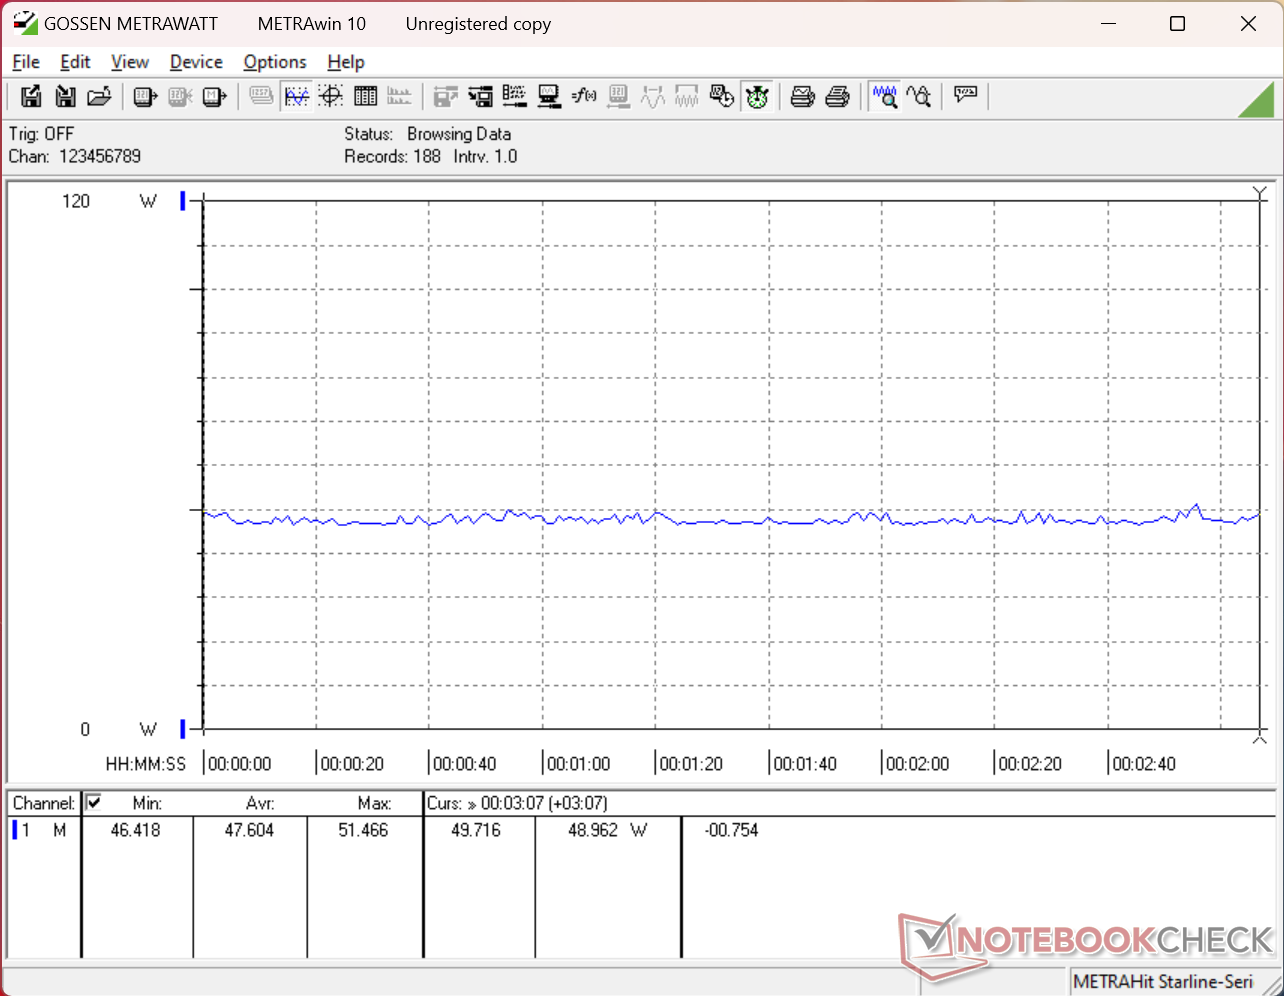
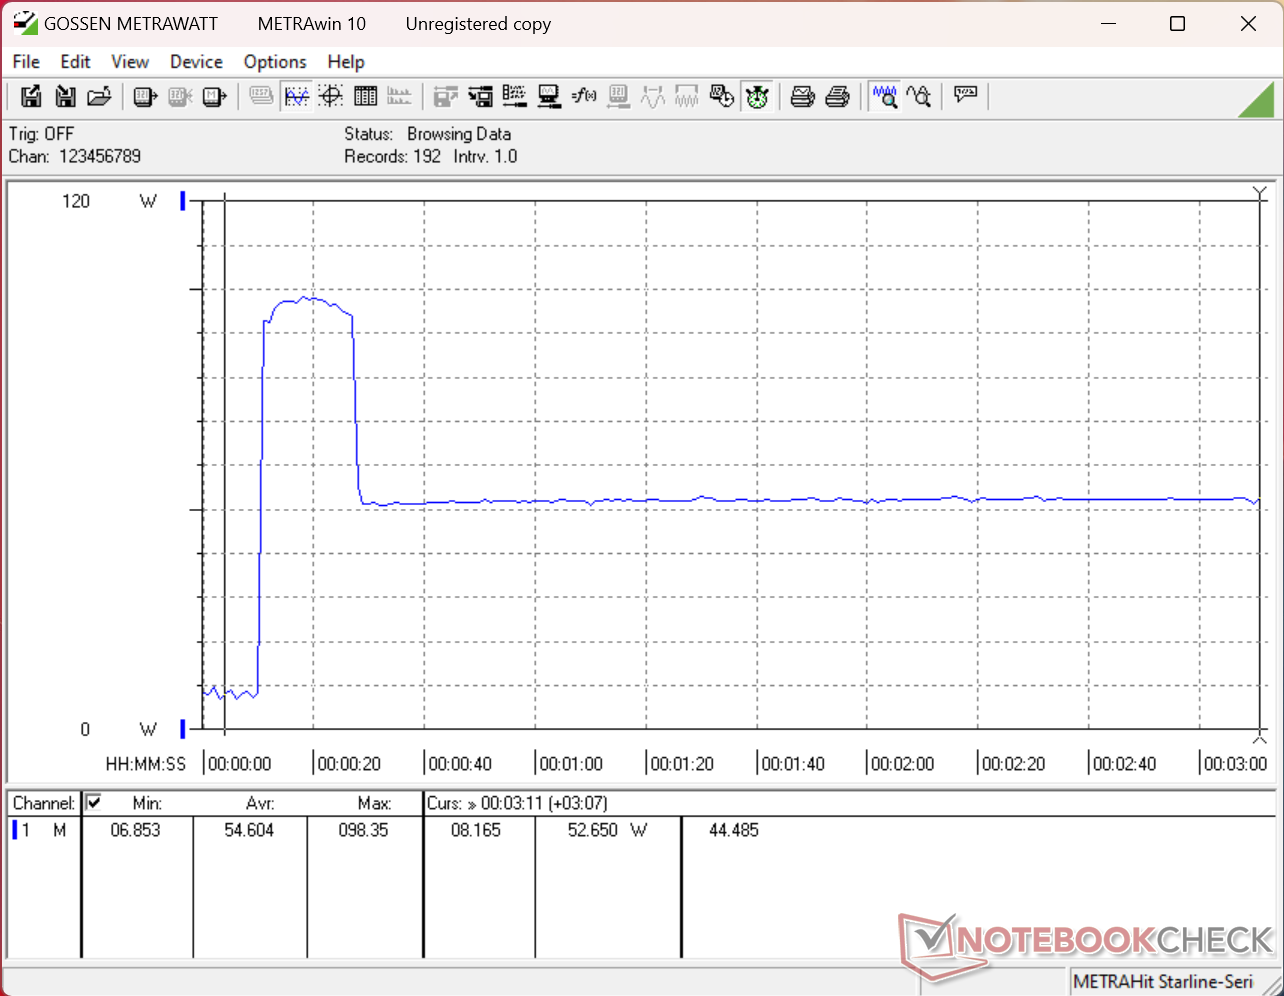
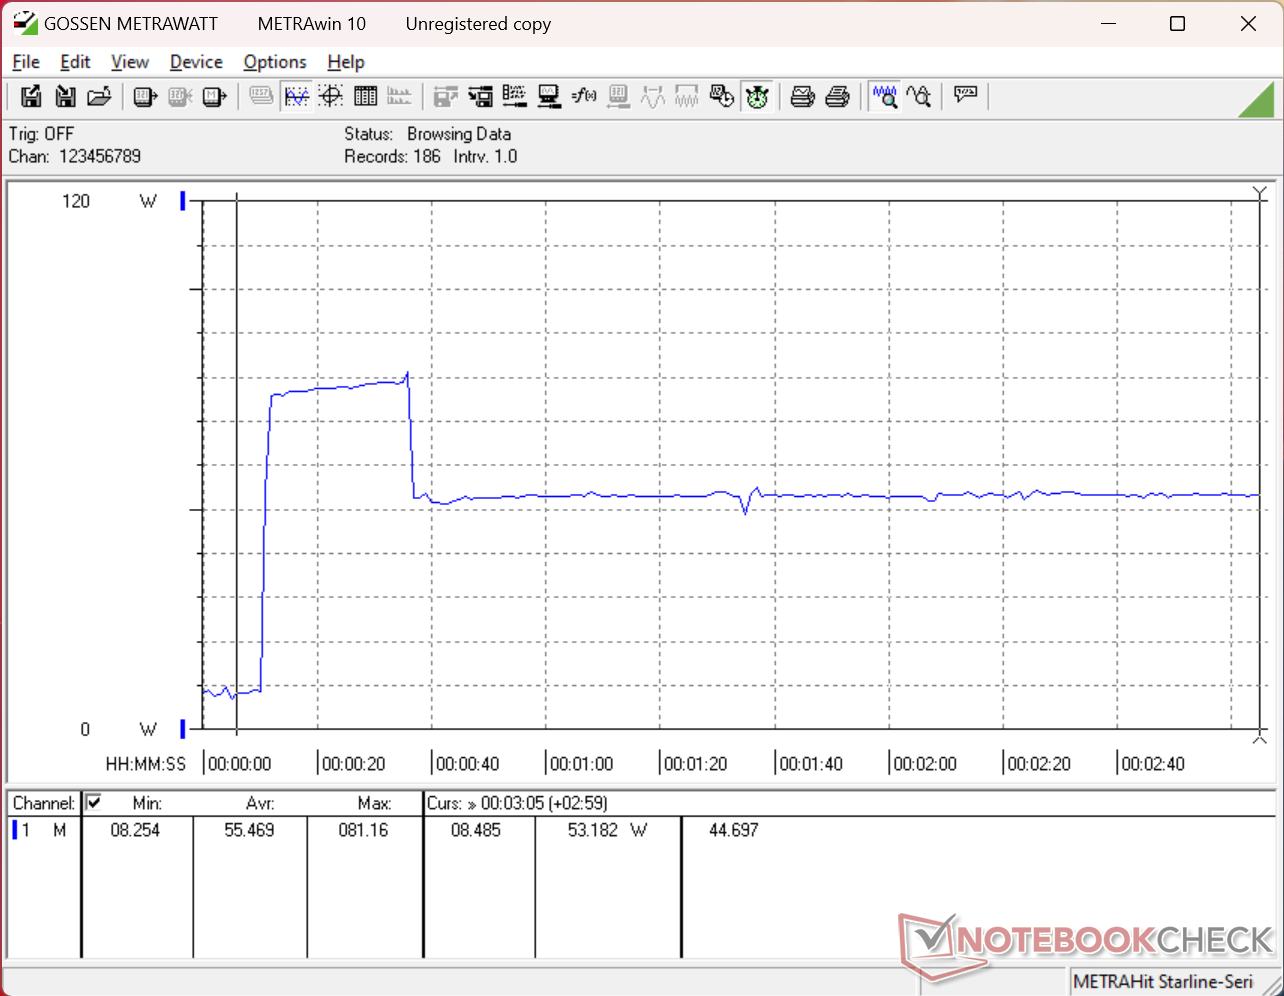
Consumo de energía
La Cubi AI+ 3MG es notablemente más eficiente que la del año pasado Cubi AI+ 2MG especialmente en términos de rendimiento por vatio. Cuando se ejecuta Prime95, por ejemplo, el consumo se estabiliza en torno a los 52 W frente a los 49 W del modelo anterior a pesar del enorme aumento del 60 al 65 por ciento en el rendimiento multihilo. El rendimiento gráfico por vatio también ha aumentado aunque en un grado mucho menor.
Tenga en cuenta que el consumo puede subir temporalmente hasta 98 W antes de volver a bajar debido a las limitaciones del Turbo Boost de la CPU. El adaptador de CA de 120 W (~13 x 6,9 x 2,5 cm) es más que suficiente en este sentido, ya que el mini PC en sí apenas supera una media de 50 W a 60 W cuando está bajo carga.
| Off / Standby | |
| Ocioso | |
| Carga |
|
Clave:
min: | |
| MSI Cubi NUC AI+ 3MG Ultra 9 386H, Intel Graphics 4 Xe3 PTL, Phison 1 TB ESR01TBTCCZ-27J, , x, | GMK NucBox K16 R7 7735HS, Radeon 680M, TWSC TSC3AN1T0-F6Q10S, , x, | GMK EVO-T1 Ultra 9 285H, Arc 140T, Crucial P3 Plus CT1000P3PSSD8, , x, | Geekom A5 Pro R5 7530U, Vega 7, Wodposit WPBSN4M8-1TGP, , x, | Asus NUC 15 Pro+ Ultra 9 285H, Arc 140T, Micron 3500 1TB MTFDKBA1T0TGD, , x, | MSI Cubi NUC AI+ 2MG Core Ultra 7 258V, Arc 140V, Phison 1 TB ESR01TBTCCZ-27J, , x, | MSI Cubi NUC 1M Core 7 150U, Iris Xe G7 96EUs, WD PC SN560 SDDPNQE-1T00, , x, | |
|---|---|---|---|---|---|---|---|
| Power Consumption | -10% | -27% | 42% | -12% | 20% | 8% | |
| Idle Minimum * (Watt) | 6.2 | 7.4 -19% | 6.1 2% | 3.2 48% | 3.9 37% | 2.9 53% | 6.4 -3% |
| Idle Average * (Watt) | 7.9 | 7.7 3% | 7.9 -0% | 4.3 46% | 6.1 23% | 5.7 28% | 8.3 -5% |
| Idle Maximum * (Watt) | 8.5 | 7.7 9% | 13.2 -55% | 5.1 40% | 8.2 4% | 10.2 -20% | 10.4 -22% |
| Load Average * (Watt) | 41.4 | 52 -26% | 60.7 -47% | 32.1 22% | 56.1 -36% | 38.7 7% | 38.5 7% |
| Cyberpunk 2077 ultra external monitor * (Watt) | 47.6 | 68 -43% | 67.4 -42% | 29.4 38% | 63.9 -34% | 41.1 14% | 36.1 24% |
| Load Maximum * (Watt) | 98 | 80.1 18% | 117.1 -19% | 43.5 56% | 160.6 -64% | 60 39% | 52.5 46% |
* ... más pequeño es mejor
Consumo de energía Cyberpunk / Prueba de estrés
Consumo de energía Monitor externo
Valoración de Notebookcheck
El MSI Cubi NUC AI+ 3MG es uno de los mini PC más pequeños que puede encontrar con una CPU Panther Lake Core Ultra 9. Sin embargo, un par de características ausentes le impiden ser la solución definitiva para el comercio o la oficina.
MSI Cubi NUC AI+ 3MG
- 06/03/2026 v8
Allen Ngo
 Total Sustainability Score:
 Competidores potenciales en comparación
Imagen | Modelo | Precio | Peso | Altura | Pantalla |
|---|---|---|---|---|---|
1. 76.9% 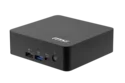 | MSI Cubi NUC AI+ 3MG Intel Core Ultra 9 386H ⎘ Intel Graphics 4 Xe3 Panther Lake iGPU ⎘ 32 GB Memoría, 1000 GB SSD | Amazon: Precio de catálogo: 830 USD | 552 g | 37.5 mm | x |
2. 64.8% 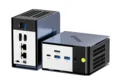 | GMK NucBox K16 AMD Ryzen 7 7735HS ⎘ AMD Radeon 680M ⎘ 32 GB Memoría, 1024 GB SSD | Amazon: 1. $639.97 GMKtec K16 Mini PC Gaming AM... Precio de catálogo: 650 USD | 567 g | 63 mm | x |
3. 75.4%  | GMK EVO-T1 Intel Core Ultra 9 285H ⎘ Intel Arc Graphics 140T ⎘ 64 GB Memoría, 1024 GB SSD | Amazon: Precio de catálogo: 999€ | 946 g | 73.6 mm | x |
4. 72.6%  | Geekom A5 Pro AMD Ryzen 5 7530U ⎘ AMD Radeon RX Vega 7 ⎘ 16 GB Memoría, 1024 GB SSD | Amazon: Precio de catálogo: 619€ | 423 g | 37 mm | x |
5. 77.5% 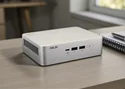 | Asus NUC 15 Pro+ Intel Core Ultra 9 285H ⎘ Intel Arc Graphics 140T ⎘ 32 GB Memoría, 1024 GB SSD | Amazon: $1,240.00 Precio de catálogo: 991€ | 690 g | 42 mm | x |
6. 75.2%  | MSI Cubi NUC AI+ 2MG Intel Core Ultra 7 258V ⎘ Intel Arc Graphics 140V ⎘ 32 GB Memoría, 1000 GB SSD | Amazon: Precio de catálogo: 900 USD | 669 g | 50.1 mm | x |
7. 66.1%  | MSI Cubi NUC 1M Intel Core 7 150U ⎘ Intel Iris Xe Graphics G7 96EUs ⎘ 16 GB Memoría, 1024 GB SSD | Amazon: Precio de catálogo: 950 USD | 660 g | 50.1 mm | x |
Transparencia
La selección de los dispositivos que se van a reseñar corre a cargo de nuestro equipo editorial. La muestra de prueba fue proporcionada al autor en calidad de préstamo por el fabricante o el minorista a los efectos de esta reseña. El prestamista no tuvo ninguna influencia en esta reseña, ni el fabricante recibió una copia de la misma antes de su publicación. No había ninguna obligación de publicar esta reseña. Como empresa de medios independiente, Notebookcheck no está sujeta a la autoridad de fabricantes, minoristas o editores.
Así es como prueba Notebookcheck
Cada año, Notebookcheck revisa de forma independiente cientos de portátiles y smartphones utilizando procedimientos estandarizados para asegurar que todos los resultados son comparables. Hemos desarrollado continuamente nuestros métodos de prueba durante unos 20 años y hemos establecido los estándares de la industria en el proceso. En nuestros laboratorios de pruebas, técnicos y editores experimentados utilizan equipos de medición de alta calidad. Estas pruebas implican un proceso de validación en varias fases. Nuestro complejo sistema de clasificación se basa en cientos de mediciones y puntos de referencia bien fundamentados, lo que mantiene la objetividad.
