Veredicto - Un gran ahorro de espacio para la oficina
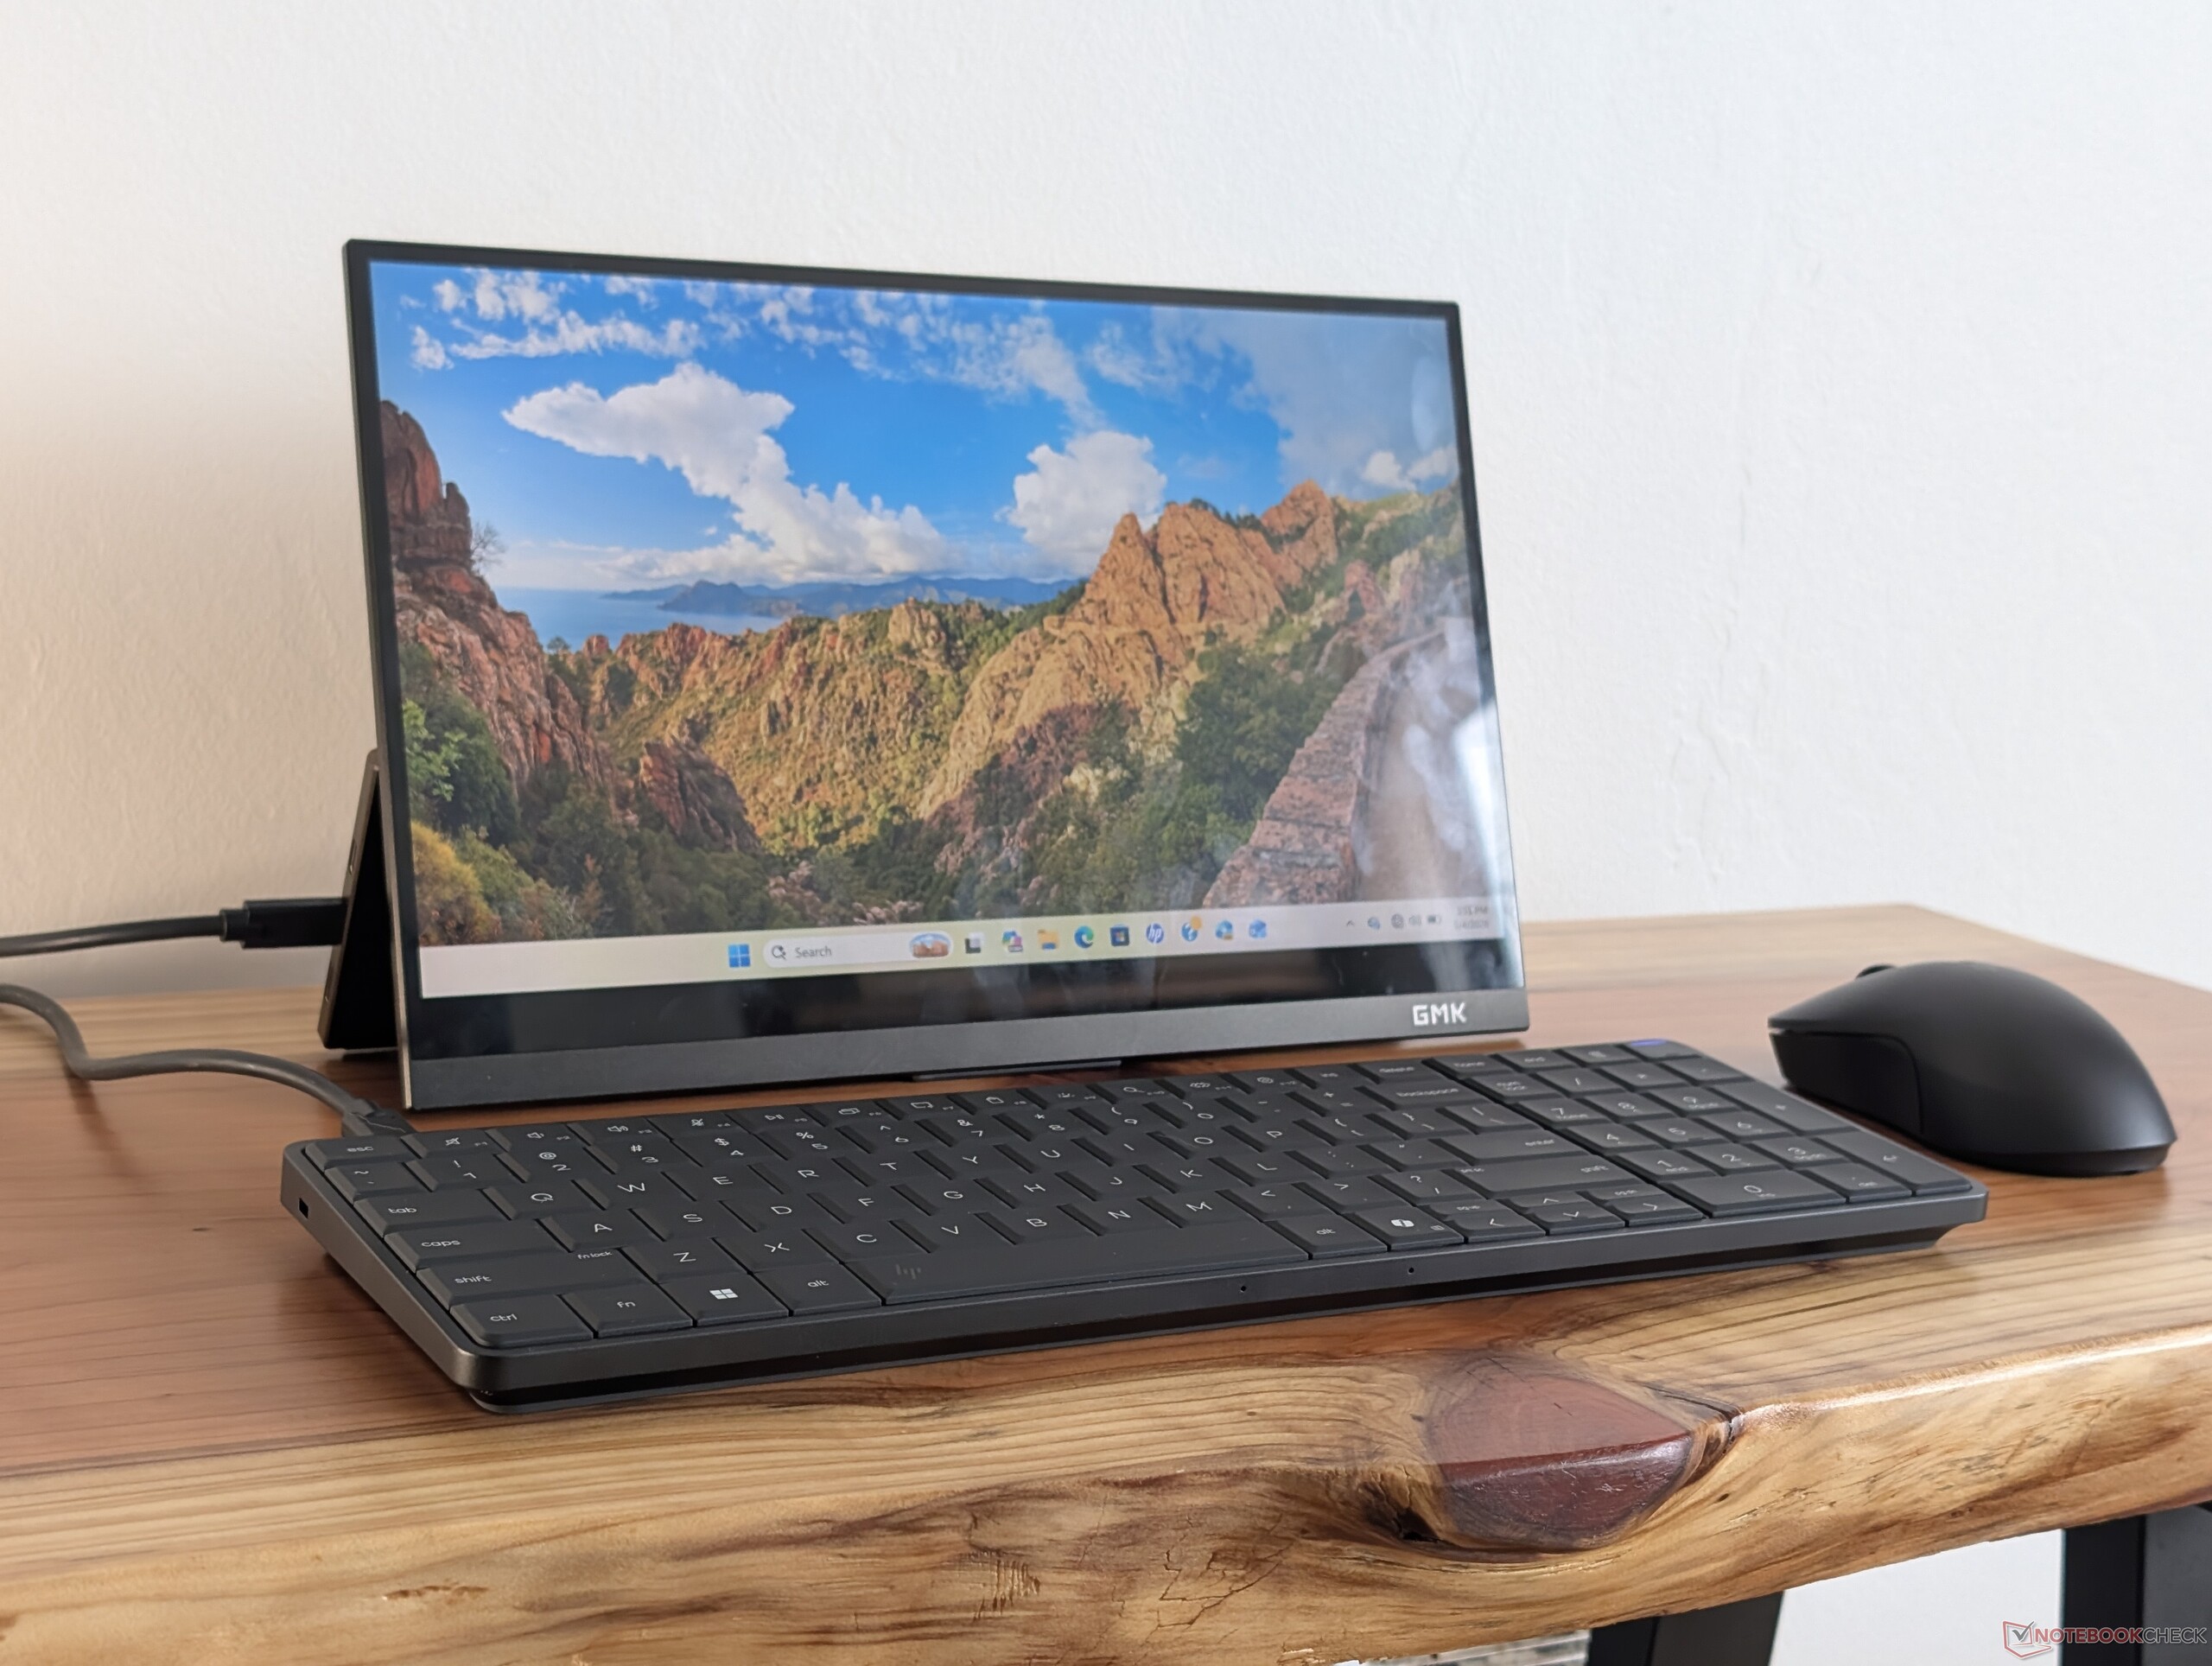
La mejor manera de experimentar la EliteBoard G1a es con un monitor USB-C existente para reducir el desorden de cables en un espacio de escritorio limitado. El diseño limpio, plug-and-play de un solo cable es posiblemente el aspecto más atractivo de la EliteBoard en comparación con los mini PC o AIO tradicionales.
Para los usuarios que se mueven constantemente entre espacios de trabajo o terminales, la EliteBoard puede configurarse con una pequeña batería que permite viajar sin necesidad de apagarla primero entre cada lugar. Sin duda, un portátil normal puede lograr objetivos similares, pero sin las ventajas de un teclado más ergonómico.
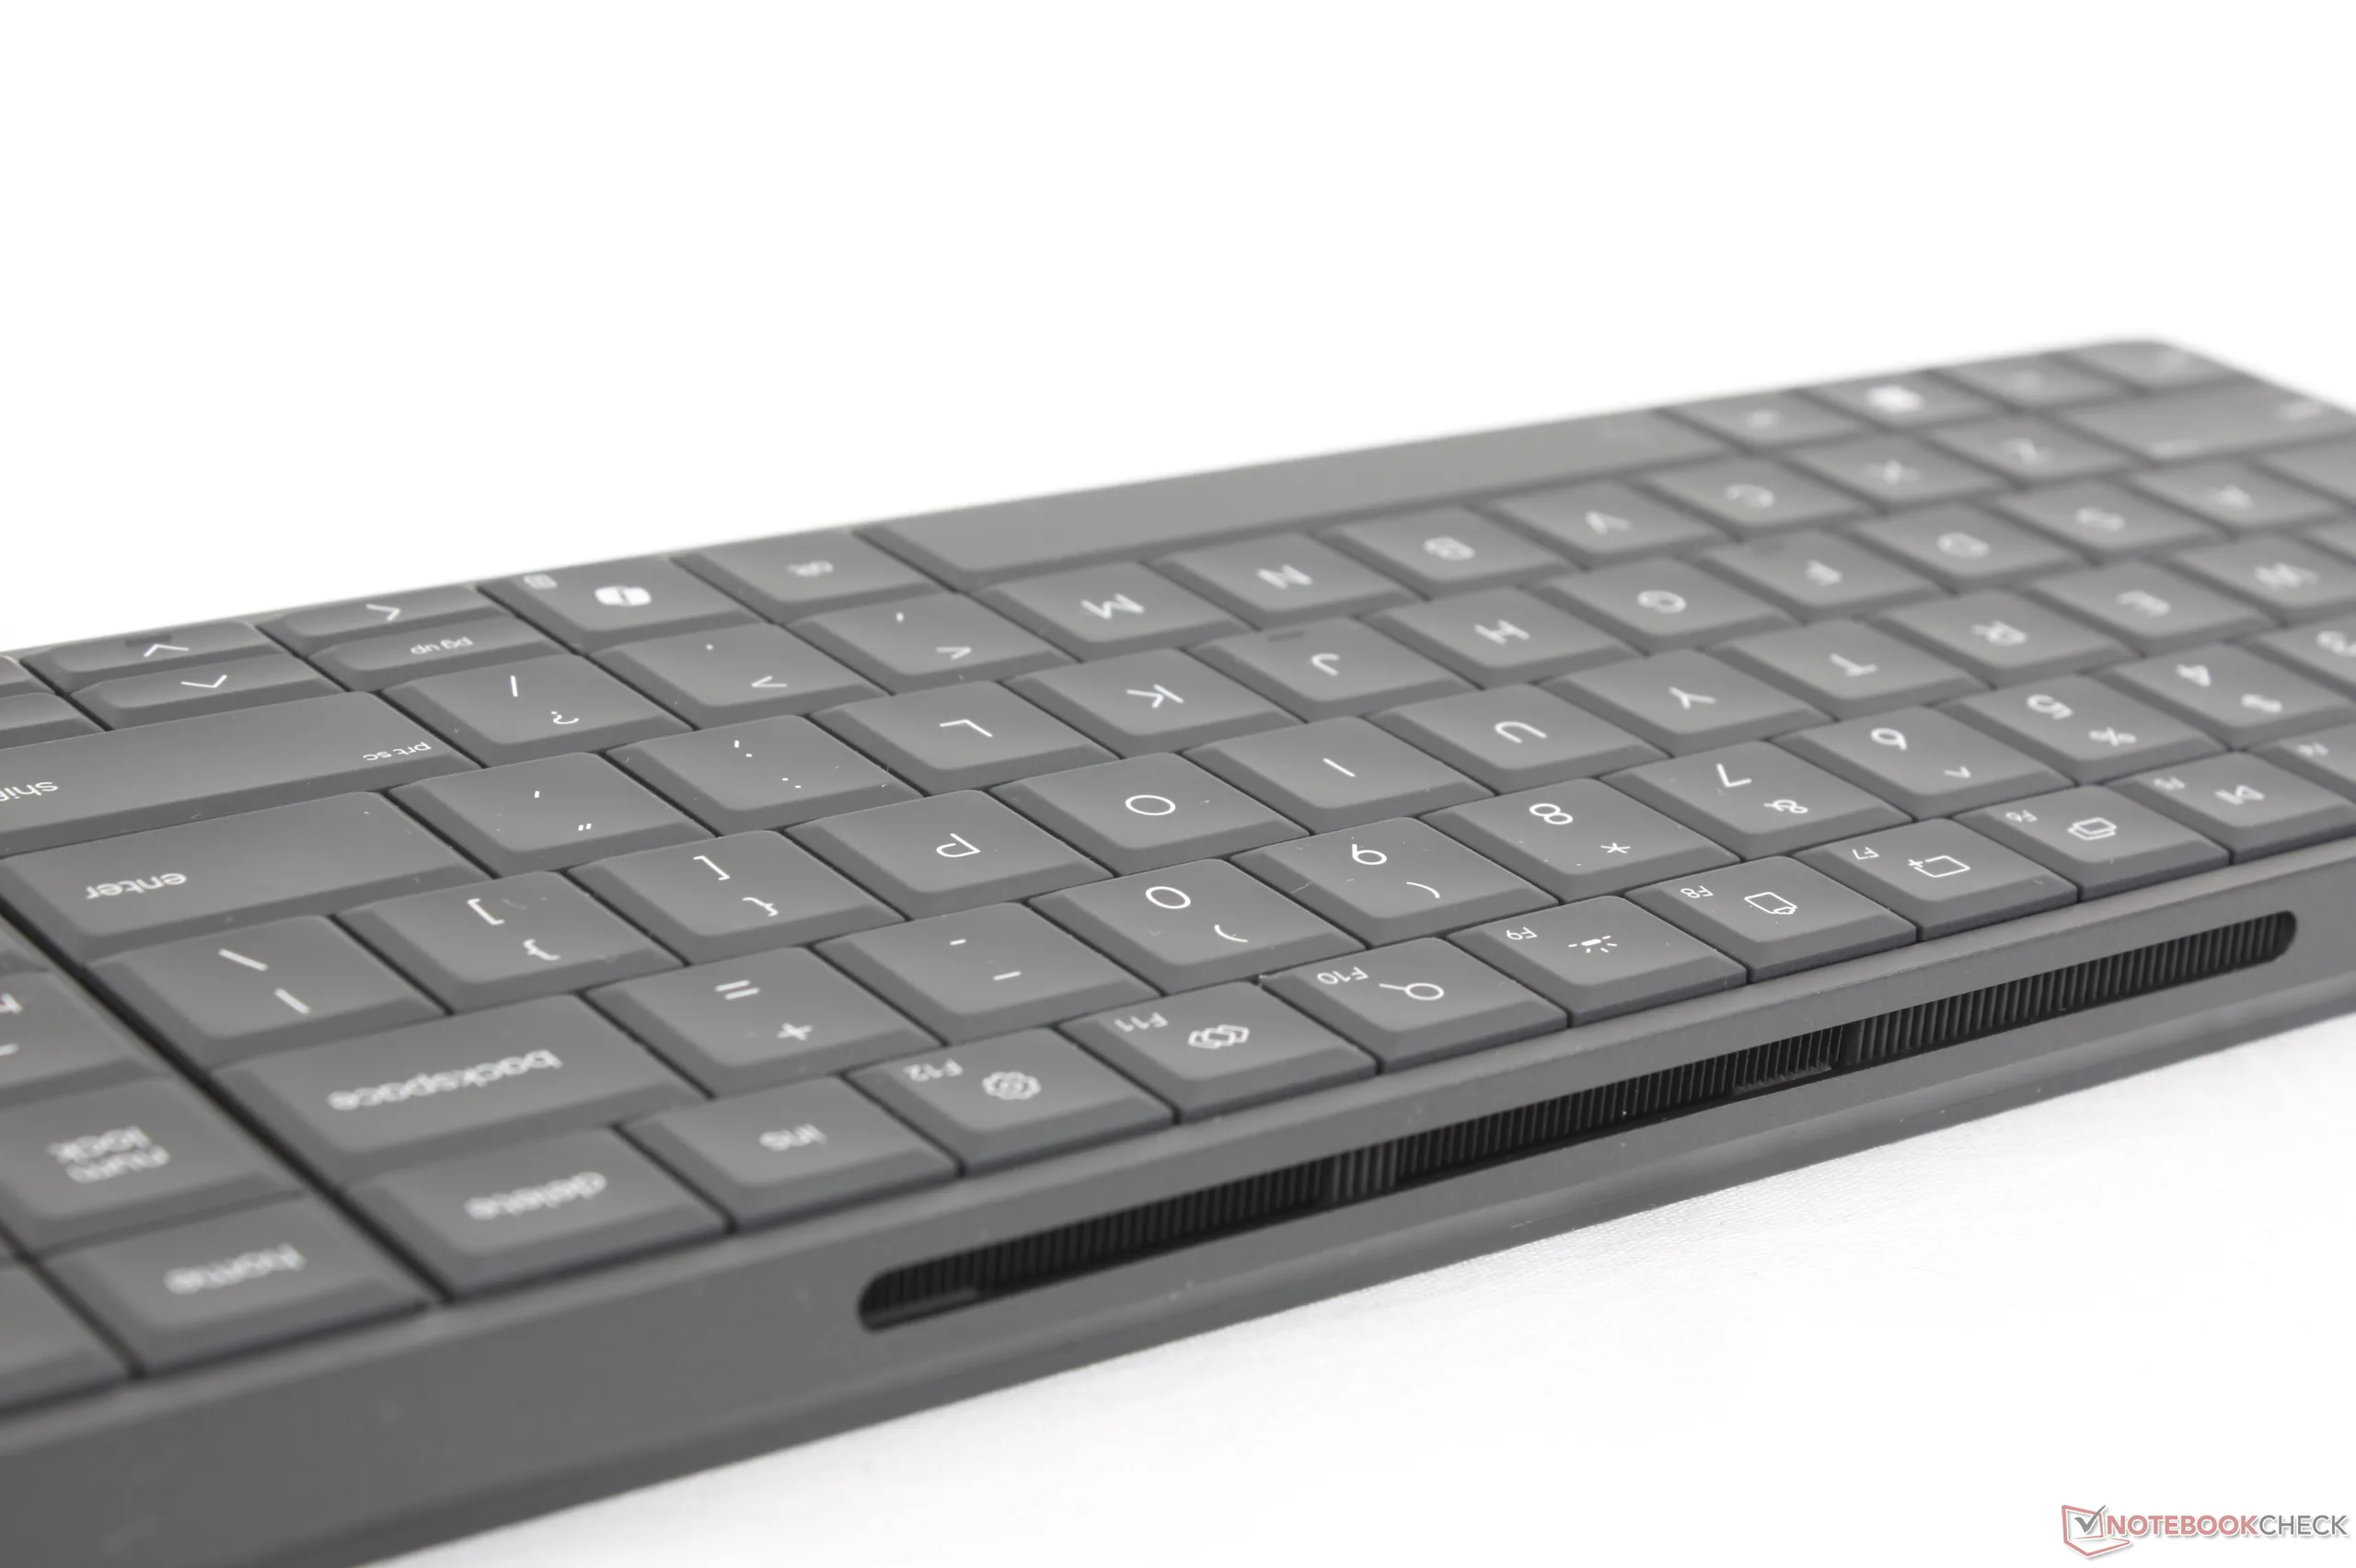
Los dos peores aspectos de la EliteBoard son sus limitadas opciones de puertos y la estrechez de las teclas de flecha. Para un diseño que es más grueso y ancho que muchos portátiles, es desconcertante ver que el EliteBoard tiene menos puertos o teclas de flecha más pequeñas que modelos populares como el Yoga Pro 9 16 o el LG Gram. Una vez que intervienen los adaptadores USB-C y HDMI, la configuración minimalista desaparece. Los mini PC tradicionales como el MSI Cubi NUC o GMK NucBox tienen una ventaja en este sentido con su compatibilidad nativa con monitores HDMI antiguos que siguen siendo comunes en la gran mayoría de las empresas. En otras palabras, no nos importaría un diseño de EliteBoard ligeramente más grande si eso significara teclas más grandes, más funciones auxiliares y puertos integrados adicionales.
Pro
Contra
Precio y disponibilidad
Como dispositivo premium centrado en la empresa, el EliteBoard G1a comienza en 1500 $ con la CPU Ryzen AI 5 Pro 340, 16 GB de RAM y 256 GB de SSD.
El EliteBoard G1a AI es un PC en un teclado diseñado para trabajadores híbridos y espacios de trabajo simplificados. Es esencialmente un teclado con un PC miniaturizado incorporado muy parecido al Commodore 64 original. Para este modelo de primera generación, HP lo ha configurado con CPU de la serie Ryzen AI 300 PRO para atraer a las empresas y las aplicaciones profesionales más que al típico usuario doméstico.
Nuestra unidad de prueba se entrega con el Ryzen AI 5 Pro 340 y 32 GB de RAM por aproximadamente 1600 dólares. Otras configuraciones alcanzan el Ryzen AI 7 Pro 350 con hasta 24 GB de RAM y 2 TB de almacenamiento.
La EliteBoard es única en el sentido de que es la primera de su clase con una CPU moderna que ejecuta Windows 11. No obstante, compite con los mini PC tradicionales diseñados para empresas, incluido el MSI Cubi NUC, Asus ExpertCentero el GMK EVO-X1.
Más opiniones sobre HP:
Especificaciones
Caso
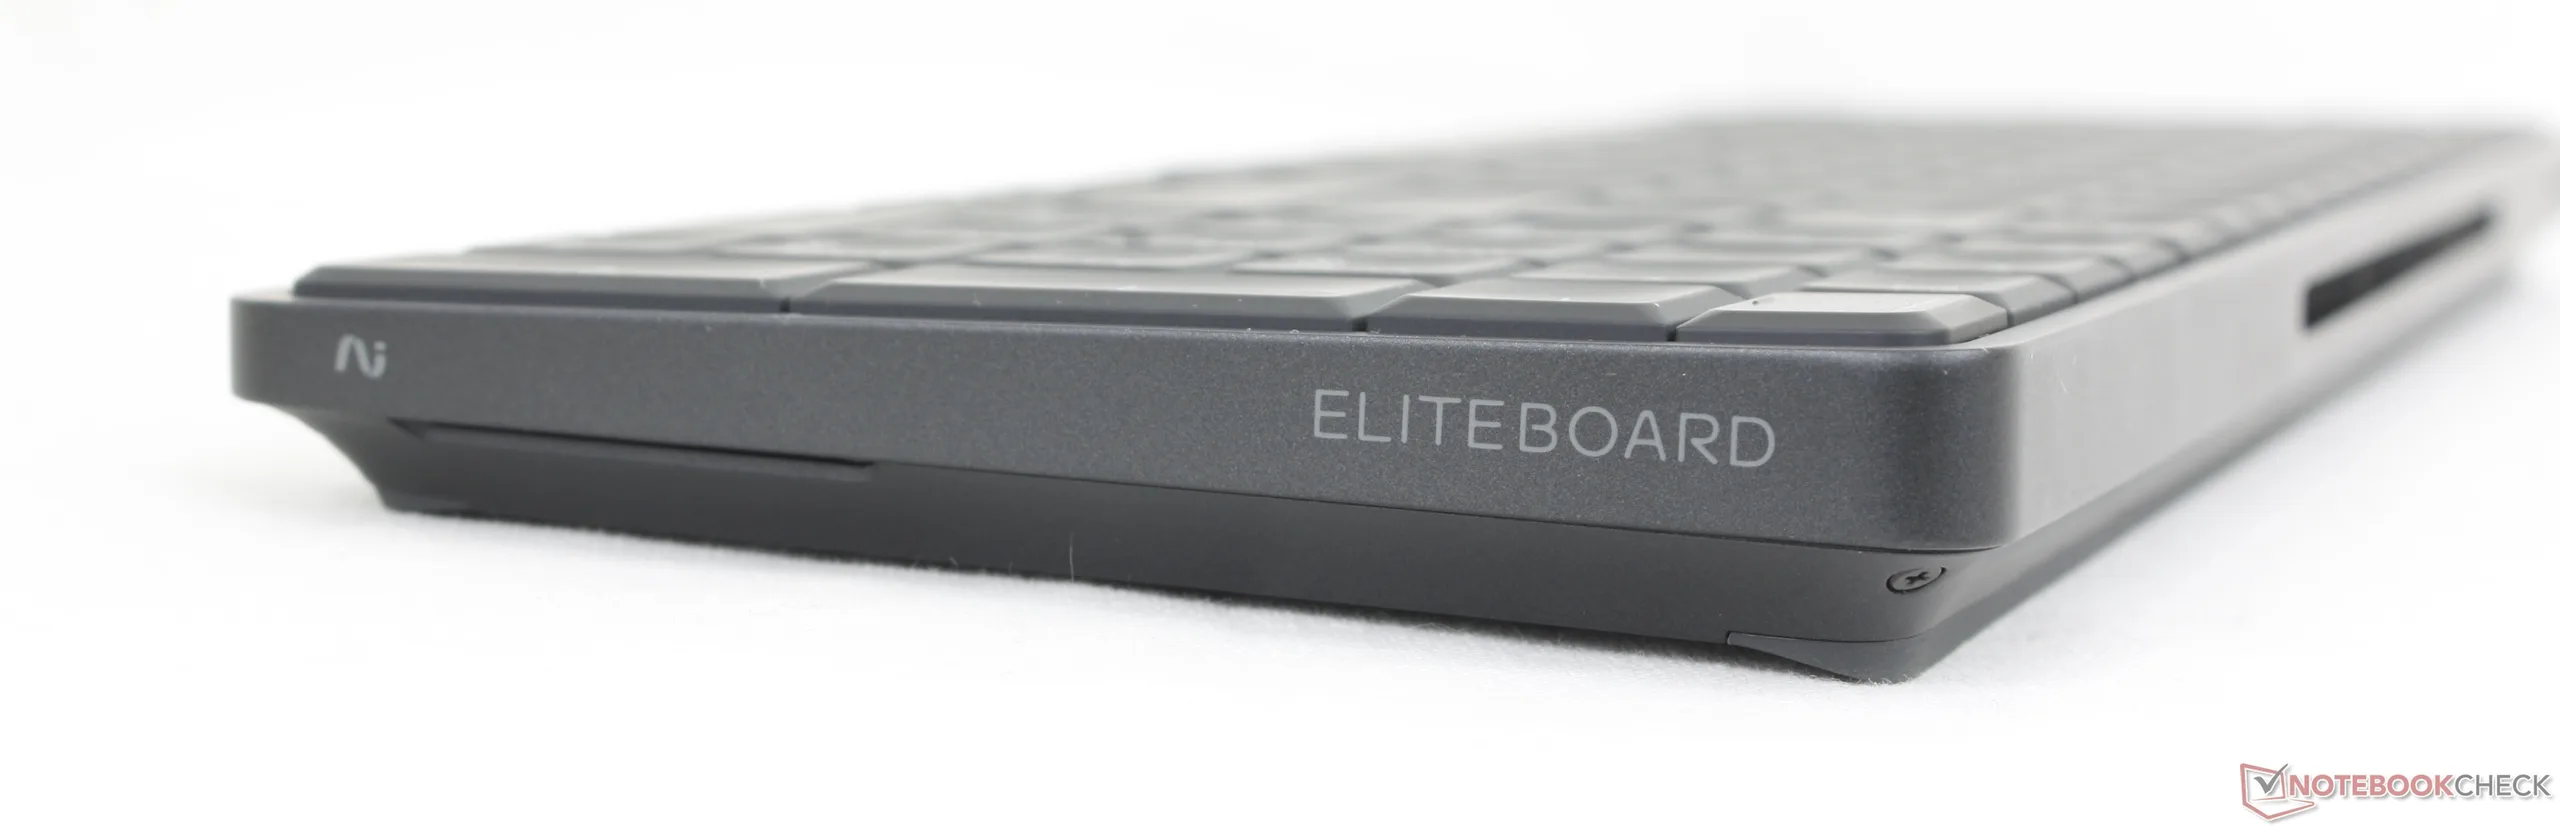
El grueso marco de plástico y los densos componentes internos del PC ayudan a fortificar el EliteBoard para conseguir una sensación más fuerte y rígida que la de un teclado tradicional. Su diseño discreto ni siquiera parece que haya un PC en su interior, lo que ayuda al enfoque minimalista.
Conectividad
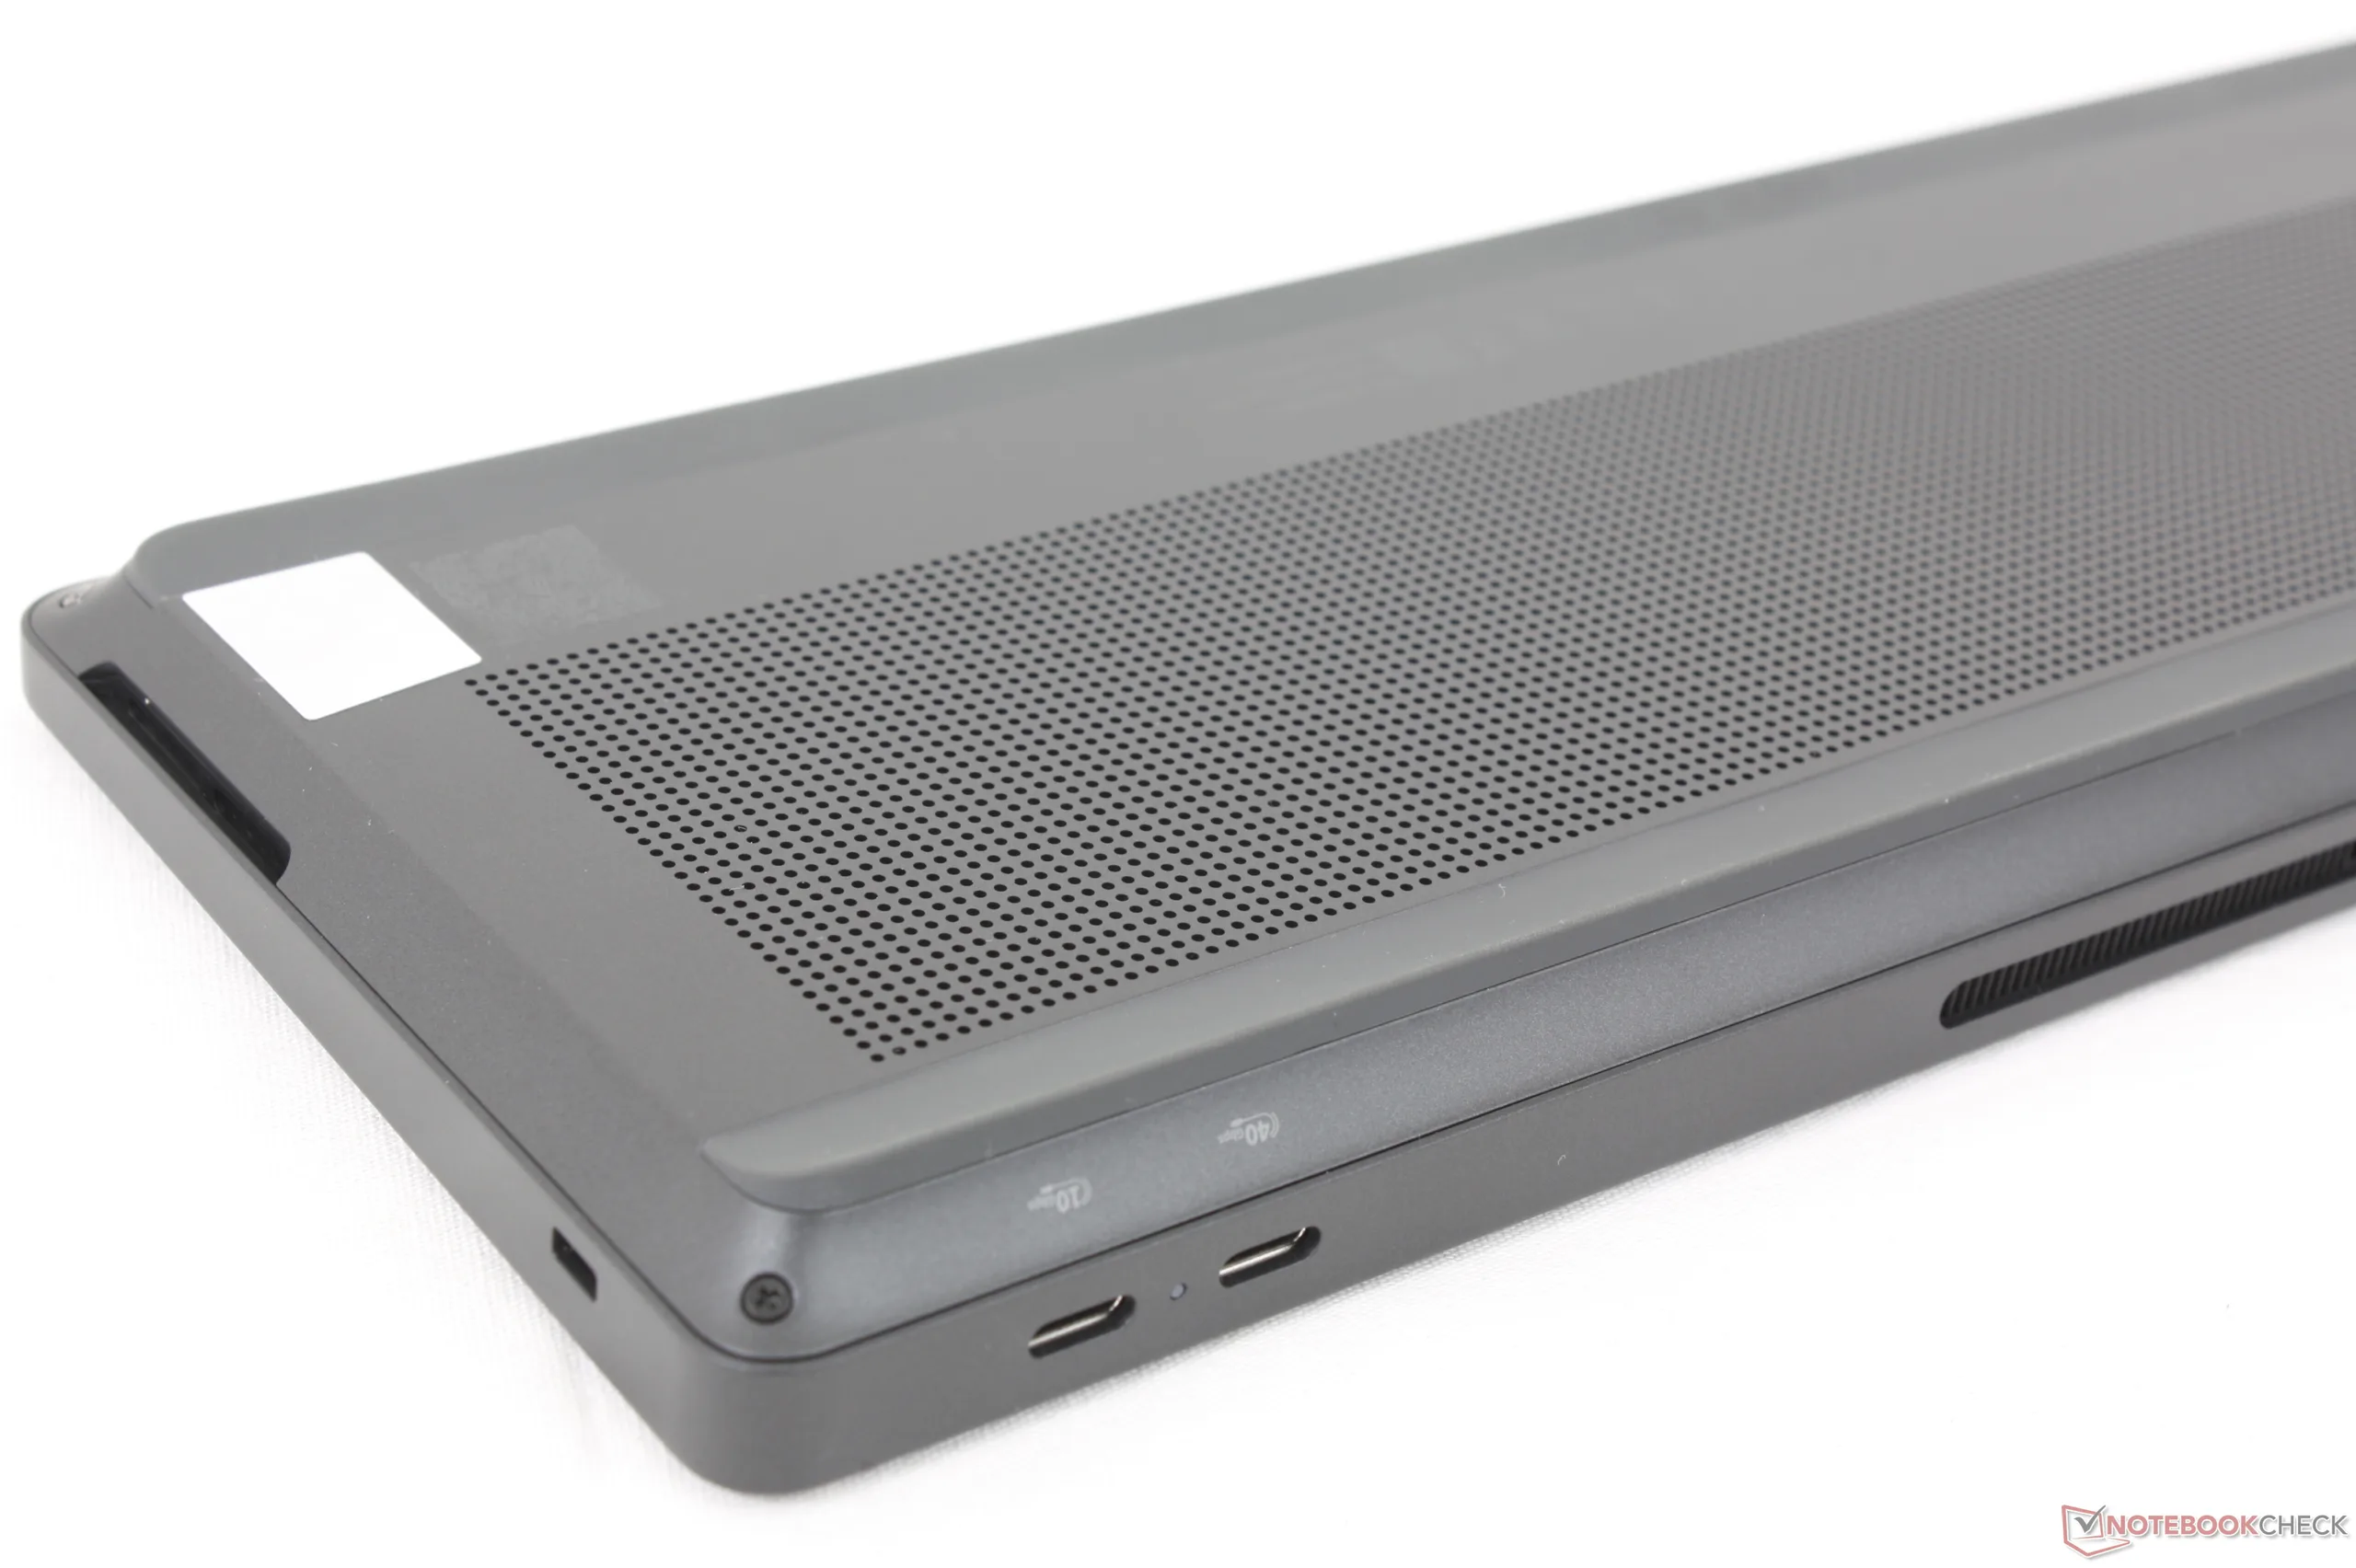
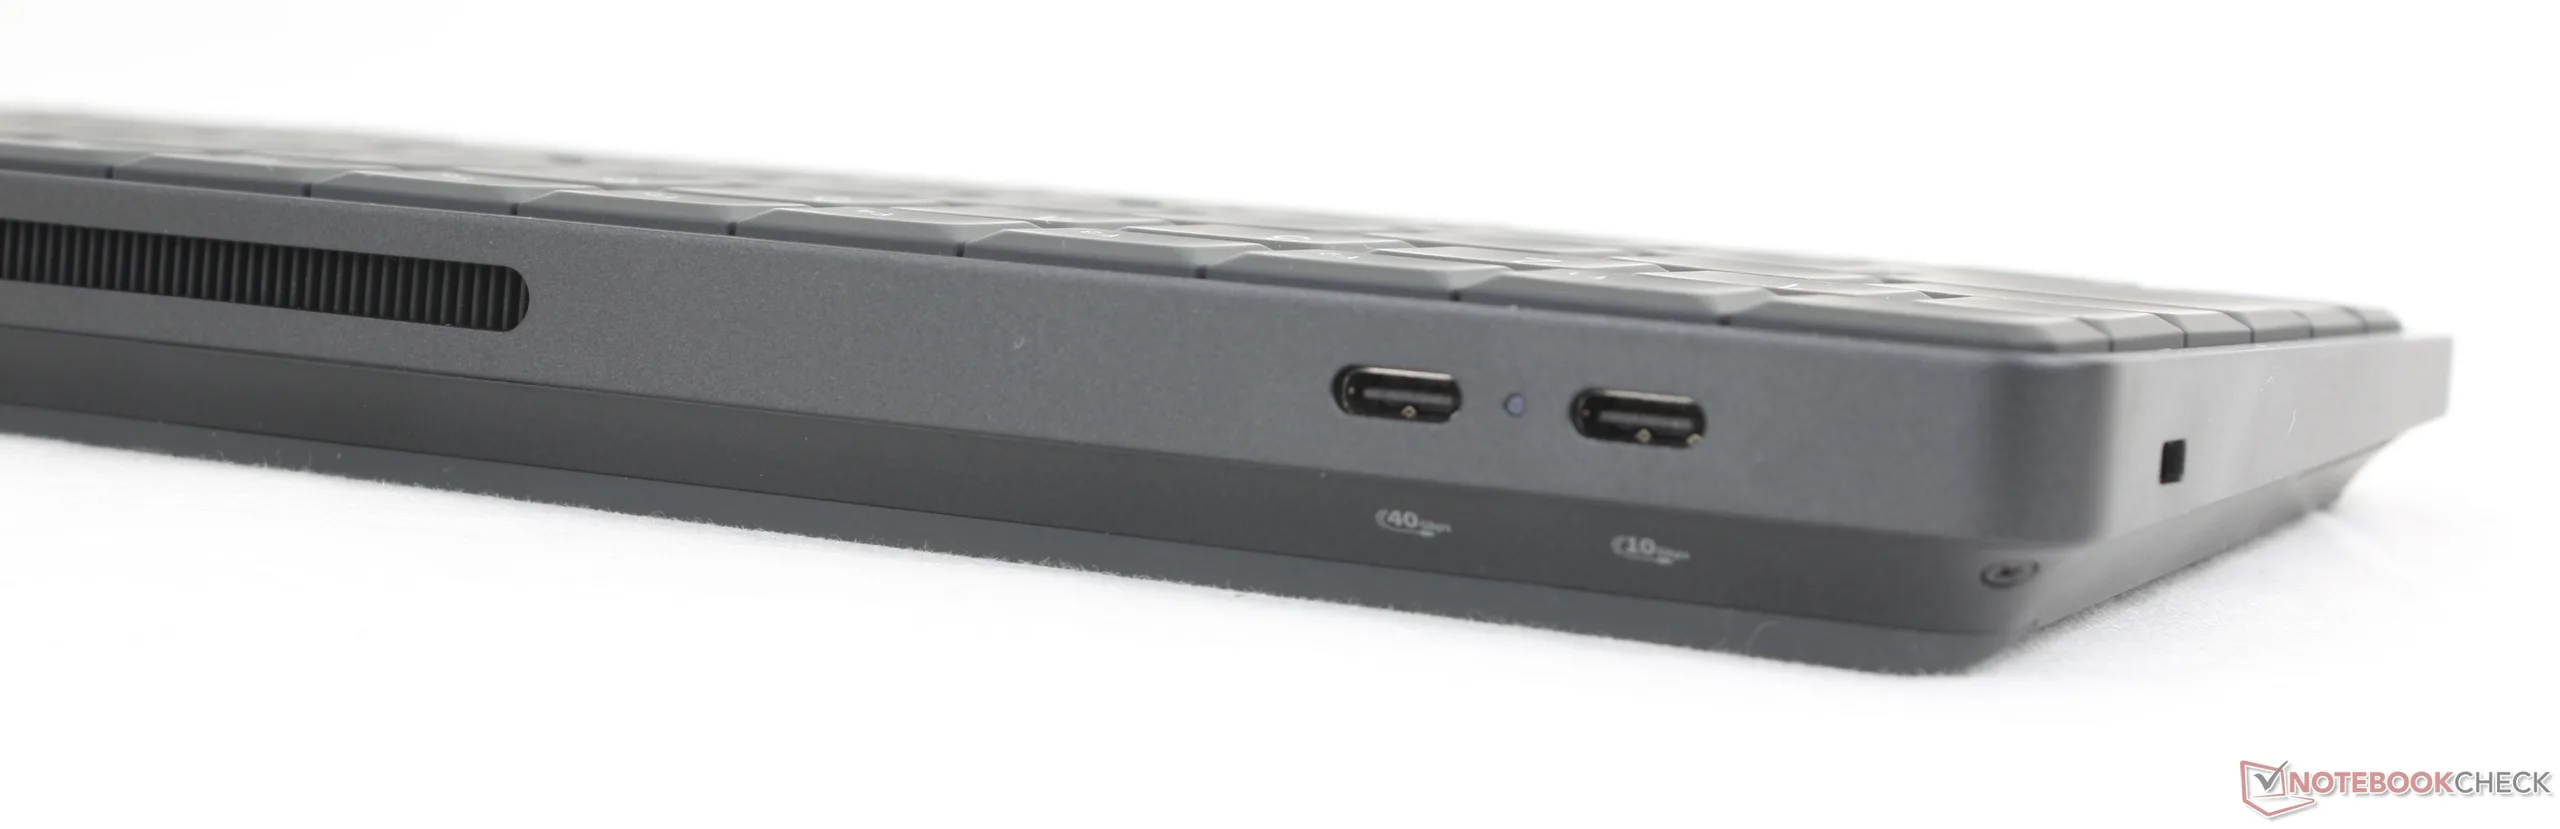
Sólo hay dos puertos USB-C con los que trabajar para una sensación de barebones. Lo ideal sería que los usuarios ya tuvieran un monitor con USB-C de vídeo y Power Delivery passthrough para una experiencia plug-and-play de un solo cable. De lo contrario, prepárese para tener dongles desordenados y estaciones de acoplamiento con el fin de configurar correctamente la EliteBoard.
Lamentablemente, los dos puertos USB-C son asimétricos, lo que significa que sólo un puerto soporta USB4 o 40 Gbps, mientras que el otro es sólo USB 3.2 Gen. 2 o 10 Gbps, probablemente debido a las limitaciones del chipset AMD.
Cada puerto USB-C también puede utilizarse para cargar o alimentar dispositivos conectados como monitores externos portátiles o smartphones aunque sólo hasta 7,5 W.
Comunicación
| Networking | |
| iperf3 transmit AXE11000 | |
| Asus NUC 15 Pro+ | |
| HP EliteBoard G1a AI | |
| MSI Cubi NUC AI+ 2MG | |
| HP Pro Mini 400 G9-937U0EA | |
| Geekom A5 Pro | |
| GMK NucBox K13 | |
| iperf3 receive AXE11000 | |
| Asus NUC 15 Pro+ | |
| HP EliteBoard G1a AI | |
| MSI Cubi NUC AI+ 2MG | |
| HP Pro Mini 400 G9-937U0EA | |
| Geekom A5 Pro | |
| GMK NucBox K13 | |
| iperf3 transmit AXE11000 6GHz | |
| HP EliteBoard G1a AI | |
| Asus NUC 15 Pro+ | |
| HP Pro Mini 400 G9-937U0EA | |
| MSI Cubi NUC AI+ 2MG | |
| GMK NucBox K13 | |
| iperf3 receive AXE11000 6GHz | |
| HP EliteBoard G1a AI | |
| GMK NucBox K13 | |
| MSI Cubi NUC AI+ 2MG | |
| Asus NUC 15 Pro+ | |
| HP Pro Mini 400 G9-937U0EA | |
Mantenimiento
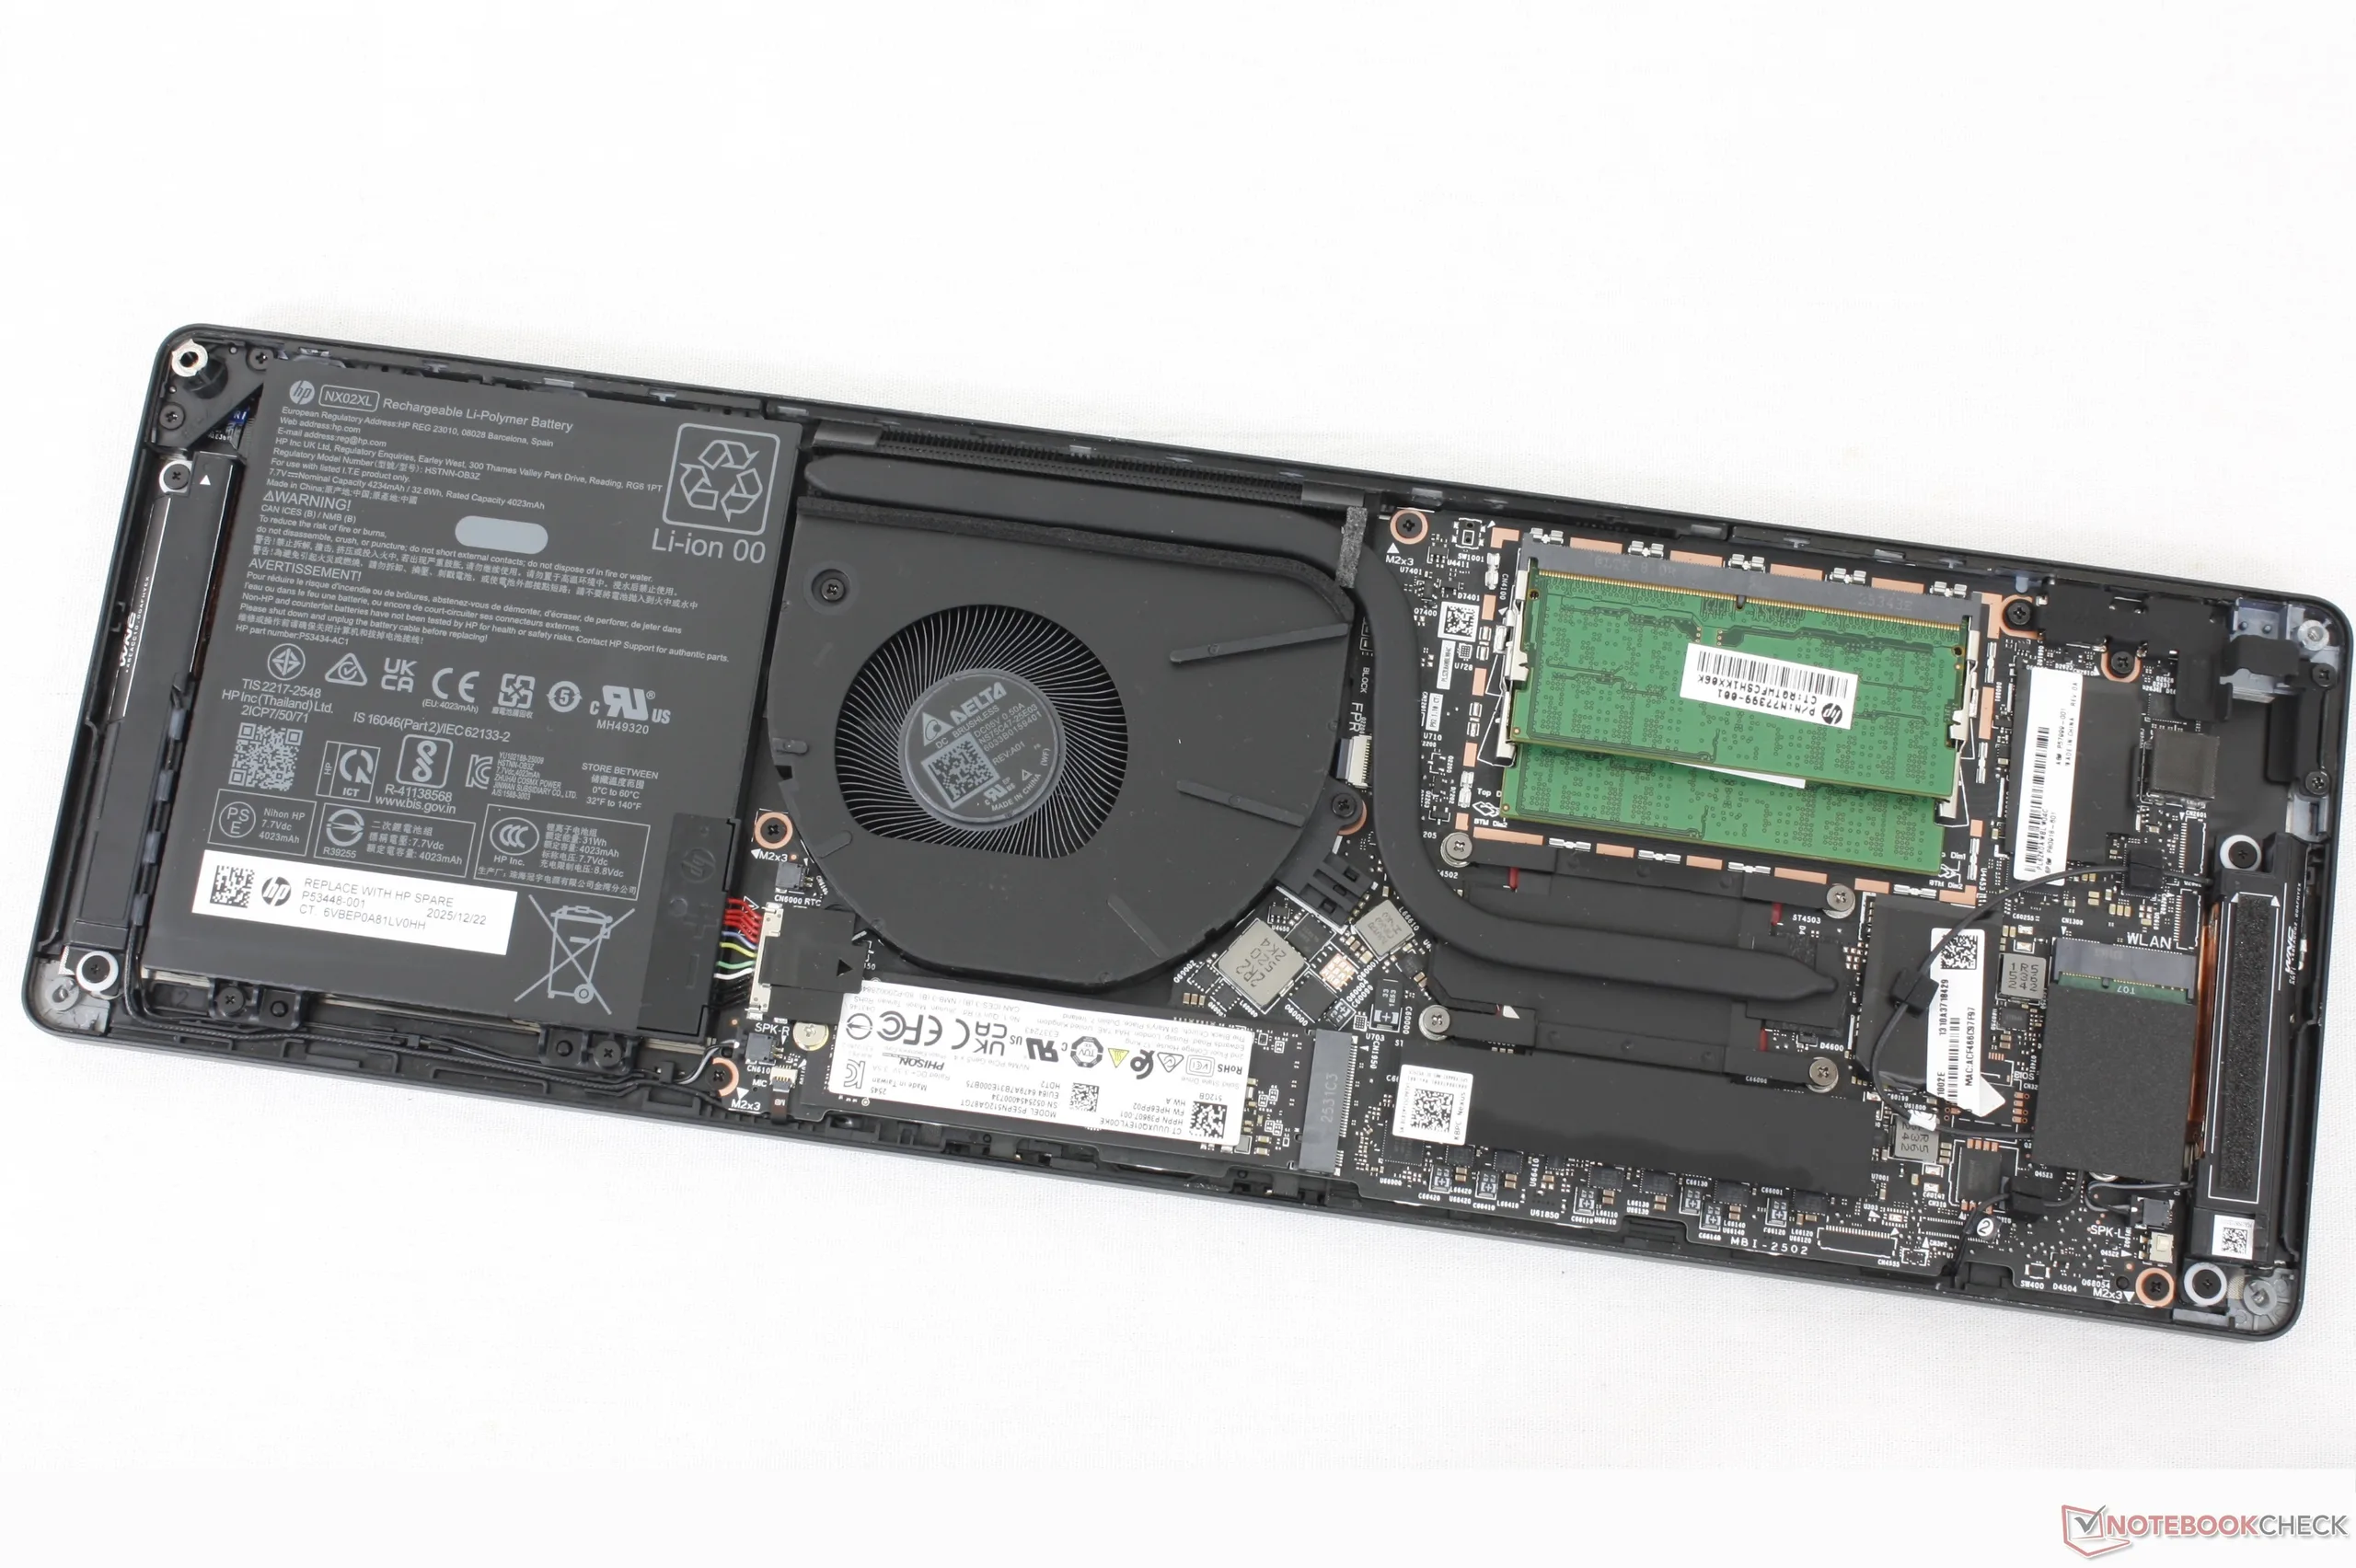
Fiel a la tradición de la serie Elite, la tarjeta EliteBoard es fácil de mantener con dos ranuras SODIMM DDR5 accesibles, un módulo WLAN M.2 extraíble y una única ranura SSD M.2 2280.
Sostenibilidad
El sistema se fabrica con plásticos y cobre reciclados hasta en un 75% y un 45%, respectivamente. Mientras tanto, el embalaje no contiene plástico y es totalmente reciclable.
Aunque las tapas individuales de las llaves son reemplazables, la cubierta o capa de membrana que hay debajo no se diseñó para que fuera fácilmente sustituible.
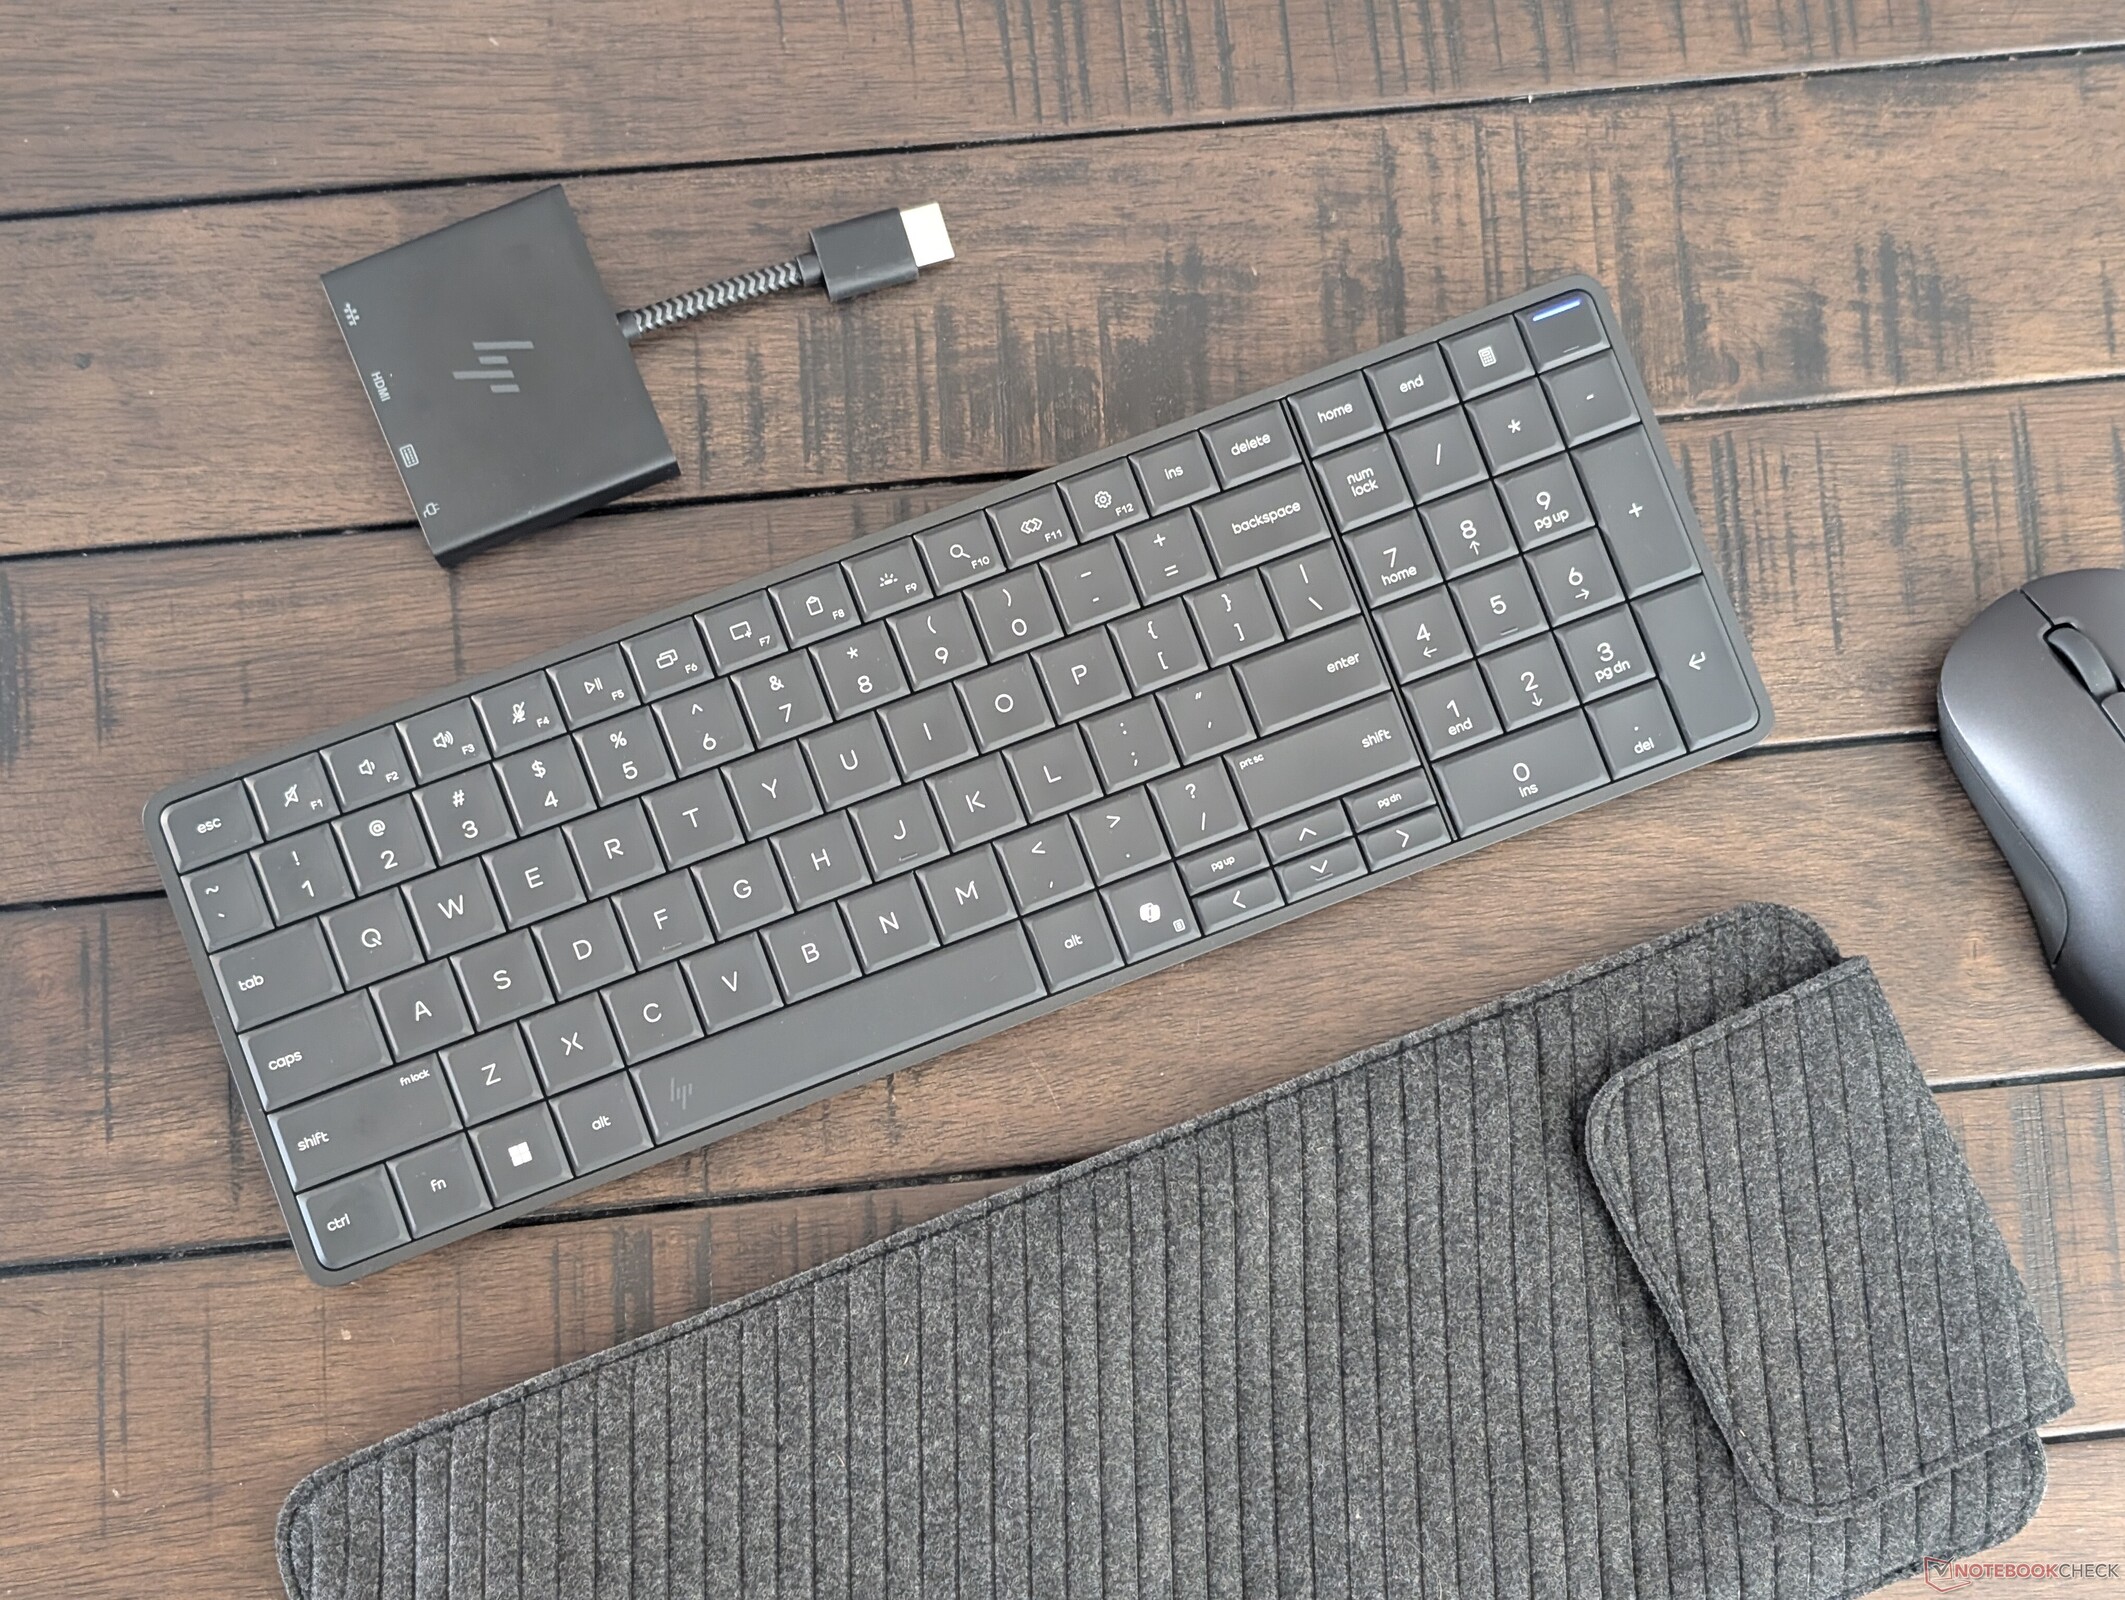
Accesorios
La caja de venta incluye un adaptador de CA GaN USB-C de 65 W, un cable USB-C y un ratón Bluetooth HP 675M con pilas. Una funda de viaje de tacto suave viene de serie sólo si se configura con un paquete de pilas.
Tenga en cuenta que el adaptador de CA no es necesario para los usuarios con monitores existentes que admitan vídeo USB-C y Power Delivery.
Los extras opcionales incluyen estaciones de acoplamiento y adaptadores para monitores externos antiguos que utilizan HDMI para vídeo en lugar de USB-C.
Dispositivos de entrada
Teclado
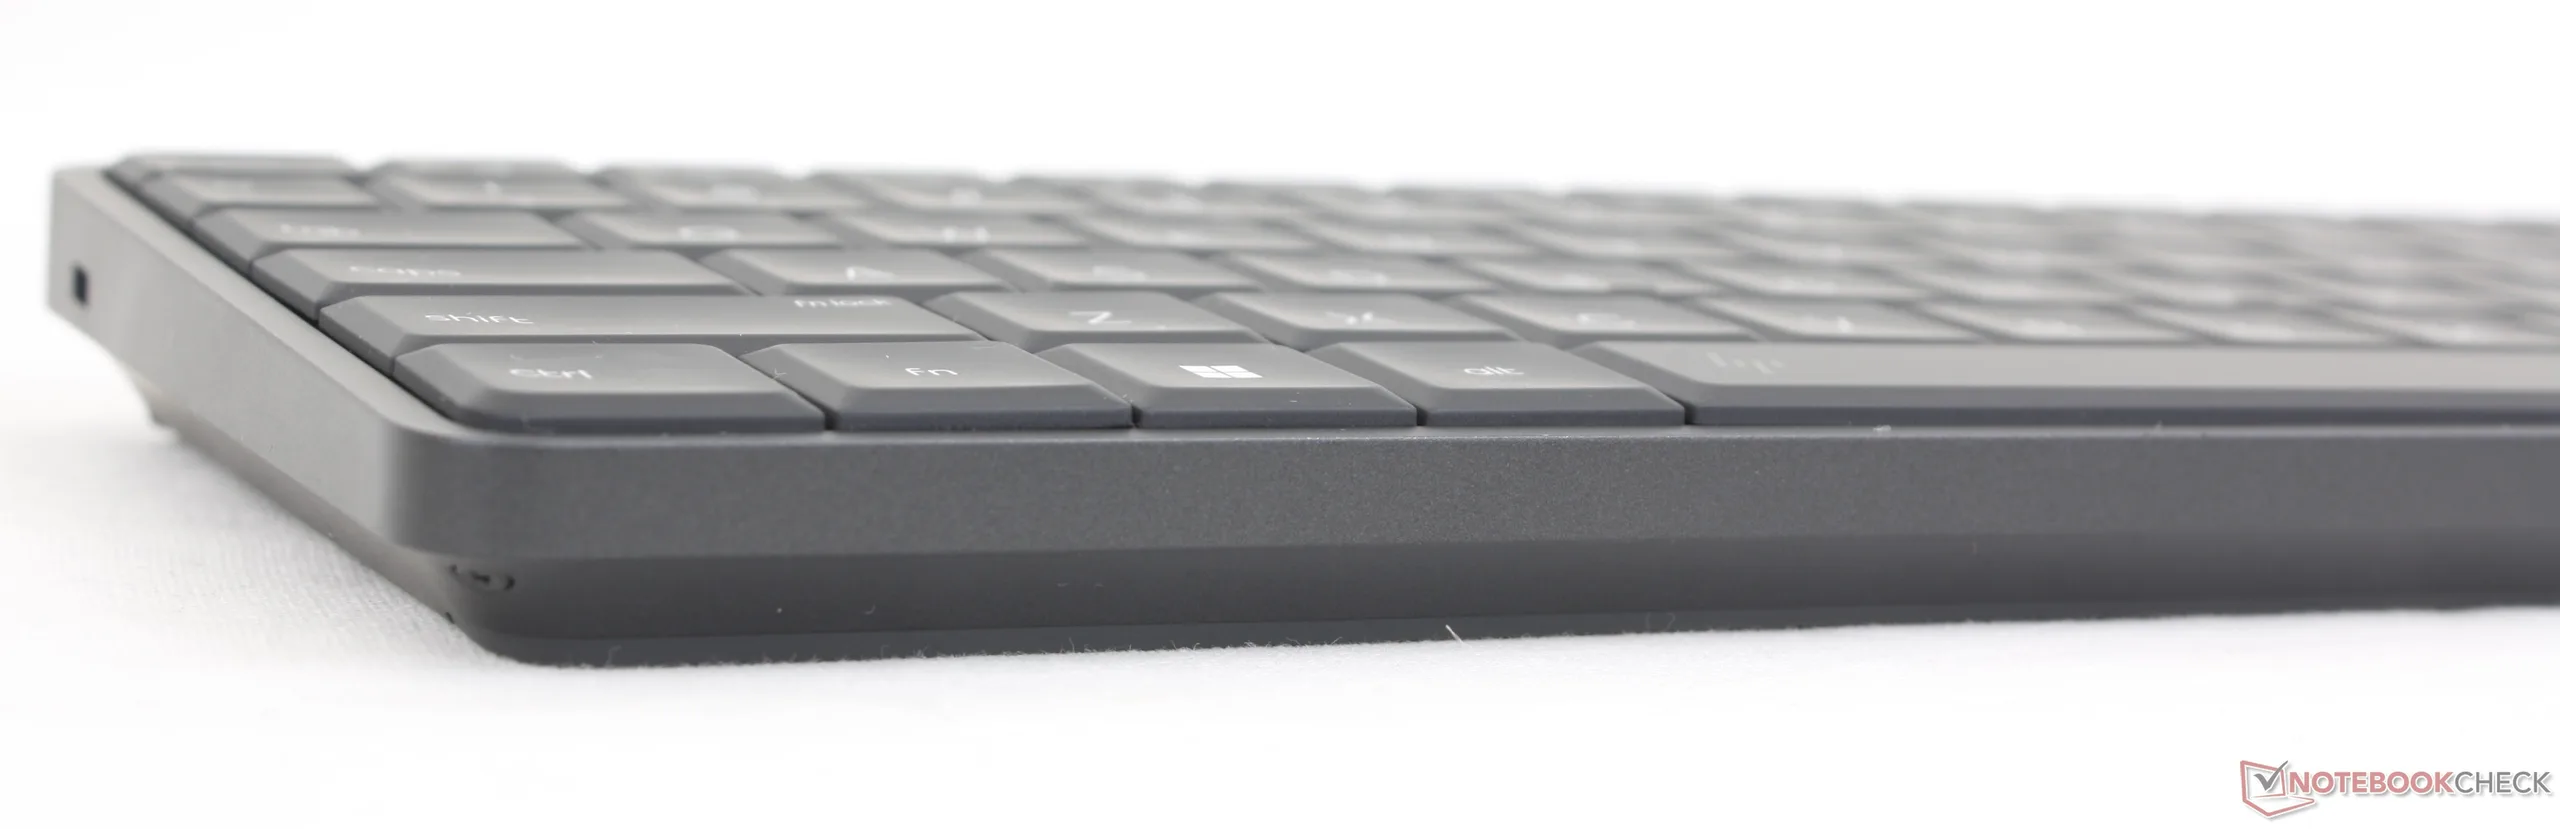
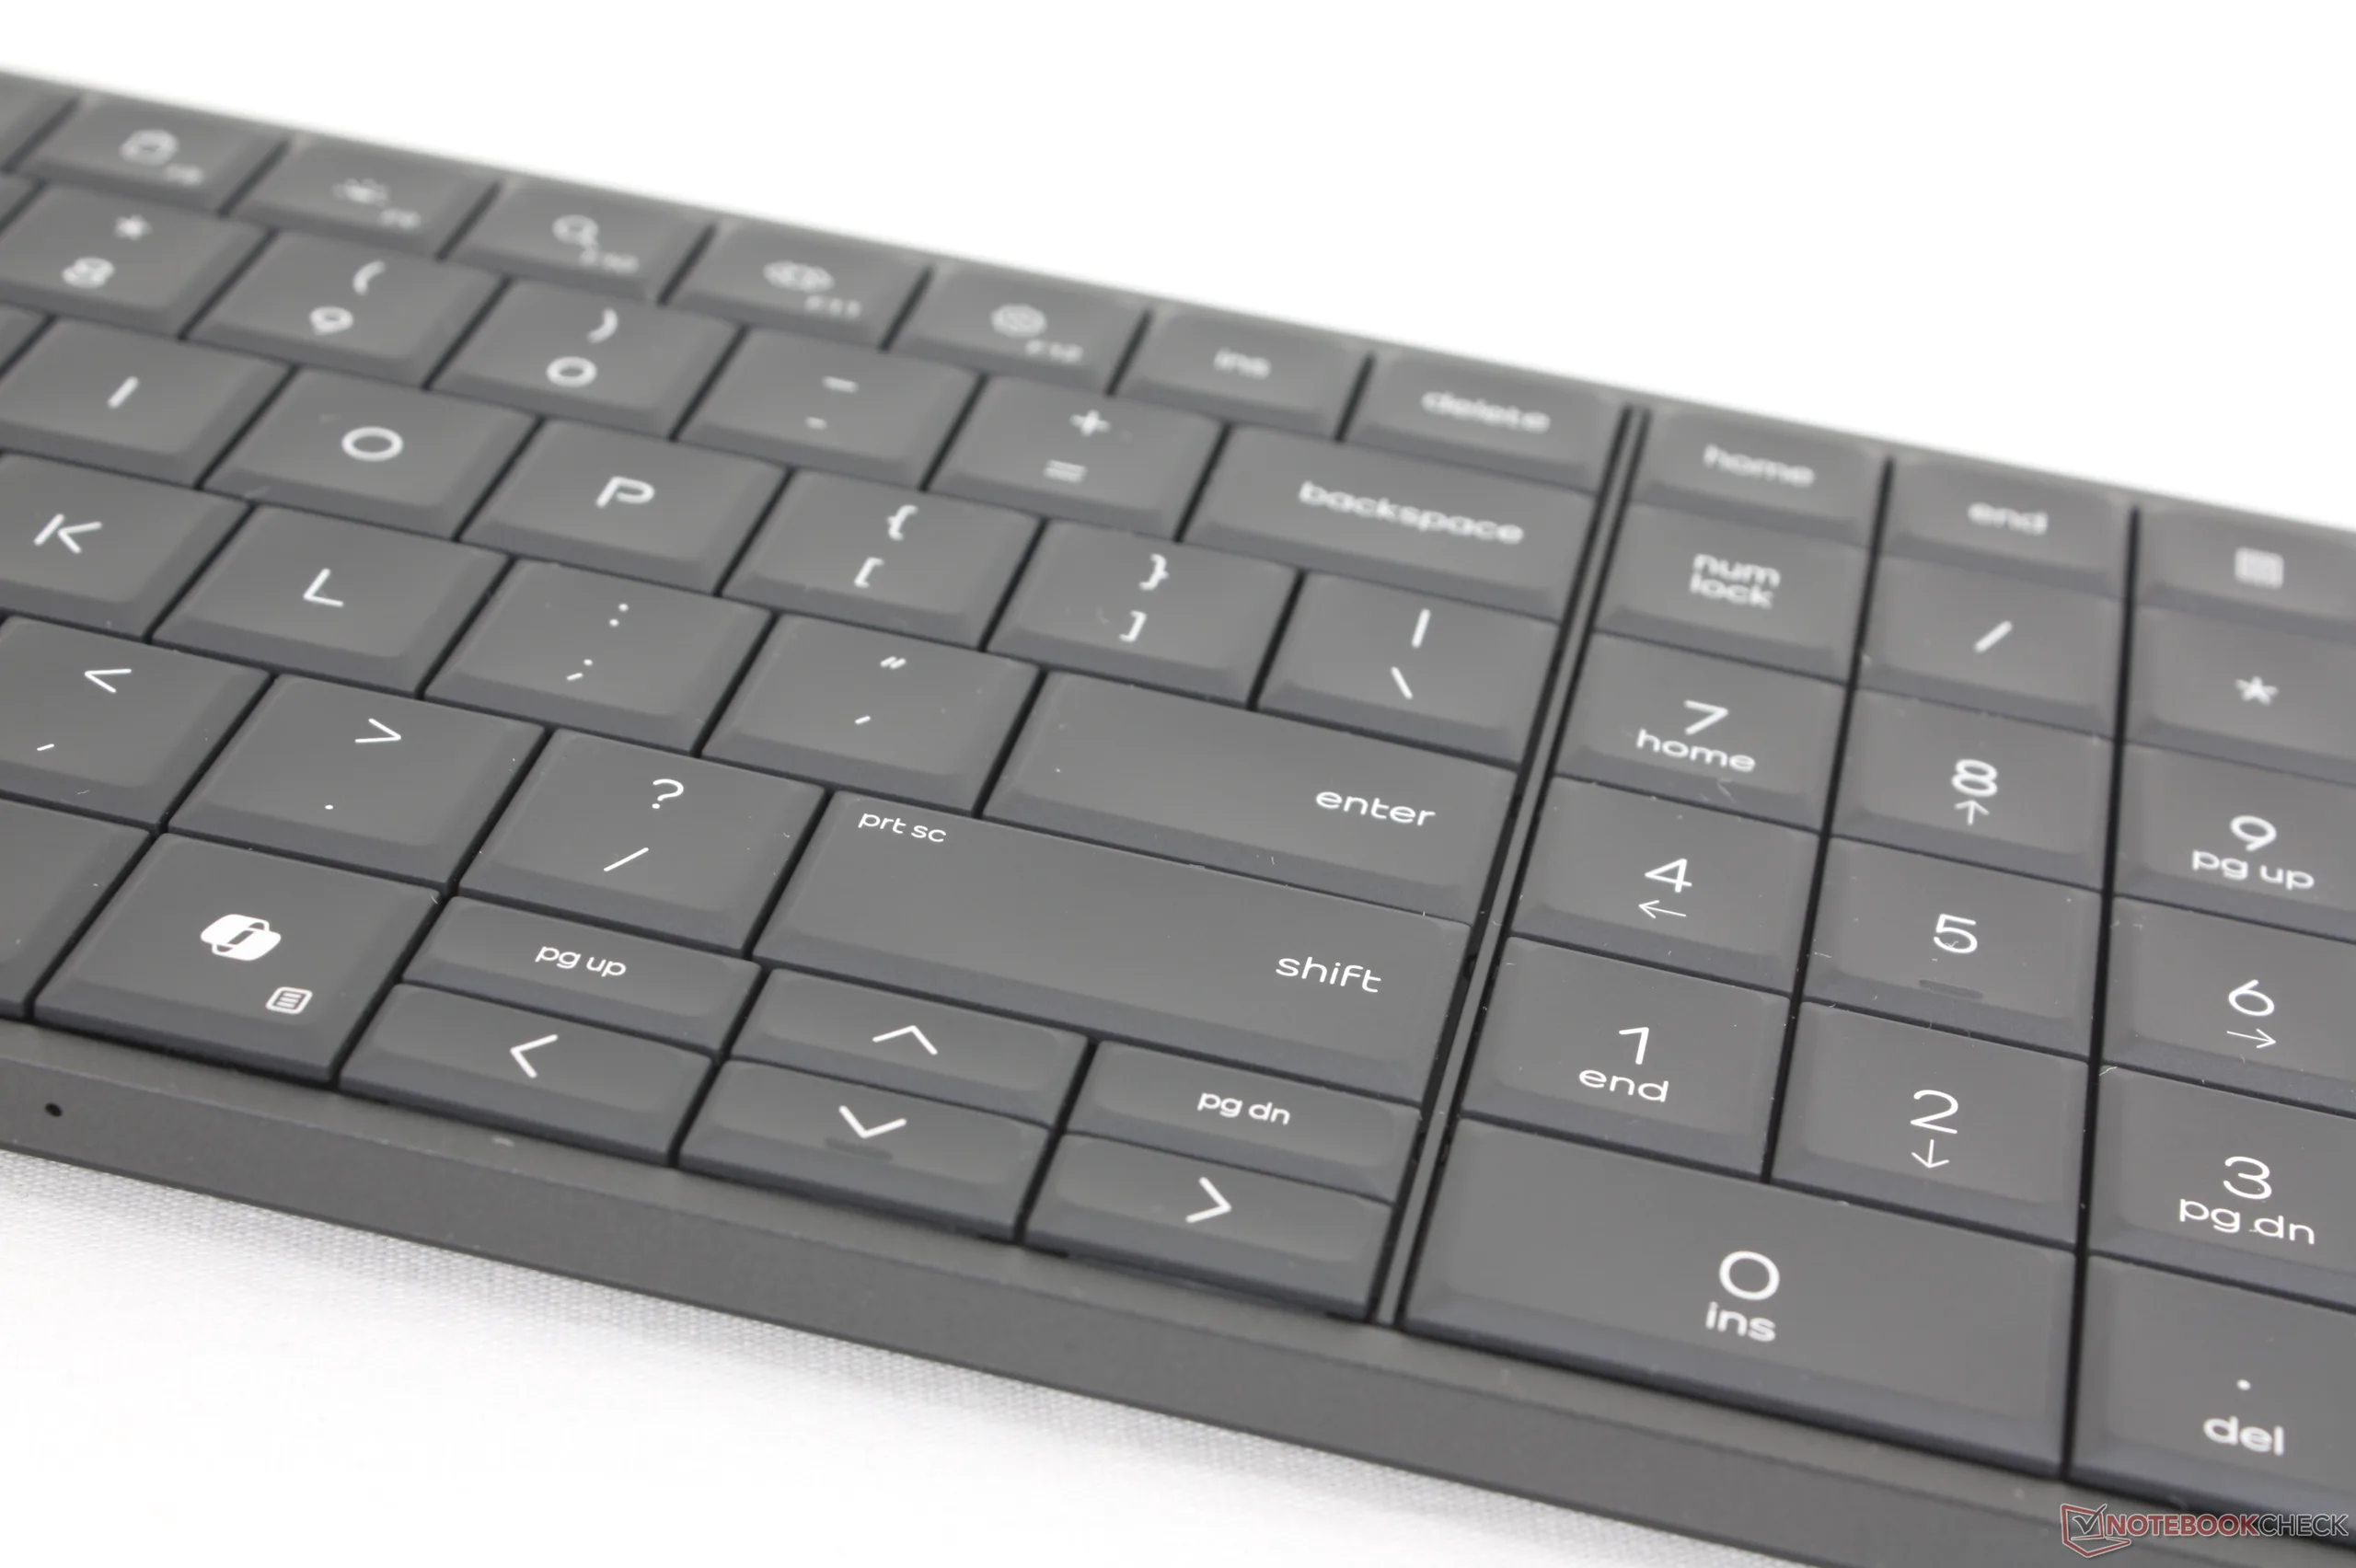
El recorrido de las teclas de 2 mm es más profundo que en la mayoría de los teclados de portátiles para una experiencia de escritura más cercana a la de un teclado de sobremesa típico. Aunque nos gusta la respuesta firme, el teclado numérico de tamaño completo y el repiqueteo de teclas especialmente silencioso, las teclas de dirección son más pequeñas que las de muchos portátiles. HP dice que esto se hizo a propósito para cumplir con las estrictas especificaciones de diseño.
Además, el teclado está "encadenado" al PC EliteBoard, lo que significa que no se puede utilizar para controlar ningún otro ordenador, a diferencia del teclado básico de sobremesa.
Rendimiento
Condiciones de prueba
Pusimos Windows en modo Rendimiento antes de ejecutar las pruebas comparativas que se indican a continuación.
Procesador
El Ryzen AI 5 PRO 340 tiene un rendimiento similar a los Lunar Lake Core Ultra 7 256V en términos de rendimiento bruto. Aunque no es especialmente rápido, es una mejora notable con respecto a las CPU más antiguas de la serie U como el Ryzen 5 7530U o el Core i7-1335U.
La actualización al Ryzen AI 7 PRO 350 se espera que mejore el rendimiento multihilo en torno a un 50 por ciento basándonos en nuestro tiempo con el Asus ExpertCenter debido al mayor número de núcleos físicos.
Bucle múltiple Cinebench R15
Cinebench R23: Multi Core | Single Core
Cinebench R20: CPU (Multi Core) | CPU (Single Core)
Cinebench R15: CPU Multi 64Bit | CPU Single 64Bit
Blender: v2.79 BMW27 CPU
7-Zip 18.03: 7z b 4 | 7z b 4 -mmt1
Geekbench 6.7: Multi-Core | Single-Core
Geekbench 5.5: Multi-Core | Single-Core
HWBOT x265 Benchmark v2.2: 4k Preset
LibreOffice : 20 Documents To PDF
R Benchmark 2.5: Overall mean
| CPU Performance rating | |
| Asus NUC 15 Pro+ | |
| Khadas Mind Pro | |
| Beelink GTI15 Ultra | |
| Asus ExpertCenter PN54-S70012NN | |
| Medio AMD Ryzen AI 5 PRO 340 | |
| HP EliteBoard G1a AI | |
| GMK NucBox K13 | |
| HP Pro Mini 400 G9-937U0EA | |
| MSI Cubi NUC AI+ 2MG | |
| Geekom A5 Pro | |
| Aoostar WTR Pro, N150 | |
| Cinebench R23 / Multi Core | |
| Asus NUC 15 Pro+ | |
| Khadas Mind Pro | |
| Beelink GTI15 Ultra | |
| Asus ExpertCenter PN54-S70012NN | |
| HP Pro Mini 400 G9-937U0EA | |
| HP EliteBoard G1a AI | |
| Medio AMD Ryzen AI 5 PRO 340 (n=1) | |
| GMK NucBox K13 | |
| MSI Cubi NUC AI+ 2MG | |
| Geekom A5 Pro | |
| Aoostar WTR Pro, N150 | |
| Cinebench R23 / Single Core | |
| Asus NUC 15 Pro+ | |
| Khadas Mind Pro | |
| Beelink GTI15 Ultra | |
| Asus ExpertCenter PN54-S70012NN | |
| MSI Cubi NUC AI+ 2MG | |
| GMK NucBox K13 | |
| HP Pro Mini 400 G9-937U0EA | |
| HP EliteBoard G1a AI | |
| Medio AMD Ryzen AI 5 PRO 340 (n=1) | |
| Geekom A5 Pro | |
| Aoostar WTR Pro, N150 | |
| Cinebench R20 / CPU (Multi Core) | |
| Asus NUC 15 Pro+ | |
| Khadas Mind Pro | |
| Beelink GTI15 Ultra | |
| Asus ExpertCenter PN54-S70012NN | |
| HP EliteBoard G1a AI | |
| Medio AMD Ryzen AI 5 PRO 340 (n=1) | |
| HP Pro Mini 400 G9-937U0EA | |
| GMK NucBox K13 | |
| MSI Cubi NUC AI+ 2MG | |
| Geekom A5 Pro | |
| Aoostar WTR Pro, N150 | |
| Cinebench R20 / CPU (Single Core) | |
| Asus NUC 15 Pro+ | |
| Beelink GTI15 Ultra | |
| Khadas Mind Pro | |
| Asus ExpertCenter PN54-S70012NN | |
| MSI Cubi NUC AI+ 2MG | |
| GMK NucBox K13 | |
| HP Pro Mini 400 G9-937U0EA | |
| HP EliteBoard G1a AI | |
| Medio AMD Ryzen AI 5 PRO 340 (n=1) | |
| Geekom A5 Pro | |
| Aoostar WTR Pro, N150 | |
| Cinebench R15 / CPU Multi 64Bit | |
| Asus NUC 15 Pro+ | |
| Khadas Mind Pro | |
| Asus ExpertCenter PN54-S70012NN | |
| Beelink GTI15 Ultra | |
| HP Pro Mini 400 G9-937U0EA | |
| HP EliteBoard G1a AI | |
| Medio AMD Ryzen AI 5 PRO 340 (n=1) | |
| GMK NucBox K13 | |
| MSI Cubi NUC AI+ 2MG | |
| Geekom A5 Pro | |
| Aoostar WTR Pro, N150 | |
| Cinebench R15 / CPU Single 64Bit | |
| Asus NUC 15 Pro+ | |
| Khadas Mind Pro | |
| Beelink GTI15 Ultra | |
| Asus ExpertCenter PN54-S70012NN | |
| MSI Cubi NUC AI+ 2MG | |
| GMK NucBox K13 | |
| HP EliteBoard G1a AI | |
| Medio AMD Ryzen AI 5 PRO 340 (n=1) | |
| HP Pro Mini 400 G9-937U0EA | |
| Geekom A5 Pro | |
| Aoostar WTR Pro, N150 | |
| Blender / v2.79 BMW27 CPU | |
| Aoostar WTR Pro, N150 | |
| Geekom A5 Pro | |
| MSI Cubi NUC AI+ 2MG | |
| GMK NucBox K13 | |
| HP Pro Mini 400 G9-937U0EA | |
| HP EliteBoard G1a AI | |
| Medio AMD Ryzen AI 5 PRO 340 (n=1) | |
| Asus ExpertCenter PN54-S70012NN | |
| Beelink GTI15 Ultra | |
| Khadas Mind Pro | |
| Asus NUC 15 Pro+ | |
| 7-Zip 18.03 / 7z b 4 | |
| Asus NUC 15 Pro+ | |
| Khadas Mind Pro | |
| Beelink GTI15 Ultra | |
| Asus ExpertCenter PN54-S70012NN | |
| HP Pro Mini 400 G9-937U0EA | |
| HP EliteBoard G1a AI | |
| Medio AMD Ryzen AI 5 PRO 340 (n=1) | |
| GMK NucBox K13 | |
| Geekom A5 Pro | |
| MSI Cubi NUC AI+ 2MG | |
| Aoostar WTR Pro, N150 | |
| 7-Zip 18.03 / 7z b 4 -mmt1 | |
| Khadas Mind Pro | |
| Beelink GTI15 Ultra | |
| Asus NUC 15 Pro+ | |
| HP Pro Mini 400 G9-937U0EA | |
| MSI Cubi NUC AI+ 2MG | |
| GMK NucBox K13 | |
| HP EliteBoard G1a AI | |
| Medio AMD Ryzen AI 5 PRO 340 (n=1) | |
| Asus ExpertCenter PN54-S70012NN | |
| Geekom A5 Pro | |
| Aoostar WTR Pro, N150 | |
| Geekbench 6.7 / Multi-Core | |
| Asus NUC 15 Pro+ | |
| Khadas Mind Pro | |
| Beelink GTI15 Ultra | |
| Asus ExpertCenter PN54-S70012NN | |
| Medio AMD Ryzen AI 5 PRO 340 (11409 - 11455, n=2) | |
| HP EliteBoard G1a AI | |
| GMK NucBox K13 | |
| HP Pro Mini 400 G9-937U0EA | |
| MSI Cubi NUC AI+ 2MG | |
| Geekom A5 Pro | |
| Aoostar WTR Pro, N150 | |
| Geekbench 6.7 / Single-Core | |
| Beelink GTI15 Ultra | |
| Asus ExpertCenter PN54-S70012NN | |
| Khadas Mind Pro | |
| GMK NucBox K13 | |
| MSI Cubi NUC AI+ 2MG | |
| Medio AMD Ryzen AI 5 PRO 340 (2640 - 2771, n=2) | |
| Asus NUC 15 Pro+ | |
| HP EliteBoard G1a AI | |
| HP Pro Mini 400 G9-937U0EA | |
| Geekom A5 Pro | |
| Aoostar WTR Pro, N150 | |
| Geekbench 5.5 / Multi-Core | |
| Khadas Mind Pro | |
| Asus NUC 15 Pro+ | |
| Beelink GTI15 Ultra | |
| Asus ExpertCenter PN54-S70012NN | |
| HP EliteBoard G1a AI | |
| Medio AMD Ryzen AI 5 PRO 340 (n=1) | |
| HP Pro Mini 400 G9-937U0EA | |
| GMK NucBox K13 | |
| MSI Cubi NUC AI+ 2MG | |
| Geekom A5 Pro | |
| Aoostar WTR Pro, N150 | |
| Geekbench 5.5 / Single-Core | |
| Beelink GTI15 Ultra | |
| Khadas Mind Pro | |
| Asus ExpertCenter PN54-S70012NN | |
| MSI Cubi NUC AI+ 2MG | |
| GMK NucBox K13 | |
| HP EliteBoard G1a AI | |
| Medio AMD Ryzen AI 5 PRO 340 (n=1) | |
| HP Pro Mini 400 G9-937U0EA | |
| Asus NUC 15 Pro+ | |
| Geekom A5 Pro | |
| Aoostar WTR Pro, N150 | |
| HWBOT x265 Benchmark v2.2 / 4k Preset | |
| Asus NUC 15 Pro+ | |
| Khadas Mind Pro | |
| Beelink GTI15 Ultra | |
| Asus ExpertCenter PN54-S70012NN | |
| HP EliteBoard G1a AI | |
| Medio AMD Ryzen AI 5 PRO 340 (n=1) | |
| GMK NucBox K13 | |
| MSI Cubi NUC AI+ 2MG | |
| HP Pro Mini 400 G9-937U0EA | |
| Geekom A5 Pro | |
| Aoostar WTR Pro, N150 | |
| LibreOffice / 20 Documents To PDF | |
| Aoostar WTR Pro, N150 | |
| HP EliteBoard G1a AI | |
| Medio AMD Ryzen AI 5 PRO 340 (n=1) | |
| Geekom A5 Pro | |
| Asus NUC 15 Pro+ | |
| GMK NucBox K13 | |
| Asus ExpertCenter PN54-S70012NN | |
| HP Pro Mini 400 G9-937U0EA | |
| Khadas Mind Pro | |
| MSI Cubi NUC AI+ 2MG | |
| Beelink GTI15 Ultra | |
| R Benchmark 2.5 / Overall mean | |
| Aoostar WTR Pro, N150 | |
| Geekom A5 Pro | |
| MSI Cubi NUC AI+ 2MG | |
| HP EliteBoard G1a AI | |
| Medio AMD Ryzen AI 5 PRO 340 (n=1) | |
| GMK NucBox K13 | |
| HP Pro Mini 400 G9-937U0EA | |
| Asus NUC 15 Pro+ | |
| Beelink GTI15 Ultra | |
| Khadas Mind Pro | |
| Khadas Mind Pro | |
| Asus ExpertCenter PN54-S70012NN | |
* ... más pequeño es mejor
AIDA64: FP32 Ray-Trace | FPU Julia | CPU SHA3 | CPU Queen | FPU SinJulia | FPU Mandel | CPU AES | CPU ZLib | FP64 Ray-Trace | CPU PhotoWorxx | CPU CheckMate
| Performance rating | |
| Asus NUC 15 Pro+ -1! | |
| HP EliteBoard G1a AI -1! | |
| Medio AMD Ryzen AI 5 PRO 340 -1! | |
| GMK NucBox K13 -1! | |
| HP Pro Mini 400 G9-937U0EA -1! | |
| MSI Cubi NUC AI+ 2MG -1! | |
| Geekom A5 Pro | |
| AIDA64 / FP32 Ray-Trace | |
| Asus NUC 15 Pro+ (v6.92.6600) | |
| HP EliteBoard G1a AI (v8.20.8100) | |
| Medio AMD Ryzen AI 5 PRO 340 (n=1) | |
| GMK NucBox K13 (v8.20.8100) | |
| MSI Cubi NUC AI+ 2MG (v6.92.6600) | |
| HP Pro Mini 400 G9-937U0EA (v6.92.6600) | |
| Geekom A5 Pro (v8.20.8100) | |
| Geekom A5 Pro (v6.92.6600) | |
| AIDA64 / FPU Julia | |
| Asus NUC 15 Pro+ (v6.92.6600) | |
| HP EliteBoard G1a AI (v8.20.8100) | |
| Medio AMD Ryzen AI 5 PRO 340 (n=1) | |
| GMK NucBox K13 (v8.20.8100) | |
| MSI Cubi NUC AI+ 2MG (v6.92.6600) | |
| HP Pro Mini 400 G9-937U0EA (v6.92.6600) | |
| Geekom A5 Pro (v8.20.8100) | |
| Geekom A5 Pro (v6.92.6600) | |
| AIDA64 / CPU SHA3 | |
| Asus NUC 15 Pro+ (v6.92.6600) | |
| GMK NucBox K13 (v8.20.8100) | |
| MSI Cubi NUC AI+ 2MG (v6.92.6600) | |
| HP Pro Mini 400 G9-937U0EA (v6.92.6600) | |
| HP EliteBoard G1a AI (v8.20.8100) | |
| Medio AMD Ryzen AI 5 PRO 340 (n=1) | |
| Geekom A5 Pro (v6.92.6600) | |
| Geekom A5 Pro (v8.20.8100) | |
| AIDA64 / CPU Queen | |
| HP Pro Mini 400 G9-937U0EA (v6.92.6600) | |
| Asus NUC 15 Pro+ (v6.92.6600) | |
| Geekom A5 Pro (v6.92.6600) | |
| MSI Cubi NUC AI+ 2MG (v6.92.6600) | |
| AIDA64 / FPU SinJulia | |
| HP EliteBoard G1a AI (v8.20.8100) | |
| Medio AMD Ryzen AI 5 PRO 340 (n=1) | |
| Asus NUC 15 Pro+ (v6.92.6600) | |
| Geekom A5 Pro (v6.92.6600) | |
| Geekom A5 Pro (v8.20.8100) | |
| HP Pro Mini 400 G9-937U0EA (v6.92.6600) | |
| GMK NucBox K13 (v8.20.8100) | |
| MSI Cubi NUC AI+ 2MG (v6.92.6600) | |
| AIDA64 / FPU Mandel | |
| Asus NUC 15 Pro+ (v6.92.6600) | |
| HP EliteBoard G1a AI (v8.20.8100) | |
| Medio AMD Ryzen AI 5 PRO 340 (n=1) | |
| GMK NucBox K13 (v8.20.8100) | |
| MSI Cubi NUC AI+ 2MG (v6.92.6600) | |
| Geekom A5 Pro (v6.92.6600) | |
| Geekom A5 Pro (v8.20.8100) | |
| HP Pro Mini 400 G9-937U0EA (v6.92.6600) | |
| AIDA64 / CPU AES | |
| Asus NUC 15 Pro+ (v6.92.6600) | |
| GMK NucBox K13 (v8.20.8100) | |
| HP Pro Mini 400 G9-937U0EA (v6.92.6600) | |
| HP EliteBoard G1a AI (v8.20.8100) | |
| Medio AMD Ryzen AI 5 PRO 340 (n=1) | |
| MSI Cubi NUC AI+ 2MG (v6.92.6600) | |
| Geekom A5 Pro (v6.92.6600) | |
| Geekom A5 Pro (v8.20.8100) | |
| AIDA64 / CPU ZLib | |
| Asus NUC 15 Pro+ (v6.92.6600) | |
| HP Pro Mini 400 G9-937U0EA (v6.92.6600) | |
| HP EliteBoard G1a AI (v8.20.8100) | |
| Medio AMD Ryzen AI 5 PRO 340 (n=1) | |
| GMK NucBox K13 (v8.20.8100) | |
| MSI Cubi NUC AI+ 2MG (v6.92.6600) | |
| Geekom A5 Pro (v6.92.6600) | |
| Geekom A5 Pro (v8.20.8100) | |
| AIDA64 / FP64 Ray-Trace | |
| Asus NUC 15 Pro+ (v6.92.6600) | |
| HP EliteBoard G1a AI (v8.20.8100) | |
| Medio AMD Ryzen AI 5 PRO 340 (n=1) | |
| GMK NucBox K13 (v8.20.8100) | |
| MSI Cubi NUC AI+ 2MG (v6.92.6600) | |
| HP Pro Mini 400 G9-937U0EA (v6.92.6600) | |
| Geekom A5 Pro (v8.20.8100) | |
| Geekom A5 Pro (v6.92.6600) | |
| AIDA64 / CPU PhotoWorxx | |
| GMK NucBox K13 (v8.20.8100) | |
| Asus NUC 15 Pro+ (v6.92.6600) | |
| MSI Cubi NUC AI+ 2MG (v6.92.6600) | |
| HP EliteBoard G1a AI (v8.20.8100) | |
| Medio AMD Ryzen AI 5 PRO 340 (n=1) | |
| HP Pro Mini 400 G9-937U0EA (v6.92.6600) | |
| Geekom A5 Pro (v6.92.6600) | |
| Geekom A5 Pro (v8.20.8100) | |
| AIDA64 / CPU CheckMate | |
| HP EliteBoard G1a AI (v8.20.8100) | |
| Medio AMD Ryzen AI 5 PRO 340 (n=1) | |
| GMK NucBox K13 (v8.20.8100) | |
| Geekom A5 Pro (v8.20.8100) | |
Rendimiento del sistema
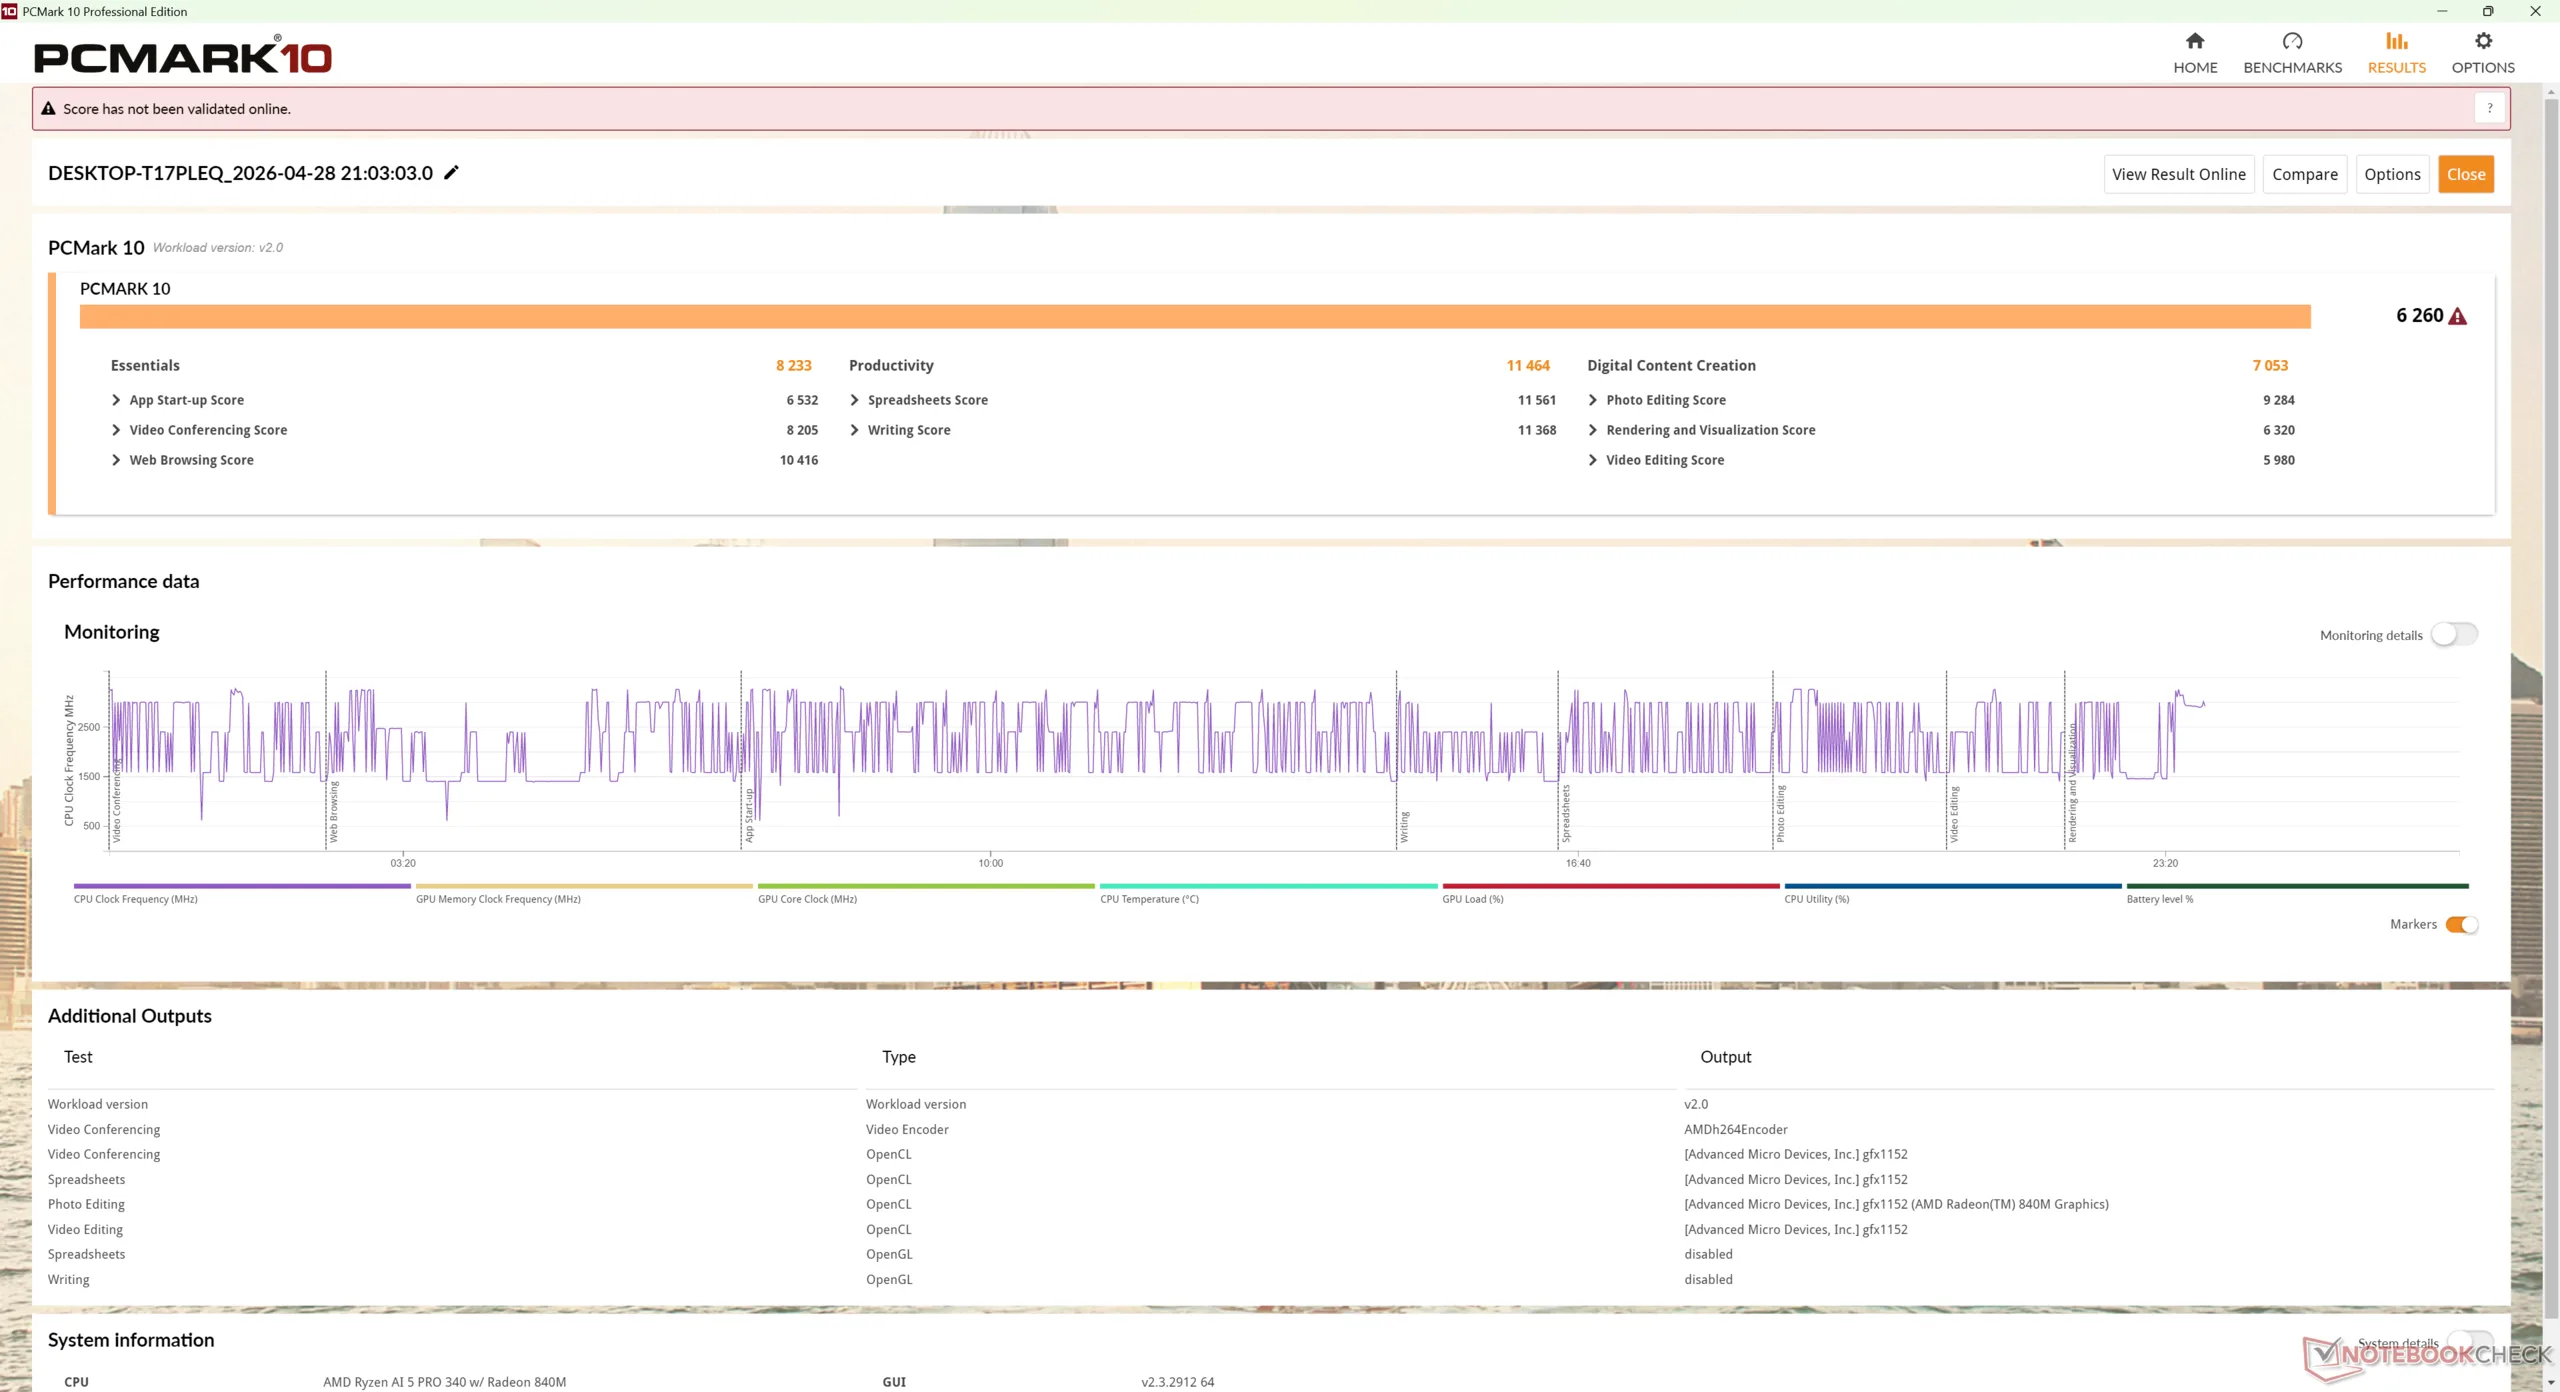
PCMark 10: Score | Essentials | Productivity | Digital Content Creation
CrossMark: Overall | Productivity | Creativity | Responsiveness
WebXPRT 3: Overall
WebXPRT 4: Overall
Mozilla Kraken 1.1: Total
Geekbench AI: Quantized GPU 1.7 | Half Precision GPU 1.7 | Single Precision GPU 1.7
| Performance rating | |
| MSI Cubi NUC AI+ 2MG | |
| GMK NucBox K13 | |
| Asus NUC 15 Pro+ | |
| HP EliteBoard G1a AI | |
| Medio AMD Ryzen AI 5 PRO 340, AMD Radeon 840M | |
| HP Pro Mini 400 G9-937U0EA -3! | |
| Geekom A5 Pro | |
| PCMark 10 / Score | |
| GMK NucBox K13 | |
| Asus NUC 15 Pro+ | |
| MSI Cubi NUC AI+ 2MG | |
| HP EliteBoard G1a AI | |
| Medio AMD Ryzen AI 5 PRO 340, AMD Radeon 840M (n=1) | |
| Geekom A5 Pro | |
| HP Pro Mini 400 G9-937U0EA | |
| PCMark 10 / Essentials | |
| MSI Cubi NUC AI+ 2MG | |
| GMK NucBox K13 | |
| Asus NUC 15 Pro+ | |
| HP Pro Mini 400 G9-937U0EA | |
| Geekom A5 Pro | |
| HP EliteBoard G1a AI | |
| Medio AMD Ryzen AI 5 PRO 340, AMD Radeon 840M (n=1) | |
| PCMark 10 / Productivity | |
| Geekom A5 Pro | |
| GMK NucBox K13 | |
| HP EliteBoard G1a AI | |
| Medio AMD Ryzen AI 5 PRO 340, AMD Radeon 840M (n=1) | |
| MSI Cubi NUC AI+ 2MG | |
| Asus NUC 15 Pro+ | |
| HP Pro Mini 400 G9-937U0EA | |
| PCMark 10 / Digital Content Creation | |
| Asus NUC 15 Pro+ | |
| GMK NucBox K13 | |
| MSI Cubi NUC AI+ 2MG | |
| HP EliteBoard G1a AI | |
| Medio AMD Ryzen AI 5 PRO 340, AMD Radeon 840M (n=1) | |
| HP Pro Mini 400 G9-937U0EA | |
| Geekom A5 Pro | |
| CrossMark / Overall | |
| Asus NUC 15 Pro+ | |
| GMK NucBox K13 | |
| HP EliteBoard G1a AI | |
| Medio AMD Ryzen AI 5 PRO 340, AMD Radeon 840M (n=1) | |
| MSI Cubi NUC AI+ 2MG | |
| HP Pro Mini 400 G9-937U0EA | |
| Geekom A5 Pro | |
| CrossMark / Productivity | |
| GMK NucBox K13 | |
| Asus NUC 15 Pro+ | |
| HP EliteBoard G1a AI | |
| Medio AMD Ryzen AI 5 PRO 340, AMD Radeon 840M (n=1) | |
| MSI Cubi NUC AI+ 2MG | |
| HP Pro Mini 400 G9-937U0EA | |
| Geekom A5 Pro | |
| CrossMark / Creativity | |
| Asus NUC 15 Pro+ | |
| HP EliteBoard G1a AI | |
| Medio AMD Ryzen AI 5 PRO 340, AMD Radeon 840M (n=1) | |
| GMK NucBox K13 | |
| MSI Cubi NUC AI+ 2MG | |
| HP Pro Mini 400 G9-937U0EA | |
| Geekom A5 Pro | |
| CrossMark / Responsiveness | |
| GMK NucBox K13 | |
| Asus NUC 15 Pro+ | |
| HP EliteBoard G1a AI | |
| Medio AMD Ryzen AI 5 PRO 340, AMD Radeon 840M (n=1) | |
| MSI Cubi NUC AI+ 2MG | |
| HP Pro Mini 400 G9-937U0EA | |
| Geekom A5 Pro | |
| WebXPRT 3 / Overall | |
| HP EliteBoard G1a AI | |
| Medio AMD Ryzen AI 5 PRO 340, AMD Radeon 840M (n=1) | |
| MSI Cubi NUC AI+ 2MG | |
| GMK NucBox K13 | |
| HP Pro Mini 400 G9-937U0EA | |
| Geekom A5 Pro | |
| Asus NUC 15 Pro+ | |
| WebXPRT 4 / Overall | |
| GMK NucBox K13 | |
| MSI Cubi NUC AI+ 2MG | |
| HP EliteBoard G1a AI | |
| Medio AMD Ryzen AI 5 PRO 340, AMD Radeon 840M (n=1) | |
| HP Pro Mini 400 G9-937U0EA | |
| Asus NUC 15 Pro+ | |
| Geekom A5 Pro | |
| Mozilla Kraken 1.1 / Total | |
| Geekom A5 Pro | |
| HP Pro Mini 400 G9-937U0EA | |
| MSI Cubi NUC AI+ 2MG | |
| HP EliteBoard G1a AI | |
| Medio AMD Ryzen AI 5 PRO 340, AMD Radeon 840M (n=1) | |
| Asus NUC 15 Pro+ | |
| GMK NucBox K13 | |
| Geekbench AI / Quantized GPU 1.7 | |
| MSI Cubi NUC AI+ 2MG | |
| Asus NUC 15 Pro+ | |
| GMK NucBox K13 | |
| HP EliteBoard G1a AI | |
| Medio AMD Ryzen AI 5 PRO 340, AMD Radeon 840M (n=1) | |
| Geekom A5 Pro | |
| Geekbench AI / Half Precision GPU 1.7 | |
| MSI Cubi NUC AI+ 2MG | |
| Asus NUC 15 Pro+ | |
| GMK NucBox K13 | |
| HP EliteBoard G1a AI | |
| Medio AMD Ryzen AI 5 PRO 340, AMD Radeon 840M (n=1) | |
| Geekom A5 Pro | |
| Geekbench AI / Single Precision GPU 1.7 | |
| MSI Cubi NUC AI+ 2MG | |
| Asus NUC 15 Pro+ | |
| GMK NucBox K13 | |
| HP EliteBoard G1a AI | |
| Medio AMD Ryzen AI 5 PRO 340, AMD Radeon 840M (n=1) | |
| Geekom A5 Pro | |
* ... más pequeño es mejor
| PCMark 10 Score | 6260 puntos | |
ayuda | ||
| AIDA64 / Memory Copy | |
| MSI Cubi NUC AI+ 2MG | |
| GMK NucBox K13 | |
| Asus NUC 15 Pro+ | |
| HP EliteBoard G1a AI | |
| Medio AMD Ryzen AI 5 PRO 340 (n=1) | |
| Geekom A5 Pro | |
| Geekom A5 Pro | |
| HP Pro Mini 400 G9-937U0EA | |
| AIDA64 / Memory Read | |
| GMK NucBox K13 | |
| Asus NUC 15 Pro+ | |
| MSI Cubi NUC AI+ 2MG | |
| HP EliteBoard G1a AI | |
| Medio AMD Ryzen AI 5 PRO 340 (n=1) | |
| Geekom A5 Pro | |
| Geekom A5 Pro | |
| HP Pro Mini 400 G9-937U0EA | |
| AIDA64 / Memory Write | |
| MSI Cubi NUC AI+ 2MG | |
| GMK NucBox K13 | |
| HP EliteBoard G1a AI | |
| Medio AMD Ryzen AI 5 PRO 340 (n=1) | |
| Asus NUC 15 Pro+ | |
| Geekom A5 Pro | |
| Geekom A5 Pro | |
| HP Pro Mini 400 G9-937U0EA | |
| AIDA64 / Memory Latency | |
| HP EliteBoard G1a AI | |
| Medio AMD Ryzen AI 5 PRO 340 (n=1) | |
| Asus NUC 15 Pro+ | |
| GMK NucBox K13 | |
| Geekom A5 Pro | |
| Geekom A5 Pro | |
| MSI Cubi NUC AI+ 2MG | |
| HP Pro Mini 400 G9-937U0EA | |
* ... más pequeño es mejor
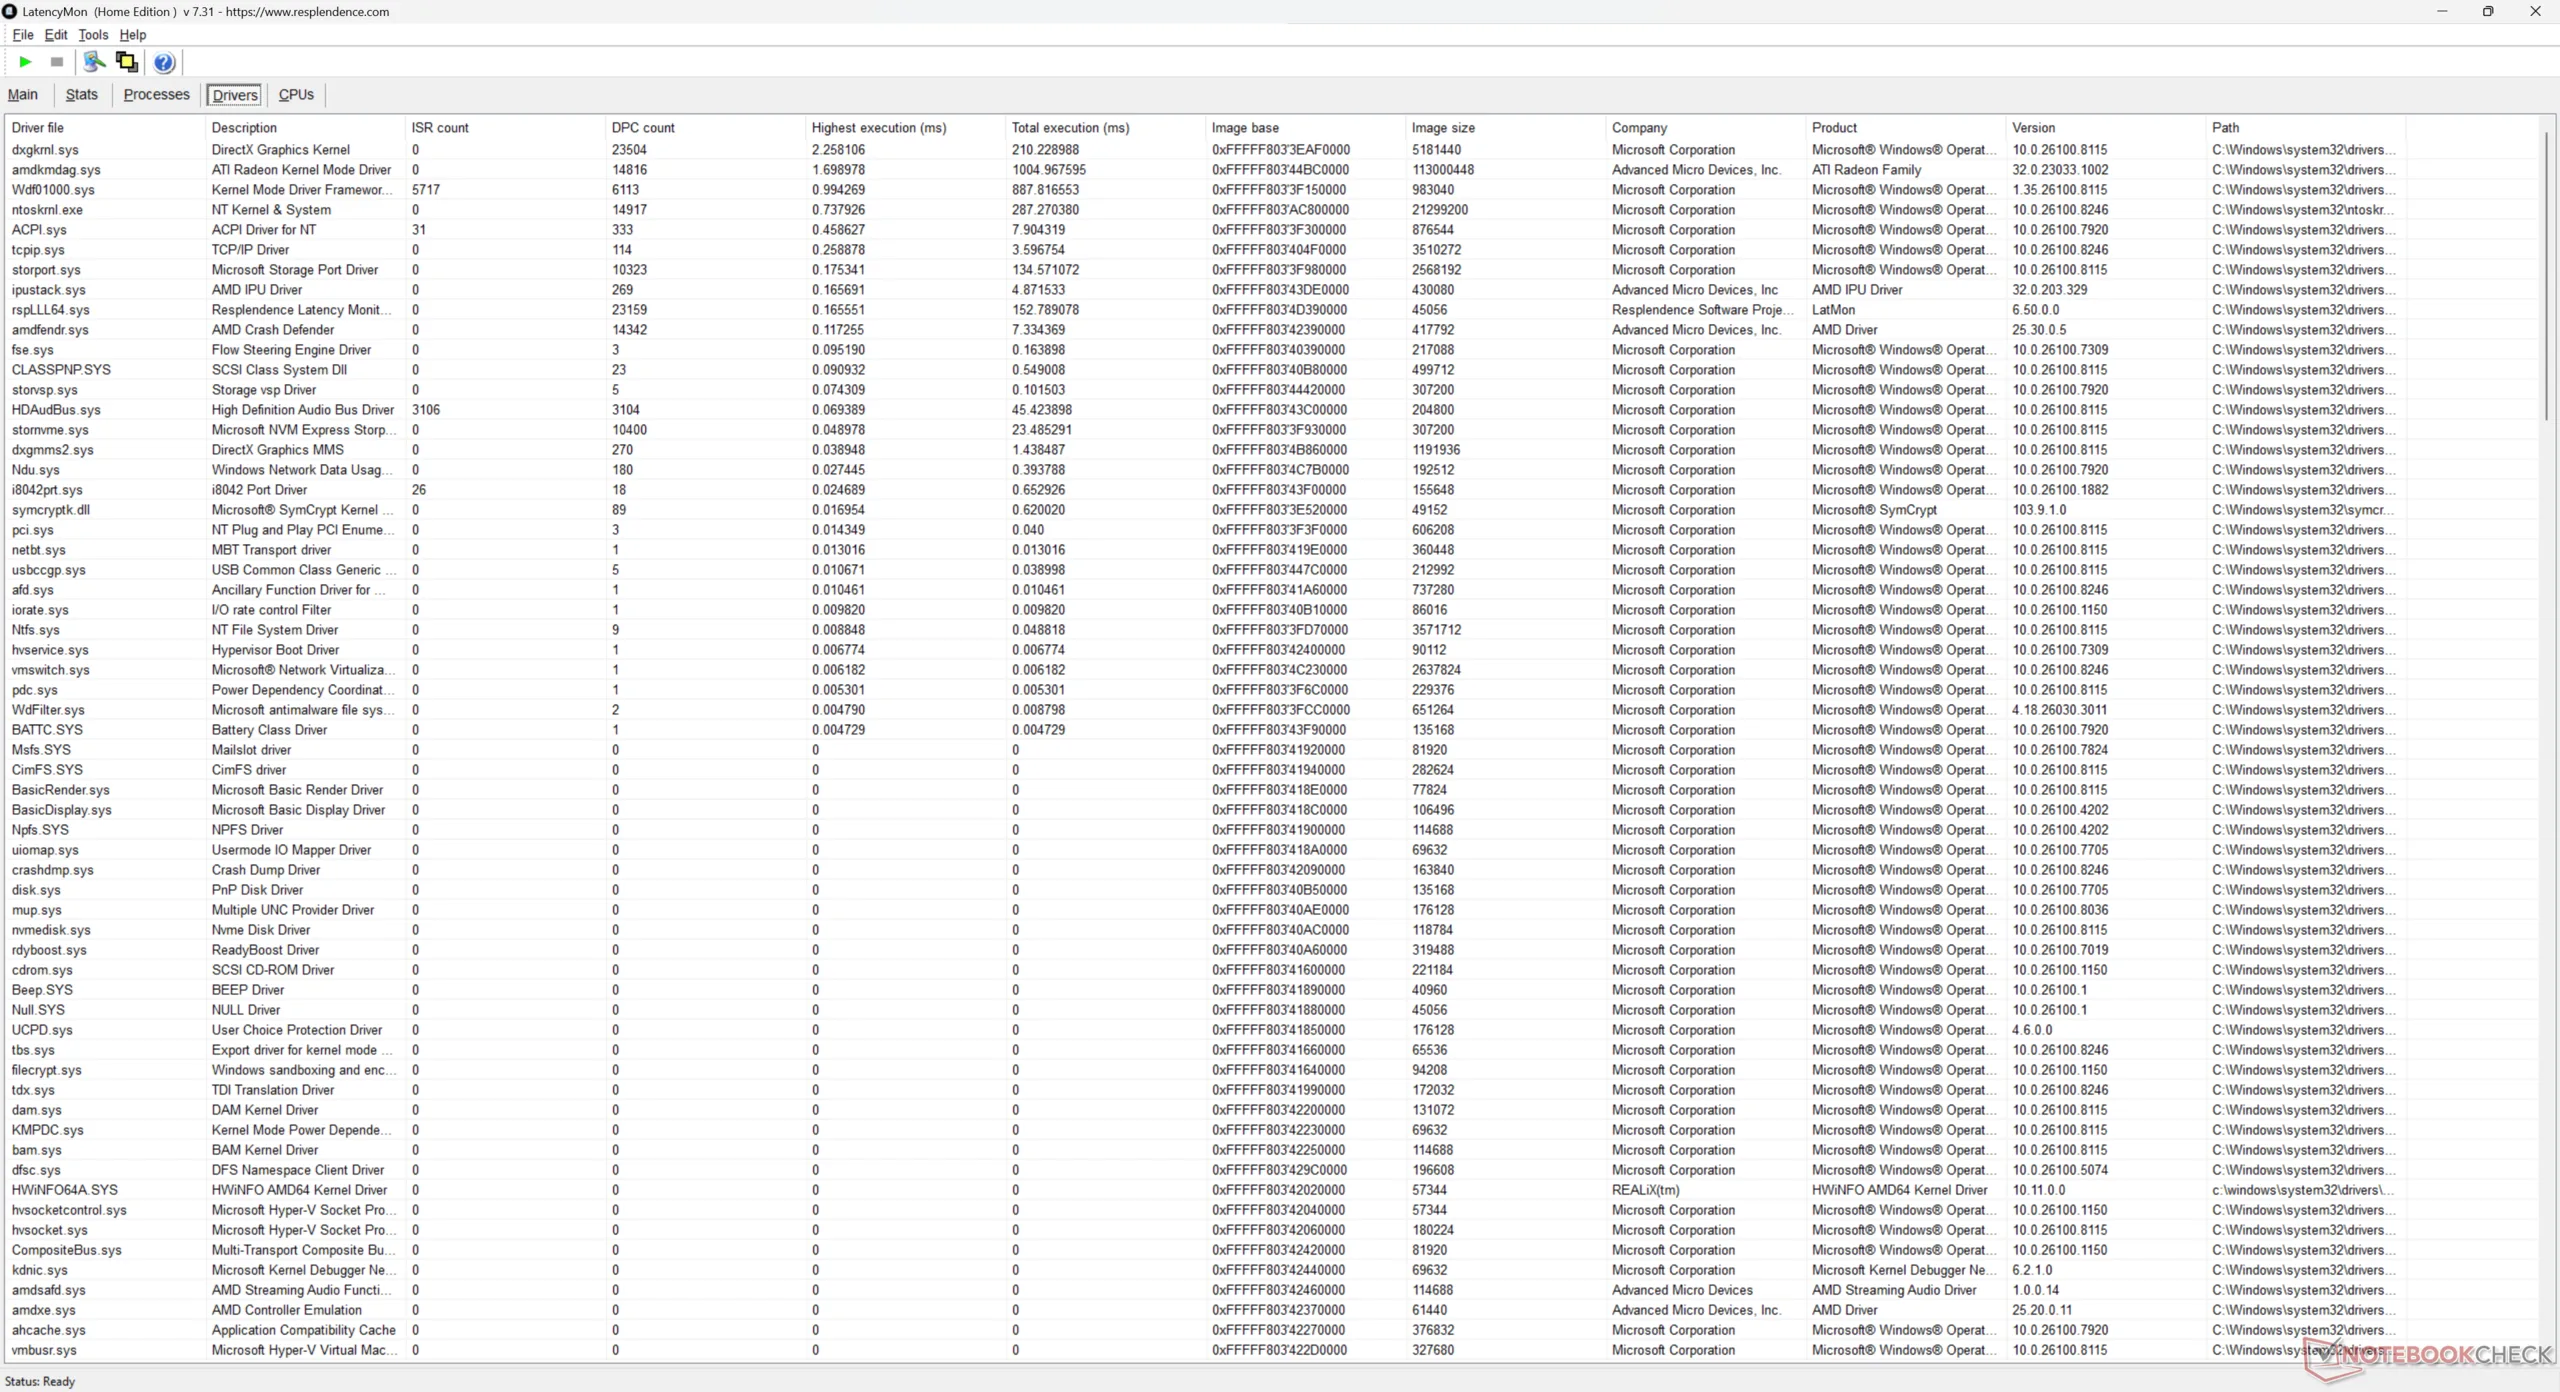
Latencia del CPD
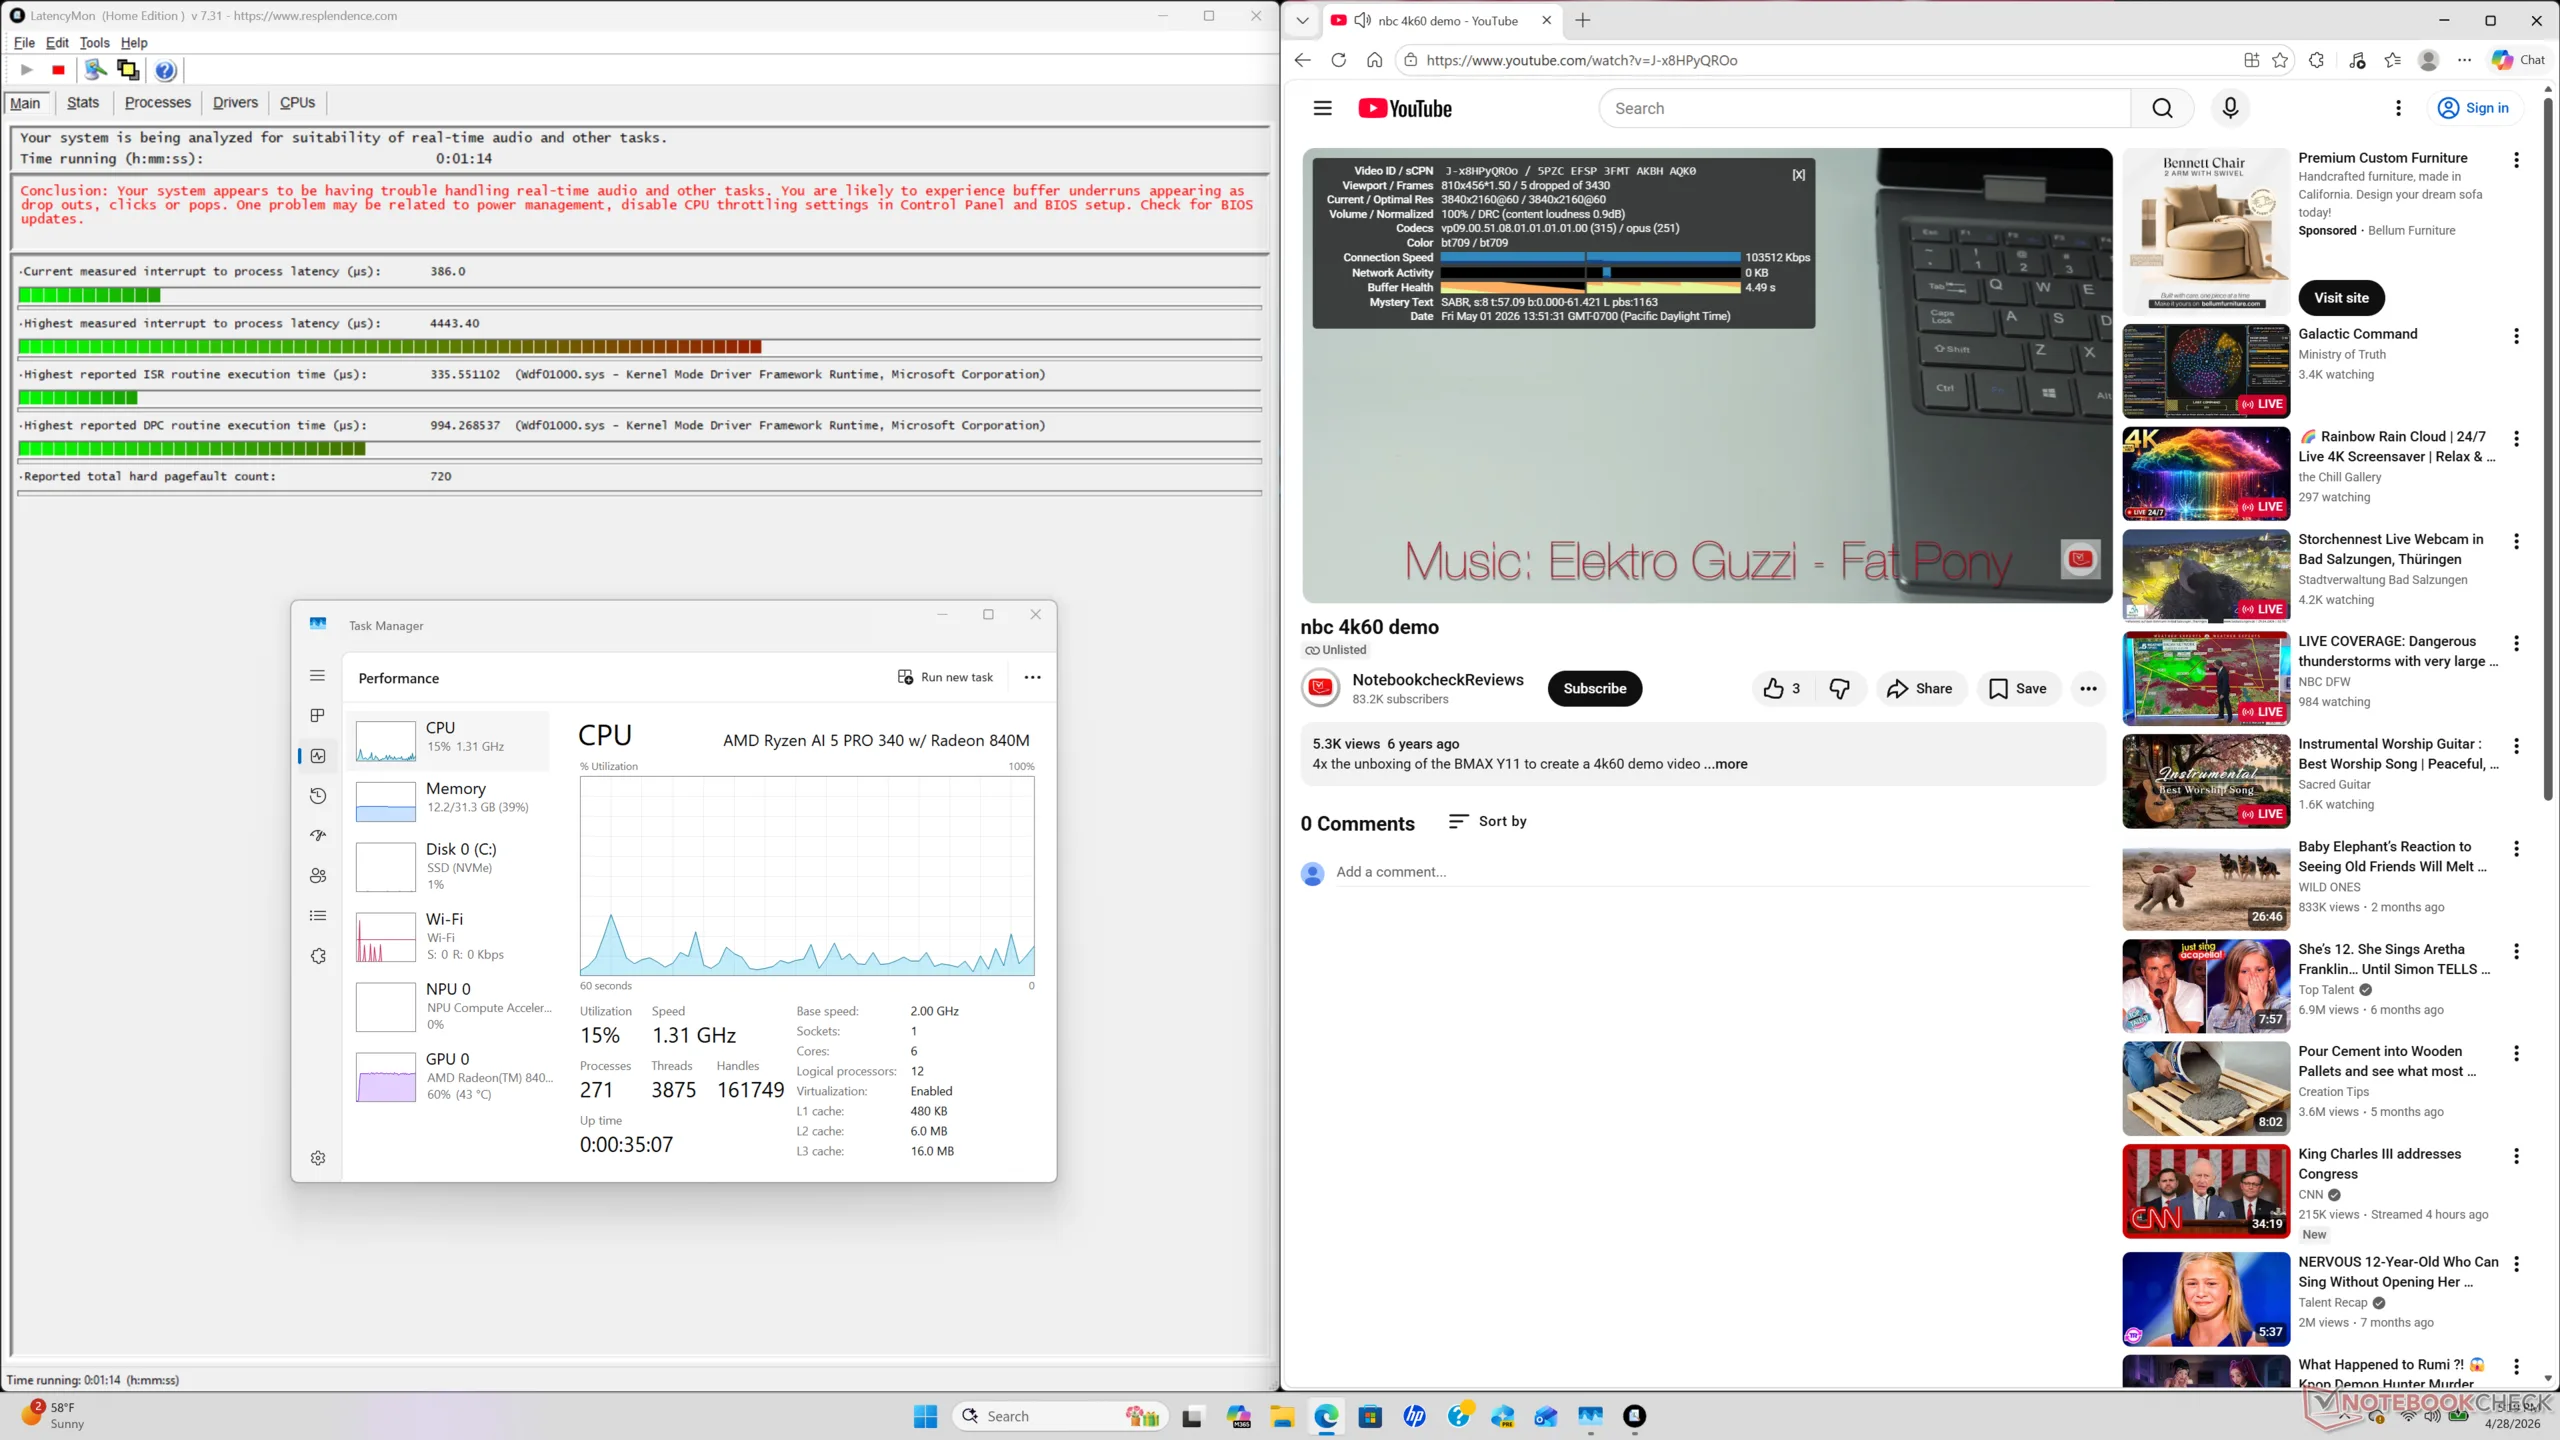
LatencyMon revela problemas de DPC y un pequeño puñado de fotogramas caídos al reproducir contenido de vídeo 4K60. Los resultados no cambiaron incluso después de repetir las pruebas con los controladores gráficos y la versión de Edge más recientes en el momento de la publicación. Mientras que los pocos fotogramas caídos al reproducir vídeo son casi imperceptibles, no tener ninguno en absoluto es lo ideal.
| DPC Latencies / LatencyMon - interrupt to process latency (max), Web, Youtube, Prime95 | |
| HP EliteBoard G1a AI | |
| GMK NucBox K13 | |
| Geekom A5 Pro | |
| HP Pro Mini 400 G9-937U0EA | |
| Asus NUC 15 Pro+ | |
| MSI Cubi NUC AI+ 2MG | |
* ... más pequeño es mejor
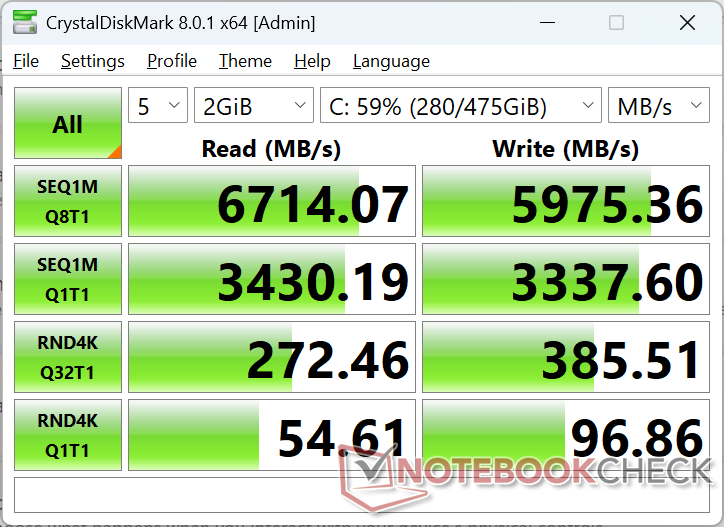
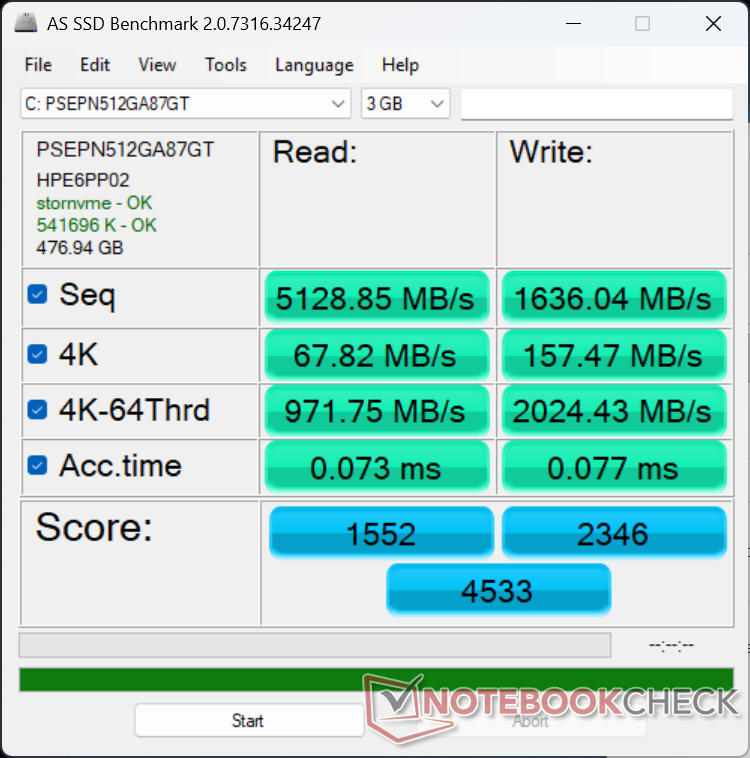
Dispositivos de almacenamiento
Nuestra configuración cuenta con un Phison PSEPN512GA87GT PCIe4 x4 NVMe 2280 SSD que ofrece velocidades de transferencia constantes de hasta ~7000 MB/s sin estrangulamiento ni siquiera cuando se somete a estrés. Podría decirse que tales velocidades son excesivas para los tipos de cargas de trabajo para los que se diseñó la EliteBoard, pero el rápido rendimiento se agradece de todos modos.

| Drive Performance rating - Percent | |
| HP EliteBoard G1a AI | |
| Asus NUC 15 Pro+ | |
| Geekom A5 Pro | |
| MSI Cubi NUC AI+ 2MG | |
| GMK NucBox K13 | |
| HP Pro Mini 400 G9-937U0EA | |
* ... más pequeño es mejor
Estrangulamiento de disco: Bucle de lectura DiskSpd, profundidad de cola 8
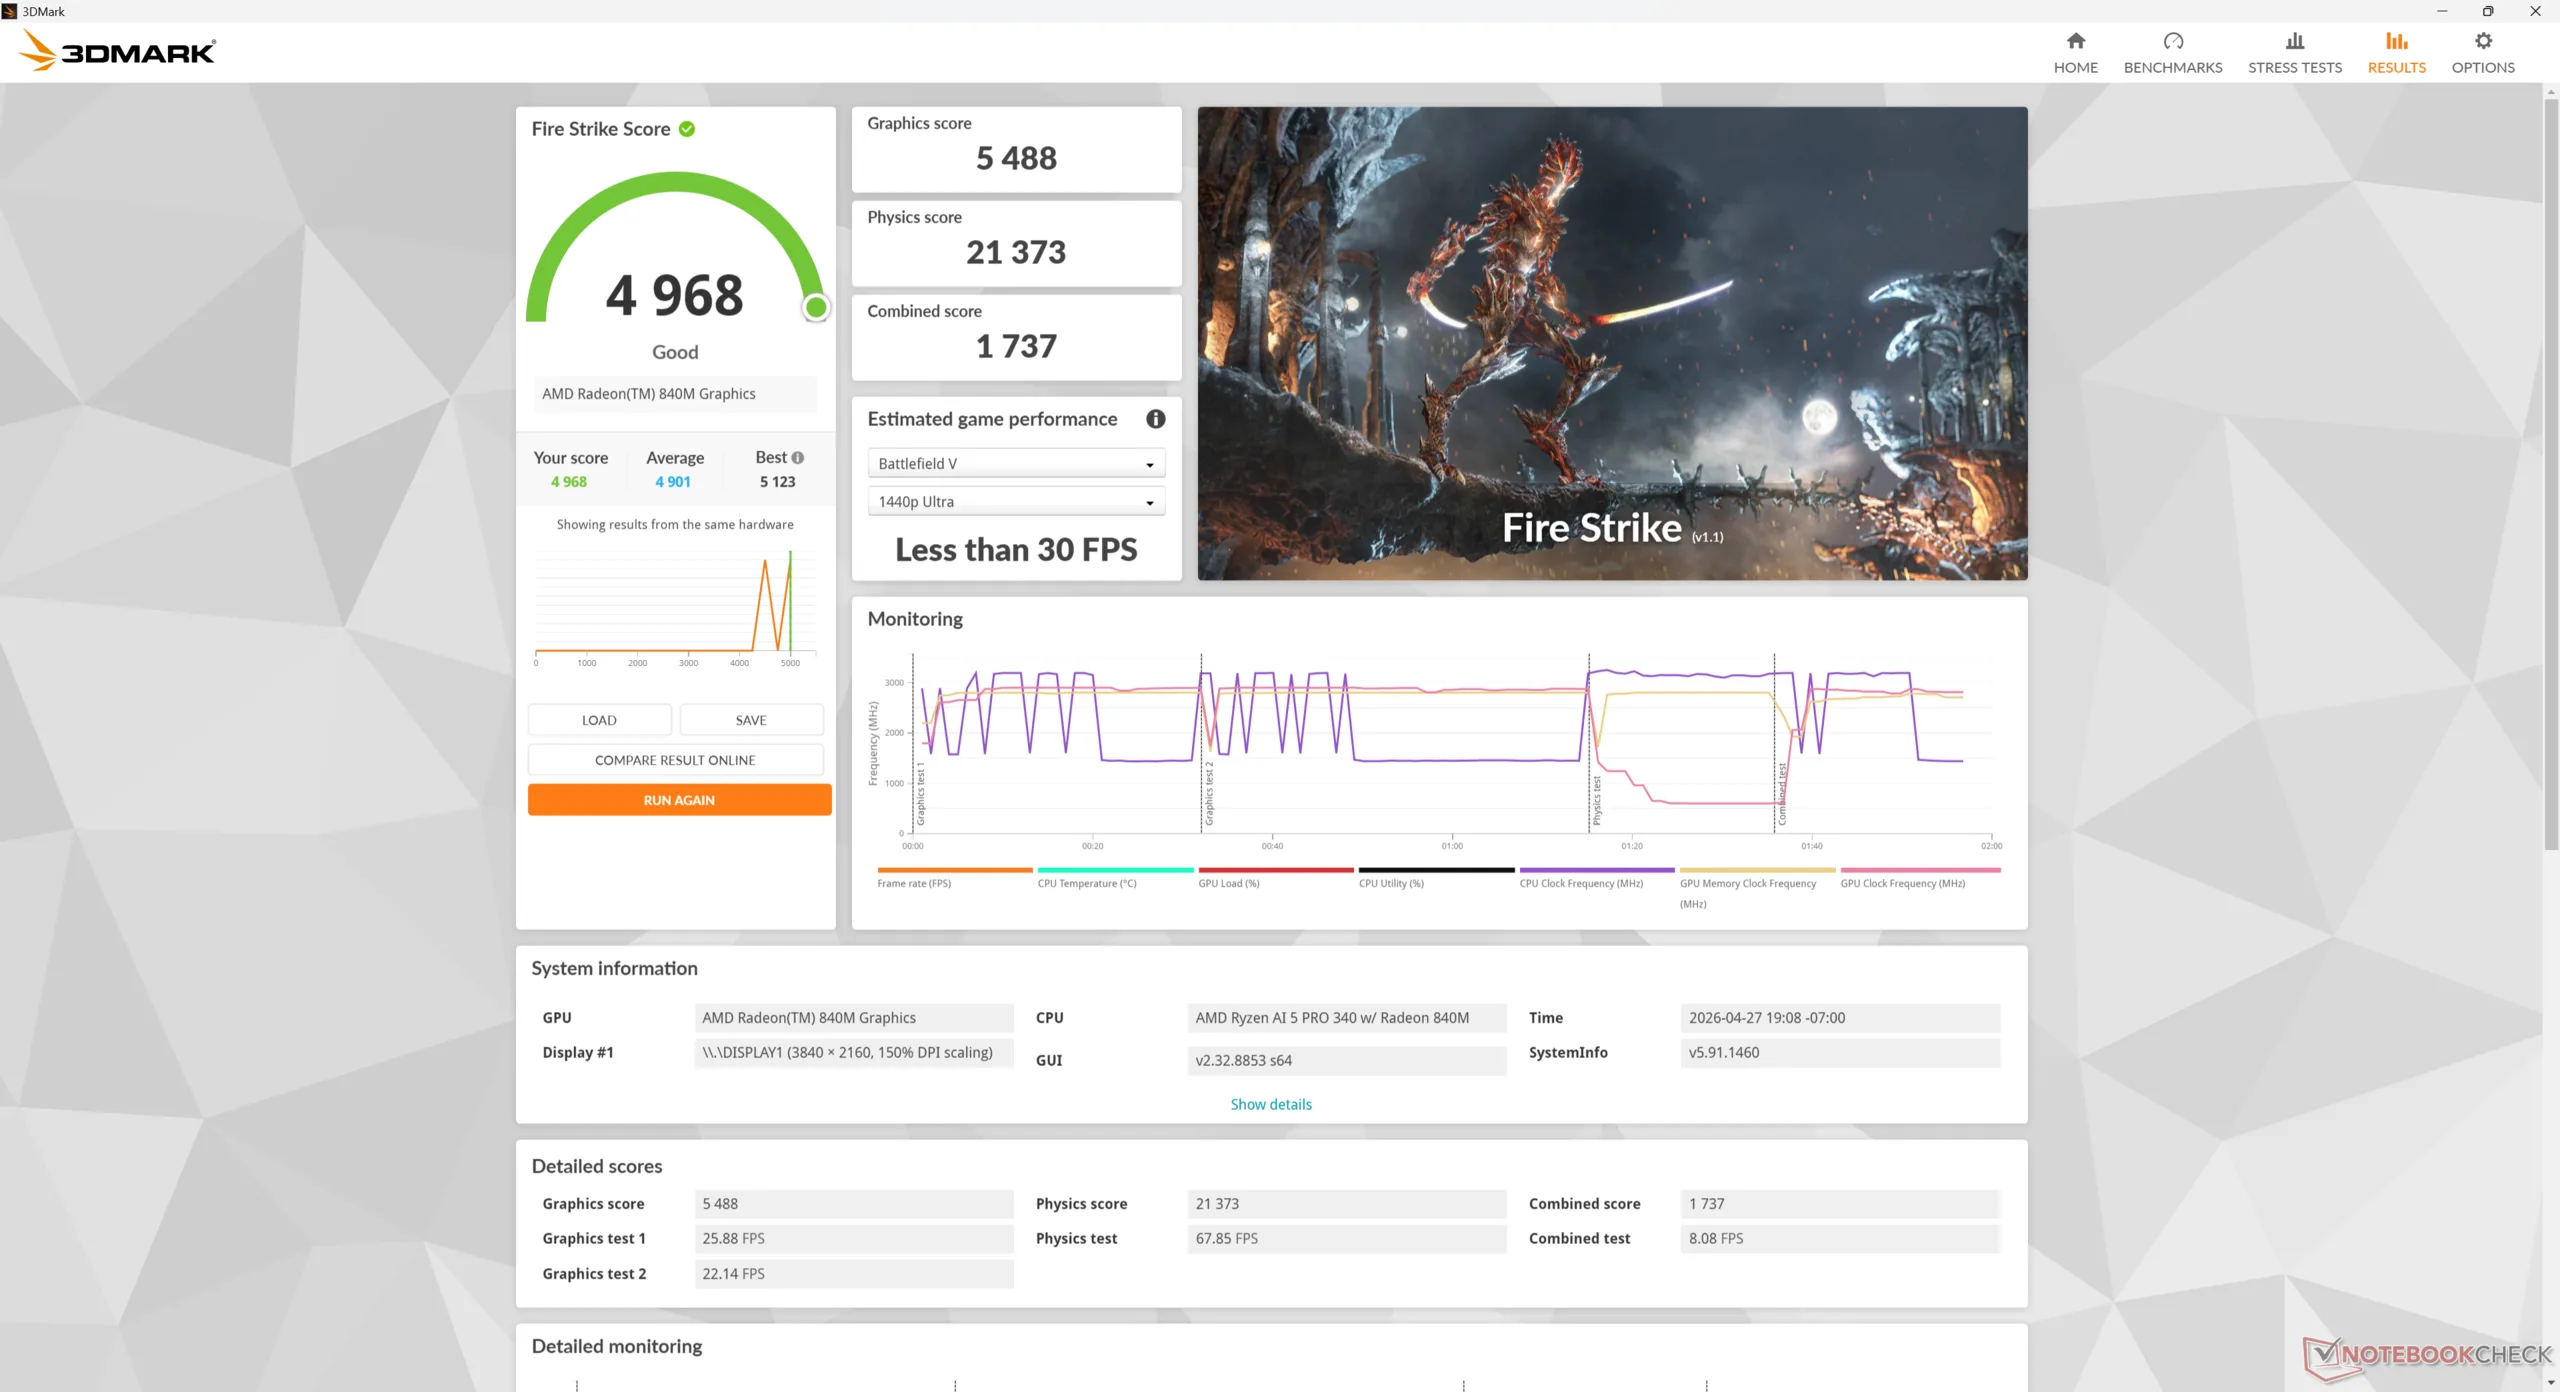
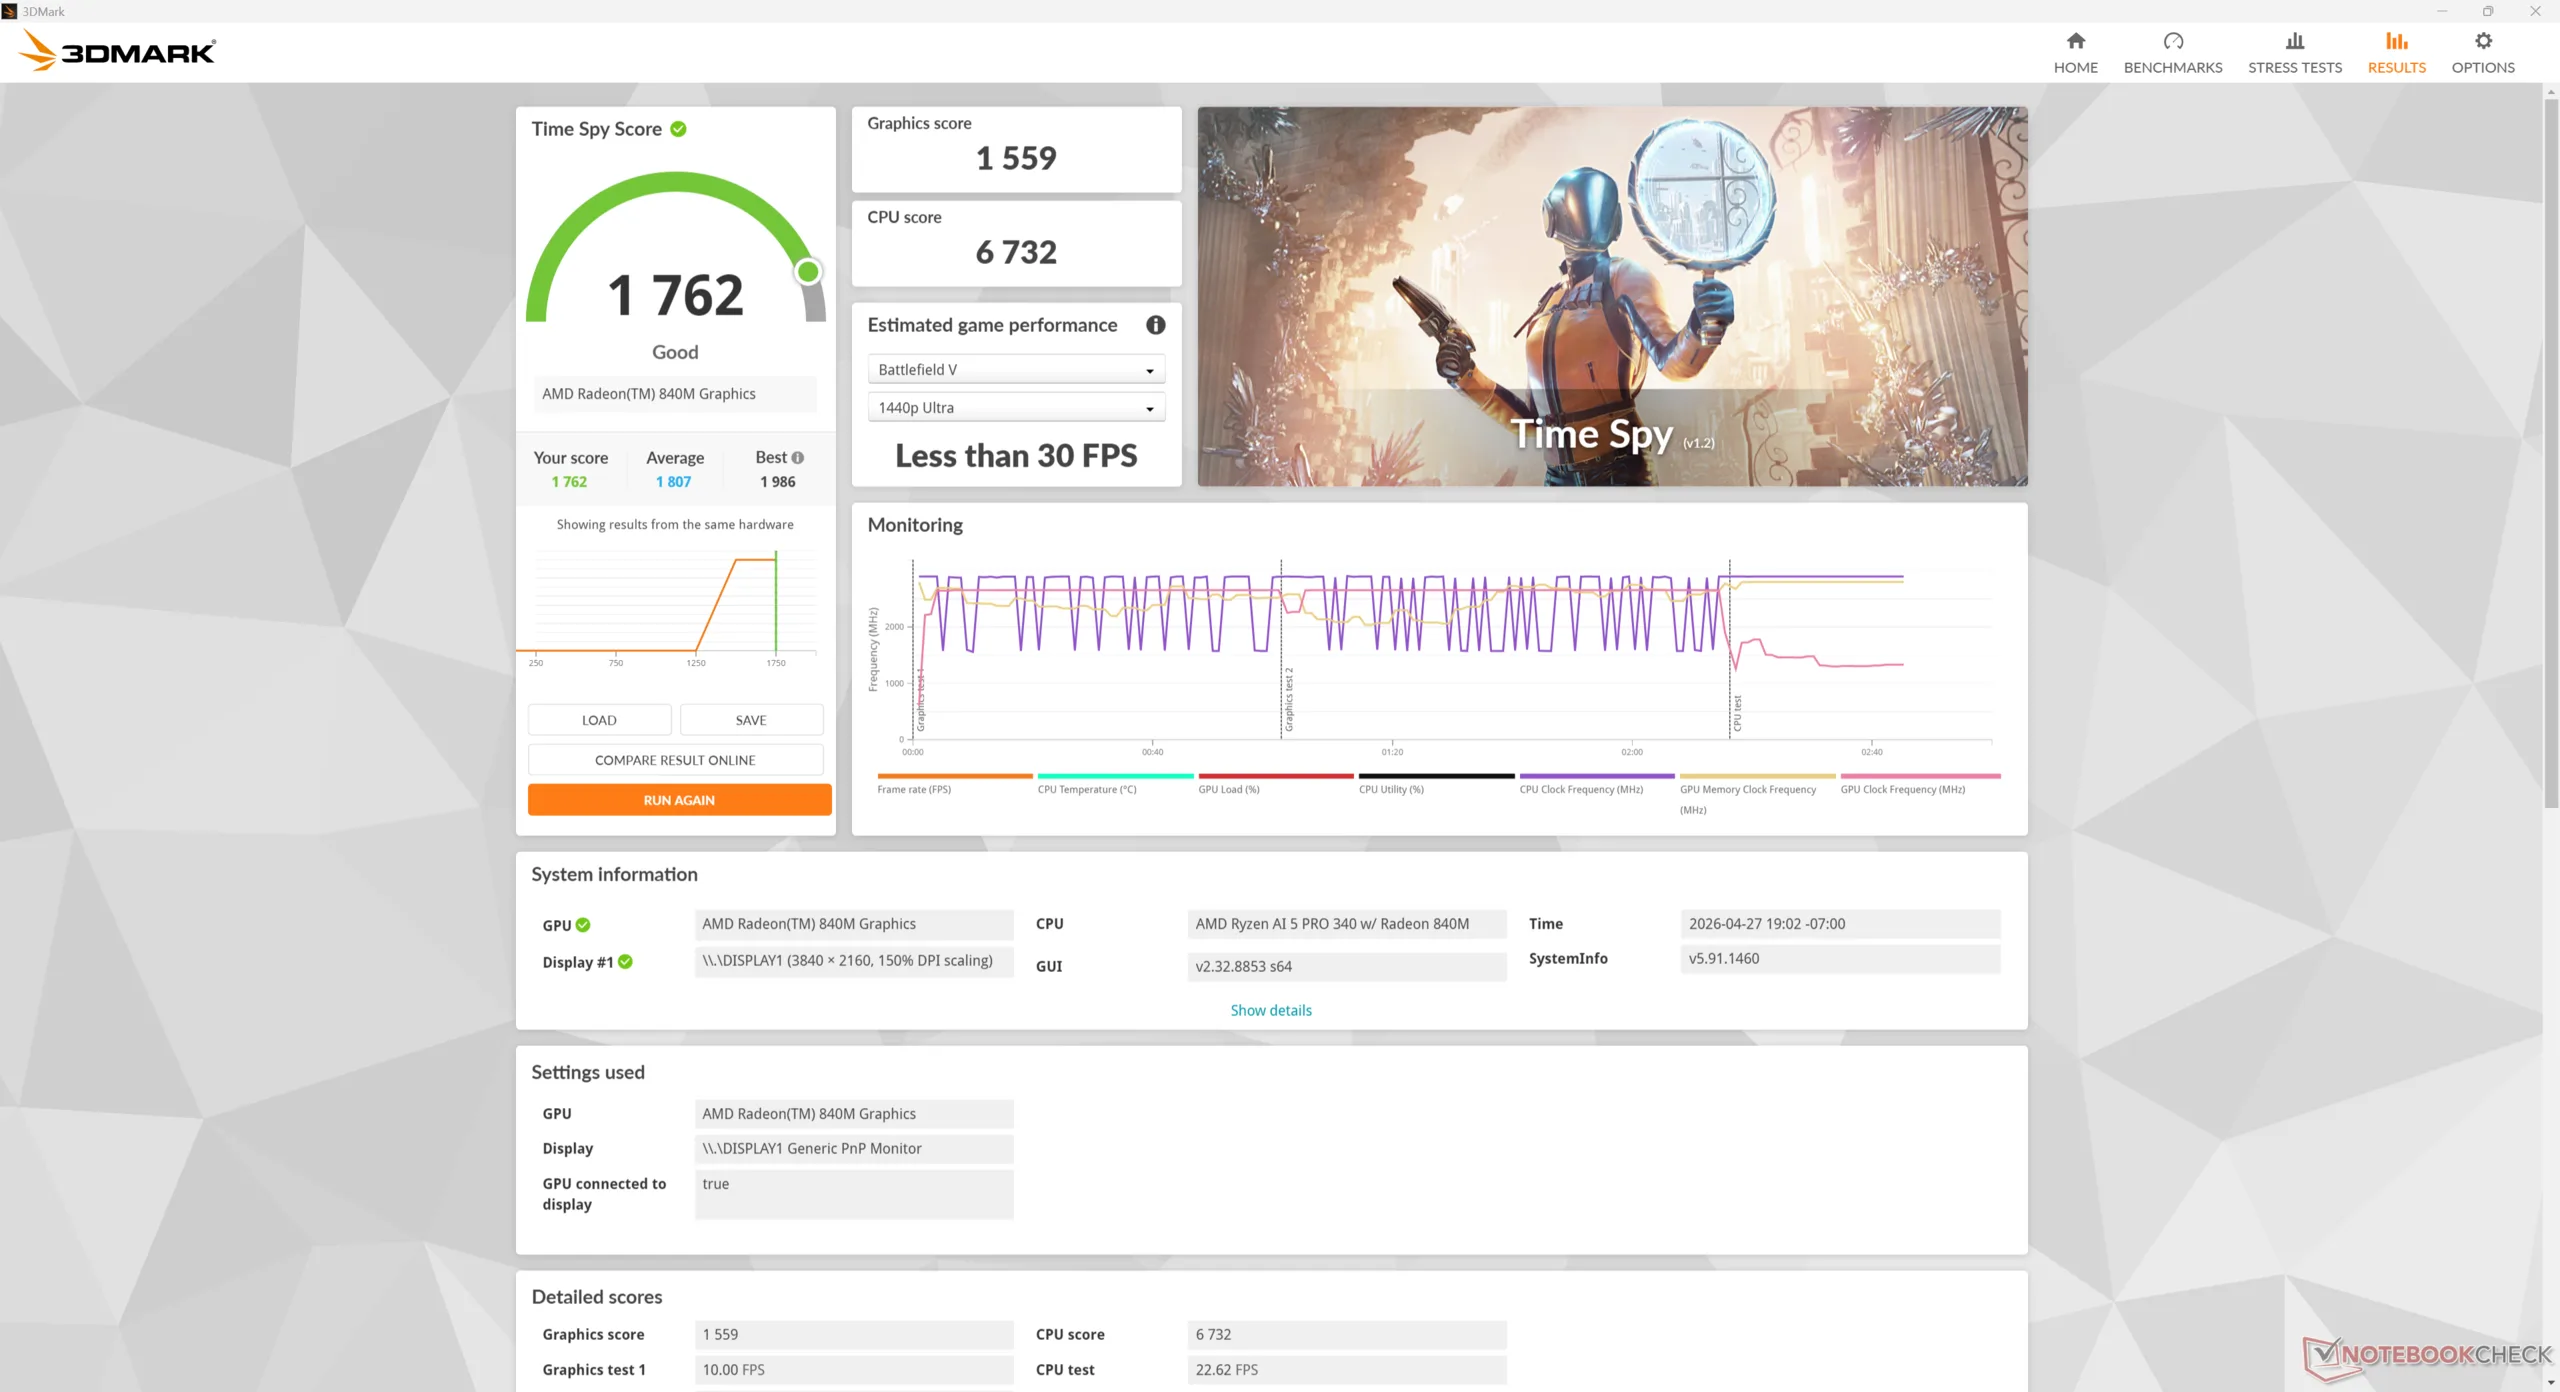
Rendimiento de la GPU
La integrada Radeon 840M está codo con codo con la vetusta Iris Xe 96EU que era popular en los subportátiles hace sólo unos años. Mientras que la actualización a la Ryzen AI 7 PRO 350 Radeon 860M SKU también mejoraría el rendimiento gráfico hasta en un 70 por ciento, el rendimiento general seguiría siendo inadecuado para la mayoría de las tareas intensivas de la GPU. Desafortunadamente, HP no ofrece el modelo con capacidad para juegos Radeon 880M o 890M.
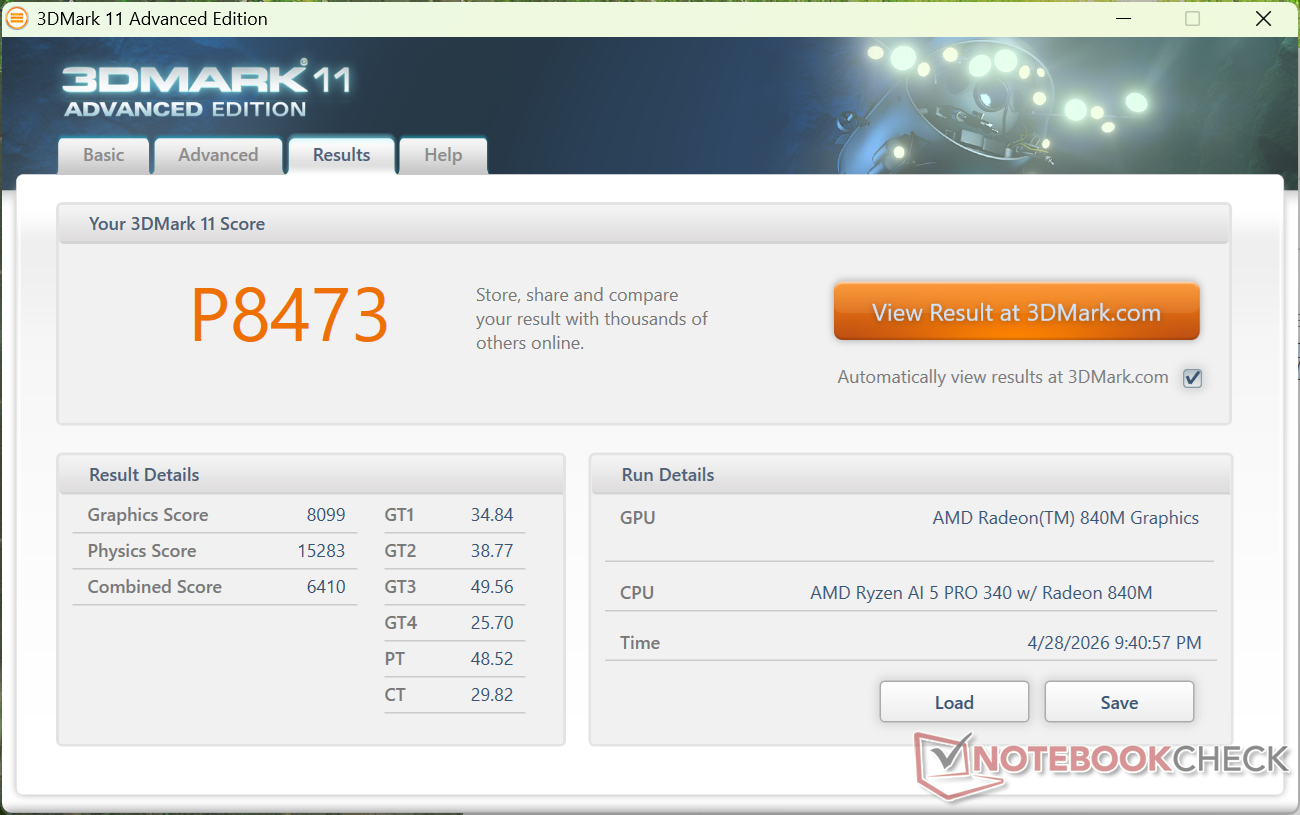
| 3DMark 11 Performance | 8473 puntos | |
| 3DMark Cloud Gate Standard Score | 25064 puntos | |
| 3DMark Fire Strike Score | 4968 puntos | |
| 3DMark Time Spy Score | 1762 puntos | |
ayuda | ||
* ... más pequeño es mejor
| Performance rating - Percent | |
| Asus NUC 15 Pro+ | |
| MSI Cubi NUC AI+ 2MG | |
| GMK NucBox K13 | |
| HP EliteBoard G1a AI | |
| Geekom A5 Pro -2! | |
| HP Pro Mini 400 G9-937U0EA -3! | |
| Cyberpunk 2077 - 1920x1080 Ultra Preset (FSR off) | |
| Asus NUC 15 Pro+ | |
| GMK NucBox K13 | |
| MSI Cubi NUC AI+ 2MG | |
| HP EliteBoard G1a AI | |
| Geekom A5 Pro | |
| HP Pro Mini 400 G9-937U0EA | |
| Baldur's Gate 3 - 1920x1080 Ultra Preset AA:T | |
| MSI Cubi NUC AI+ 2MG | |
| Asus NUC 15 Pro+ | |
| GMK NucBox K13 | |
| HP EliteBoard G1a AI | |
| GTA V - 1920x1080 Highest AA:4xMSAA + FX AF:16x | |
| MSI Cubi NUC AI+ 2MG | |
| GMK NucBox K13 | |
| HP EliteBoard G1a AI | |
| Asus NUC 15 Pro+ | |
| Geekom A5 Pro | |
| Final Fantasy XV Benchmark - 1920x1080 High Quality | |
| Asus NUC 15 Pro+ | |
| MSI Cubi NUC AI+ 2MG | |
| GMK NucBox K13 | |
| HP EliteBoard G1a AI | |
| Geekom A5 Pro | |
| HP Pro Mini 400 G9-937U0EA | |
| Strange Brigade - 1920x1080 ultra AA:ultra AF:16 | |
| MSI Cubi NUC AI+ 2MG | |
| Asus NUC 15 Pro+ | |
| GMK NucBox K13 | |
| HP EliteBoard G1a AI | |
| Dota 2 Reborn - 1920x1080 ultra (3/3) best looking | |
| Asus NUC 15 Pro+ | |
| GMK NucBox K13 | |
| HP EliteBoard G1a AI | |
| MSI Cubi NUC AI+ 2MG | |
| Geekom A5 Pro | |
| HP Pro Mini 400 G9-937U0EA | |
| X-Plane 11.11 - 1920x1080 high (fps_test=3) | |
| Asus NUC 15 Pro+ | |
| HP EliteBoard G1a AI | |
| MSI Cubi NUC AI+ 2MG | |
| Geekom A5 Pro | |
| GMK NucBox K13 | |
| HP Pro Mini 400 G9-937U0EA | |
Cyberpunk 2077 ultra FPS Gráfico
| bajo | medio | alto | ultra | |
|---|---|---|---|---|
| GTA V (2015) | 164.1 | 115.1 | 52.4 | 22.7 |
| Dota 2 Reborn (2015) | 160.6 | 127.2 | 80.1 | 67.7 |
| Final Fantasy XV Benchmark (2018) | 57.3 | 27 | 20.4 | |
| X-Plane 11.11 (2018) | 63.1 | 46.7 | 39.1 | |
| Strange Brigade (2018) | 128.8 | 48.1 | 40.1 | 34.5 |
| Baldur's Gate 3 (2023) | 22.7 | 18.7 | 14.3 | 14.3 |
| Cyberpunk 2077 (2023) | 26.3 | 19.7 | 15.8 | 12.6 |
| F1 24 (2024) | 48.4 | 45 | 32.4 | 6.83 |
Emisiones
Ruido del sistema
Por lo general, el ruido del ventilador es más perceptible, ya que los usuarios se sientan más cerca de sus teclados que de sus ordenadores de sobremesa o mini PC. Si se ejecutan cargas muy exigentes, el EliteBoard puede ser tan ruidoso como algunos portátiles en condiciones similares. Por lo demás, el ventilador es discreto y no presenta problemas de pulsaciones importantes cuando simplemente navega por Internet o está en reposo.
Ruido
| Ocioso |
| 24.1 / 24.1 / 25.8 dB(A) |
| Carga |
| 40.5 / 45.2 dB(A) |
 | ||
30 dB silencioso 40 dB(A) audible 50 dB(A) ruidosamente alto |
||
min: | ||
| HP EliteBoard G1a AI Ryzen AI 5 340, Radeon 840M | Geekom A5 Pro R5 7530U, Vega 7 | GMK NucBox K13 Core Ultra 7 256V, Arc 140V | Asus NUC 15 Pro+ Ultra 9 285H, Arc 140T | MSI Cubi NUC AI+ 2MG Core Ultra 7 258V, Arc 140V | HP Pro Mini 400 G9-937U0EA i5-14500T, UHD Graphics 770 | |
|---|---|---|---|---|---|---|
| Noise | 6% | -1% | -14% | -15% | 2% | |
| apagado / medio ambiente * (dB) | 23.6 | 25 -6% | 23.3 1% | 25.3 -7% | 24.8 -5% | 24.8 -5% |
| Idle Minimum * (dB) | 24.1 | 26.6 -10% | 24.5 -2% | 25.4 -5% | 28 -16% | 26.9 -12% |
| Idle Average * (dB) | 24.1 | 26.6 -10% | 25 -4% | 25.5 -6% | 36.1 -50% | 26.9 -12% |
| Idle Maximum * (dB) | 25.8 | 26.7 -3% | 25.1 3% | 37.3 -45% | 36.1 -40% | 26.9 -4% |
| Load Average * (dB) | 40.5 | 33.5 17% | 40.1 1% | 44.4 -10% | 38.9 4% | 32.5 20% |
| Cyberpunk 2077 ultra * (dB) | 42.2 | 31.2 26% | 44.2 -5% | 46.2 -9% | 37 12% | 37.2 12% |
| Load Maximum * (dB) | 45.2 | 33.8 25% | 45.1 -0% | 52.7 -17% | 49.2 -9% | 37.2 18% |
| Witcher 3 ultra * (dB) | 31.2 | 47.7 |
* ... más pequeño es mejor
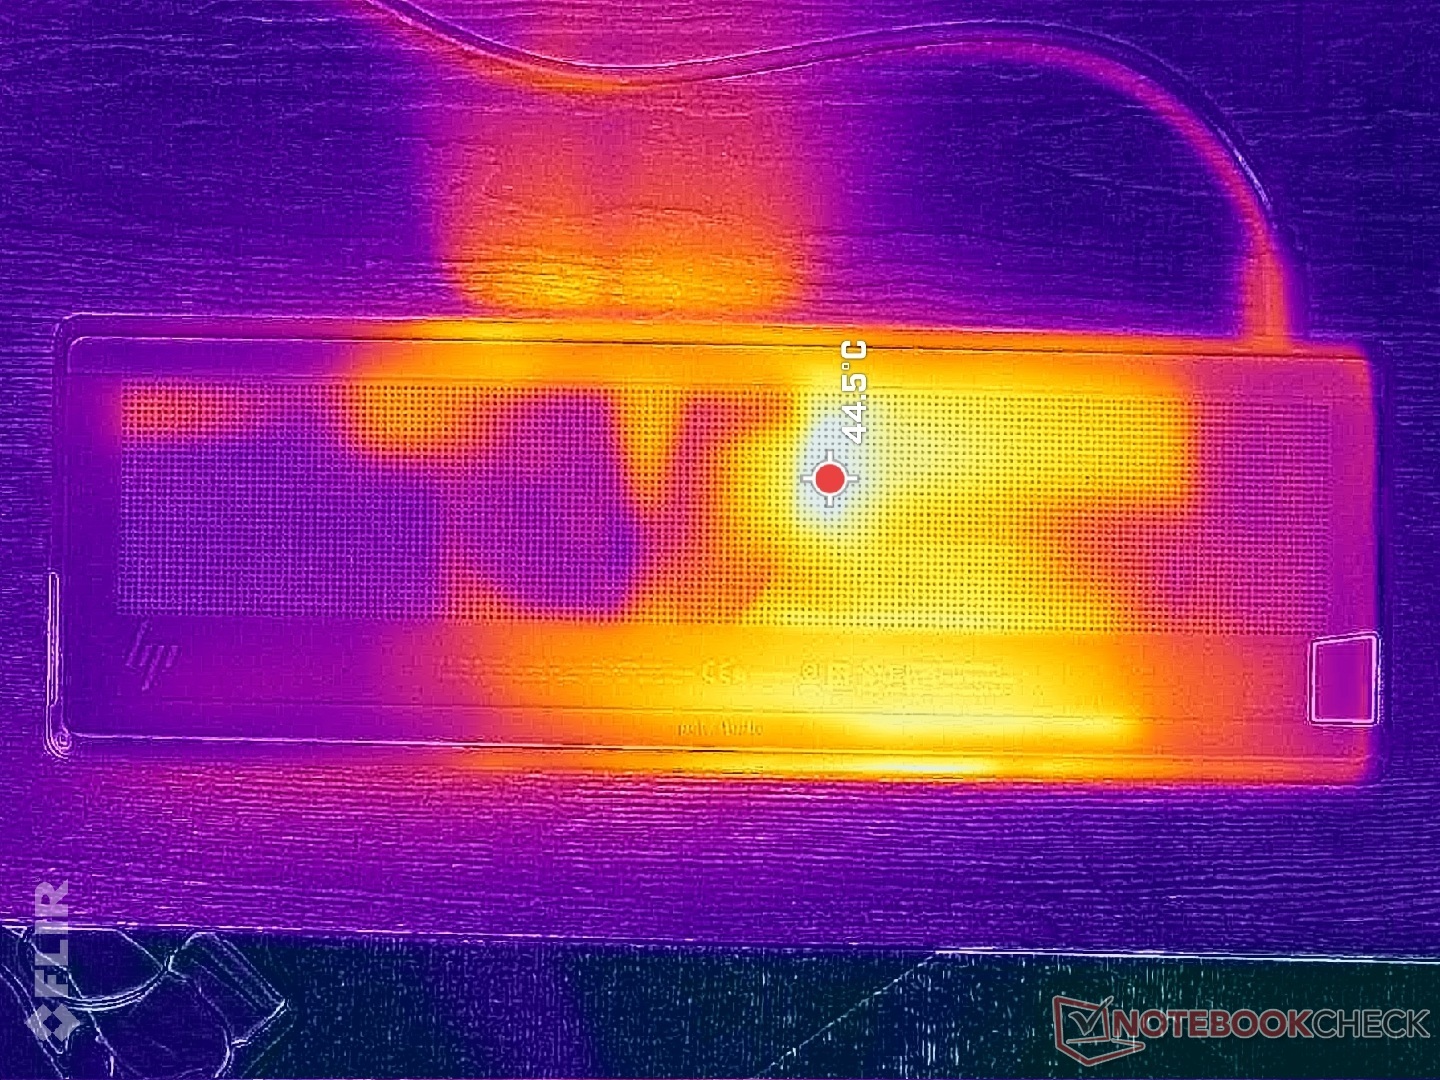
Temperatura
Los puntos calientes pueden alcanzar más de 39 C en el centro del teclado o 43 C en la parte inferior cuando se ejecutan cargas exigentes durante largos periodos. Aunque el calor es perceptible al teclear, nunca lo encontramos incómodamente caliente ya que el contacto con las yemas de los dedos es mínimo durante el uso habitual.
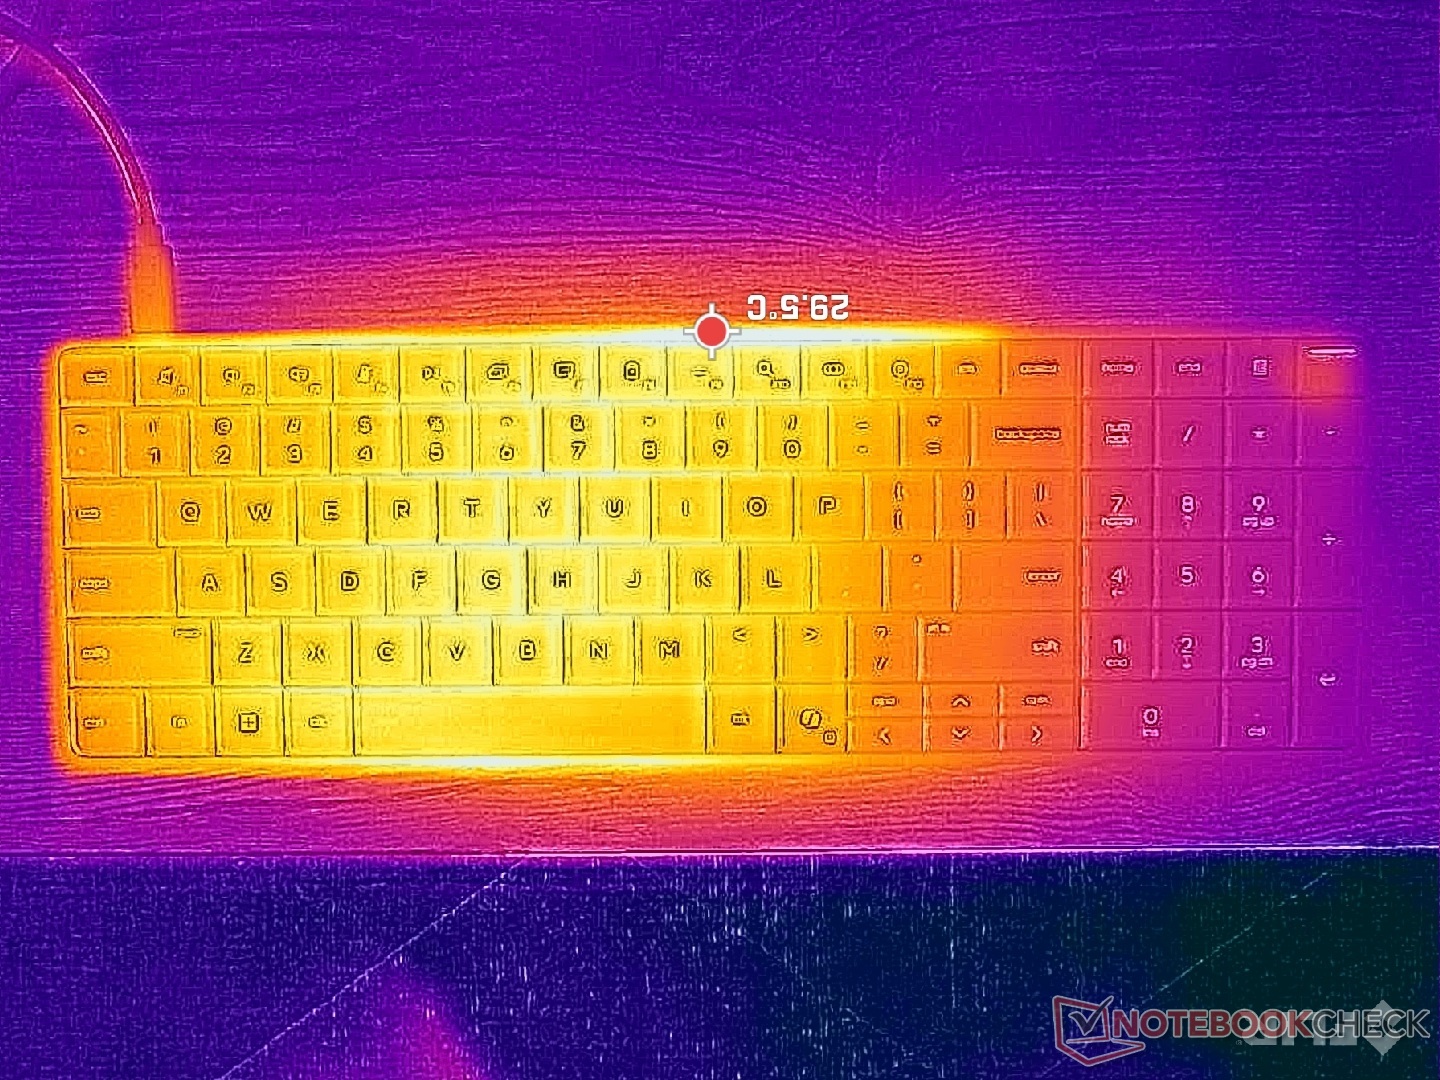
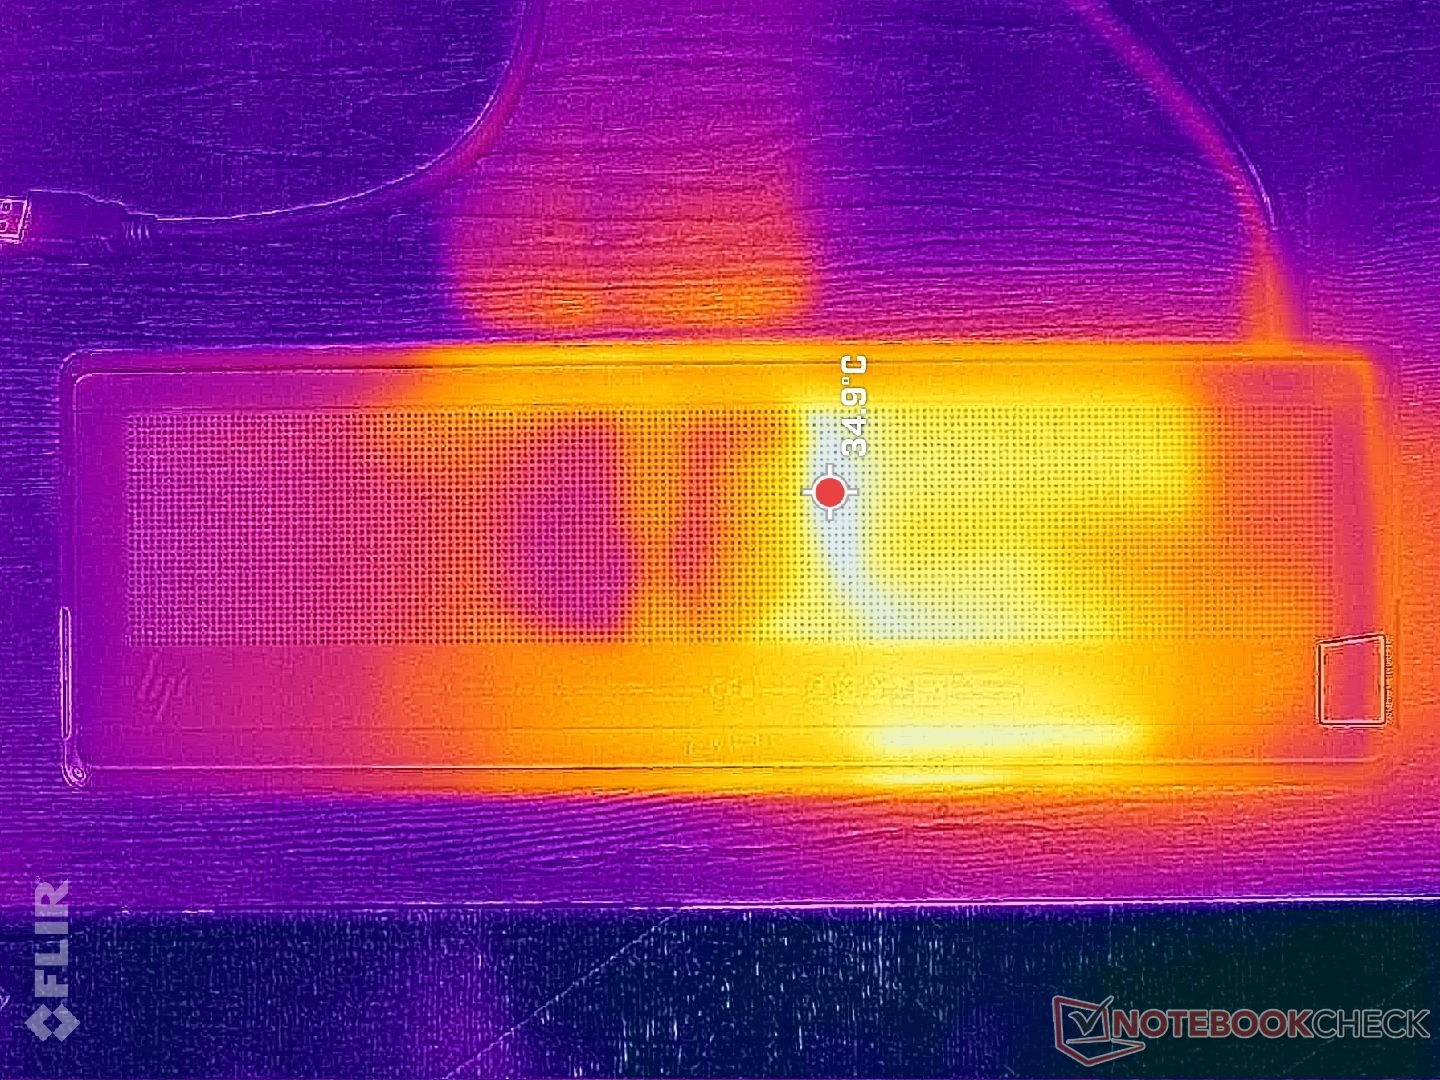
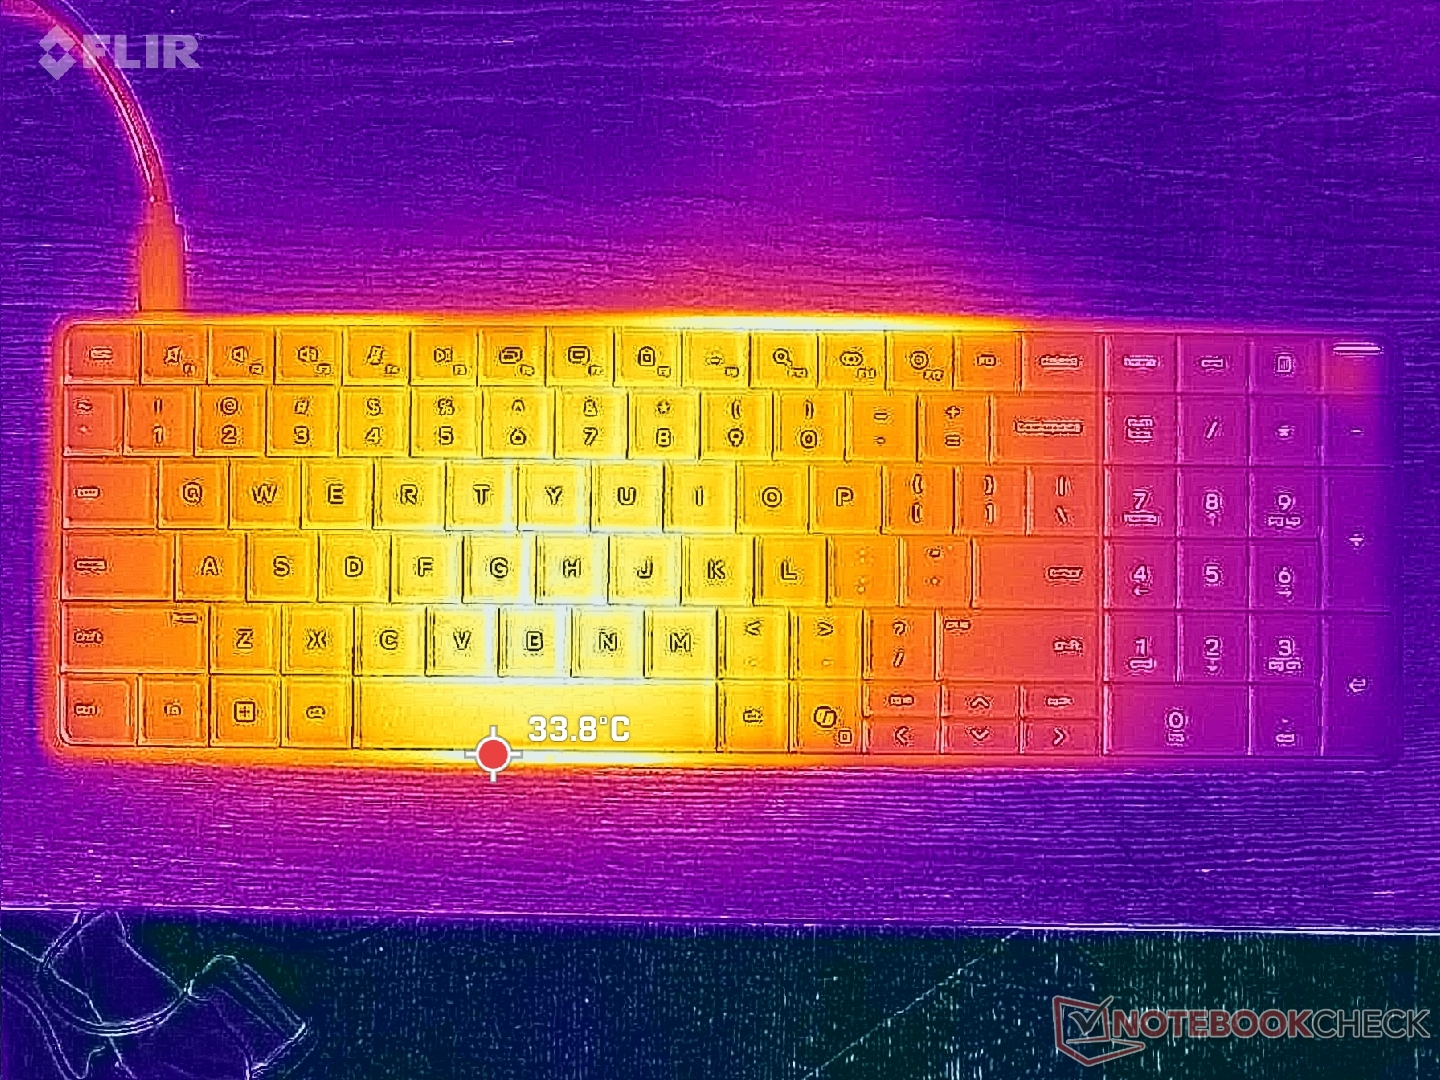
(+) La temperatura máxima en la parte superior es de 38.4 °C / 101 F, frente a la media de 35.4 °C / 96 F, que oscila entre 20.6 y 69.5 °C para la clase Mini PC.
(±) El fondo se calienta hasta un máximo de 42.6 °C / 109 F, frente a la media de 36.1 °C / 97 F
(+) En reposo, la temperatura media de la parte superior es de 30.4 °C / 87# F, frente a la media del dispositivo de 32.1 °C / 90 F.
| HP EliteBoard G1a AI Ryzen AI 5 340, Radeon 840M | Geekom A5 Pro R5 7530U, Vega 7 | GMK NucBox K13 Core Ultra 7 256V, Arc 140V | Asus NUC 15 Pro+ Ultra 9 285H, Arc 140T | MSI Cubi NUC AI+ 2MG Core Ultra 7 258V, Arc 140V | HP Pro Mini 400 G9-937U0EA i5-14500T, UHD Graphics 770 | |
|---|---|---|---|---|---|---|
| Heat | 16% | 7% | 4% | 26% | 11% | |
| Maximum Upper Side * (°C) | 38.4 | 36.7 4% | 31.6 18% | 42.2 -10% | 30.8 20% | 35.7 7% |
| Maximum Bottom * (°C) | 42.6 | 40.5 5% | 50.6 -19% | 31.3 27% | 26.4 38% | 39.6 7% |
| Idle Upper Side * (°C) | 32.4 | 23.1 29% | 27 17% | 34.9 -8% | 26.4 19% | 28.6 12% |
| Idle Bottom * (°C) | 34.6 | 25.1 27% | 31.2 10% | 32.2 7% | 25.4 27% | 29 16% |
* ... más pequeño es mejor
Prueba de estrés
La CPU aumentaría a 3,7 GHz y 54 W antes de caer rápidamente a 3,3 GHz y 33 W para una temperatura constante del núcleo de 72 C. El potencial Turbo Boost es limitado, lo que es de esperar de un sistema más sobre versatilidad que sobre rendimiento bruto. El rango medio de 70 C cuando se ejecutan cargas exigentes es típico si no ligeramente más frío que la mayoría de los subportátiles.

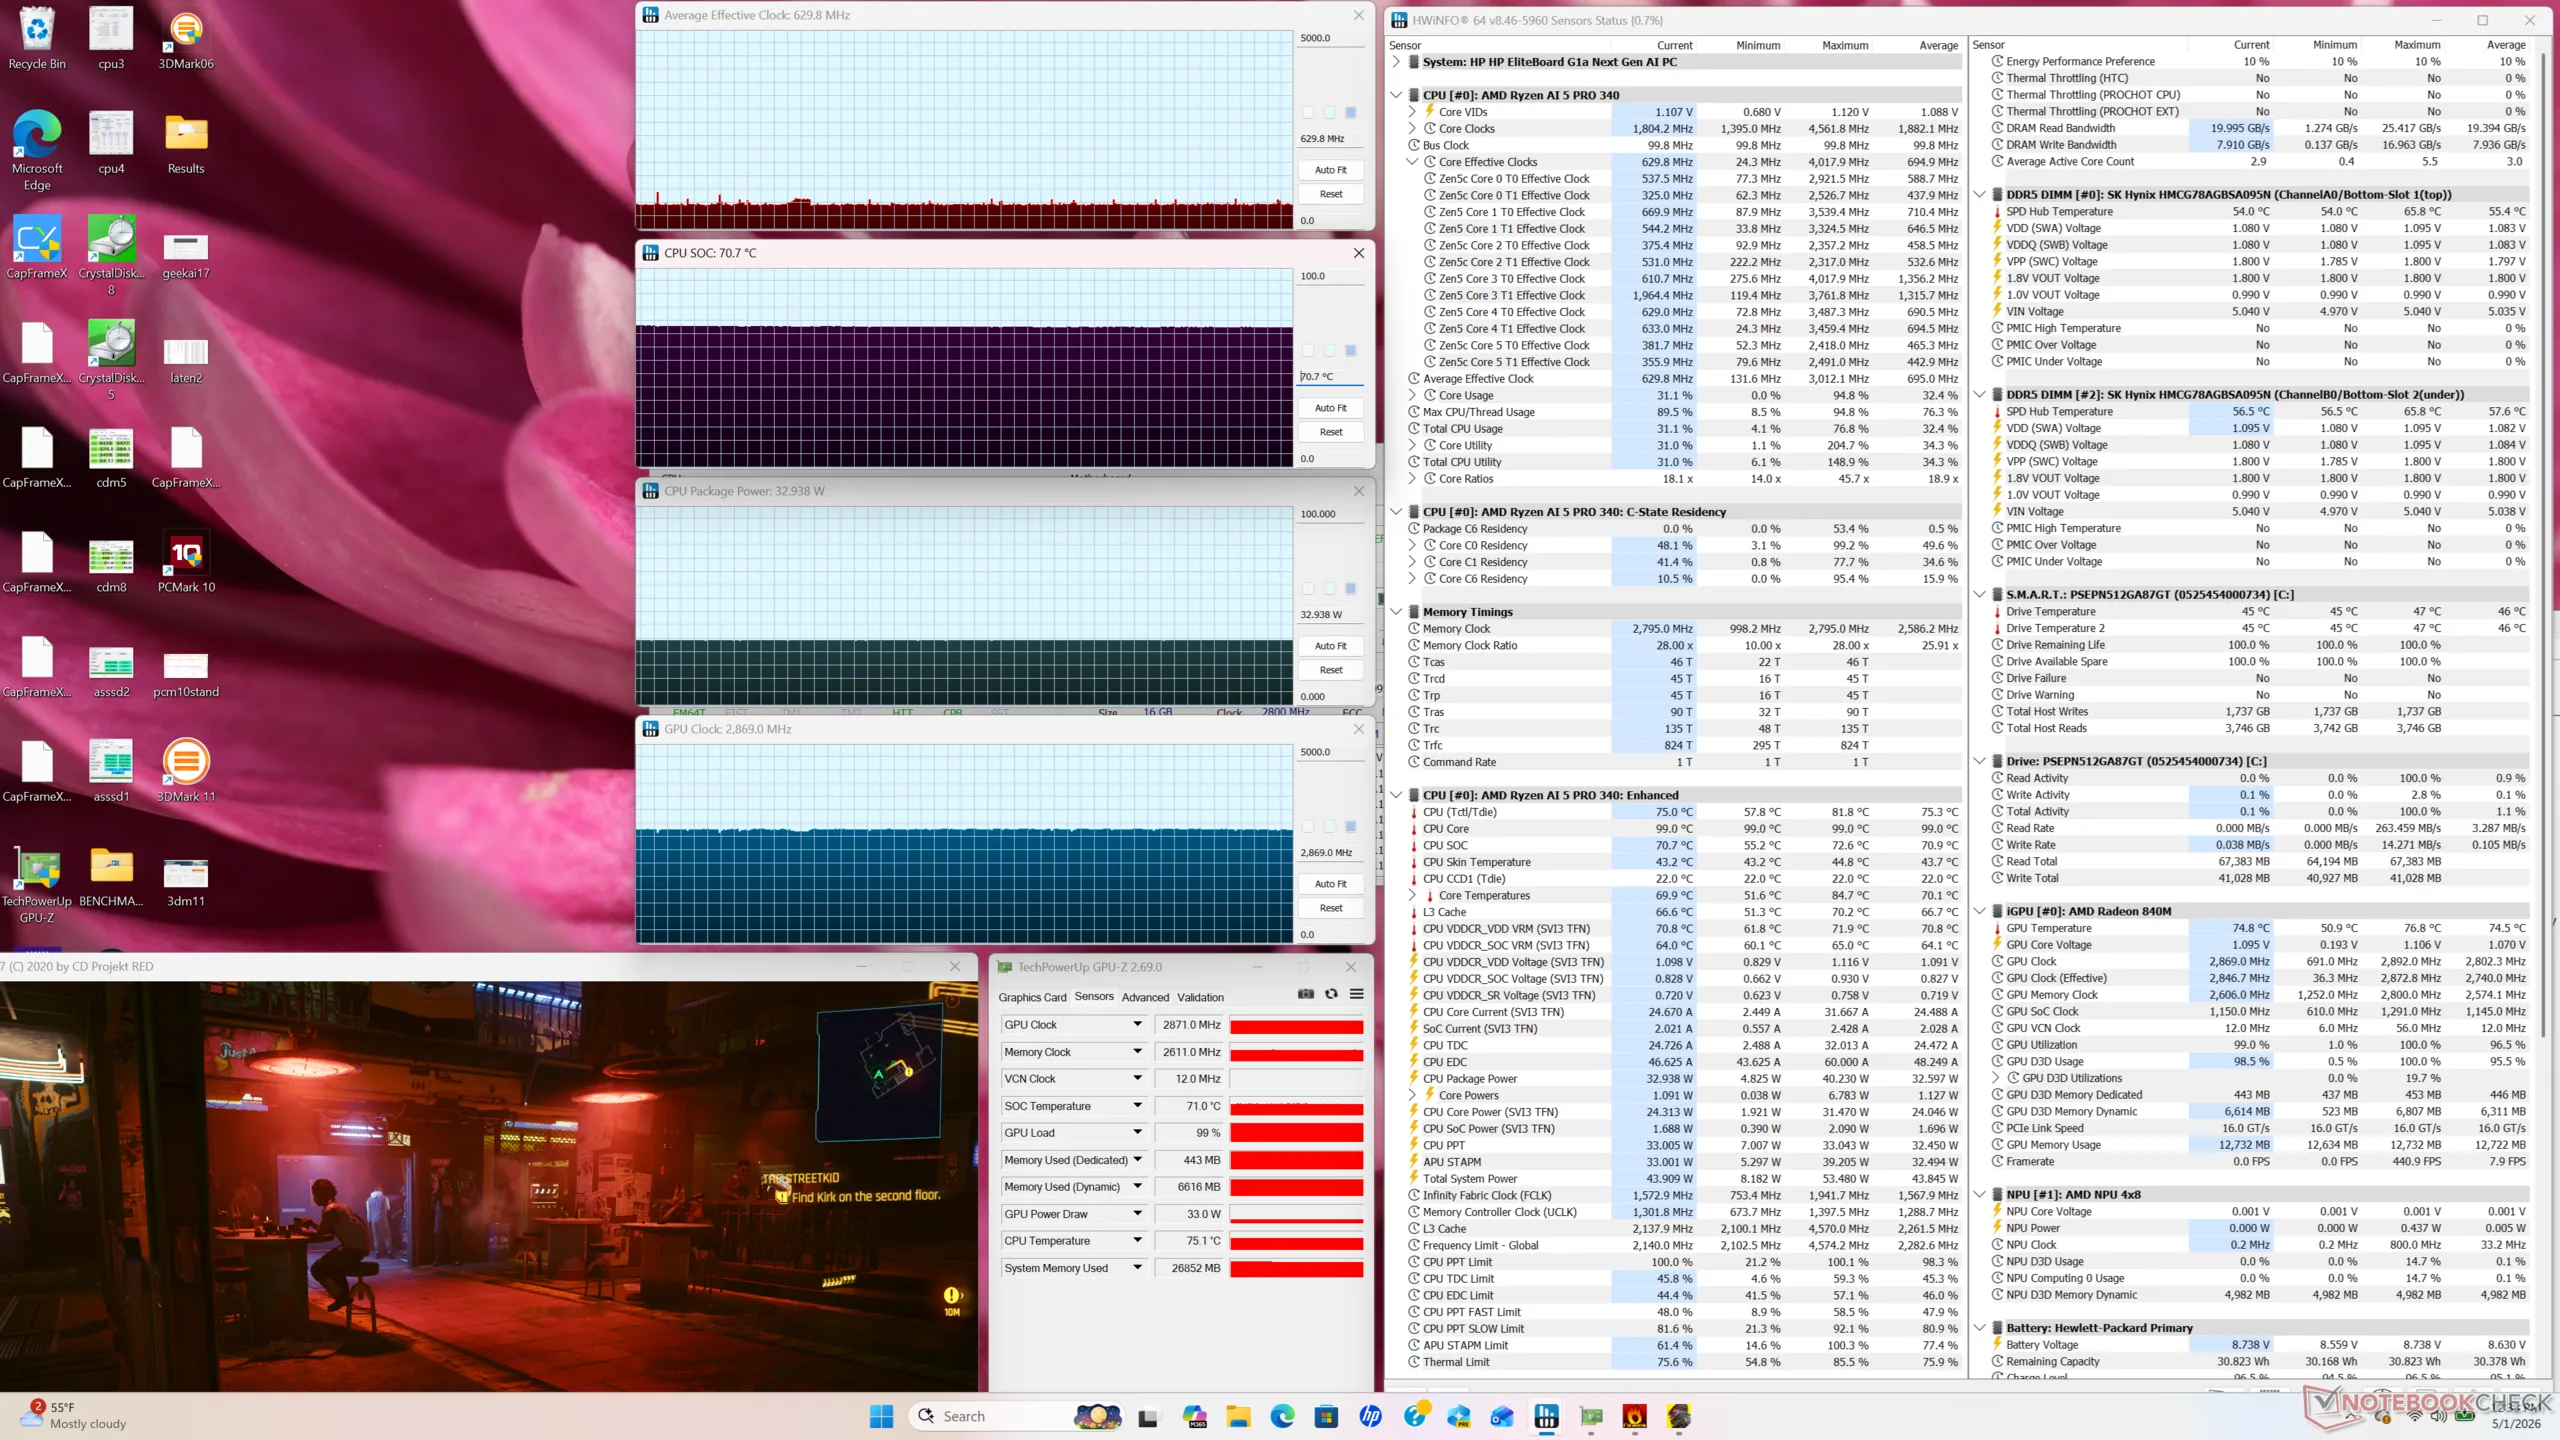
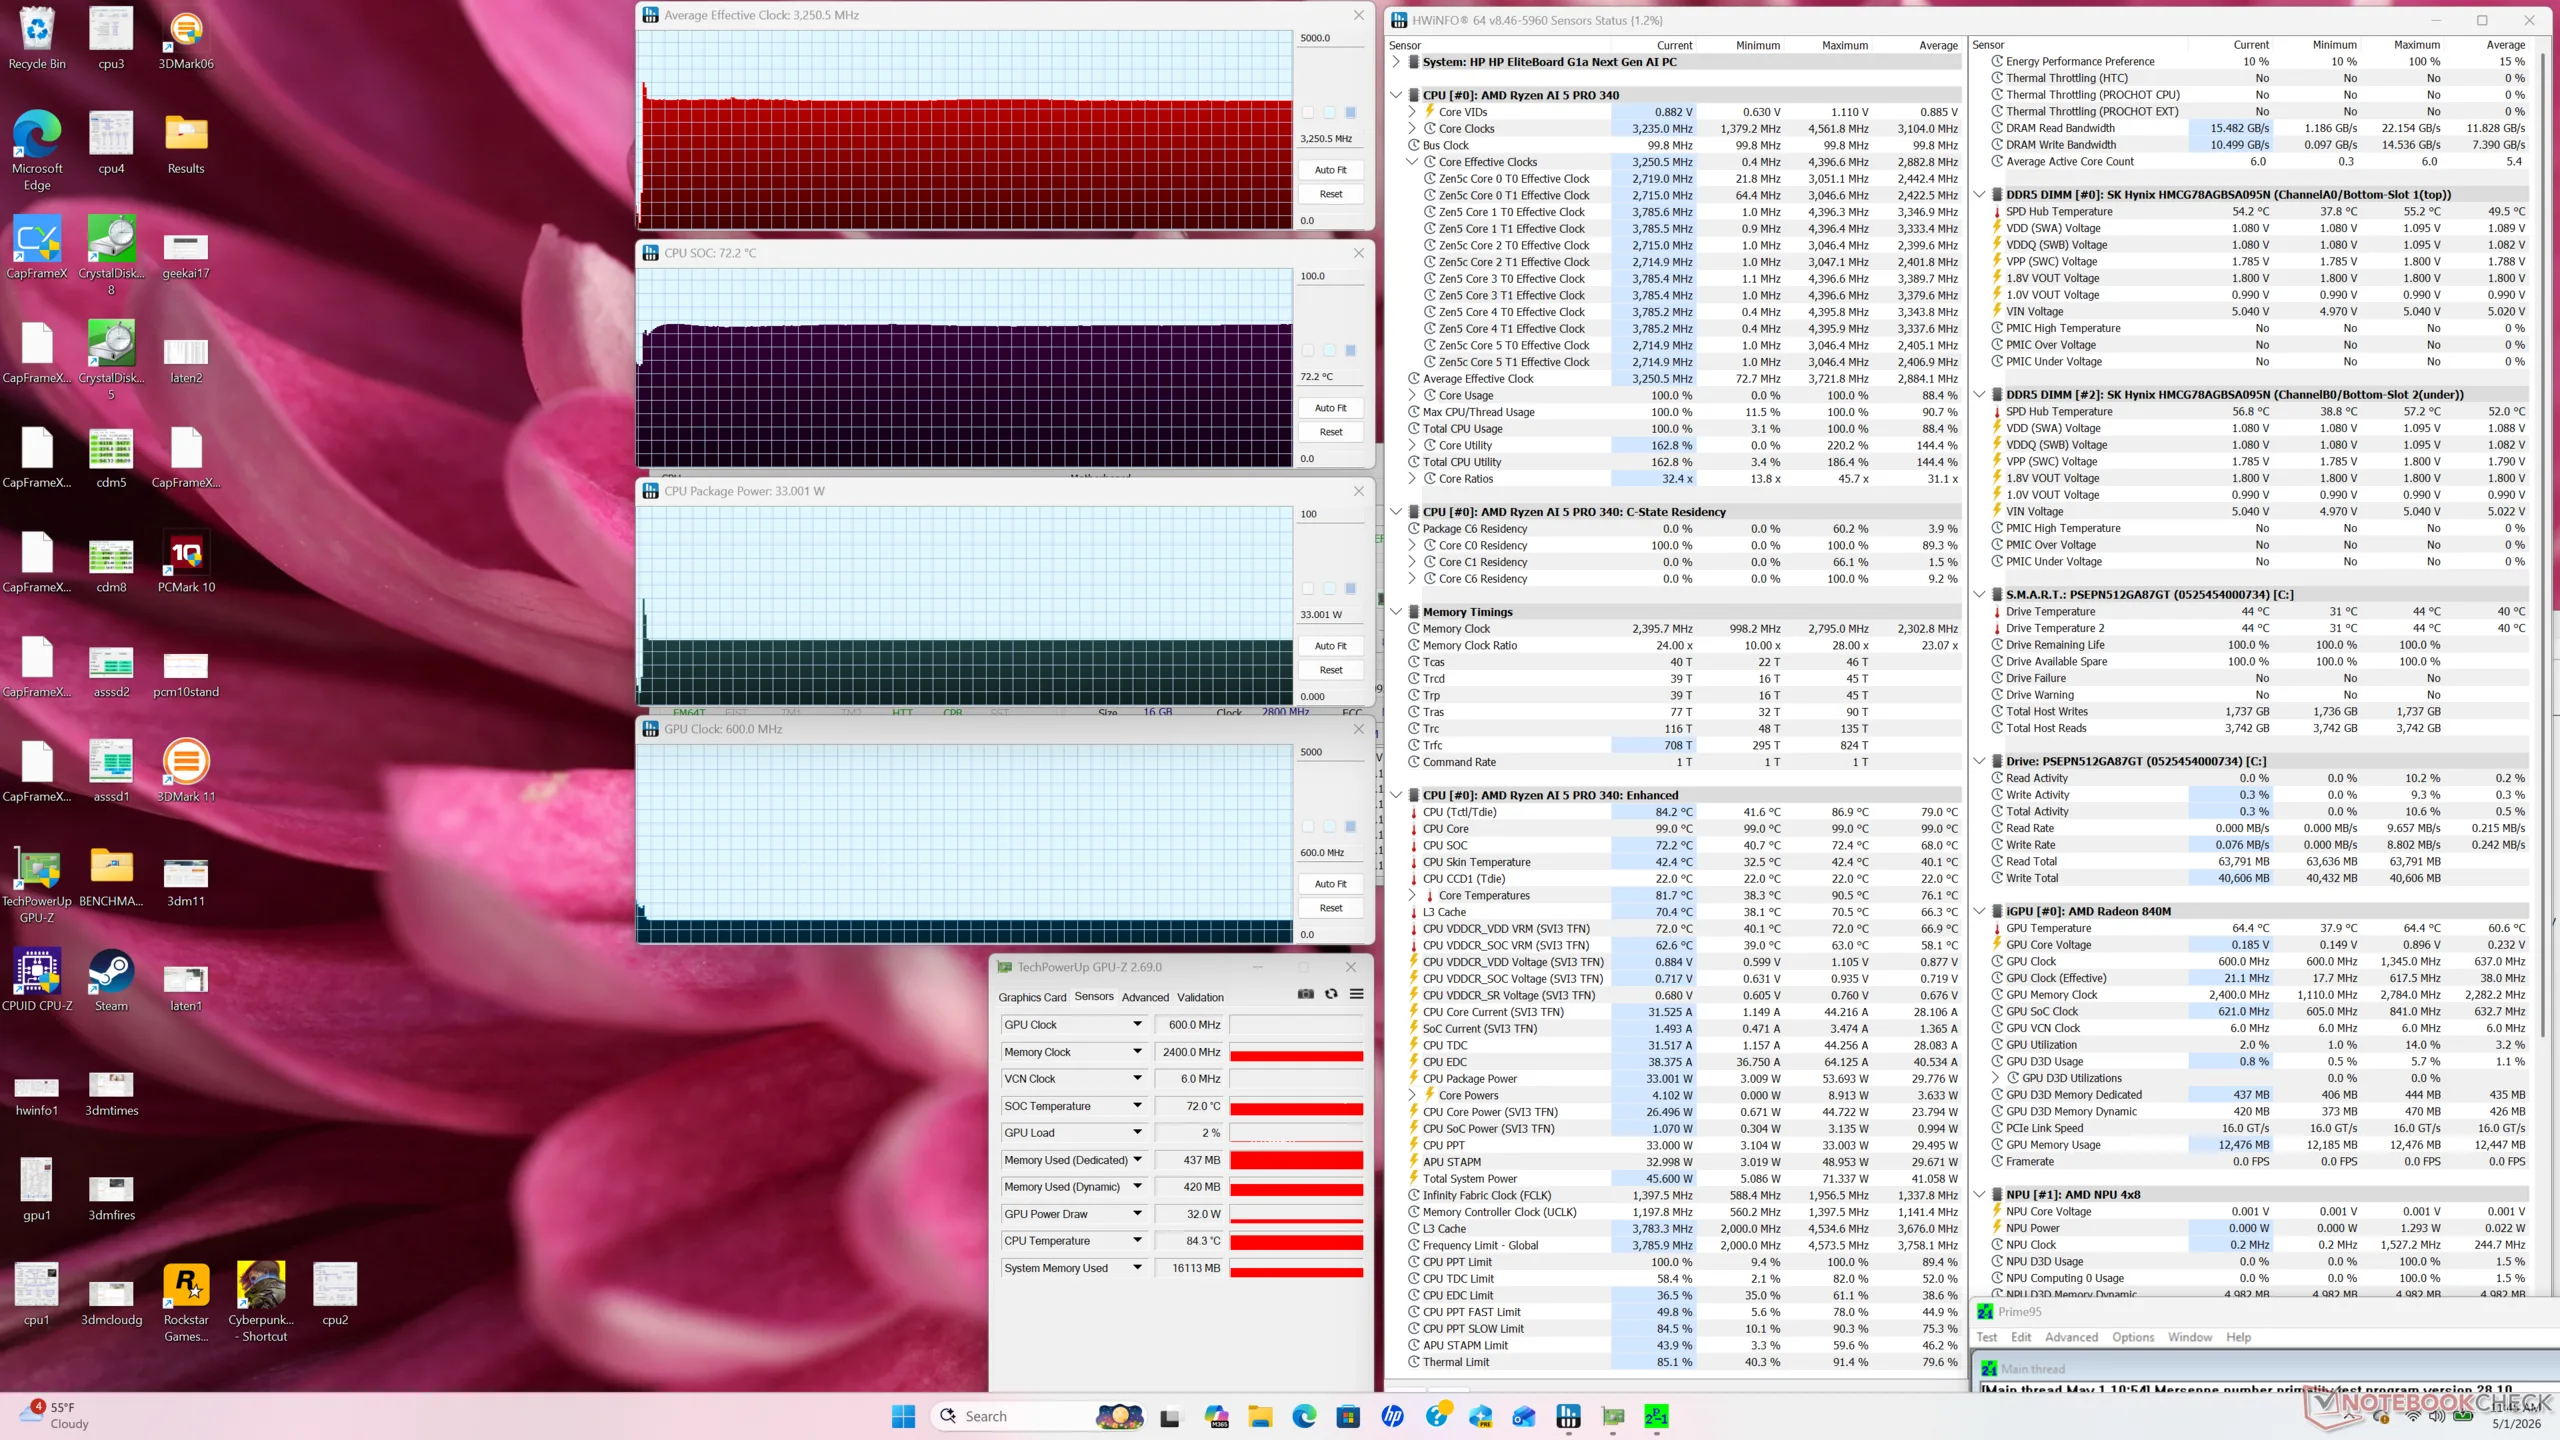
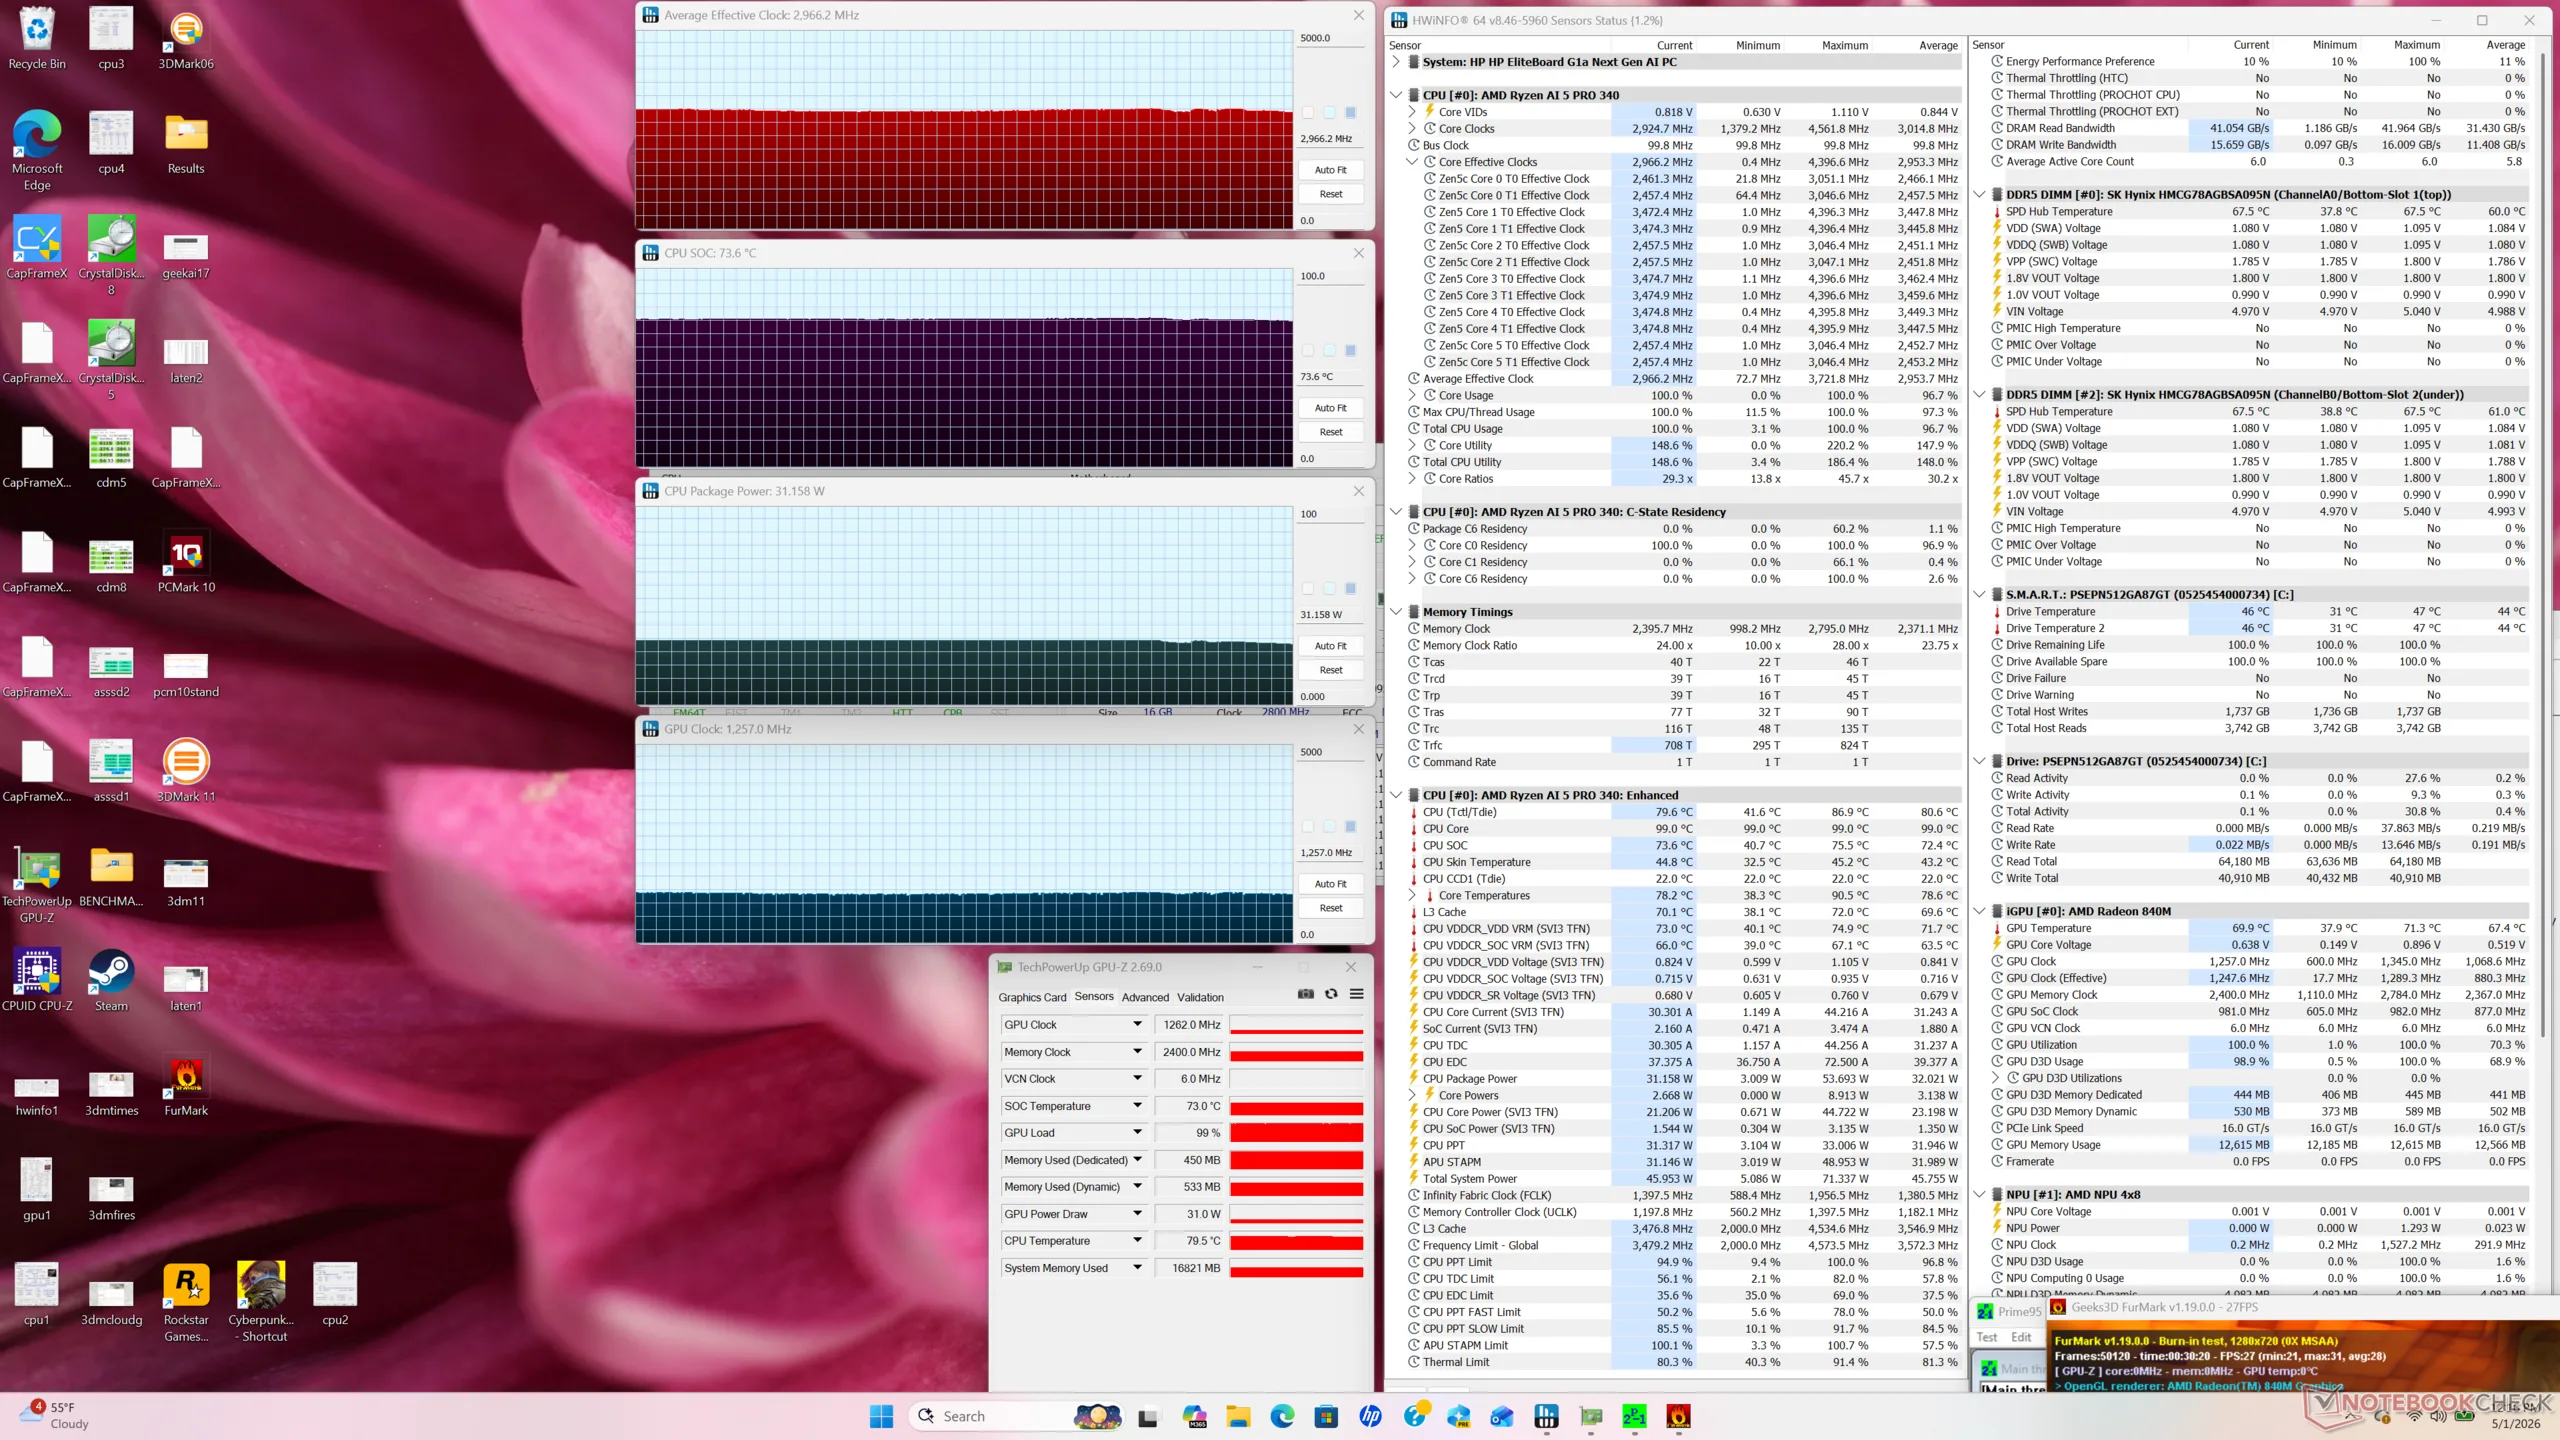
| Reloj medio de la CPU (GHz) | Reloj de la GPU (MHz) | Temperatura media de la CPU (°C) | |
| Sistema en reposo | -- | 696 | 42 |
| Prime95 Estrés | 3.3 | -- | 72 |
| Prime95 + FurMark Stress | 3.0 | 1257 | 74 |
| Cyberpunk 2077 Estrés | 0,6 | 2869 | 71 |
Altavoces
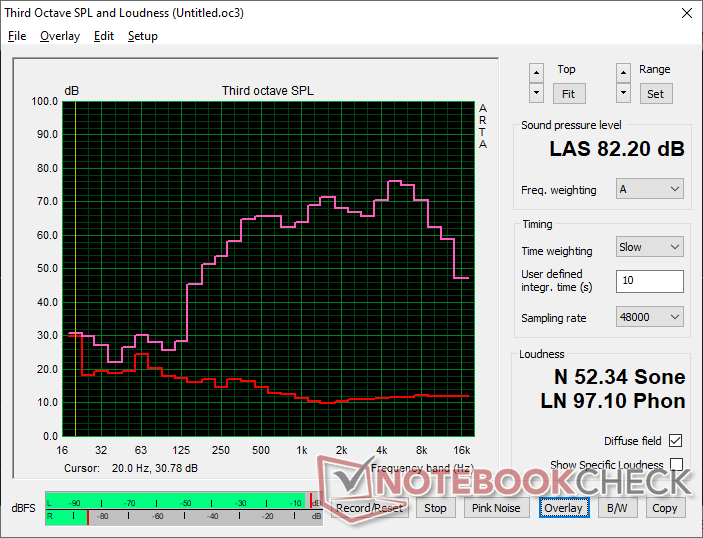
HP EliteBoard G1a AI análisis de audio
(+) | los altavoces pueden reproducir a un volumen relativamente alto (#82.2 dB)
Graves 100 - 315 Hz
(-) | casi sin bajos - de media 21% inferior a la mediana
(±) | la linealidad de los graves es media (11% delta a frecuencia anterior)
Medios 400 - 2000 Hz
(+) | medios equilibrados - a sólo 2.4% de la mediana
(+) | los medios son lineales (5.4% delta a la frecuencia anterior)
Altos 2 - 16 kHz
(±) | máximos más altos - de media 5.5% más altos que la mediana
(±) | la linealidad de los máximos es media (7.2% delta a frecuencia anterior)
Total 100 - 16.000 Hz
(±) | la linealidad del sonido global es media (17.9% de diferencia con la mediana)
En comparación con la misma clase
» 21% de todos los dispositivos probados de esta clase eran mejores, 7% similares, 71% peores
» El mejor tuvo un delta de 13%, la media fue 24%, el peor fue ###max##%
En comparación con todos los dispositivos probados
» 37% de todos los dispositivos probados eran mejores, 8% similares, 55% peores
» El mejor tuvo un delta de 4%, la media fue 24%, el peor fue ###max##%
Apple MacBook Pro 16 2021 M1 Pro análisis de audio
(+) | los altavoces pueden reproducir a un volumen relativamente alto (#84.7 dB)
Graves 100 - 315 Hz
(+) | buen bajo - sólo 3.8% lejos de la mediana
(+) | el bajo es lineal (5.2% delta a la frecuencia anterior)
Medios 400 - 2000 Hz
(+) | medios equilibrados - a sólo 1.3% de la mediana
(+) | los medios son lineales (2.1% delta a la frecuencia anterior)
Altos 2 - 16 kHz
(+) | máximos equilibrados - a sólo 1.9% de la mediana
(+) | los máximos son lineales (2.7% delta a la frecuencia anterior)
Total 100 - 16.000 Hz
(+) | el sonido global es lineal (4.6% de diferencia con la mediana)
En comparación con la misma clase
» 0% de todos los dispositivos probados de esta clase eran mejores, 0% similares, 100% peores
» El mejor tuvo un delta de 5%, la media fue 17%, el peor fue ###max##%
En comparación con todos los dispositivos probados
» 0% de todos los dispositivos probados eran mejores, 0% similares, 100% peores
» El mejor tuvo un delta de 4%, la media fue 24%, el peor fue ###max##%
Gestión de la energía
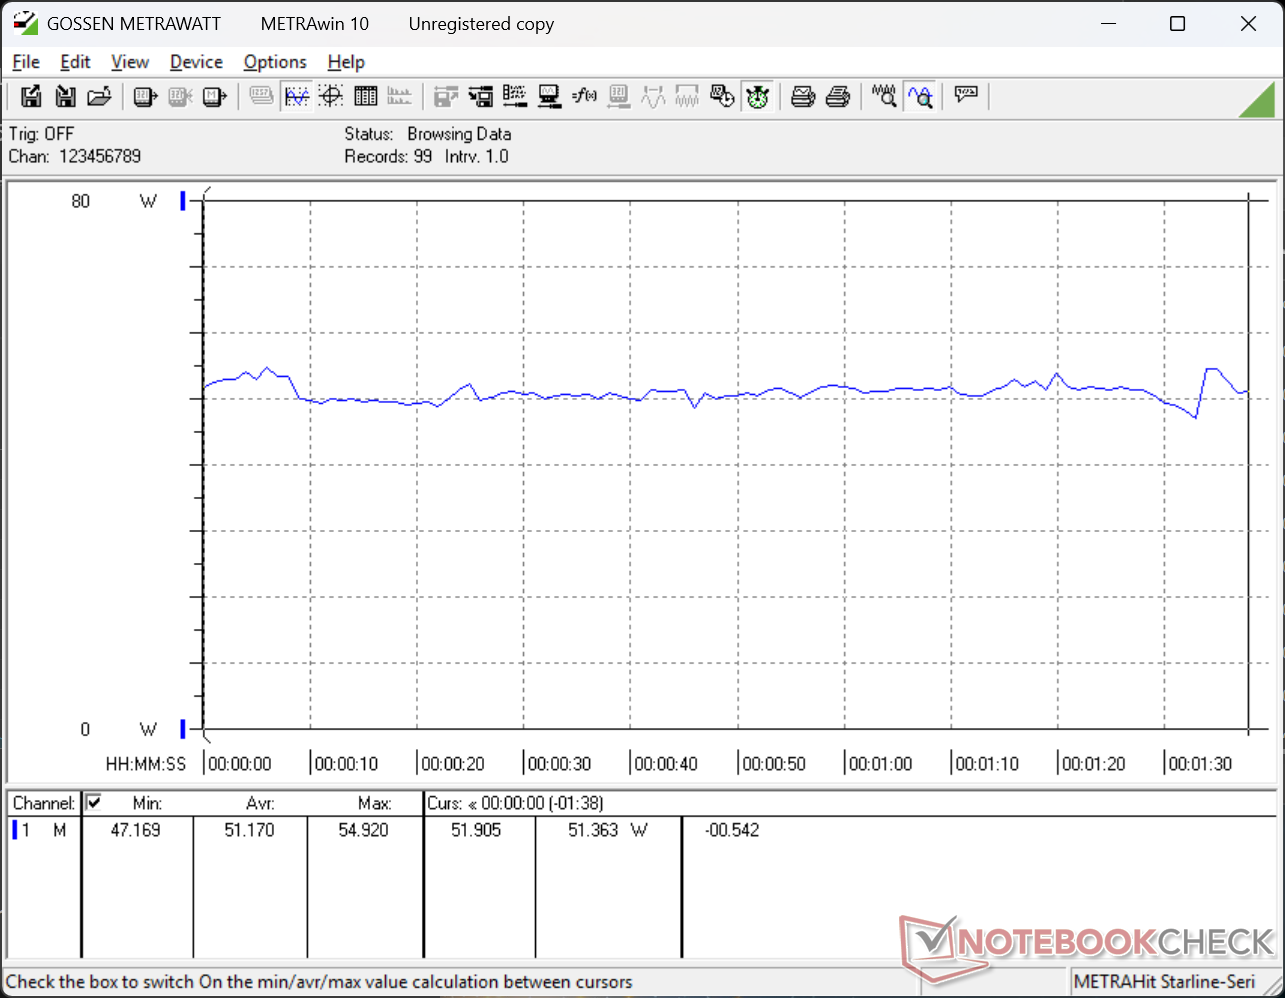
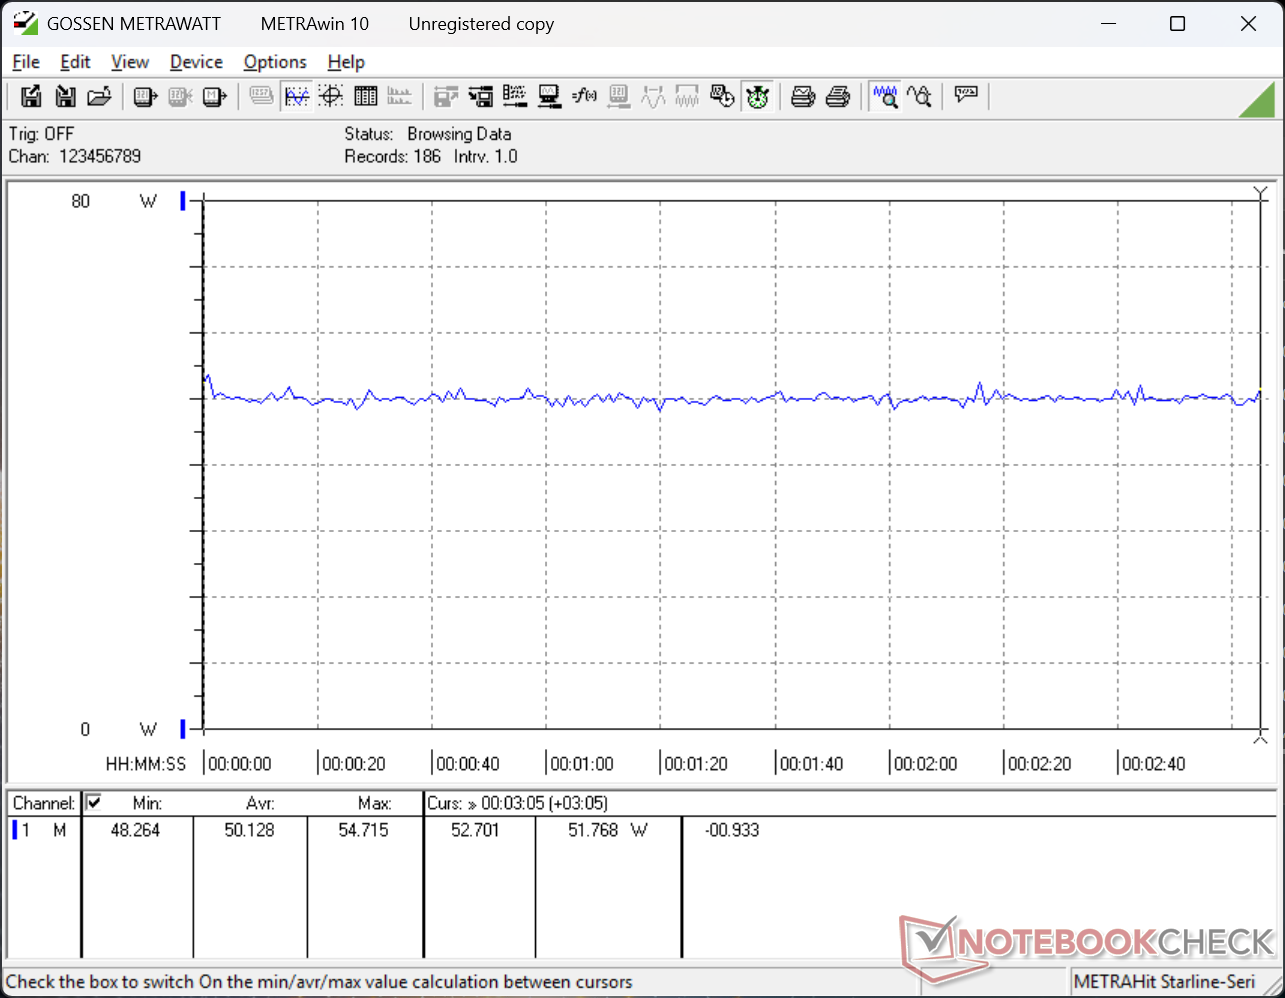
Consumo de energía
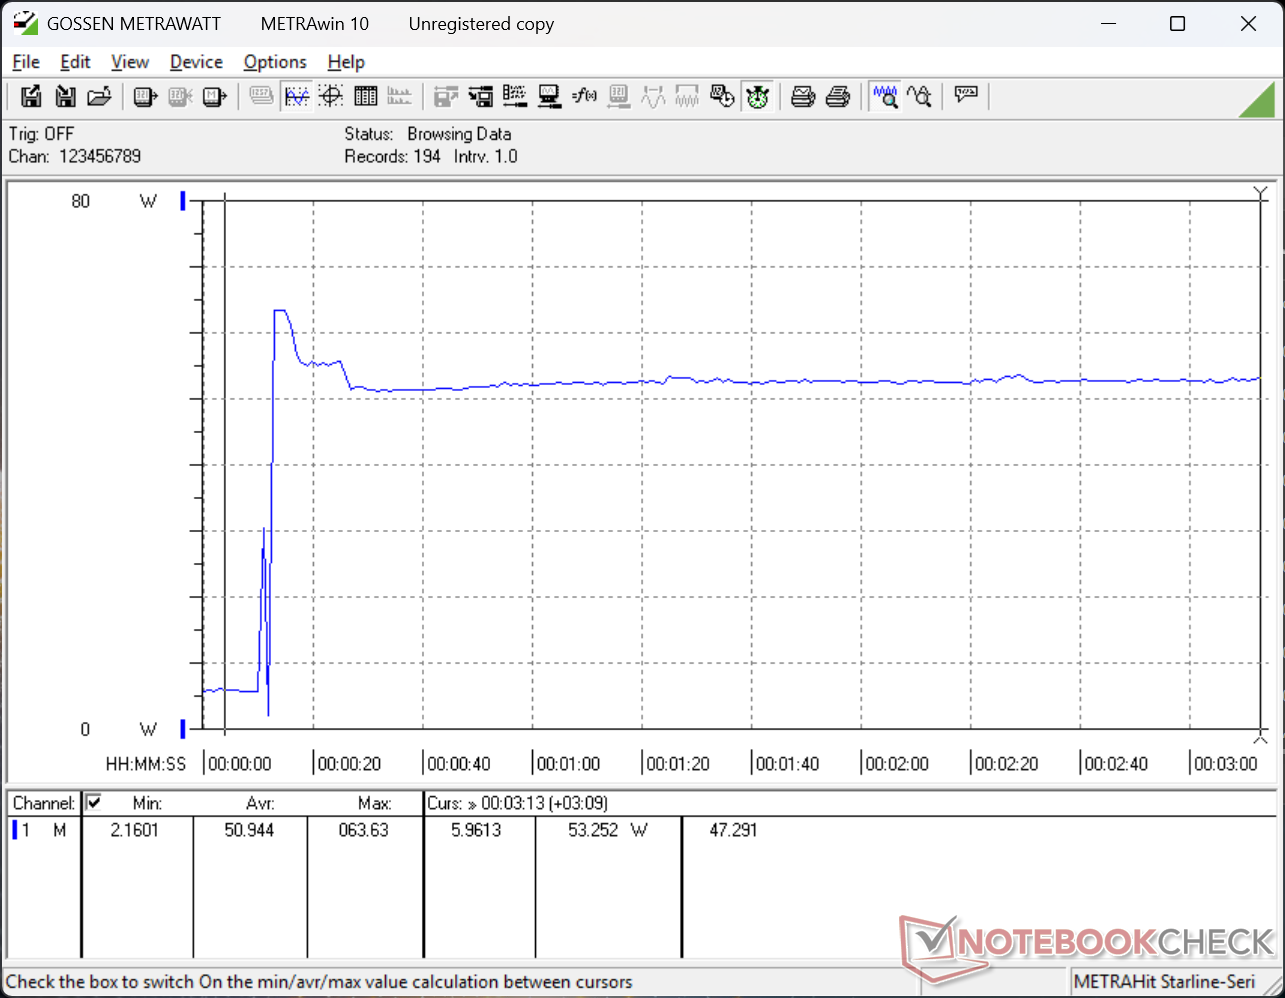
El consumo puede alcanzar más de 50 W cuando está bajo carga para ser más exigente que los mini PC Lunar Lake como el NucBox K13. Sin embargo, el bajo consumo es más habitual cuando simplemente se navega por la web o se está en reposo.
| Off / Standby | |
| Ocioso | |
| Carga |
|
Clave:
min: | |
| HP EliteBoard G1a AI Ryzen AI 5 340, Radeon 840M, , , x, | Geekom A5 Pro R5 7530U, Vega 7, Wodposit WPBSN4M8-1TGP, , x, | GMK NucBox K13 Core Ultra 7 256V, Arc 140V, Huawei eKitStor Xtreme 200e 1 TB, , x, | Asus NUC 15 Pro+ Ultra 9 285H, Arc 140T, Micron 3500 1TB MTFDKBA1T0TGD, , x, | MSI Cubi NUC AI+ 2MG Core Ultra 7 258V, Arc 140V, Phison 1 TB ESR01TBTCCZ-27J, , x, | HP Pro Mini 400 G9-937U0EA i5-14500T, UHD Graphics 770, HP PSEJN512GA87EC0, , x, | |
|---|---|---|---|---|---|---|
| Power Consumption | 33% | 39% | -32% | 9% | -22% | |
| Idle Minimum * (Watt) | 4.7 | 3.2 32% | 2.3 51% | 3.9 17% | 2.9 38% | 4.9 -4% |
| Idle Average * (Watt) | 5.4 | 4.3 20% | 3.6 33% | 6.1 -13% | 5.7 -6% | 8 -48% |
| Idle Maximum * (Watt) | 7.9 | 5.1 35% | 5.8 27% | 8.2 -4% | 10.2 -29% | 13.3 -68% |
| Load Average * (Watt) | 51.2 | 32.1 37% | 27.3 47% | 56.1 -10% | 38.7 24% | 44.6 13% |
| Cyberpunk 2077 ultra external monitor * (Watt) | 50.1 | 29.4 41% | 31.6 37% | 63.9 -28% | 41.1 18% | 49 2% |
| Load Maximum * (Watt) | 63.6 | 43.5 32% | 39.6 38% | 160.6 -153% | 60 6% | 81.3 -28% |
* ... más pequeño es mejor
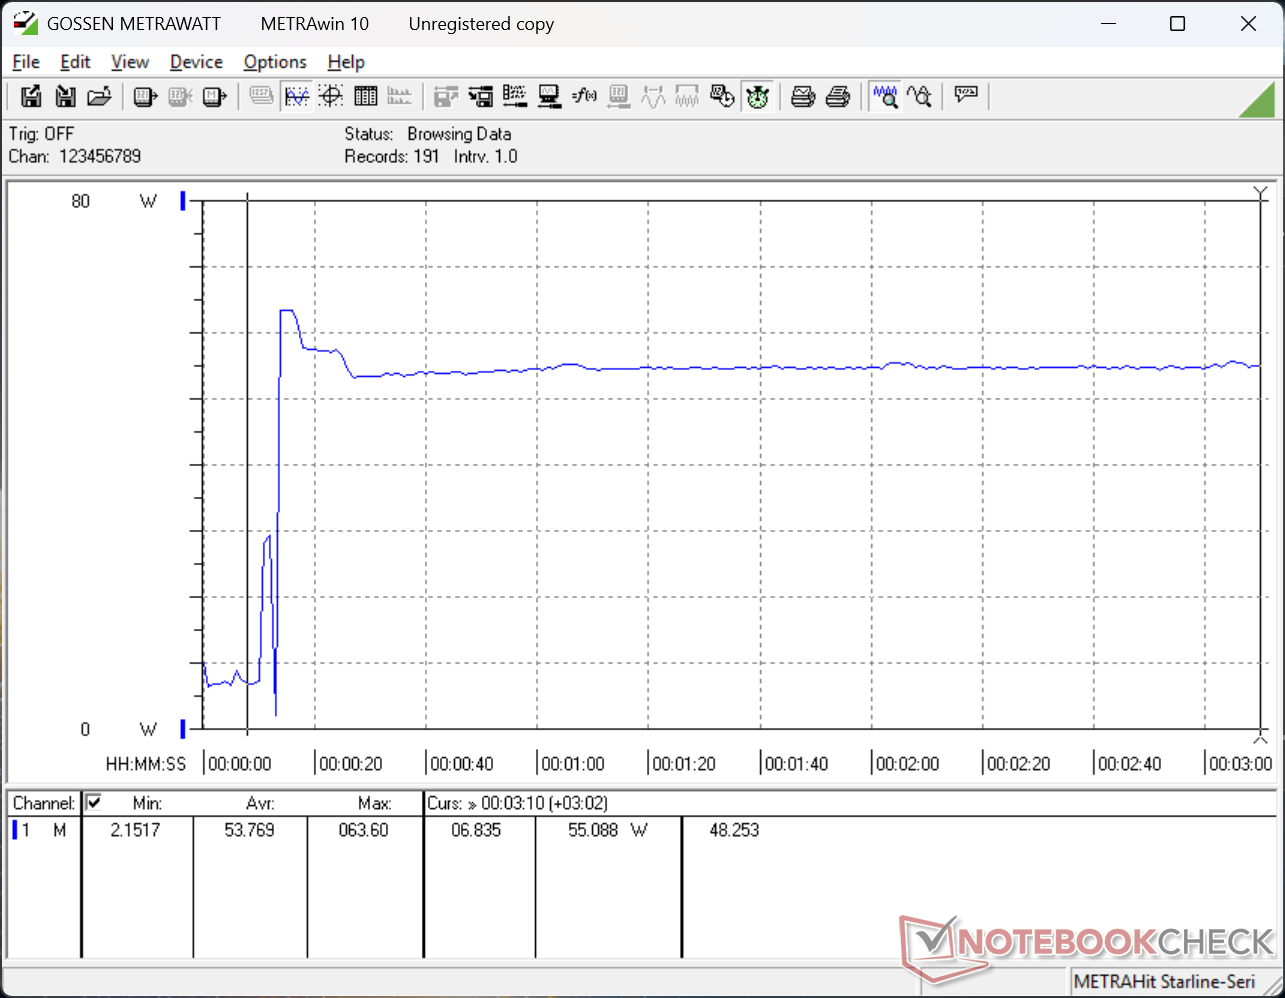
Consumo de energía Cyberpunk / Prueba de estrés
Consumo de energía Monitor externo
Duración de las pilas
La pequeña batería opcional de 32 Wh puede durar unas 8 horas de navegación WLAN constante cuando se conecta a un monitor HDMI. Cuando se conecta mediante USB-C con PD, la duración de la batería deja de ser un problema.
Valoración de Notebookcheck
Un PC en un teclado perfecto para espacios de trabajo más reducidos o terminales en los que una torre de PC tradicional puede resultar excesiva. Sin embargo, el sistema solo USB-C depende en gran medida de adaptadores.
HP EliteBoard G1a AI
- 05/05/2026 v8
Allen Ngo
 Total Sustainability Score:
 Competidores potenciales en comparación
Imagen | Modelo | Precio | Peso | Altura | Pantalla |
|---|---|---|---|---|---|
1. 75.6%  | HP EliteBoard G1a AI AMD Ryzen AI 5 PRO 340 ⎘ AMD Radeon 840M ⎘ 32 GB Memoría | Amazon: 1. $1,593.78 HP EliteBoard G1a Next Gen A... 2. HP EliteBoard G1a Next Gen A... 3. $1,964.80 HP EliteBook 6 G1a 16" Noteb... Precio de catálogo: 1800 USD | 771 g | 17.9 mm | x |
2. 72.6%  | Geekom A5 Pro AMD Ryzen 5 7530U ⎘ AMD Radeon RX Vega 7 ⎘ 16 GB Memoría, 1024 GB SSD | Amazon: Precio de catálogo: 619€ | 423 g | 37 mm | x |
3. 77.4%  | GMK NucBox K13 Intel Core Ultra 7 256V ⎘ Intel Arc Graphics 140V ⎘ 16 GB Memoría, 1000 GB SSD | Amazon: Precio de catálogo: 670 USD | 506 g | 36.6 mm | x |
4. 77.5% 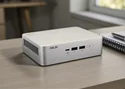 | Asus NUC 15 Pro+ Intel Core Ultra 9 285H ⎘ Intel Arc Graphics 140T ⎘ 32 GB Memoría, 1024 GB SSD | Amazon: $1,642.00 Precio de catálogo: 991€ | 690 g | 42 mm | x |
5. 75.2%  | MSI Cubi NUC AI+ 2MG Intel Core Ultra 7 258V ⎘ Intel Arc Graphics 140V ⎘ 32 GB Memoría, 1000 GB SSD | Amazon: Precio de catálogo: 900 USD | 669 g | 50.1 mm | x |
6. 70.8%  | HP Pro Mini 400 G9-937U0EA Intel Core i5-14500T ⎘ Intel UHD Graphics 770 ⎘ 16 GB Memoría, 512 GB SSD | Amazon: 1. $399.99 HP Pro 400 G9 Mini PC Deskto... 2. $699.00 HP Pro Mini 400 G9 Tiny Desk... 3. $499.99 HP Pro 400 G9 Mini PC Deskto... Precio de catálogo: 870€ | 1.2 kg | 34 mm | x |
Transparencia
La selección de los dispositivos que se van a reseñar corre a cargo de nuestro equipo editorial. La muestra de prueba fue proporcionada al autor en calidad de préstamo por el fabricante o el minorista a los efectos de esta reseña. El prestamista no tuvo ninguna influencia en esta reseña, ni el fabricante recibió una copia de la misma antes de su publicación. No había ninguna obligación de publicar esta reseña. Como empresa de medios independiente, Notebookcheck no está sujeta a la autoridad de fabricantes, minoristas o editores.
Así es como prueba Notebookcheck
Cada año, Notebookcheck revisa de forma independiente cientos de portátiles y smartphones utilizando procedimientos estandarizados para asegurar que todos los resultados son comparables. Hemos desarrollado continuamente nuestros métodos de prueba durante unos 20 años y hemos establecido los estándares de la industria en el proceso. En nuestros laboratorios de pruebas, técnicos y editores experimentados utilizan equipos de medición de alta calidad. Estas pruebas implican un proceso de validación en varias fases. Nuestro complejo sistema de clasificación se basa en cientos de mediciones y puntos de referencia bien fundamentados, lo que mantiene la objetividad.
