

Notebookcheck Logo
Teaser

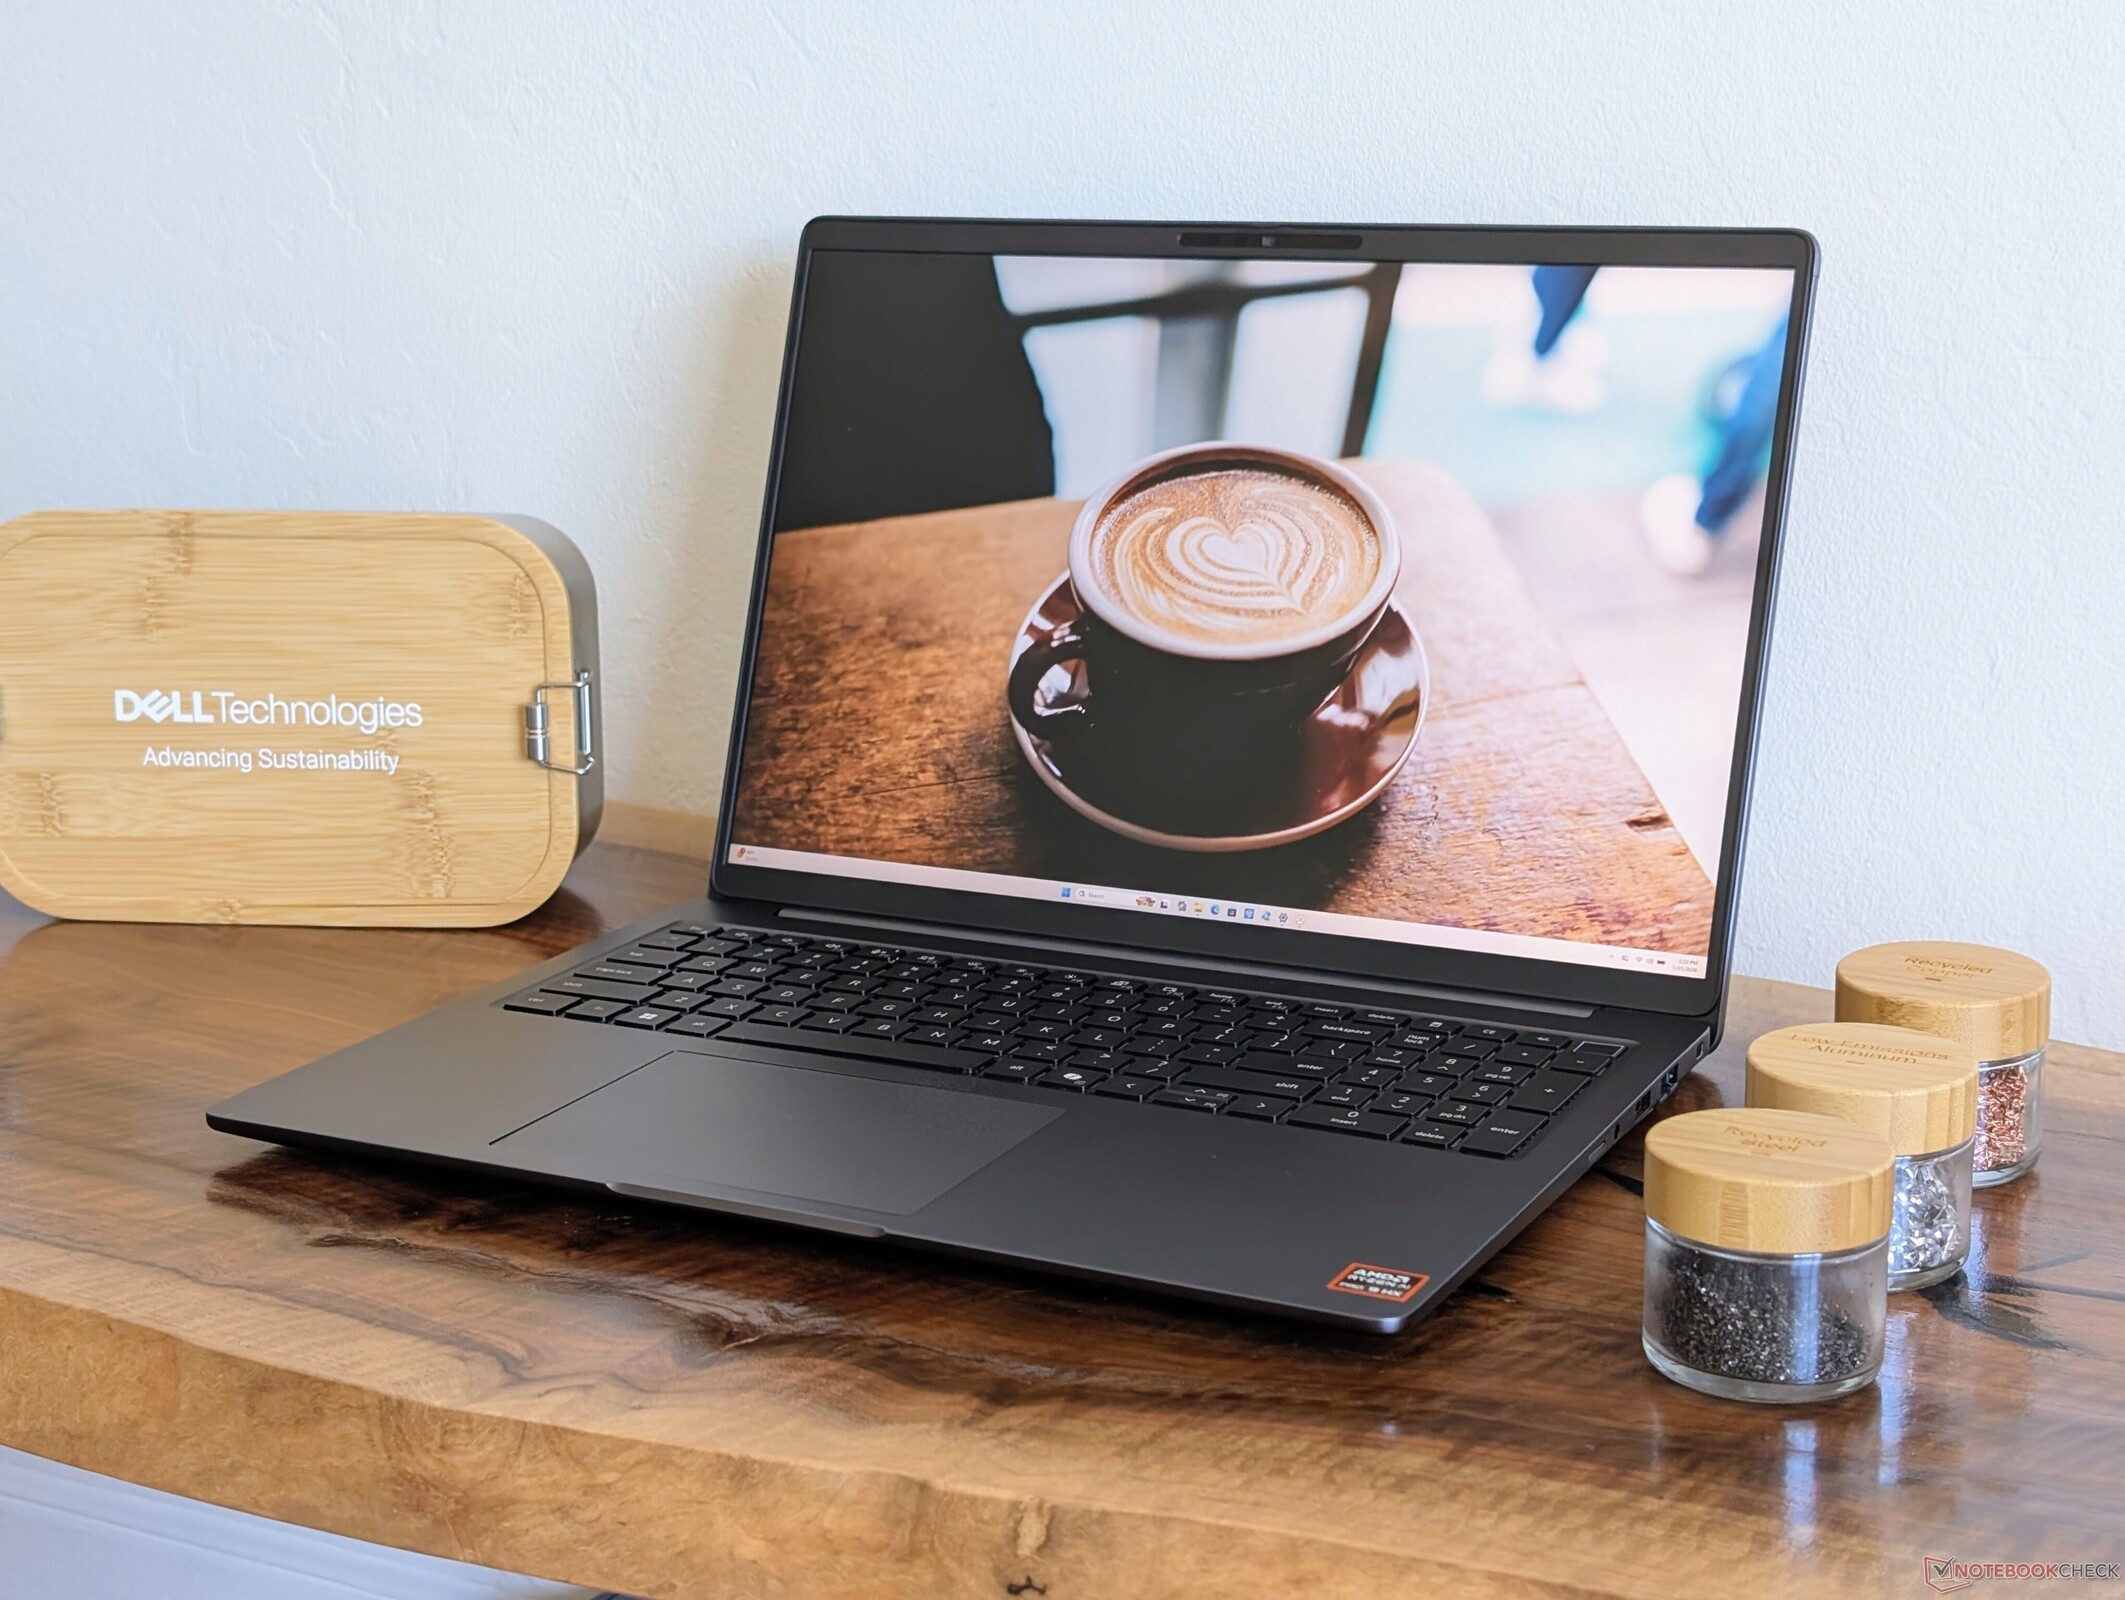
Reseña del Dell Pro 5 16 P516265: tradicional y fiable

Pantalla grande con numerosas opciones.

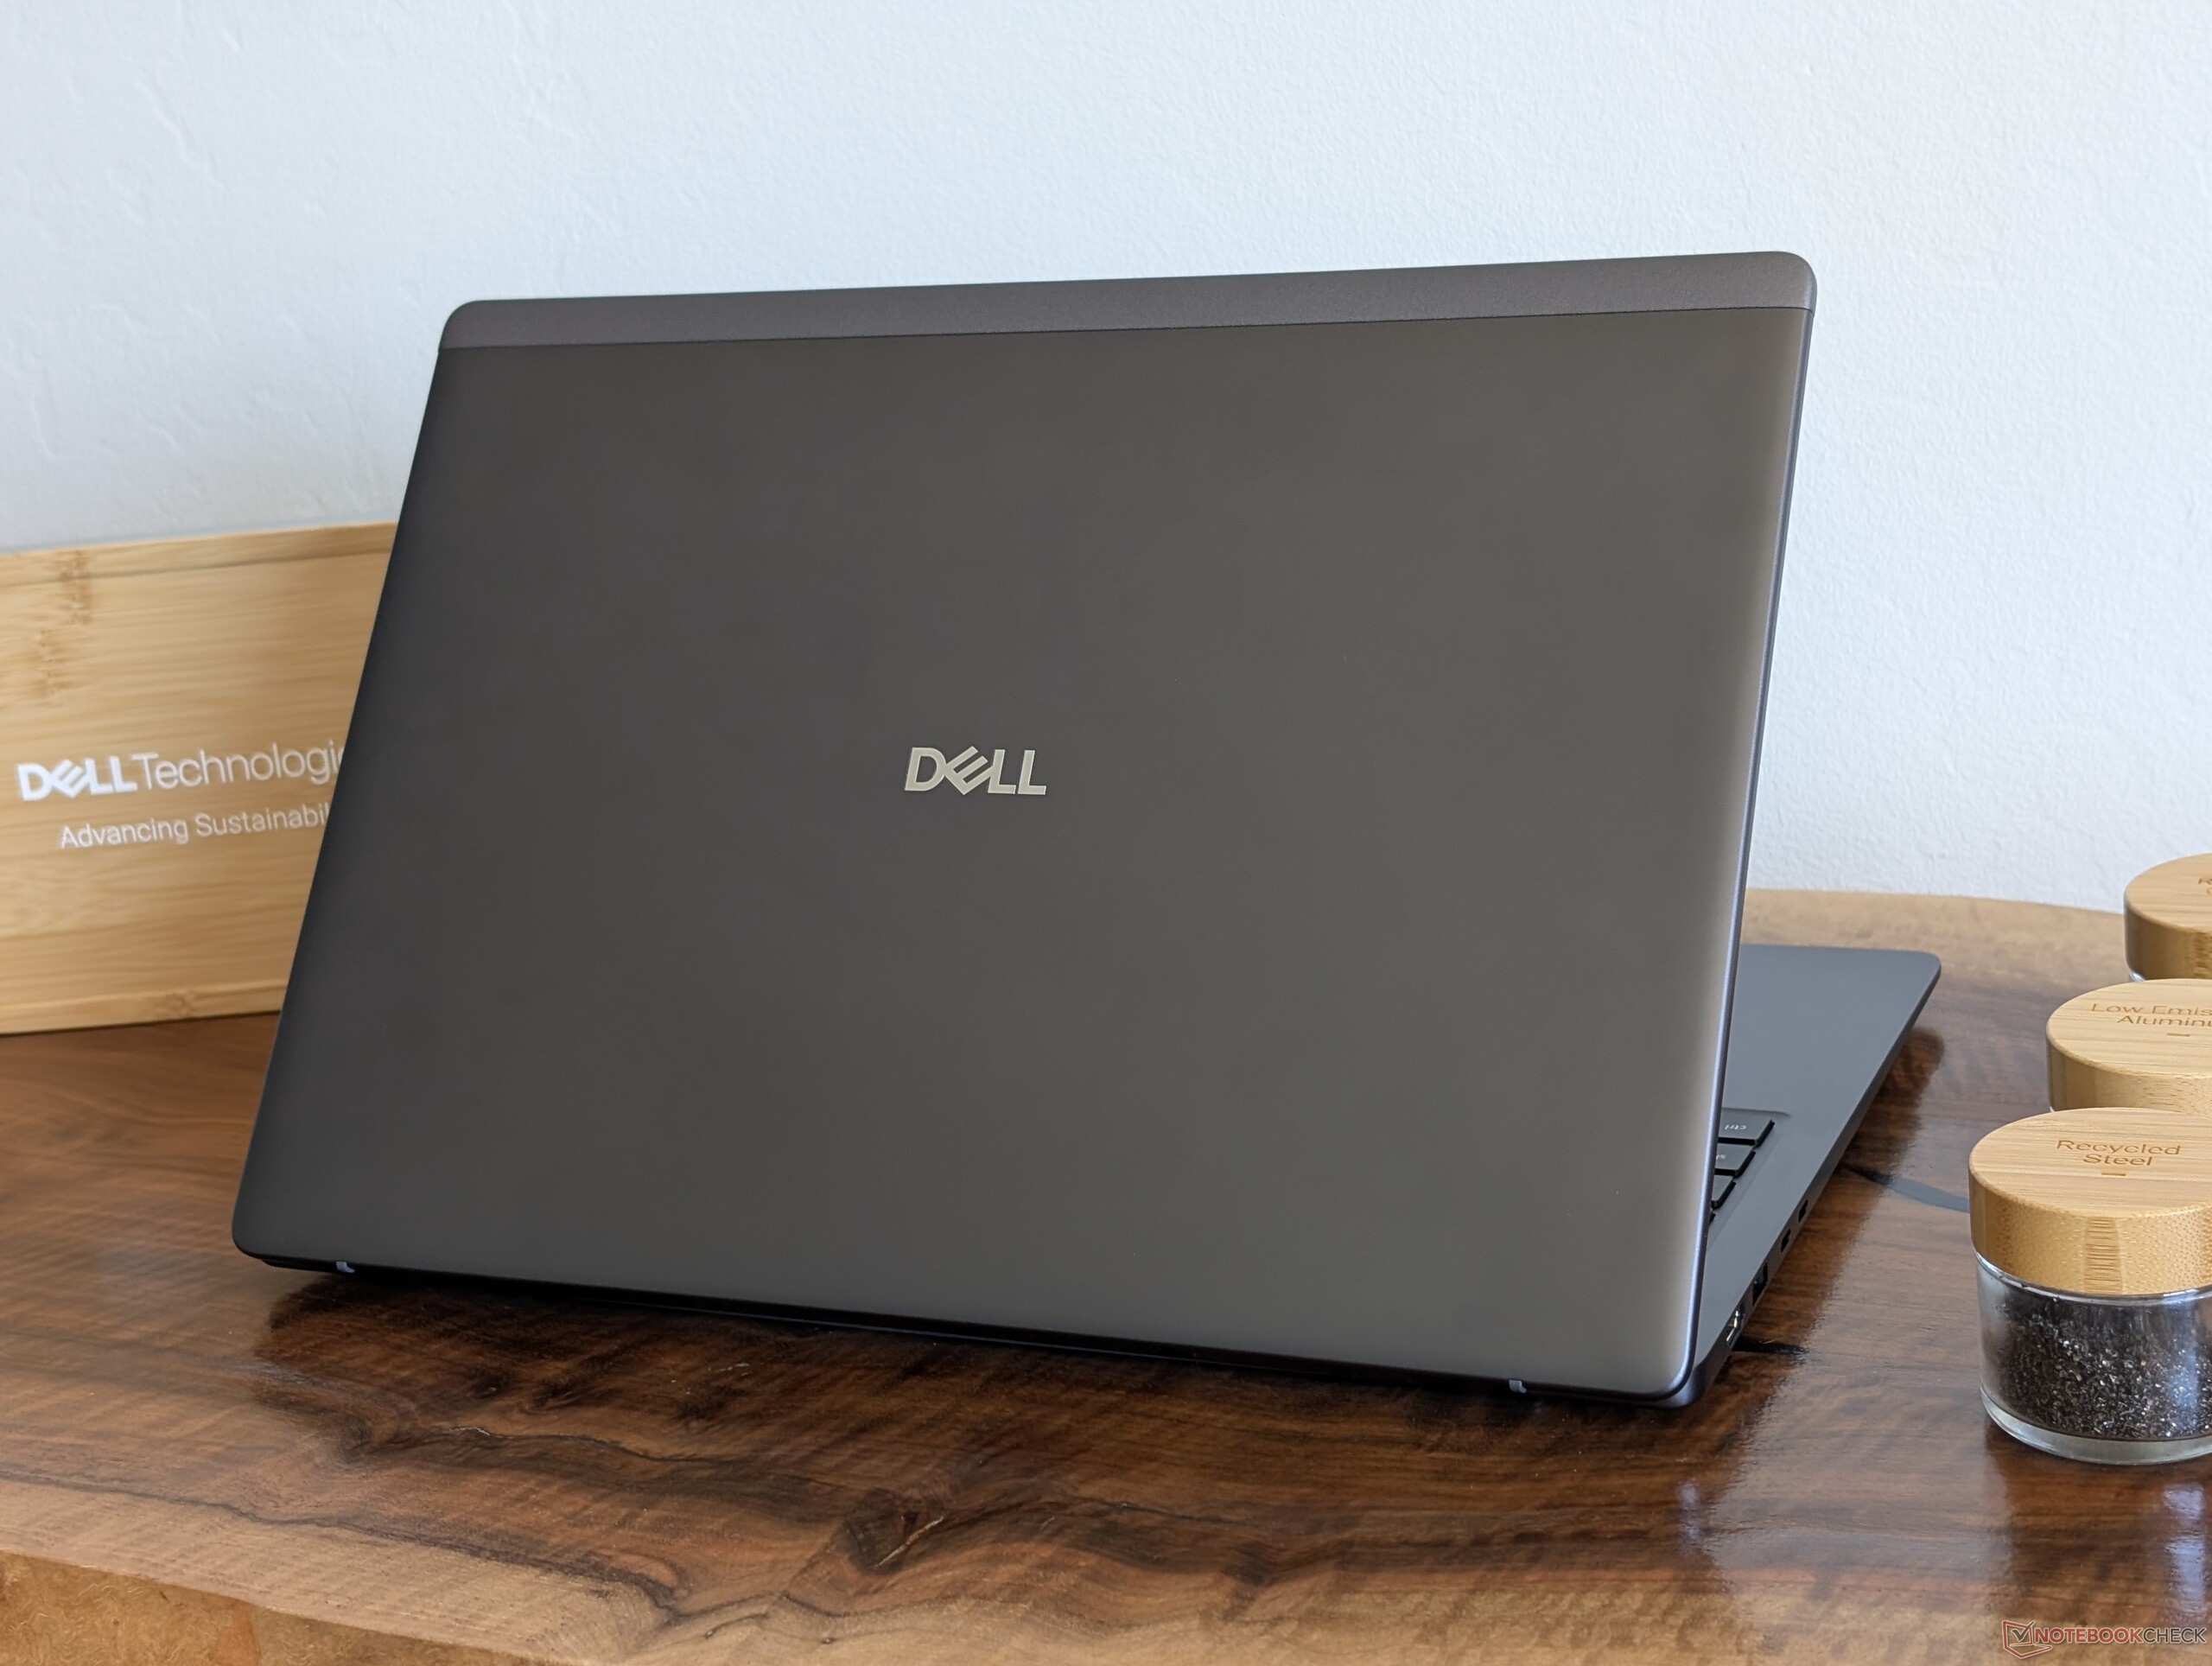
El Dell Pro 5 16 mantiene el carácter asequible de la serie Latitude 5000, además de ofrecer características auxiliares habituales, como conexión WAN y pantalla táctil, como extras opcionales. Las empresas u oficinas que no busquen nada sofisticado encontrarán en el Dell Pro 5 16 la opción ideal para la mayoría de los casos de uso.
Allen Ngo, 👁 Allen Ngo (traducido por DeepL / Ninh Duy) Publicado 🇺🇸 🇳🇱 ...
Laptop / Notebook Zen 5 AMD Business

Veredicto: una sencilla carcasa tipo clamshell para oficina bien diseñada

El Dell Pro 5 16 ofrece una pantalla de gran tamaño sin la tarjeta gráfica dedicada ni las opciones 4K, de las que muchos usuarios pueden prescindir. Por lo tanto, los precios parten de niveles más razonables, lo que lo convierte en una solución empresarial atractiva y sin florituras, especialmente para quienes valoran los entornos AMD Pro o Intel vPro. Además, merece una mención especial la memoria RAM extraíble, ya que la memoria soldada se está convirtiendo en algo habitual en la mayoría de los demás modelos.

El rendimiento bruto, cuando se configura con el Ryzen AI 9 HX Pro 470, resulta impresionante para un portátil empresarial de gama media. Tenga en cuenta que, aunque los modelos de Intel presentan un rendimiento del procesador ligeramente inferior al de AMD, la velocidad de la memoria RAM puede ser mayor, ya que, por el momento, la tecnología CAMM solo es configurable con Intel.

Hay algunos pequeños inconvenientes que merece la pena mencionar, la mayoría de los cuales probablemente sean deliberados para ahorrar costes. La carga por USB-C, por ejemplo, solo está disponible en el borde izquierdo del dispositivo, a diferencia del Dell Pro 7 14. La compatibilidad con SSD se limita únicamente a una unidad M.2 2242 de tamaño reducido, sin opciones secundarias. El compuesto de magnesio ligero, presente en el Dell Pro 7, no se encuentra en el Dell Pro 5. También se recomienda evitar las opciones de pantalla de gama baja debido a su reproducción del color notablemente inferior. No obstante, la amplia variedad de puertos integrados, junto con la conexión WAN opcional y la cámara web de 8 MP, debería satisfacer la mayoría de los casos de uso en la oficina.

Pro

+ buen rendimiento del procesador para su categoría
+ módulos SODIMM DDR5 extraíbles
+ WAN y OLED son opcionales
+ altavoces internos potentes
+ buena duración de la batería

Contra

- No es compatible con unidades SSD M.2 2280 de tamaño completo
- Colores de pantalla deficientes en las opciones de pantalla básicas
- Opciones CAMM solo para referencias de Intel
- No es compatible con unidades SSD secundarias
- No hay opciones 4K ni Arc B390

Precio y disponibilidad

El Dell Pro 5 16 se comercializa actualmente en versiones con procesadores AMD e Intel, con precios que van desde unos 2.000 dólares hasta más de 4.500 dólares si se configura al máximo.

Al igual que la serie Dell Pro 7 sustituye a la anterior serie Latitude 7000, la serie Dell Pro 5 sustituye a la anterior serie Latitude 5000. El Dell Pro 5 16 es un portátil empresarial de gama media, pero cuenta con muchas de las mismas opciones de procesador que se encuentran en la serie Dell Pro 7, de mayor precio.

Nuestra unidad de prueba del Dell Pro 5 16 es una configuración AMD de gama alta con la CPU Ryzen AI 9 HX Pro 470 Zen 5 y una pantalla IPS de 1600p a 120 Hz, por un precio aproximado de 4500 dólares. Los modelos de gama más baja parten del Ryzen AI 5 Pro 435, con pantalla de 1200p a 60 Hz y mucha menos memoria RAM, a un precio considerablemente inferior. Este modelo también está disponible con opciones de la serie Intel Core 3.

Entre las alternativas al Dell Pro 5 16 se incluyen otros portátiles de gama media orientados al ámbito empresarial, como la serie HP EliteBook 8, el MSI Venture 16 AI o la serie Lenovo ThinkPad E.

Más reseñas de Dell:

Especificaciones

Dell Pro 5 16 P516265
Procesador
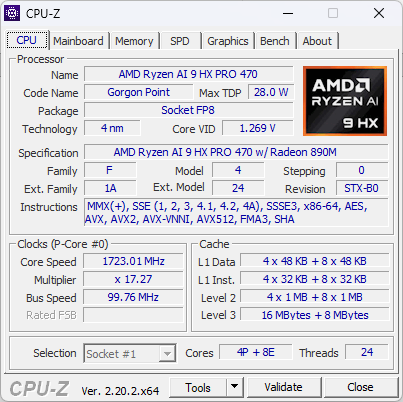
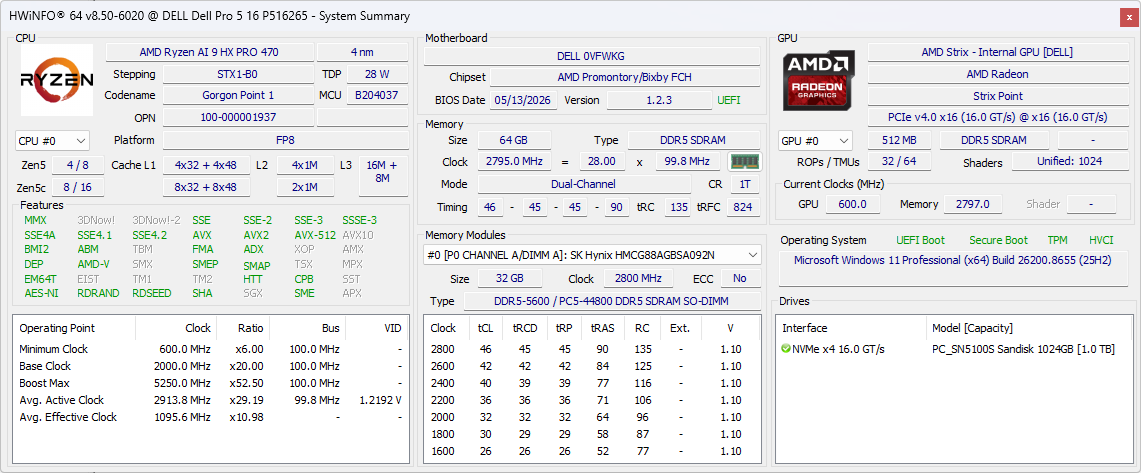
AMD Ryzen AI 9 HX PRO 470 12c/24t, 4 x 5.2 GHz AMD Zen 5, 8 x 3.3 GHz AMD Zen 5c, 43 W PL2 / Short Burst, 33 W PL1 / Sustained, Gorgon Point
Adaptador gráfico
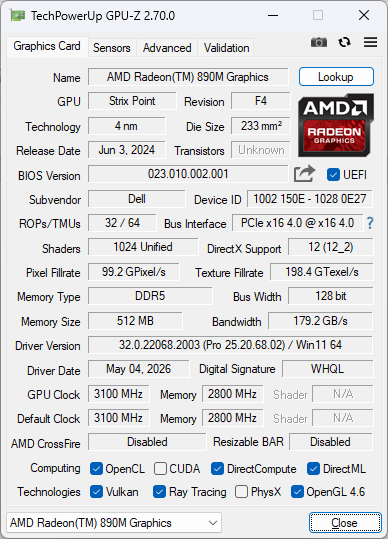
AMD Radeon 890M, Núcleo: 2590 MHz, Memoría: 2800 MHz, DDR5, 32.0.22068.2003
Memoría
64 GB 
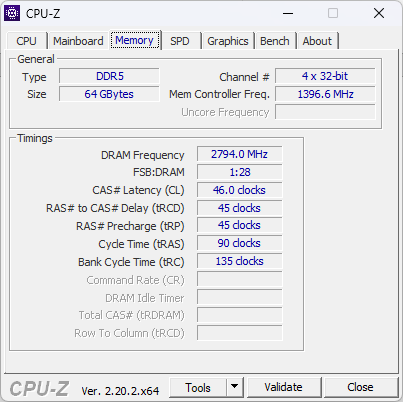
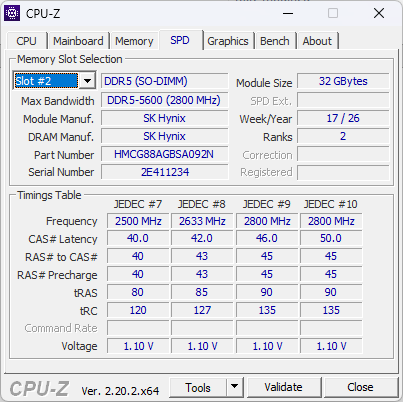
, DDR5-5600, SK Hynix, 46-45-45-90, Dual-Channel
pantalla
16.00 pulgadas 16:10, 2560 x 1600 pixels 189 PPI, BOE NS16M30, IPS, Dell P/N: 270R4, lustroso: no, 120 Hz
Placa base
AMD Promontory/Bixby FCH
Disco duro
SanDisk PC SN5100S, 1024 GB 
Tarjeta de sonido
AMD Zen - Audio Processor - HD Audio Controller
Conexiones
2 USB 3.0, 2 Thunderbolt 4, USB-C Power Delivery (PD), 1 HDMI, 2 DisplayPort, 1 Kensington Lock, Audio Conexiones: 3.5 mm combo, 1 Lector de Huellas Digitales
Equipamento de red
Realtek RTL8168/8111 Gigabit-LAN (10/100/1000MBit/s), Mediatek Wi-Fi 7 MT7925 Wireless LAN Card (a/b/g/ac = Wi-Fi 5/ax = Wi-Fi 6/ Wi-Fi 6E 6 GHz be = Wi-Fi 7), Bluetooth 5.4
Tamaño
Alto x ancho x profundidad (en mm): 18.95 x 358.6 x 253.4
Battería
70 Wh, 3-cell
Sistema Operativo
Microsoft Windows 11 Pro
Cámara
Webcam: 1440p30
Cámara principal: 8.3 MPix
Características adicionales
Altavoces: 2x 2 W, Teclado: Chiclet, Luz de Teclado: si, Dell Command, Update, Optimizer, SupportAssist, Trusted Device, 36 Meses Garantía
Peso
2.034 kg, Suministro de Electricidad: 327 g
Precio
4500 USD
Amazon
Nota: El fabricante puede utilizar componentes de diferentes proveedores, incluidos paneles de visualización, unidades o lápices de memoria con especificaciones similares.


Caso

Comparación de tamaños

359.3 mm 245.25 mm 23.15 mm 2.1 kg358.6 mm 253.4 mm 18.95 mm 2 kg357.9 mm 247.9 mm 18.2 mm 1.9 kg358 mm 254 mm 18 mm 1.7 kg359 mm 250 mm 15.5 mm 1.9 kg352.58 mm 237.47 mm 14.62 mm 1.7 kg297 mm 210 mm 1 mm 5.7 g

Conectividad

Parte frontal: Sin puertos
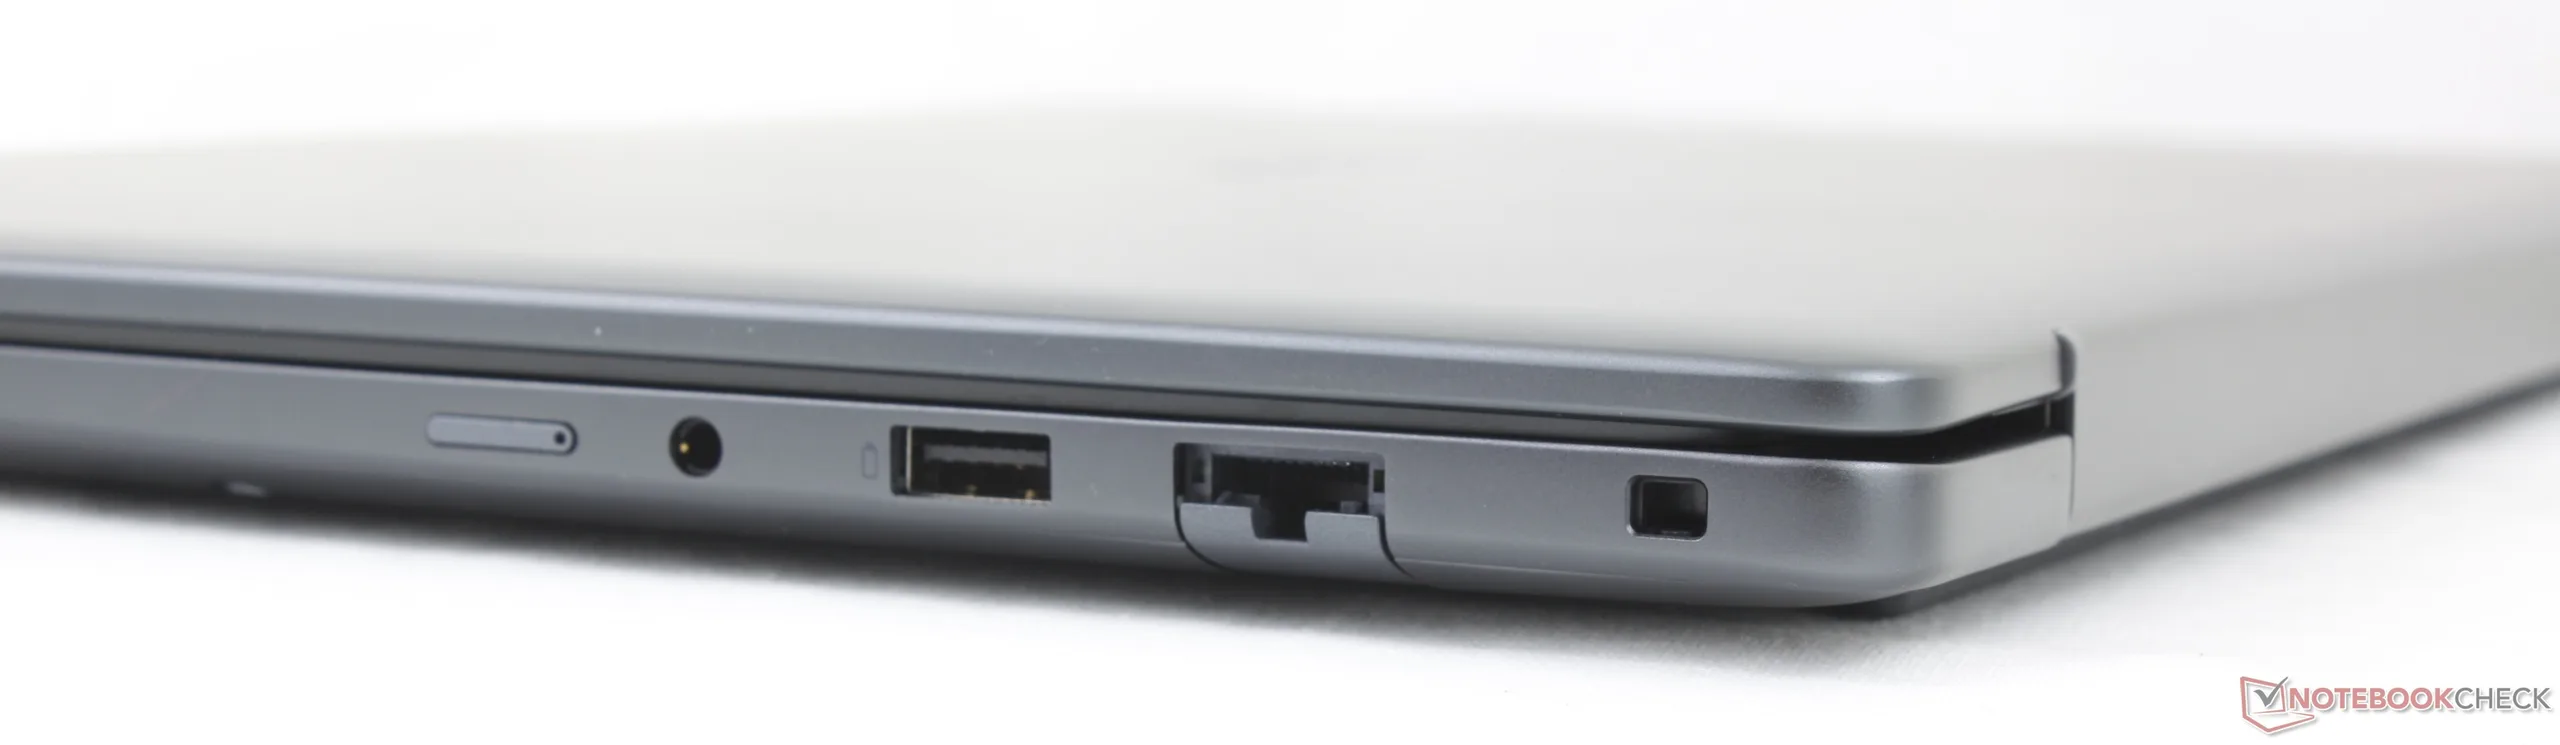
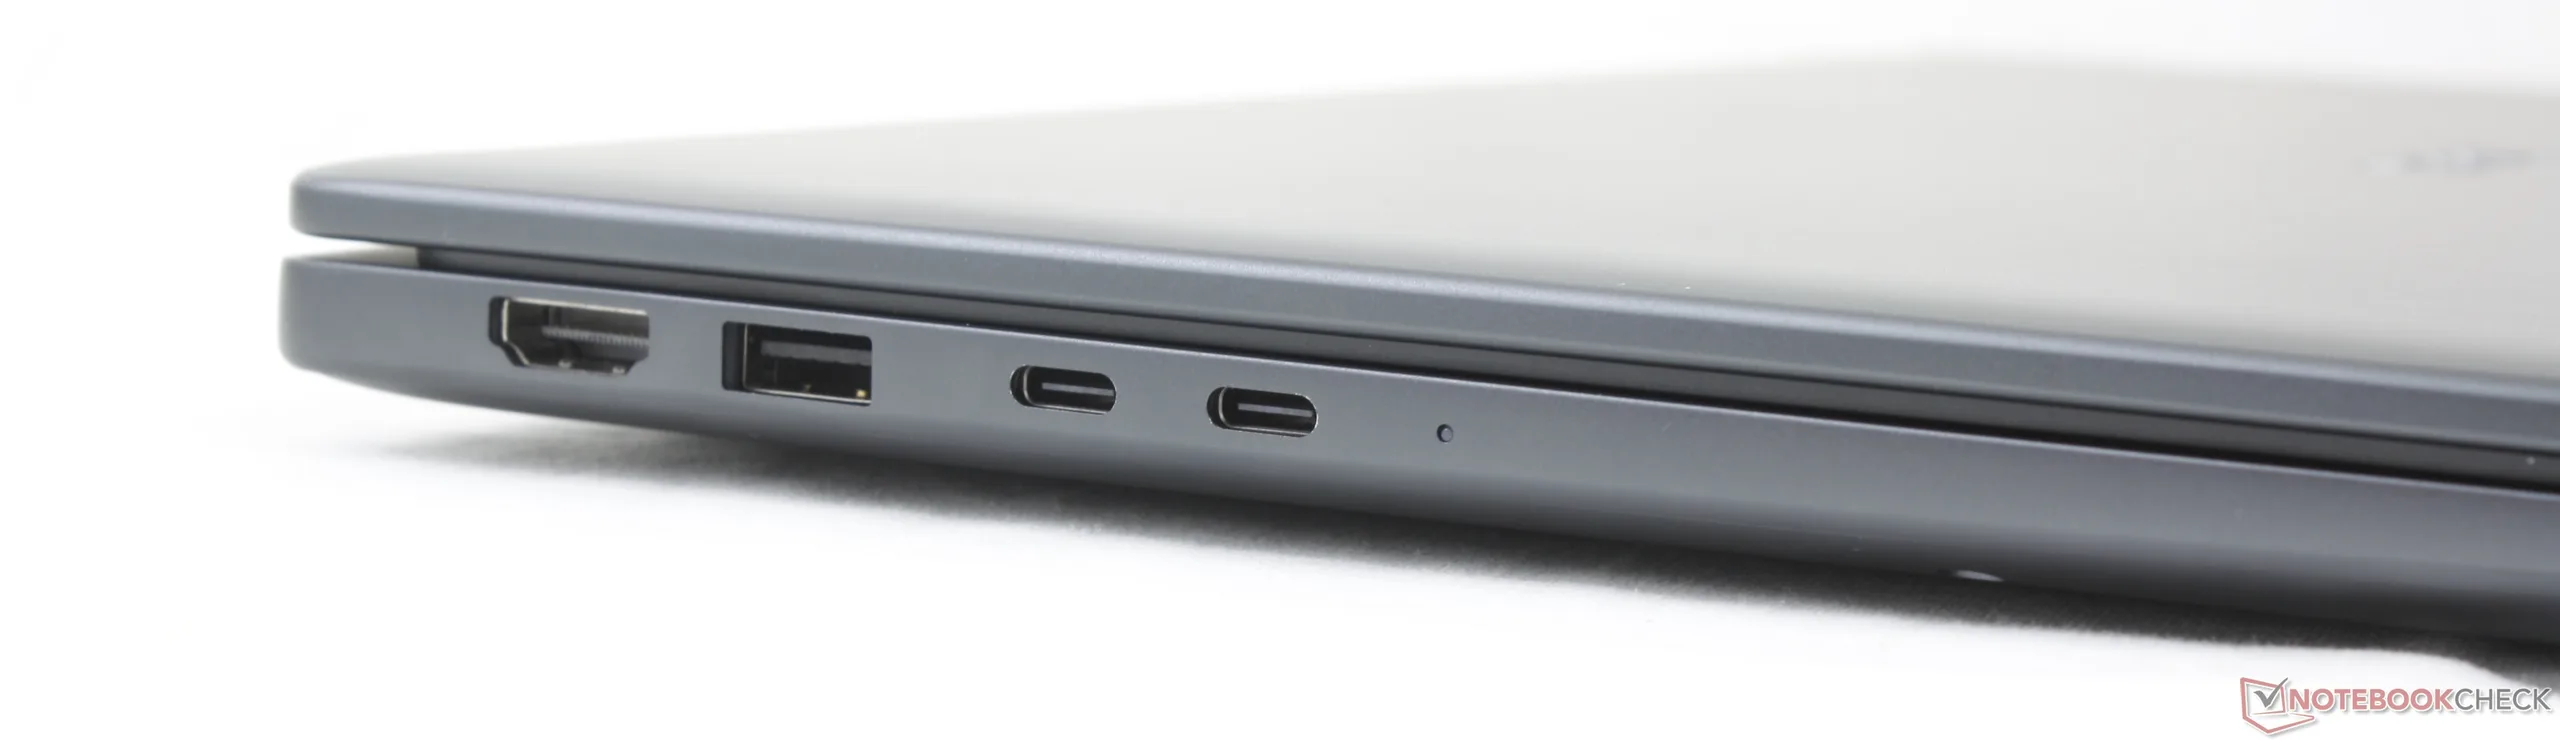
Correcto: Ranura para tarjeta Nano-SIM (opcional), conector para auriculares de 3,5 mm, USB-A 3.2 Gen. 1, RJ-45 (1 Gbps), Noble Lock
Parte trasera: Sin puertos
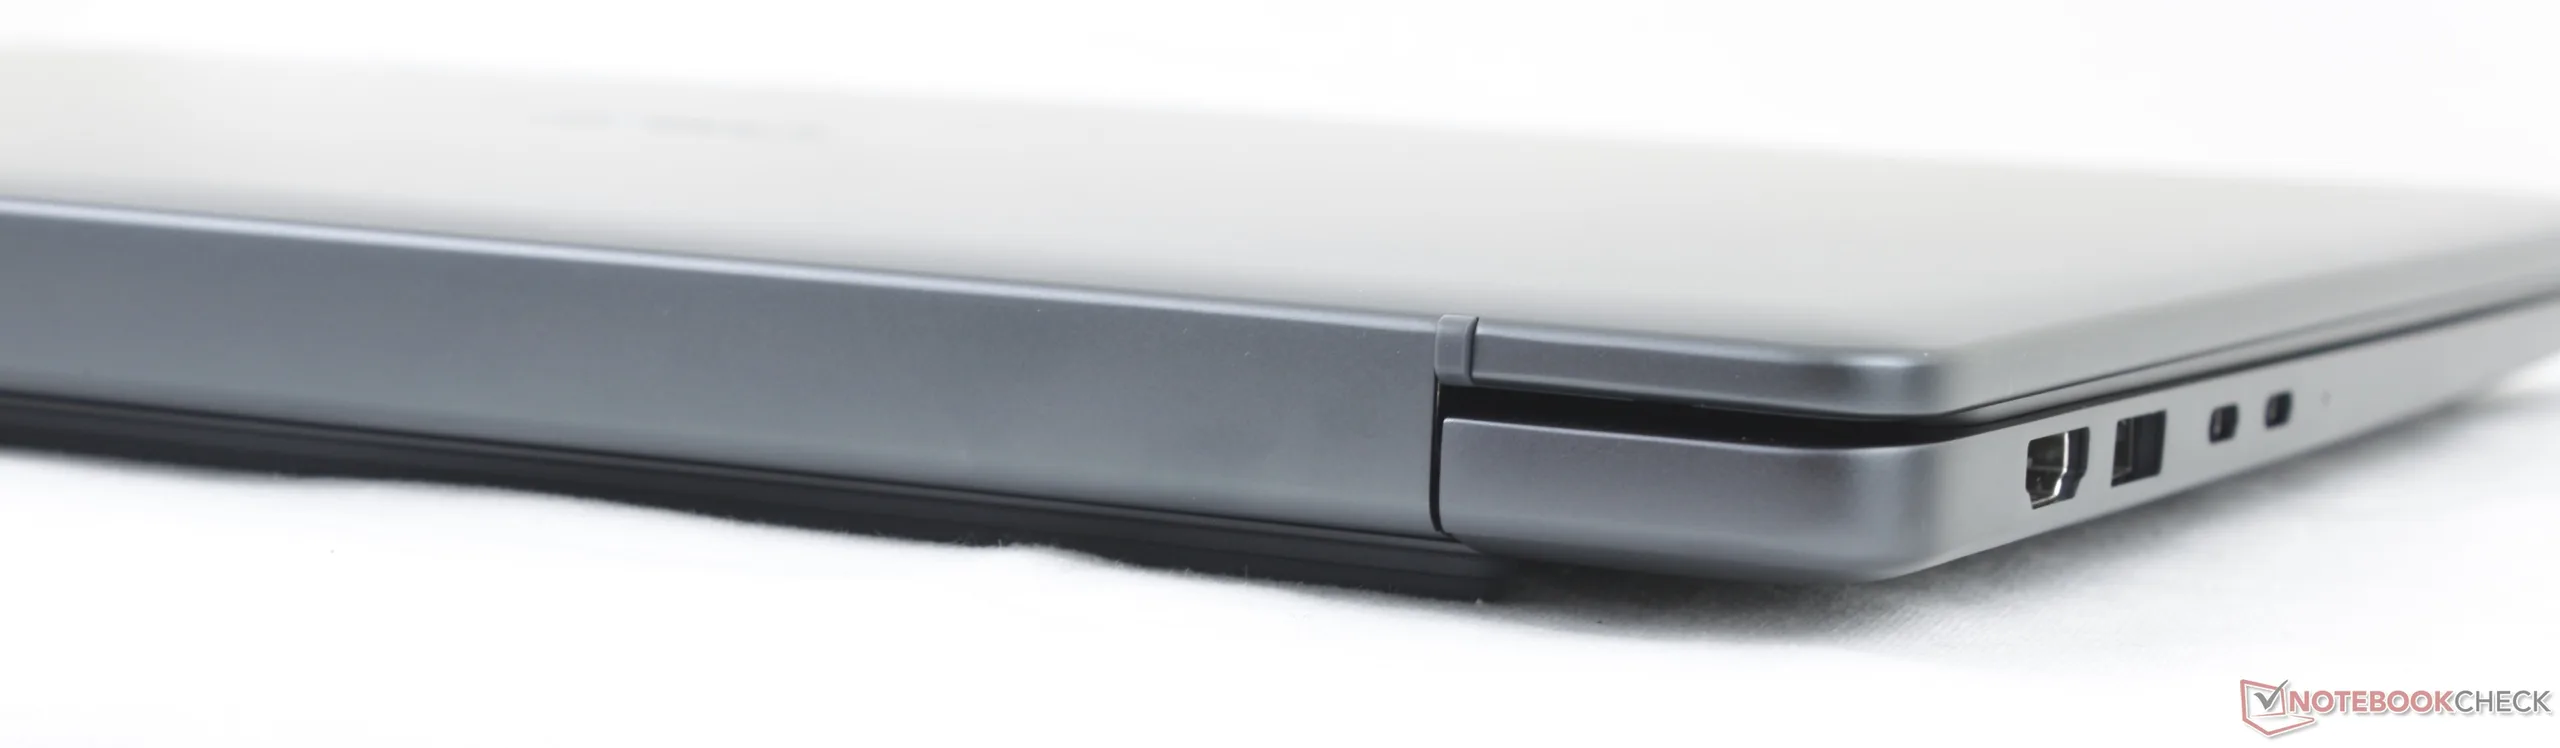
Izquierda: HDMI 2.1, USB-A 3.2 Gen. 1, 2 puertos Thunderbolt 4 con DisplayPort 2.1 + Power Delivery

Comunicación

Networking
iperf3 receive AXE11000 6GHz
Dell XPS 16 Core Ultra X7 358H
Intel Wi-Fi 7 BE211 320MHz
1735 (1715min - 1747max) MBit/s +17%
HP EliteBook 8 G1a 16 AI
Mediatek Wi-Fi 7 MT7925 Wireless LAN Card
1730 (1703min - 1750max) MBit/s +16%
Dell Pro 5 16 P516265
Mediatek Wi-Fi 7 MT7925 Wireless LAN Card
1486 (1449min - 1514max) MBit/s
MSI Venture 16 AI A2HMTG
Intel Wi-Fi 6E AX211
1459 (1378min - 1503max) MBit/s -2%
iperf3 transmit AXE11000 6GHz
Dell XPS 16 Core Ultra X7 358H
Intel Wi-Fi 7 BE211 320MHz
1619 (1525min - 1692max) MBit/s +8%
Dell Pro 5 16 P516265
Mediatek Wi-Fi 7 MT7925 Wireless LAN Card
1495 (1437min - 1564max) MBit/s
HP EliteBook 8 G1a 16 AI
Mediatek Wi-Fi 7 MT7925 Wireless LAN Card
1430 (1401min - 1478max) MBit/s -4%
MSI Venture 16 AI A2HMTG
Intel Wi-Fi 6E AX211
1202 (1138min - 1257max) MBit/s -20%
0100200300400500600700800900100011001200130014001500Tooltip
Dell Pro 5 16 P516265; iperf3 receive AXE11000 6GHz; iperf 3.1.3: Ø1486 (1449-1514) MBit/s
Dell Pro 5 16 P516265; iperf3 transmit AXE11000 6GHz; iperf 3.1.3: Ø1495 (1437-1564) MBit/s

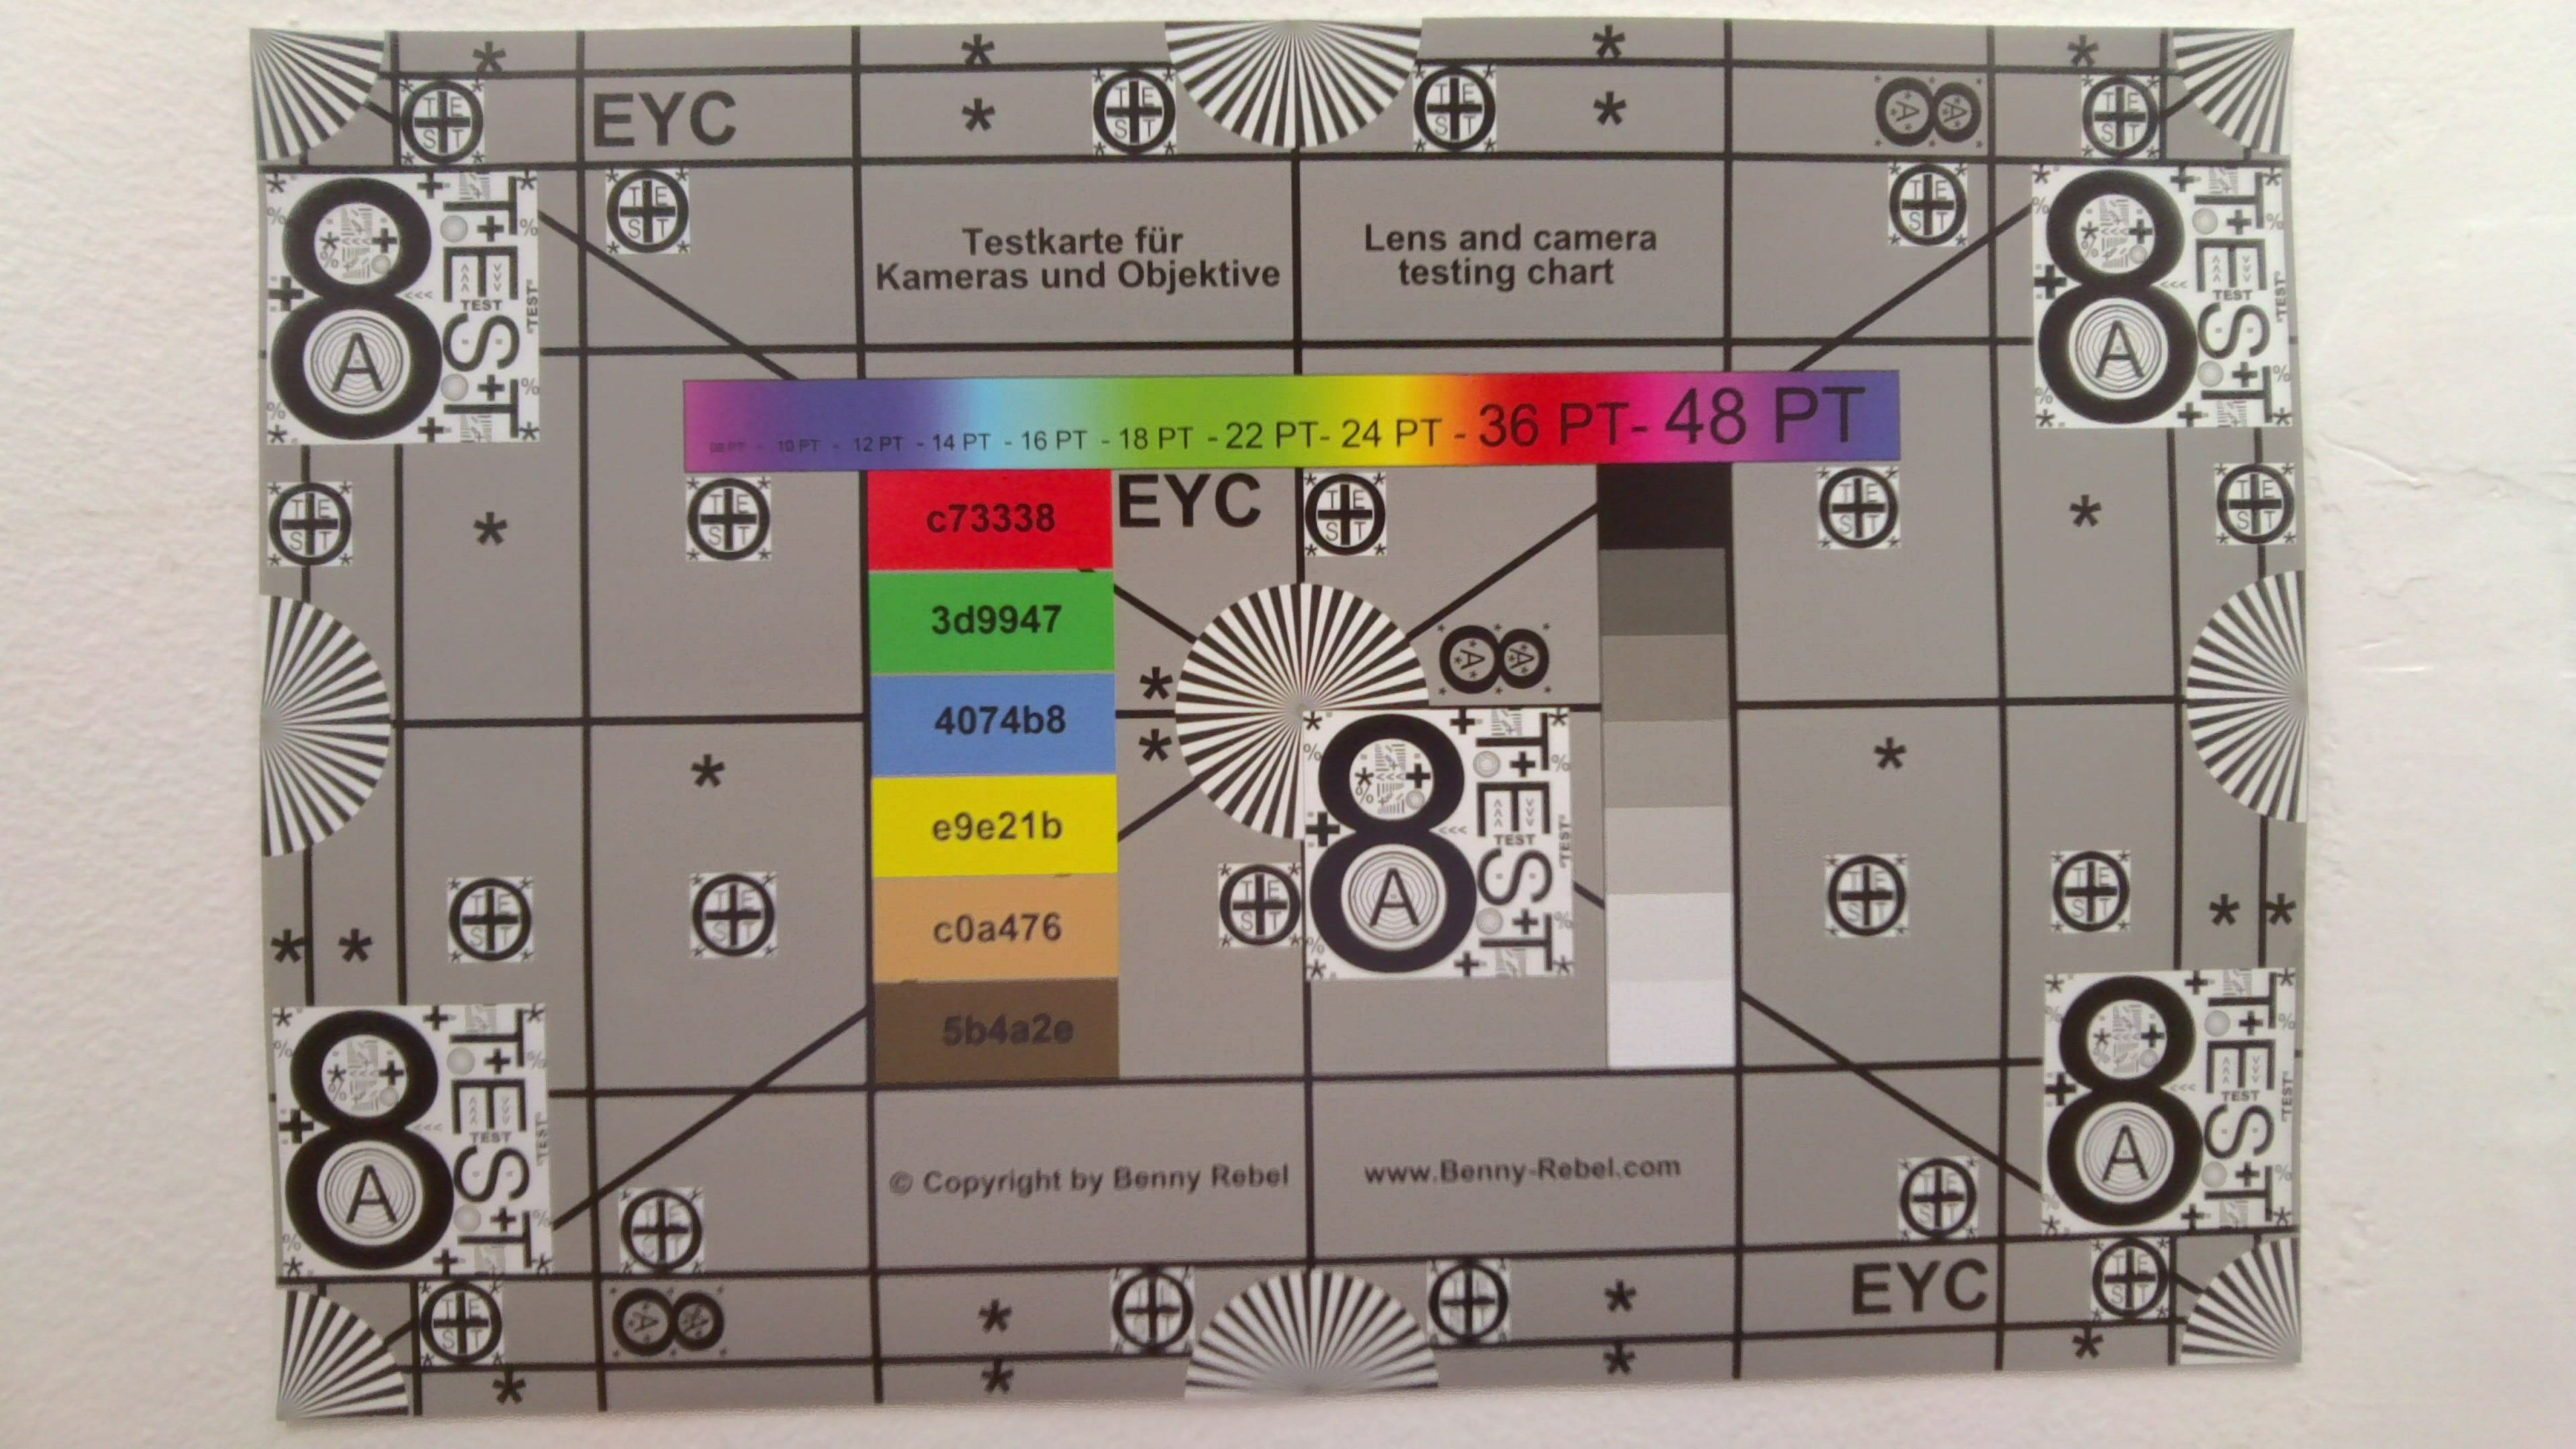
Cámara web

ColorChecker
13.6 ∆E
11.4 ∆E
17.7 ∆E
23.6 ∆E
16.6 ∆E
18.4 ∆E
7.7 ∆E
18.1 ∆E
12.1 ∆E
16.5 ∆E
16.9 ∆E
18.8 ∆E
8.6 ∆E
20.8 ∆E
17.2 ∆E
13.1 ∆E
13.6 ∆E
22.4 ∆E
2.3 ∆E
11.8 ∆E
17.6 ∆E
18 ∆E
19.3 ∆E
6 ∆E
ColorChecker Dell Pro 5 16 P516265: 15.1 ∆E min: 2.33 - max: 23.63 ∆E

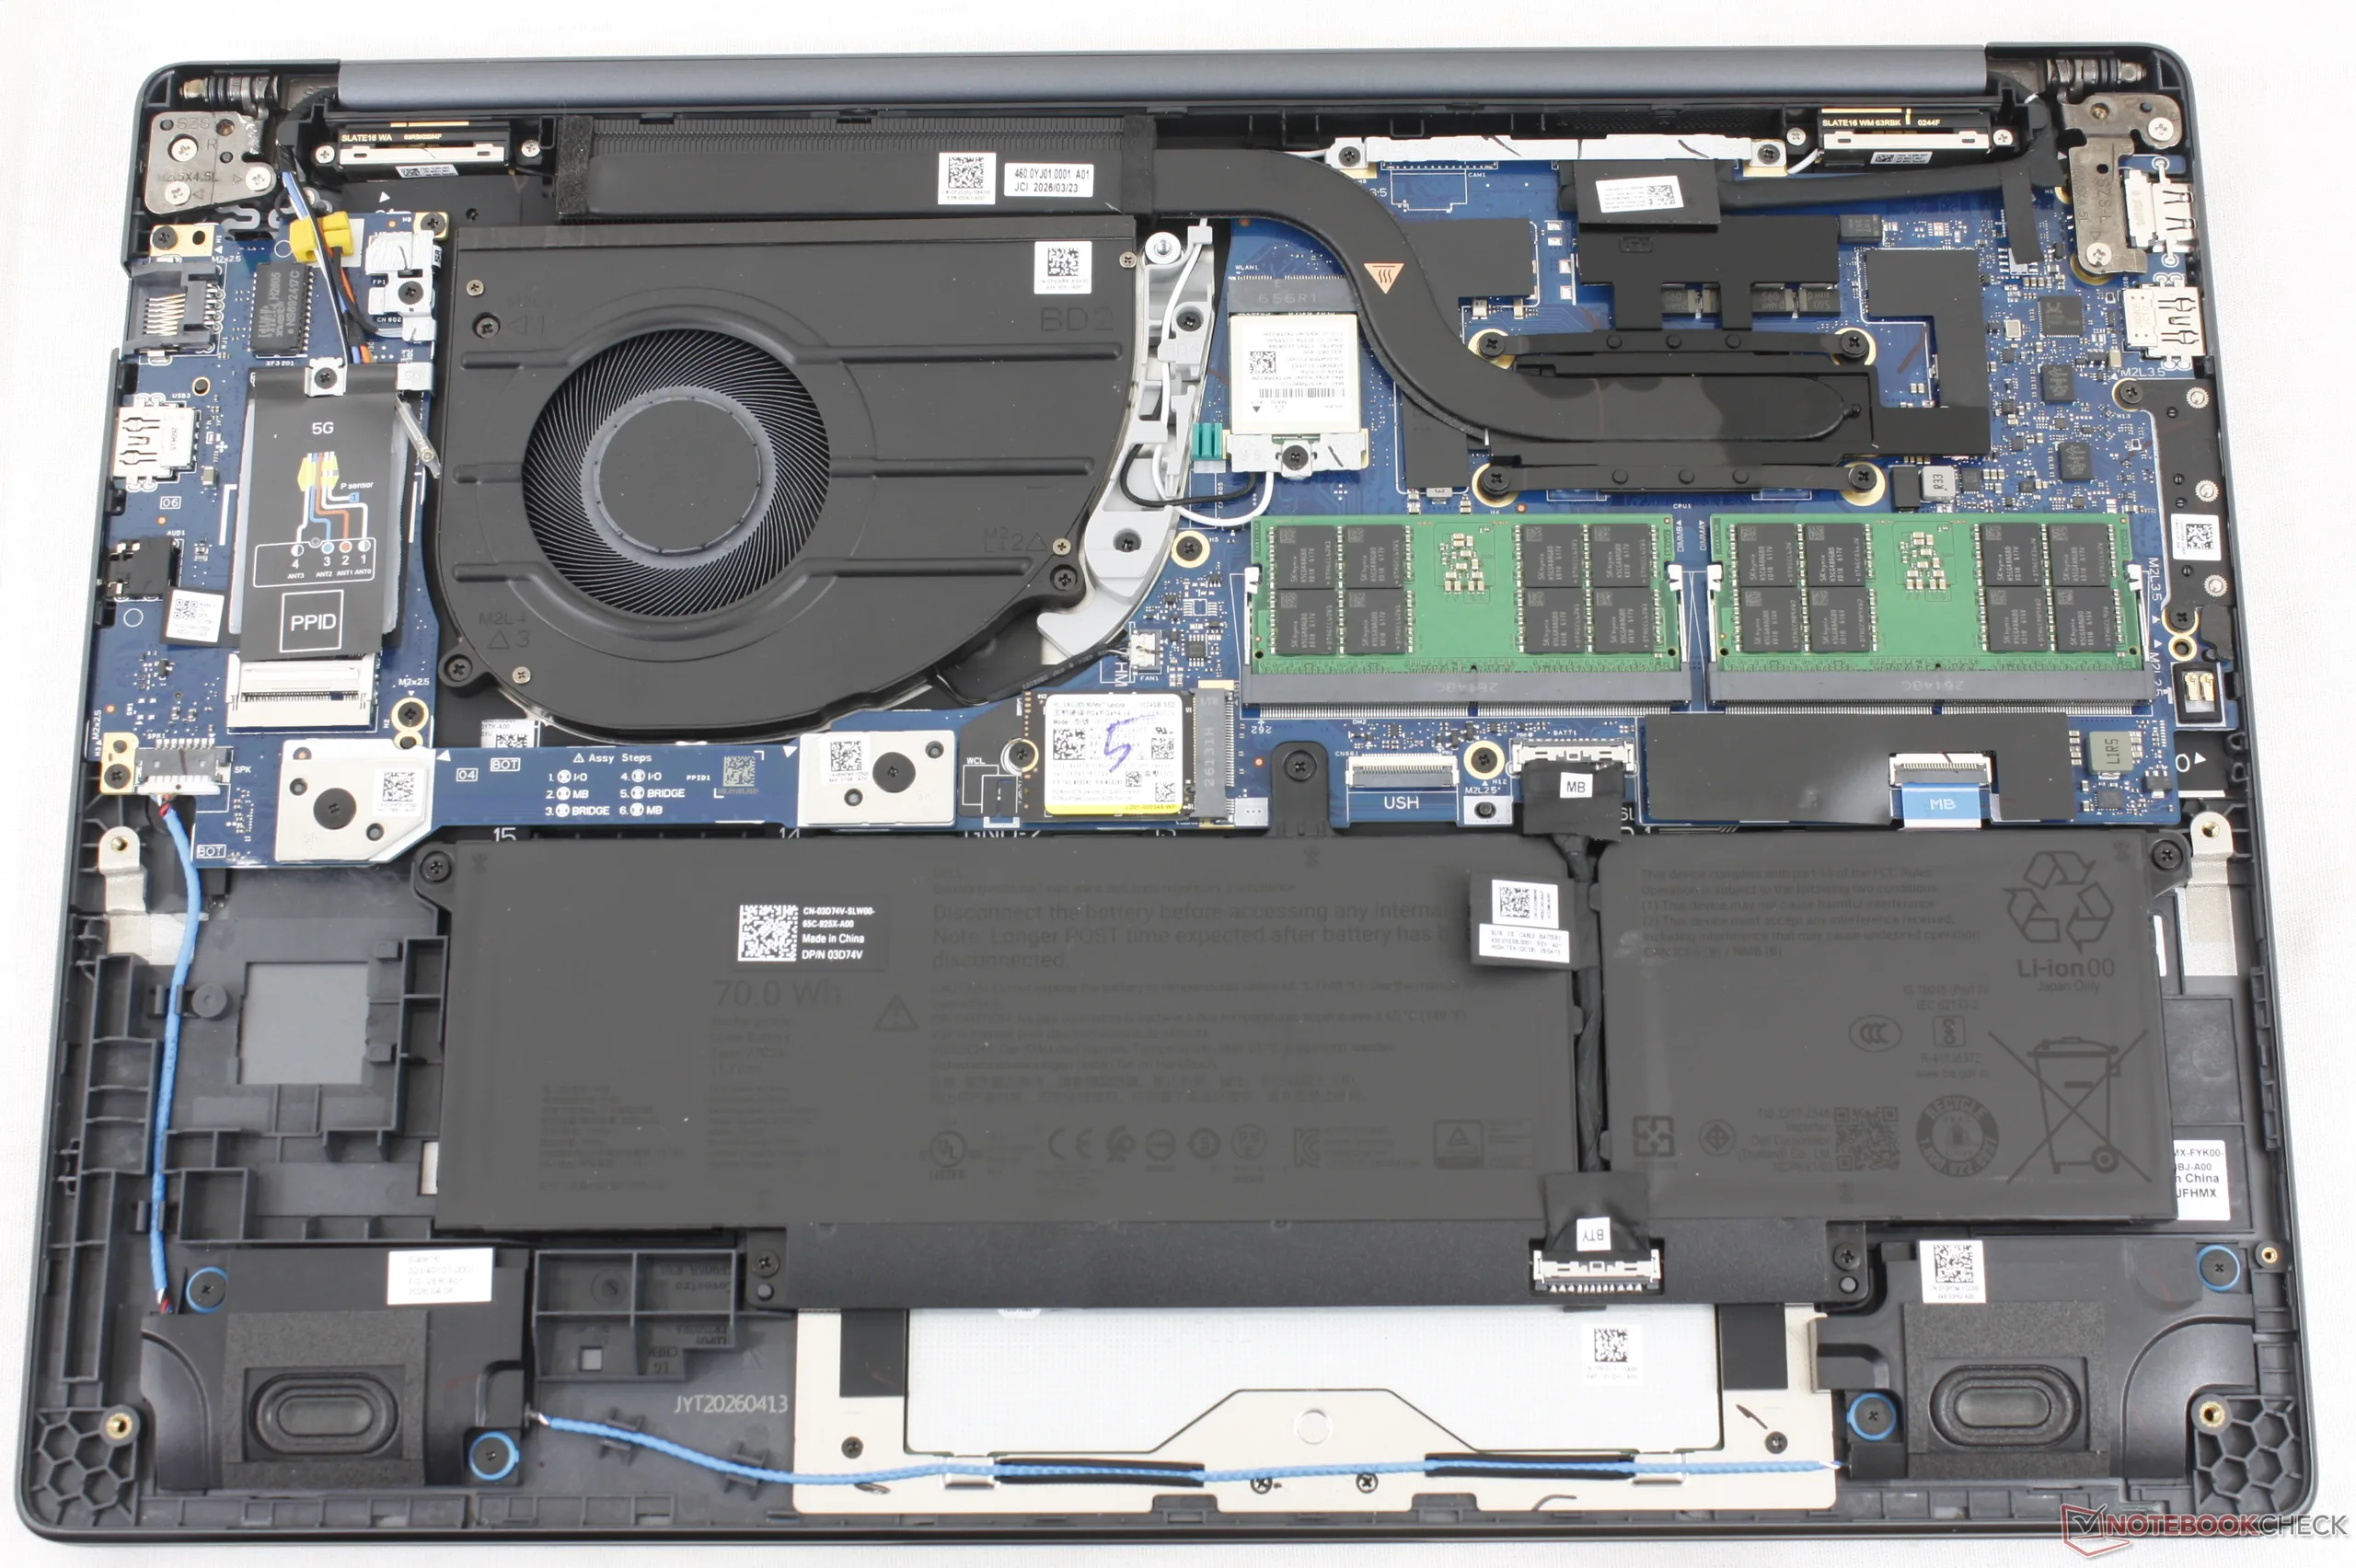
Mantenimiento

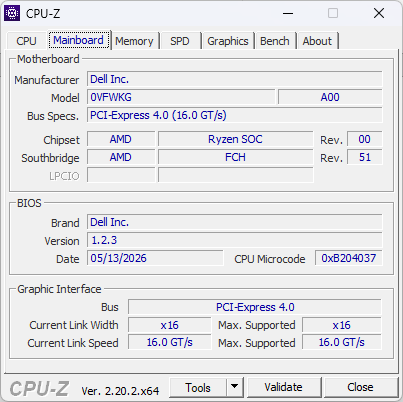
Placa base Dell Pro 5 16

Sostenibilidad

Una parte significativa del modelo está compuesta por materiales reciclados, incluyendo hasta un 50 % de plástico en la carcasa del ventilador, las patas de goma y las cubiertas A, C y D; hasta un 50 % de aluminio reciclado en la cubierta A; y hasta un 100 % de cobalto reciclado en determinadas configuraciones de batería. El adaptador de CA y el embalaje también están compuestos, respectivamente, por metales y papel reciclados.

Accesorios y garantía

Aunque la caja no incluye ningún accesorio adicional, valoramos que se ofrezca de serie una garantía de tres años si se adquiere en EE. UU.

Dispositivos de entrada
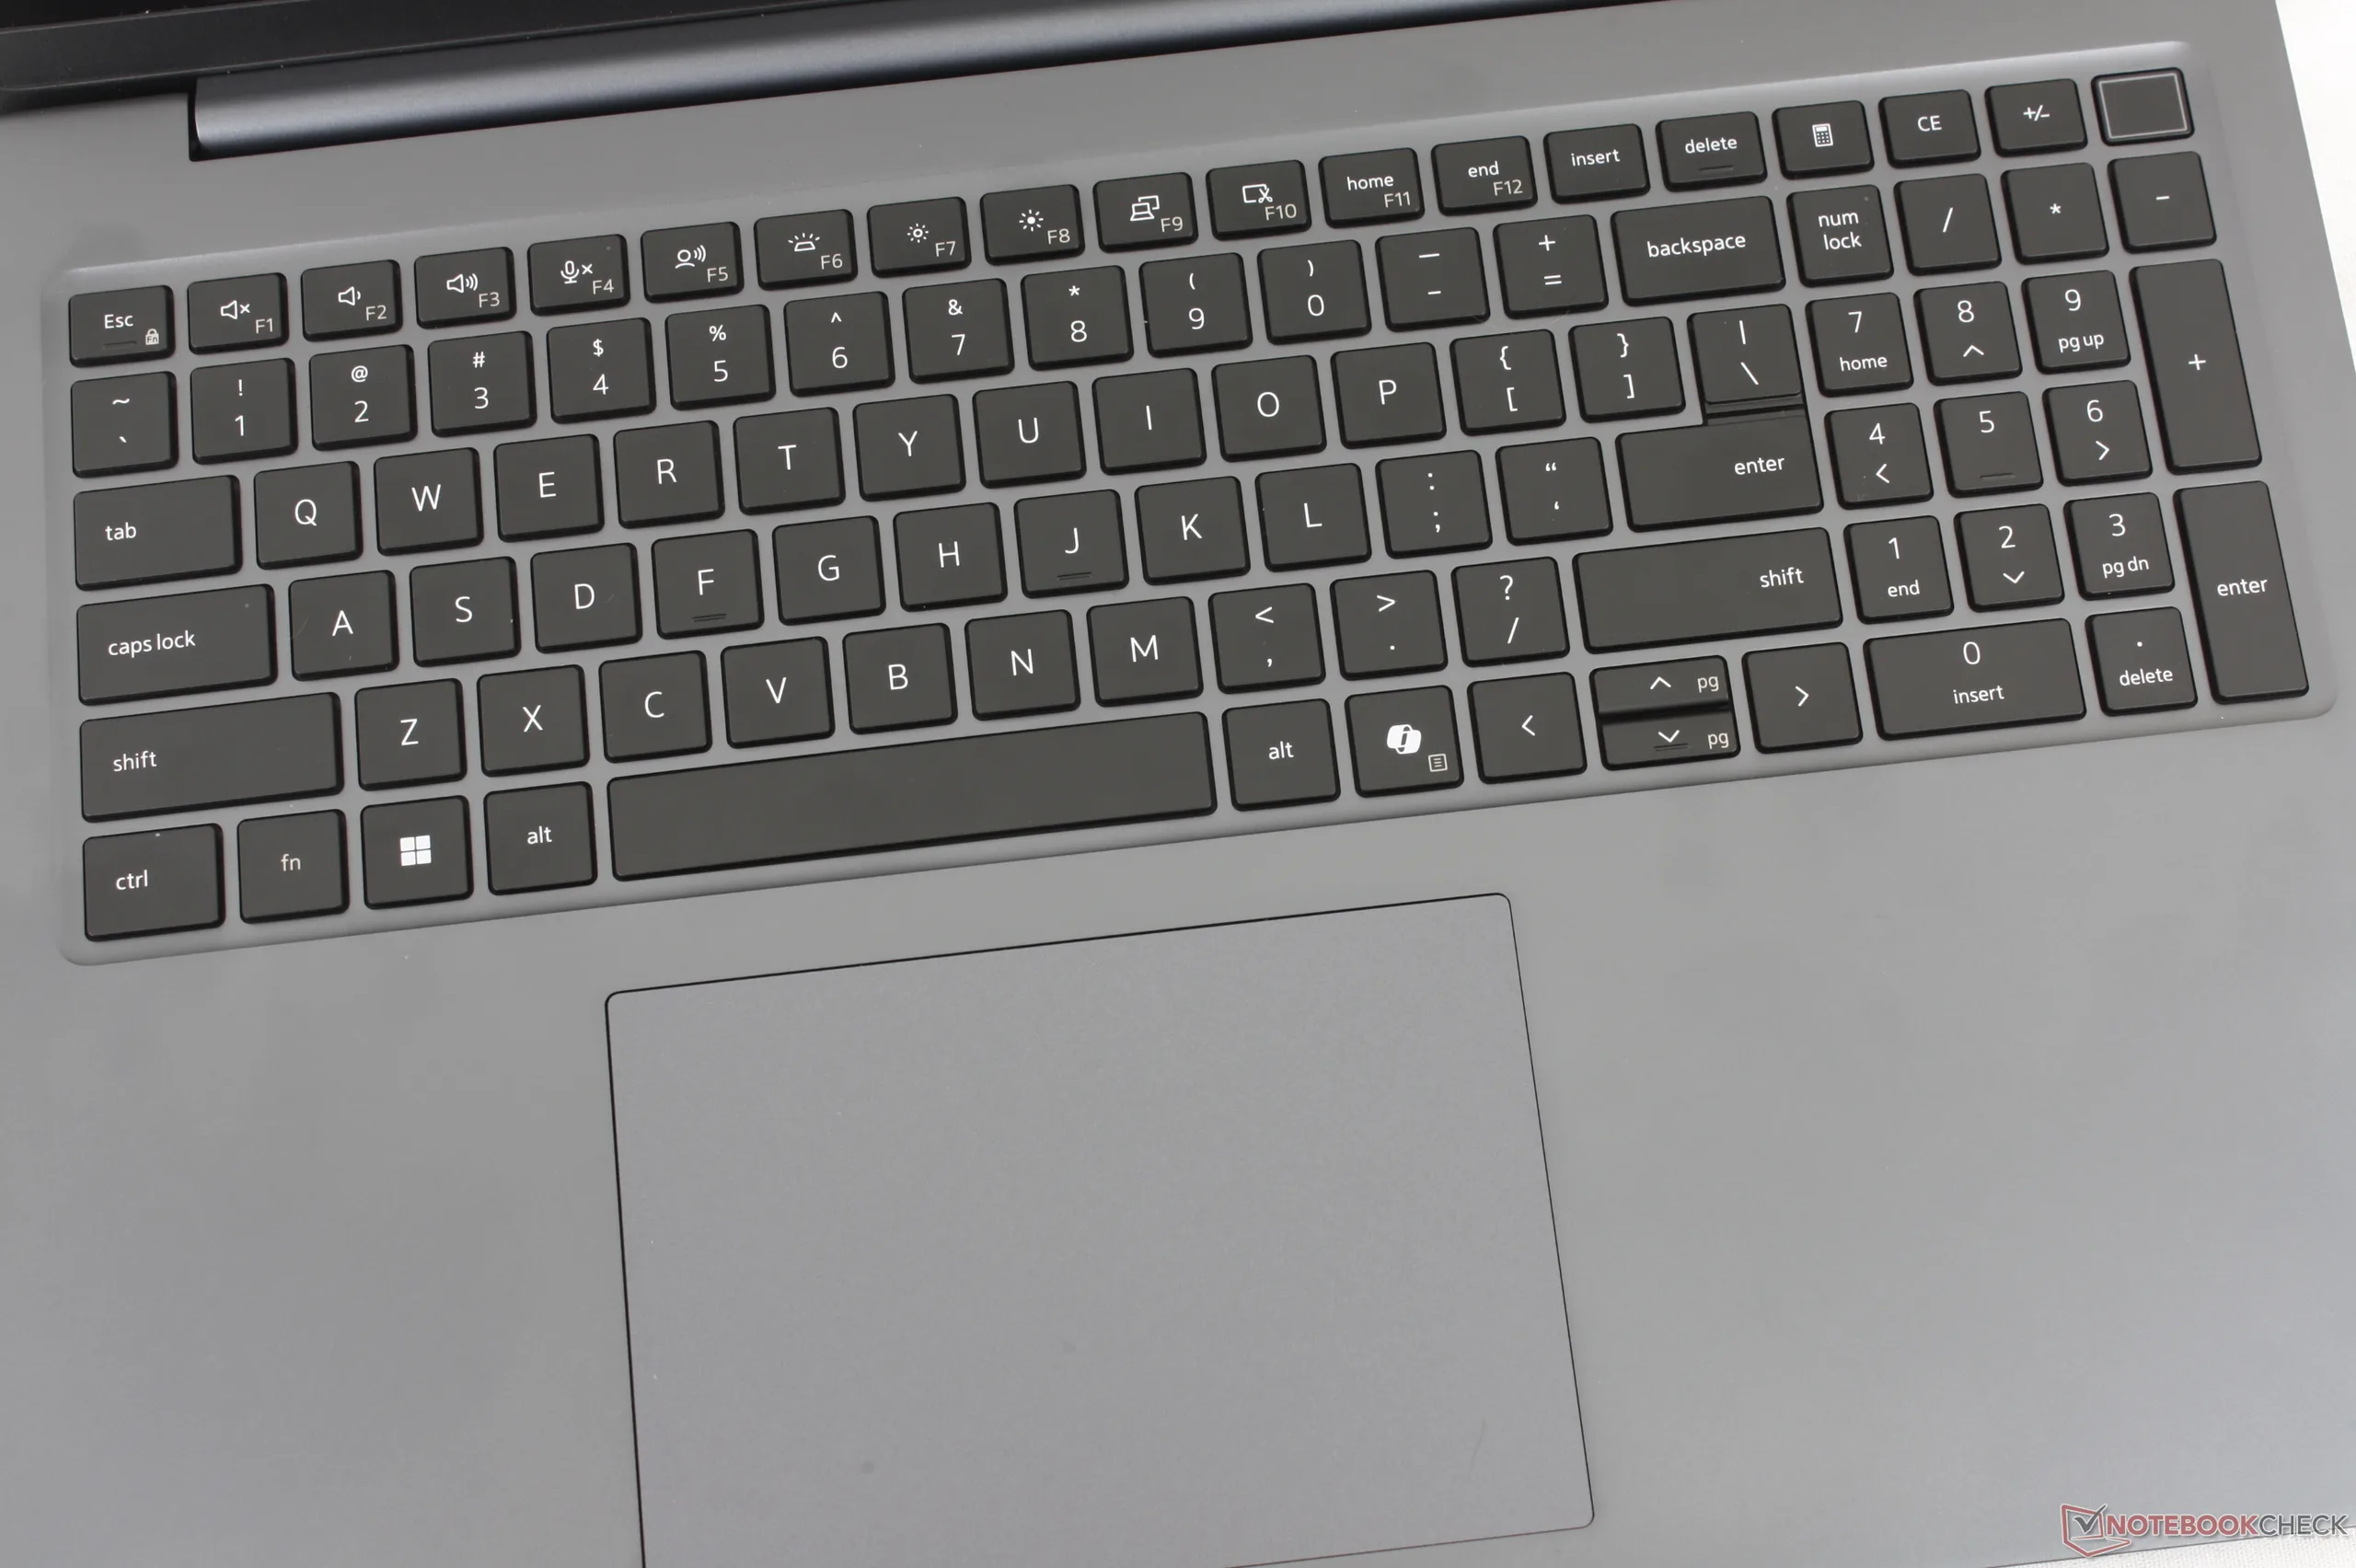
Teclado y respuesta similares a los del Dell Pro 7 14, pero con un panel táctil más grande (13 x 9 cm) y un teclado numérico integrado.

Visualización

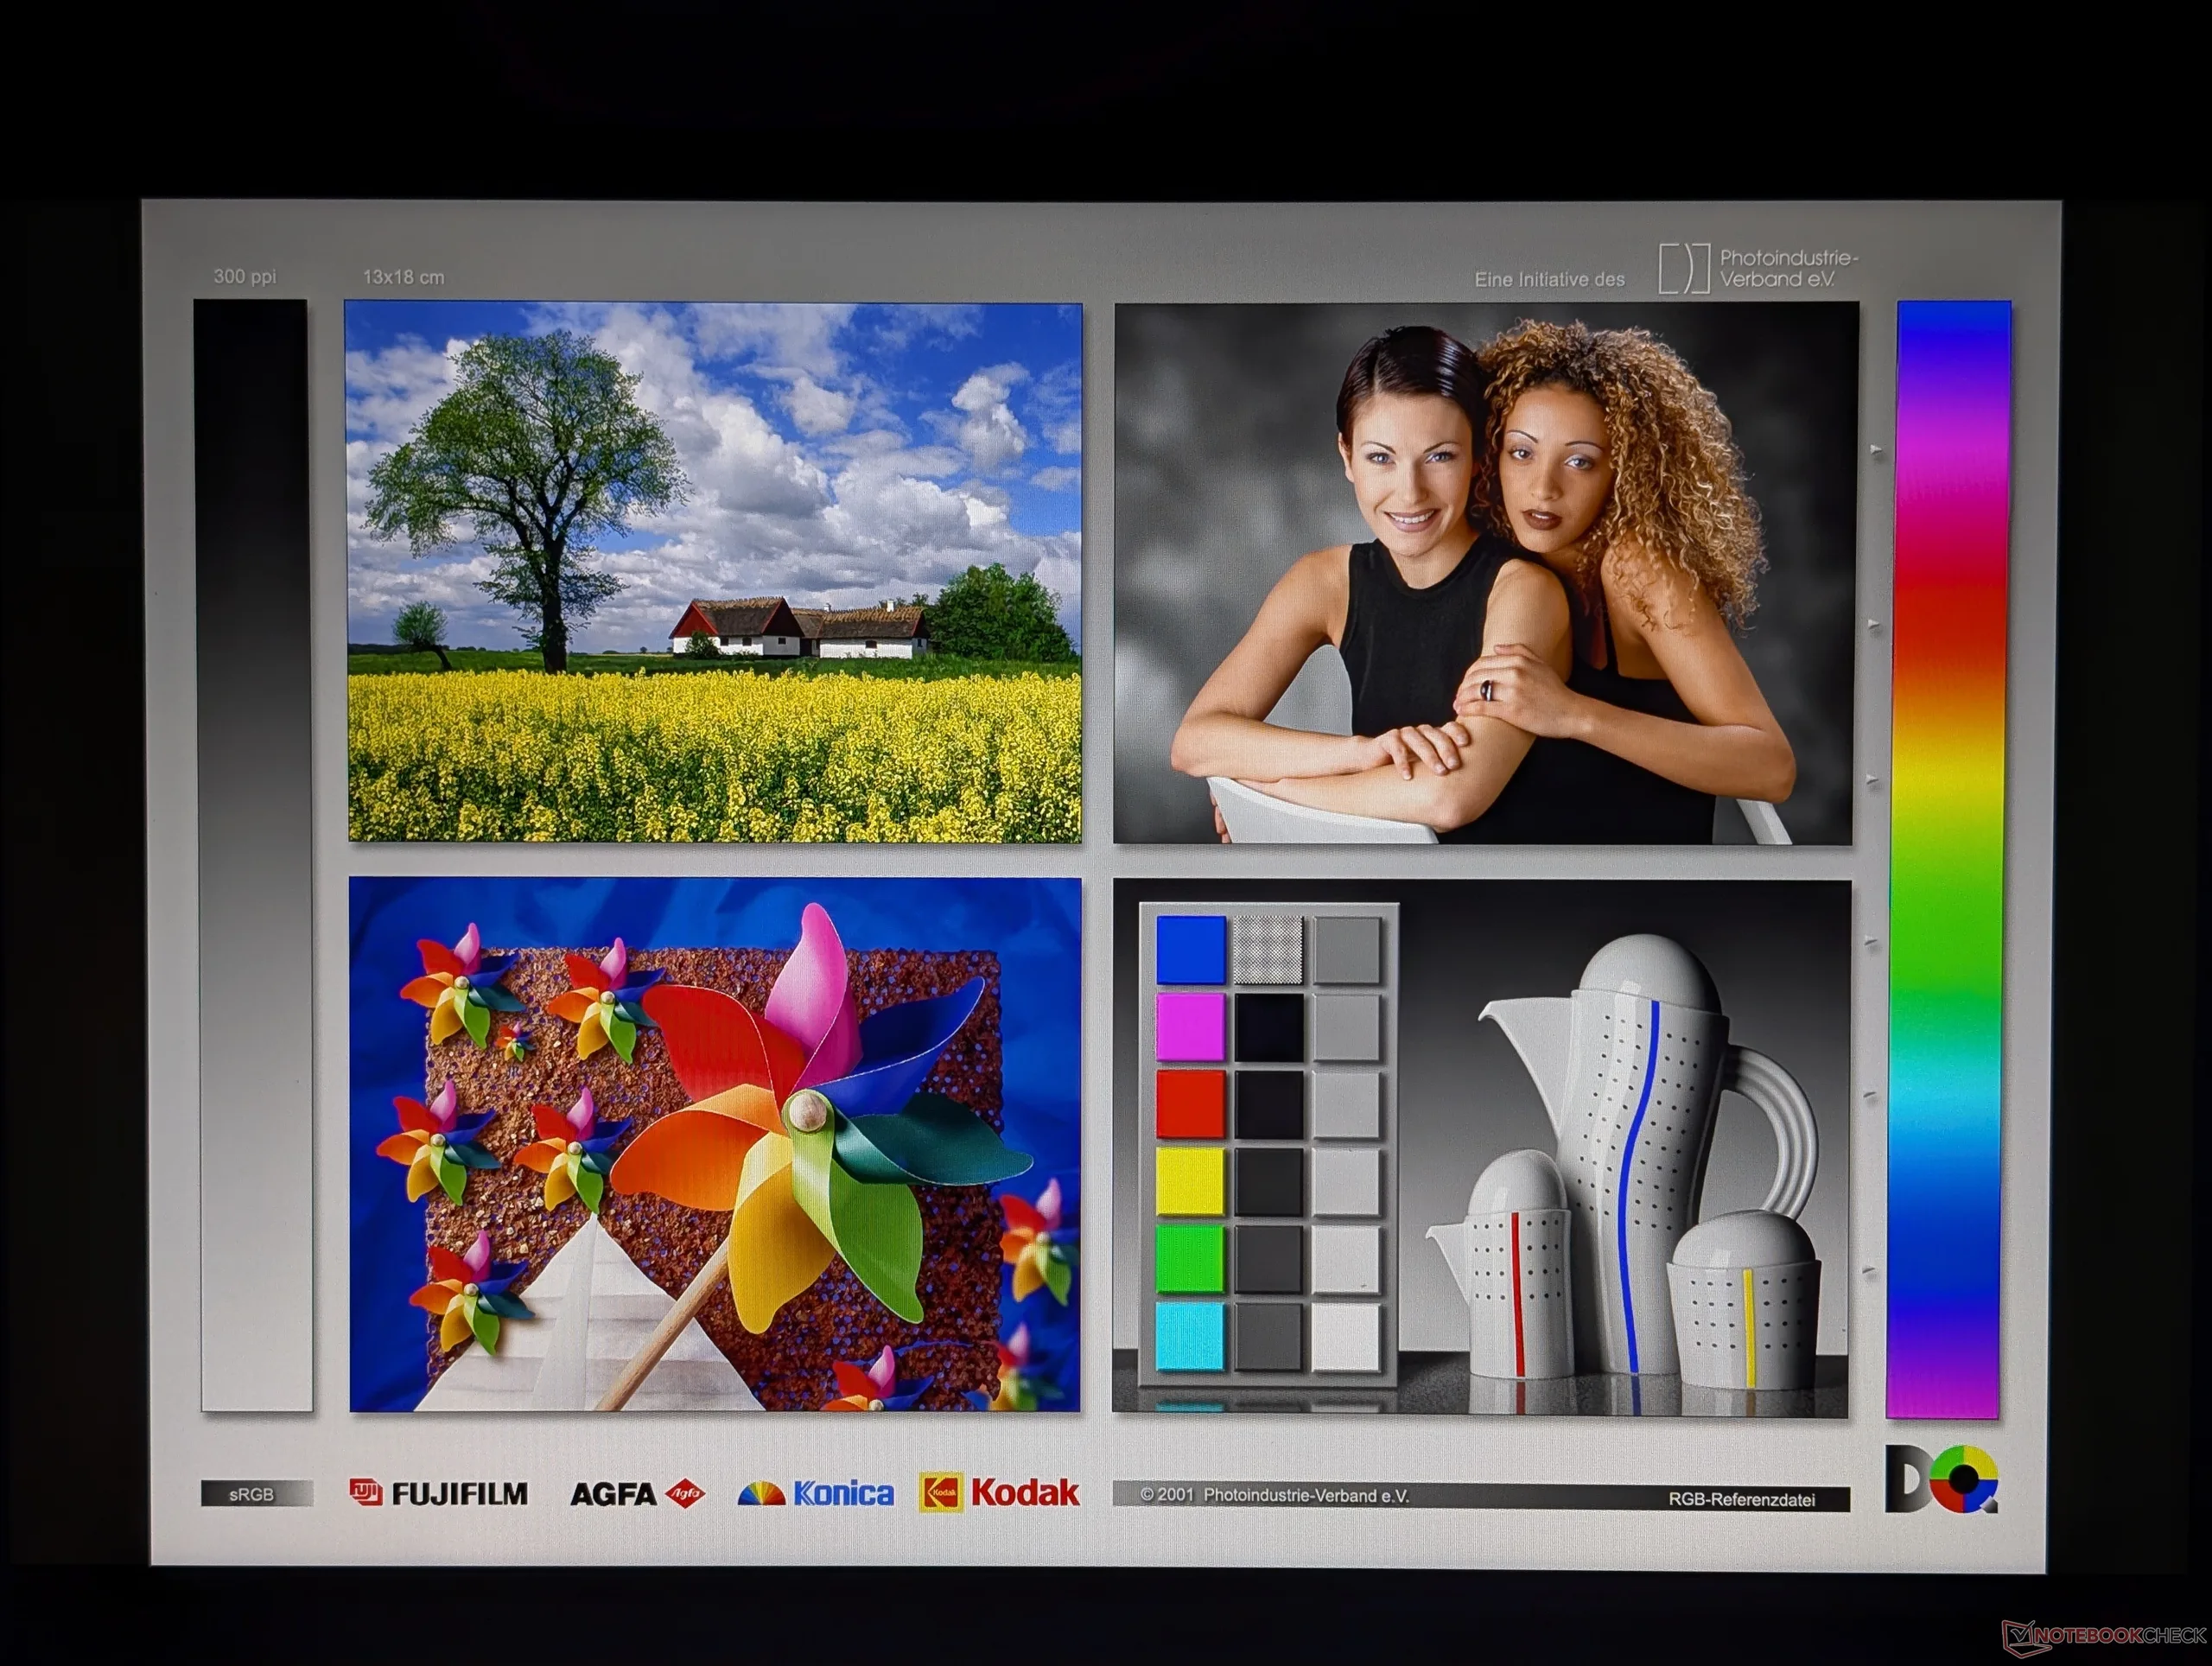
El panel mate presenta un grano ligeramente más marcado que su alternativa brillante cuando se observa de cerca.
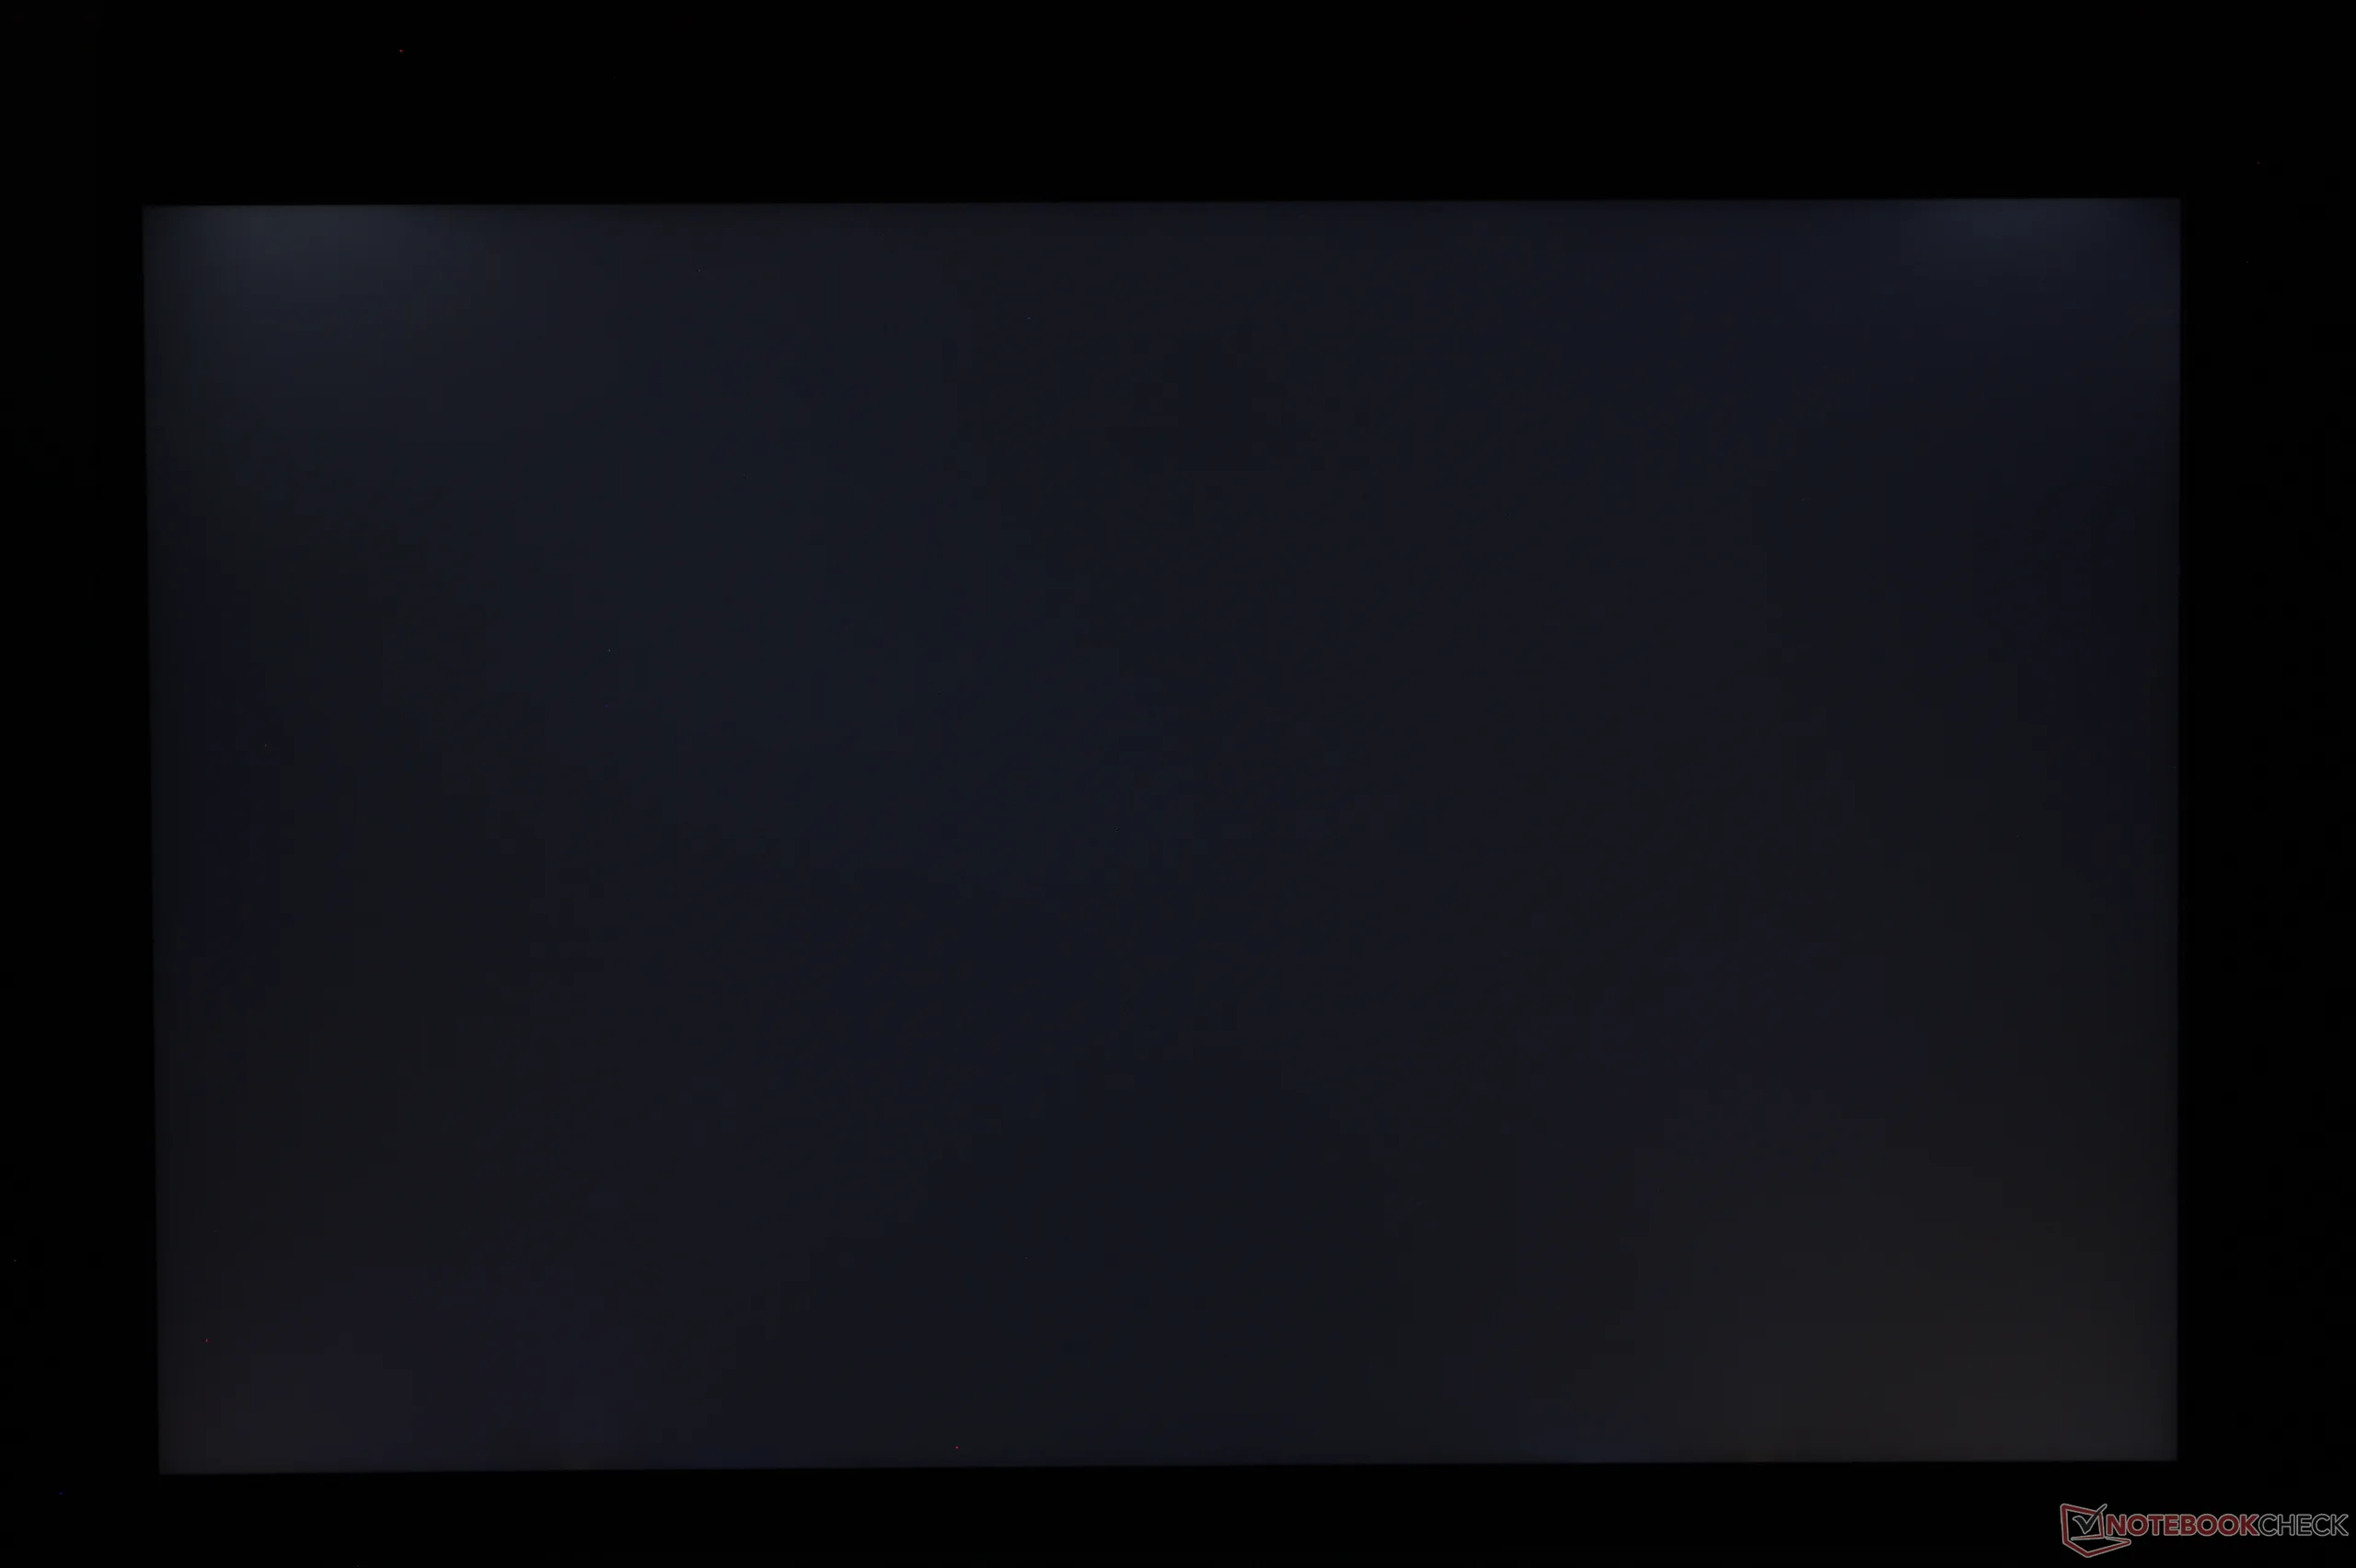
Ligera fuga de luz de fondo irregular en las esquinas superiores
473.4
cd/m²
458.6
cd/m²
477.3
cd/m²
451.5
cd/m²
470.3
cd/m²
467.3
cd/m²
465.5
cd/m²
446.8
cd/m²
467.5
cd/m²
Temperatura del cuarto
BOE NS16M30 tested with X-Rite i1Pro 3
Máximo: 477.3 cd/m² (Nits) Médio: 464.2 cd/m² Minimum: 24.5 cd/m²
iluminación: 94 %
Brillo con batería: 470.3 cd/m²
Contraste: 2766:1 (Negro: 0.17 cd/m²)
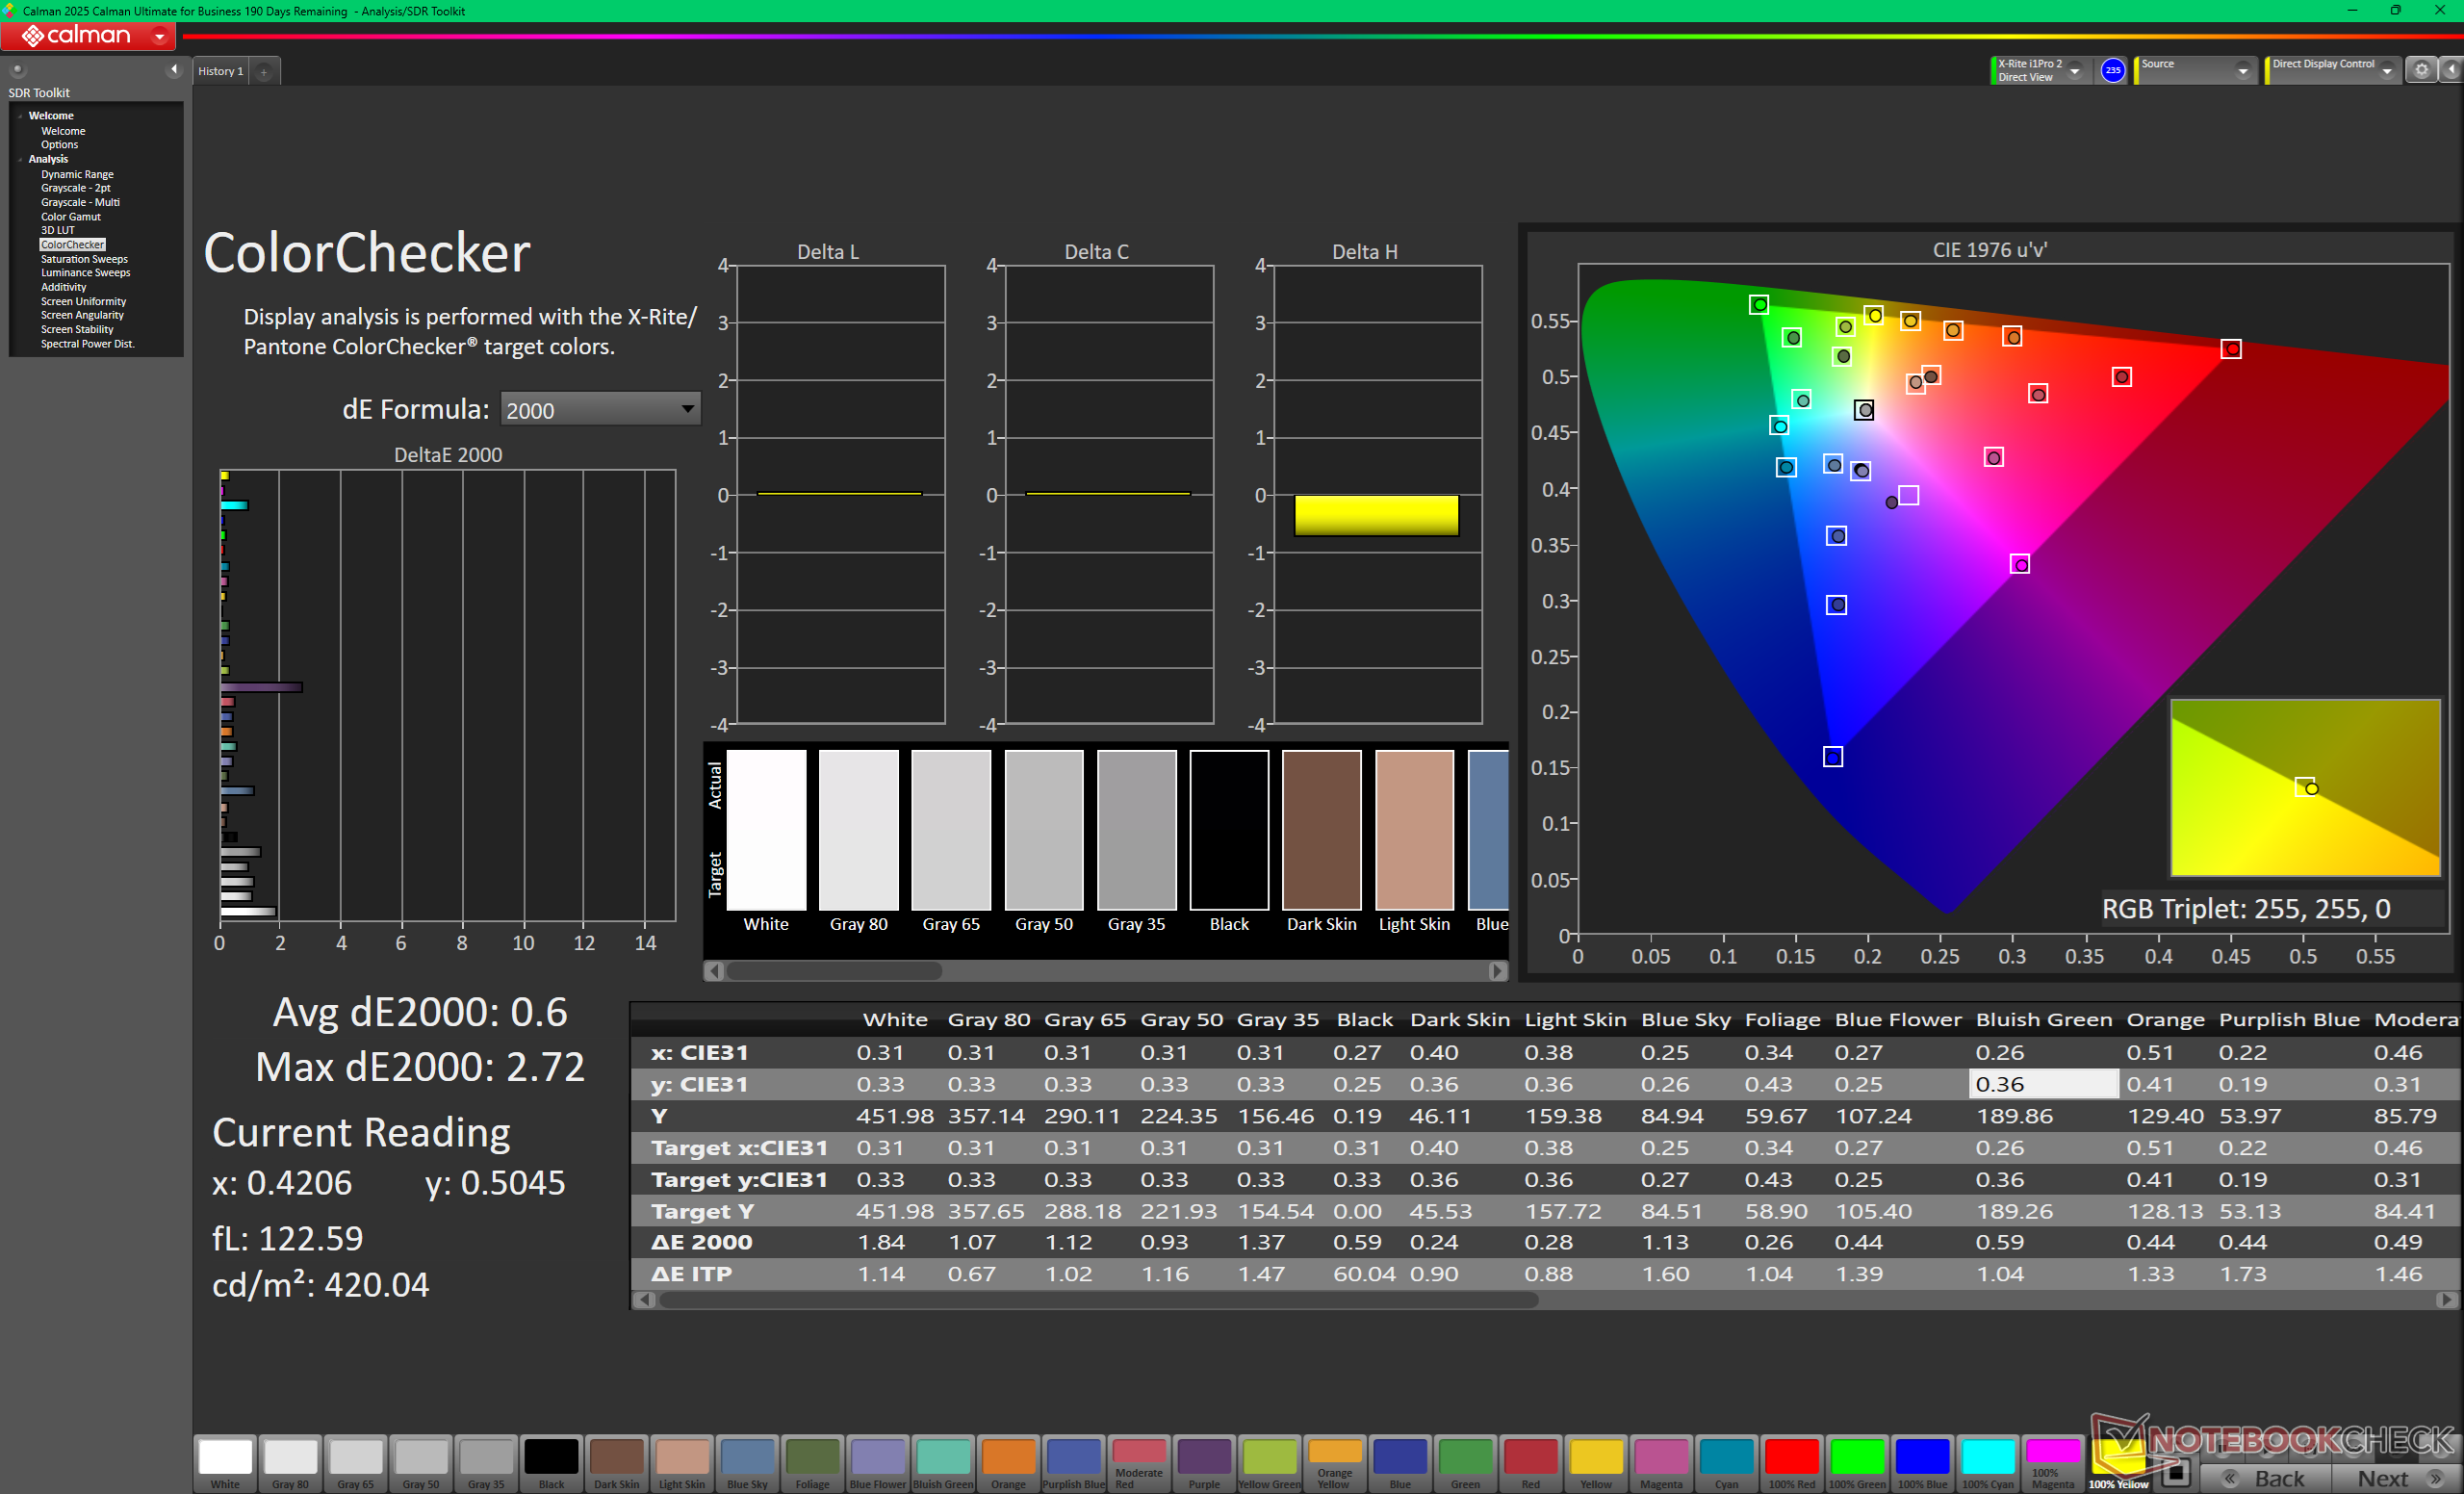
ΔE ColorChecker Calman: 4.45 | ∀{0.5-29.43 Ø4.71}
calibrated: 0.6
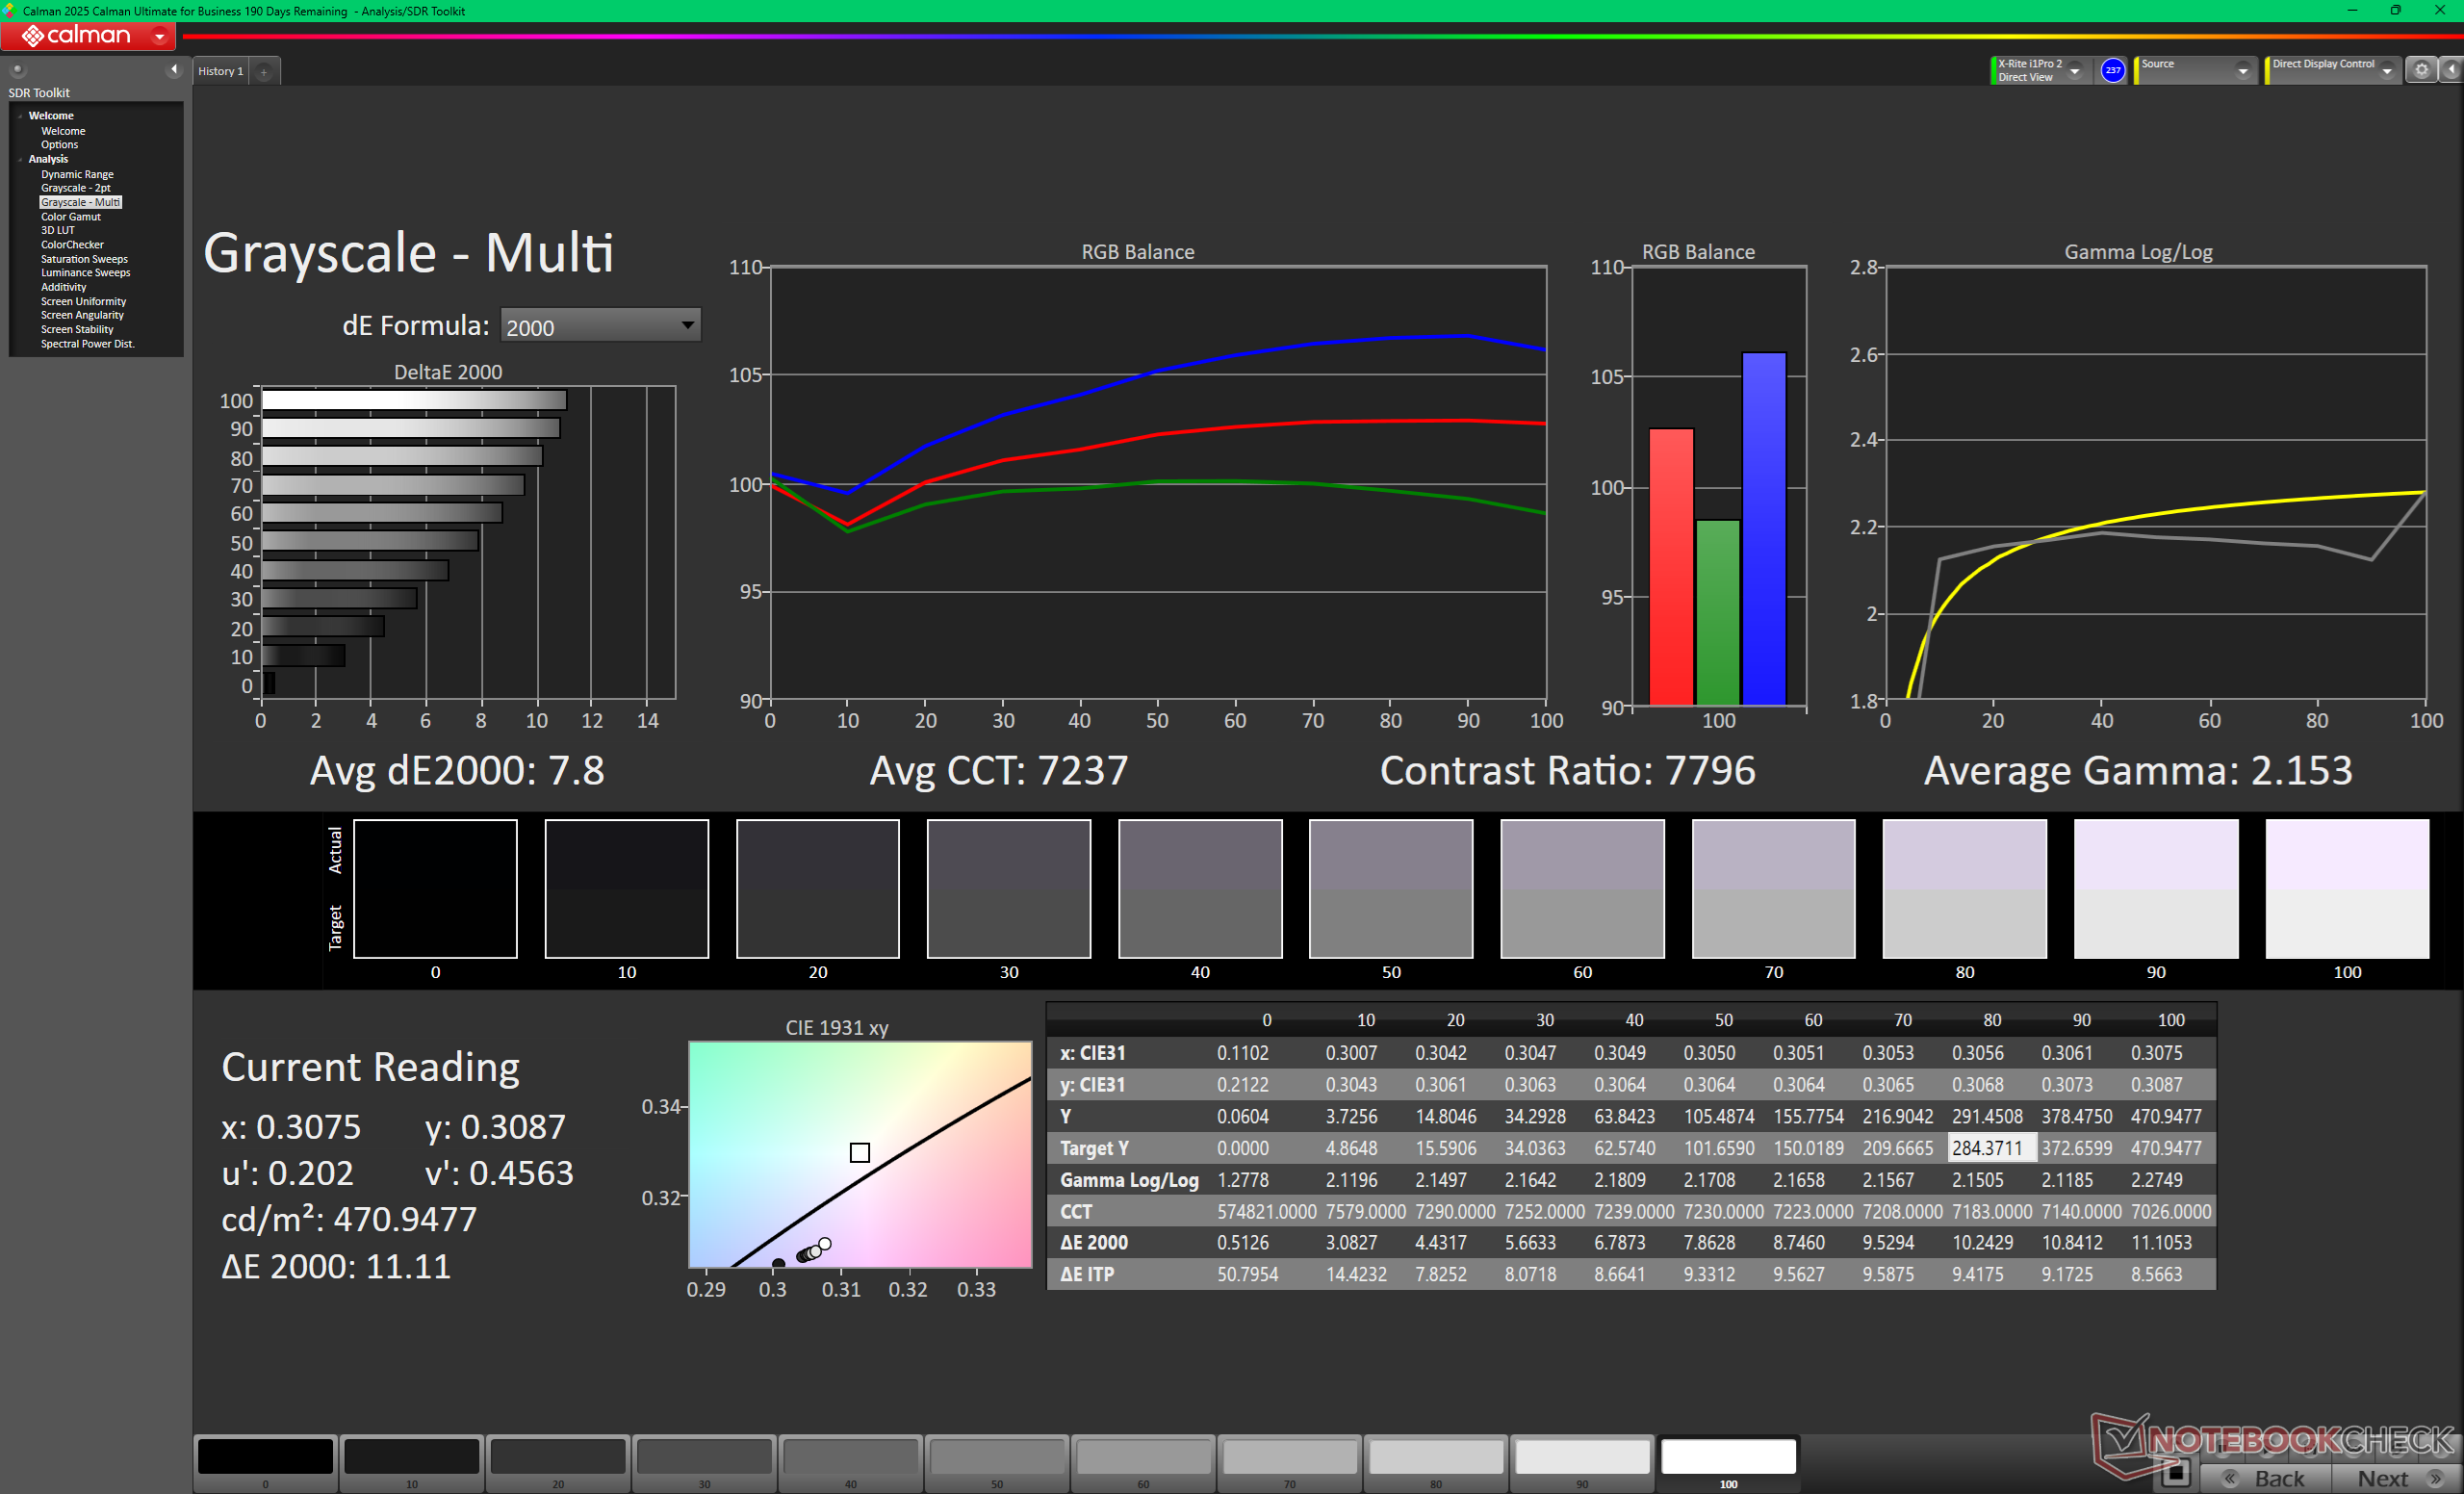
ΔE Greyscale Calman: 7.8 | ∀{0.09-98 Ø4.96}
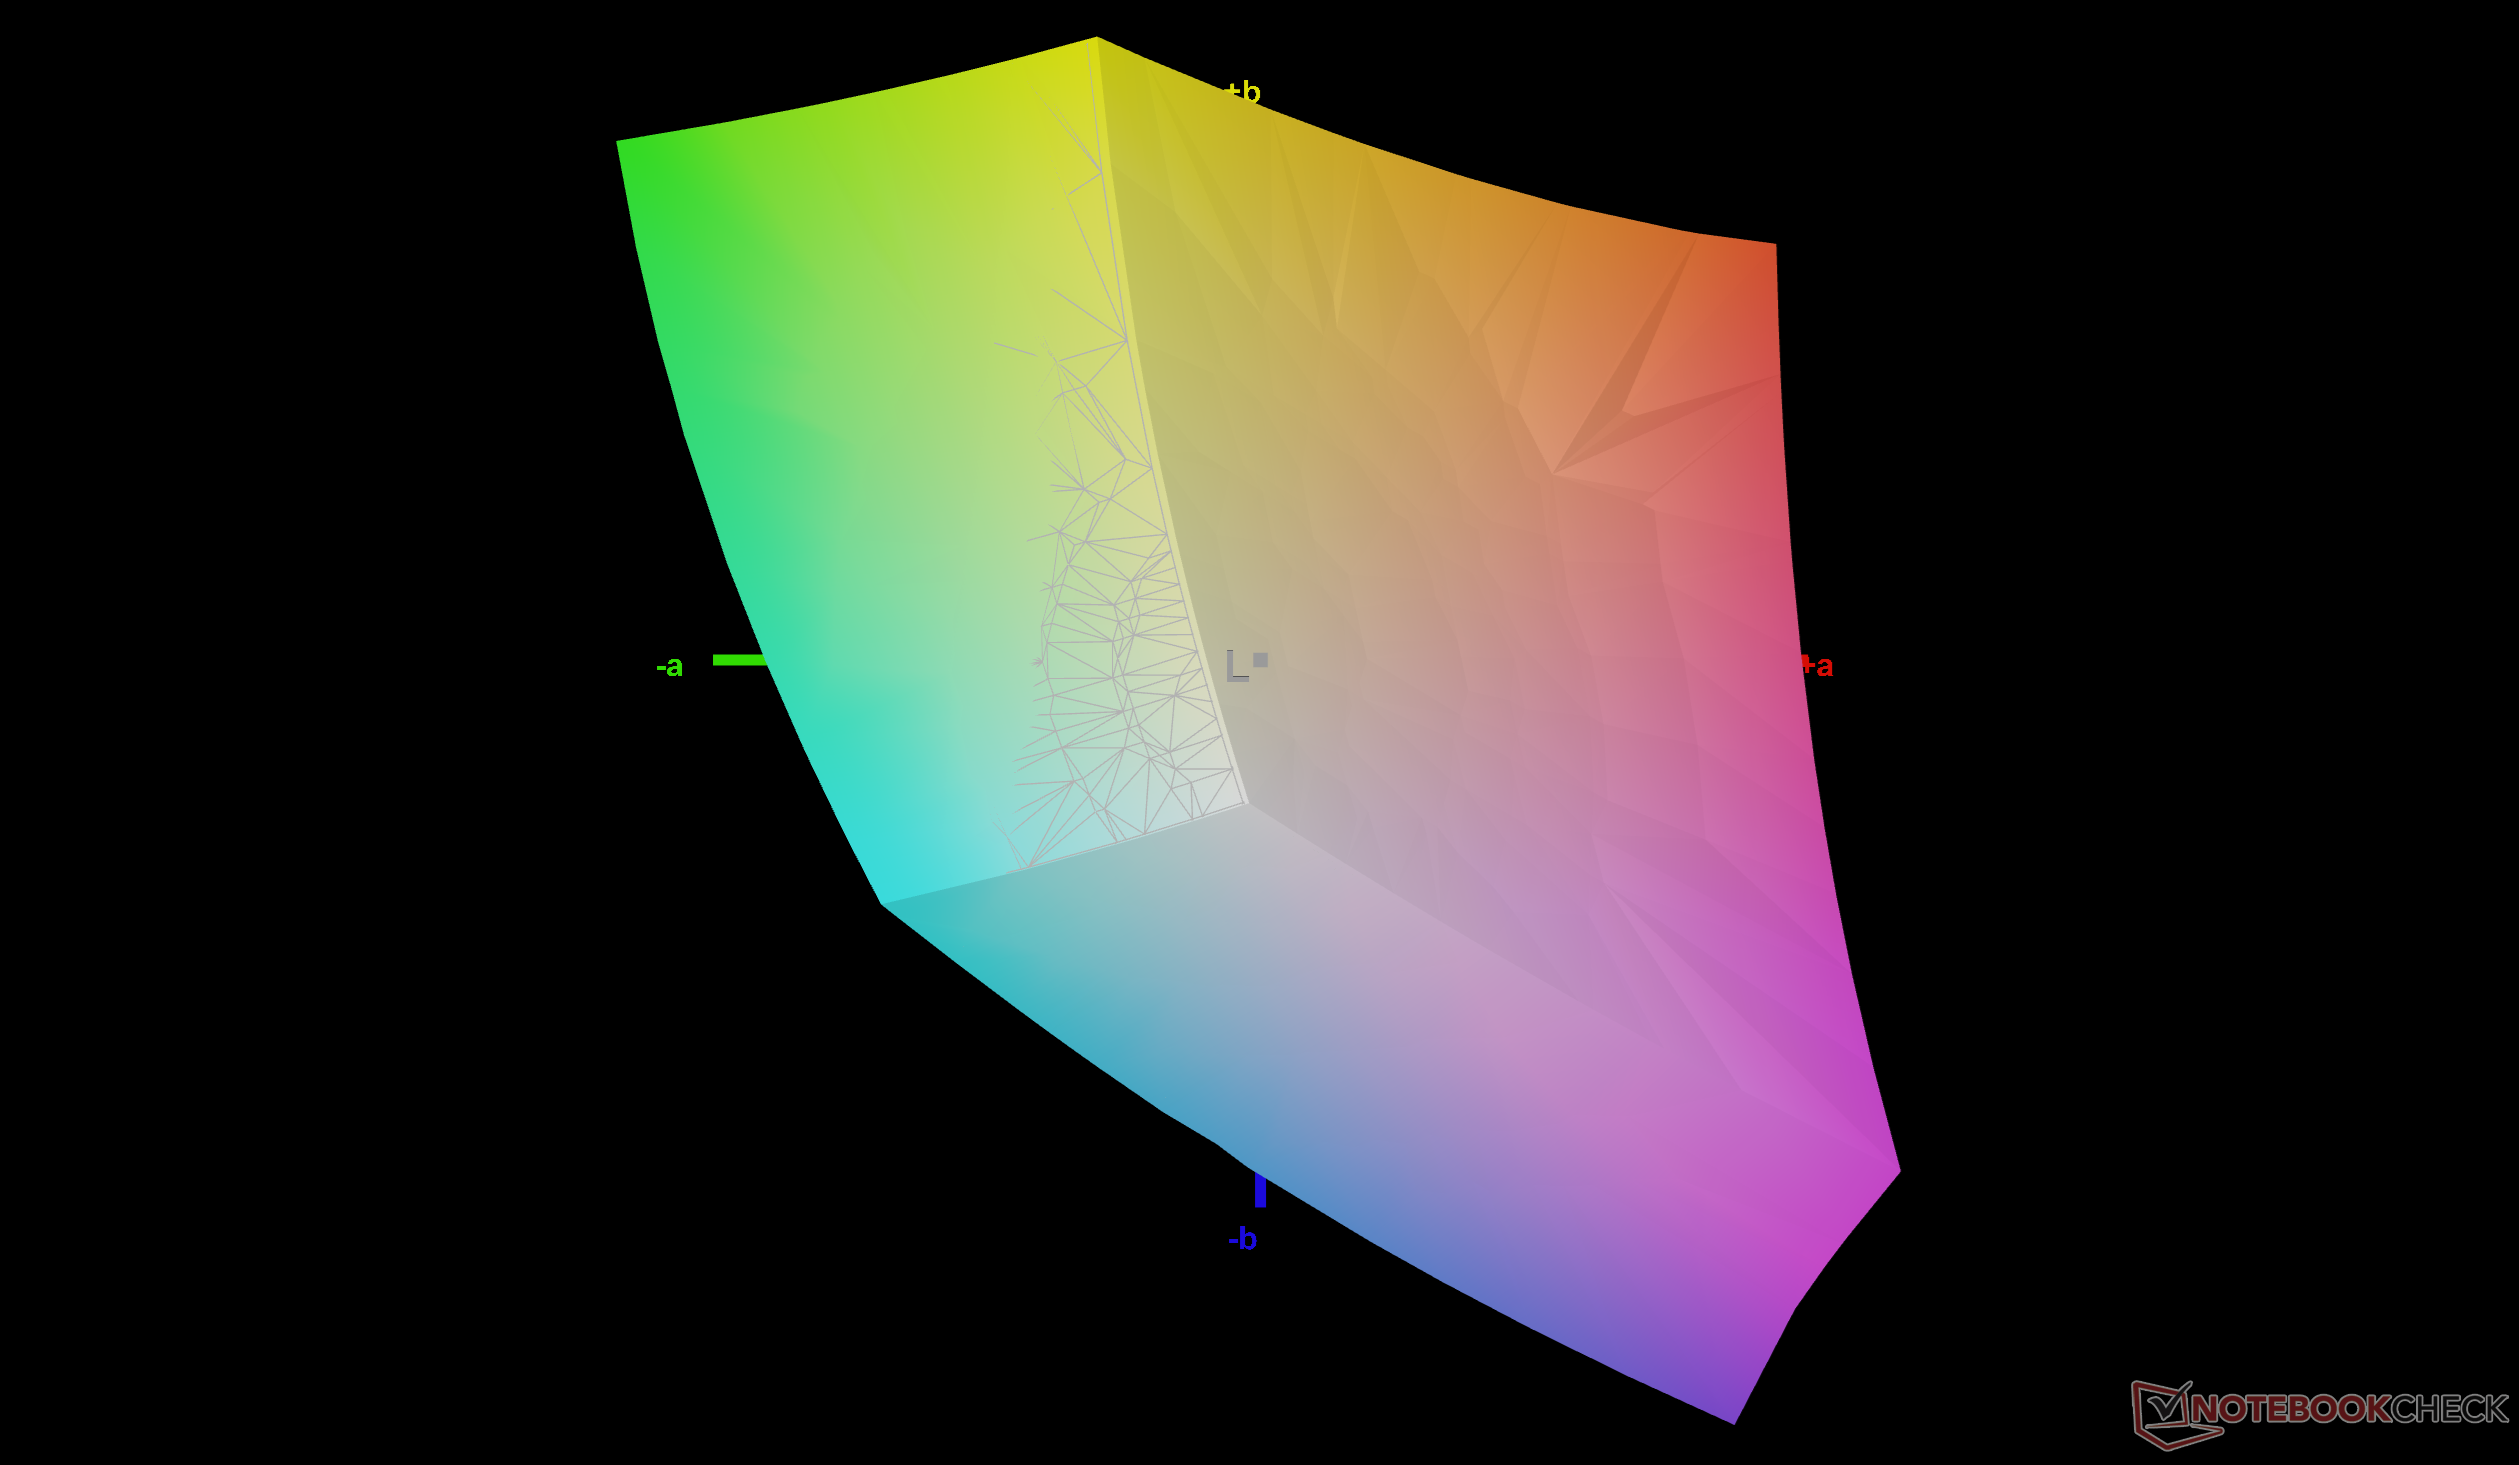
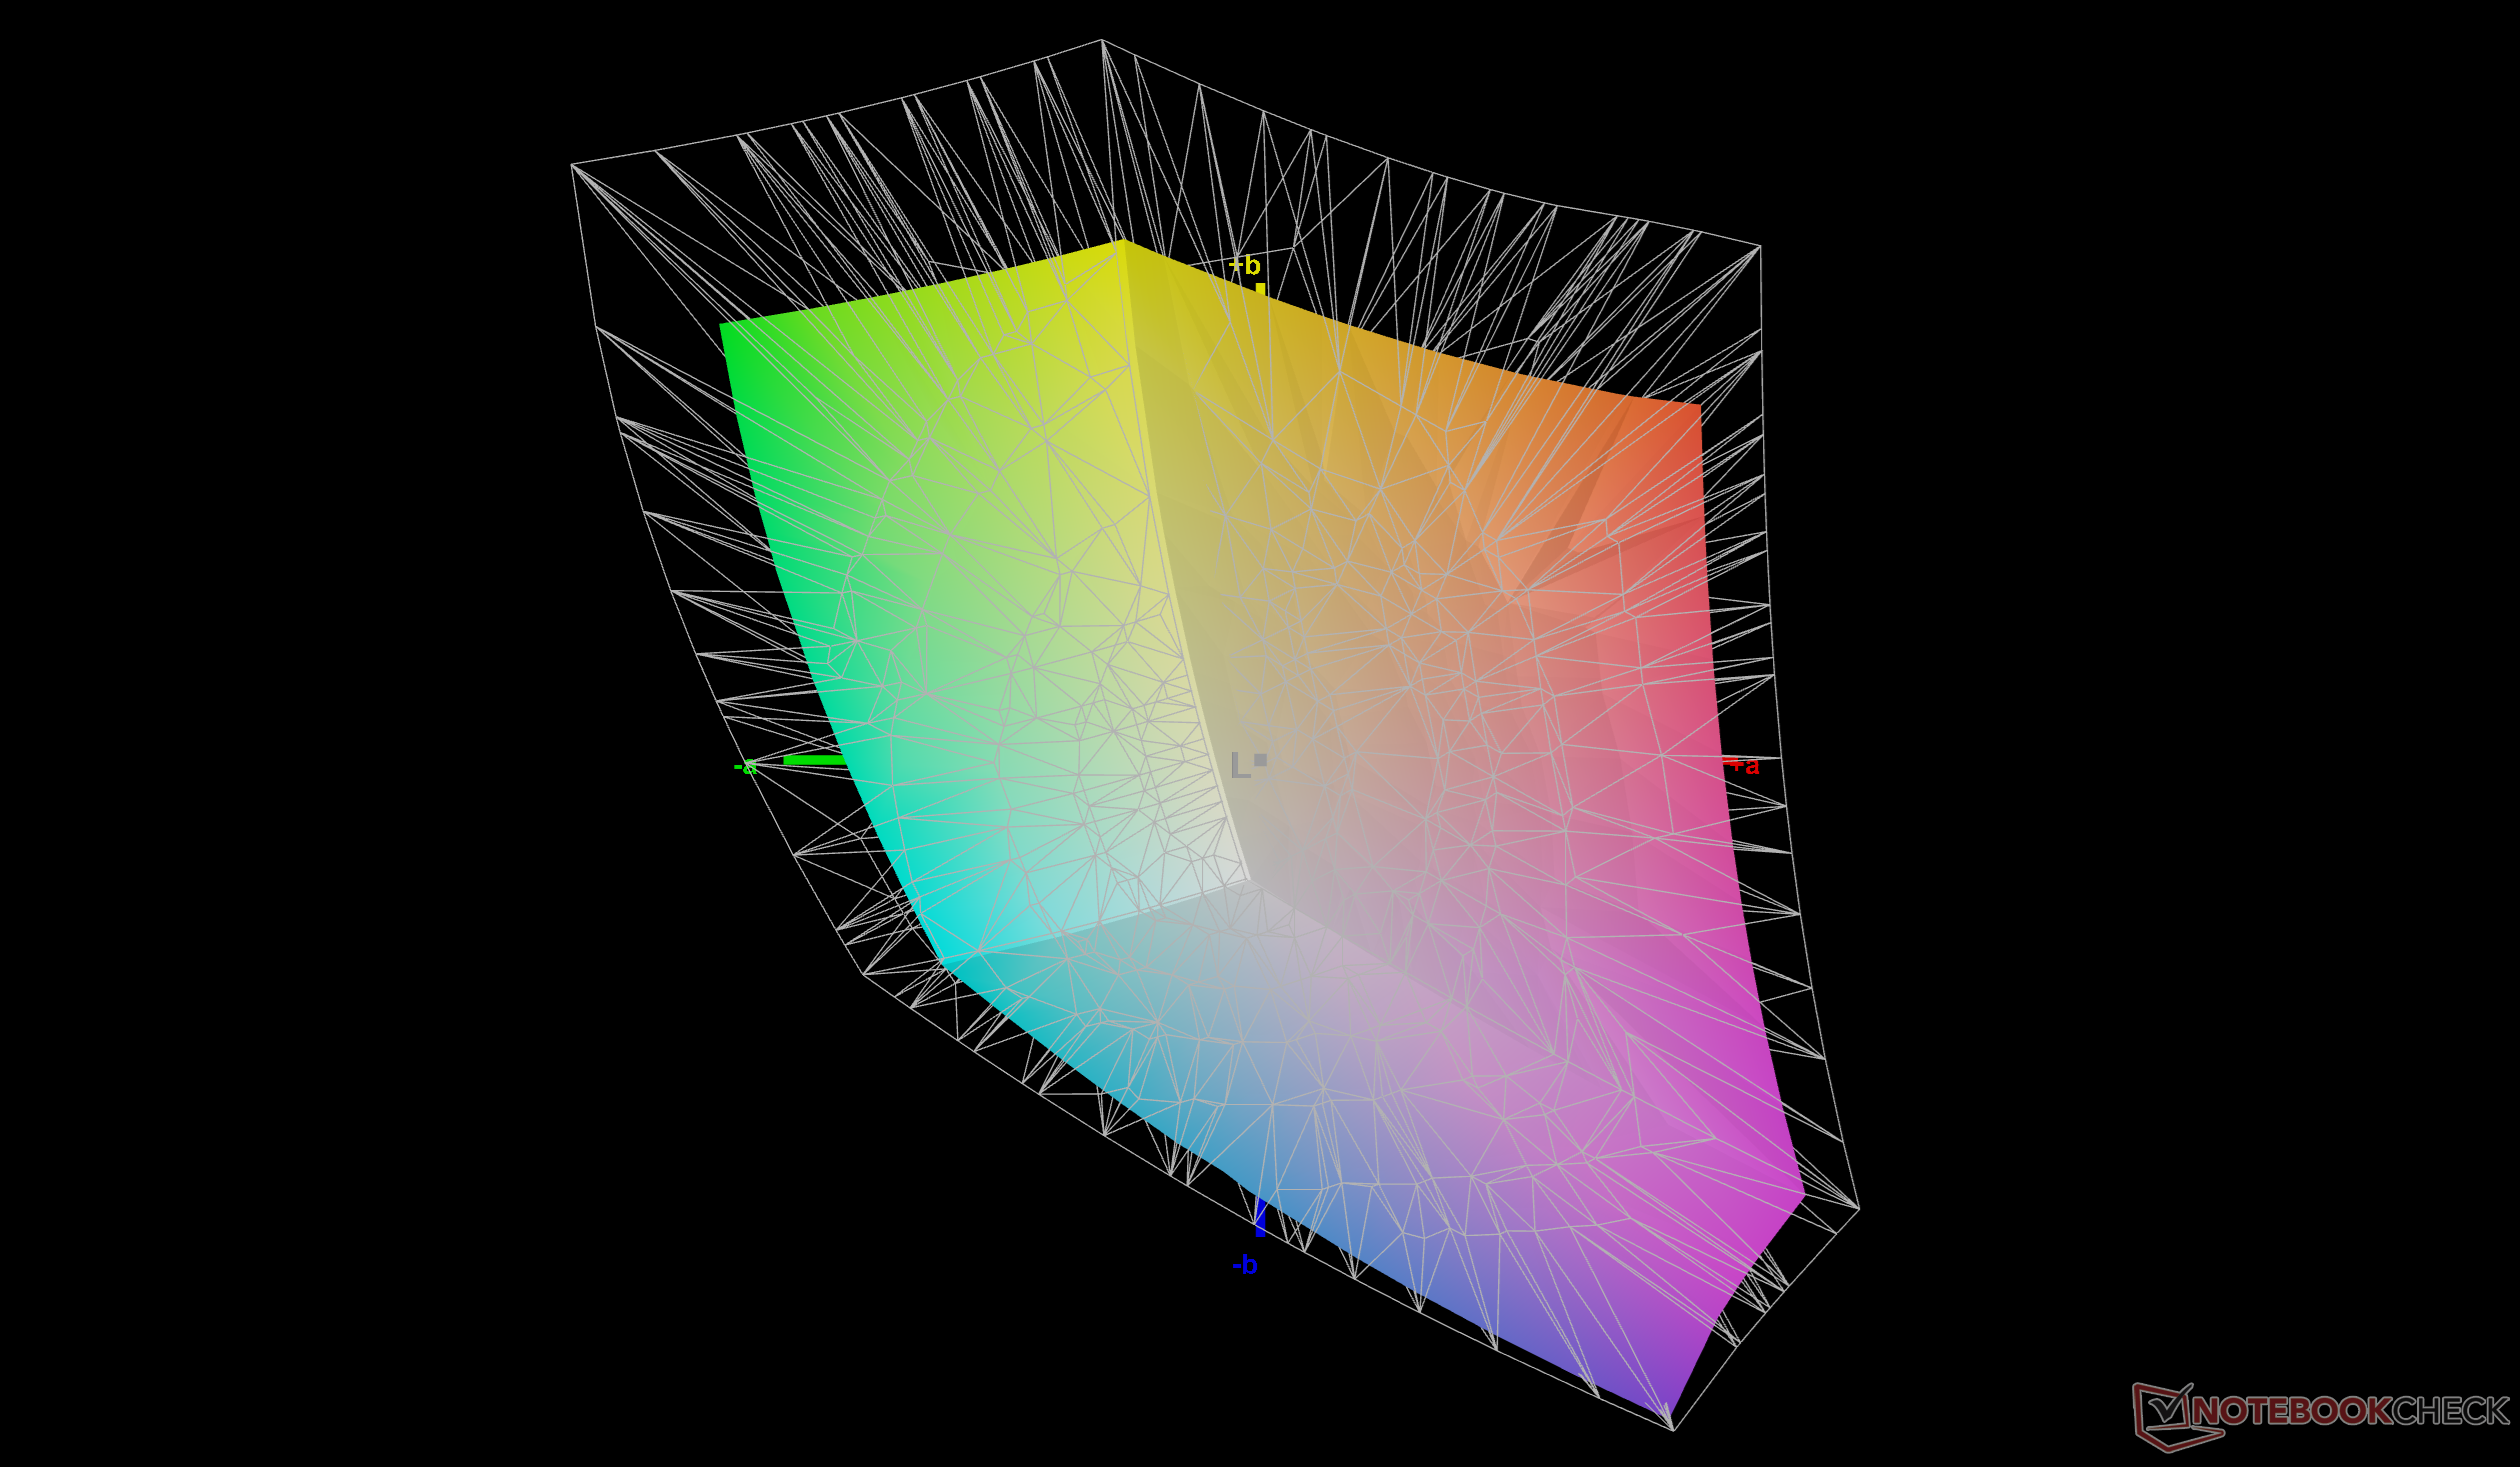
72.4% AdobeRGB 1998 (Argyll 3D)
100% sRGB (Argyll 3D)
71% Display P3 (Argyll 3D)
Gamma: 2.15
CCT: 7237 K
Dell Pro 5 16 P516265
BOE NS16M30, IPS, 2560x1600, 16", 120 Hz
Dell XPS 16 Core Ultra X7 358H
LG Philips 160WV1, OLED, 3200x2000, 16", 120 Hz
Lenovo ThinkPad T16 Gen 5 22AN001WGE
N160JCA-ELN, IPS, 1920x1200, 16", 60 Hz
MSI Venture 16 AI A2HMTG
BOE0D3E, IPS, 1920x1200, 16", 60 Hz
Asus ExpertBook B5 B5605CCA
NE160QDM-NX4, IPS, 2560x1600, 16", 144 Hz
HP EliteBook 8 G1a 16 AI
IPS, 1920x1200, 16", 60 Hz
Display
24%
-41%
-44%
-3%
-3%
Display P3 Coverage (%)
71
99.5
40%
40.7
-43%
39.4
-45%
68.5
-4%
68.5
-4%
sRGB Coverage (%)
100
100
0%
61.1
-39%
57.4
-43%
98.3
-2%
98.6
-1%
AdobeRGB 1998 Coverage (%)
72.4
96.5
33%
42
-42%
40.7
-44%
69.4
-4%
70.4
-3%
Response Times
97%
27%
26%
16%
-31%
Response Time Grey 50% / Grey 80% * (ms)
38.3 ?(17, 21.3)
0.65 ?(0.36, 0.29)
98%
32.6 ?(16, 16.6)
15%
26.7 ?(12.9, 13.8)
30%
35.6 ?(16.7, 18.9)
7%
50.2 ?(22.8, 27.4)
-31%
Response Time Black / White * (ms)
23.4 ?(10.8, 12.6)
0.87 ?(0.43, 0.44)
96%
14.2 ?(5.7, 8.5)
39%
18.4 ?(9.9, 8.5)
21%
17.5 ?(6.6, 10.9)
25%
30.7 ?(15.7, 15)
-31%
PWM Frequency (Hz)
240.2 ?(100)
PWM Amplitude * (%)
31
Screen
11%
-86%
-66%
-13%
4%
Brightness middle (cd/m²)
470.3
395.4
-16%
479
2%
321.7
-32%
413
-12%
439.2
-7%
Brightness (cd/m²)
464
392
-16%
452
-3%
306
-34%
408
-12%
405
-13%
Brightness Distribution (%)
94
95
1%
89
-5%
91
-3%
94
0%
88
-6%
Black Level * (cd/m²)
0.17
0.51
-200%
0.18
-6%
0.2
-18%
0.31
-82%
Contrast (:1)
2766
939
-66%
1787
-35%
2065
-25%
1417
-49%
Colorchecker dE 2000 *
4.45
3.69
17%
4.1
8%
6.11
-37%
3.6
19%
2.2
51%
Colorchecker dE 2000 max. *
11.13
7.94
29%
16.8
-51%
19.43
-75%
7.1
36%
4.31
61%
Colorchecker dE 2000 calibrated *
0.6
0.68
-13%
3.8
-533%
3.13
-422%
1.5
-150%
0.49
18%
Greyscale dE 2000 *
7.8
1.9
76%
1.7
78%
3.9
50%
4.6
41%
3.2
59%
Gamma
2.15 102%
2.28 96%
2.25 98%
2.22 99%
2.25 98%
2.3 96%
CCT
7237 90%
6274 104%
6777 96%
6250 104%
7461 87%
6438 101%
Media total (Programa/Opciones)
44% / 29%
-33% / -60%
-28% / -48%
0% / -7%
-10% / -3%

* ... más pequeño es mejor

vs. sRGB
vs. sRGB
vs. P3
vs. P3
Escala de grises antes de la calibración (frente a sRGB)
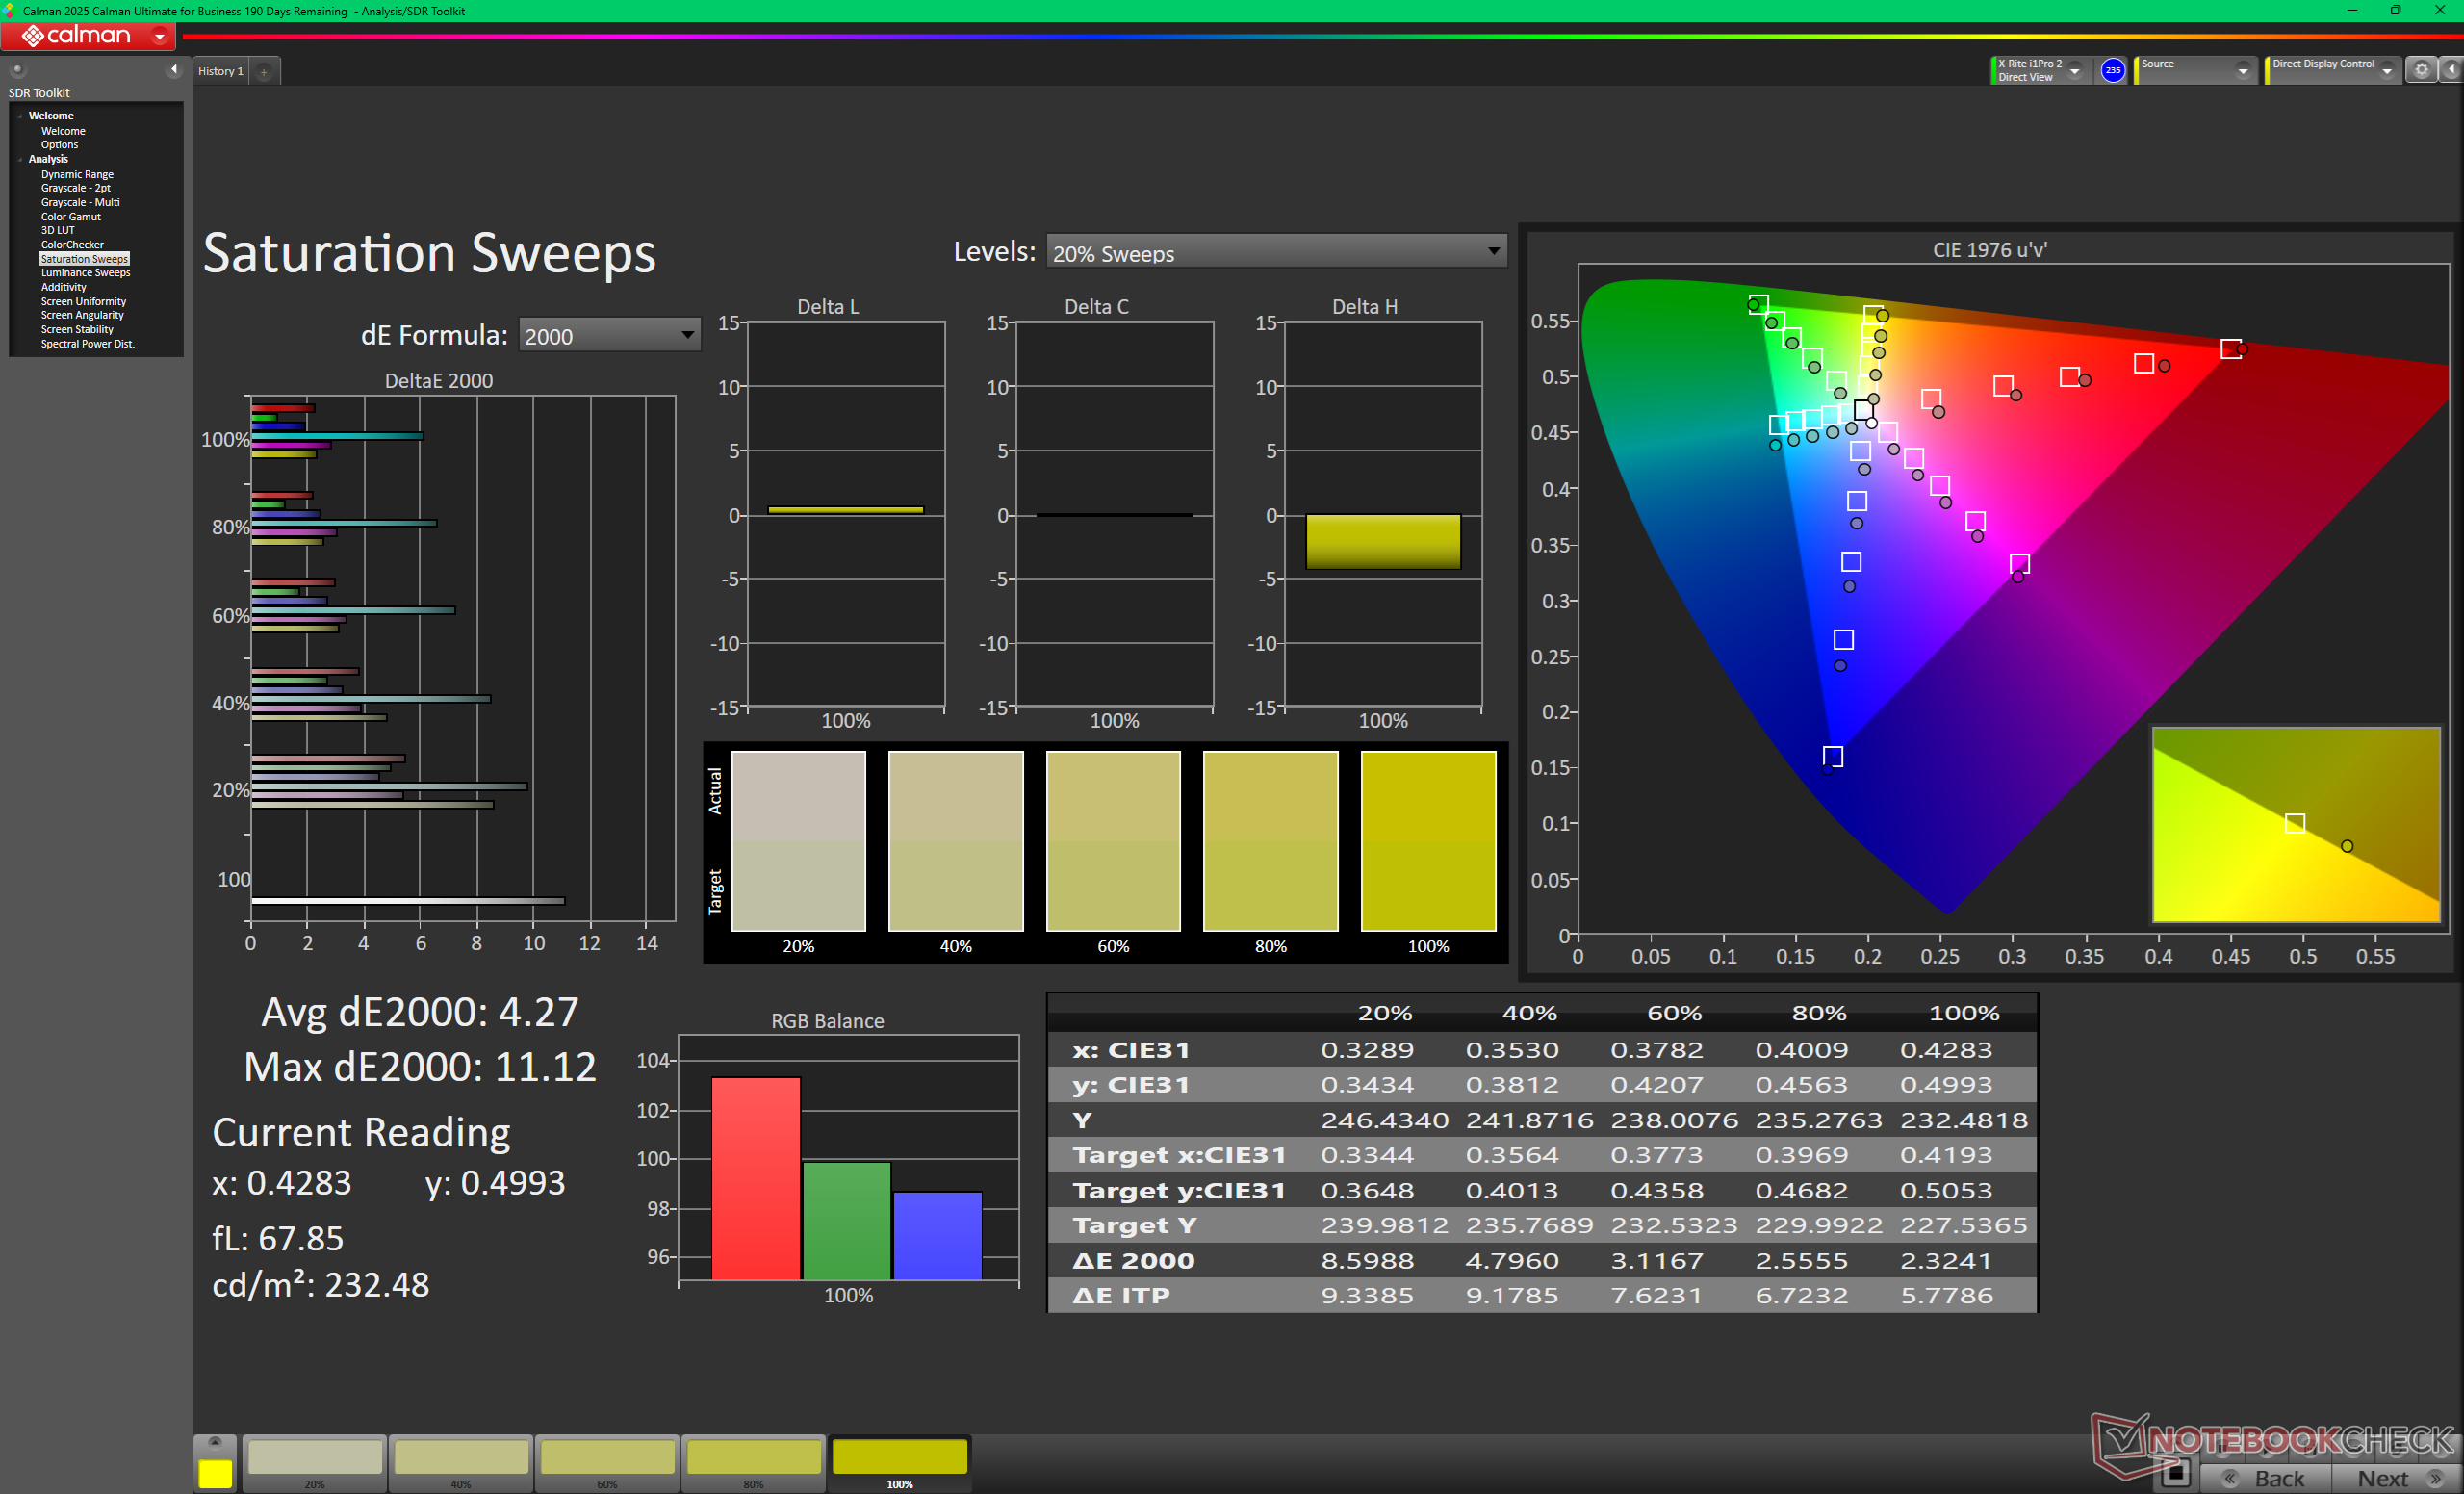
Barridos de saturación antes de la calibración (frente a sRGB)
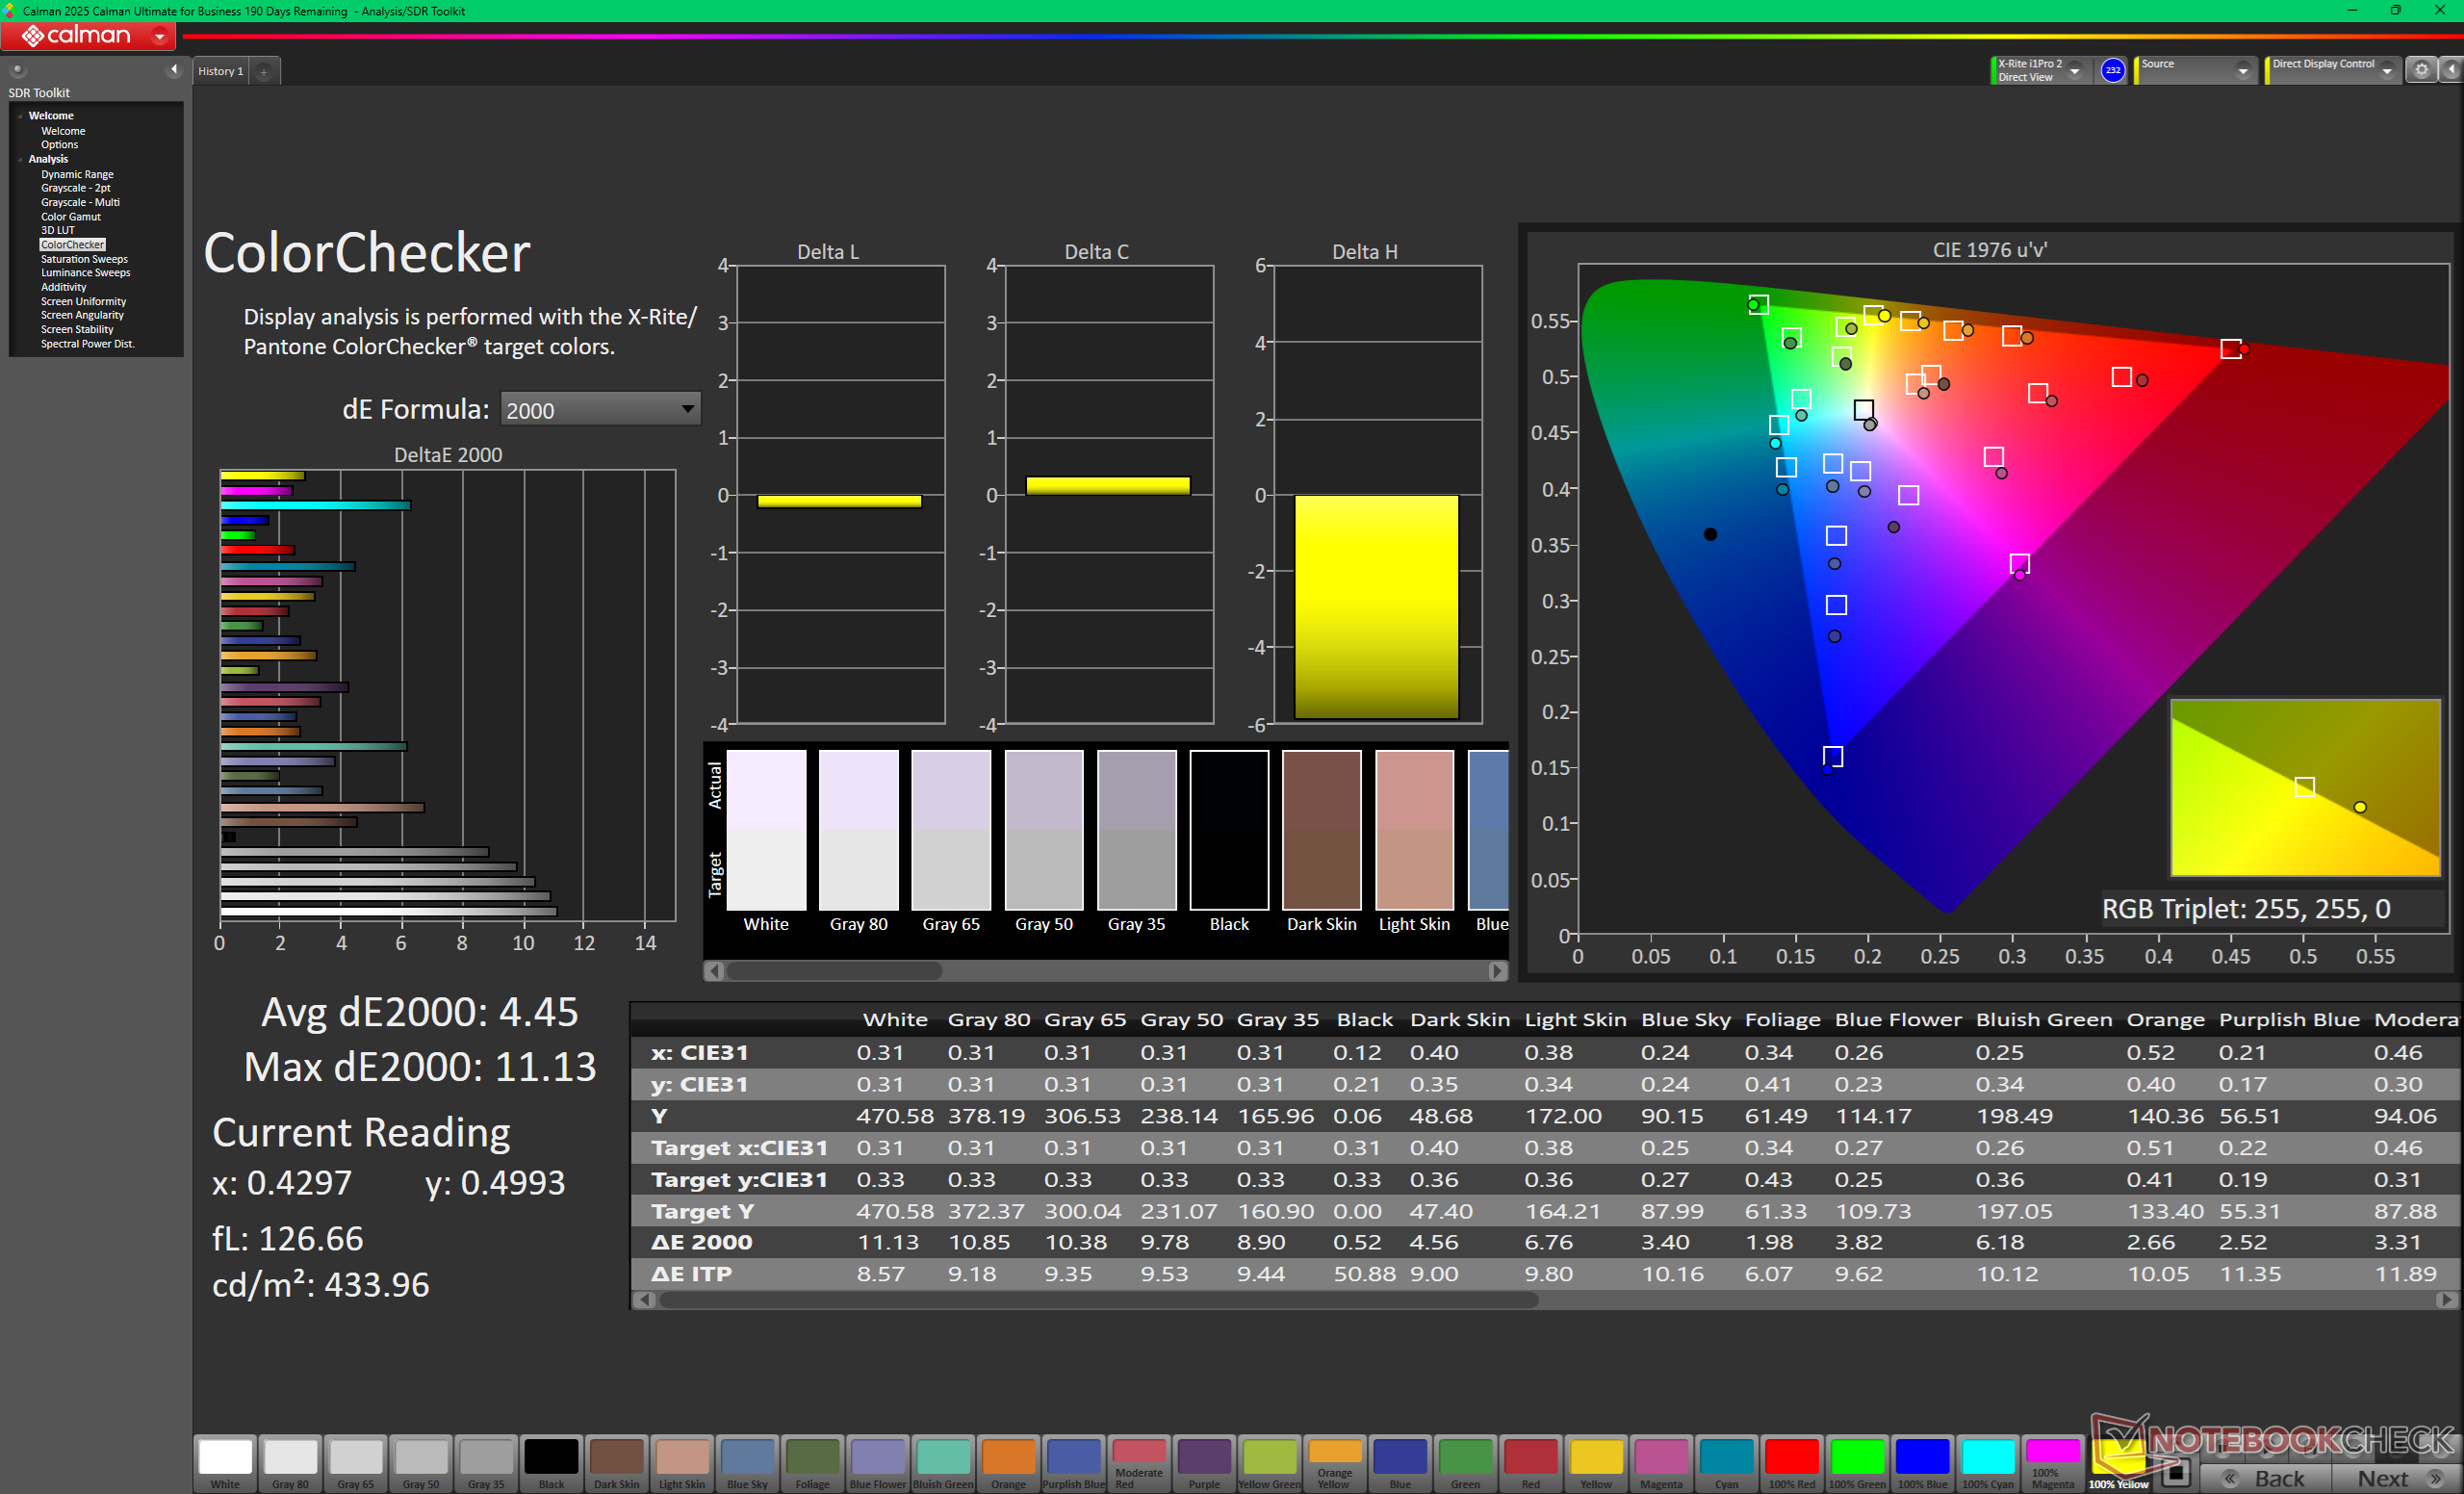
ColorChecker antes de la calibración (frente a sRGB)
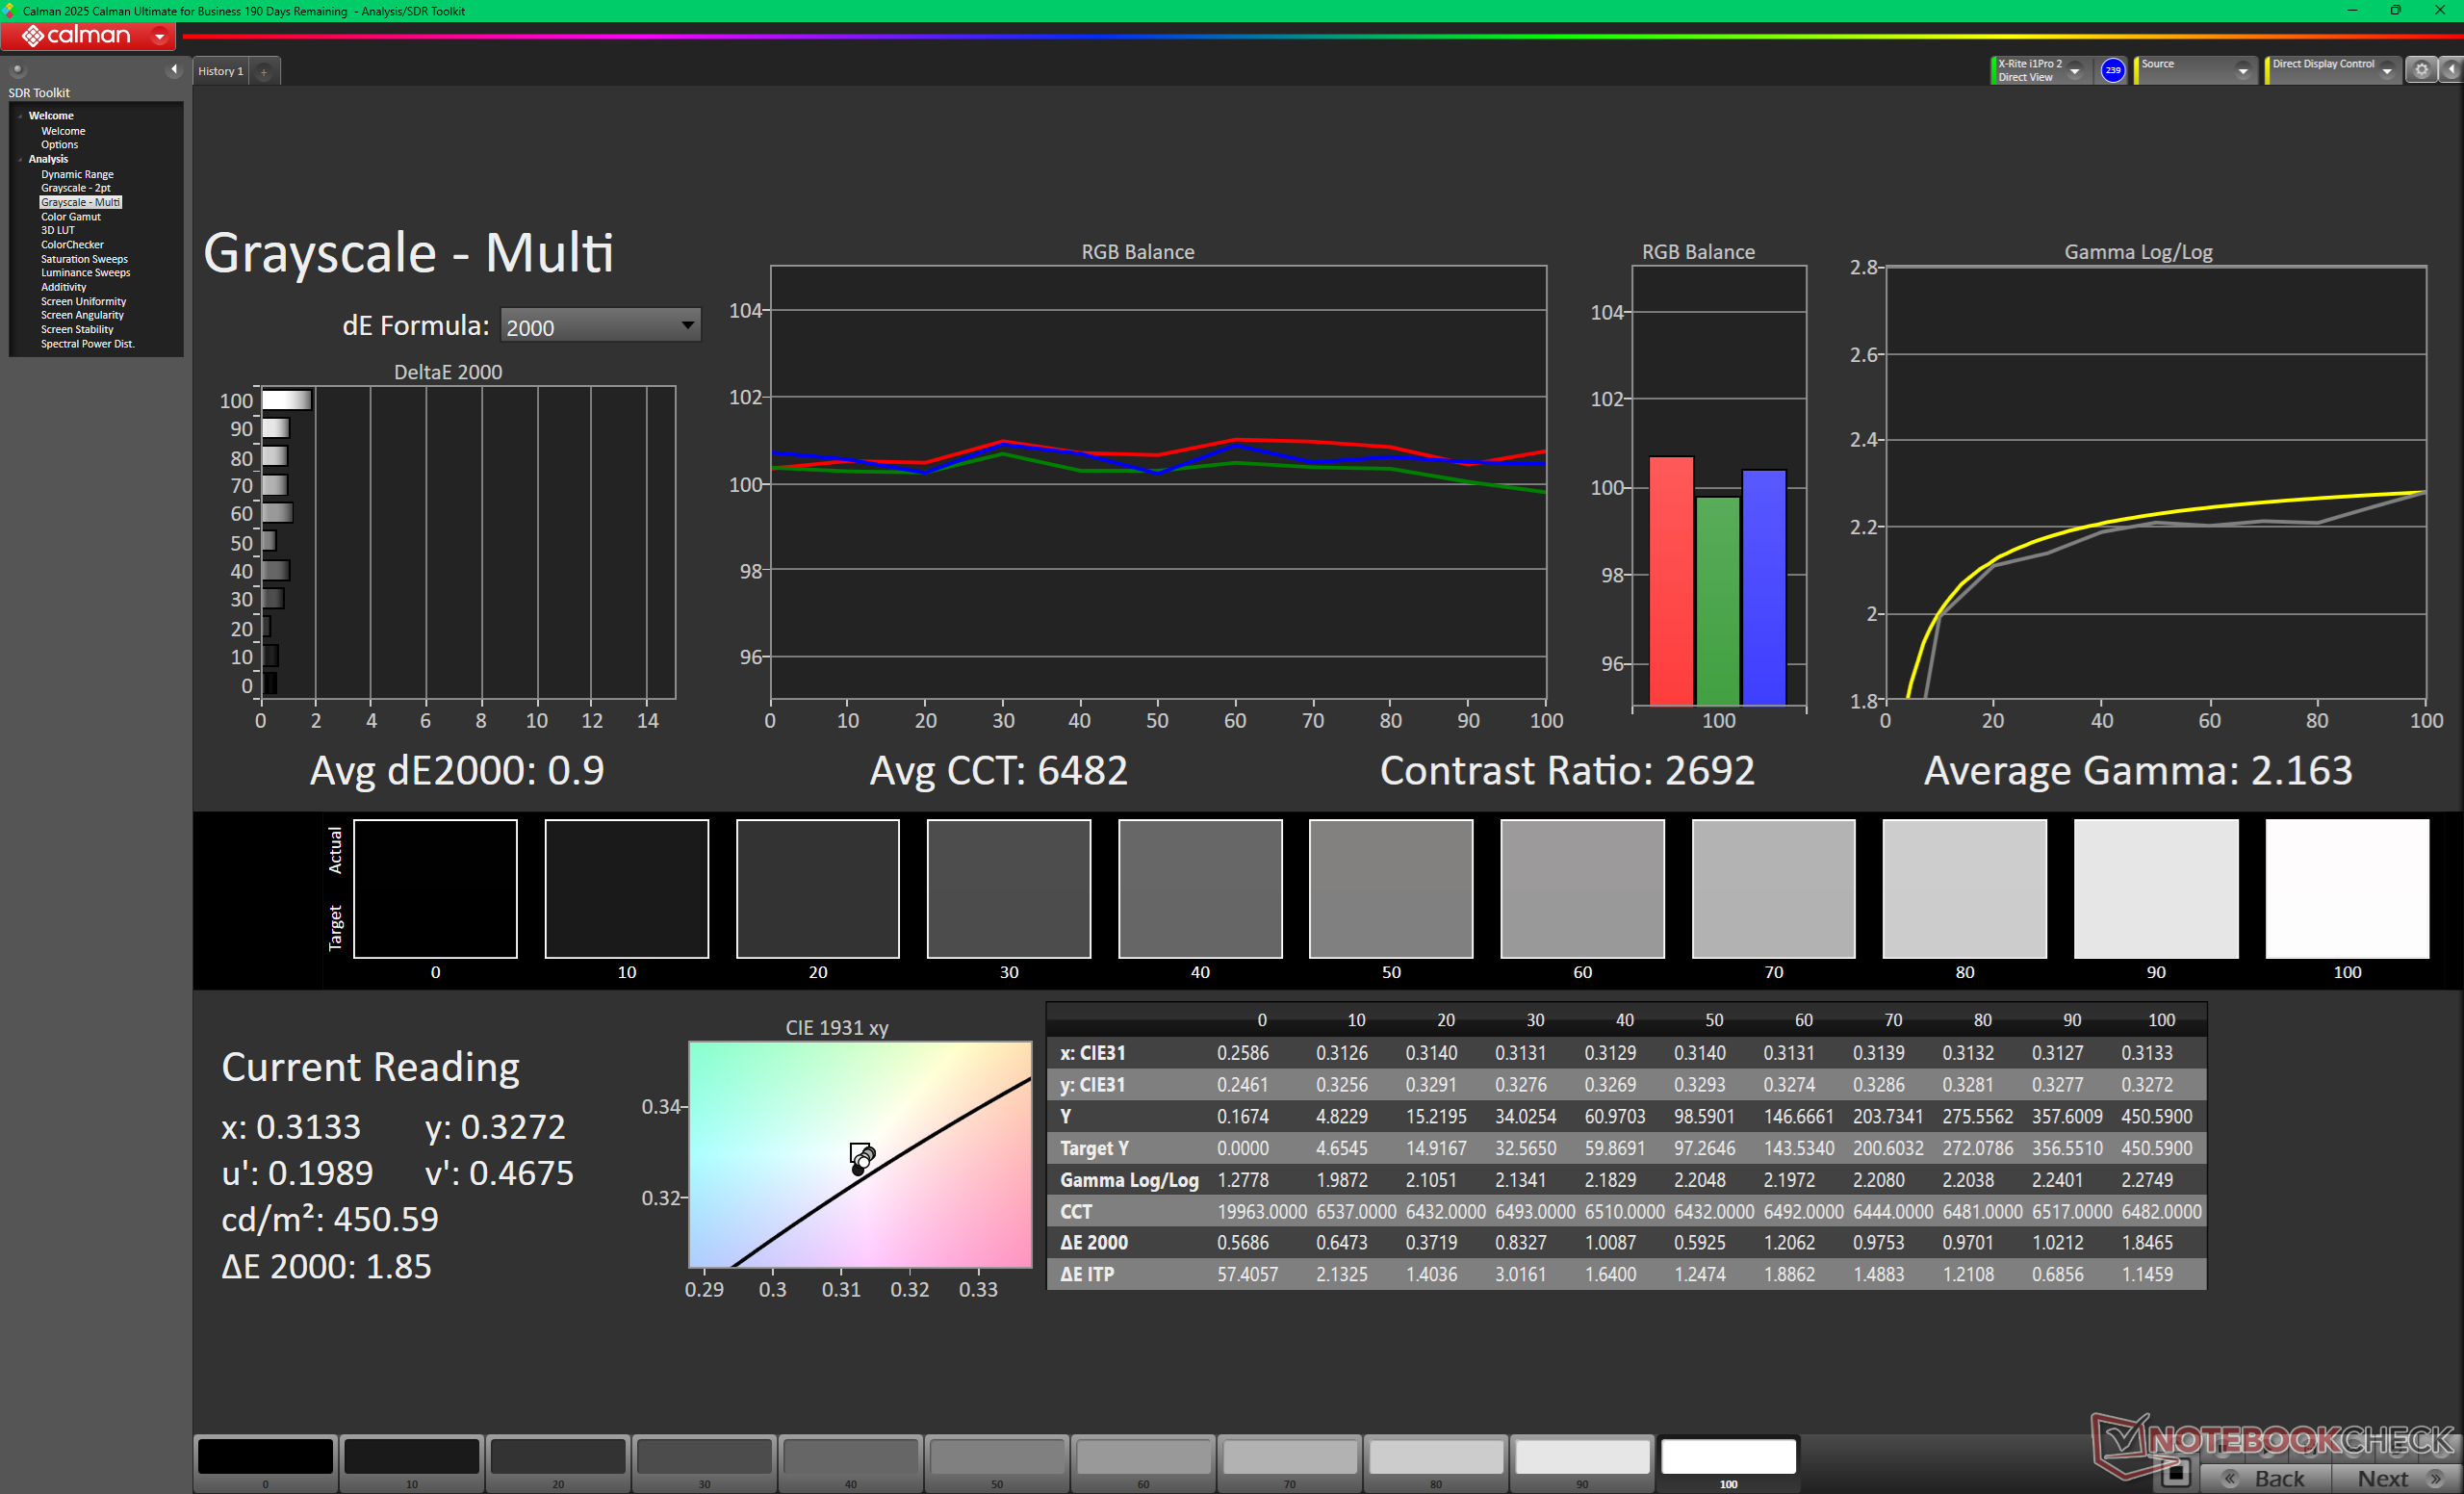
Escala de grises tras la calibración
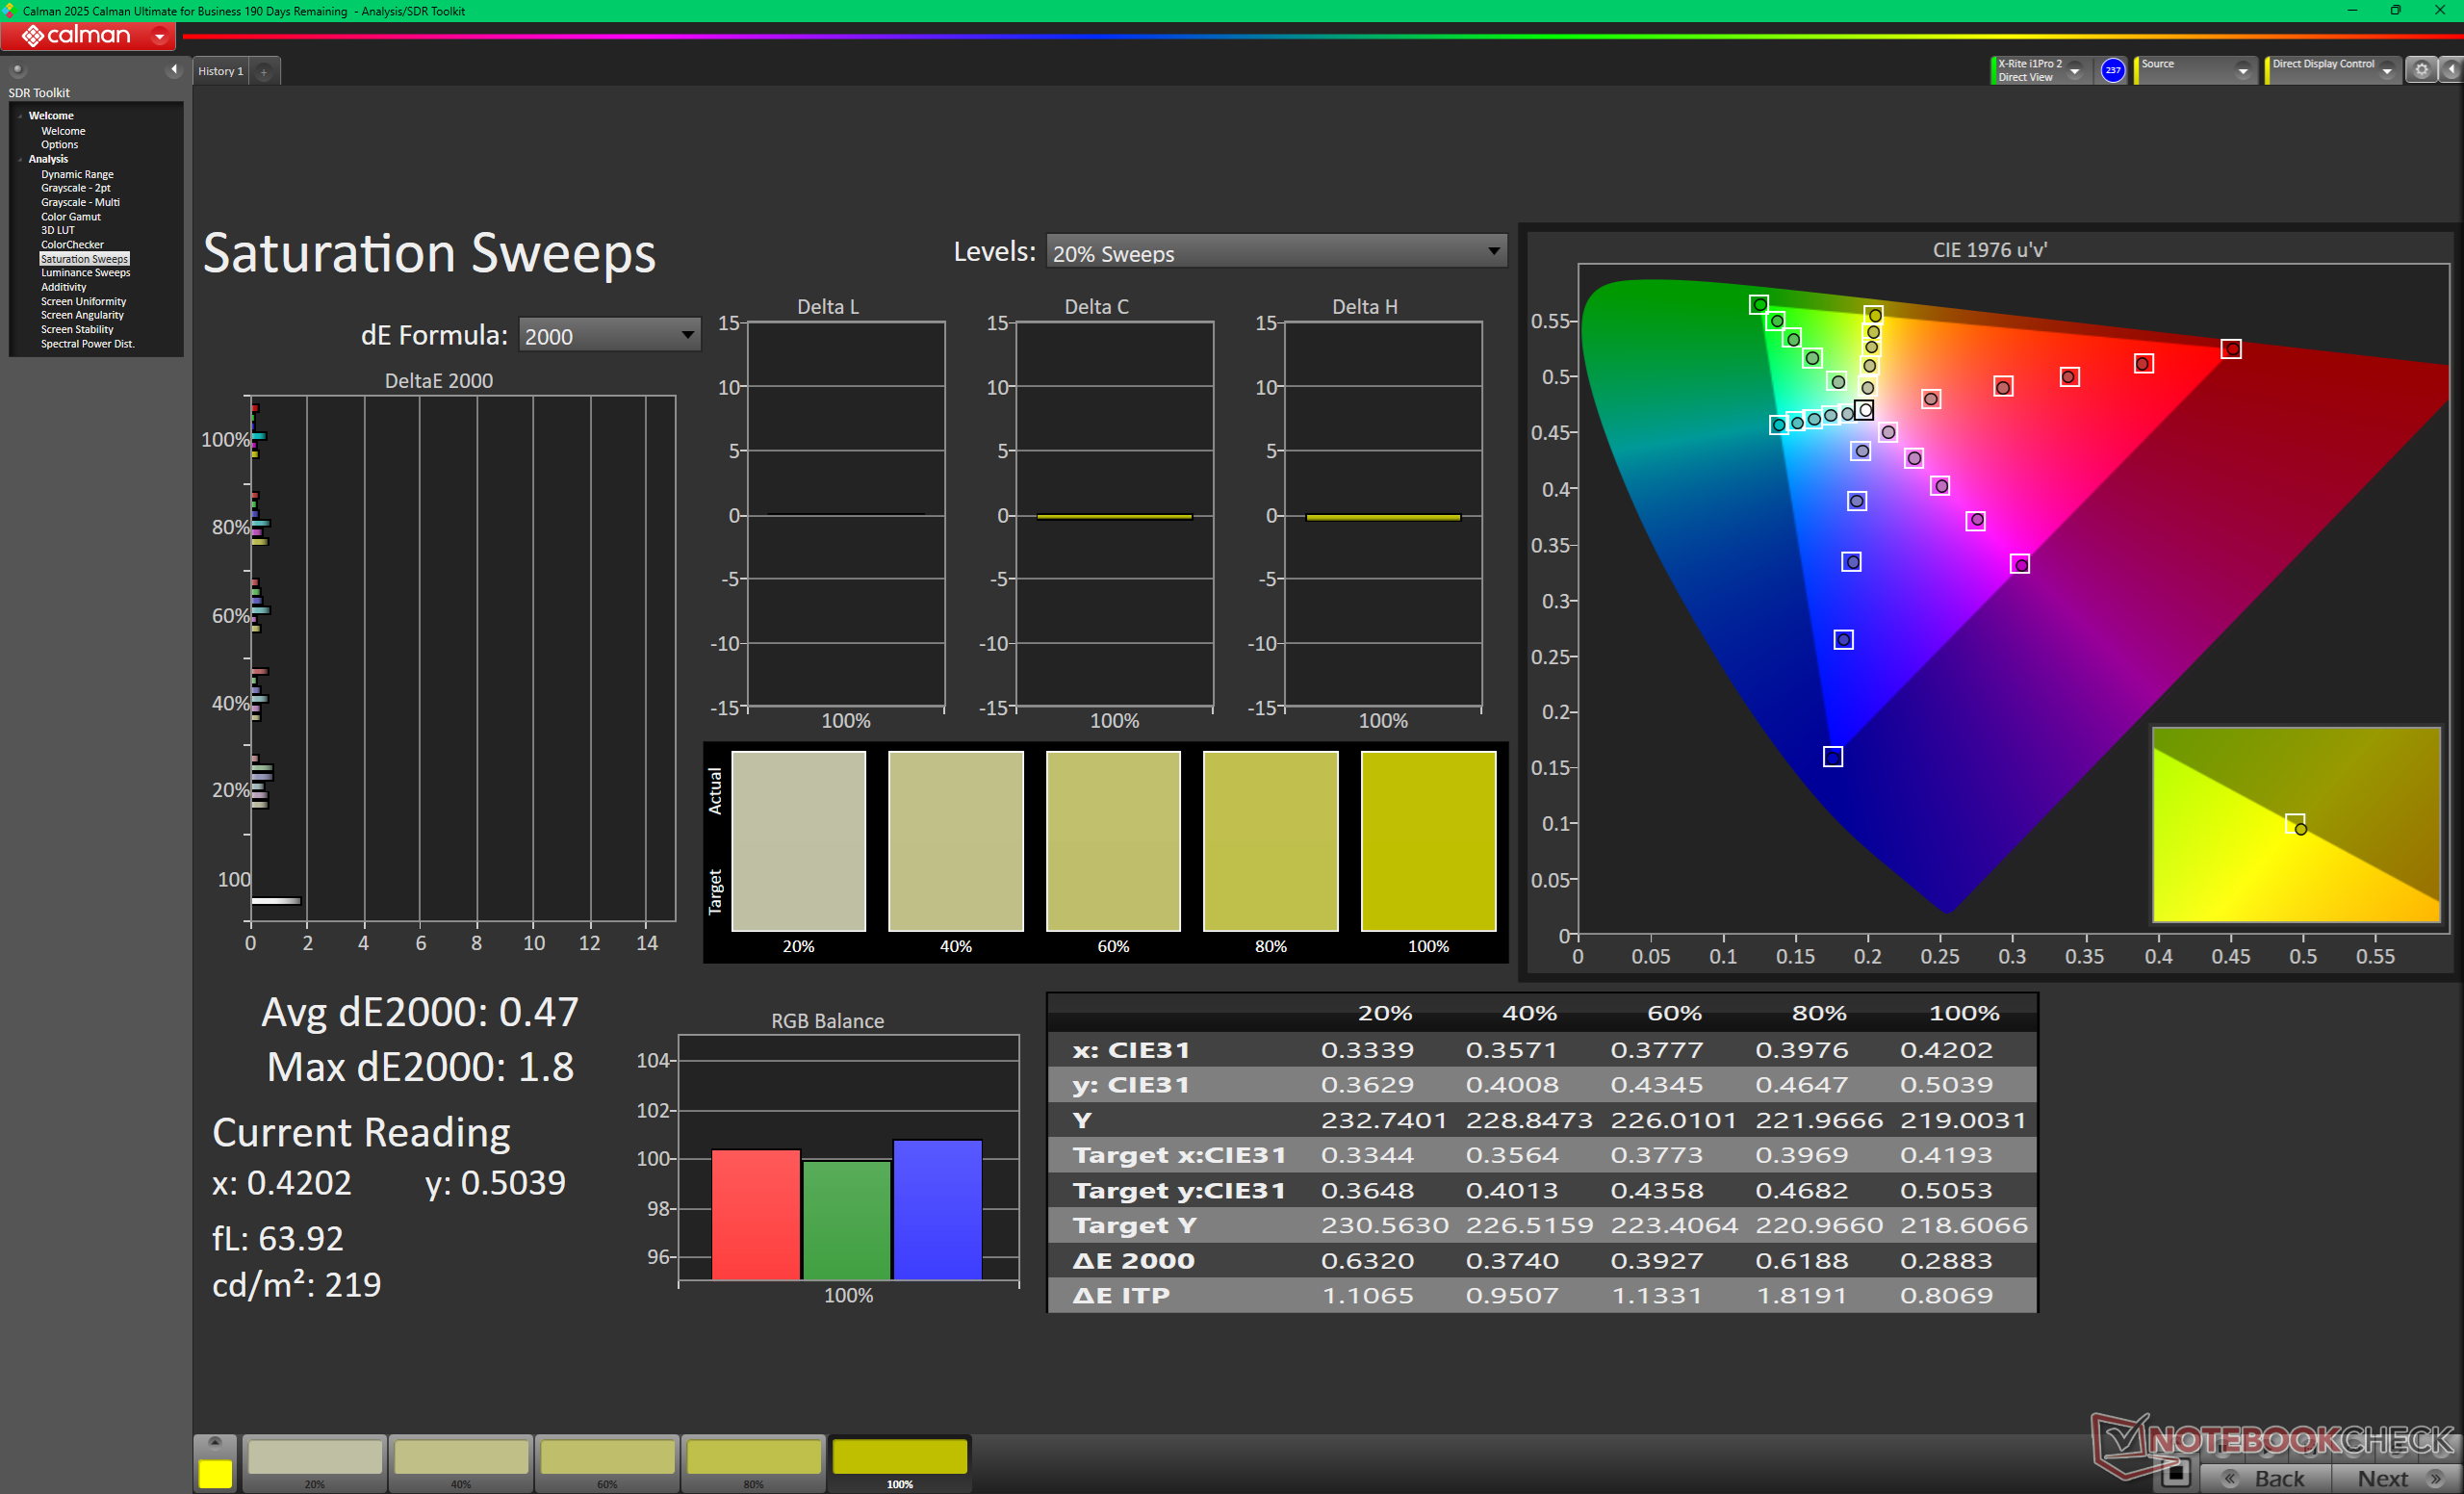
Barridos de saturación tras la calibración
ColorChecker tras la calibración

Tiempos de respuesta del display

Los tiempos de respuesta del display muestran lo rápido que puede cambiar la pantalla de un color al siguiente. Tiempos lentos de respuesta pueden llevar a imágenes persistentes alrededor de objetos en movimiento o a displays borrosos. Particularmente los aficionados a los juegos 3D frenéticos deberían usar una pantalla con tiempos de respuesta rápidos.
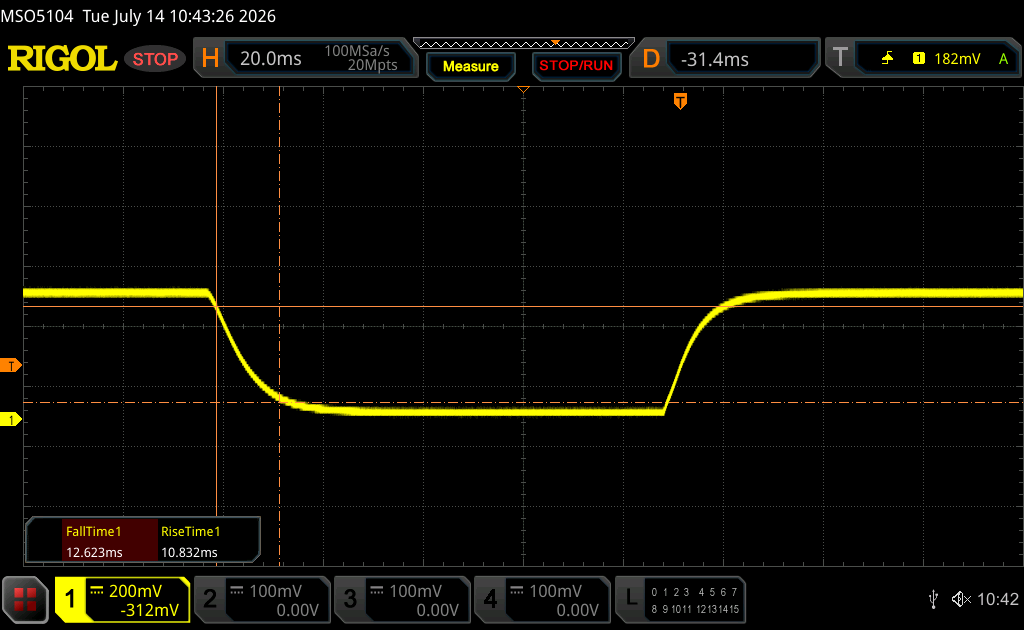
       Tiempo de respuesta de Negro a Blanco
23.4 ms ... subida ↗ y bajada ↘ combinada↗ 10.8 ms subida
↘ 12.6 ms bajada
La pantalla mostró buenos tiempos de respuesta en nuestros tests pero podría ser demasiado lenta para los jugones competitivos.
En comparación, todos los dispositivos de prueba van de ##min### (mínimo) a 240 (máximo) ms. » 54 % de todos los dispositivos son mejores.
Eso quiere decir que el tiempo de respuesta es peor que la media (19.8 ms) de todos los dispositivos testados.
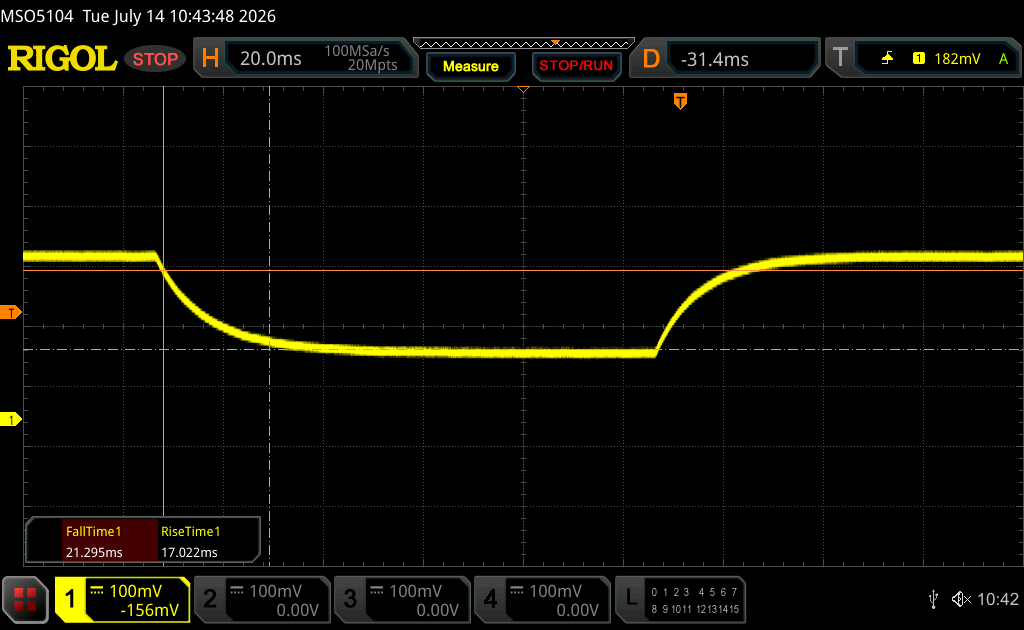
       Tiempo de respuesta 50% Gris a 80% Gris
38.3 ms ... subida ↗ y bajada ↘ combinada↗ 17 ms subida
↘ 21.3 ms bajada
La pantalla mostró tiempos de respuesta lentos en nuestros tests y podría ser demasiado lenta para los jugones.
En comparación, todos los dispositivos de prueba van de ##min### (mínimo) a 636 (máximo) ms. » 57 % de todos los dispositivos son mejores.
Eso quiere decir que el tiempo de respuesta es peor que la media (31 ms) de todos los dispositivos testados.

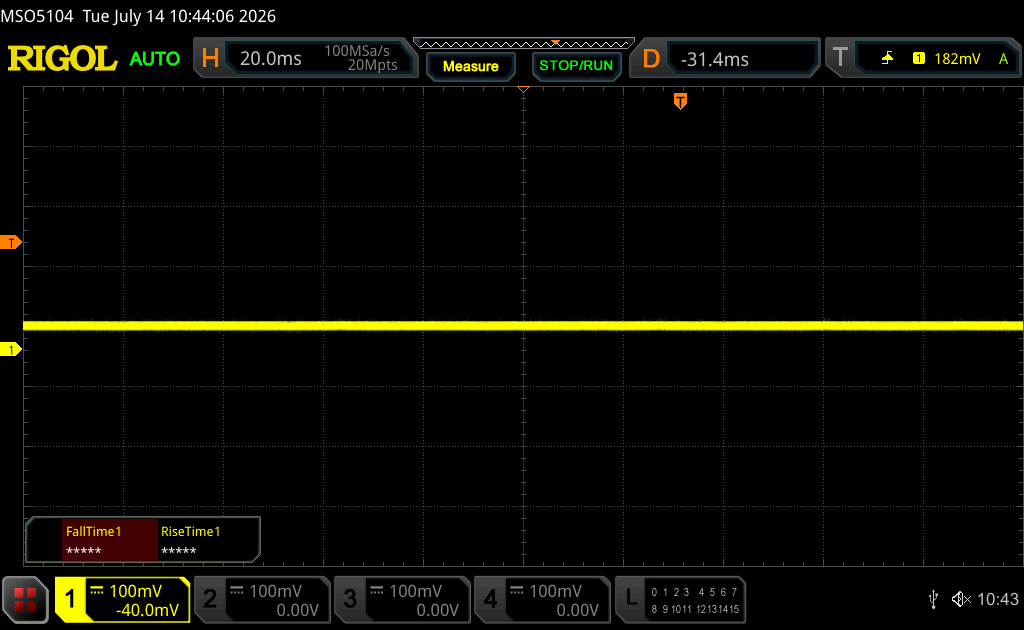
Parpadeo de Pantalla / PWM (Pulse-Width Modulation)

Para atenuar el brillo de pantalla algunos portátiles están encendiendo y apagando la retroiluminación muy rápidamente. Esto se hace a una frecuencia que no debiera detectarse a simple vista. Si la frecuencia es demasiado lenta, la gente sensible podría experimentar problemas visuales, dolores de cabeza e incluso ver parpadeos.
Parpadeo de Pantalla / PWM no detectado

Comparación: 52 % de todos los dispositivos testados no usaron PWM para atenuar el display. Si se usó, medimos una media de 7757 (mínimo: 5 - máxmo: 343500) Hz.

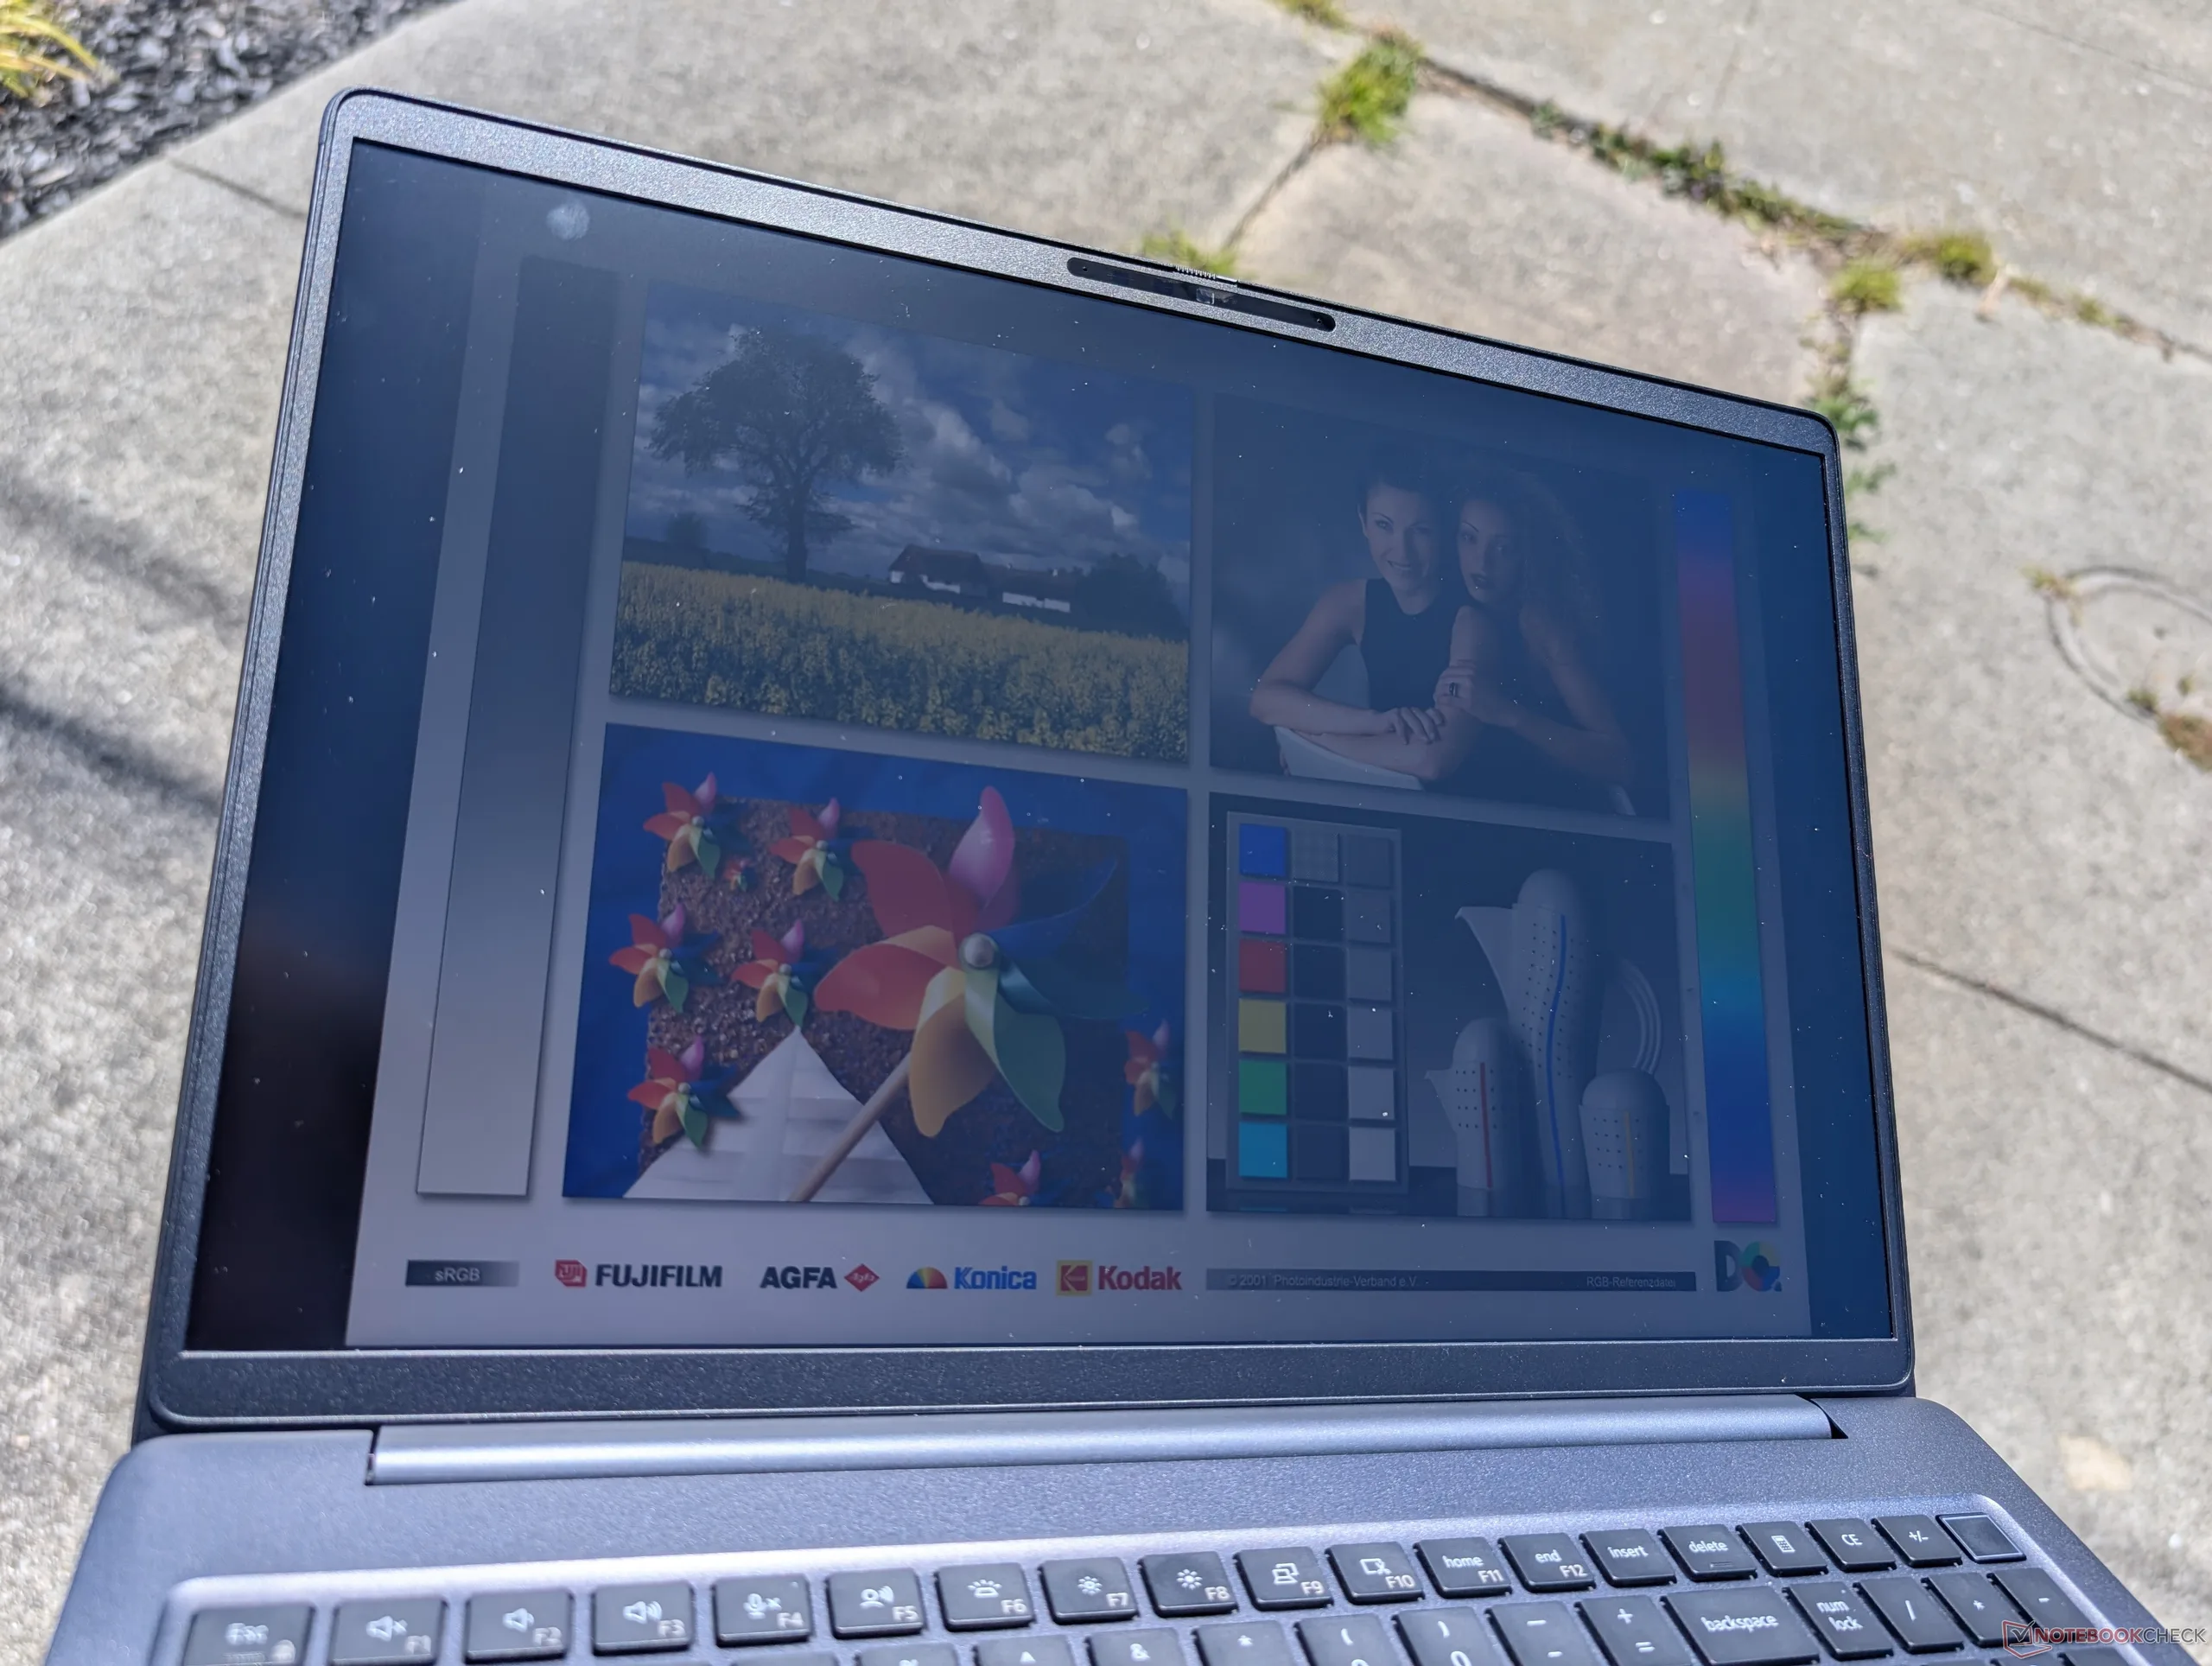
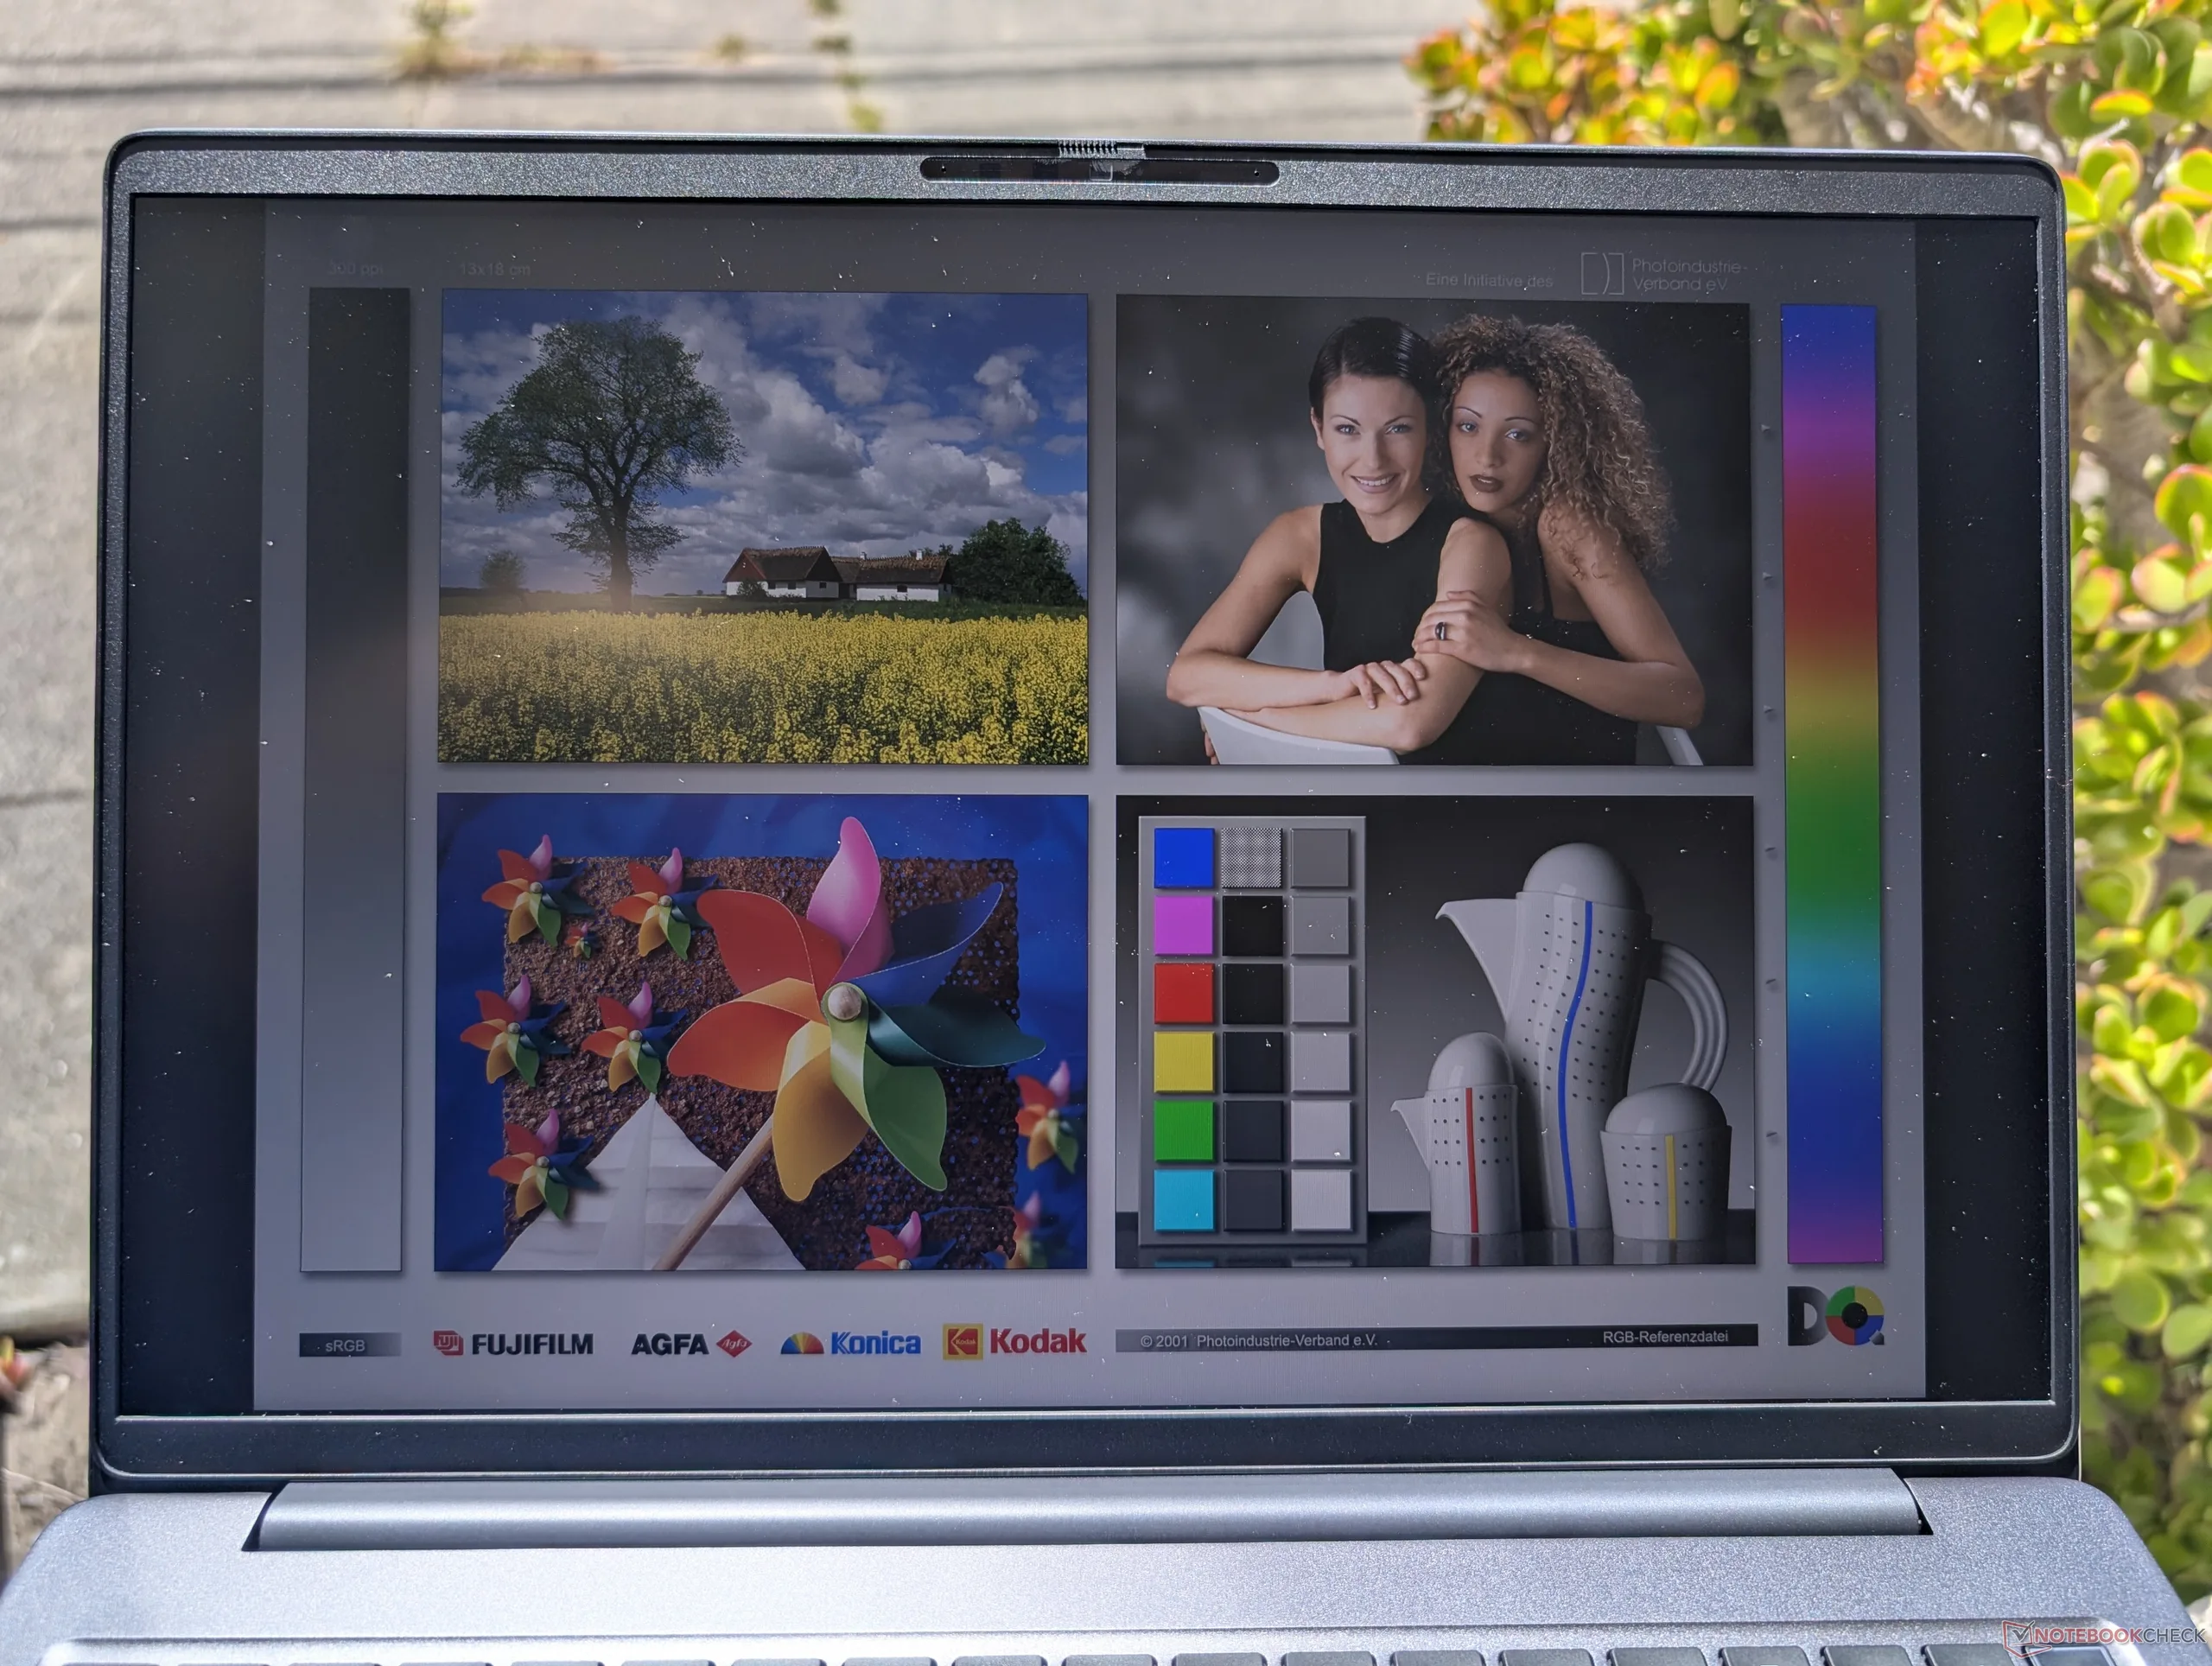
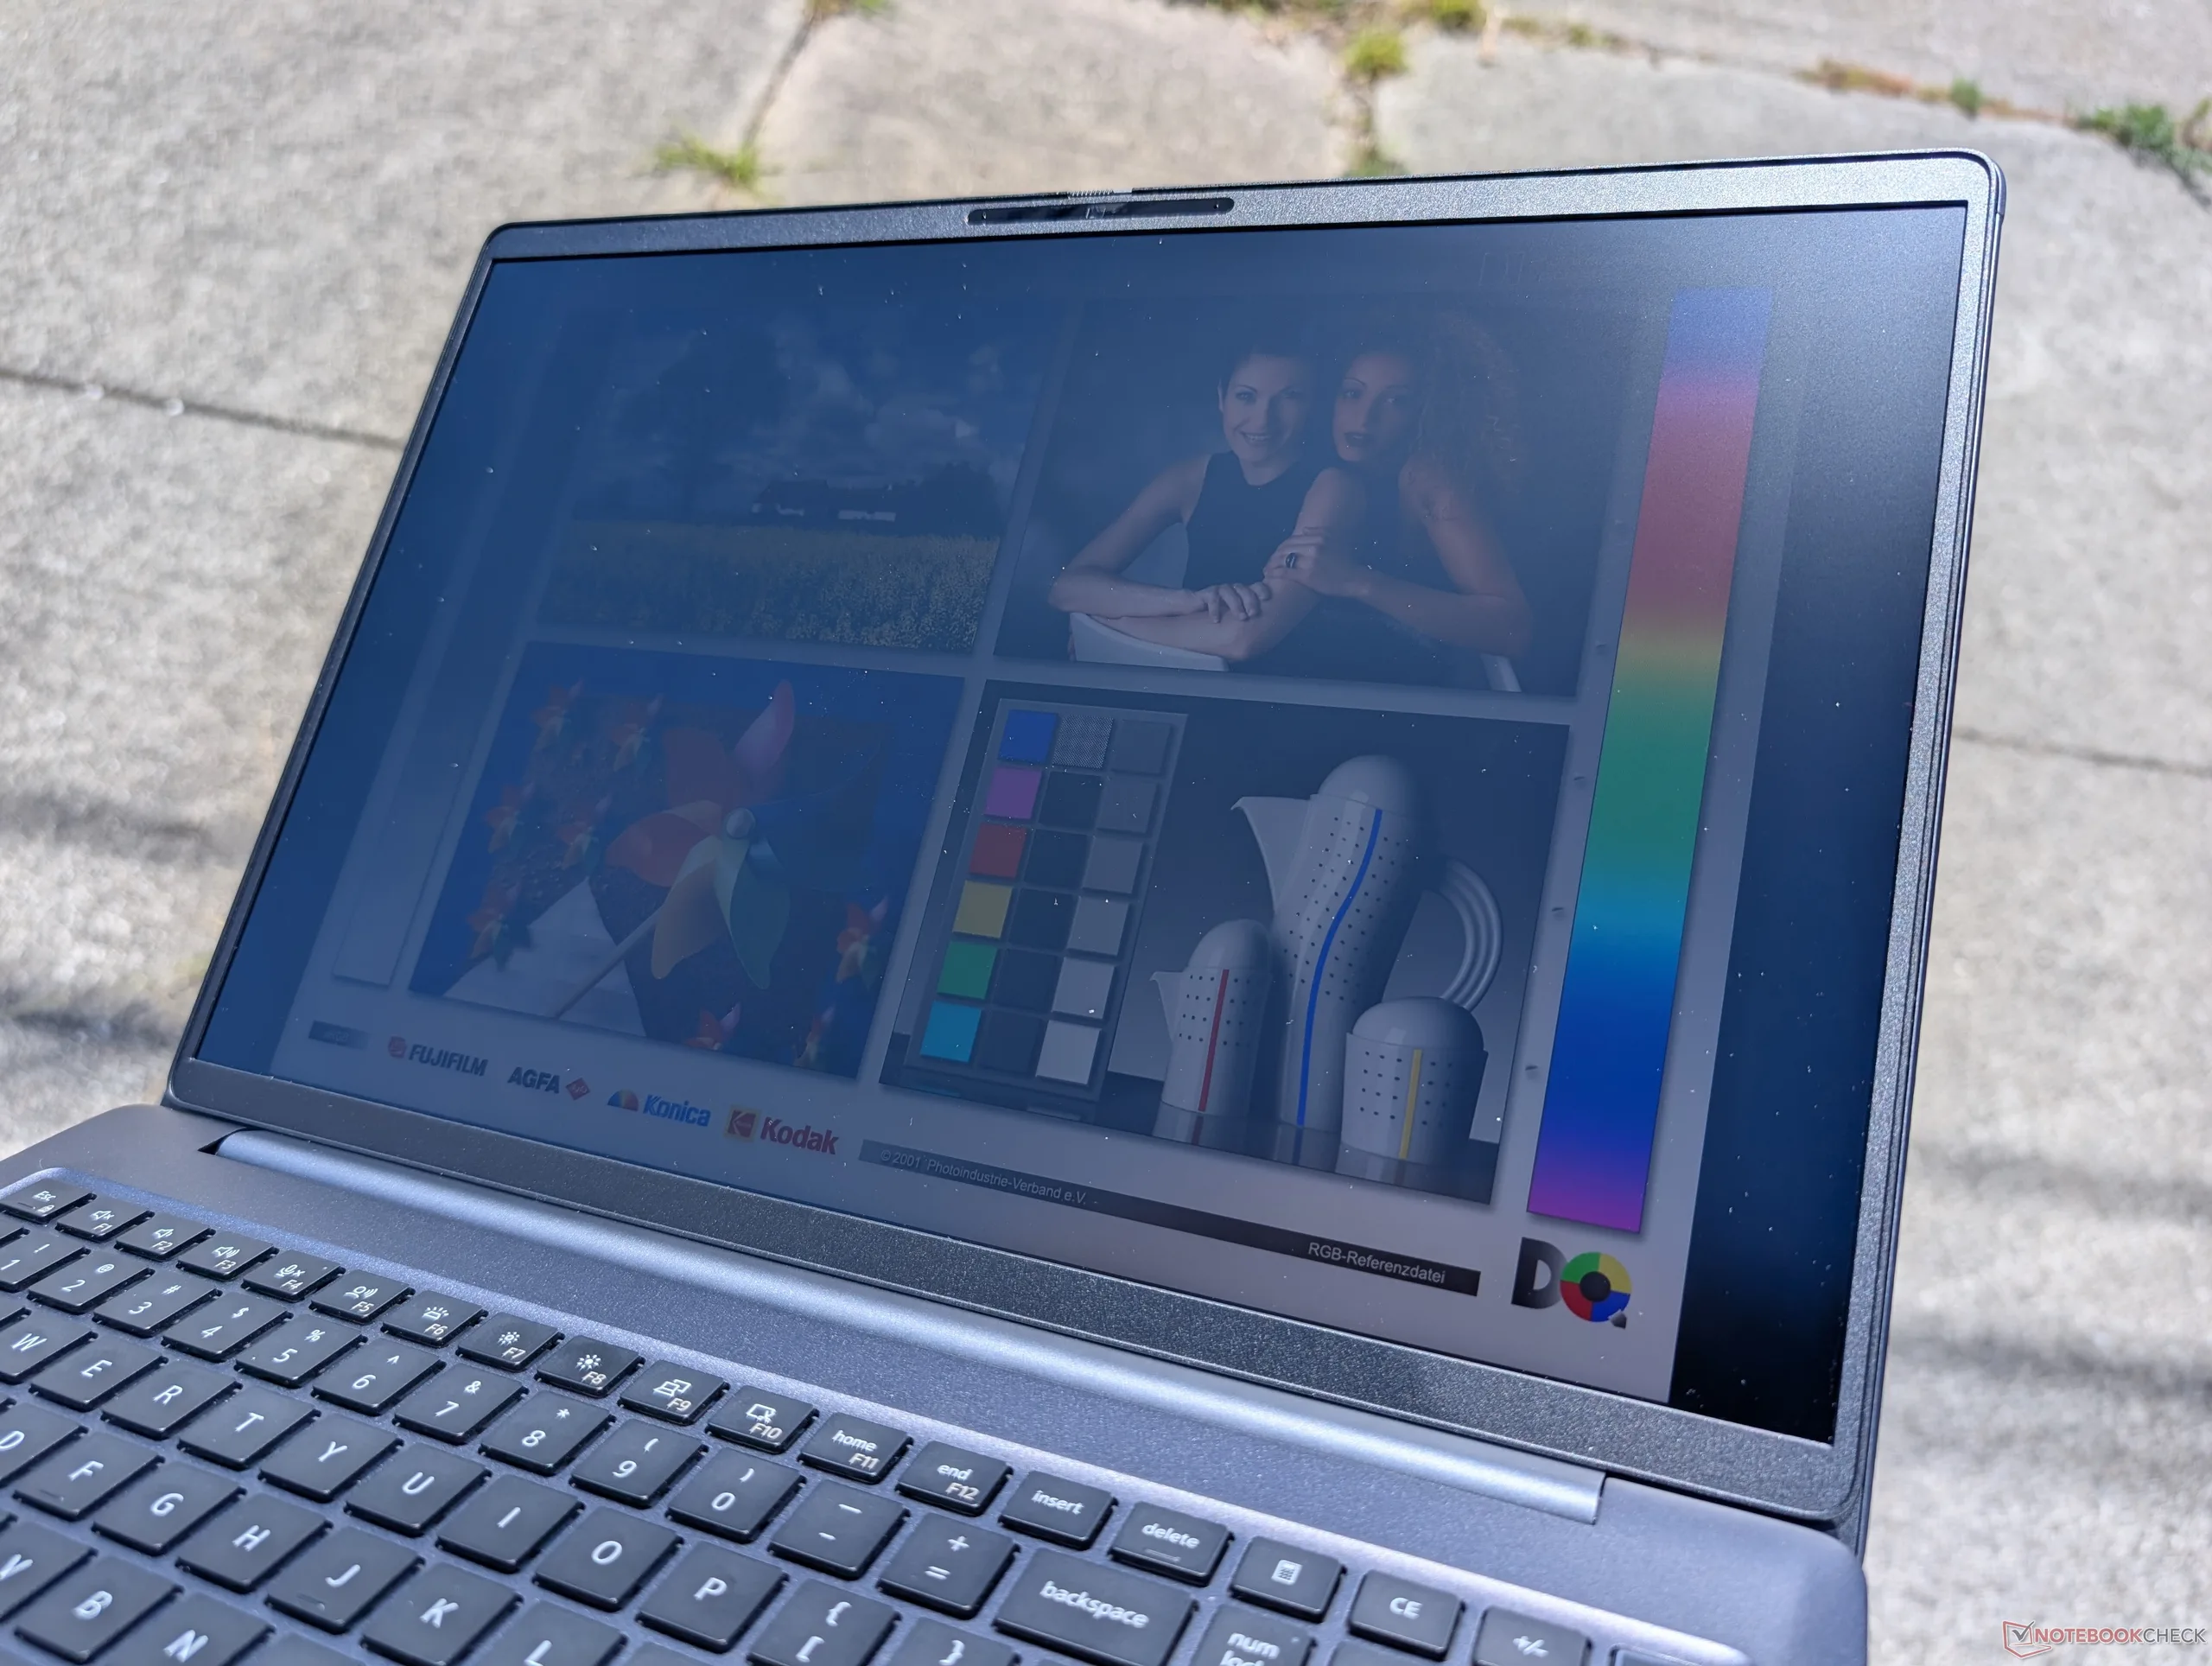
Al aire libre, bajo la luz del sol
Al aire libre, a la sombra
Al aire libre, bajo la luz del sol
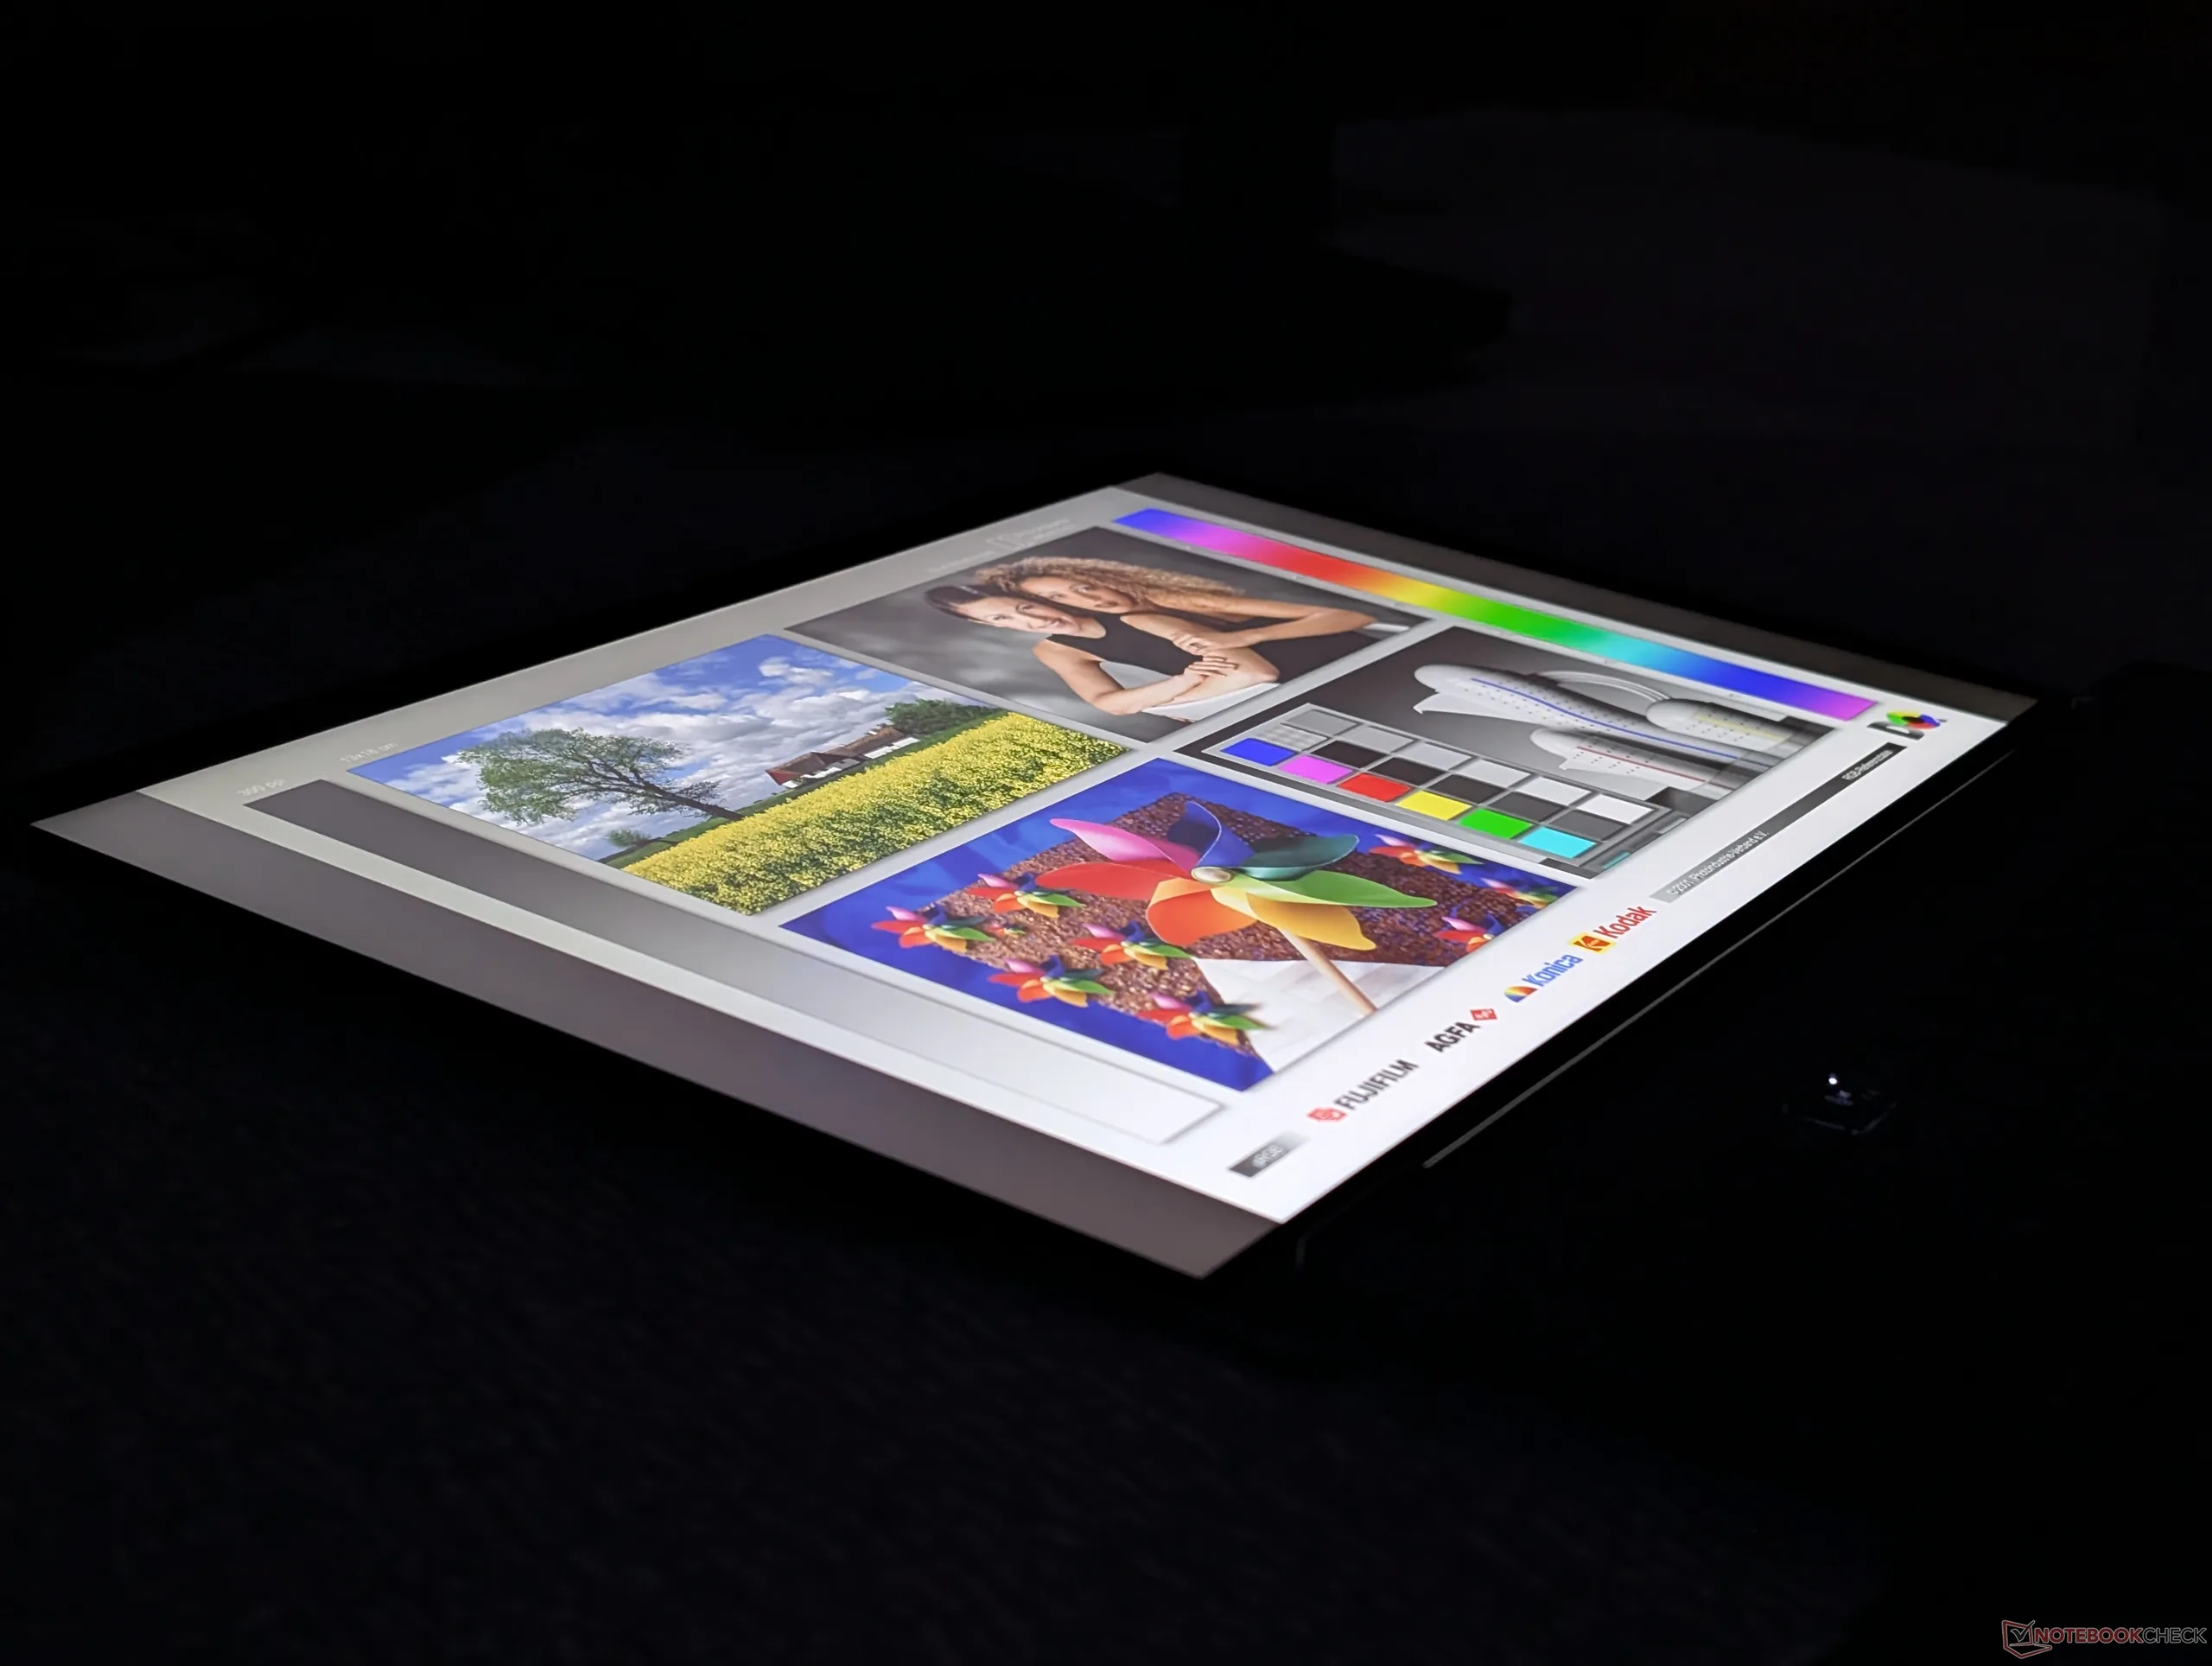
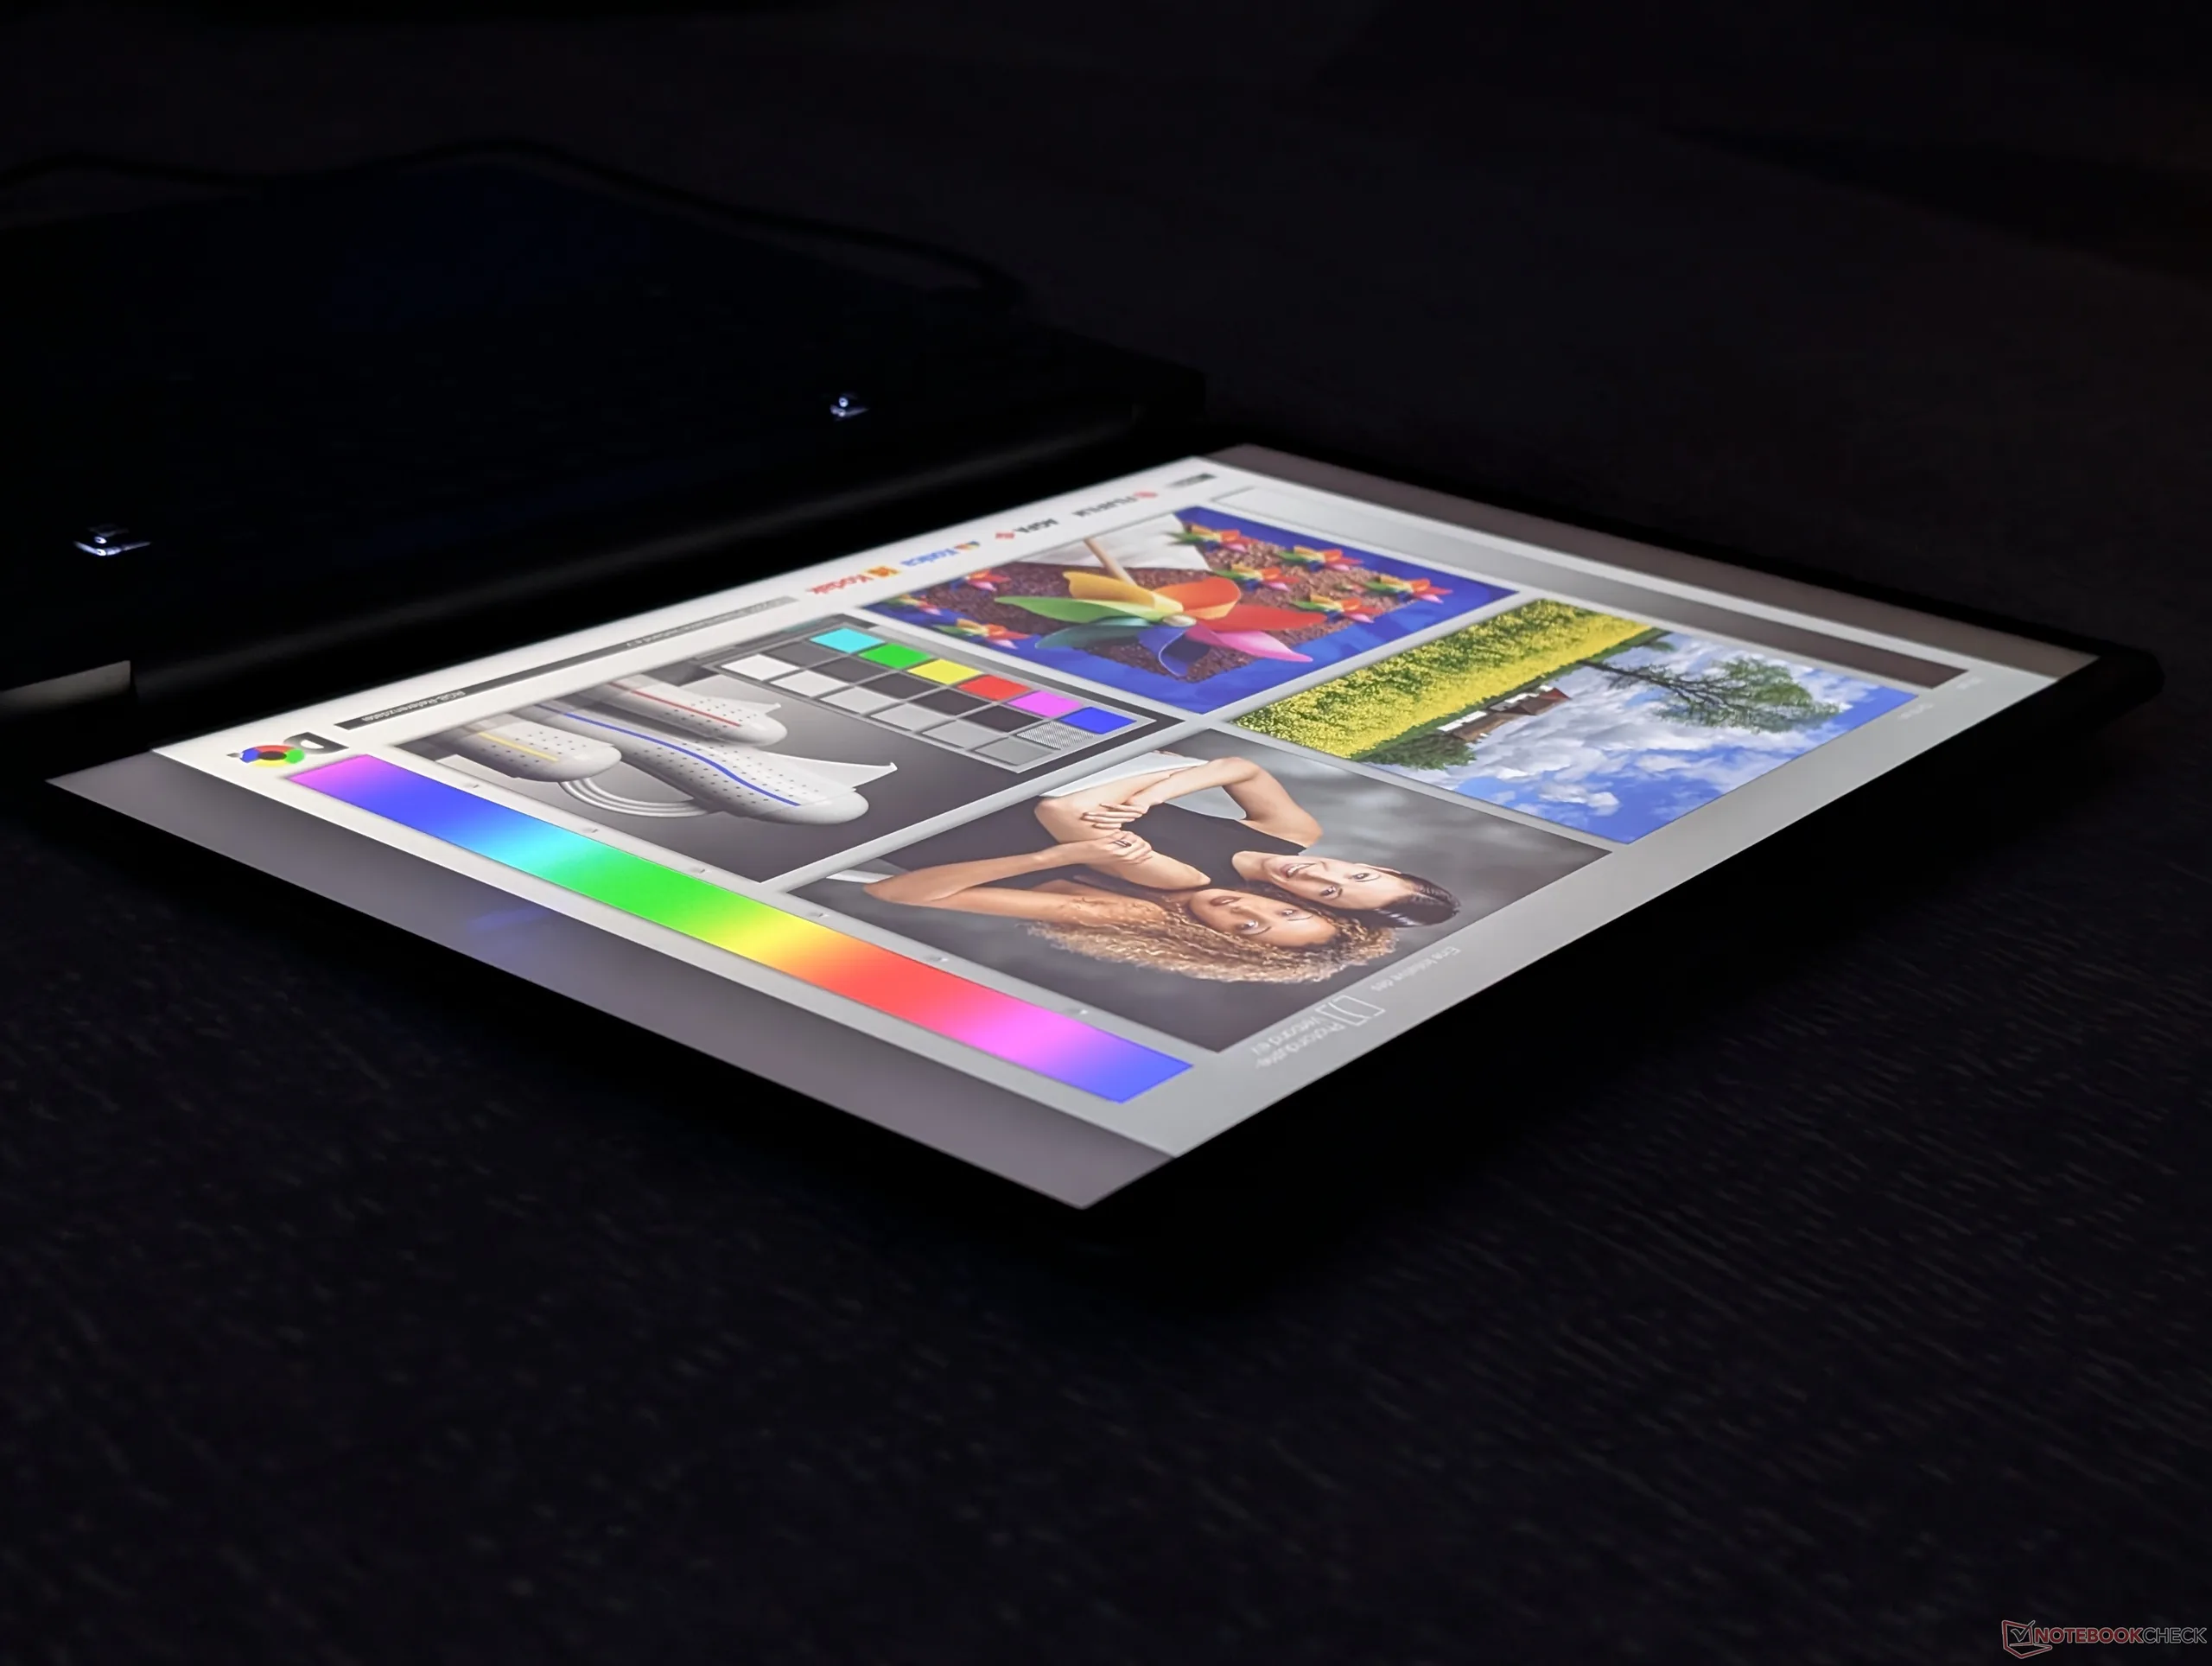
Amplios ángulos de visión IPS

Rendimiento

Condiciones de ensayo

Configuramos Dell Optimizer en el modo «Rendimiento» antes de ejecutar las pruebas de rendimiento que se indican a continuación.

Rendimiento del procesador

Cinebench R15 Multi Loop

060120180240300360420480540600660720780840900960102010801140120012601320138014401500156016201680174018001860192019802040210021602220228023402400246025202580264027002760282028802940Tooltip
Dell Pro 5 16 P516265 AMD Ryzen AI 9 HX PRO 470: Ø2898 (2832.46-2983.29) Points
Dell XPS 16 Core Ultra X7 358H Intel Core Ultra X7 358H: Ø2543 (2491.75-2985.52) Points
Lenovo ThinkPad T16 Gen 5 22AN001WGE AMD Ryzen 5 PRO 215: Ø1584 (1576.79-1603.85) Points
MSI Venture 16 AI A2HMTG Intel Core Ultra 7 255H: Ø2596 (2544.21-2610.8) Points
Asus ExpertBook B5 B5605CCA Intel Core Ultra 5 225H: Ø2342 (2293.31-2626.4) Points
HP EliteBook 8 G1a 16 AI AMD Ryzen AI 7 PRO 350: Ø2376 (2309.87-2407.9) Points
CPU Performance rating: Percent
Cinebench R23: Multi Core | Single Core
Cinebench R20: CPU (Multi Core) | CPU (Single Core)
Cinebench R15: CPU Multi 64Bit | CPU Single 64Bit
Blender: v2.79 BMW27 CPU
7-Zip 18.03: 7z b 4 | 7z b 4 -mmt1
Geekbench 6.7: Multi-Core | Single-Core
Geekbench 5.5: Multi-Core | Single-Core
HWBOT x265 Benchmark v2.2: 4k Preset
LibreOffice : 20 Documents To PDF
R Benchmark 2.5: Overall mean
CPU Performance rating
Lenovo ThinkPad P16 Gen 3
Intel Core Ultra 9 285HX
89.6 pt
Lenovo Yoga Pro 9 16IAH10 RTX 5050
Intel Core Ultra 9 285H
74.2 pt
Lenovo Pro 9 16IPH11
Intel Core Ultra 9 386H
74 pt
Lenovo ThinkPad P1 Gen 8
Intel Core Ultra 7 255H
71.9 pt
Dell Pro 5 16 P516265
AMD Ryzen AI 9 HX PRO 470
71.3 pt
Medio AMD Ryzen AI 9 HX PRO 470
 
71.3 pt
Dell XPS 16 Core Ultra X7 358H
Intel Core Ultra X7 358H
70.3 pt
MSI Venture 16 AI A2HMTG
Intel Core Ultra 7 255H
66.4 pt
Asus ExpertBook B5 B5605CCA
Intel Core Ultra 5 225H
62.3 pt
HP EliteBook 8 G1a 16 AI
AMD Ryzen AI 7 PRO 350
60.7 pt
Lenovo ThinkPad L16 Gen 2 21SC0029GE
AMD Ryzen 5 PRO 215
50.8 pt
Lenovo ThinkPad T16 Gen 5 22AN001WGE
AMD Ryzen 5 PRO 215
49 pt
Cinebench R23 / Multi Core
Lenovo ThinkPad P16 Gen 3
Intel Core Ultra 9 285HX
34998 Points +83%
Lenovo ThinkPad P1 Gen 8
Intel Core Ultra 7 255H
22191 (21038.4min - 22190.6max) Points +16%
Lenovo Yoga Pro 9 16IAH10 RTX 5050
Intel Core Ultra 9 285H
21343 (17440.8min - 21342.7max) Points +12%
Lenovo Pro 9 16IPH11
Intel Core Ultra 9 386H
20841 (20017min - 20841.2max) Points +9%
Medio AMD Ryzen AI 9 HX PRO 470
  (18834 - 21244, n=3)
19724 Points +3%
Dell Pro 5 16 P516265
AMD Ryzen AI 9 HX PRO 470
19095 (17945.6min - 19094.8max) Points
Dell XPS 16 Core Ultra X7 358H
Intel Core Ultra X7 358H
17884 (15984.6min - 17883.7max) Points -6%
MSI Venture 16 AI A2HMTG
Intel Core Ultra 7 255H
17569 (17404.9min - 17569max) Points -8%
Asus ExpertBook B5 B5605CCA
Intel Core Ultra 5 225H
16466 Points -14%
HP EliteBook 8 G1a 16 AI
AMD Ryzen AI 7 PRO 350
15543 (15453.3min - 15543.2max) Points -19%
Lenovo ThinkPad L16 Gen 2 21SC0029GE
AMD Ryzen 5 PRO 215
10048 Points -47%
Lenovo ThinkPad T16 Gen 5 22AN001WGE
AMD Ryzen 5 PRO 215
10024 Points -48%
Cinebench R23 / Single Core
Lenovo ThinkPad P16 Gen 3
Intel Core Ultra 9 285HX
2228 Points +8%
Lenovo Yoga Pro 9 16IAH10 RTX 5050
Intel Core Ultra 9 285H
2122 Points +3%
Dell XPS 16 Core Ultra X7 358H
Intel Core Ultra X7 358H
2087 Points +1%
Dell Pro 5 16 P516265
AMD Ryzen AI 9 HX PRO 470
2063 Points
Lenovo Pro 9 16IPH11
Intel Core Ultra 9 386H
2057 Points 0%
Medio AMD Ryzen AI 9 HX PRO 470
  (2042 - 2063, n=3)
2053 Points 0%
Lenovo ThinkPad P1 Gen 8
Intel Core Ultra 7 255H
1999 Points -3%
Asus ExpertBook B5 B5605CCA
Intel Core Ultra 5 225H
1992 Points -3%
HP EliteBook 8 G1a 16 AI
AMD Ryzen AI 7 PRO 350
1954 Points -5%
MSI Venture 16 AI A2HMTG
Intel Core Ultra 7 255H
1954 Points -5%
Lenovo ThinkPad T16 Gen 5 22AN001WGE
AMD Ryzen 5 PRO 215
1721 Points -17%
Lenovo ThinkPad L16 Gen 2 21SC0029GE
AMD Ryzen 5 PRO 215
1705 Points -17%
Cinebench R20 / CPU (Multi Core)
Lenovo ThinkPad P16 Gen 3
Intel Core Ultra 9 285HX
13152 Points +77%
Lenovo ThinkPad P1 Gen 8
Intel Core Ultra 7 255H
8651 Points +16%
Lenovo Yoga Pro 9 16IAH10 RTX 5050
Intel Core Ultra 9 285H
8342 Points +12%
Lenovo Pro 9 16IPH11
Intel Core Ultra 9 386H
8299 Points +12%
Medio AMD Ryzen AI 9 HX PRO 470
  (7355 - 8157, n=3)
7648 Points +3%
Dell Pro 5 16 P516265
AMD Ryzen AI 9 HX PRO 470
7433 Points
Dell XPS 16 Core Ultra X7 358H
Intel Core Ultra X7 358H
7195 Points -3%
MSI Venture 16 AI A2HMTG
Intel Core Ultra 7 255H
6862 Points -8%
Asus ExpertBook B5 B5605CCA
Intel Core Ultra 5 225H
6399 Points -14%
HP EliteBook 8 G1a 16 AI
AMD Ryzen AI 7 PRO 350
6071 Points -18%
Lenovo ThinkPad L16 Gen 2 21SC0029GE
AMD Ryzen 5 PRO 215
3937 Points -47%
Lenovo ThinkPad T16 Gen 5 22AN001WGE
AMD Ryzen 5 PRO 215
3903 Points -47%
Cinebench R20 / CPU (Single Core)
Lenovo ThinkPad P16 Gen 3
Intel Core Ultra 9 285HX
857 Points +6%
Lenovo Yoga Pro 9 16IAH10 RTX 5050
Intel Core Ultra 9 285H
812 Points 0%
Dell Pro 5 16 P516265
AMD Ryzen AI 9 HX PRO 470
810 Points
Medio AMD Ryzen AI 9 HX PRO 470
  (804 - 810, n=3)
807 Points 0%
Lenovo Pro 9 16IPH11
Intel Core Ultra 9 386H
787 Points -3%
Dell XPS 16 Core Ultra X7 358H
Intel Core Ultra X7 358H
780 Points -4%
HP EliteBook 8 G1a 16 AI
AMD Ryzen AI 7 PRO 350
773 Points -5%
Asus ExpertBook B5 B5605CCA
Intel Core Ultra 5 225H
763 Points -6%
Lenovo ThinkPad P1 Gen 8
Intel Core Ultra 7 255H
760 Points -6%
MSI Venture 16 AI A2HMTG
Intel Core Ultra 7 255H
743 Points -8%
Lenovo ThinkPad L16 Gen 2 21SC0029GE
AMD Ryzen 5 PRO 215
668 Points -18%
Lenovo ThinkPad T16 Gen 5 22AN001WGE
AMD Ryzen 5 PRO 215
664 Points -18%
Cinebench R15 / CPU Multi 64Bit
Lenovo ThinkPad P16 Gen 3
Intel Core Ultra 9 285HX
5627 (4290min - 5626.67max) Points +89%
Lenovo ThinkPad P1 Gen 8
Intel Core Ultra 7 255H
3388 (2958.36min - 3387.53max) Points +14%
Lenovo Pro 9 16IPH11
Intel Core Ultra 9 386H
3277 (3189.03min - 3276.54max) Points +10%
Lenovo Yoga Pro 9 16IAH10 RTX 5050
Intel Core Ultra 9 285H
3204 (2732.05min - 3203.59max) Points +7%
Medio AMD Ryzen AI 9 HX PRO 470
  (2983 - 3274, n=3)
3164 Points +6%
Dell XPS 16 Core Ultra X7 358H
Intel Core Ultra X7 358H
2986 (2491.75min - 2985.52max) Points 0%
Dell Pro 5 16 P516265
AMD Ryzen AI 9 HX PRO 470
2983 (2832.46min - 2983.29max) Points
Asus ExpertBook B5 B5605CCA
Intel Core Ultra 5 225H
2626 (2293.31min - 2626.4max) Points -12%
MSI Venture 16 AI A2HMTG
Intel Core Ultra 7 255H
2611 (2544.21min - 2610.8max) Points -12%
HP EliteBook 8 G1a 16 AI
AMD Ryzen AI 7 PRO 350
2408 (2309.87min - 2407.9max) Points -19%
Lenovo ThinkPad L16 Gen 2 21SC0029GE
AMD Ryzen 5 PRO 215
1617 (1402.28min - 1617.27max) Points -46%
Lenovo ThinkPad T16 Gen 5 22AN001WGE
AMD Ryzen 5 PRO 215
1604 (1576.79min - 1603.85max) Points -46%
Cinebench R15 / CPU Single 64Bit
Lenovo ThinkPad P16 Gen 3
Intel Core Ultra 9 285HX
323 Points +2%
Dell Pro 5 16 P516265
AMD Ryzen AI 9 HX PRO 470
316 Points
Lenovo Pro 9 16IPH11
Intel Core Ultra 9 386H
314 Points -1%
Lenovo Yoga Pro 9 16IAH10 RTX 5050
Intel Core Ultra 9 285H
313 Points -1%
Medio AMD Ryzen AI 9 HX PRO 470
  (311 - 316, n=3)
313 Points -1%
Dell XPS 16 Core Ultra X7 358H
Intel Core Ultra X7 358H
304 Points -4%
Lenovo ThinkPad P1 Gen 8
Intel Core Ultra 7 255H
302 Points -4%
HP EliteBook 8 G1a 16 AI
AMD Ryzen AI 7 PRO 350
299 Points -5%
MSI Venture 16 AI A2HMTG
Intel Core Ultra 7 255H
297 Points -6%
Asus ExpertBook B5 B5605CCA
Intel Core Ultra 5 225H
296 Points -6%
Lenovo ThinkPad L16 Gen 2 21SC0029GE
AMD Ryzen 5 PRO 215
269 Points -15%
Lenovo ThinkPad T16 Gen 5 22AN001WGE
AMD Ryzen 5 PRO 215
262 Points -17%
Blender / v2.79 BMW27 CPU
Lenovo ThinkPad L16 Gen 2 21SC0029GE
AMD Ryzen 5 PRO 215
333 Seconds * -98%
Lenovo ThinkPad T16 Gen 5 22AN001WGE
AMD Ryzen 5 PRO 215
314 Seconds * -87%
Asus ExpertBook B5 B5605CCA
Intel Core Ultra 5 225H
216 Seconds * -29%
HP EliteBook 8 G1a 16 AI
AMD Ryzen AI 7 PRO 350
206 Seconds * -23%
Dell XPS 16 Core Ultra X7 358H
Intel Core Ultra X7 358H
196 Seconds * -17%
MSI Venture 16 AI A2HMTG
Intel Core Ultra 7 255H
189 Seconds * -13%
Dell Pro 5 16 P516265
AMD Ryzen AI 9 HX PRO 470
168 Seconds *
Lenovo ThinkPad P1 Gen 8
Intel Core Ultra 7 255H
166 Seconds * +1%
Medio AMD Ryzen AI 9 HX PRO 470
  (152 - 178, n=3)
166 Seconds * +1%
Lenovo Pro 9 16IPH11
Intel Core Ultra 9 386H
160 Seconds * +5%
Lenovo Yoga Pro 9 16IAH10 RTX 5050
Intel Core Ultra 9 285H
158 Seconds * +6%
Lenovo ThinkPad P16 Gen 3
Intel Core Ultra 9 285HX
103 Seconds * +39%
7-Zip 18.03 / 7z b 4
Lenovo ThinkPad P16 Gen 3
Intel Core Ultra 9 285HX
99260 MIPS +33%
Medio AMD Ryzen AI 9 HX PRO 470
  (71554 - 79243, n=3)
75107 MIPS +1%
Dell Pro 5 16 P516265
AMD Ryzen AI 9 HX PRO 470
74523 MIPS
Lenovo Pro 9 16IPH11
Intel Core Ultra 9 386H
71479 MIPS -4%
Lenovo Yoga Pro 9 16IAH10 RTX 5050
Intel Core Ultra 9 285H
69778 MIPS -6%
Lenovo ThinkPad P1 Gen 8
Intel Core Ultra 7 255H
64912 MIPS -13%
Dell XPS 16 Core Ultra X7 358H
Intel Core Ultra X7 358H
64852 MIPS -13%
MSI Venture 16 AI A2HMTG
Intel Core Ultra 7 255H
60579 MIPS -19%
HP EliteBook 8 G1a 16 AI
AMD Ryzen AI 7 PRO 350
57736 MIPS -23%
Asus ExpertBook B5 B5605CCA
Intel Core Ultra 5 225H
51720 MIPS -31%
Lenovo ThinkPad L16 Gen 2 21SC0029GE
AMD Ryzen 5 PRO 215
43292 MIPS -42%
Lenovo ThinkPad T16 Gen 5 22AN001WGE
AMD Ryzen 5 PRO 215
41255 MIPS -45%
7-Zip 18.03 / 7z b 4 -mmt1
Dell XPS 16 Core Ultra X7 358H
Intel Core Ultra X7 358H
6441 MIPS +1%
Lenovo ThinkPad P16 Gen 3
Intel Core Ultra 9 285HX
6422 MIPS +1%
Dell Pro 5 16 P516265
AMD Ryzen AI 9 HX PRO 470
6353 MIPS
Medio AMD Ryzen AI 9 HX PRO 470
  (6041 - 6353, n=3)
6244 MIPS -2%
Lenovo ThinkPad L16 Gen 2 21SC0029GE
AMD Ryzen 5 PRO 215
6220 MIPS -2%
Lenovo Pro 9 16IPH11
Intel Core Ultra 9 386H
6118 MIPS -4%
Lenovo ThinkPad T16 Gen 5 22AN001WGE
AMD Ryzen 5 PRO 215
6118 MIPS -4%
HP EliteBook 8 G1a 16 AI
AMD Ryzen AI 7 PRO 350
6052 MIPS -5%
Lenovo Yoga Pro 9 16IAH10 RTX 5050
Intel Core Ultra 9 285H
6044 MIPS -5%
MSI Venture 16 AI A2HMTG
Intel Core Ultra 7 255H
5937 MIPS -7%
Asus ExpertBook B5 B5605CCA
Intel Core Ultra 5 225H
5695 MIPS -10%
Lenovo ThinkPad P1 Gen 8
Intel Core Ultra 7 255H
5126 MIPS -19%
Geekbench 6.7 / Multi-Core
Lenovo ThinkPad P16 Gen 3
Intel Core Ultra 9 285HX
18212 Points +21%
Lenovo Yoga Pro 9 16IAH10 RTX 5050
Intel Core Ultra 9 285H
17172 Points +14%
Dell XPS 16 Core Ultra X7 358H
Intel Core Ultra X7 358H
16943 Points +12%
Lenovo ThinkPad P1 Gen 8
Intel Core Ultra 7 255H
16940 Points +12%
Lenovo Pro 9 16IPH11
Intel Core Ultra 9 386H
16816 Points +12%
Dell Pro 5 16 P516265
AMD Ryzen AI 9 HX PRO 470
15079 Points
MSI Venture 16 AI A2HMTG
Intel Core Ultra 7 255H
14801 Points -2%
Medio AMD Ryzen AI 9 HX PRO 470
  (13878 - 15079, n=3)
14645 Points -3%
HP EliteBook 8 G1a 16 AI
AMD Ryzen AI 7 PRO 350
13539 Points -10%
Asus ExpertBook B5 B5605CCA
Intel Core Ultra 5 225H
12099 Points -20%
Lenovo ThinkPad L16 Gen 2 21SC0029GE
AMD Ryzen 5 PRO 215
9960 Points -34%
Lenovo ThinkPad T16 Gen 5 22AN001WGE
AMD Ryzen 5 PRO 215
8056 Points -47%
Geekbench 6.7 / Single-Core
Lenovo ThinkPad P16 Gen 3
Intel Core Ultra 9 285HX
2989 Points 0%
Dell Pro 5 16 P516265
AMD Ryzen AI 9 HX PRO 470
2988 Points
Medio AMD Ryzen AI 9 HX PRO 470
  (2918 - 2988, n=3)
2950 Points -1%
Lenovo Yoga Pro 9 16IAH10 RTX 5050
Intel Core Ultra 9 285H
2909 Points -3%
Dell XPS 16 Core Ultra X7 358H
Intel Core Ultra X7 358H
2903 Points -3%
Lenovo Pro 9 16IPH11
Intel Core Ultra 9 386H
2895 Points -3%
HP EliteBook 8 G1a 16 AI
AMD Ryzen AI 7 PRO 350
2855 Points -4%
Lenovo ThinkPad P1 Gen 8
Intel Core Ultra 7 255H
2811 Points -6%
MSI Venture 16 AI A2HMTG
Intel Core Ultra 7 255H
2776 Points -7%
Asus ExpertBook B5 B5605CCA
Intel Core Ultra 5 225H
2770 Points -7%
Lenovo ThinkPad L16 Gen 2 21SC0029GE
AMD Ryzen 5 PRO 215
2580 Points -14%
Lenovo ThinkPad T16 Gen 5 22AN001WGE
AMD Ryzen 5 PRO 215
2459 Points -18%
Geekbench 5.5 / Multi-Core
Lenovo ThinkPad P16 Gen 3
Intel Core Ultra 9 285HX
21565 Points +48%
Lenovo Pro 9 16IPH11
Intel Core Ultra 9 386H
17246 Points +18%
Dell XPS 16 Core Ultra X7 358H
Intel Core Ultra X7 358H
16763 Points +15%
Lenovo ThinkPad P1 Gen 8
Intel Core Ultra 7 255H
16483 Points +13%
Lenovo Yoga Pro 9 16IAH10 RTX 5050
Intel Core Ultra 9 285H
16257 Points +12%
Dell Pro 5 16 P516265
AMD Ryzen AI 9 HX PRO 470
14571 Points
Medio AMD Ryzen AI 9 HX PRO 470
  (14029 - 15013, n=3)
14538 Points 0%
MSI Venture 16 AI A2HMTG
Intel Core Ultra 7 255H
13705 Points -6%
HP EliteBook 8 G1a 16 AI
AMD Ryzen AI 7 PRO 350
11701 Points -20%
Asus ExpertBook B5 B5605CCA
Intel Core Ultra 5 225H
11570 Points -21%
Lenovo ThinkPad L16 Gen 2 21SC0029GE
AMD Ryzen 5 PRO 215
8181 Points -44%
Lenovo ThinkPad T16 Gen 5 22AN001WGE
AMD Ryzen 5 PRO 215
7113 Points -51%
Geekbench 5.5 / Single-Core
Dell Pro 5 16 P516265
AMD Ryzen AI 9 HX PRO 470
2175 Points
Medio AMD Ryzen AI 9 HX PRO 470
  (2129 - 2182, n=3)
2162 Points -1%
Lenovo ThinkPad P16 Gen 3
Intel Core Ultra 9 285HX
2143 Points -1%
Lenovo Pro 9 16IPH11
Intel Core Ultra 9 386H
2134 Points -2%
HP EliteBook 8 G1a 16 AI
AMD Ryzen AI 7 PRO 350
2128 Points -2%
Dell XPS 16 Core Ultra X7 358H
Intel Core Ultra X7 358H
2119 Points -3%
Lenovo Yoga Pro 9 16IAH10 RTX 5050
Intel Core Ultra 9 285H
2083 Points -4%
MSI Venture 16 AI A2HMTG
Intel Core Ultra 7 255H
2047 Points -6%
Lenovo ThinkPad P1 Gen 8
Intel Core Ultra 7 255H
1998 Points -8%
Asus ExpertBook B5 B5605CCA
Intel Core Ultra 5 225H
1987 Points -9%
Lenovo ThinkPad L16 Gen 2 21SC0029GE
AMD Ryzen 5 PRO 215
1906 Points -12%
Lenovo ThinkPad T16 Gen 5 22AN001WGE
AMD Ryzen 5 PRO 215
1829 Points -16%
HWBOT x265 Benchmark v2.2 / 4k Preset
Lenovo ThinkPad P16 Gen 3
Intel Core Ultra 9 285HX
35.4 fps +53%
Lenovo ThinkPad P1 Gen 8
Intel Core Ultra 7 255H
26.5 fps +14%
Lenovo Yoga Pro 9 16IAH10 RTX 5050
Intel Core Ultra 9 285H
25.1 fps +8%
Lenovo Pro 9 16IPH11
Intel Core Ultra 9 386H
24.8 fps +7%
Medio AMD Ryzen AI 9 HX PRO 470
  (21.9 - 25.8, n=3)
23.6 fps +2%
Dell Pro 5 16 P516265
AMD Ryzen AI 9 HX PRO 470
23.2 fps
MSI Venture 16 AI A2HMTG
Intel Core Ultra 7 255H
21.4 fps -8%
Dell XPS 16 Core Ultra X7 358H
Intel Core Ultra X7 358H
21 fps -9%
HP EliteBook 8 G1a 16 AI
AMD Ryzen AI 7 PRO 350
19.7 fps -15%
Asus ExpertBook B5 B5605CCA
Intel Core Ultra 5 225H
18.5 fps -20%
Lenovo ThinkPad L16 Gen 2 21SC0029GE
AMD Ryzen 5 PRO 215
13.3 fps -43%
Lenovo ThinkPad T16 Gen 5 22AN001WGE
AMD Ryzen 5 PRO 215
12.6 fps -46%
LibreOffice / 20 Documents To PDF
HP EliteBook 8 G1a 16 AI
AMD Ryzen AI 7 PRO 350
69.3 s * -27%
Lenovo ThinkPad T16 Gen 5 22AN001WGE
AMD Ryzen 5 PRO 215
55.9 s * -2%
Medio AMD Ryzen AI 9 HX PRO 470
  (54.7 - 56.1, n=3)
55.4 s * -1%
Dell Pro 5 16 P516265
AMD Ryzen AI 9 HX PRO 470
54.7 s *
Lenovo ThinkPad L16 Gen 2 21SC0029GE
AMD Ryzen 5 PRO 215
53.7 s * +2%
Dell XPS 16 Core Ultra X7 358H
Intel Core Ultra X7 358H
49.5 s * +10%
Asus ExpertBook B5 B5605CCA
Intel Core Ultra 5 225H
48.5 s * +11%
MSI Venture 16 AI A2HMTG
Intel Core Ultra 7 255H
44.4 s * +19%
Lenovo ThinkPad P16 Gen 3
Intel Core Ultra 9 285HX
42.6 s * +22%
Lenovo ThinkPad P1 Gen 8
Intel Core Ultra 7 255H
41.8 s * +24%
Lenovo Pro 9 16IPH11
Intel Core Ultra 9 386H
41.6 s * +24%
Lenovo Yoga Pro 9 16IAH10 RTX 5050
Intel Core Ultra 9 285H
39.4 s * +28%
R Benchmark 2.5 / Overall mean
HP EliteBook 8 G1a 16 AI
AMD Ryzen AI 7 PRO 350
0.577 sec * -47%
Lenovo ThinkPad L16 Gen 2 21SC0029GE
AMD Ryzen 5 PRO 215
0.4599 sec * -17%
Lenovo ThinkPad T16 Gen 5 22AN001WGE
AMD Ryzen 5 PRO 215
0.4599 sec * -17%
Asus ExpertBook B5 B5605CCA
Intel Core Ultra 5 225H
0.4507 sec * -15%
MSI Venture 16 AI A2HMTG
Intel Core Ultra 7 255H
0.4498 sec * -14%
Lenovo ThinkPad P1 Gen 8
Intel Core Ultra 7 255H
0.4382 sec * -12%
Lenovo Pro 9 16IPH11
Intel Core Ultra 9 386H
0.4321 sec * -10%
Lenovo Yoga Pro 9 16IAH10 RTX 5050
Intel Core Ultra 9 285H
0.4275 sec * -9%
Dell XPS 16 Core Ultra X7 358H
Intel Core Ultra X7 358H
0.4216 sec * -7%
Lenovo ThinkPad P16 Gen 3
Intel Core Ultra 9 285HX
0.4202 sec * -7%
Medio AMD Ryzen AI 9 HX PRO 470
  (0.393 - 0.4047, n=3)
0.3984 sec * -1%
Dell Pro 5 16 P516265
AMD Ryzen AI 9 HX PRO 470
0.393 sec *

* ... más pequeño es mejor

Cinebench R15 CPU Multi 64Bit
2983 Points
Cinebench R15 OpenGL 64Bit
106.2 fps
Cinebench R15 Ref. Match 64Bit
97.9 %
Cinebench R15 CPU Single 64Bit
316 Points
Cinebench R20 CPU (Single Core)
810 Points
Cinebench R20 CPU (Multi Core)
7433 Points
Cinebench R23 Single Core
2063 Points
Cinebench R23 Multi Core
19095 Points
Cinebench 2024 CPU Multi Core
1070 Points
Cinebench 2024 CPU Single Core
120.2 Points
Cinebench 2026 CPU Multi
4448 Points
Cinebench 2026 CPU Single Thread
488 Points
ayuda
Performance rating
Medio AMD Ryzen AI 9 HX PRO 470 -1!
 
95.7 pt
Dell Pro 5 16 P516265 -1!
AMD Ryzen AI 9 HX PRO 470, Radeon 890M
94.7 pt
HP EliteBook 8 G1a 16 AI -1!
AMD Ryzen AI 7 PRO 350, Radeon 860M
77.9 pt
MSI Venture 16 AI A2HMTG -1!
Intel Core Ultra 7 255H, Arc 140T
66 pt
Dell XPS 16 Core Ultra X7 358H -1!
Intel Core Ultra X7 358H, Arc B390 Panther Lake iGPU
65.2 pt
Asus ExpertBook B5 B5605CCA -1!
Intel Core Ultra 5 225H, Arc 130T
60.9 pt
Lenovo ThinkPad T16 Gen 5 22AN001WGE -1!
AMD Ryzen 5 PRO 215, Radeon 740M
50.4 pt
AIDA64 / FP32 Ray-Trace
Medio AMD Ryzen AI 9 HX PRO 470
  (28416 - 33700, n=3)
30865 KRay/s +1%
Dell Pro 5 16 P516265
AMD Ryzen AI 9 HX PRO 470, Radeon 890M (v8.20.8100)
30478 KRay/s
HP EliteBook 8 G1a 16 AI
AMD Ryzen AI 7 PRO 350, Radeon 860M (v6.92.6600)
24795 KRay/s -19%
Asus ExpertBook B5 B5605CCA
Intel Core Ultra 5 225H, Arc 130T (v6.92.6600)
18754 KRay/s -38%
MSI Venture 16 AI A2HMTG
Intel Core Ultra 7 255H, Arc 140T (v8.20.8100)
18493 KRay/s -39%
Lenovo ThinkPad T16 Gen 5 22AN001WGE
AMD Ryzen 5 PRO 215, Radeon 740M (v8.20.8100)
16708 KRay/s -45%
Dell XPS 16 Core Ultra X7 358H
Intel Core Ultra X7 358H, Arc B390 Panther Lake iGPU (v8.20.8100)
15681 KRay/s -49%
AIDA64 / FPU Julia
Medio AMD Ryzen AI 9 HX PRO 470
  (117109 - 138581, n=3)
126778 Points +2%
Dell Pro 5 16 P516265
AMD Ryzen AI 9 HX PRO 470, Radeon 890M (v8.20.8100)
124643 Points
HP EliteBook 8 G1a 16 AI
AMD Ryzen AI 7 PRO 350, Radeon 860M (v6.92.6600)
94532 Points -24%
MSI Venture 16 AI A2HMTG
Intel Core Ultra 7 255H, Arc 140T (v8.20.8100)
94357 Points -24%
Asus ExpertBook B5 B5605CCA
Intel Core Ultra 5 225H, Arc 130T (v6.92.6600)
84588 Points -32%
Dell XPS 16 Core Ultra X7 358H
Intel Core Ultra X7 358H, Arc B390 Panther Lake iGPU (v8.20.8100)
83114 Points -33%
Lenovo ThinkPad T16 Gen 5 22AN001WGE
AMD Ryzen 5 PRO 215, Radeon 740M (v8.20.8100)
67527 Points -46%
AIDA64 / CPU SHA3
Medio AMD Ryzen AI 9 HX PRO 470
  (4824 - 5450, n=3)
5113 MB/s +1%
Dell Pro 5 16 P516265
AMD Ryzen AI 9 HX PRO 470, Radeon 890M (v8.20.8100)
5065 MB/s
MSI Venture 16 AI A2HMTG
Intel Core Ultra 7 255H, Arc 140T (v8.20.8100)
4321 MB/s -15%
Dell XPS 16 Core Ultra X7 358H
Intel Core Ultra X7 358H, Arc B390 Panther Lake iGPU (v8.20.8100)
4200 MB/s -17%
HP EliteBook 8 G1a 16 AI
AMD Ryzen AI 7 PRO 350, Radeon 860M (v6.92.6600)
4091 MB/s -19%
Asus ExpertBook B5 B5605CCA
Intel Core Ultra 5 225H, Arc 130T (v6.92.6600)
4034 MB/s -20%
Lenovo ThinkPad T16 Gen 5 22AN001WGE
AMD Ryzen 5 PRO 215, Radeon 740M (v8.20.8100)
2903 MB/s -43%
AIDA64 / CPU Queen
HP EliteBook 8 G1a 16 AI
AMD Ryzen AI 7 PRO 350, Radeon 860M (v6.92.6600)
76742 Points
Asus ExpertBook B5 B5605CCA
Intel Core Ultra 5 225H, Arc 130T (v6.92.6600)
53437 Points
AIDA64 / FPU SinJulia
Medio AMD Ryzen AI 9 HX PRO 470
  (17621 - 18605, n=3)
18101 Points 0%
Dell Pro 5 16 P516265
AMD Ryzen AI 9 HX PRO 470, Radeon 890M (v8.20.8100)
18076 Points
HP EliteBook 8 G1a 16 AI
AMD Ryzen AI 7 PRO 350, Radeon 860M (v6.92.6600)
13653 Points -24%
Lenovo ThinkPad T16 Gen 5 22AN001WGE
AMD Ryzen 5 PRO 215, Radeon 740M (v8.20.8100)
8966 Points -50%
MSI Venture 16 AI A2HMTG
Intel Core Ultra 7 255H, Arc 140T (v8.20.8100)
7871 Points -56%
Dell XPS 16 Core Ultra X7 358H
Intel Core Ultra X7 358H, Arc B390 Panther Lake iGPU (v8.20.8100)
6892 Points -62%
Asus ExpertBook B5 B5605CCA
Intel Core Ultra 5 225H, Arc 130T (v6.92.6600)
6881 Points -62%
AIDA64 / FPU Mandel
Medio AMD Ryzen AI 9 HX PRO 470
  (62125 - 71733, n=3)
66549 Points +1%
Dell Pro 5 16 P516265
AMD Ryzen AI 9 HX PRO 470, Radeon 890M (v8.20.8100)
65789 Points
HP EliteBook 8 G1a 16 AI
AMD Ryzen AI 7 PRO 350, Radeon 860M (v6.92.6600)
50597 Points -23%
MSI Venture 16 AI A2HMTG
Intel Core Ultra 7 255H, Arc 140T (v8.20.8100)
49437 Points -25%
Dell XPS 16 Core Ultra X7 358H
Intel Core Ultra X7 358H, Arc B390 Panther Lake iGPU (v8.20.8100)
44733 Points -32%
Asus ExpertBook B5 B5605CCA
Intel Core Ultra 5 225H, Arc 130T (v6.92.6600)
44411 Points -32%
Lenovo ThinkPad T16 Gen 5 22AN001WGE
AMD Ryzen 5 PRO 215, Radeon 740M (v8.20.8100)
36315 Points -45%
AIDA64 / CPU AES
Medio AMD Ryzen AI 9 HX PRO 470
  (98035 - 110544, n=3)
103919 MB/s +1%
Dell Pro 5 16 P516265
AMD Ryzen AI 9 HX PRO 470, Radeon 890M (v8.20.8100)
103177 MB/s
HP EliteBook 8 G1a 16 AI
AMD Ryzen AI 7 PRO 350, Radeon 860M (v6.92.6600)
82843 MB/s -20%
MSI Venture 16 AI A2HMTG
Intel Core Ultra 7 255H, Arc 140T (v8.20.8100)
70611 MB/s -32%
Asus ExpertBook B5 B5605CCA
Intel Core Ultra 5 225H, Arc 130T (v6.92.6600)
65057 MB/s -37%
Dell XPS 16 Core Ultra X7 358H
Intel Core Ultra X7 358H, Arc B390 Panther Lake iGPU (v8.20.8100)
61102 MB/s -41%
Lenovo ThinkPad T16 Gen 5 22AN001WGE
AMD Ryzen 5 PRO 215, Radeon 740M (v8.20.8100)
53125 MB/s -49%
AIDA64 / CPU ZLib
Medio AMD Ryzen AI 9 HX PRO 470
  (1174 - 1397, n=3)
1278 MB/s +1%
Dell Pro 5 16 P516265
AMD Ryzen AI 9 HX PRO 470, Radeon 890M (v8.20.8100)
1262 MB/s
Asus ExpertBook B5 B5605CCA
Intel Core Ultra 5 225H, Arc 130T (v6.92.6600)
1032 MB/s -18%
HP EliteBook 8 G1a 16 AI
AMD Ryzen AI 7 PRO 350, Radeon 860M (v6.92.6600)
1029 MB/s -18%
MSI Venture 16 AI A2HMTG
Intel Core Ultra 7 255H, Arc 140T (v8.20.8100)
1016 MB/s -19%
Dell XPS 16 Core Ultra X7 358H
Intel Core Ultra X7 358H, Arc B390 Panther Lake iGPU (v8.20.8100)
991 MB/s -21%
Lenovo ThinkPad T16 Gen 5 22AN001WGE
AMD Ryzen 5 PRO 215, Radeon 740M (v8.20.8100)
658 MB/s -48%
AIDA64 / FP64 Ray-Trace
Medio AMD Ryzen AI 9 HX PRO 470
  (14799 - 17629, n=3)
16095 KRay/s +2%
Dell Pro 5 16 P516265
AMD Ryzen AI 9 HX PRO 470, Radeon 890M (v8.20.8100)
15857 KRay/s
HP EliteBook 8 G1a 16 AI
AMD Ryzen AI 7 PRO 350, Radeon 860M (v6.92.6600)
13384 KRay/s -16%
MSI Venture 16 AI A2HMTG
Intel Core Ultra 7 255H, Arc 140T (v8.20.8100)
10023 KRay/s -37%
Asus ExpertBook B5 B5605CCA
Intel Core Ultra 5 225H, Arc 130T (v6.92.6600)
9024 KRay/s -43%
Lenovo ThinkPad T16 Gen 5 22AN001WGE
AMD Ryzen 5 PRO 215, Radeon 740M (v8.20.8100)
8875 KRay/s -44%
Dell XPS 16 Core Ultra X7 358H
Intel Core Ultra X7 358H, Arc B390 Panther Lake iGPU (v8.20.8100)
8285 KRay/s -48%
AIDA64 / CPU PhotoWorxx
Dell XPS 16 Core Ultra X7 358H
Intel Core Ultra X7 358H, Arc B390 Panther Lake iGPU (v8.20.8100)
88154 MPixel/s +68%
MSI Venture 16 AI A2HMTG
Intel Core Ultra 7 255H, Arc 140T (v8.20.8100)
52561 MPixel/s 0%
Dell Pro 5 16 P516265
AMD Ryzen AI 9 HX PRO 470, Radeon 890M (v8.20.8100)
52444 MPixel/s
Medio AMD Ryzen AI 9 HX PRO 470
  (48728 - 52444, n=3)
50489 MPixel/s -4%
HP EliteBook 8 G1a 16 AI
AMD Ryzen AI 7 PRO 350, Radeon 860M (v6.92.6600)
43805 MPixel/s -16%
Asus ExpertBook B5 B5605CCA
Intel Core Ultra 5 225H, Arc 130T (v6.92.6600)
25809 MPixel/s -51%
Lenovo ThinkPad T16 Gen 5 22AN001WGE
AMD Ryzen 5 PRO 215, Radeon 740M (v8.20.8100)
22912 MPixel/s -56%
AIDA64 / CPU CheckMate
Medio AMD Ryzen AI 9 HX PRO 470
  (6848 - 7502, n=3)
7122 MP/s +4%
Dell Pro 5 16 P516265
AMD Ryzen AI 9 HX PRO 470, Radeon 890M (v8.20.8100)
6848 MP/s
Dell XPS 16 Core Ultra X7 358H
Intel Core Ultra X7 358H, Arc B390 Panther Lake iGPU (v8.20.8100)
4269 MP/s -38%
MSI Venture 16 AI A2HMTG
Intel Core Ultra 7 255H, Arc 140T (v8.20.8100)
3862 MP/s -44%
Lenovo ThinkPad T16 Gen 5 22AN001WGE
AMD Ryzen 5 PRO 215, Radeon 740M (v8.20.8100)
3679 MP/s -46%

Rendimiento del sistema

PCMark 10 Standard
PCMark 10 Standard
Performance rating
Dell XPS 16 Core Ultra X7 358H
Arc B390 Panther Lake iGPU, Ultra X7 358H
94.5 pt
Dell Pro 5 16 P516265
Radeon 890M, Ryzen AI 9 HX PRO 470, SanDisk PC SN5100S
81.1 pt
MSI Venture 16 AI A2HMTG
Arc 140T, Ultra 7 255H
79.3 pt
Medio AMD Ryzen AI 9 HX PRO 470, AMD Radeon 890M
 
79 pt
Asus ExpertBook B5 B5605CCA -3!
Arc 130T, Ultra 5 225H, Micron 2500 MTFDKBA512QGN
77.4 pt
HP EliteBook 8 G1a 16 AI
Radeon 860M, Ryzen AI 7 PRO 350, Micron 3500 MTFDKBA512TGD
66.9 pt
Lenovo ThinkPad T16 Gen 5 22AN001WGE -3!
Radeon 740M, R5 PRO 215, Samsung PM9C1b MZVL8512HFLU-00BLL
66.3 pt
PCMark 10 / Score
Dell XPS 16 Core Ultra X7 358H
Arc B390 Panther Lake iGPU, Ultra X7 358H
9717 Points +12%
MSI Venture 16 AI A2HMTG
Arc 140T, Ultra 7 255H
8903 Points +3%
Dell Pro 5 16 P516265
Radeon 890M, Ryzen AI 9 HX PRO 470, SanDisk PC SN5100S
8665 Points
Medio AMD Ryzen AI 9 HX PRO 470, AMD Radeon 890M
  (8465 - 8665, n=2)
8565 Points -1%
HP EliteBook 8 G1a 16 AI
Radeon 860M, Ryzen AI 7 PRO 350, Micron 3500 MTFDKBA512TGD
7626 Points -12%
Asus ExpertBook B5 B5605CCA
Arc 130T, Ultra 5 225H, Micron 2500 MTFDKBA512QGN
7069 Points -18%
Lenovo ThinkPad T16 Gen 5 22AN001WGE
Radeon 740M, R5 PRO 215, Samsung PM9C1b MZVL8512HFLU-00BLL
6092 Points -30%
PCMark 10 / Essentials
HP EliteBook 8 G1a 16 AI
Radeon 860M, Ryzen AI 7 PRO 350, Micron 3500 MTFDKBA512TGD
11594 Points +5%
Dell XPS 16 Core Ultra X7 358H
Arc B390 Panther Lake iGPU, Ultra X7 358H
11122 Points +1%
Dell Pro 5 16 P516265
Radeon 890M, Ryzen AI 9 HX PRO 470, SanDisk PC SN5100S
11009 Points
Medio AMD Ryzen AI 9 HX PRO 470, AMD Radeon 890M
  (10475 - 11009, n=2)
10742 Points -2%
MSI Venture 16 AI A2HMTG
Arc 140T, Ultra 7 255H
10716 Points -3%
Asus ExpertBook B5 B5605CCA
Arc 130T, Ultra 5 225H, Micron 2500 MTFDKBA512QGN
10245 Points -7%
Lenovo ThinkPad T16 Gen 5 22AN001WGE
Radeon 740M, R5 PRO 215, Samsung PM9C1b MZVL8512HFLU-00BLL
9146 Points -17%
PCMark 10 / Productivity
Dell Pro 5 16 P516265
Radeon 890M, Ryzen AI 9 HX PRO 470, SanDisk PC SN5100S
16430 Points
Dell XPS 16 Core Ultra X7 358H
Arc B390 Panther Lake iGPU, Ultra X7 358H
16422 Points 0%
Medio AMD Ryzen AI 9 HX PRO 470, AMD Radeon 890M
  (15768 - 16430, n=2)
16099 Points -2%
MSI Venture 16 AI A2HMTG
Arc 140T, Ultra 7 255H
15694 Points -4%
Lenovo ThinkPad T16 Gen 5 22AN001WGE
Radeon 740M, R5 PRO 215, Samsung PM9C1b MZVL8512HFLU-00BLL
10938 Points -33%
HP EliteBook 8 G1a 16 AI
Radeon 860M, Ryzen AI 7 PRO 350, Micron 3500 MTFDKBA512TGD
10925 Points -34%
Asus ExpertBook B5 B5605CCA
Arc 130T, Ultra 5 225H, Micron 2500 MTFDKBA512QGN
8873 Points -46%
PCMark 10 / Digital Content Creation
Dell XPS 16 Core Ultra X7 358H
Arc B390 Panther Lake iGPU, Ultra X7 358H
13633 Points +40%
MSI Venture 16 AI A2HMTG
Arc 140T, Ultra 7 255H
11387 Points +17%
Asus ExpertBook B5 B5605CCA
Arc 130T, Ultra 5 225H, Micron 2500 MTFDKBA512QGN
10548 Points +8%
Medio AMD Ryzen AI 9 HX PRO 470, AMD Radeon 890M
  (9762 - 9967, n=2)
9865 Points +1%
Dell Pro 5 16 P516265
Radeon 890M, Ryzen AI 9 HX PRO 470, SanDisk PC SN5100S
9762 Points
HP EliteBook 8 G1a 16 AI
Radeon 860M, Ryzen AI 7 PRO 350, Micron 3500 MTFDKBA512TGD
9503 Points -3%
Lenovo ThinkPad T16 Gen 5 22AN001WGE
Radeon 740M, R5 PRO 215, Samsung PM9C1b MZVL8512HFLU-00BLL
6134 Points -37%
CrossMark / Overall
Dell XPS 16 Core Ultra X7 358H
Arc B390 Panther Lake iGPU, Ultra X7 358H
2114 Points +11%
Dell Pro 5 16 P516265
Radeon 890M, Ryzen AI 9 HX PRO 470, SanDisk PC SN5100S
1903 Points
MSI Venture 16 AI A2HMTG
Arc 140T, Ultra 7 255H
1901 Points 0%
Medio AMD Ryzen AI 9 HX PRO 470, AMD Radeon 890M
  (1739 - 1903, n=3)
1808 Points -5%
Asus ExpertBook B5 B5605CCA
Arc 130T, Ultra 5 225H, Micron 2500 MTFDKBA512QGN
1754 Points -8%
HP EliteBook 8 G1a 16 AI
Radeon 860M, Ryzen AI 7 PRO 350, Micron 3500 MTFDKBA512TGD
1703 Points -11%
Lenovo ThinkPad T16 Gen 5 22AN001WGE
Radeon 740M, R5 PRO 215, Samsung PM9C1b MZVL8512HFLU-00BLL
1472 Points -23%
CrossMark / Productivity
Dell XPS 16 Core Ultra X7 358H
Arc B390 Panther Lake iGPU, Ultra X7 358H
1898 Points +10%
MSI Venture 16 AI A2HMTG
Arc 140T, Ultra 7 255H
1814 Points +5%
Asus ExpertBook B5 B5605CCA
Arc 130T, Ultra 5 225H, Micron 2500 MTFDKBA512QGN
1740 Points +1%
Dell Pro 5 16 P516265
Radeon 890M, Ryzen AI 9 HX PRO 470, SanDisk PC SN5100S
1729 Points
Medio AMD Ryzen AI 9 HX PRO 470, AMD Radeon 890M
  (1620 - 1729, n=3)
1667 Points -4%
HP EliteBook 8 G1a 16 AI
Radeon 860M, Ryzen AI 7 PRO 350, Micron 3500 MTFDKBA512TGD
1612 Points -7%
Lenovo ThinkPad T16 Gen 5 22AN001WGE
Radeon 740M, R5 PRO 215, Samsung PM9C1b MZVL8512HFLU-00BLL
1501 Points -13%
CrossMark / Creativity
Dell XPS 16 Core Ultra X7 358H
Arc B390 Panther Lake iGPU, Ultra X7 358H
2529 Points +12%
Dell Pro 5 16 P516265
Radeon 890M, Ryzen AI 9 HX PRO 470, SanDisk PC SN5100S
2254 Points
MSI Venture 16 AI A2HMTG
Arc 140T, Ultra 7 255H
2151 Points -5%
Medio AMD Ryzen AI 9 HX PRO 470, AMD Radeon 890M
  (2024 - 2254, n=3)
2104 Points -7%
HP EliteBook 8 G1a 16 AI
Radeon 860M, Ryzen AI 7 PRO 350, Micron 3500 MTFDKBA512TGD
1907 Points -15%
Asus ExpertBook B5 B5605CCA
Arc 130T, Ultra 5 225H, Micron 2500 MTFDKBA512QGN
1893 Points -16%
Lenovo ThinkPad T16 Gen 5 22AN001WGE
Radeon 740M, R5 PRO 215, Samsung PM9C1b MZVL8512HFLU-00BLL
1541 Points -32%
CrossMark / Responsiveness
Dell XPS 16 Core Ultra X7 358H
Arc B390 Panther Lake iGPU, Ultra X7 358H
1706 Points +12%
Dell Pro 5 16 P516265
Radeon 890M, Ryzen AI 9 HX PRO 470, SanDisk PC SN5100S
1526 Points
MSI Venture 16 AI A2HMTG
Arc 140T, Ultra 7 255H
1511 Points -1%
Medio AMD Ryzen AI 9 HX PRO 470, AMD Radeon 890M
  (1366 - 1526, n=3)
1467 Points -4%
HP EliteBook 8 G1a 16 AI
Radeon 860M, Ryzen AI 7 PRO 350, Micron 3500 MTFDKBA512TGD
1433 Points -6%
Asus ExpertBook B5 B5605CCA
Arc 130T, Ultra 5 225H, Micron 2500 MTFDKBA512QGN
1426 Points -7%
Lenovo ThinkPad T16 Gen 5 22AN001WGE
Radeon 740M, R5 PRO 215, Samsung PM9C1b MZVL8512HFLU-00BLL
1212 Points -21%
WebXPRT 3 / Overall
Dell Pro 5 16 P516265
Radeon 890M, Ryzen AI 9 HX PRO 470, SanDisk PC SN5100S
349 Points
Medio AMD Ryzen AI 9 HX PRO 470, AMD Radeon 890M
  (298 - 349, n=3)
330 Points -5%
MSI Venture 16 AI A2HMTG
Arc 140T, Ultra 7 255H
323 Points -7%
Asus ExpertBook B5 B5605CCA
Arc 130T, Ultra 5 225H, Micron 2500 MTFDKBA512QGN
309 Points -11%
Dell XPS 16 Core Ultra X7 358H
Arc B390 Panther Lake iGPU, Ultra X7 358H
304 Points -13%
Lenovo ThinkPad T16 Gen 5 22AN001WGE
Radeon 740M, R5 PRO 215, Samsung PM9C1b MZVL8512HFLU-00BLL
292 Points -16%
HP EliteBook 8 G1a 16 AI
Radeon 860M, Ryzen AI 7 PRO 350, Micron 3500 MTFDKBA512TGD
250 Points -28%
WebXPRT 4 / Overall
Dell XPS 16 Core Ultra X7 358H
Arc B390 Panther Lake iGPU, Ultra X7 358H
300 Points +6%
MSI Venture 16 AI A2HMTG
Arc 140T, Ultra 7 255H
297 Points +5%
Asus ExpertBook B5 B5605CCA
Arc 130T, Ultra 5 225H, Micron 2500 MTFDKBA512QGN
294 Points +4%
Dell Pro 5 16 P516265
Radeon 890M, Ryzen AI 9 HX PRO 470, SanDisk PC SN5100S
284 Points
Medio AMD Ryzen AI 9 HX PRO 470, AMD Radeon 890M
  (237 - 284, n=3)
266 Points -6%
Lenovo ThinkPad T16 Gen 5 22AN001WGE
Radeon 740M, R5 PRO 215, Samsung PM9C1b MZVL8512HFLU-00BLL
250 Points -12%
HP EliteBook 8 G1a 16 AI
Radeon 860M, Ryzen AI 7 PRO 350, Micron 3500 MTFDKBA512TGD
200 Points -30%
Mozilla Kraken 1.1 / Total
HP EliteBook 8 G1a 16 AI
Radeon 860M, Ryzen AI 7 PRO 350, Micron 3500 MTFDKBA512TGD
749 ms * -76%
Lenovo ThinkPad T16 Gen 5 22AN001WGE
Radeon 740M, R5 PRO 215, Samsung PM9C1b MZVL8512HFLU-00BLL
538 ms * -26%
Asus ExpertBook B5 B5605CCA
Arc 130T, Ultra 5 225H, Micron 2500 MTFDKBA512QGN
458 ms * -8%
MSI Venture 16 AI A2HMTG
Arc 140T, Ultra 7 255H
454 ms * -7%
Dell XPS 16 Core Ultra X7 358H
Arc B390 Panther Lake iGPU, Ultra X7 358H
450 ms * -6%
Medio AMD Ryzen AI 9 HX PRO 470, AMD Radeon 890M
  (426 - 431, n=3)
428 ms * -0%
Dell Pro 5 16 P516265
Radeon 890M, Ryzen AI 9 HX PRO 470, SanDisk PC SN5100S
426 ms *
Geekbench AI / Quantized GPU 1.7
Dell XPS 16 Core Ultra X7 358H
Arc B390 Panther Lake iGPU, Ultra X7 358H
7990 Points +51%
Medio AMD Ryzen AI 9 HX PRO 470, AMD Radeon 890M
  (5297 - 5656, n=2)
5477 Points +3%
Dell Pro 5 16 P516265
Radeon 890M, Ryzen AI 9 HX PRO 470, SanDisk PC SN5100S
5297 Points
MSI Venture 16 AI A2HMTG
Arc 140T, Ultra 7 255H
4705 Points -11%
HP EliteBook 8 G1a 16 AI
Radeon 860M, Ryzen AI 7 PRO 350, Micron 3500 MTFDKBA512TGD
4564 Points -14%
Geekbench AI / Half Precision GPU 1.7
Dell XPS 16 Core Ultra X7 358H
Arc B390 Panther Lake iGPU, Ultra X7 358H
20773 Points +79%
Medio AMD Ryzen AI 9 HX PRO 470, AMD Radeon 890M
  (11589 - 11832, n=2)
11711 Points +1%
Dell Pro 5 16 P516265
Radeon 890M, Ryzen AI 9 HX PRO 470, SanDisk PC SN5100S
11589 Points
HP EliteBook 8 G1a 16 AI
Radeon 860M, Ryzen AI 7 PRO 350, Micron 3500 MTFDKBA512TGD
9607 Points -17%
MSI Venture 16 AI A2HMTG
Arc 140T, Ultra 7 255H
8108 Points -30%
Geekbench AI / Single Precision GPU 1.7
Dell XPS 16 Core Ultra X7 358H
Arc B390 Panther Lake iGPU, Ultra X7 358H
11471 Points +66%
Medio AMD Ryzen AI 9 HX PRO 470, AMD Radeon 890M
  (6931 - 7225, n=2)
7078 Points +2%
Dell Pro 5 16 P516265
Radeon 890M, Ryzen AI 9 HX PRO 470, SanDisk PC SN5100S
6931 Points
MSI Venture 16 AI A2HMTG
Arc 140T, Ultra 7 255H
6840 Points -1%
HP EliteBook 8 G1a 16 AI
Radeon 860M, Ryzen AI 7 PRO 350, Micron 3500 MTFDKBA512TGD
6301 Points -9%

* ... más pequeño es mejor

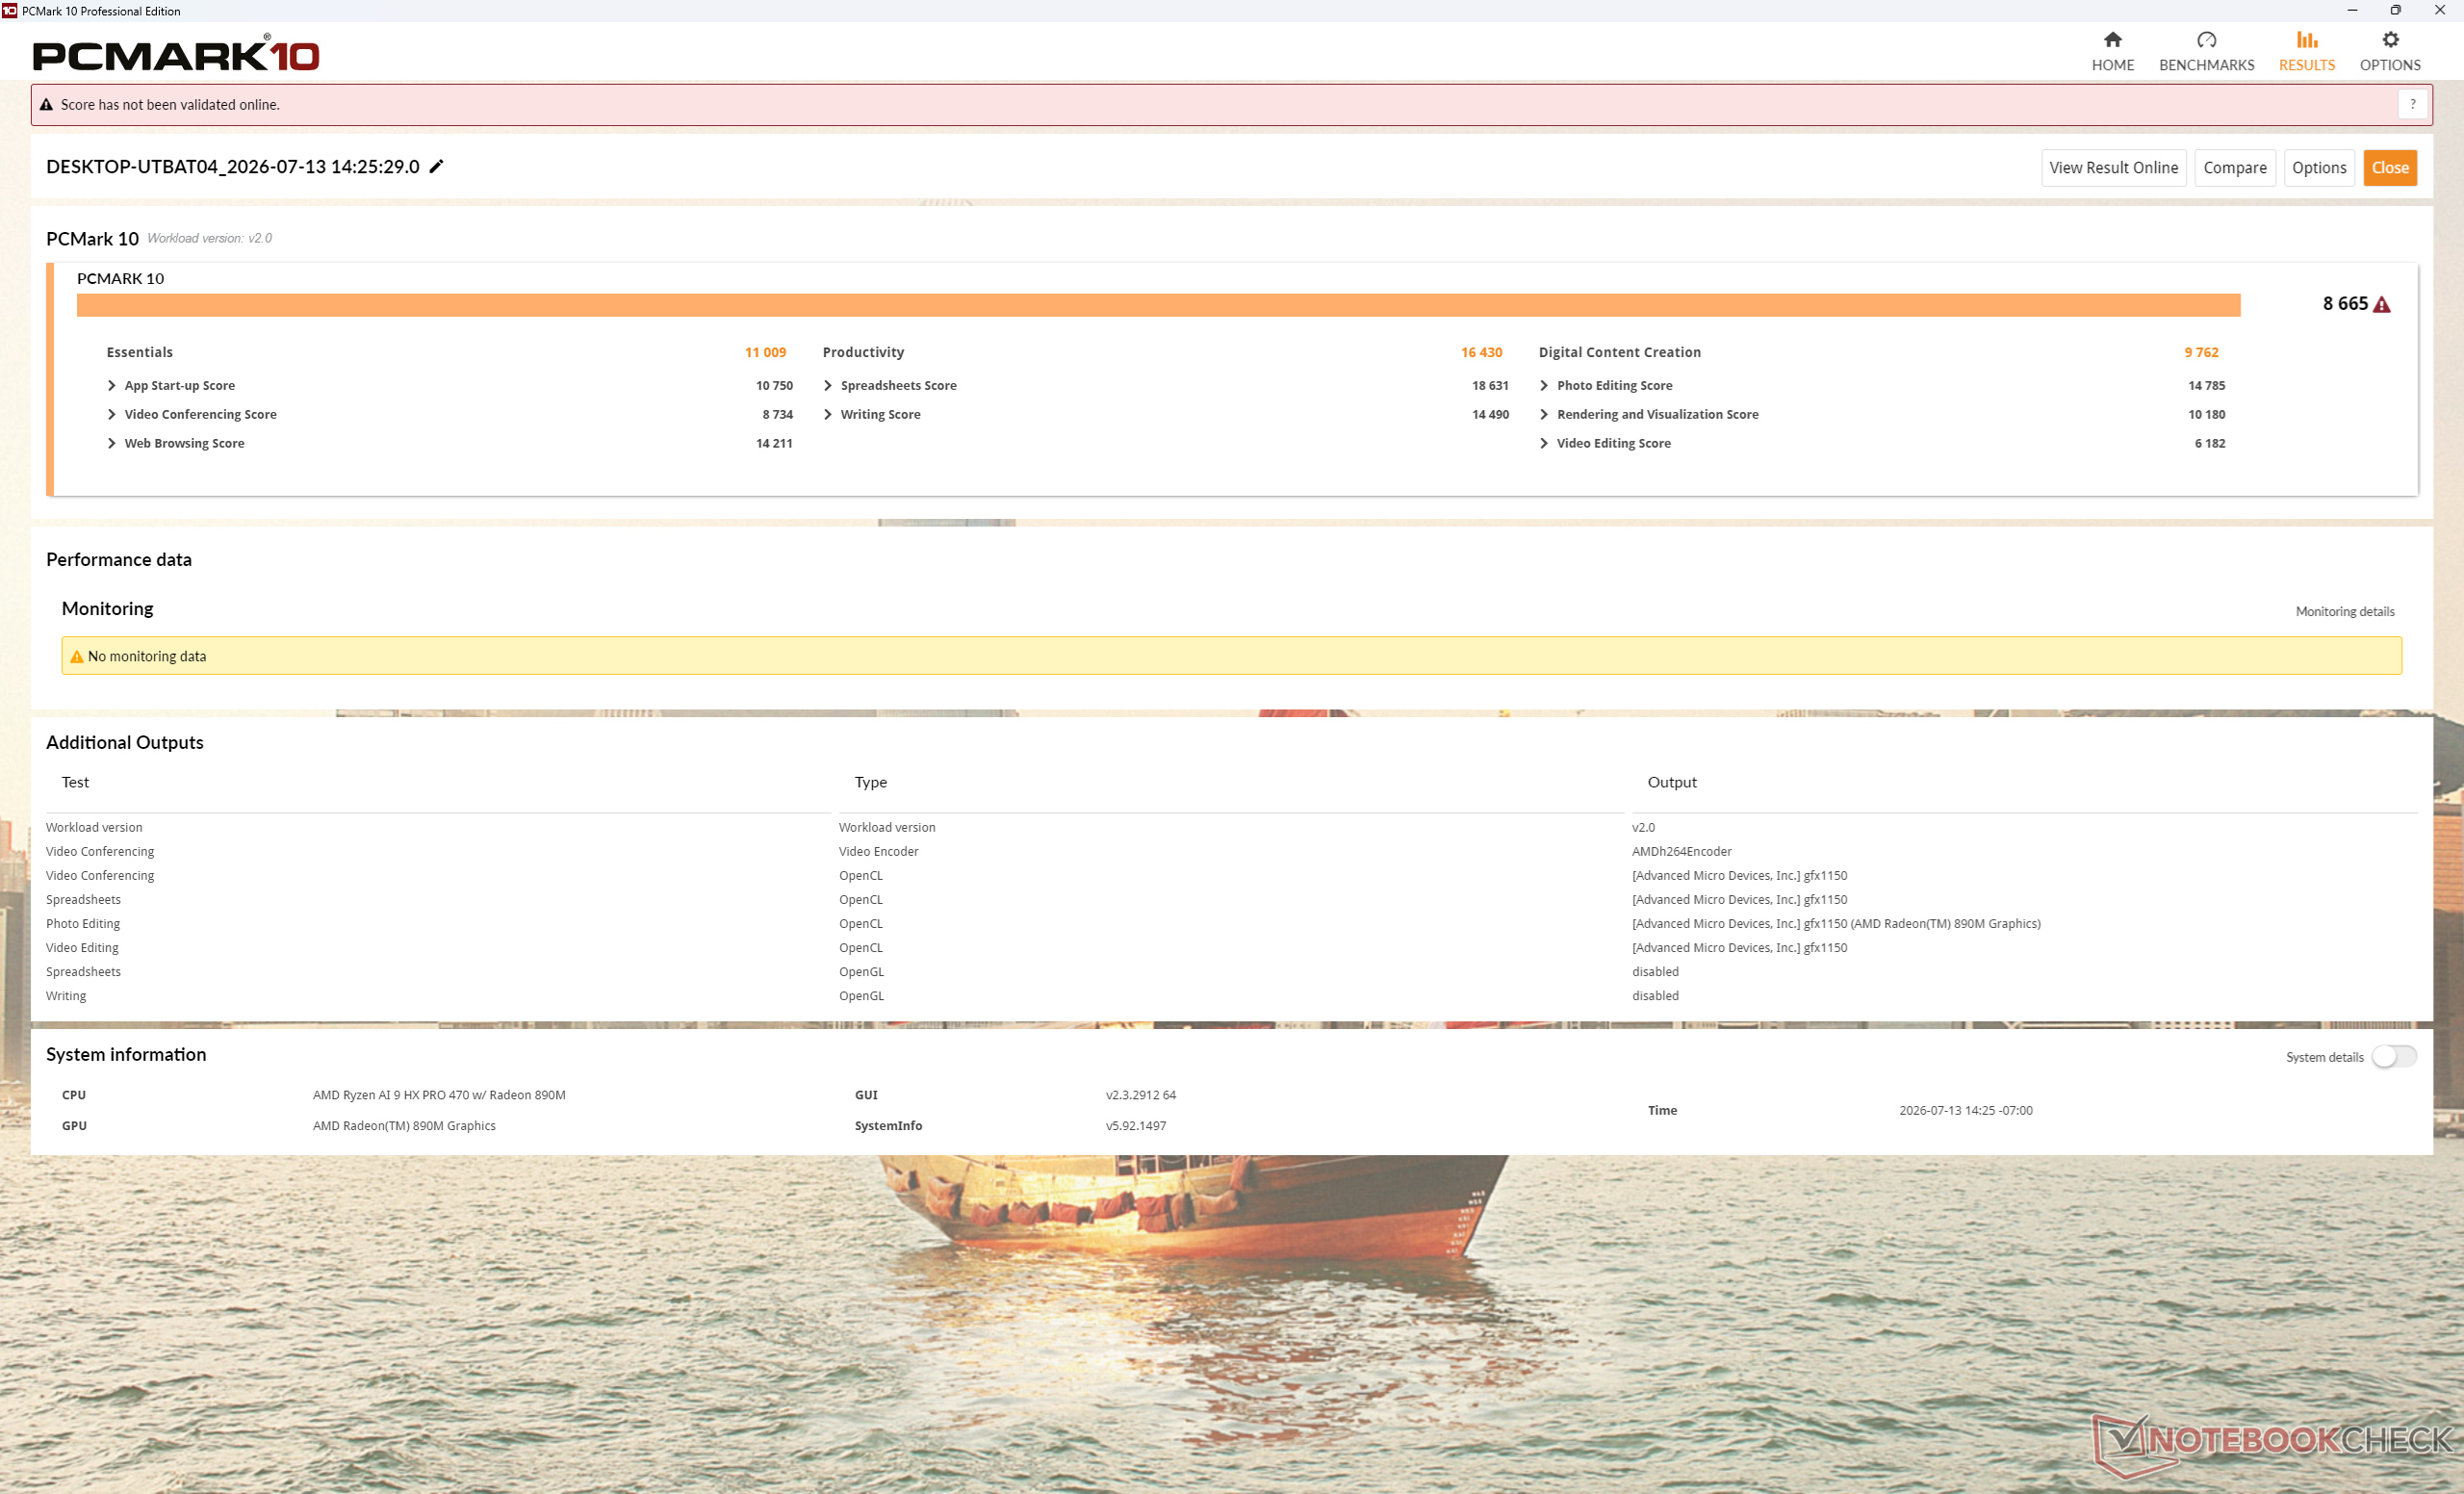
PCMark 10 Score
8665 puntos
ayuda
AIDA64 / Memory Copy
Dell XPS 16 Core Ultra X7 358H
Intel Core Ultra X7 358H, Arc B390 Panther Lake iGPU
132135 MB/s +71%
Dell Pro 5 16 P516265
AMD Ryzen AI 9 HX PRO 470, Radeon 890M
77066 MB/s
Medio AMD Ryzen AI 9 HX PRO 470
  (70163 - 82931, n=3)
76720 MB/s 0%
HP EliteBook 8 G1a 16 AI
AMD Ryzen AI 7 PRO 350, Radeon 860M
73363 MB/s -5%
MSI Venture 16 AI A2HMTG
Intel Core Ultra 7 255H, Arc 140T
67747 MB/s -12%
Asus ExpertBook B5 B5605CCA
Intel Core Ultra 5 225H, Arc 130T
47920 MB/s -38%
Lenovo ThinkPad T16 Gen 5 22AN001WGE
AMD Ryzen 5 PRO 215, Radeon 740M
35500 MB/s -54%
AIDA64 / Memory Read
Dell XPS 16 Core Ultra X7 358H
Intel Core Ultra X7 358H, Arc B390 Panther Lake iGPU
118888 MB/s +47%
Medio AMD Ryzen AI 9 HX PRO 470
  (80270 - 86838, n=3)
82703 MB/s +2%
MSI Venture 16 AI A2HMTG
Intel Core Ultra 7 255H, Arc 140T
81958 MB/s +1%
Dell Pro 5 16 P516265
AMD Ryzen AI 9 HX PRO 470, Radeon 890M
81001 MB/s
HP EliteBook 8 G1a 16 AI
AMD Ryzen AI 7 PRO 350, Radeon 860M
62435 MB/s -23%
Asus ExpertBook B5 B5605CCA
Intel Core Ultra 5 225H, Arc 130T
44496 MB/s -45%
Lenovo ThinkPad T16 Gen 5 22AN001WGE
AMD Ryzen 5 PRO 215, Radeon 740M
30310 MB/s -63%
AIDA64 / Memory Write
Dell XPS 16 Core Ultra X7 358H
Intel Core Ultra X7 358H, Arc B390 Panther Lake iGPU
134998 MB/s +58%
Medio AMD Ryzen AI 9 HX PRO 470
  (85093 - 109384, n=3)
93224 MB/s +9%
HP EliteBook 8 G1a 16 AI
AMD Ryzen AI 7 PRO 350, Radeon 860M
86184 MB/s +1%
Dell Pro 5 16 P516265
AMD Ryzen AI 9 HX PRO 470, Radeon 890M
85194 MB/s
MSI Venture 16 AI A2HMTG
Intel Core Ultra 7 255H, Arc 140T
77727 MB/s -9%
Lenovo ThinkPad T16 Gen 5 22AN001WGE
AMD Ryzen 5 PRO 215, Radeon 740M
42605 MB/s -50%
Asus ExpertBook B5 B5605CCA
Intel Core Ultra 5 225H, Arc 130T
39188 MB/s -54%
AIDA64 / Memory Latency
Asus ExpertBook B5 B5605CCA
Intel Core Ultra 5 225H, Arc 130T
115.7 ns * -16%
MSI Venture 16 AI A2HMTG
Intel Core Ultra 7 255H, Arc 140T
109 ns * -9%
Medio AMD Ryzen AI 9 HX PRO 470
  (100.1 - 118.5, n=3)
106.7 ns * -7%
Lenovo ThinkPad T16 Gen 5 22AN001WGE
AMD Ryzen 5 PRO 215, Radeon 740M
105.8 ns * -6%
HP EliteBook 8 G1a 16 AI
AMD Ryzen AI 7 PRO 350, Radeon 860M
105.3 ns * -5%
Dell Pro 5 16 P516265
AMD Ryzen AI 9 HX PRO 470, Radeon 890M
100.1 ns *
Dell XPS 16 Core Ultra X7 358H
Intel Core Ultra X7 358H, Arc B390 Panther Lake iGPU
84.6 ns * +15%

* ... más pequeño es mejor

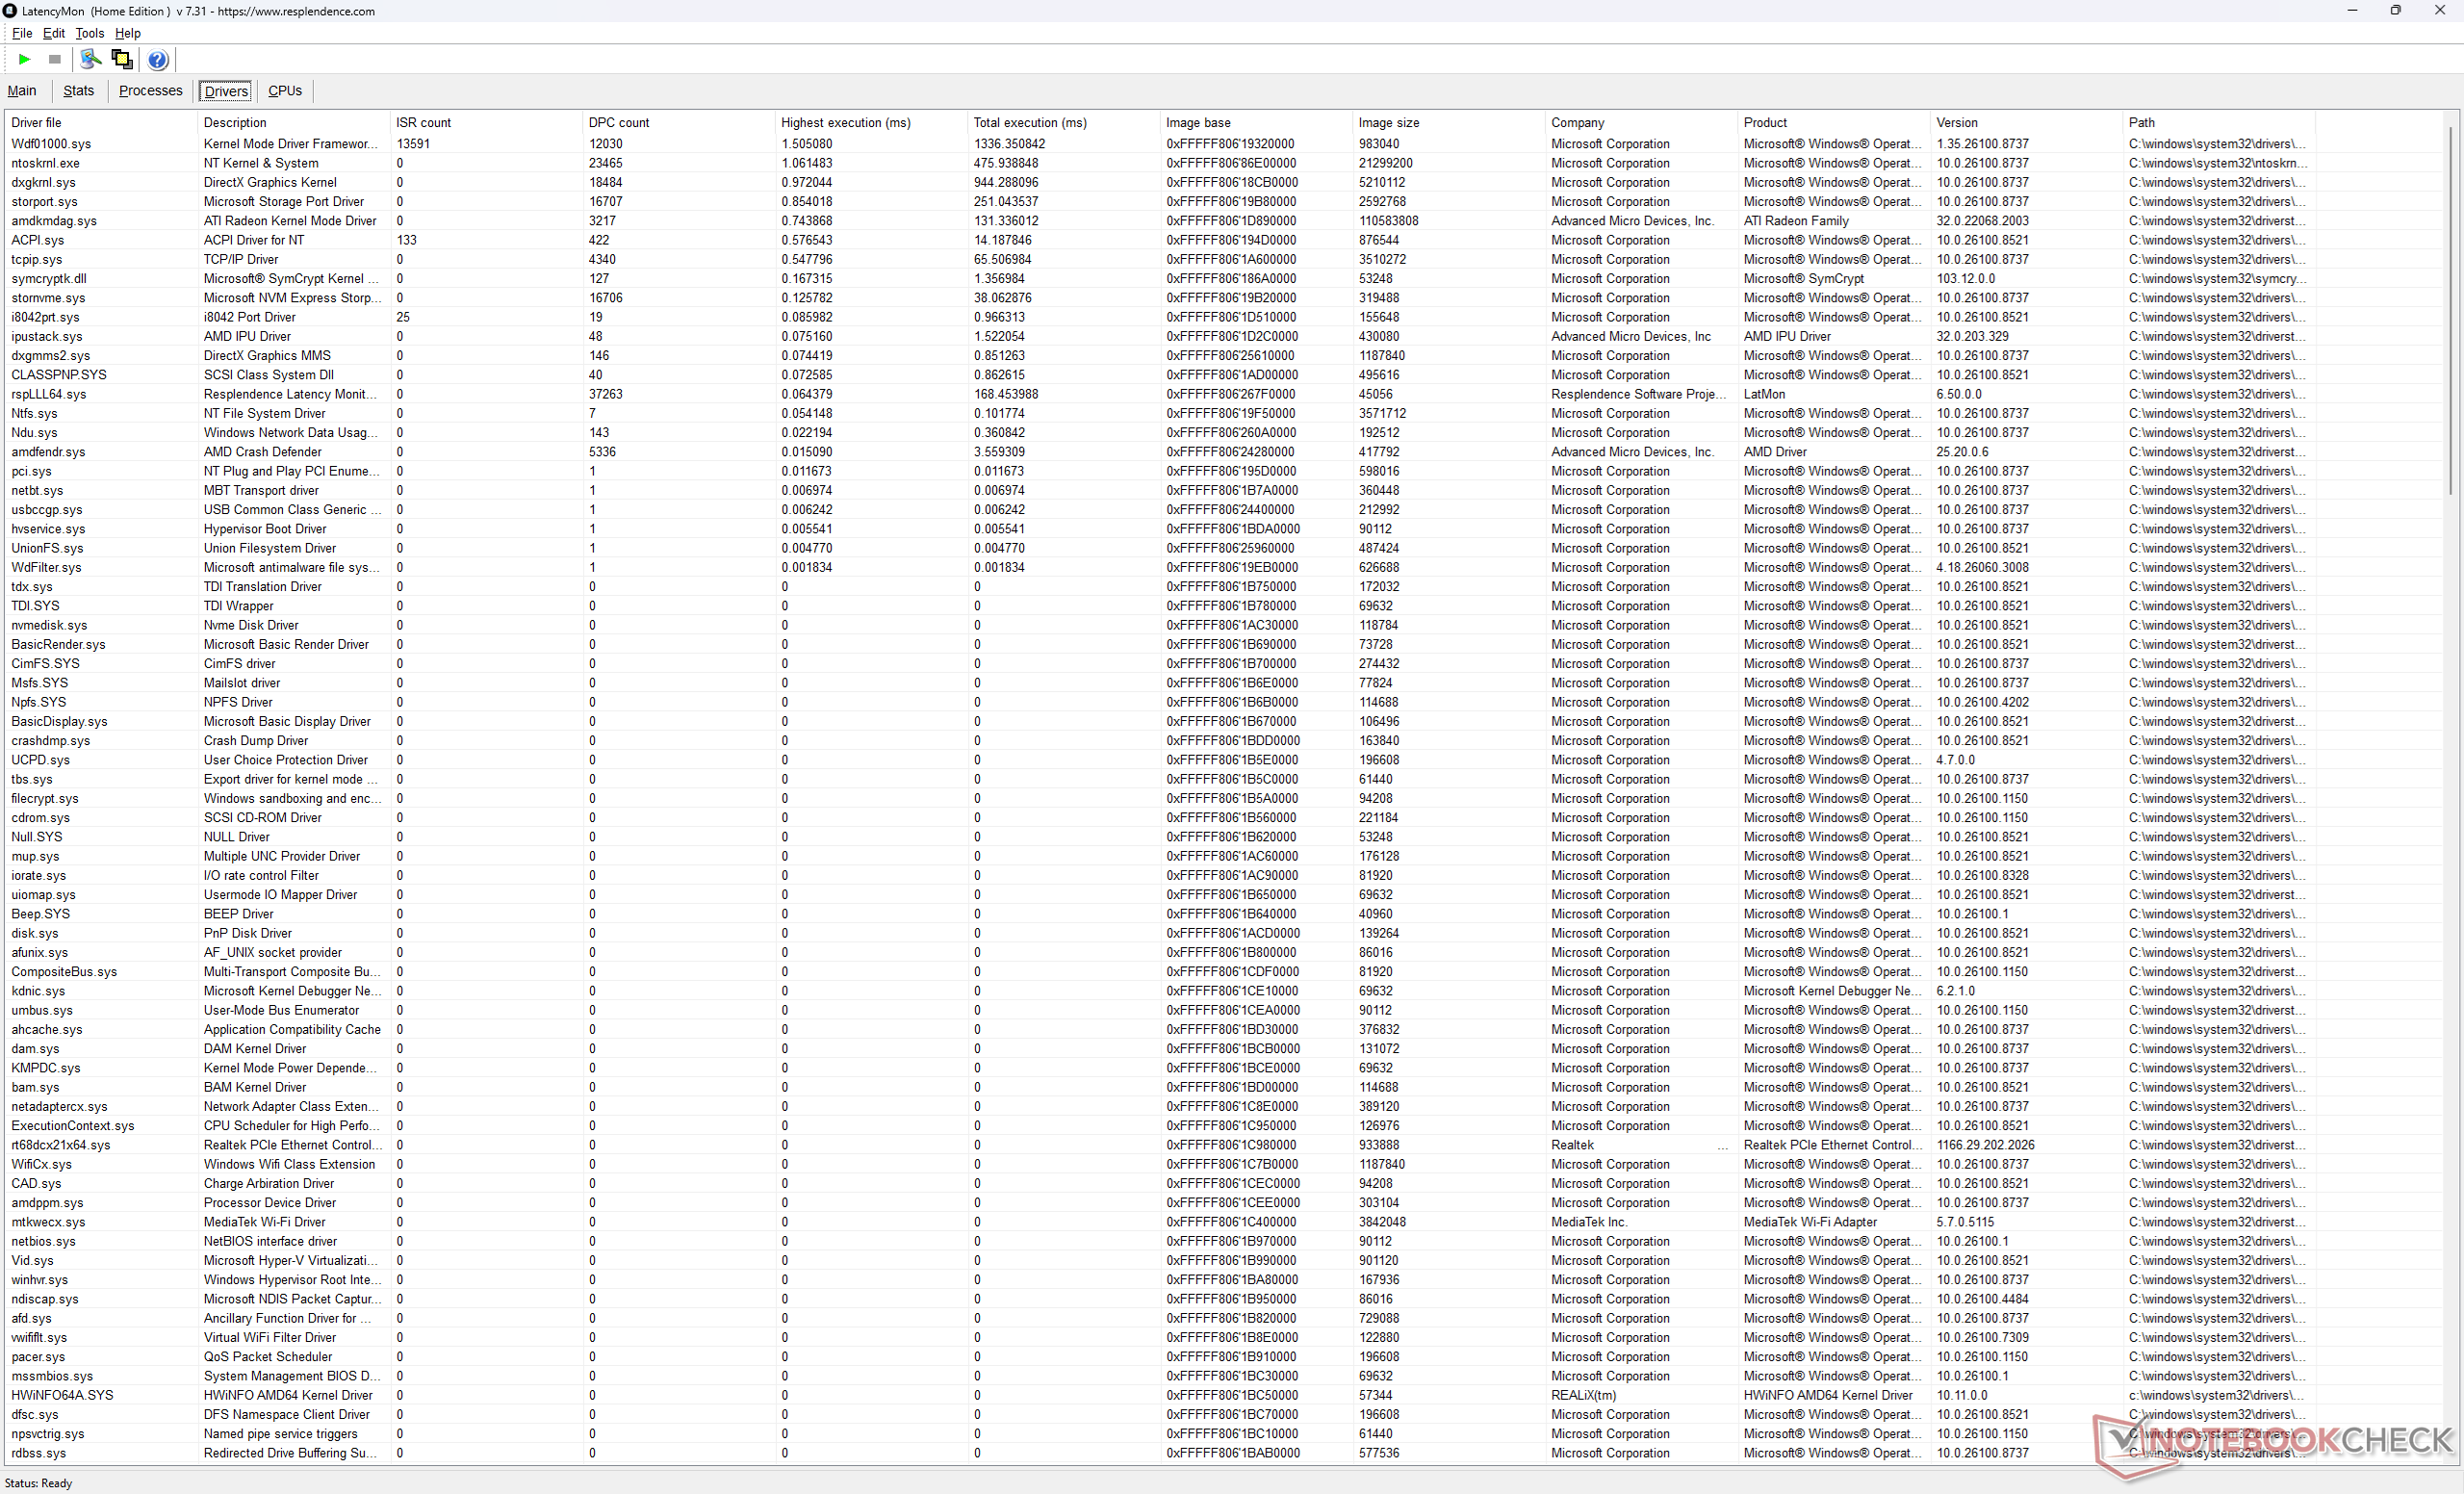
Latencia del DPC
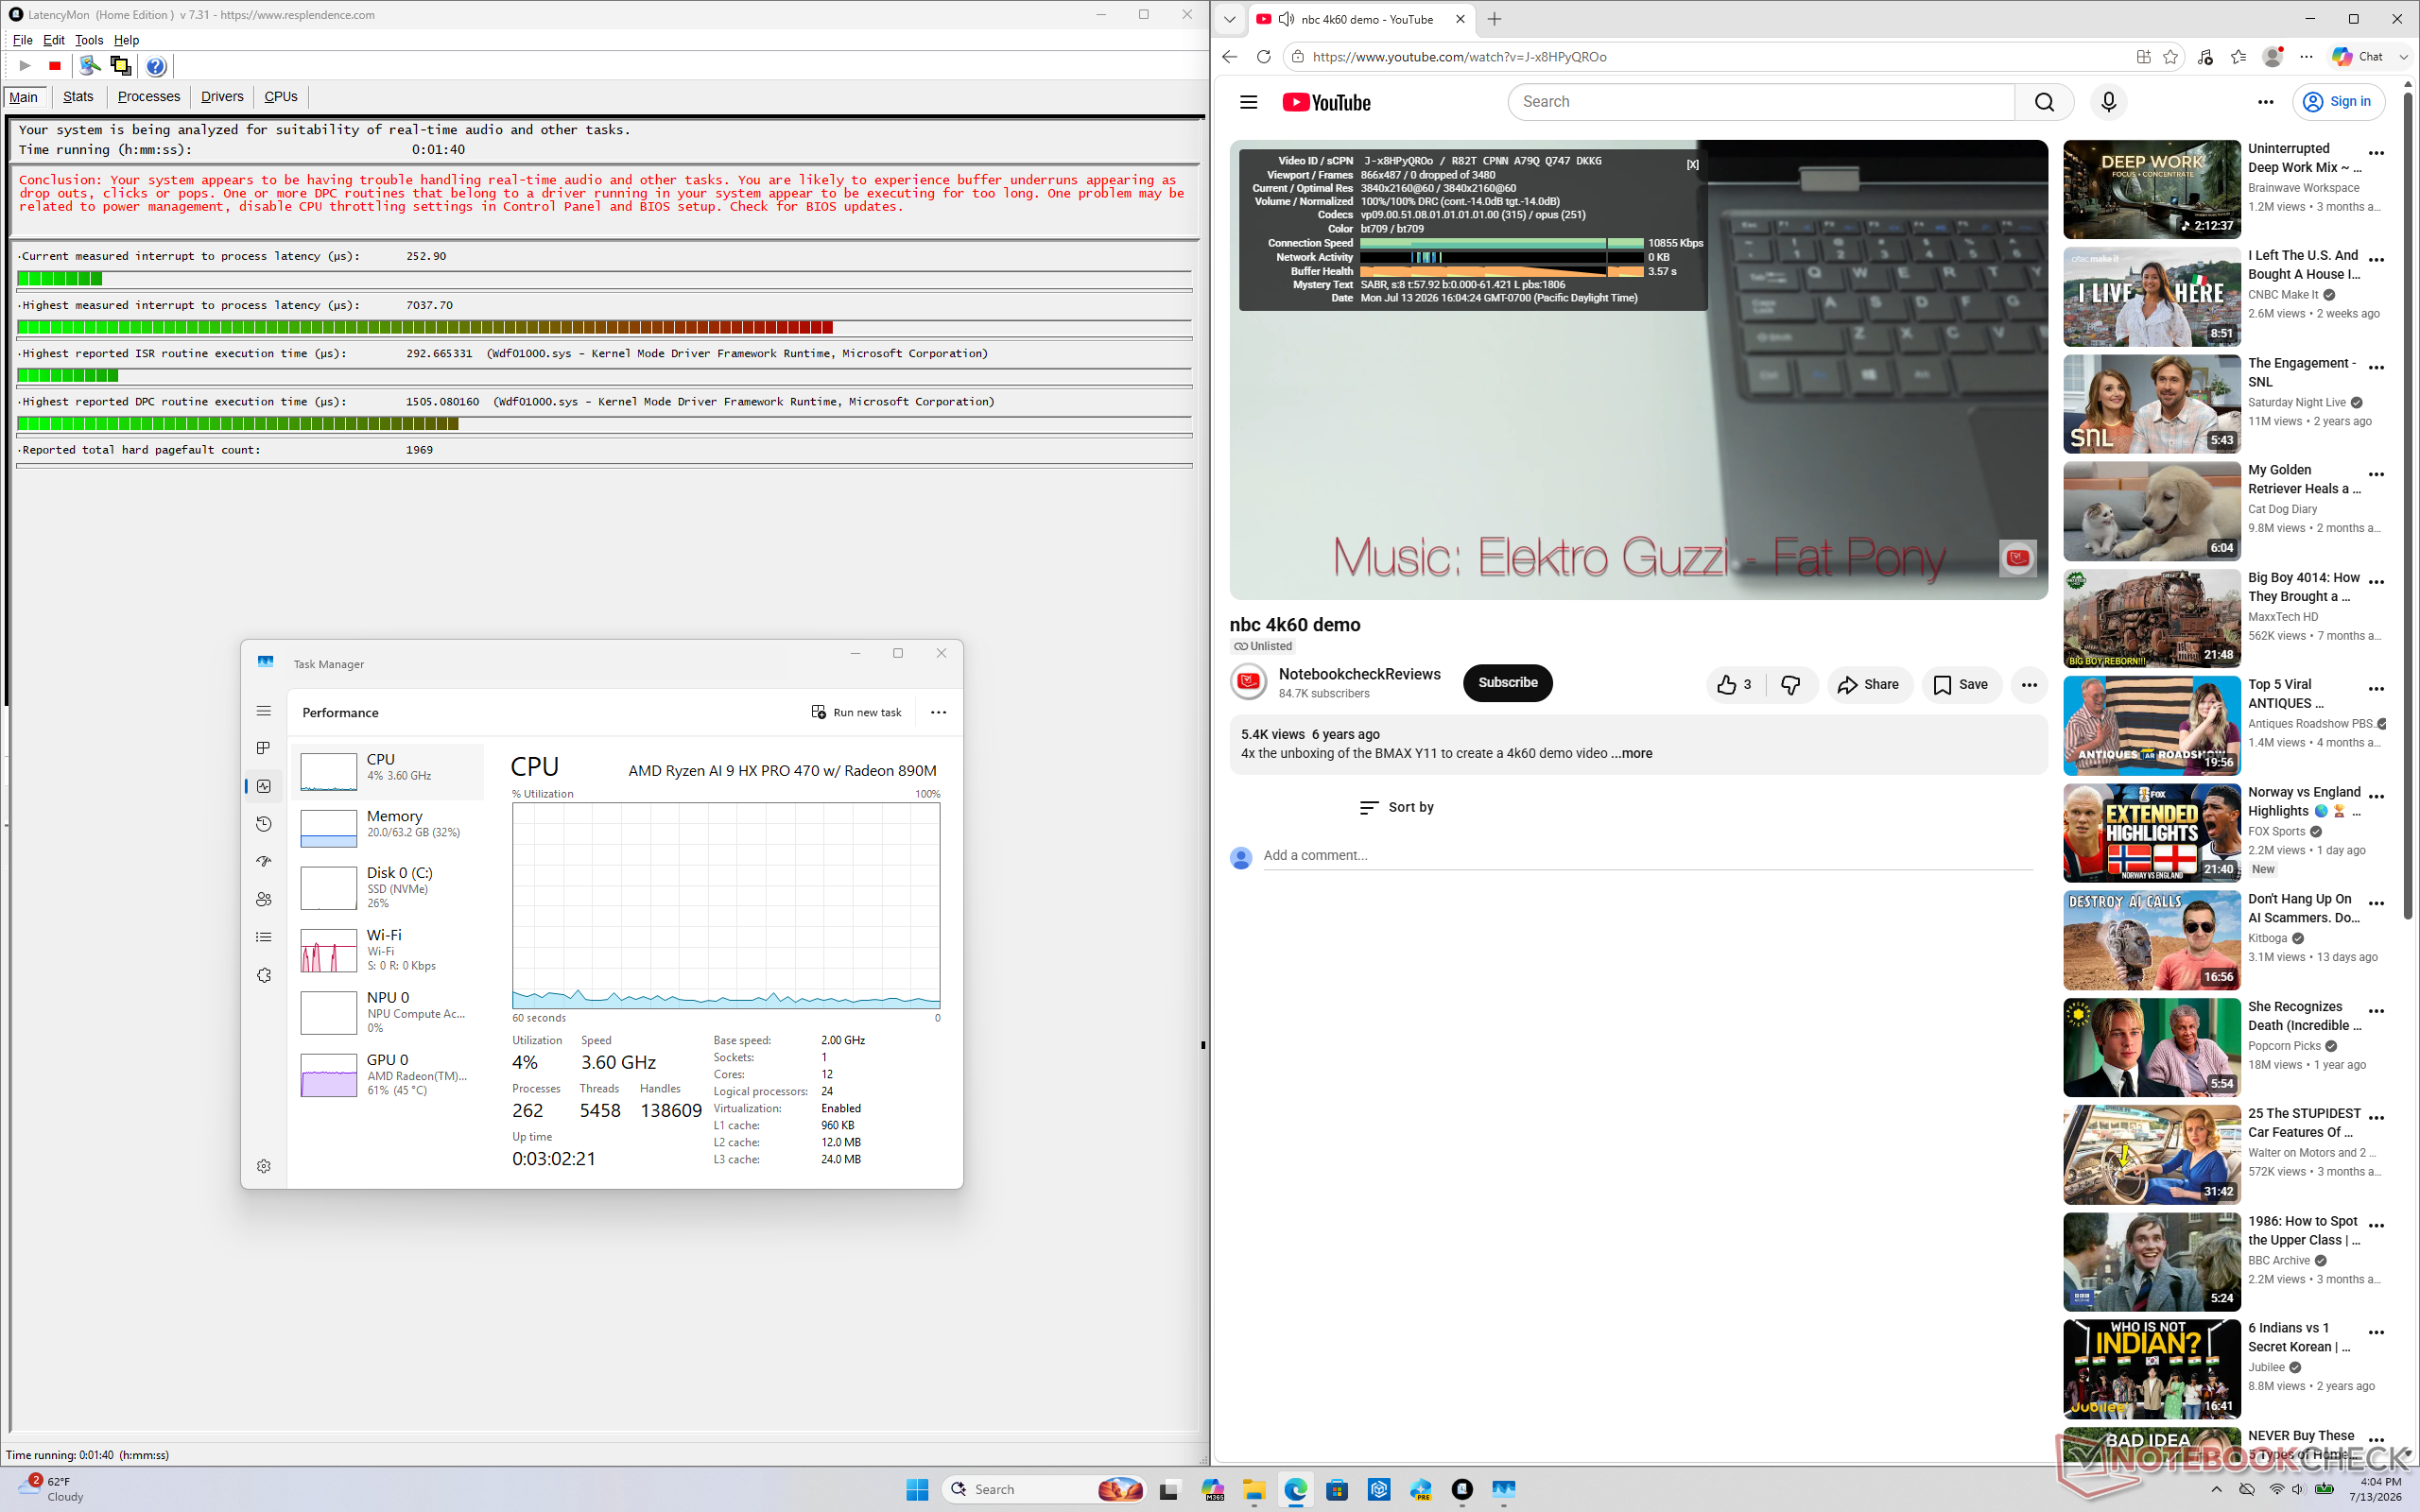
LatencyMon muestra problemas de DPC, pero, por lo demás, no se producen pérdidas de fotogramas durante la reproducción de vídeo en 4K a 60 fps.
Lista de controladores
DPC Latencies / LatencyMon - interrupt to process latency (max), Web, Youtube, Prime95
Dell Pro 5 16 P516265
Radeon 890M, Ryzen AI 9 HX PRO 470, SanDisk PC SN5100S
7037.7 μs *
HP EliteBook 8 G1a 16 AI
Radeon 860M, Ryzen AI 7 PRO 350, Micron 3500 MTFDKBA512TGD
5628.9 μs * +20%
MSI Venture 16 AI A2HMTG
Arc 140T, Ultra 7 255H
2467.2 μs * +65%
Asus ExpertBook B5 B5605CCA
Arc 130T, Ultra 5 225H, Micron 2500 MTFDKBA512QGN
2421.1 μs * +66%
Lenovo ThinkPad T16 Gen 5 22AN001WGE
Radeon 740M, R5 PRO 215, Samsung PM9C1b MZVL8512HFLU-00BLL
1316.2 μs * +81%
Dell XPS 16 Core Ultra X7 358H
Arc B390 Panther Lake iGPU, Ultra X7 358H
513.7 μs * +93%

* ... más pequeño es mejor

Dispositivos de almacenamiento
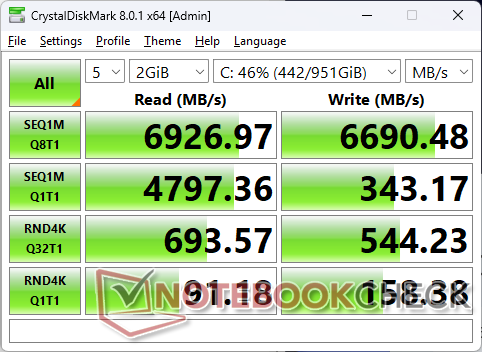
CDM 8
CDM 8
AS SSD
AS SSD
SanDisk PC SN5100S
CDM 5/6 Read Seq Q32T1: 6749 MB/s
CDM 5/6 Write Seq Q32T1: 6683 MB/s
CDM 5/6 Read 4K Q32T1: 693.2 MB/s
CDM 5/6 Write 4K Q32T1: 549.6 MB/s
CDM 5 Read Seq: 4745 MB/s
CDM 5 Write Seq: 4311 MB/s
CDM 5/6 Read 4K: 82.39 MB/s
CDM 5/6 Write 4K: 156.7 MB/s
Drive Performance rating - Percent
HP EliteBook 8 G1a 16 AI
Micron 3500 MTFDKBA512TGD
87 pt
Dell Pro 5 16 P516265
SanDisk PC SN5100S
82.1 pt
Asus ExpertBook B5 B5605CCA
Micron 2500 MTFDKBA512QGN
80.5 pt
Dell XPS 16 Core Ultra X7 358H
 
76.8 pt
Lenovo ThinkPad T16 Gen 5 22AN001WGE
Samsung PM9C1b MZVL8512HFLU-00BLL
70.9 pt
MSI Venture 16 AI A2HMTG
 
70 pt
DiskSpd
seq read
Dell Pro 5 16 P516265
SanDisk PC SN5100S
3788 (3754.74min - 3787.88max) MB/s
Dell XPS 16 Core Ultra X7 358H
 
3600 (3100.64min - 3600.18max) MB/s -5%
MSI Venture 16 AI A2HMTG
 
3459 (3115.95min - 3458.62max) MB/s -9%
HP EliteBook 8 G1a 16 AI
Micron 3500 MTFDKBA512TGD
3451 (3407.77min - 3451.07max) MB/s -9%
Asus ExpertBook B5 B5605CCA
Micron 2500 MTFDKBA512QGN
3130 (3044.44min - 3129.58max) MB/s -17%
Lenovo ThinkPad T16 Gen 5 22AN001WGE
Samsung PM9C1b MZVL8512HFLU-00BLL
2923 (2630.44min - 2922.8max) MB/s -23%
seq write
Dell Pro 5 16 P516265
SanDisk PC SN5100S
4280 (3249.96min - 4279.66max) MB/s
HP EliteBook 8 G1a 16 AI
Micron 3500 MTFDKBA512TGD
3810 (3218.56min - 3810.11max) MB/s -11%
MSI Venture 16 AI A2HMTG
 
3716 (3581.27min - 3716.36max) MB/s -13%
Asus ExpertBook B5 B5605CCA
Micron 2500 MTFDKBA512QGN
3518 (3278.21min - 3518.28max) MB/s -18%
Lenovo ThinkPad T16 Gen 5 22AN001WGE
Samsung PM9C1b MZVL8512HFLU-00BLL
2953 (2837.02min - 2953.21max) MB/s -31%
Dell XPS 16 Core Ultra X7 358H
 
2599 (796.92min - 2599.25max) MB/s -39%
seq q8 t1 read
Dell Pro 5 16 P516265
SanDisk PC SN5100S
7061 (6371.99min - 7061.46max) MB/s
Dell XPS 16 Core Ultra X7 358H
 
7039 (5536.1min - 7039.48max) MB/s 0%
HP EliteBook 8 G1a 16 AI
Micron 3500 MTFDKBA512TGD
7034 (5797.22min - 7033.83max) MB/s 0%
MSI Venture 16 AI A2HMTG
 
7030 (5829.87min - 7029.85max) MB/s 0%
Asus ExpertBook B5 B5605CCA
Micron 2500 MTFDKBA512QGN
6759 (5352.77min - 6758.7max) MB/s -4%
Lenovo ThinkPad T16 Gen 5 22AN001WGE
Samsung PM9C1b MZVL8512HFLU-00BLL
5920 (4743.97min - 5919.84max) MB/s -16%
seq q8 t1 write
Dell Pro 5 16 P516265
SanDisk PC SN5100S
6699 (5478.39min - 6698.96max) MB/s
Dell XPS 16 Core Ultra X7 358H
 
6101 (5938.22min - 6101.03max) MB/s -9%
MSI Venture 16 AI A2HMTG
 
5781 (5725.31min - 5780.8max) MB/s -14%
HP EliteBook 8 G1a 16 AI
Micron 3500 MTFDKBA512TGD
5580 (5219.39min - 5579.64max) MB/s -17%
Lenovo ThinkPad T16 Gen 5 22AN001WGE
Samsung PM9C1b MZVL8512HFLU-00BLL
4178 (3970.78min - 4178.16max) MB/s -38%
Asus ExpertBook B5 B5605CCA
Micron 2500 MTFDKBA512QGN
3686 (3662.27min - 3685.95max) MB/s -45%
4k q1 t1 read
Dell Pro 5 16 P516265
SanDisk PC SN5100S
87.6 (82.04min - 87.6max) MB/s
MSI Venture 16 AI A2HMTG
 
70.6 (70.28min - 70.62max) MB/s -19%
Asus ExpertBook B5 B5605CCA
Micron 2500 MTFDKBA512QGN
67.7 (16.42min - 67.69max) MB/s -23%
HP EliteBook 8 G1a 16 AI
Micron 3500 MTFDKBA512TGD
64.7 (63.97min - 64.71max) MB/s -26%
Lenovo ThinkPad T16 Gen 5 22AN001WGE
Samsung PM9C1b MZVL8512HFLU-00BLL
62.9 (60.4min - 62.86max) MB/s -28%
Dell XPS 16 Core Ultra X7 358H
 
59.1 (53.74min - 59.08max) MB/s -33%
4k q1 t1 write
Asus ExpertBook B5 B5605CCA
Micron 2500 MTFDKBA512QGN
167.2 (160.9min - 167.23max) MB/s +13%
MSI Venture 16 AI A2HMTG
 
156 (154.1min - 156.01max) MB/s +5%
Dell Pro 5 16 P516265
SanDisk PC SN5100S
148.4 (143.87min - 148.36max) MB/s
Dell XPS 16 Core Ultra X7 358H
 
145.5 (139.46min - 145.49max) MB/s -2%
HP EliteBook 8 G1a 16 AI
Micron 3500 MTFDKBA512TGD
145.3 (139.41min - 145.3max) MB/s -2%
Lenovo ThinkPad T16 Gen 5 22AN001WGE
Samsung PM9C1b MZVL8512HFLU-00BLL
135.8 (121.93min - 135.79max) MB/s -8%
4k q32 t16 read
HP EliteBook 8 G1a 16 AI
Micron 3500 MTFDKBA512TGD
902 (889.61min - 901.61max) MB/s +5%
Dell Pro 5 16 P516265
SanDisk PC SN5100S
857 (811.21min - 857.27max) MB/s
Lenovo ThinkPad T16 Gen 5 22AN001WGE
Samsung PM9C1b MZVL8512HFLU-00BLL
800 (779.99min - 799.67max) MB/s -7%
MSI Venture 16 AI A2HMTG
 
749 (725.2min - 748.69max) MB/s -13%
Dell XPS 16 Core Ultra X7 358H
 
652 (602.16min - 651.54max) MB/s -24%
Asus ExpertBook B5 B5605CCA
Micron 2500 MTFDKBA512QGN
619 (612.02min - 618.83max) MB/s -28%
4k q32 t16 write
HP EliteBook 8 G1a 16 AI
Micron 3500 MTFDKBA512TGD
555 (533.25min - 554.9max) MB/s +12%
MSI Venture 16 AI A2HMTG
 
522 (486.21min - 522.14max) MB/s +5%
Dell Pro 5 16 P516265
SanDisk PC SN5100S
496 (451.35min - 496.31max) MB/s
Asus ExpertBook B5 B5605CCA
Micron 2500 MTFDKBA512QGN
488 (481.29min - 487.52max) MB/s -2%
Dell XPS 16 Core Ultra X7 358H
 
447 (308.53min - 447.08max) MB/s -10%
Lenovo ThinkPad T16 Gen 5 22AN001WGE
Samsung PM9C1b MZVL8512HFLU-00BLL
375 (350.6min - 374.64max) MB/s -24%
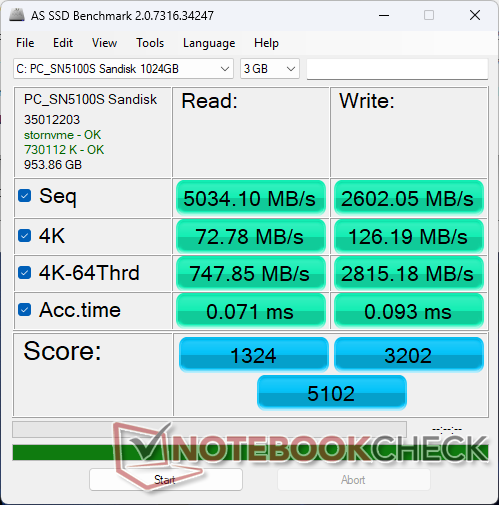
AS SSD
Score Total
HP EliteBook 8 G1a 16 AI
Micron 3500 MTFDKBA512TGD
5911 Points +16%
Dell XPS 16 Core Ultra X7 358H
 
5309 Points +4%
Dell Pro 5 16 P516265
SanDisk PC SN5100S
5102 Points
Asus ExpertBook B5 B5605CCA
Micron 2500 MTFDKBA512QGN
5080 Points 0%
Lenovo ThinkPad T16 Gen 5 22AN001WGE
Samsung PM9C1b MZVL8512HFLU-00BLL
3867 Points -24%
MSI Venture 16 AI A2HMTG
 
3190 Points -37%
Score Read
HP EliteBook 8 G1a 16 AI
Micron 3500 MTFDKBA512TGD
1584 Points +20%
Asus ExpertBook B5 B5605CCA
Micron 2500 MTFDKBA512QGN
1499 Points +13%
Dell XPS 16 Core Ultra X7 358H
 
1423 Points +7%
Dell Pro 5 16 P516265
SanDisk PC SN5100S
1324 Points
MSI Venture 16 AI A2HMTG
 
1262 Points -5%
Lenovo ThinkPad T16 Gen 5 22AN001WGE
Samsung PM9C1b MZVL8512HFLU-00BLL
1125 Points -15%
Score Write
HP EliteBook 8 G1a 16 AI
Micron 3500 MTFDKBA512TGD
3587 Points +12%
Dell XPS 16 Core Ultra X7 358H
 
3277 Points +2%
Dell Pro 5 16 P516265
SanDisk PC SN5100S
3202 Points
Asus ExpertBook B5 B5605CCA
Micron 2500 MTFDKBA512QGN
2964 Points -7%
Lenovo ThinkPad T16 Gen 5 22AN001WGE
Samsung PM9C1b MZVL8512HFLU-00BLL
2232 Points -30%
MSI Venture 16 AI A2HMTG
 
1354 Points -58%
Seq Read
HP EliteBook 8 G1a 16 AI
Micron 3500 MTFDKBA512TGD
5376.02 MB/s +7%
Dell XPS 16 Core Ultra X7 358H
 
5083.41 MB/s +1%
Dell Pro 5 16 P516265
SanDisk PC SN5100S
5034.1 MB/s
Asus ExpertBook B5 B5605CCA
Micron 2500 MTFDKBA512QGN
4886 MB/s -3%
Lenovo ThinkPad T16 Gen 5 22AN001WGE
Samsung PM9C1b MZVL8512HFLU-00BLL
3746 MB/s -26%
MSI Venture 16 AI A2HMTG
 
3129.37 MB/s -38%
Seq Write
HP EliteBook 8 G1a 16 AI
Micron 3500 MTFDKBA512TGD
3708.7 MB/s +43%
Dell Pro 5 16 P516265
SanDisk PC SN5100S
2602.05 MB/s
Dell XPS 16 Core Ultra X7 358H
 
2509.02 MB/s -4%
Lenovo ThinkPad T16 Gen 5 22AN001WGE
Samsung PM9C1b MZVL8512HFLU-00BLL
2097 MB/s -19%
Asus ExpertBook B5 B5605CCA
Micron 2500 MTFDKBA512QGN
1608 MB/s -38%
MSI Venture 16 AI A2HMTG
 
1302.17 MB/s -50%
4K Read
Dell Pro 5 16 P516265
SanDisk PC SN5100S
72.78 MB/s
MSI Venture 16 AI A2HMTG
 
68.7 MB/s -6%
Asus ExpertBook B5 B5605CCA
Micron 2500 MTFDKBA512QGN
63.3 MB/s -13%
HP EliteBook 8 G1a 16 AI
Micron 3500 MTFDKBA512TGD
61.16 MB/s -16%
Lenovo ThinkPad T16 Gen 5 22AN001WGE
Samsung PM9C1b MZVL8512HFLU-00BLL
58.7 MB/s -19%
Dell XPS 16 Core Ultra X7 358H
 
52.53 MB/s -28%
4K Write
Asus ExpertBook B5 B5605CCA
Micron 2500 MTFDKBA512QGN
245 MB/s +94%
MSI Venture 16 AI A2HMTG
 
210.64 MB/s +67%
HP EliteBook 8 G1a 16 AI
Micron 3500 MTFDKBA512TGD
194.49 MB/s +54%
Lenovo ThinkPad T16 Gen 5 22AN001WGE
Samsung PM9C1b MZVL8512HFLU-00BLL
156.9 MB/s +24%
Dell Pro 5 16 P516265
SanDisk PC SN5100S
126.19 MB/s
Dell XPS 16 Core Ultra X7 358H
 
125.58 MB/s 0%
4K-64 Read
HP EliteBook 8 G1a 16 AI
Micron 3500 MTFDKBA512TGD
985.17 MB/s +32%
Asus ExpertBook B5 B5605CCA
Micron 2500 MTFDKBA512QGN
947 MB/s +27%
MSI Venture 16 AI A2HMTG
 
880.27 MB/s +18%
Dell XPS 16 Core Ultra X7 358H
 
862.49 MB/s +15%
Dell Pro 5 16 P516265
SanDisk PC SN5100S
747.85 MB/s
Lenovo ThinkPad T16 Gen 5 22AN001WGE
Samsung PM9C1b MZVL8512HFLU-00BLL
692 MB/s -7%
4K-64 Write
HP EliteBook 8 G1a 16 AI
Micron 3500 MTFDKBA512TGD
3022.06 MB/s +7%
Dell XPS 16 Core Ultra X7 358H
 
2900.39 MB/s +3%
Dell Pro 5 16 P516265
SanDisk PC SN5100S
2815.18 MB/s
Asus ExpertBook B5 B5605CCA
Micron 2500 MTFDKBA512QGN
2559 MB/s -9%
Lenovo ThinkPad T16 Gen 5 22AN001WGE
Samsung PM9C1b MZVL8512HFLU-00BLL
1865 MB/s -34%
MSI Venture 16 AI A2HMTG
 
1013.6 MB/s -64%
Access Time Read
MSI Venture 16 AI A2HMTG
 
0.125 ms * -76%
Asus ExpertBook B5 B5605CCA
Micron 2500 MTFDKBA512QGN
0.084 ms * -18%
HP EliteBook 8 G1a 16 AI
Micron 3500 MTFDKBA512TGD
0.078 ms * -10%
Dell Pro 5 16 P516265
SanDisk PC SN5100S
0.071 ms *
Dell XPS 16 Core Ultra X7 358H
 
0.059 ms * +17%
Lenovo ThinkPad T16 Gen 5 22AN001WGE
Samsung PM9C1b MZVL8512HFLU-00BLL
0.038 ms * +46%
Access Time Write
Dell Pro 5 16 P516265
SanDisk PC SN5100S
0.093 ms *
Dell XPS 16 Core Ultra X7 358H
 
0.082 ms * +12%
HP EliteBook 8 G1a 16 AI
Micron 3500 MTFDKBA512TGD
0.066 ms * +29%
MSI Venture 16 AI A2HMTG
 
0.05 ms * +46%
Lenovo ThinkPad T16 Gen 5 22AN001WGE
Samsung PM9C1b MZVL8512HFLU-00BLL
0.024 ms * +74%
Asus ExpertBook B5 B5605CCA
Micron 2500 MTFDKBA512QGN
0.016 ms * +83%

* ... más pequeño es mejor

Limitación del disco: bucle de lectura de DiskSpd, profundidad de cola 8

0145290435580725870101511601305145015951740188520302175232024652610275529003045319033353480362537703915406042054350449546404785493050755220536555105655580059456090623563806525667068156960Tooltip
Dell Pro 5 16 P516265 SanDisk PC SN5100S; diskspd 2.0.17 f: Ø7051 (6192.26-7076.84) MB/s
Lenovo ThinkPad T16 Gen 5 22AN001WGE Samsung PM9C1b MZVL8512HFLU-00BLL; diskspd 2.0.17 f: Ø4669 (4117.49-4849.24) MB/s

Rendimiento de la GPU

Perfil de potenciaPuntuación de gráficosPuntuación de físicaPuntuación combinada
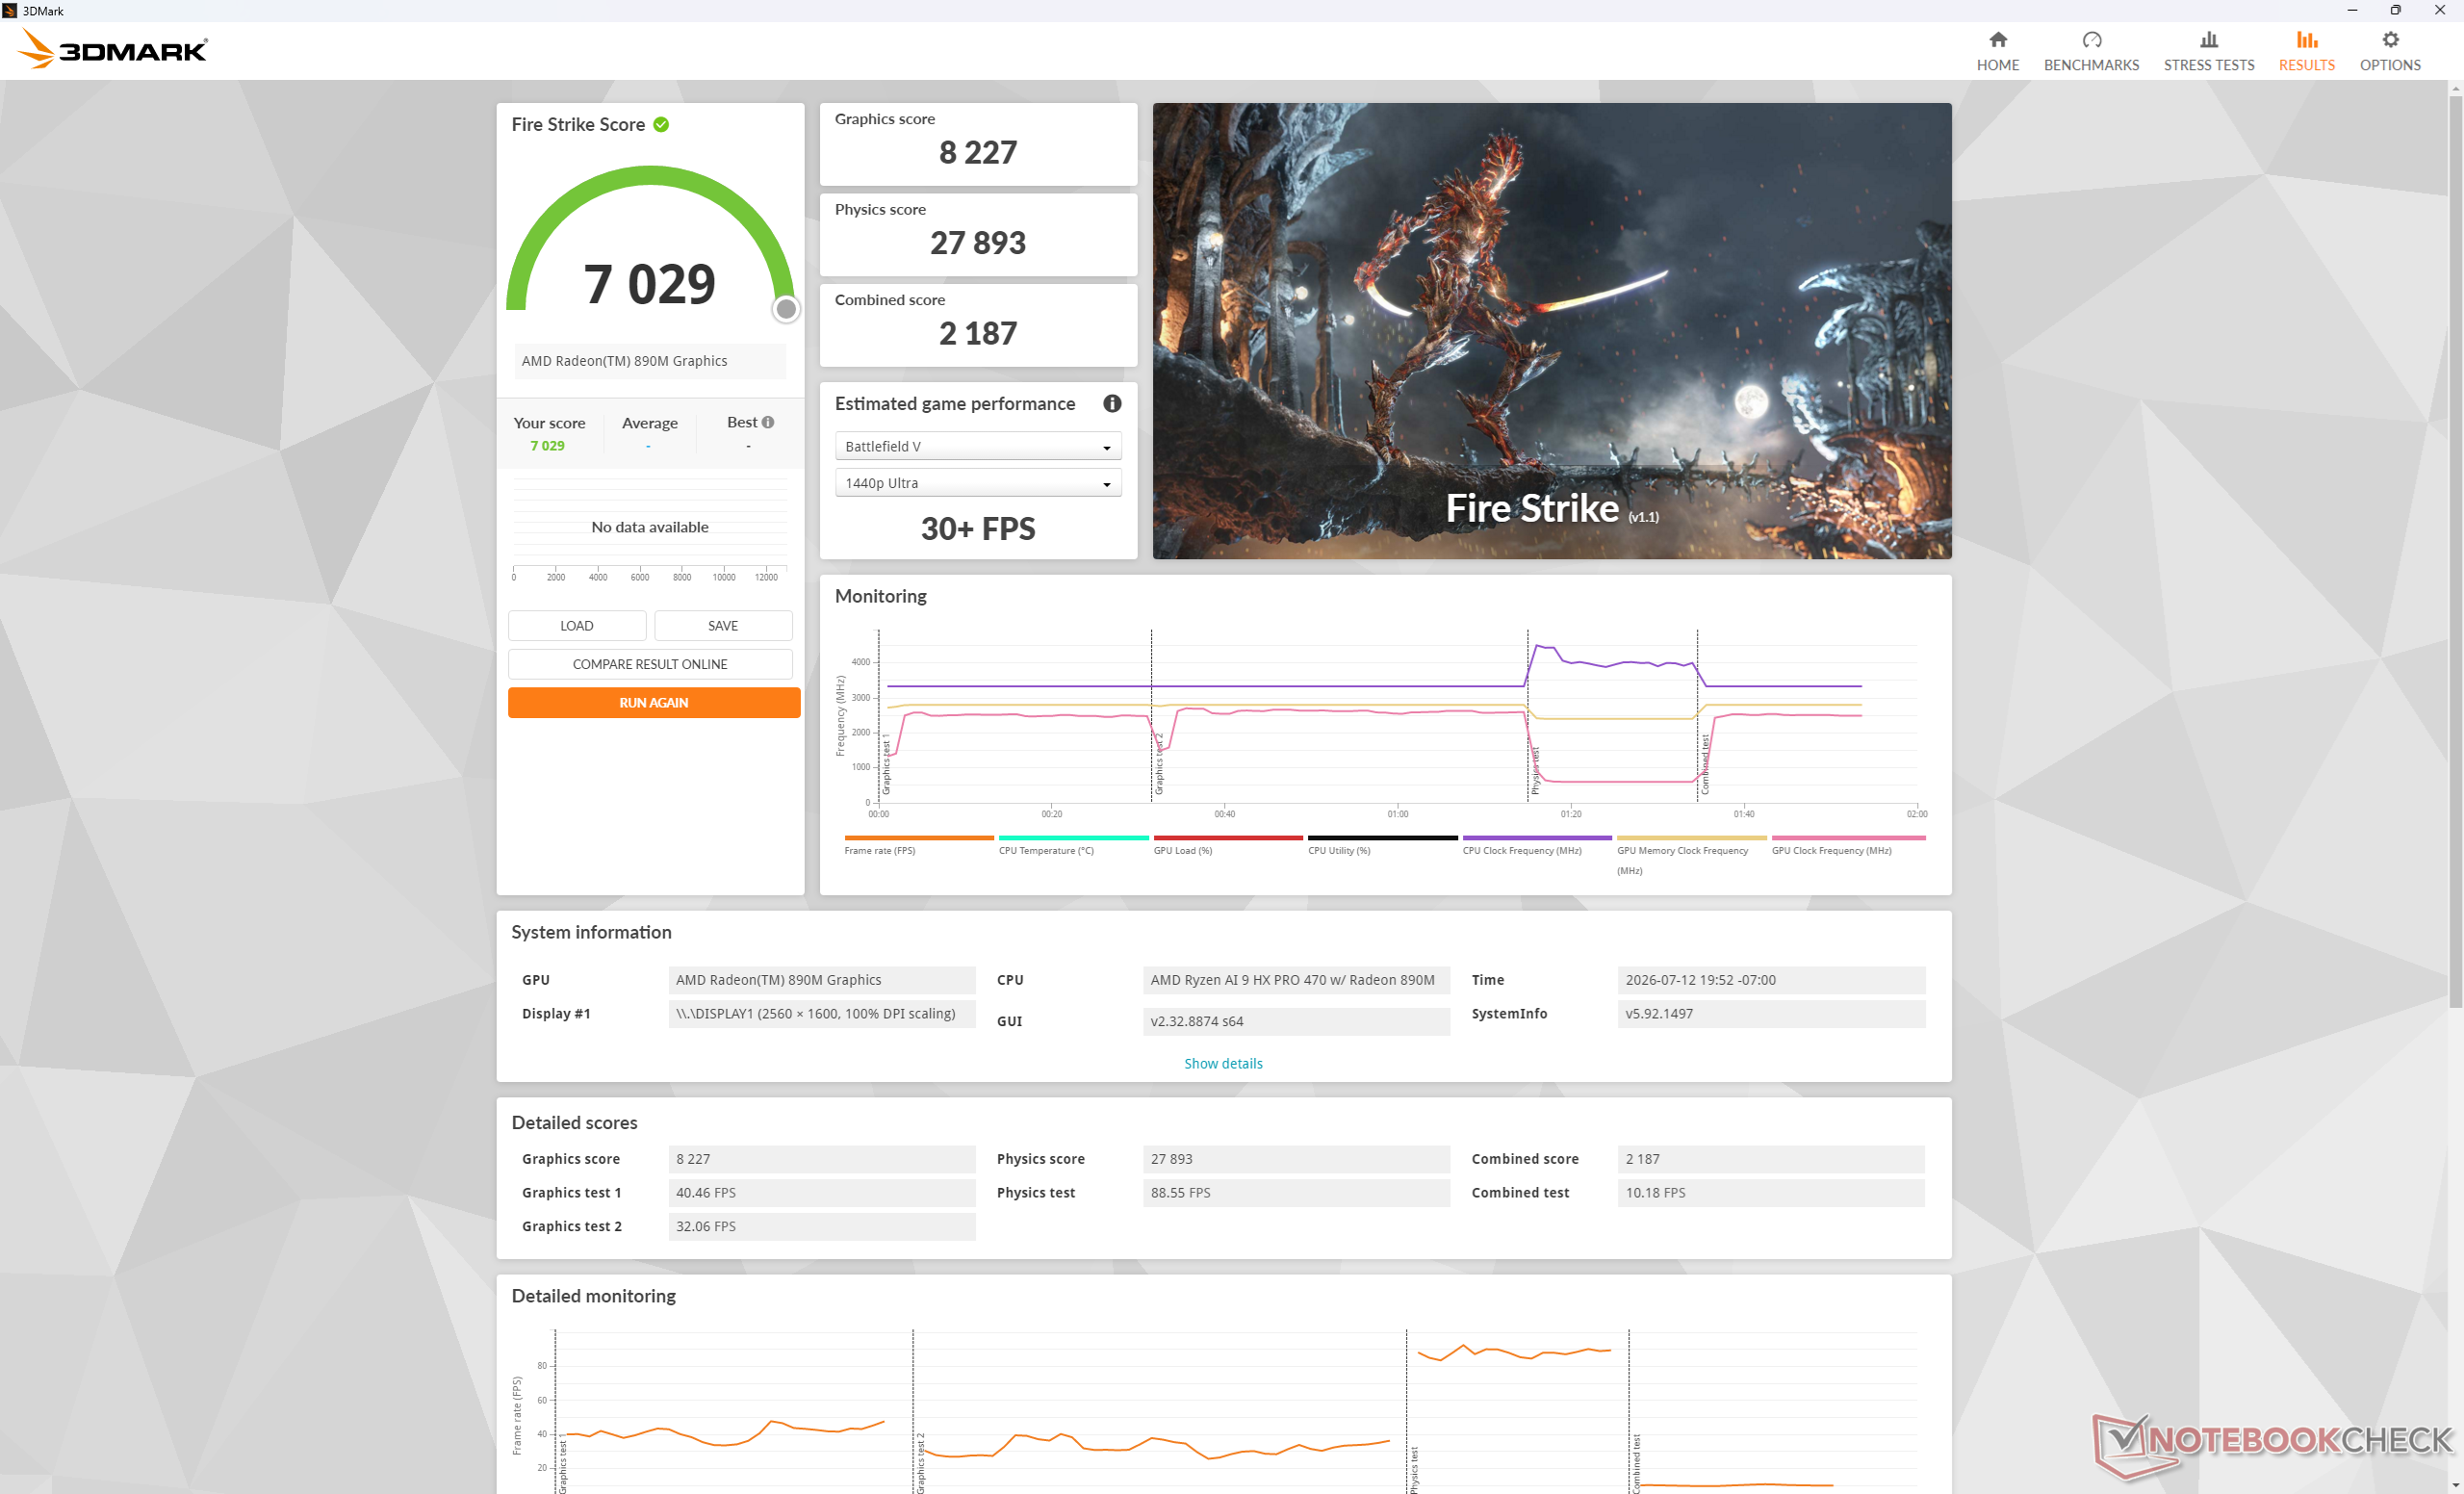
Modo de rendimiento822727 8932187
Modo equilibrado6746 (-18 %)27 923 (-0 %)2120 (-0 %)
Alimentación por batería6666 (-19 %)27 029 (-3 %)2159 (-0 %)
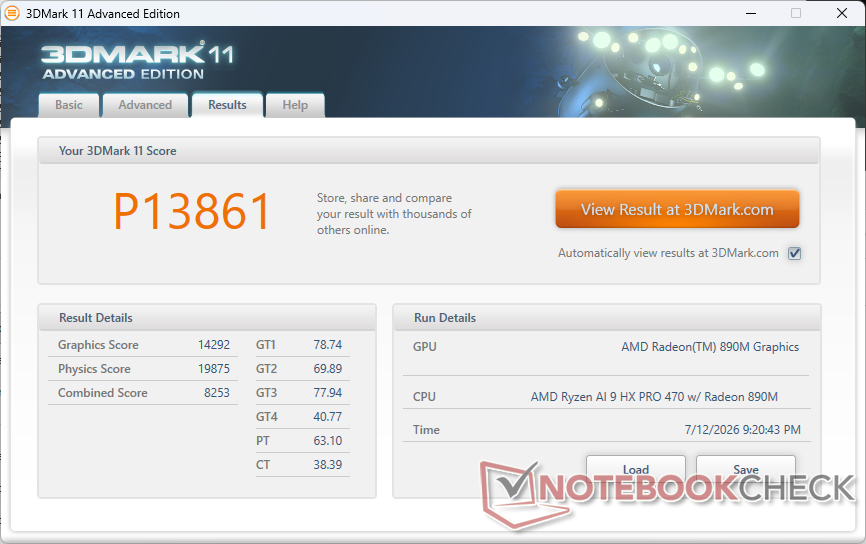
3DMark 11
3DMark 11
Fire Strike
Fire Strike
Time Spy
Time Spy
Speed Way
Speed Way
3DMark Performance rating - Percent
Lenovo ThinkPad P16 Gen 3
NVIDIA RTX PRO 3000 Blackwell Generation Laptop, Intel Core Ultra 9 285HX
100 pt
Lenovo Pro 9 16IPH11
NVIDIA GeForce RTX 5060 Laptop, Intel Core Ultra 9 386H
81.7 pt
Lenovo ThinkPad P1 Gen 8
NVIDIA RTX PRO 2000 Blackwell Generation Laptop, Intel Core Ultra 7 255H
71.9 pt
Lenovo Yoga Pro 9 16IAH10 RTX 5050
NVIDIA GeForce RTX 5050 Laptop, Intel Core Ultra 9 285H
64.6 pt
Dell XPS 16 Core Ultra X7 358H
Intel Arc B390 12 Xe3 Panther Lake iGPU, Intel Core Ultra X7 358H
45.3 pt
Medio AMD Radeon 890M
 
25 pt
Dell Pro 5 16 P516265
AMD Radeon 890M, AMD Ryzen AI 9 HX PRO 470
23.6 pt
MSI Venture 16 AI A2HMTG
Intel Arc Graphics 140T, Intel Core Ultra 7 255H
22.9 pt
HP EliteBook 8 G1a 16 AI
AMD Radeon 860M, AMD Ryzen AI 7 PRO 350
19.9 pt
Asus ExpertBook B5 B5605CCA
Intel Arc Graphics 130T, Intel Core Ultra 5 225H
16.8 pt
Lenovo ThinkPad L16 Gen 2 21SC0029GE
AMD Radeon 740M, AMD Ryzen 5 PRO 215
12.2 pt
Lenovo ThinkPad T16 Gen 5 22AN001WGE
AMD Radeon 740M, AMD Ryzen 5 PRO 215
9.5 pt
3DMark 11 - 1280x720 Performance GPU
Lenovo ThinkPad P16 Gen 3
NVIDIA RTX PRO 3000 Blackwell Generation Laptop, Intel Core Ultra 9 285HX
49410 Points +246%
Lenovo Pro 9 16IPH11
NVIDIA GeForce RTX 5060 Laptop, Intel Core Ultra 9 386H
39324 Points +175%
Lenovo ThinkPad P1 Gen 8
NVIDIA RTX PRO 2000 Blackwell Generation Laptop, Intel Core Ultra 7 255H
35003 Points +145%
Lenovo Yoga Pro 9 16IAH10 RTX 5050
NVIDIA GeForce RTX 5050 Laptop, Intel Core Ultra 9 285H
31191 Points +118%
Dell XPS 16 Core Ultra X7 358H
Intel Arc B390 12 Xe3 Panther Lake iGPU, Intel Core Ultra X7 358H
18308 Points +28%
Medio AMD Radeon 890M
  (8947 - 17483, n=29)
14692 Points +3%
Dell Pro 5 16 P516265
AMD Radeon 890M, AMD Ryzen AI 9 HX PRO 470
14292 Points
MSI Venture 16 AI A2HMTG
Intel Arc Graphics 140T, Intel Core Ultra 7 255H
11396 Points -20%
HP EliteBook 8 G1a 16 AI
AMD Radeon 860M, AMD Ryzen AI 7 PRO 350
10802 Points -24%
Asus ExpertBook B5 B5605CCA
Intel Arc Graphics 130T, Intel Core Ultra 5 225H
9106 Points -36%
Lenovo ThinkPad L16 Gen 2 21SC0029GE
AMD Radeon 740M, AMD Ryzen 5 PRO 215
6929 Points -52%
Lenovo ThinkPad T16 Gen 5 22AN001WGE
AMD Radeon 740M, AMD Ryzen 5 PRO 215
5519 Points -61%
3DMark
1920x1080 Fire Strike Graphics
Lenovo ThinkPad P16 Gen 3
NVIDIA RTX PRO 3000 Blackwell Generation Laptop, Intel Core Ultra 9 285HX
36897 Points +348%
Lenovo Pro 9 16IPH11
NVIDIA GeForce RTX 5060 Laptop, Intel Core Ultra 9 386H
31366 Points +281%
Lenovo ThinkPad P1 Gen 8
NVIDIA RTX PRO 2000 Blackwell Generation Laptop, Intel Core Ultra 7 255H
27781 Points +238%
Lenovo Yoga Pro 9 16IAH10 RTX 5050
NVIDIA GeForce RTX 5050 Laptop, Intel Core Ultra 9 285H
25400 Points +209%
Dell XPS 16 Core Ultra X7 358H
Intel Arc B390 12 Xe3 Panther Lake iGPU, Intel Core Ultra X7 358H
17018 Points +107%
Medio AMD Radeon 890M
  (5173 - 10037, n=29)
8744 Points +6%
Dell Pro 5 16 P516265
AMD Radeon 890M, AMD Ryzen AI 9 HX PRO 470
8227 Points
MSI Venture 16 AI A2HMTG
Intel Arc Graphics 140T, Intel Core Ultra 7 255H
7691 Points -7%
HP EliteBook 8 G1a 16 AI
AMD Radeon 860M, AMD Ryzen AI 7 PRO 350
7131 Points -13%
Asus ExpertBook B5 B5605CCA
Intel Arc Graphics 130T, Intel Core Ultra 5 225H
5173 Points -37%
Lenovo ThinkPad L16 Gen 2 21SC0029GE
AMD Radeon 740M, AMD Ryzen 5 PRO 215
4625 Points -44%
Lenovo ThinkPad T16 Gen 5 22AN001WGE
AMD Radeon 740M, AMD Ryzen 5 PRO 215
3560 Points -57%
2560x1440 Time Spy Graphics
Lenovo ThinkPad P16 Gen 3
NVIDIA RTX PRO 3000 Blackwell Generation Laptop, Intel Core Ultra 9 285HX
14875 Points +396%
Lenovo Pro 9 16IPH11
NVIDIA GeForce RTX 5060 Laptop, Intel Core Ultra 9 386H
11755 Points +292%
Lenovo ThinkPad P1 Gen 8
NVIDIA RTX PRO 2000 Blackwell Generation Laptop, Intel Core Ultra 7 255H
10230 Points +241%
Lenovo Yoga Pro 9 16IAH10 RTX 5050
NVIDIA GeForce RTX 5050 Laptop, Intel Core Ultra 9 285H
9122 Points +204%
Dell XPS 16 Core Ultra X7 358H
Intel Arc B390 12 Xe3 Panther Lake iGPU, Intel Core Ultra X7 358H
6972 Points +132%
MSI Venture 16 AI A2HMTG
Intel Arc Graphics 140T, Intel Core Ultra 7 255H
3318 Points +11%
Medio AMD Radeon 890M
  (1918 - 3750, n=30)
3255 Points +9%
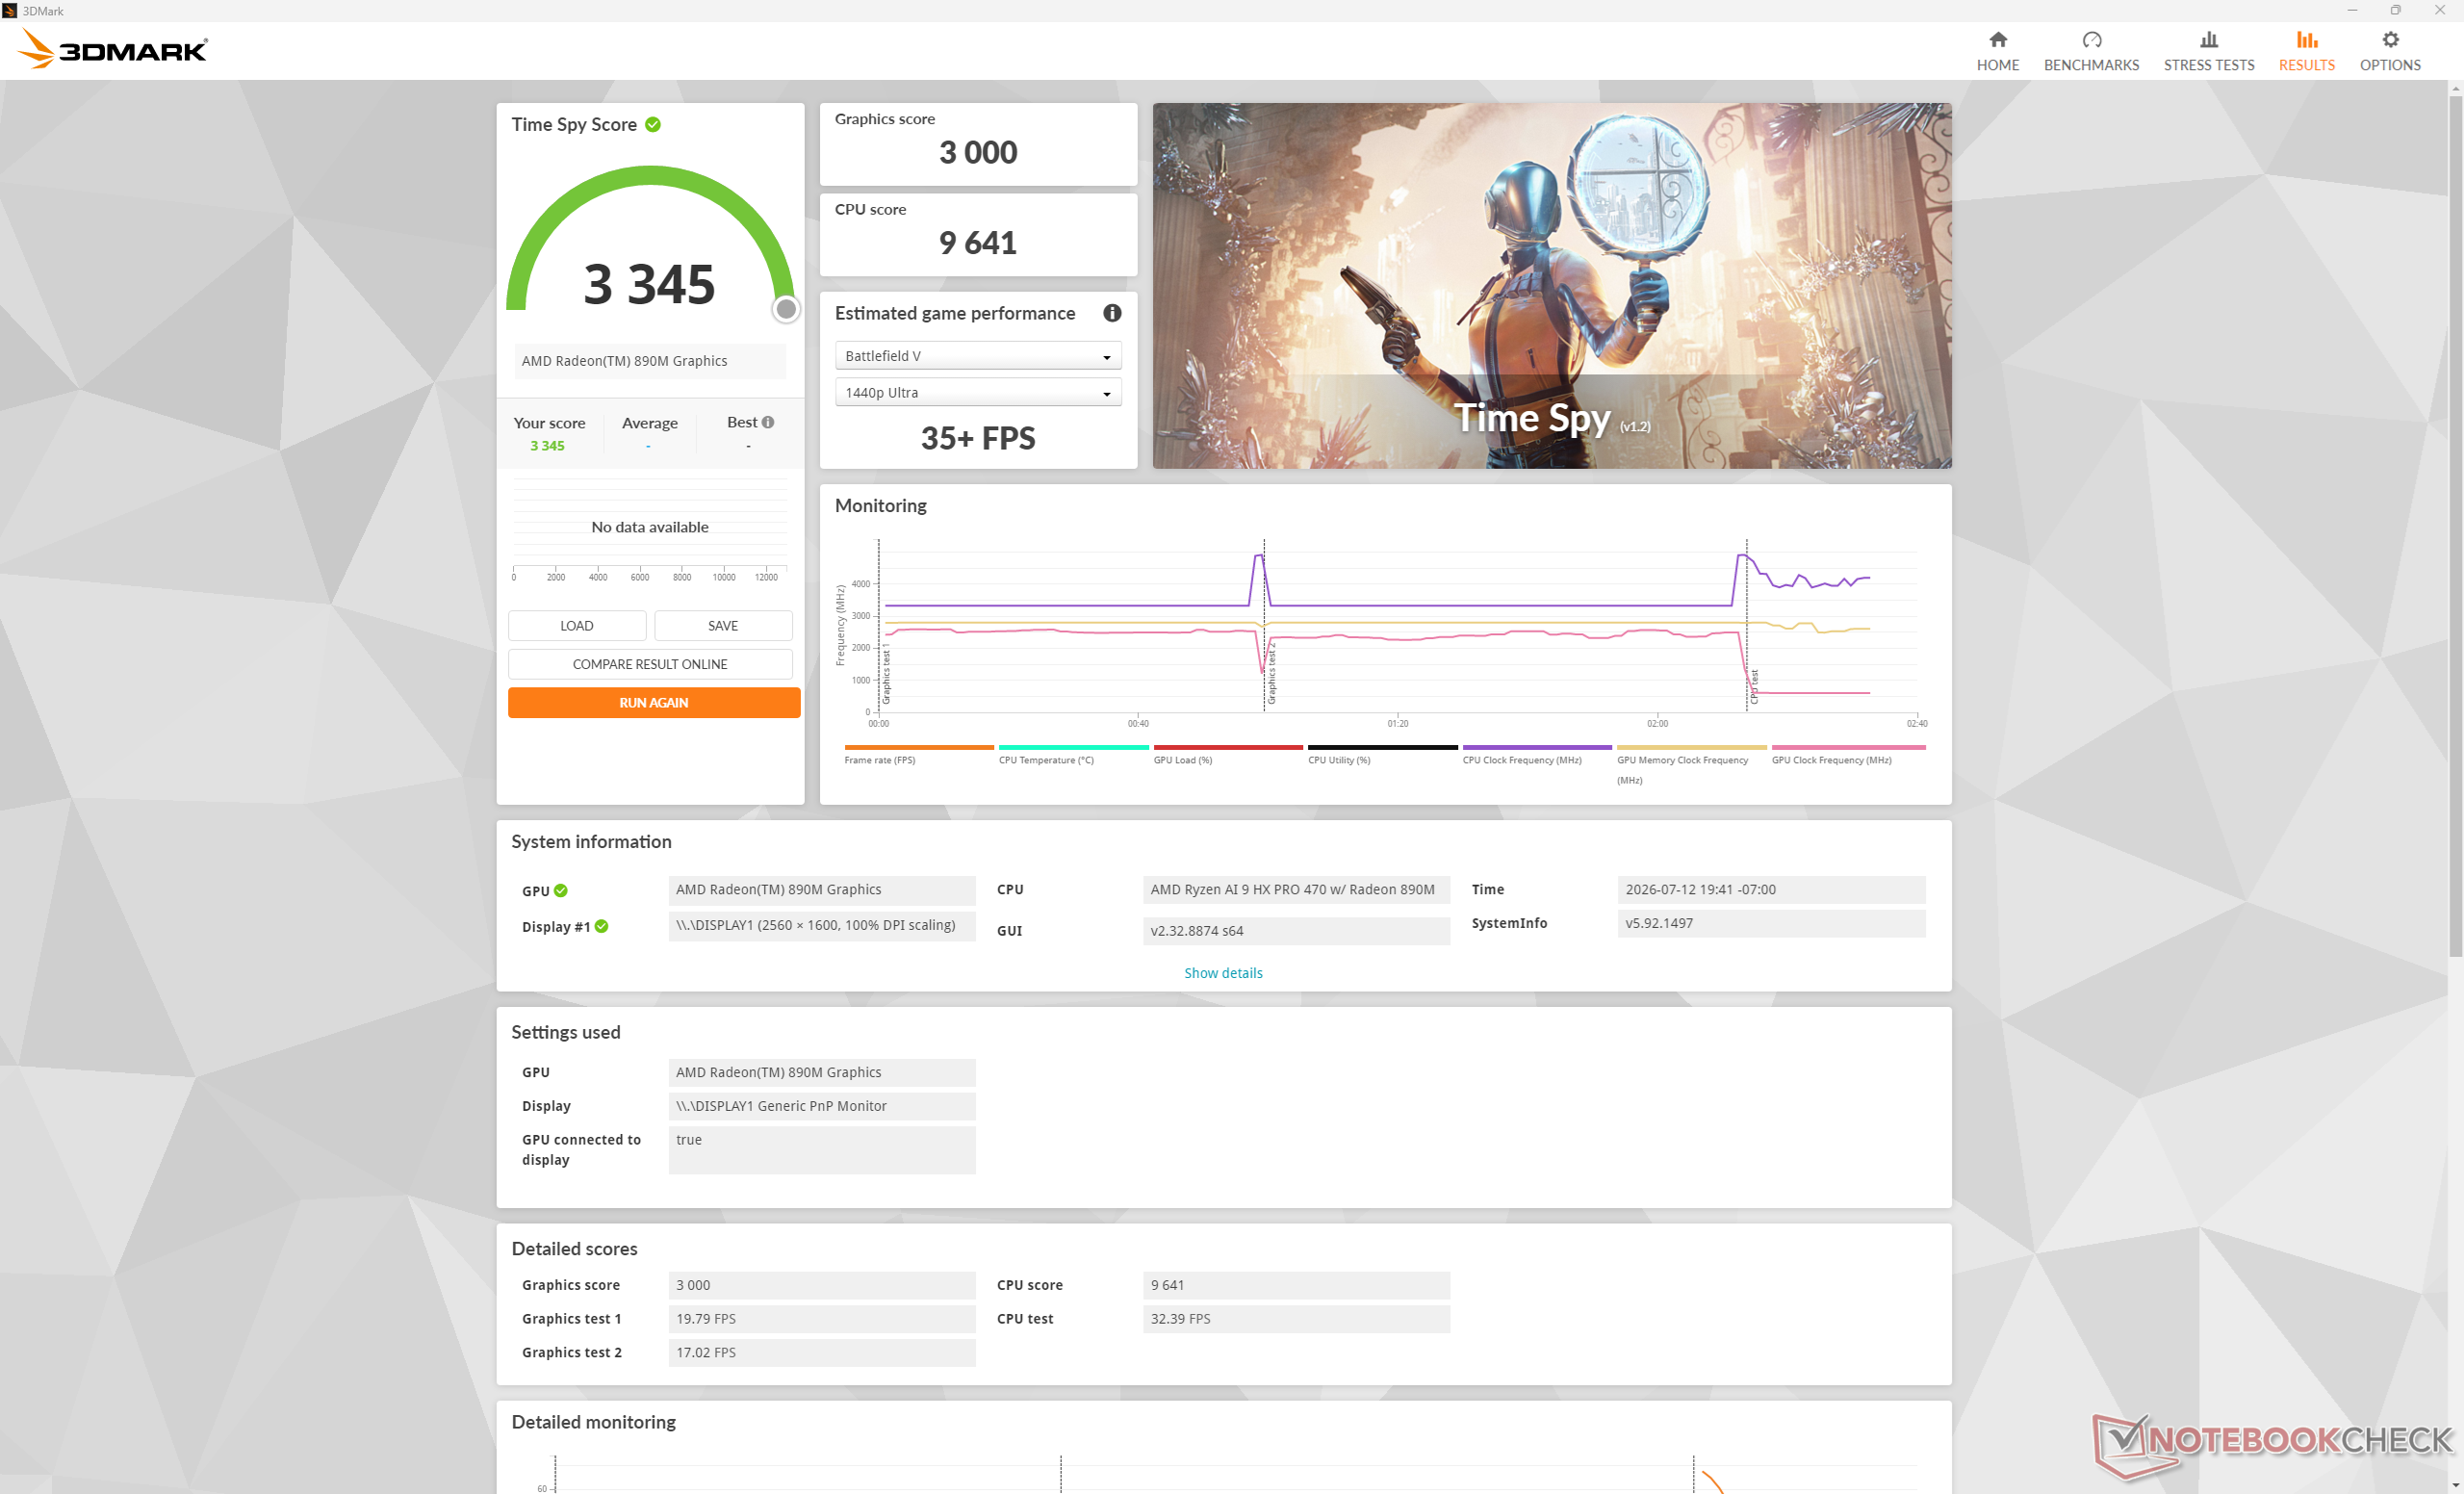
Dell Pro 5 16 P516265
AMD Radeon 890M, AMD Ryzen AI 9 HX PRO 470
3000 Points
HP EliteBook 8 G1a 16 AI
AMD Radeon 860M, AMD Ryzen AI 7 PRO 350
2674 Points -11%
Asus ExpertBook B5 B5605CCA
Intel Arc Graphics 130T, Intel Core Ultra 5 225H
2402 Points -20%
Lenovo ThinkPad L16 Gen 2 21SC0029GE
AMD Radeon 740M, AMD Ryzen 5 PRO 215
1527 Points -49%
Lenovo ThinkPad T16 Gen 5 22AN001WGE
AMD Radeon 740M, AMD Ryzen 5 PRO 215
1190 Points -60%
2560x1440 Time Spy Score
Lenovo ThinkPad P16 Gen 3
NVIDIA RTX PRO 3000 Blackwell Generation Laptop, Intel Core Ultra 9 285HX
14579 Points +336%
Lenovo Pro 9 16IPH11
NVIDIA GeForce RTX 5060 Laptop, Intel Core Ultra 9 386H
12142 Points +263%
Lenovo ThinkPad P1 Gen 8
NVIDIA RTX PRO 2000 Blackwell Generation Laptop, Intel Core Ultra 7 255H
10595 Points +217%
Lenovo Yoga Pro 9 16IAH10 RTX 5050
NVIDIA GeForce RTX 5050 Laptop, Intel Core Ultra 9 285H
9519 Points +185%
Dell XPS 16 Core Ultra X7 358H
Intel Arc B390 12 Xe3 Panther Lake iGPU, Intel Core Ultra X7 358H
7436 Points +122%
MSI Venture 16 AI A2HMTG
Intel Arc Graphics 140T, Intel Core Ultra 7 255H
3688 Points +10%
Medio AMD Radeon 890M
  (2168 - 4163, n=29)
3605 Points +8%
Dell Pro 5 16 P516265
AMD Radeon 890M, AMD Ryzen AI 9 HX PRO 470
3345 Points
HP EliteBook 8 G1a 16 AI
AMD Radeon 860M, AMD Ryzen AI 7 PRO 350
2996 Points -10%
Asus ExpertBook B5 B5605CCA
Intel Arc Graphics 130T, Intel Core Ultra 5 225H
2697 Points -19%
Lenovo ThinkPad L16 Gen 2 21SC0029GE
AMD Radeon 740M, AMD Ryzen 5 PRO 215
1722 Points -49%
Lenovo ThinkPad T16 Gen 5 22AN001WGE
AMD Radeon 740M, AMD Ryzen 5 PRO 215
1354 Points -60%
3DMark 11 Performance
13861 puntos
3DMark Cloud Gate Standard Score
35749 puntos
3DMark Fire Strike Score
7029 puntos
3DMark Time Spy Score
3345 puntos
ayuda
Blender
v3.3 Classroom OPTIX/RTX
Lenovo Yoga Pro 9 16IAH10 RTX 5050
NVIDIA GeForce RTX 5050 Laptop, Intel Core Ultra 9 285H
24 Seconds *
Lenovo ThinkPad P1 Gen 8
NVIDIA RTX PRO 2000 Blackwell Generation Laptop, Intel Core Ultra 7 255H
22 Seconds *
Lenovo Pro 9 16IPH11
NVIDIA GeForce RTX 5060 Laptop, Intel Core Ultra 9 386H
20 Seconds *
Lenovo ThinkPad P16 Gen 3
NVIDIA RTX PRO 3000 Blackwell Generation Laptop, Intel Core Ultra 9 285HX
16 Seconds *
v3.3 Classroom CUDA
Lenovo Yoga Pro 9 16IAH10 RTX 5050
NVIDIA GeForce RTX 5050 Laptop, Intel Core Ultra 9 285H
49 Seconds *
Lenovo ThinkPad P1 Gen 8
NVIDIA RTX PRO 2000 Blackwell Generation Laptop, Intel Core Ultra 7 255H
42 Seconds *
Lenovo Pro 9 16IPH11
NVIDIA GeForce RTX 5060 Laptop, Intel Core Ultra 9 386H
40 Seconds *
Lenovo ThinkPad P16 Gen 3
NVIDIA RTX PRO 3000 Blackwell Generation Laptop, Intel Core Ultra 9 285HX
28 Seconds *
v3.3 Classroom CPU
Lenovo ThinkPad L16 Gen 2 21SC0029GE
AMD Radeon 740M, AMD Ryzen 5 PRO 215
555 Seconds * -113%
Lenovo ThinkPad T16 Gen 5 22AN001WGE
AMD Radeon 740M, AMD Ryzen 5 PRO 215
510 Seconds * -95%
Asus ExpertBook B5 B5605CCA
Intel Arc Graphics 130T, Intel Core Ultra 5 225H
358 Seconds * -37%
Dell XPS 16 Core Ultra X7 358H
Intel Arc B390 12 Xe3 Panther Lake iGPU, Intel Core Ultra X7 358H
328 Seconds * -26%
HP EliteBook 8 G1a 16 AI
AMD Radeon 860M, AMD Ryzen AI 7 PRO 350
322 Seconds * -23%
MSI Venture 16 AI A2HMTG
Intel Arc Graphics 140T, Intel Core Ultra 7 255H
307 Seconds * -18%
Lenovo ThinkPad P1 Gen 8
NVIDIA RTX PRO 2000 Blackwell Generation Laptop, Intel Core Ultra 7 255H
273 Seconds * -5%
Medio AMD Radeon 890M
  (211 - 475, n=29)
266 Seconds * -2%
Dell Pro 5 16 P516265
AMD Radeon 890M, AMD Ryzen AI 9 HX PRO 470
261 Seconds *
Lenovo Pro 9 16IPH11
NVIDIA GeForce RTX 5060 Laptop, Intel Core Ultra 9 386H
260 Seconds * -0%
Lenovo Yoga Pro 9 16IAH10 RTX 5050
NVIDIA GeForce RTX 5050 Laptop, Intel Core Ultra 9 285H
255 Seconds * +2%
Lenovo ThinkPad P16 Gen 3
NVIDIA RTX PRO 3000 Blackwell Generation Laptop, Intel Core Ultra 9 285HX
189 Seconds * +28%
v3.3 Classroom oneAPI/Intel
MSI Venture 16 AI A2HMTG
Intel Arc Graphics 140T, Intel Core Ultra 7 255H
157 Seconds *
Dell XPS 16 Core Ultra X7 358H
Intel Arc B390 12 Xe3 Panther Lake iGPU, Intel Core Ultra X7 358H
105 Seconds *
v4.3 Barbershop CPU
Dell XPS 16 Core Ultra X7 358H
Intel Arc B390 12 Xe3 Panther Lake iGPU, Intel Core Ultra X7 358H
1662 Seconds * -24%
HP EliteBook 8 G1a 16 AI
AMD Radeon 860M, AMD Ryzen AI 7 PRO 350
1651 Seconds * -24%
MSI Venture 16 AI A2HMTG
Intel Arc Graphics 140T, Intel Core Ultra 7 255H
1510 Seconds * -13%
Lenovo ThinkPad P1 Gen 8
NVIDIA RTX PRO 2000 Blackwell Generation Laptop, Intel Core Ultra 7 255H
1425 Seconds * -7%
Lenovo Yoga Pro 9 16IAH10 RTX 5050
NVIDIA GeForce RTX 5050 Laptop, Intel Core Ultra 9 285H
1355 Seconds * -1%
Dell Pro 5 16 P516265
AMD Radeon 890M, AMD Ryzen AI 9 HX PRO 470
1336 Seconds *
Lenovo Pro 9 16IPH11
NVIDIA GeForce RTX 5060 Laptop, Intel Core Ultra 9 386H
1294 Seconds * +3%
Medio AMD Radeon 890M
  (1101 - 1532, n=15)
1258 Seconds * +6%

* ... más pequeño es mejor

Performance rating - Percent
Dell XPS 16 Core Ultra X7 358H
Intel Core Ultra X7 358H, Intel Arc B390 12 Xe3 Panther Lake iGPU
98.5 pt
Dell Pro 5 16 P516265
AMD Ryzen AI 9 HX PRO 470, AMD Radeon 890M
66.2 pt
MSI Venture 16 AI A2HMTG
Intel Core Ultra 7 255H, Intel Arc Graphics 140T
57.6 pt
HP EliteBook 8 G1a 16 AI
AMD Ryzen AI 7 PRO 350, AMD Radeon 860M
55.6 pt
Asus ExpertBook B5 B5605CCA
Intel Core Ultra 5 225H, Intel Arc Graphics 130T
42.4 pt
Lenovo ThinkPad T16 Gen 5 22AN001WGE
AMD Ryzen 5 PRO 215, AMD Radeon 740M
29.9 pt
Cyberpunk 2077 - 1920x1080 Ultra Preset (FSR off)
Dell XPS 16 Core Ultra X7 358H
Intel Core Ultra X7 358H, Intel Arc B390 12 Xe3 Panther Lake iGPU
48.7 (40min, 37.6P1) fps +92%
Dell Pro 5 16 P516265
AMD Ryzen AI 9 HX PRO 470, AMD Radeon 890M
25.3 (20.9min, 18.5P1) fps
MSI Venture 16 AI A2HMTG
Intel Core Ultra 7 255H, Intel Arc Graphics 140T
23 (20min, 18.7P1) fps -9%
HP EliteBook 8 G1a 16 AI
AMD Ryzen AI 7 PRO 350, AMD Radeon 860M
17.9 (14.5min, 10.6P1) fps -29%
Asus ExpertBook B5 B5605CCA
Intel Core Ultra 5 225H, Intel Arc Graphics 130T
15.6 (13.6min) fps -38%
Lenovo ThinkPad T16 Gen 5 22AN001WGE
AMD Ryzen 5 PRO 215, AMD Radeon 740M
9.53 (7.88min) fps -62%
Baldur's Gate 3 - 1920x1080 Ultra Preset AA:T
Dell XPS 16 Core Ultra X7 358H
Intel Core Ultra X7 358H, Intel Arc B390 12 Xe3 Panther Lake iGPU
54.3 (48.6min, 49.6P0.1, 51P1) fps +75%
Dell Pro 5 16 P516265
AMD Ryzen AI 9 HX PRO 470, AMD Radeon 890M
31.1 (24.4min, 24.7P0.1, 28.8P1) fps
Asus ExpertBook B5 B5605CCA
Intel Core Ultra 5 225H, Intel Arc Graphics 130T
27.2 fps -13%
MSI Venture 16 AI A2HMTG
Intel Core Ultra 7 255H, Intel Arc Graphics 140T
26.1 (23.5min, 23.5P0.1, 24.2P1) fps -16%
HP EliteBook 8 G1a 16 AI
AMD Ryzen AI 7 PRO 350, AMD Radeon 860M
22.5 fps -28%
Lenovo ThinkPad T16 Gen 5 22AN001WGE
AMD Ryzen 5 PRO 215, AMD Radeon 740M
10.6 (9.46min, 9.46P0.1, 9.64P1) fps -66%
GTA V - 1920x1080 Highest AA:4xMSAA + FX AF:16x
Dell XPS 16 Core Ultra X7 358H
Intel Core Ultra X7 358H, Intel Arc B390 12 Xe3 Panther Lake iGPU
45.2 (6.18min, 34.5P1) fps +50%
Dell Pro 5 16 P516265
AMD Ryzen AI 9 HX PRO 470, AMD Radeon 890M
30.1 (3.99min, 20.8P1) fps
HP EliteBook 8 G1a 16 AI
AMD Ryzen AI 7 PRO 350, AMD Radeon 860M
25.1 (4.65min, 17.5P1) fps -17%
MSI Venture 16 AI A2HMTG
Intel Core Ultra 7 255H, Intel Arc Graphics 140T
16.7 (7.28min, 12.8P1) fps -45%
Lenovo ThinkPad T16 Gen 5 22AN001WGE
AMD Ryzen 5 PRO 215, AMD Radeon 740M
11.7 (4.5min, 8.06P1) fps -61%
Asus ExpertBook B5 B5605CCA
Intel Core Ultra 5 225H, Intel Arc Graphics 130T
9.75 (6.37min, 7.46P1) fps -68%
Final Fantasy XV Benchmark - 1920x1080 High Quality
Dell XPS 16 Core Ultra X7 358H
Intel Core Ultra X7 358H, Intel Arc B390 12 Xe3 Panther Lake iGPU
56.2 fps +91%
Dell Pro 5 16 P516265
AMD Ryzen AI 9 HX PRO 470, AMD Radeon 890M
29.4 fps
MSI Venture 16 AI A2HMTG
Intel Core Ultra 7 255H, Intel Arc Graphics 140T
26 fps -12%
HP EliteBook 8 G1a 16 AI
AMD Ryzen AI 7 PRO 350, AMD Radeon 860M
23.9 fps -19%
Asus ExpertBook B5 B5605CCA
Intel Core Ultra 5 225H, Intel Arc Graphics 130T
18.8 fps -36%
Lenovo ThinkPad T16 Gen 5 22AN001WGE
AMD Ryzen 5 PRO 215, AMD Radeon 740M
12.9 fps -56%
Strange Brigade - 1920x1080 ultra AA:ultra AF:16
Dell XPS 16 Core Ultra X7 358H
Intel Core Ultra X7 358H, Intel Arc B390 12 Xe3 Panther Lake iGPU
90.6 (24.7min, 39.3P1) fps +89%
MSI Venture 16 AI A2HMTG
Intel Core Ultra 7 255H, Intel Arc Graphics 140T
50.1 (34.9min, 40.2P1) fps +5%
Dell Pro 5 16 P516265
AMD Ryzen AI 9 HX PRO 470, AMD Radeon 890M
47.9 (31.9min, 36.9P1) fps
HP EliteBook 8 G1a 16 AI
AMD Ryzen AI 7 PRO 350, AMD Radeon 860M
40 (19.2min, 25.6P1) fps -16%
Asus ExpertBook B5 B5605CCA
Intel Core Ultra 5 225H, Intel Arc Graphics 130T
29.9 (12.8min, 20P1) fps -38%
Lenovo ThinkPad T16 Gen 5 22AN001WGE
AMD Ryzen 5 PRO 215, AMD Radeon 740M
21 (13.8min, 15.3P1) fps -56%
Dota 2 Reborn - 1920x1080 ultra (3/3) best looking
Dell XPS 16 Core Ultra X7 358H
Intel Core Ultra X7 358H, Intel Arc B390 12 Xe3 Panther Lake iGPU
96.9 (57min) fps +22%
Dell Pro 5 16 P516265
AMD Ryzen AI 9 HX PRO 470, AMD Radeon 890M
79.6 (70min) fps
MSI Venture 16 AI A2HMTG
Intel Core Ultra 7 255H, Intel Arc Graphics 140T
75.8 (49.2min) fps -5%
HP EliteBook 8 G1a 16 AI
AMD Ryzen AI 7 PRO 350, AMD Radeon 860M
72.2 (61.8min) fps -9%
Asus ExpertBook B5 B5605CCA
Intel Core Ultra 5 225H, Intel Arc Graphics 130T
52.5 (26.2min) fps -34%
Lenovo ThinkPad T16 Gen 5 22AN001WGE
AMD Ryzen 5 PRO 215, AMD Radeon 740M
47.6 (43.7min) fps -40%
X-Plane 11.11 - 1920x1080 high (fps_test=3)
Dell Pro 5 16 P516265
AMD Ryzen AI 9 HX PRO 470, AMD Radeon 890M
43.5 fps
HP EliteBook 8 G1a 16 AI
AMD Ryzen AI 7 PRO 350, AMD Radeon 860M
41.1 fps -6%
MSI Venture 16 AI A2HMTG
Intel Core Ultra 7 255H, Intel Arc Graphics 140T
39.7 fps -9%
Dell XPS 16 Core Ultra X7 358H
Intel Core Ultra X7 358H, Intel Arc B390 12 Xe3 Panther Lake iGPU
38.8 fps -11%
Asus ExpertBook B5 B5605CCA
Intel Core Ultra 5 225H, Intel Arc Graphics 130T
31.5 fps -28%
Lenovo ThinkPad T16 Gen 5 22AN001WGE
AMD Ryzen 5 PRO 215, AMD Radeon 740M
21.4 fps -51%
Baldur's Gate 3
1920x1080 Medium Preset AA:T
Dell XPS 16 Core Ultra X7 358H
Intel Core Ultra X7 358H, Intel Arc B390 12 Xe3 Panther Lake iGPU
62.3 (55.9min, 56.3P0.1, 57.4P1) fps +62%
Dell Pro 5 16 P516265
AMD Ryzen AI 9 HX PRO 470, AMD Radeon 890M
38.5 (30.4min, 31.1P0.1, 34.3P1) fps
Medio AMD Radeon 890M
  (20.4 - 40.2, n=34)
34.5 fps -10%
MSI Venture 16 AI A2HMTG
Intel Core Ultra 7 255H, Intel Arc Graphics 140T
31 (28.2min, 28.4P0.1, 28.9P1) fps -19%
HP EliteBook 8 G1a 16 AI
AMD Ryzen AI 7 PRO 350, AMD Radeon 860M
30.4 fps -21%
Asus ExpertBook B5 B5605CCA
Intel Core Ultra 5 225H, Intel Arc Graphics 130T
20.5 fps -47%
Lenovo ThinkPad L16 Gen 2 21SC0029GE
AMD Ryzen 5 PRO 215, AMD Radeon 740M
15.7 (5.98min, 7.88P0.1, 11.7P1) fps -59%
Lenovo ThinkPad T16 Gen 5 22AN001WGE
AMD Ryzen 5 PRO 215, AMD Radeon 740M
13.5 (11.9min, 11.9P0.1, 12.3P1) fps -65%
1920x1080 High Preset AA:T
Dell XPS 16 Core Ultra X7 358H
Intel Core Ultra X7 358H, Intel Arc B390 12 Xe3 Panther Lake iGPU
55.6 (49.5min, 50.1P0.1, 52.1P1) fps +76%
Dell Pro 5 16 P516265
AMD Ryzen AI 9 HX PRO 470, AMD Radeon 890M
31.6 (24.6min, 25.1P0.1, 28.8P1) fps
Medio AMD Radeon 890M
  (16.9 - 33.2, n=34)
28.6 fps -9%
Asus ExpertBook B5 B5605CCA
Intel Core Ultra 5 225H, Intel Arc Graphics 130T
27.5 fps -13%
MSI Venture 16 AI A2HMTG
Intel Core Ultra 7 255H, Intel Arc Graphics 140T
26.5 (23.9min, 24.2P0.1, 24.6P1) fps -16%
HP EliteBook 8 G1a 16 AI
AMD Ryzen AI 7 PRO 350, AMD Radeon 860M
23.5 fps -26%
Lenovo ThinkPad T16 Gen 5 22AN001WGE
AMD Ryzen 5 PRO 215, AMD Radeon 740M
11 (9.63min, 9.67P0.1, 9.76P1) fps -65%
1920x1080 Ultra Preset AA:T
Dell XPS 16 Core Ultra X7 358H
Intel Core Ultra X7 358H, Intel Arc B390 12 Xe3 Panther Lake iGPU
54.3 (48.6min, 49.6P0.1, 51P1) fps +75%
Dell Pro 5 16 P516265
AMD Ryzen AI 9 HX PRO 470, AMD Radeon 890M
31.1 (24.4min, 24.7P0.1, 28.8P1) fps
Medio AMD Radeon 890M
  (16.8 - 32.7, n=33)
27.8 fps -11%
Asus ExpertBook B5 B5605CCA
Intel Core Ultra 5 225H, Intel Arc Graphics 130T
27.2 fps -13%
MSI Venture 16 AI A2HMTG
Intel Core Ultra 7 255H, Intel Arc Graphics 140T
26.1 (23.5min, 23.5P0.1, 24.2P1) fps -16%
HP EliteBook 8 G1a 16 AI
AMD Ryzen AI 7 PRO 350, AMD Radeon 860M
22.5 fps -28%
Lenovo ThinkPad L16 Gen 2 21SC0029GE
AMD Ryzen 5 PRO 215, AMD Radeon 740M
13.2 (9.19min, 9.39P0.1, 10.1P1) fps -58%
Lenovo ThinkPad T16 Gen 5 22AN001WGE
AMD Ryzen 5 PRO 215, AMD Radeon 740M
10.6 (9.46min, 9.46P0.1, 9.64P1) fps -66%
GTA V
1024x768 Lowest Settings possible
Dell XPS 16 Core Ultra X7 358H
Intel Core Ultra X7 358H, Intel Arc B390 12 Xe3 Panther Lake iGPU
182 (2.05min, 142.9P1) fps +9%
MSI Venture 16 AI A2HMTG
Intel Core Ultra 7 255H, Intel Arc Graphics 140T
167.9 (3.35min, 100P1) fps 0%
Dell Pro 5 16 P516265
AMD Ryzen AI 9 HX PRO 470, AMD Radeon 890M
167.5 (4.63min, 111.1P1) fps
HP EliteBook 8 G1a 16 AI
AMD Ryzen AI 7 PRO 350, AMD Radeon 860M
165.9 (5min, 111.1P1) fps -1%
Medio AMD Radeon 890M
  (126.4 - 175.8, n=29)
163.3 fps -3%
Lenovo ThinkPad L16 Gen 2 21SC0029GE
AMD Ryzen 5 PRO 215, AMD Radeon 740M
148.3 (5.08min, 100P1) fps -11%
Asus ExpertBook B5 B5605CCA
Intel Core Ultra 5 225H, Intel Arc Graphics 130T
125.9 (6.09min, 83.3P1) fps -25%
Lenovo ThinkPad T16 Gen 5 22AN001WGE
AMD Ryzen 5 PRO 215, AMD Radeon 740M
100.6 (18.2min, 66.7P1) fps -40%
1920x1080 Lowest Settings possible
Dell XPS 16 Core Ultra X7 358H
Intel Core Ultra X7 358H, Intel Arc B390 12 Xe3 Panther Lake iGPU
180 (2.44min, 125P1) fps +32%
Medio AMD Radeon 890M
  (76.1 - 156.5, n=23)
137.5 fps +1%
HP EliteBook 8 G1a 16 AI
AMD Ryzen AI 7 PRO 350, AMD Radeon 860M
137.3 (5.26min, 90.9P1) fps +1%
Dell Pro 5 16 P516265
AMD Ryzen AI 9 HX PRO 470, AMD Radeon 890M
136.6 (4.73min, 90.9P1) fps
MSI Venture 16 AI A2HMTG
Intel Core Ultra 7 255H, Intel Arc Graphics 140T
132.6 (38.4min, 90.9P1) fps -3%
Lenovo ThinkPad L16 Gen 2 21SC0029GE
AMD Ryzen 5 PRO 215, AMD Radeon 740M
97.5 (13.5min, 62.5P1) fps -29%
1920x1080 Normal/Off AF:4x
Dell XPS 16 Core Ultra X7 358H
Intel Core Ultra X7 358H, Intel Arc B390 12 Xe3 Panther Lake iGPU
172.7 (3.42min, 111.1P1) fps +29%
HP EliteBook 8 G1a 16 AI
AMD Ryzen AI 7 PRO 350, AMD Radeon 860M
139.4 (4.41min, 90.9P1) fps +4%
Medio AMD Radeon 890M
  (81.6 - 153.1, n=23)
136.6 fps +2%
Dell Pro 5 16 P516265
AMD Ryzen AI 9 HX PRO 470, AMD Radeon 890M
134.2 (4.28min, 83.3P1) fps
MSI Venture 16 AI A2HMTG
Intel Core Ultra 7 255H, Intel Arc Graphics 140T
120 (36.6min, 83.3P1) fps -11%
Lenovo ThinkPad L16 Gen 2 21SC0029GE
AMD Ryzen 5 PRO 215, AMD Radeon 740M
99.1 (13.4min, 66.7P1) fps -26%
1920x1080 High/On (Advanced Graphics Off) AA:2xMSAA + FX AF:8x
Dell XPS 16 Core Ultra X7 358H
Intel Core Ultra X7 358H, Intel Arc B390 12 Xe3 Panther Lake iGPU
103.3 (9.42min, 76.9P1) fps +45%
Medio AMD Radeon 890M
  (36.6 - 81.5, n=30)
72.6 fps +2%
Dell Pro 5 16 P516265
AMD Ryzen AI 9 HX PRO 470, AMD Radeon 890M
71.3 (6.59min, 47.6P1) fps
HP EliteBook 8 G1a 16 AI
AMD Ryzen AI 7 PRO 350, AMD Radeon 860M
58.7 (2.47min, 41.7P1) fps -18%
Lenovo ThinkPad L16 Gen 2 21SC0029GE
AMD Ryzen 5 PRO 215, AMD Radeon 740M
42.4 (4.83min, 27.8P1) fps -41%
MSI Venture 16 AI A2HMTG
Intel Core Ultra 7 255H, Intel Arc Graphics 140T
41.1 (11.7min, 32.3P1) fps -42%
Lenovo ThinkPad T16 Gen 5 22AN001WGE
AMD Ryzen 5 PRO 215, AMD Radeon 740M
29.3 (6.7min, 20P1) fps -59%
Asus ExpertBook B5 B5605CCA
Intel Core Ultra 5 225H, Intel Arc Graphics 130T
24.4 (7.52min, 19.2P1) fps -66%
1920x1080 Highest AA:4xMSAA + FX AF:16x
Dell XPS 16 Core Ultra X7 358H
Intel Core Ultra X7 358H, Intel Arc B390 12 Xe3 Panther Lake iGPU
45.2 (6.18min, 34.5P1) fps +50%
Medio AMD Radeon 890M
  (14.9 - 33.3, n=30)
30.4 fps +1%
Dell Pro 5 16 P516265
AMD Ryzen AI 9 HX PRO 470, AMD Radeon 890M
30.1 (3.99min, 20.8P1) fps
HP EliteBook 8 G1a 16 AI
AMD Ryzen AI 7 PRO 350, AMD Radeon 860M
25.1 (4.65min, 17.5P1) fps -17%
Lenovo ThinkPad L16 Gen 2 21SC0029GE
AMD Ryzen 5 PRO 215, AMD Radeon 740M
17.7 (5.27min, 11.6P1) fps -41%
MSI Venture 16 AI A2HMTG
Intel Core Ultra 7 255H, Intel Arc Graphics 140T
16.7 (7.28min, 12.8P1) fps -45%
Lenovo ThinkPad T16 Gen 5 22AN001WGE
AMD Ryzen 5 PRO 215, AMD Radeon 740M
11.7 (4.5min, 8.06P1) fps -61%
Asus ExpertBook B5 B5605CCA
Intel Core Ultra 5 225H, Intel Arc Graphics 130T
9.75 (6.37min, 7.46P1) fps -68%
Dota 2 Reborn
1920x1080 high (2/3)
Dell XPS 16 Core Ultra X7 358H
Intel Core Ultra X7 358H, Intel Arc B390 12 Xe3 Panther Lake iGPU
100.2 (51.7min) fps +12%
Dell Pro 5 16 P516265
AMD Ryzen AI 9 HX PRO 470, AMD Radeon 890M
89.3 (79.5min) fps
MSI Venture 16 AI A2HMTG
Intel Core Ultra 7 255H, Intel Arc Graphics 140T
79.4 (50.5min) fps -11%
HP EliteBook 8 G1a 16 AI
AMD Ryzen AI 7 PRO 350, AMD Radeon 860M
78.4 (65.2min) fps -12%
Medio AMD Radeon 890M
  (34.8 - 103, n=35)
75.9 fps -15%
Lenovo ThinkPad L16 Gen 2 21SC0029GE
AMD Ryzen 5 PRO 215, AMD Radeon 740M
66.5 (55.5min) fps -26%
Asus ExpertBook B5 B5605CCA
Intel Core Ultra 5 225H, Intel Arc Graphics 130T
53.7 (26.2min) fps -40%
Lenovo ThinkPad T16 Gen 5 22AN001WGE
AMD Ryzen 5 PRO 215, AMD Radeon 740M
53.5 (49min) fps -40%
1920x1080 ultra (3/3) best looking
Dell XPS 16 Core Ultra X7 358H
Intel Core Ultra X7 358H, Intel Arc B390 12 Xe3 Panther Lake iGPU
96.9 (57min) fps +22%
Dell Pro 5 16 P516265
AMD Ryzen AI 9 HX PRO 470, AMD Radeon 890M
79.6 (70min) fps
MSI Venture 16 AI A2HMTG
Intel Core Ultra 7 255H, Intel Arc Graphics 140T
75.8 (49.2min) fps -5%
HP EliteBook 8 G1a 16 AI
AMD Ryzen AI 7 PRO 350, AMD Radeon 860M
72.2 (61.8min) fps -9%
Medio AMD Radeon 890M
  (32.4 - 93, n=35)
68.5 fps -14%
Lenovo ThinkPad L16 Gen 2 21SC0029GE
AMD Ryzen 5 PRO 215, AMD Radeon 740M
57.6 (51.5min) fps -28%
Asus ExpertBook B5 B5605CCA
Intel Core Ultra 5 225H, Intel Arc Graphics 130T
52.5 (26.2min) fps -34%
Lenovo ThinkPad T16 Gen 5 22AN001WGE
AMD Ryzen 5 PRO 215, AMD Radeon 740M
47.6 (43.7min) fps -40%
Final Fantasy XV Benchmark
1280x720 Lite Quality
Dell XPS 16 Core Ultra X7 358H
Intel Core Ultra X7 358H, Intel Arc B390 12 Xe3 Panther Lake iGPU
131.1 fps +64%
Medio AMD Radeon 890M
  (40.9 - 94.6, n=31)
80.2 fps 0%
Dell Pro 5 16 P516265
AMD Ryzen AI 9 HX PRO 470, AMD Radeon 890M
80 fps
MSI Venture 16 AI A2HMTG
Intel Core Ultra 7 255H, Intel Arc Graphics 140T
68 fps -15%
HP EliteBook 8 G1a 16 AI
AMD Ryzen AI 7 PRO 350, AMD Radeon 860M
66.9 fps -16%
Lenovo ThinkPad L16 Gen 2 21SC0029GE
AMD Ryzen 5 PRO 215, AMD Radeon 740M
51.2 fps -36%
Asus ExpertBook B5 B5605CCA
Intel Core Ultra 5 225H, Intel Arc Graphics 130T
45.1 fps -44%
Lenovo ThinkPad T16 Gen 5 22AN001WGE
AMD Ryzen 5 PRO 215, AMD Radeon 740M
35.9 fps -55%
1920x1080 Standard Quality
Dell XPS 16 Core Ultra X7 358H
Intel Core Ultra X7 358H, Intel Arc B390 12 Xe3 Panther Lake iGPU
79.7 fps +95%
Medio AMD Radeon 890M
  (23.7 - 48.4, n=31)
41.6 fps +2%
Dell Pro 5 16 P516265
AMD Ryzen AI 9 HX PRO 470, AMD Radeon 890M
40.9 fps
MSI Venture 16 AI A2HMTG
Intel Core Ultra 7 255H, Intel Arc Graphics 140T
39.2 fps -4%
HP EliteBook 8 G1a 16 AI
AMD Ryzen AI 7 PRO 350, AMD Radeon 860M
34 fps -17%
Lenovo ThinkPad L16 Gen 2 21SC0029GE
AMD Ryzen 5 PRO 215, AMD Radeon 740M
24.1 fps -41%
Asus ExpertBook B5 B5605CCA
Intel Core Ultra 5 225H, Intel Arc Graphics 130T
24 fps -41%
Lenovo ThinkPad T16 Gen 5 22AN001WGE
AMD Ryzen 5 PRO 215, AMD Radeon 740M
17.7 fps -57%
1920x1080 High Quality
Dell XPS 16 Core Ultra X7 358H
Intel Core Ultra X7 358H, Intel Arc B390 12 Xe3 Panther Lake iGPU
56.2 fps +91%
Medio AMD Radeon 890M
  (17.7 - 34.8, n=31)
29.9 fps +2%
Dell Pro 5 16 P516265
AMD Ryzen AI 9 HX PRO 470, AMD Radeon 890M
29.4 fps
MSI Venture 16 AI A2HMTG
Intel Core Ultra 7 255H, Intel Arc Graphics 140T
26 fps -12%
HP EliteBook 8 G1a 16 AI
AMD Ryzen AI 7 PRO 350, AMD Radeon 860M
23.9 fps -19%
Asus ExpertBook B5 B5605CCA
Intel Core Ultra 5 225H, Intel Arc Graphics 130T
18.8 fps -36%
Lenovo ThinkPad L16 Gen 2 21SC0029GE
AMD Ryzen 5 PRO 215, AMD Radeon 740M
17.9 fps -39%
Lenovo ThinkPad T16 Gen 5 22AN001WGE
AMD Ryzen 5 PRO 215, AMD Radeon 740M
12.9 fps -56%
X-Plane 11.11 - 1920x1080 high (fps_test=3)
Medio AMD Radeon 890M
  (33.7 - 58.3, n=32)
46.2 fps +6%
Dell Pro 5 16 P516265
AMD Ryzen AI 9 HX PRO 470, AMD Radeon 890M
43.5 fps
HP EliteBook 8 G1a 16 AI
AMD Ryzen AI 7 PRO 350, AMD Radeon 860M
41.1 fps -6%
MSI Venture 16 AI A2HMTG
Intel Core Ultra 7 255H, Intel Arc Graphics 140T
39.7 fps -9%
Dell XPS 16 Core Ultra X7 358H
Intel Core Ultra X7 358H, Intel Arc B390 12 Xe3 Panther Lake iGPU
38.8 fps -11%
Asus ExpertBook B5 B5605CCA
Intel Core Ultra 5 225H, Intel Arc Graphics 130T
31.5 fps -28%
Lenovo ThinkPad L16 Gen 2 21SC0029GE
AMD Ryzen 5 PRO 215, AMD Radeon 740M
23.4 fps -46%
Lenovo ThinkPad T16 Gen 5 22AN001WGE
AMD Ryzen 5 PRO 215, AMD Radeon 740M
21.4 fps -51%
Strange Brigade
1920x1080 high AA:high AF:8
Dell XPS 16 Core Ultra X7 358H
Intel Core Ultra X7 358H, Intel Arc B390 12 Xe3 Panther Lake iGPU
104 (12.8min, 75.8P1) fps +93%
Medio AMD Radeon 890M
  (51 - 69.8, n=26)
63.2 fps +17%
MSI Venture 16 AI A2HMTG
Intel Core Ultra 7 255H, Intel Arc Graphics 140T
60.2 (21.6min, 48.7P1) fps +11%
Dell Pro 5 16 P516265
AMD Ryzen AI 9 HX PRO 470, AMD Radeon 890M
54 (35.9min, 42.8P1) fps
HP EliteBook 8 G1a 16 AI
AMD Ryzen AI 7 PRO 350, AMD Radeon 860M
47.4 (21.2min, 35.4P1) fps -12%
Asus ExpertBook B5 B5605CCA
Intel Core Ultra 5 225H, Intel Arc Graphics 130T
30.3 (23.4min, 25.3P1) fps -44%
Lenovo ThinkPad T16 Gen 5 22AN001WGE
AMD Ryzen 5 PRO 215, AMD Radeon 740M
24.3 (19.9min, 20.5P1) fps -55%
1920x1080 ultra AA:ultra AF:16
Dell XPS 16 Core Ultra X7 358H
Intel Core Ultra X7 358H, Intel Arc B390 12 Xe3 Panther Lake iGPU
90.6 (24.7min, 39.3P1) fps +89%
Medio AMD Radeon 890M
  (44.8 - 59.7, n=26)
53.8 fps +12%
MSI Venture 16 AI A2HMTG
Intel Core Ultra 7 255H, Intel Arc Graphics 140T
50.1 (34.9min, 40.2P1) fps +5%
Dell Pro 5 16 P516265
AMD Ryzen AI 9 HX PRO 470, AMD Radeon 890M
47.9 (31.9min, 36.9P1) fps
HP EliteBook 8 G1a 16 AI
AMD Ryzen AI 7 PRO 350, AMD Radeon 860M
40 (19.2min, 25.6P1) fps -16%
Asus ExpertBook B5 B5605CCA
Intel Core Ultra 5 225H, Intel Arc Graphics 130T
29.9 (12.8min, 20P1) fps -38%
Lenovo ThinkPad T16 Gen 5 22AN001WGE
AMD Ryzen 5 PRO 215, AMD Radeon 740M
21 (13.8min, 15.3P1) fps -56%
Cyberpunk 2077
1920x1080 Medium Preset (FSR off)
Dell XPS 16 Core Ultra X7 358H
Intel Core Ultra X7 358H, Intel Arc B390 12 Xe3 Panther Lake iGPU
65.4 (55.8min, 52P1) fps +73%
Dell Pro 5 16 P516265
AMD Ryzen AI 9 HX PRO 470, AMD Radeon 890M
37.7 (32.6min, 30.2P1) fps
Medio AMD Radeon 890M
  (16.9 - 41.9, n=34)
36 fps -5%
MSI Venture 16 AI A2HMTG
Intel Core Ultra 7 255H, Intel Arc Graphics 140T
29.6 (26.3min, 25.2P1) fps -21%
HP EliteBook 8 G1a 16 AI
AMD Ryzen AI 7 PRO 350, AMD Radeon 860M
27.7 (23.7min, 22.6P1) fps -27%
Asus ExpertBook B5 B5605CCA
Intel Core Ultra 5 225H, Intel Arc Graphics 130T
21.8 (19.5min) fps -42%
Lenovo ThinkPad L16 Gen 2 21SC0029GE
AMD Ryzen 5 PRO 215, AMD Radeon 740M
18.7 (16.3min, 15.7P1) fps -50%
Lenovo ThinkPad T16 Gen 5 22AN001WGE
AMD Ryzen 5 PRO 215, AMD Radeon 740M
14.9 (12.7min) fps -60%
1920x1080 High Preset (FSR off)
Dell XPS 16 Core Ultra X7 358H
Intel Core Ultra X7 358H, Intel Arc B390 12 Xe3 Panther Lake iGPU
56 (47.2min, 45.4P1) fps +93%
Dell Pro 5 16 P516265
AMD Ryzen AI 9 HX PRO 470, AMD Radeon 890M
29 (24.4min, 22.7P1) fps
Medio AMD Radeon 890M
  (13 - 32.3, n=34)
28 fps -3%
MSI Venture 16 AI A2HMTG
Intel Core Ultra 7 255H, Intel Arc Graphics 140T
25.5 (22.3min, 21.5P1) fps -12%
HP EliteBook 8 G1a 16 AI
AMD Ryzen AI 7 PRO 350, AMD Radeon 860M
21.7 (17.5min, 16.3P1) fps -25%
Asus ExpertBook B5 B5605CCA
Intel Core Ultra 5 225H, Intel Arc Graphics 130T
17.6 (15.3min) fps -39%
Lenovo ThinkPad T16 Gen 5 22AN001WGE
AMD Ryzen 5 PRO 215, AMD Radeon 740M
11.1 (8.91min) fps -62%
1920x1080 Ultra Preset (FSR off)
Dell XPS 16 Core Ultra X7 358H
Intel Core Ultra X7 358H, Intel Arc B390 12 Xe3 Panther Lake iGPU
48.7 (40min, 37.6P1) fps +92%
Dell Pro 5 16 P516265
AMD Ryzen AI 9 HX PRO 470, AMD Radeon 890M
25.3 (20.9min, 18.5P1) fps
Medio AMD Radeon 890M
  (15.5 - 28.4, n=35)
24.7 fps -2%
MSI Venture 16 AI A2HMTG
Intel Core Ultra 7 255H, Intel Arc Graphics 140T
23 (20min, 18.7P1) fps -9%
HP EliteBook 8 G1a 16 AI
AMD Ryzen AI 7 PRO 350, AMD Radeon 860M
17.9 (14.5min, 10.6P1) fps -29%
Asus ExpertBook B5 B5605CCA
Intel Core Ultra 5 225H, Intel Arc Graphics 130T
15.6 (13.6min) fps -38%
Lenovo ThinkPad T16 Gen 5 22AN001WGE
AMD Ryzen 5 PRO 215, AMD Radeon 740M
9.53 (7.88min) fps -62%
F1 24
1920x1080 Medium Preset AA:T AF:16x
Dell XPS 16 Core Ultra X7 358H
Intel Core Ultra X7 358H, Intel Arc B390 12 Xe3 Panther Lake iGPU
135.3 (105min, 88P1) fps +78%
Dell Pro 5 16 P516265
AMD Ryzen AI 9 HX PRO 470, AMD Radeon 890M
75.9 (64min, 48P1) fps
Medio AMD Radeon 890M
  (43.9 - 94, n=23)
75.3 fps -1%
MSI Venture 16 AI A2HMTG
Intel Core Ultra 7 255H, Intel Arc Graphics 140T
69.9 (59min, 54P1) fps -8%
HP EliteBook 8 G1a 16 AI
AMD Ryzen AI 7 PRO 350, AMD Radeon 860M
56.2 (31min, 30P1) fps -26%
Asus ExpertBook B5 B5605CCA
Intel Core Ultra 5 225H, Intel Arc Graphics 130T
48.3 (30min, 36P1) fps -36%
Lenovo ThinkPad T16 Gen 5 22AN001WGE
AMD Ryzen 5 PRO 215, AMD Radeon 740M
31.9 (22min, 23P1) fps -58%
1920x1080 High Preset AA:T AF:16x
Dell XPS 16 Core Ultra X7 358H
Intel Core Ultra X7 358H, Intel Arc B390 12 Xe3 Panther Lake iGPU
103.4 (68min, 69P1) fps +82%
Dell Pro 5 16 P516265
AMD Ryzen AI 9 HX PRO 470, AMD Radeon 890M
56.7 (45min, 38P1) fps
Medio AMD Radeon 890M
  (31.1 - 67, n=23)
54.9 fps -3%
MSI Venture 16 AI A2HMTG
Intel Core Ultra 7 255H, Intel Arc Graphics 140T
48 (41min, 39P1) fps -15%
HP EliteBook 8 G1a 16 AI
AMD Ryzen AI 7 PRO 350, AMD Radeon 860M
44.3 (35min, 28P1) fps -22%
Asus ExpertBook B5 B5605CCA
Intel Core Ultra 5 225H, Intel Arc Graphics 130T
37.2 (18min, 28P1) fps -34%
Lenovo ThinkPad T16 Gen 5 22AN001WGE
AMD Ryzen 5 PRO 215, AMD Radeon 740M
23.7 (16min, 17P1) fps -58%
1920x1080 Ultra High Preset AA:T AF:16x
Dell XPS 16 Core Ultra X7 358H
Intel Core Ultra X7 358H, Intel Arc B390 12 Xe3 Panther Lake iGPU
36.8 (20min, 28P1) fps +144%
MSI Venture 16 AI A2HMTG
Intel Core Ultra 7 255H, Intel Arc Graphics 140T
15.7 (10min, 12P1) fps +4%
Dell Pro 5 16 P516265
AMD Ryzen AI 9 HX PRO 470, AMD Radeon 890M
15.1 (9min, 8P1) fps
Medio AMD Radeon 890M
  (8.41 - 18.4, n=19)
14.1 fps -7%
HP EliteBook 8 G1a 16 AI
AMD Ryzen AI 7 PRO 350, AMD Radeon 860M
9.84 (7min, 6P1) fps -35%
Lenovo ThinkPad T16 Gen 5 22AN001WGE
AMD Ryzen 5 PRO 215, AMD Radeon 740M
5.51 (4min, 4P1) fps -64%

Gráfico de FPS en modo «Ultra» de Cyberpunk 2077

0510152025Tooltip
Dell Pro 5 16 P516265 Ryzen AI 9 HX PRO 470, Radeon 890M: Ø26.9 (25-27.4) fps
Lenovo ThinkPad T16 Gen 5 22AN001WGE R5 PRO 215, Radeon 740M: Ø9.12 (8.14-9.29) fps
bajomedioaltoultra
GTA V (2015) 167.5 71.3 30.1
Dota 2 Reborn (2015) 174.1 129.5 89.3 79.6
Final Fantasy XV Benchmark (2018) 80 40.9 29.4
X-Plane 11.11 (2018) 72.6 59.3 43.5
Strange Brigade (2018) 168.2 63.8 54 47.9
Baldur's Gate 3 (2023) 47.3 38.5 31.6 31.1
Cyberpunk 2077 (2023) 46.9 37.7 29 25.3
F1 24 (2024) 84.2 75.9 56.7 15.1

Emisiones

Ruido del sistema

Perfil de ruido del ventilador (Blanco: fondo; Rojo: sistema inactivo; Azul: 3DMark 06; Naranja: Cyberpunk 2077; Verde: estrés con Prime95)

Ruido

Ocioso
23.2 / 23.2 / 27 dB(A)
Carga
34.1 / 46.7 dB(A)
  red to green bar
 
 
30 dB
silencioso
40 dB(A)
audible
50 dB(A)
ruidosamente alto
 
min: dark, med: mid, max: light   Earthworks M23R, Arta (15 cm de distancia)   ruido ambiental: 23 dB(A)
dB(A) 0102030405060708090Deep BassMiddle BassHigh BassLower RangeMidsHigher MidsLower HighsMid HighsUpper HighsSuper Highs2031.332.932.831.733.62522.821.822.523.727.73122.922.22119.527.24020.118.218.118.824.95022.420.919.423.525.56322.621.921.323.928.48023.522.522.222.928.110024.820.121.420.726.312521.117.317.317.122.81602418.513.713.125.520025.925.11413.226.725029.119.318.712.828.231529.52017.214.429.140031.521.715.811.831.450030.221.314.39.930.363032.924.915.710.133.680034.226.11610.234.3100037.428.917.69.838125036.728.416.59.436.7160035.826.5169.836.5200036.927.416.69.937.2250036.826.315.110.336.931503523.613.410.735.2400033.622.81211.233.6500030.420.211.711.430.363003116.31211.530.7800027.614.611.811.827.61000022.113.612.112.122.11250019.613.61211.919.61600015.3131110.815.4SPL46.537272346.7N5.42.30.80.45.5median 30.4median 21.3median 15.1median 11.4median 30.3Delta5.24.72.31.84.5hearing rangehide median Fan NoiseDell Pro 5 16 P516265
Dell Pro 5 16 P516265
Ryzen AI 9 HX PRO 470, Radeon 890M
Dell XPS 16 Core Ultra X7 358H
Ultra X7 358H, Arc B390 Panther Lake iGPU
Lenovo ThinkPad T16 Gen 5 22AN001WGE
R5 PRO 215, Radeon 740M
MSI Venture 16 AI A2HMTG
Ultra 7 255H, Arc 140T
Asus ExpertBook B5 B5605CCA
Ultra 5 225H, Arc 130T
HP EliteBook 8 G1a 16 AI
Ryzen AI 7 PRO 350, Radeon 860M
Noise
1%
7%
-0%
11%
-5%
apagado / medio ambiente * (dB)
23
23.3
-1%
24.6
-7%
22.9
-0%
23.2
-1%
22.7
1%
Idle Minimum * (dB)
23.2
23.4
-1%
24.6
-6%
23.1
-0%
23.2
-0%
22.8
2%
Idle Average * (dB)
23.2
23.4
-1%
24.6
-6%
23.1
-0%
23.2
-0%
22.8
2%
Idle Maximum * (dB)
27
25.8
4%
26.4
2%
24.1
11%
23.2
14%
24.7
9%
Load Average * (dB)
34.1
38
-11%
28.6
16%
45.2
-33%
26.3
23%
46
-35%
Cyberpunk 2077 ultra * (dB)
46.5
38.1
18%
34.2
26%
39.4
15%
35.4
24%
48.7
-5%
Load Maximum * (dB)
46.7
48.6
-4%
34.2
27%
44.7
4%
38.8
17%
49.5
-6%

* ... más pequeño es mejor

Temperatura
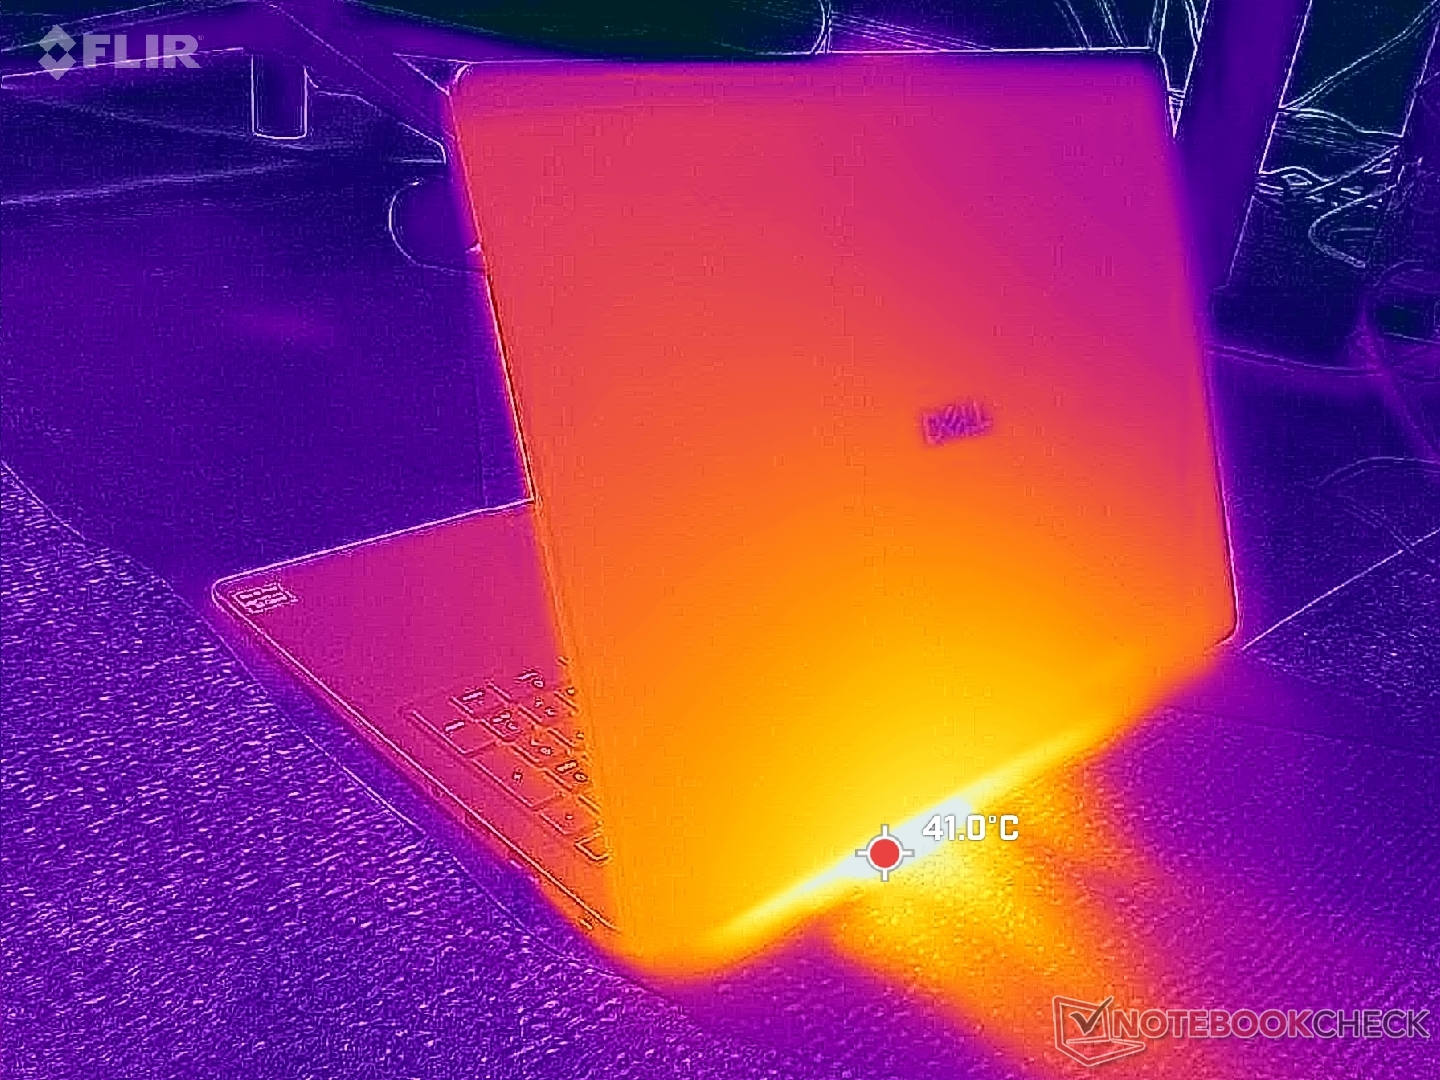
Escape trasero
Escape trasero
El adaptador de CA alcanza más de 48 °C cuando se somete a cargas exigentes
Carga Máx.
 41 °C40 °C36.2 °C 
 39.6 °C38.6 °C28.8 °C 
 31.6 °C28.2 °C26.8 °C 
Máximo: 41 °C
Médio: 34.5 °C
28.8 °C36.2 °C39.2 °C
28.4 °C36.2 °C38.8 °C
28.4 °C31.4 °C33.2 °C
Máximo: 39.2 °C
Médio: 33.4 °C
Conector de corriente  50 °C | Temperatura del cuarto 20 °C | Fluke 62 Mini IR Thermometer
(±) La temperatura media de la parte superior bajo carga máxima es de 34.5 °C / 94 F, en comparación con la media de 29.5 °C / 85 F de los dispositivos de la clase Office.
(±) La temperatura máxima en la parte superior es de 41 °C / 106 F, frente a la media de 34.3 °C / 94 F, que oscila entre 21.2 y 62.5 °C para la clase Office.
(+) El fondo se calienta hasta un máximo de 39.2 °C / 103 F, frente a la media de 36.8 °C / 98 F
(+) En reposo, la temperatura media de la parte superior es de 26.6 °C / 80# F, frente a la media del dispositivo de 29.5 °C / 85 F.
(+) El reposamanos y el panel táctil están a una temperatura inferior a la de la piel, con un máximo de 31.6 °C / 88.9 F y, por tanto, son fríos al tacto.
(-) La temperatura media de la zona del reposamanos de dispositivos similares fue de 27.5 °C / 81.5 F (-4.1 °C / -7.4 F).
Sistema inactivo (portada C)
Sistema inactivo (tapa D)
Prueba de estrés con Prime95+FurMark (nivel C)
Prueba de estrés con Prime95+FurMark (nivel D)
Dell Pro 5 16 P516265
Ryzen AI 9 HX PRO 470, Radeon 890M
Dell XPS 16 Core Ultra X7 358H
Ultra X7 358H, Arc B390 Panther Lake iGPU
Lenovo ThinkPad T16 Gen 5 22AN001WGE
R5 PRO 215, Radeon 740M
MSI Venture 16 AI A2HMTG
Ultra 7 255H, Arc 140T
Asus ExpertBook B5 B5605CCA
Ultra 5 225H, Arc 130T
HP EliteBook 8 G1a 16 AI
Ryzen AI 7 PRO 350, Radeon 860M
Heat
9%
7%
-0%
-2%
6%
Maximum Upper Side * (°C)
41
40.6
1%
37
10%
35
15%
40.7
1%
38
7%
Maximum Bottom * (°C)
39.2
39.8
-2%
40.9
-4%
37.4
5%
47.8
-22%
33.4
15%
Idle Upper Side * (°C)
28.4
23.2
18%
24.9
12%
30.2
-6%
26
8%
28
1%
Idle Bottom * (°C)
28.6
23.8
17%
26.4
8%
33
-15%
27
6%
28.2
1%

* ... más pequeño es mejor

Prueba de resistencia

La CPU alcanzaba los 3 GHz y los 43 W al iniciar la prueba de estrés Prime95, antes de descender y estabilizarse en 2,8 GHz, 33 W y 62 °C tan solo unos segundos después.
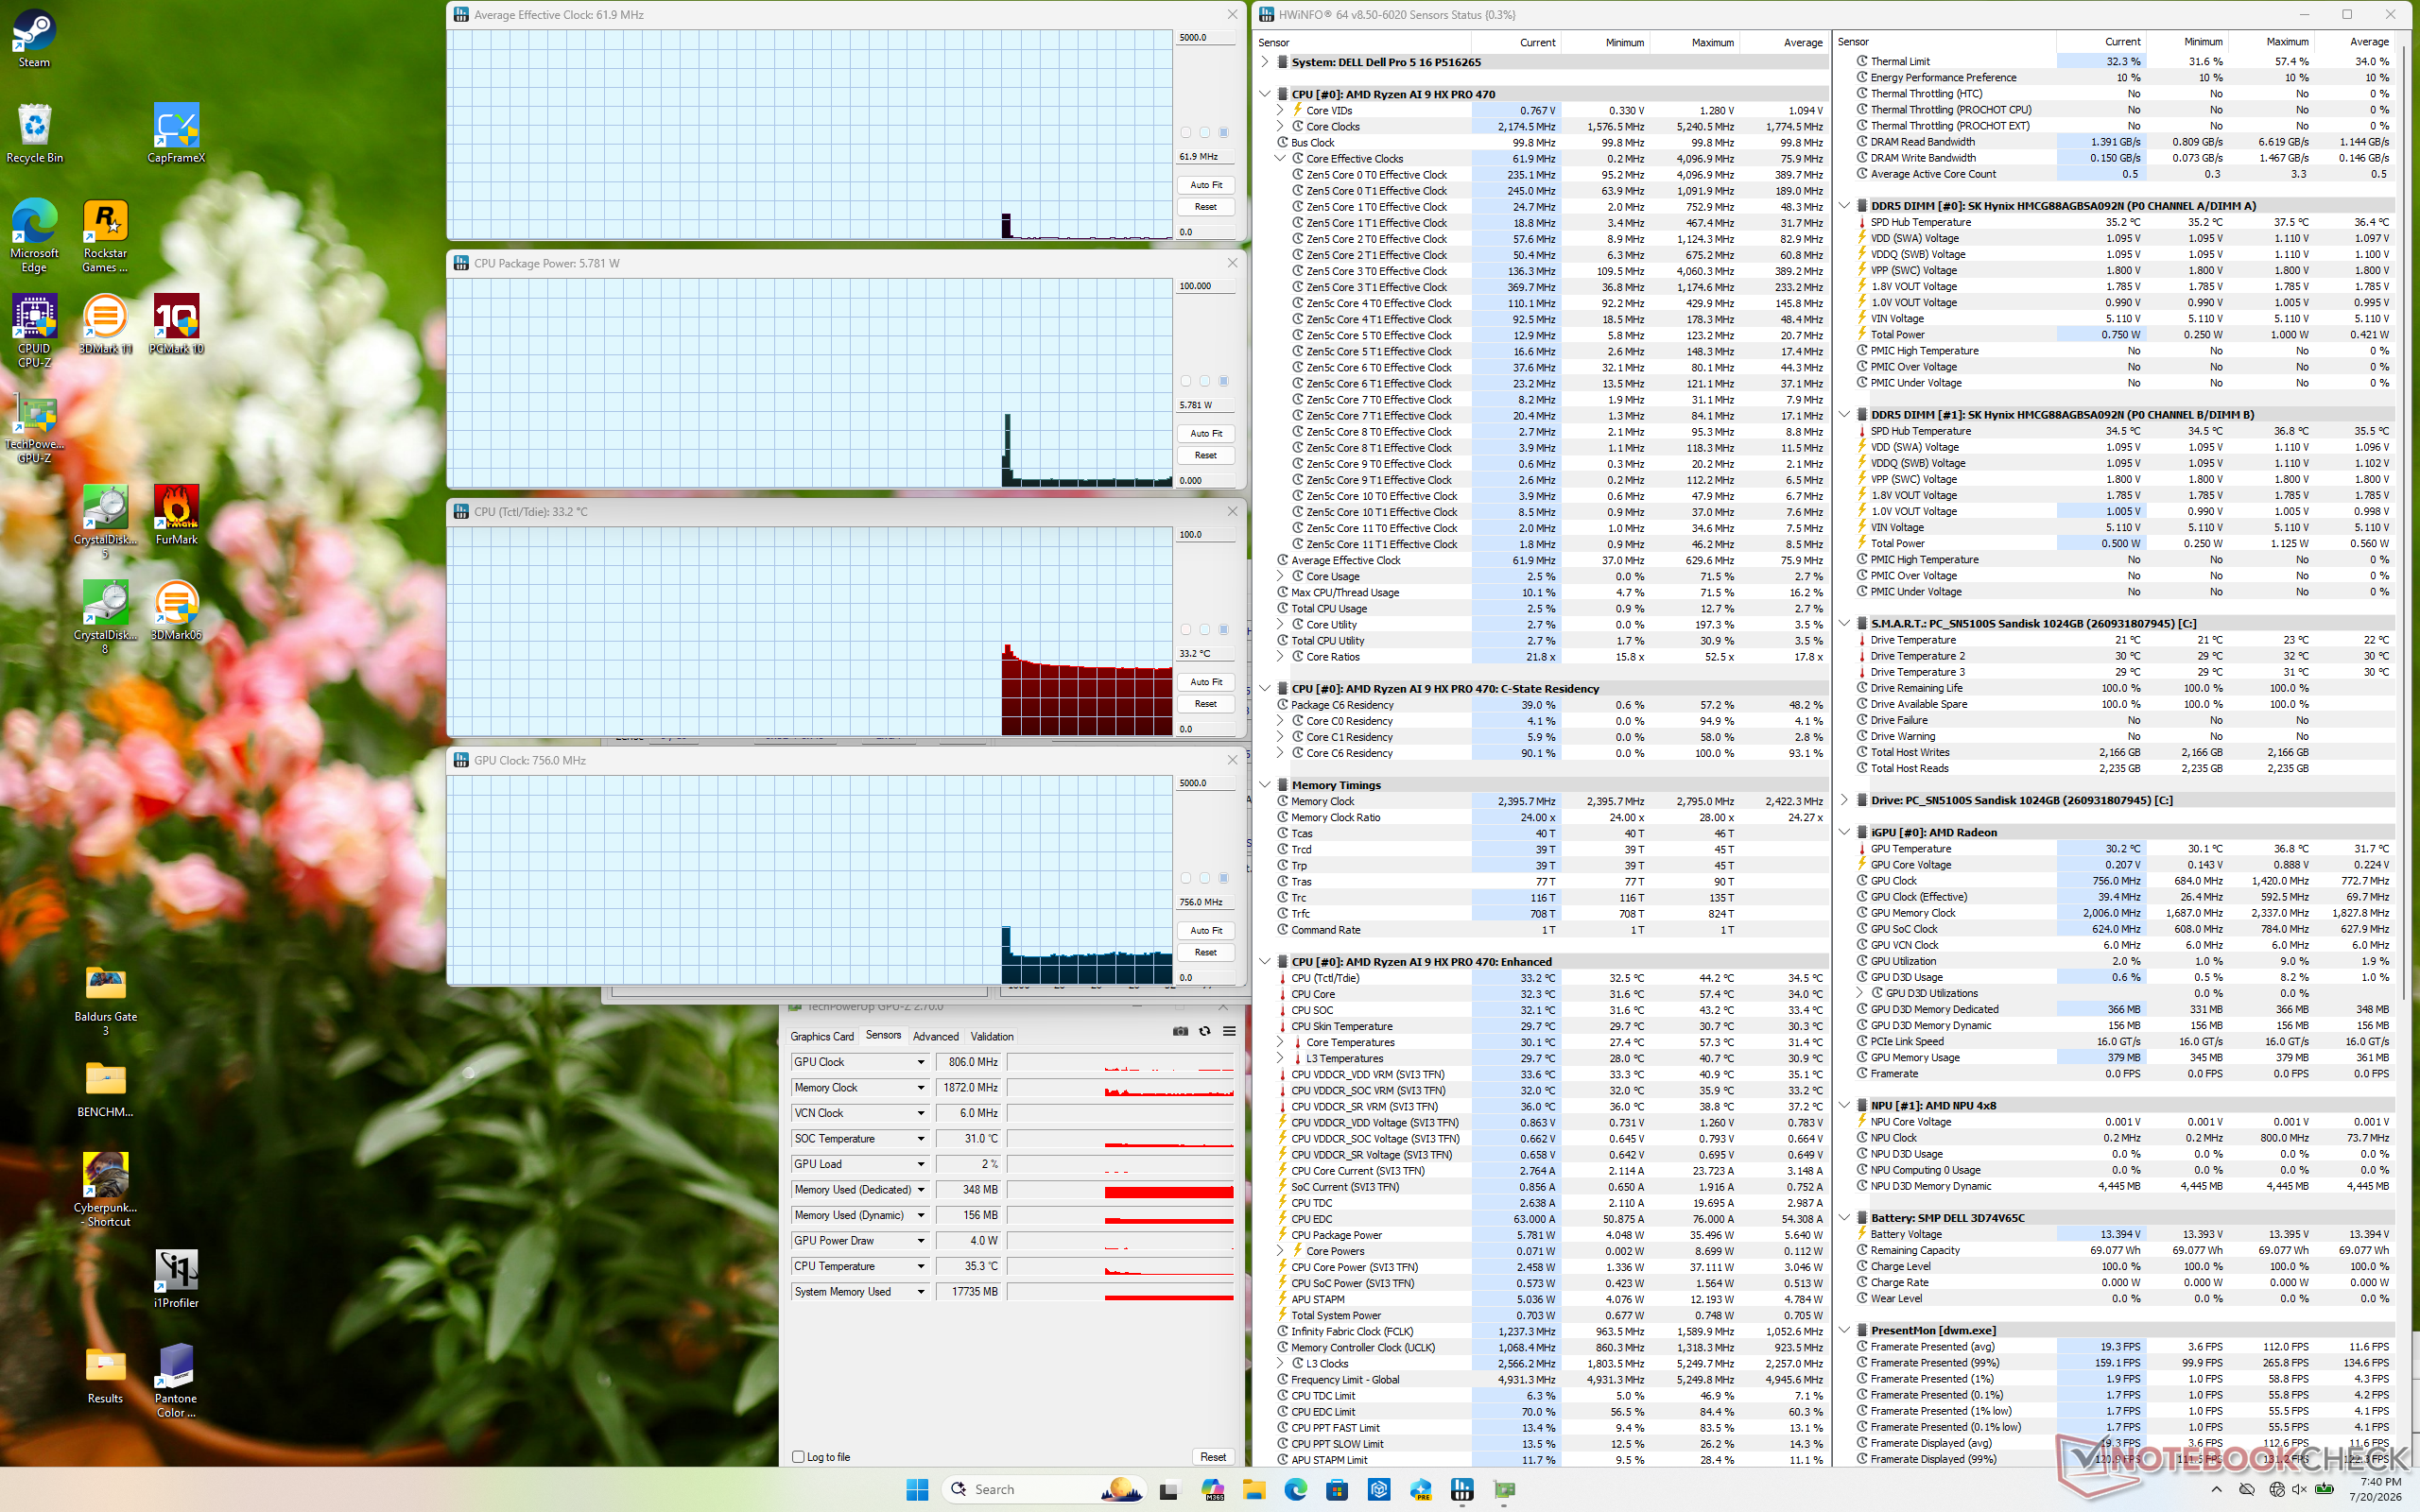
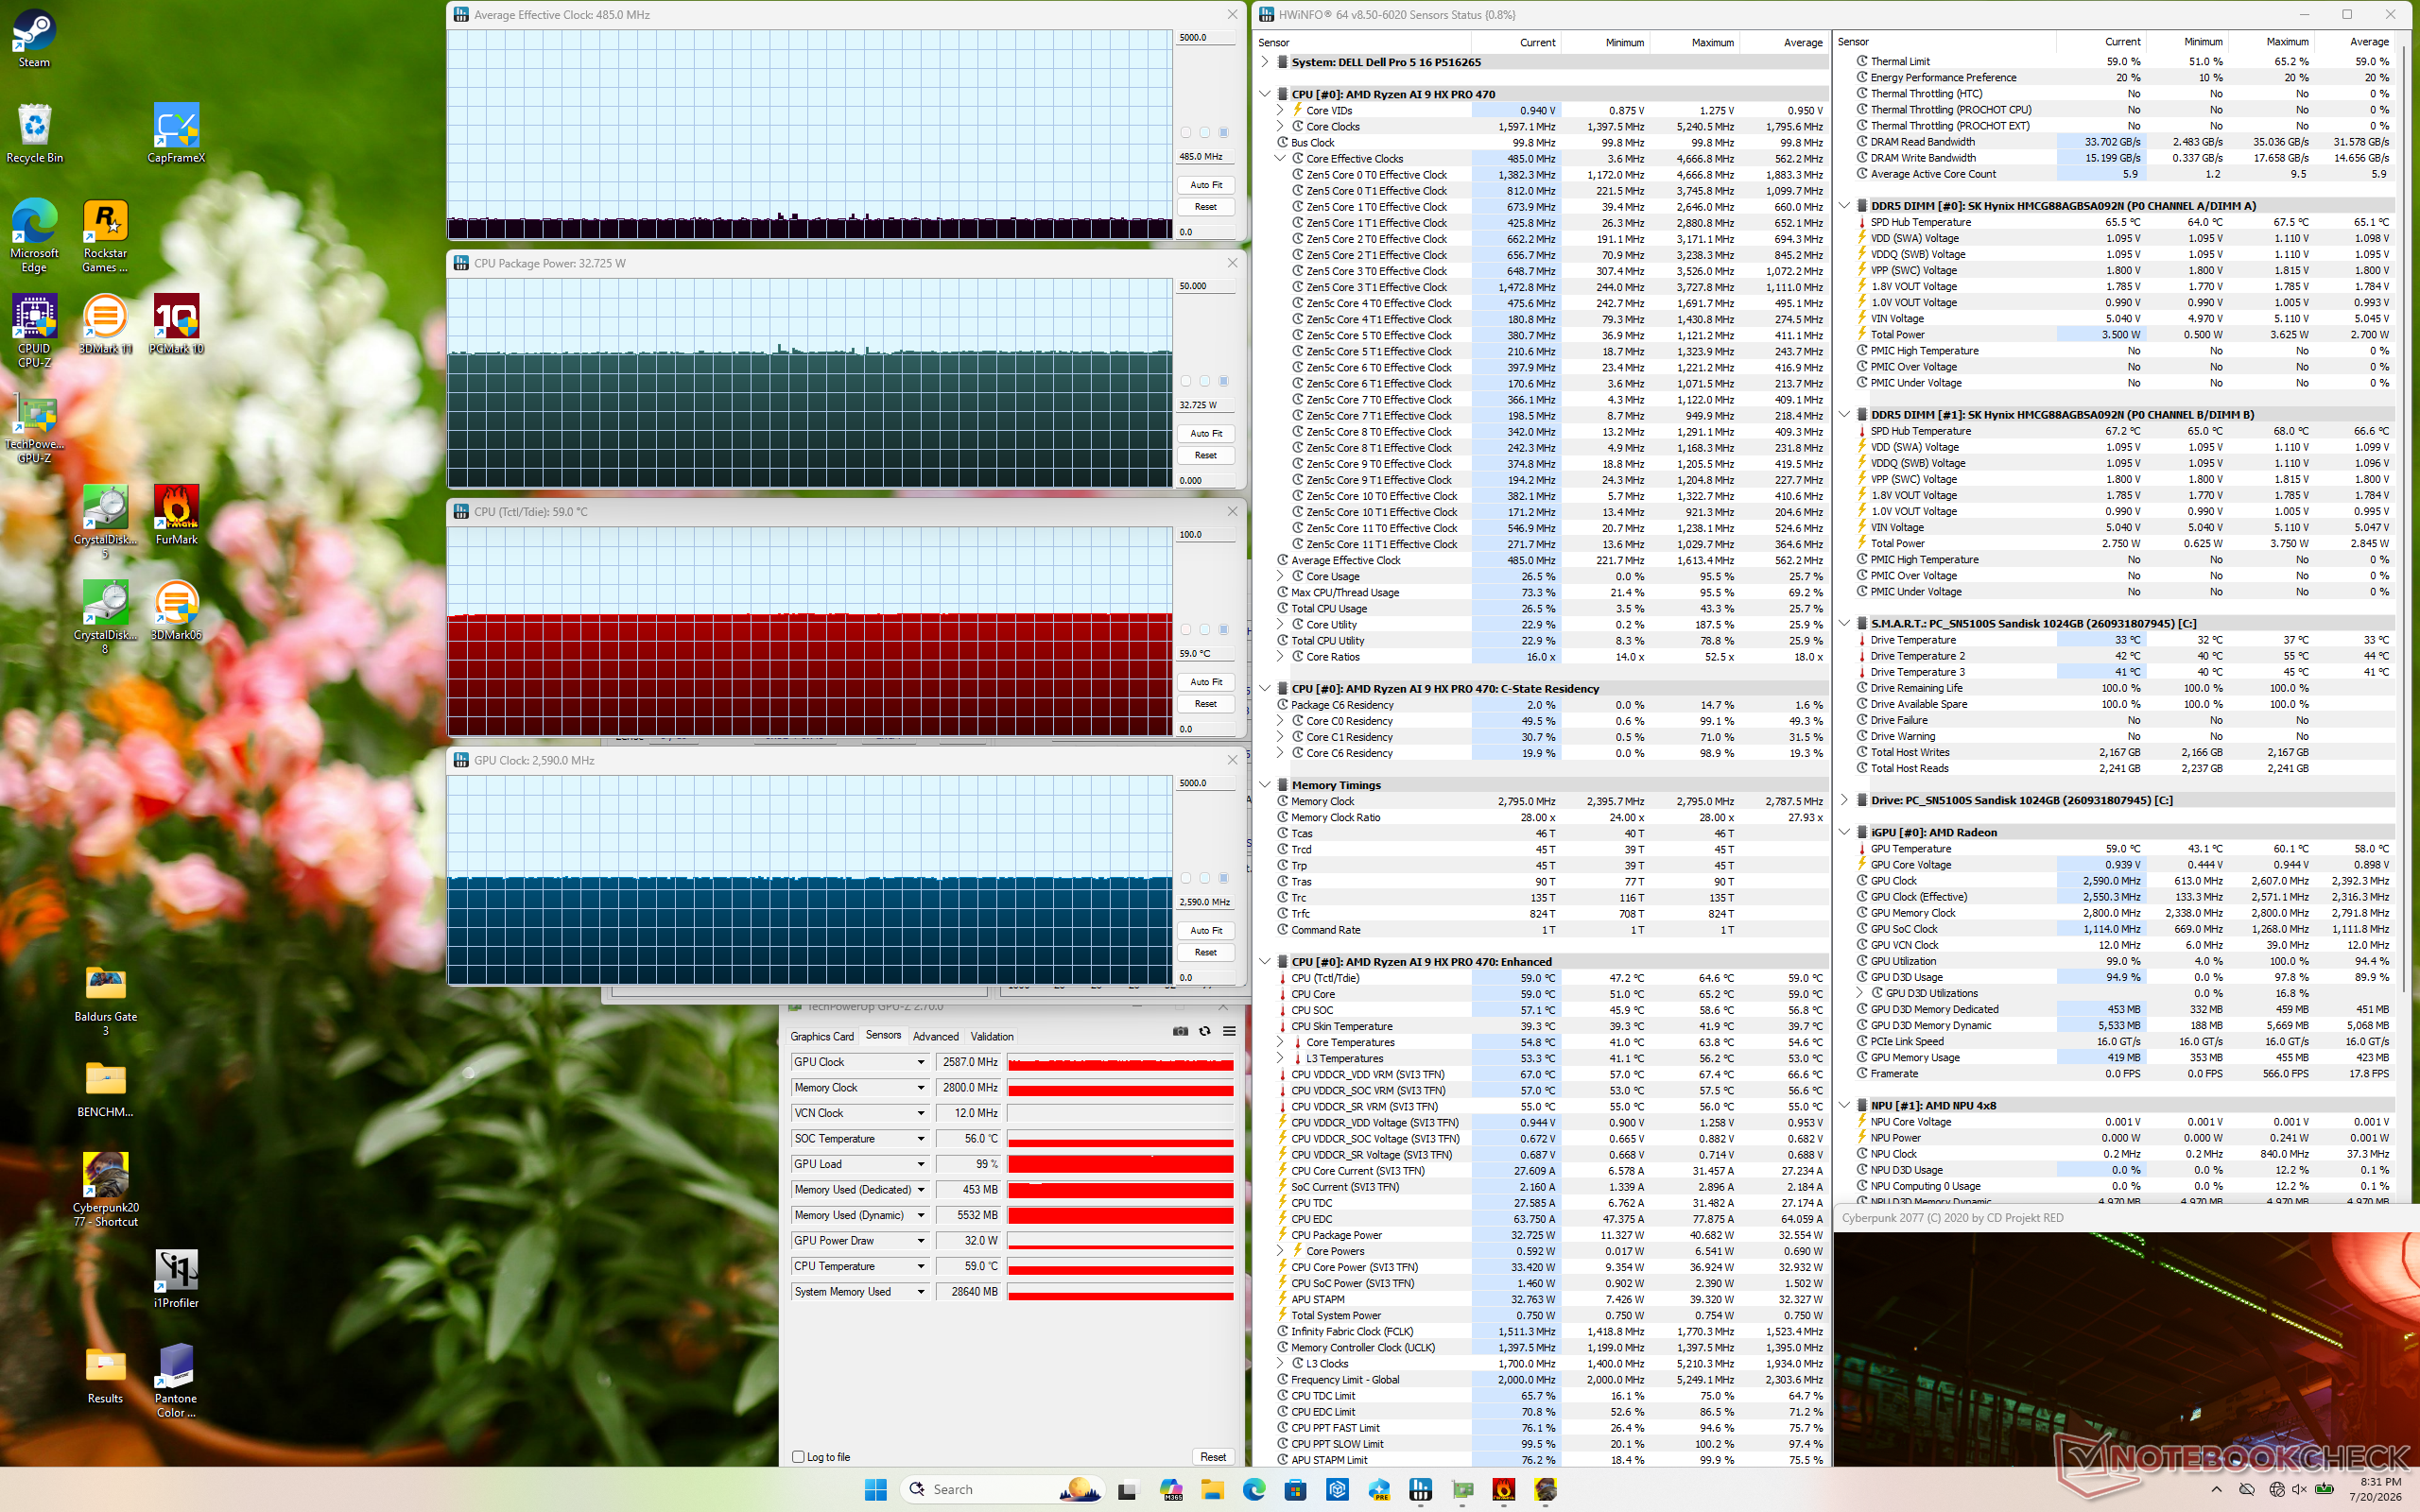
Sistema inactivo
Sistema inactivo
El estrés de Cyberpunk 2077
Prueba de estrés con Prime95
Prueba de estrés con Prime95 y FurMark
Frecuencia media de la CPU (GHz) Frecuencia de la GPU (MHz) Temperatura media de la CPU (°C)
Sistema inactivo -- 756 33
Carga de Prime95 2,8 -- 62
Carga de Prime95 + FurMark 3,0 1153 62
Carga deCyberpunk 2077 0,5 2590 59

Ponentes

El ruido rosa presenta un volumen máximo elevado y un amplio rango
dB(A) 0102030405060708090Deep BassMiddle BassHigh BassLower RangeMidsHigher MidsLower HighsMid HighsUpper HighsSuper Highs2032.8342522.523.4312123.34018.121.75019.423.76321.325.58022.230.710021.439.512517.346.216013.757.72001462.525018.764.431517.265.440015.86750014.370.163015.778.48001677.5100017.672125016.570.916001671.8200016.670.1250015.172.9315013.473.940001273.6500011.775.263001271.7800011.869.31000012.162.3125001259.8160001158.5SPL2785.1N0.866.5median 15.1median 70.1Delta2.3526.325.821.422.12624.925.127.622.532.523.448.72655.818.860.922.167.2267019.372.317.674.217.774.319.575.31571.711.871.311.27410.574.21072.710.17210.67210.97511.374.811.671.71269.71269.612.371.112.669.61270.111.269.824.784.70.666.6median 12median 71.73.42.2hearing rangehide median Pink NoiseDell Pro 5 16 P516265Apple MacBook Pro 16 2021 M1 Pro
Diagrama de frecuencia en comparación (¡las casillas de verificación se pueden marcar y desmarcar!)
Dell Pro 5 16 P516265 análisis de audio

(+) | los altavoces pueden reproducir a un volumen relativamente alto (#85.1 dB)
Graves 100 - 315 Hz
(±) | lubina reducida - en promedio 14.1% inferior a la mediana
(±) | la linealidad de los graves es media (10.5% delta a frecuencia anterior)
Medios 400 - 2000 Hz
(+) | medios equilibrados - a sólo 2.9% de la mediana
(+) | los medios son lineales (5.3% delta a la frecuencia anterior)
Altos 2 - 16 kHz
(+) | máximos equilibrados - a sólo 3.6% de la mediana
(+) | los máximos son lineales (4.8% delta a la frecuencia anterior)
Total 100 - 16.000 Hz
(+) | el sonido global es lineal (12.7% de diferencia con la mediana)
En comparación con la misma clase
» 6% de todos los dispositivos probados de esta clase eran mejores, 2% similares, 92% peores
» El mejor tuvo un delta de 7%, la media fue 21%, el peor fue ###max##%
En comparación con todos los dispositivos probados
» 12% de todos los dispositivos probados eran mejores, 3% similares, 86% peores
» El mejor tuvo un delta de 4%, la media fue 23%, el peor fue ###max##%

Apple MacBook Pro 16 2021 M1 Pro análisis de audio

(+) | los altavoces pueden reproducir a un volumen relativamente alto (#84.7 dB)
Graves 100 - 315 Hz
(+) | buen bajo - sólo 3.8% lejos de la mediana
(+) | el bajo es lineal (5.2% delta a la frecuencia anterior)
Medios 400 - 2000 Hz
(+) | medios equilibrados - a sólo 1.3% de la mediana
(+) | los medios son lineales (2.1% delta a la frecuencia anterior)
Altos 2 - 16 kHz
(+) | máximos equilibrados - a sólo 1.9% de la mediana
(+) | los máximos son lineales (2.7% delta a la frecuencia anterior)
Total 100 - 16.000 Hz
(+) | el sonido global es lineal (4.6% de diferencia con la mediana)
En comparación con la misma clase
» 0% de todos los dispositivos probados de esta clase eran mejores, 0% similares, 100% peores
» El mejor tuvo un delta de 5%, la media fue 17%, el peor fue ###max##%
En comparación con todos los dispositivos probados
» 0% de todos los dispositivos probados eran mejores, 0% similares, 100% peores
» El mejor tuvo un delta de 4%, la media fue 23%, el peor fue ###max##%

Gestión energética

Consumo energético
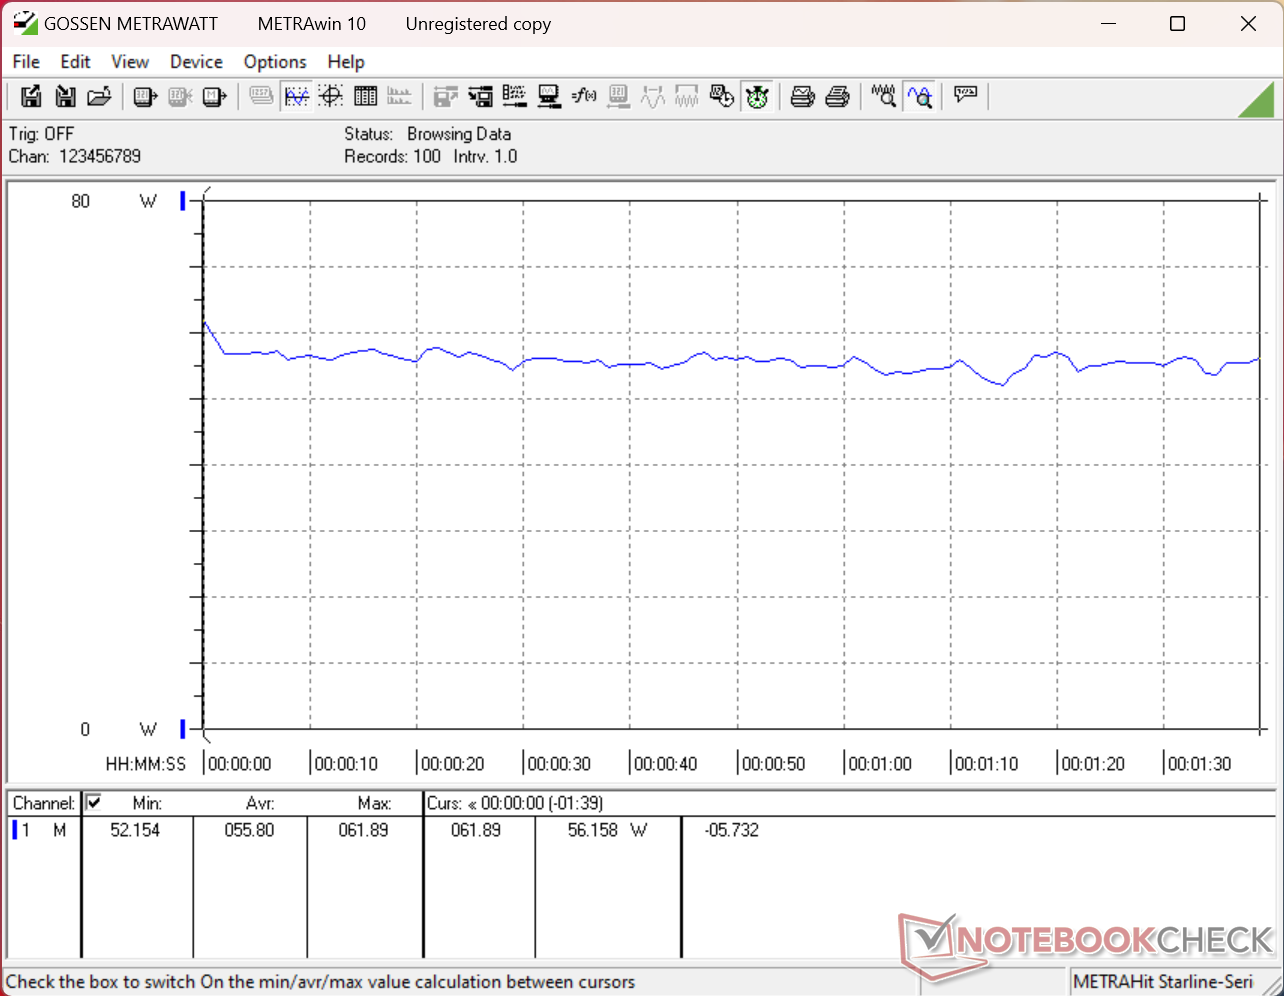
Consumo de 3DMark 06
Consumo de recursos de Cyberpunk 2077 en 1080p Ultra
El consumo se dispararía hasta los 69 W al iniciar la prueba de estrés Prime95, para luego descender y estabilizarse en 60 W tan solo unos segundos después.
La prueba de estrés con Prime95+FurMark se inició en el segundo 10.
Consumo de corriente
Off / Standbydarklight 0.26 / 2.7 Watt
Ociosodarkmidlight 5.4 / 10.1 / 10.3 Watt
Carga midlight 55.8 / 69.2 Watt
 color bar
Clave: min: dark, med: mid, max: light        Metrahit Energy
Dell Pro 5 16 P516265
Ryzen AI 9 HX PRO 470, Radeon 890M, SanDisk PC SN5100S, IPS, 2560x1600, 16"
Dell XPS 16 Core Ultra X7 358H
Ultra X7 358H, Arc B390 Panther Lake iGPU, , OLED, 3200x2000, 16"
Lenovo ThinkPad T16 Gen 5 22AN001WGE
R5 PRO 215, Radeon 740M, Samsung PM9C1b MZVL8512HFLU-00BLL, IPS, 1920x1200, 16"
MSI Venture 16 AI A2HMTG
Ultra 7 255H, Arc 140T, , IPS, 1920x1200, 16"
Asus ExpertBook B5 B5605CCA
Ultra 5 225H, Arc 130T, Micron 2500 MTFDKBA512QGN, IPS, 2560x1600, 16"
HP EliteBook 8 G1a 16 AI
Ryzen AI 7 PRO 350, Radeon 860M, Micron 3500 MTFDKBA512TGD, IPS, 1920x1200, 16"
Power Consumption
8%
21%
3%
10%
10%
Idle Minimum * (Watt)
5.4
4
26%
3.7
31%
5.9
-9%
4.7
13%
2.9
46%
Idle Average * (Watt)
10.1
4.4
56%
7.4
27%
9
11%
9.7
4%
6.5
36%
Idle Maximum * (Watt)
10.3
10.2
1%
8.1
21%
9.7
6%
10.1
2%
6.7
35%
Load Average * (Watt)
55.8
44.2
21%
40.8
27%
54.9
2%
44.2
21%
65.6
-18%
Cyberpunk 2077 ultra * (Watt)
61.6
62.6
-2%
45.1
27%
57.3
7%
50.3
18%
65.8
-7%
Cyberpunk 2077 ultra external monitor * (Watt)
58.6
62.4
-6%
43.7
25%
54.2
8%
50.9
13%
62.8
-7%
Load Maximum * (Watt)
69.2
94.6
-37%
78.9
-14%
72.3
-4%
69.6
-1%
80.6
-16%

* ... más pequeño es mejor

Consumo energético en modo «Cyberpunk» / Prueba de estrés

0510152025303540455055606570Tooltip
Dell Pro 5 16 P516265 Ryzen AI 9 HX PRO 470, Radeon 890M; 1280x720 Prime95 28.10 and Furmark 1.25: Ø65.1 (63-69.2) Watt
Samsung Galaxy Book6 Pro Ultra 7 356H, Intel Graphics 4 Xe3 PTL; 1280x720 Prime95 28.10 and Furmark 1.25: Ø57.8 (52.8-70.8) Watt
Dell Pro 5 16 P516265 Ryzen AI 9 HX PRO 470, Radeon 890M; Idle 150cd/m2: Ø6.29 (5.99-7.75) Watt
Samsung Galaxy Book6 Pro Ultra 7 356H, Intel Graphics 4 Xe3 PTL; Idle 150cd/m2: Ø3.37 (3.19-4.12) Watt
Dell Pro 5 16 P516265 Ryzen AI 9 HX PRO 470, Radeon 890M; Cyberpunk 2077 FHD ultra no FSR 150cd: Ø61.6 (60.4-64.1) Watt
Samsung Galaxy Book6 Pro Ultra 7 356H, Intel Graphics 4 Xe3 PTL; Cyberpunk 2077 FHD ultra no FSR 150cd: Ø52.7 (51.7-58) Watt

Consumo energético del monitor externo

0510152025303540455055606570Tooltip
Dell Pro 5 16 P516265 Ryzen AI 9 HX PRO 470, Radeon 890M; Prime95 V2810 Stress (external Monitor): Ø58.8 (56.3-69.3) Watt
Samsung Galaxy Book6 Pro Ultra 7 356H, Intel Graphics 4 Xe3 PTL; Prime95 V2810 Stress (external Monitor): Ø58.1 (52.5-70.8) Watt
Dell Pro 5 16 P516265 Ryzen AI 9 HX PRO 470, Radeon 890M; Cinebench R15 Multi (external Monitor): Ø55.7 (51-60) Watt
Samsung Galaxy Book6 Pro Ultra 7 356H, Intel Graphics 4 Xe3 PTL; Cinebench R15 Multi (external Monitor): Ø70.8 (70.6-70.8) Watt
Dell Pro 5 16 P516265 Ryzen AI 9 HX PRO 470, Radeon 890M; Cinebench R23 Multi (external Monitor): Ø52 (42.7-60.2) Watt
Samsung Galaxy Book6 Pro Ultra 7 356H, Intel Graphics 4 Xe3 PTL; Cinebench R23 Multi (external Monitor): Ø68.1 (65-70.8) Watt
Dell Pro 5 16 P516265 Ryzen AI 9 HX PRO 470, Radeon 890M; 1280x720 FurMark 1.19 GPU Stress Test (external Monitor): Ø58.4 (56.1-66.7) Watt
Samsung Galaxy Book6 Pro Ultra 7 356H, Intel Graphics 4 Xe3 PTL; 1280x720 FurMark 1.19 GPU Stress Test (external Monitor): Ø48 (44.3-49.8) Watt
Dell Pro 5 16 P516265 Ryzen AI 9 HX PRO 470, Radeon 890M; Idle 1min (external Monitor): Ø5.47 (5.17-6.32) Watt
Samsung Galaxy Book6 Pro Ultra 7 356H, Intel Graphics 4 Xe3 PTL; Idle 1min (external Monitor): Ø3.72 (3.53-4.46) Watt
Dell Pro 5 16 P516265 Ryzen AI 9 HX PRO 470, Radeon 890M; Cyberpunk 2077 FHD ultra no FSR (external Monitor): Ø58.6 (57.4-61.2) Watt
Samsung Galaxy Book6 Pro Ultra 7 356H, Intel Graphics 4 Xe3 PTL; Cyberpunk 2077 FHD ultra no FSR (external Monitor): Ø40.6 (35.7-44.8) Watt

Duración de la batería

Tiempo de Ejecución de la Batería
WiFi Websurfing
12h 28min
Dell Pro 5 16 P516265
Ryzen AI 9 HX PRO 470, Radeon 890M, 70 Wh
Dell XPS 16 Core Ultra X7 358H
Ultra X7 358H, Arc B390 Panther Lake iGPU, 70 Wh
Lenovo ThinkPad T16 Gen 5 22AN001WGE
R5 PRO 215, Radeon 740M, 75 Wh
MSI Venture 16 AI A2HMTG
Ultra 7 255H, Arc 140T, 55.2 Wh
Asus ExpertBook B5 B5605CCA
Ultra 5 225H, Arc 130T, 50 Wh
HP EliteBook 8 G1a 16 AI
Ryzen AI 7 PRO 350, Radeon 860M, 77 Wh
Duración de Batería
WiFi v1.3 (h)
12.5
10.3
-18%
15.8
26%
7
-44%
8.9
-29%
13.3
6%

Valoración de Notebookcheck

Un ordenador portátil empresarial tradicional, por no decir discreto, con memoria RAM extraíble, conexión WAN opcional y numerosos puertos integrados.

Dell Pro 5 16 P516265 - 07/24/2026 v8
Allen Ngo

Acabado
84 / 98 → 86%
Teclado
80%
Ratón
77%
Conectividad
70 / 80 → 88%
Peso
63 / 20-75 → 78%
Battería
89%
Pantalla
82%
Rendimiento de juegos
56 / 75 → 74%
Rendimiento de la Aplicación
89 / 92 → 96%
AI Performance
90%
Temperatura
92%
Ruido
80%
Audio
83%
Cámara
42 / 75 → 55%
Médio
67%
83%
Office - media ponderada
CO2 Emissions
No Data
Materials
50%
Packaging
100%
Power Use
76.7%
Repairability
Software Updates
39%
Recycle Logo Total Sustainability Score: 0%

Comparación con posibles competidores

Imagen
Modelo
Precio
Peso
Altura
Pantalla
1.
83.4%
Dell Pro 5 16 P516265
AMD Ryzen AI 9 HX PRO 470 ⎘
AMD Radeon 890M ⎘
64 GB Memoría, 1024 GB SSD
Amazon: Precio de catálogo: 4500 USD2 kg18.95 mm16.00"
2560x1600
189 PPI
IPS
2.
87.2%
Dell XPS 16 Core Ultra X7 358H
Intel Core Ultra X7 358H ⎘
Intel Arc B390 12 Xe3 Panther Lake iGPU ⎘
32 GB Memoría
Amazon:
1. $1,977.99
Dell Premium 16 (Previously ...
2. $2,399.99
Dell Premium 16 (Previously ...
3. $2,595.99
Dell Premium 16 (XPS 16 2025...
Precio de catálogo: 2350 USD
1.7 kg14.62 mm16.00"
3200x2000
236 PPI
OLED
3.
86.9%
Lenovo ThinkPad T16 Gen 5 22AN001WGE
AMD Ryzen 5 PRO 215 ⎘
AMD Radeon 740M ⎘
16 GB Memoría, 512 GB SSD
Amazon:
1. $1,249.99
Lenovo ThinkPad T16 Gen 4 La...
2. $1,299.95
Lenovo ThinkPad T16 Gen 4 Bu...
3. $1,789.99
Lenovo ThinkPad T16 Gen 4 Co...
Precio de catálogo: 1640€
1.9 kg18.2 mm16.00"
1920x1200
142 PPI
IPS
4.
80.7%
MSI Venture 16 AI A2HMTG
Intel Core Ultra 7 255H ⎘
Intel Arc Graphics 140T ⎘
32 GB Memoría
Amazon: Precio de catálogo: 1000 USD2.1 kg23.15 mm16.00"
1920x1200
142 PPI
IPS
5.
84.4%
Asus ExpertBook B5 B5605CCA
Intel Core Ultra 5 225H ⎘
Intel Arc Graphics 130T ⎘
16 GB Memoría, 512 GB SSD
Amazon: Precio de catálogo: 1300€1.7 kg18 mm16.00"
2560x1600
189 PPI
IPS
6.
87%
HP EliteBook 8 G1a 16 AI
AMD Ryzen AI 7 PRO 350 ⎘
AMD Radeon 860M ⎘
32 GB Memoría, 512 GB SSD
Amazon: Precio de catálogo: 4400 USD1.9 kg15.5 mm16.00"
1920x1200
142 PPI
IPS

Transparencia

La selección de los dispositivos que se van a reseñar corre a cargo de nuestro equipo editorial. La muestra de prueba fue proporcionada al autor en calidad de préstamo por el fabricante o el minorista a los efectos de esta reseña. El prestamista no tuvo ninguna influencia en esta reseña, ni el fabricante recibió una copia de la misma antes de su publicación. No había ninguna obligación de publicar esta reseña. Como empresa de medios independiente, Notebookcheck no está sujeta a la autoridad de fabricantes, minoristas o editores.

Así es como prueba Notebookcheck

Cada año, Notebookcheck revisa de forma independiente cientos de portátiles y smartphones utilizando procedimientos estandarizados para asegurar que todos los resultados son comparables. Hemos desarrollado continuamente nuestros métodos de prueba durante unos 20 años y hemos establecido los estándares de la industria en el proceso. En nuestros laboratorios de pruebas, técnicos y editores experimentados utilizan equipos de medición de alta calidad. Estas pruebas implican un proceso de validación en varias fases. Nuestro complejo sistema de clasificación se basa en cientos de mediciones y puntos de referencia bien fundamentados, lo que mantiene la objetividad.
Google LogoAdd as a preferred source on Google
Mail Logo
> Análisis y pruebas de ordenadores portátiles y móviles teléfonos > Análisis > Reseña del Dell Pro 5 16 P516265: tradicional y fiable
Allen Ngo, 2026-07-25 (Update: 2026-07-25)