Veredicto - Elevar los estándares
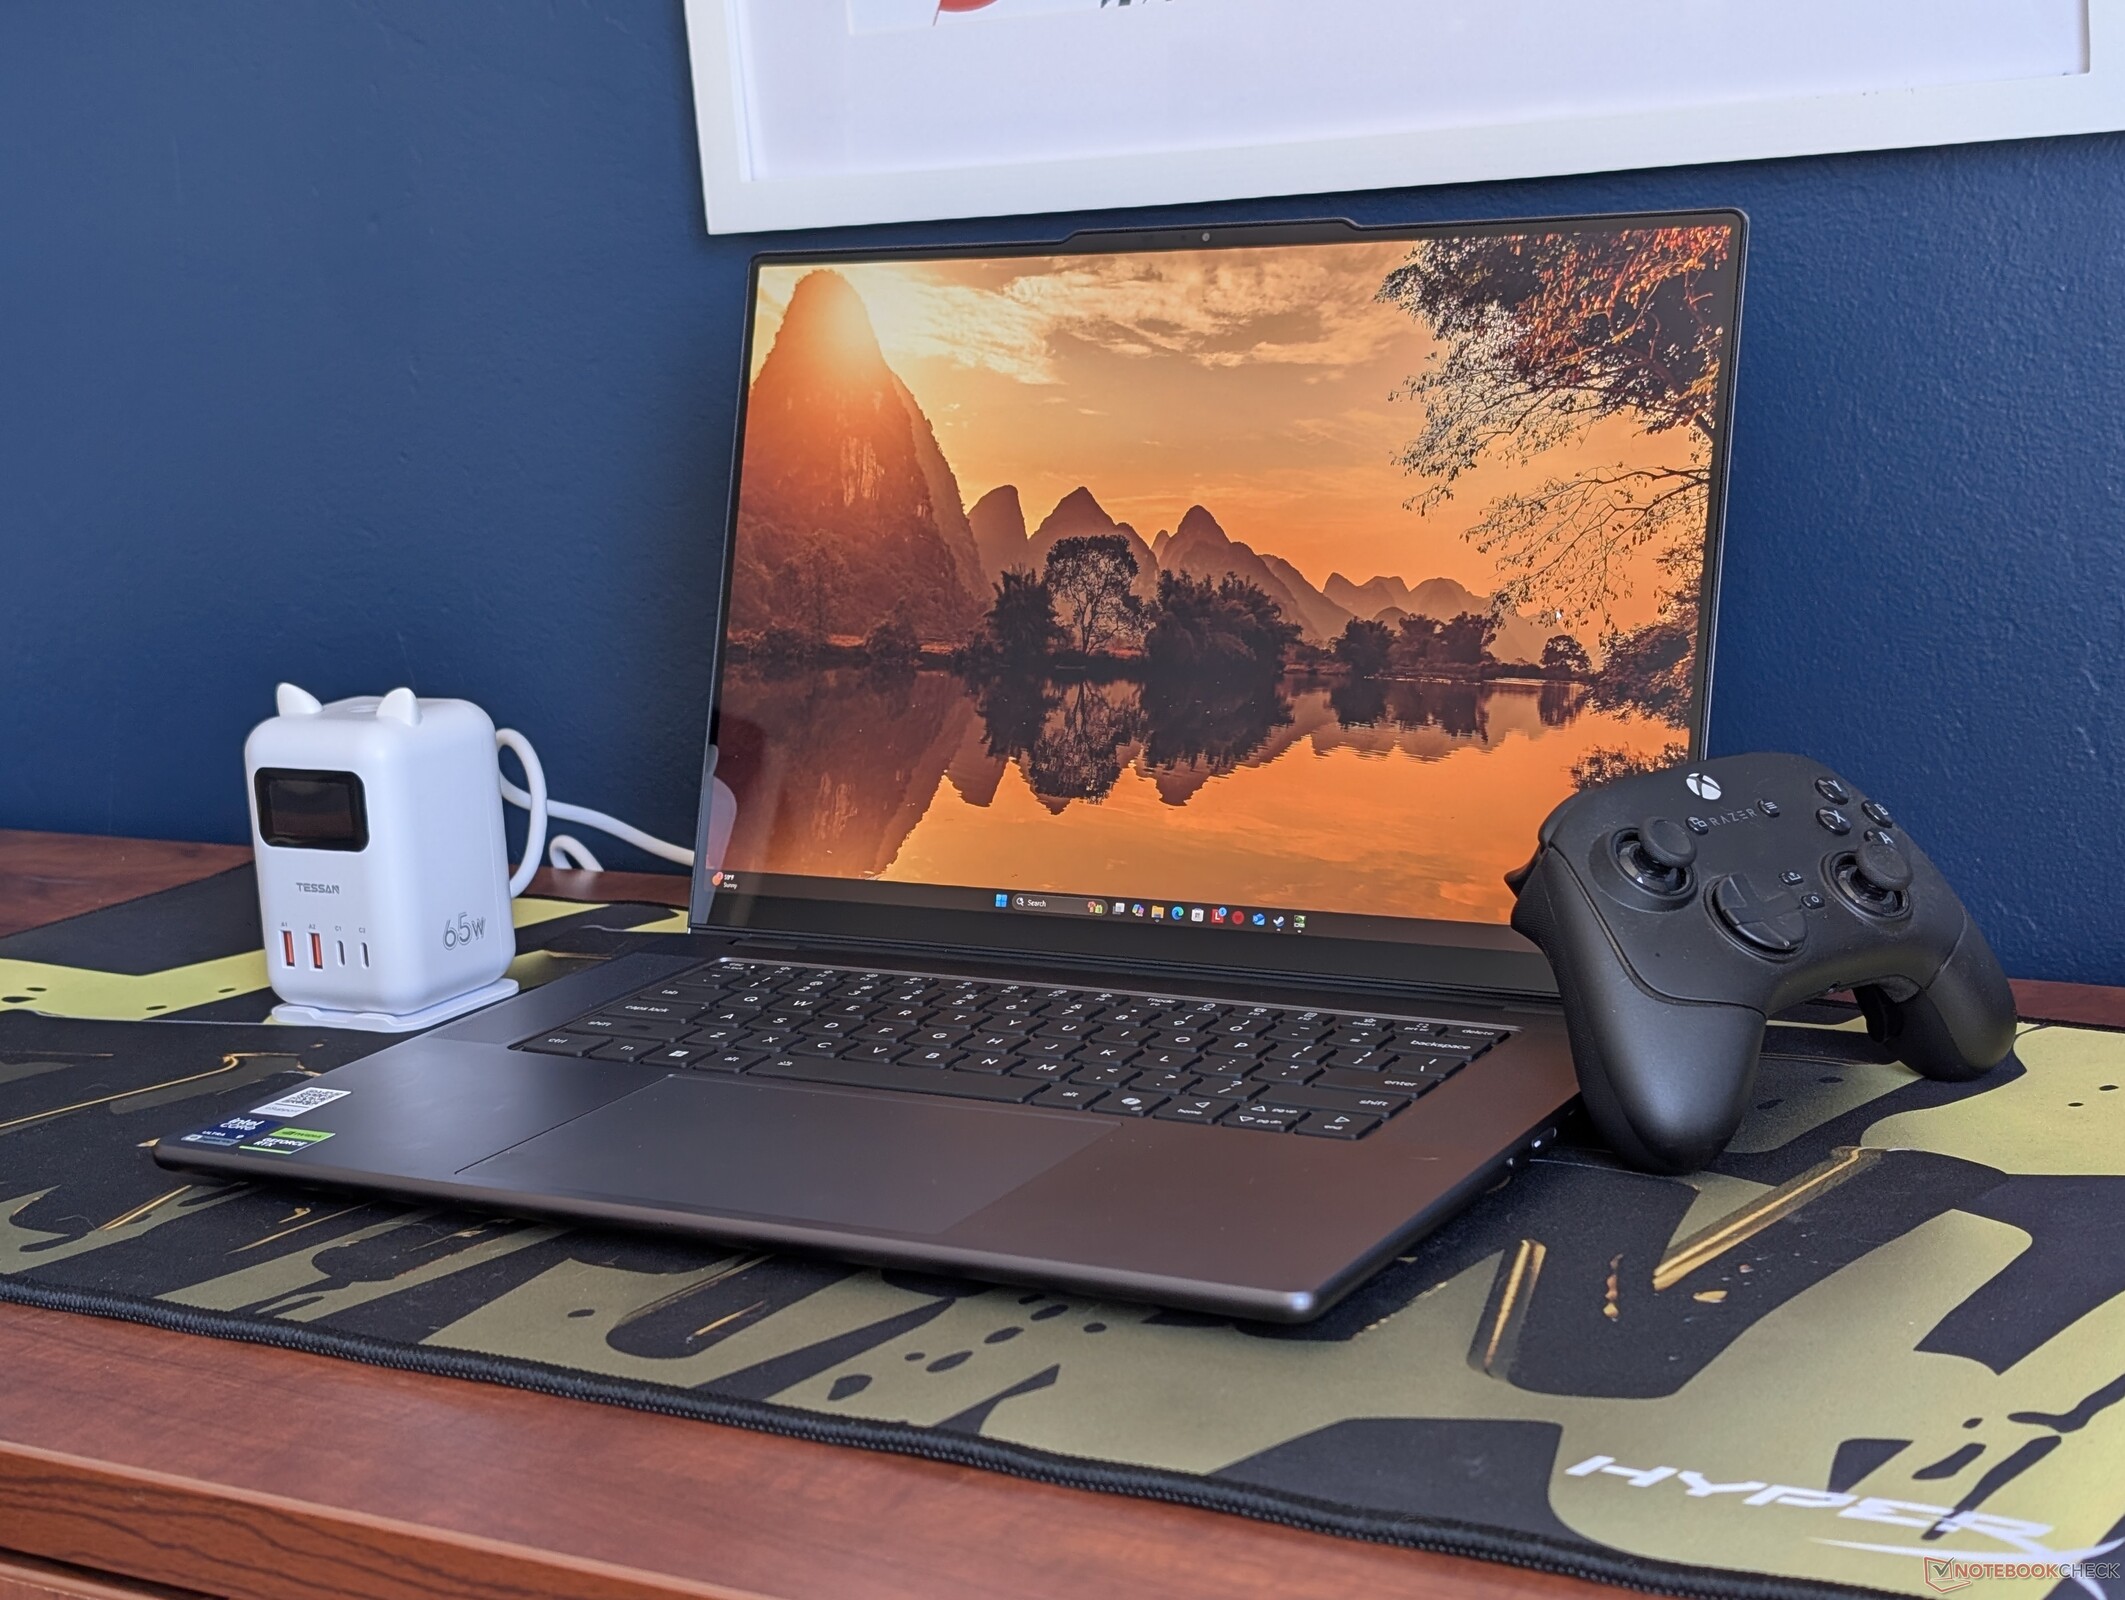
A diferencia de muchos clamshells tradicionales del mercado, el Lenovo Pro 9 16 G11 Aura incorpora nada menos que una CPU Core Ultra 9, una GPU GeForce RTX y una pantalla táctil OLED para ofrecer una experiencia de usuario de primera sin importar el nivel de configuración. Ofrece una de las pantallas táctiles más brillantes en su clase de tamaño y aparentemente marca todas las casillas que se le pueden pedir a una potencia multimedia, incluyendo un lector de tarjetas integrado, una saludable selección de puertos, un gran audio y soporte para múltiples SSD internas. No podemos decir lo mismo del nuevo Dell XPS 16 que ha omitido algunas de estas características en su último rediseño.
Aunque apreciamos que el modelo 2026 es ligeramente más delgado y ligero que el modelo 2025, por lo demás no ofrece muchas mejoras de rendimiento, ya que el nuevo Core Ultra 9 386H rinde casi lo mismo que el Core Ultra 9 285H del año pasado. Tanto la GPU como las opciones de pantalla siguen siendo las mismas, por lo que tampoco hay mejoras en la experiencia de usuario. La eliminación del teclado numérico en favor de unas rejillas de altavoz más grandes también puede afectar a ciertos escenarios de uso que dependen de él.
Los inconvenientes más notables del modelo son el ruido del ventilador cuando está en modo Rendimiento y tanto el mayor peso como la menor duración de la batería en relación con sus competidores, a pesar de la mejora de la capacidad de la batería. Atiborrar tantas funciones y puertos tiene evidentemente sus consecuencias cuando se trata de portabilidad. Los usuarios que puedan arreglárselas sin gráficos discretos o una lujosa pantalla OLED encontrarán el Panther Lake XPS 16 o el MSI Prestige 16 como alternativas mucho más silenciosas, elegantes y fáciles de transportar. Por otro lado, si realmente necesita gráficos discretos, entonces este Lenovo todoterreno sigue siendo una de nuestras máquinas multimedia de 16 pulgadas favoritas disponibles dos años consecutivos.
Pro
Contra
Precio y disponibilidad
La Lenovo Pro 9 16IPH11 ya está a la venta a partir de 2800 dólares para la configuración básica de 1800p RTX 5050 hasta más de 3100 dólares para la configuración de 2000p RTX 5060, tal y como se ha analizado.
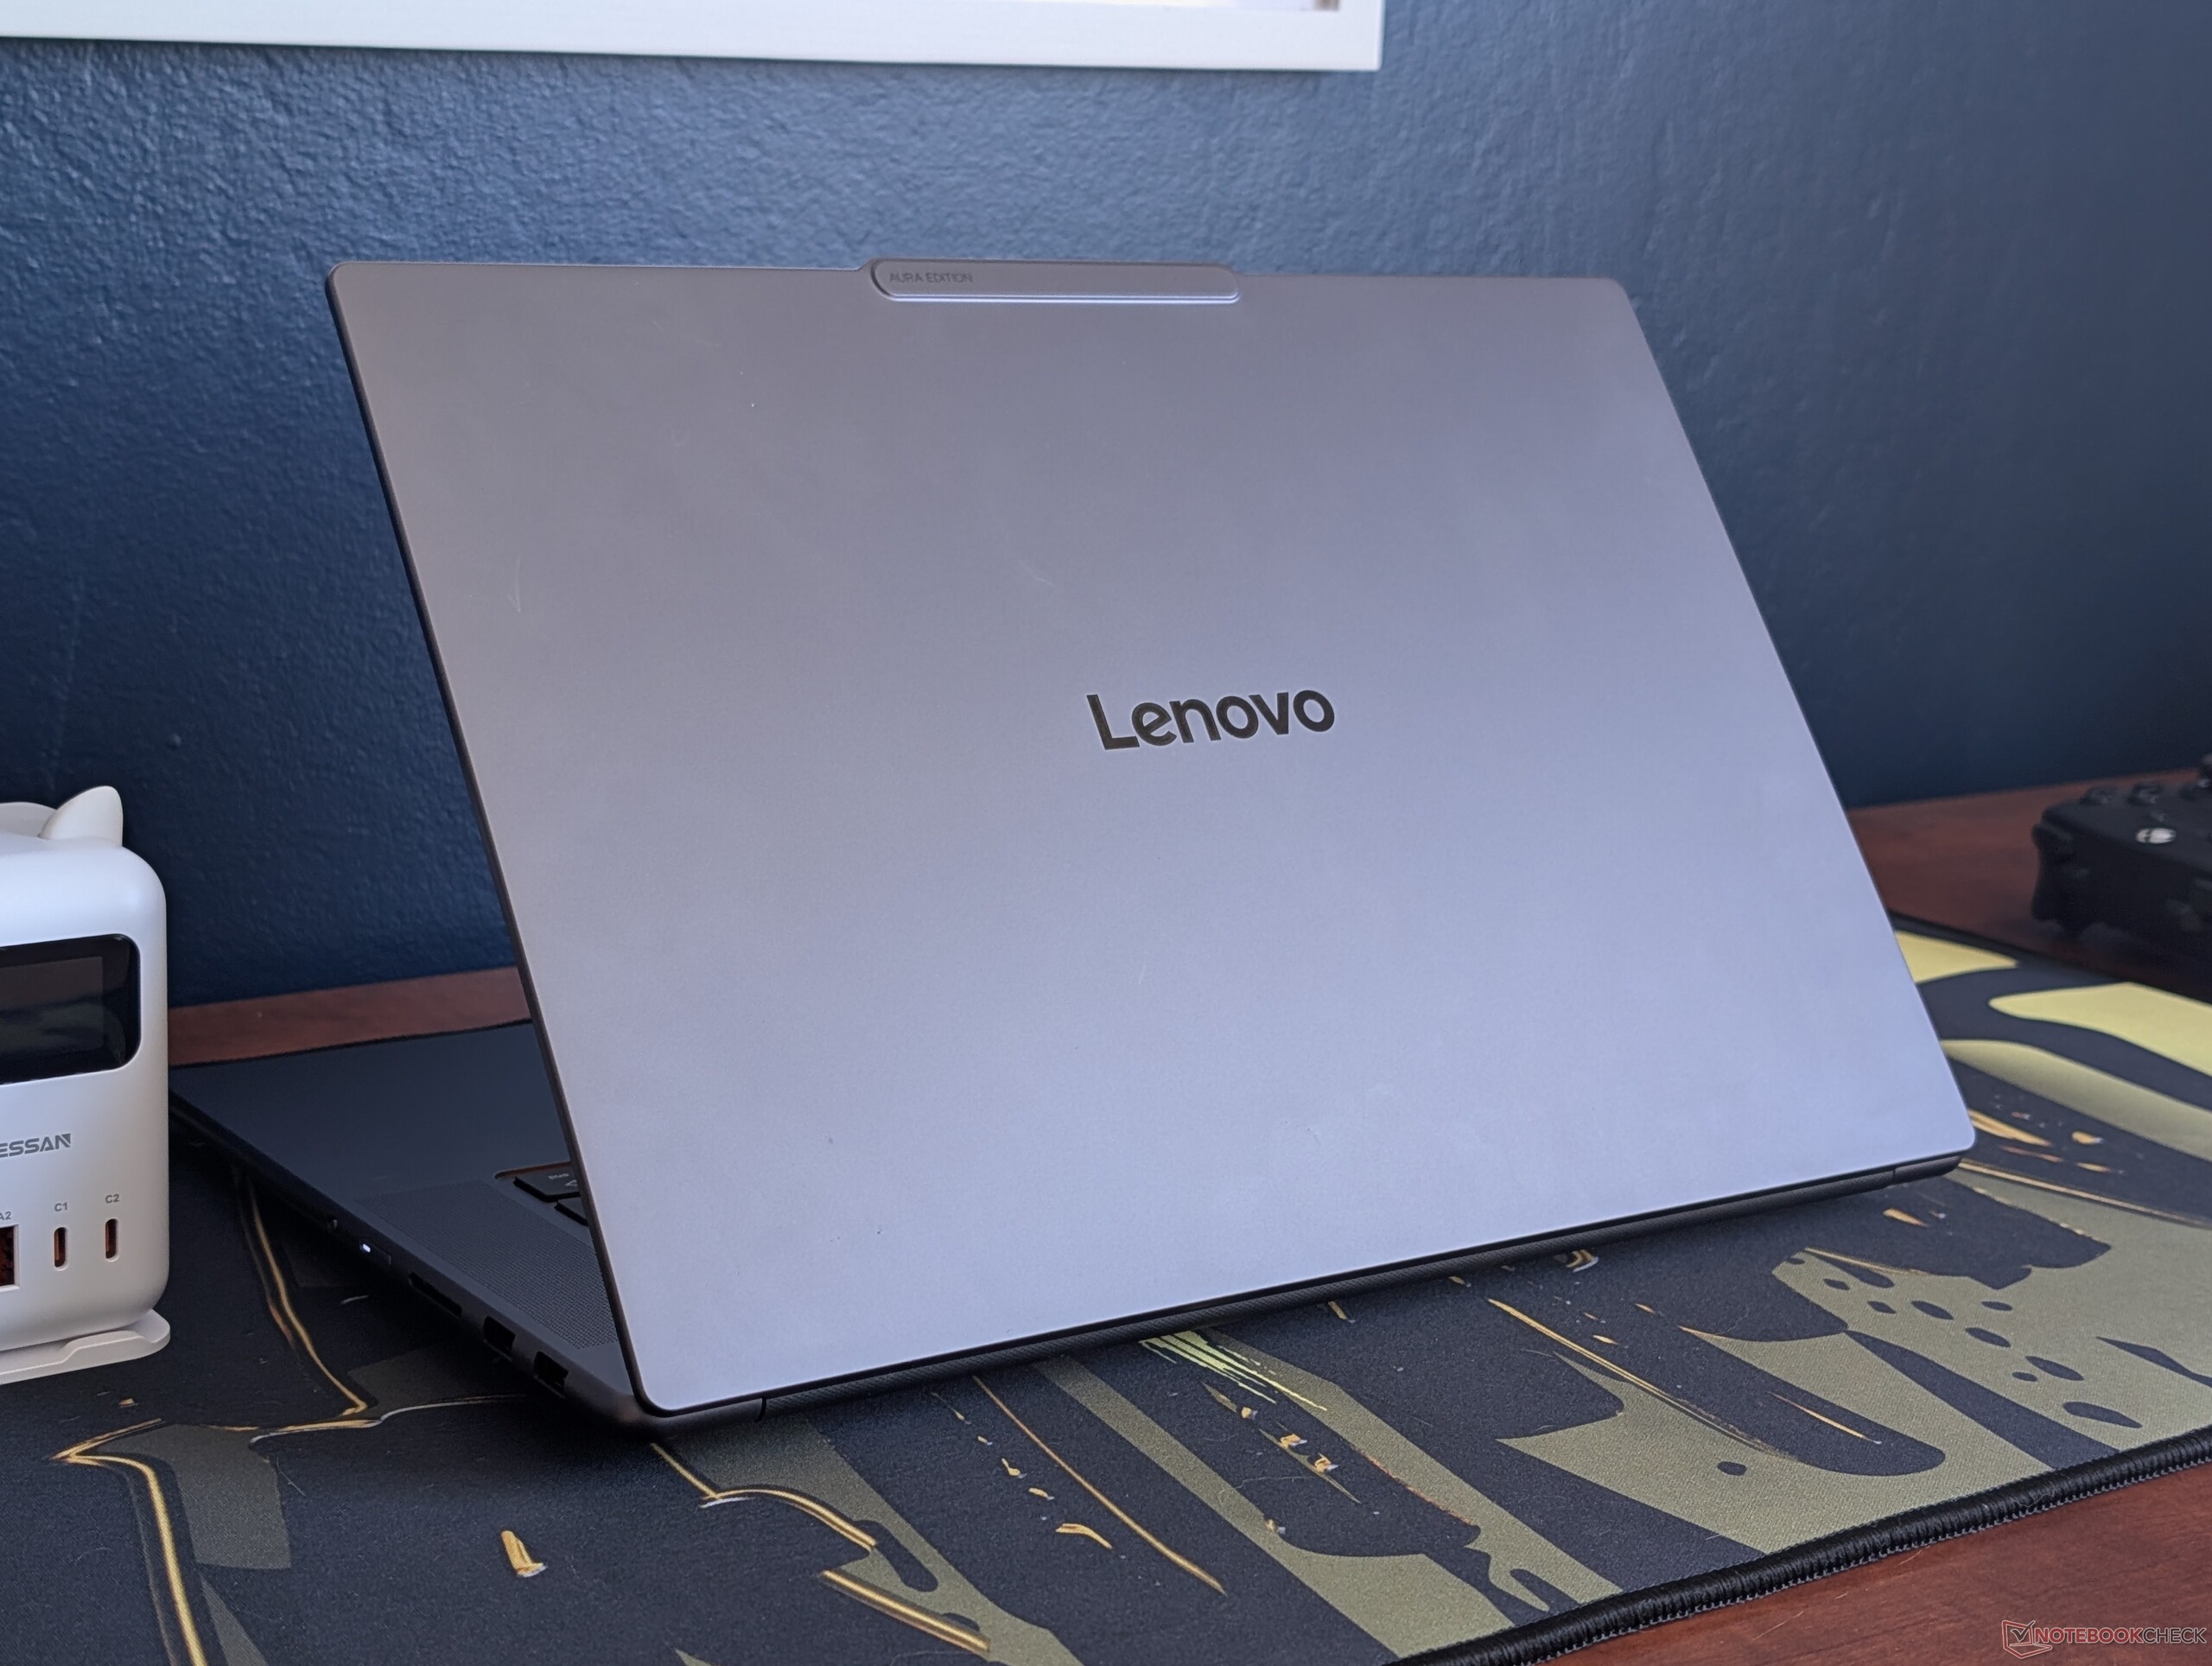
El Lenovo Pro 9 16IPH11 (comercializado como Lenovo Pro 9i Aura Edition 16 G11) sucede directamente al Yoga Pro 9i 16IAH G10 Aura del año pasado. El fabricante ha eliminado el nombre Yoga a la vez que ha refrescado el diseño externo.
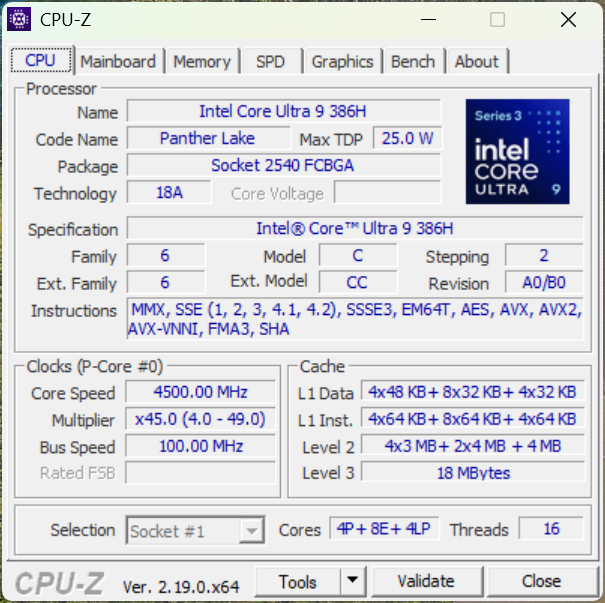
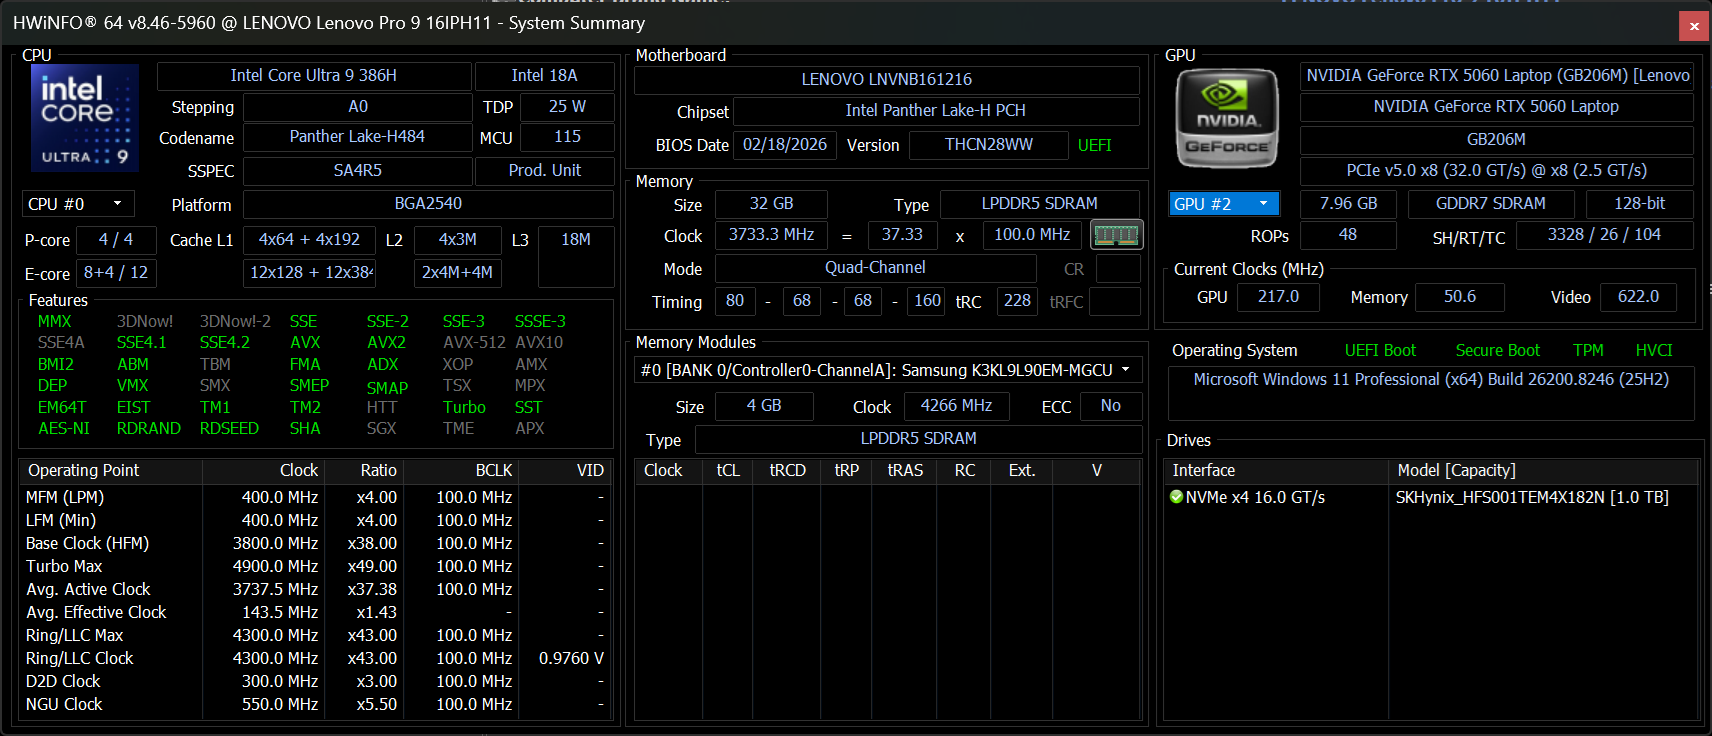
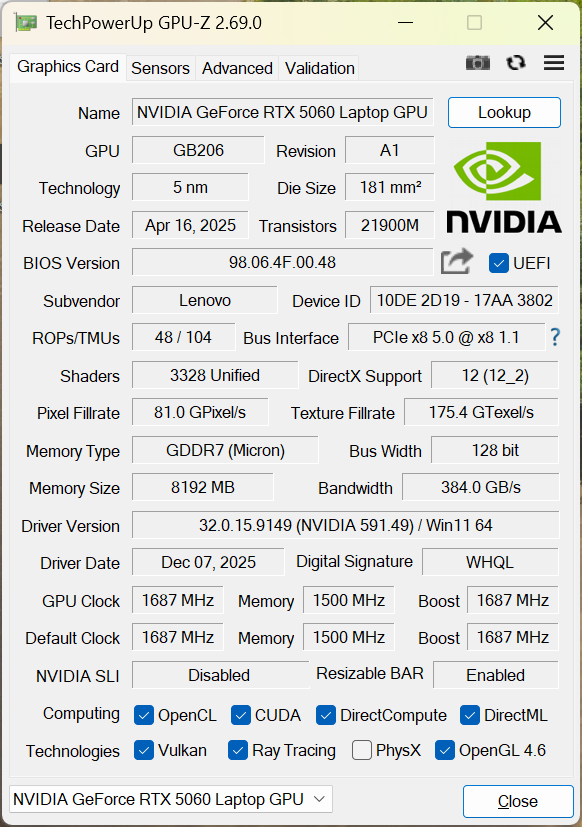
Nuestra unidad de prueba es la configuración superior equipada con la GPU GeForce RTX 5060 de 100 W y pantalla táctil OLED Tandem de 3200 x 2000 por aproximadamente 3100 dólares. Las SKU de gama inferior vienen con la RTX 5050 o la OLED de 2880 x 1800 en su lugar, pero todas las opciones se envían con la misma CPU Core Ultra 9 386H Panther Lake.
Este modelo insignia de Lenovo compite directamente con otras máquinas multimedia de 16 pulgadas de gama alta, como el MSI Prestige 16 AI Evo, La serie ZenBook 16 de Asusy el nuevo Dell XPS 16.
Más reseñas de Lenovo:
Especificaciones
Caso
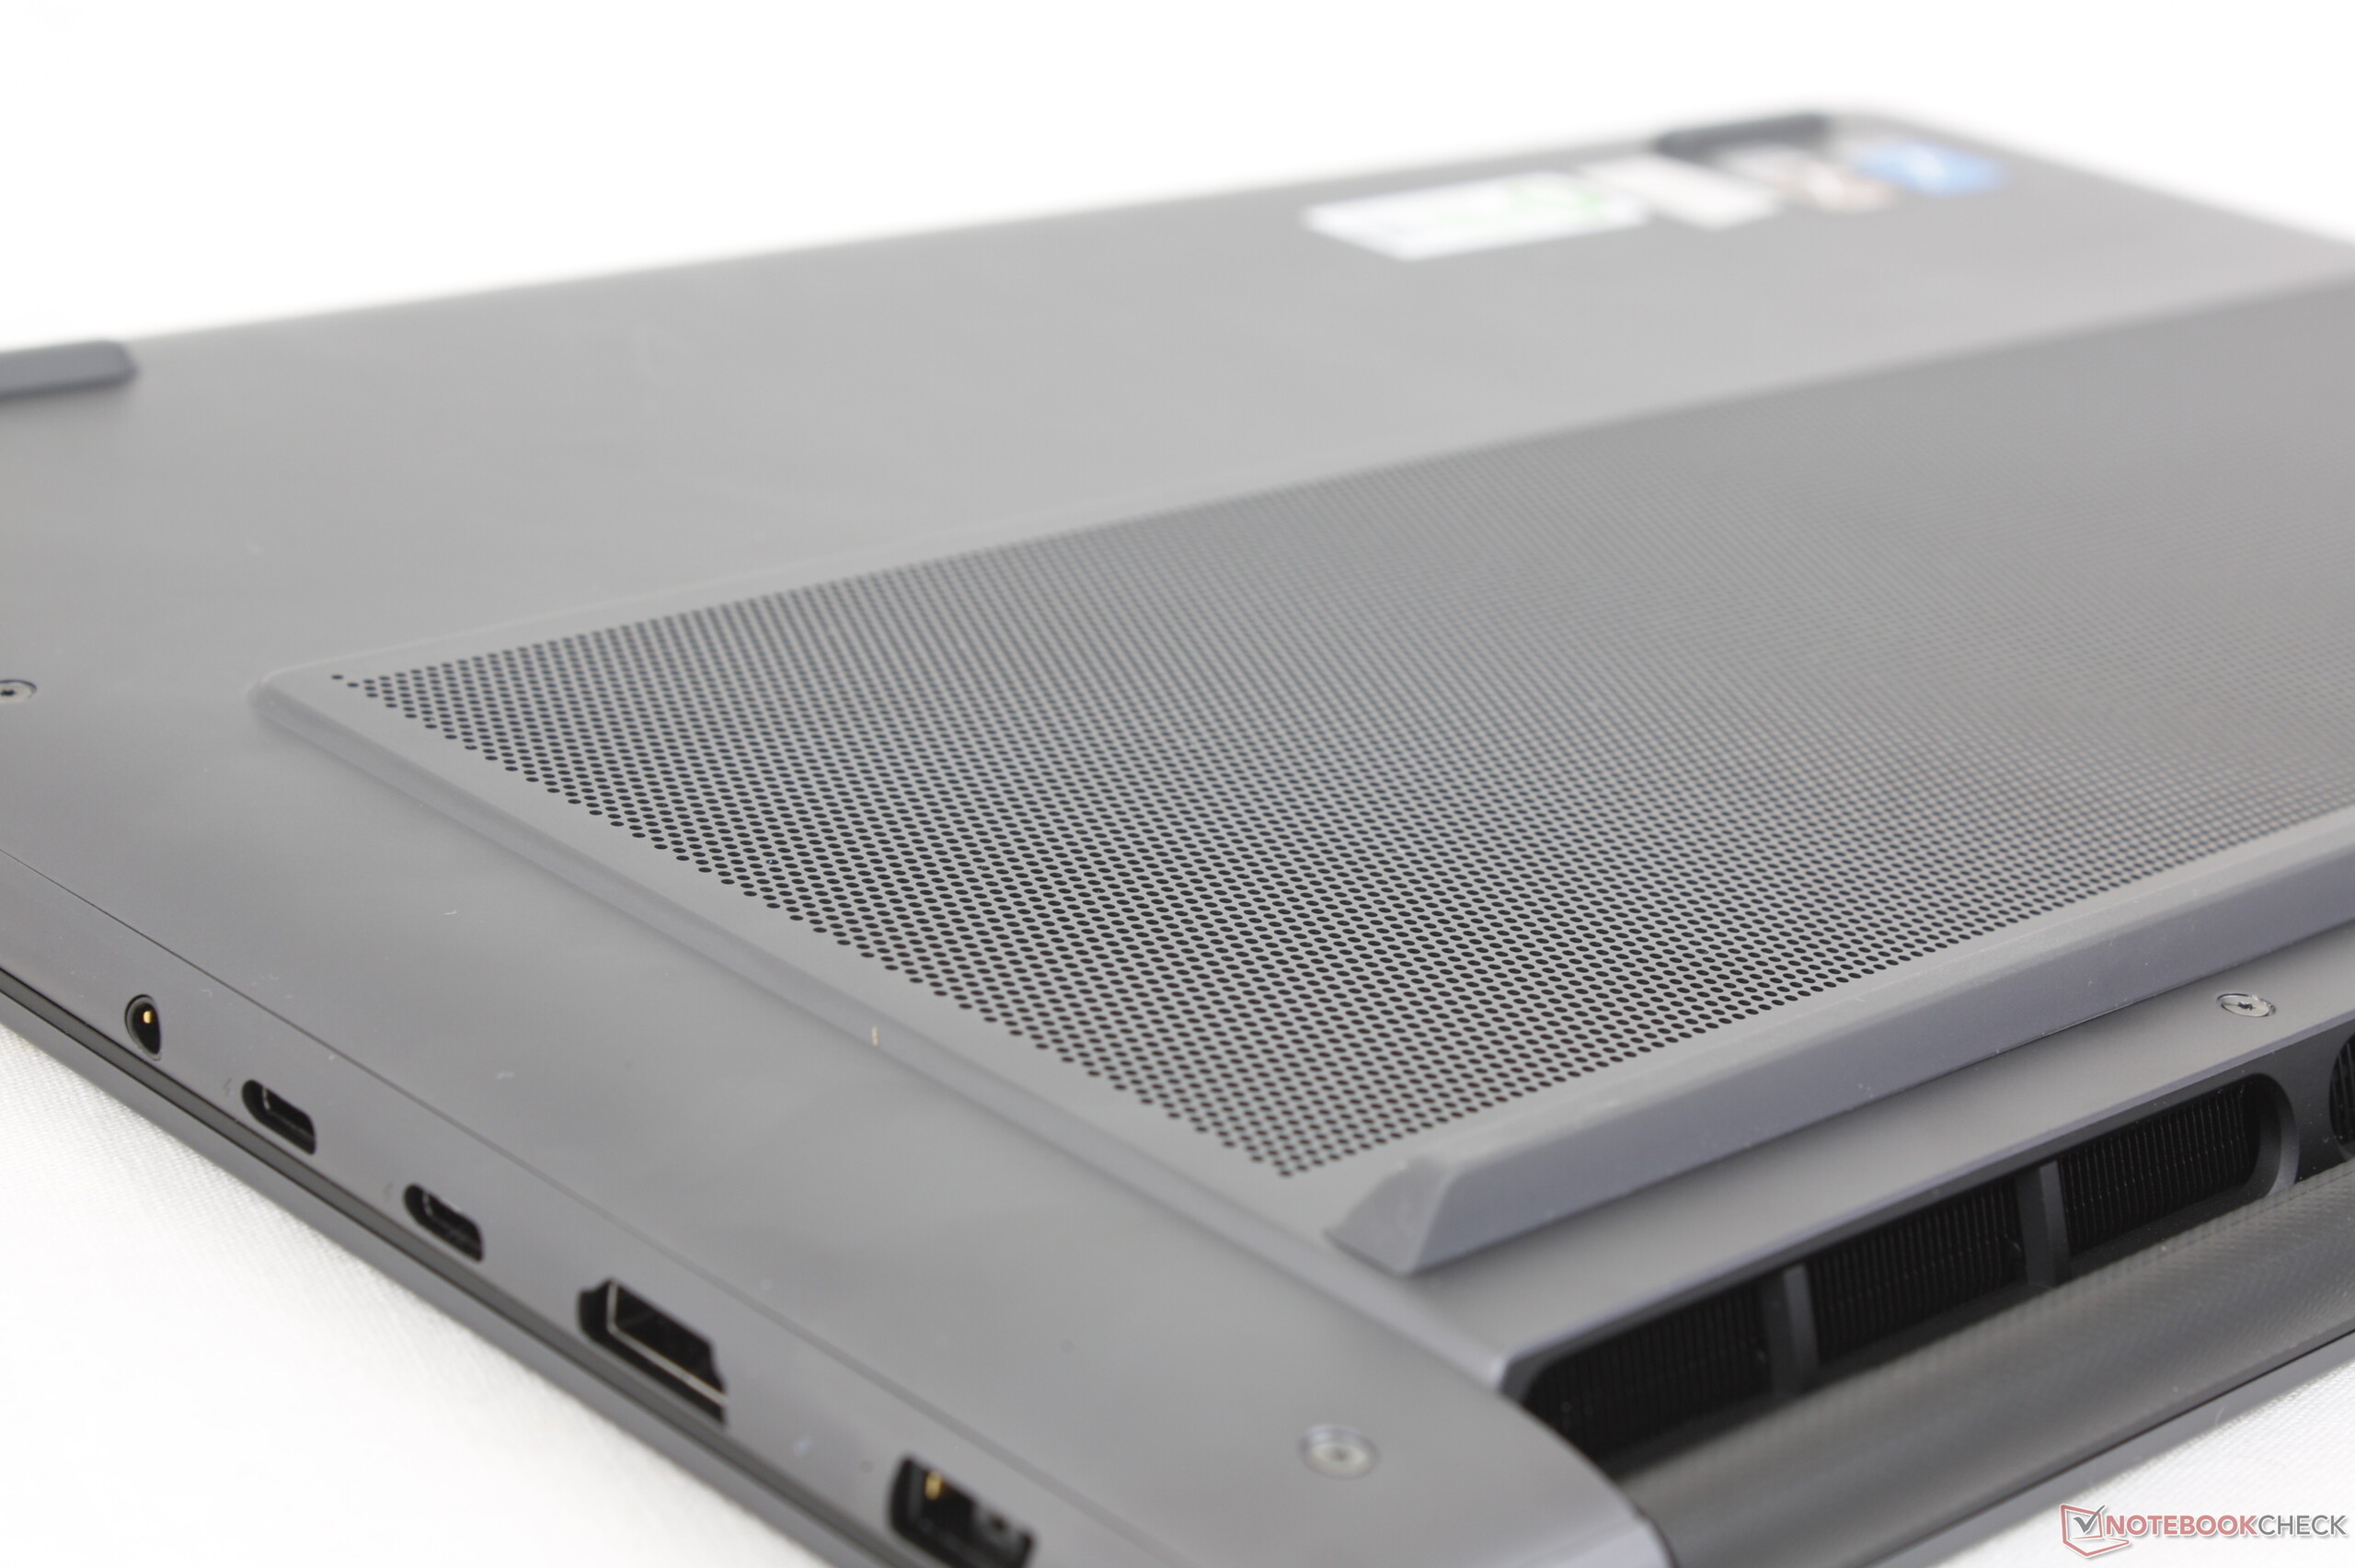
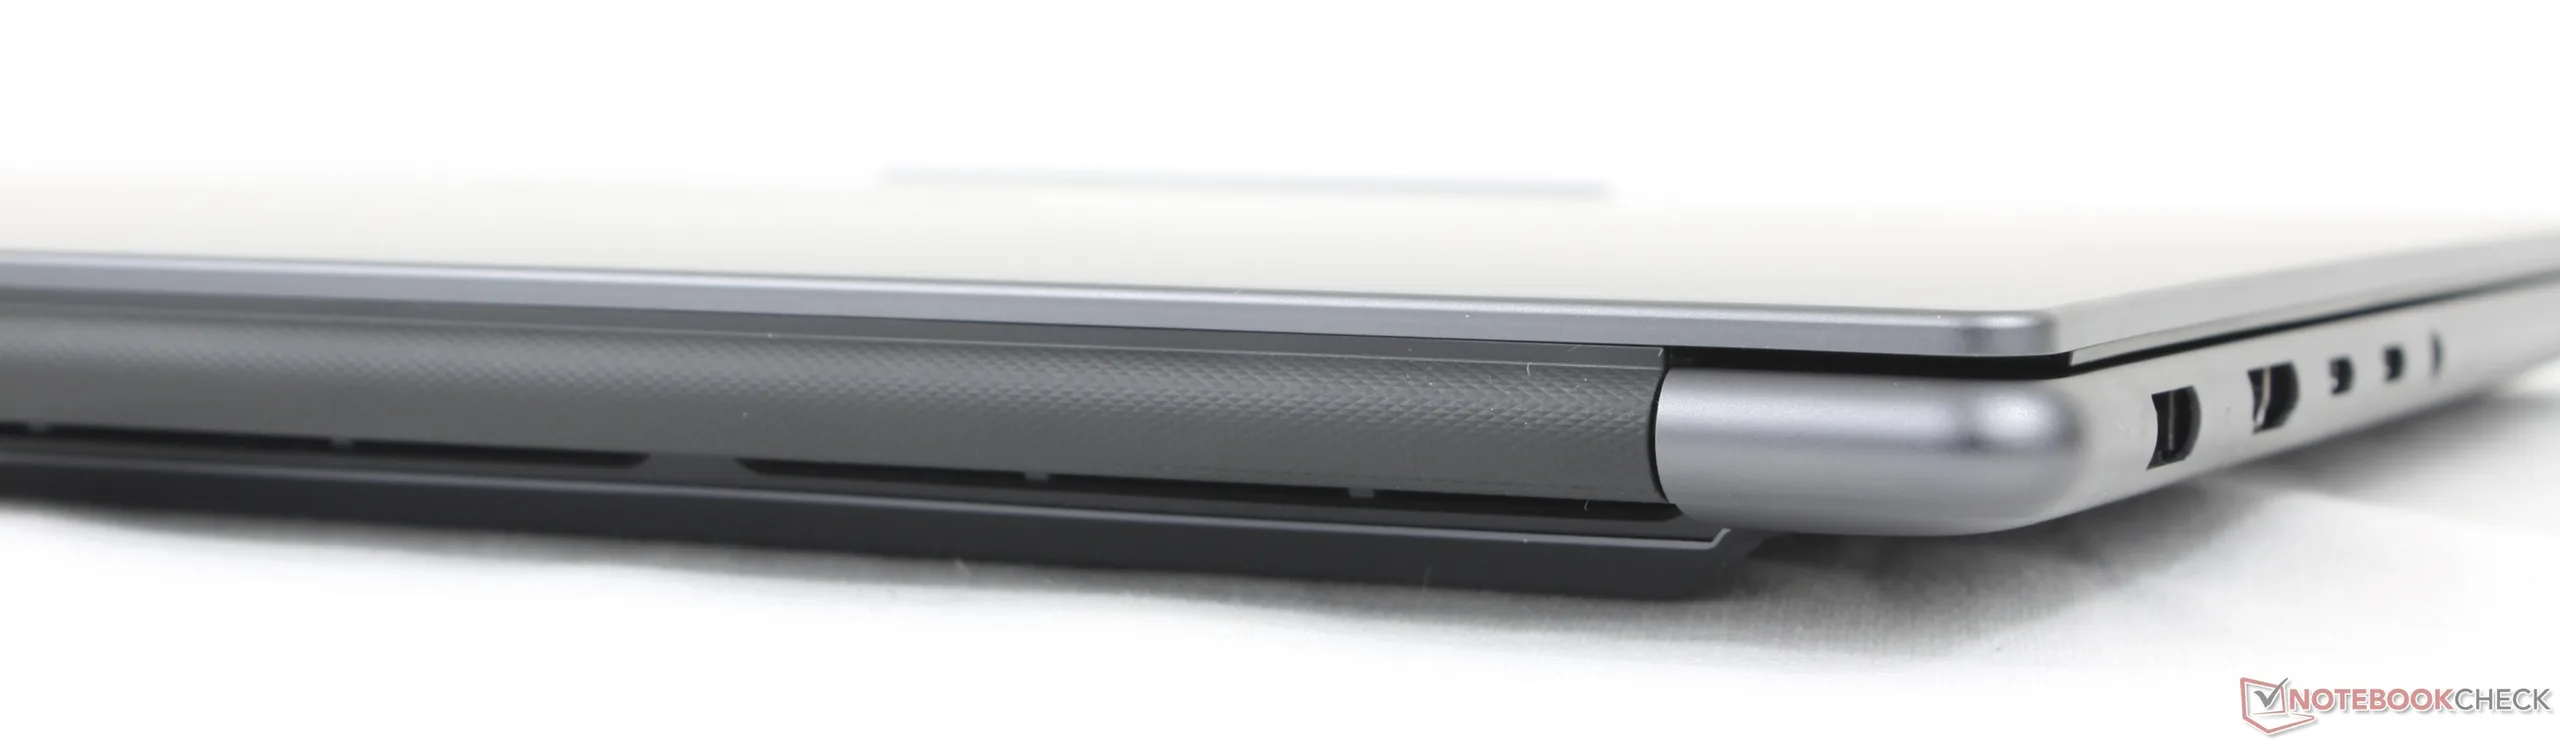
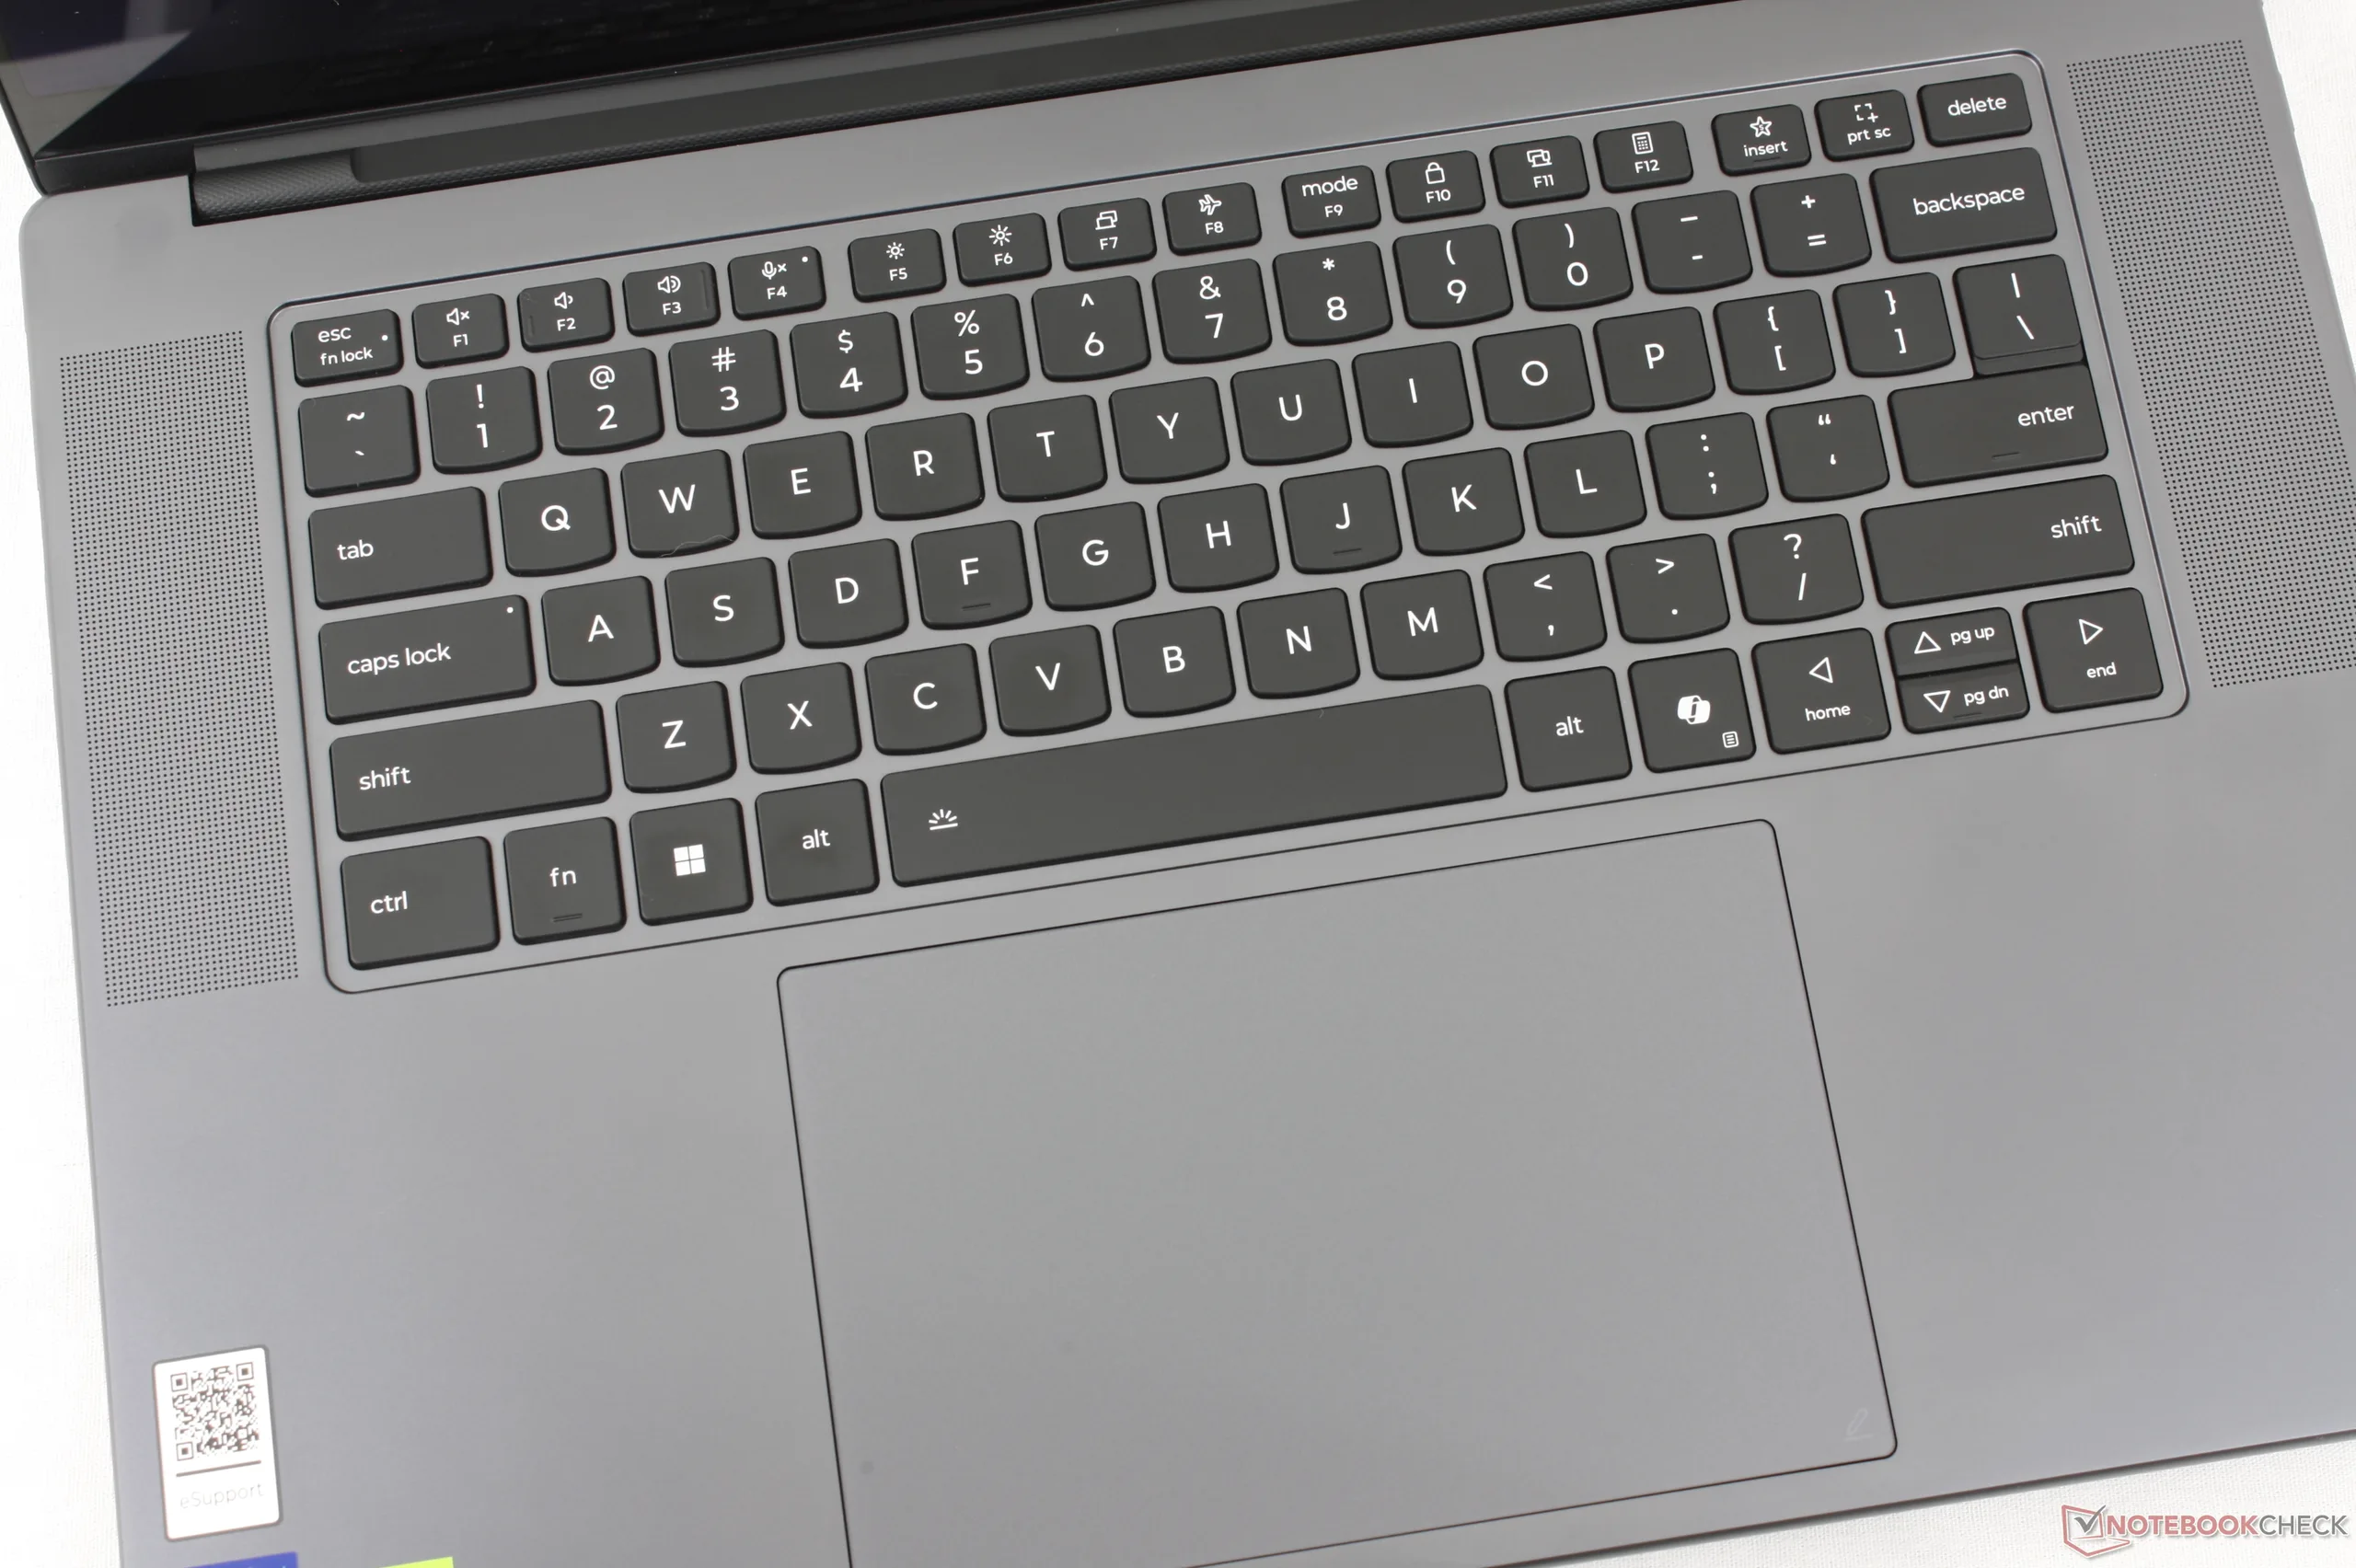
Lenovo ha realizado varios cambios externos con respecto al diseño del año pasado. El más notable es la eliminación del teclado numérico en favor de unas rejillas de ventilación más grandes a lo largo de los laterales del teclado. Además, la cubierta inferior D ya no es completamente plana, ya que las rejillas de ventilación están ahora ligeramente elevadas. La etiqueta "Yoga" grabada con láser que era tan prominente en el modelo del año pasado también se ha eliminado ya que Lenovo quiere enfatizar en su lugar la denominación "Pro".
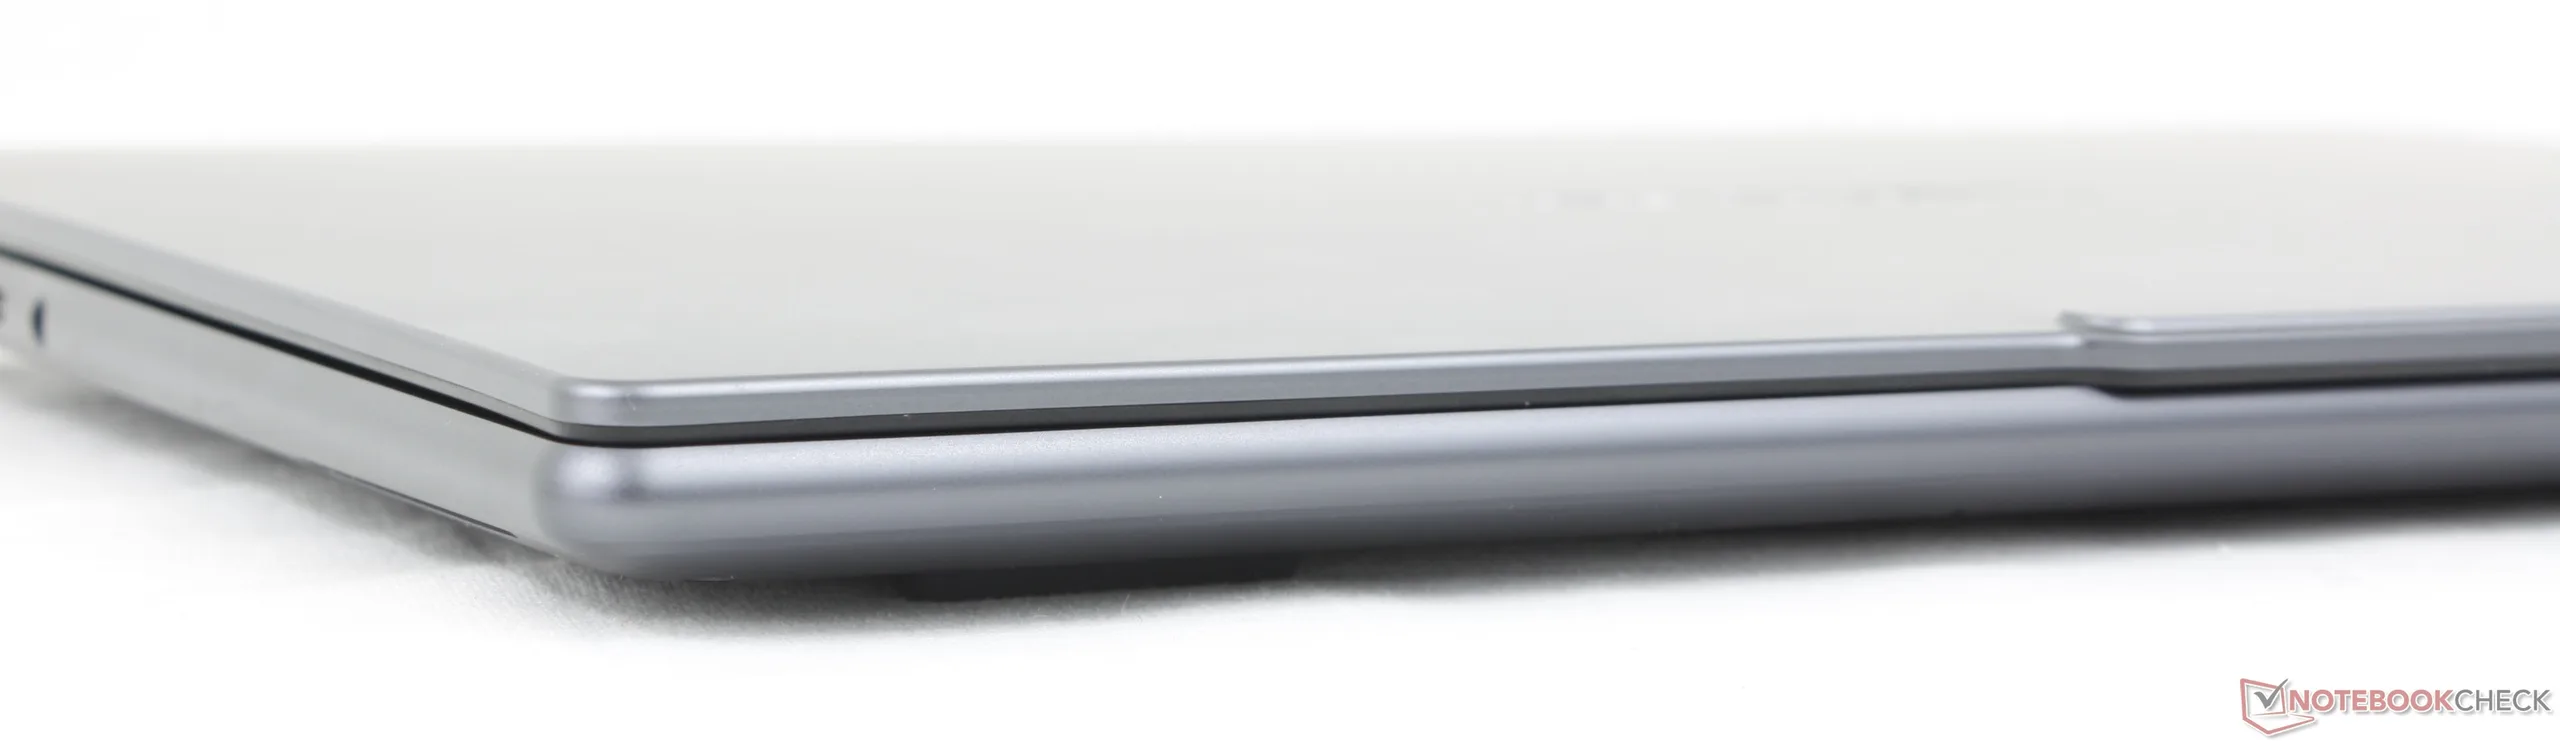
El nuevo modelo es ligeramente más delgado, pequeño y ligero que la generación anterior pero, por lo demás, con los mismos materiales de aluminio anodizado para un nivel de calidad similar.
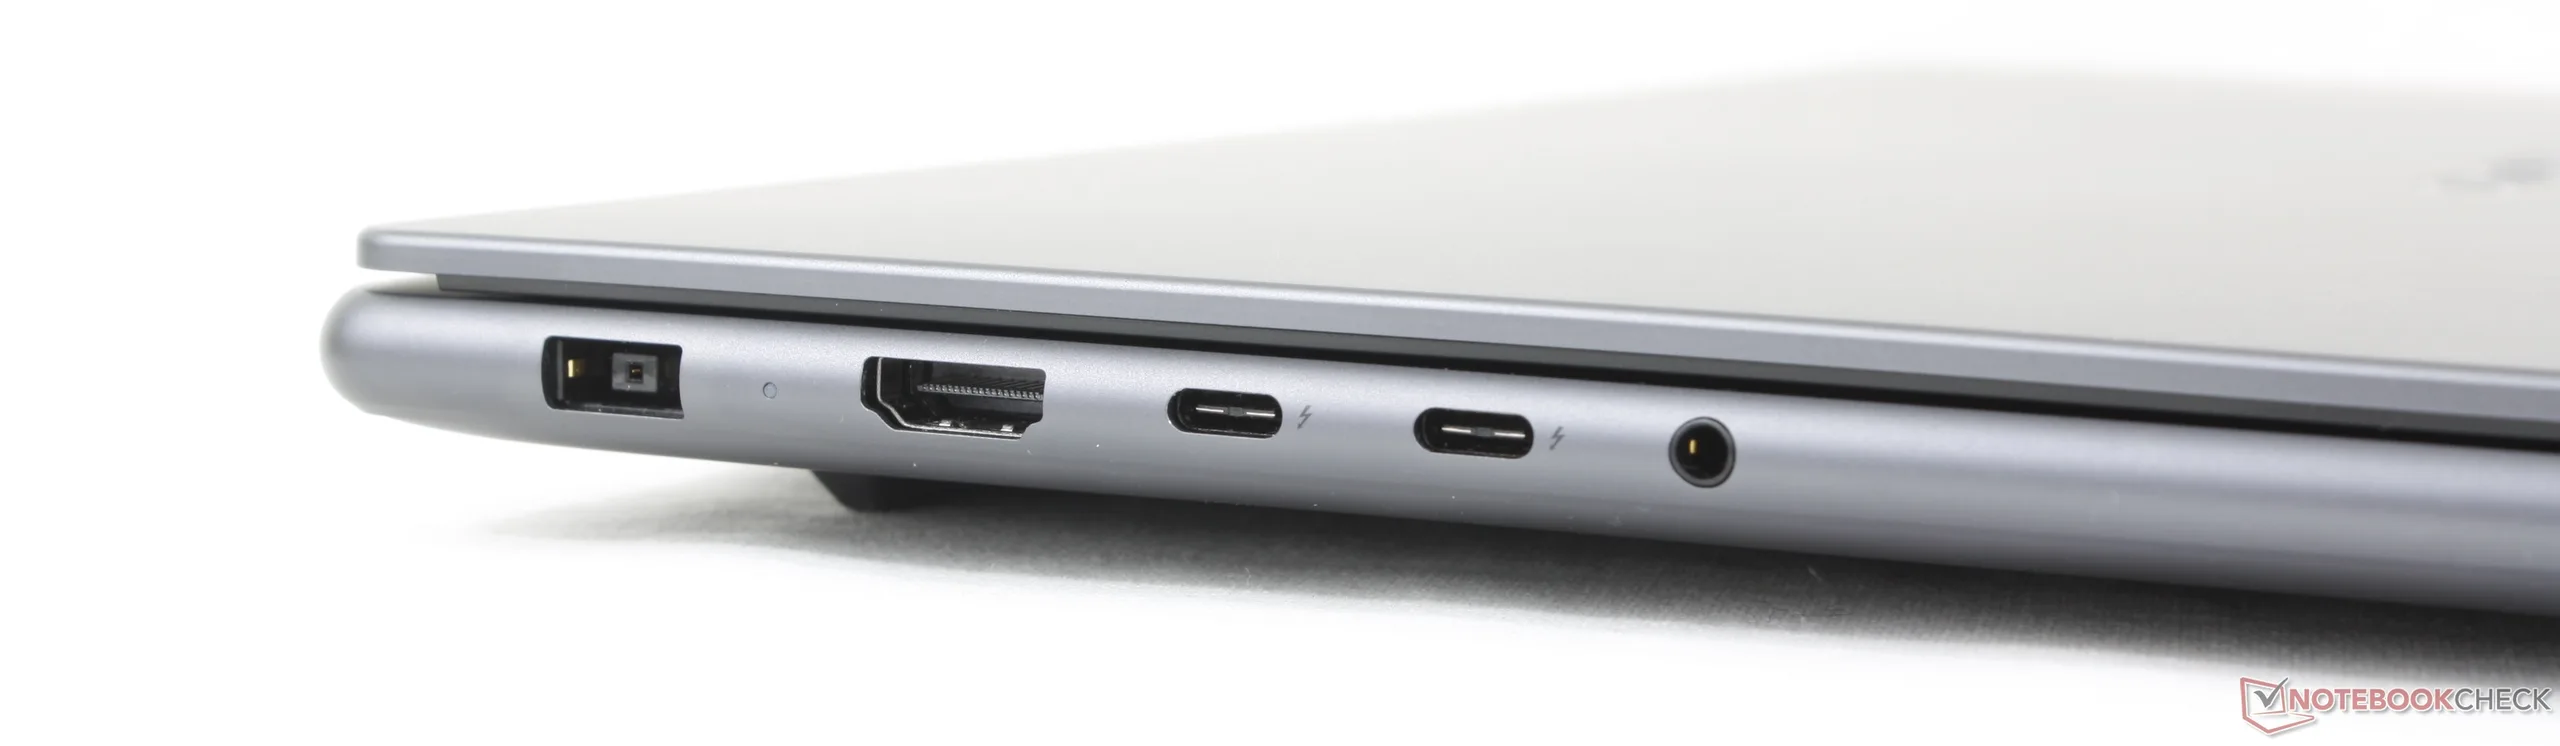
Conectividad
A pesar de todos los cambios físicos mencionados, los puertos siguen siendo los mismos que antes.
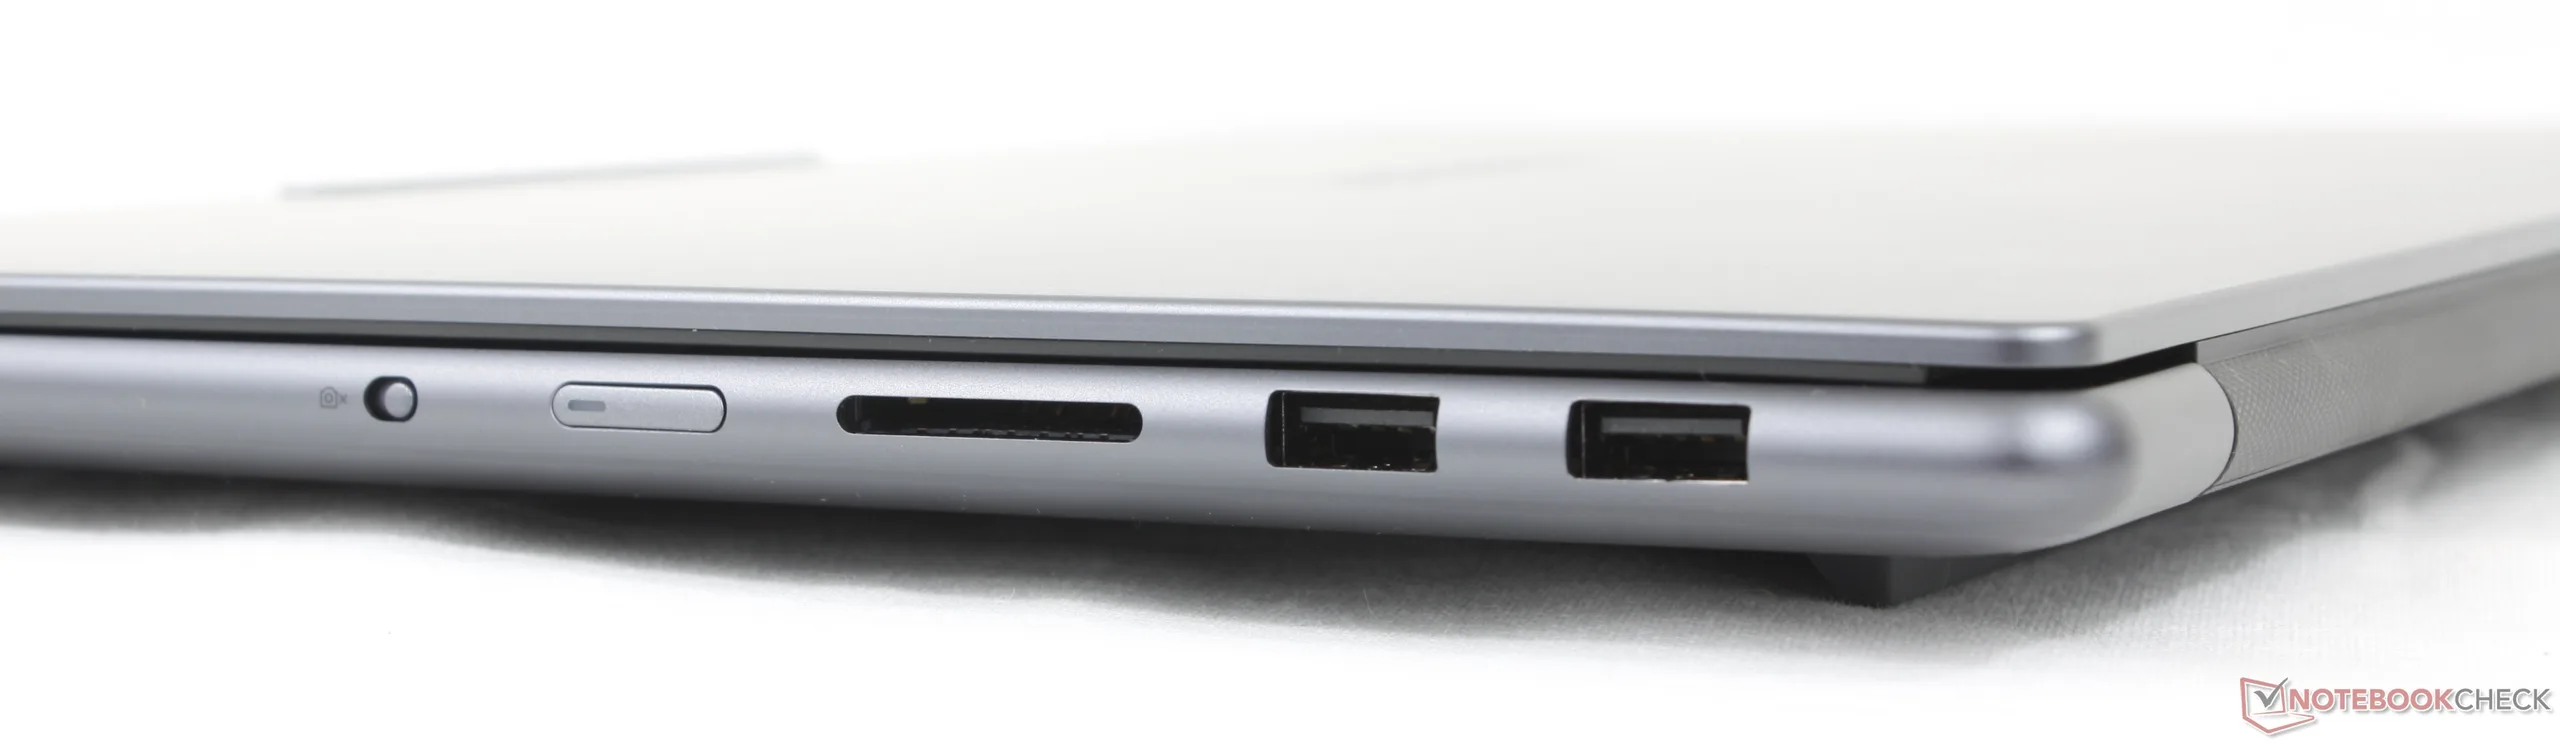
Lector de tarjetas SD
| SD Card Reader | |
| average JPG Copy Test (av. of 3 runs) | |
| Lenovo Pro 9 16IPH11 (Toshiba Exceria Pro SDXC 64 GB UHS-II) | |
| Asus ProArt P16 H7606WP (Angelbird AV Pro V60) | |
| MSI Prestige 16 AI Evo B2HMG (Angelbird AV Pro V60) | |
| Lenovo Yoga Pro 9 16IAH10 RTX 5050 (Angelbird AV Pro V60) | |
| maximum AS SSD Seq Read Test (1GB) | |
| Asus ProArt P16 H7606WP (Angelbird AV Pro V60) | |
| Lenovo Pro 9 16IPH11 (Toshiba Exceria Pro SDXC 64 GB UHS-II) | |
| Lenovo Yoga Pro 9 16IAH10 RTX 5050 (Angelbird AV Pro V60) | |
| MSI Prestige 16 AI Evo B2HMG (Angelbird AV Pro V60) | |
Comunicación
Cámara web


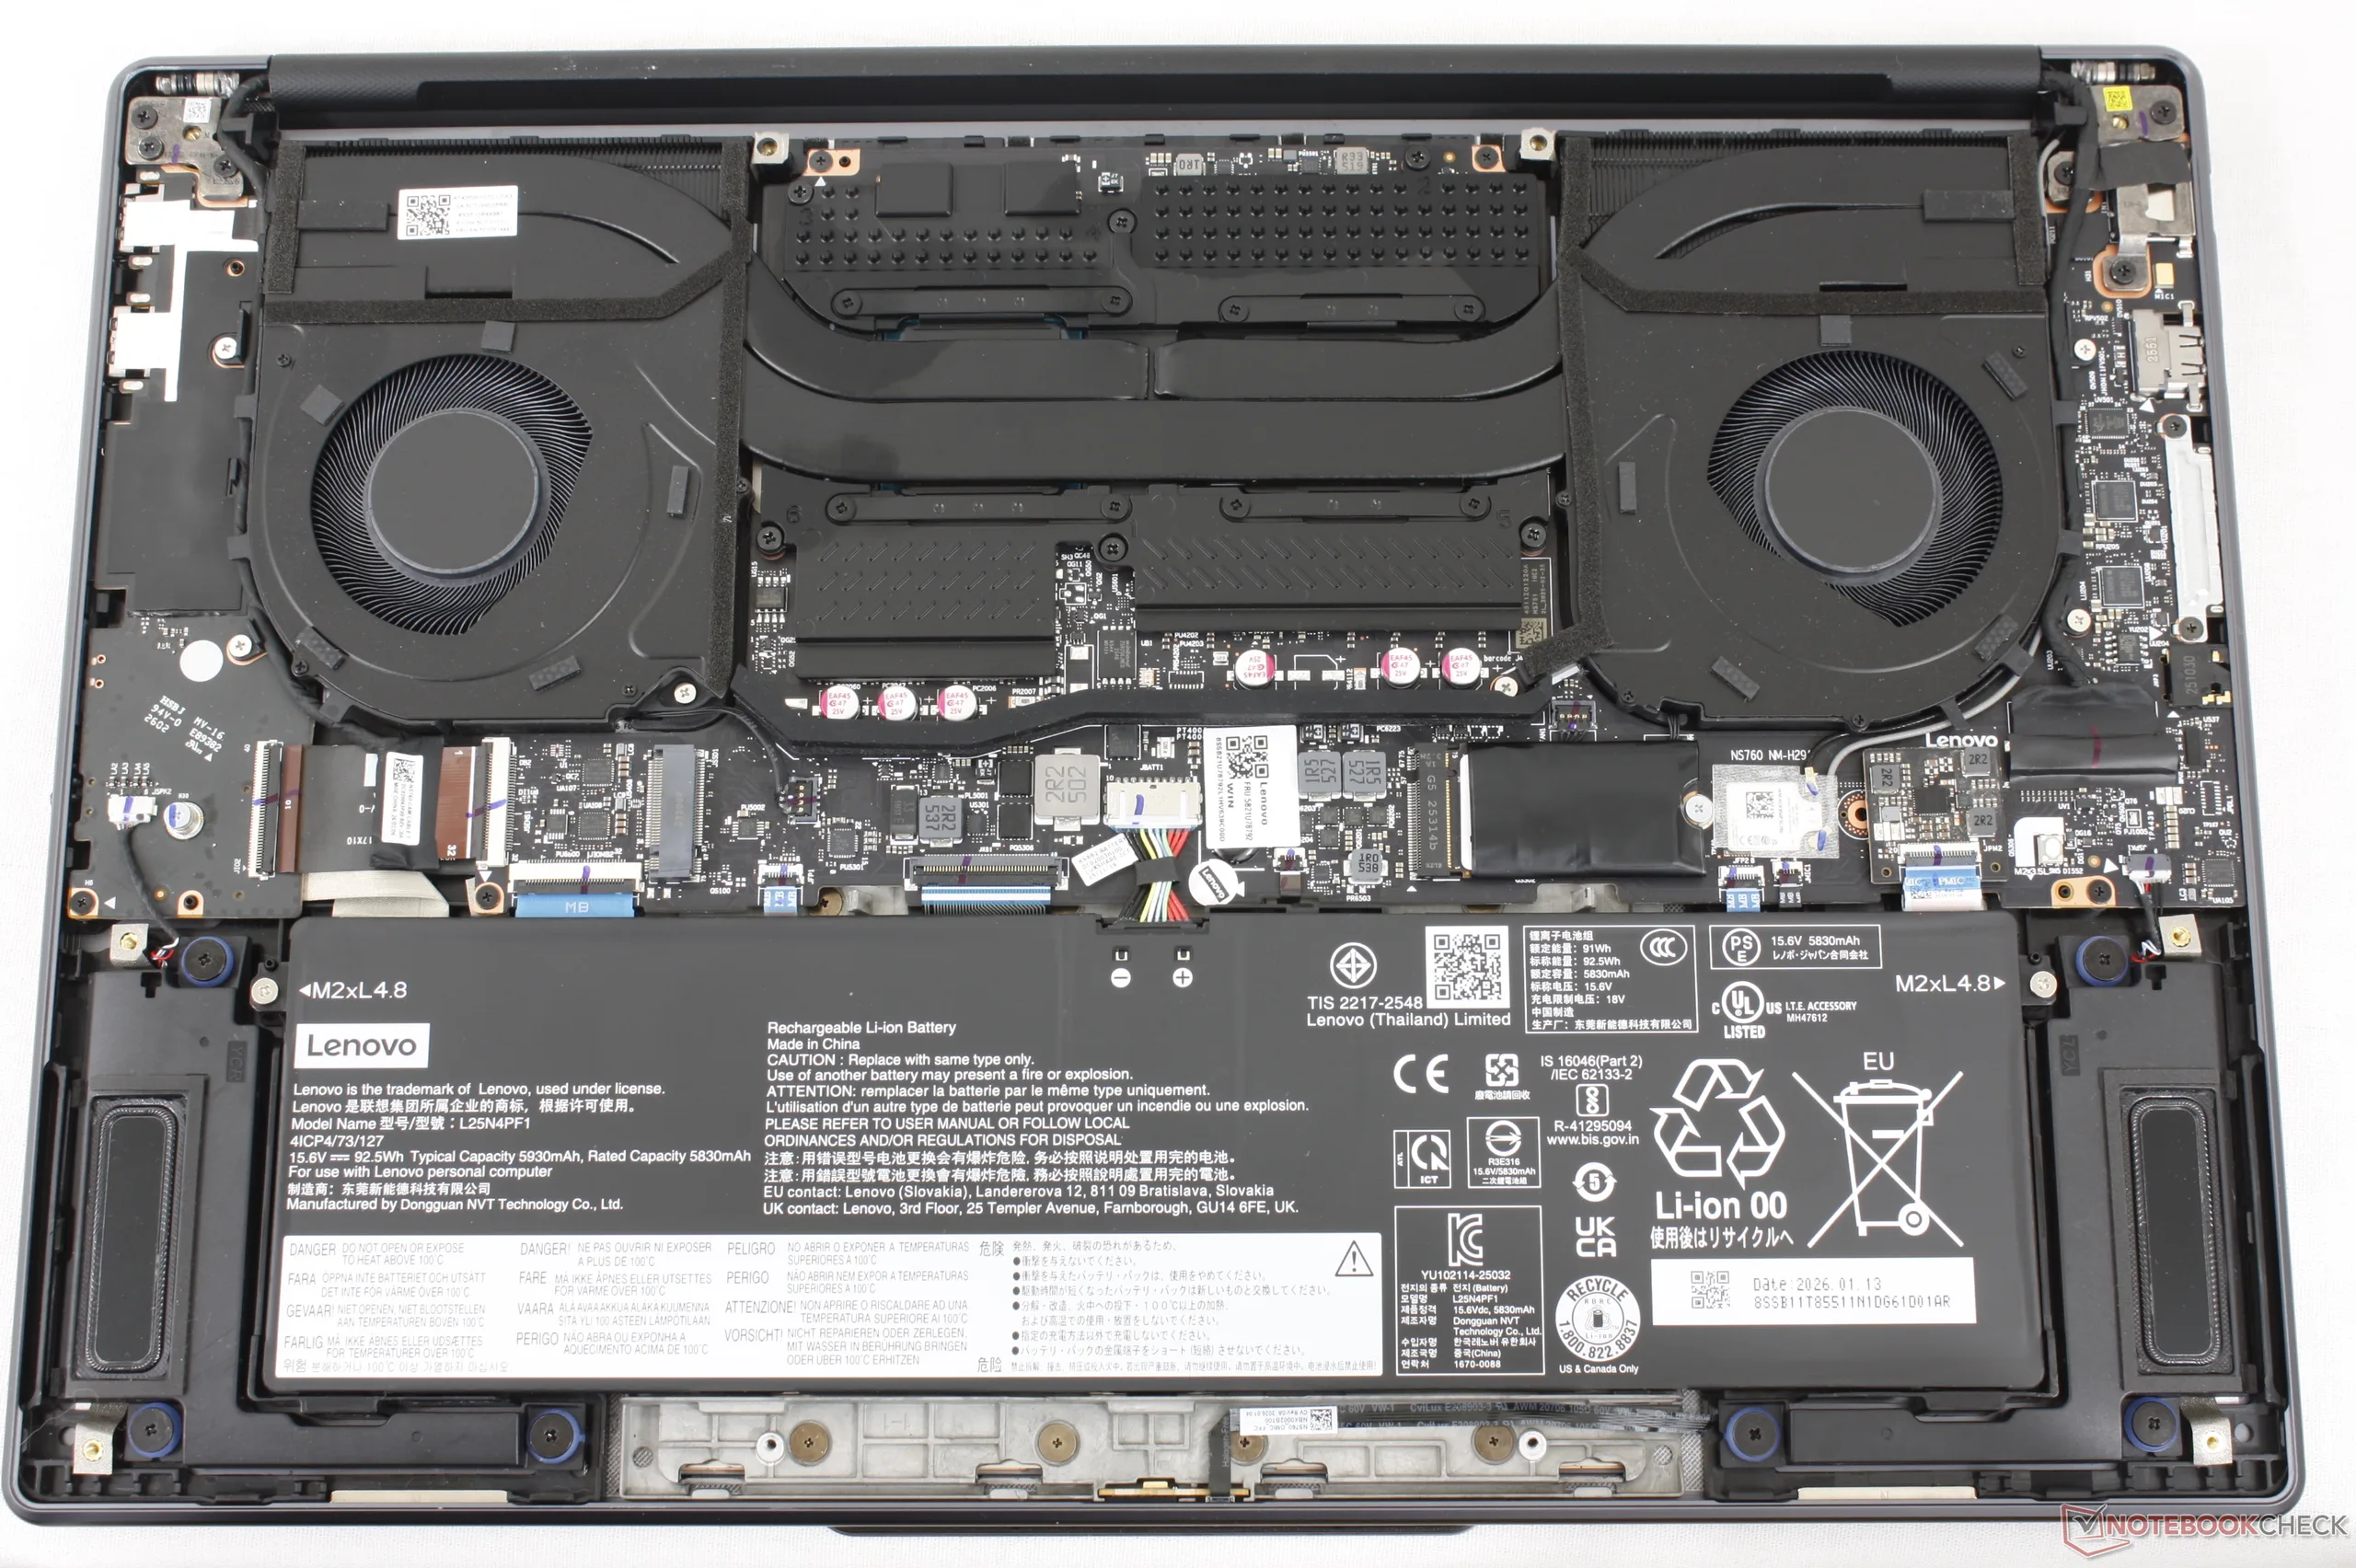
Mantenimiento
Los componentes internos han sufrido cambios menores. El más notable es la capacidad ligeramente mayor de la batería (de 84 Wh a 93 Wh), pero las opciones de actualización de la SSD son por lo demás las mismas que antes.

Sostenibilidad
Lenovo no proporciona ningún detalle sobre los materiales reciclados utilizados durante la fabricación. Por lo demás, el embalaje no contiene plásticos y es totalmente reciclable.
Dispositivos de entrada
La fuente y la impresión de las teclas han cambiado respecto al modelo del año pasado para ser más grandes, centradas y, en general, más fáciles de ver. Por lo demás, el tacto de las teclas es el mismo, incluido el recorrido de 1,5 mm y la respuesta relativamente nítida para una experiencia de tecleo similar a pesar de la falta de teclado numérico.
Mostrar
Las dos opciones de pantalla táctil siguen siendo las mismas que antes:
- 2880 x 1800, OLED, 500 nits SDR (1100 nits HDR), 100% DCI-P3, 120 Hz, Gorilla Glass 3
- 3200 x 2000, OLED en tándem, 1000 nits SDR (1600 nits HDR), 100% DCI-P3, 120 Hz, Gorilla Glass 3
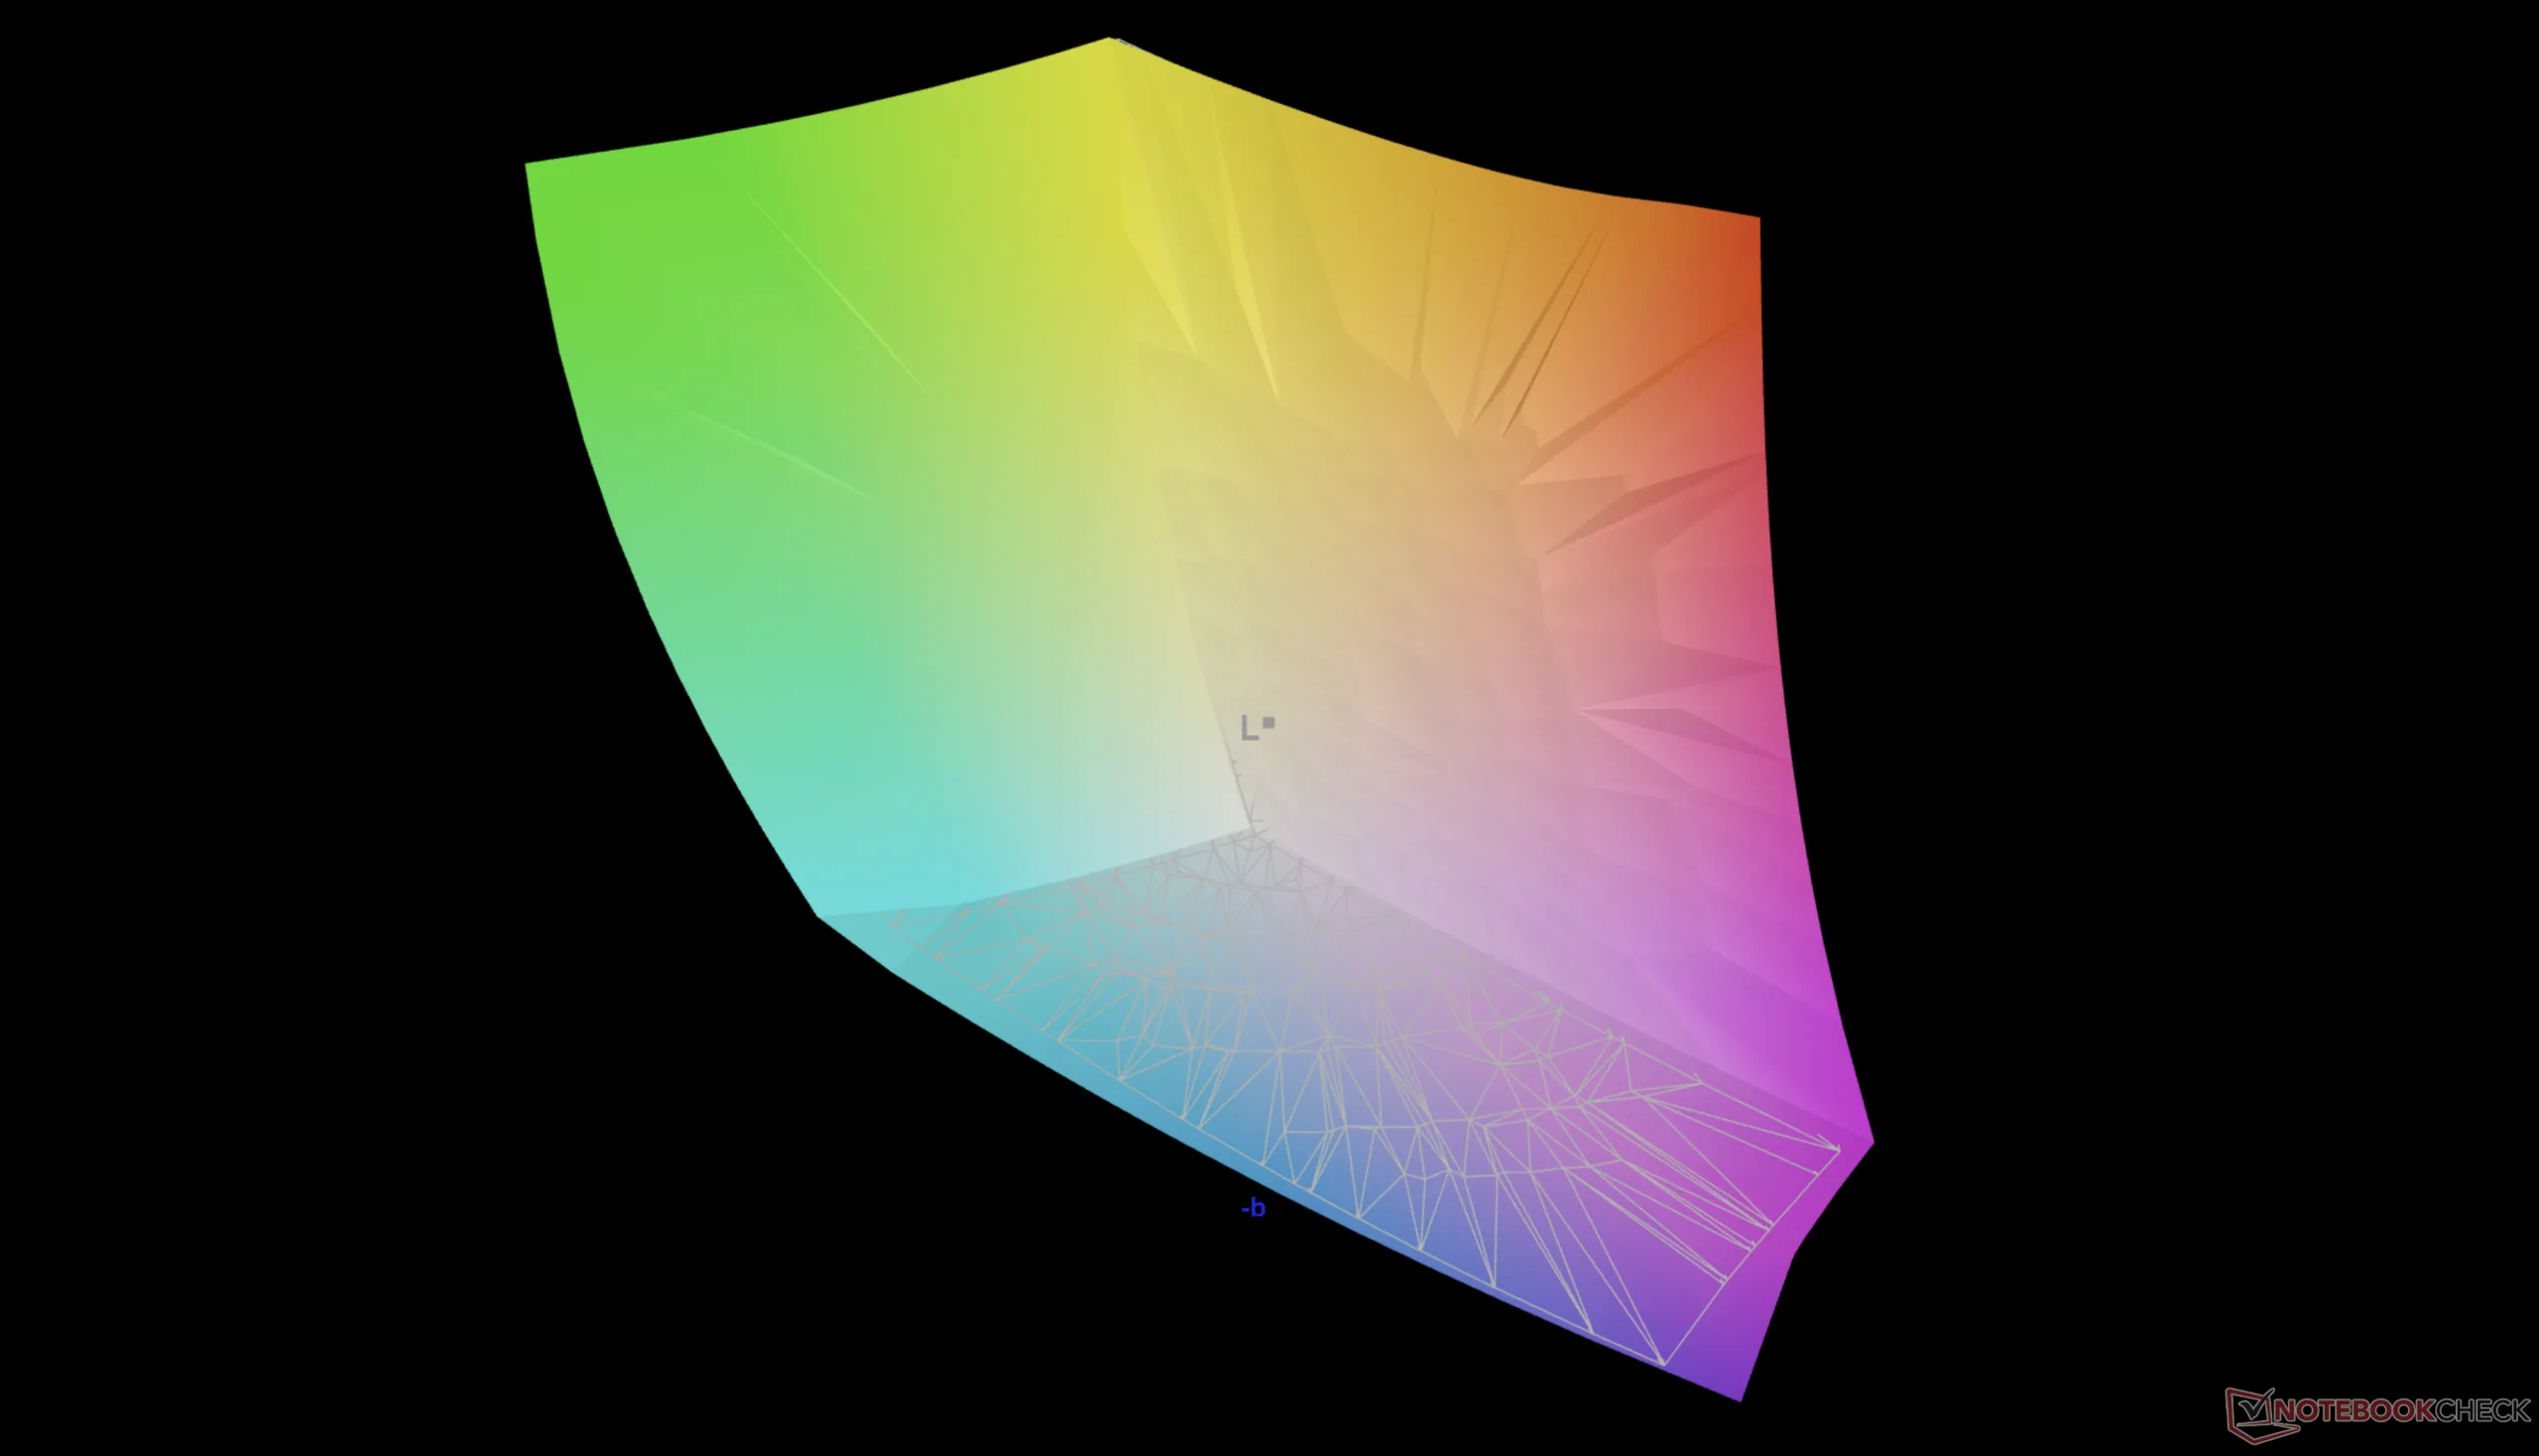
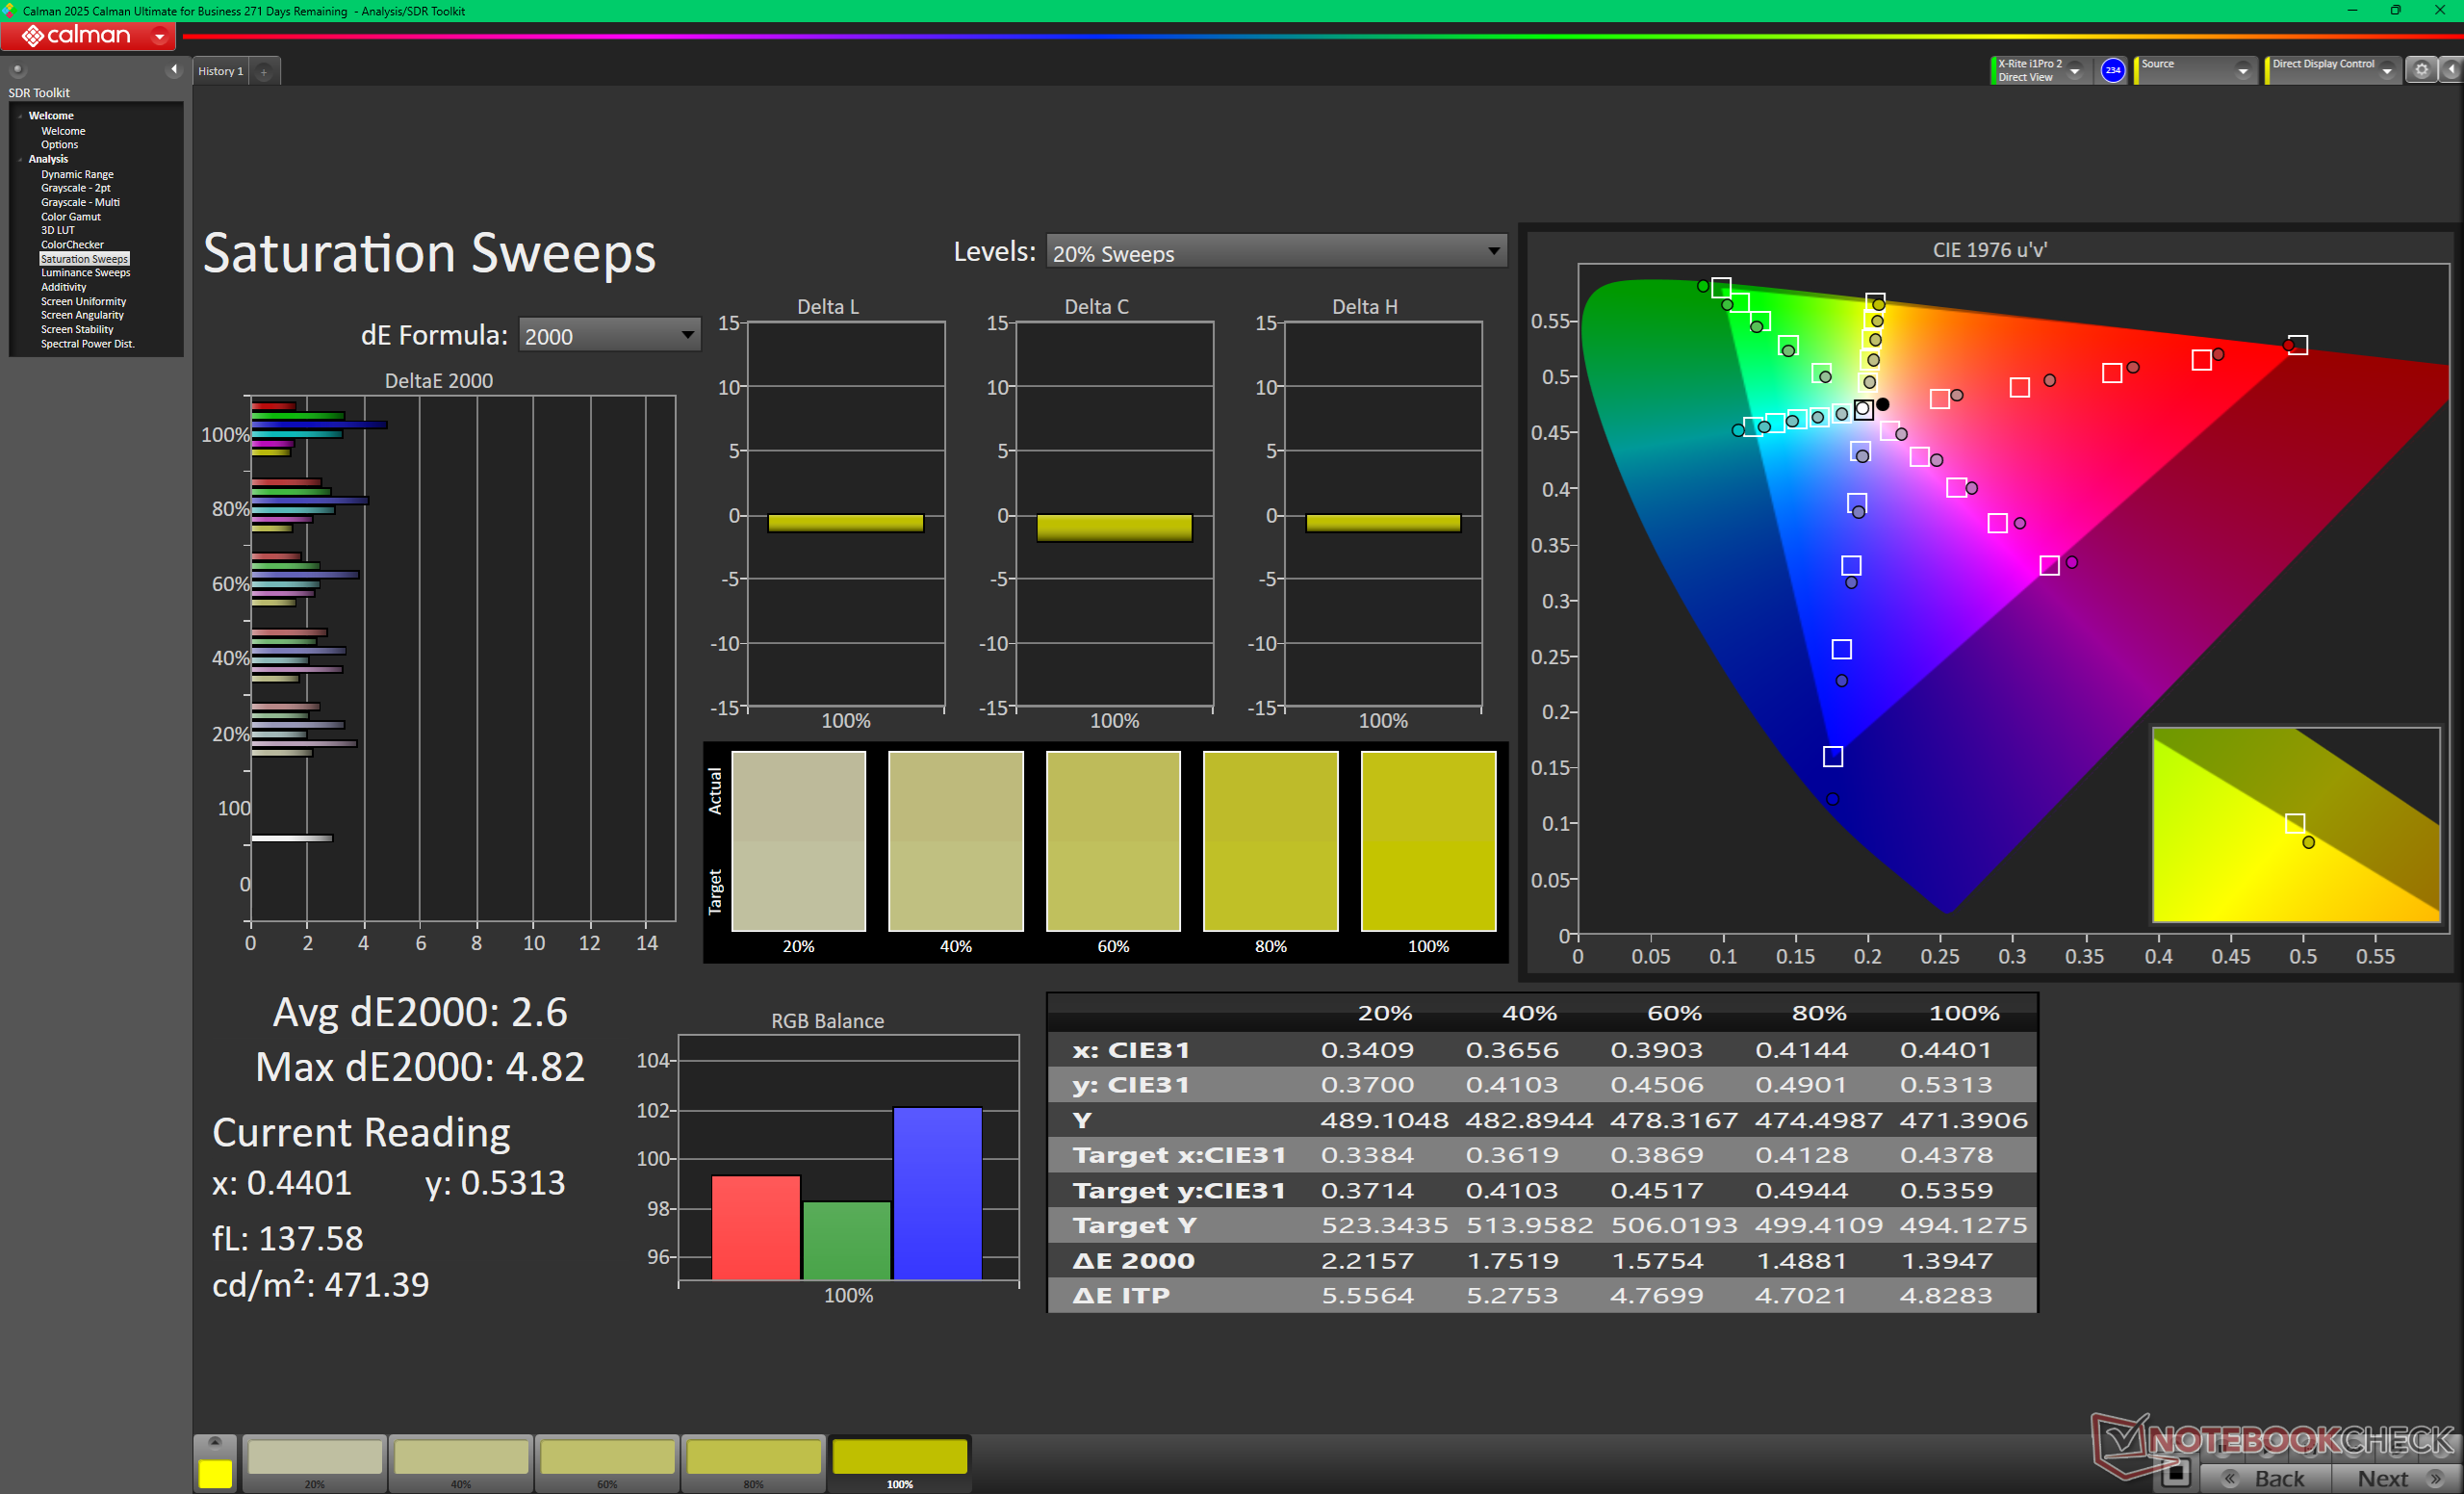
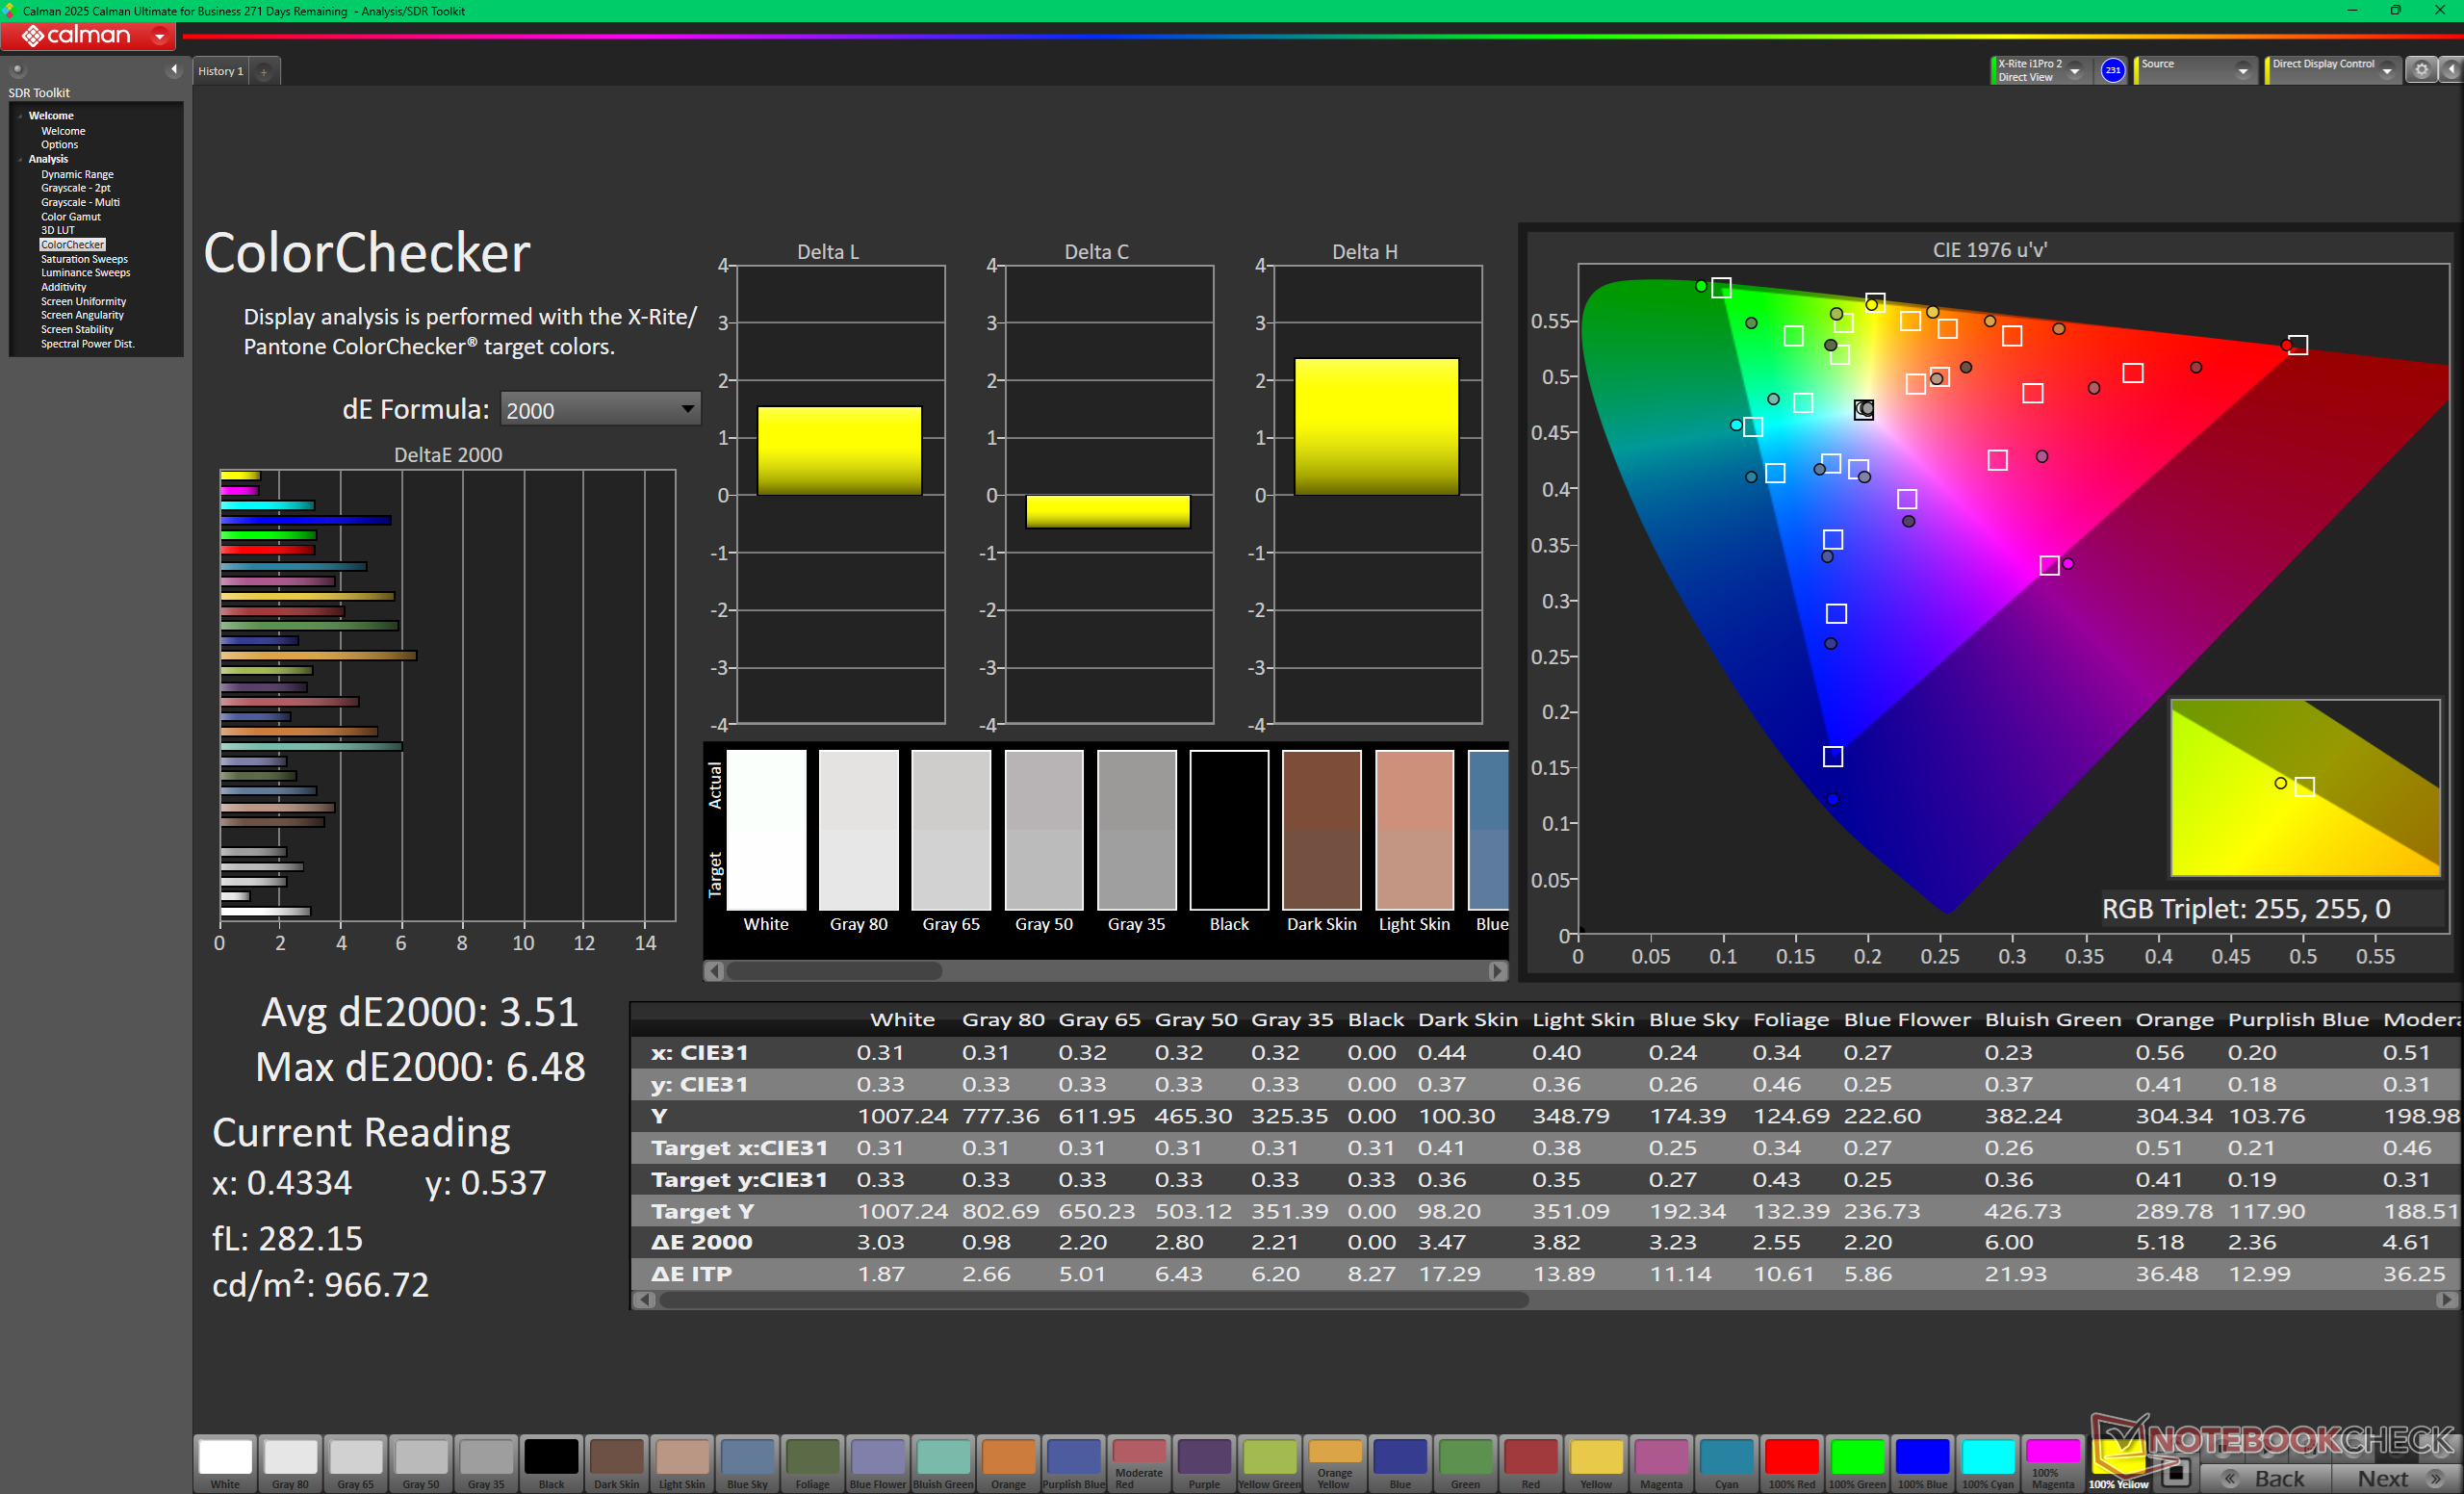
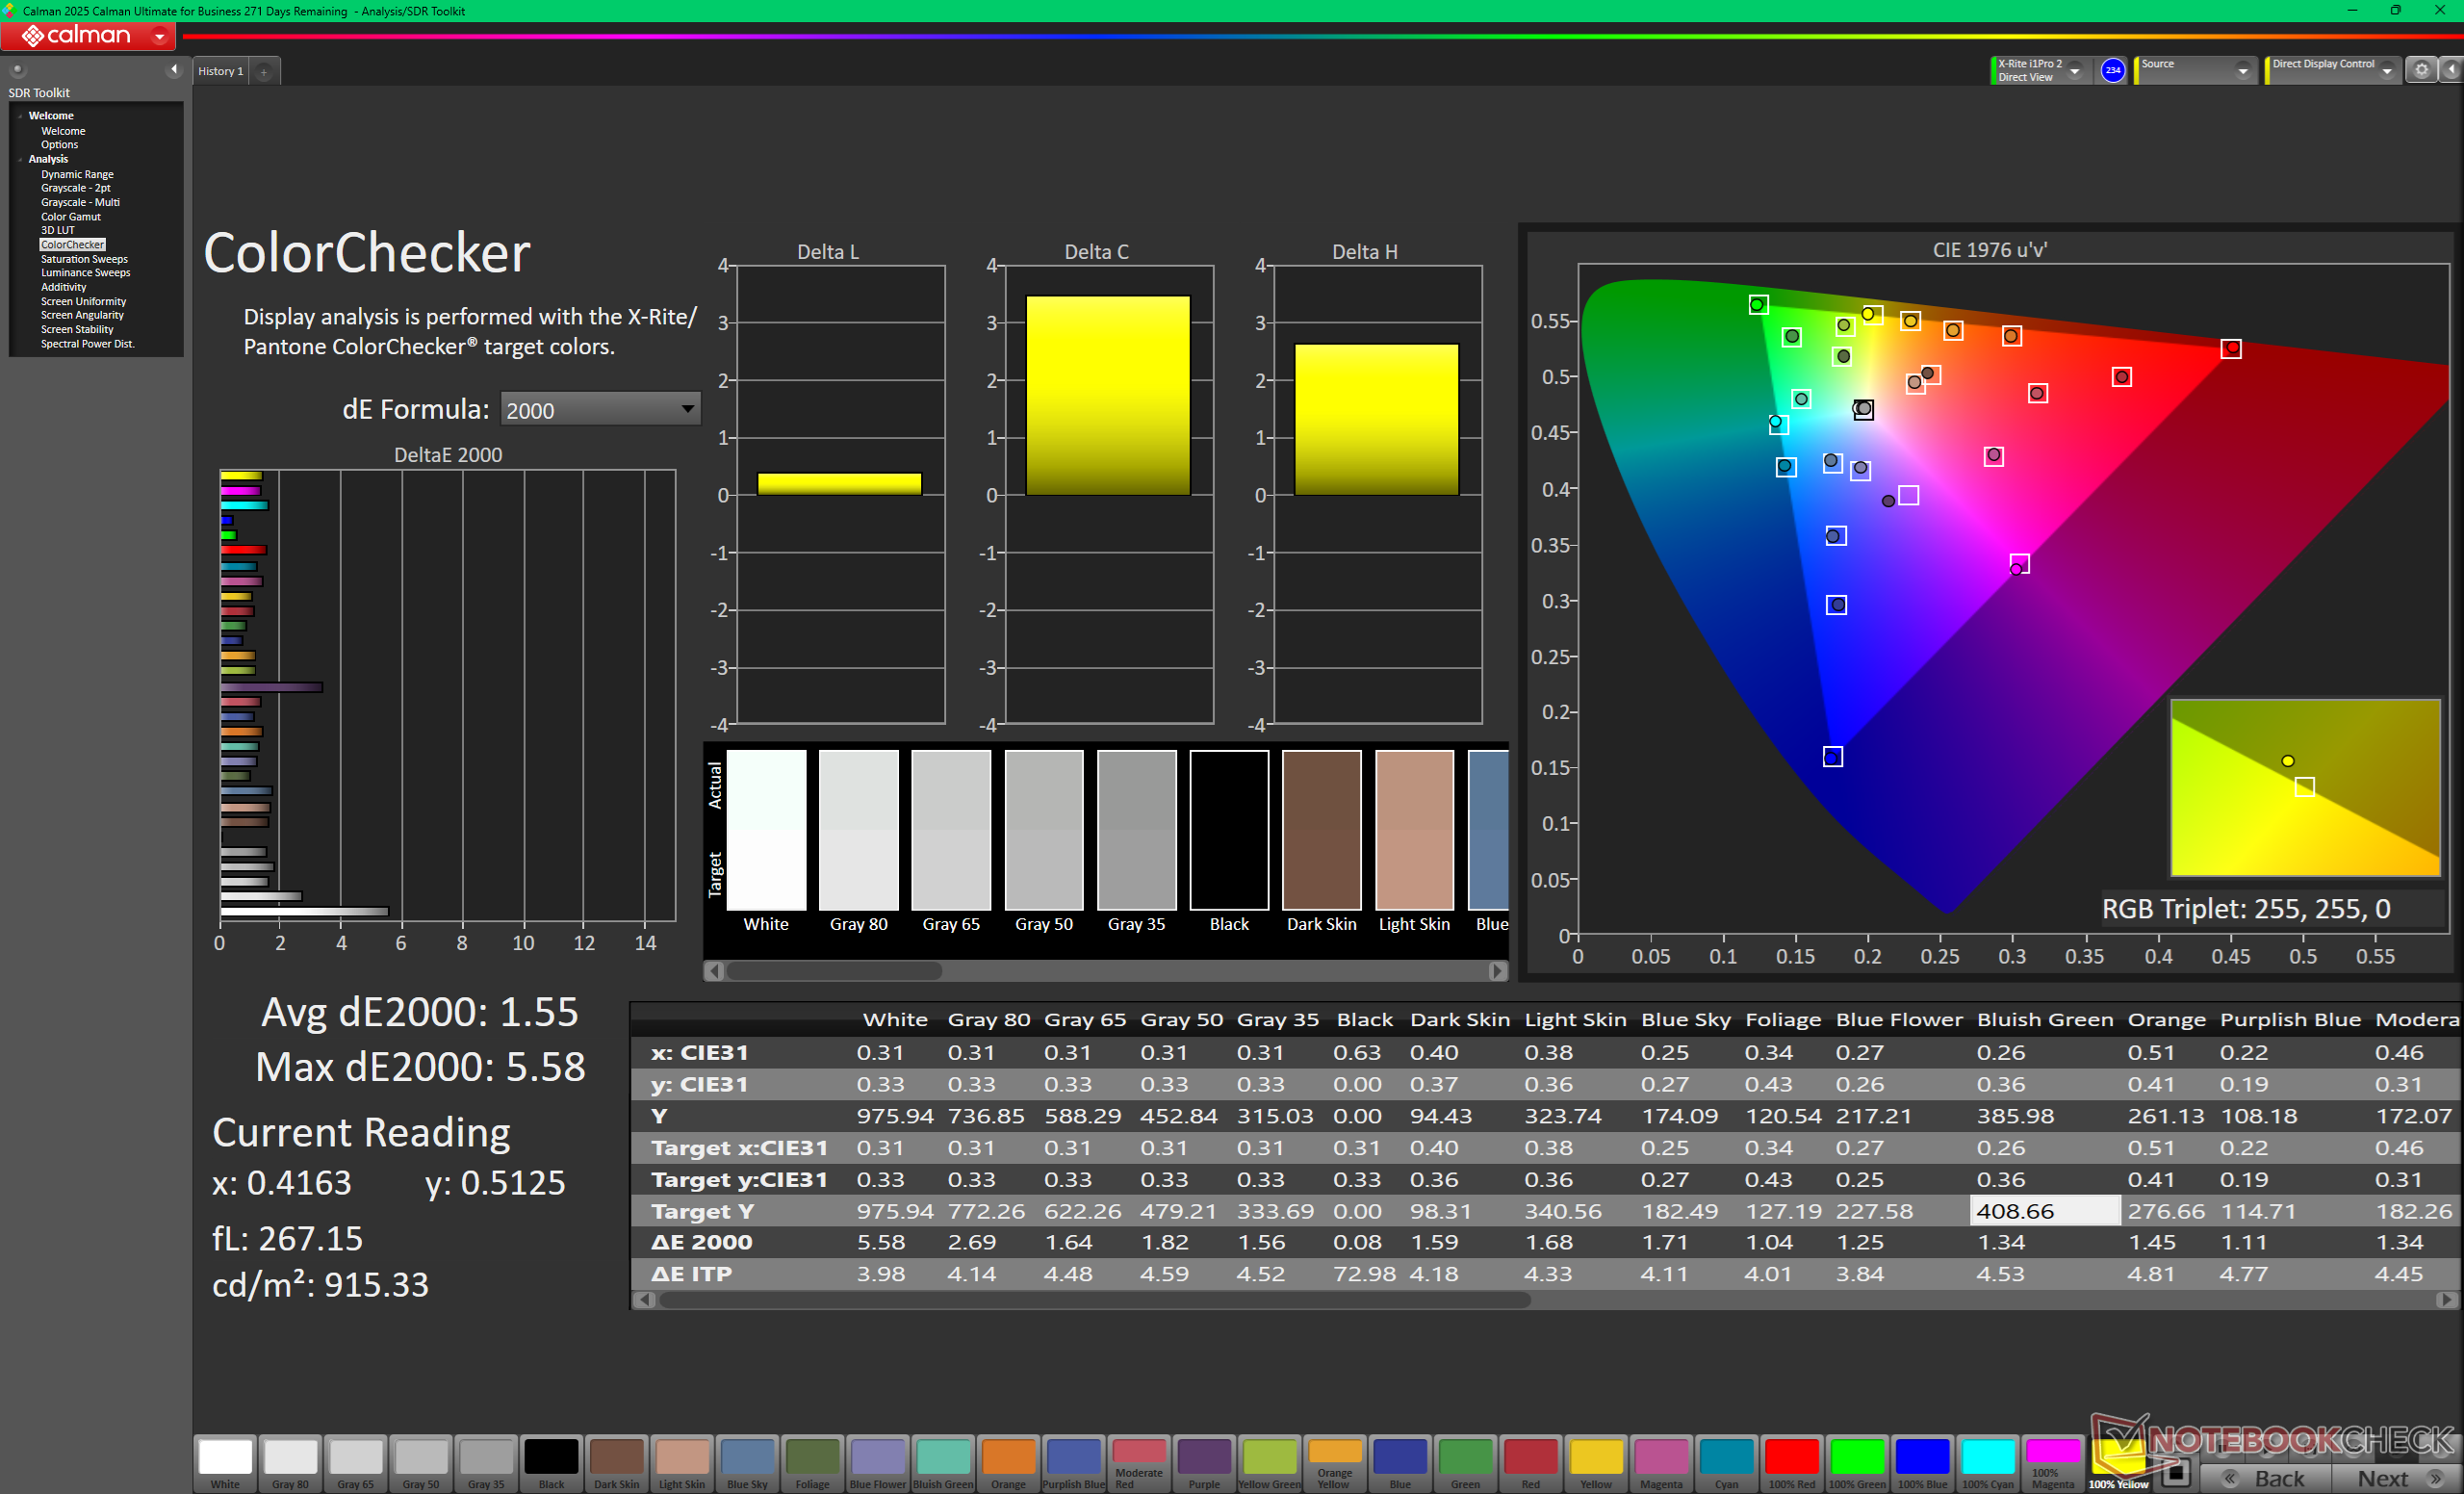
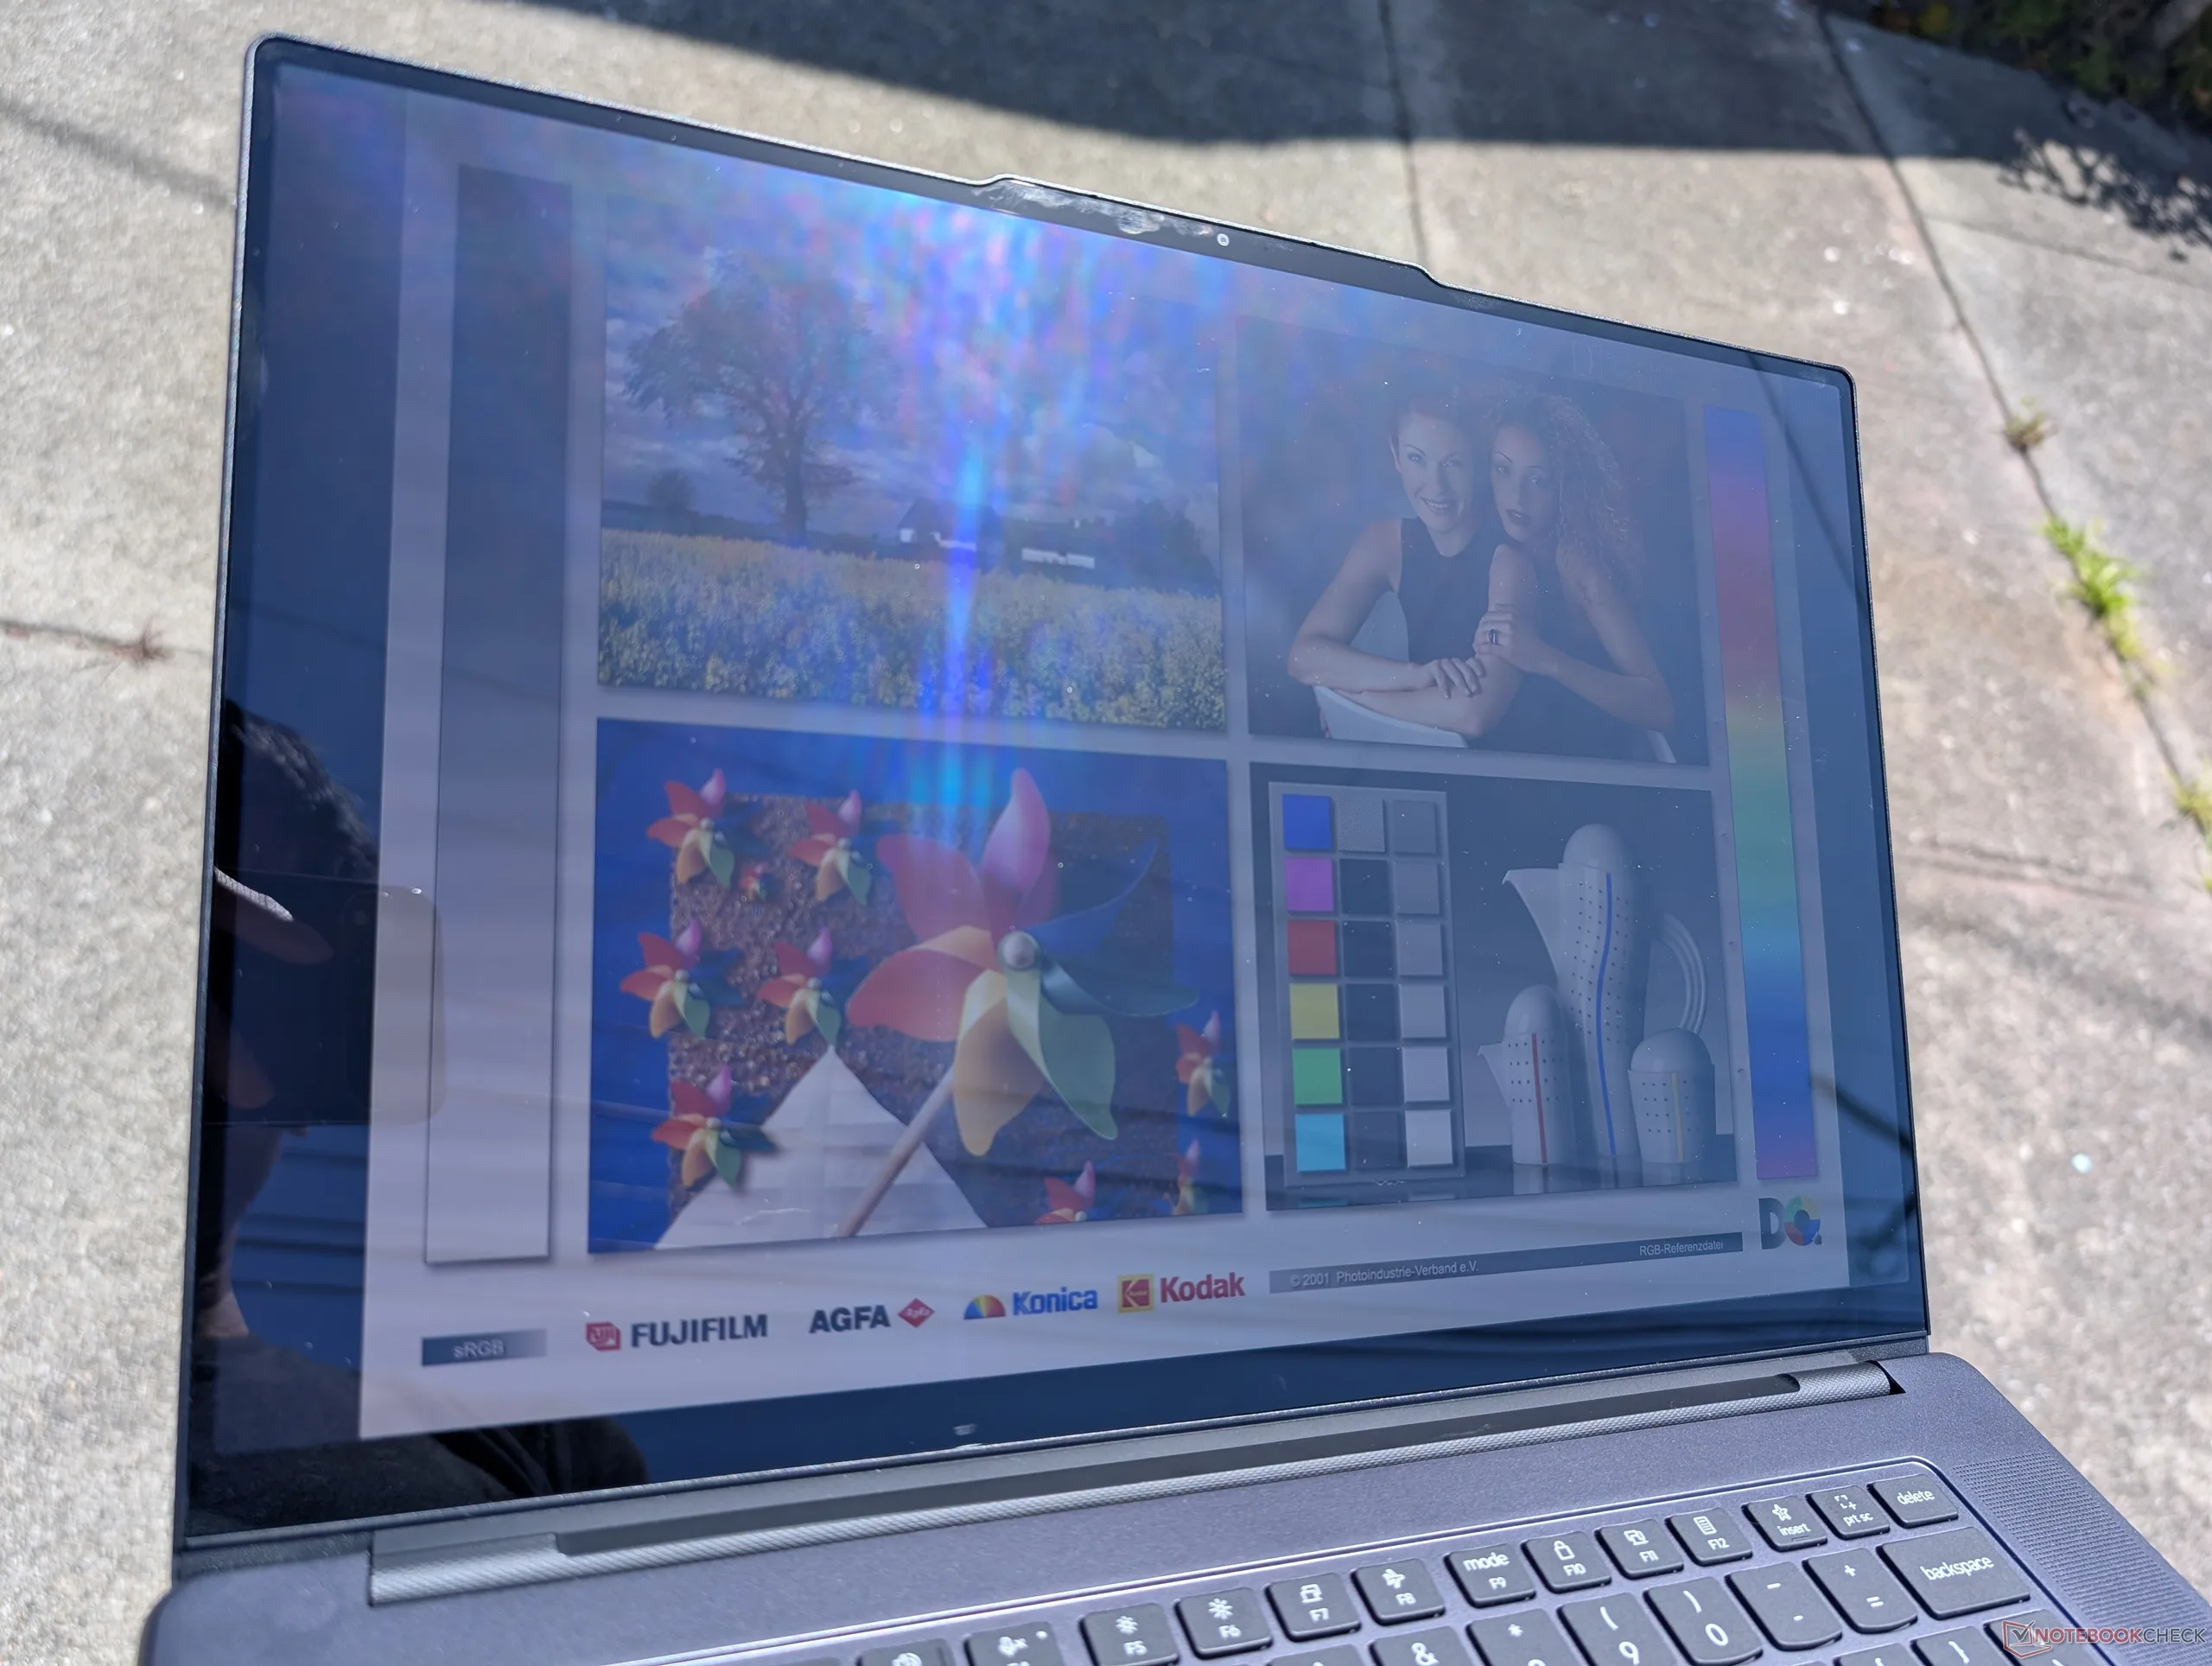
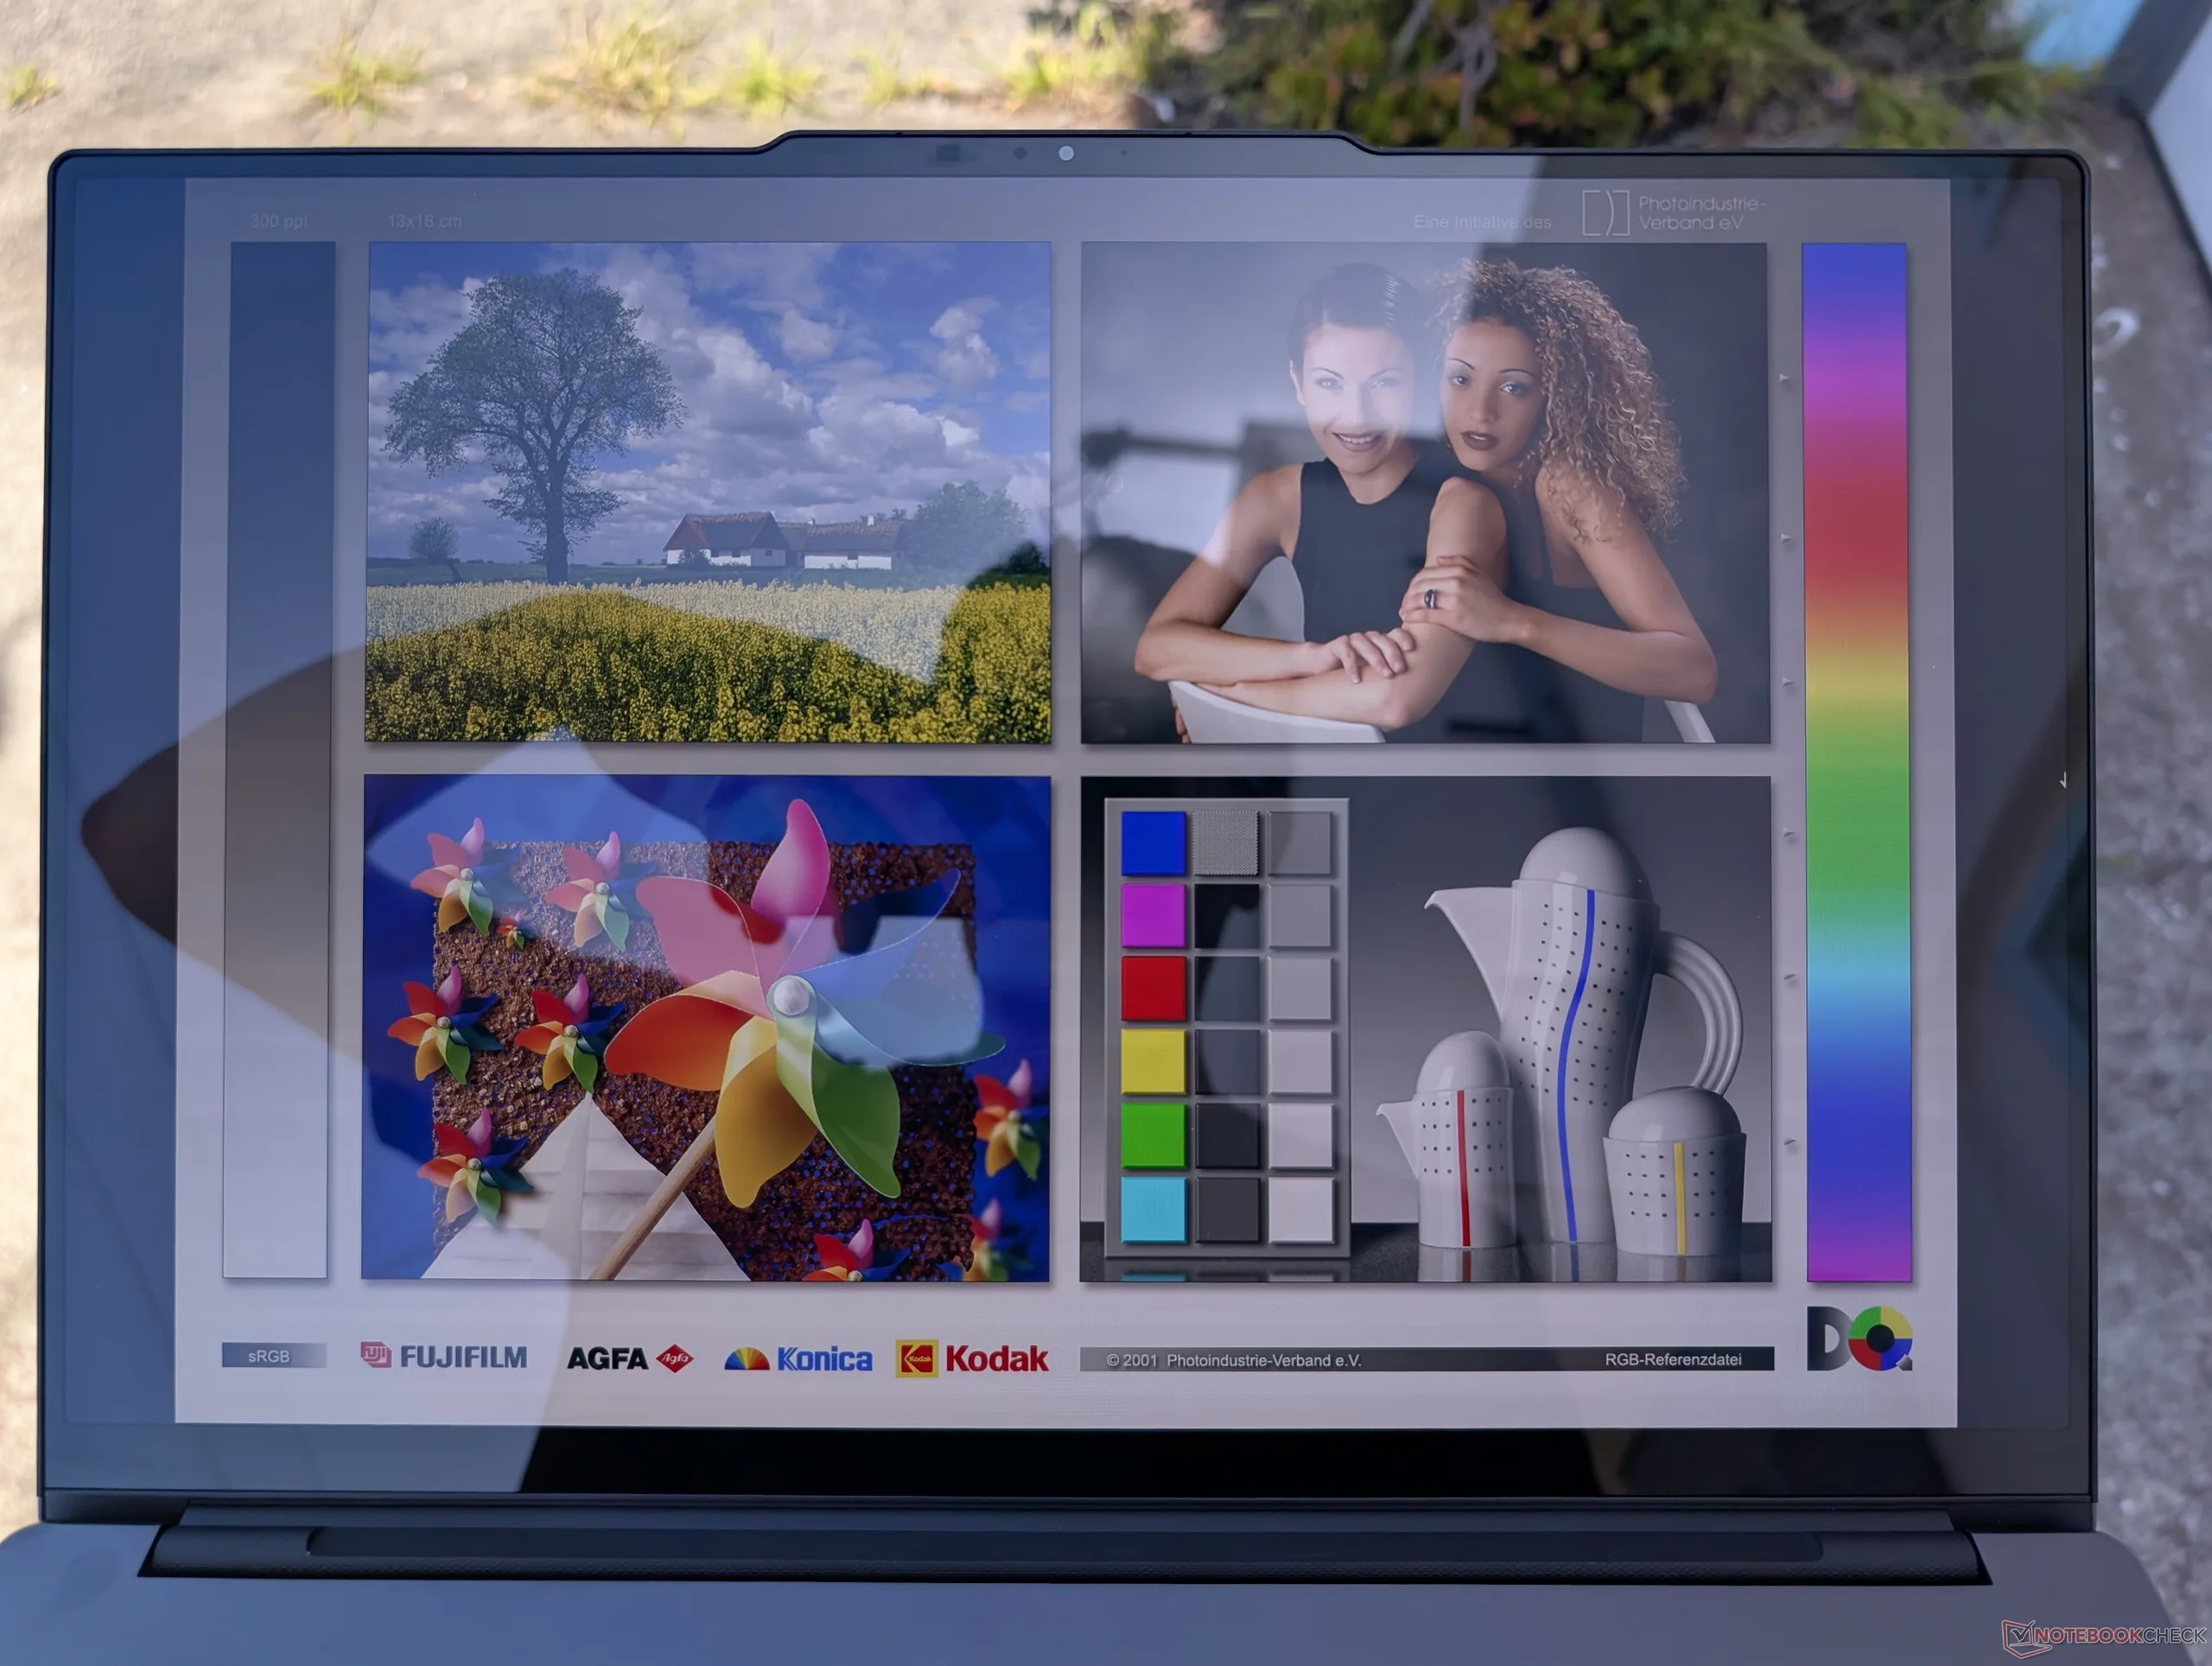
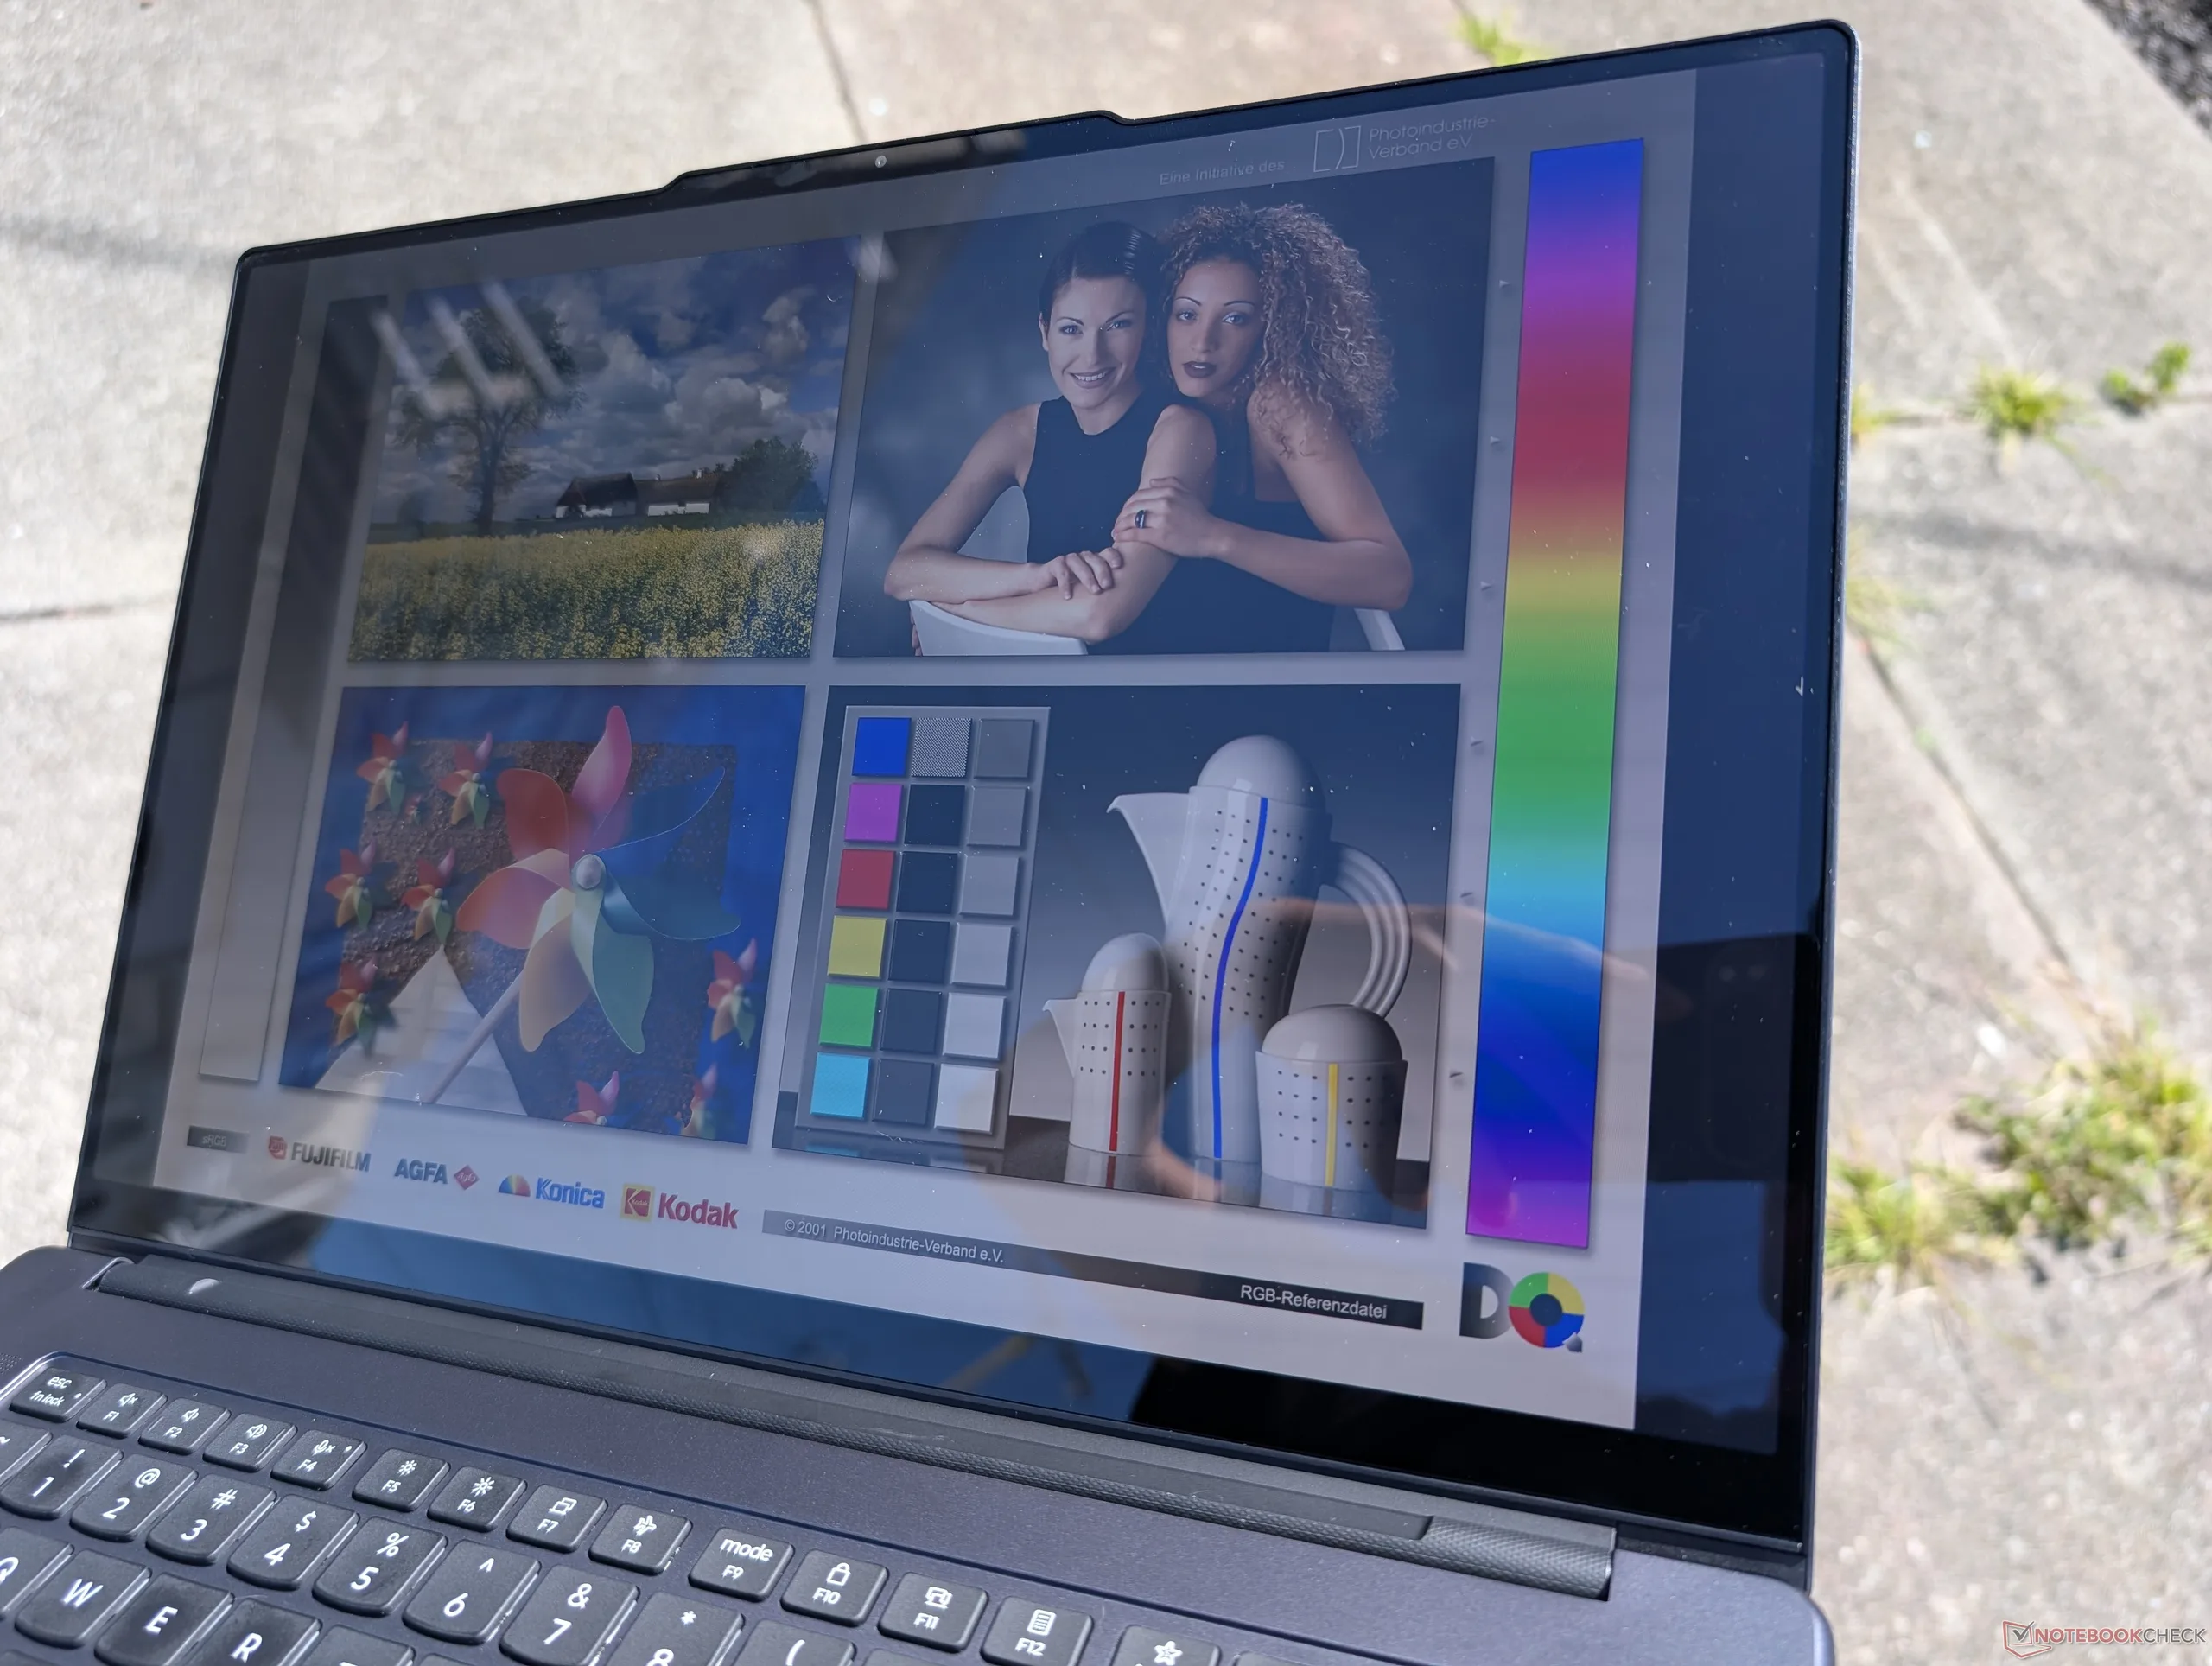
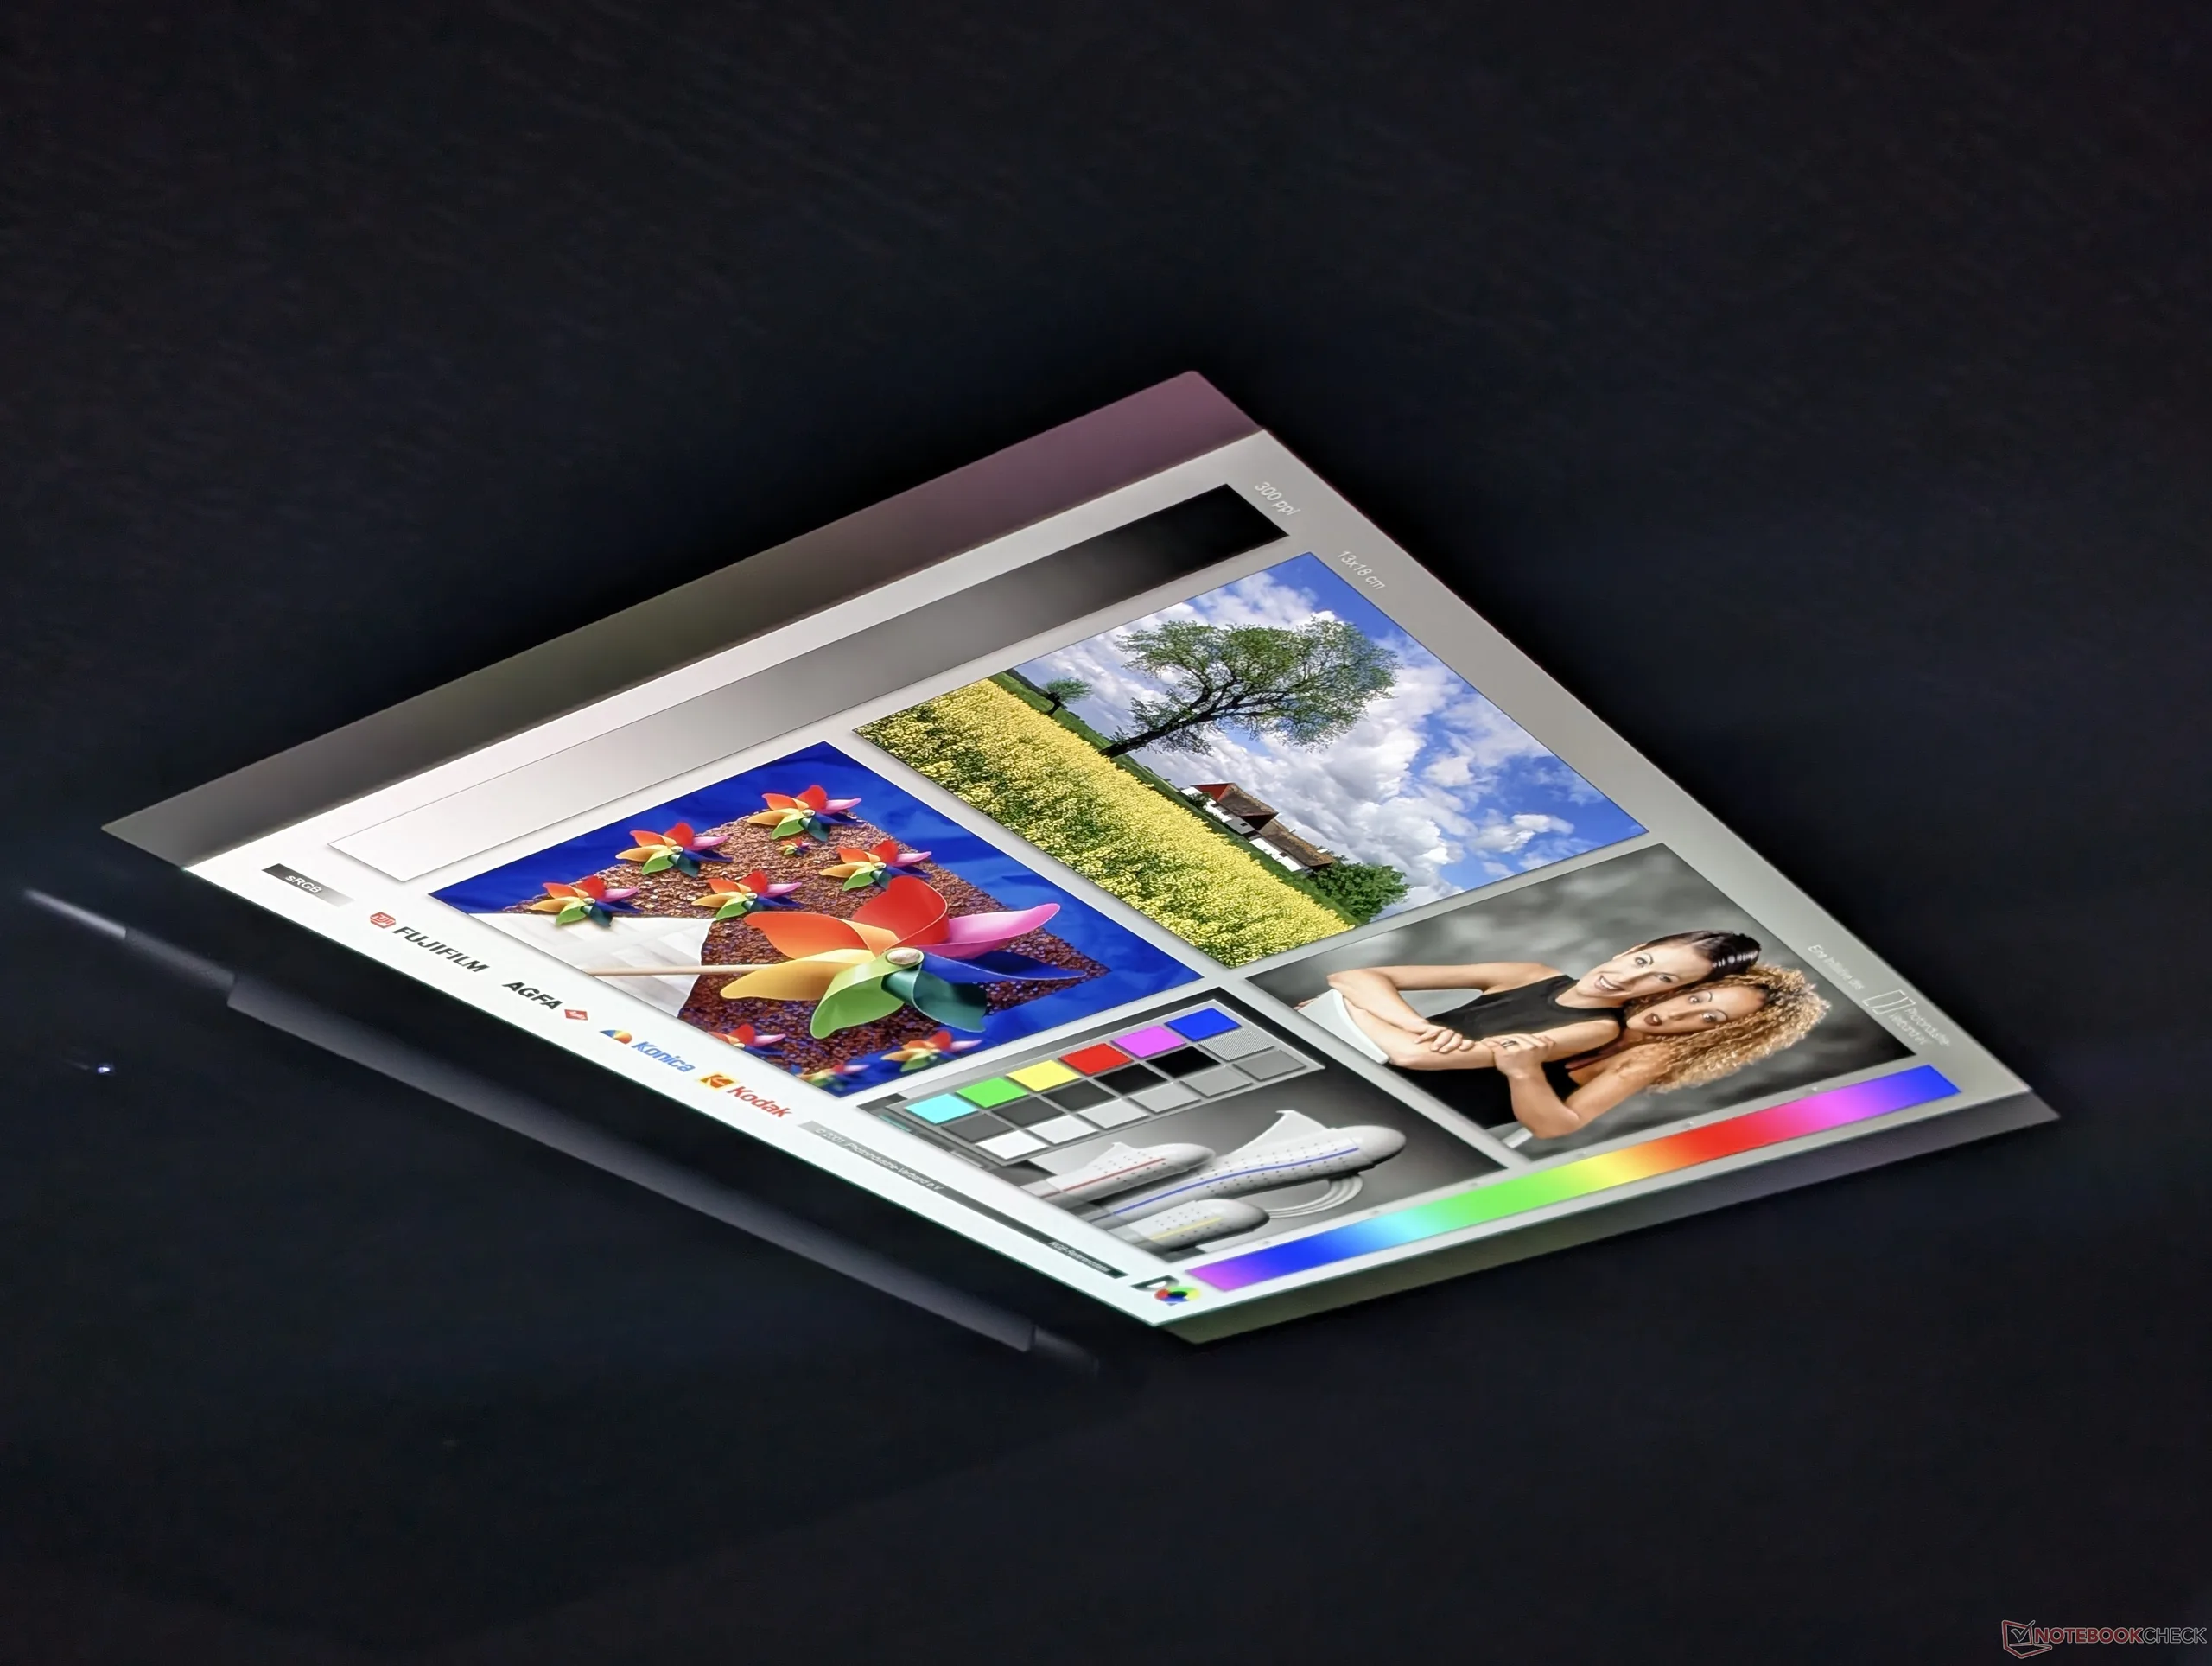
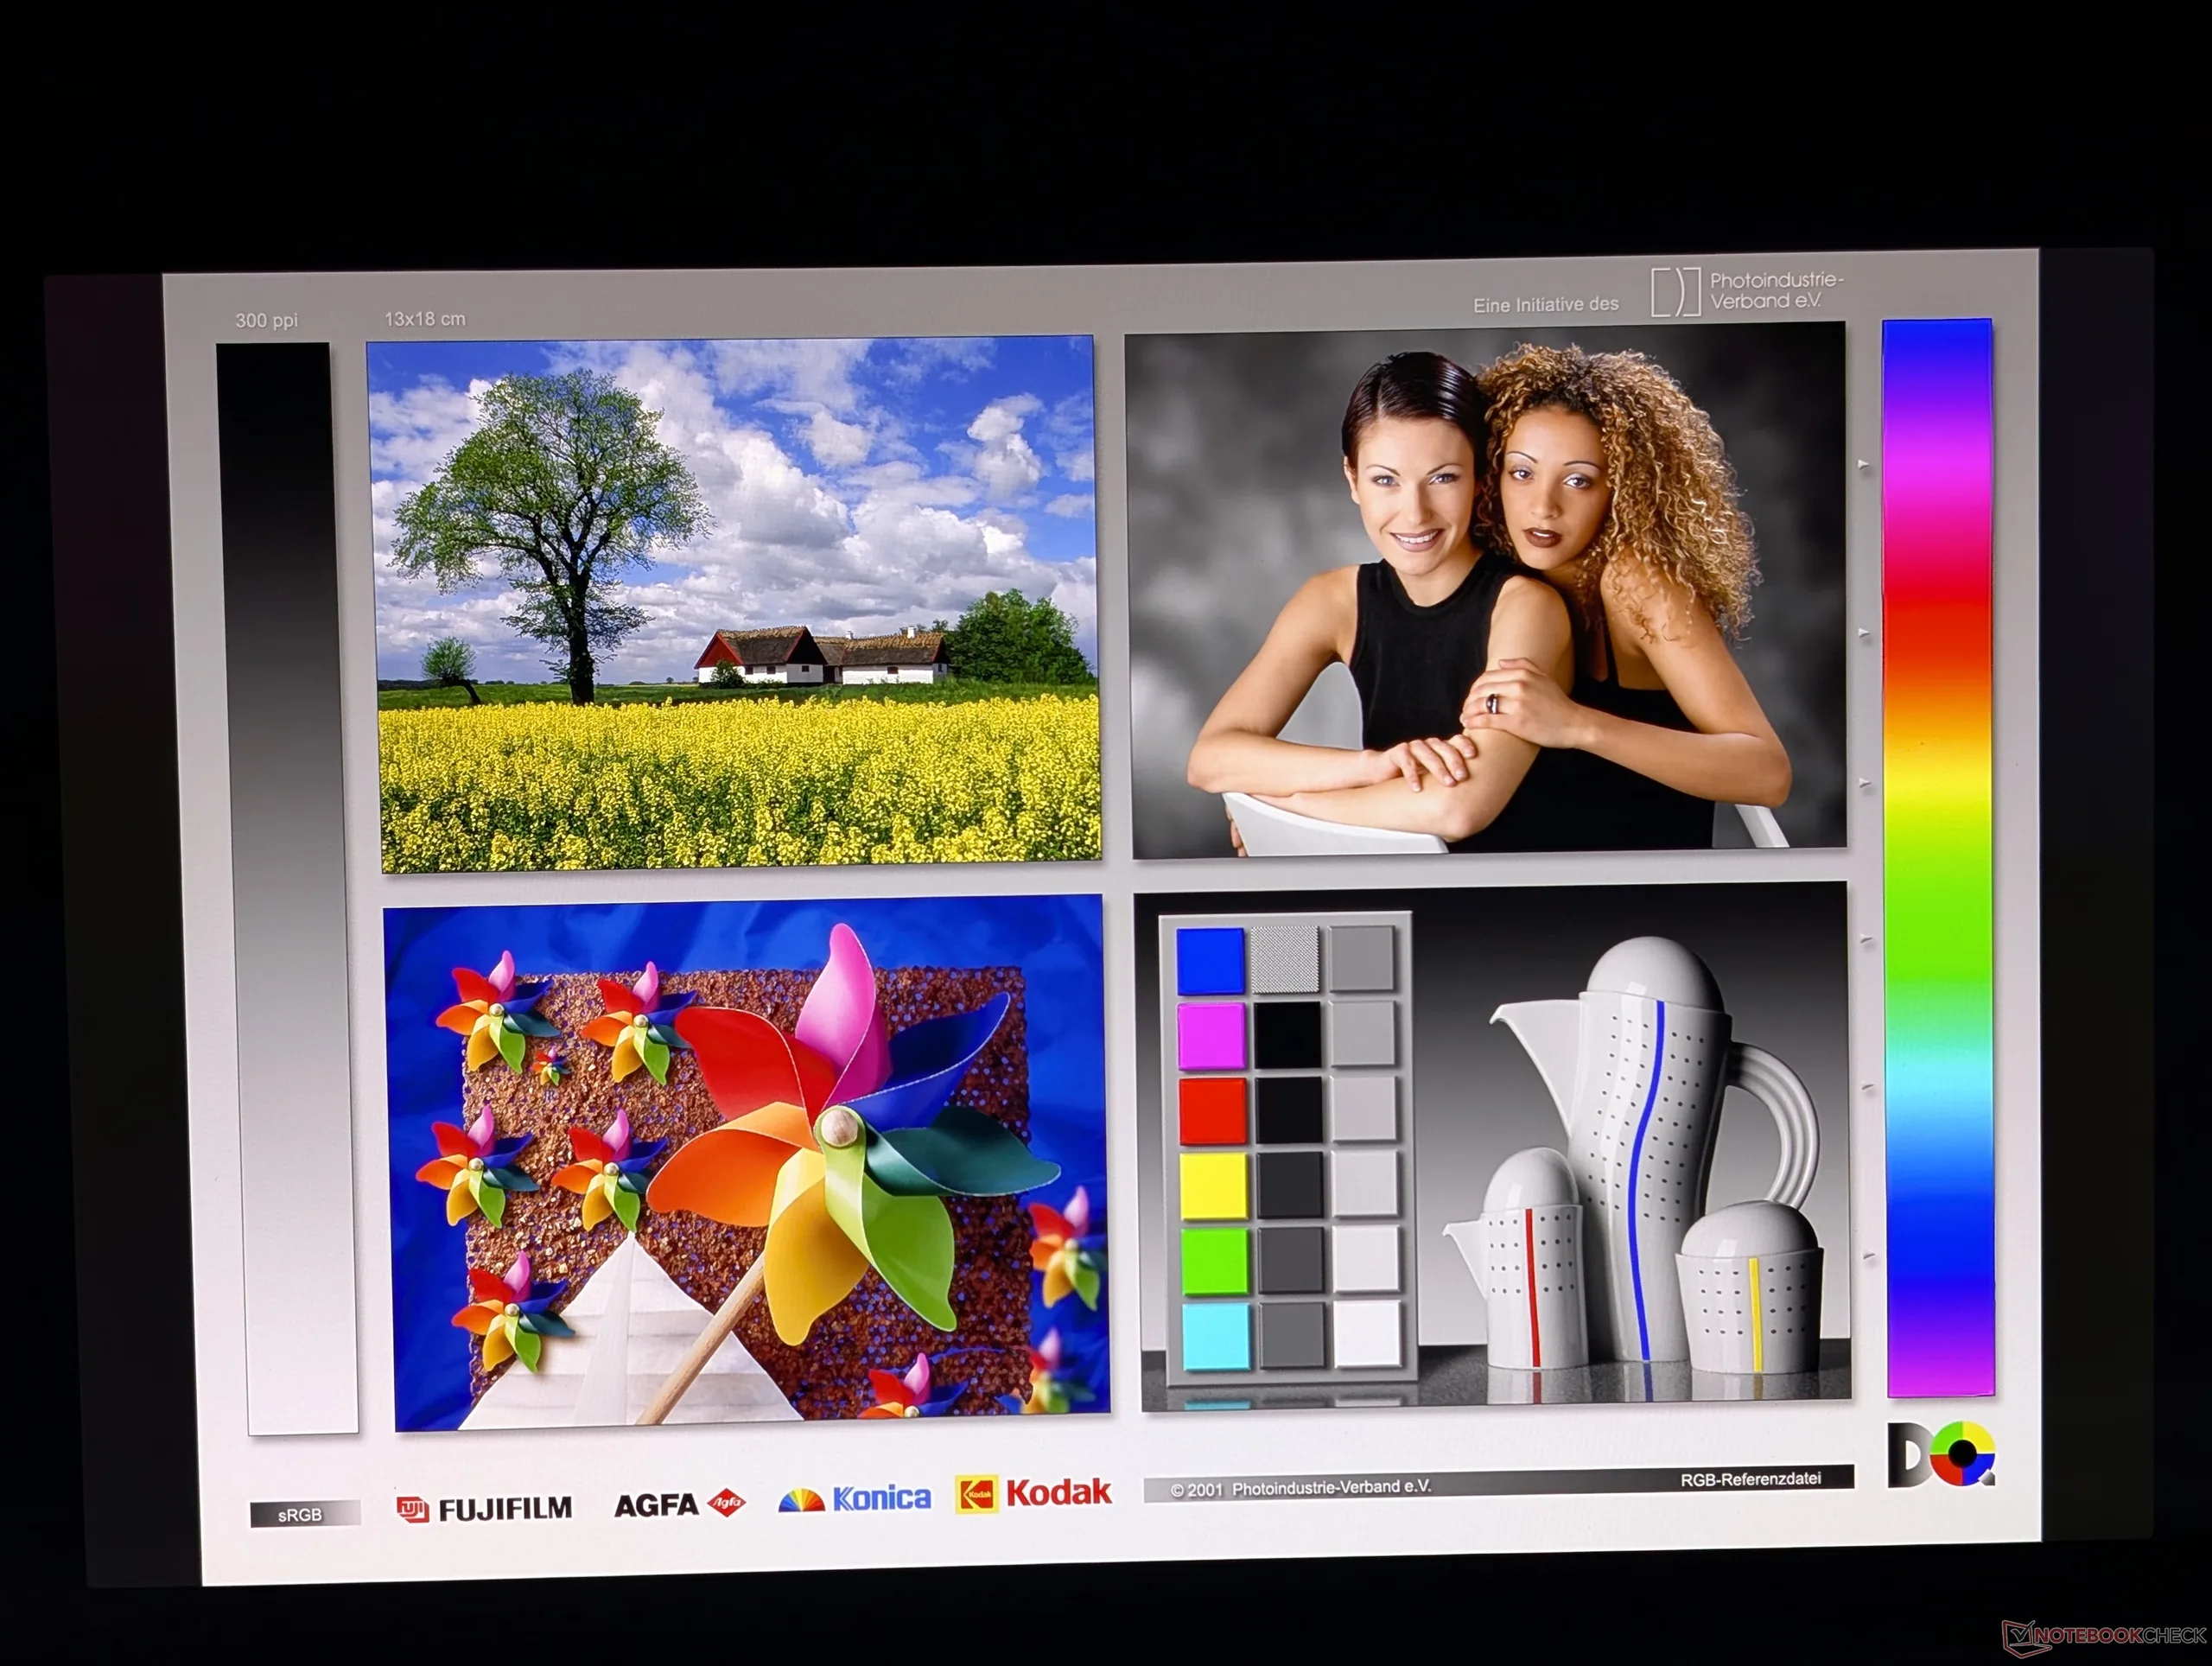
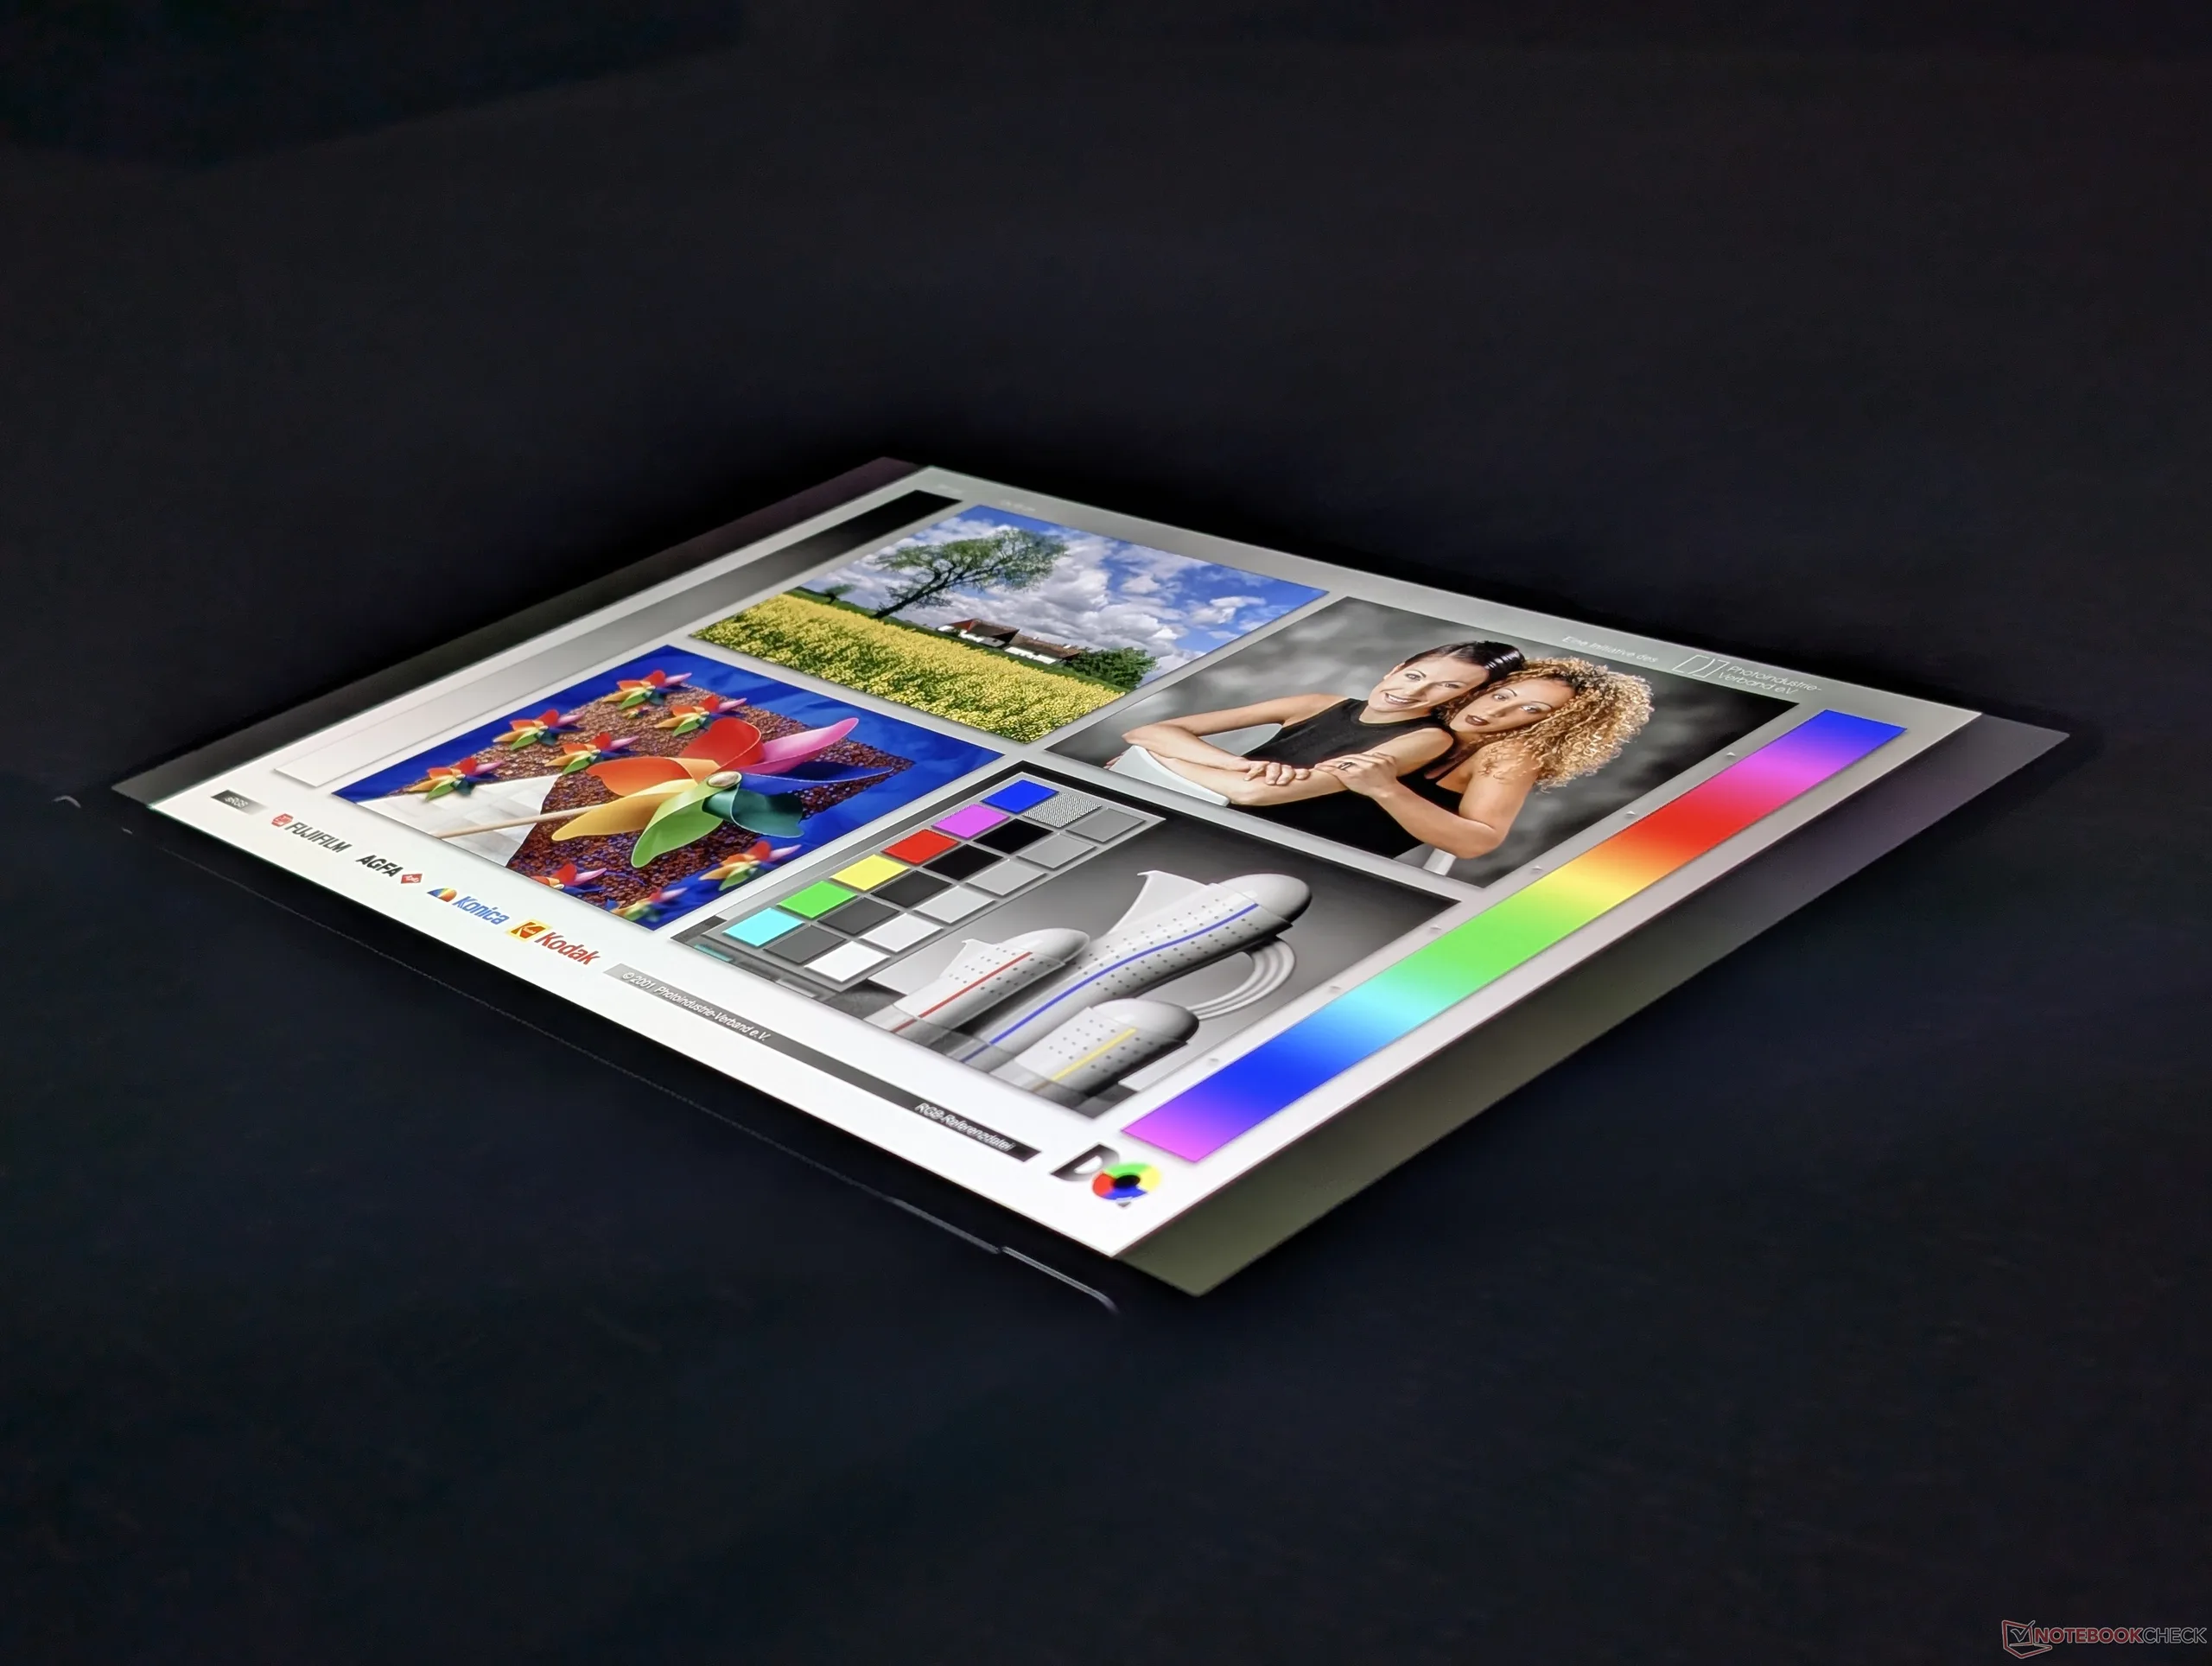
La pantalla OLED en tándem de nuestra unidad es exactamente el mismo panel Samsung ATNA60KA04-0 que se encuentra en el 2025 Yoga Pro 9i 16 para obtener la misma experiencia de visualización. Nuestras propias mediciones revelan un brillo central máximo de 931 nits en modo SDR y 1480 nits en modo HDR para hacer de esta una de las pantallas más brillantes en cualquier portátil de 16 pulgadas.
Tenga en cuenta que, aunque es compatible con Advanced Optimus, se sigue omitiendo G-Sync, ya que la serie Pro 9 no es principalmente para juegos.
| |||||||||||||||||||||||||
iluminación: 94 %
Brillo con batería: 930.9 cd/m²
Contraste: ∞:1 (Negro: 0 cd/m²)
ΔE ColorChecker Calman: 3.51 | ∀{0.5-29.43 Ø4.71}
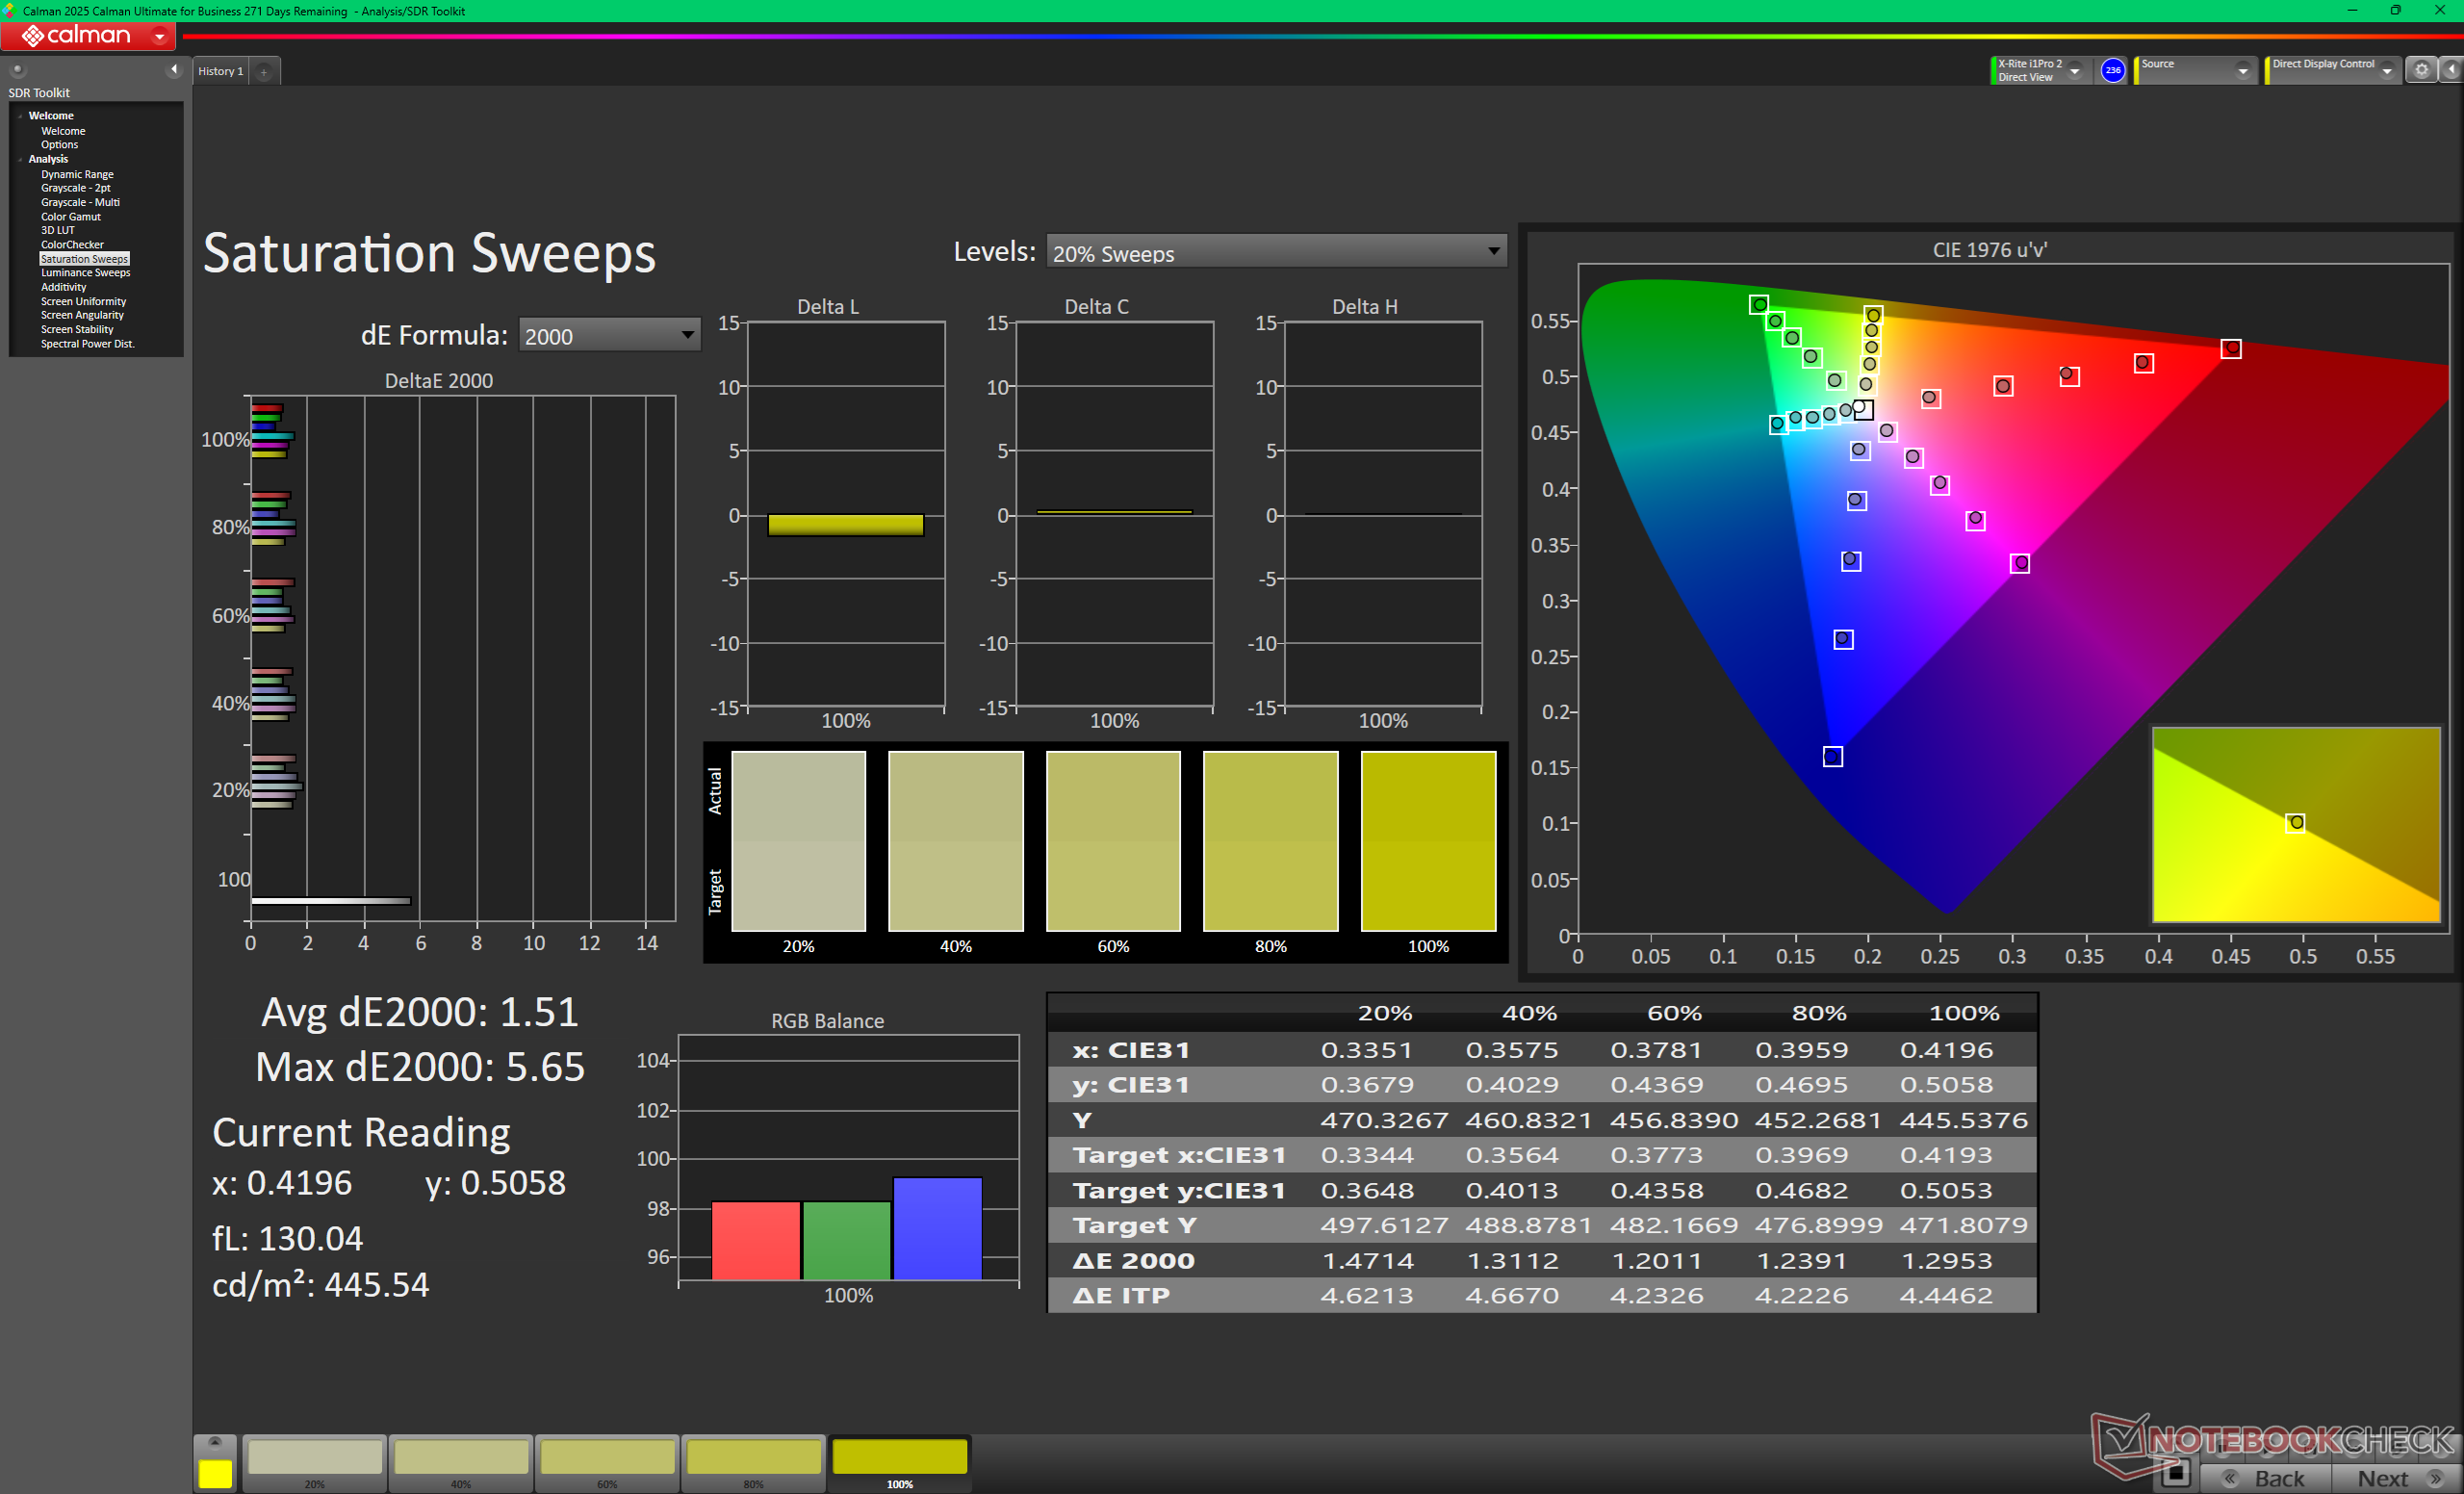
calibrated: 1.55
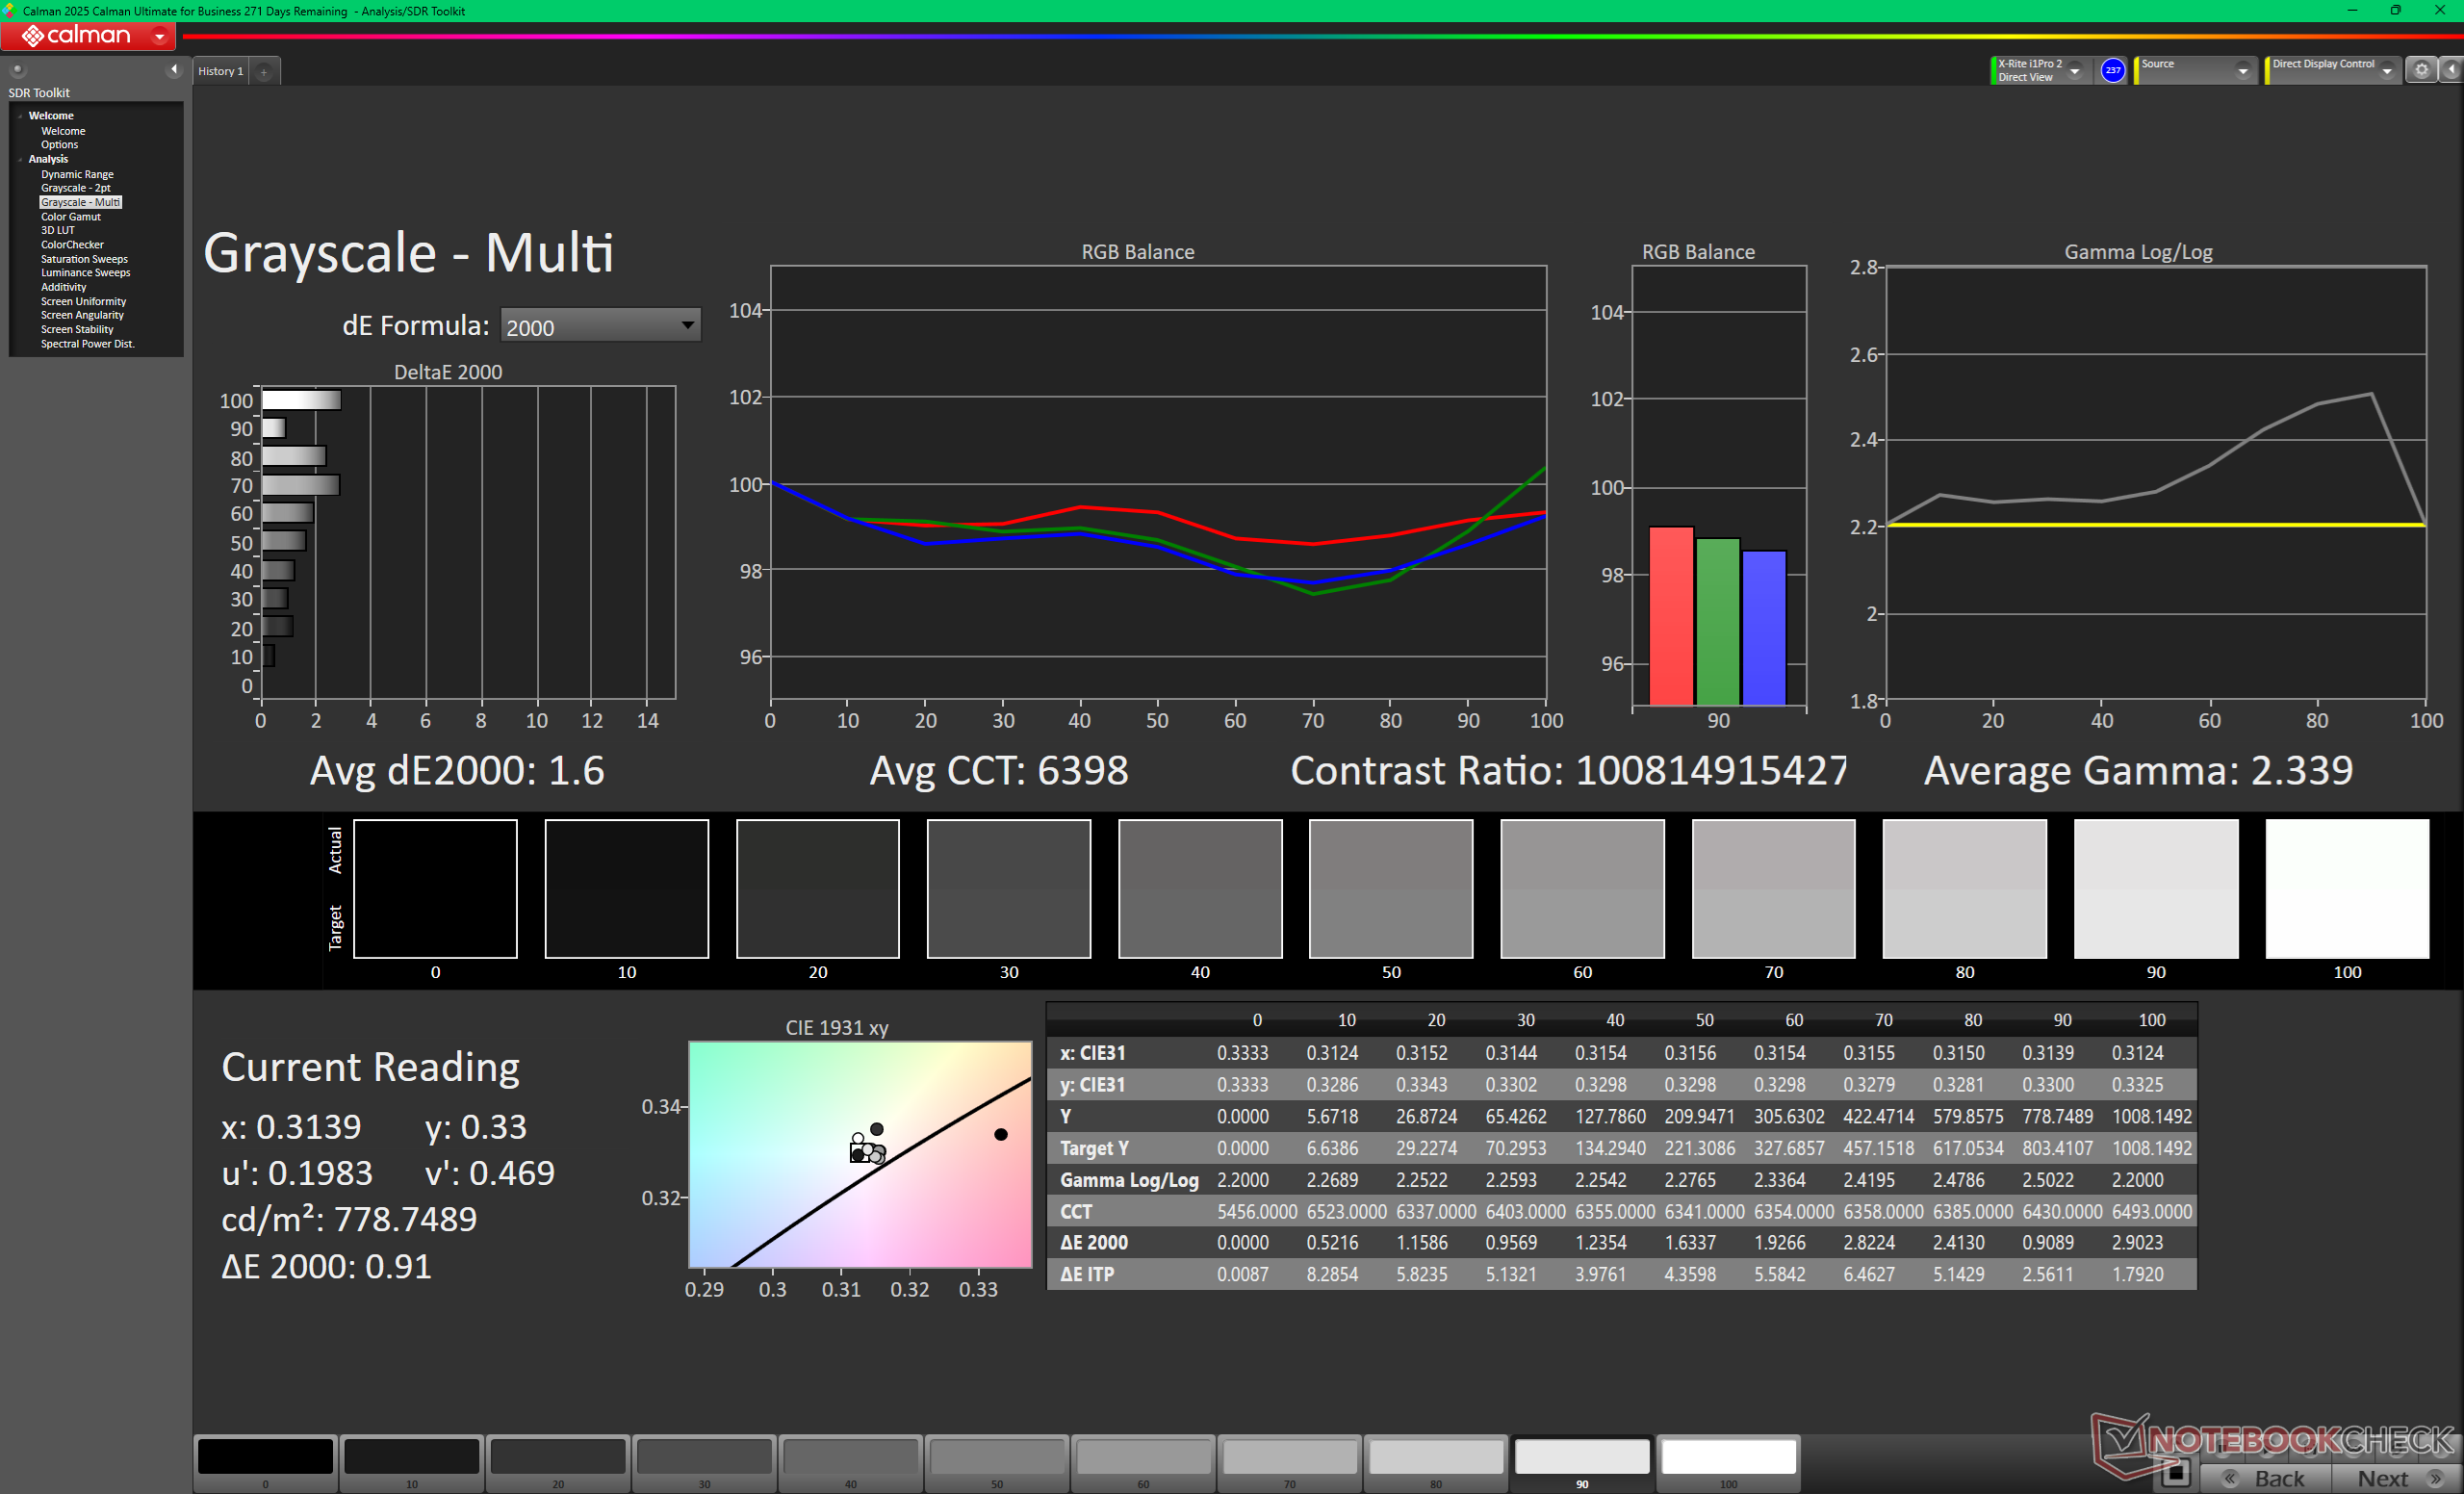
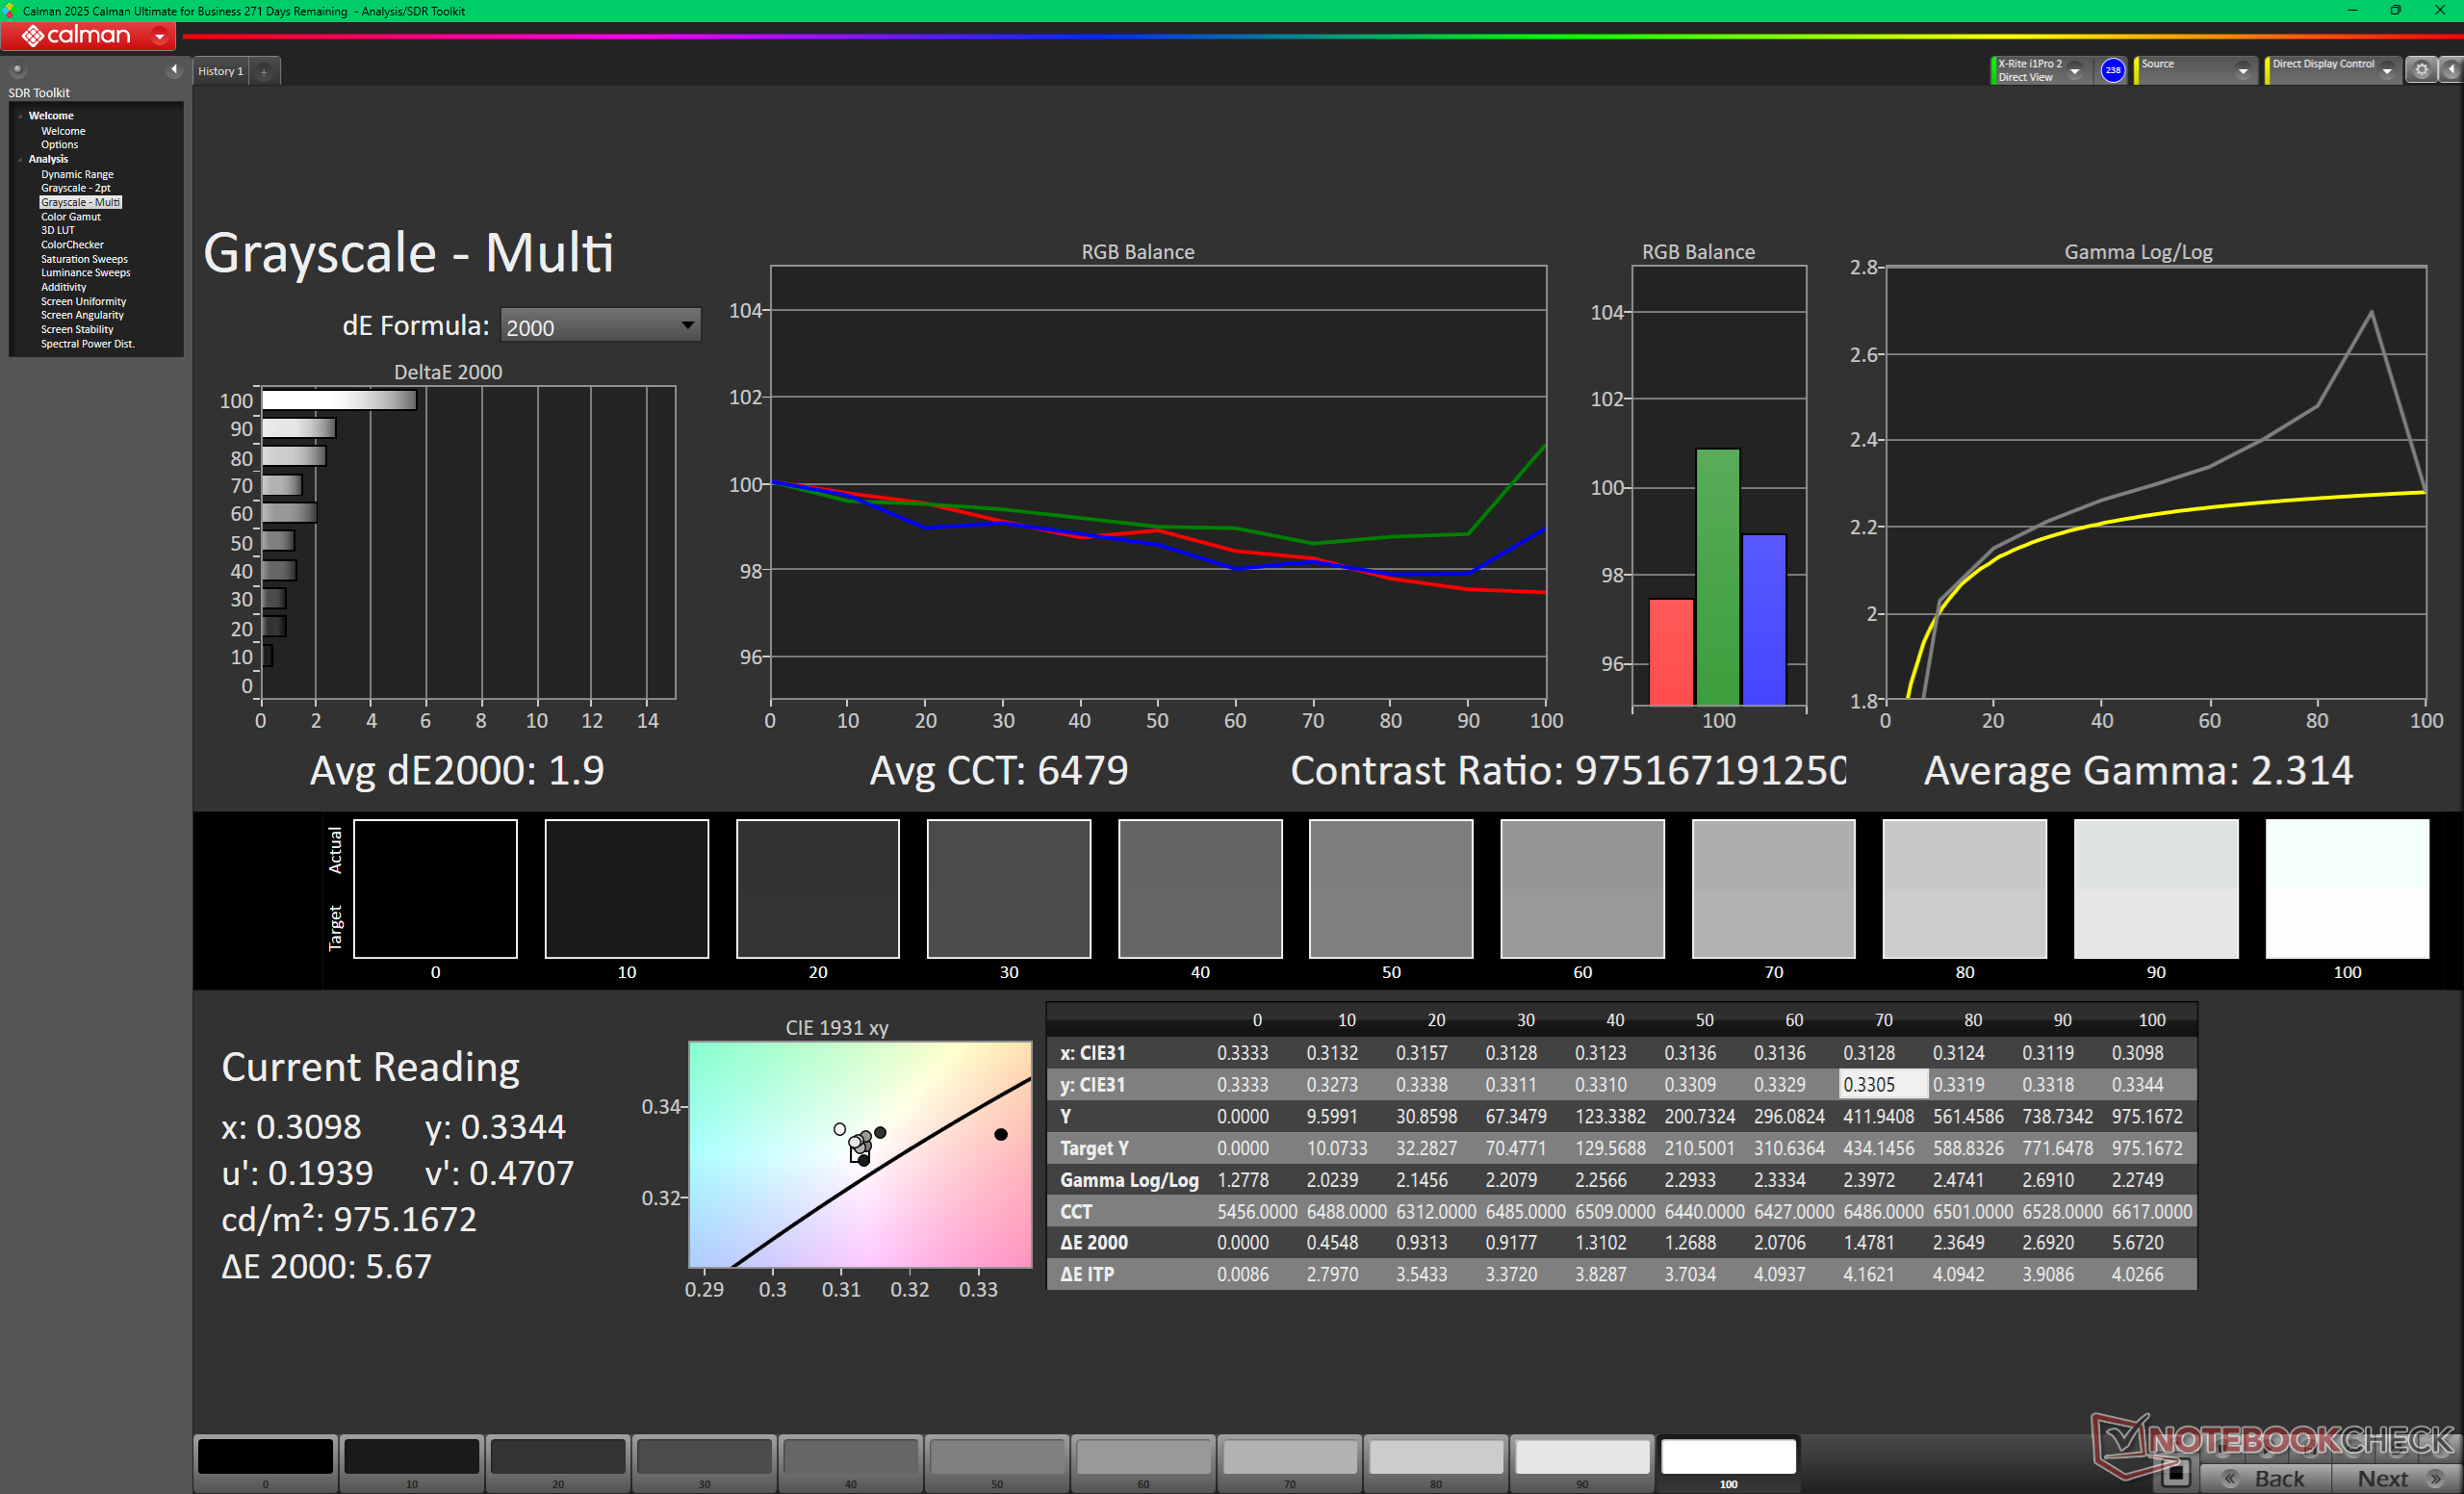
ΔE Greyscale Calman: 1.6 | ∀{0.09-98 Ø4.96}
95.7% AdobeRGB 1998 (Argyll 3D)
100% sRGB (Argyll 3D)
98.8% Display P3 (Argyll 3D)
Gamma: 2.34
CCT: 6398 K
| Lenovo Pro 9 16IPH11 Samsung ATNA60KA04-0, Tandem OLED, 3200x2000, 16", 120 Hz | Lenovo Yoga Pro 9 16IAH10 RTX 5050 ATNA60HR04-0, OLED, 2880x1800, 16", 120 Hz | Dell XPS 16 Core Ultra X7 358H LG Philips 160WV1, OLED, 3200x2000, 16", 120 Hz | MSI Prestige 16 AI Evo B2HMG B160QAN03_R, IPS, 2560x1600, 16", 60 Hz | HP Omen Transcend 16-u1095ng ATNA60DL02-0 (SDC41A4), OLED, 2560x1600, 16", 240 Hz | Asus ProArt P16 H7606WP ATNA60CL10-0, OLED, 2880x1800, 16", 120 Hz | |
|---|---|---|---|---|---|---|
| Display | 1% | -5% | 1% | -2% | ||
| Display P3 Coverage (%) | 98.8 | 99.5 1% | 96.4 -2% | 99.8 1% | 99.5 1% | |
| sRGB Coverage (%) | 100 | 100 0% | 99.7 0% | 100 0% | 100 0% | |
| AdobeRGB 1998 Coverage (%) | 95.7 | 96.5 1% | 84.3 -12% | 97 1% | 89.5 -6% | |
| Response Times | -131% | -39% | -5878% | 71% | -17% | |
| Response Time Grey 50% / Grey 80% * (ms) | 0.58 ? | 0.65 ? -12% | 51.5 ? -8779% | 0.2 ? 66% | 0.63 ? -9% | |
| Response Time Black / White * (ms) | 0.79 ? | 0.87 ? -10% | 24.3 ? -2976% | 0.2 ? 75% | 0.63 ? 20% | |
| PWM Frequency (Hz) | 1173.2 | 1200 | 240.2 ? | 120 ? | 480 ? | |
| PWM Amplitude * (%) | 16 | 37 -131% | 31 -94% | 26 -63% | ||
| Screen | -26% | -15% | -92% | -29% | 8% | |
| Brightness middle (cd/m²) | 930.9 | 471.7 -49% | 395.4 -58% | 471 -49% | 390 -58% | 362 -61% |
| Brightness (cd/m²) | 947 | 474 -50% | 392 -59% | 455 -52% | 392 -59% | 363 -62% |
| Brightness Distribution (%) | 94 | 98 4% | 95 1% | 92 -2% | 98 4% | 99 5% |
| Black Level * (cd/m²) | 0.2 | 0.02 | ||||
| Colorchecker dE 2000 * | 3.51 | 3.53 -1% | 3.69 -5% | 5.8 -65% | 1.94 45% | 0.8 77% |
| Colorchecker dE 2000 max. * | 6.48 | 6.31 3% | 7.94 -23% | 10.8 -67% | 4.26 34% | 1.8 72% |
| Colorchecker dE 2000 calibrated * | 1.55 | 0.68 56% | 1.9 -23% | 4.21 -172% | ||
| Greyscale dE 2000 * | 1.6 | 2.6 -63% | 1.9 -19% | 7.8 -388% | 1.5 6% | 1.3 19% |
| Gamma | 2.34 94% | 2.24 98% | 2.28 96% | 2.07 106% | 2.221 99% | 2.2 100% |
| CCT | 6398 102% | 6292 103% | 6274 104% | 7262 90% | 6395 102% | 6741 96% |
| Contrast (:1) | 2355 | 19500 | ||||
| Media total (Programa/Opciones) | -79% /
-41% | -18% /
-17% | -1992% /
-1035% | 14% /
-5% | -4% /
-1% |
* ... más pequeño es mejor

Tiempos de respuesta del display
| ↔ Tiempo de respuesta de Negro a Blanco | ||
|---|---|---|
| 0.79 ms ... subida ↗ y bajada ↘ combinada | ↗ 0.37 ms subida | 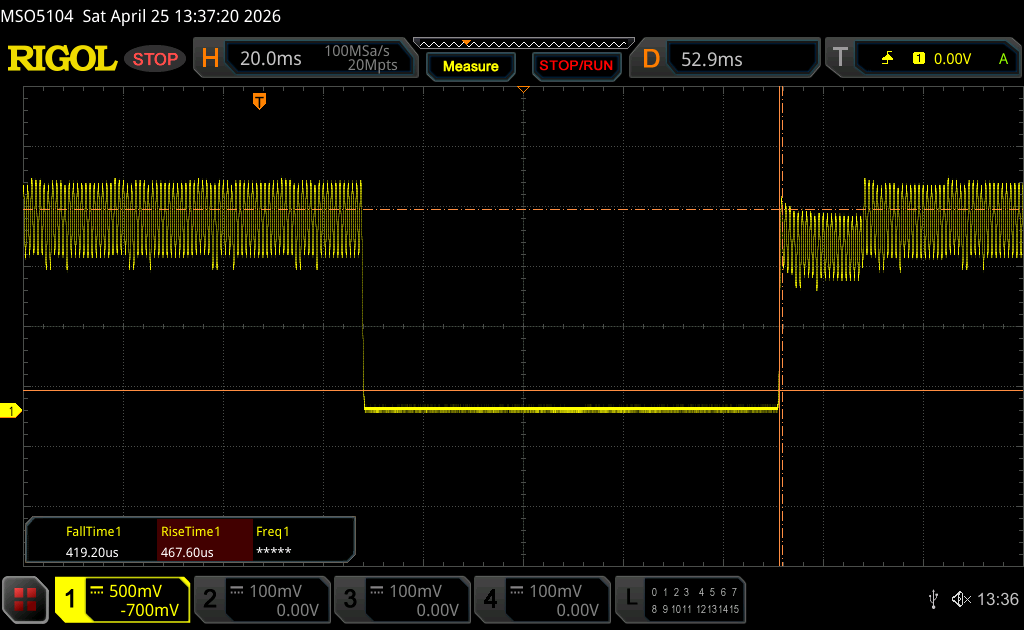 |
| ↘ 0.42 ms bajada | ||
| La pantalla mostró tiempos de respuesta muy rápidos en nuestros tests y debería ser adecuada para juegos frenéticos. En comparación, todos los dispositivos de prueba van de ##min### (mínimo) a 240 (máximo) ms. » 2 % de todos los dispositivos son mejores. Esto quiere decir que el tiempo de respuesta medido es mejor que la media (19.8 ms) de todos los dispositivos testados. | ||
| ↔ Tiempo de respuesta 50% Gris a 80% Gris | ||
| 0.58 ms ... subida ↗ y bajada ↘ combinada | ↗ 0.3 ms subida | 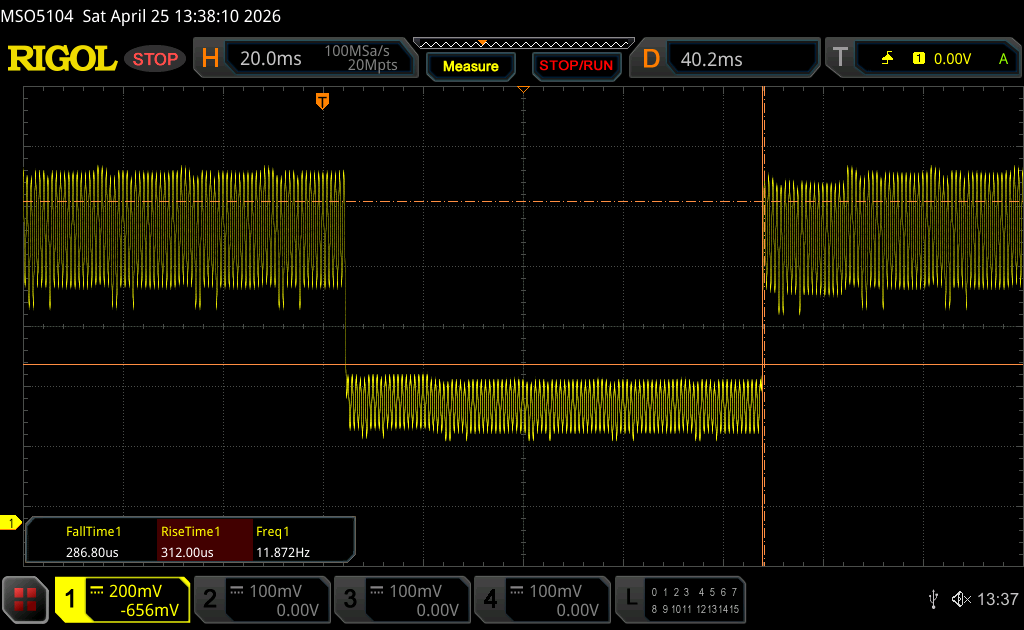 |
| ↘ 0.28 ms bajada | ||
| La pantalla mostró tiempos de respuesta muy rápidos en nuestros tests y debería ser adecuada para juegos frenéticos. En comparación, todos los dispositivos de prueba van de ##min### (mínimo) a 636 (máximo) ms. » 1 % de todos los dispositivos son mejores. Esto quiere decir que el tiempo de respuesta medido es mejor que la media (31 ms) de todos los dispositivos testados. | ||
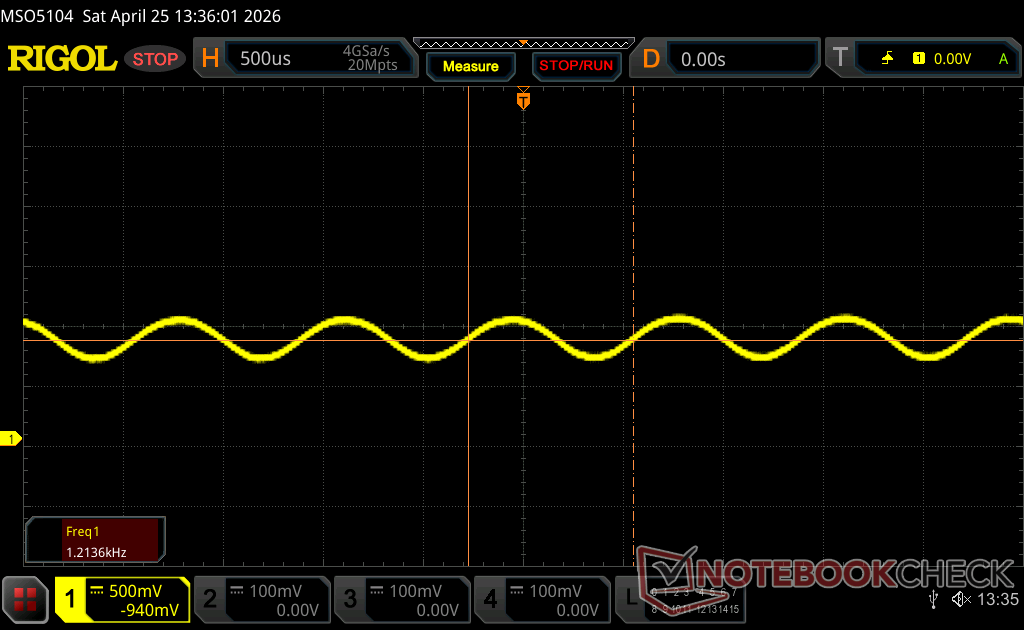
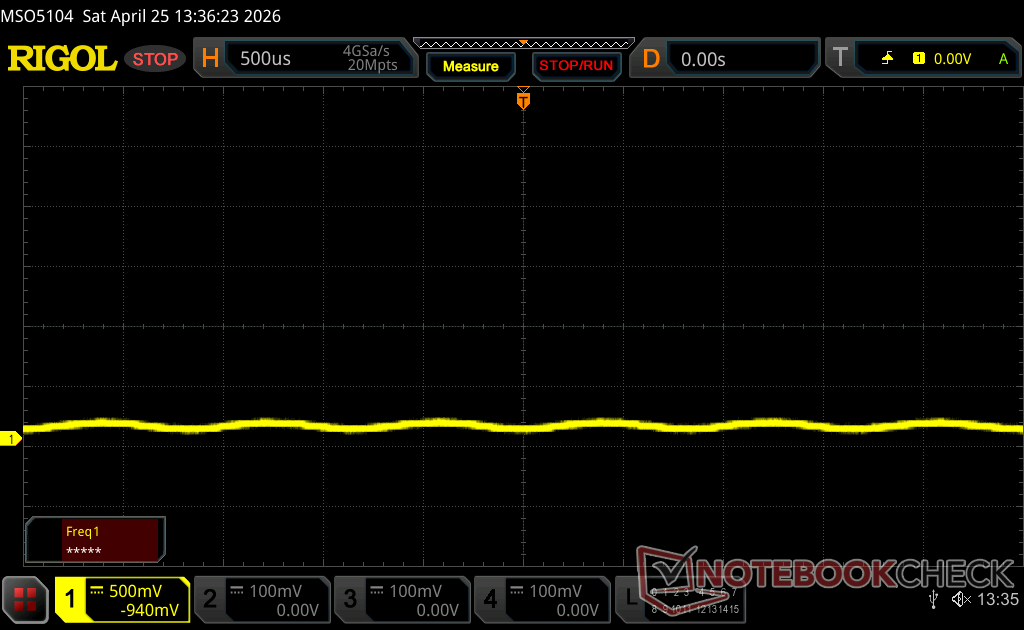
Parpadeo de Pantalla / PWM (Pulse-Width Modulation)
| Parpadeo de Pantalla / PWM detectado | 1173.2 Hz Amplitude: 16 % | 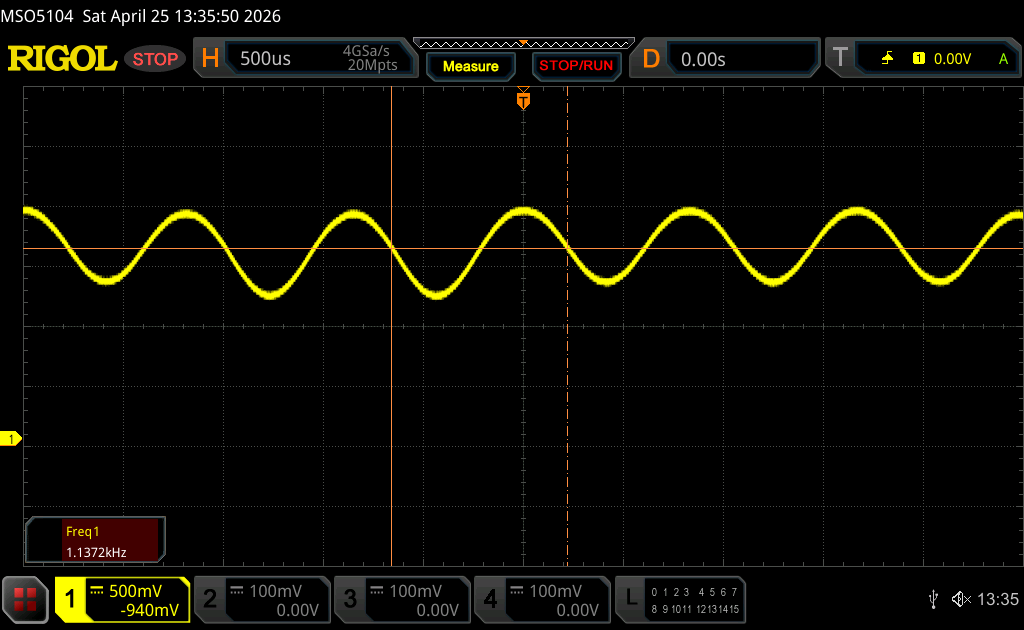 | |
La retroiluminación del display parpadea a 1173.2 Hz (seguramente usa PWM - Pulse-Width Modulation) . La frecuencia de 1173.2 Hz es bastante alta, por lo que la mayoría de gente sensible al parpadeo no debería ver parpadeo o tener fatiga visual. Comparación: 52 % de todos los dispositivos testados no usaron PWM para atenuar el display. Si se usó, medimos una media de 7757 (mínimo: 5 - máxmo: 343500) Hz. | |||


Rendimiento
Condiciones de prueba
Pusimos Windows en modo Rendimiento y en modo de gráficos discretos antes de ejecutar las pruebas comparativas que se indican a continuación.
Procesador
El nuevo Core Ultra 9 386H desgraciadamente proporciona pocas o ninguna ventaja de rendimiento respecto a la generación anterior Core Ultra 9 285H tal y como muestran nuestras tablas comparativas a continuación. De hecho, la nueva CPU cuenta incluso con menos caché L2 y L3 que su predecesora. Sin embargo, lo compensa con una mayor eficiencia de fabricación (1,8 nm frente a 5 nm) y un rendimiento más rápido de la NPU integrada (50 frente a 13 TOPS).
Bucle múltiple Cinebench R15
Cinebench R23: Multi Core | Single Core
Cinebench R20: CPU (Multi Core) | CPU (Single Core)
Cinebench R15: CPU Multi 64Bit | CPU Single 64Bit
Blender: v2.79 BMW27 CPU
7-Zip 18.03: 7z b 4 | 7z b 4 -mmt1
Geekbench 6.7: Multi-Core | Single-Core
Geekbench 5.5: Multi-Core | Single-Core
HWBOT x265 Benchmark v2.2: 4k Preset
LibreOffice : 20 Documents To PDF
R Benchmark 2.5: Overall mean
* ... más pequeño es mejor
AIDA64: FP32 Ray-Trace | FPU Julia | CPU SHA3 | CPU Queen | FPU SinJulia | FPU Mandel | CPU AES | CPU ZLib | FP64 Ray-Trace | CPU PhotoWorxx | CPU CheckMate
| Performance rating | |
| Asus ProArt P16 H7606WP -1! | |
| Lenovo Pro 9 16IPH11 -1! | |
| Lenovo Yoga Pro 9 16IAH10 RTX 5050 -1! | |
| HP Omen Transcend 16-u1095ng -1! | |
| Medio Intel Core Ultra 9 386H -1! | |
| Dell XPS 16 Core Ultra X7 358H -1! | |
| MSI Prestige 16 AI Evo B2HMG -1! | |
| AIDA64 / FP32 Ray-Trace | |
| Asus ProArt P16 H7606WP (v6.92.6600) | |
| Lenovo Yoga Pro 9 16IAH10 RTX 5050 (v6.92.6600) | |
| Lenovo Pro 9 16IPH11 (v8.20.8100) | |
| MSI Prestige 16 AI Evo B2HMG (v6.92.6600) | |
| Medio Intel Core Ultra 9 386H (10001 - 21727, n=8) | |
| HP Omen Transcend 16-u1095ng (v6.92.6600) | |
| Dell XPS 16 Core Ultra X7 358H (v8.20.8100) | |
| AIDA64 / FPU Julia | |
| Asus ProArt P16 H7606WP (v6.92.6600) | |
| Lenovo Yoga Pro 9 16IAH10 RTX 5050 (v6.92.6600) | |
| Lenovo Pro 9 16IPH11 (v8.20.8100) | |
| Medio Intel Core Ultra 9 386H (53370 - 113595, n=8) | |
| MSI Prestige 16 AI Evo B2HMG (v6.92.6600) | |
| HP Omen Transcend 16-u1095ng (v6.92.6600) | |
| Dell XPS 16 Core Ultra X7 358H (v8.20.8100) | |
| AIDA64 / CPU SHA3 | |
| Asus ProArt P16 H7606WP (v6.92.6600) | |
| Lenovo Pro 9 16IPH11 (v8.20.8100) | |
| Lenovo Yoga Pro 9 16IAH10 RTX 5050 (v6.92.6600) | |
| Medio Intel Core Ultra 9 386H (2776 - 5604, n=8) | |
| MSI Prestige 16 AI Evo B2HMG (v6.92.6600) | |
| HP Omen Transcend 16-u1095ng (v6.92.6600) | |
| Dell XPS 16 Core Ultra X7 358H (v8.20.8100) | |
| AIDA64 / CPU Queen | |
| HP Omen Transcend 16-u1095ng (v6.92.6600) | |
| Asus ProArt P16 H7606WP (v6.92.6600) | |
| MSI Prestige 16 AI Evo B2HMG (v6.92.6600) | |
| Lenovo Yoga Pro 9 16IAH10 RTX 5050 (v6.92.6600) | |
| AIDA64 / FPU SinJulia | |
| Asus ProArt P16 H7606WP (v6.92.6600) | |
| HP Omen Transcend 16-u1095ng (v6.92.6600) | |
| Lenovo Yoga Pro 9 16IAH10 RTX 5050 (v6.92.6600) | |
| MSI Prestige 16 AI Evo B2HMG (v6.92.6600) | |
| Lenovo Pro 9 16IPH11 (v8.20.8100) | |
| Dell XPS 16 Core Ultra X7 358H (v8.20.8100) | |
| Medio Intel Core Ultra 9 386H (5314 - 7332, n=8) | |
| AIDA64 / FPU Mandel | |
| Asus ProArt P16 H7606WP (v6.92.6600) | |
| Lenovo Yoga Pro 9 16IAH10 RTX 5050 (v6.92.6600) | |
| Lenovo Pro 9 16IPH11 (v8.20.8100) | |
| Medio Intel Core Ultra 9 386H (28414 - 61578, n=8) | |
| MSI Prestige 16 AI Evo B2HMG (v6.92.6600) | |
| Dell XPS 16 Core Ultra X7 358H (v8.20.8100) | |
| HP Omen Transcend 16-u1095ng (v6.92.6600) | |
| AIDA64 / CPU AES | |
| Asus ProArt P16 H7606WP (v6.92.6600) | |
| HP Omen Transcend 16-u1095ng (v6.92.6600) | |
| Lenovo Yoga Pro 9 16IAH10 RTX 5050 (v6.92.6600) | |
| Lenovo Pro 9 16IPH11 (v8.20.8100) | |
| MSI Prestige 16 AI Evo B2HMG (v6.92.6600) | |
| Medio Intel Core Ultra 9 386H (46362 - 72112, n=8) | |
| Dell XPS 16 Core Ultra X7 358H (v8.20.8100) | |
| AIDA64 / CPU ZLib | |
| Asus ProArt P16 H7606WP (v6.92.6600) | |
| HP Omen Transcend 16-u1095ng (v6.92.6600) | |
| Lenovo Yoga Pro 9 16IAH10 RTX 5050 (v6.92.6600) | |
| Lenovo Pro 9 16IPH11 (v8.20.8100) | |
| Medio Intel Core Ultra 9 386H (669 - 1271, n=8) | |
| MSI Prestige 16 AI Evo B2HMG (v6.92.6600) | |
| Dell XPS 16 Core Ultra X7 358H (v8.20.8100) | |
| AIDA64 / FP64 Ray-Trace | |
| Asus ProArt P16 H7606WP (v6.92.6600) | |
| Lenovo Yoga Pro 9 16IAH10 RTX 5050 (v6.92.6600) | |
| Lenovo Pro 9 16IPH11 (v8.20.8100) | |
| MSI Prestige 16 AI Evo B2HMG (v6.92.6600) | |
| Medio Intel Core Ultra 9 386H (5138 - 11627, n=8) | |
| HP Omen Transcend 16-u1095ng (v6.92.6600) | |
| Dell XPS 16 Core Ultra X7 358H (v8.20.8100) | |
| AIDA64 / CPU PhotoWorxx | |
| Dell XPS 16 Core Ultra X7 358H (v8.20.8100) | |
| Medio Intel Core Ultra 9 386H (54042 - 89891, n=8) | |
| Lenovo Pro 9 16IPH11 (v8.20.8100) | |
| Lenovo Yoga Pro 9 16IAH10 RTX 5050 (v6.92.6600) | |
| MSI Prestige 16 AI Evo B2HMG (v6.92.6600) | |
| HP Omen Transcend 16-u1095ng (v6.92.6600) | |
| Asus ProArt P16 H7606WP (v6.92.6600) | |
| AIDA64 / CPU CheckMate | |
| Lenovo Pro 9 16IPH11 (v8.20.8100) | |
| Medio Intel Core Ultra 9 386H (4051 - 4858, n=7) | |
| Dell XPS 16 Core Ultra X7 358H (v8.20.8100) | |
Rendimiento del sistema
PCMark 10: Score | Essentials | Productivity | Digital Content Creation
CrossMark: Overall | Productivity | Creativity | Responsiveness
WebXPRT 3: Overall
WebXPRT 4: Overall
Mozilla Kraken 1.1: Total
Geekbench AI: Half Precision GPU 1.7 | Single Precision GPU 1.7 | Quantized GPU 1.7
| Performance rating | |
| Medio Intel Core Ultra 9 386H, NVIDIA GeForce RTX 5060 Laptop | |
| Lenovo Pro 9 16IPH11 | |
| Lenovo Yoga Pro 9 16IAH10 RTX 5050 | |
| MSI Prestige 16 AI Evo B2HMG -3! | |
| Dell XPS 16 Core Ultra X7 358H | |
| Asus ProArt P16 H7606WP -3! | |
| HP Omen Transcend 16-u1095ng -8! | |
| PCMark 10 / Score | |
| Dell XPS 16 Core Ultra X7 358H | |
| Lenovo Yoga Pro 9 16IAH10 RTX 5050 | |
| Lenovo Pro 9 16IPH11 | |
| Medio Intel Core Ultra 9 386H, NVIDIA GeForce RTX 5060 Laptop (9465 - 9484, n=2) | |
| Asus ProArt P16 H7606WP | |
| HP Omen Transcend 16-u1095ng | |
| MSI Prestige 16 AI Evo B2HMG | |
| PCMark 10 / Essentials | |
| MSI Prestige 16 AI Evo B2HMG | |
| Dell XPS 16 Core Ultra X7 358H | |
| Medio Intel Core Ultra 9 386H, NVIDIA GeForce RTX 5060 Laptop (10759 - 10841, n=2) | |
| Lenovo Yoga Pro 9 16IAH10 RTX 5050 | |
| Lenovo Pro 9 16IPH11 | |
| Asus ProArt P16 H7606WP | |
| HP Omen Transcend 16-u1095ng | |
| PCMark 10 / Productivity | |
| Lenovo Yoga Pro 9 16IAH10 RTX 5050 | |
| Dell XPS 16 Core Ultra X7 358H | |
| Lenovo Pro 9 16IPH11 | |
| Medio Intel Core Ultra 9 386H, NVIDIA GeForce RTX 5060 Laptop (15199 - 15447, n=2) | |
| HP Omen Transcend 16-u1095ng | |
| MSI Prestige 16 AI Evo B2HMG | |
| Asus ProArt P16 H7606WP | |
| PCMark 10 / Digital Content Creation | |
| Asus ProArt P16 H7606WP | |
| Medio Intel Core Ultra 9 386H, NVIDIA GeForce RTX 5060 Laptop (13928 - 13963, n=2) | |
| Lenovo Pro 9 16IPH11 | |
| Dell XPS 16 Core Ultra X7 358H | |
| Lenovo Yoga Pro 9 16IAH10 RTX 5050 | |
| MSI Prestige 16 AI Evo B2HMG | |
| HP Omen Transcend 16-u1095ng | |
| CrossMark / Overall | |
| MSI Prestige 16 AI Evo B2HMG | |
| Medio Intel Core Ultra 9 386H, NVIDIA GeForce RTX 5060 Laptop (2108 - 2164, n=2) | |
| Dell XPS 16 Core Ultra X7 358H | |
| Lenovo Pro 9 16IPH11 | |
| Lenovo Yoga Pro 9 16IAH10 RTX 5050 | |
| Asus ProArt P16 H7606WP | |
| CrossMark / Productivity | |
| MSI Prestige 16 AI Evo B2HMG | |
| Medio Intel Core Ultra 9 386H, NVIDIA GeForce RTX 5060 Laptop (1917 - 1973, n=2) | |
| Lenovo Pro 9 16IPH11 | |
| Dell XPS 16 Core Ultra X7 358H | |
| Lenovo Yoga Pro 9 16IAH10 RTX 5050 | |
| Asus ProArt P16 H7606WP | |
| CrossMark / Creativity | |
| Dell XPS 16 Core Ultra X7 358H | |
| Lenovo Pro 9 16IPH11 | |
| Medio Intel Core Ultra 9 386H, NVIDIA GeForce RTX 5060 Laptop (2442 - 2500, n=2) | |
| MSI Prestige 16 AI Evo B2HMG | |
| Lenovo Yoga Pro 9 16IAH10 RTX 5050 | |
| Asus ProArt P16 H7606WP | |
| CrossMark / Responsiveness | |
| MSI Prestige 16 AI Evo B2HMG | |
| Medio Intel Core Ultra 9 386H, NVIDIA GeForce RTX 5060 Laptop (1682 - 1988, n=2) | |
| Dell XPS 16 Core Ultra X7 358H | |
| Lenovo Pro 9 16IPH11 | |
| Lenovo Yoga Pro 9 16IAH10 RTX 5050 | |
| Asus ProArt P16 H7606WP | |
| WebXPRT 3 / Overall | |
| MSI Prestige 16 AI Evo B2HMG | |
| HP Omen Transcend 16-u1095ng | |
| Asus ProArt P16 H7606WP | |
| Lenovo Pro 9 16IPH11 | |
| Lenovo Yoga Pro 9 16IAH10 RTX 5050 | |
| Medio Intel Core Ultra 9 386H, NVIDIA GeForce RTX 5060 Laptop (310 - 326, n=2) | |
| Dell XPS 16 Core Ultra X7 358H | |
| WebXPRT 4 / Overall | |
| MSI Prestige 16 AI Evo B2HMG | |
| Lenovo Yoga Pro 9 16IAH10 RTX 5050 | |
| Lenovo Pro 9 16IPH11 | |
| Dell XPS 16 Core Ultra X7 358H | |
| Medio Intel Core Ultra 9 386H, NVIDIA GeForce RTX 5060 Laptop (298 - 302, n=2) | |
| Asus ProArt P16 H7606WP | |
| Mozilla Kraken 1.1 / Total | |
| Dell XPS 16 Core Ultra X7 358H | |
| Asus ProArt P16 H7606WP | |
| Medio Intel Core Ultra 9 386H, NVIDIA GeForce RTX 5060 Laptop (442 - 446, n=2) | |
| Lenovo Pro 9 16IPH11 | |
| HP Omen Transcend 16-u1095ng | |
| Lenovo Yoga Pro 9 16IAH10 RTX 5050 | |
| MSI Prestige 16 AI Evo B2HMG | |
| Geekbench AI / Half Precision GPU 1.7 | |
| Lenovo Yoga Pro 9 16IAH10 RTX 5050 | |
| Lenovo Pro 9 16IPH11 | |
| Medio Intel Core Ultra 9 386H, NVIDIA GeForce RTX 5060 Laptop (n=1) | |
| Dell XPS 16 Core Ultra X7 358H | |
| Geekbench AI / Single Precision GPU 1.7 | |
| Lenovo Pro 9 16IPH11 | |
| Medio Intel Core Ultra 9 386H, NVIDIA GeForce RTX 5060 Laptop (n=1) | |
| Lenovo Yoga Pro 9 16IAH10 RTX 5050 | |
| Dell XPS 16 Core Ultra X7 358H | |
| Geekbench AI / Quantized GPU 1.7 | |
| Lenovo Pro 9 16IPH11 | |
| Medio Intel Core Ultra 9 386H, NVIDIA GeForce RTX 5060 Laptop (n=1) | |
| Lenovo Yoga Pro 9 16IAH10 RTX 5050 | |
| Dell XPS 16 Core Ultra X7 358H | |
* ... más pequeño es mejor
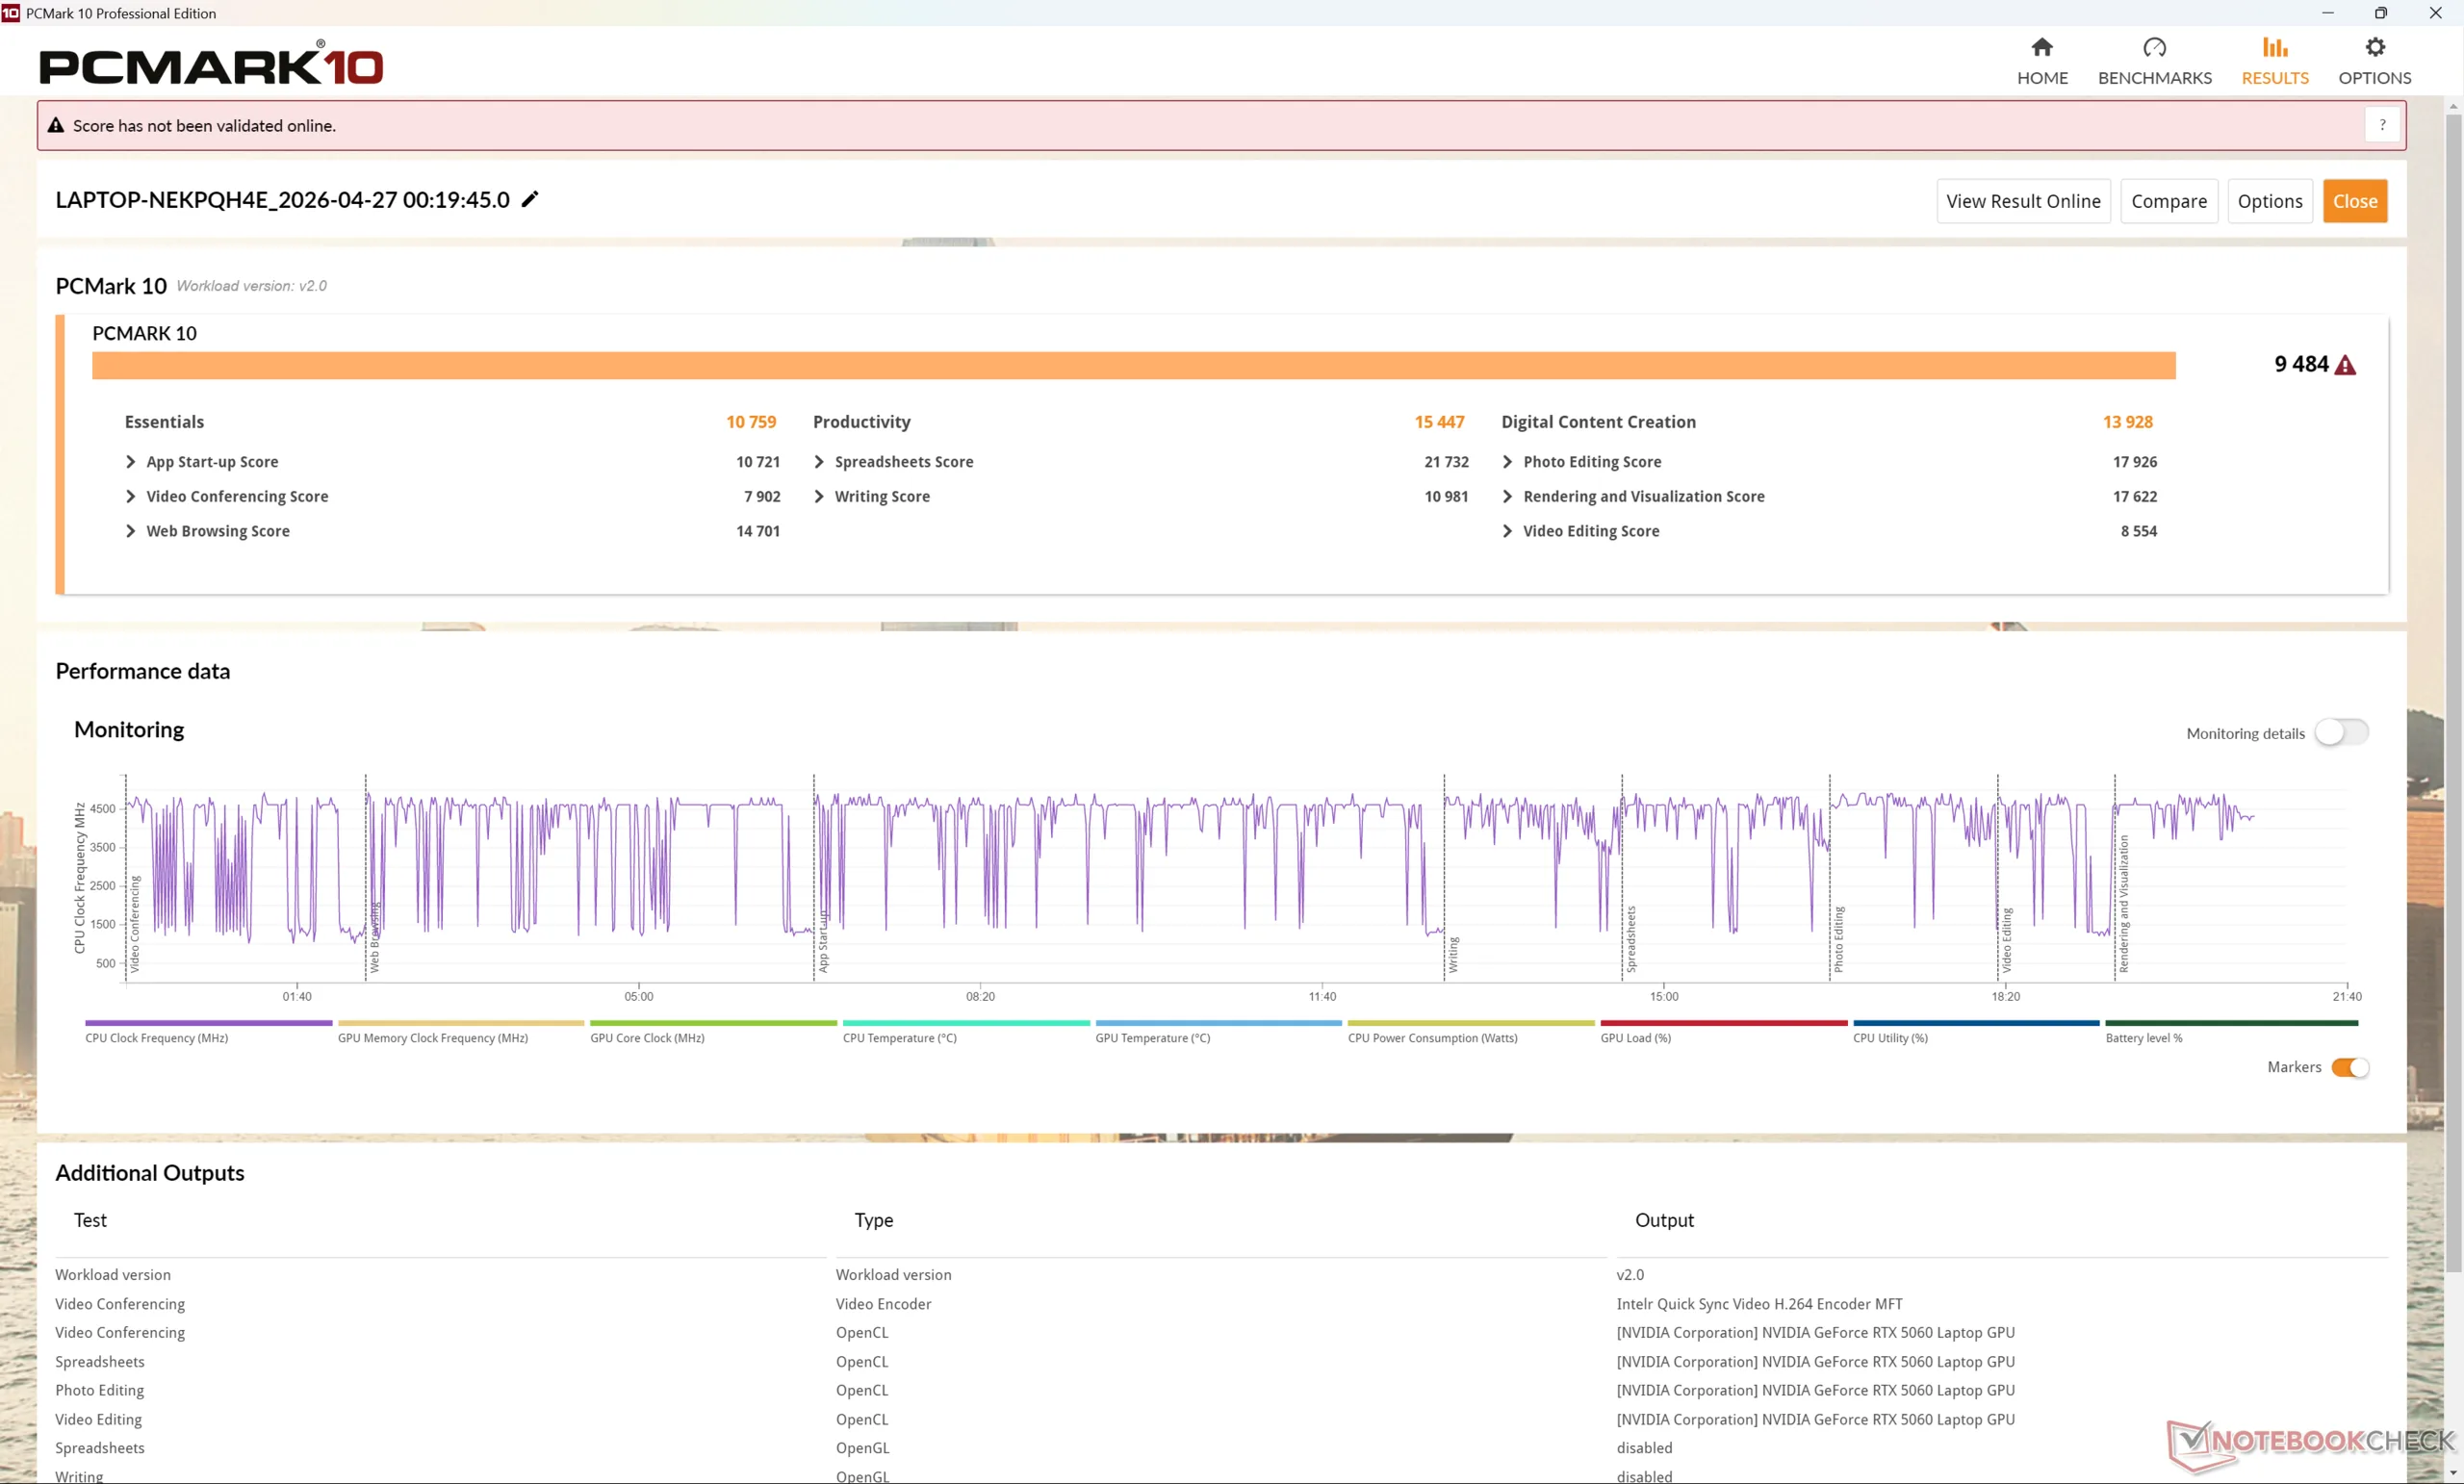
| PCMark 10 Score | 9484 puntos | |
ayuda | ||
| AIDA64 / Memory Copy | |
| Dell XPS 16 Core Ultra X7 358H | |
| Medio Intel Core Ultra 9 386H (75437 - 129946, n=8) | |
| Lenovo Pro 9 16IPH11 | |
| Lenovo Yoga Pro 9 16IAH10 RTX 5050 | |
| MSI Prestige 16 AI Evo B2HMG | |
| Asus ProArt P16 H7606WP | |
| HP Omen Transcend 16-u1095ng | |
| AIDA64 / Memory Read | |
| Dell XPS 16 Core Ultra X7 358H | |
| Medio Intel Core Ultra 9 386H (81021 - 118858, n=8) | |
| Lenovo Pro 9 16IPH11 | |
| Asus ProArt P16 H7606WP | |
| Lenovo Yoga Pro 9 16IAH10 RTX 5050 | |
| HP Omen Transcend 16-u1095ng | |
| MSI Prestige 16 AI Evo B2HMG | |
| AIDA64 / Memory Write | |
| Dell XPS 16 Core Ultra X7 358H | |
| Medio Intel Core Ultra 9 386H (75959 - 135096, n=8) | |
| Lenovo Yoga Pro 9 16IAH10 RTX 5050 | |
| Lenovo Pro 9 16IPH11 | |
| Asus ProArt P16 H7606WP | |
| HP Omen Transcend 16-u1095ng | |
| MSI Prestige 16 AI Evo B2HMG | |
| AIDA64 / Memory Latency | |
| MSI Prestige 16 AI Evo B2HMG | |
| Lenovo Yoga Pro 9 16IAH10 RTX 5050 | |
| Asus ProArt P16 H7606WP | |
| Lenovo Pro 9 16IPH11 | |
| Medio Intel Core Ultra 9 386H (87.2 - 116.9, n=8) | |
| HP Omen Transcend 16-u1095ng | |
| Dell XPS 16 Core Ultra X7 358H | |
* ... más pequeño es mejor
Latencia del CPD
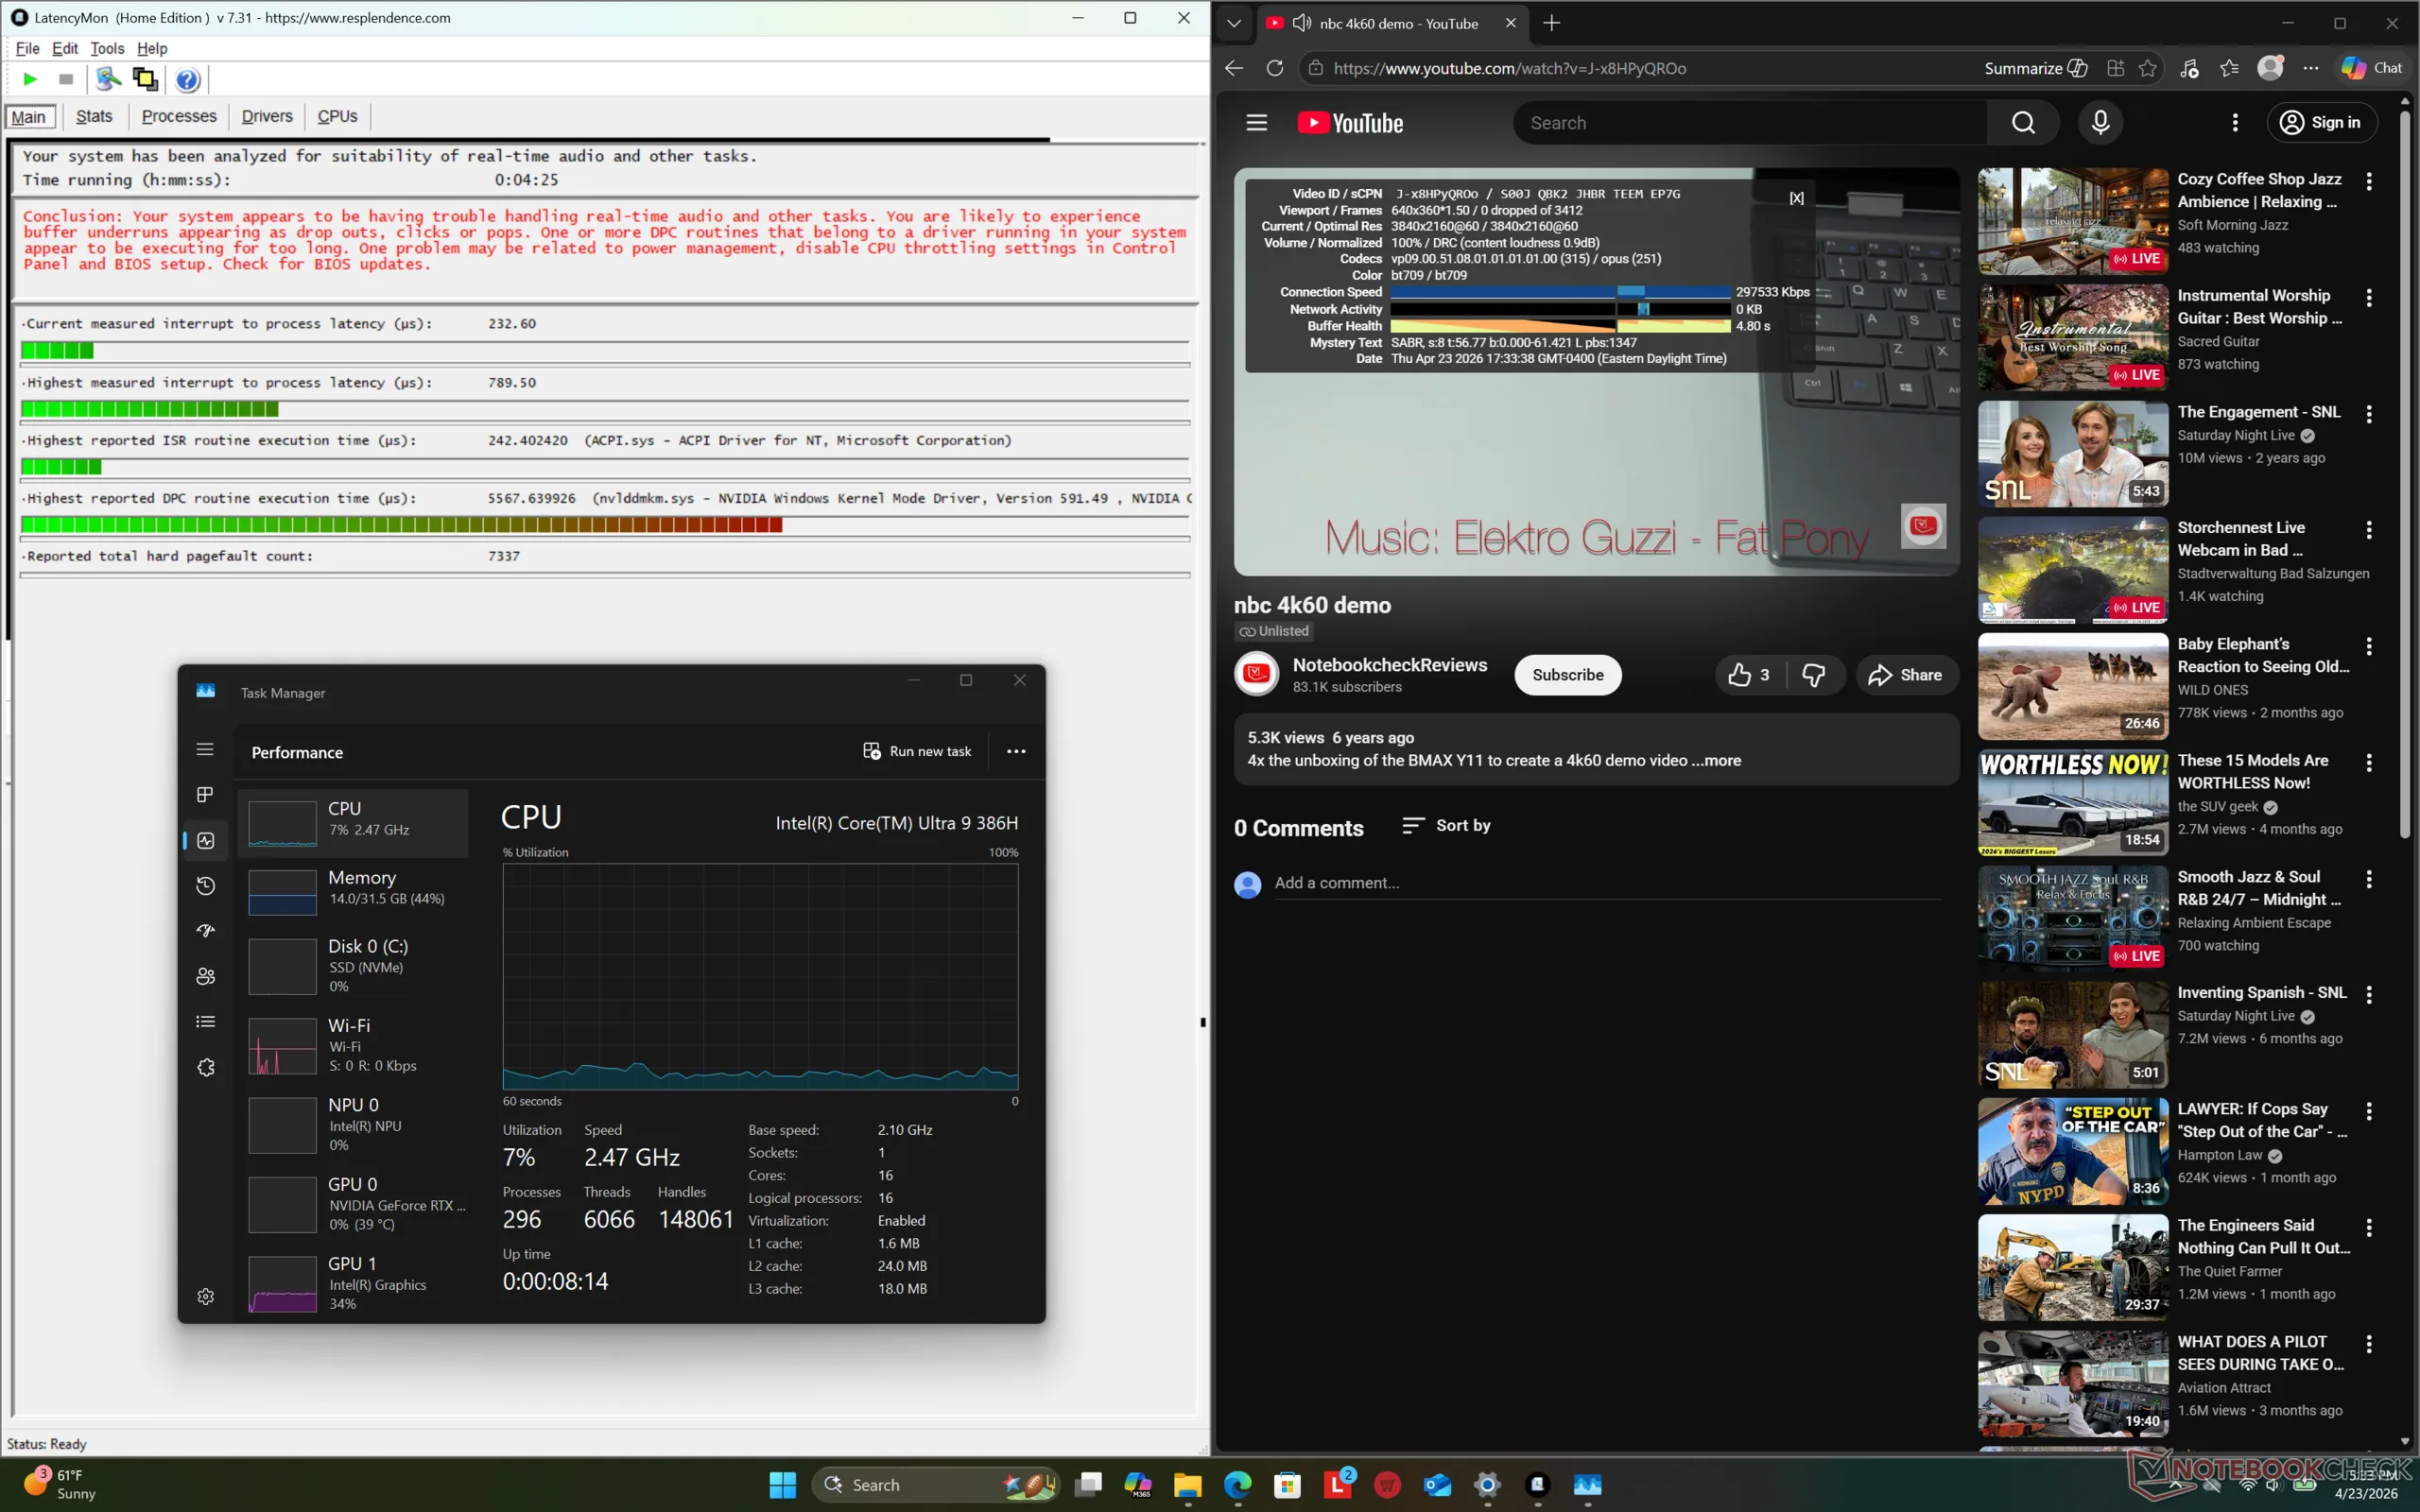
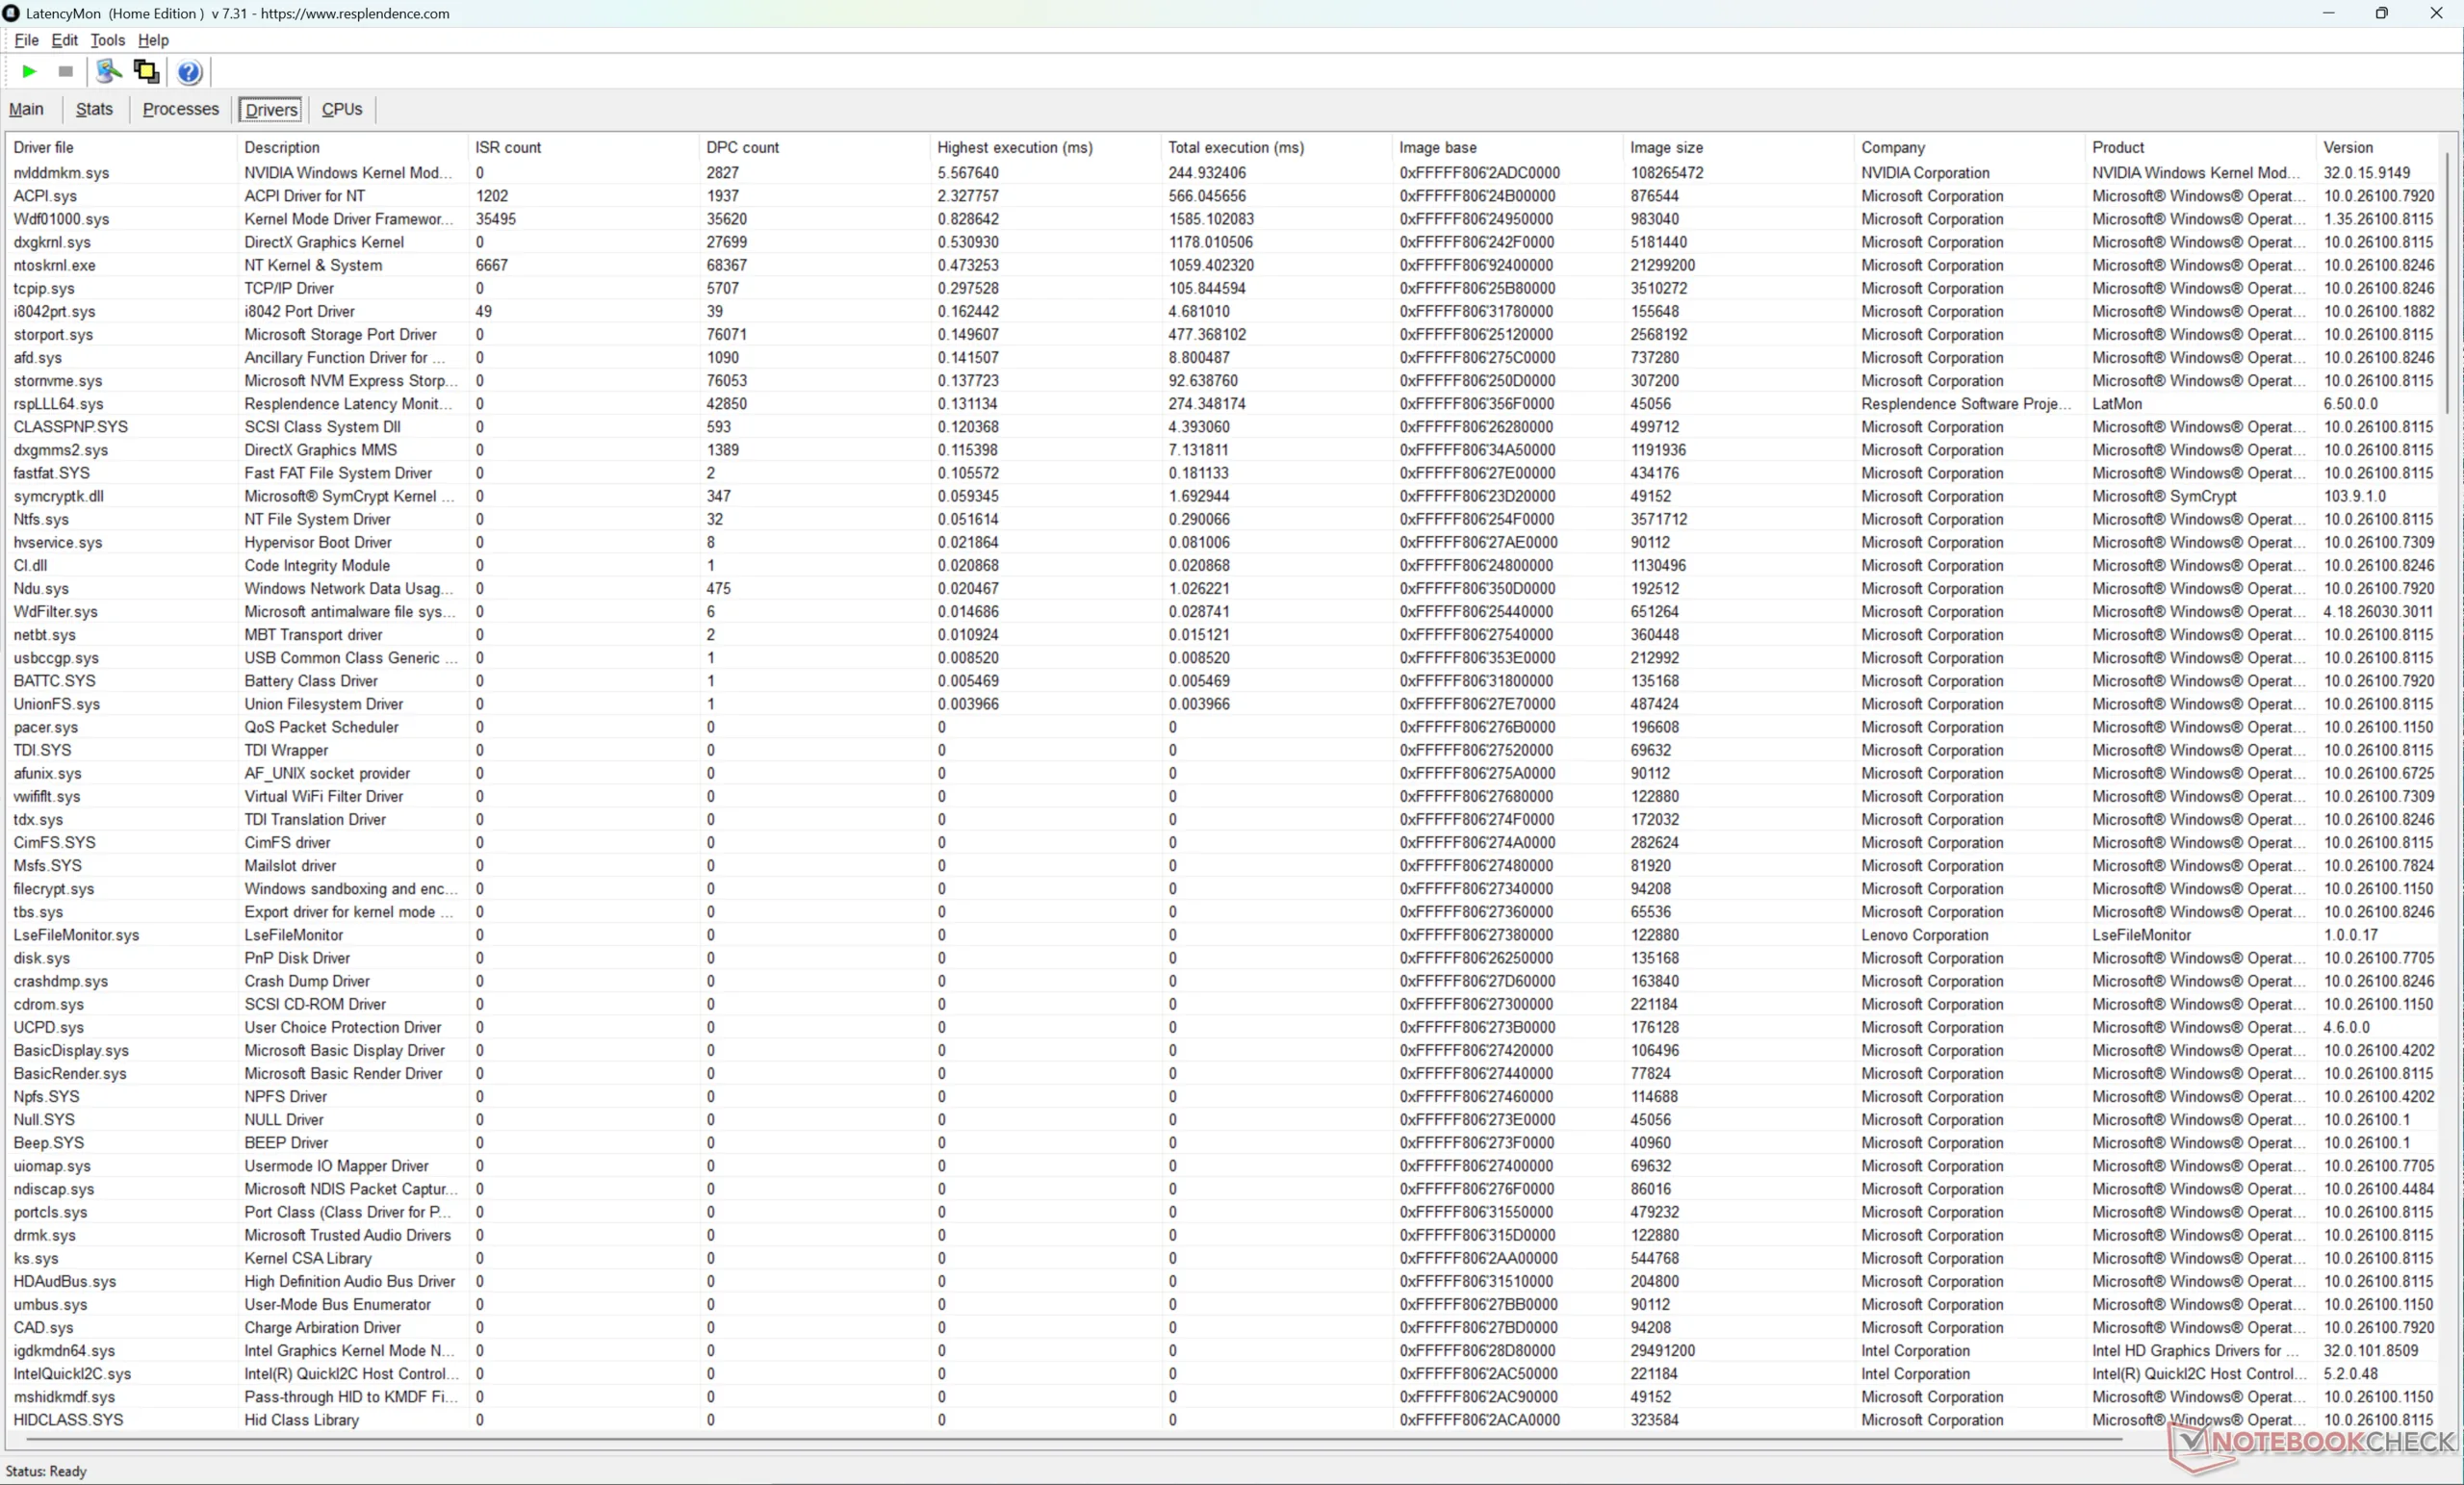
| DPC Latencies / LatencyMon - interrupt to process latency (max), Web, Youtube, Prime95 | |
| Lenovo Yoga Pro 9 16IAH10 RTX 5050 | |
| MSI Prestige 16 AI Evo B2HMG | |
| HP Omen Transcend 16-u1095ng | |
| Lenovo Pro 9 16IPH11 | |
| Asus ProArt P16 H7606WP | |
| Dell XPS 16 Core Ultra X7 358H | |
* ... más pequeño es mejor
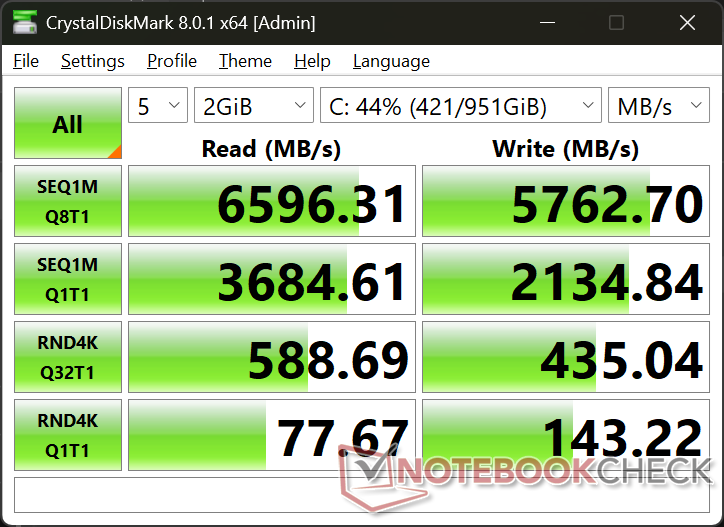
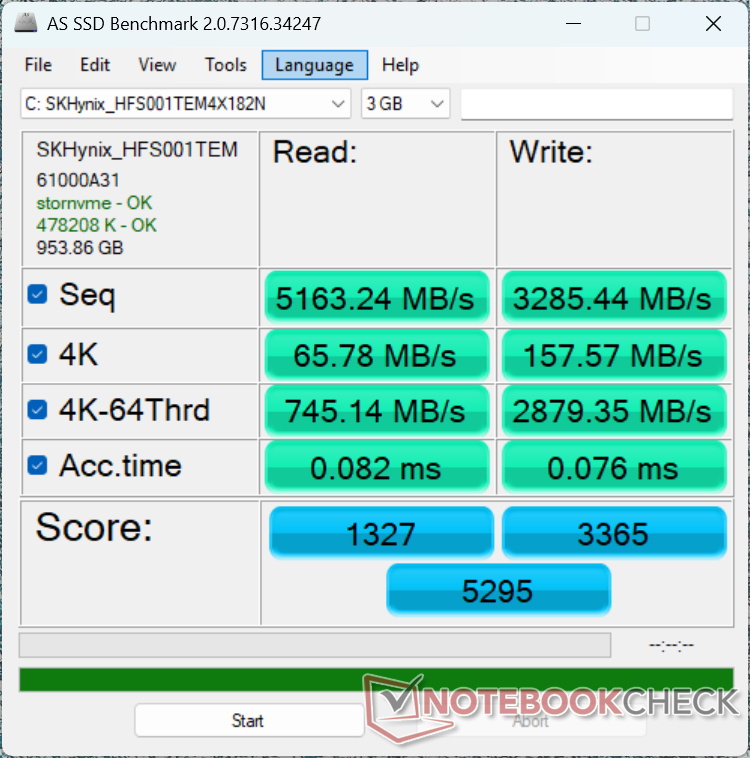
Dispositivos de almacenamiento
El sistema admite hasta dos SSD PCIe4 x4 NVMe sin problemas de estrangulamiento. Tenga en cuenta que las velocidades de las SSD PCIe5 no son compatibles y que una de las dos SSD M.2 debe ser de la variedad 2242 más corta.

| Drive Performance rating - Percent | |
| MSI Prestige 16 AI Evo B2HMG | |
| HP Omen Transcend 16-u1095ng | |
| Lenovo Yoga Pro 9 16IAH10 RTX 5050 | |
| Asus ProArt P16 H7606WP | |
| Lenovo Pro 9 16IPH11 | |
| Dell XPS 16 Core Ultra X7 358H | |
* ... más pequeño es mejor
Estrangulamiento de disco: Bucle de lectura DiskSpd, profundidad de cola 8
Rendimiento de la GPU
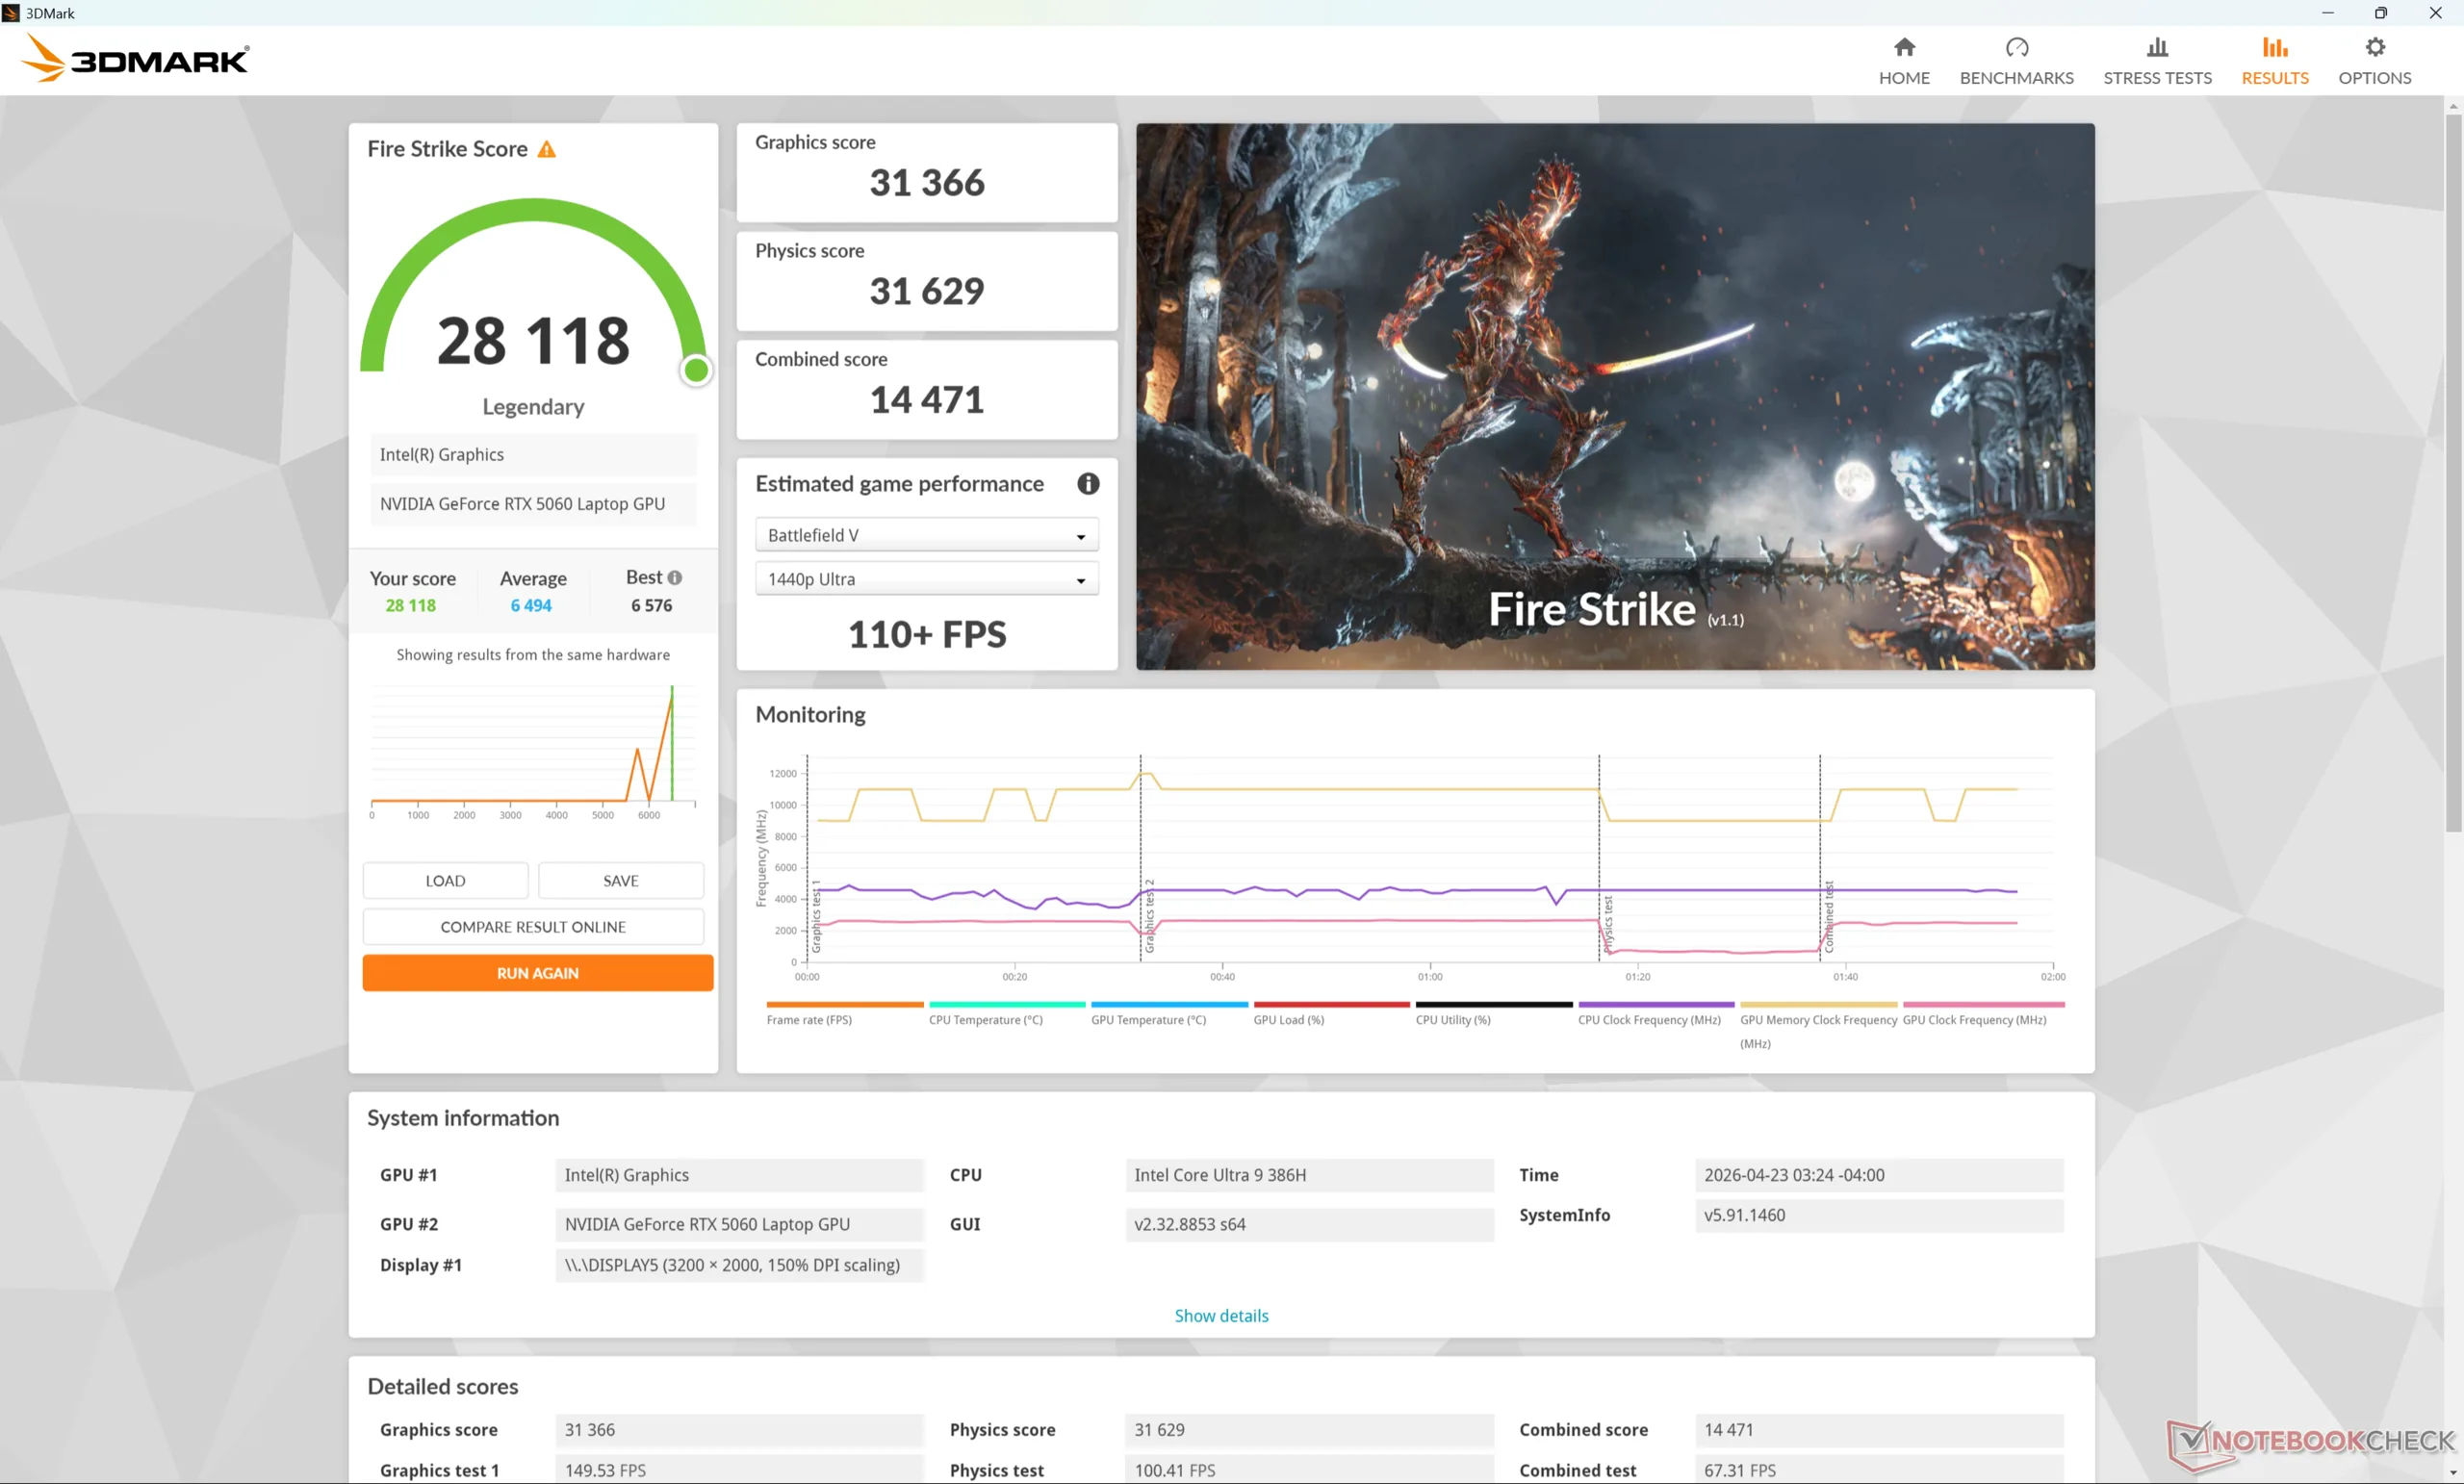
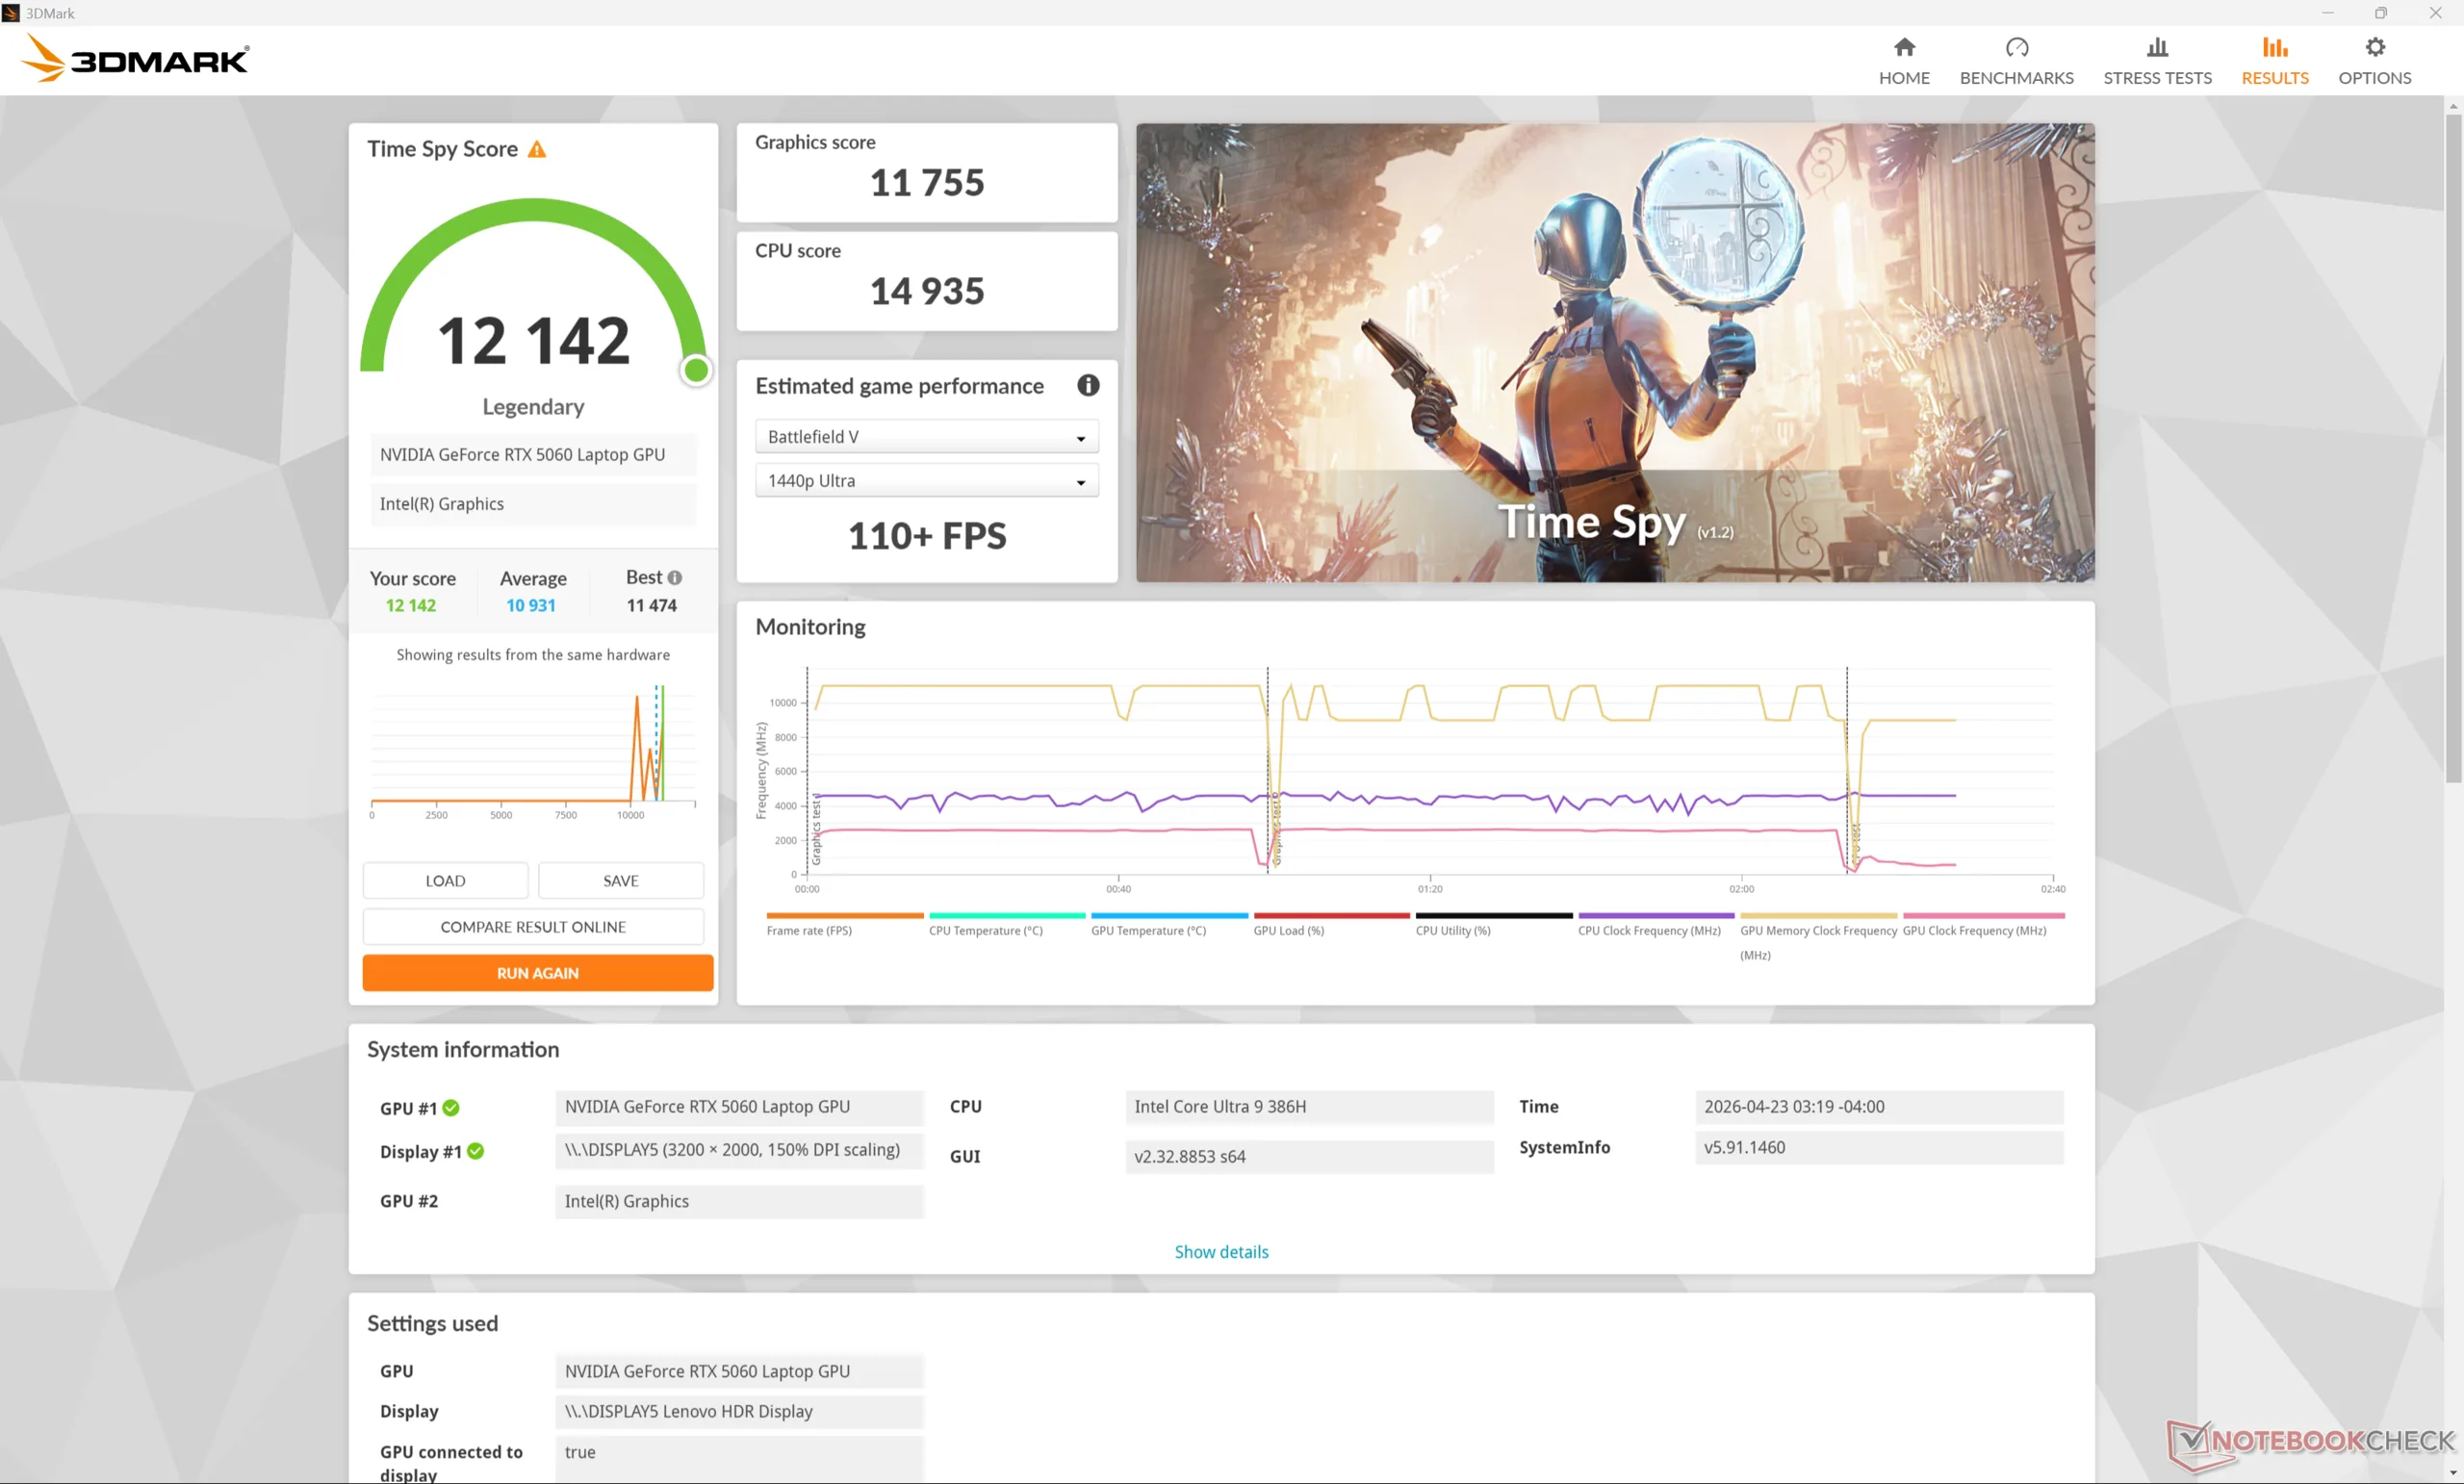
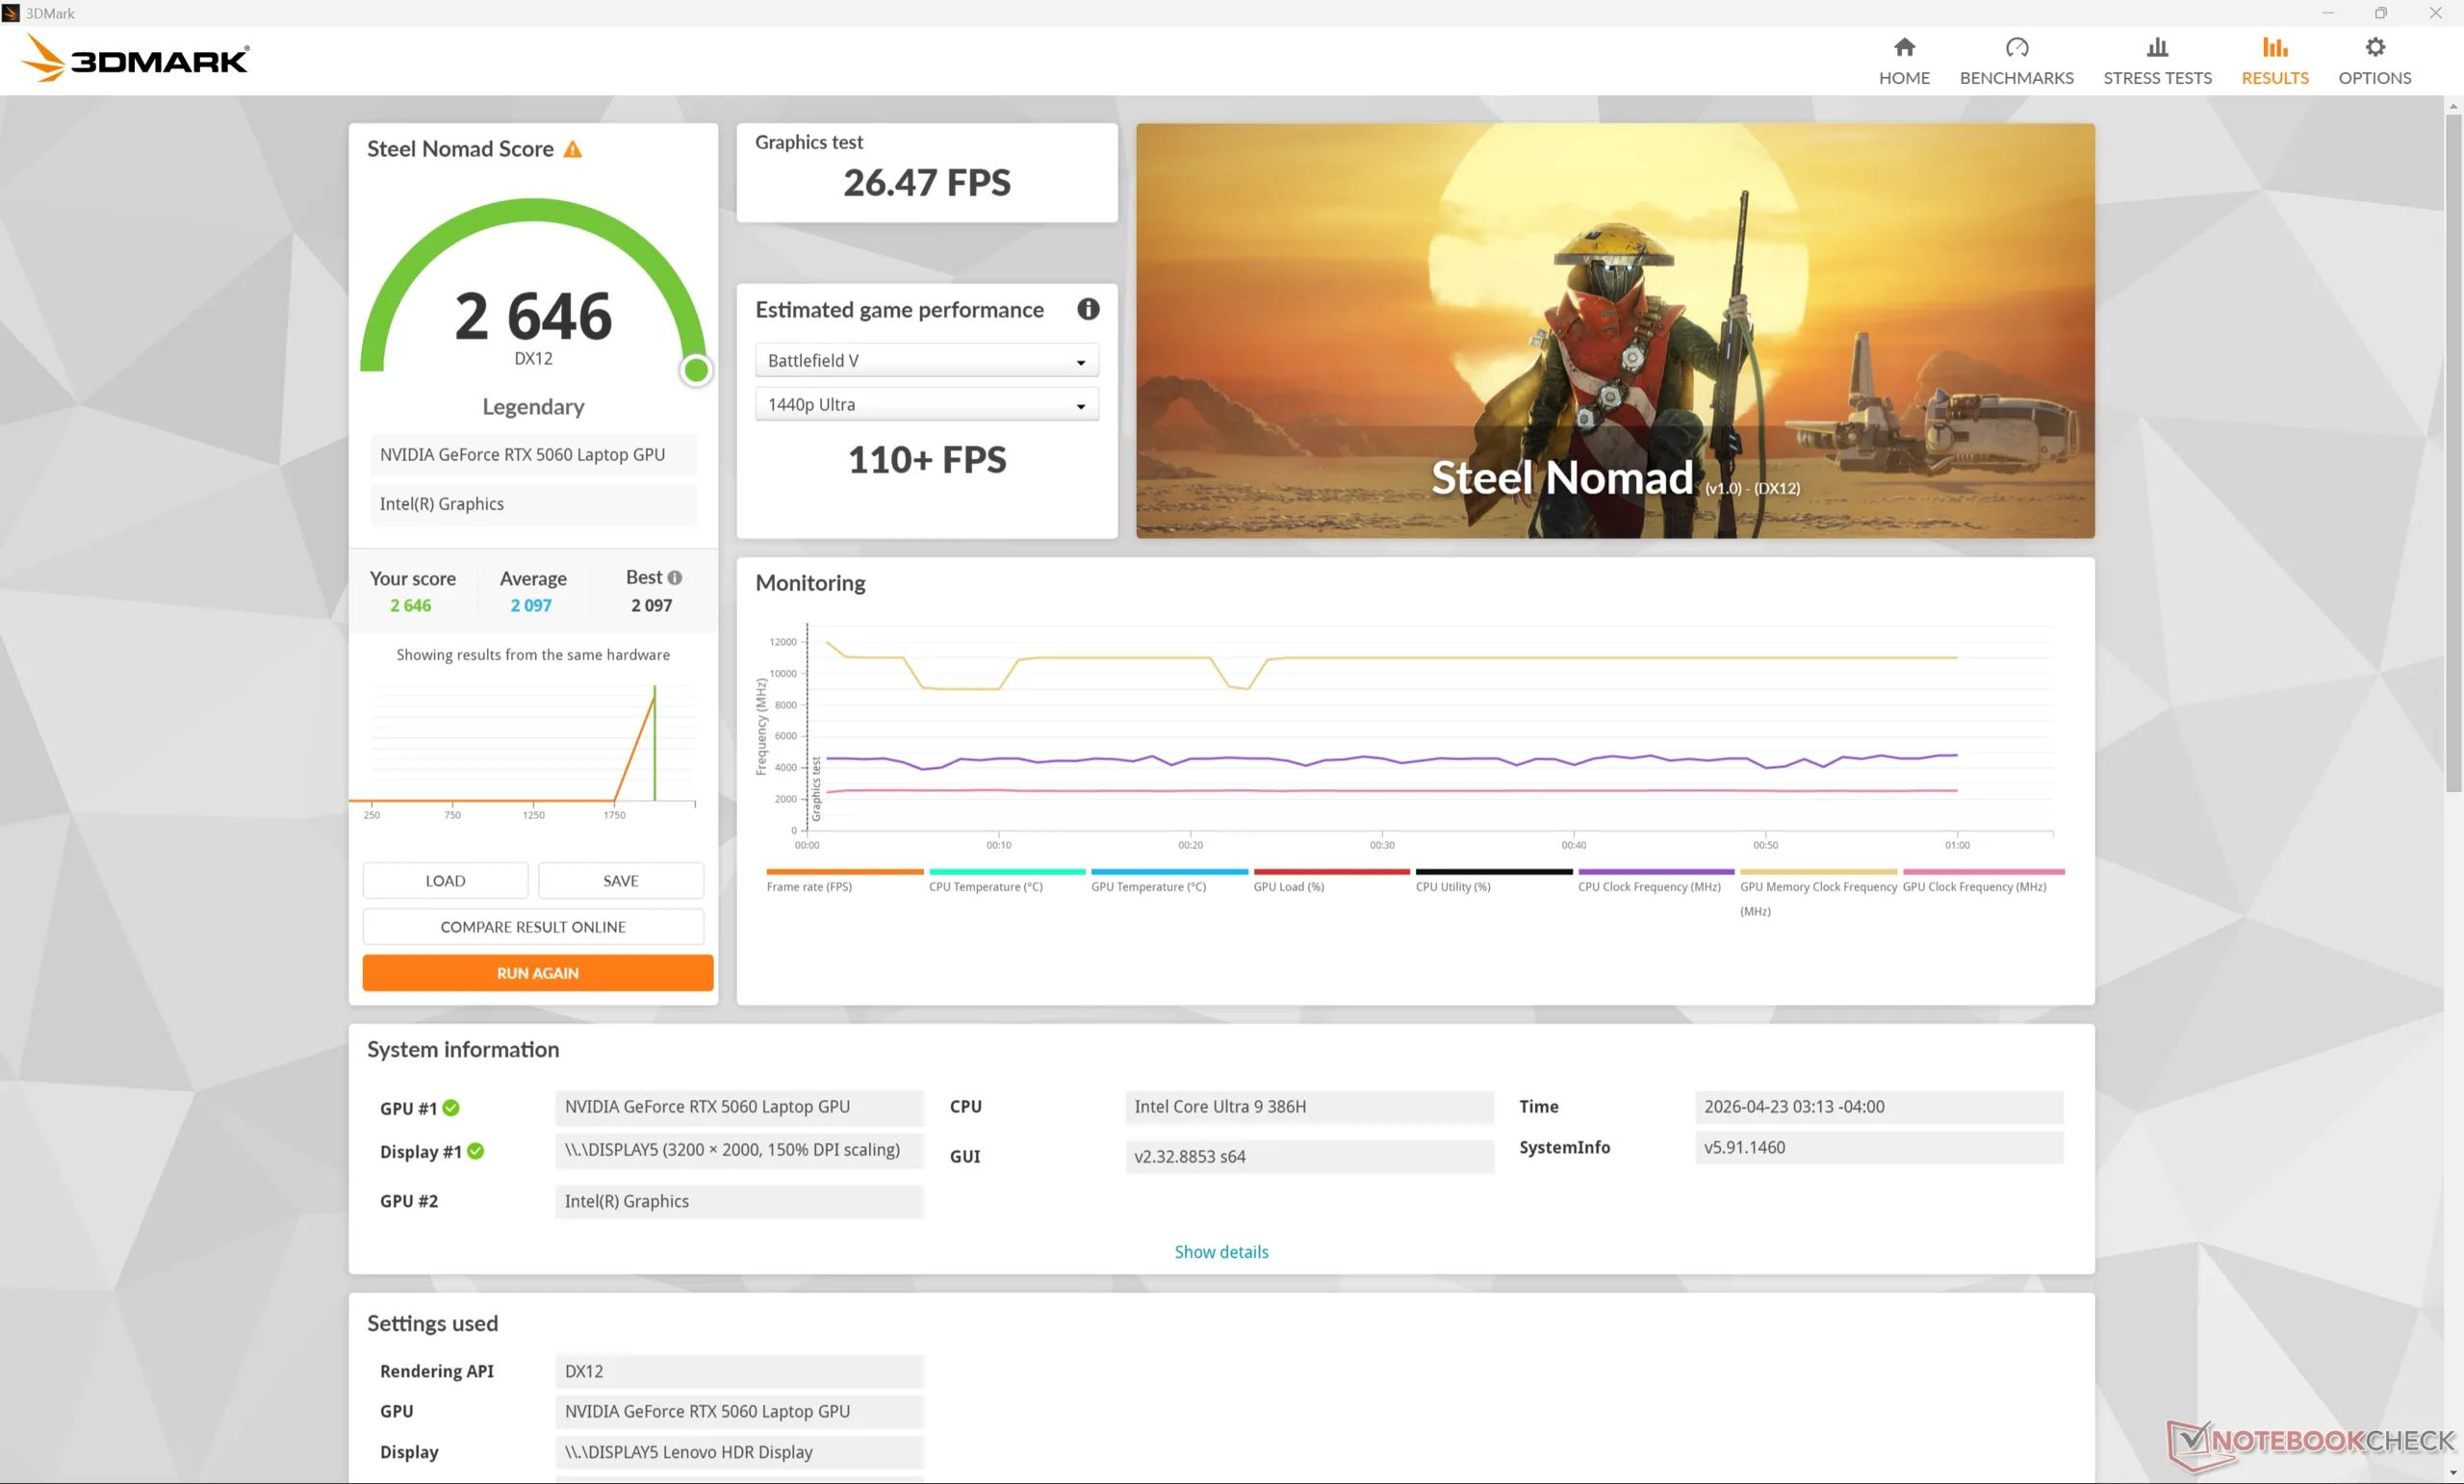
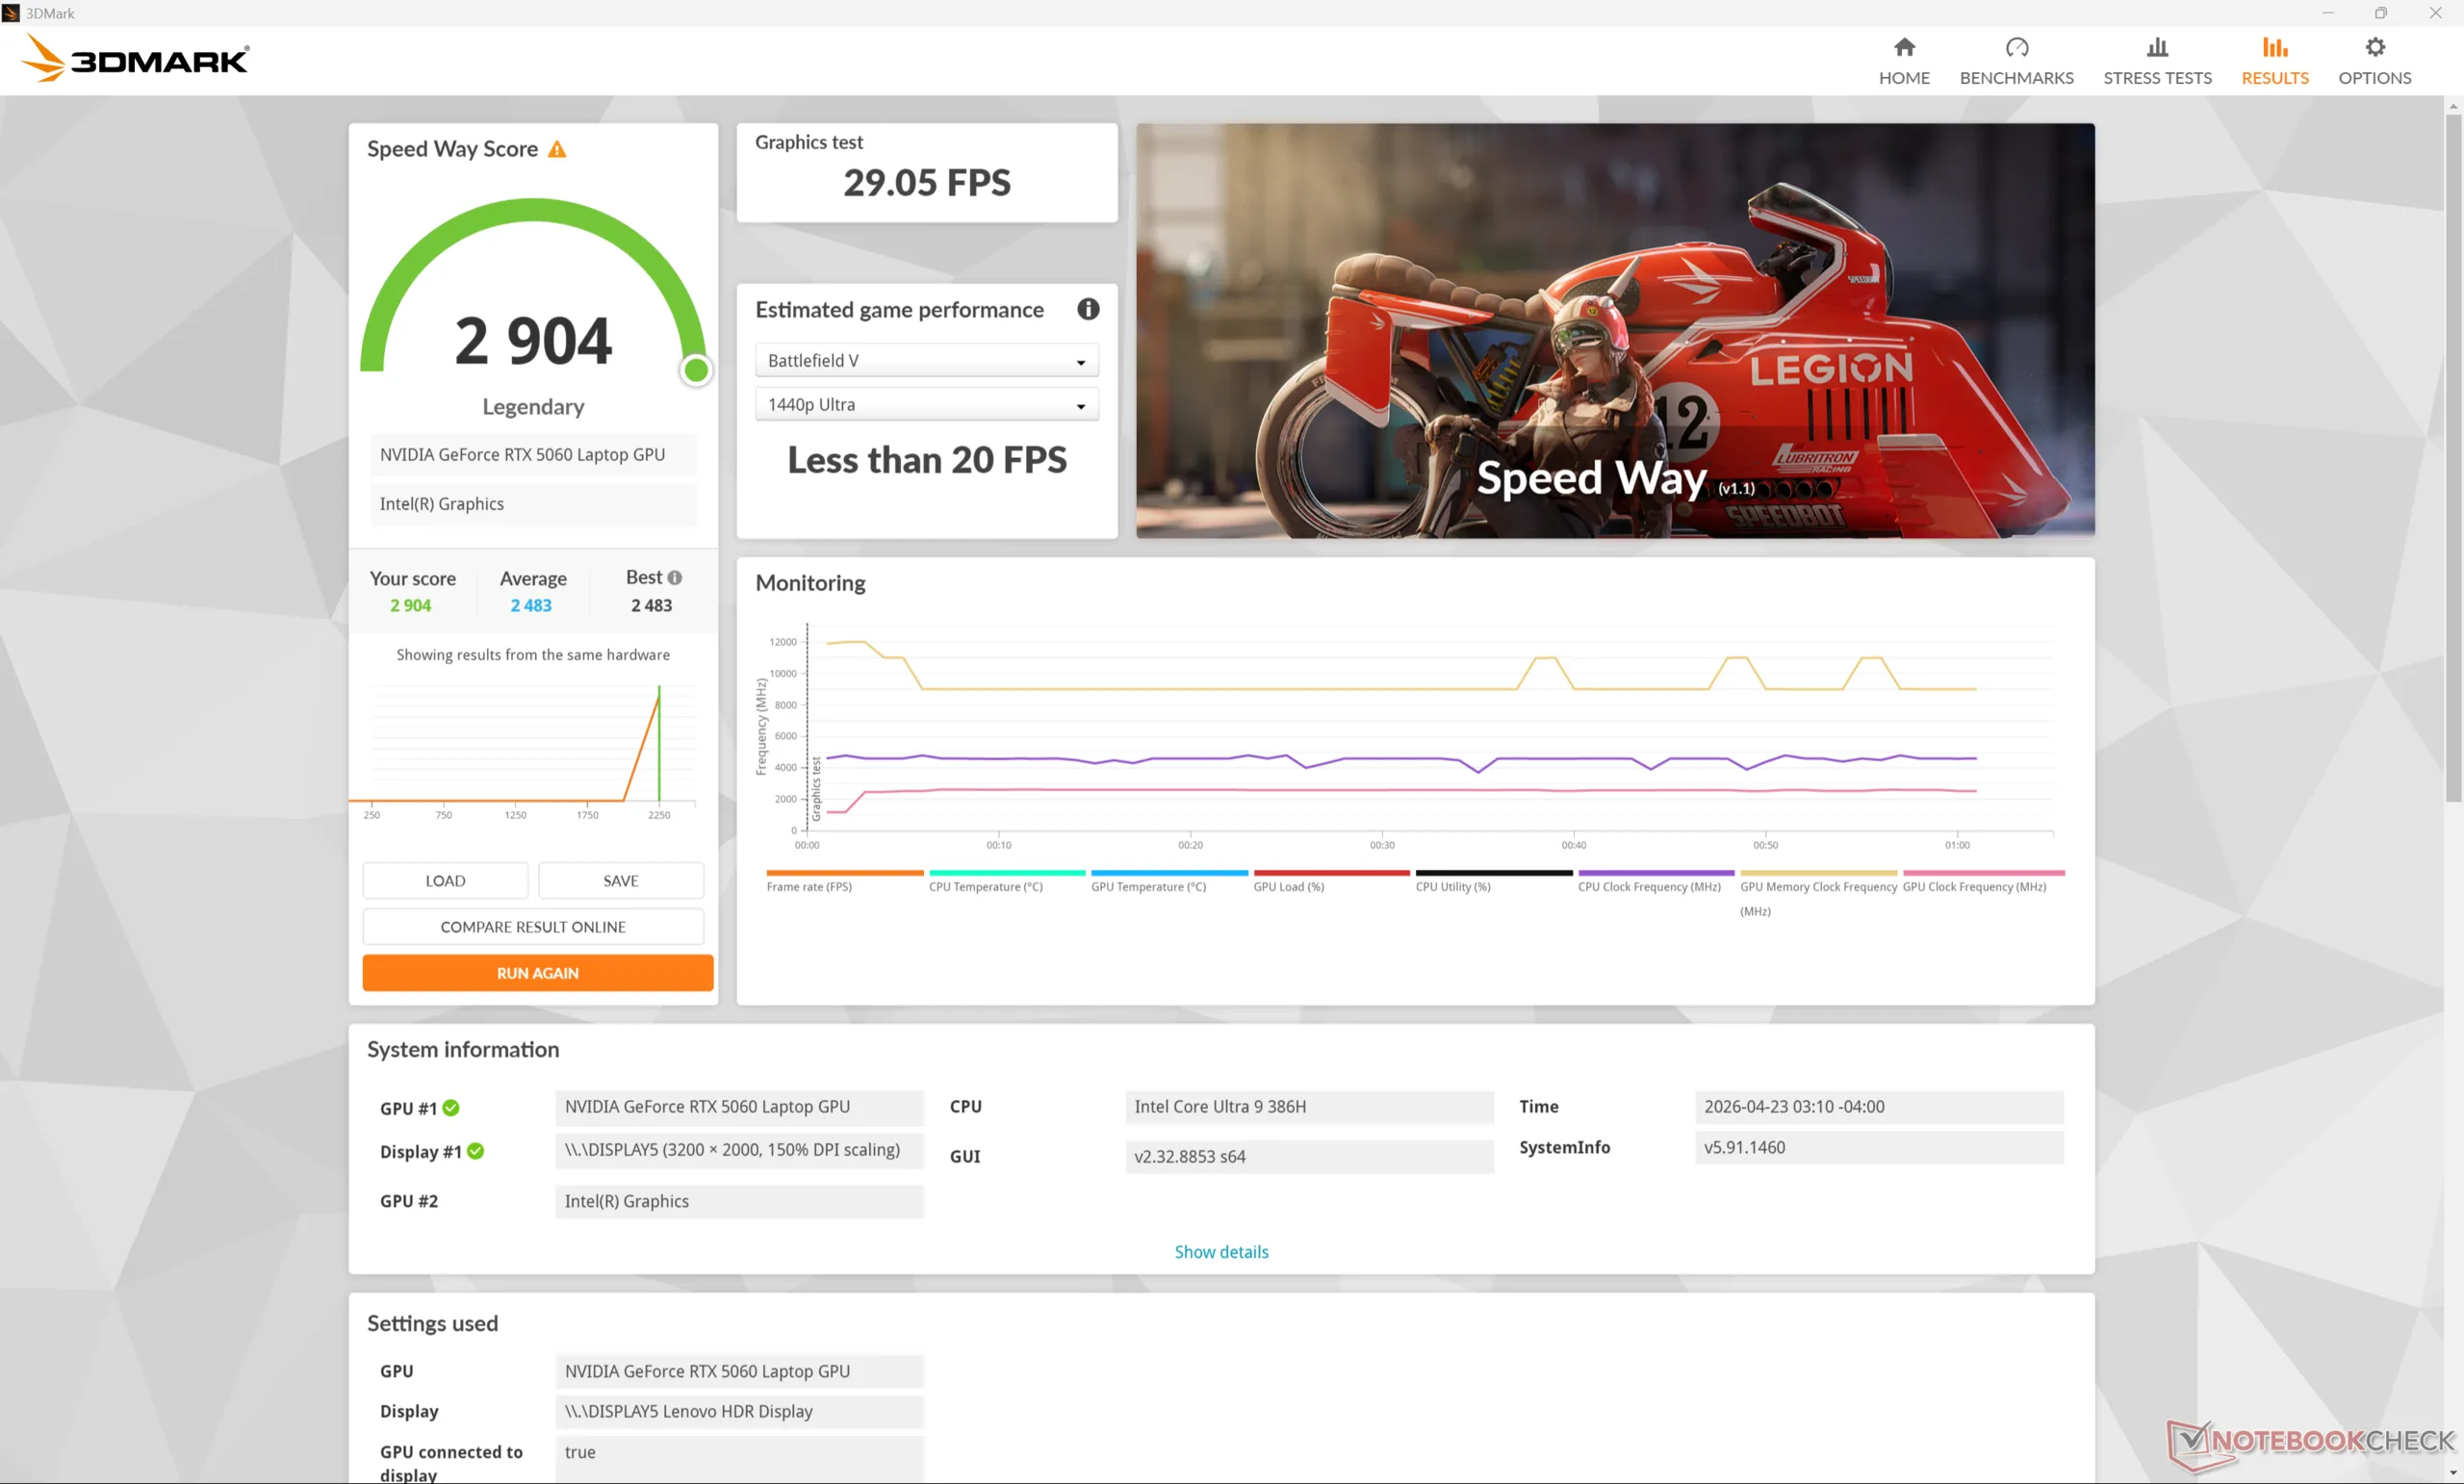
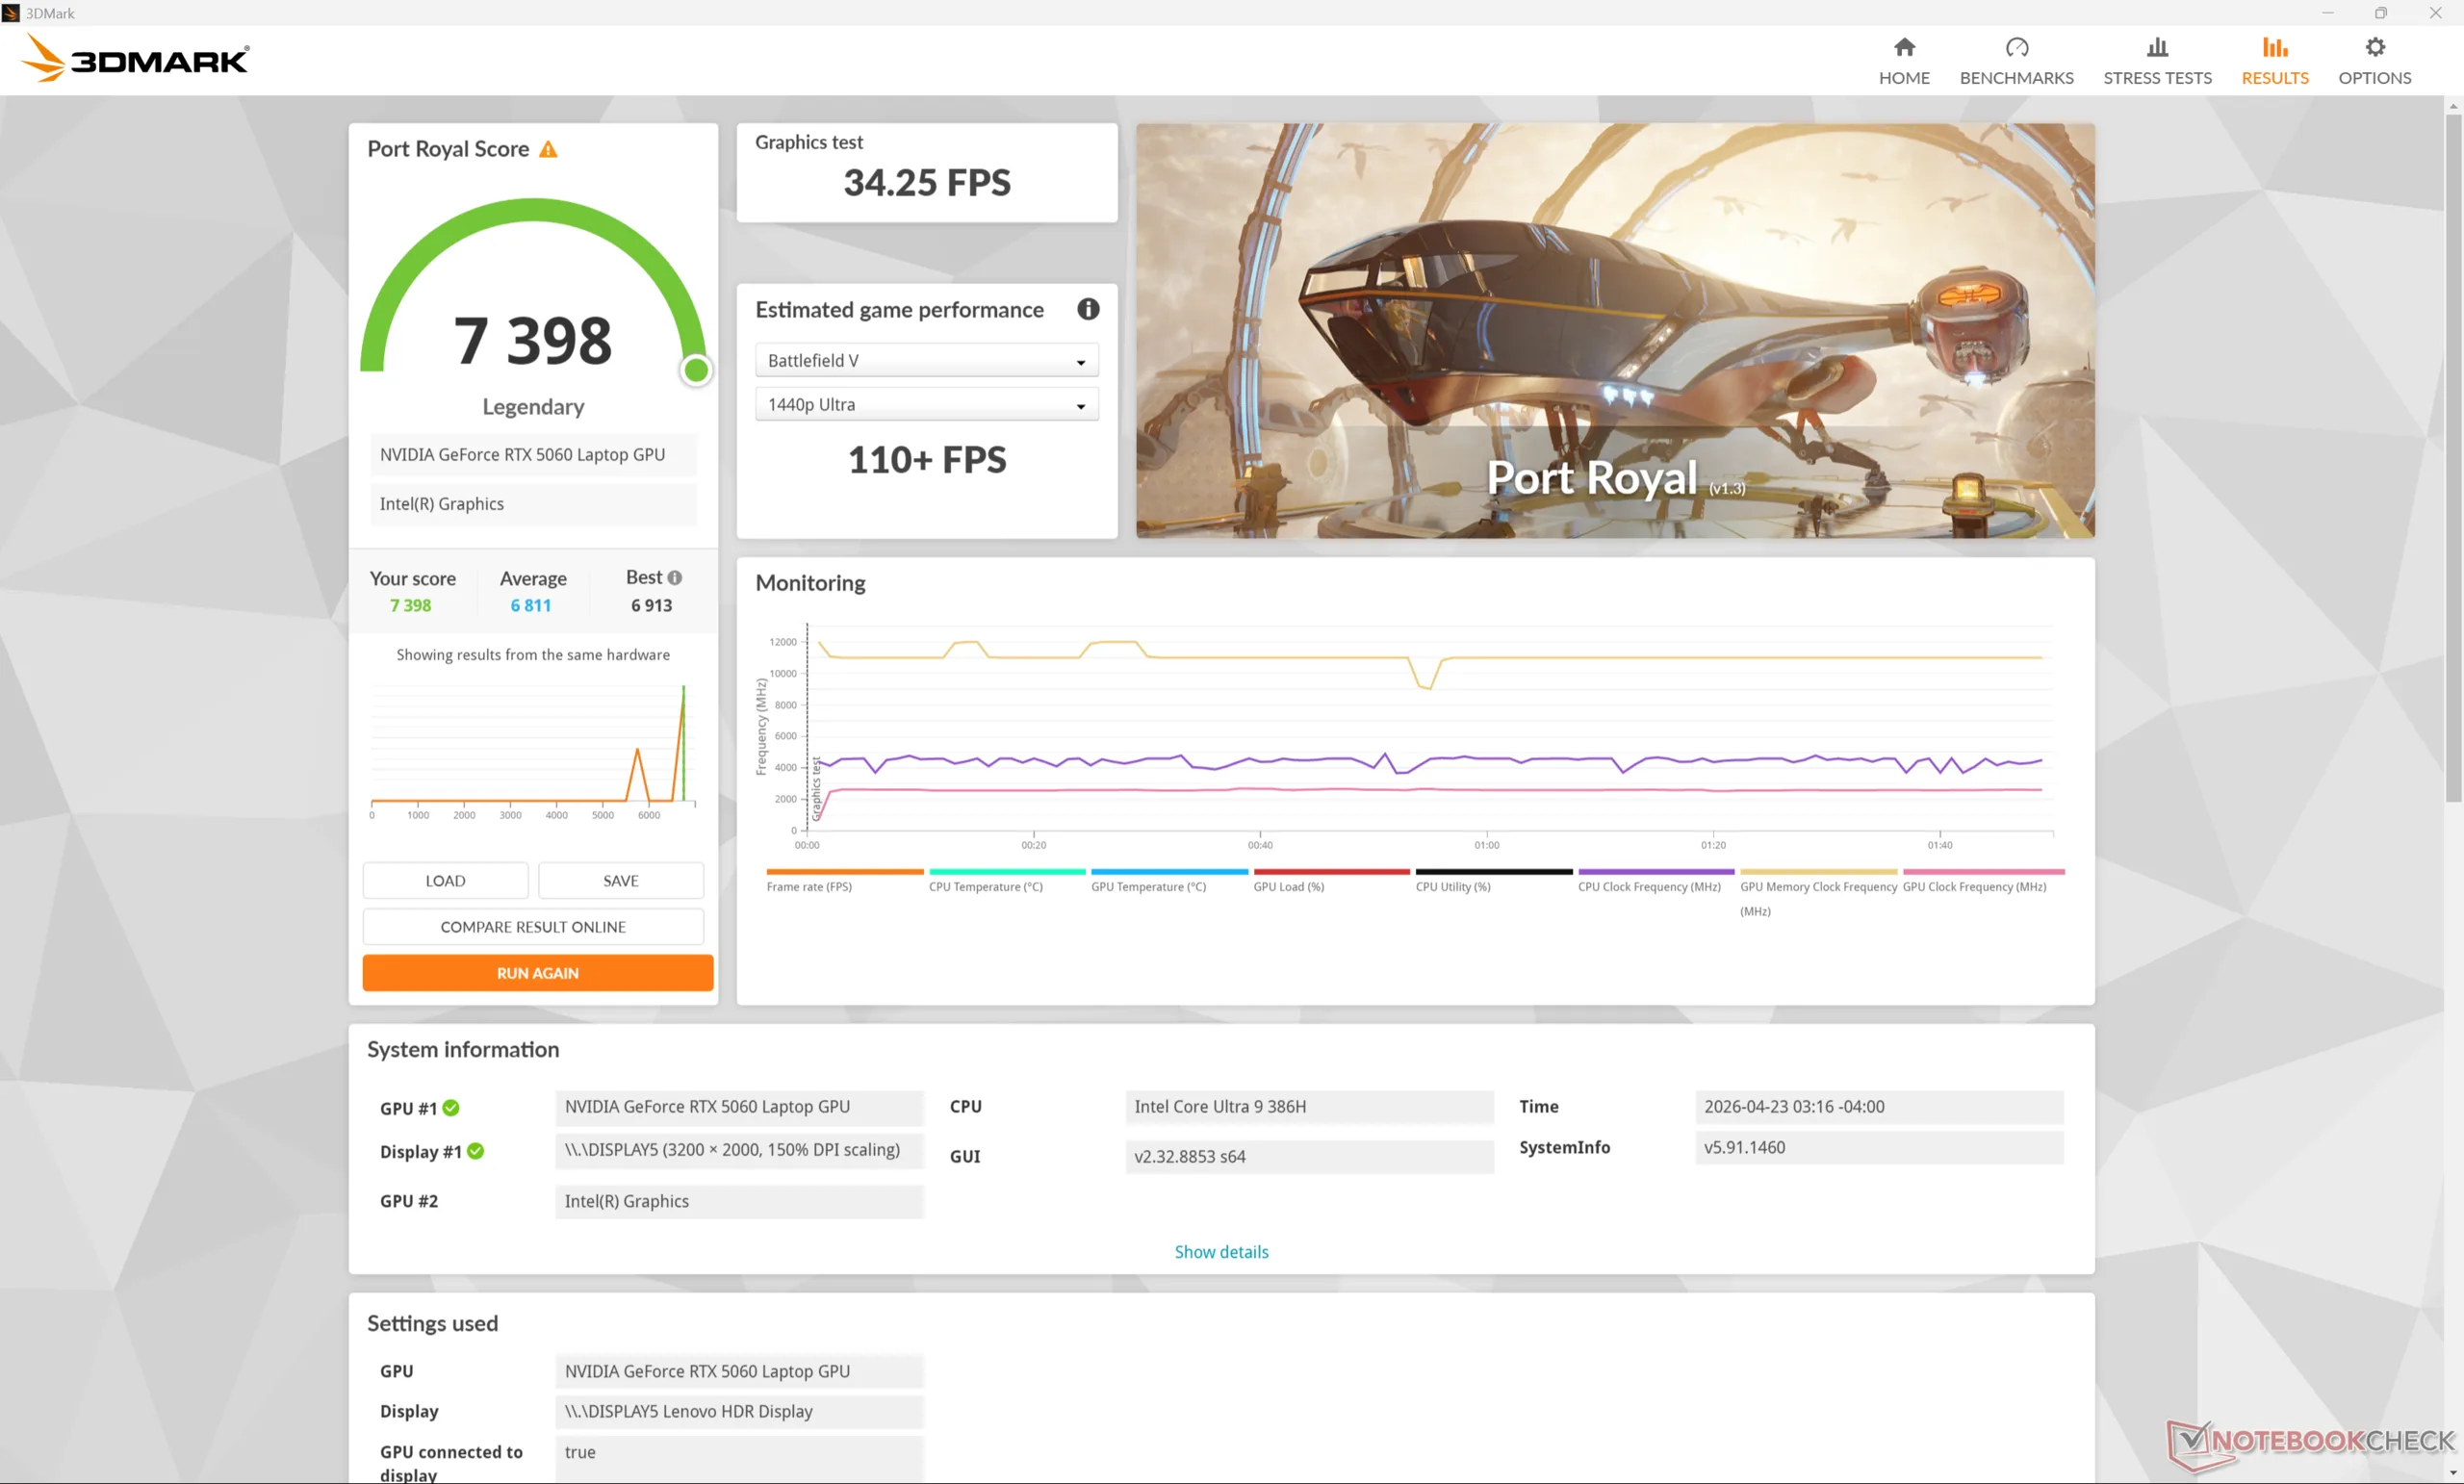
El portátil GeForce RTX 5060 está rindiendo donde esperamos que lo haga en relación con otros portátiles con la misma GPU. El rendimiento gráfico en bruto está ligeramente por detrás del optimizado para juegos Legion 7 16 AGP11 equipado con la misma RTX 5060 por apenas unos puntos porcentuales.
Ejecutar el sistema en modo Equilibrado en lugar de en modo Rendimiento afectaría al rendimiento gráfico hasta en un 10 por ciento, como muestra nuestra tabla de resultados Time Spy que aparece a continuación.
Bajar a la configuración RTX 5050 desde nuestra RTX 5060 reduciría el rendimiento gráfico hasta en un 20-25 por ciento.
| Perfil de potencia | Puntuación de gráficos | Puntuación física | Puntuación combinada |
| Modo Rendimiento | 11755 | 14935 | 12142 |
| Modo equilibrado | 10676 (-9%) | 15025 (-0%) | 11160 (-8%) |
| Batería | 9886 (-16%) | 12811 (-14%) | 10236 (-16%) |
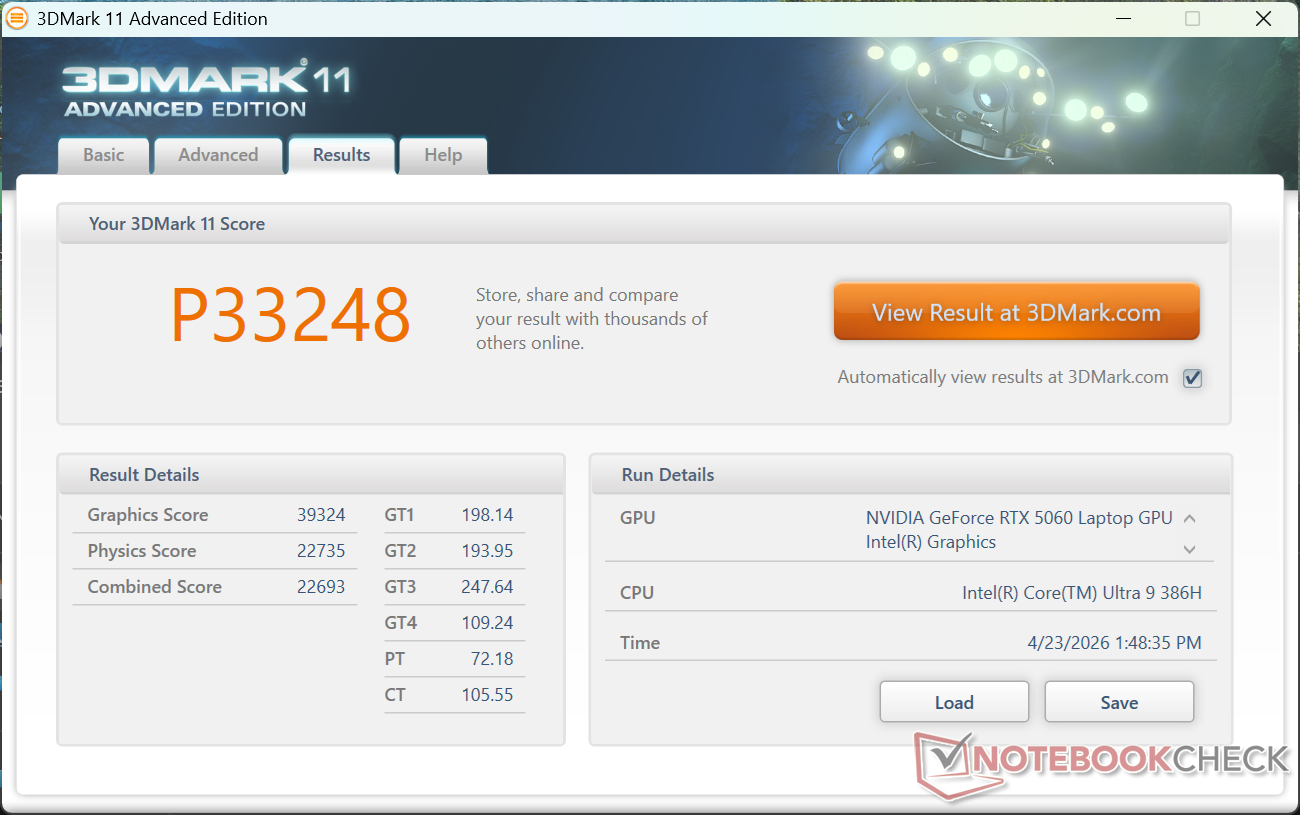
| 3DMark 11 Performance | 33248 puntos | |
| 3DMark Cloud Gate Standard Score | 61799 puntos | |
| 3DMark Fire Strike Score | 28118 puntos | |
| 3DMark Time Spy Score | 12142 puntos | |
| 3DMark Steel Nomad Score | 2646 puntos | |
ayuda | ||
* ... más pequeño es mejor
| Cyberpunk 2077 - 1920x1080 Ultra Preset (FSR off) | |
| Asus ProArt P16 H7606WP | |
| Lenovo Pro 9 16IPH11 | |
| Lenovo Yoga Pro 9 16IAH10 RTX 5050 | |
| Dell XPS 16 Core Ultra X7 358H | |
| MSI Prestige 16 AI Evo B2HMG | |
| Baldur's Gate 3 - 1920x1080 Ultra Preset AA:T | |
| Asus ProArt P16 H7606WP | |
| Lenovo Pro 9 16IPH11 | |
| Lenovo Yoga Pro 9 16IAH10 RTX 5050 | |
| Dell XPS 16 Core Ultra X7 358H | |
| MSI Prestige 16 AI Evo B2HMG | |
| GTA V - 1920x1080 Highest AA:4xMSAA + FX AF:16x | |
| Lenovo Pro 9 16IPH11 | |
| Lenovo Yoga Pro 9 16IAH10 RTX 5050 | |
| Asus ProArt P16 H7606WP | |
| HP Omen Transcend 16-u1095ng | |
| Dell XPS 16 Core Ultra X7 358H | |
| MSI Prestige 16 AI Evo B2HMG | |
| Final Fantasy XV Benchmark - 1920x1080 High Quality | |
| Asus ProArt P16 H7606WP | |
| Lenovo Pro 9 16IPH11 | |
| Lenovo Yoga Pro 9 16IAH10 RTX 5050 | |
| HP Omen Transcend 16-u1095ng | |
| Dell XPS 16 Core Ultra X7 358H | |
| MSI Prestige 16 AI Evo B2HMG | |
| Strange Brigade - 1920x1080 ultra AA:ultra AF:16 | |
| Asus ProArt P16 H7606WP | |
| Lenovo Pro 9 16IPH11 | |
| HP Omen Transcend 16-u1095ng | |
| Lenovo Yoga Pro 9 16IAH10 RTX 5050 | |
| Dell XPS 16 Core Ultra X7 358H | |
| MSI Prestige 16 AI Evo B2HMG | |
| Dota 2 Reborn - 1920x1080 ultra (3/3) best looking | |
| HP Omen Transcend 16-u1095ng | |
| Lenovo Yoga Pro 9 16IAH10 RTX 5050 | |
| Lenovo Pro 9 16IPH11 | |
| Asus ProArt P16 H7606WP | |
| Dell XPS 16 Core Ultra X7 358H | |
| MSI Prestige 16 AI Evo B2HMG | |
| X-Plane 11.11 - 1920x1080 high (fps_test=3) | |
| HP Omen Transcend 16-u1095ng | |
| Lenovo Yoga Pro 9 16IAH10 RTX 5050 | |
| Asus ProArt P16 H7606WP | |
| Dell XPS 16 Core Ultra X7 358H | |
| MSI Prestige 16 AI Evo B2HMG | |
| Black Myth: Wukong | |
| 1920x1080 high TSR 100 | |
| Medio NVIDIA GeForce RTX 5060 Laptop (50 - 58, n=2) | |
| Lenovo Pro 9 16IPH11 | |
| Dell XPS 16 Core Ultra X7 358H | |
| 1920x1080 cinematic TSR 100 | |
| Medio NVIDIA GeForce RTX 5060 Laptop (28 - 32, n=3) | |
| Lenovo Pro 9 16IPH11 | |
| Dell XPS 16 Core Ultra X7 358H | |
| 2560x1440 cinematic TSR 100 | |
| Medio NVIDIA GeForce RTX 5060 Laptop (21 - 23, n=3) | |
| Lenovo Pro 9 16IPH11 | |
| 2560x1440 cinematic DLSS 68 | |
| Medio NVIDIA GeForce RTX 5060 Laptop (32 - 36, n=2) | |
| Lenovo Pro 9 16IPH11 | |
| 2560x1440 cinematic RT: Very High DLSS 68 FG | |
| Lenovo Pro 9 16IPH11 | |
| Medio NVIDIA GeForce RTX 5060 Laptop (31 - 37, n=2) | |
| F1 24 | |
| 1920x1080 Ultra High Preset AA:T AF:16x | |
| Asus ProArt P16 H7606WP | |
| Lenovo Legion 7 16 AGP11 | |
| Medio NVIDIA GeForce RTX 5060 Laptop (68.2 - 77.5, n=8) | |
| Lenovo Pro 9 16IPH11 | |
| Lenovo Yoga Pro 9 16IAH10 RTX 5050 | |
| Dell XPS 16 Core Ultra X7 358H | |
| MSI Venture 16 AI A2HMTG | |
| 2560x1440 Ultra High Preset AA:T AF:16x | |
| Asus ProArt P16 H7606WP | |
| Lenovo Legion 7 16 AGP11 | |
| Medio NVIDIA GeForce RTX 5060 Laptop (39 - 49.1, n=8) | |
| Lenovo Pro 9 16IPH11 | |
| Lenovo Yoga Pro 9 16IAH10 RTX 5050 | |
| 2560x1440 Ultra High Preset + Quality DLSS AF:16x | |
| Lenovo Legion 7 16 AGP11 | |
| Lenovo Pro 9 16IPH11 | |
| Medio NVIDIA GeForce RTX 5060 Laptop (65 - 74.5, n=7) | |
| Lenovo Yoga Pro 9 16IAH10 RTX 5050 | |
| Monster Hunter Wilds | |
| 1920x1080 high, no upscaling | |
| Lenovo Pro 9 16IPH11 | |
| Medio NVIDIA GeForce RTX 5060 Laptop (49.7 - 58.8, n=2) | |
| 1920x1080 ultra, RT: high, no upscaling | |
| Lenovo Pro 9 16IPH11 | |
| Medio NVIDIA GeForce RTX 5060 Laptop (16.6 - 36.5, n=3) | |
| 2560x1440 ultra, RT: high, no upscaling | |
| Lenovo Pro 9 16IPH11 | |
| Medio NVIDIA GeForce RTX 5060 Laptop (13.9 - 20.9, n=2) | |
Cyberpunk 2077 ultra FPS Gráfico
| bajo | medio | alto | ultra | QHD DLSS | QHD | |
|---|---|---|---|---|---|---|
| GTA V (2015) | 185.8 | 183.5 | 179.4 | 133.6 | 110.7 | |
| Dota 2 Reborn (2015) | 172.5 | 156.7 | 151.6 | 142.4 | ||
| Final Fantasy XV Benchmark (2018) | 187.9 | 170.4 | 124.1 | 92.3 | ||
| X-Plane 11.11 (2018) | 113 | 102.9 | ||||
| Strange Brigade (2018) | 482 | 314 | 214 | 217 | 125.5 | |
| Baldur's Gate 3 (2023) | 164.6 | 137.8 | 119.9 | 117.8 | 117.5 | 79.4 |
| Cyberpunk 2077 (2023) | 132.3 | 108.2 | 92.3 | 83.3 | 63.2 | 53.4 |
| F1 24 (2024) | 249 | 249 | 207 | 69.5 | 69.3 | 42.8 |
| Black Myth: Wukong (2024) | 85 | 64 | 50 | 28 | 32 | 21 |
| Monster Hunter Wilds (2025) | 74.2 | 63 | 58.8 | 34.8 | 20.9 |
Emisiones
Ruido del sistema
El techo de ruido del ventilador y su comportamiento se asemejan mucho al del Yoga Pro 9 16IAH10 del año pasado, ya que no hay grandes cambios en la placa base. Quizá lo más importante es que el ruido del ventilador al ejecutar Cyberpunk 2077 rondaría los 41 dB(A) si está en modo Equilibrado o los 50 dB(A) si está en modo Rendimiento. La mencionada caída del 10 por ciento en el rendimiento gráfico cuando se juega en modo Equilibrado puede ser un compromiso razonable para los ventiladores mucho más silenciosos.
Ruido
| Ocioso |
| 23.5 / 24 / 24 dB(A) |
| Carga |
| 32.3 / 50.1 dB(A) |
 | ||
30 dB silencioso 40 dB(A) audible 50 dB(A) ruidosamente alto |
||
min: | ||
| Lenovo Pro 9 16IPH11 Ultra 9 386H, GeForce RTX 5060 Laptop | Lenovo Yoga Pro 9 16IAH10 RTX 5050 Ultra 9 285H, GeForce RTX 5050 Laptop | Dell XPS 16 Core Ultra X7 358H Ultra X7 358H, Arc B390 Panther Lake iGPU | MSI Prestige 16 AI Evo B2HMG Ultra 9 285H, Arc 140T | HP Omen Transcend 16-u1095ng i9-14900HX, GeForce RTX 4070 Laptop GPU | Asus ProArt P16 H7606WP Ryzen AI 9 HX 370, GeForce RTX 5070 Laptop | |
|---|---|---|---|---|---|---|
| Noise | -5% | 0% | 1% | -19% | -16% | |
| apagado / medio ambiente * (dB) | 23 | 24.6 -7% | 23.3 -1% | 23.6 -3% | 24 -4% | 23.5 -2% |
| Idle Minimum * (dB) | 23.5 | 24.6 -5% | 23.4 -0% | 23.6 -0% | 29 -23% | 26.7 -14% |
| Idle Average * (dB) | 24 | 24.6 -3% | 23.4 2% | 23.6 2% | 30 -25% | 26.7 -11% |
| Idle Maximum * (dB) | 24 | 26.8 -12% | 25.8 -8% | 26.2 -9% | 31 -29% | 31.1 -30% |
| Load Average * (dB) | 32.3 | 32.8 -2% | 38 -18% | 37.1 -15% | 45 -39% | 44.8 -39% |
| Cyberpunk 2077 ultra * (dB) | 50.1 | 51.8 -3% | 38.1 24% | 42.1 16% | 53.7 -7% | |
| Load Maximum * (dB) | 50.1 | 51.8 -3% | 48.6 3% | 42.1 16% | 47 6% | 53.7 -7% |
| Witcher 3 ultra * (dB) | 44 |
* ... más pequeño es mejor
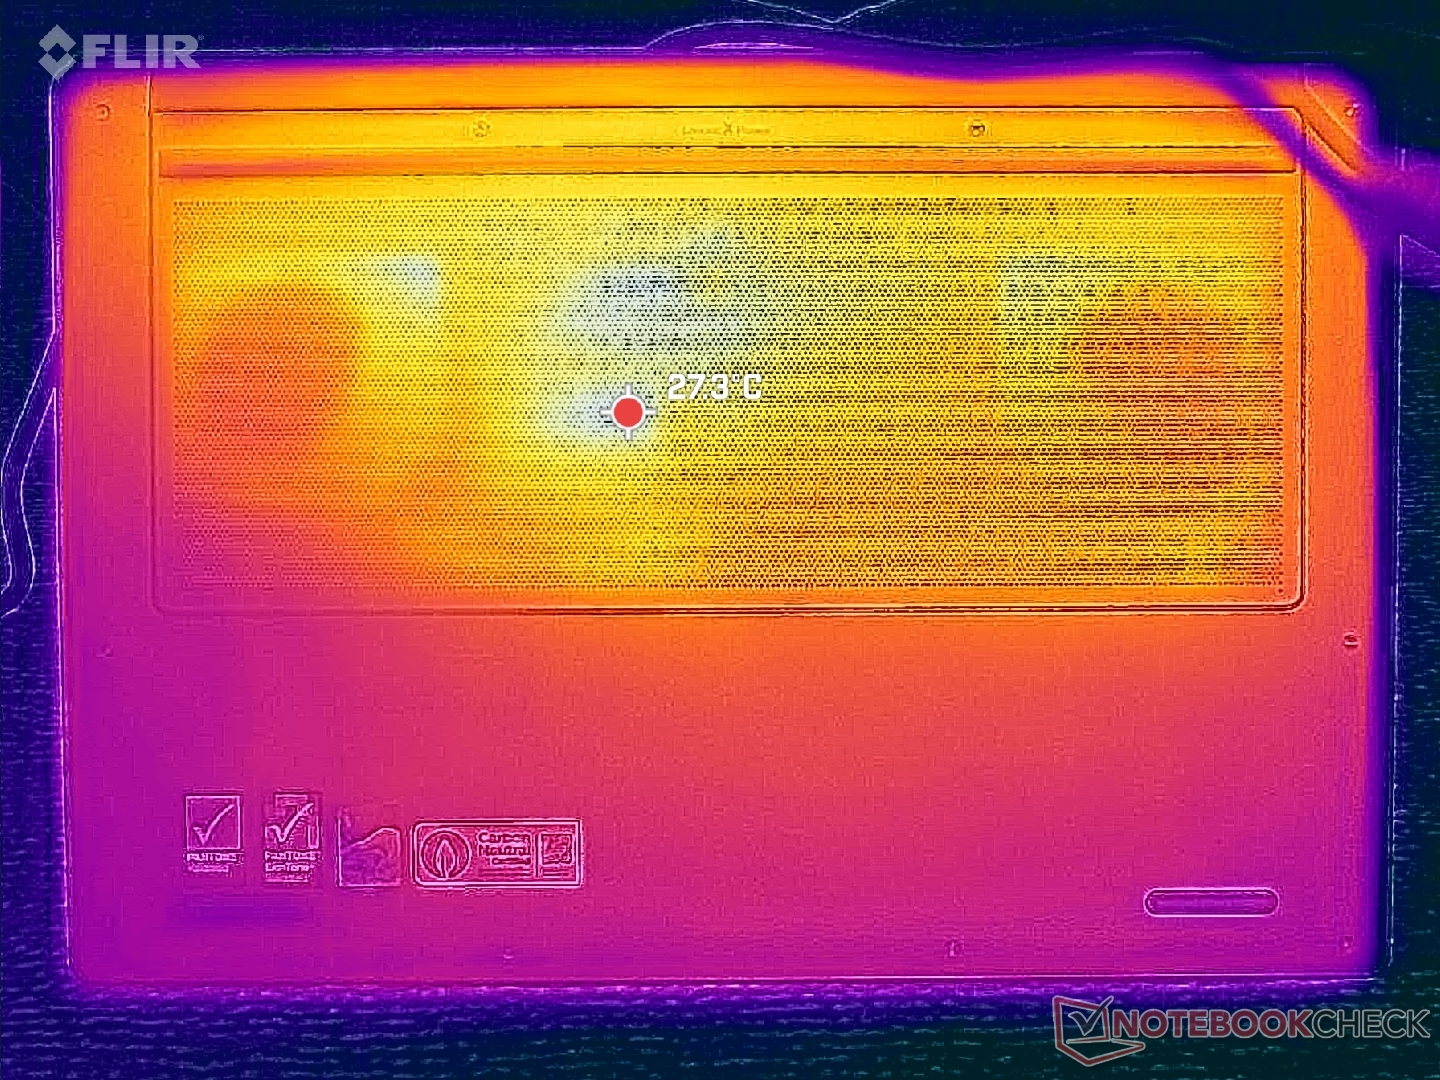
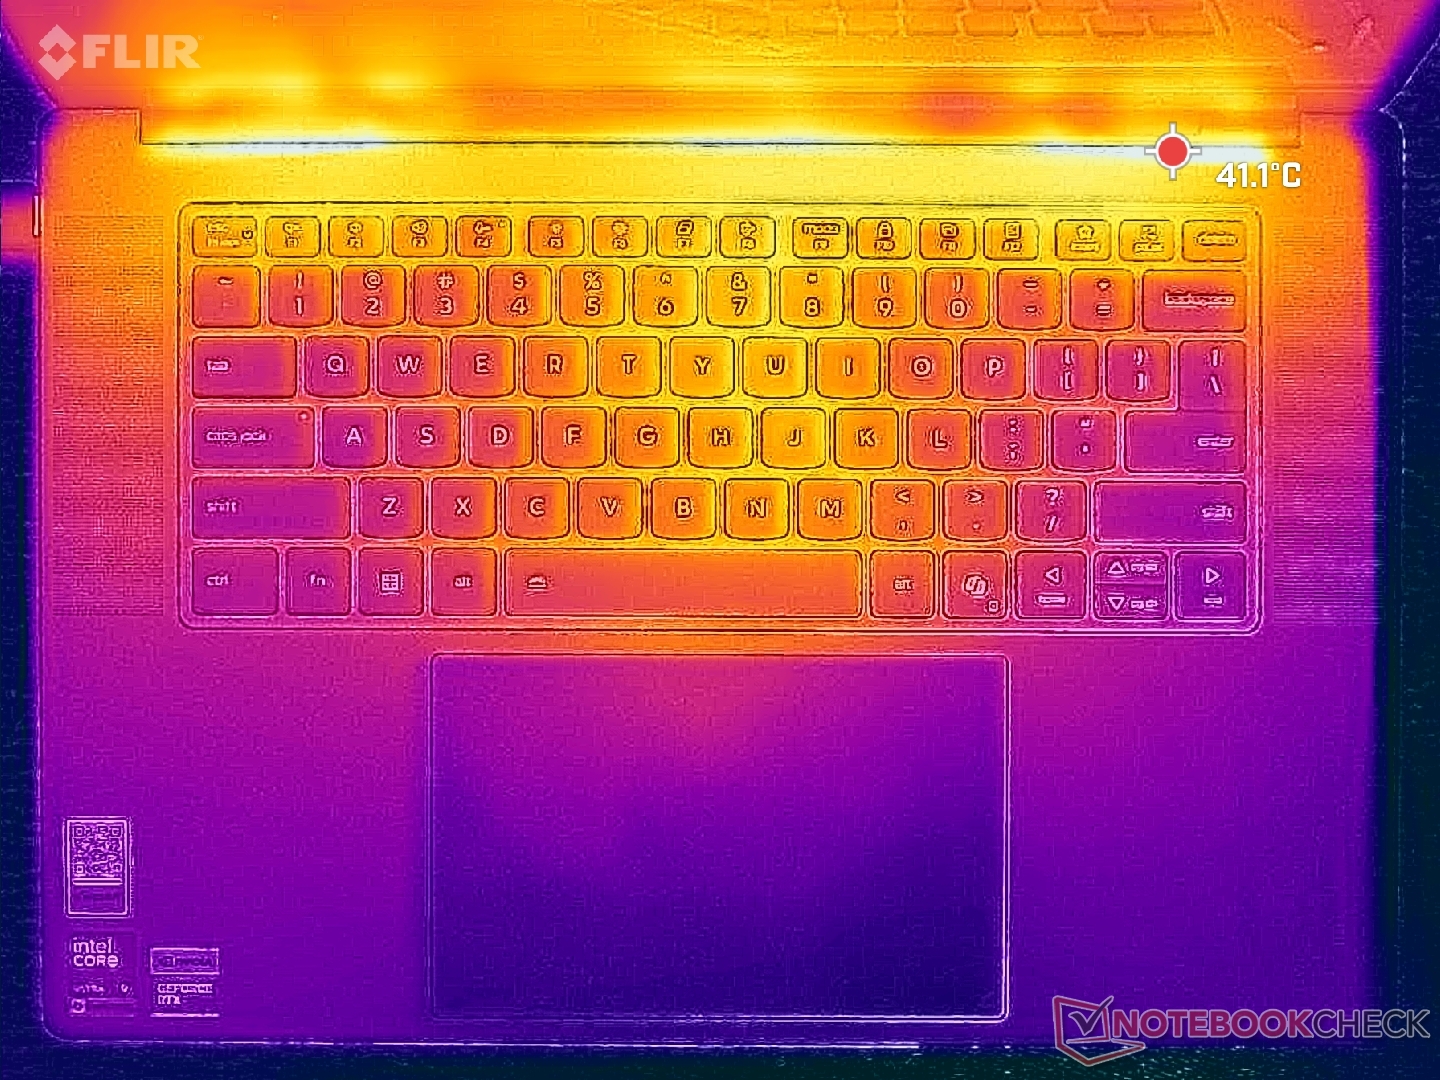
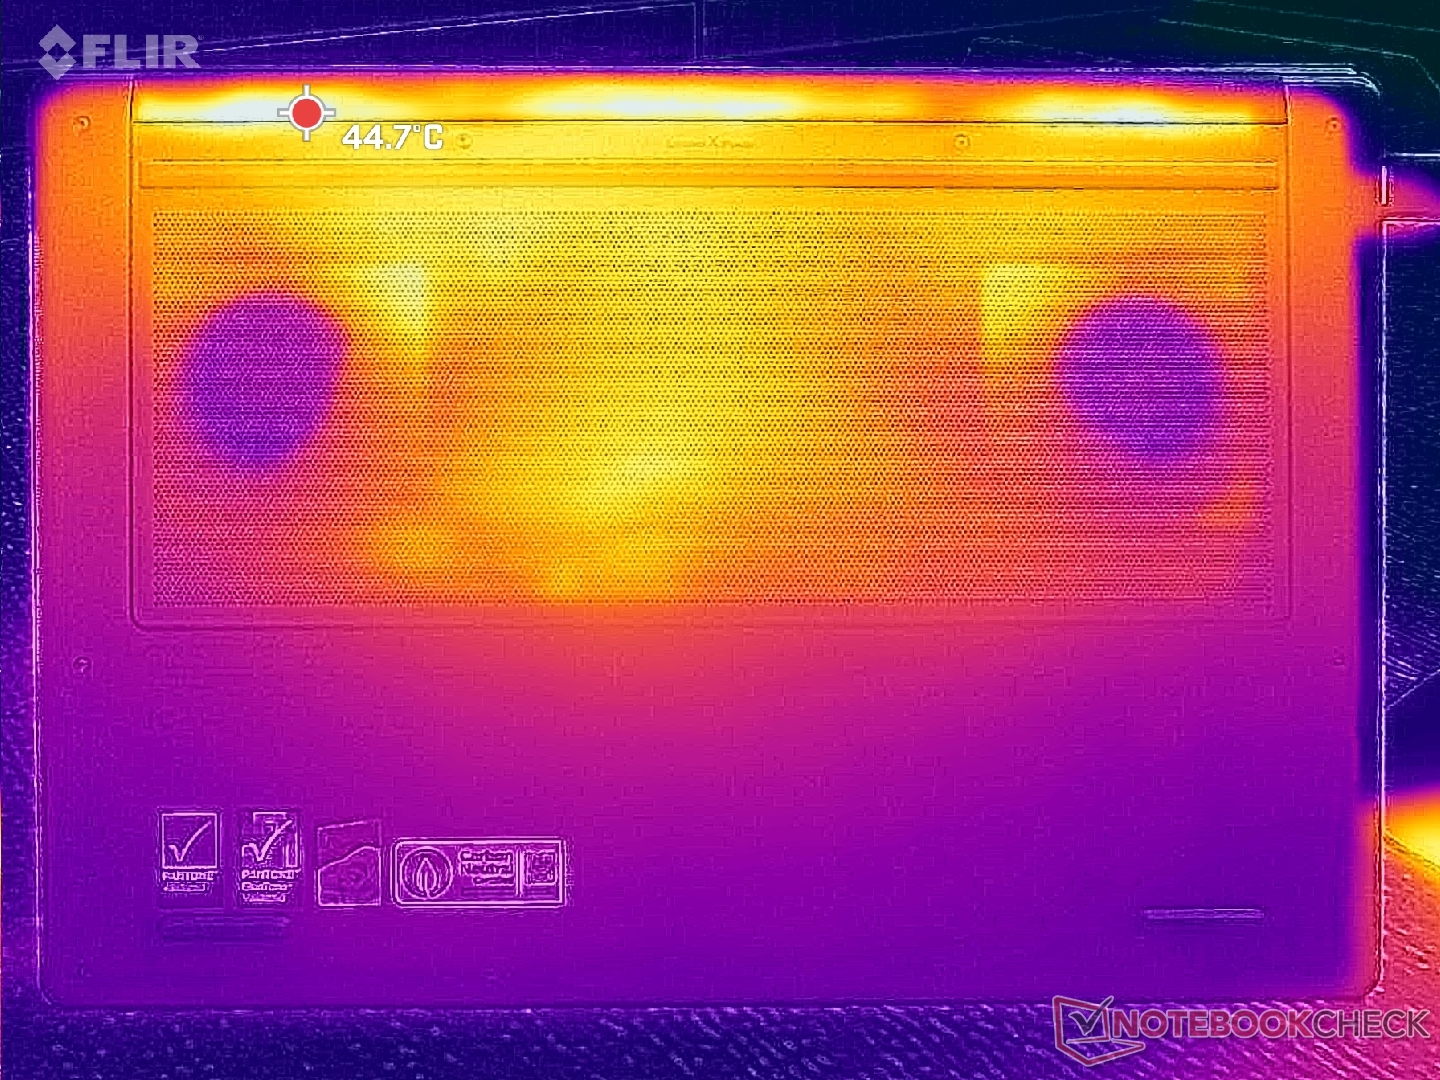
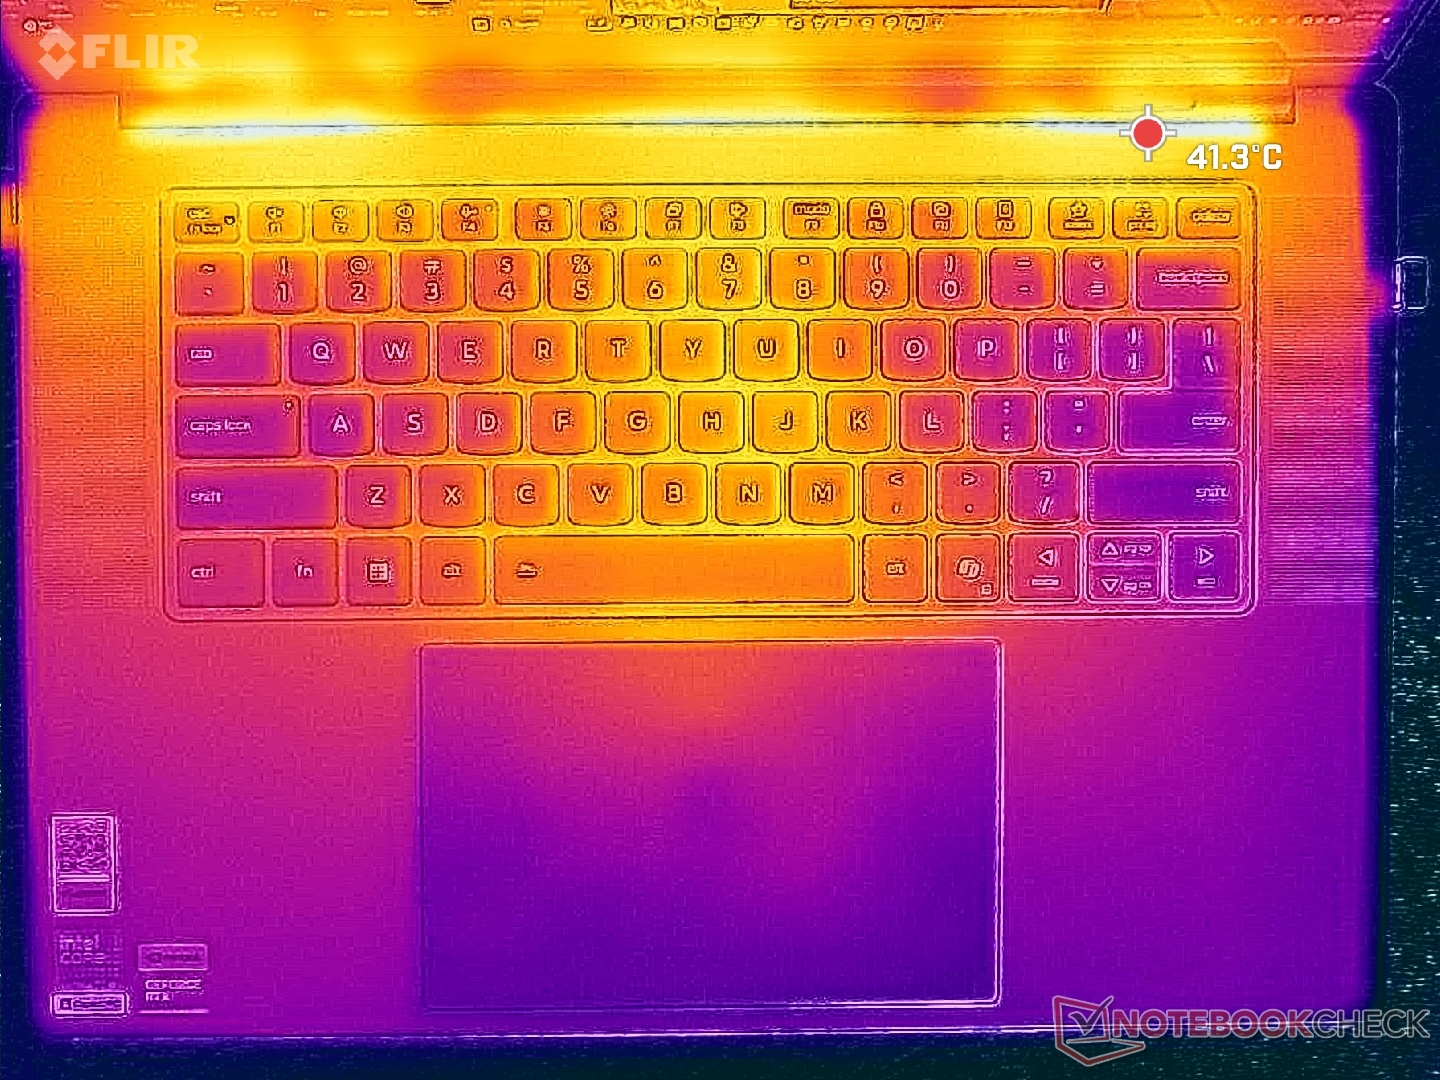
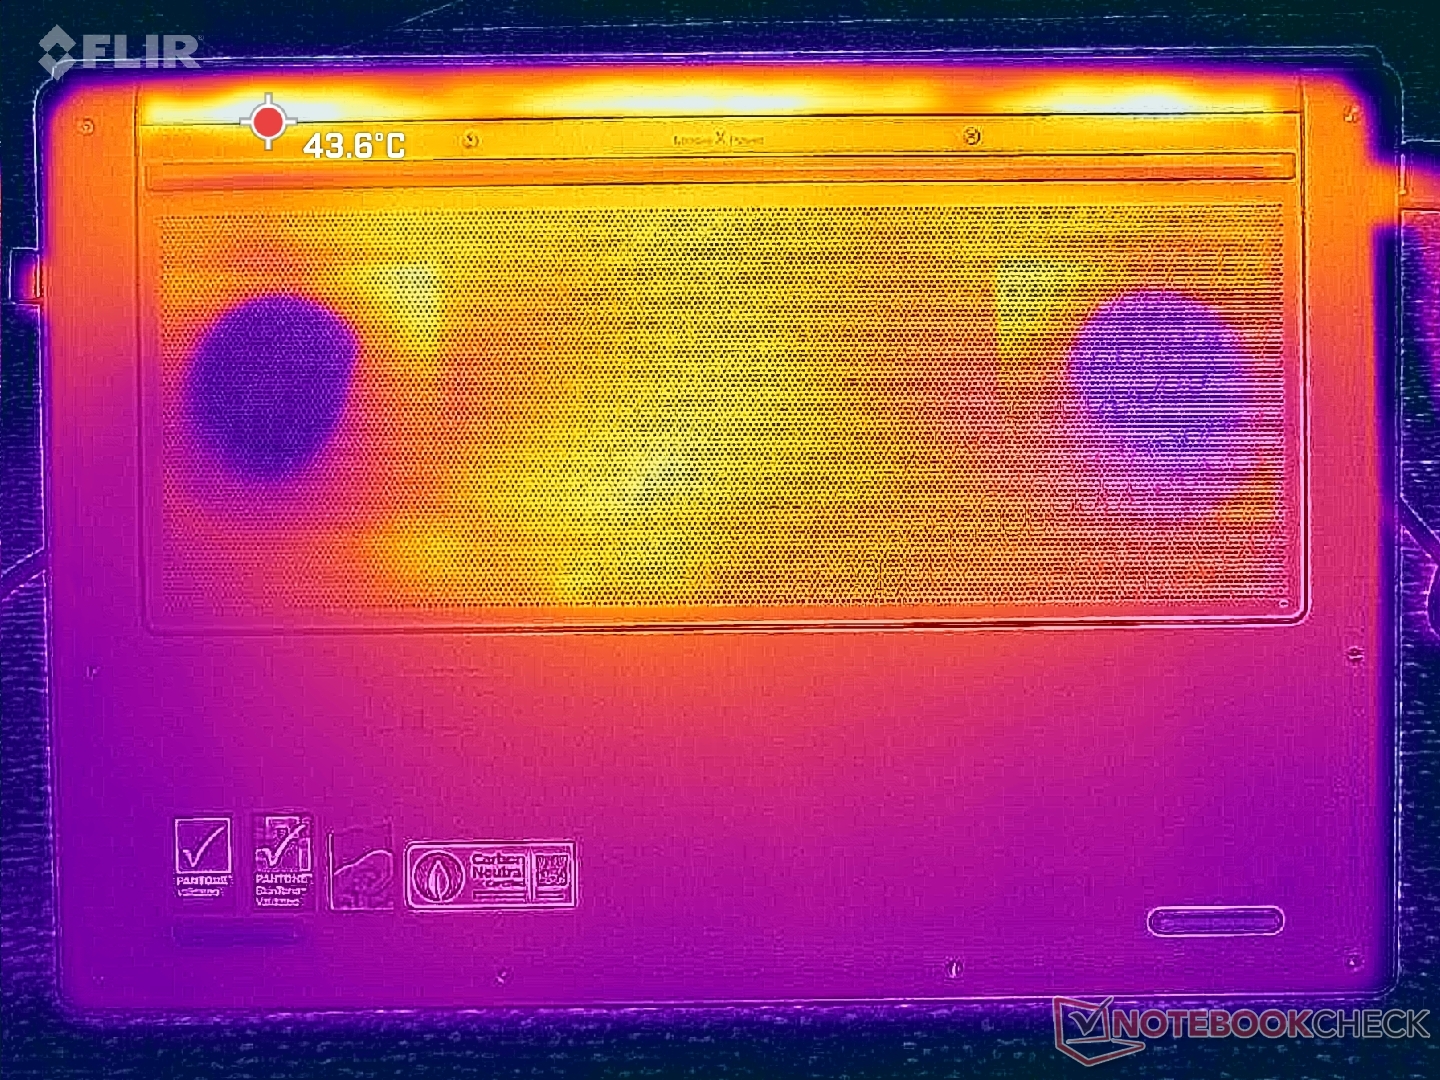
Temperatura
Las temperaturas de la superficie son notablemente más frías a pesar de las dimensiones más reducidas que el modelo saliente. Al ejecutar Cyberpunk 2077, por ejemplo, los puntos calientes de nuestra unidad alcanzaban sólo los 38 C y 41 C en comparación con los 42 C y 49 C del Yoga Pro 9i 16IAH G10 Aura con la misma GPU Nvidia.
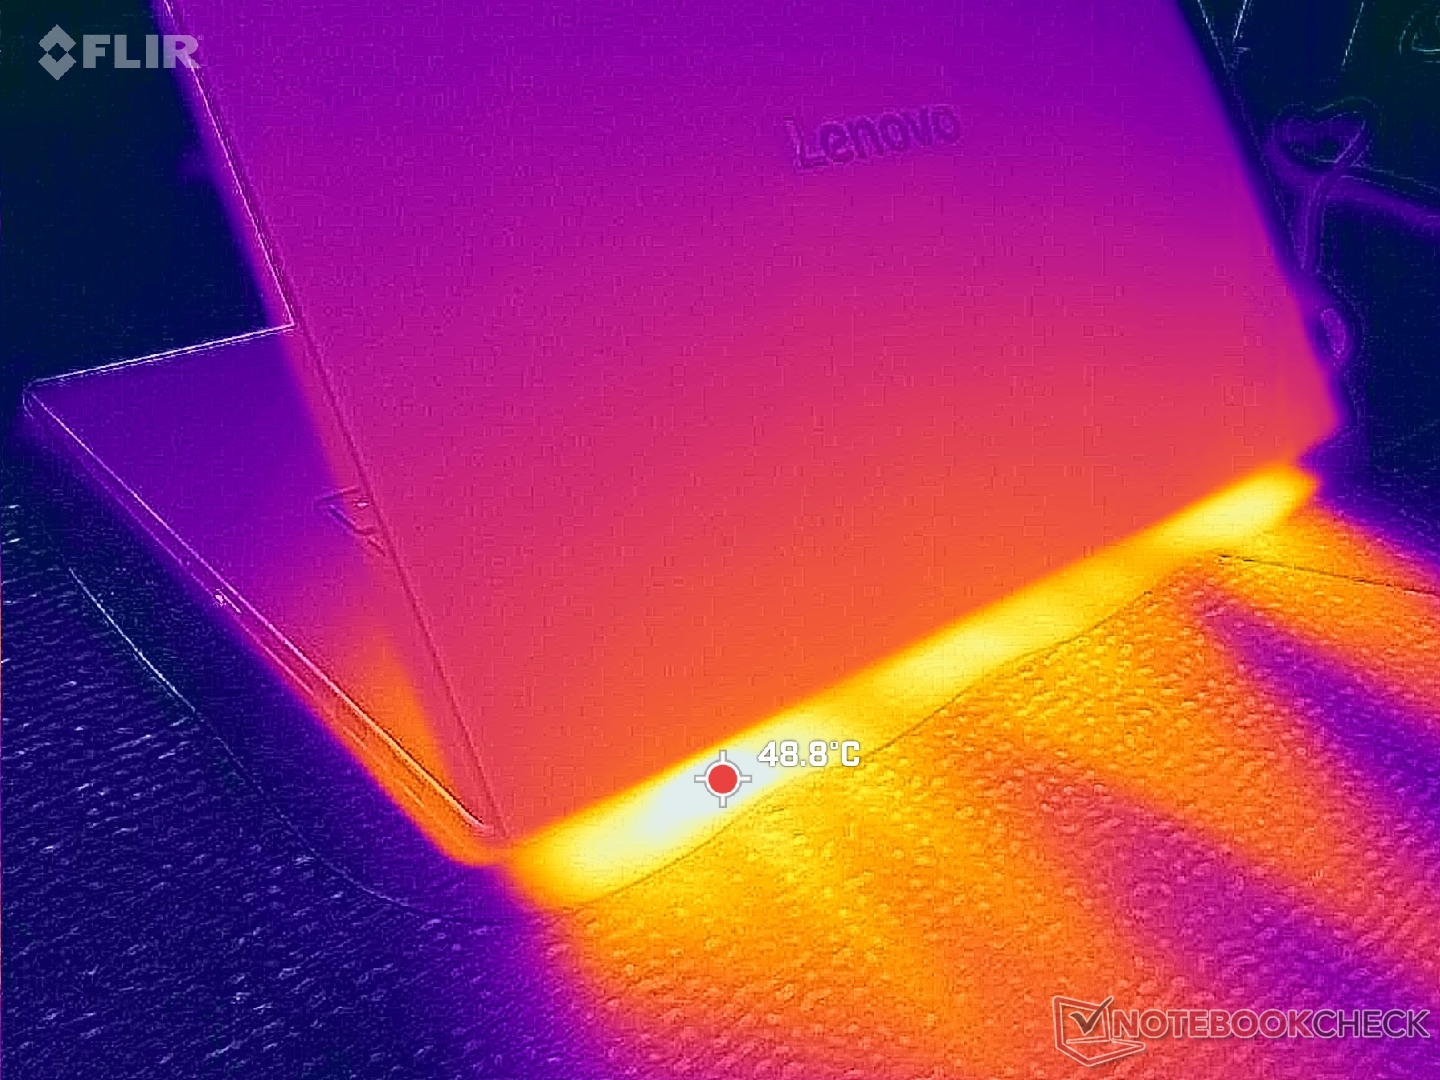
(+) La temperatura máxima en la parte superior es de 37.8 °C / 100 F, frente a la media de 36.8 °C / 98 F, que oscila entre 21 y 71 °C para la clase Multimedia.
(+) El fondo se calienta hasta un máximo de 38.2 °C / 101 F, frente a la media de 39.1 °C / 102 F
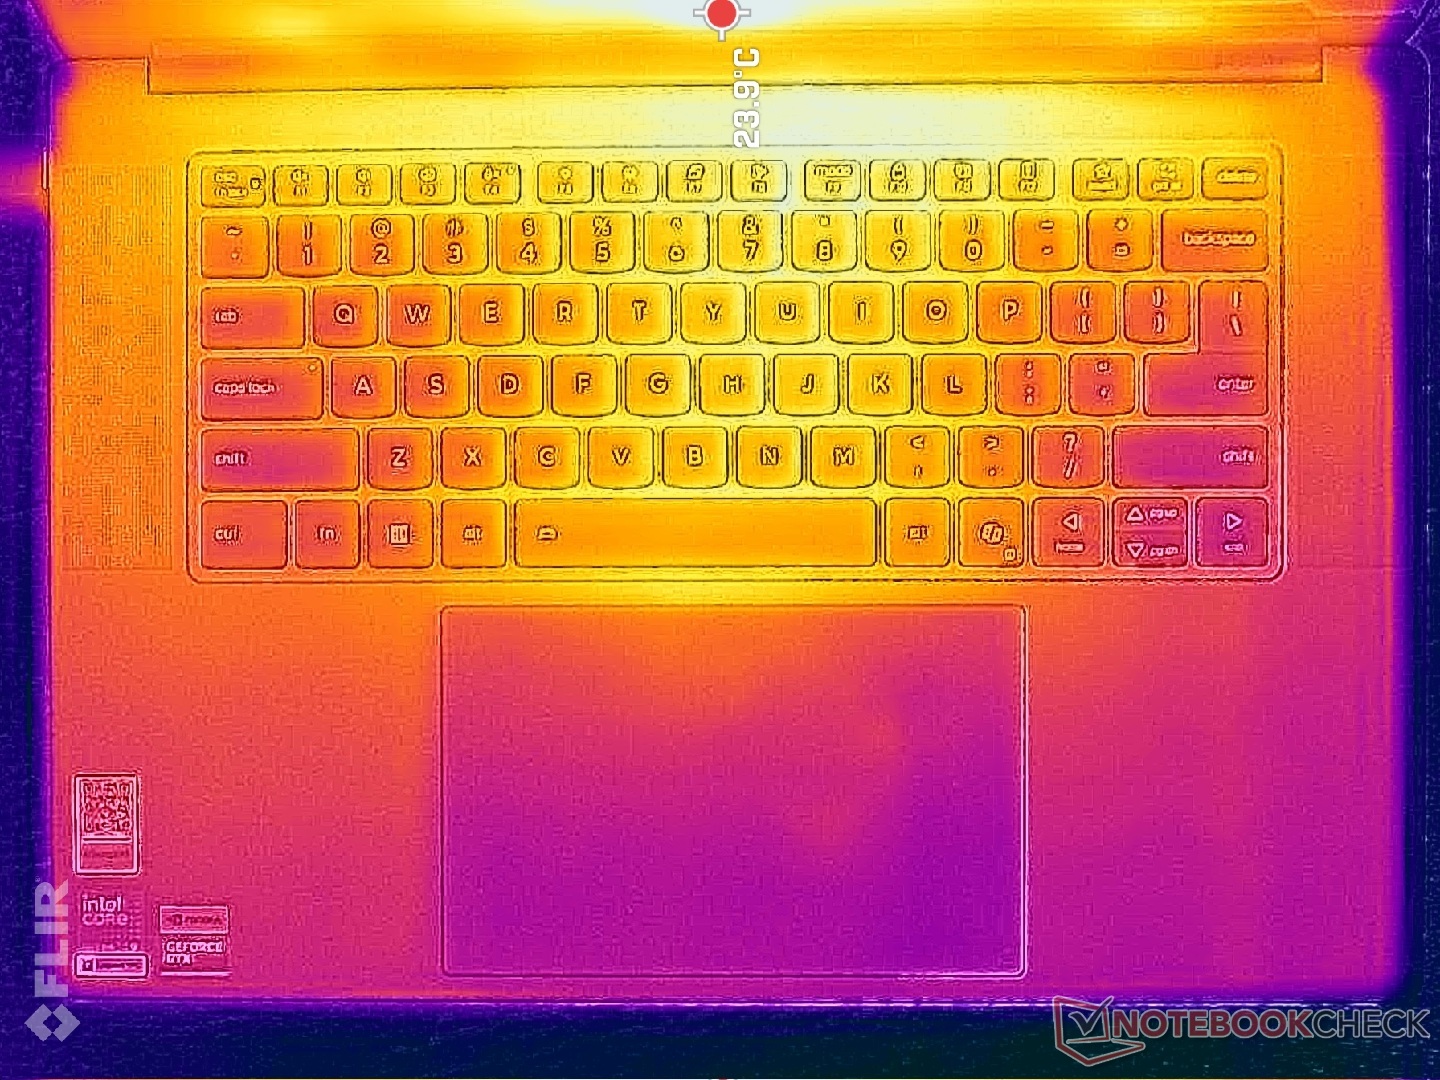
(+) En reposo, la temperatura media de la parte superior es de 27.1 °C / 81# F, frente a la media del dispositivo de 31.3 °C / 88 F.
(+) 3: The average temperature for the upper side is 31.7 °C / 89 F, compared to the average of 31.3 °C / 88 F for the class Multimedia.
(+) El reposamanos y el panel táctil están a una temperatura inferior a la de la piel, con un máximo de 29.4 °C / 84.9 F y, por tanto, son fríos al tacto.
(±) La temperatura media de la zona del reposamanos de dispositivos similares fue de 28.7 °C / 83.7 F (-0.7 °C / -1.2 F).
| Lenovo Pro 9 16IPH11 Ultra 9 386H, GeForce RTX 5060 Laptop | Lenovo Yoga Pro 9 16IAH10 RTX 5050 Ultra 9 285H, GeForce RTX 5050 Laptop | Dell XPS 16 Core Ultra X7 358H Ultra X7 358H, Arc B390 Panther Lake iGPU | MSI Prestige 16 AI Evo B2HMG Ultra 9 285H, Arc 140T | HP Omen Transcend 16-u1095ng i9-14900HX, GeForce RTX 4070 Laptop GPU | Asus ProArt P16 H7606WP Ryzen AI 9 HX 370, GeForce RTX 5070 Laptop | |
|---|---|---|---|---|---|---|
| Heat | 1% | 9% | -7% | -22% | -5% | |
| Maximum Upper Side * (°C) | 37.8 | 34.4 9% | 40.6 -7% | 48.1 -27% | 49 -30% | 47 -24% |
| Maximum Bottom * (°C) | 38.2 | 41.4 -8% | 39.8 -4% | 51.6 -35% | 63 -65% | 47.4 -24% |
| Idle Upper Side * (°C) | 30.4 | 28.6 6% | 23.2 24% | 25.9 15% | 30 1% | 26.1 14% |
| Idle Bottom * (°C) | 31 | 31.8 -3% | 23.8 23% | 25.2 19% | 29 6% | 26.4 15% |
* ... más pequeño es mejor
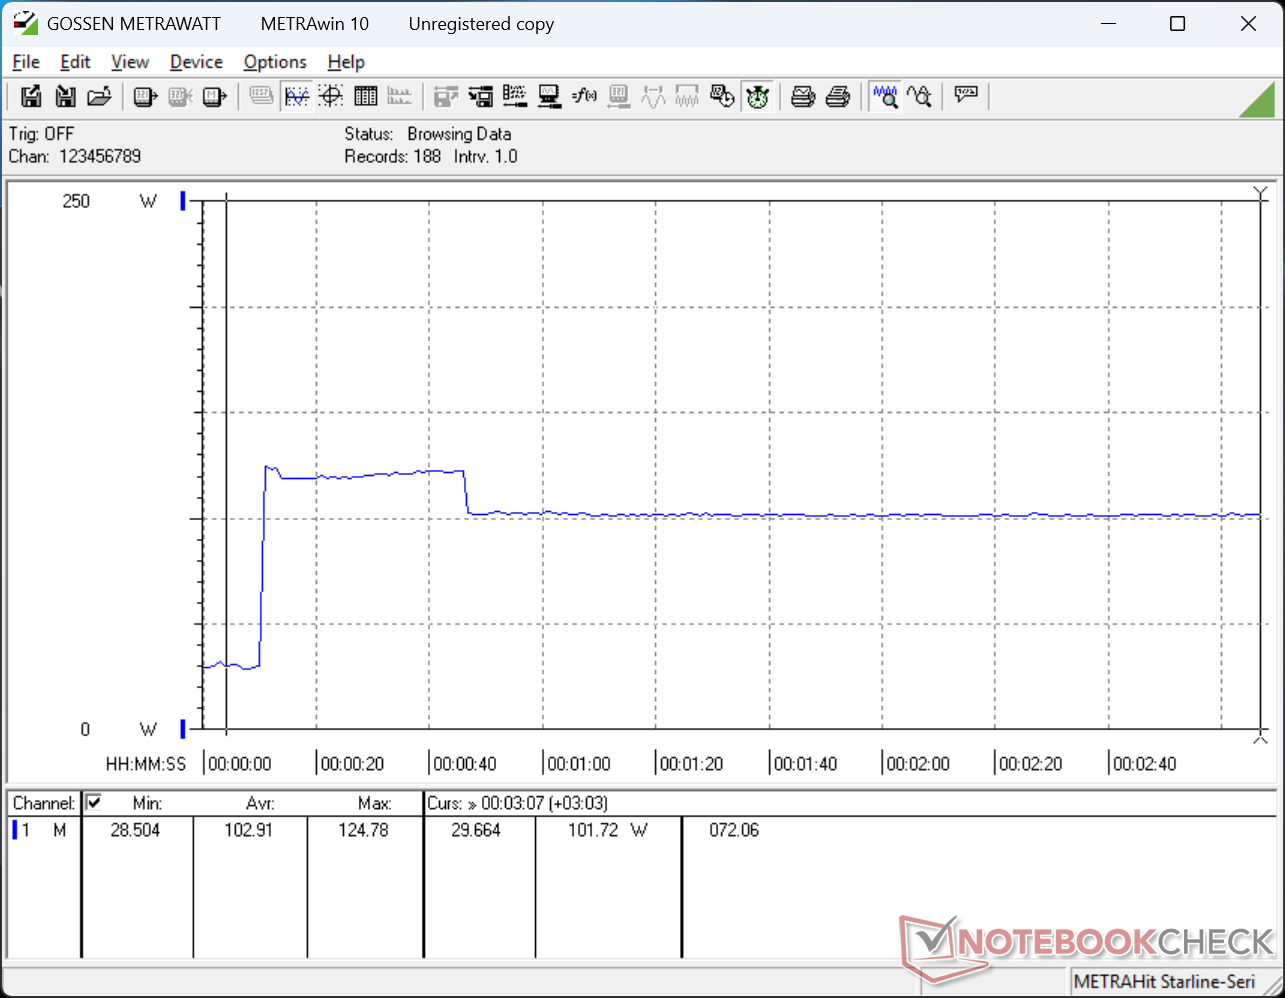
Prueba de estrés
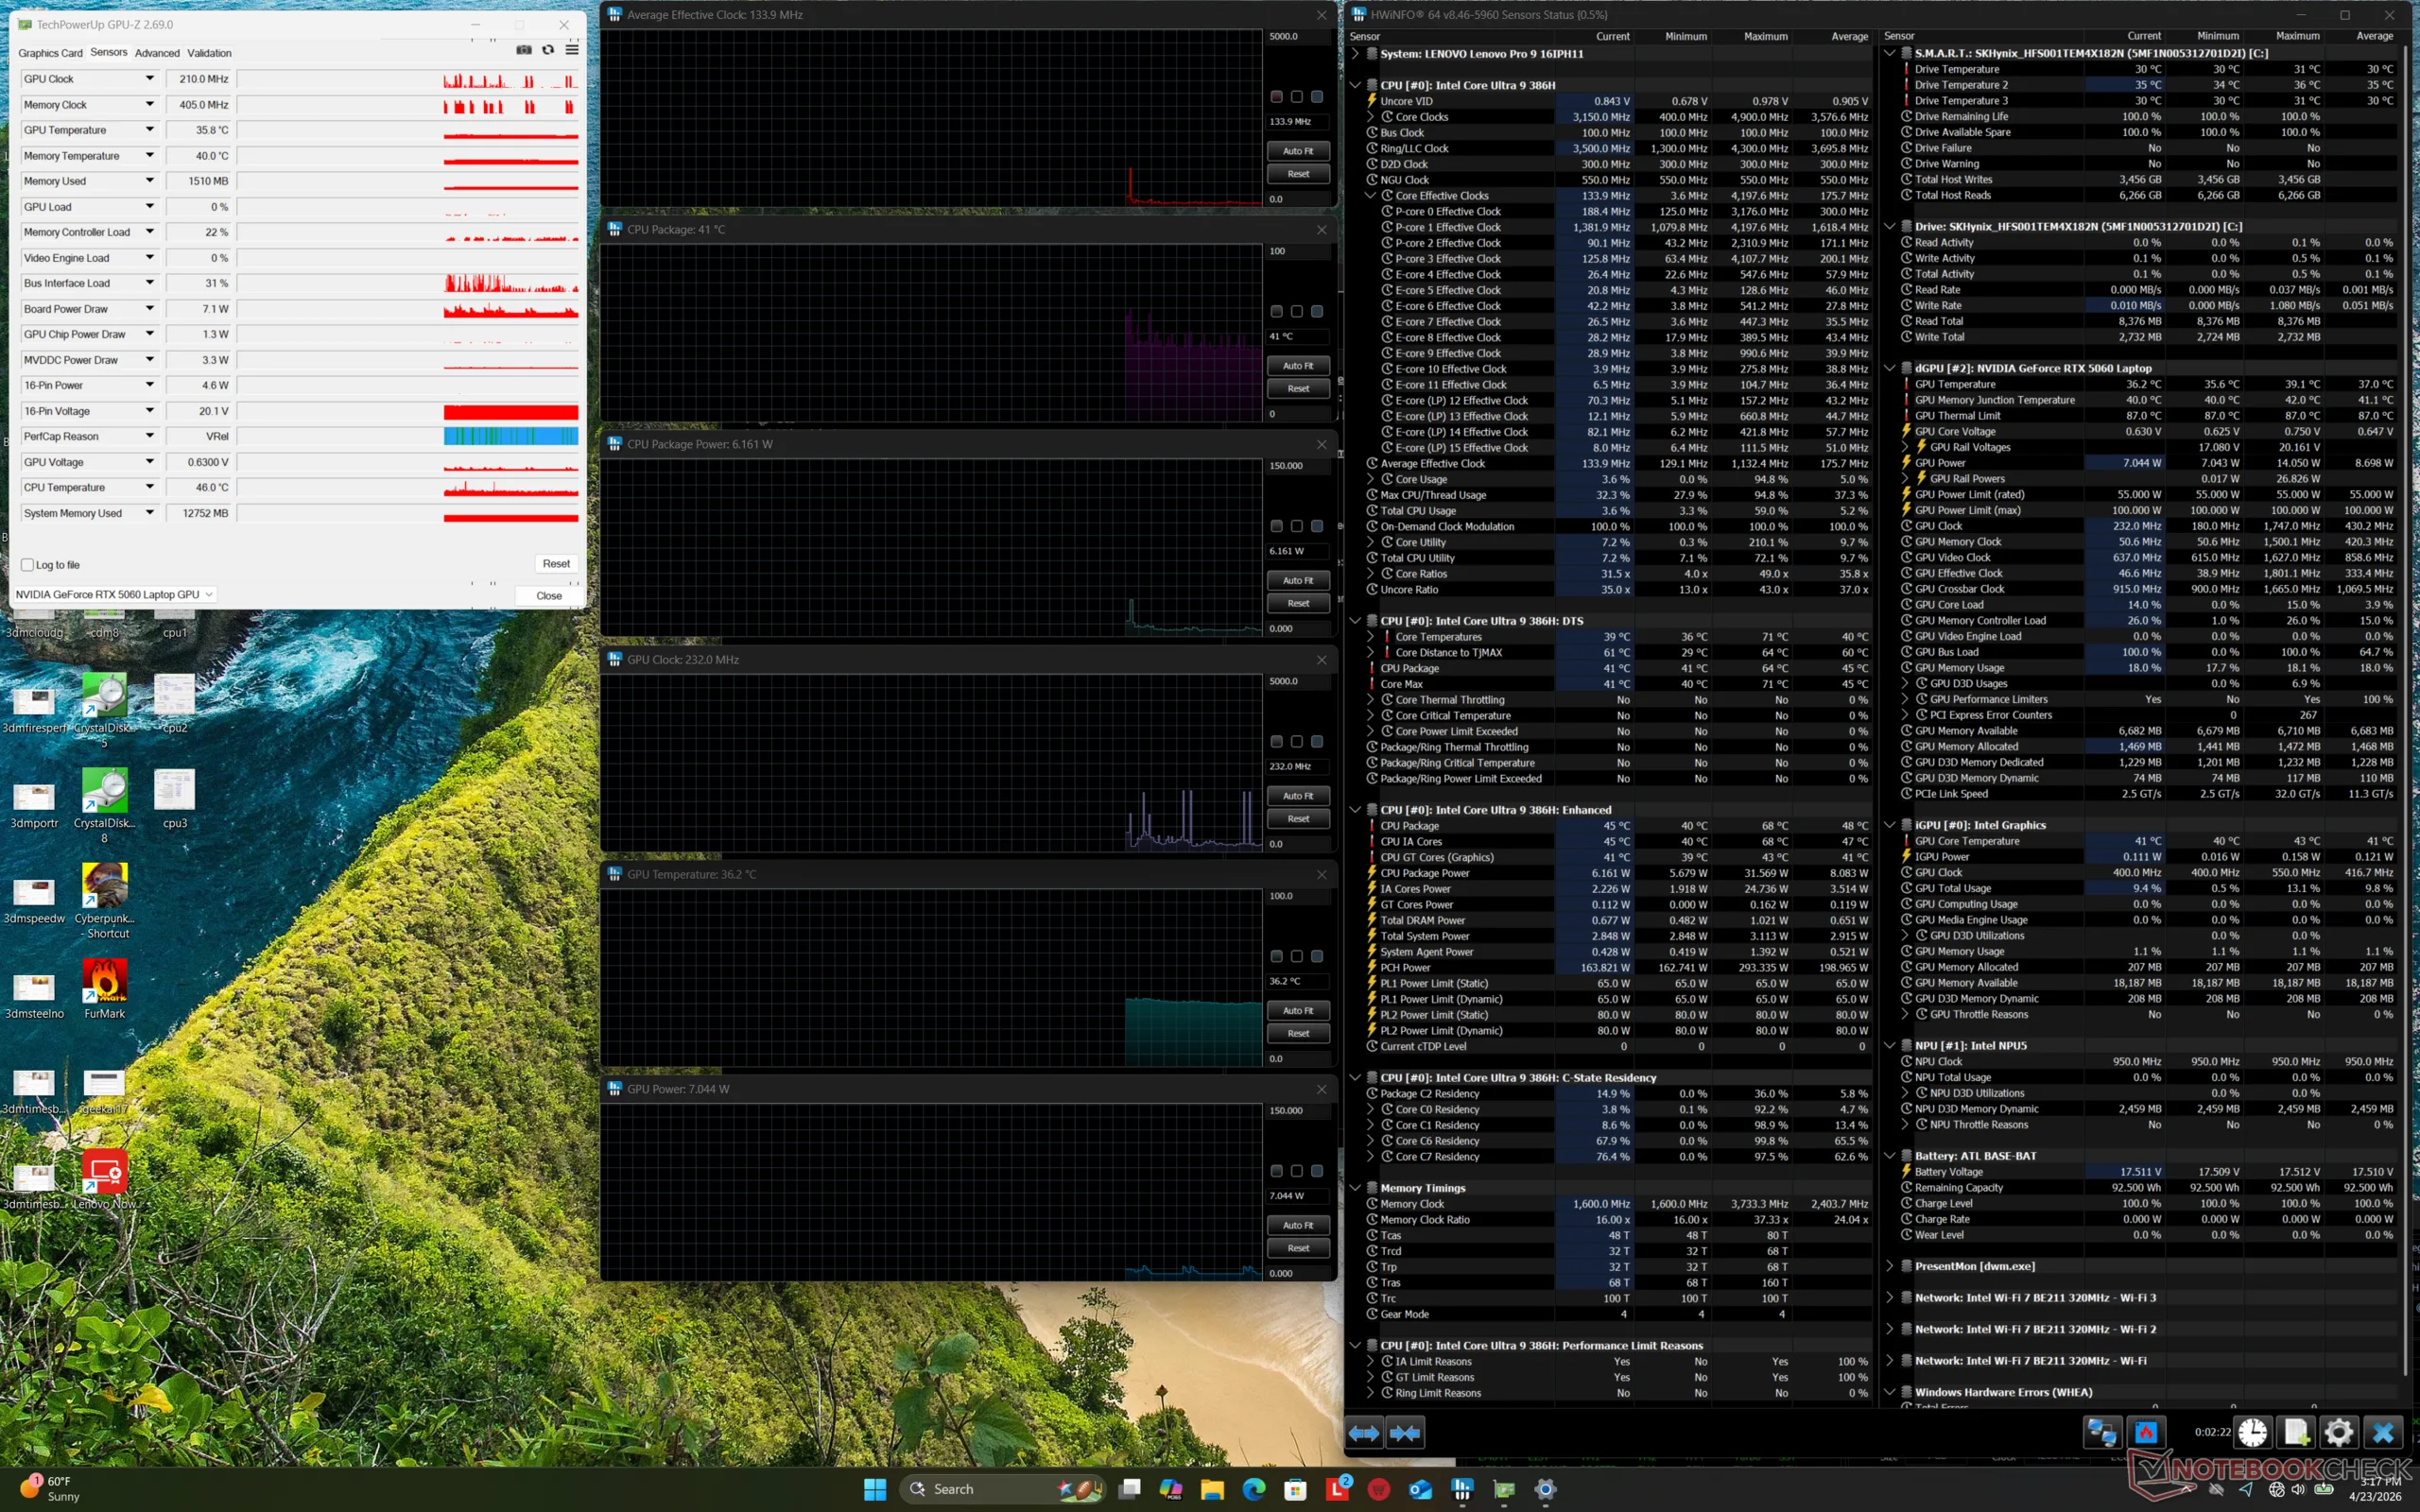
La CPU aumentaría a 3,3 GHz, 98 C y 86 W al iniciar el estrés Prime95 antes de caer y estabilizarse en 3,0 GHz, 90 C y 62 W unos 30 segundos después.
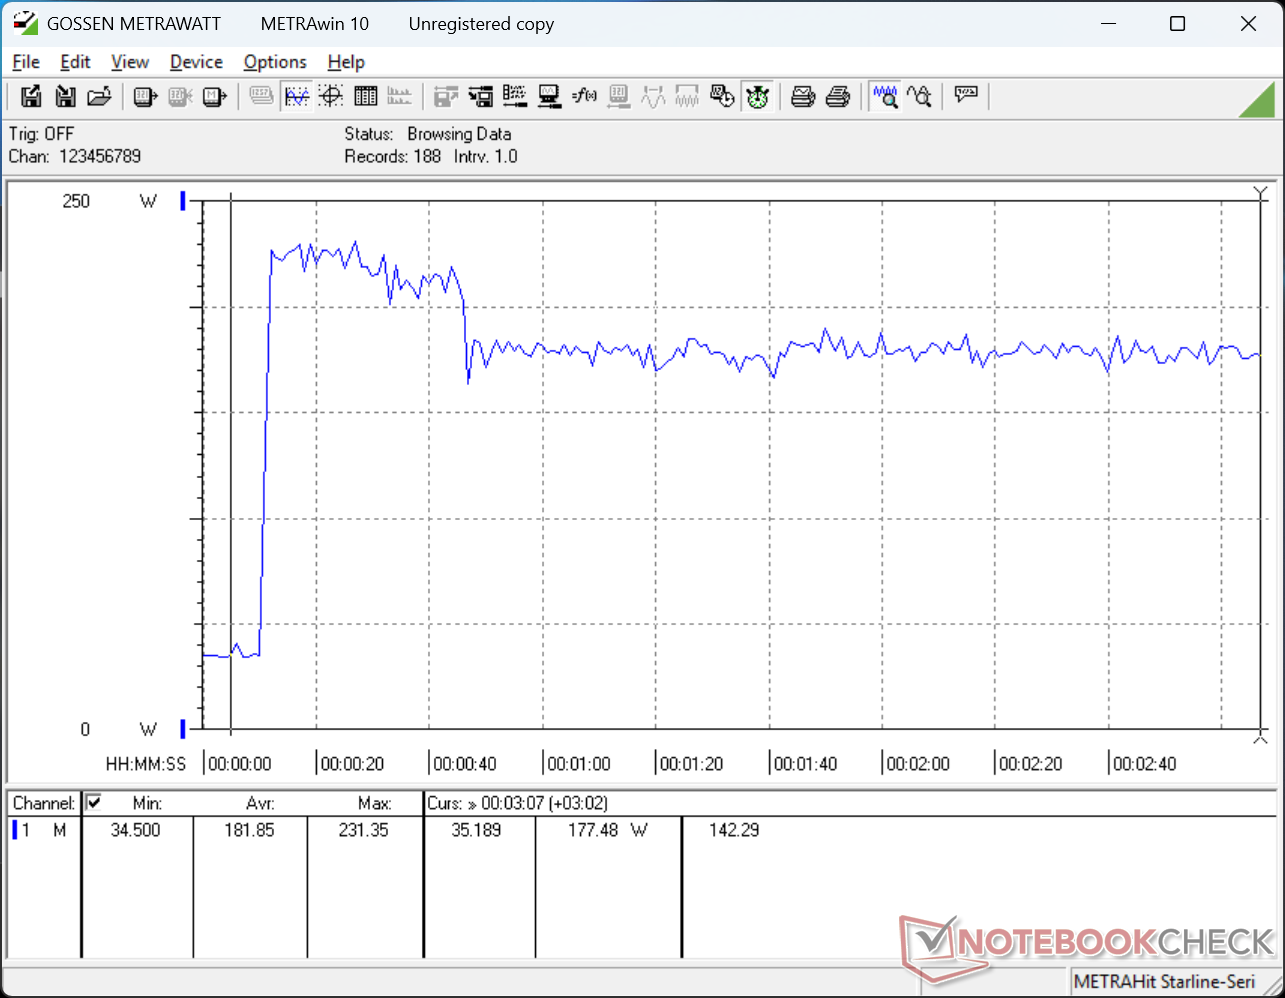
La temperatura del núcleo y las velocidades de reloj cambiaban drásticamente entre los modos Equilibrado y Rendimiento, como muestran las capturas de pantalla siguientes. Al ejecutar Cyberpunk 2077, por ejemplo, la GPU alcanzaría una media de 2647 MHz, 75 C y 91 W si se configuraba en modo Rendimiento o de 2340 MHz, 68 C y 67 W si se configuraba en modo Equilibrado. El rendimiento globalmente más lento en el modo Equilibrado coincide con nuestras observaciones de Time SPy en la sección anterior sobre la GPU.
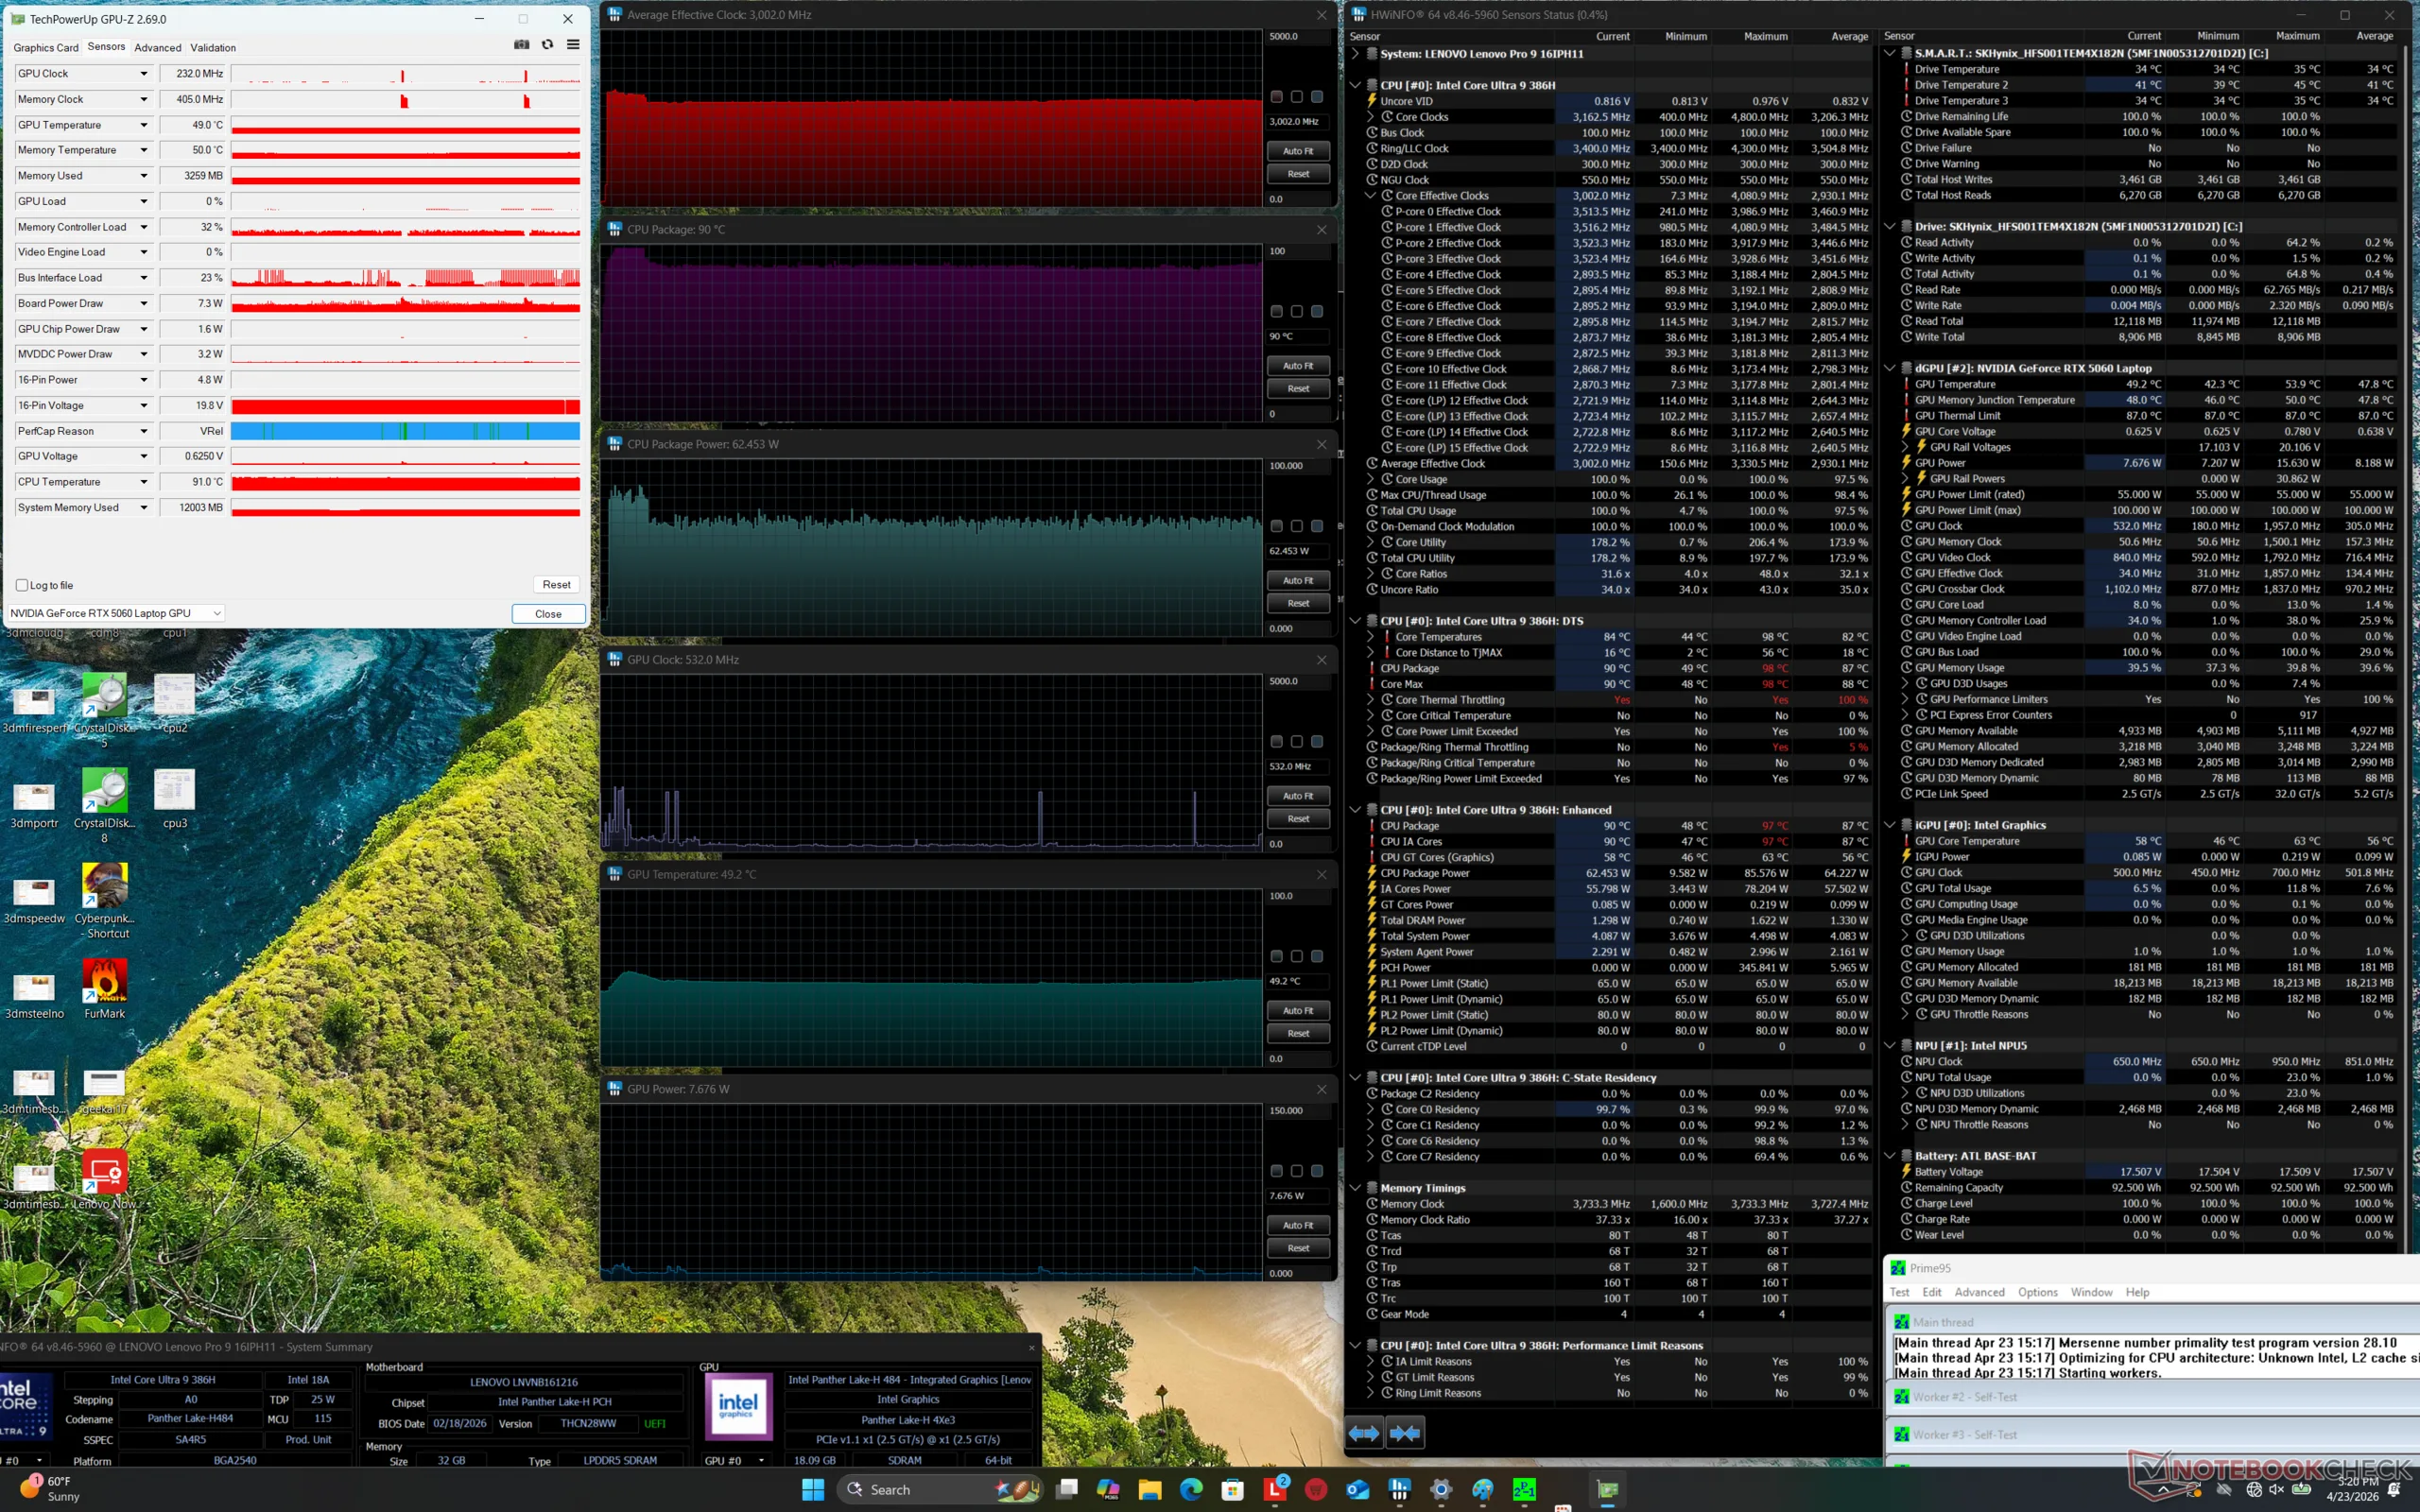
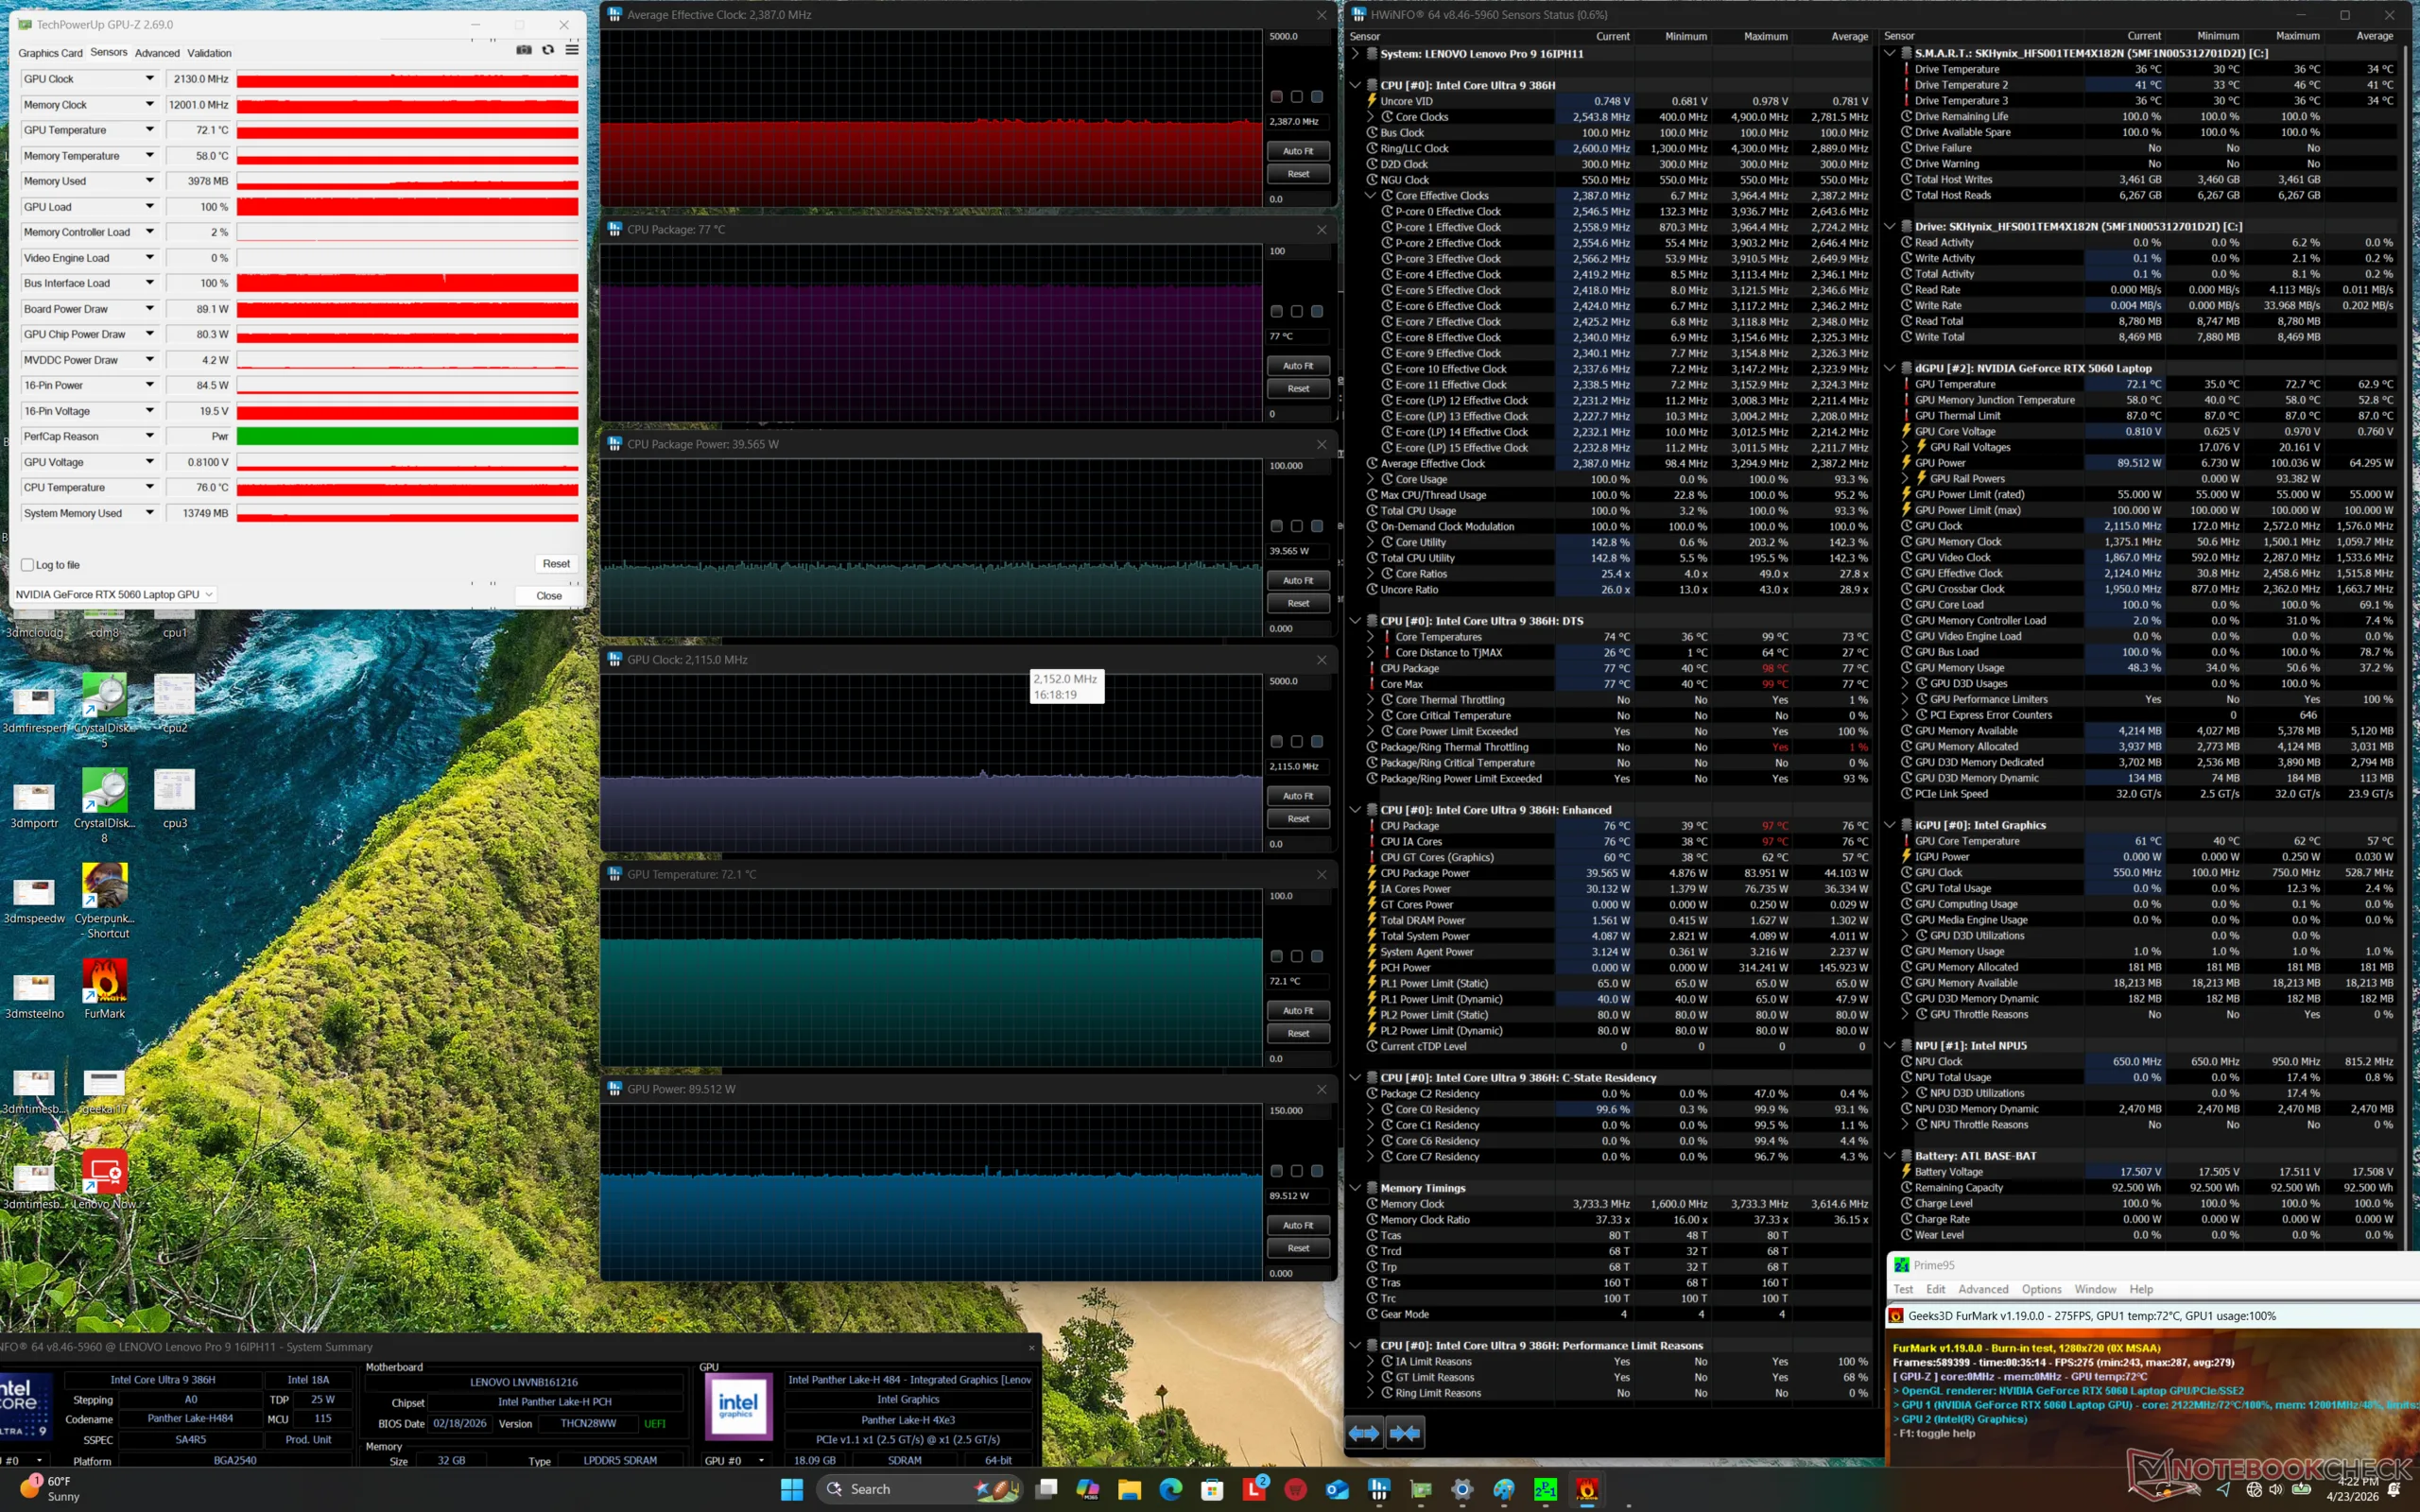
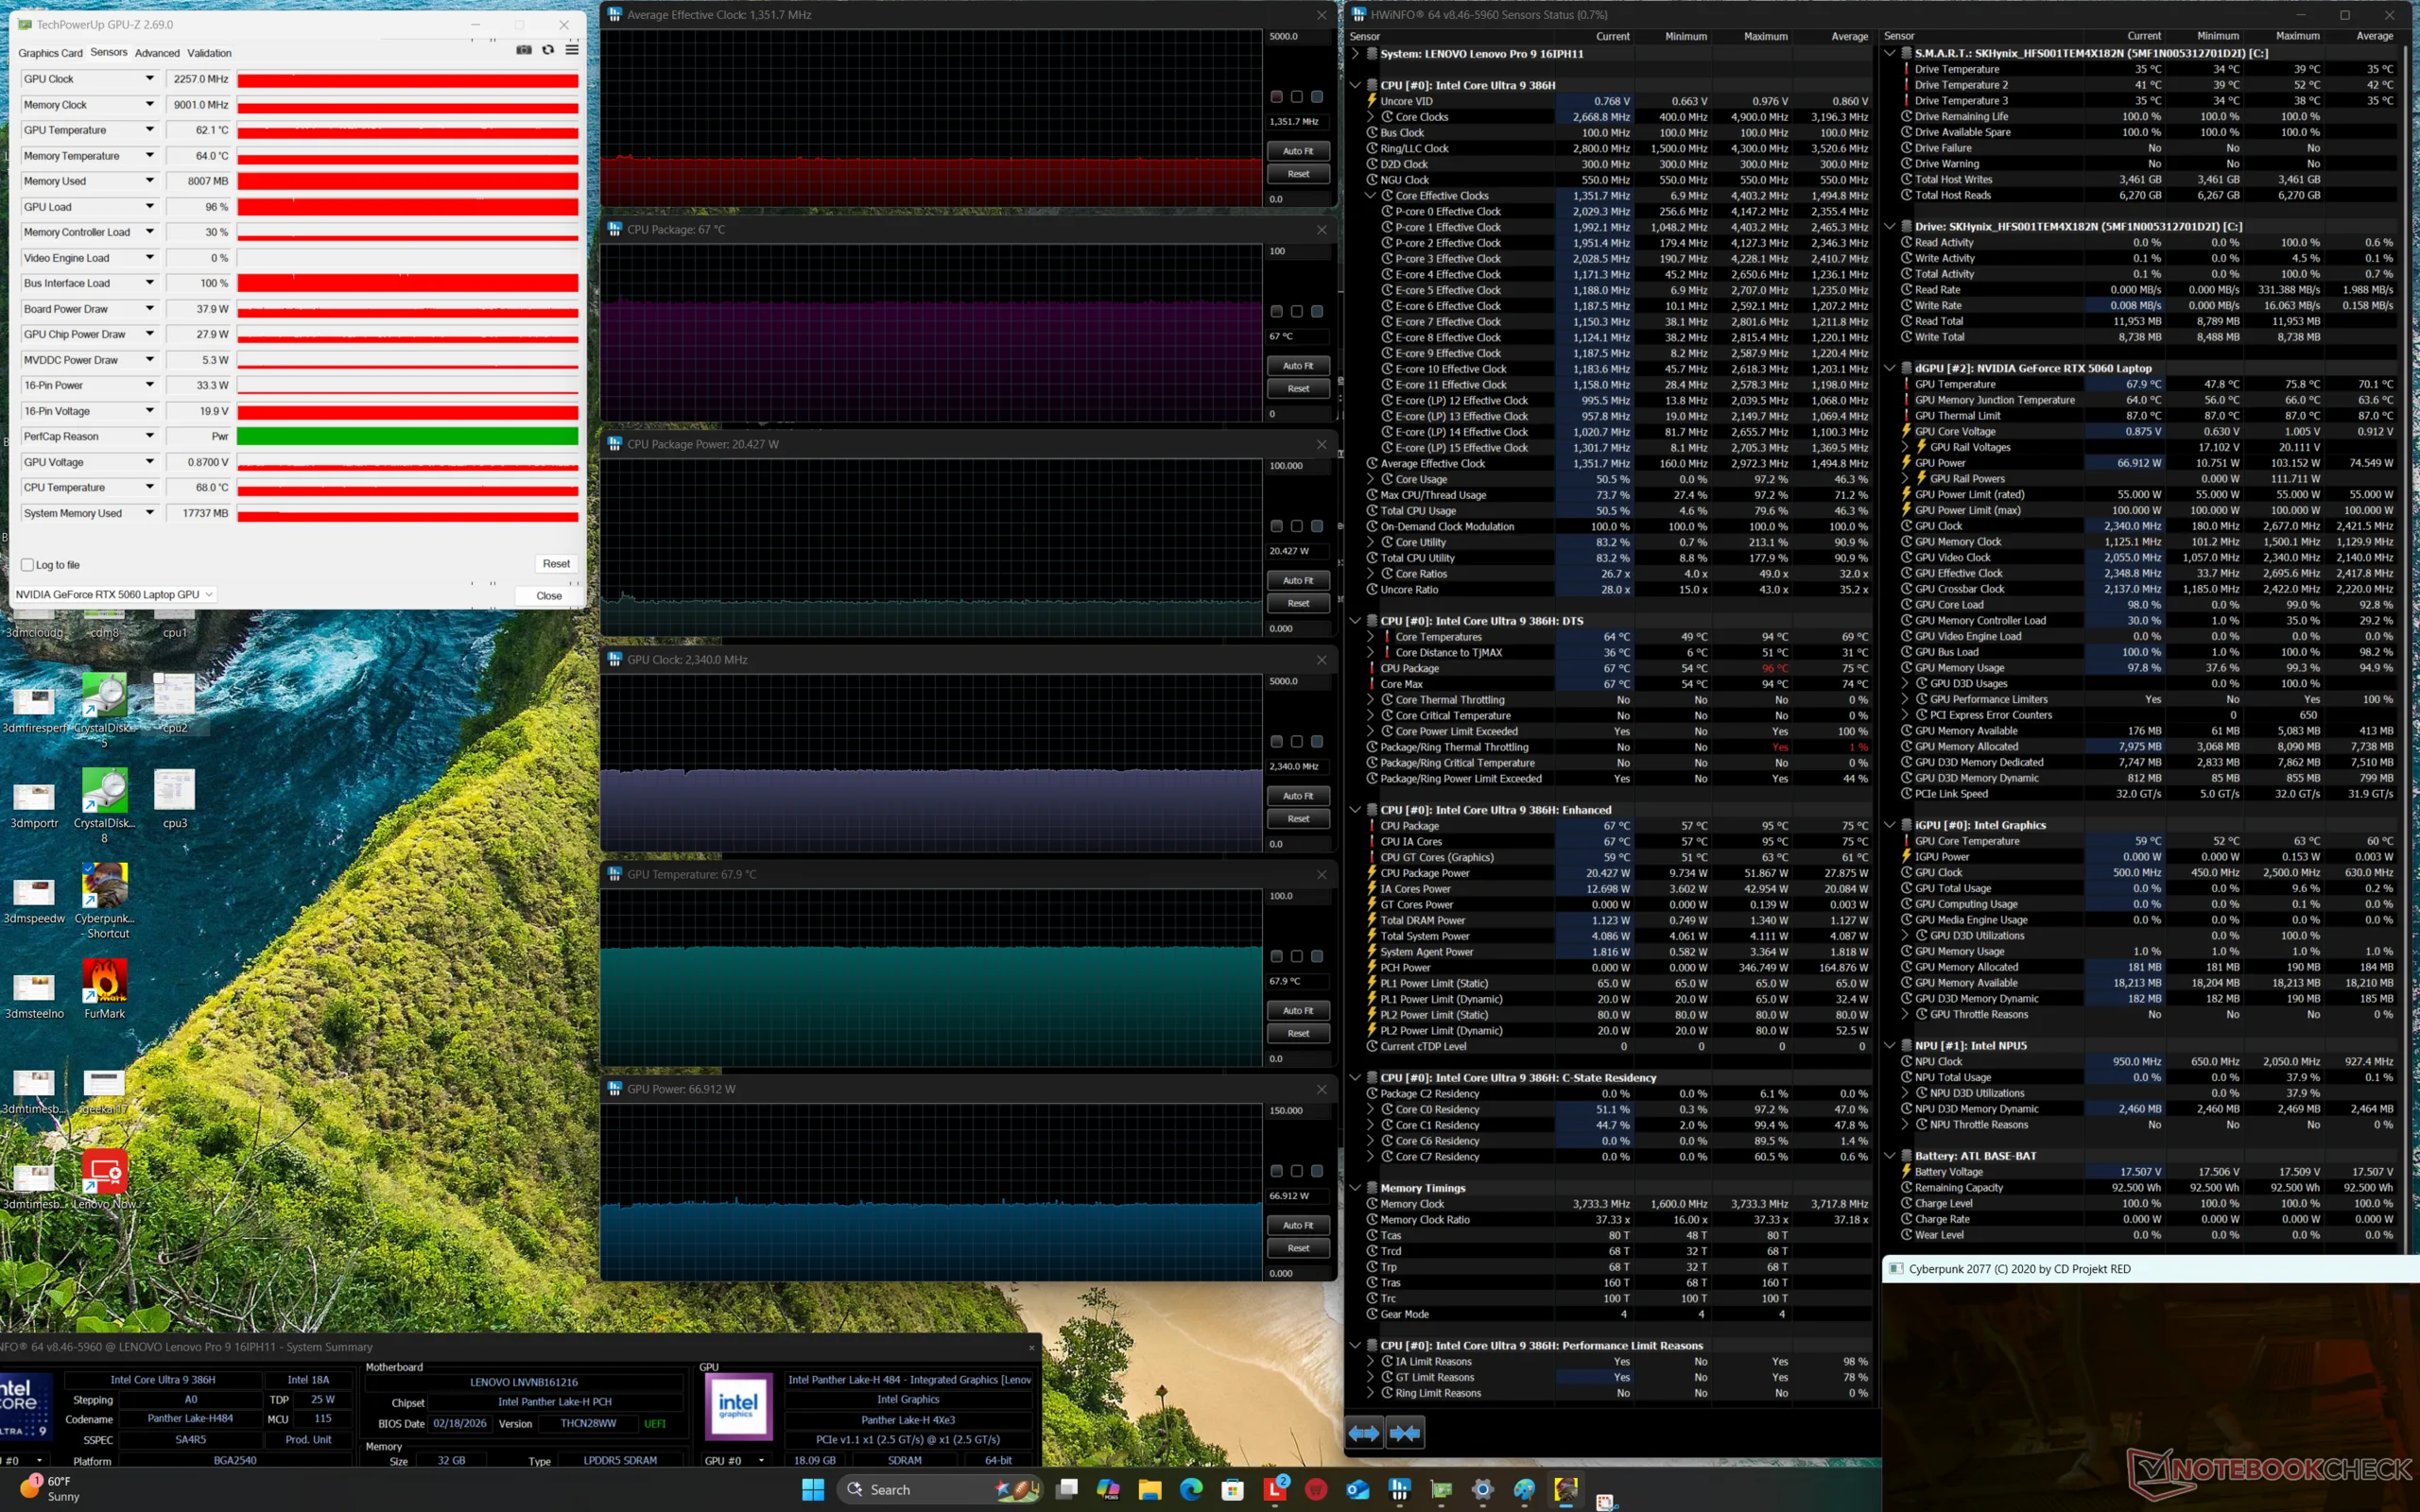
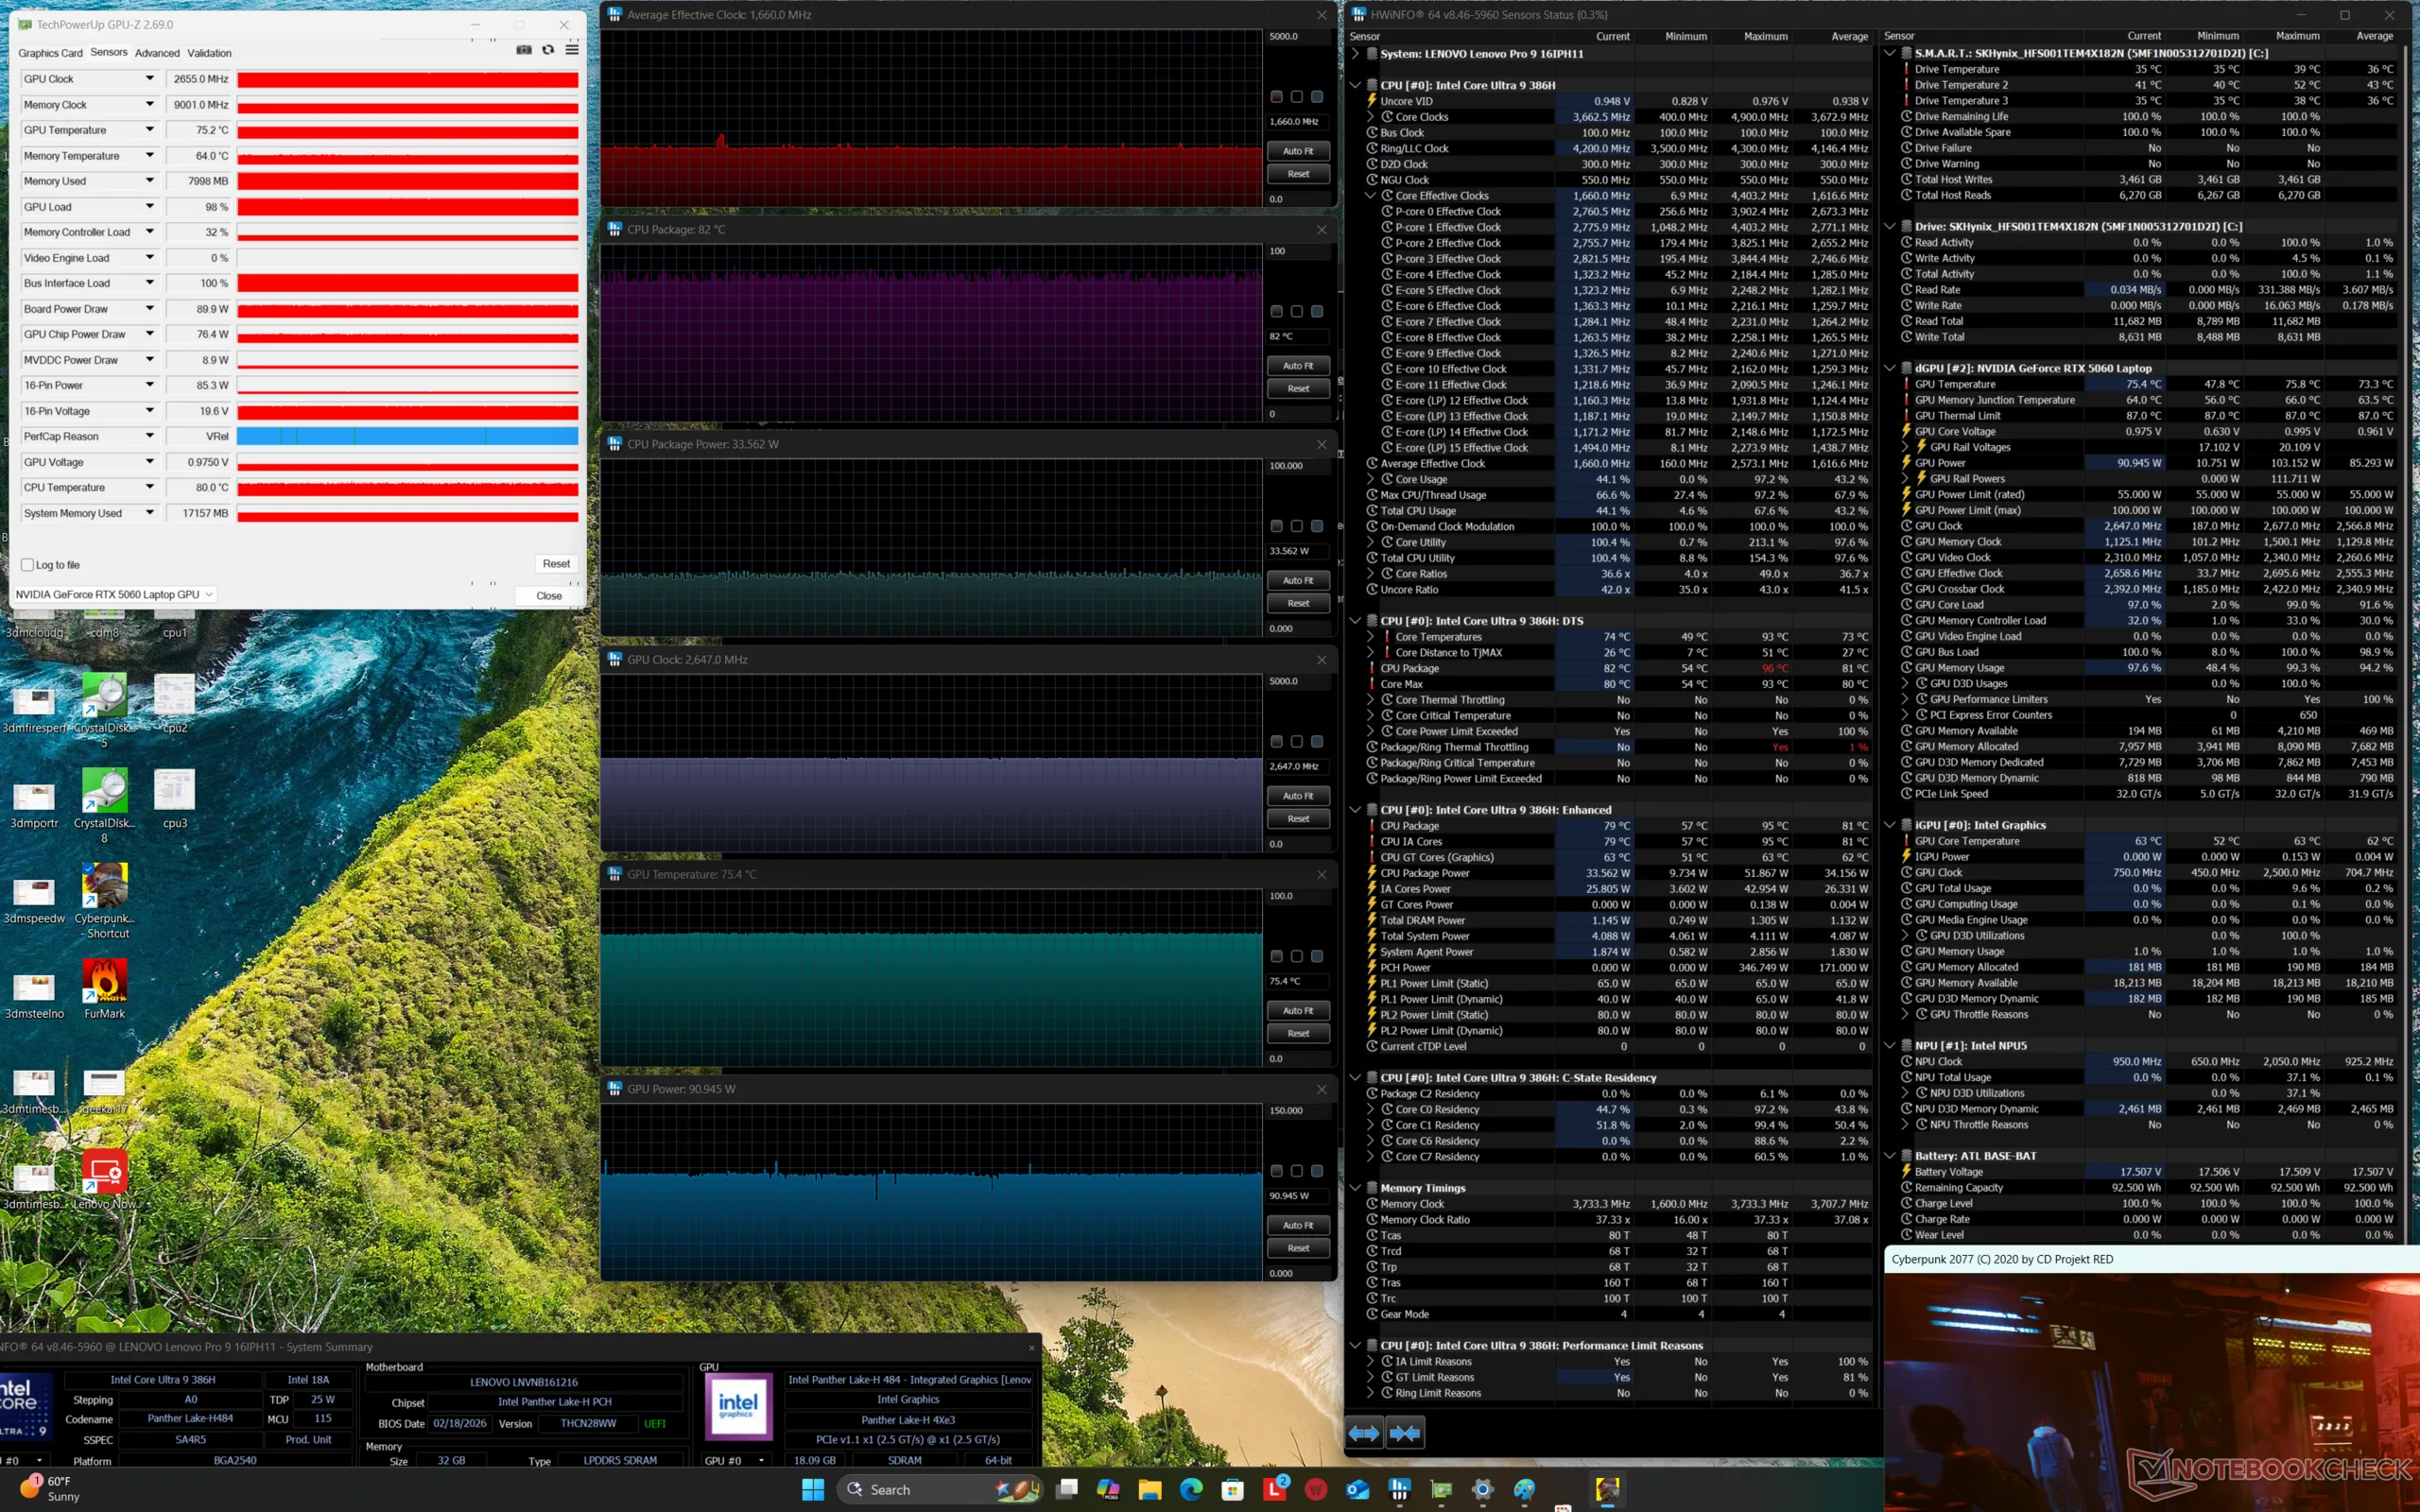
| Reloj medio de la CPU (GHz) | Reloj medio de la GPU (MHz) | Temperatura media dela CPU (°C) | Temperatura media de la GPU (°C) | |
| Sistema en reposo | -- | 232 | 41 | 36 |
| Prime95 Stress | 3.0 | -- | 90 | 49 |
| Estrés de Prime95 + FurMark | 2.4 | 2115 | 77 | 72 |
| Estrés de Cyberpunk 2077 (modo equilibrado) | 1.4 | 2340 | 67 | 68 |
| Cyberpunk 2077 Estrés (modo Rendimiento) | 1.7 | 2647 | 82 | 75 |
Altavoces
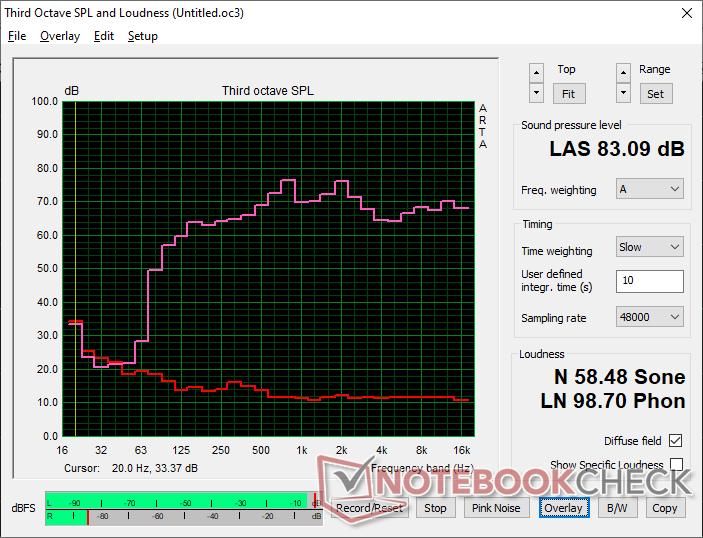
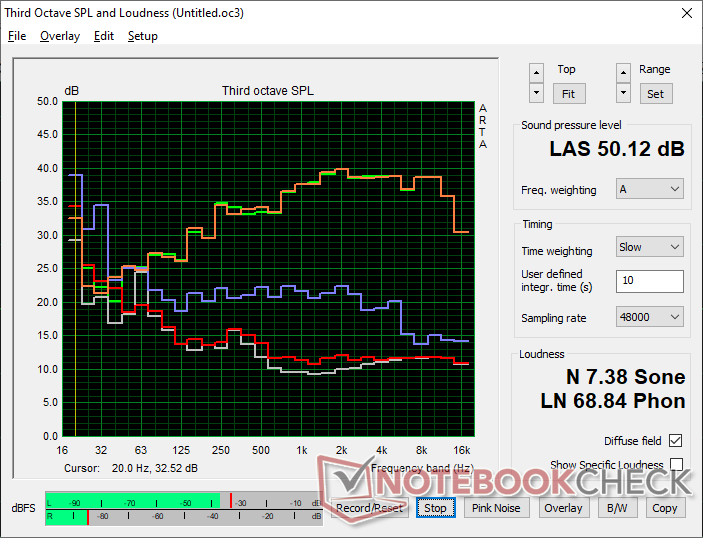
Lenovo Pro 9 16IPH11 análisis de audio
(+) | los altavoces pueden reproducir a un volumen relativamente alto (#83.1 dB)
Graves 100 - 315 Hz
(±) | lubina reducida - en promedio 5.7% inferior a la mediana
(+) | el bajo es lineal (5.1% delta a la frecuencia anterior)
Medios 400 - 2000 Hz
(+) | medios equilibrados - a sólo 4.2% de la mediana
(+) | los medios son lineales (5.4% delta a la frecuencia anterior)
Altos 2 - 16 kHz
(+) | máximos equilibrados - a sólo 1.8% de la mediana
(+) | los máximos son lineales (4.4% delta a la frecuencia anterior)
Total 100 - 16.000 Hz
(+) | el sonido global es lineal (7.7% de diferencia con la mediana)
En comparación con la misma clase
» 6% de todos los dispositivos probados de esta clase eran mejores, 2% similares, 91% peores
» El mejor tuvo un delta de 5%, la media fue 17%, el peor fue ###max##%
En comparación con todos los dispositivos probados
» 1% de todos los dispositivos probados eran mejores, 0% similares, 98% peores
» El mejor tuvo un delta de 4%, la media fue 23%, el peor fue ###max##%
Apple MacBook Pro 16 2021 M1 Pro análisis de audio
(+) | los altavoces pueden reproducir a un volumen relativamente alto (#84.7 dB)
Graves 100 - 315 Hz
(+) | buen bajo - sólo 3.8% lejos de la mediana
(+) | el bajo es lineal (5.2% delta a la frecuencia anterior)
Medios 400 - 2000 Hz
(+) | medios equilibrados - a sólo 1.3% de la mediana
(+) | los medios son lineales (2.1% delta a la frecuencia anterior)
Altos 2 - 16 kHz
(+) | máximos equilibrados - a sólo 1.9% de la mediana
(+) | los máximos son lineales (2.7% delta a la frecuencia anterior)
Total 100 - 16.000 Hz
(+) | el sonido global es lineal (4.6% de diferencia con la mediana)
En comparación con la misma clase
» 0% de todos los dispositivos probados de esta clase eran mejores, 0% similares, 100% peores
» El mejor tuvo un delta de 5%, la media fue 17%, el peor fue ###max##%
En comparación con todos los dispositivos probados
» 0% de todos los dispositivos probados eran mejores, 0% similares, 100% peores
» El mejor tuvo un delta de 4%, la media fue 23%, el peor fue ###max##%
Gestión de la energía
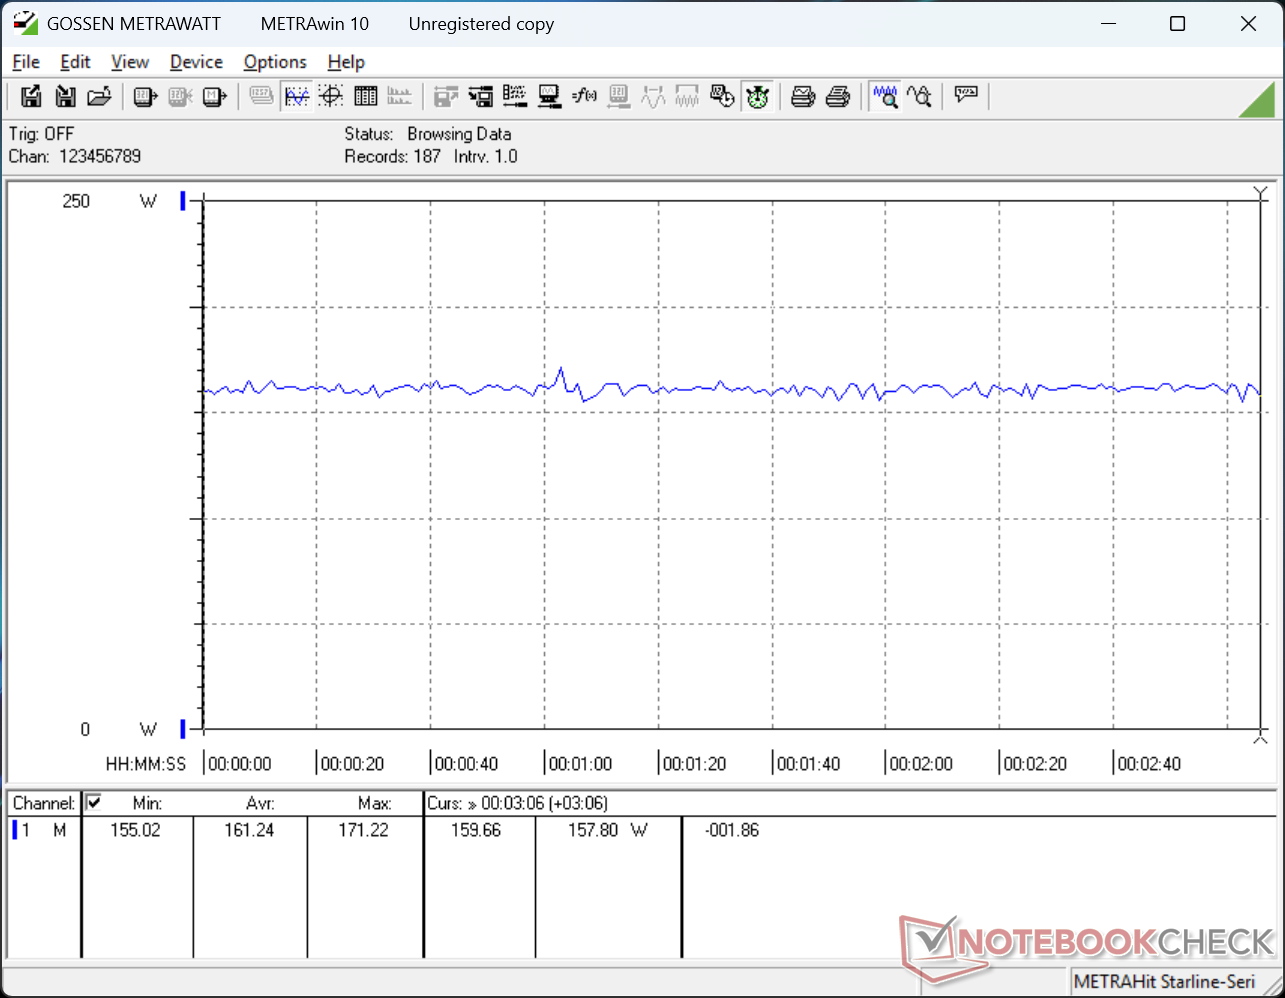
Consumo de energía
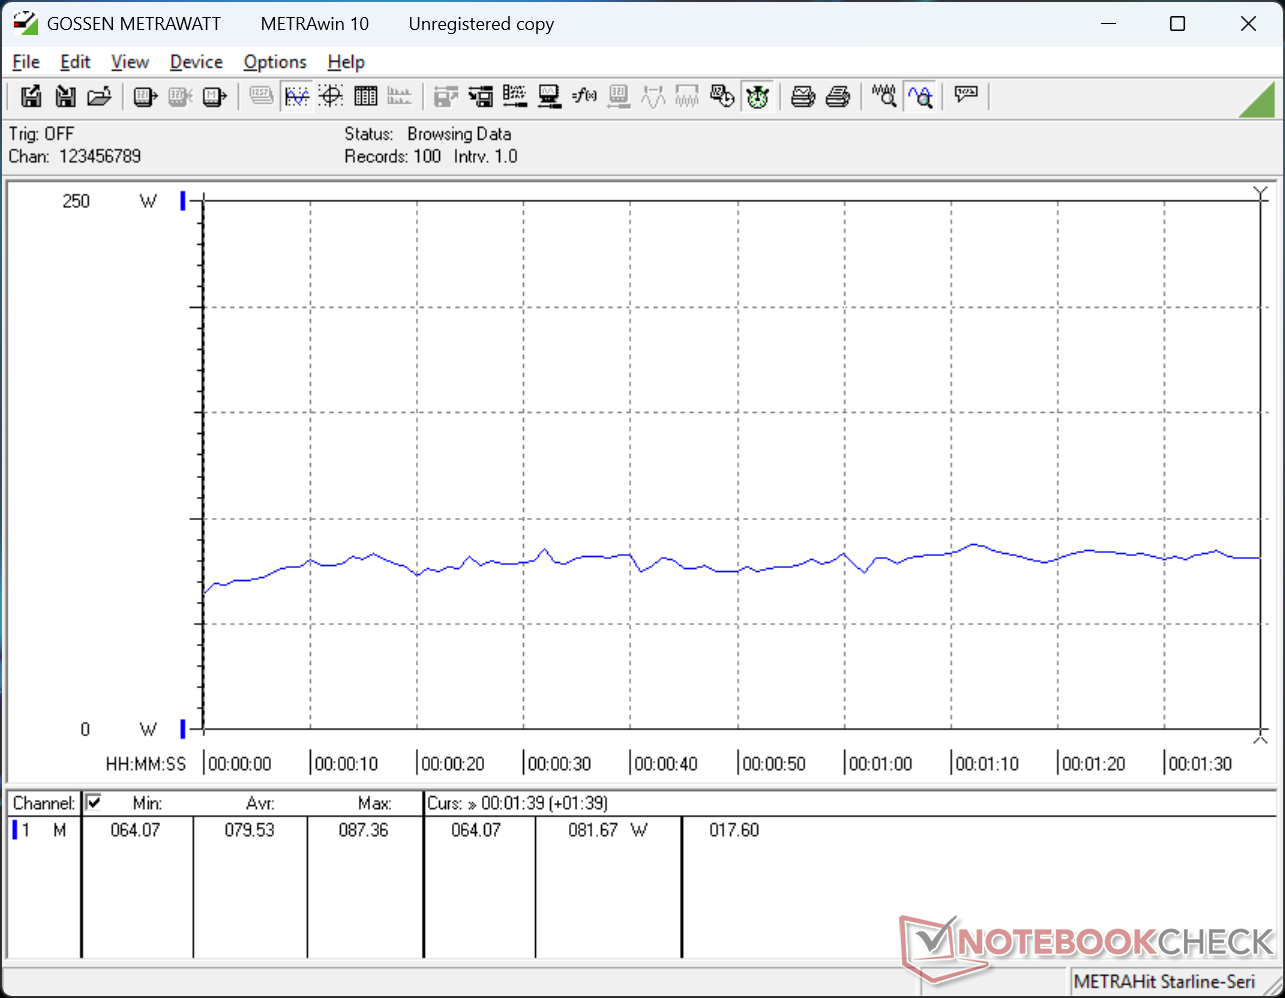
El sistema Lenovo es una máquina muy exigente con un alto mínimo de 15 W incluso cuando está en el ajuste de brillo más tenue con Optimus activo hasta 46 W si está en el ajuste más brillante con la dGPU activa. Al ejecutar cargas más altas como juegos, nuestra unidad consumiría tanta energía como el Asus ProArt P16 equipado con la CPU Ryzen AI 9 HX 370 más rápida y la GPU RTX 5070.
| Off / Standby | |
| Ocioso | |
| Carga |
|
Clave:
min: | |
| Lenovo Pro 9 16IPH11 Ultra 9 386H, GeForce RTX 5060 Laptop, SK hynix PVC10 HFS001TEM4X182N, Tandem OLED, 3200x2000, 16" | Lenovo Yoga Pro 9 16IAH10 RTX 5050 Ultra 9 285H, GeForce RTX 5050 Laptop, WD PC SN7100S SDFPMSL-1T00-1101, OLED, 2880x1800, 16" | Dell XPS 16 Core Ultra X7 358H Ultra X7 358H, Arc B390 Panther Lake iGPU, , OLED, 3200x2000, 16" | MSI Prestige 16 AI Evo B2HMG Ultra 9 285H, Arc 140T, Micron 2500 1TB MTFDKBA1T0QGN, IPS, 2560x1600, 16" | HP Omen Transcend 16-u1095ng i9-14900HX, GeForce RTX 4070 Laptop GPU, Kioxia XG8 KXG80ZNV1T02, OLED, 2560x1600, 16" | Asus ProArt P16 H7606WP Ryzen AI 9 HX 370, GeForce RTX 5070 Laptop, WD PC SN740 SDDPNQE-2T00, OLED, 2880x1800, 16" | |
|---|---|---|---|---|---|---|
| Power Consumption | 25% | 66% | 58% | 8% | 20% | |
| Idle Minimum * (Watt) | 15.1 | 6.8 55% | 4 74% | 4.4 71% | 10 34% | 9.9 34% |
| Idle Average * (Watt) | 30.4 | 20.1 34% | 4.4 86% | 9.2 70% | 18 41% | 13.6 55% |
| Idle Maximum * (Watt) | 46.2 | 21.6 53% | 10.2 78% | 9.5 79% | 32 31% | 14 70% |
| Load Average * (Watt) | 79.5 | 87.6 -10% | 44.2 44% | 66.9 16% | 128 -61% | 93.8 -18% |
| Cyberpunk 2077 ultra * (Watt) | 161.2 | 148.2 8% | 62.6 61% | 68.8 57% | 162.1 -1% | |
| Cyberpunk 2077 ultra external monitor * (Watt) | 160.7 | 147.9 8% | 62.4 61% | 67.4 58% | 158.3 1% | |
| Load Maximum * (Watt) | 231.4 | 173.5 25% | 94.6 59% | 102.9 56% | 242 -5% | 229 1% |
| Witcher 3 ultra * (Watt) | 148.4 |
* ... más pequeño es mejor
Consumo de energía Cyberpunk / Prueba de estrés
Consumo de energía Monitor externo
Duración de las pilas
Los tiempos de ejecución son relativamente cortos incluso cuando se configura en modo equilibrado con la iGPU activa. El relativamente grande paquete de baterías de 93 Wh sólo puede reunir 5,5 horas de navegación WLAN antes del apagado automático, lo que supone varias horas menos que muchos otros modelos multimedia, incluido el propio Yoga Pro 9i 16IAH G10 Aura de Lenovo.
(Actualización del 3 de mayo de 2026: se ha vuelto a probar la duración de la batería de navegación web Wi-Fi con el brillo de la pantalla ajustado a 150 nits, una frecuencia de actualización fija de 60 Hz y los gráficos Nvidia ajustados en Automático, obteniendo unos resultados que se acercan más al Yoga Pro 9i 16IAH G10 Aura del año pasado con ~10 horas. La puntuación final también se ha actualizado para reflejar la mayor autonomía)
| Lenovo Pro 9 16IPH11 Ultra 9 386H, GeForce RTX 5060 Laptop, 92.5 Wh | Lenovo Yoga Pro 9 16IAH10 RTX 5050 Ultra 9 285H, GeForce RTX 5050 Laptop, 84 Wh | Dell XPS 16 Core Ultra X7 358H Ultra X7 358H, Arc B390 Panther Lake iGPU, 70 Wh | MSI Prestige 16 AI Evo B2HMG Ultra 9 285H, Arc 140T, 99.9 Wh | HP Omen Transcend 16-u1095ng i9-14900HX, GeForce RTX 4070 Laptop GPU, 97 Wh | Asus ProArt P16 H7606WP Ryzen AI 9 HX 370, GeForce RTX 5070 Laptop, 90 Wh | |
|---|---|---|---|---|---|---|
| Duración de Batería | 8% | 4% | 67% | -51% | -7% | |
| WiFi v1.3 (h) | 9.9 | 10.7 8% | 10.3 4% | 16.5 67% | 4.9 -51% | 9.2 -7% |
| H.264 (h) | 20.8 | |||||
| Load (h) | 2.4 |
Valoración de Notebookcheck
Una máquina multimedia de gama alta con mucho rendimiento y una pantalla táctil OLED superbrillante, pero que carece de batería.
Lenovo Pro 9 16IPH11
- 05/03/2026 v8
Allen Ngo
 Total Sustainability Score:
 Competidores potenciales en comparación
Imagen | Modelo | Precio | Peso | Altura | Pantalla |
|---|---|---|---|---|---|
1. 91%  | Lenovo Pro 9 16IPH11 Intel Core Ultra 9 386H ⎘ NVIDIA GeForce RTX 5060 Laptop ⎘ 32 GB Memoría, 1024 GB SSD | Amazon: Precio de catálogo: 3100 USD | 1.9 kg | 17.3 mm | 16.00" 3200x2000 236 PPI Tandem OLED |
2. 88.8%  | Lenovo Yoga Pro 9 16IAH10 RTX 5050 Intel Core Ultra 9 285H ⎘ NVIDIA GeForce RTX 5050 Laptop ⎘ 32 GB Memoría, 1024 GB SSD | Amazon: Precio de catálogo: 1800 USD | 2 kg | 17.9 mm | 16.00" 2880x1800 212 PPI OLED |
3. 87.2%  | Dell XPS 16 Core Ultra X7 358H Intel Core Ultra X7 358H ⎘ Intel Arc B390 12 Xe3 Panther Lake iGPU ⎘ 32 GB Memoría | Amazon: 1. $1,977.99 Dell Premium 16 (Previously ... 2. $2,399.99 Dell Premium 16 (Previously ... 3. $2,595.99 Dell Premium 16 (XPS 16 2025... Precio de catálogo: 2350 USD | 1.7 kg | 14.62 mm | 16.00" 3200x2000 236 PPI OLED |
4. 82.8%  | MSI Prestige 16 AI Evo B2HMG Intel Core Ultra 9 285H ⎘ Intel Arc Graphics 140T ⎘ 32 GB Memoría, 1024 GB SSD | Amazon: 1. $1,149.49 msi Prestige 13 AI Evo Lapto... 2. $2,299.00 msi Prestige 16 Intel Evo AI... 3. $2,599.00 msi Prestige 16 AI Evo Busin... | 1.6 kg | 18.95 mm | 16.00" 2560x1600 189 PPI IPS |
5. 88.4% v7 (old)  | HP Omen Transcend 16-u1095ng Intel Core i9-14900HX ⎘ NVIDIA GeForce RTX 4070 Laptop GPU ⎘ 32 GB Memoría, 1024 GB SSD | Amazon: Precio de catálogo: 3000 EUR | 2.3 kg | 20 mm | 16.00" 2560x1600 189 PPI OLED |
6. 89.1%  | Asus ProArt P16 H7606WP AMD Ryzen AI 9 HX 370 ⎘ NVIDIA GeForce RTX 5070 Laptop ⎘ 64 GB Memoría, 2048 GB SSD | Amazon: 1. $4,599.00 HIDevolution [2025] ASUS Pro... 2. $4,924.00 HIDevolution [2025] ASUS Pro... 3. $5,649.00 HIDevolution [2025] ASUS Pro... Precio de catálogo: 3399€ | 1.8 kg | 17.3 mm | 16.00" 2880x1800 212 PPI OLED |
Transparencia
La selección de los dispositivos que se van a reseñar corre a cargo de nuestro equipo editorial. La muestra de prueba fue proporcionada al autor en calidad de préstamo por el fabricante o el minorista a los efectos de esta reseña. El prestamista no tuvo ninguna influencia en esta reseña, ni el fabricante recibió una copia de la misma antes de su publicación. No había ninguna obligación de publicar esta reseña. Como empresa de medios independiente, Notebookcheck no está sujeta a la autoridad de fabricantes, minoristas o editores.
Así es como prueba Notebookcheck
Cada año, Notebookcheck revisa de forma independiente cientos de portátiles y smartphones utilizando procedimientos estandarizados para asegurar que todos los resultados son comparables. Hemos desarrollado continuamente nuestros métodos de prueba durante unos 20 años y hemos establecido los estándares de la industria en el proceso. En nuestros laboratorios de pruebas, técnicos y editores experimentados utilizan equipos de medición de alta calidad. Estas pruebas implican un proceso de validación en varias fases. Nuestro complejo sistema de clasificación se basa en cientos de mediciones y puntos de referencia bien fundamentados, lo que mantiene la objetividad.
