Análisis para el Intel Core i3-1115G4 procesador
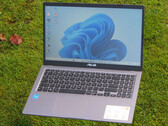
Análisis del Asus P1511CEA: Un portátil de oficina asequible para la escuela, la oficina y el ocio
El portátil de 15,6 pulgadas de Asus tiene un procesador Tiger Lake a bordo, apenas se calienta y se puede conseguir por unos 350 dólares. El sistema operativo es Windows 10 Pro (se puede actualizar a Windows 11).
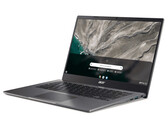
Intel Core i3-1115G4, UHD Graphics Xe G4 48EUs, 15.6", 1.8 kgAcer Chromebook 514 CB514-1WT en revisión: Un portátil de oficina silencioso con una buena duración de la batería
El portátil de 14 pulgadas de Acer ofrece una pantalla táctil mate (Full HD, IPS), poco ruido de funcionamiento, buena duración de la batería y Thunderbolt 4. La integración con Google Play Store permite el uso de innumerables apps de Android.
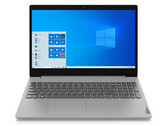
Intel Core i3-1115G4, UHD Graphics Xe G4 48EUs, 14", 1.4 kgAnálisis del Lenovo IdeaPad 3 15ITL05: Portátil para la oficina en casa por 399 euros
El Lenovo de 15,6 pulgadas tiene un procesador Tiger Lake a bordo, apenas se calienta y sólo emite poco ruido. El sistema operativo es Windows 10 Home en modo S (se puede actualizar a Windows 11). El precio de venta es de 399 euros.
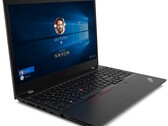
Intel Core i3-1115G4, UHD Graphics Xe G4 48EUs, 15.6", 1.7 kgAnálisis del Lenovo ThinkPad L15 G2: Un portátil de oficina por 600 euros
Con el ThinkPad L15 G2, puedes combinar la alta calidad de los portátiles empresariales de Lenovo con un hardware asequible. El resultado es un dispositivo potente y robusto por menos de 600 euros que demuestra lo que puede hacer en nuestra prueba.
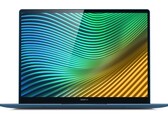
Intel Core i3-1115G4, UHD Graphics Xe G4 48EUs, 15.6", 1.9 kgAnálisis del portátil Realme Book (Slim): Rendimiento Tiger Lake Core i3 con una pantalla 3:2 2K
El Realme Book (Slim) es el intento de la compañía de crear un portátil polivalente capaz de realizar tareas básicas de oficina y multimedia. Tenemos la versión Core i3 del Realme Book (Slim) con nosotros, y lo probamos a fondo para ver si el debut del portátil de Realme merece su consideración.
Intel Core i3-1115G4, UHD Graphics Xe G4 48EUs, 14", 1.4 kgDell Inspiron 15 5000 5502: Intel UHD Graphics Xe G4 48EUs, 15.60", 1.6 kg
análise » Revisión del portátil Dell Inspiron 15 5502: Intel 11ª generación para las masas
HP 15s-fq2185ns: Intel UHD Graphics Xe G4 48EUs, 15.60", 1.7 kg
análise externo » HP 15s-fq2185ns
Medion Akoya E15423: Intel UHD Graphics Xe G4 48EUs, 15.60", 1.9 kg
análise externo » Medion Akoya E15423
Asus VivoBook 15 F1500EA, i3-1115G4: Intel UHD Graphics Xe G4 48EUs, 15.60", 1.8 kg
análise externo » Asus VivoBook 15 F1500EA, i3-1115G4
Asus Vivobook 14 F415EA, i3-1115G4: Intel UHD Graphics Xe G4 48EUs, 14.00", 1.6 kg
análise externo » Asus Vivobook 14 F415EA, i3-1115G4
HP 15s-fq2159ns: Intel UHD Graphics Xe G4 48EUs, 15.60", 1.7 kg
análise externo » HP 15s-fq2159ns
Asus Chromebook Vibe CX55 Flip CX5501FEA, i3-1115G4: Intel UHD Graphics Xe G4 48EUs, 15.60", 2 kg
análise externo » Asus Chromebook Vibe CX55 Flip CX5501FEA, i3-1115G4
Acer Chromebook 515 CB515-1W-36N4: Intel UHD Graphics Xe G4 48EUs, 15.60", 1.7 kg
análise externo » Acer Chromebook 515 CB515-1W-36N4
Asus Vivobook 15 F1500EA-EJ2535W: Intel UHD Graphics Xe G4 48EUs, 15.60", 1.8 kg
análise externo » Asus Vivobook 15 F1500EA-EJ2535W
Acer Aspire 5 A515-56-347N: Intel UHD Graphics Xe G4 48EUs, 15.60", 1.7 kg
análise externo » Acer Aspire 5 A515-56-347N
HP 250 G8, i3-1115G4: Intel UHD Graphics Xe G4 48EUs, 15.60", 1.7 kg
análise externo » HP 250 G8, i3-1115G4
Acer Aspire 5 A514-54G, i3-1115G4 MX350: NVIDIA GeForce MX350, 14.00", 1.7 kg
análise externo » Acer Aspire 5 A514-54G, i3-1115G4 MX350
Asus VivoBook 15 F515EA-BQ1359: Intel UHD Graphics Xe G4 48EUs, 15.60", 1.8 kg
análise externo » Asus VivoBook 15 F515EA-BQ1359
HP 15s-fq2148ns: Intel UHD Graphics Xe G4 48EUs, 15.60", 1.7 kg
análise externo » HP 15s-fq2148ns
Asus Vivobook 15 F1500EA-EJ2383W: Intel UHD Graphics Xe G4 48EUs, 15.60", 1.8 kg
análise externo » Asus Vivobook 15 F1500EA-EJ2383W
HP 15s-fq2182ns: Intel UHD Graphics Xe G4 48EUs, 15.60", 1.7 kg
análise externo » HP 15s-fq2182ns
Acer Aspire 3 A315-58-39L1: Intel UHD Graphics Xe G4 48EUs, 15.60", 1.7 kg
análise externo » Acer Aspire 3 A315-58-39L1
HP 15s-fq2172ns: Intel UHD Graphics Xe G4 48EUs, 15.60", 1.7 kg
análise externo » HP 15s-fq2172ns
Asus VivoBook 15 F515EA-BR1354W: Intel UHD Graphics Xe G4 48EUs, 15.60", 1.8 kg
análise externo » Asus VivoBook 15 F515EA-BR1354W
Asus VivoBook 15 F515EA-EJ1564W: Intel UHD Graphics Xe G4 48EUs, 15.60", 1.8 kg
análise externo » Asus VivoBook 15 F515EA-EJ1564W
Huawei Matebook D 14 2022, i3-1115G4: Intel UHD Graphics Xe G4 48EUs, 14.00", 1.4 kg
análise externo » Huawei Matebook D 14 2022, i3-1115G4
Lenovo IdeaPad Flex 5 CB 13ITL6-82M70037MH: Intel UHD Graphics Xe G4 48EUs, 13.30", 1.4 kg
análise externo » Lenovo IdeaPad Flex 5 CB 13ITL6-82M70037MH
MSI Modern 14 B11MOU-1226RU: Intel UHD Graphics Xe G4 48EUs, 14.00", 1.3 kg
análise externo » MSI Modern 14 B11MOU-1226RU
Asus Chromebook Flip CX5 CX5500FEA-E60122: Intel UHD Graphics Xe G4 48EUs, 15.60", 2 kg
análise externo » Asus Chromebook Flip CX5 CX5500FEA-E60122
HP 14s-dq2021ns: Intel UHD Graphics Xe G4 48EUs, 14.00", 1.5 kg
análise externo » HP 14s-dq2021ns
Acer Aspire 3 A315-58-36U6: Intel UHD Graphics Xe G4 48EUs, 15.60", 1.7 kg
análise externo » Acer Aspire 3 A315-58-36U6
HP 15s-fq2711nd: Intel UHD Graphics Xe G4 48EUs, 15.60", 1.7 kg
análise externo » HP 15s-fq2711nd
Acer TravelMate P2 TMP214-53-37AT: Intel UHD Graphics Xe G4 48EUs, 14.00", 1.6 kg
análise externo » Acer TravelMate P2 TMP214-53-37AT
Lenovo IdeaPad 3 14ITL6-82H701AYSP: Intel UHD Graphics Xe G4 48EUs, 14.00", 1.4 kg
análise externo » Lenovo IdeaPad 3 14ITL6-82H701AYSP
Acer Aspire 5 A515-56-32DK: Intel UHD Graphics Xe G4 48EUs, 15.60", 1.7 kg
análise externo » Acer Aspire 5 A515-56-32DK
Acer Enduro Urban N3 EUN314-51W-38DT: Intel UHD Graphics Xe G4 48EUs, 14.00", 1.9 kg
análise externo » Acer Enduro Urban N3 EUN314-51W-38DT
Asus Vivobook 15 F515EA-EJ1782W: Intel UHD Graphics Xe G4 48EUs, 15.60", 1.8 kg
análise externo » Asus Vivobook 15 F515EA-EJ1782W
HP 14s-dq2025ns: Intel UHD Graphics Xe G4 48EUs, 14.00", 1.5 kg
análise externo » HP 14s-dq2025ns
Acer Chromebook 514 CB514-1WT-36DP: Intel UHD Graphics Xe G4 48EUs, 14.00", 1.4 kg
análise externo » Acer Chromebook 514 CB514-1WT-36DP
Asus Vivobook 15 F515EA-BR1354T: Intel UHD Graphics Xe G4 48EUs, 15.60", 1.8 kg
análise externo » Asus Vivobook 15 F515EA-BR1354T
Acer Enduro Urban N3 EUN314-51W-32N2: Intel UHD Graphics Xe G4 48EUs, 14.00", 1.9 kg
análise externo » Acer Enduro Urban N3 EUN314-51W-32N2
HP 15s-du3577TU: Intel UHD Graphics Xe G4 48EUs, 15.60", 1.8 kg
análise externo » HP 15s-du3577TU
Asus VivoBook Flip 14 TP470EA-AS34T: Intel UHD Graphics Xe G4 48EUs, 14.00", 1.5 kg
análise externo » Asus VivoBook Flip 14 TP470EA-AS34T
HP 15s-fq2147ns: Intel UHD Graphics Xe G4 48EUs, 15.60", 1.7 kg
análise externo » HP 15s-fq2147ns
HP 15s-fq2095ns: Intel UHD Graphics Xe G4 48EUs, 15.60", 1.7 kg
análise externo » HP 15s-fq2095ns
Acer Swift 3 SF314-511-38C8: Intel UHD Graphics Xe G4 48EUs, 14.00", 1.2 kg
análise externo » Acer Swift 3 SF314-511-38C8
Acer Chromebook Spin 713 CP713-3W-35CR: Intel UHD Graphics Xe G4 48EUs, 13.50", 1.4 kg
análise externo » Acer Chromebook Spin 713 CP713-3W-35CR
Acer Spin 3 SP313-51N-33KW: Intel UHD Graphics Xe G4 48EUs, 13.30", 1.4 kg
análise externo » Acer Spin 3 SP313-51N-33KW
Asus Chromebook Flip CX5400FMA-AI0084: Intel UHD Graphics Xe G4 48EUs, 14.00", 2 kg
análise externo » Asus Chromebook Flip CX5400FMA-AI0084
Lenovo V15 G2 ITL-82KB0006GE: Intel UHD Graphics Xe G4 48EUs, 15.60", 1.7 kg
análise externo » Lenovo V15 G2 ITL-82KB0006GE
Acer TravelMate P2 TMP215-53-39BE: Intel UHD Graphics Xe G4 48EUs, 15.60", 1.8 kg
análise externo » Acer TravelMate P2 TMP215-53-39BE
Lenovo IdeaPad Flex 5 CB 13ITL6-82M70027GE: Intel UHD Graphics Xe G4 48EUs, 13.30", 1.6 kg
análise externo » Lenovo IdeaPad Flex 5 CB 13ITL6-82M70027GE
Asus Chromebook Flip CX5 CX5500FEA-E60050: Intel UHD Graphics Xe G4 48EUs, 15.60", 2 kg
análise externo » Asus Chromebook Flip CX5 CX5500FEA-E60050
Asus VivoBook 17 X712EA-WH34: Intel UHD Graphics Xe G4 48EUs, 17.30", 2.3 kg
análise externo » Asus VivoBook 17 X712EA-WH34
Dell Inspiron 15 3511, i3-1115G4: Intel UHD Graphics Xe G4 48EUs, 15.60", 1.7 kg
análise externo » Dell Inspiron 15 3511, i3-1115G4
Asus Vivobook 15 K513EQ, i5-1154G4: Intel UHD Graphics Xe G4 48EUs, 15.60", 1.6 kg
análise externo » Asus Vivobook 15 K513EQ, i5-1154G4
HP Chromebook x360 14c-cc0003na: Intel UHD Graphics Xe G4 48EUs, 14.00", 1.7 kg
análise externo » HP Chromebook x360 14c-cc0003na
Dell Inspiron 15 3501-XT8R1: Intel UHD Graphics Xe G4 48EUs, 15.60", 1.9 kg
análise externo » Dell Inspiron 15 3501-XT8R1
HP 14s-dq2002ns: Intel UHD Graphics Xe G4 48EUs, 14.00", 1.5 kg
análise externo » HP 14s-dq2002ns
Realme Book (Slim): Intel UHD Graphics Xe G4 48EUs, 14.00", 1.4 kg
análise externo » realme Book (Slim)
Asus ExpertBook B5 B5302FEA, 1115G4: Intel UHD Graphics Xe G4 48EUs, 14.00", 1.3 kg
análise externo » Asus ExpertBook B5 B5302FEA, 1115G4
HP 15s-fq2000np: Intel UHD Graphics Xe G4 48EUs, 15.60", 1.7 kg
análise externo » HP 15s-fq2000np
HP 15s-fq2940nd: Intel UHD Graphics Xe G4 48EUs, 15.60", 1.7 kg
análise externo » HP 15s-fq2940nd
HP 15s-fq2097ns: Intel UHD Graphics Xe G4 48EUs, 15.60", 1.7 kg
análise externo » HP 15s-fq2097ns
Gateway GWTN156-7BL: Intel UHD Graphics Xe G4 48EUs, 15.60", 1.9 kg
análise externo » Gateway GWTN156-7BL
Realme Book 14, i3-1115G4: Intel UHD Graphics Xe G4 48EUs, 14.00", 1.4 kg
análise externo » realme Book 14, i3-1115G4
Asus Chromebook Flip C536: Intel UHD Graphics Xe G4 48EUs, 15.60", 2 kg
análise externo » Asus Chromebook Flip C536
Xiaomi RedmiBook 15 e-Learning Edition : Intel UHD Graphics Xe G4 48EUs, 15.60", 1.8 kg
análise externo » Xiaomi RedmiBook 15 e-Learning Edition
Acer Aspire 5 A515-56-36UT: Intel UHD Graphics Xe G4 48EUs, 15.60", 1.7 kg
análise externo » Acer Aspire 5 A515-56-36UT
Acer Aspire 5 A515-56-363A: Intel UHD Graphics Xe G4 48EUs, 15.60", 1.7 kg
análise externo » Acer Aspire 5 A515-56-363A
Lenovo IdeaPad 3 14ITL6-82H700A3SP: Intel UHD Graphics Xe G4 48EUs, 14.00", 1.4 kg
análise externo » Lenovo IdeaPad 3 14ITL6-82H700A3SP
HP Pavilion 13-bb0730ng: Intel UHD Graphics Xe G4 48EUs, 13.30", 1.2 kg
análise externo » HP Pavilion 13-bb0730ng
Lenovo IdeaPad 3 15ITL6, i3-1115G4: Intel UHD Graphics Xe G4 48EUs, 15.60", 1.7 kg
análise externo » Lenovo IdeaPad 3 15ITL6, i3-1115G4
HP 15s-fq2040ns: Intel UHD Graphics Xe G4 48EUs, 15.60", 1.7 kg
análise externo » HP 15s-fq2040ns
HP 15s-fq2037ns: Intel UHD Graphics Xe G4 48EUs, 15.60", 1.7 kg
análise externo » HP 15s-fq2037ns
MSI Modern 14 B11MO-208: Intel UHD Graphics Xe G4 48EUs, 14.00", 1.3 kg
análise externo » MSI Modern 14 B11MO-208
Dell Vostro 15 5502, i3-1115G4: Intel UHD Graphics Xe G4 48EUs, 15.60", 1.6 kg
análise externo » Dell Vostro 15 5502, i3-1115G4
HP 14s-dq2011ns: Intel UHD Graphics Xe G4 48EUs, 14.00"
análise externo » HP 14s-dq2011ns
HP 15s-fq2084ns: Intel UHD Graphics Xe G4 48EUs, 15.60", 1.7 kg
análise externo » HP 15s-fq2084ns
HP Pavilion 15-eg0432ng: Intel UHD Graphics Xe G4 48EUs, 15.60", 1.8 kg
análise externo » HP Pavilion 15-eg0432ng
HP Pavilion 14-dv0511sa: Intel UHD Graphics Xe G4 48EUs, 14.00", 1.4 kg
análise externo » HP Pavilion 14-dv0511sa
HP 15s-fq2085ns: Intel UHD Graphics Xe G4 48EUs, 15.60", 1.7 kg
análise externo » HP 15s-fq2085ns
HP Pavilion x360 14-dw1000ns: Intel UHD Graphics Xe G4 48EUs, 14.00", 1.6 kg
análise externo » HP Pavilion x360 14-dw1000ns
Acer Aspire 5 A514-54-37JF: Intel UHD Graphics Xe G4 48EUs, 14.00", 1.5 kg
análise externo » Acer Aspire 5 A514-54-37JF
Asus VivoBook A415EA, i3-1115G4: Intel UHD Graphics Xe G4 48EUs, 14.00", 1.5 kg
análise externo » Asus VivoBook A415EA, i3-1115G4