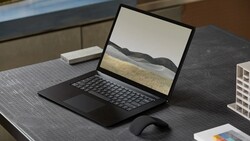
Review del Core i7 de 15 pulgadas de Microsoft Surface Laptop 3: Mejor con Ice Lake
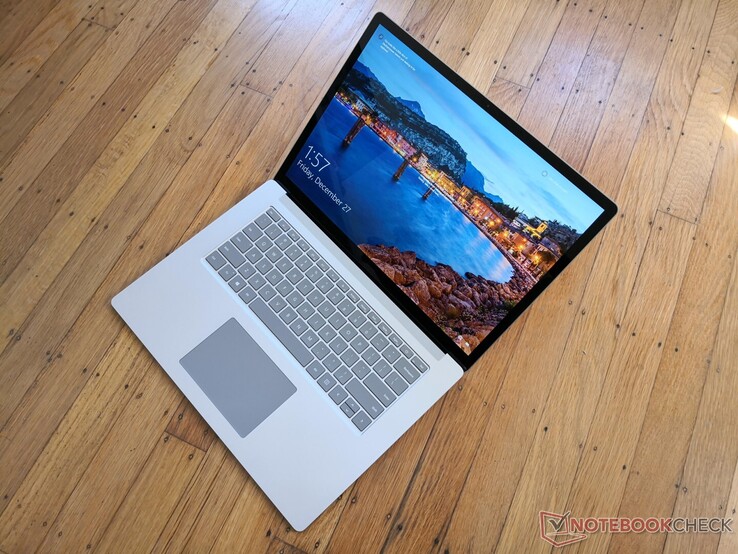
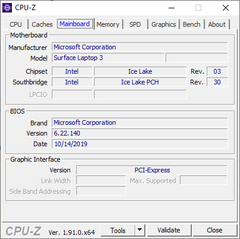
El Microsoft Surface Laptop 3 de 15 pulgadas consta de cuatro modelos principales en el siguiente orden, de menor a mayor precio: Ryzen 5 3580U, Core i5-1035G7, el Ryzen 7 3780U y el Core i7-1065G7. Recientemente hemos comprobado la configuración del AMD Ryzen 5 para ver lo que el Surface Laptop puede ofrecer en su nivel base. Hoy, vamos a revisar la versión del Intel Core i7 para ver qué puede hacer el Surface Laptop cuando se supone que está en su mejor momento.
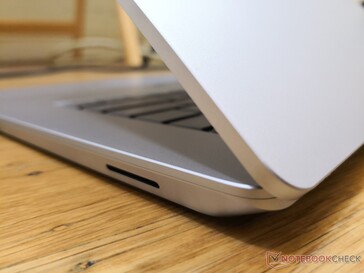
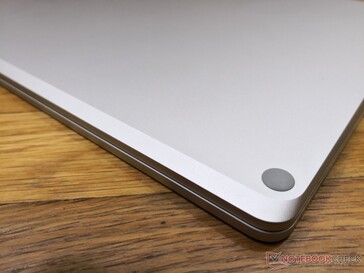
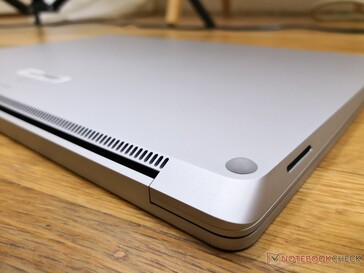
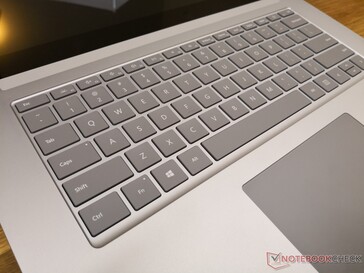
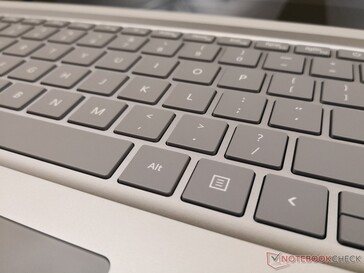
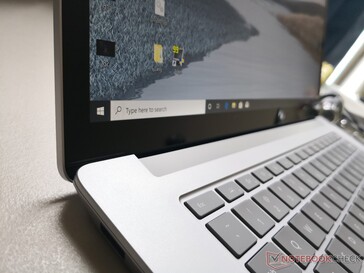
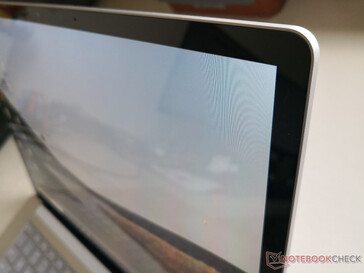
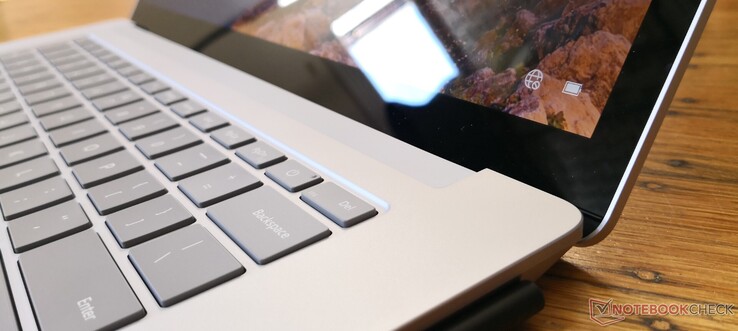
Recomendamos revisar nuestra revisión existente sobre la versión del Surface Laptop 3 Ryzen 5 para aprender más sobre el chasis, el teclado, la pantalla y otras características externas ya que estas características son idénticas entre los modelos de Intel y AMD. Esta revisión se centrará en las diferencias internas entre los modelos Intel Core i7 y AMD Ryzen 5, incluyendo la temperatura, el consumo de energía, la duración de la batería y, por supuesto, el rendimiento. Comparar nuestro modelo Core i7 con el Ryzen 7 habría dado resultados más interesantes, pero eso tendrá que esperar hasta una fecha futura en la que podamos tener en nuestras manos una unidad Ryzen 7.
Más reseñas de Microsoft:
Valoración | Fecha | Modelo | Peso | Altura | Tamaño | Resolución | Precio |
|---|---|---|---|---|---|---|---|
| 83.9 % v7 (old) | 12/2019 | Microsoft Surface Laptop 3 15 i7-1065G7 i7-1065G7, Iris Plus Graphics G7 (Ice Lake 64 EU) | 1.5 kg | 14.7 mm | 15.00" | 2496x1664 | |
| 86.3 % v7 (old) | 09/2019 | Dell XPS 15 7590 i5 iGPU FHD i5-9300H, UHD Graphics 630 | 1.9 kg | 17 mm | 15.60" | 1920x1080 | |
| 86 % v7 (old) | 12/2019 | Lenovo Yoga C940-15IRH i7-9750H, GeForce GTX 1650 Max-Q | 2 kg | 19.7 mm | 15.60" | 1920x1080 | |
| 83.9 % v7 (old) | 03/2019 | HP Spectre x360 15-df0126ng i7-8750H, GeForce GTX 1050 Ti Max-Q | 2.2 kg | 19.3 mm | 15.60" | 3840x2160 | |
| 89.7 % v7 (old) | 11/2019 | Apple MacBook Pro 16 2019 i9 5500M i9-9880H, Radeon Pro 5500M | 2 kg | 16.2 mm | 16.00" | 3072x1920 |
Top 10 Análisis
» Top 10 Portátiles Multimedia
» Top 10 Portátiles de Juego
» Top 10 Portátiles de Juego ligeros
» Top 10 Portátiles Asequibles de Oficina/Empresa
» Top 10 Portátiles de Juego Ligeros
» Top 10 Portátiles de Oficina/Empresa Premium
» Top 10 Estaciones de Trabajo
» Top 10 Subportátiles
» Top 10 Ultrabooks
» Top 10 Convertibles
» Top 10 Tablets
» Top 10 Tablets Windows
» Top 10 Tablets de menos de 250 Euros
» Top 10 Phablets (>5.5")
» Top 10 Smartphones
» Top 10 Smartphones (≤5")
» Top 10 Smartphones de menos de 300 Euros
» Top 10 Smartphones de menos de 120 Euros
» Top 10 Portátiles de menos de 1000 Euros
» Top 10 Portátiles de menos de 500 Euros
» Top 10 Portátiles de menos de 300 Euros
» Los Mejores Displays de Portátiles Analizados por Notebookcheck
Carcasa
Conectividad
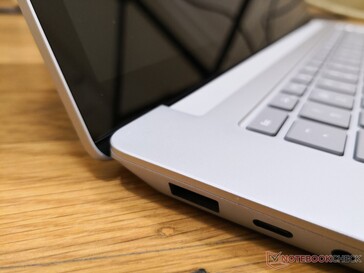
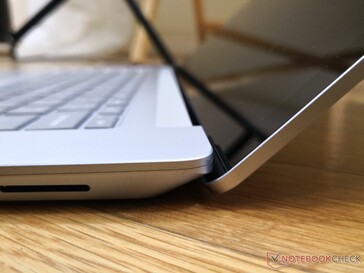
Las opciones de puerto están limitadas para un portátil de 15 pulgadas. El Huawei MateBook X Pro más pequeño, por ejemplo, viene con dos puertos USB Tipo C, Thunderbolt 3, y un puerto USB Tipo A, mientras que el portátil de Microsoft ofrece sólo un puerto USB Tipo C sin compatibilidad con Thunderbolt. Un lector SD habría sido apreciado especialmente por los creadores de contenido y los usuarios en movimiento. Tendrá que comprar el costoso Surface Dock si quiere aprovechar al máximo las capacidades de acoplamiento del Surface Laptop 3.
Comunicación
Las unidades de Intel vienen de serie con la unidad Intel AX201 para la conectividad Wi-Fi 6 (802.11ax), mientras que las unidades de AMD vienen con la unidad Atheros/Qualcomm QCA6174, más lenta, para la conectividad Wi-Fi 5 solamente. El primero puede ofrecer más del doble de la velocidad de transferencia del segundo si usted es uno de los pocos usuarios con un nuevo router Wi-Fi 6. De lo contrario, el rendimiento de la WLAN no se sentirá diferente durante las cargas del día a día, ya que la razón principal para poseer un portátil Wi-Fi 6 en este momento es sobre todo para la prueba de futuro. Tenga en cuenta que el AX201 es funcionalmente idéntico al AX200, excepto por algunos cambios de hardware bajo el capó.
Dispositivos de entrada
Display
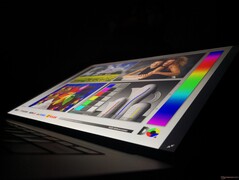
Microsoft utiliza el mismo panel Sharp LQ150P1JX51 IPS en todas sus versiones de Surface Laptop 3. Nuestras mediciones independientes muestran que las características clave de la pantalla son idénticas entre las opciones de Intel y AMD, incluyendo el brillo, el contraste, los colores, los tiempos de respuesta e incluso su frecuencia de modulación de ancho de pulso. El Apple MacBook Pro 16 y el Dell XPS 15 de la competencia tienen pantallas más brillantes para una mejor visibilidad en el exterior.
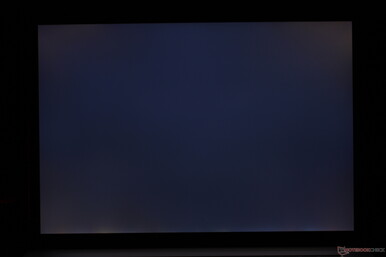
| |||||||||||||||||||||||||
iluminación: 78 %
Brillo con batería: 412.4 cd/m²
Contraste: 1178:1 (Negro: 0.35 cd/m²)
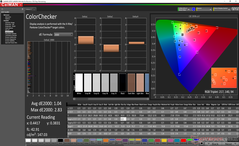
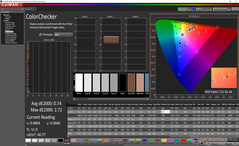
ΔE ColorChecker Calman: 1.04 | ∀{0.5-29.43 Ø4.76}
calibrated: 0.74
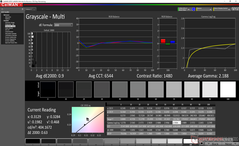
ΔE Greyscale Calman: 1.3 | ∀{0.09-98 Ø5}
98.4% sRGB (Argyll 1.6.3 3D)
62.4% AdobeRGB 1998 (Argyll 1.6.3 3D)
67.8% AdobeRGB 1998 (Argyll 3D)
98.4% sRGB (Argyll 3D)
65.6% Display P3 (Argyll 3D)
Gamma: 2.07
CCT: 6634 K
| Microsoft Surface Laptop 3 15 i7-1065G7 Sharp LQ150P1JX51, IPS, 15", 2496x1664 | Apple MacBook Pro 16 2019 i9 5500M APPA044, IPS, 16", 3072x1920 | Dell XPS 15 7590 i5 iGPU FHD LQ156M1, IPS, 15.6", 1920x1080 | Asus ZenBook 15 UX534FT-DB77 BOE NV156FHM-N63, IPS, 15.6", 1920x1080 | MSI Prestige 15 A10SC Sharp LQ156D1JW42, IPS, 15.6", 3840x2160 | Microsoft Surface Laptop 3 15 Ryzen 5 3580U Sharp LQ150P1JX51, IPS, 15", 2496x1664 | |
|---|---|---|---|---|---|---|
| Display | 1% | -5% | 22% | -1% | ||
| Display P3 Coverage (%) | 65.6 | 66.5 1% | 66.6 2% | 82 25% | 66.9 2% | |
| sRGB Coverage (%) | 98.4 | 98 0% | 87.7 -11% | 98.3 0% | 99.3 1% | |
| AdobeRGB 1998 Coverage (%) | 67.8 | 68.4 1% | 64.1 -5% | 96.2 42% | 63.7 -6% | |
| Response Times | 7% | 11% | 20% | -8% | 10% | |
| Response Time Grey 50% / Grey 80% * (ms) | 56 ? | 52.4 ? 6% | 52.8 ? 6% | 41.2 ? 26% | 60 ? -7% | 47.2 ? 16% |
| Response Time Black / White * (ms) | 38 ? | 34.9 ? 8% | 32 ? 16% | 33.2 ? 13% | 41.2 ? -8% | 36.8 ? 3% |
| PWM Frequency (Hz) | 21370 ? | 131700 | 1020 ? | 26040 ? | 21370 ? | |
| Screen | -14% | -34% | -132% | -65% | -31% | |
| Brightness middle (cd/m²) | 412.4 | 519 26% | 588 43% | 312.6 -24% | 464.5 13% | 416.9 1% |
| Brightness (cd/m²) | 374 | 477 28% | 555 48% | 290 -22% | 451 21% | 389 4% |
| Brightness Distribution (%) | 78 | 86 10% | 89 14% | 85 9% | 92 18% | 86 10% |
| Black Level * (cd/m²) | 0.35 | 0.39 -11% | 0.4 -14% | 0.31 11% | 0.5 -43% | 0.4 -14% |
| Contrast (:1) | 1178 | 1331 13% | 1470 25% | 1008 -14% | 929 -21% | 1042 -12% |
| Colorchecker dE 2000 * | 1.04 | 2.28 -119% | 2.5 -140% | 5.78 -456% | 3.36 -223% | 2.75 -164% |
| Colorchecker dE 2000 max. * | 2.83 | 6.54 -131% | 6.3 -123% | 8.86 -213% | 7.06 -149% | 6.64 -135% |
| Colorchecker dE 2000 calibrated * | 0.74 | 0.86 -16% | 0.6 19% | 3.78 -411% | 3.42 -362% | 0.71 4% |
| Greyscale dE 2000 * | 1.3 | 0.9 31% | 4.5 -246% | 5.4 -315% | 1.3 -0% | 1.8 -38% |
| Gamma | 2.07 106% | 2145 0% | 2.2 100% | 2.21 100% | 2.14 103% | 2.09 105% |
| CCT | 6634 98% | 6572 99% | 6836 95% | 7864 83% | 6596 99% | 6646 98% |
| Color Space (Percent of AdobeRGB 1998) (%) | 62.4 | 78 25% | 63.2 1% | 57.1 -8% | 84.8 36% | 63.4 2% |
| Color Space (Percent of sRGB) (%) | 98.4 | 98 0% | 87.4 -11% | 98.3 0% | 99.4 1% | |
| Media total (Programa/Opciones) | -4% /
-11% | -7% /
-22% | -39% /
-89% | -17% /
-41% | -7% /
-20% |
* ... más pequeño es mejor
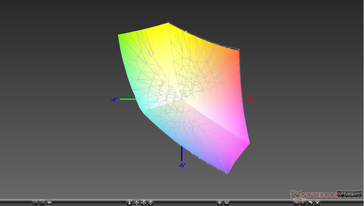
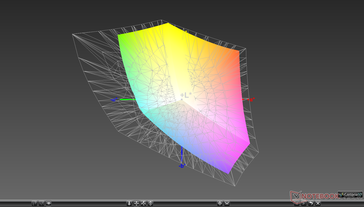
El espacio de color abarca sRGB y aproximadamente el 62 por ciento del estándar AdobeRGB. La cobertura completa de AdobeRGB no está disponible, a diferencia del XPS 15, Asus ZenBook Pro 15 o MSI Prestige 15.
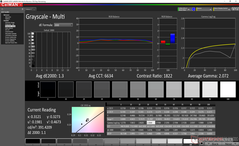
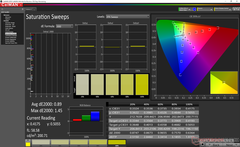
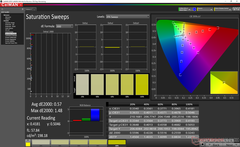
Nuestra unidad Intel viene mejor calibrada fuera de la caja cuando se compara con nuestra unidad Ryzen. Intel dice que no se realizó ninguna poscalibración en nuestra prueba para sugerir que ciertos SKUs de Surface Laptop 3 pueden venir mejor calibrados que otros. Los valores promedio de escala de grises y color DeltaE ya son bajos, con sólo 1,3 y 0,89, respectivamente. Calibrar la pantalla aún más nosotros mismos mejora estos valores sólo marginalmente.
Tiempos de respuesta del display
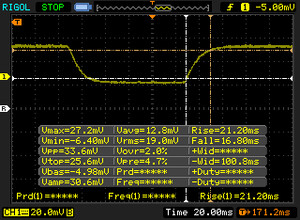
| ↔ Tiempo de respuesta de Negro a Blanco | ||
|---|---|---|
| 38 ms ... subida ↗ y bajada ↘ combinada | ↗ 21.2 ms subida | |
| ↘ 16.8 ms bajada | ||
| La pantalla mostró tiempos de respuesta lentos en nuestros tests y podría ser demasiado lenta para los jugones. En comparación, todos los dispositivos de prueba van de ##min### (mínimo) a 240 (máximo) ms. » 96 % de todos los dispositivos son mejores. Eso quiere decir que el tiempo de respuesta es peor que la media (20.1 ms) de todos los dispositivos testados. | ||
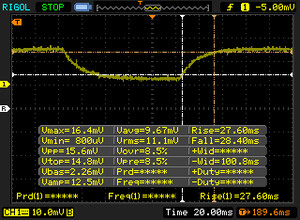
| ↔ Tiempo de respuesta 50% Gris a 80% Gris | ||
| 56 ms ... subida ↗ y bajada ↘ combinada | ↗ 27.6 ms subida | |
| ↘ 28.4 ms bajada | ||
| La pantalla mostró tiempos de respuesta lentos en nuestros tests y podría ser demasiado lenta para los jugones. En comparación, todos los dispositivos de prueba van de ##min### (mínimo) a 636 (máximo) ms. » 92 % de todos los dispositivos son mejores. Eso quiere decir que el tiempo de respuesta es peor que la media (31.5 ms) de todos los dispositivos testados. | ||
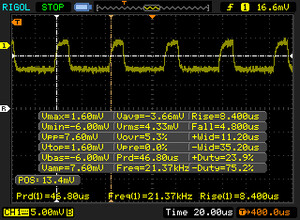
Parpadeo de Pantalla / PWM (Pulse-Width Modulation)
| Parpadeo de Pantalla / PWM detectado | 21370 Hz | ≤ 51 % de brillo | |
La retroiluminación del display parpadea a 21370 Hz (seguramente usa PWM - Pulse-Width Modulation) a un brillo del 51 % e inferior. Sobre este nivel de brillo no debería darse parpadeo / PWM. La frecuencia de 21370 Hz es bastante alta, por lo que la mayoría de gente sensible al parpadeo no debería ver parpadeo o tener fatiga visual. Comparación: 53 % de todos los dispositivos testados no usaron PWM para atenuar el display. Si se usó, medimos una media de 8036 (mínimo: 5 - máxmo: 343500) Hz. | |||
Rendimiento
El modelo Core i7-1065G7 se comercializa como la configuración Surface Laptop 3 más rápida de Microsoft. Compite directamente con el AMD Ryzen 7 3780U de la misma manera que el modelo Core i5-1035G7 compite con el Ryzen 5 3580U. Ten en cuenta que esta misma CPU Intel Ice Lake también se puede encontrar en la última Surface Pro 7. Aunque no juegues, la potencia gráfica extra del Iris Plus G7 integrado debería resultar útil para los editores gráficos, acelerando la codificación o decodificación de vídeo y el soporte de monitores externos a resoluciones más altas.
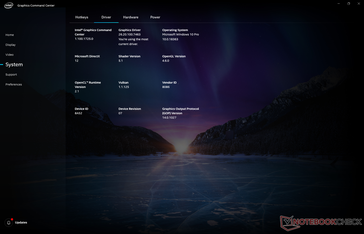
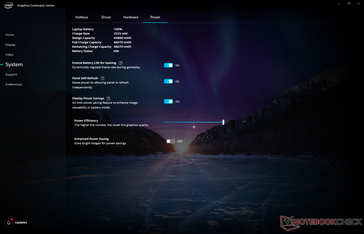
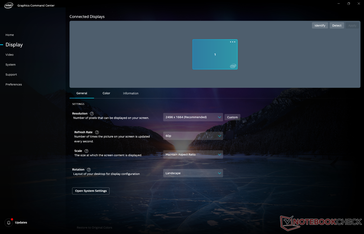
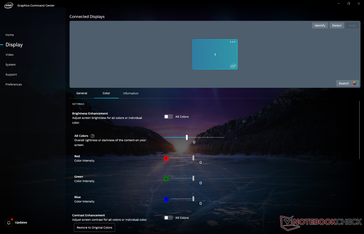
Nuestra unidad se envía con el software del Centro de comandos Intel preinstalado para reemplazar el antiguo Centro de control de gráficos Intel. La nueva aplicación ofrece más configuraciones visuales con una interfaz de usuario revisada. Se espera que las futuras laptops equipadas con gráficos Intel también se envíen con el Centro de control de gráficos.
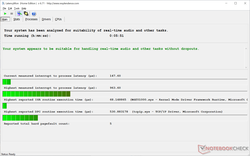
LatencyMon no muestra problemas recurrentes de latencia de DPC, independientemente de la Wi-Fi, a diferencia de lo que observamos en nuestra unidad Ryzen.
Procesador
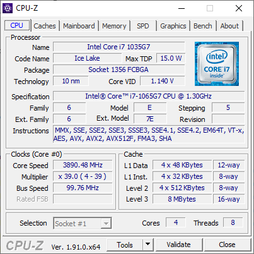
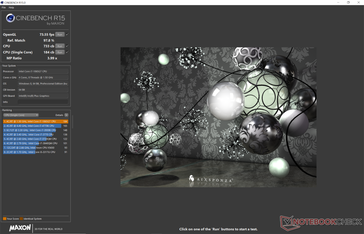
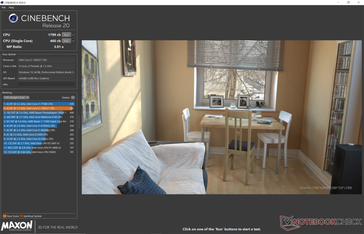
Como nuestro 9º núcleo i7-1065G7 entró en nuestra base de datos, estamos empezando a ver lo que el procesador es capaz de hacer. La implementación de Microsoft de la CPU de 25 W parece ser mejor que la de la mayoría, ya que su puntuación en el CineBench multihilo es un 11 por ciento más rápida que el promedio del i7-1065G7. Por lo tanto, el rendimiento bruto es un 16 por ciento más alto que el del Ryzen 5 3580U y dentro de unos pocos puntos porcentuales del Core i5-9300H.
La sostenibilidad del rendimiento es mejor de lo esperado, lo que explica las puntuaciones de referencia de la CPU, más altas que el promedio. Cuando se ejecuta CineBench R15 Multi-Thread en un bucle, por ejemplo, el rendimiento cae en sólo un 6 a 7 por ciento con el tiempo, en comparación con el 17 por ciento del Lenovo Yoga C940, equipado de manera similar. El rendimiento también es más estable cuando se encuentra en condiciones tan estresantes como se muestra en nuestro gráfico a continuación.
Otra ventaja sobre AMD es la aceleración de la IA basada en el hardware. El problema es que la mayoría de las aplicaciones e incluso el propio Windows todavía no han explotado la tecnología emergente, lo que significa que sus cargas de trabajo diarias probablemente no se beneficiarán de las capacidades de IA de Ice Lake, si es que lo hacen.
Vea nuestra página dedicada al Core i7-1065G7 para más información técnica y comparaciones de benchmarks.
rendimiento del sistema
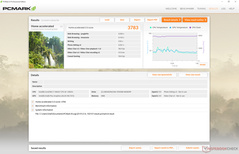
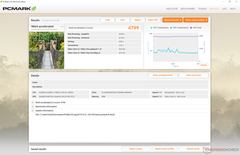
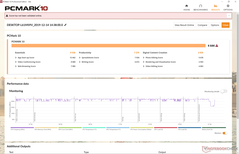
Las puntuaciones del PCMark son entre un 4 y un 21 por ciento más altas que las del Ryzen 5 SKU, dependiendo del punto de referencia. Su puntuación de Digital Creation, por ejemplo, es sólo un 4 por ciento más alta que la de AMD para sugerir que la diferencia de rendimiento en el mundo real entre Iris Plus y la serie Vega 8/9/10/11 no es tan amplia como Intel quiere que creas. Intel tiene su mayor ventaja en el benchmark PCMark Essentials que prueba cuán rápido y sin problemas el sistema puede realizar múltiples tareas entre la navegación web y el lanzamiento de aplicaciones. Es probable que el chipset de Intel esté mejor optimizado para este tipo de aplicaciones cotidianas.
No hemos experimentado ningún problema de software o hardware durante nuestro tiempo con la unidad de prueba.
| PCMark 8 Home Score Accelerated v2 | 3783 puntos | |
| PCMark 8 Work Score Accelerated v2 | 4799 puntos | |
| PCMark 10 Score | 4644 puntos | |
ayuda | ||
Dispositivos de almacenamiento
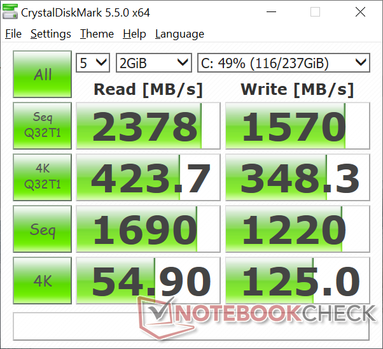
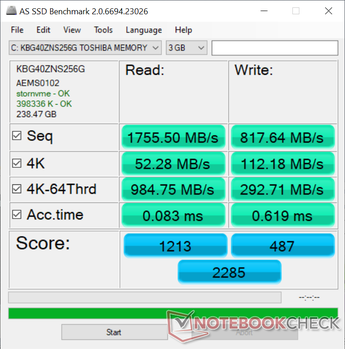
Curiosamente, nuestra unidad Intel viene con una SSD Toshiba KBG40ZNS256G NVMe de 256 GB, en contraste con la SK Hynix BC501 de 256 GB de nuestra unidad Ryzen 5, lo que sugiere que Microsoft está buscando varios proveedores para su serie Surface Laptop 3. Por lo tanto, es un juego de azar saber qué SSD acabará comprando.
La unidad Toshiba supera a la unidad SK Hynix. Las SSD de AS muestran unas velocidades de lectura y escritura secuenciales de 1755 MB/s y 818 MB/s, respectivamente, en comparación con los 1122 MB/s y 514 MB/s de nuestra unidad Ryzen 5. Aunque se trata de una mejora, las velocidades de transferencia son meramente medias si se comparan con las de las unidades SSD de Apple o SSD Lite-On, como las que se encuentran en el Apple MacBook Pro 16 o Razer Blade Stealth. Es decepcionante ver cómo Microsoft hace recortes aquí en su serie de portátiles de primera clase.
Consulte nuestra tabla de HDDs y SSDs para obtener más comparaciones de referencia.
| Microsoft Surface Laptop 3 15 i7-1065G7 Toshiba KBG40ZNS256G NVMe | Apple MacBook Pro 16 2019 i9 5500M Apple SSD AP1024 7171 | Asus ZenBook 15 UX534FT-DB77 Samsung SSD PM981 MZVLB1T0HALR | MSI Prestige 15 A10SC Samsung SSD PM981 MZVLB1T0HALR | Microsoft Surface Laptop 3 15 Ryzen 5 3580U SK hynix BC501 HFM256GDGTNG | Razer Blade Stealth 13, Core i7-1065G7 Lite-On CA3-8D512 | |
|---|---|---|---|---|---|---|
| AS SSD | 82% | 66% | 85% | -21% | 13% | |
| Seq Read (MB/s) | 1756 | 2531 44% | 1887 7% | 1274 -27% | 1122 -36% | 2666 52% |
| Seq Write (MB/s) | 818 | 2289 180% | 1432 75% | 1395 71% | 514 -37% | 1497 83% |
| 4K Read (MB/s) | 52.3 | 15.85 -70% | 52.3 0% | 50.3 -4% | 34.98 -33% | 53.7 3% |
| 4K Write (MB/s) | 112.2 | 39.88 -64% | 146 30% | 119.8 7% | 96.8 -14% | 133.7 19% |
| 4K-64 Read (MB/s) | 985 | 1267 29% | 969 -2% | 1599 62% | 492 -50% | 652 -34% |
| 4K-64 Write (MB/s) | 292.7 | 1749 498% | 1375 370% | 1455 397% | 339.9 16% | 272 -7% |
| Access Time Read * (ms) | 0.083 | 0.122 -47% | 0.034 59% | 0.044 47% | 0.056 33% | 0.075 10% |
| Access Time Write * (ms) | 0.619 | 0.095 85% | 0.075 88% | 0.092 85% | 0.11 82% | 0.032 95% |
| Score Read (Points) | 1213 | 1536 27% | 1210 0% | 1777 46% | 639 -47% | 972 -20% |
| Score Write (Points) | 487 | 2018 314% | 1664 242% | 1714 252% | 488 0% | 555 14% |
| Score Total (Points) | 2285 | 4317 89% | 3483 52% | 4411 93% | 1434 -37% | 1982 -13% |
| Copy ISO MB/s (MB/s) | 1192 | 1995 67% | 1375 15% | 2830 137% | 828 -31% | 1495 25% |
| Copy Program MB/s (MB/s) | 604 | 584 -3% | 468 -23% | 609 1% | 200.5 -67% | 458.4 -24% |
| Copy Game MB/s (MB/s) | 1136 | 1135 0% | 1287 13% | 1424 25% | 387.4 -66% | 964 -15% |
* ... más pequeño es mejor
Rendimiento de la GPU
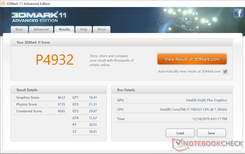
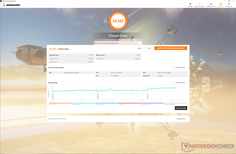
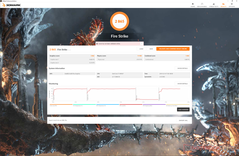
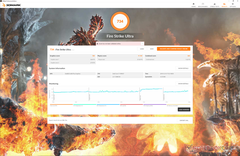
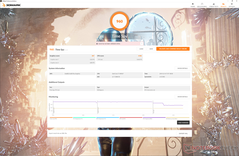
Las puntuaciones de 3DMark muestran que la GPU Iris Plus integrada está a la altura de la RX Vega 9 en el Ryzen 5 3580U en el peor de los casos o alrededor de un 15 por ciento más rápido en el mejor de los casos. Sin embargo, en los escenarios de juego del mundo real, la GPU de Intel tiene el potencial de ser mucho más rápida. Rocket League y F1 2019, por ejemplo, pueden ser hasta un 40 por ciento más rápidos que la RX Vega 9, mientras que otros juegos como Overwatch y Shadow of the Tomb Raider se encuentran muy cerca de las unidades de Intel y AMD. Si planeas jugar a títulos populares como Fortnite o Rocket League, entonces tal vez quieras considerar las opciones de Intel Iris Plus para maximizar el rendimiento. 3DMark sigue siendo un pobre indicaor del rendimiento en el mundo real de los juegos para las series de GPU integradas Intel Iris Plus y AMD RX Vega.
Se pueden encontrar benchmarks y comparaciones adicionales de juegos en nuestra página de Iris Plus G7.
| 3DMark 11 Performance | 4932 puntos | |
| 3DMark Ice Storm Standard Score | 67987 puntos | |
| 3DMark Cloud Gate Standard Score | 14347 puntos | |
| 3DMark Fire Strike Score | 2865 puntos | |
| 3DMark Time Spy Score | 960 puntos | |
ayuda | ||
| F1 2019 | |
| 1280x720 Ultra Low Preset | |
| Microsoft Surface Laptop 3 15 i7-1065G7 | |
| Microsoft Surface Laptop 3 15 Ryzen 5 3580U | |
| Medio Intel Iris Plus Graphics G7 (Ice Lake 64 EU) (35 - 63, n=5) | |
| 1920x1080 Medium Preset AA:T AF:16x | |
| Microsoft Surface Laptop 3 15 i7-1065G7 | |
| Medio Intel Iris Plus Graphics G7 (Ice Lake 64 EU) (22 - 31, n=5) | |
| Microsoft Surface Laptop 3 15 Ryzen 5 3580U | |
| 1920x1080 High Preset AA:T AF:16x | |
| Microsoft Surface Laptop 3 15 i7-1065G7 | |
| Medio Intel Iris Plus Graphics G7 (Ice Lake 64 EU) (19 - 27, n=4) | |
| Microsoft Surface Laptop 3 15 Ryzen 5 3580U | |
| 1920x1080 Ultra High Preset AA:T AF:16x | |
| Microsoft Surface Laptop 3 15 i7-1065G7 | |
| Medio Intel Iris Plus Graphics G7 (Ice Lake 64 EU) (12 - 21, n=4) | |
| Microsoft Surface Laptop 3 15 Ryzen 5 3580U | |
| Borderlands 3 | |
| 1280x720 Very Low Overall Quality (DX11) | |
| Microsoft Surface Laptop 3 15 i7-1065G7 | |
| Medio Intel Iris Plus Graphics G7 (Ice Lake 64 EU) (26.7 - 37, n=4) | |
| Microsoft Surface Laptop 3 15 Ryzen 5 3580U | |
| 1920x1080 Medium Overall Quality (DX11) | |
| Microsoft Surface Laptop 3 15 i7-1065G7 | |
| Medio Intel Iris Plus Graphics G7 (Ice Lake 64 EU) (11.7 - 16, n=3) | |
| Microsoft Surface Laptop 3 15 Ryzen 5 3580U | |
| 1920x1080 High Overall Quality (DX11) | |
| Microsoft Surface Laptop 3 15 i7-1065G7 | |
| Medio Intel Iris Plus Graphics G7 (Ice Lake 64 EU) (7.73 - 10, n=3) | |
| Microsoft Surface Laptop 3 15 Ryzen 5 3580U | |
| bajo | medio | alto | ultra | |
|---|---|---|---|---|
| StarCraft II: Heart of the Swarm (2013) | 358.2 | 100.9 | 64.8 | |
| BioShock Infinite (2013) | 109.6 | 73 | 61.5 | 22.6 |
| The Witcher 3 (2015) | 56.4 | 36.8 | 20.1 | 10 |
| Overwatch (2016) | 90 | 64 | 32.9 | 19.7 |
| Rocket League (2017) | 96.1 | 61 | 42.8 | |
| Shadow of the Tomb Raider (2018) | 31 | |||
| F1 2019 (2019) | 63 | 31 | 27 | 17 |
| Borderlands 3 (2019) | 37 | 16 | 10 |
Emisiones
ruido del sistema
Habíamos anticipado algunas diferencias en el ruido del ventilador entre las unidades de Intel y AMD, pero no es así. Nuestras mediciones de micrófono cuando se ejecuta 3DMark 06, Witcher 3, o Prime95, todas resultaron esencialmente en los mismos resultados que nuestra configuración de AMD el mes pasado. El Surface Laptop 3 es mayormente inaudible durante las cargas bajas a medias con el ruido del ventilador recogiendo notablemente sólo cuando se ejecutan cargas más altas como los juegos durante períodos prolongados.
Nuestra unidad de prueba muestra un ligero quejido de la bobina al colocar un oído cerca de las teclas del teclado. El ruido electrónico es lo suficientemente pequeño como para no ser un problema.
| Microsoft Surface Laptop 3 15 i7-1065G7 Iris Plus Graphics G7 (Ice Lake 64 EU), i7-1065G7, Toshiba KBG40ZNS256G NVMe | Apple MacBook Pro 16 2019 i9 5500M Radeon Pro 5500M, i9-9880H, Apple SSD AP1024 7171 | Dell XPS 15 7590 i5 iGPU FHD UHD Graphics 630, i5-9300H, Toshiba XG6 KXG60ZNV512G | Asus ZenBook 15 UX534FT-DB77 GeForce GTX 1650 Max-Q, i7-8565U, Samsung SSD PM981 MZVLB1T0HALR | Razer Blade Stealth i7-8565U GeForce MX150, i7-8565U, Lite-On CA3-8D256-Q11 | Microsoft Surface Laptop 3 15 Ryzen 5 3580U Vega 9, R5 3580U, SK hynix BC501 HFM256GDGTNG | |
|---|---|---|---|---|---|---|
| Noise | -13% | -2% | -2% | -8% | 2% | |
| apagado / medio ambiente * (dB) | 28.5 | 29.8 -5% | 29.3 -3% | 28.4 -0% | 28.4 -0% | 28 2% |
| Idle Minimum * (dB) | 28.5 | 29.9 -5% | 29.3 -3% | 28.4 -0% | 28.5 -0% | 28 2% |
| Idle Average * (dB) | 28.5 | 29.9 -5% | 29.3 -3% | 28.4 -0% | 29 -2% | 28 2% |
| Idle Maximum * (dB) | 28.7 | 29.9 -4% | 29.8 -4% | 28.4 1% | 29.1 -1% | 28 2% |
| Load Average * (dB) | 30 | 43 -43% | 32.4 -8% | 33.9 -13% | 42.8 -43% | 29.2 3% |
| Witcher 3 ultra * (dB) | 39.2 | 45.4 -16% | 39.8 -2% | 41.4 -6% | 39 1% | |
| Load Maximum * (dB) | 41.2 | 46.1 -12% | 37.2 10% | 40.2 2% | 41.6 -1% | 41.4 -0% |
* ... más pequeño es mejor
Ruido
| Ocioso |
| 28.5 / 28.5 / 28.7 dB(A) |
| Carga |
| 30 / 41.2 dB(A) |
 | ||
30 dB silencioso 40 dB(A) audible 50 dB(A) ruidosamente alto |
||
min: | ||
Temperatura
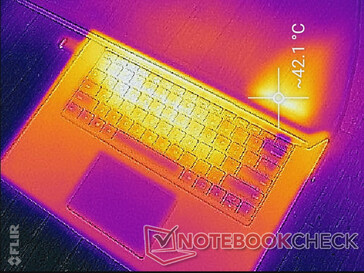
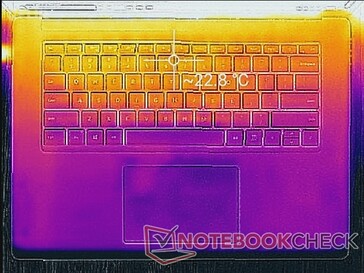
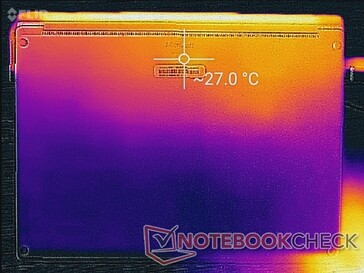
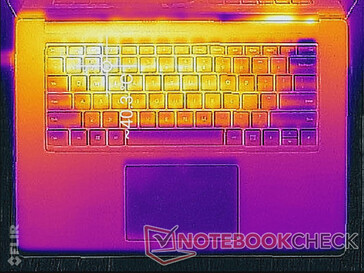
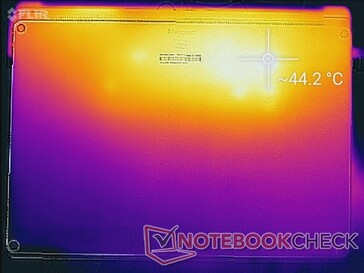
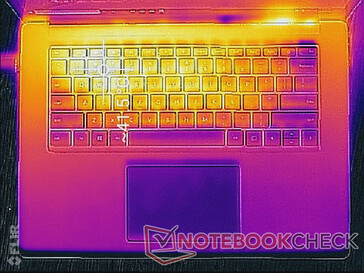
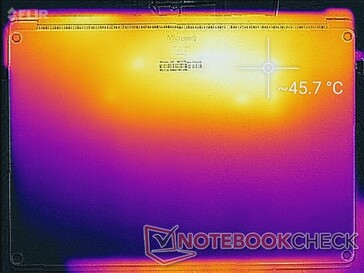
No hay grandes diferencias en el desarrollo de la temperatura de la superficie entre las unidades de Intel y AMD, a pesar de las diferencias de rendimiento. La ejecución de ambos Prime95 y FurMark simultáneamente resulta en puntos calientes de 41 C a 46 C en el Intel comparado con 42 C a 50 C en el AMD. Prepárate para teclas WASD muy calientes cuando juegues o corras cargas altas en contraste con la mayoría de los portátiles para juegos.
La falta de rejillas de ventilación en el panel inferior significa que puedes usar el portátil en tu regazo sin bloquear el flujo de aire. Por otro lado, la mitad trasera del portátil estará más caliente de lo habitual.
(±) La temperatura máxima en la parte superior es de 41.8 °C / 107 F, frente a la media de 34.3 °C / 94 F, que oscila entre 21.2 y 62.5 °C para la clase Office.
(-) El fondo se calienta hasta un máximo de 45.6 °C / 114 F, frente a la media de 36.8 °C / 98 F
(+) En reposo, la temperatura media de la parte superior es de 21.6 °C / 71# F, frente a la media del dispositivo de 29.5 °C / 85 F.
(±) Jugando a The Witcher 3, la temperatura media de la parte superior es de 32.2 °C / 90 F, frente a la media del dispositivo de 29.5 °C / 85 F.
(+) El reposamanos y el panel táctil están a una temperatura inferior a la de la piel, con un máximo de 29 °C / 84.2 F y, por tanto, son fríos al tacto.
(±) La temperatura media de la zona del reposamanos de dispositivos similares fue de 27.5 °C / 81.5 F (-1.5 °C / -2.7 F).
Prueba de esfuerzo
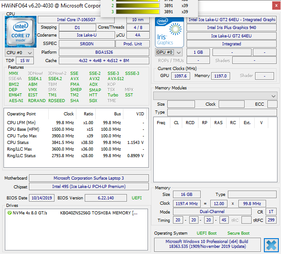
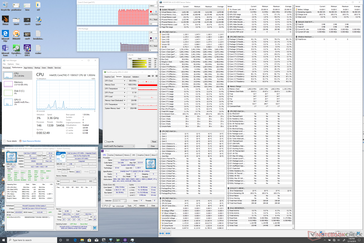
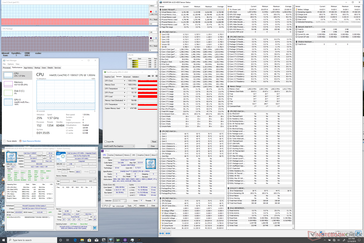
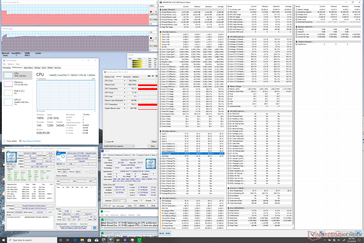
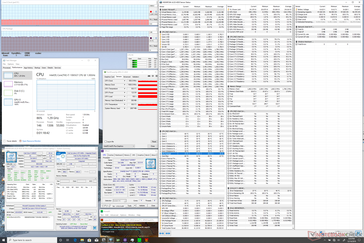
Enfatizamos el sistema con cargas sintéticas para identificar cualquier problema potencial de estrangulamiento o estabilidad. Cuando se ejecuta Prime95, las velocidades de reloj de la CPU se pueden observar funcionando a 3,5 GHz durante los primeros 20 segundos más o menos hasta alcanzar un techo de temperatura del núcleo de 85 C. A partir de entonces, las velocidades de reloj caen al rango de 2,6 - 2,7 GHz para mantener una temperatura del núcleo más fría de 75 C. Tanto las velocidades de reloj (2,7 GHz vs. 2,4 GHz) como la temperatura del núcleo (77 C vs. 66 C Tctl/Tdie) se estabilizan en valores más altos en el Core i7 cuando se comparan con el modelo Ryzen 5 3580U. Ten en cuenta que HWiNFO reporta las temperaturas del núcleo de forma diferente entre las CPUs de Intel y AMD, por lo que estas diferencias de temperatura pueden no ser directamente comparables aquí.
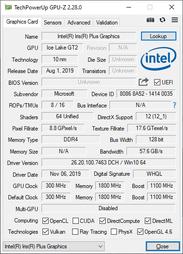
Ejecutar Witcher 3 es más representativo de las exigentes cargas del mundo real. Tanto la velocidad de reloj de la GPU como la temperatura del núcleo son de nuevo más altas en nuestro SKU de Intel cuando se comparan con el Ryzen 5 (1050 MHz vs. 800 MHz y 73 C vs. 58 C) según la GPU-Z.
El funcionamiento con energía de la batería no limitará el rendimiento, lo que significa que los usuarios pueden obtener el rendimiento completo del sistema si están lejos de un enchufe de CA. Un Fire Strike ejecutado con baterías devuelve una puntuación en física y gráficos de 1.228 y 3.060 puntos, respectivamente, en comparación con los 1.959 y 3.062 puntos obtenidos con la red eléctrica.
| CPU Clock (GHz) | GPU Clock (MHz) | Average CPU Temperature (°C) | |
| System Idle | -- | -- | 34 |
| Prime95 Stress | 2.6 - 2.7 | -- | 77 |
| Prime95 + FurMark Stress | 1.3 | 850 | 71 |
| Witcher 3 Stress | 1.6 | 1050 | 73 |
Altavoces

Microsoft Surface Laptop 3 15 i7-1065G7 análisis de audio
(±) | la sonoridad del altavoz es media pero buena (80.5 dB)
Graves 100 - 315 Hz
(±) | lubina reducida - en promedio 5.3% inferior a la mediana
(±) | la linealidad de los graves es media (10.3% delta a frecuencia anterior)
Medios 400 - 2000 Hz
(+) | medios equilibrados - a sólo 2.7% de la mediana
(+) | los medios son lineales (6.7% delta a la frecuencia anterior)
Altos 2 - 16 kHz
(+) | máximos equilibrados - a sólo 2.7% de la mediana
(±) | la linealidad de los máximos es media (8.5% delta a frecuencia anterior)
Total 100 - 16.000 Hz
(+) | el sonido global es lineal (11.7% de diferencia con la mediana)
En comparación con la misma clase
» 3% de todos los dispositivos probados de esta clase eran mejores, 2% similares, 95% peores
» El mejor tuvo un delta de 7%, la media fue 21%, el peor fue ###max##%
En comparación con todos los dispositivos probados
» 8% de todos los dispositivos probados eran mejores, 2% similares, 90% peores
» El mejor tuvo un delta de 4%, la media fue 24%, el peor fue ###max##%
Apple MacBook 12 (Early 2016) 1.1 GHz análisis de audio
(+) | los altavoces pueden reproducir a un volumen relativamente alto (#83.6 dB)
Graves 100 - 315 Hz
(±) | lubina reducida - en promedio 11.3% inferior a la mediana
(±) | la linealidad de los graves es media (14.2% delta a frecuencia anterior)
Medios 400 - 2000 Hz
(+) | medios equilibrados - a sólo 2.4% de la mediana
(+) | los medios son lineales (5.5% delta a la frecuencia anterior)
Altos 2 - 16 kHz
(+) | máximos equilibrados - a sólo 2% de la mediana
(+) | los máximos son lineales (4.5% delta a la frecuencia anterior)
Total 100 - 16.000 Hz
(+) | el sonido global es lineal (10.2% de diferencia con la mediana)
En comparación con la misma clase
» 7% de todos los dispositivos probados de esta clase eran mejores, 2% similares, 91% peores
» El mejor tuvo un delta de 5%, la media fue 18%, el peor fue ###max##%
En comparación con todos los dispositivos probados
» 4% de todos los dispositivos probados eran mejores, 1% similares, 94% peores
» El mejor tuvo un delta de 4%, la media fue 24%, el peor fue ###max##%
Gestión de la energía
Power Consumption
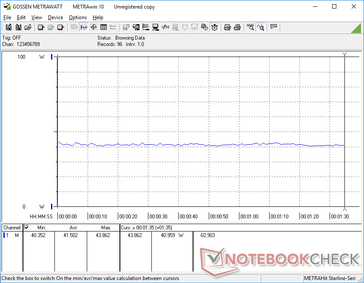
El ralentí en el escritorio exige entre 4 W y 8 W en comparación con 3 W y 7 W en nuestro modelo Ryzen 5. Sin embargo, sospechamos que las diferencias en la actividad de fondo son probablemente responsables de la discrepancia, especialmente en estas bajas tasas. Las cifras de consumo de energía más interesantes se dan cuando se juega, ya que el portátil Intel consume un poco menos de 42 W de media en comparación con los 45 W del Ryzen 5, a pesar de que el portátil Intel ofrece un mejor rendimiento de juego en general. En otras palabras, Intel tiene un rendimiento por vatio superior al de AMD.
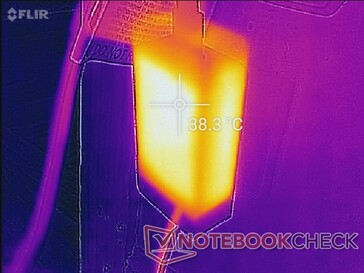
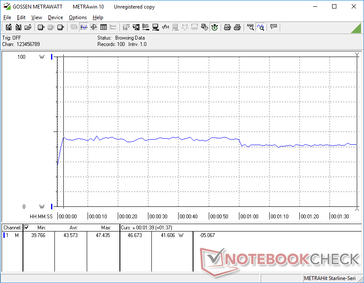
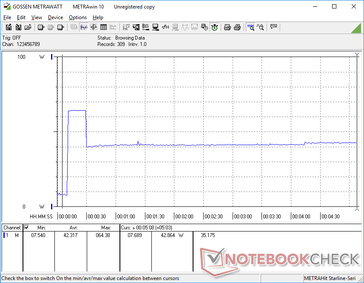
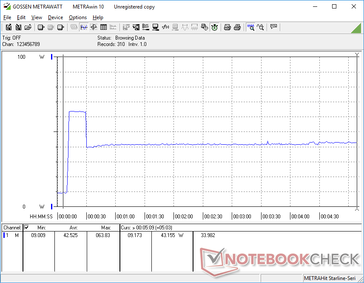
Podemos registrar un consumo máximo de 64,4 W del pequeño (~9 x 5 x 2,5 cm) adaptador de CA de 65 W cuando se ejecutan cargas Prime95 y FurMark. Sin embargo, esto sólo dura unos 20 segundos antes de que el consumo caiga y se estabilice en 43 W debido a razones térmicas.
| Off / Standby | |
| Ocioso | |
| Carga |
|
Clave:
min: | |
| Microsoft Surface Laptop 3 15 i7-1065G7 i7-1065G7, Iris Plus Graphics G7 (Ice Lake 64 EU), Toshiba KBG40ZNS256G NVMe, IPS, 2496x1664, 15" | Dell XPS 15 7590 i5 iGPU FHD i5-9300H, UHD Graphics 630, Toshiba XG6 KXG60ZNV512G, IPS, 1920x1080, 15.6" | Asus ZenBook 15 UX534FT-DB77 i7-8565U, GeForce GTX 1650 Max-Q, Samsung SSD PM981 MZVLB1T0HALR, IPS, 1920x1080, 15.6" | MSI Prestige 15 A10SC i7-10710U, GeForce GTX 1650 Max-Q, Samsung SSD PM981 MZVLB1T0HALR, IPS, 3840x2160, 15.6" | Razer Blade Stealth i7-8565U i7-8565U, GeForce MX150, Lite-On CA3-8D256-Q11, IPS, 1920x1080, 13.3" | Microsoft Surface Laptop 3 15 Ryzen 5 3580U R5 3580U, Vega 9, SK hynix BC501 HFM256GDGTNG, IPS, 2496x1664, 15" | |
|---|---|---|---|---|---|---|
| Power Consumption | -17% | -74% | -68% | -28% | 10% | |
| Idle Minimum * (Watt) | 4.4 | 3.79 14% | 5 -14% | 6.1 -39% | 6.7 -52% | 3.3 25% |
| Idle Average * (Watt) | 8.3 | 6.9 17% | 13.2 -59% | 13.2 -59% | 8.6 -4% | 7.1 14% |
| Idle Maximum * (Watt) | 8.6 | 9.2 -7% | 24 -179% | 19.2 -123% | 9.4 -9% | 7.2 16% |
| Load Average * (Watt) | 43.6 | 62 -42% | 70 -61% | 75 -72% | 64.1 -47% | 44.8 -3% |
| Witcher 3 ultra * (Watt) | 41.5 | 63.3 -53% | 74 -78% | 63.7 -53% | 45.1 -9% | |
| Load Maximum * (Watt) | 64.4 | 108 -68% | 114 -77% | 89.7 -39% | 64.1 -0% | 53 18% |
* ... más pequeño es mejor
Duración de la batería
La capacidad de la batería es pequeña para un portátil de 15 pulgadas a sólo 45 Wh. Incluso el Huawei MateBook X Pro, por ejemplo, viene con una batería de mayor capacidad de 57 Wh. Los tiempos de funcionamiento son todavía respetables, con poco más de 8 horas de uso de WLAN en el mundo real para ser casi una hora más corto que el modelo más lento Ryzen 5.
Un hallazgo digno de mención es que si se deja en reposo en el escritorio con la configuración y el nivel de brillo más bajos posibles, durará unas 35 horas antes de tener que recargarse. Aunque es un escenario poco realista, muestra que los usuarios pueden estirar la batería durante más tiempo de lo habitual si es necesario.
La recarga desde la capacidad vacía a la plena capacidad toma alrededor de 2 horas. La recarga a través de USB Tipo-C con nuestros adaptadores de CA de 130 W Dell o 65 W Lenovo también funciona.
| Microsoft Surface Laptop 3 15 i7-1065G7 i7-1065G7, Iris Plus Graphics G7 (Ice Lake 64 EU), 45 Wh | Apple MacBook Pro 16 2019 i9 5500M i9-9880H, Radeon Pro 5500M, 99.8 Wh | Dell XPS 15 7590 i5 iGPU FHD i5-9300H, UHD Graphics 630, 97 Wh | Lenovo Yoga C940-15IRH i7-9750H, GeForce GTX 1650 Max-Q, 69 Wh | HP Spectre x360 15-df0126ng i7-8750H, GeForce GTX 1050 Ti Max-Q, 84 Wh | Asus ZenBook 15 UX534FT-DB77 i7-8565U, GeForce GTX 1650 Max-Q, 71 Wh | MSI Prestige 15 A10SC i7-10710U, GeForce GTX 1650 Max-Q, 82 Wh | Microsoft Surface Laptop 3 15 Ryzen 5 3580U R5 3580U, Vega 9, 45 Wh | |
|---|---|---|---|---|---|---|---|---|
| Duración de Batería | -1% | 31% | -26% | -6% | 5% | -14% | -16% | |
| Reader / Idle (h) | 35 | 18.2 -48% | 18.8 -46% | 21.5 -39% | 19.1 -45% | 18.7 -47% | ||
| WiFi v1.3 (h) | 8.2 | 12 46% | 14.1 72% | 9.7 18% | 8.8 7% | 8.4 2% | 7.6 -7% | 9.1 11% |
| Load (h) | 1.9 | 1 -47% | 1.7 -11% | 1 -47% | 2.3 21% | 2.9 53% | 2.1 11% | 1.7 -11% |
| Witcher 3 ultra (h) | 0.9 |
Pro
Contra
Veredicto
Las principales ventajas de nuestro modelo Core i7 en comparación con el modelo Ryzen 5 incluyen la compatibilidad con Wi-Fi 6, un rendimiento de almacenamiento más rápido, un rendimiento de la CPU más rápido, aceleración de la IA integrada, un rendimiento de juego más rápido y un mayor rendimiento por vatio. Otros aspectos como la pantalla, la duración de la batería WLAN, la temperatura de la superficie y el ruido del ventilador son iguales o casi idénticos.
Aunque no es sorprendente que nuestro modelo Core i7 sea capaz de superar a nuestro modelo Ryzen 5 más barato, es el margen lo que nos interesa más. El rendimiento bruto del CPU, por ejemplo, no es mucho más rápido, lo que significa que no deberías elegir Intel en lugar de AMD basándote únicamente en la potencia del procesador. El rendimiento de los juegos también es en gran medida inconsistente, ya que algunos juegos se ejecutan mejor con Intel y otros están muy igualados. Mientras tanto, la aceleración de la IA sigue siendo una novedad para la mayoría de los usuarios de oficina en el momento de escribir este artículo, ya que no tiene una influencia directa en las tareas cotidianas. Intel puede realmente aprovechar sus ventajas sobre AMD en el campo de la IA, pero eso no significará mucho para los consumidores si las aplicaciones no están optimizadas para explotar la aceleración de la IA en primer lugar.
En resumen, las diferencias de rendimiento diario entre las versiones de Surface Laptop 3 Core i7 y Ryzen 5 son menores de lo que se esperaba, especialmente si se tiene en cuenta el sobreprecio que Microsoft está cobrando por sus modelos de Intel. Si usted es un usuario de energía que quiere lo mejor que el Surface Laptop puede ofrecer, entonces las opciones de Intel son una obviedad. De lo contrario, le resultará difícil diferenciar entre un Intel y un AMD Surface Laptop 3 si su carga de trabajo consiste principalmente en procesamiento de texto, navegación web o transmisión de video.
Microsoft Surface Laptop 3 15 i7-1065G7
- 02/23/2020 v7 (old)
Allen Ngo


