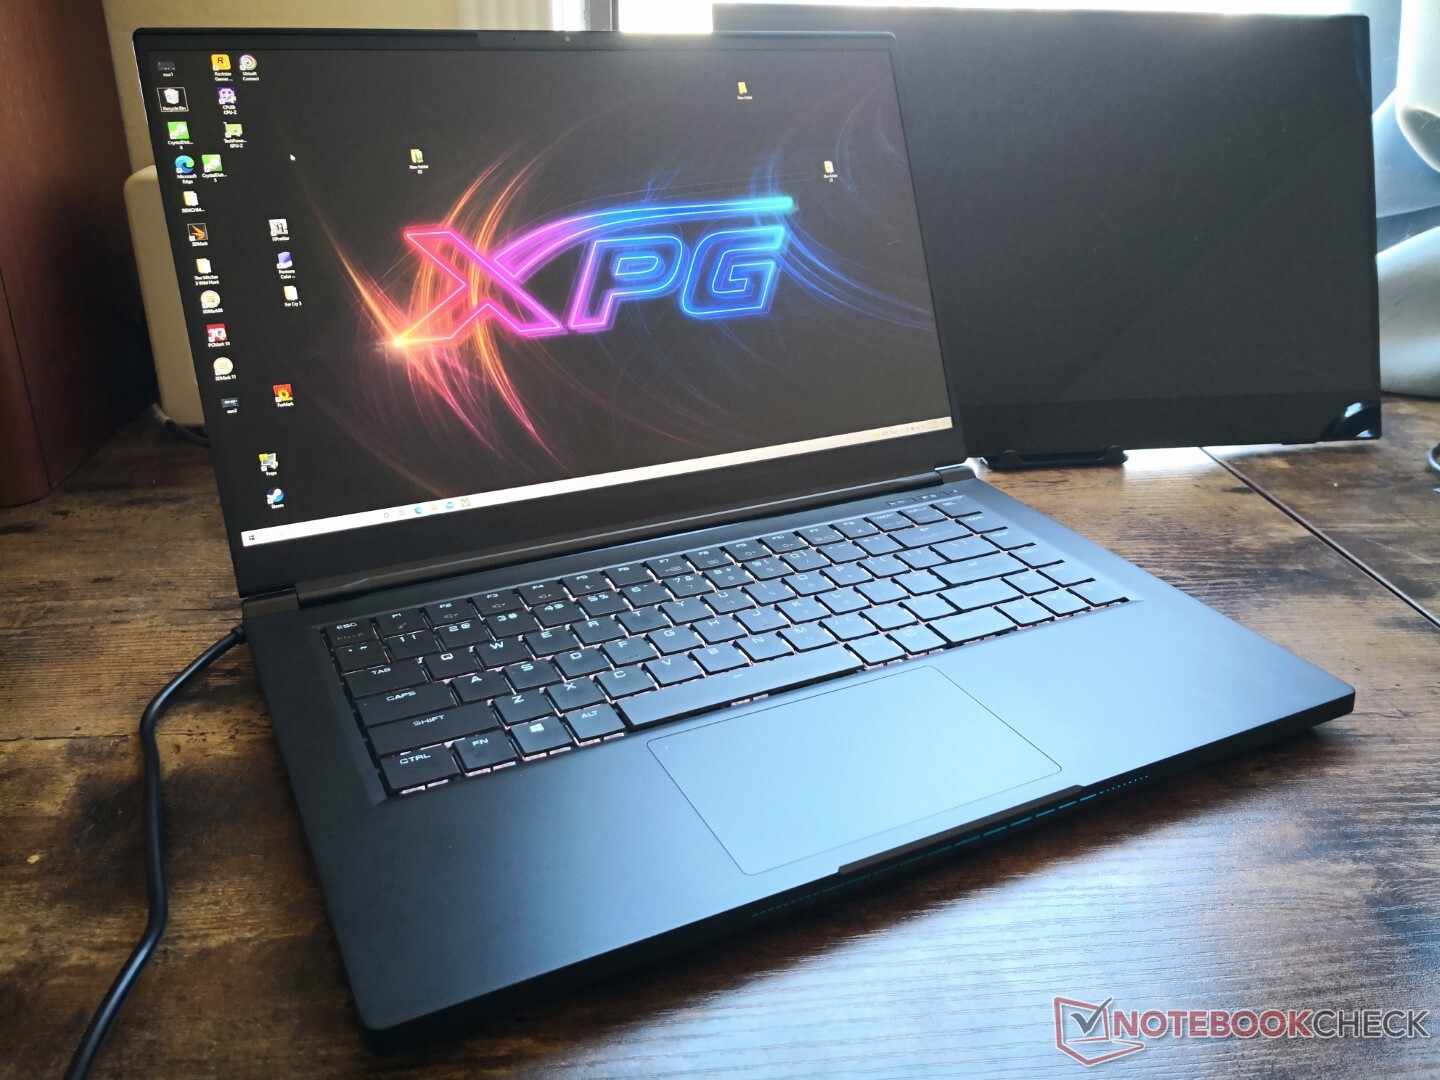
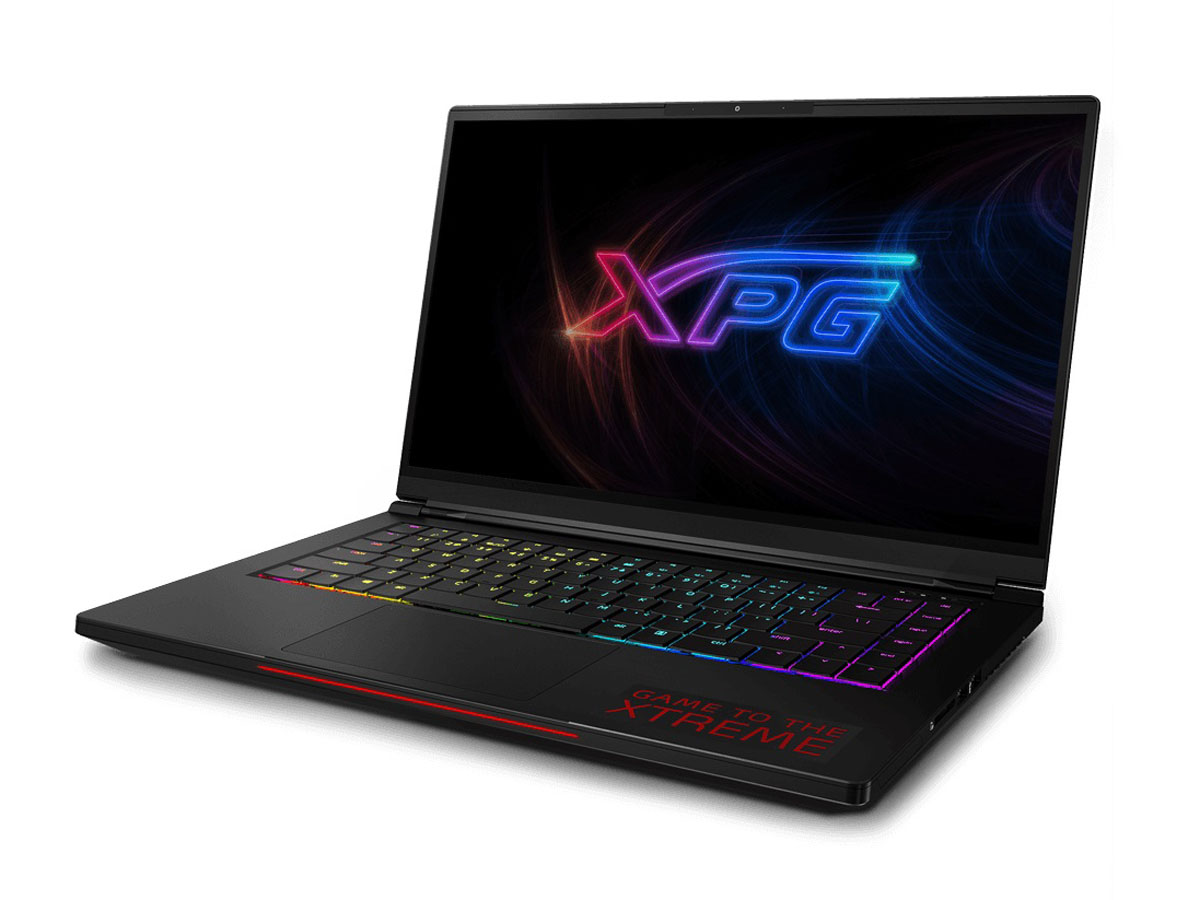
Análisis del portátil ADATA XPG Xenia 15: Casi tan afilado como un Razer Blade

Después de lanzar los XPG Xenia Xe y Xenia 14 en mayo y julio, respectivamente, ADATA está lista para actualizar su Xenia 15 centrado en los juegos con Tiger Lake-H y GPU Nvidia Ampere para reemplazar las opciones Coffee Lake-H y Turing del modelo anterior. Otras actualizaciones incluyen una nueva pantalla de 1440p 165 Hz en lugar de 1080p 144 Hz y soporte para SSDs PCIe4 y Thunderbolt 4 en lugar de sólo PCIe3 y Thunderbolt 3
Nuestra configuración exacta con GeForce RTX 3070, 32 GB de RAM y 1 TB de almacenamiento se comercializa ahora por 2499 dólares, pero es posible que haya versiones inferiores por menos dinero. El modelo compite con otros portátiles de juego ultradelgados de 15,6 pulgadas como el Razer Blade 15, MSI GS66, Asus Zephyrus S15, Lenovo Legion 7o Dell Alienware x15
Más opiniones de ADATA:
potential competitors in comparison
Valoración | Fecha | Modelo | Peso | Altura | Tamaño | Resolución | Precio |
|---|---|---|---|---|---|---|---|
| 87.3 % v7 (old) | 10/2021 | ADATA XPG Xenia 15 i7-11800H, GeForce RTX 3070 Laptop GPU | 1.9 kg | 20.5 mm | 15.60" | 2560x1440 | |
| 82.9 % v7 (old) | 10/2021 | MSI Delta 15 A5EFK R9 5900HX, Radeon RX 6700M | 2 kg | 19 mm | 15.60" | 1920x1080 | |
| 87.2 % v7 (old) | 09/2021 | Alienware x15 RTX 3070 P111F i7-11800H, GeForce RTX 3070 Laptop GPU | 2.4 kg | 15.9 mm | 15.60" | 2560x1440 | |
| 88.9 % v7 (old) | 07/2021 | Razer Blade 15 Advanced (Mid 2021) i7-11800H, GeForce RTX 3080 Laptop GPU | 2 kg | 16.99 mm | 15.60" | 1920x1080 | |
| 84 % v7 (old) | 02/2021 | MSI GS66 Stealth 10UG i7-10870H, GeForce RTX 3070 Laptop GPU | 2.1 kg | 19.8 mm | 15.60" | 1920x1080 | |
| 83.8 % v7 (old) | 02/2021 | Asus ROG Zephyrus G15 GA503Q R9 5900HS, GeForce RTX 3080 Laptop GPU | 2 kg | 20 mm | 15.60" | 2560x1440 |
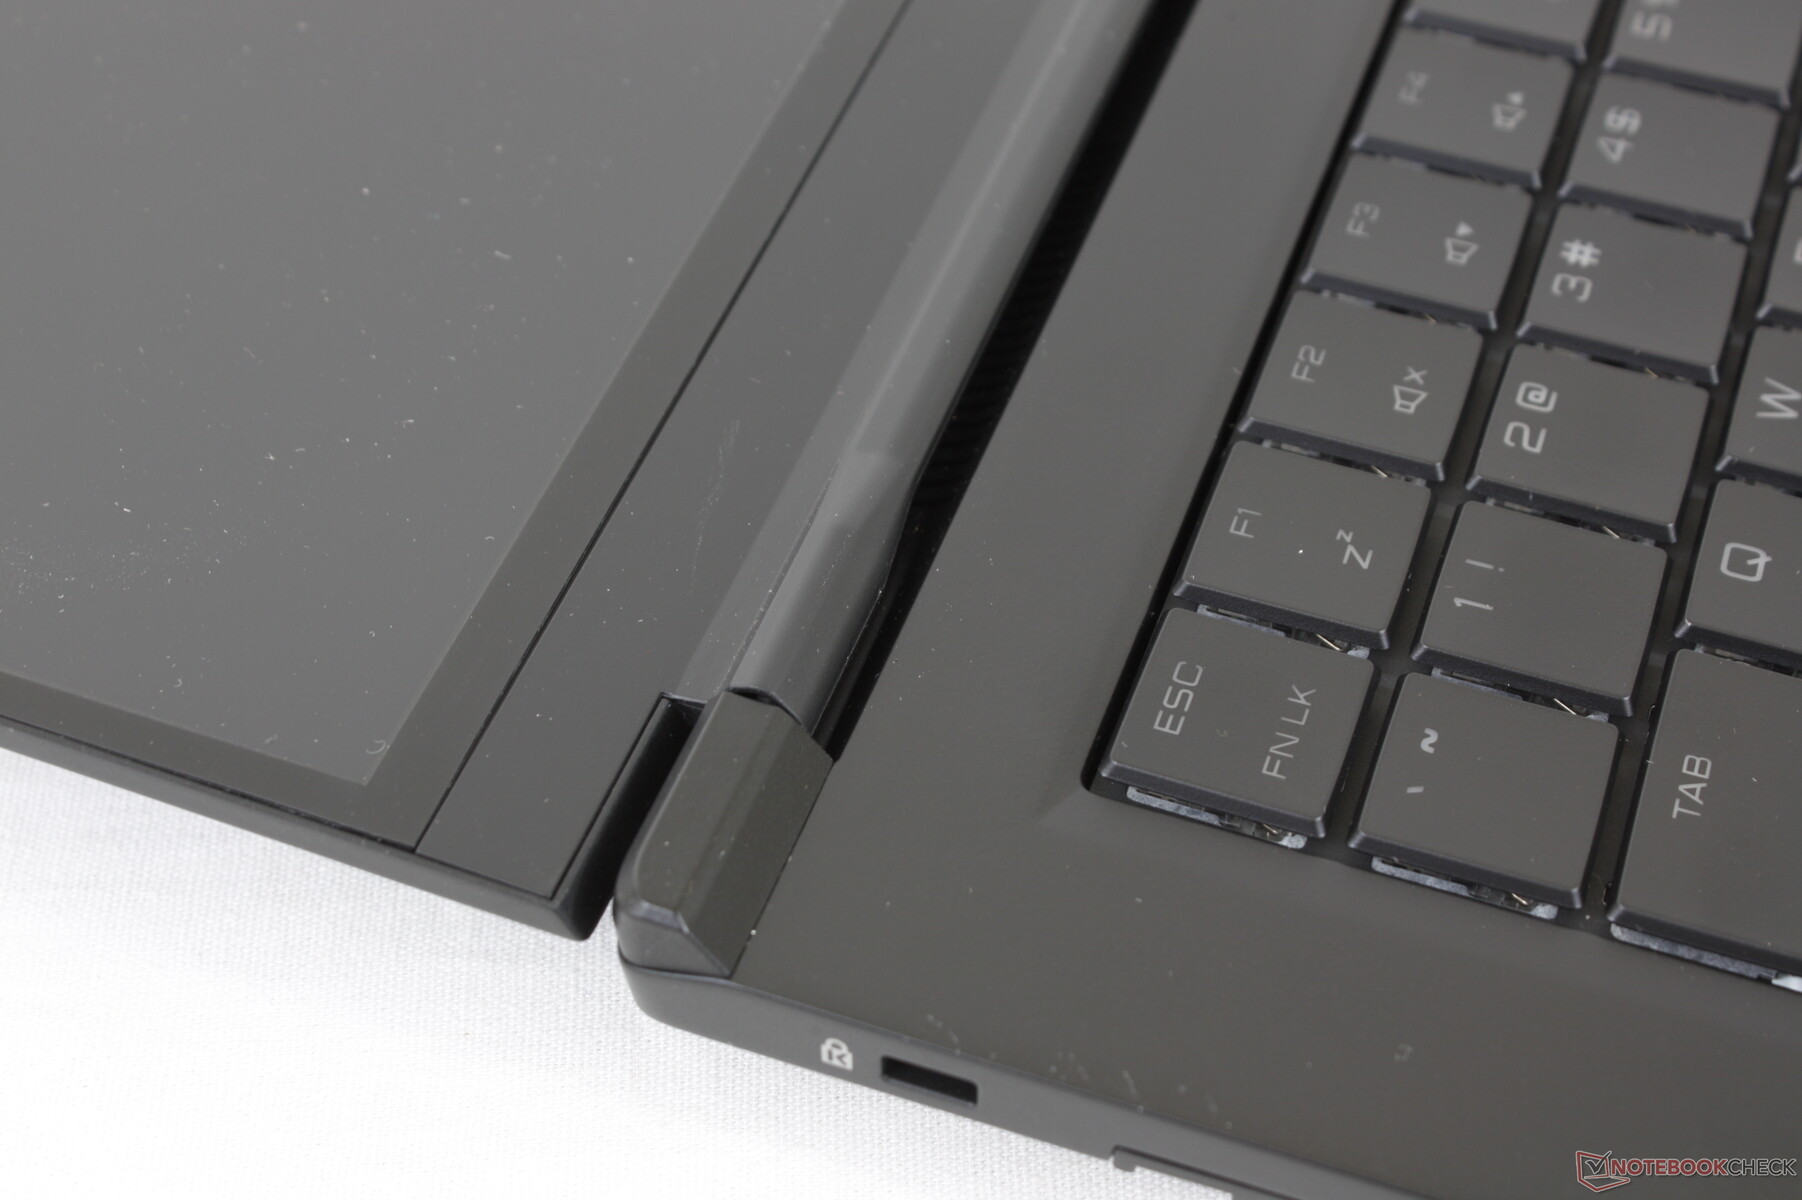
Caso - Base fuerte, bisagras débiles
El chasis tiene muchas similitudes con el Schenker Core 15 o a Neo 15 ya que todos estos modelos utilizan diseños de marca blanca de Tongfang. ADATA es un distribuidor del chasis, lo que significa que los usuarios pueden encontrar exactamente el mismo modelo en otro distribuidor dependiendo de la región. Sin embargo, a diferencia de los dos modelos mencionados de Schenker, el XPG Xenia 15 es más pequeño en las tres dimensiones y ligeramente más ligero para un aspecto aún más compacto. Su tamaño es prácticamente el mismo que el del Razer Blade 15 Advanced, pero es un poco más grueso, con algo más de 3 milímetros.
La base de aleación de magnesio se siente tan sólida como en el Blade 15 e incluso mejor que en el Asus Zephyrus S15 o el Lenovo Legion 5, que muestran más flexión y crujidos. La tapa y las bisagras, sin embargo, son mucho más débiles y de menor calidad que la base. Las bisagras, en particular, se vuelven más débiles en ángulos más amplios y se tambalean notablemente también. Esto es algo que podría mejorarse en un posible diseño de próxima generación.
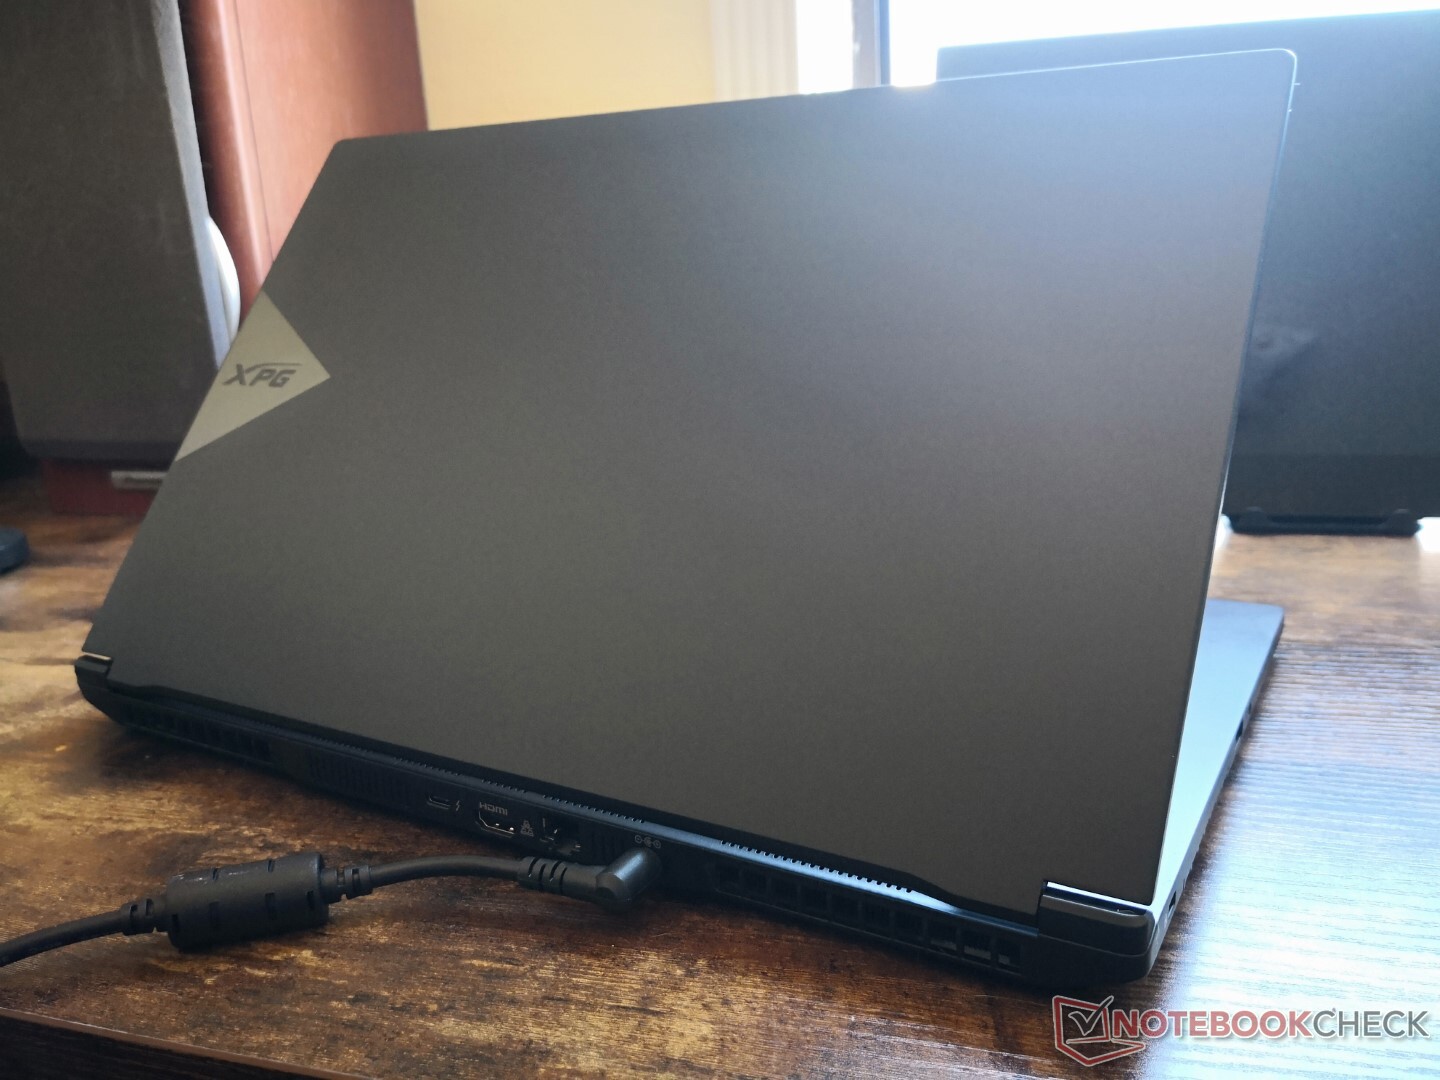
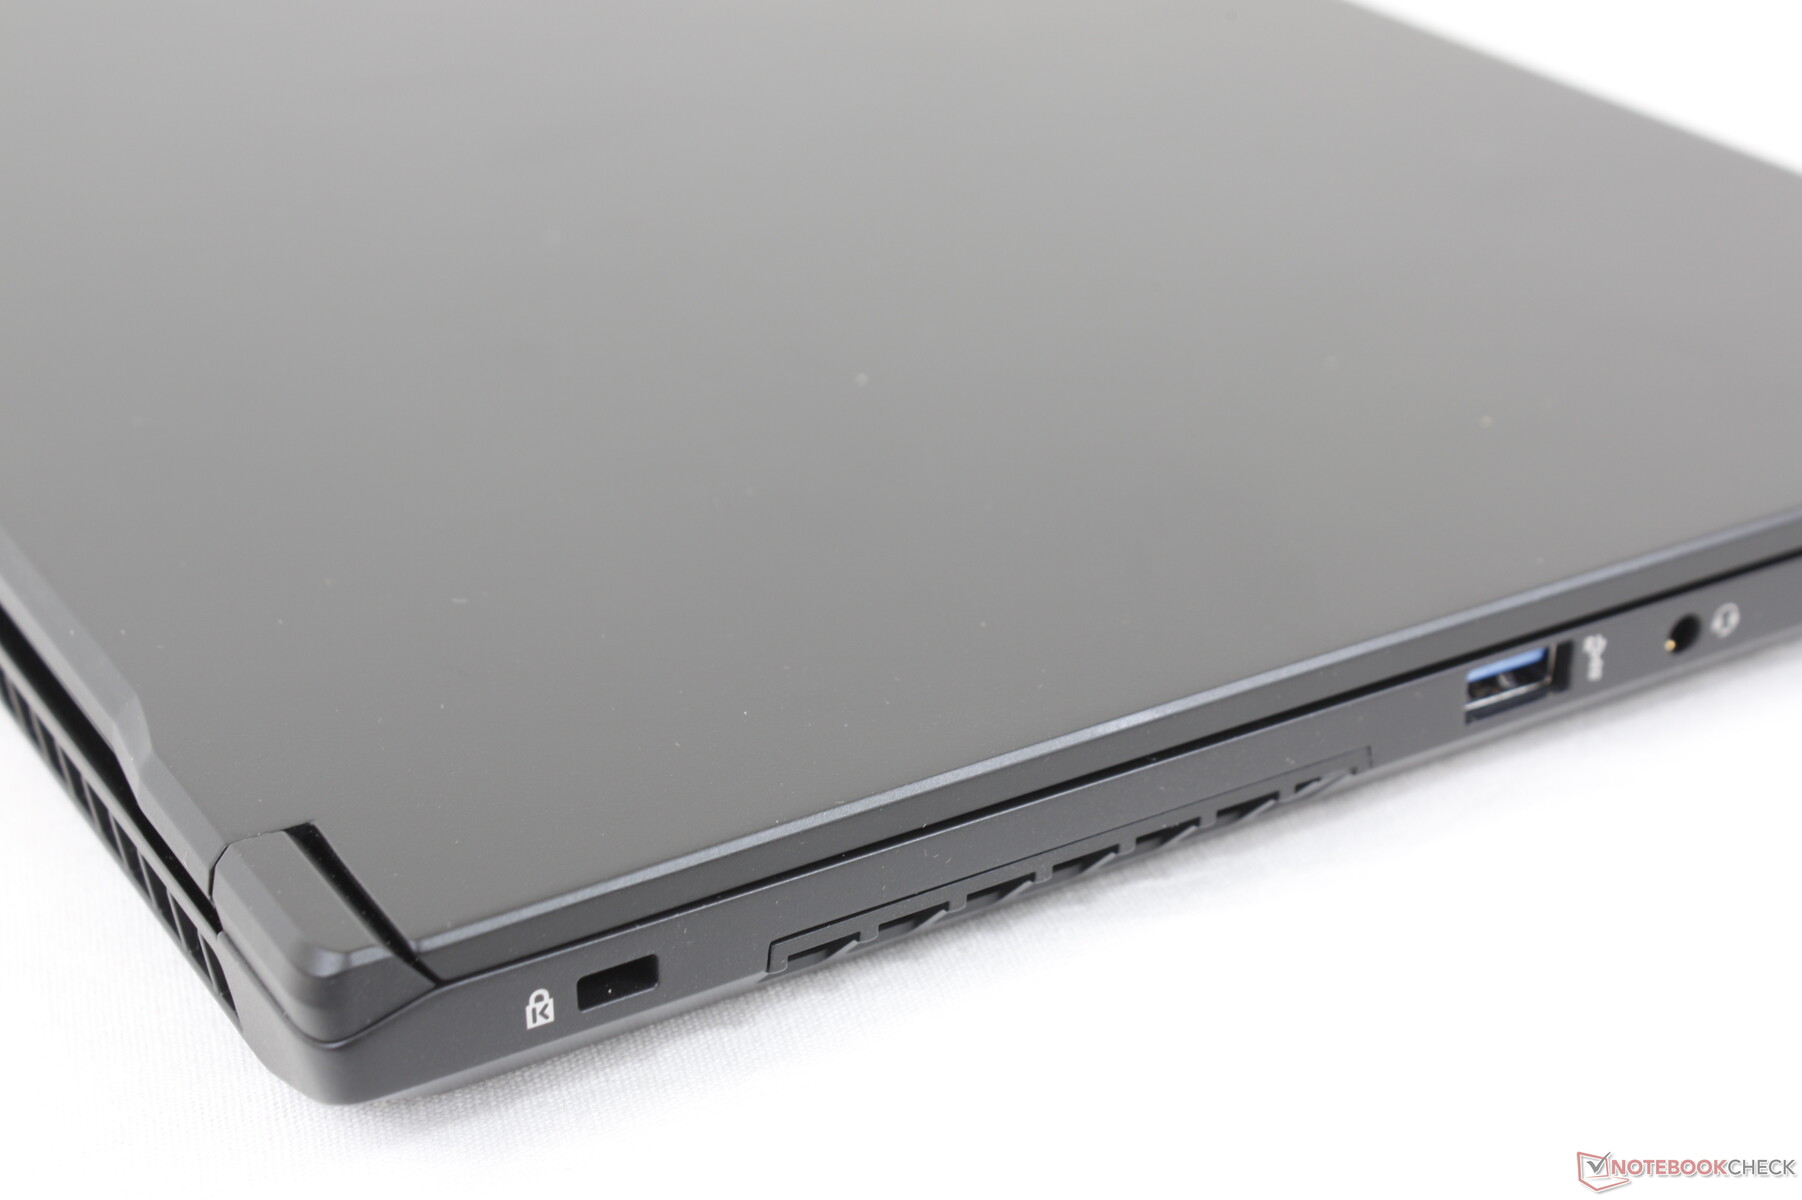
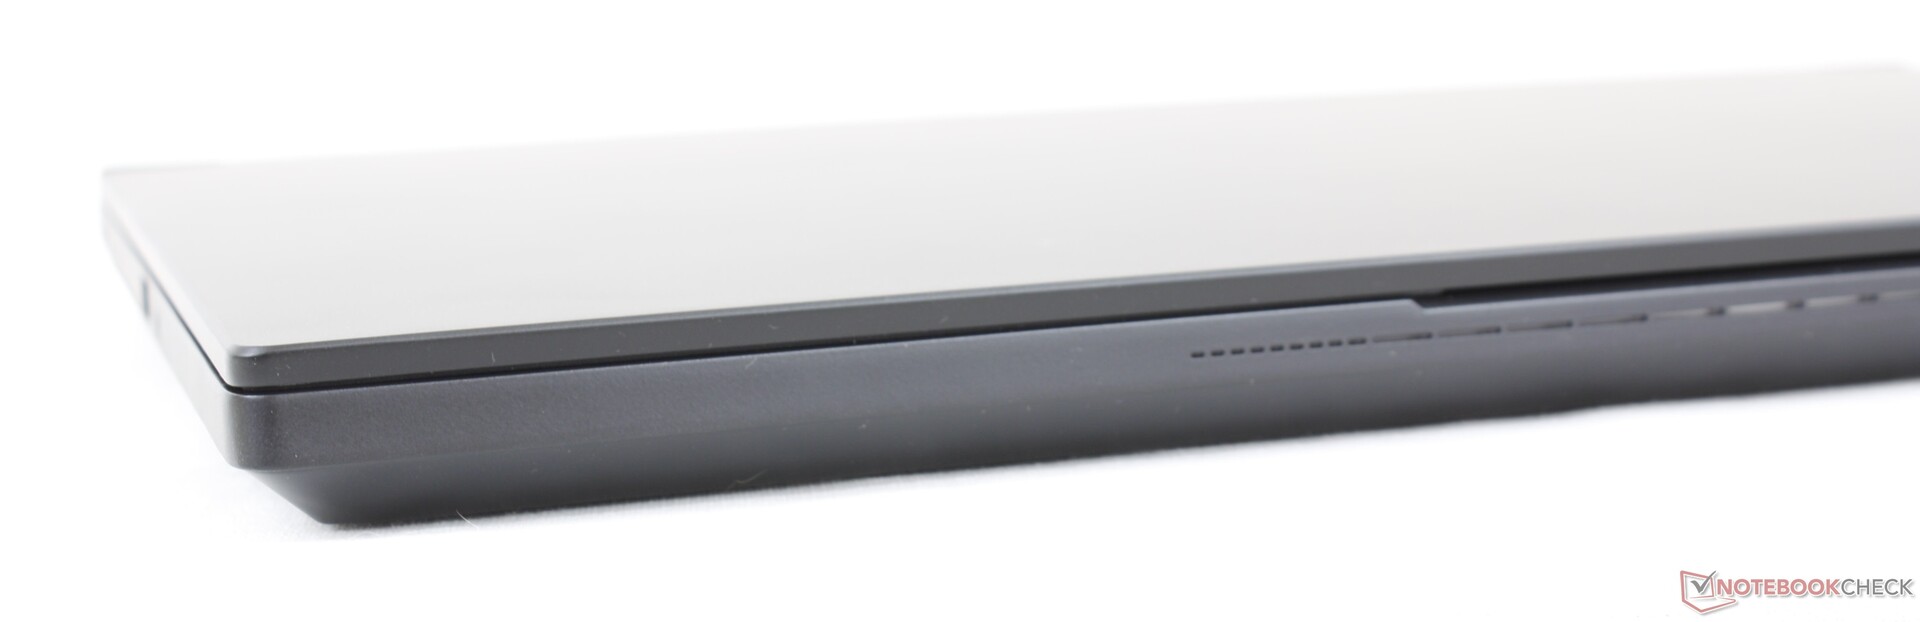
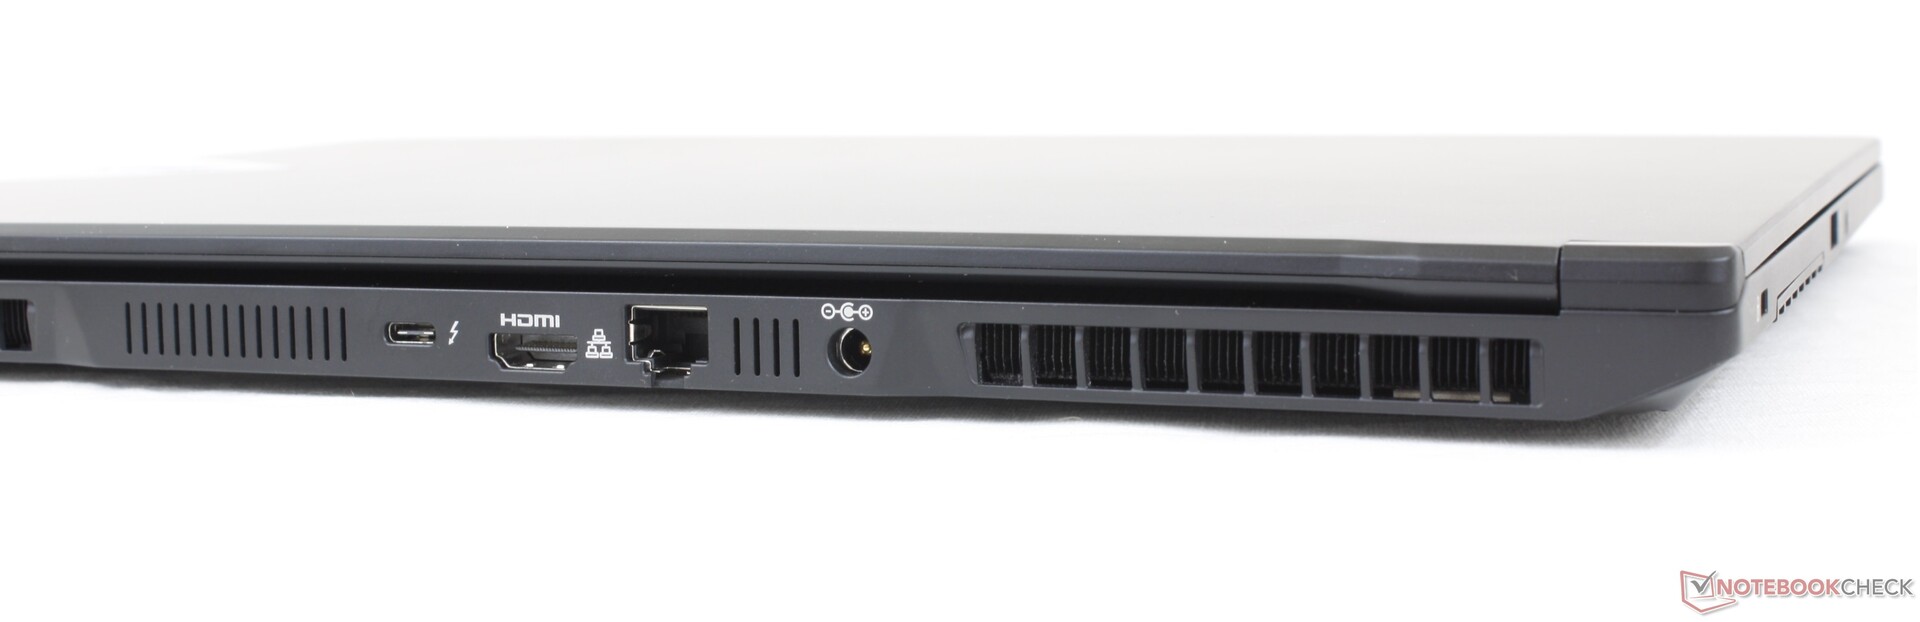
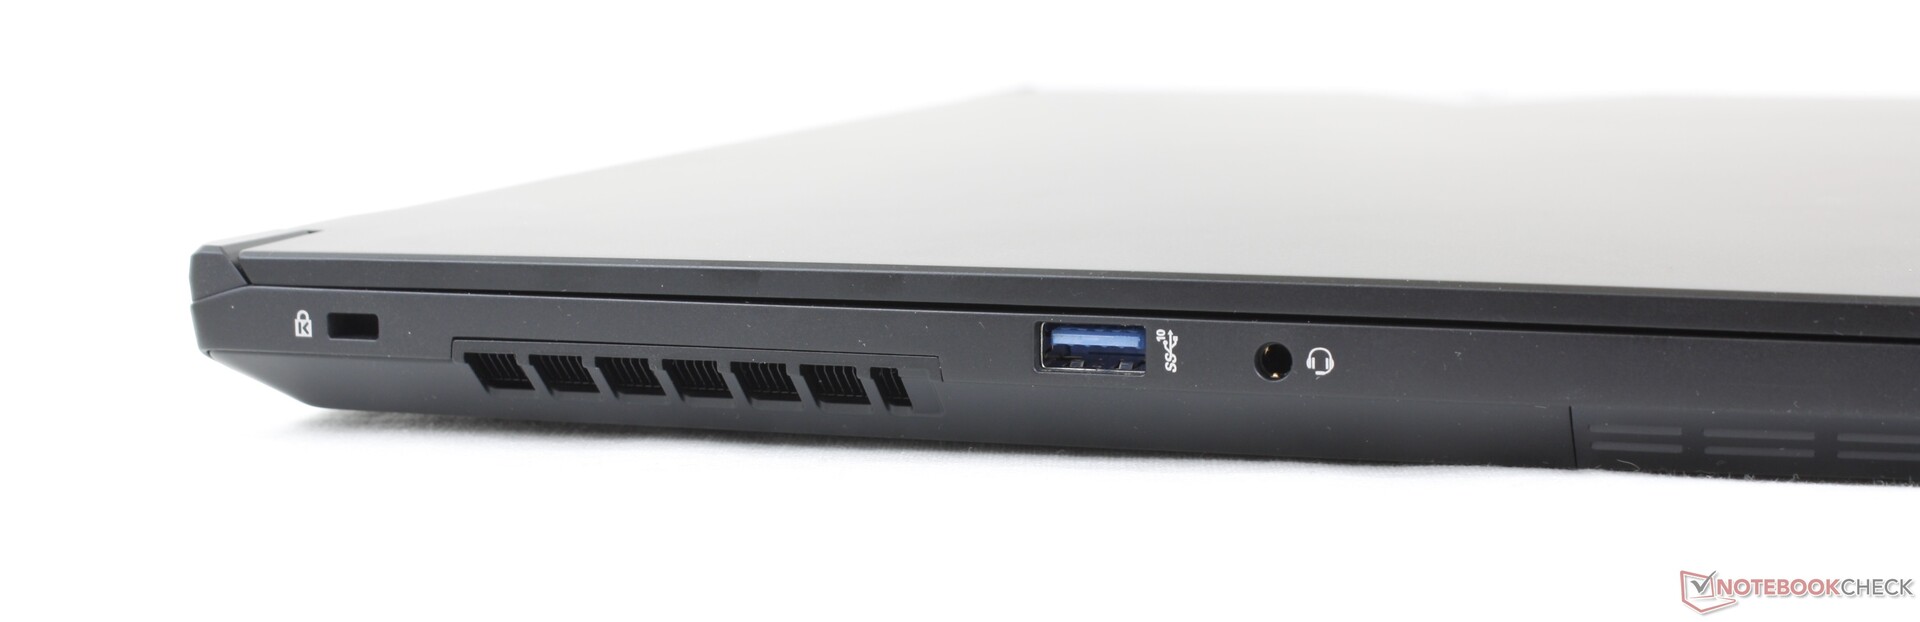
Conectividad - Soporte de Thunderbolt 4
Las opciones de puertos y la posición son similares a las del Schenker XMG Neo 15, pero con algunas diferencias menores. Por ejemplo, el conector de micrófono de 3,5 mm dedicado ha desaparecido, mientras que el puerto RJ-45 trasero no tiene solapa protectora.
Merece la pena mencionar que el puerto USB-C de esta máquina no puede usarse para recargar el portátil, a diferencia de lo que ocurre en la mayoría de portátiles para juegos de hoy en día. Probamos dos adaptadores de CA USB-C diferentes que funcionaban en el MSI GS66, el Razer Blade 15 y el Alienware x15 pero no funcionaron en nuestro ADATA.
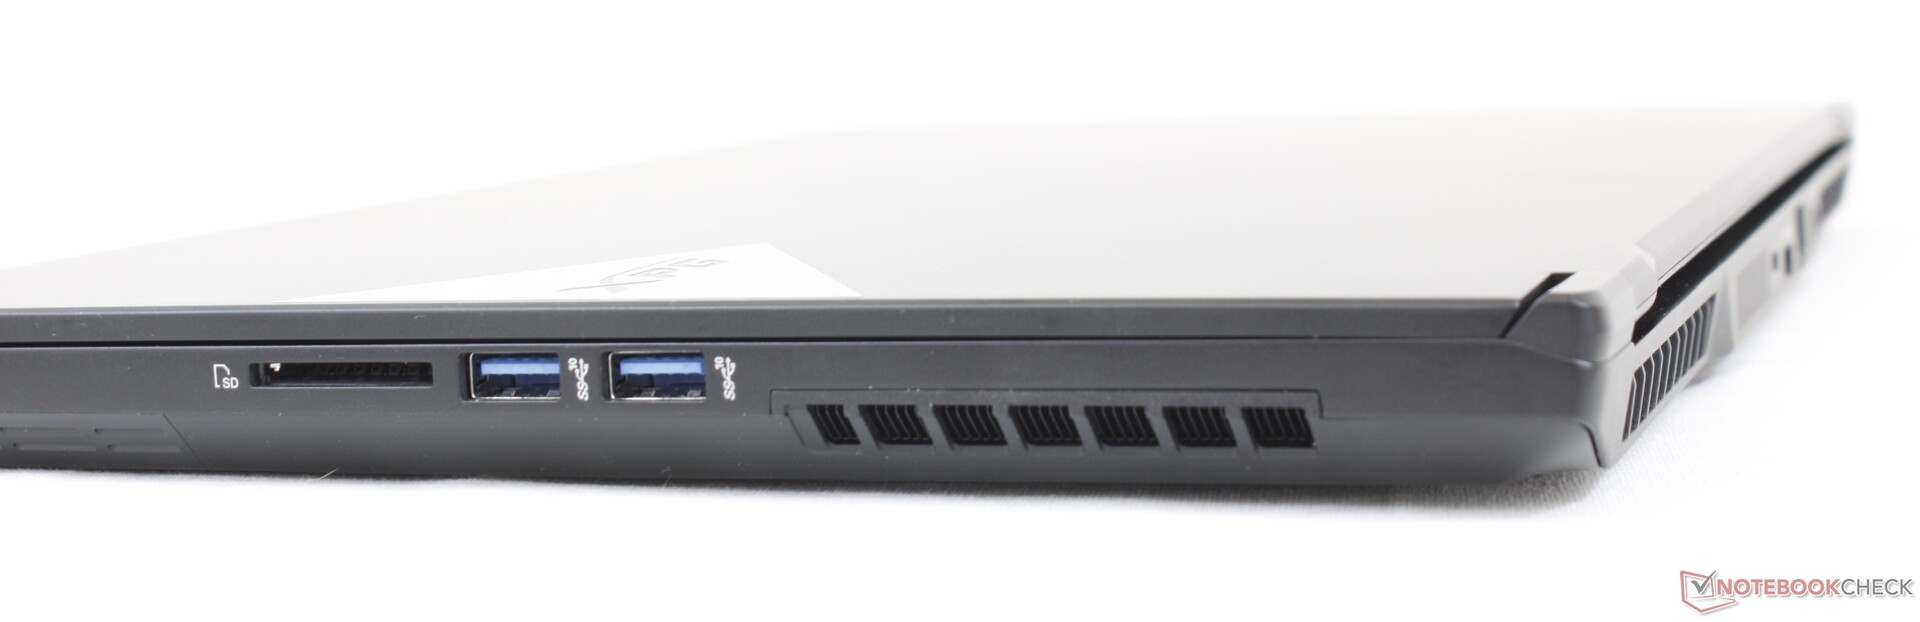
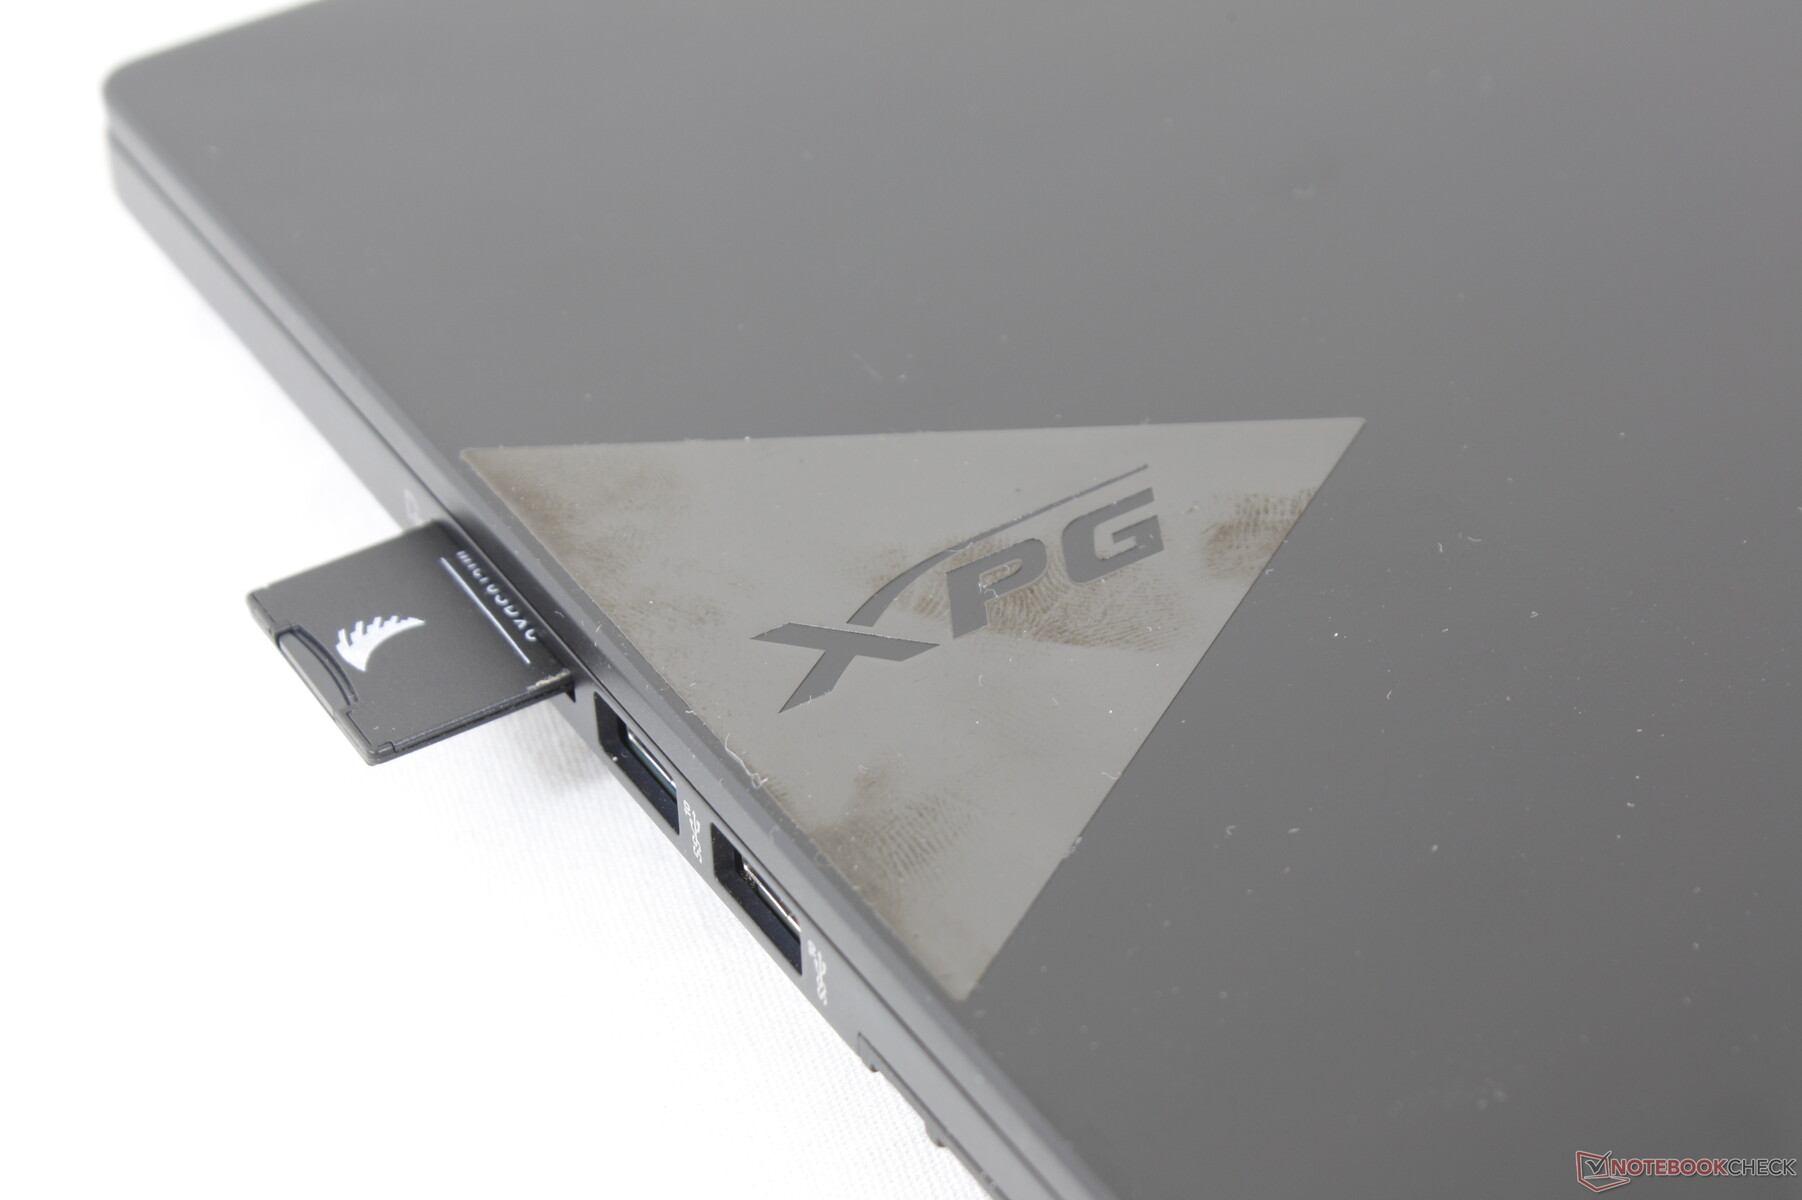
Lector de tarjetas SD
Las tasas de transferencia son medias, menos de la mitad de la velocidad del lector de tarjetas del Alienware x15. No obstante, apreciamos que el sistema integre un lector de tarjetas en primer lugar, lo que es más de lo que podemos decir del Razer Blade 15 o el MSI GS66.
| SD Card Reader | |
| average JPG Copy Test (av. of 3 runs) | |
| Alienware x15 RTX 3070 P111F (AV Pro V60) | |
| ADATA XPG Xenia 15 (AV Pro V60) | |
| maximum AS SSD Seq Read Test (1GB) | |
| Alienware x15 RTX 3070 P111F (AV Pro V60) | |
| ADATA XPG Xenia 15 (AV Pro V60) | |
Comunicación
El rendimiento podría haber sido más estable cuando se empareja con nuestro router de prueba Netgear RAX200. Las tasas de transferencia se reducen ocasionalmente a un rango de 300 a 500 Mbps, incluso después de múltiples pruebas, cuando deberían ser consistentes en más de 1 Gbps.
Cámara web
La cámara web de 720p es de mala calidad, lo que no es raro en la mayoría de los portátiles. El Razer Blade 17 sigue siendo uno de los pocos portátiles de juego con una webcam de 1080p. Ni siquiera hay un obturador de privacidad aquí, pero al menos hay una cámara IR para el soporte de Windows Hello.


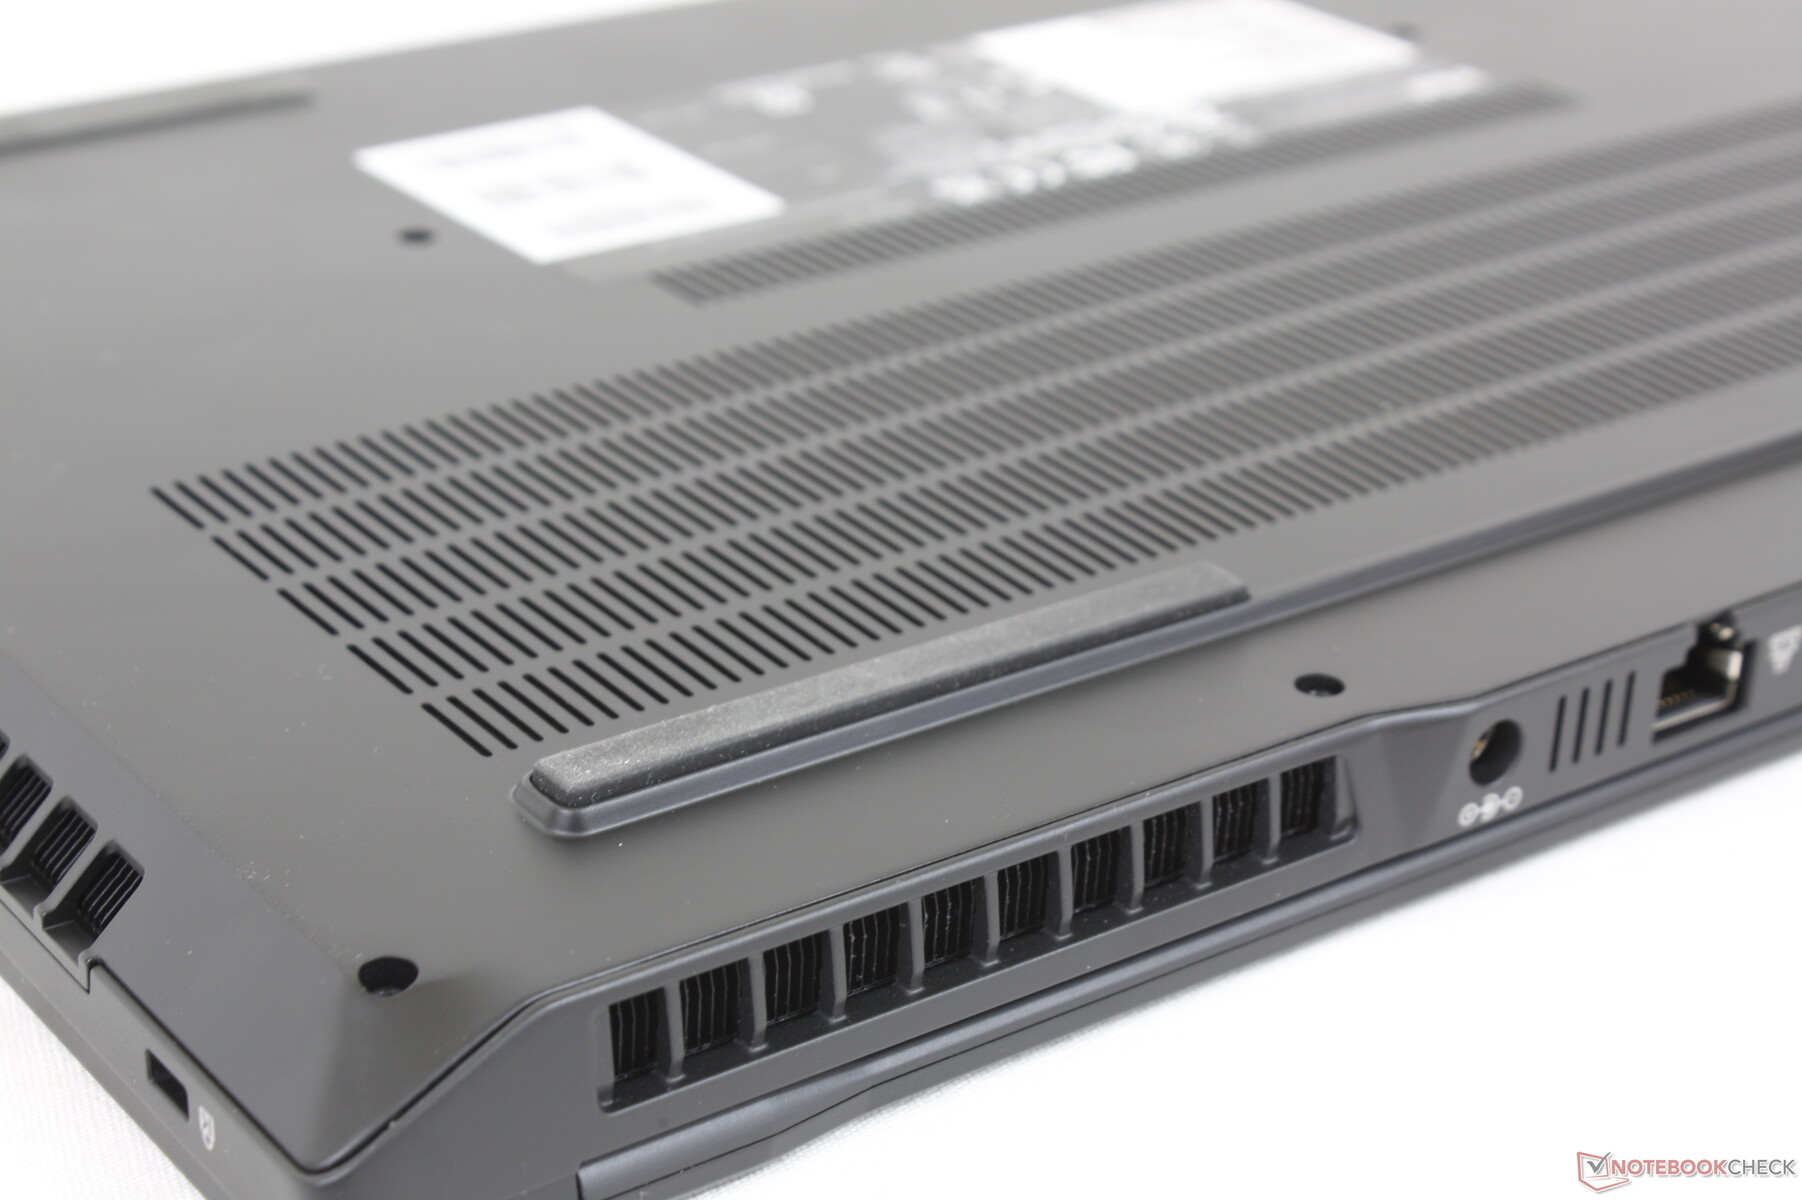
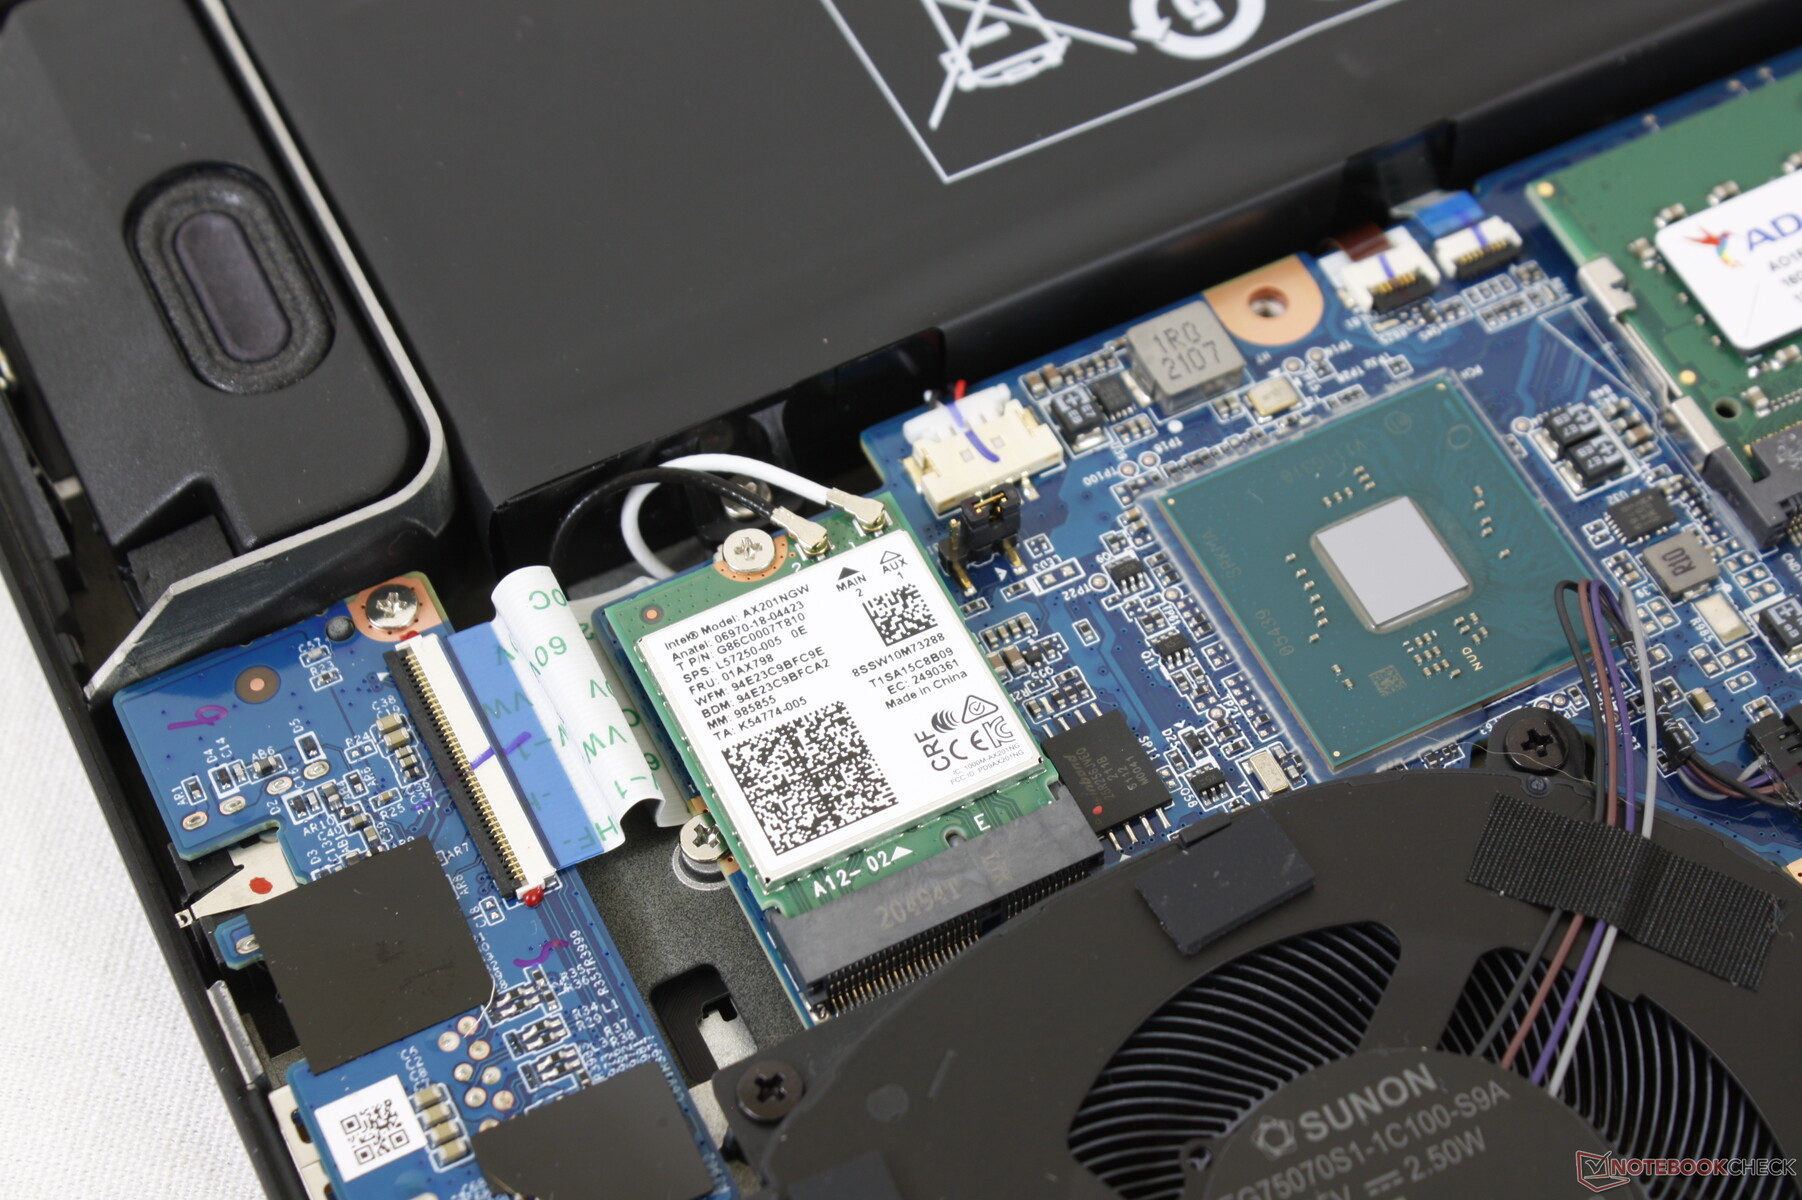
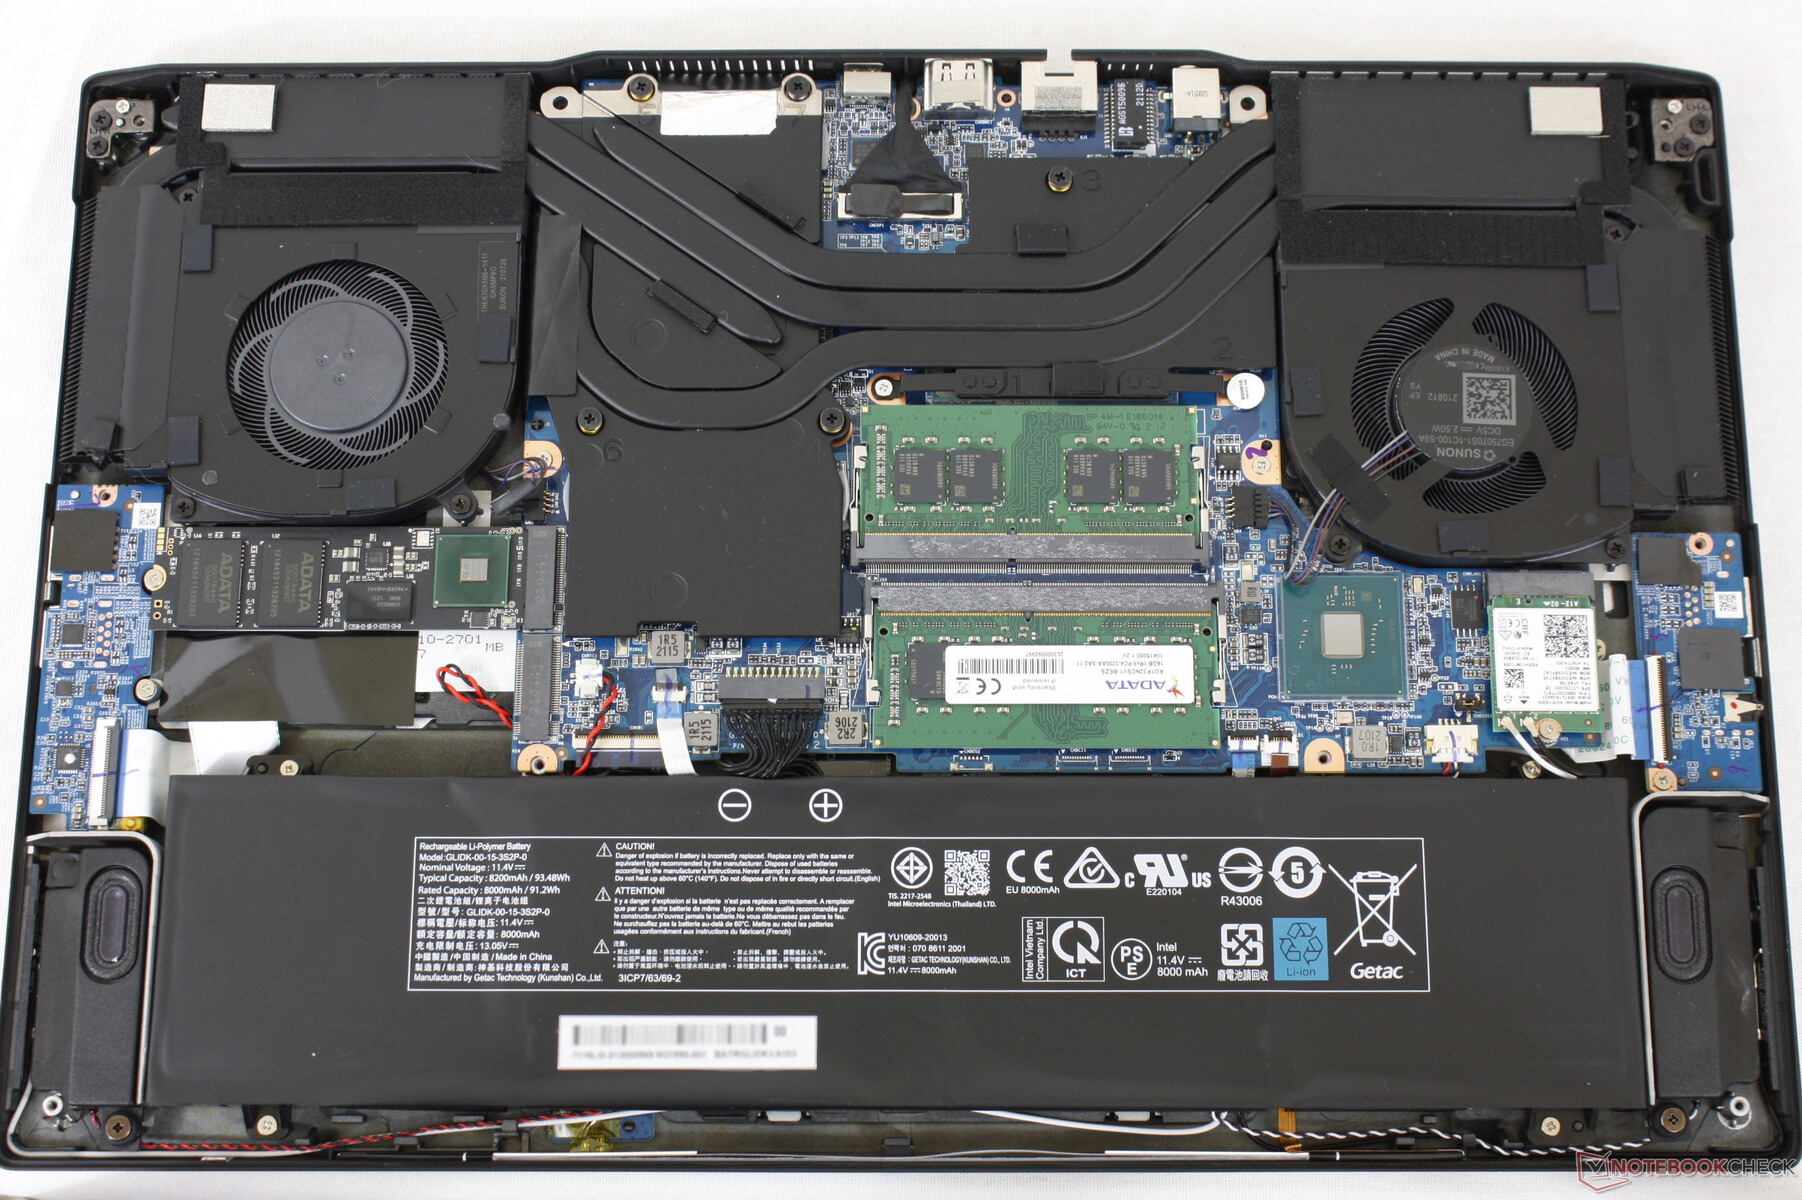
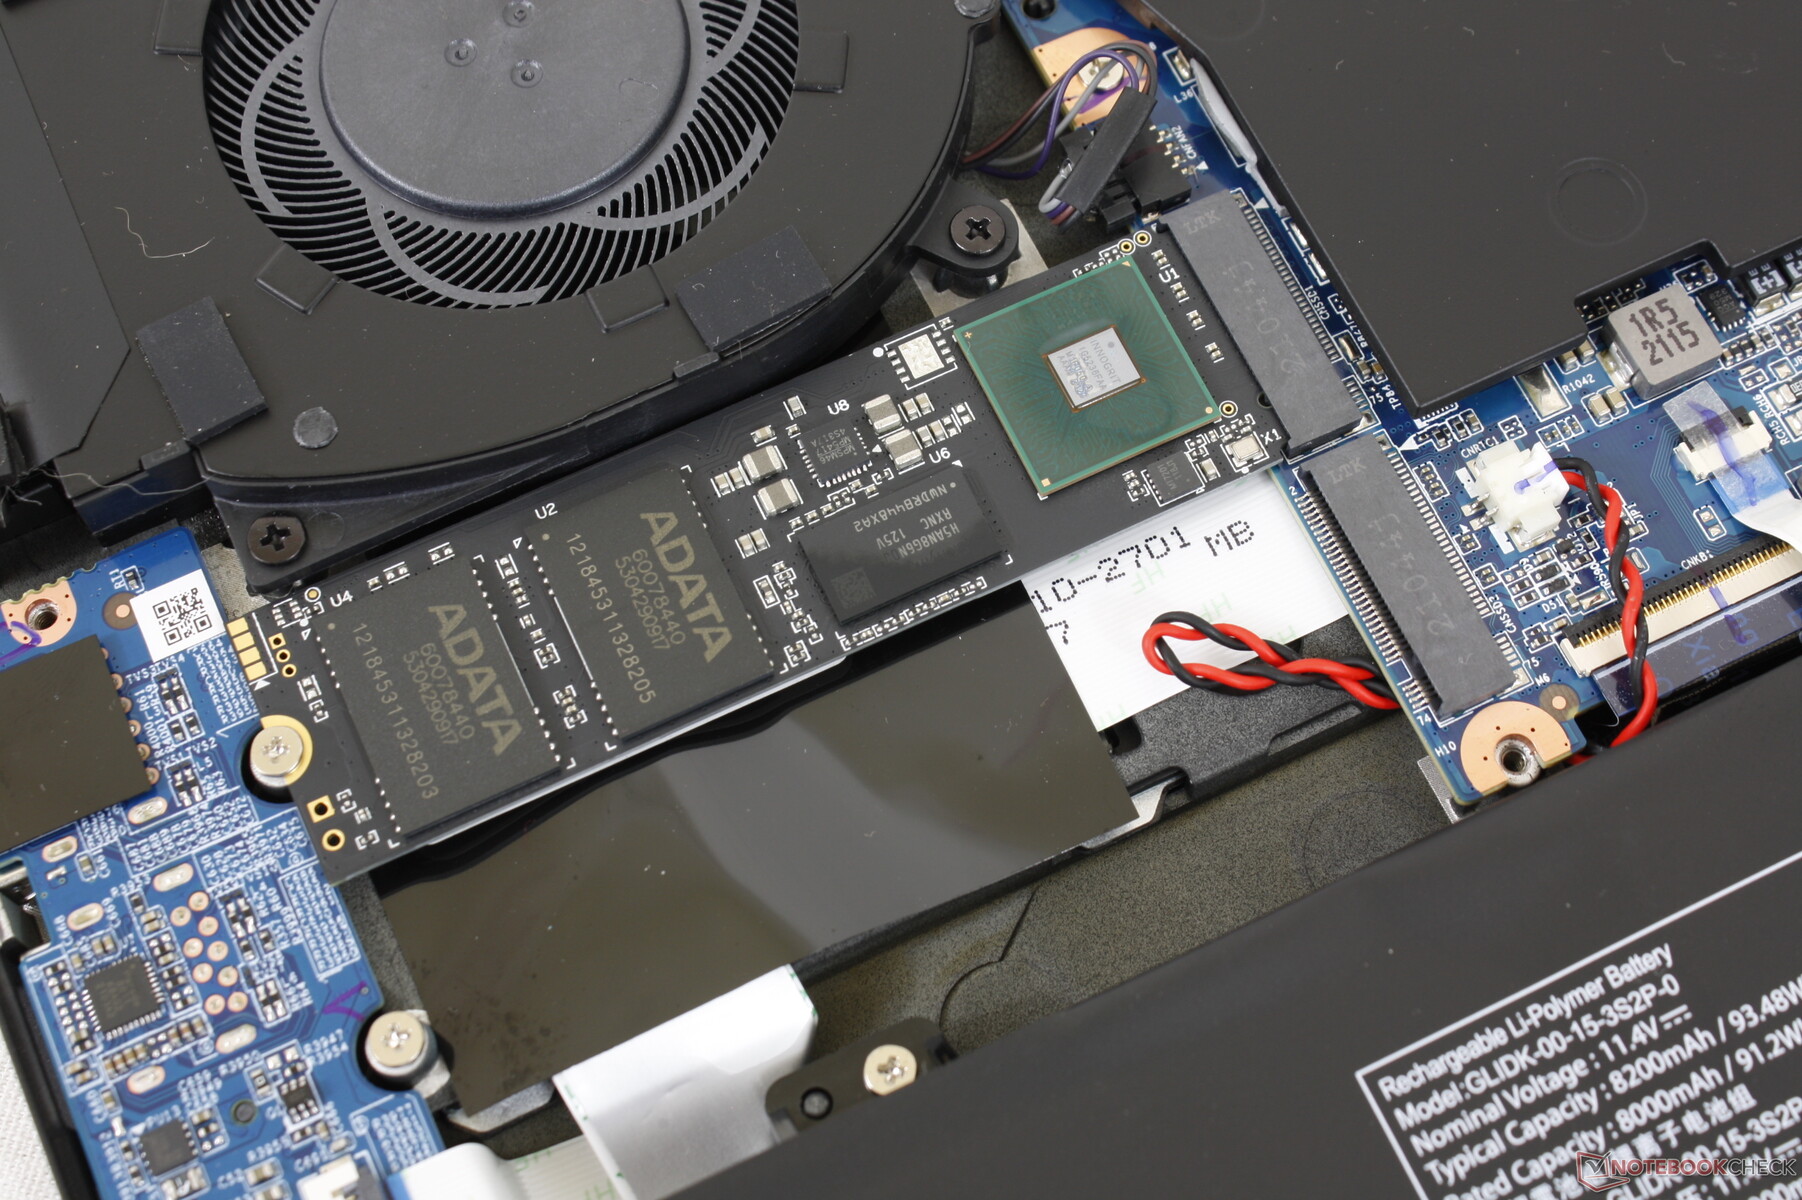
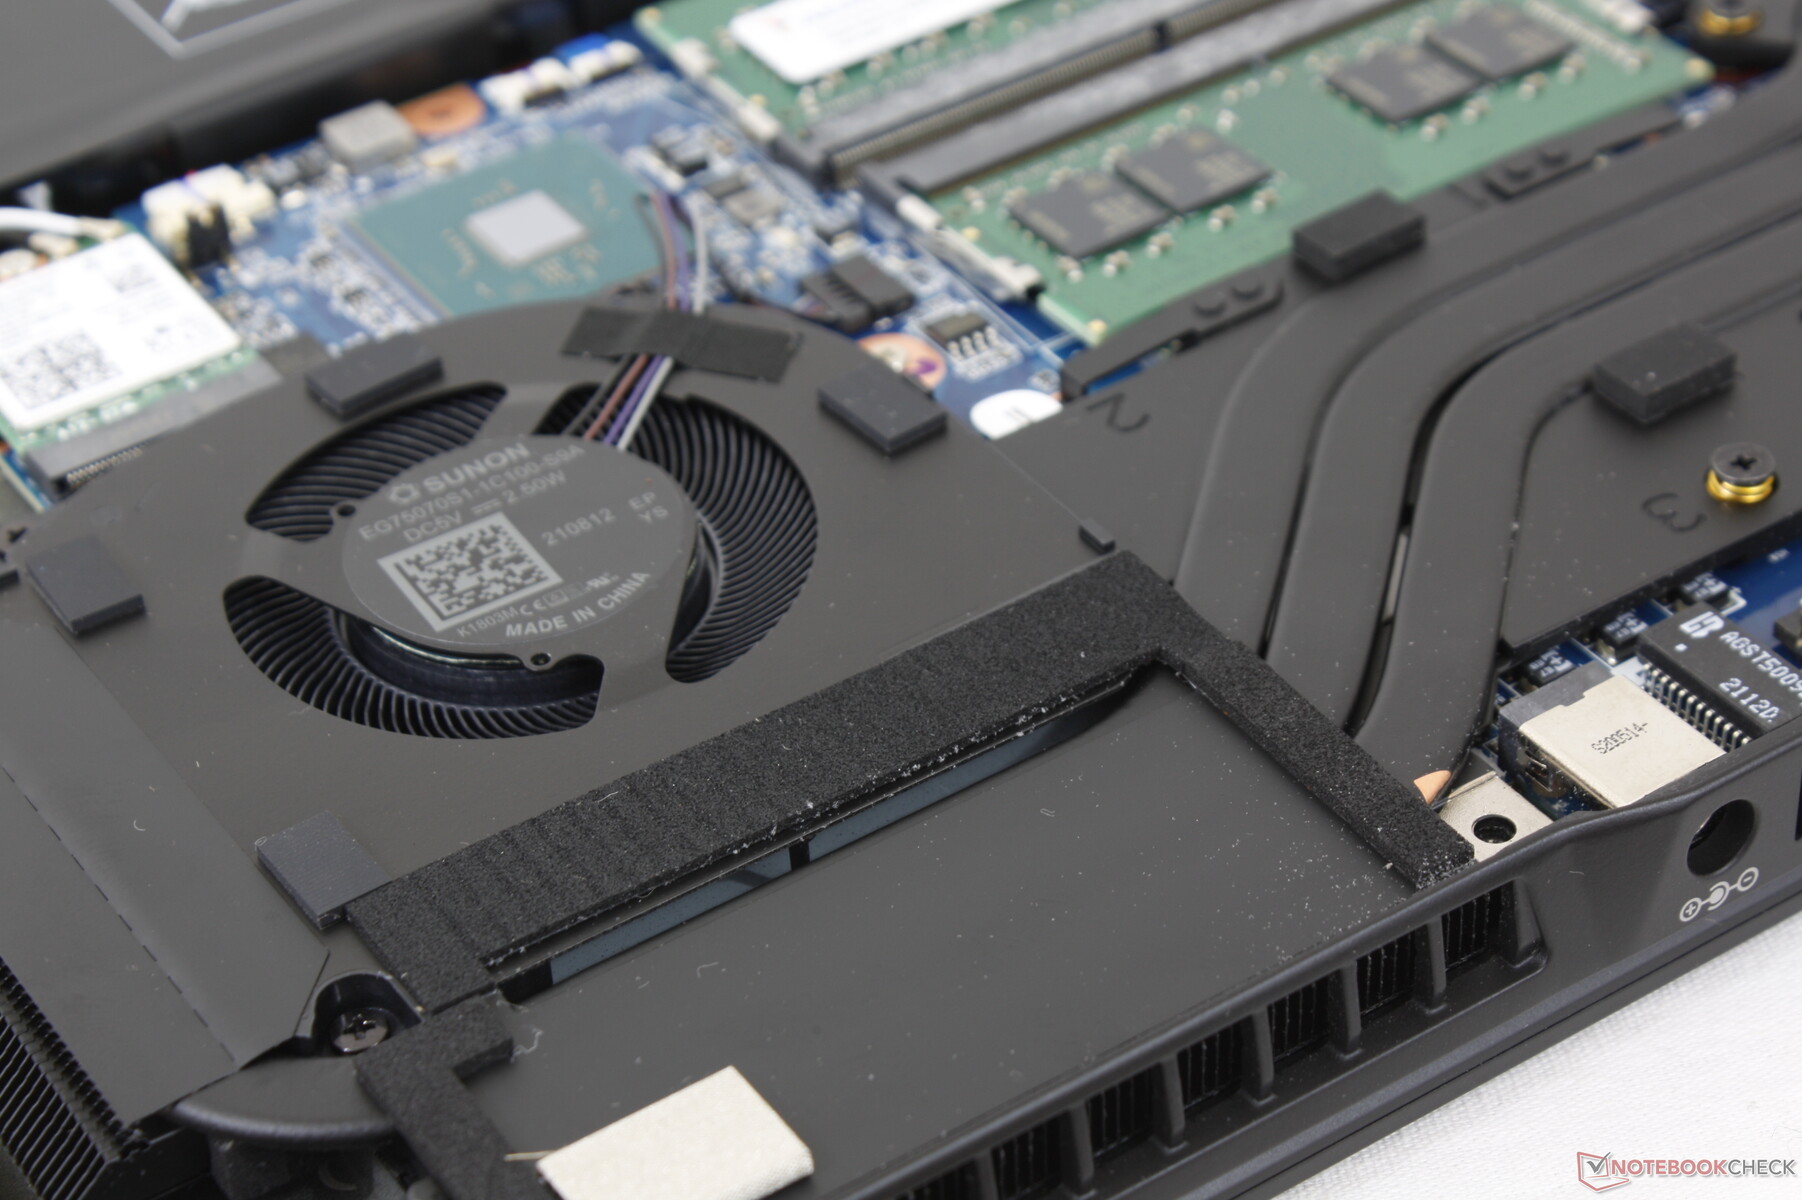
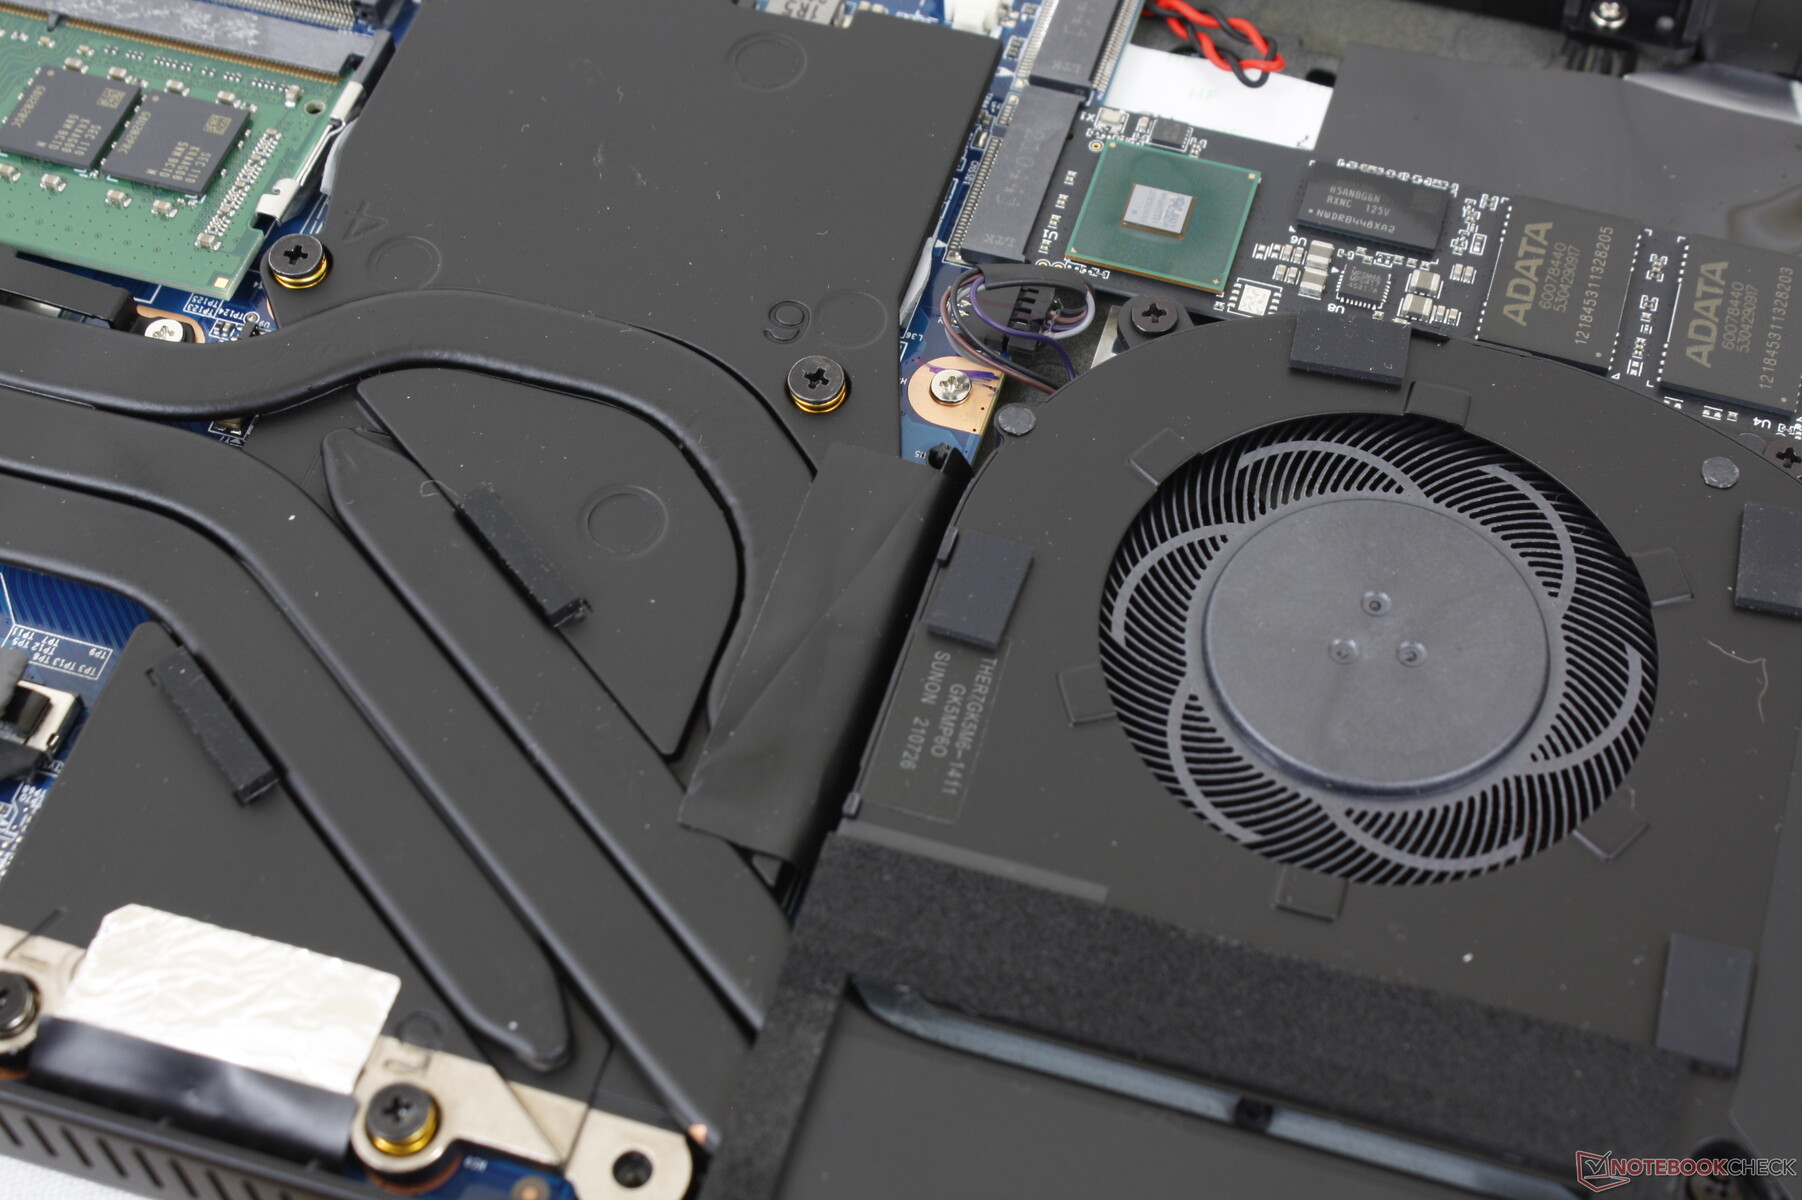
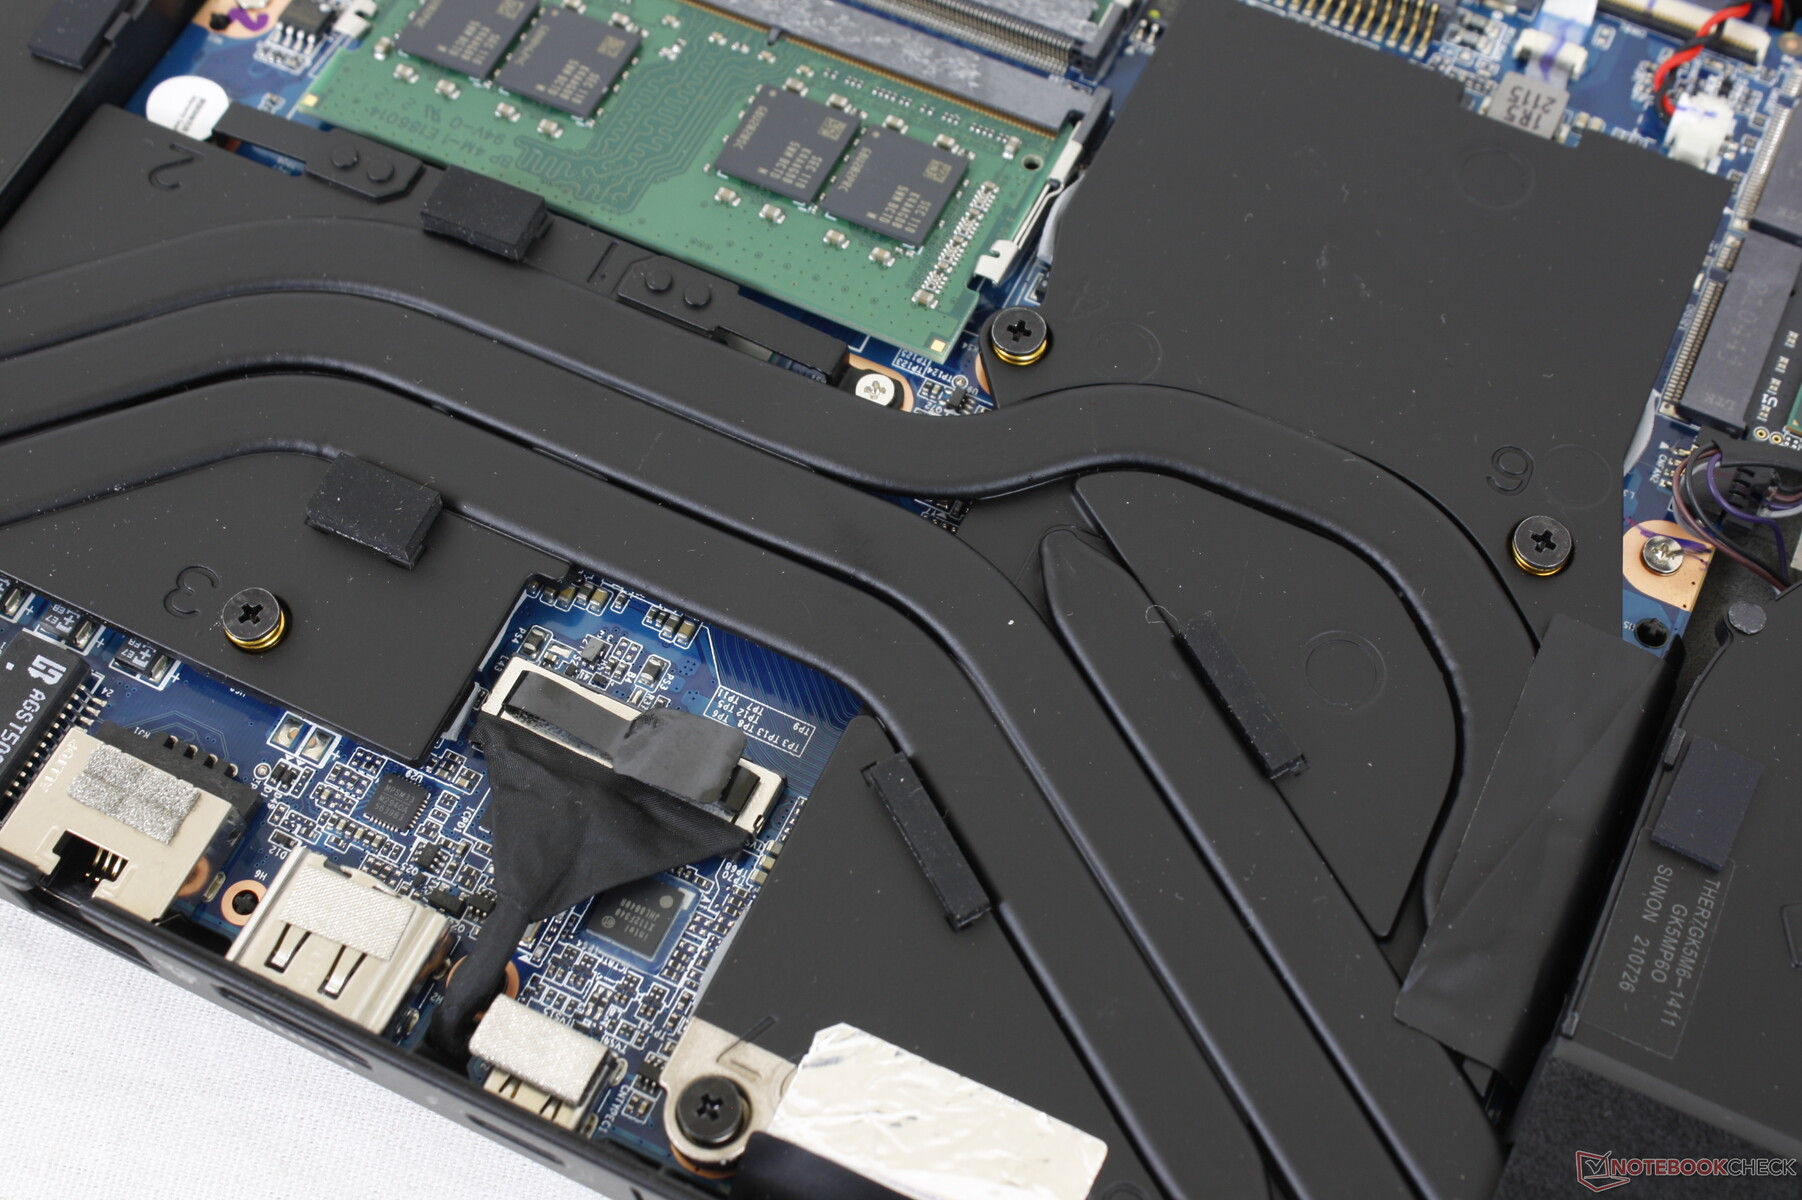
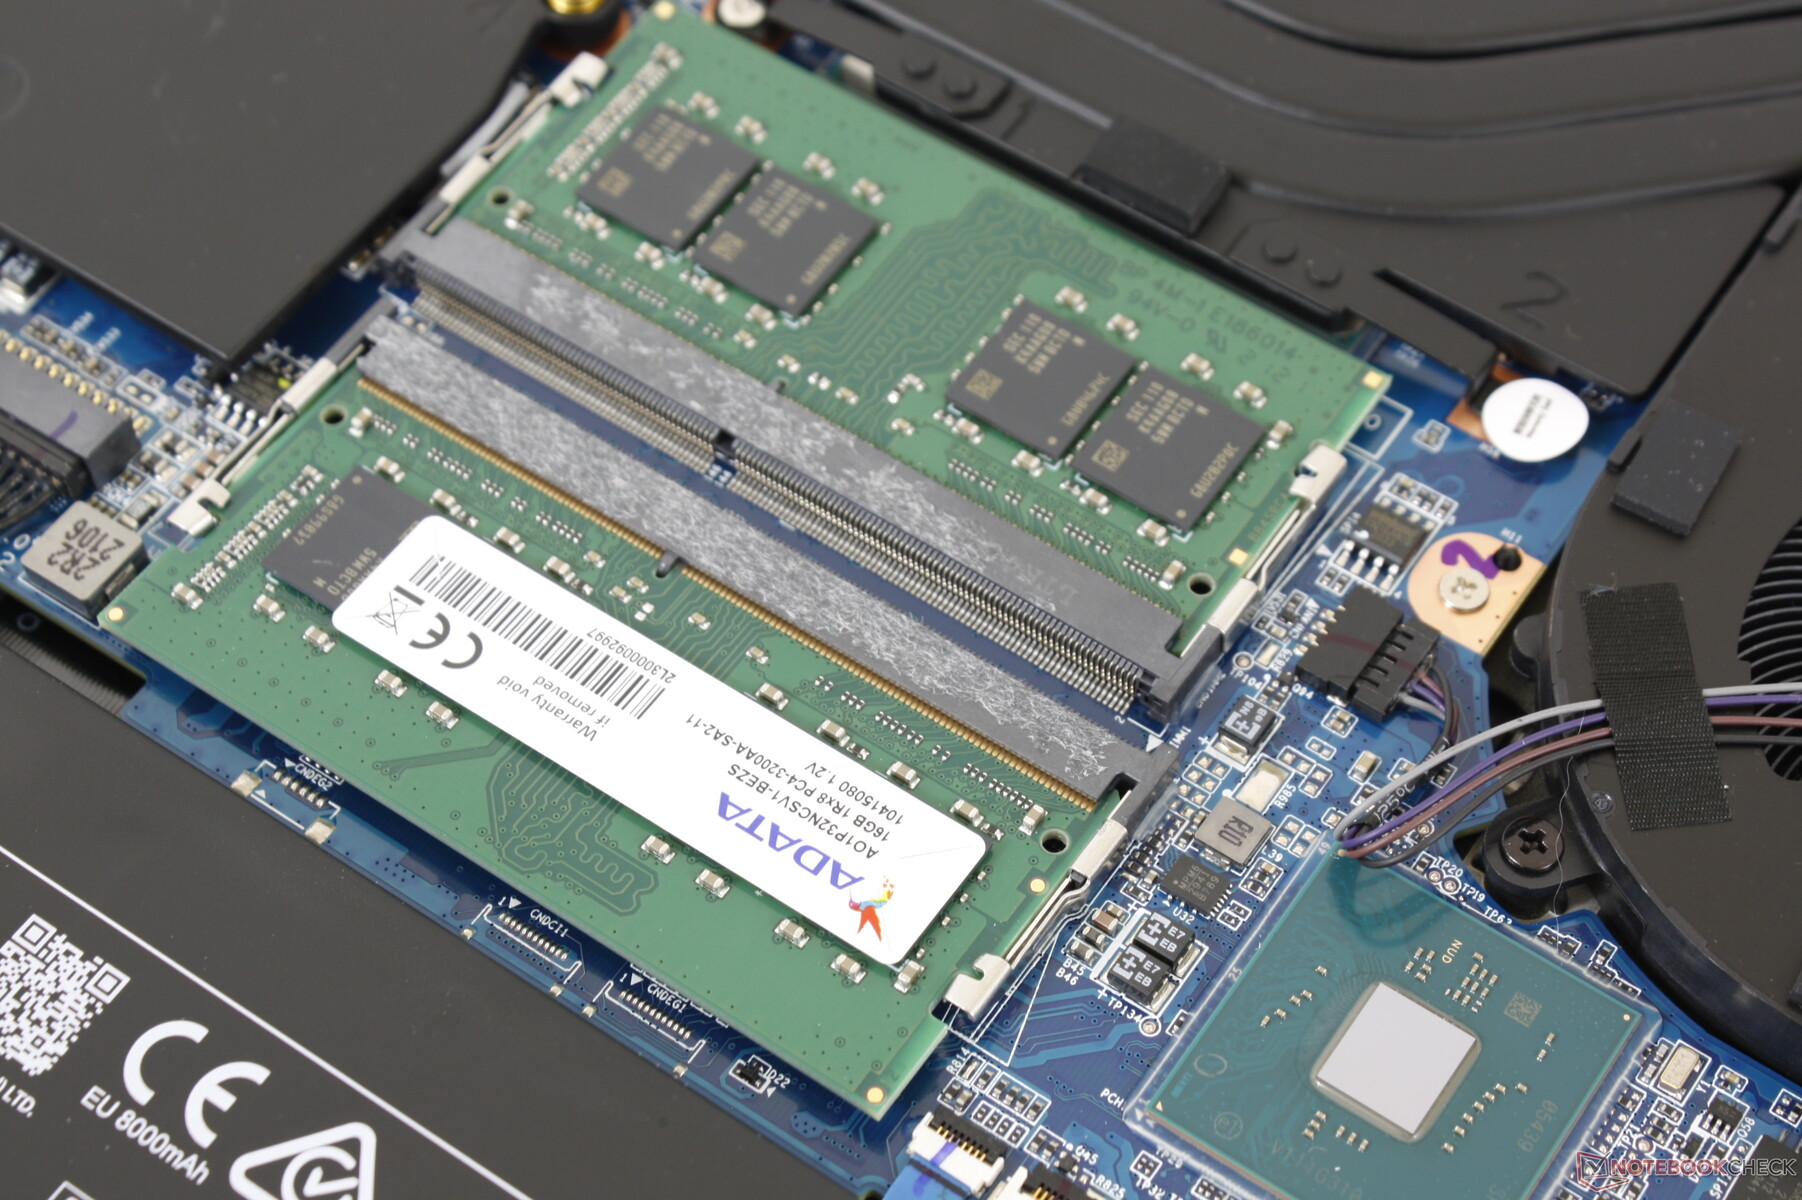
Mantenimiento - Fácil mantenimiento
El panel inferior requiere un destornillador Philips estándar para retirarlo, a diferencia de la llave Torx de la serie Razer Blade. Los propietarios tienen acceso directo a dos ranuras de almacenamiento M.2, dos ranuras SODIMM, la batería y el módulo WLAN.
Accesorios y garantía
La caja de venta al público incluye el manual habitual y el adaptador de CA, sin extras. Se aplica una garantía estándar de un año limitada por el fabricante.
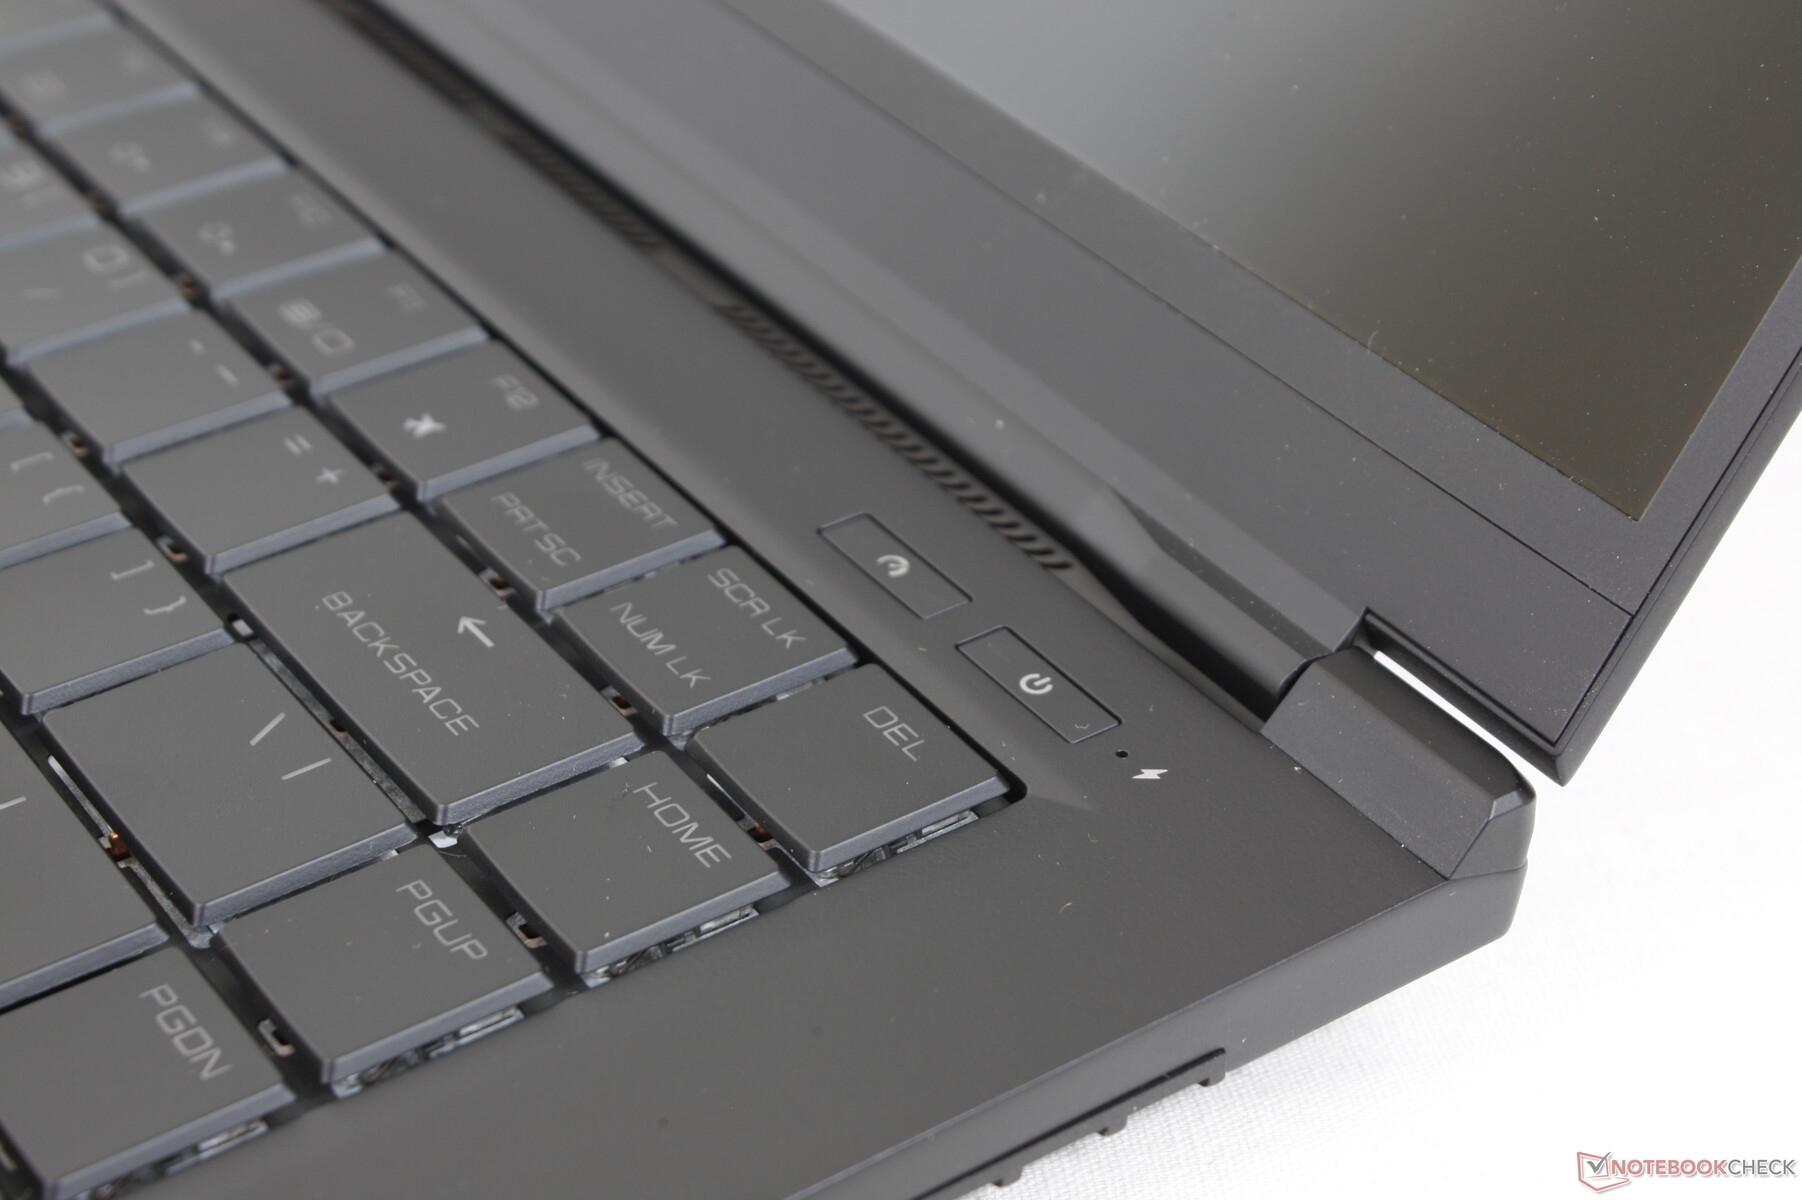
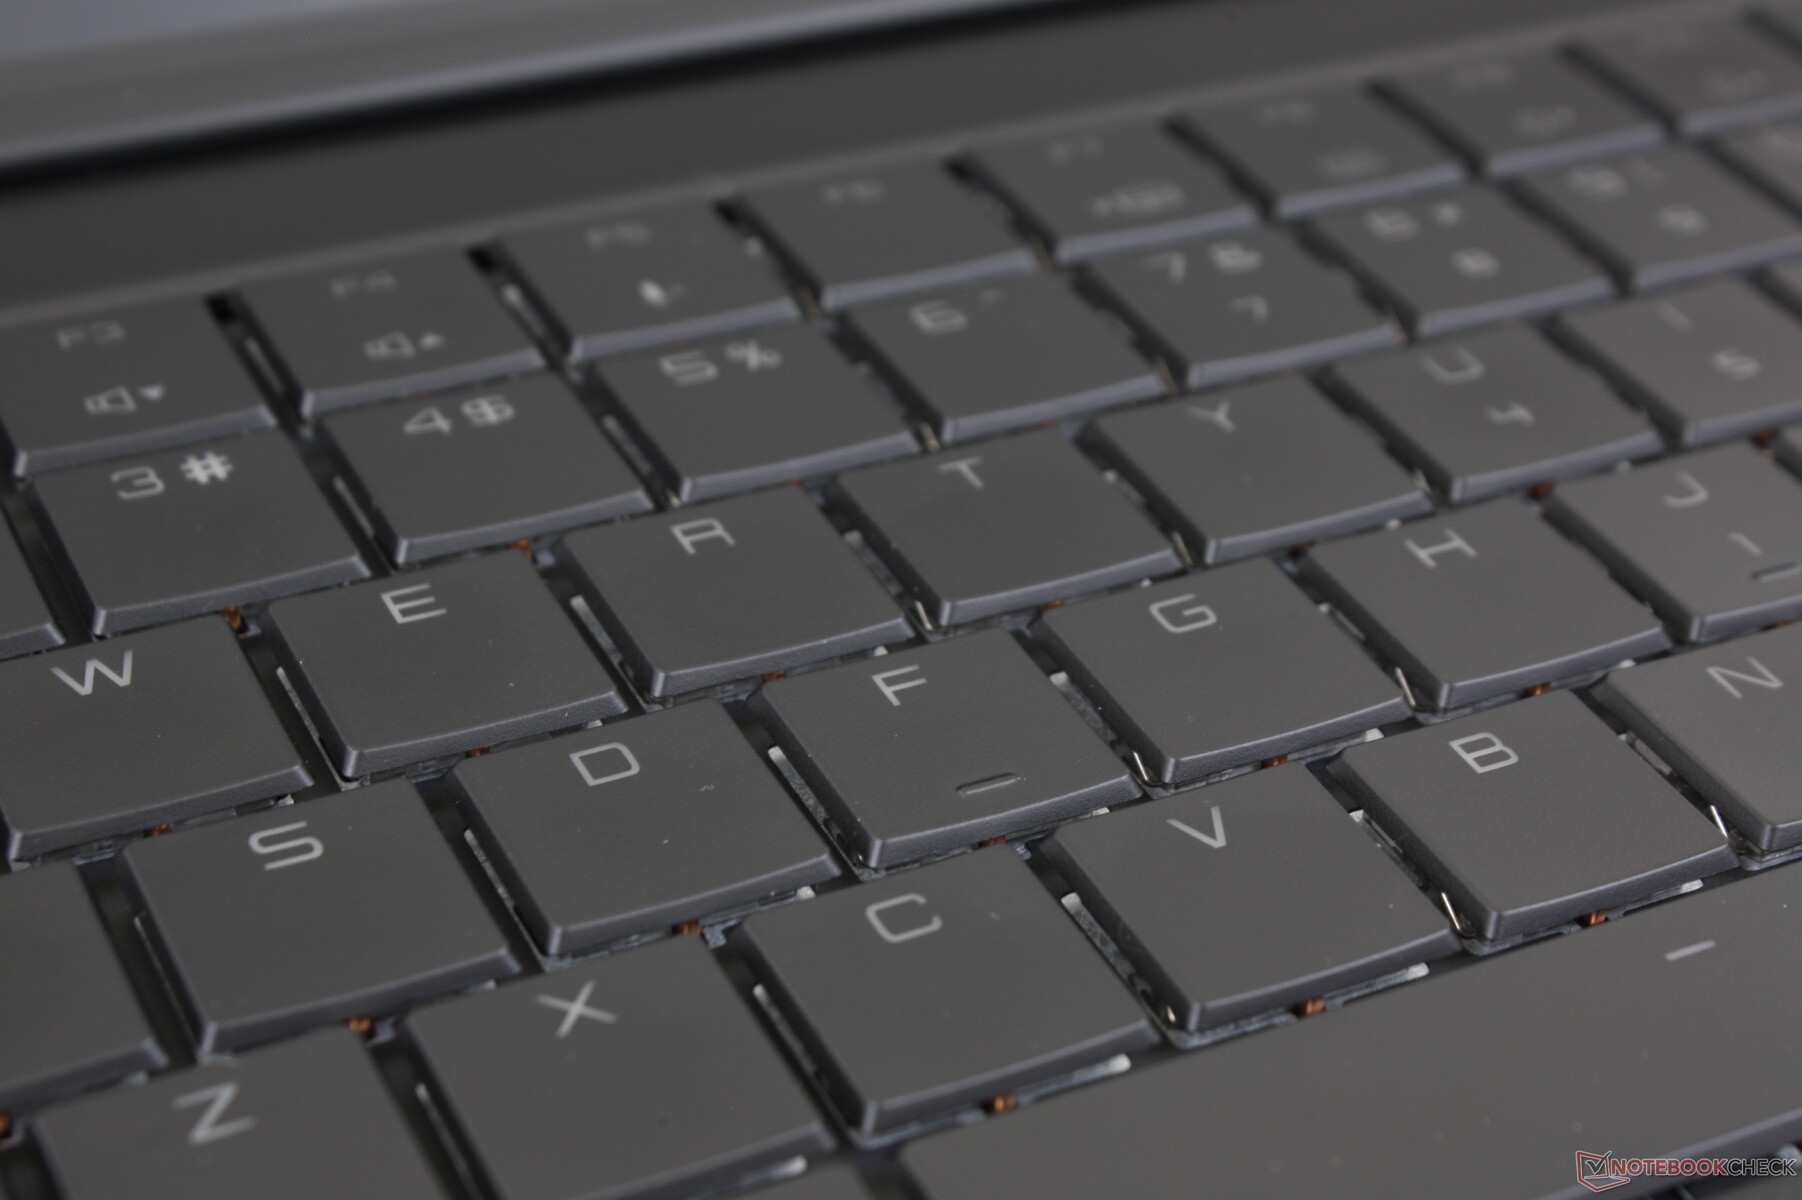
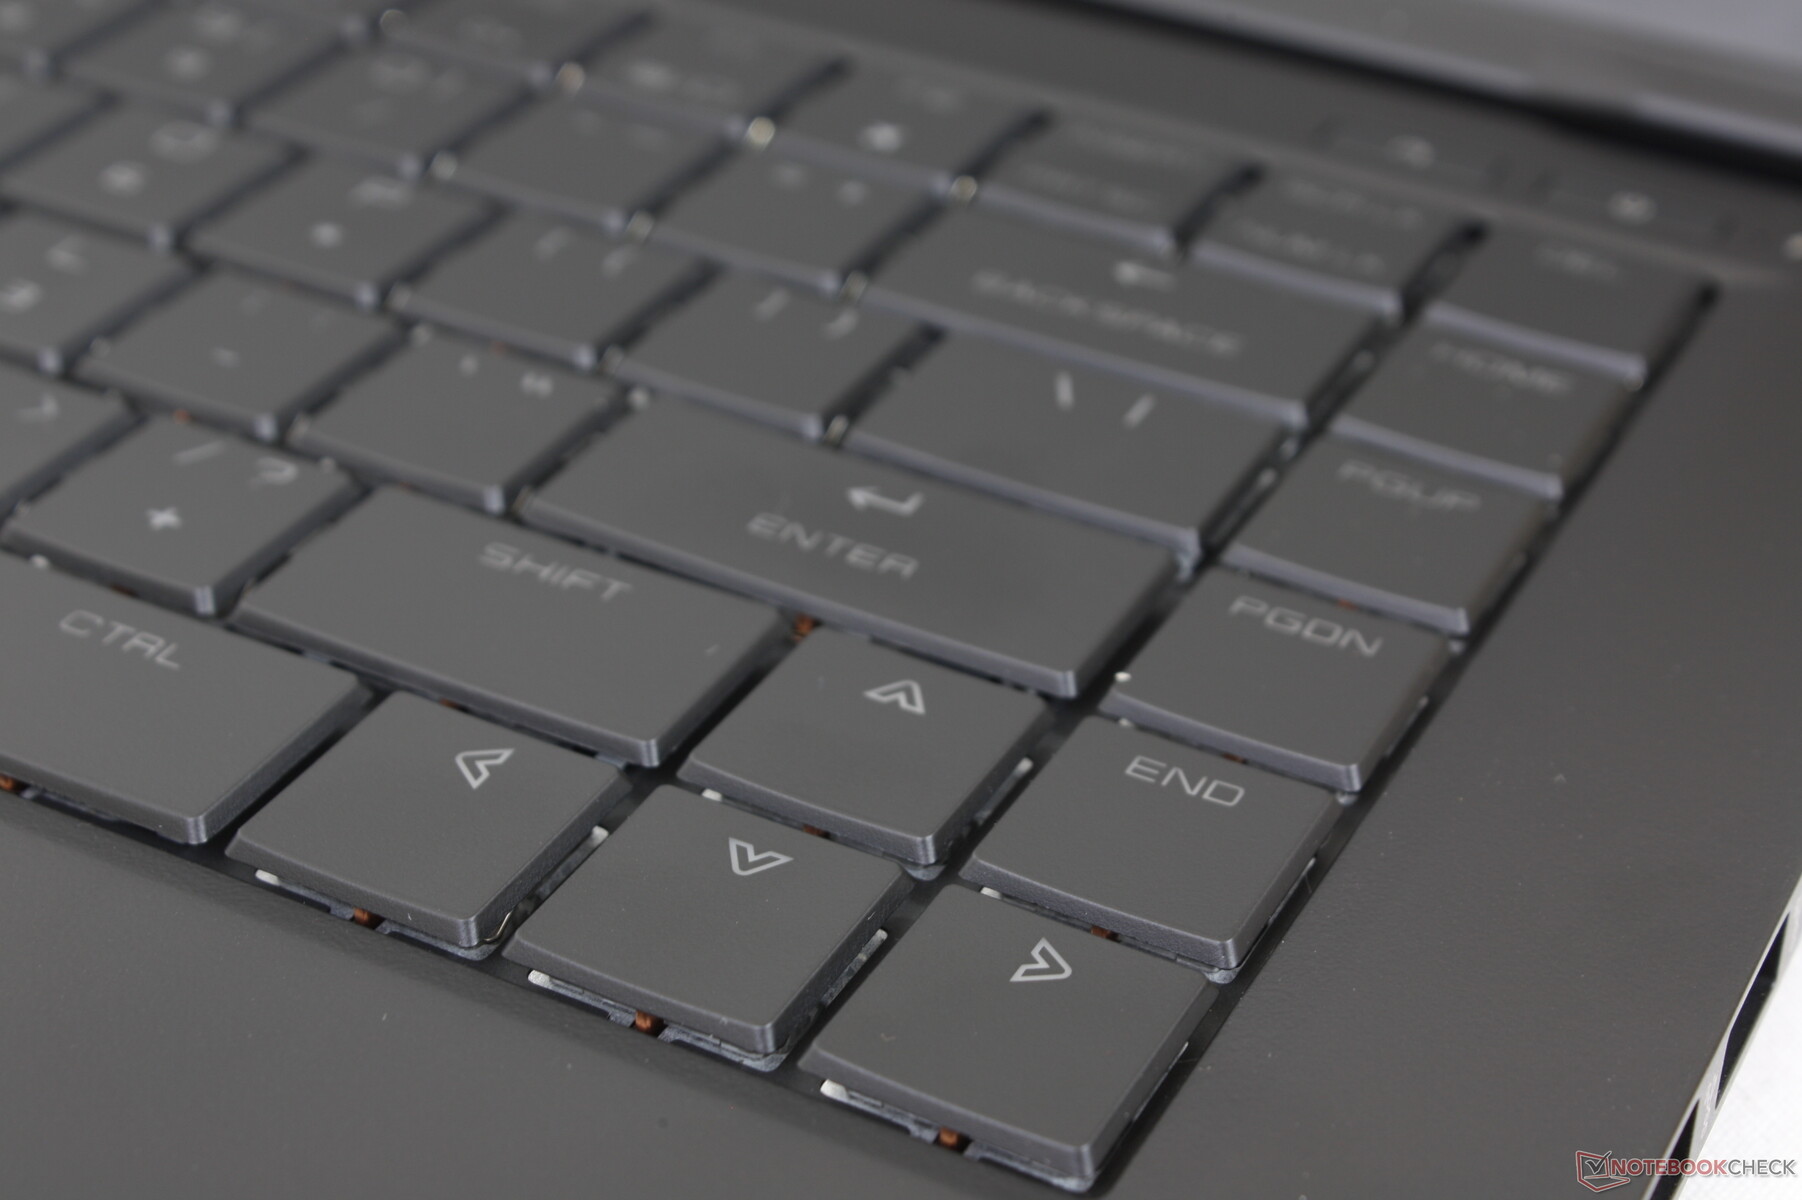
Dispositivos de entrada - Teclas mecánicas ópticas
Teclado
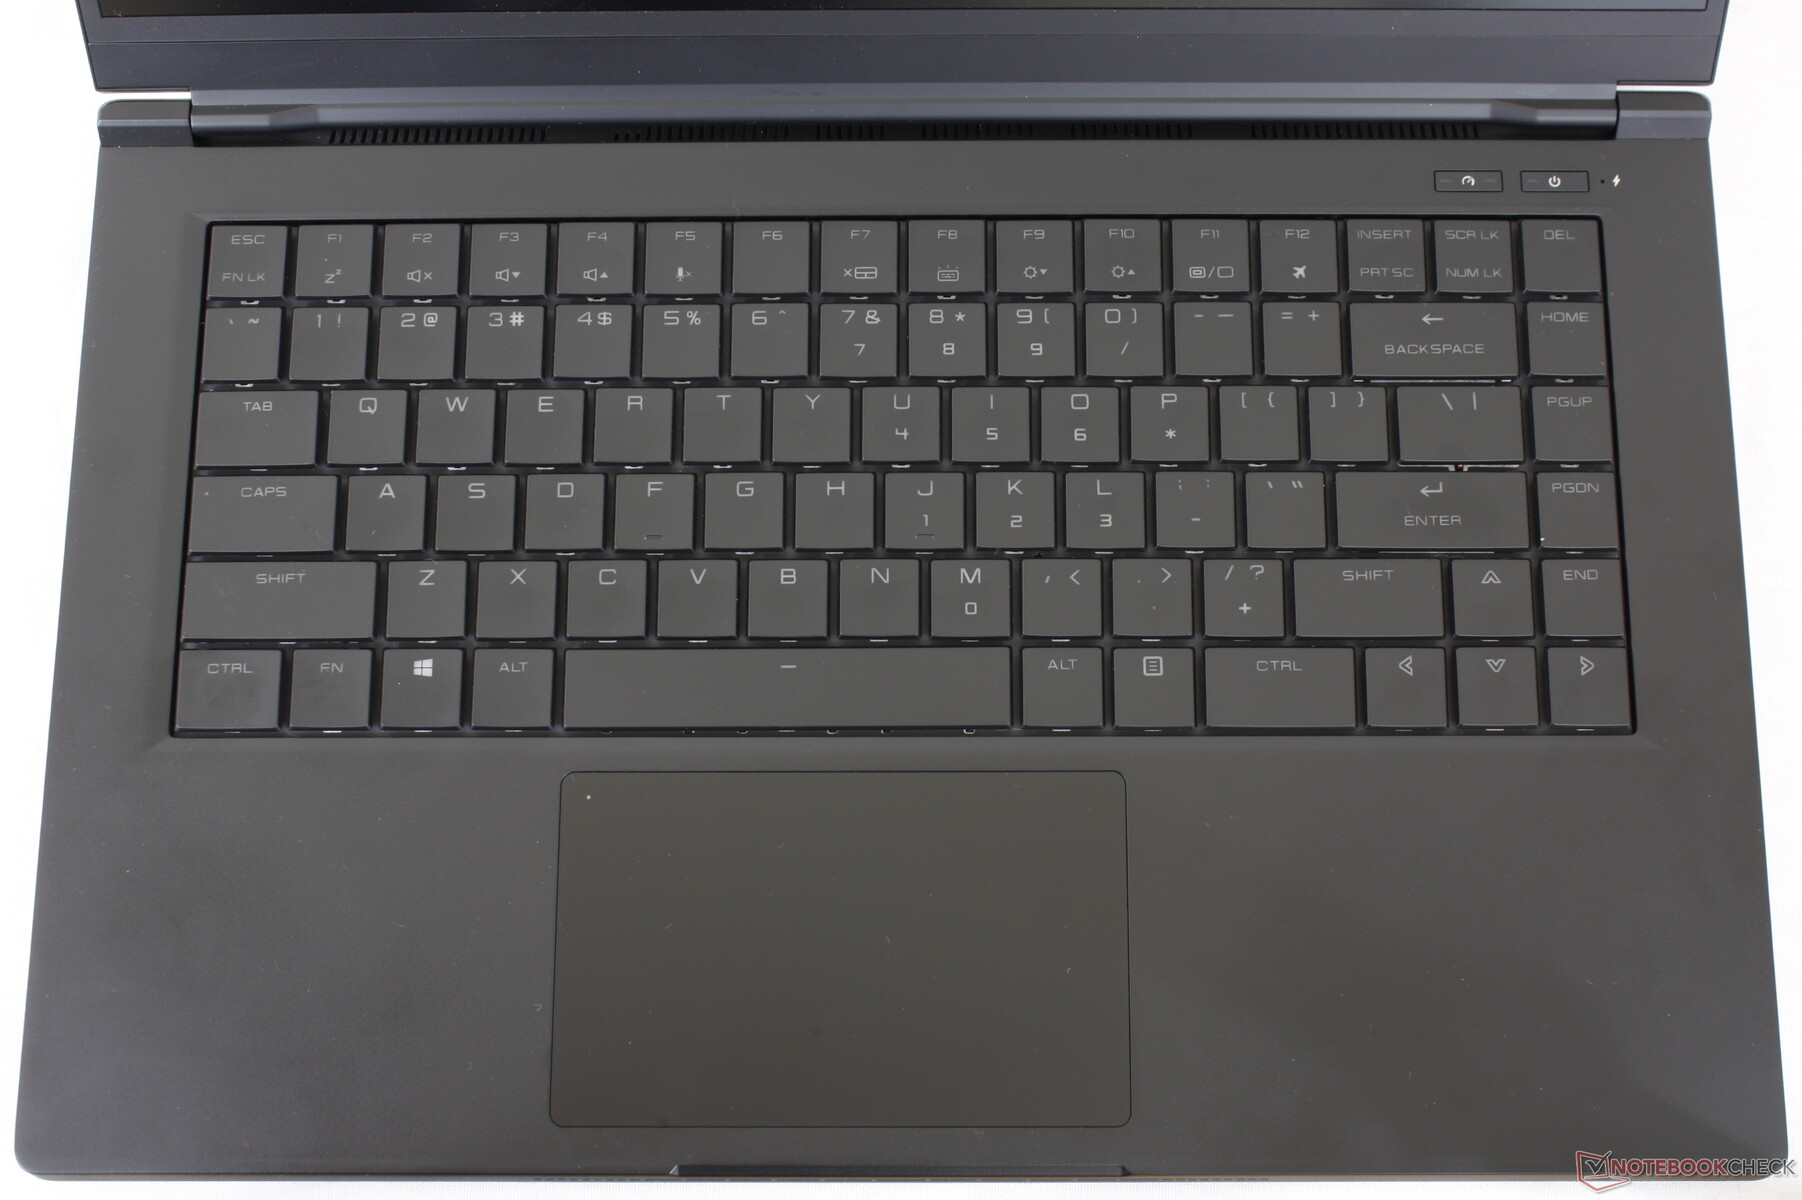
ADATA describe su teclado mecánico óptico como "silencioso" y con una respuesta muy similar a la de los interruptores Cherry Brown. En realidad, estas teclas siguen siendo mucho más ruidosas que las tradicionales de los Ultrabooks, especialmente al pulsar Espacio o Intro. Encontramos que la respuesta es más nítida que la de las teclas del Razer Blade 15 o el MSI GS66 pero más suave que las teclas mecánicas del nuevo Alienware x15
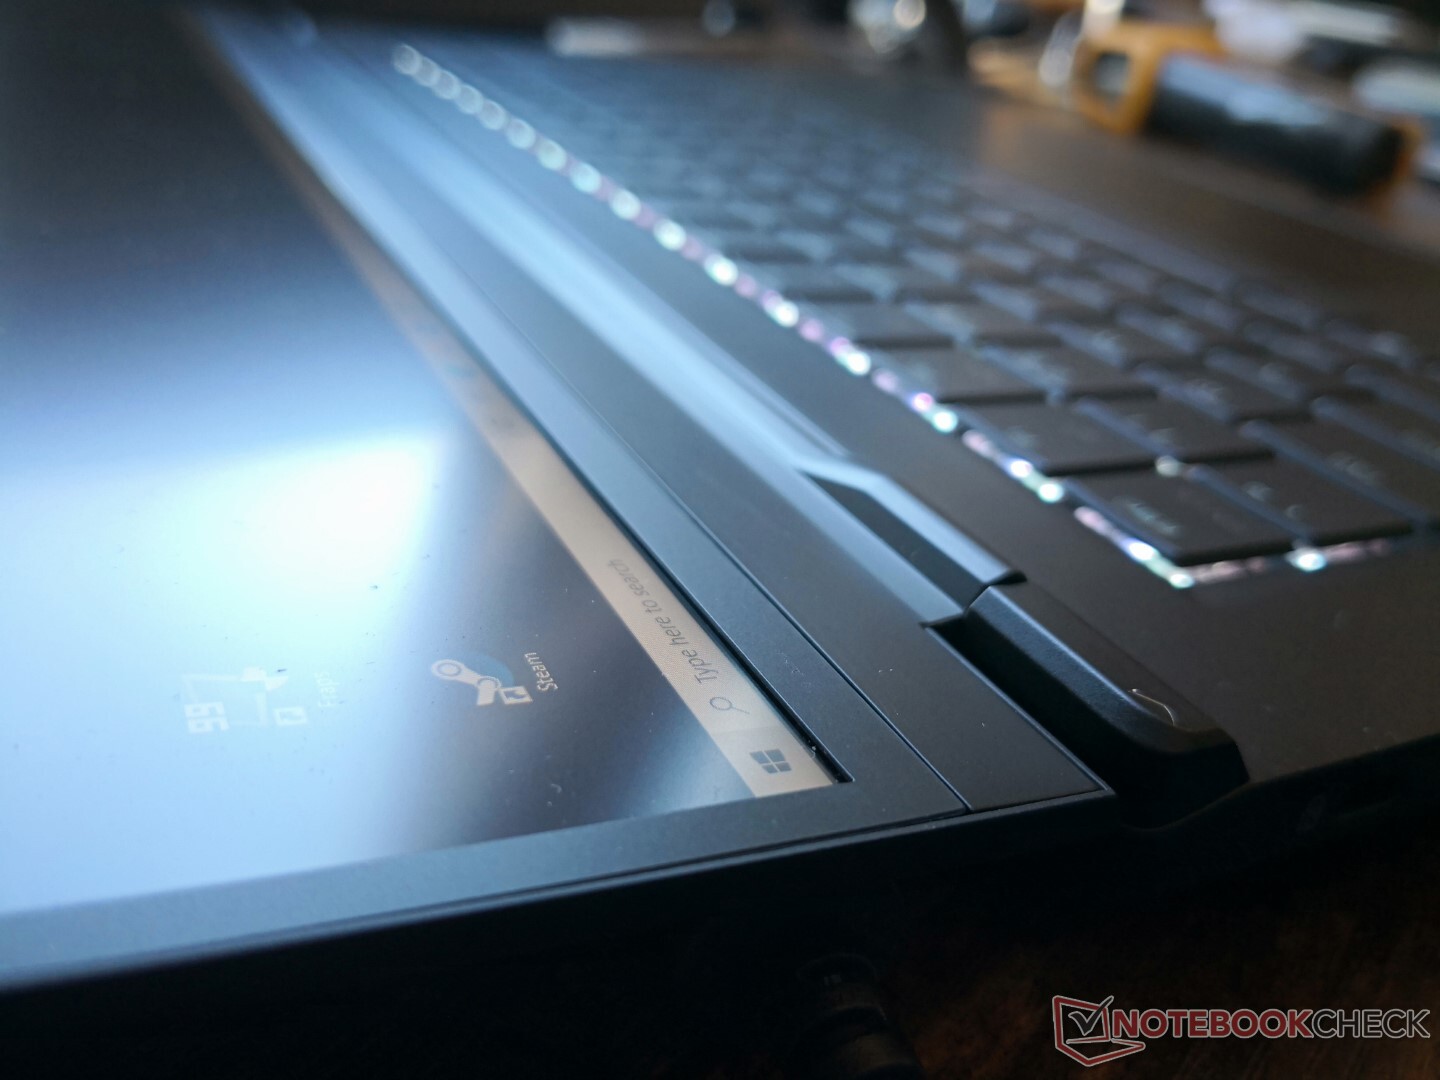
Un punto de crítica particular que tenemos sobre el teclado es que la fuente gris oscura de cada tecla contrasta mal con las tapas negras de las teclas. Por lo tanto, es difícil ver la impresión en cada tecla, incluso cuando en una habitación muy iluminada. Activar la retroiluminación alivia este problema, pero los usuarios no deberían estar obligados a encender la retroiluminación sólo para poder ver las teclas, especialmente si la duración de la batería es una preocupación.
Todos los símbolos de las teclas primarias y secundarias están retroiluminados a diferencia del Alienware x15.
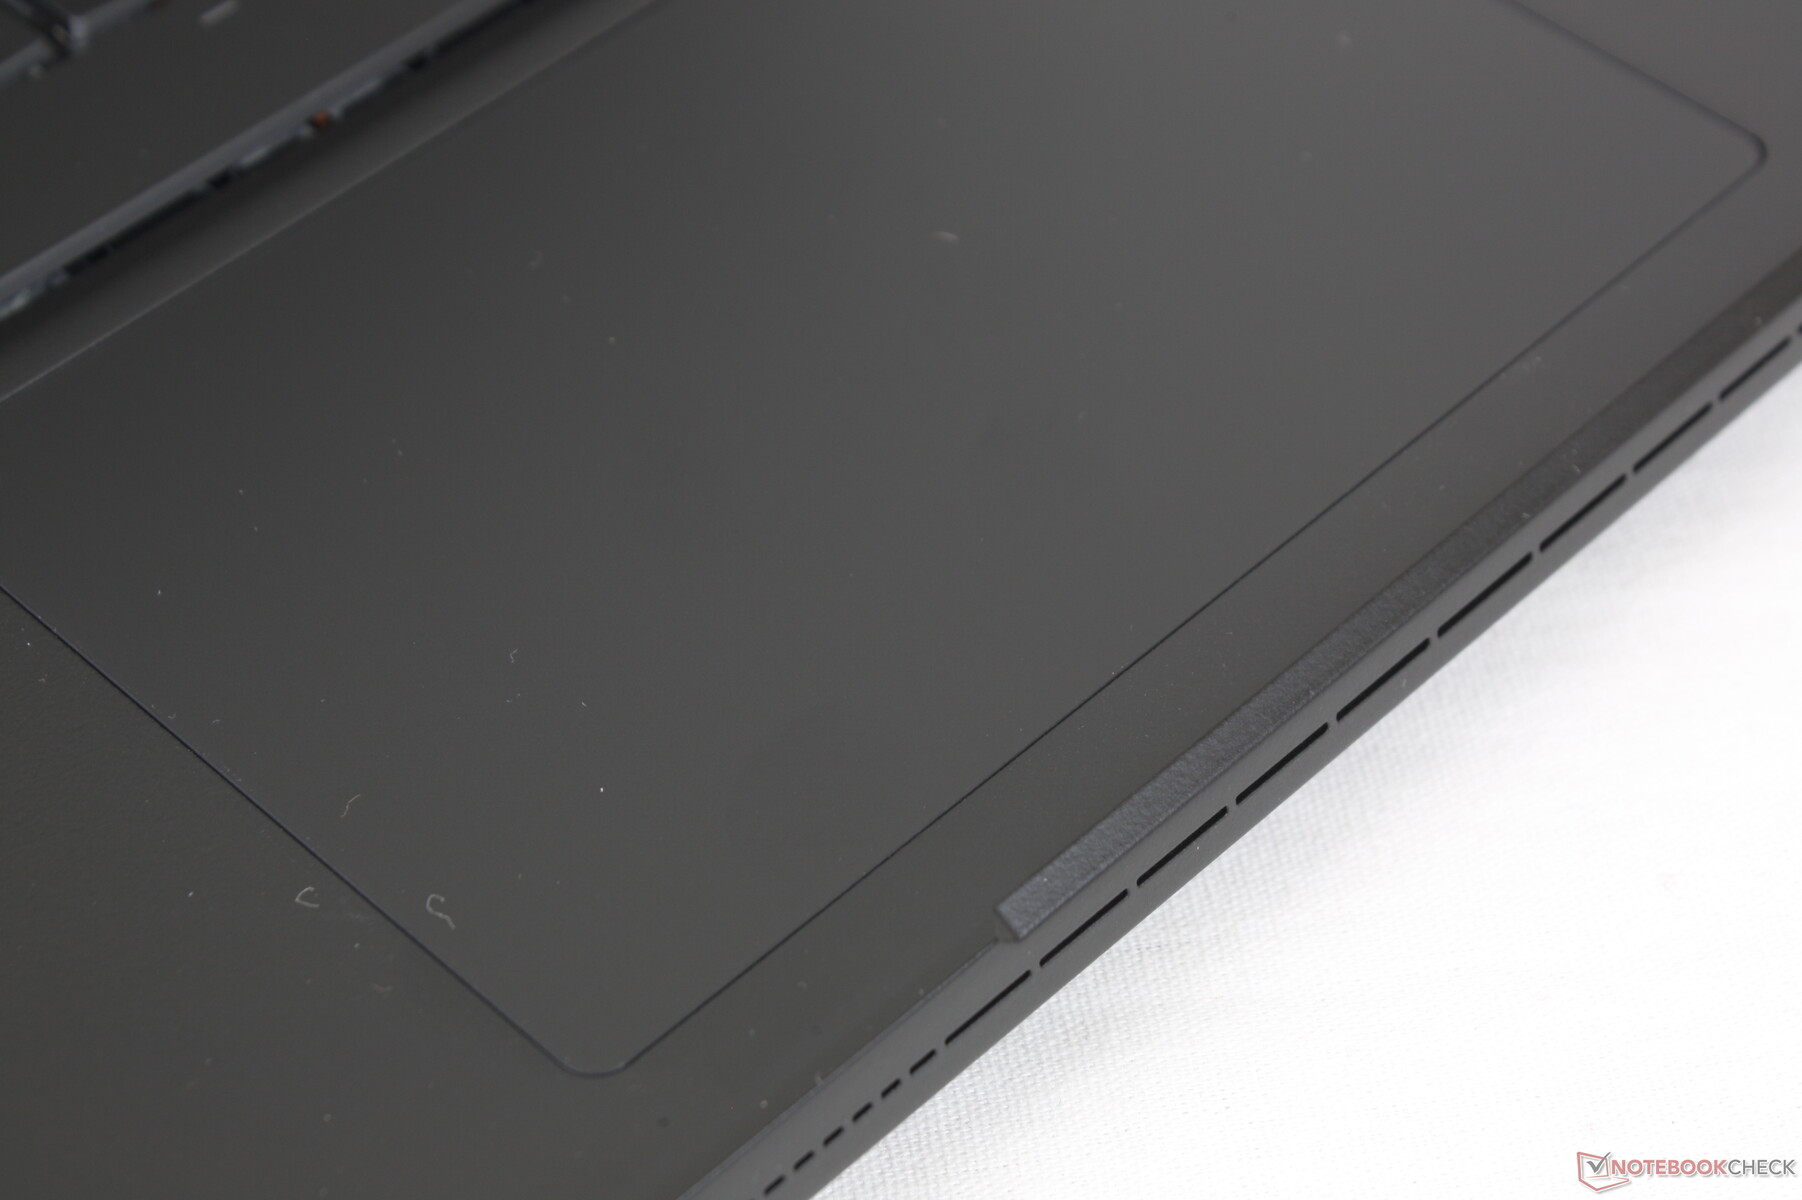
Panel táctil
El clickpad es más pequeño que el del Razer Blade 15 (11,6 x 7,2 cm frente a 13 x 8 cm). Sin embargo, encontramos que el clickpad del sistema ADATA es más cómodo de usar simplemente porque sus teclas de ratón integradas no son tan esponjosas como las del Razer. La respuesta es más rápida y más ruidosa para una experiencia más satisfactoria.
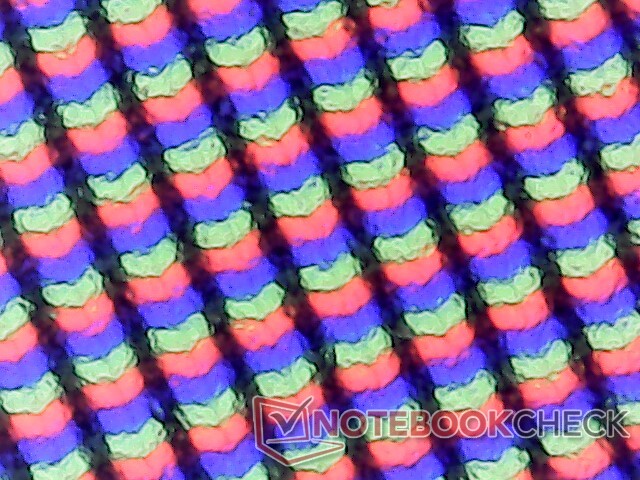
Pantalla: casi perfecta para los juegos
El XPG Xenia 15 utiliza exactamente el mismo panel BOE NE156QHM-NY2 1440p IPS que se encuentra en el Schenker XMG Core 15 o el XMG Neo 15. Por lo tanto, la experiencia de visualización aquí es muy similar en lo que respecta a los colores, la resolución, las tasas de refresco y los tiempos de respuesta. Los dos últimos, en particular, son muy rápidos, con 165 Hz y 25,6 ms combinados, respectivamente, lo que hace que este panel 1440p sea excelente para jugar sin problemas y con un ghosting mínimo.
El principal inconveniente de este panel es su falta de compatibilidad con G-Sync. Aquí no se admite Advanced Optimus, por lo que los usuarios tendrán que conformarse con el Optimus normal. Se admite G-Sync en monitores externos.

| |||||||||||||||||||||||||
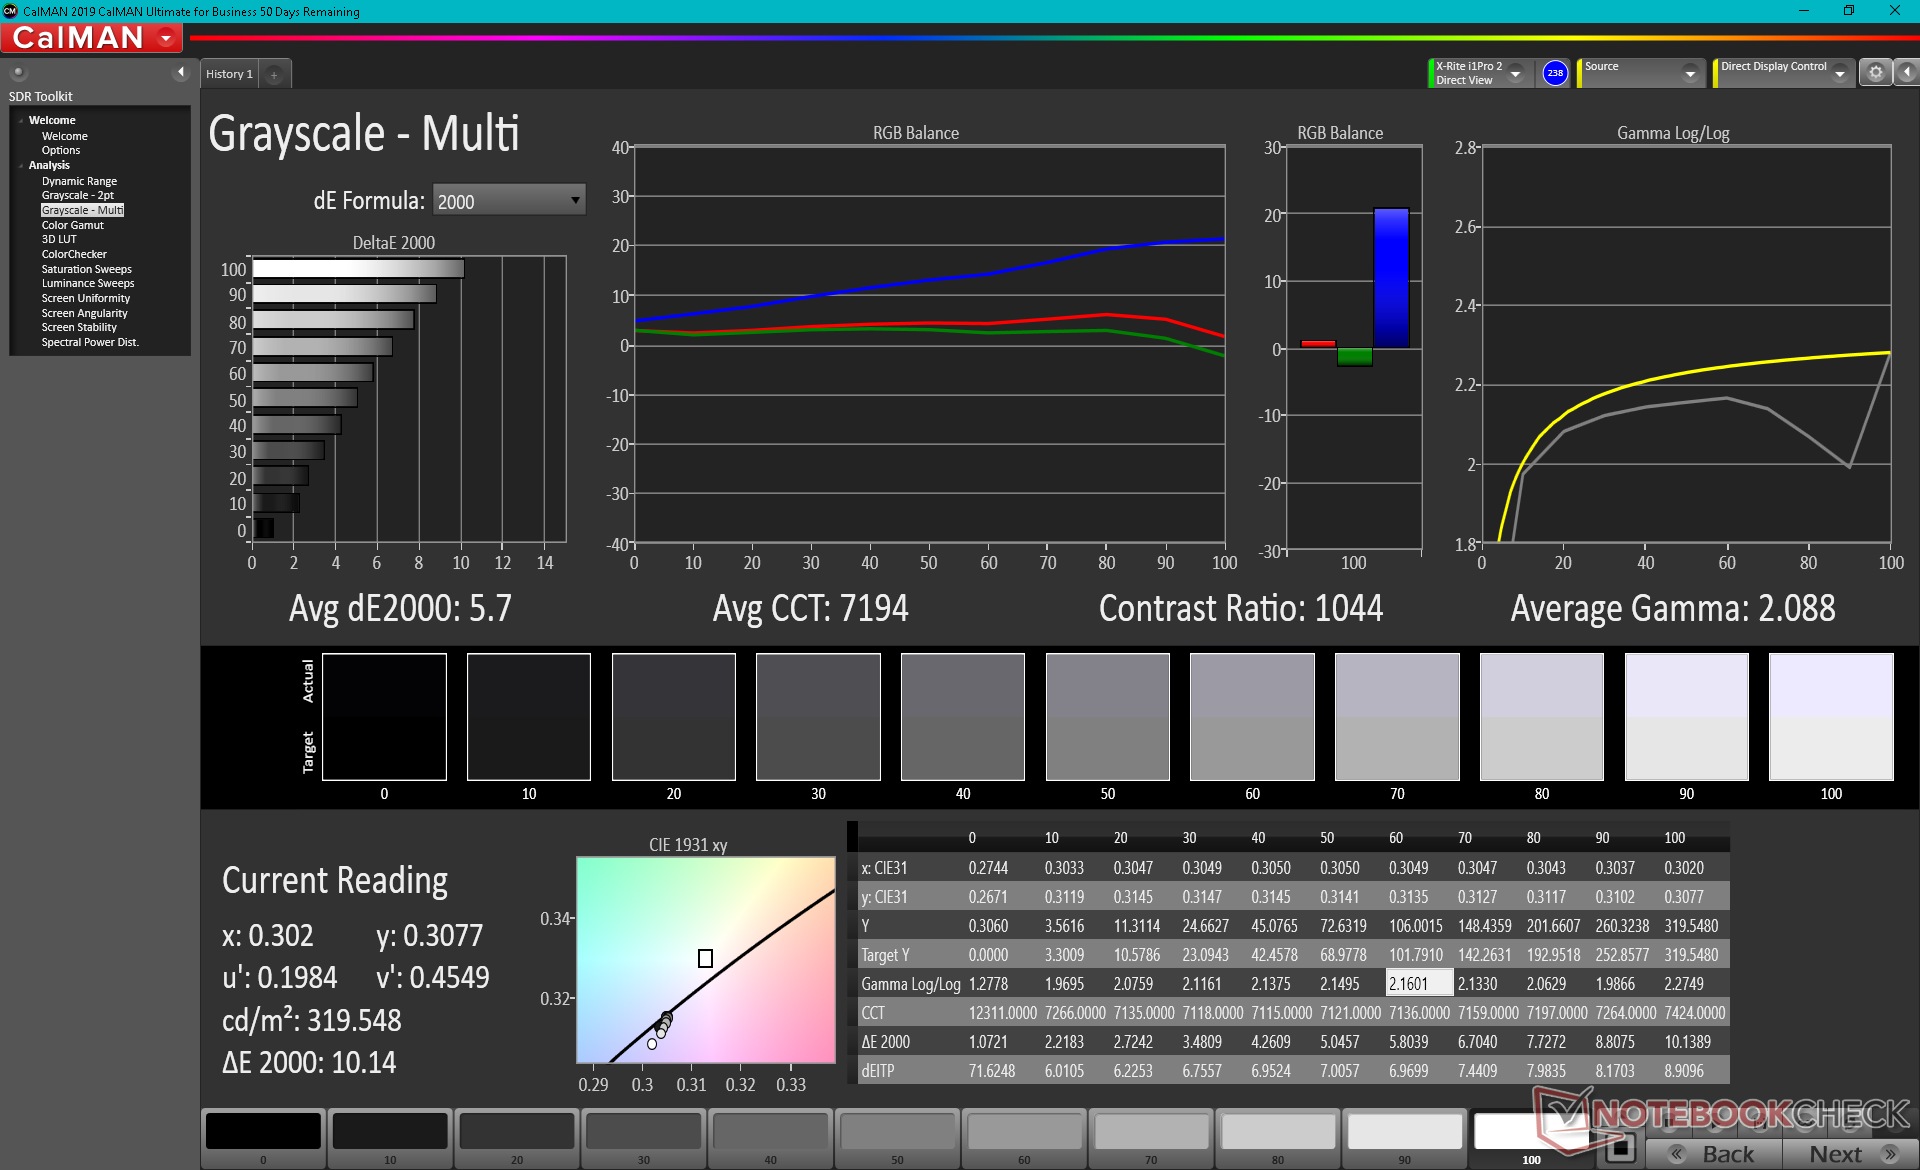
iluminación: 82 %
Brillo con batería: 321.1 cd/m²
Contraste: 845:1 (Negro: 0.38 cd/m²)
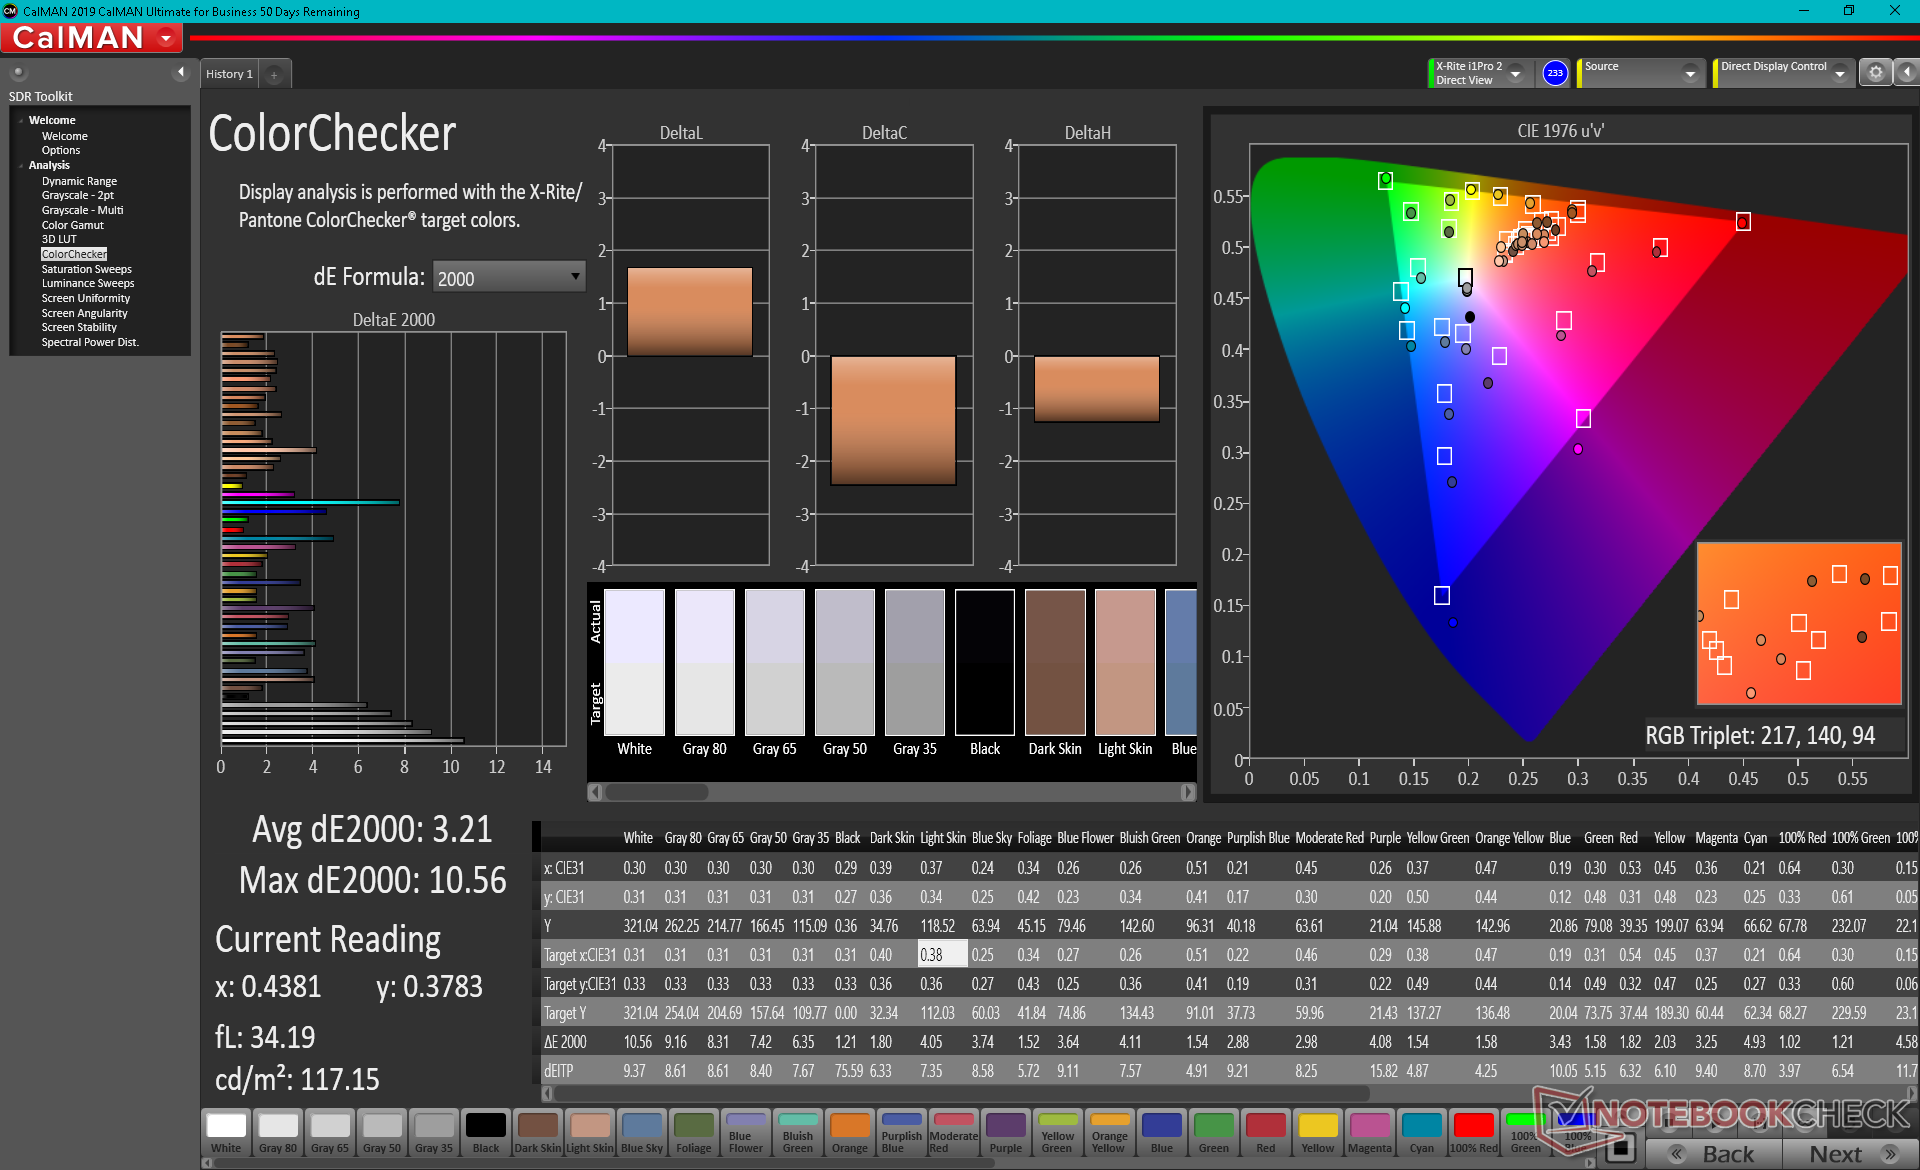
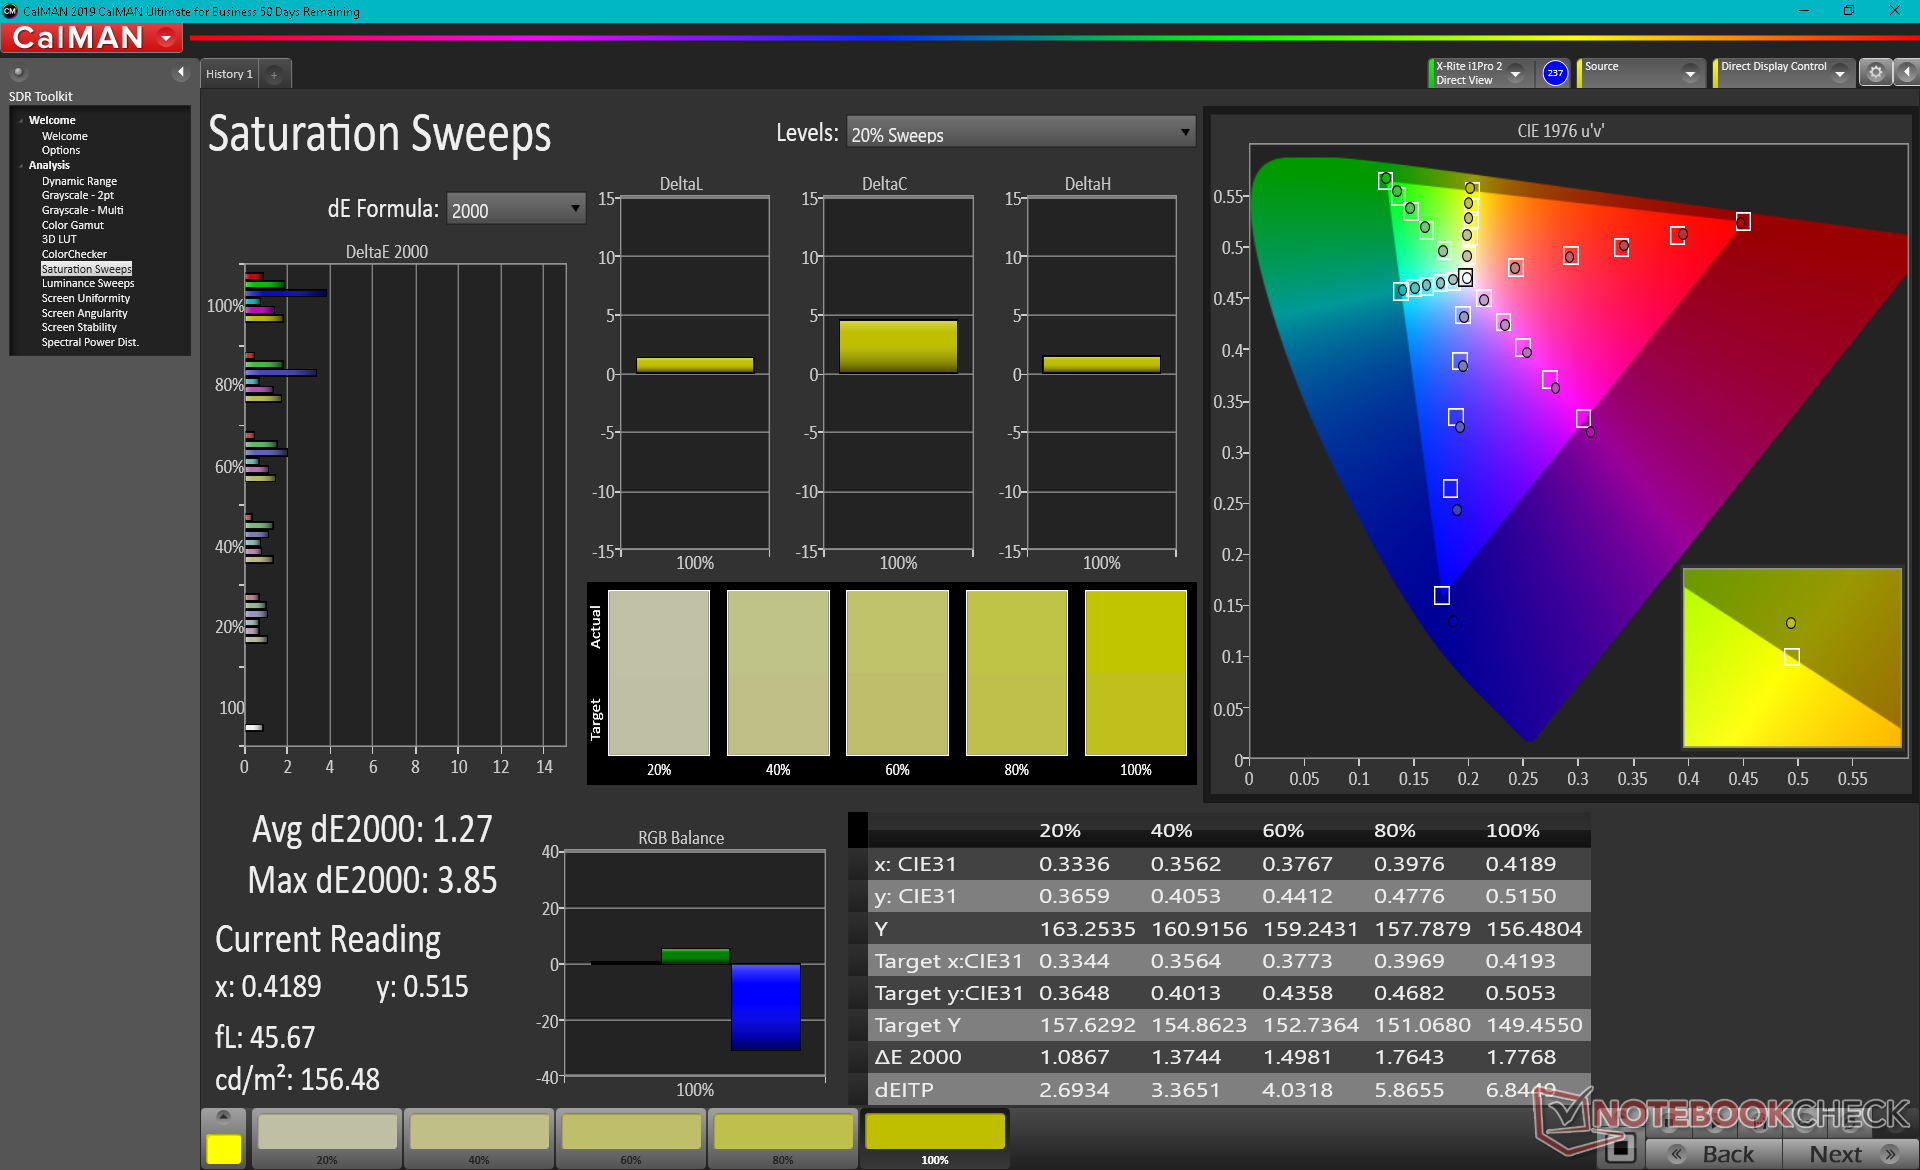
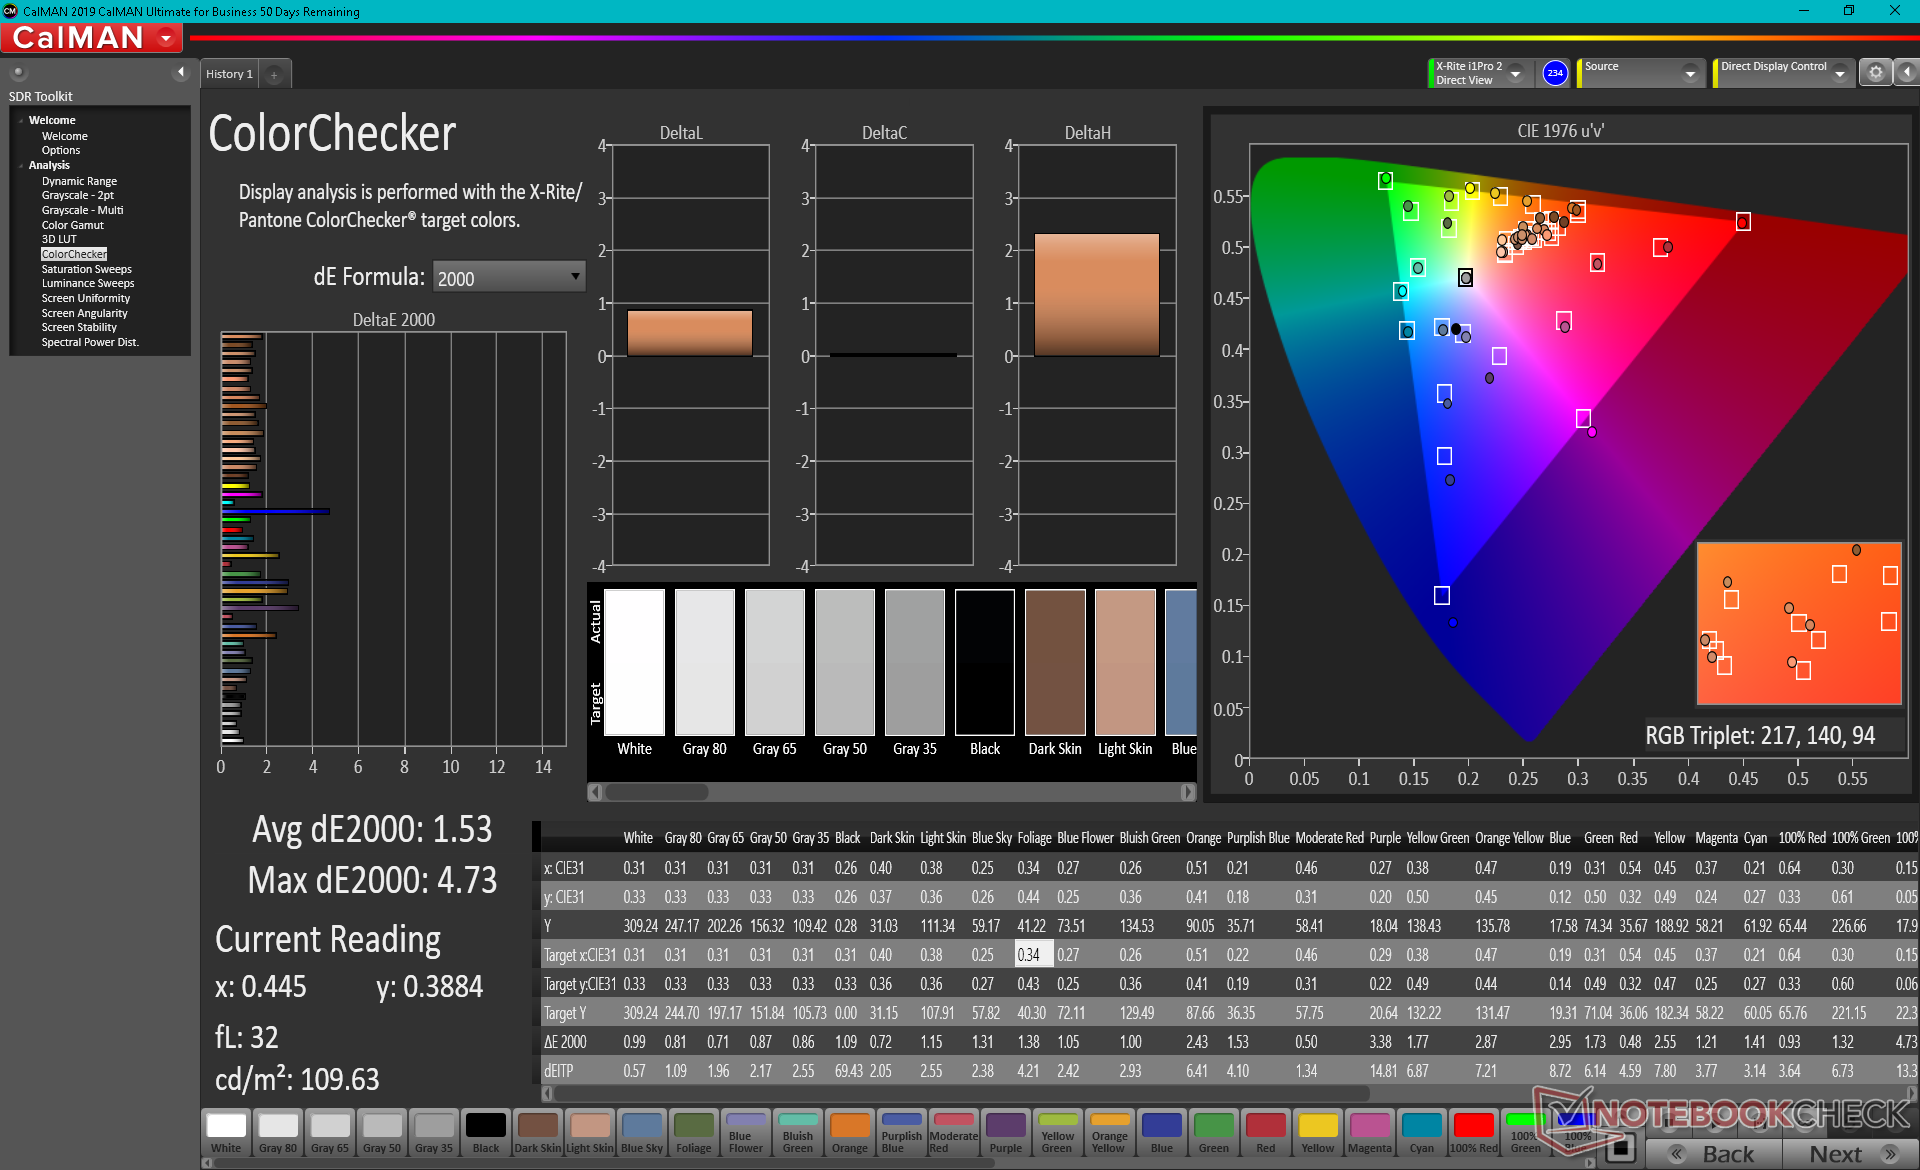
ΔE ColorChecker Calman: 3.21 | ∀{0.5-29.43 Ø4.71}
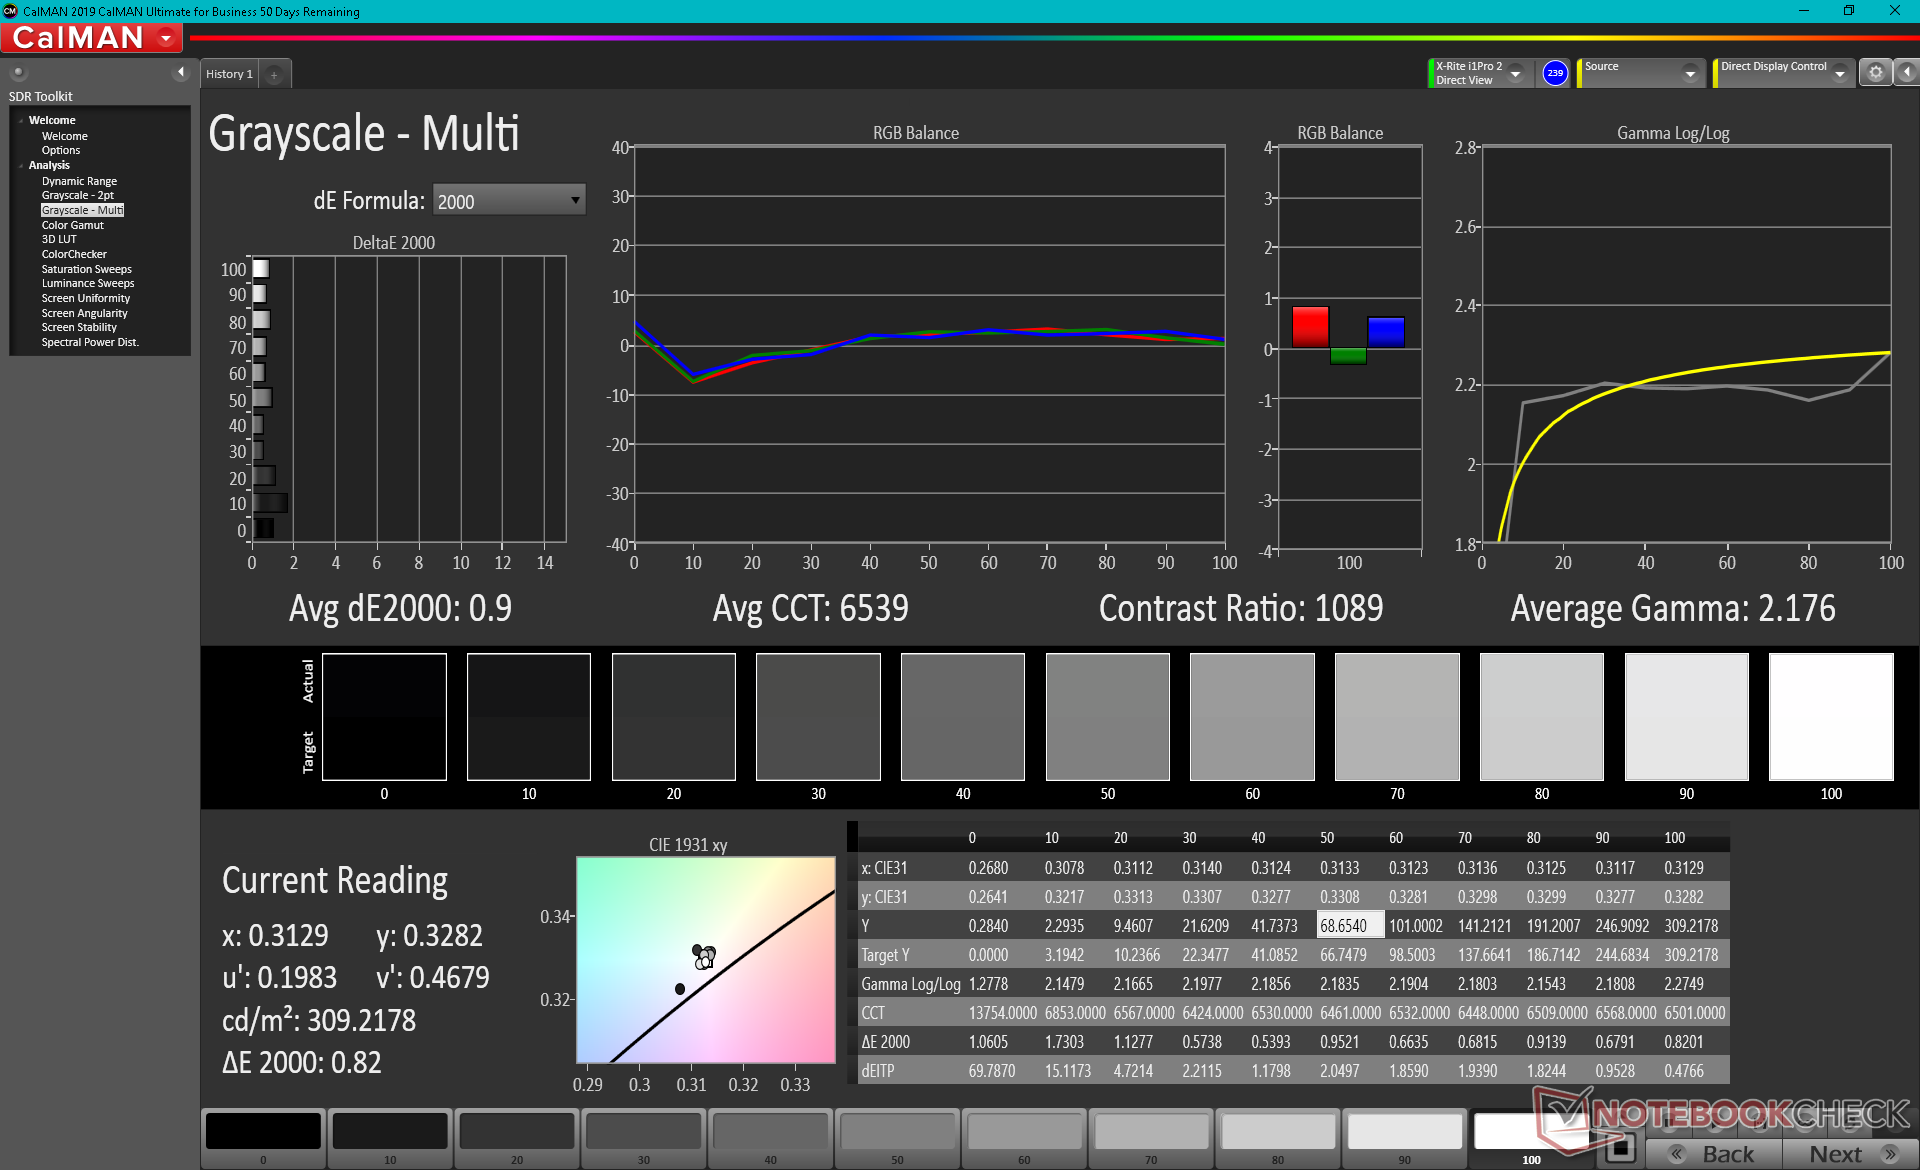
calibrated: 1.53
ΔE Greyscale Calman: 5.7 | ∀{0.09-98 Ø4.96}
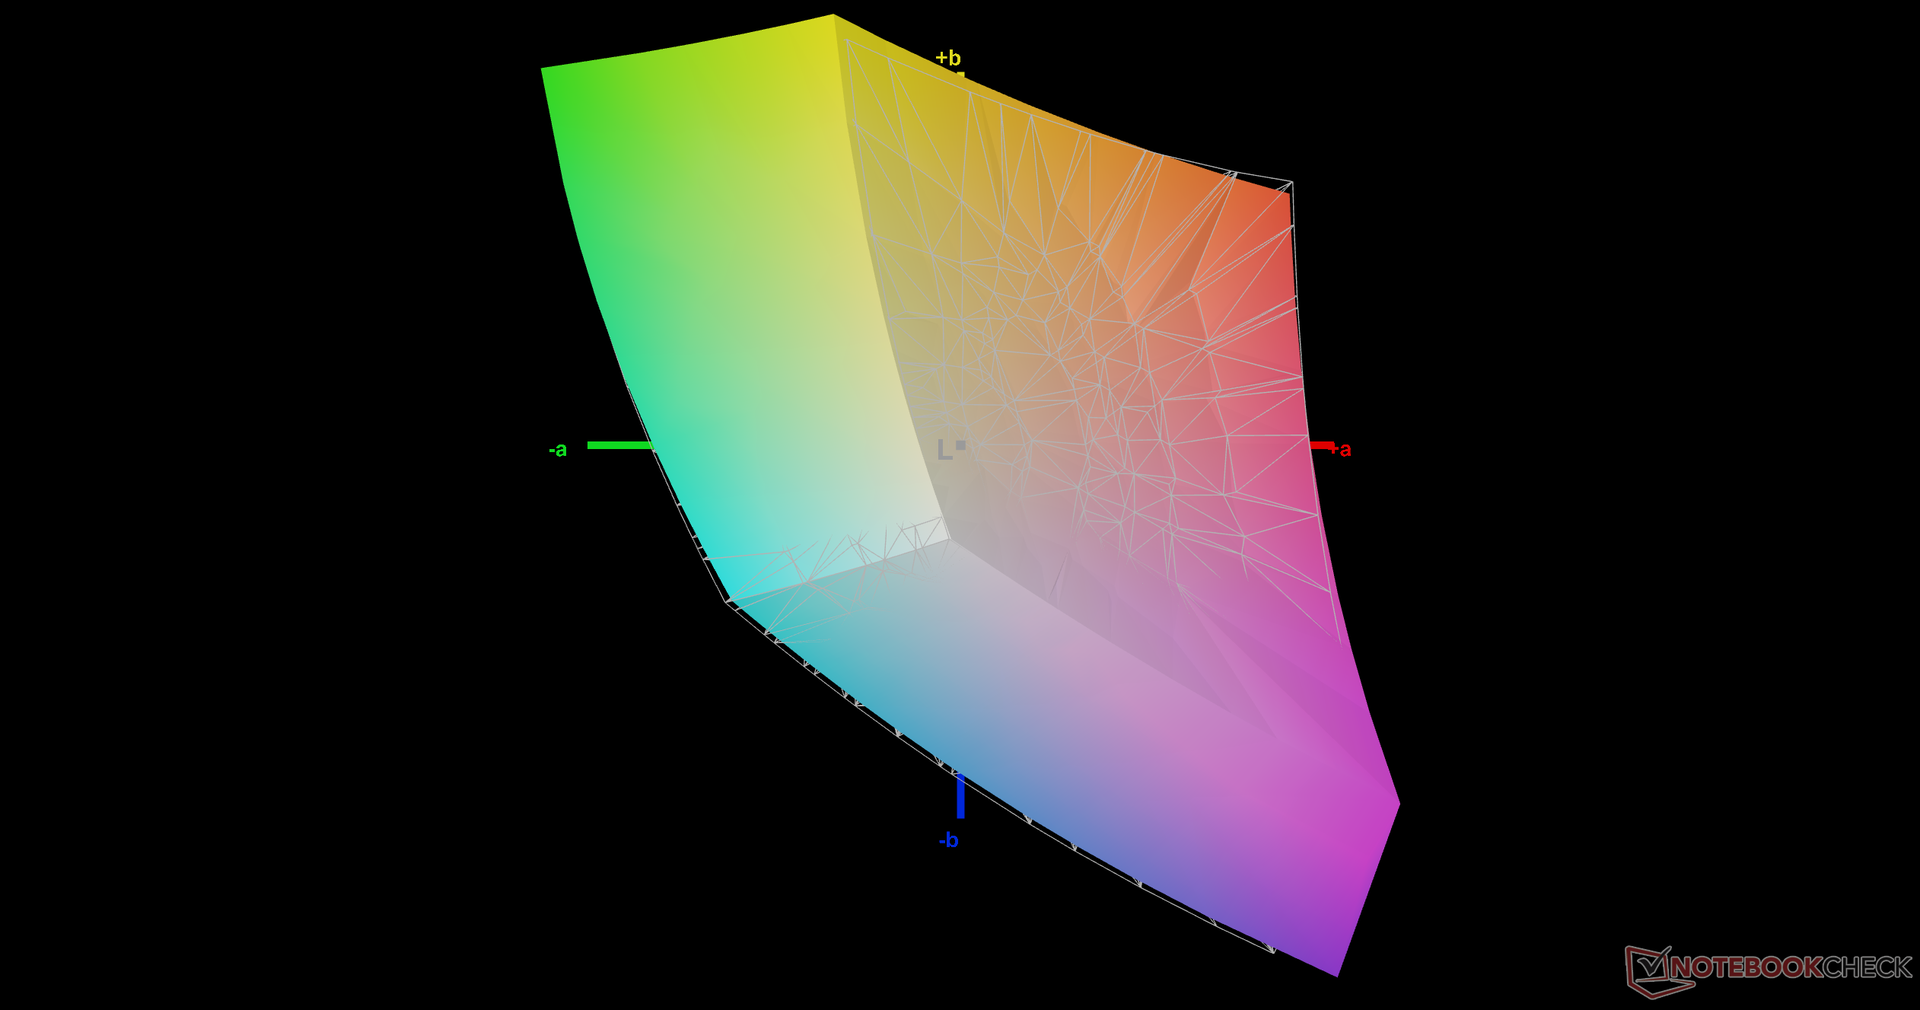
69.1% AdobeRGB 1998 (Argyll 3D)
98.1% sRGB (Argyll 3D)
68.2% Display P3 (Argyll 3D)
Gamma: 2.09
CCT: 7194 K
| ADATA XPG Xenia 15 BOE CQ NE156QHM-NY2, IPS, 15.6", 2560x1440 | MSI Delta 15 A5EFK LQ156M1JW03 (SHP155D), IPS-Level, 15.6", 1920x1080 | Alienware x15 RTX 3070 P111F LG Philips 156QHG, IPS, 15.6", 2560x1440 | Razer Blade 15 Advanced (Mid 2021) TL156VDXP02-0, IPS, 15.6", 1920x1080 | MSI GS66 Stealth 10UG AU Optronics B156HAN12.0, IPS, 15.6", 1920x1080 | Asus ROG Zephyrus G15 GA503Q CMN N156KME-GNA (CMN152A), IPS-Level, 15.6", 2560x1440 | |
|---|---|---|---|---|---|---|
| Display | -1% | 23% | -1% | -0% | 23% | |
| Display P3 Coverage (%) | 68.2 | 66.5 -2% | 97.8 43% | 66.9 -2% | 67.7 -1% | 97.3 43% |
| sRGB Coverage (%) | 98.1 | 97.8 0% | 99.9 2% | 97.1 -1% | 98.4 0% | 99.9 2% |
| AdobeRGB 1998 Coverage (%) | 69.1 | 67.6 -2% | 69 0% | 69.1 0% | 86.2 25% | |
| Response Times | 10% | 13% | 43% | -2% | 21% | |
| Response Time Grey 50% / Grey 80% * (ms) | 13.6 ? | 12.8 ? 6% | 12 ? 12% | 4.2 ? 69% | 14.4 ? -6% | 8.8 ? 35% |
| Response Time Black / White * (ms) | 12 ? | 10.4 ? 13% | 10.4 ? 13% | 10 ? 17% | 11.6 ? 3% | 11.2 ? 7% |
| PWM Frequency (Hz) | 23580 ? | |||||
| Screen | 10% | 14% | 26% | 16% | -0% | |
| Brightness middle (cd/m²) | 321.1 | 291 -9% | 409.5 28% | 353.4 10% | 259.5 -19% | 327 2% |
| Brightness (cd/m²) | 308 | 266 -14% | 390 27% | 340 10% | 264 -14% | 309 0% |
| Brightness Distribution (%) | 82 | 88 7% | 88 7% | 92 12% | 90 10% | 89 9% |
| Black Level * (cd/m²) | 0.38 | 0.36 5% | 0.47 -24% | 0.31 18% | 0.25 34% | 0.33 13% |
| Contrast (:1) | 845 | 808 -4% | 871 3% | 1140 35% | 1038 23% | 991 17% |
| Colorchecker dE 2000 * | 3.21 | 2.98 7% | 3.48 -8% | 2.17 32% | 2.52 21% | 4.49 -40% |
| Colorchecker dE 2000 max. * | 10.56 | 7.59 28% | 6.31 40% | 5.69 46% | 5.55 47% | 8.42 20% |
| Colorchecker dE 2000 calibrated * | 1.53 | 0.91 41% | 0.89 42% | 1.05 31% | 1.93 -26% | 2.27 -48% |
| Greyscale dE 2000 * | 5.7 | 4.2 26% | 5 12% | 3.4 40% | 1.7 70% | 4.2 26% |
| Gamma | 2.09 105% | 2.293 96% | 2.16 102% | 2.2 100% | 2.04 108% | 2.173 101% |
| CCT | 7194 90% | 7624 85% | 6591 99% | 6830 95% | 6414 101% | 7014 93% |
| Color Space (Percent of AdobeRGB 1998) (%) | 63.3 | 86 | ||||
| Color Space (Percent of sRGB) (%) | 98.8 | 99 | ||||
| Media total (Programa/Opciones) | 6% /
7% | 17% /
15% | 23% /
23% | 5% /
10% | 15% /
8% |
* ... más pequeño es mejor
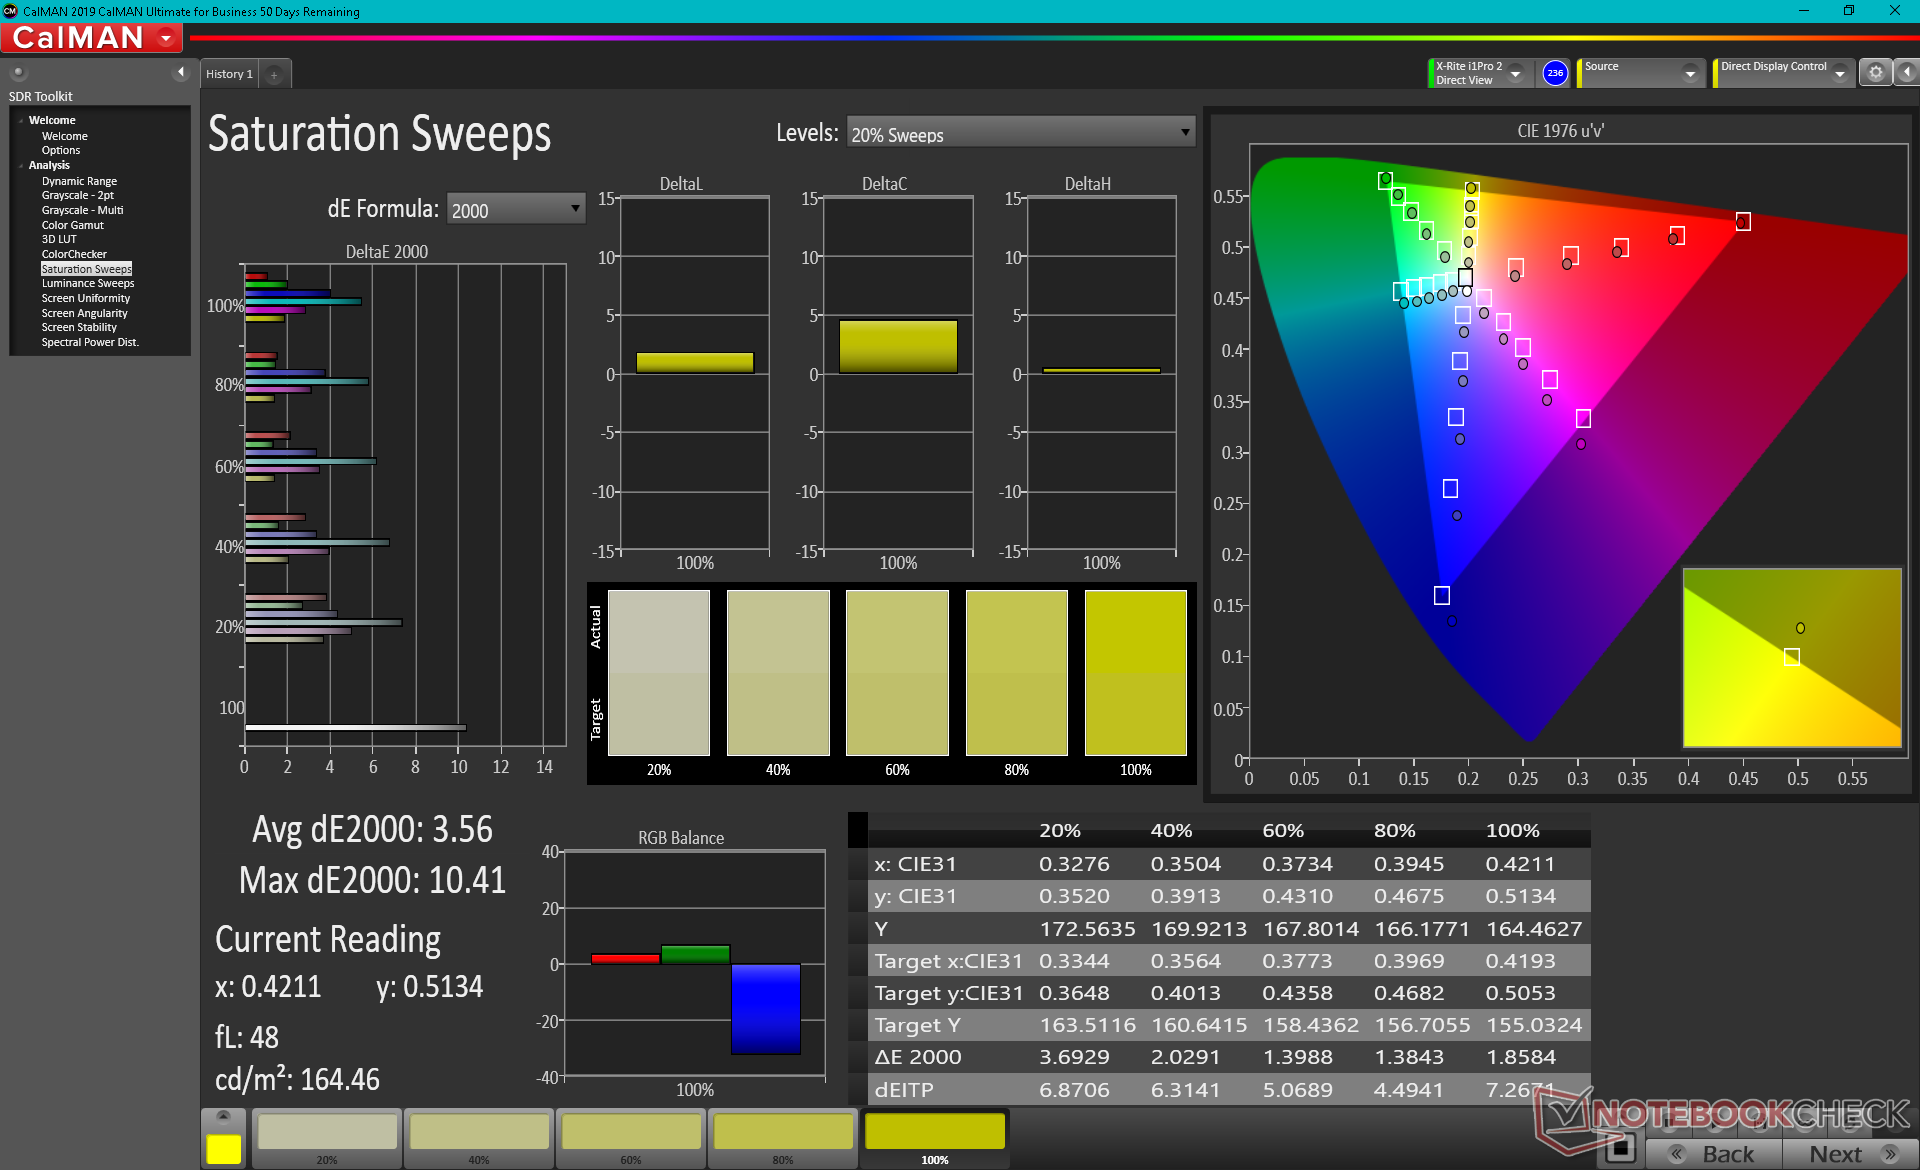
El espacio de color abarca el 69 por ciento de AdobeRGB y casi todo el sRGB para ser aceptable para la mayoría de las tareas de edición de gráficos, además de los ya mencionados escenarios de juego rápido.
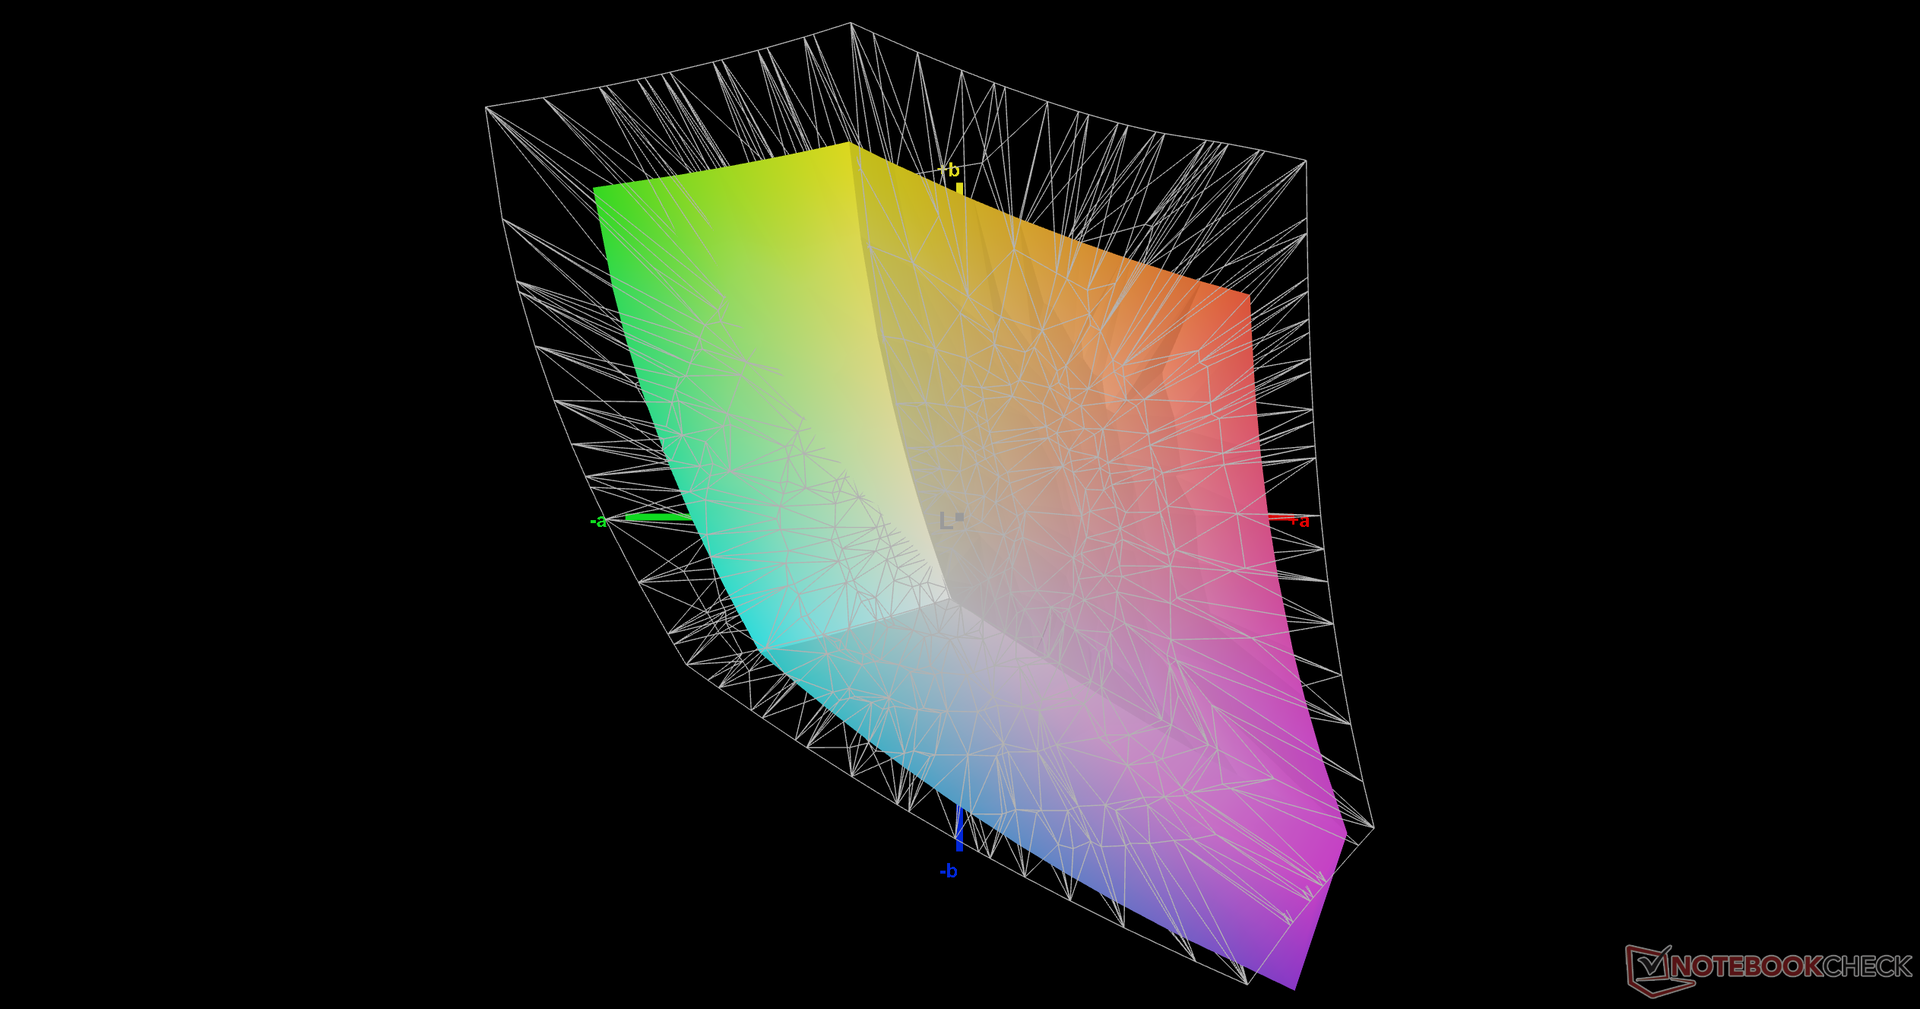
La pantalla podría haberse calibrado mejor al sacarla de la caja. La temperatura del color, en particular, es demasiado fría para un valor deltaE de escala de grises relativamente alto de 5,7. Una calibración adecuada con nuestro colorímetro X-Rite soluciona este problema para aprovechar al máximo la cobertura sRGB del panel, como muestran nuestros resultados Calman a continuación.
Tiempos de respuesta del display
| ↔ Tiempo de respuesta de Negro a Blanco | ||
|---|---|---|
| 12 ms ... subida ↗ y bajada ↘ combinada | ↗ 6.8 ms subida | 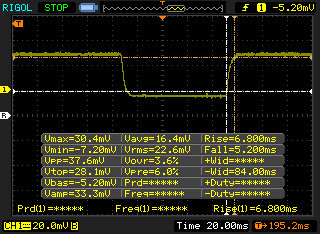 |
| ↘ 5.2 ms bajada | ||
| La pantalla mostró buenos tiempos de respuesta en nuestros tests pero podría ser demasiado lenta para los jugones competitivos. En comparación, todos los dispositivos de prueba van de ##min### (mínimo) a 240 (máximo) ms. » 32 % de todos los dispositivos son mejores. Esto quiere decir que el tiempo de respuesta medido es mejor que la media (19.8 ms) de todos los dispositivos testados. | ||
| ↔ Tiempo de respuesta 50% Gris a 80% Gris | ||
| 13.6 ms ... subida ↗ y bajada ↘ combinada | ↗ 7.6 ms subida | 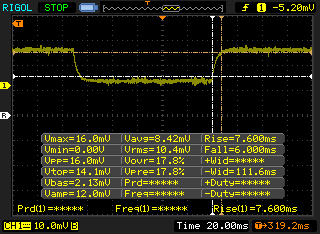 |
| ↘ 6 ms bajada | ||
| La pantalla mostró buenos tiempos de respuesta en nuestros tests pero podría ser demasiado lenta para los jugones competitivos. En comparación, todos los dispositivos de prueba van de ##min### (mínimo) a 636 (máximo) ms. » 27 % de todos los dispositivos son mejores. Esto quiere decir que el tiempo de respuesta medido es mejor que la media (30.9 ms) de todos los dispositivos testados. | ||
Parpadeo de Pantalla / PWM (Pulse-Width Modulation)
| Parpadeo de Pantalla / PWM no detectado | 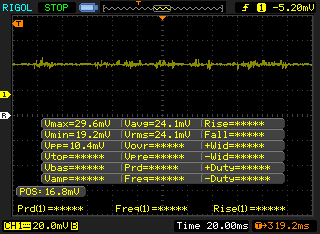 | ||
Comparación: 52 % de todos los dispositivos testados no usaron PWM para atenuar el display. Si se usó, medimos una media de 7748 (mínimo: 5 - máxmo: 343500) Hz. | |||
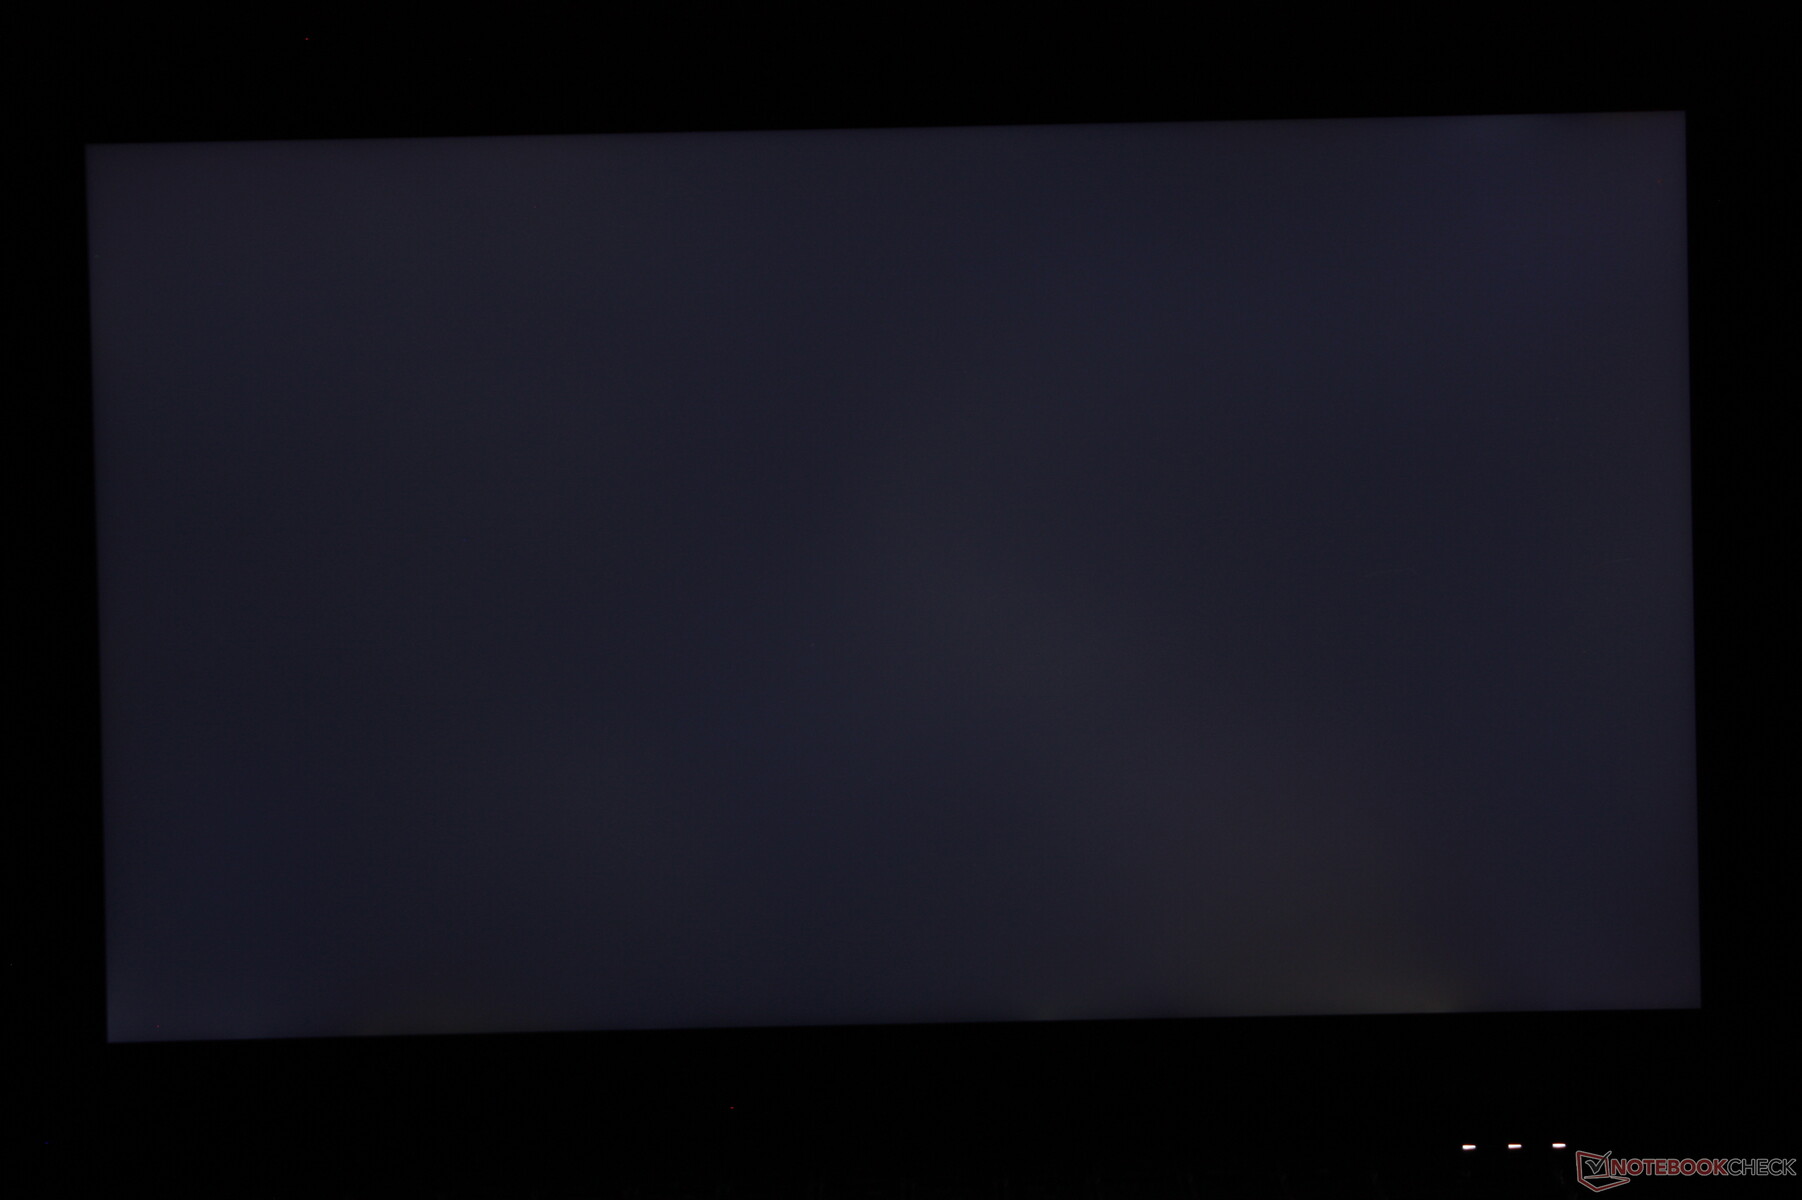
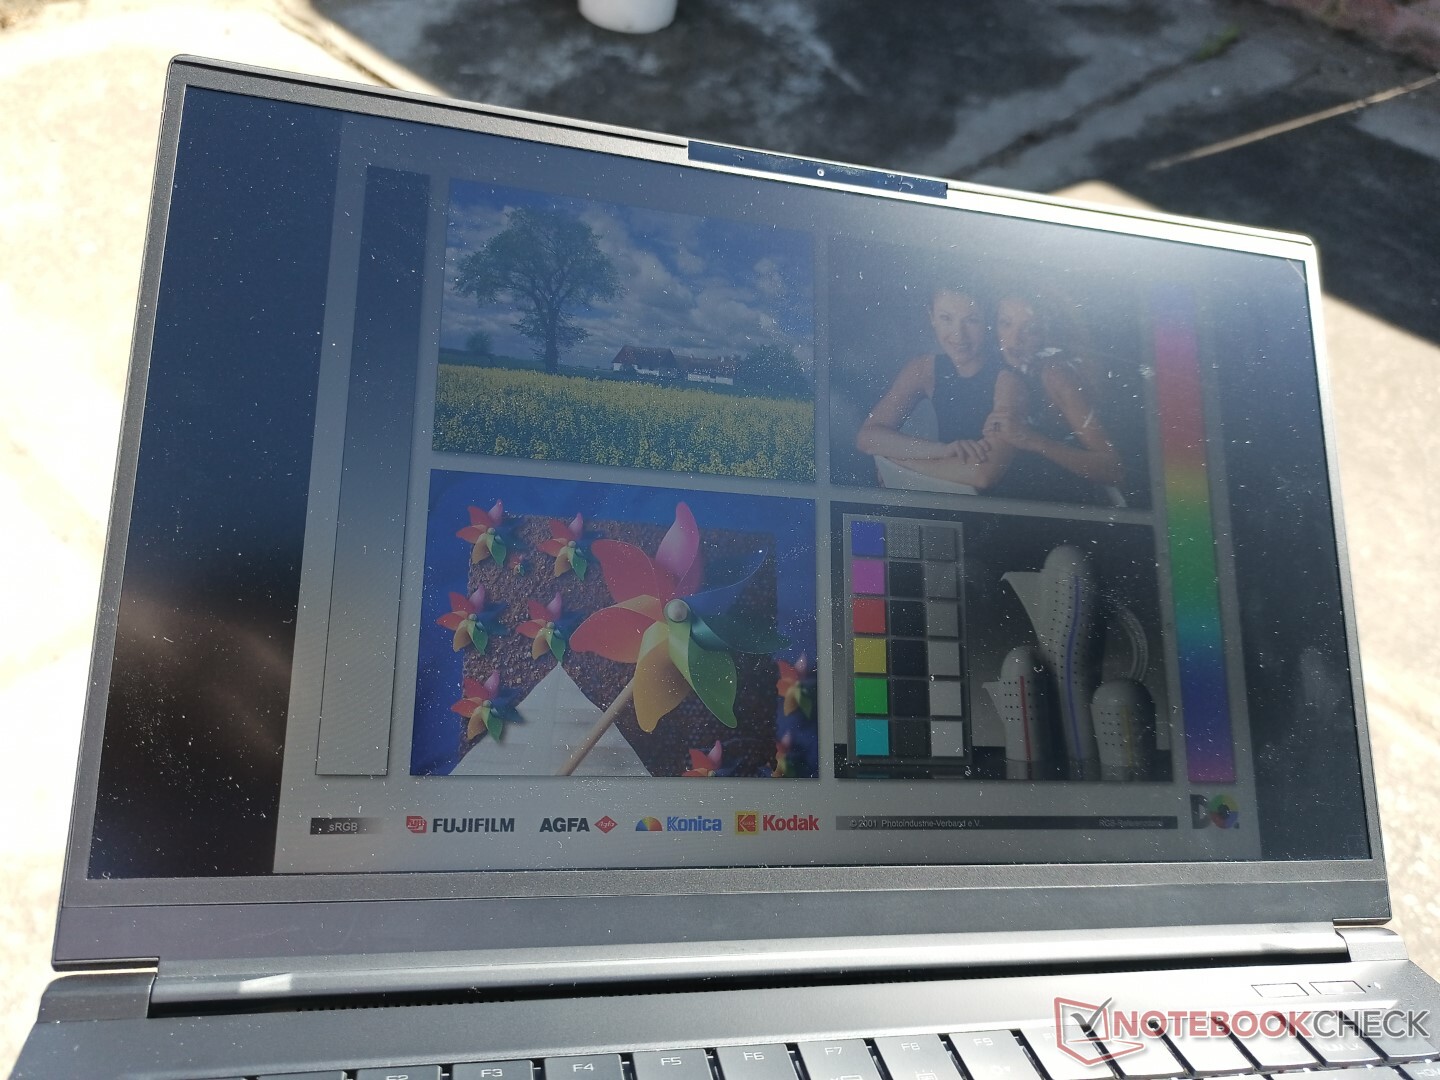
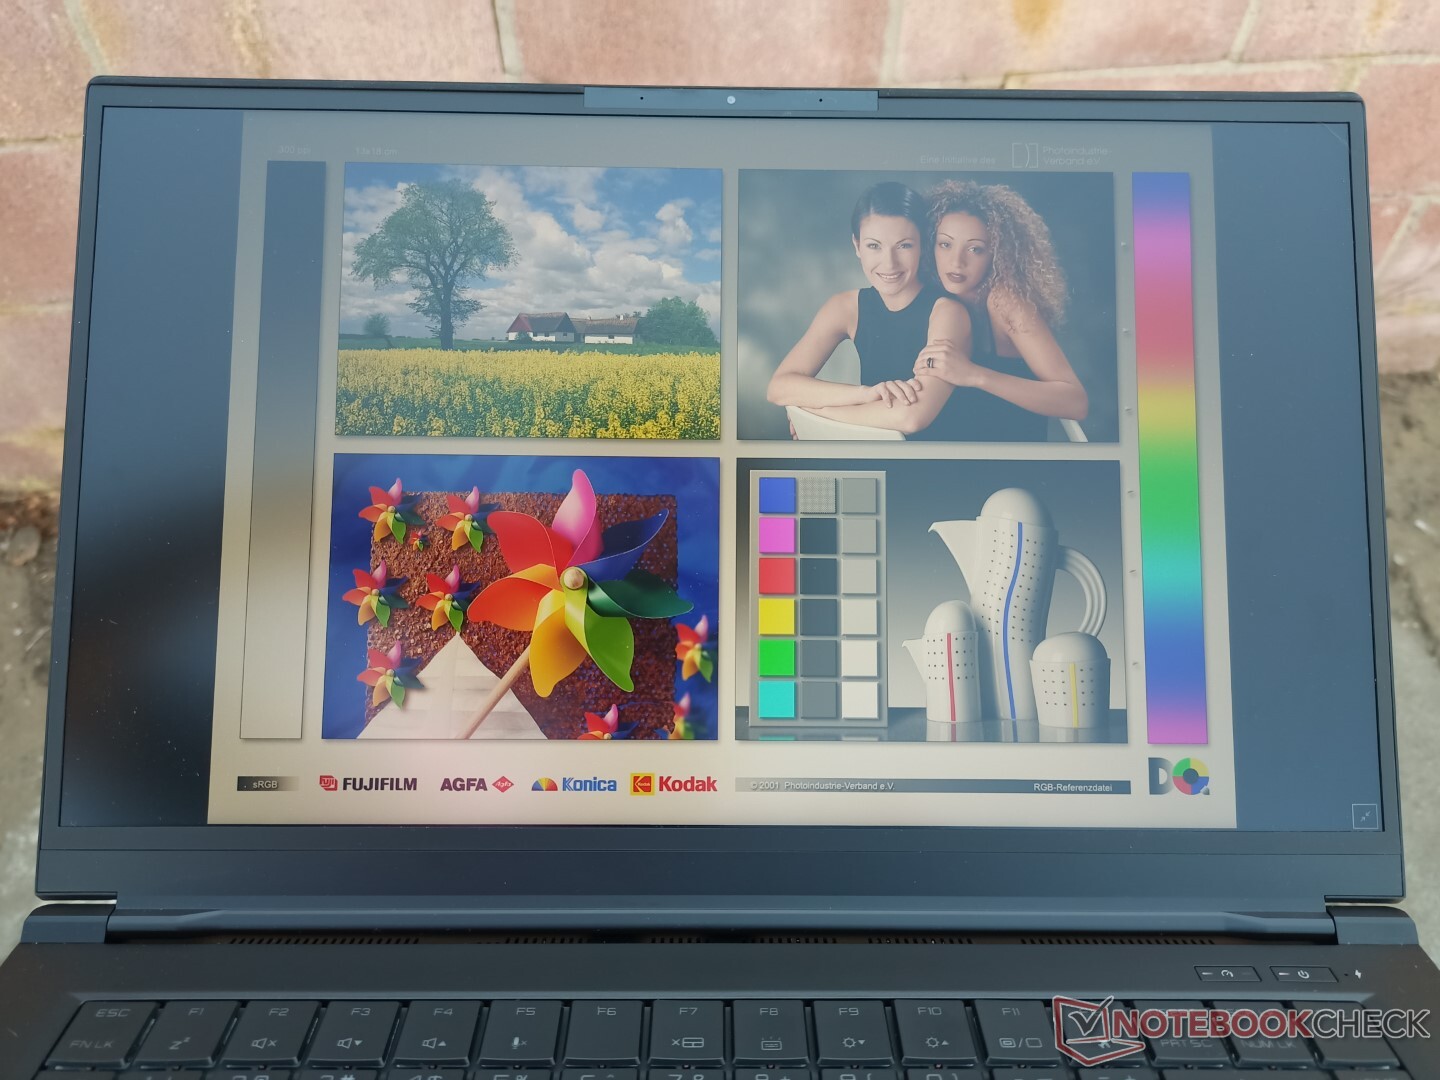
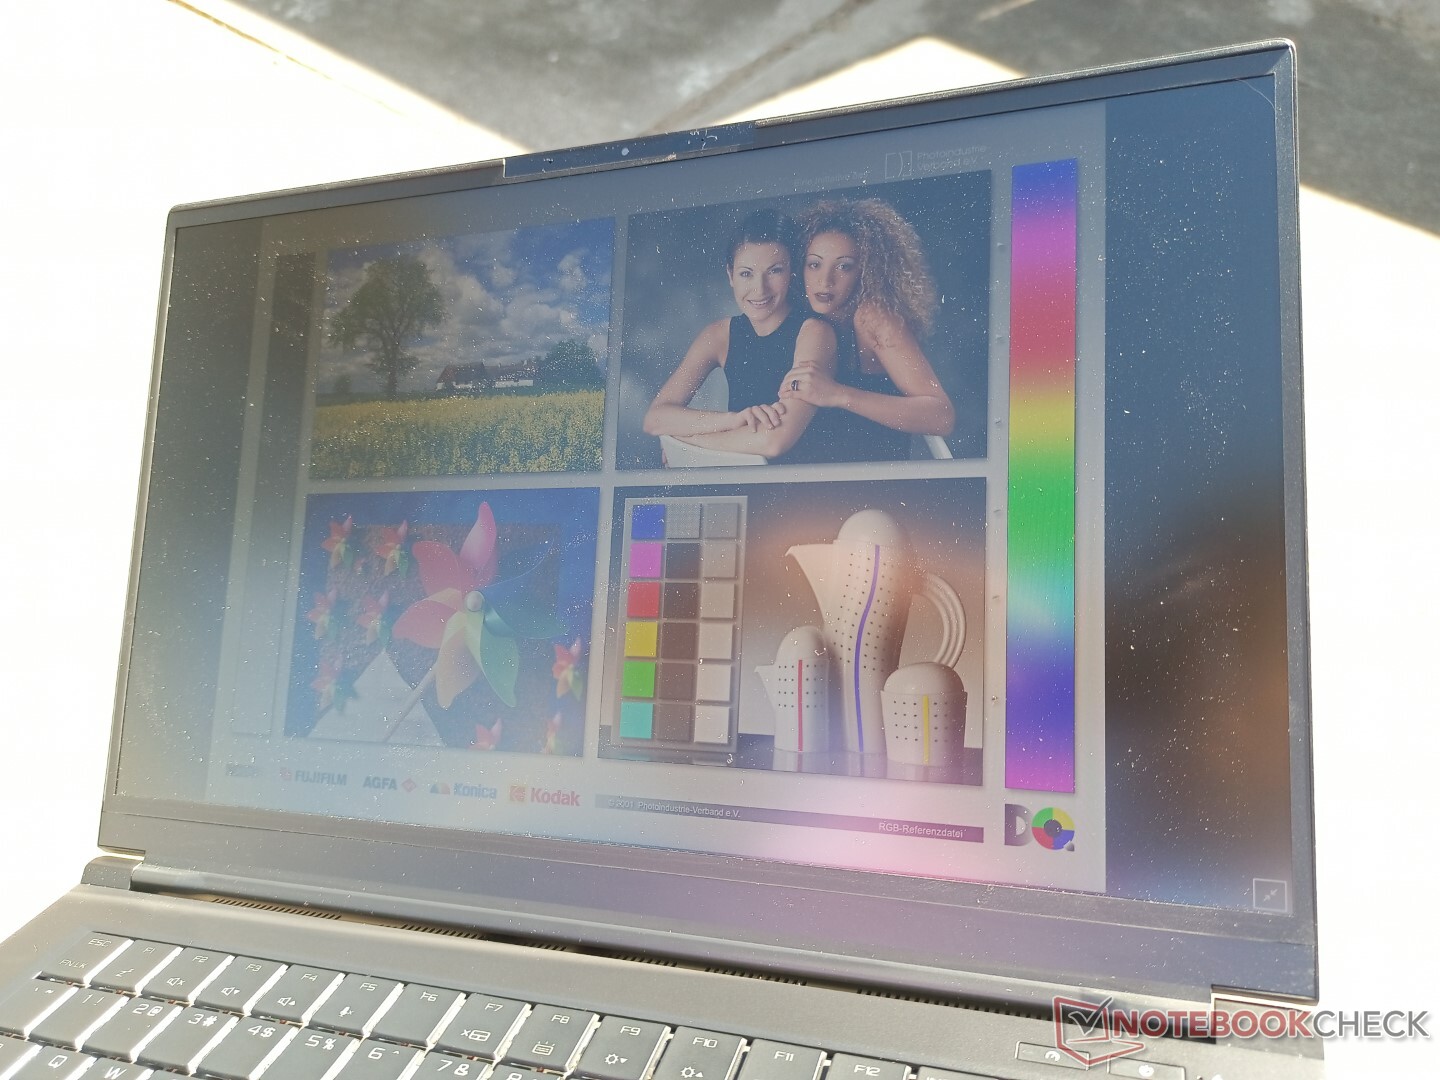
Tanto el brillo máximo como la visibilidad en exteriores son comparables a los de la mayoría de los portátiles para juegos. No obstante, el panel mate y las amplias bisagras de 180 grados dan al Xenia 15 una ligera ventaja a la hora de reducir los reflejos.

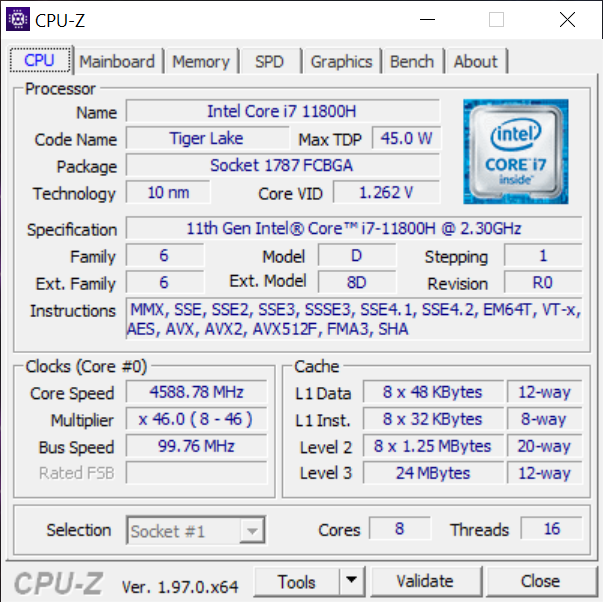
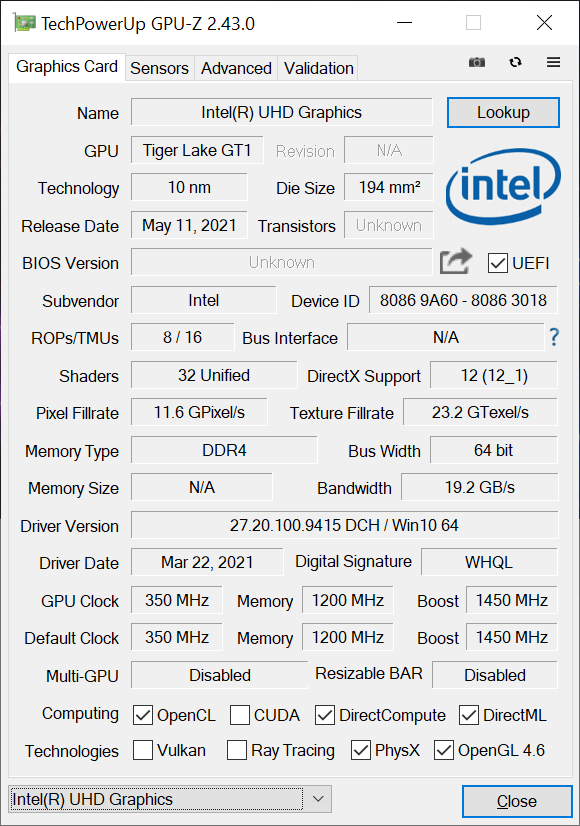
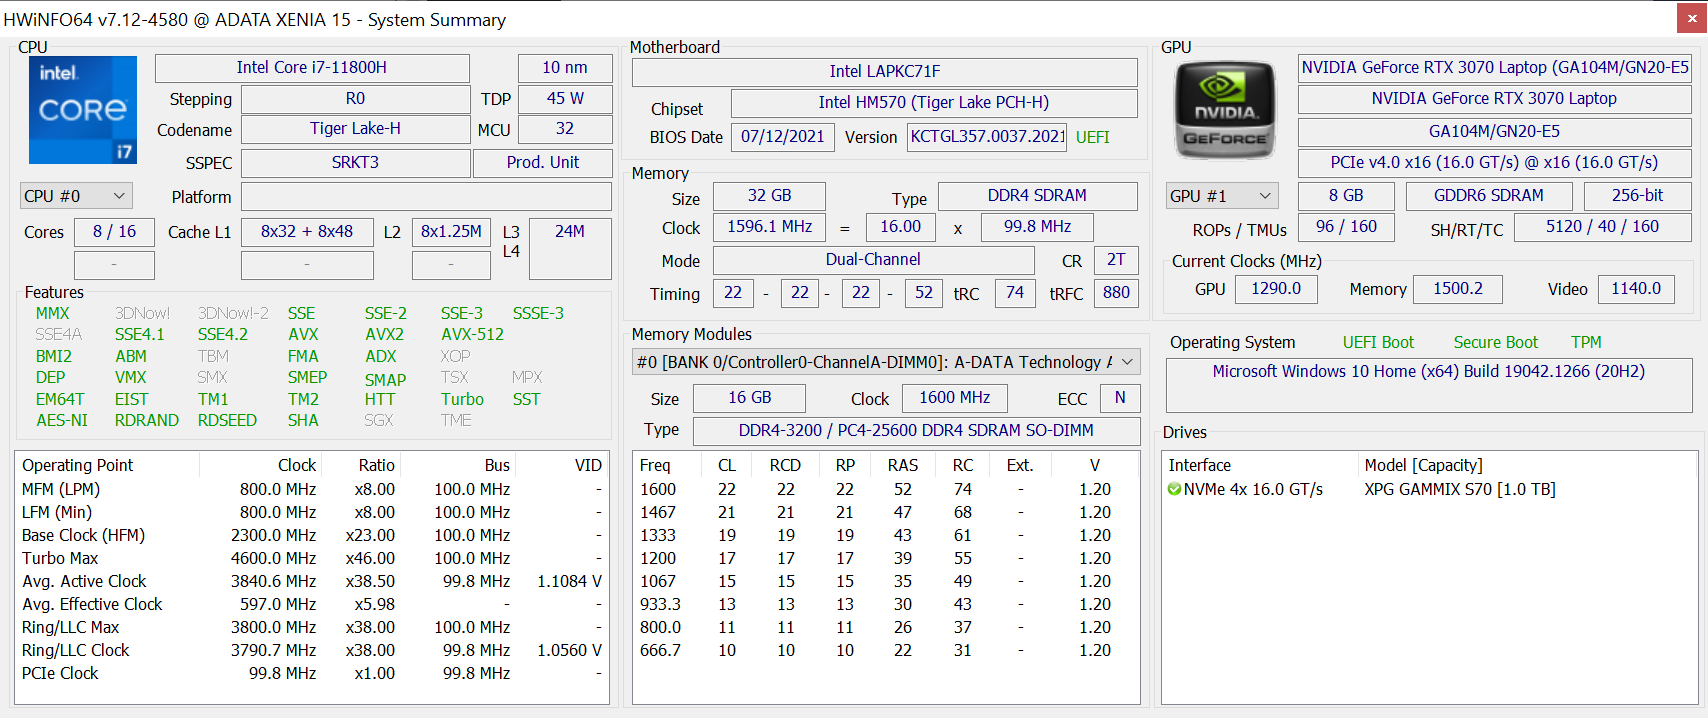
Rendimiento - Tiger Lake-H con GPU TGP de 125 W
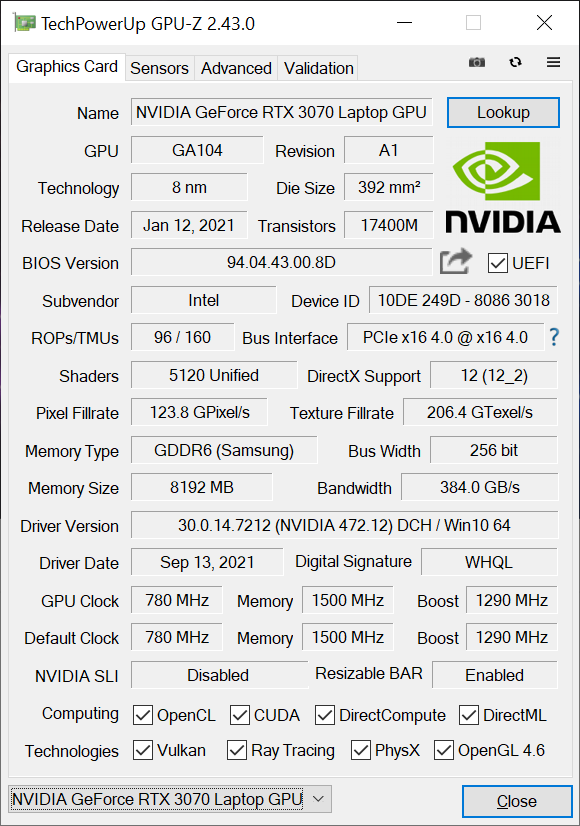
El panel de control de Nvidia indica explícitamente un TGP de 145 W para la RTX 3070 de nuestro Xenia 15, pero ADATA dice que el portátil sólo es capaz de alcanzar 125 W, lo que podemos confirmar en nuestra sección de pruebas de estrés más abajo. Aun así, esto es más alto que lo que las GPUs están clasificadas para el Razer Blade 15 (105 W TGP) y el MSI GS66 (95 W TGP).
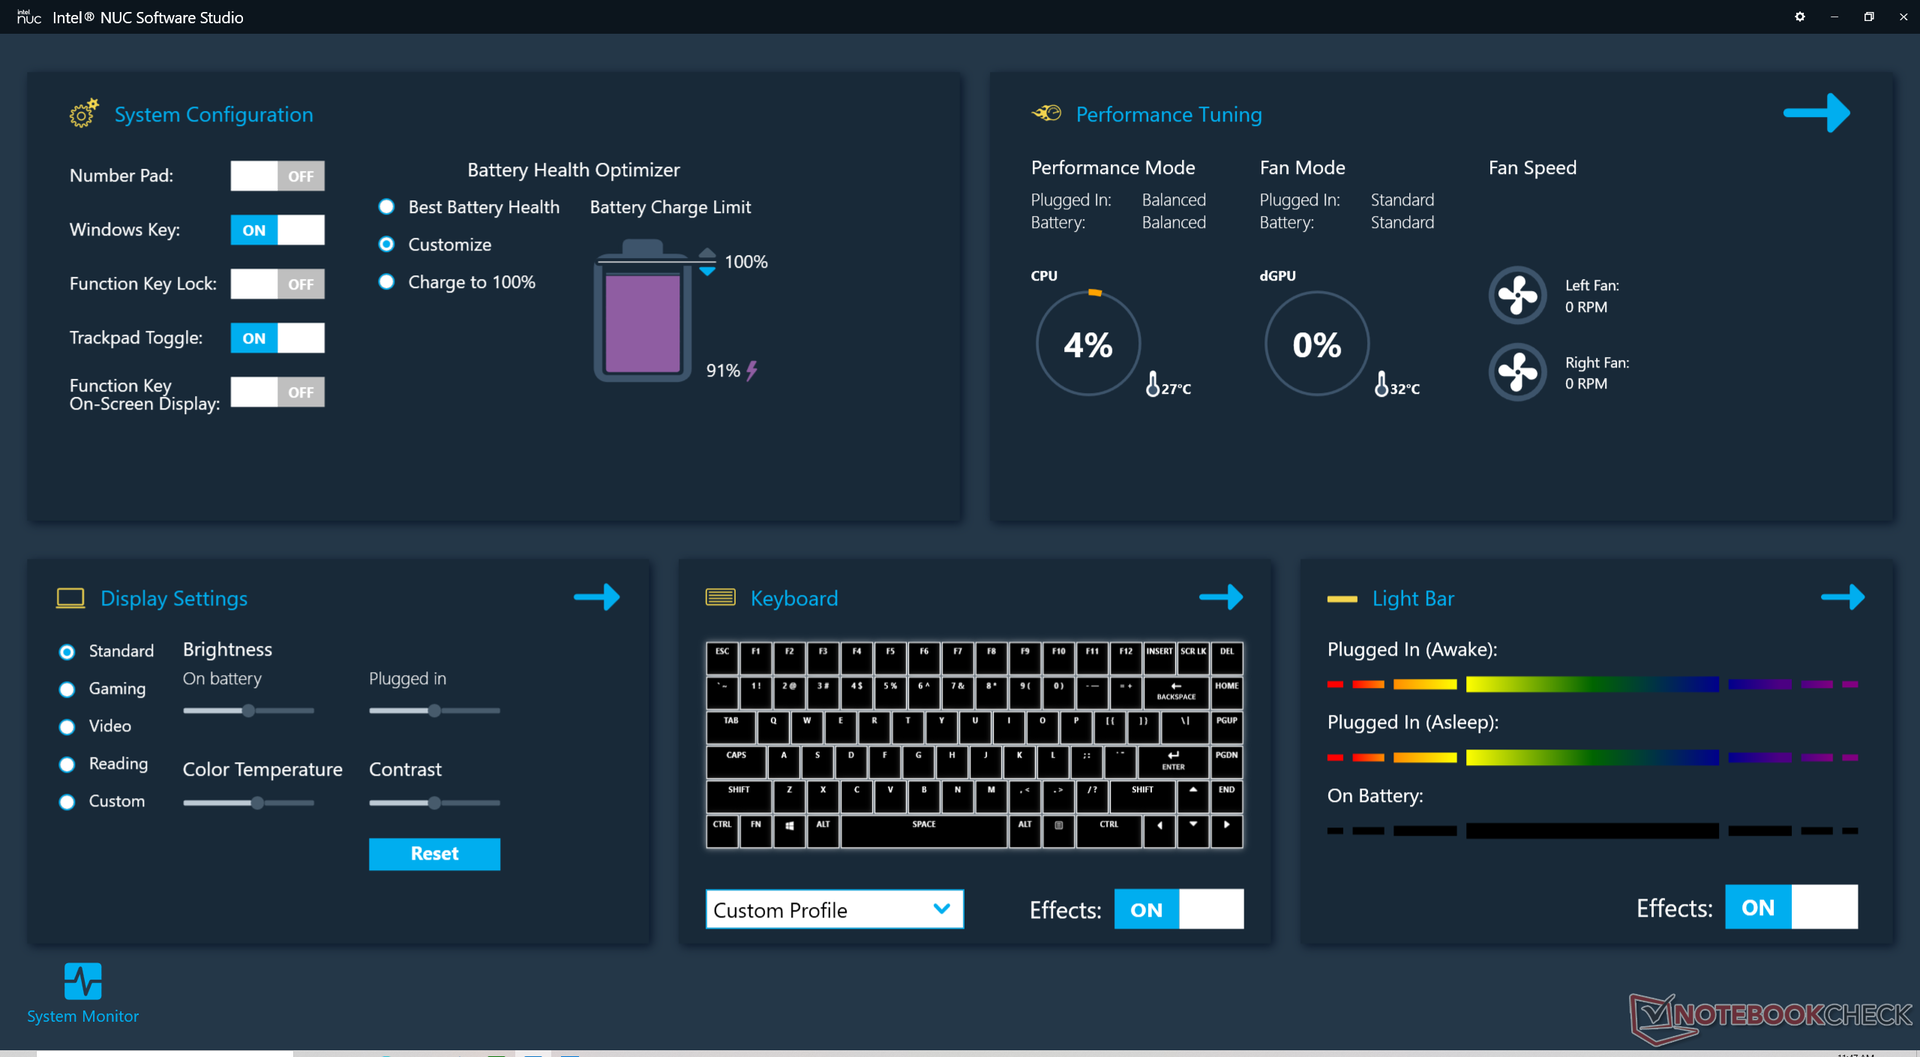
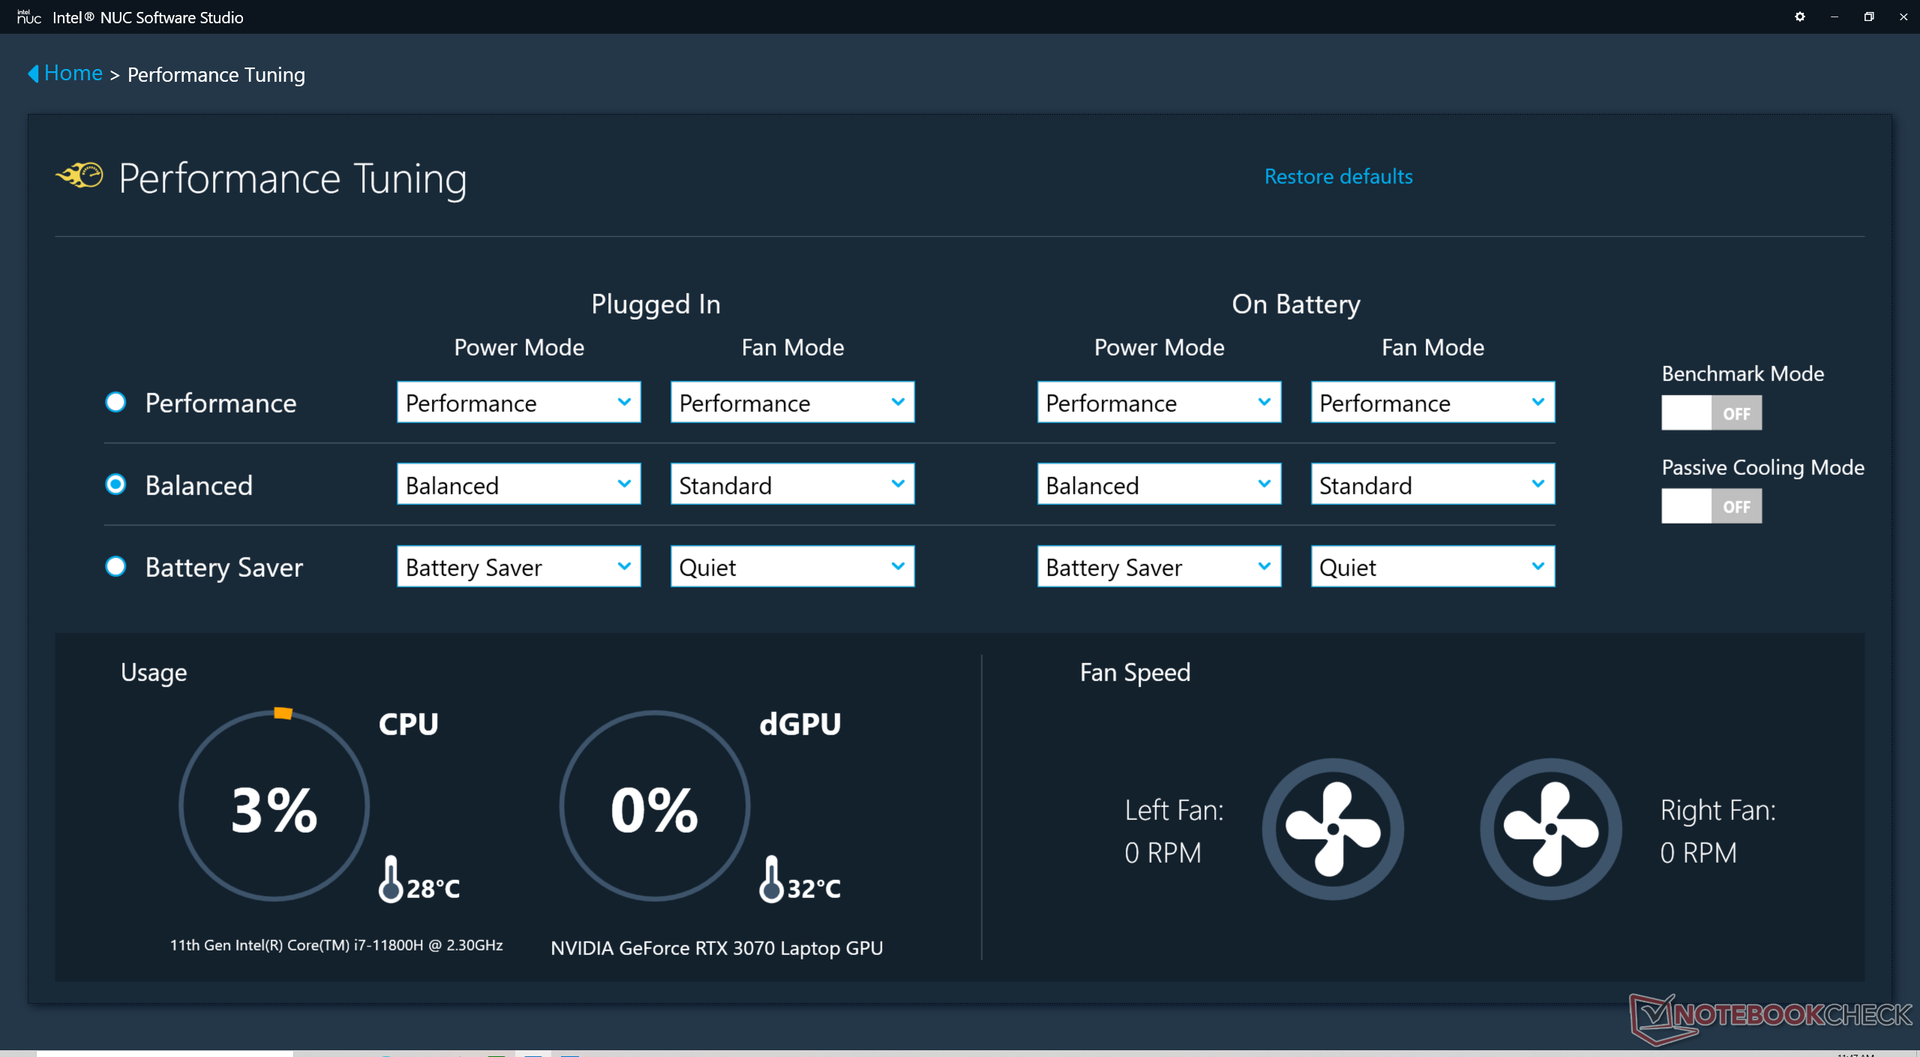
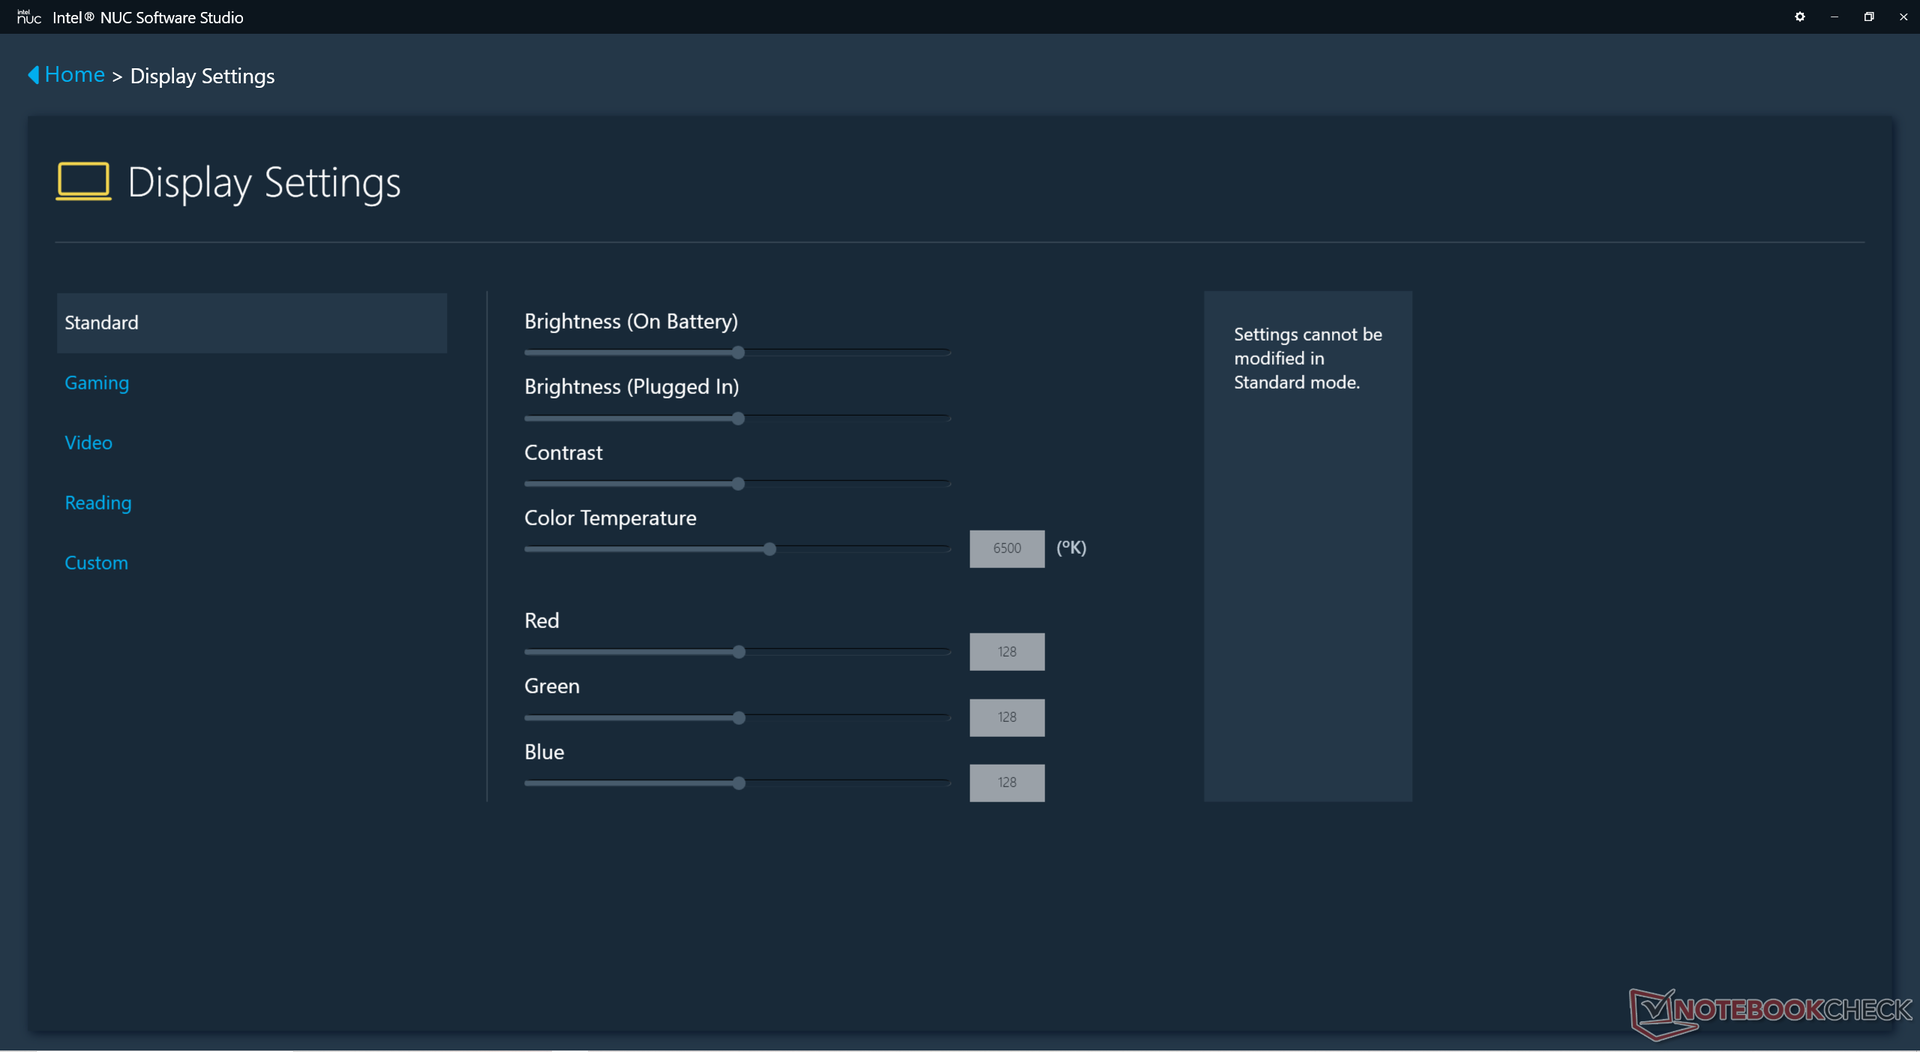
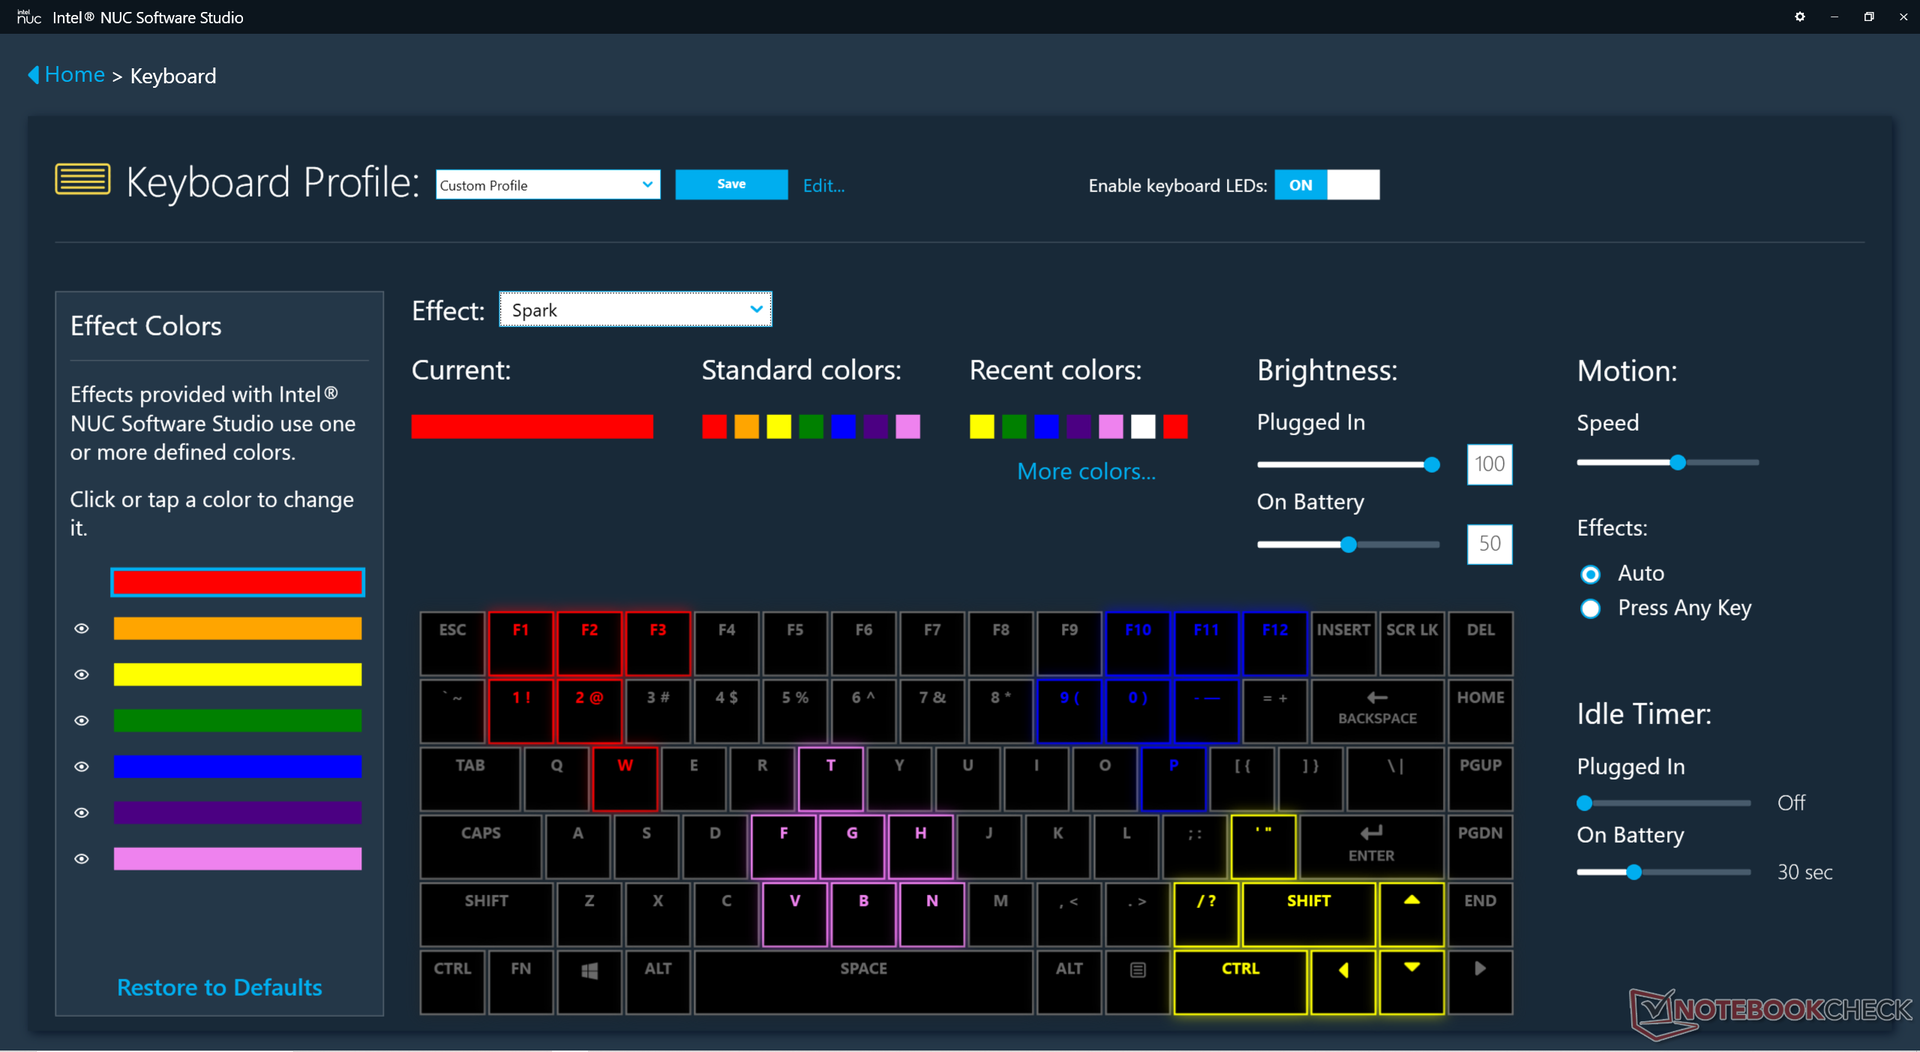
Los propietarios deberían familiarizarse con la aplicación NUC Software Studio preinstalada, ya que es el centro de control del portátil. En ella se pueden activar funciones importantes como la iluminación RGB por tecla, los perfiles de color, la batería y el rendimiento. Nuestra unidad estaba configurada en el modo de rendimiento antes de ejecutar cualquier punto de referencia a continuación. Hay un único "Modo Benchmark" que no es más que otro término para el "modo de ventilador máximo", pero dejamos esta característica desactivada a menos que se indique lo contrario.
Procesador
El rendimiento de la CPU es estable y se encuentra a unos pocos puntos porcentuales de la media de portátiles de nuestra base de datos equipados con el mismo Core i7-11800H CPU. Unos pocos modelos pueden ejecutar el procesador a velocidades de reloj Turbo Boost más altas durante periodos más largos como en el Alienware x15 para un rendimiento multihilo casi un 20 por ciento más rápido como muestran nuestros resultados del bucle CineBench R15 a continuación.
Cinebench R15 Multi Loop
Cinebench R23: Multi Core | Single Core
Cinebench R15: CPU Multi 64Bit | CPU Single 64Bit
Blender: v2.79 BMW27 CPU
7-Zip 18.03: 7z b 4 -mmt1 | 7z b 4
Geekbench 5.5: Single-Core | Multi-Core
HWBOT x265 Benchmark v2.2: 4k Preset
LibreOffice : 20 Documents To PDF
R Benchmark 2.5: Overall mean
| Cinebench R23 / Multi Core | |
| Asus ROG Strix Scar 15 G533QS | |
| MSI GS76 Stealth 11UH | |
| ADATA XPG Xenia 15 | |
| Dell G15 5515 | |
| Medio Intel Core i7-11800H (6508 - 14088, n=48) | |
| Schenker XMG Core 15 Ampere | |
| Aorus 15P XC | |
| Razer Blade 15 Base Edition 2021, i7-10750H RTX 3060 | |
| Acer Aspire Nitro 5 AN515-55-57GF | |
| Cinebench R23 / Single Core | |
| MSI GS76 Stealth 11UH | |
| ADATA XPG Xenia 15 | |
| Medio Intel Core i7-11800H (1386 - 1522, n=45) | |
| Asus ROG Strix Scar 15 G533QS | |
| Dell G15 5515 | |
| Schenker XMG Core 15 Ampere | |
| Aorus 15P XC | |
| Razer Blade 15 Base Edition 2021, i7-10750H RTX 3060 | |
| Acer Aspire Nitro 5 AN515-55-57GF | |
| Geekbench 5.5 / Single-Core | |
| MSI GS76 Stealth 11UH | |
| Medio Intel Core i7-11800H (1429 - 1625, n=40) | |
| Dell G15 5515 | |
| Aorus 15P XC | |
| Razer Blade 15 Base Edition 2021, i7-10750H RTX 3060 | |
| Asus Zephyrus S15 GX502L | |
| Schenker XMG Core 15 Ampere | |
| Acer Aspire Nitro 5 AN515-55-57GF | |
| Schenker XMG Pro 15 | |
| Geekbench 5.5 / Multi-Core | |
| MSI GS76 Stealth 11UH | |
| Medio Intel Core i7-11800H (4655 - 9851, n=40) | |
| Schenker XMG Core 15 Ampere | |
| Aorus 15P XC | |
| Asus Zephyrus S15 GX502L | |
| Dell G15 5515 | |
| Schenker XMG Pro 15 | |
| Razer Blade 15 Base Edition 2021, i7-10750H RTX 3060 | |
| Acer Aspire Nitro 5 AN515-55-57GF | |
| HWBOT x265 Benchmark v2.2 / 4k Preset | |
| Asus ROG Strix Scar 15 G533QS | |
| ADATA XPG Xenia 15 | |
| MSI GS76 Stealth 11UH | |
| Dell G15 5515 | |
| Medio Intel Core i7-11800H (7.38 - 17.4, n=46) | |
| Schenker XMG Core 15 Ampere | |
| Asus Zephyrus S15 GX502L | |
| Aorus 15P XC | |
| Schenker XMG Pro 15 | |
| Razer Blade 15 Base Edition 2021, i7-10750H RTX 3060 | |
| Acer Aspire Nitro 5 AN515-55-57GF | |
| LibreOffice / 20 Documents To PDF | |
| Dell G15 5515 | |
| Acer Aspire Nitro 5 AN515-55-57GF | |
| Schenker XMG Core 15 Ampere | |
| Aorus 15P XC | |
| Asus ROG Strix Scar 15 G533QS | |
| MSI GS76 Stealth 11UH | |
| Razer Blade 15 Base Edition 2021, i7-10750H RTX 3060 | |
| Asus Zephyrus S15 GX502L | |
| Medio Intel Core i7-11800H (38.6 - 59.9, n=45) | |
| ADATA XPG Xenia 15 | |
* ... más pequeño es mejor
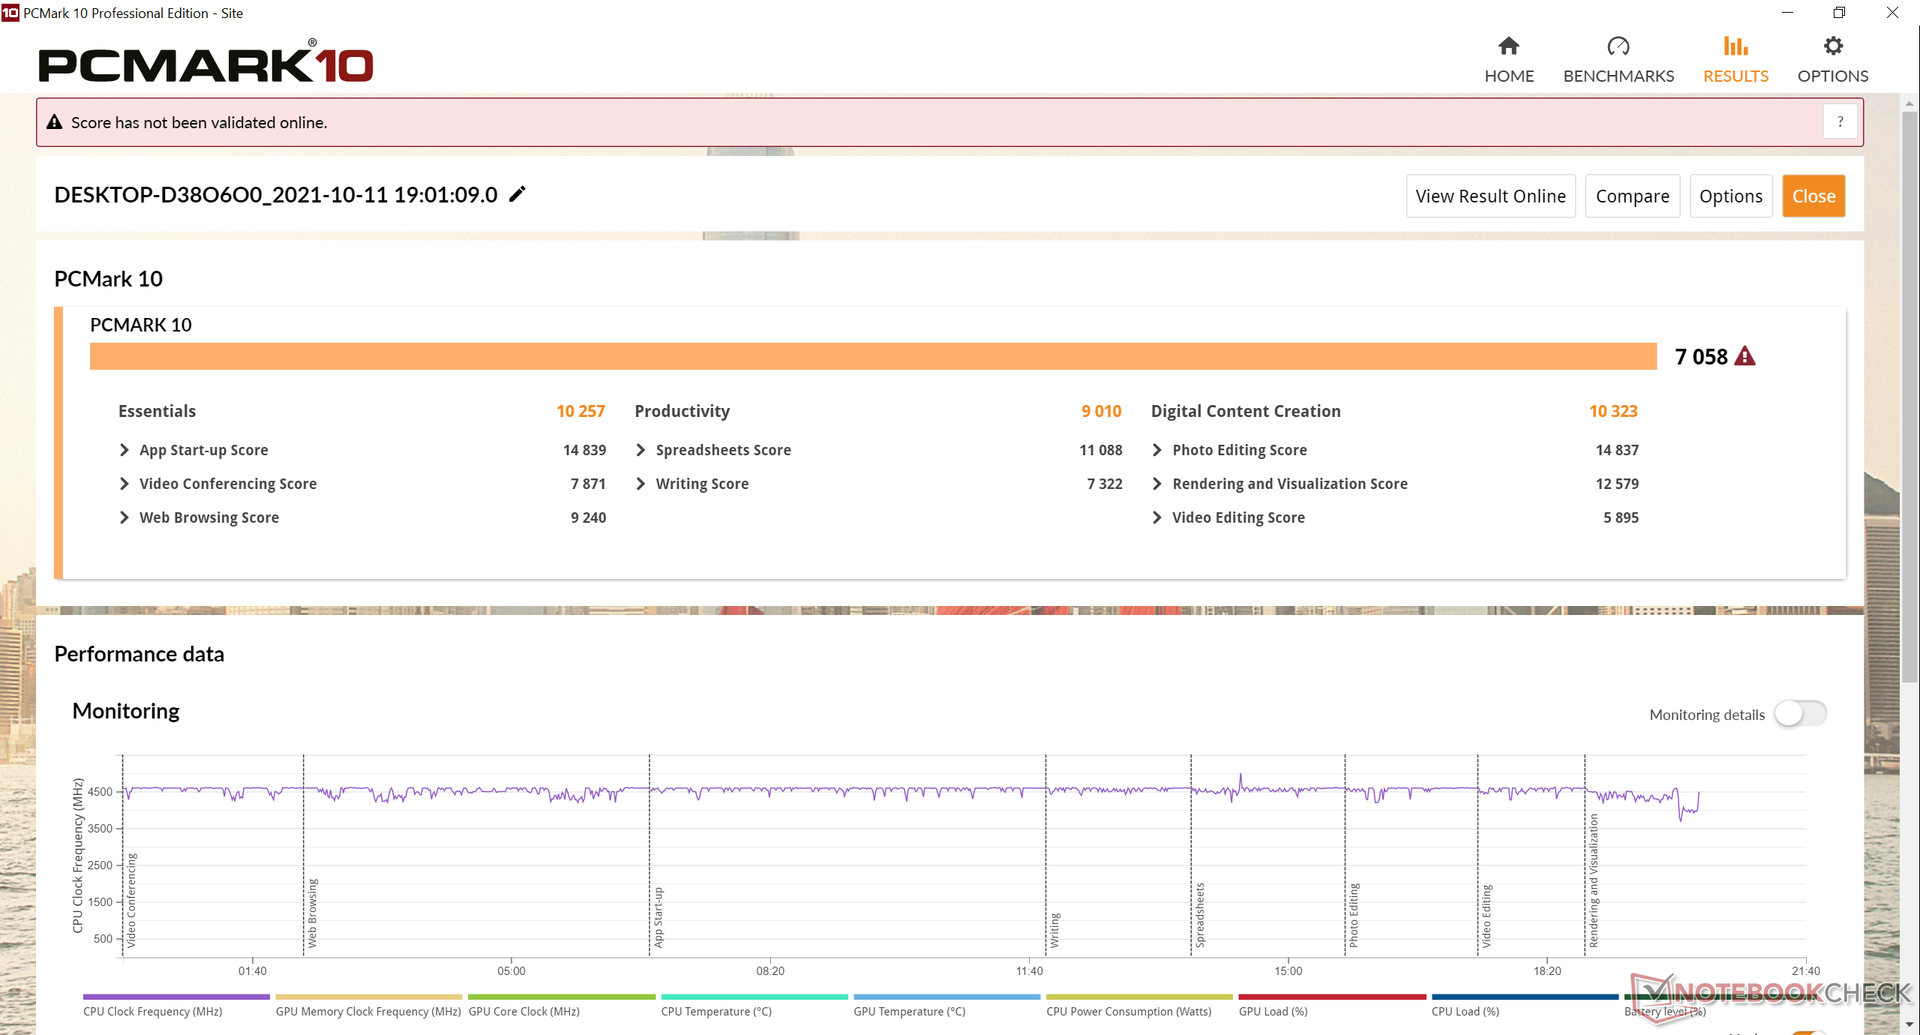
Rendimiento del sistema
Los resultados de PCMark son excelentes y comparables a los de otros portátiles de juego de gama alta con gráficos GeForce RTX. También apreciamos la ausencia de bloatware preinstalado.
| PCMark 10 / Score | |
| Razer Blade 15 Advanced (Mid 2021) | |
| MSI Delta 15 A5EFK | |
| Alienware x15 RTX 3070 P111F | |
| ADATA XPG Xenia 15 | |
| Medio Intel Core i7-11800H, NVIDIA GeForce RTX 3070 Laptop GPU (6126 - 7311, n=11) | |
| Asus ROG Zephyrus G15 GA503Q | |
| MSI GS66 Stealth 10UG | |
| PCMark 10 / Essentials | |
| Razer Blade 15 Advanced (Mid 2021) | |
| MSI Delta 15 A5EFK | |
| Alienware x15 RTX 3070 P111F | |
| ADATA XPG Xenia 15 | |
| Asus ROG Zephyrus G15 GA503Q | |
| Medio Intel Core i7-11800H, NVIDIA GeForce RTX 3070 Laptop GPU (9248 - 10832, n=11) | |
| MSI GS66 Stealth 10UG | |
| PCMark 10 / Productivity | |
| MSI Delta 15 A5EFK | |
| Asus ROG Zephyrus G15 GA503Q | |
| Medio Intel Core i7-11800H, NVIDIA GeForce RTX 3070 Laptop GPU (8571 - 9669, n=11) | |
| Alienware x15 RTX 3070 P111F | |
| Razer Blade 15 Advanced (Mid 2021) | |
| ADATA XPG Xenia 15 | |
| MSI GS66 Stealth 10UG | |
| PCMark 10 / Digital Content Creation | |
| Alienware x15 RTX 3070 P111F | |
| Razer Blade 15 Advanced (Mid 2021) | |
| MSI Delta 15 A5EFK | |
| ADATA XPG Xenia 15 | |
| Medio Intel Core i7-11800H, NVIDIA GeForce RTX 3070 Laptop GPU (7627 - 10851, n=11) | |
| Asus ROG Zephyrus G15 GA503Q | |
| MSI GS66 Stealth 10UG | |
| PCMark 10 Score | 7058 puntos | |
ayuda | ||
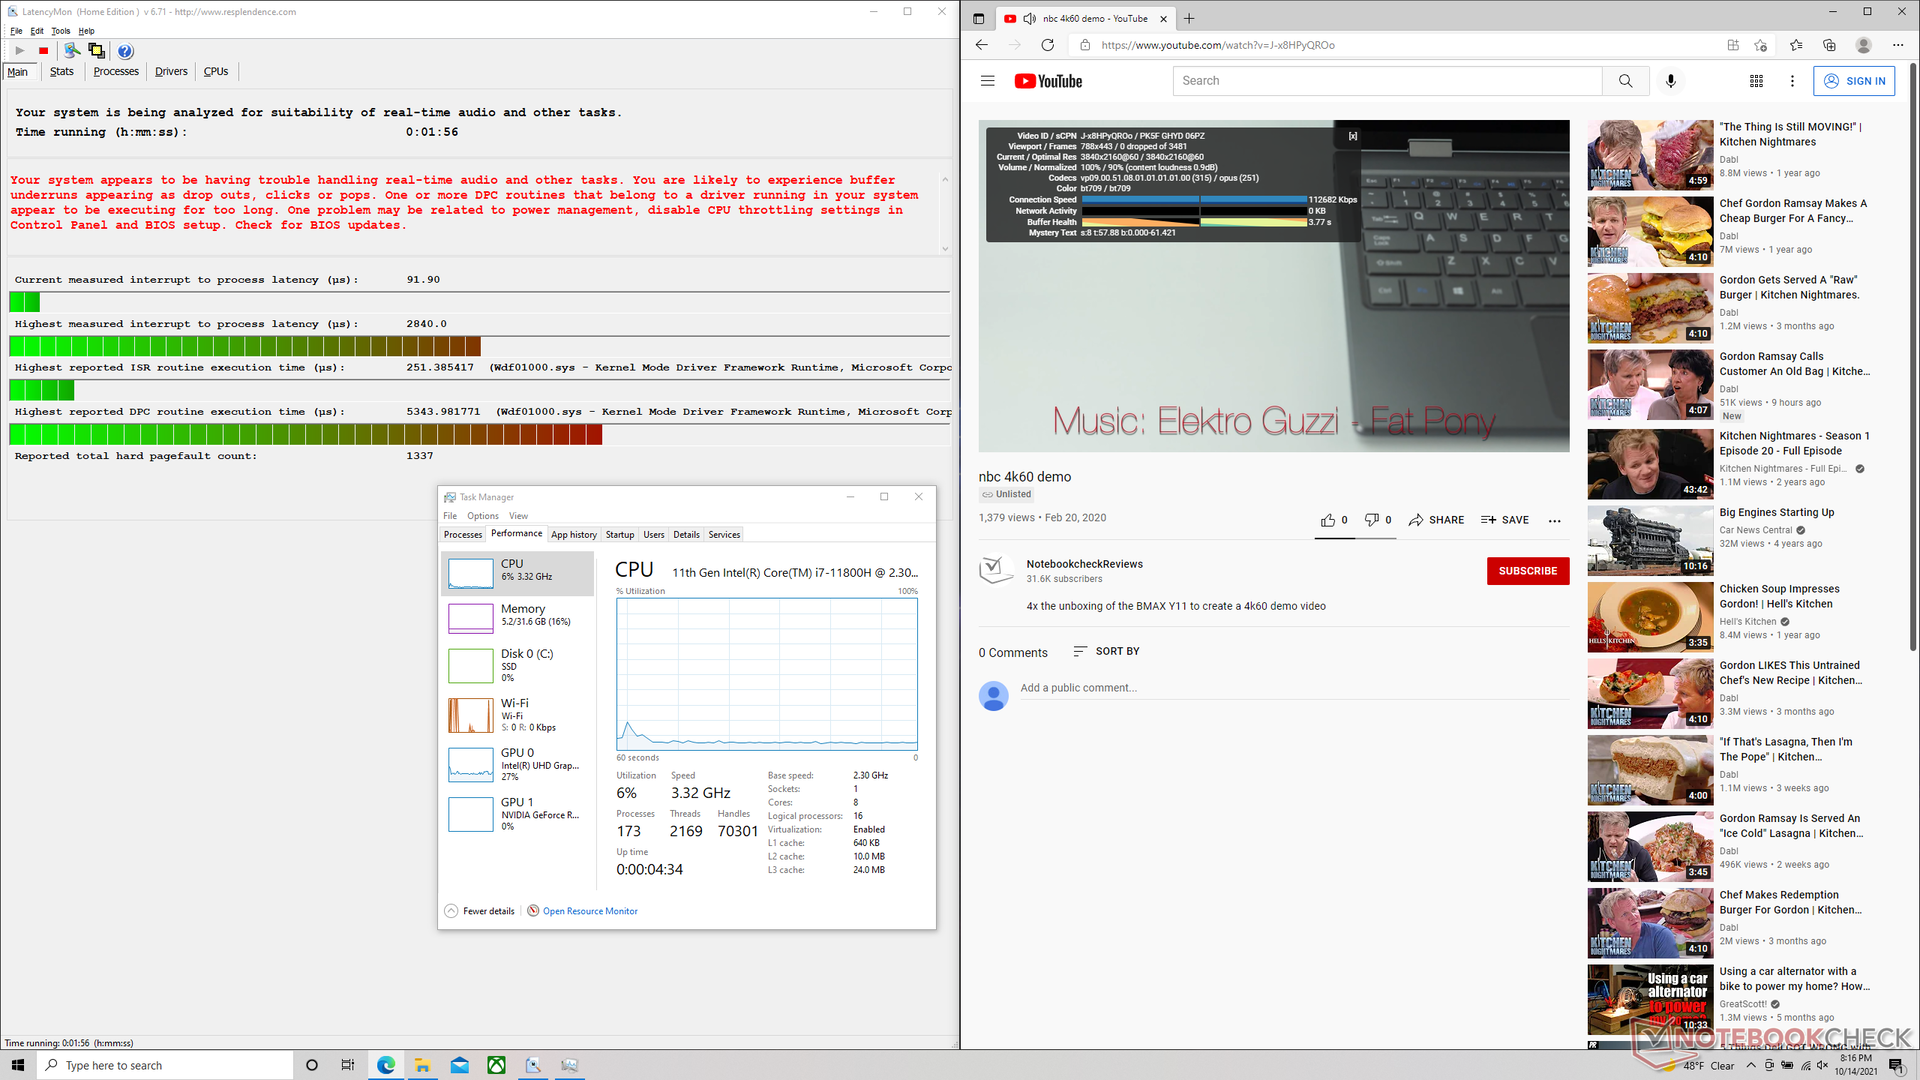
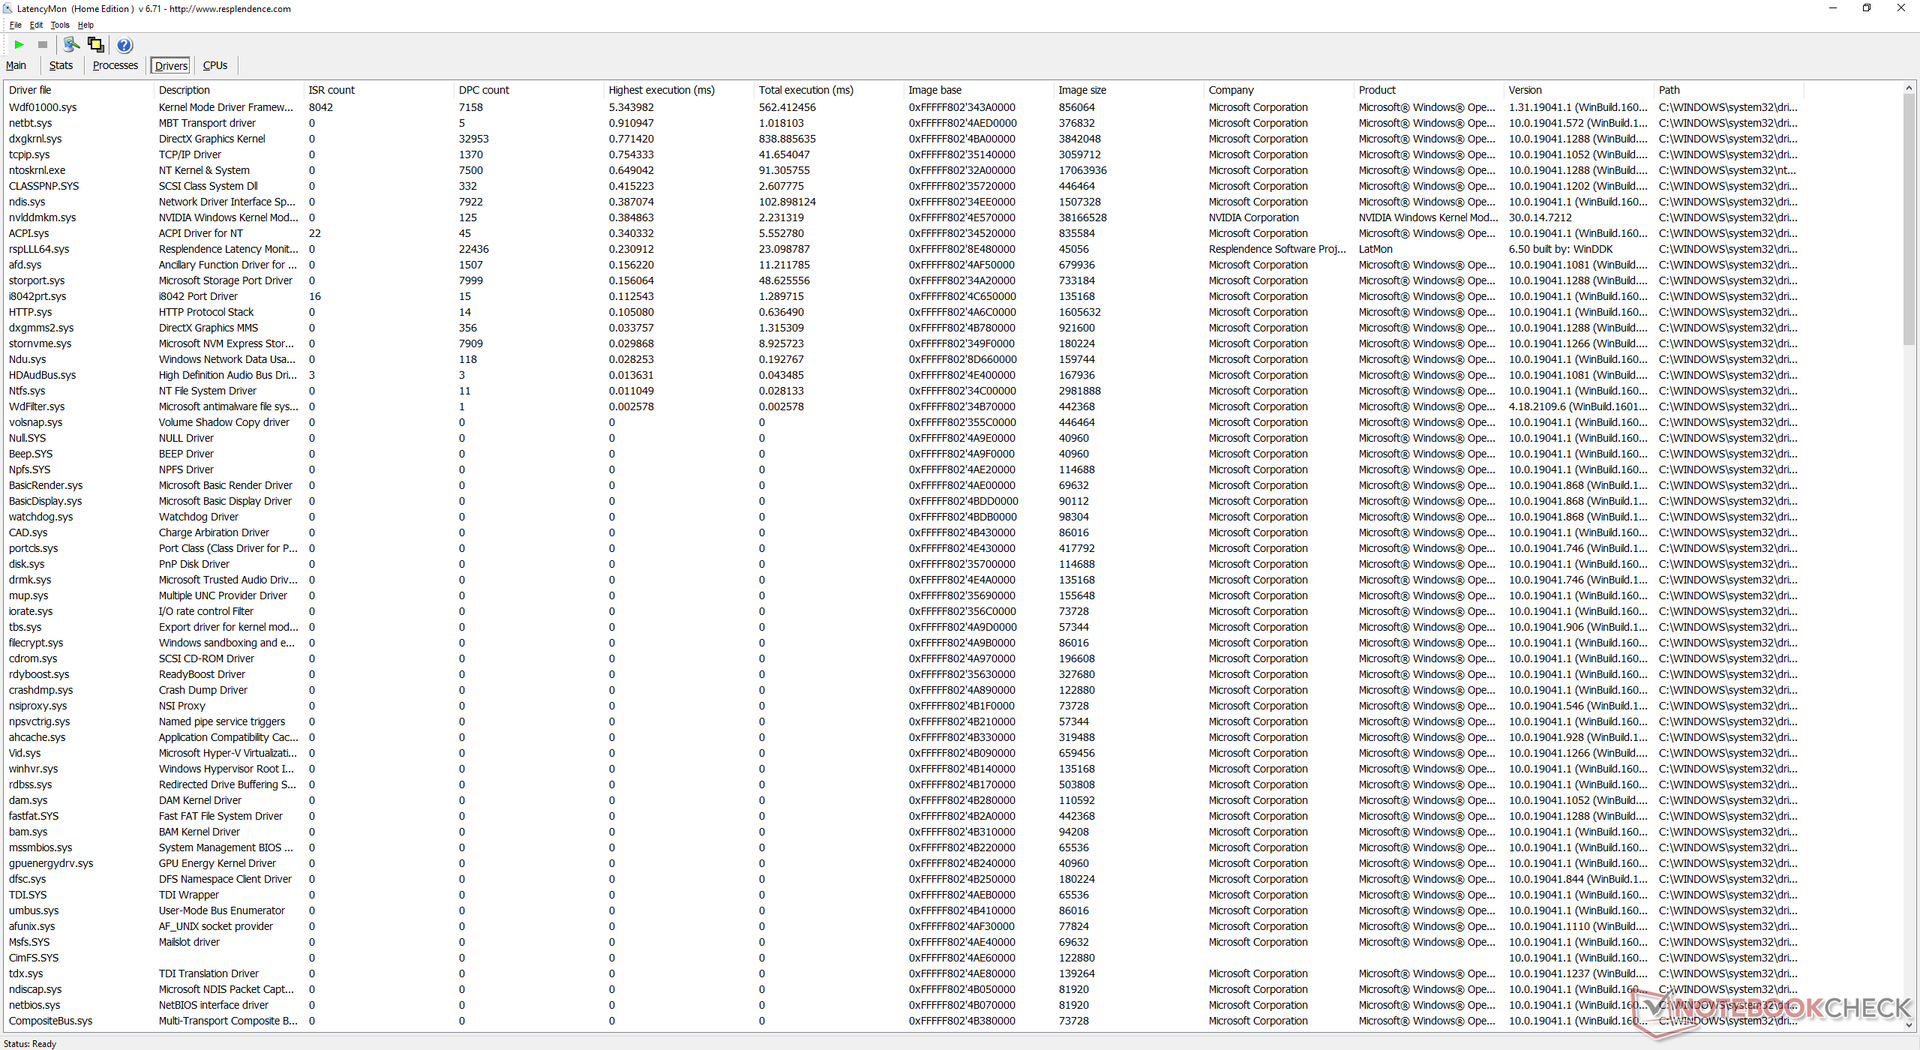
Latencia del CPD
LatencyMon revela problemas al abrir varias pestañas del navegador en nuestra página de inicio, mientras que la reproducción de vídeo 4K a 60 FPS es, por lo demás, fluida y sin caídas de fotogramas.
| DPC Latencies / LatencyMon - interrupt to process latency (max), Web, Youtube, Prime95 | |
| Razer Blade 15 Advanced (Mid 2021) | |
| ADATA XPG Xenia 15 | |
| MSI Delta 15 A5EFK | |
| Alienware x15 RTX 3070 P111F | |
| MSI GS66 Stealth 10UG | |
| Asus ROG Zephyrus G15 GA503Q | |
* ... más pequeño es mejor
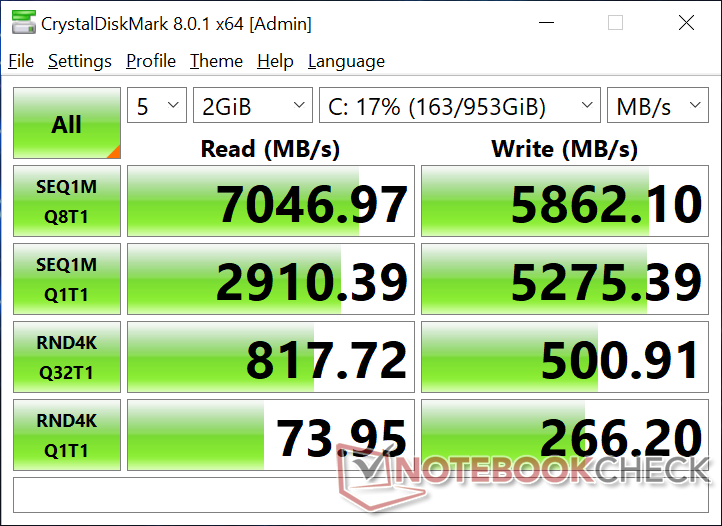
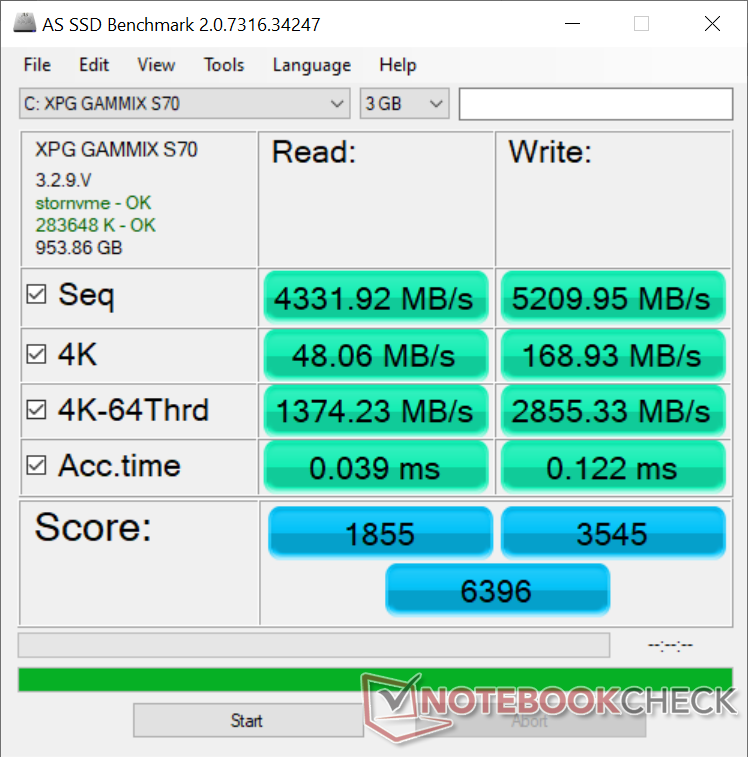
Dispositivos de almacenamiento: hasta dos SSD M.2 NVMe
Todos los modelos vienen con una unidad SSD Gammix S70 PCIe4 NVMe de ADATA, que es una actualización de la serie Gammix S50 que se encuentra en el modelo más pequeño Xenia 14. El modelo de 1 TB de nuestra unidad de prueba puede alcanzar velocidades de lectura y escritura de hasta 7000 MB/s y 6000 MB/s, respectivamente, en comparación con los 7000 MB/s y 5200 MB/s del modelo de la competencia Samsung PM9A1. Se trata, sin duda, de una de las unidades más rápidas que se pueden encontrar actualmente en un portátil de consumo. Sin embargo, no hay disipador de calor, a diferencia de los portátiles más grandes como el Alienware x15 o el HP ZBook Fury 15 G8.
| ADATA XPG Xenia 15 ADATA XPG Gammix S70 1TB | MSI Delta 15 A5EFK Micron 2210 MTFDHBA1T0QFD | Razer Blade 15 Advanced (Mid 2021) SSSTC CA6-8D1024 | MSI GS66 Stealth 10UG WDC PC SN730 SDBPNTY-1T00 | Asus ROG Zephyrus G15 GA503Q SK Hynix HFM001TD3JX013N | |
|---|---|---|---|---|---|
| AS SSD | -39% | 36% | -8% | -16% | |
| Seq Read (MB/s) | 4332 | 2023 -53% | 5739 32% | 2198 -49% | 2950 -32% |
| Seq Write (MB/s) | 5210 | 1836 -65% | 4201 -19% | 2596 -50% | 1600 -69% |
| 4K Read (MB/s) | 48.06 | 56.4 17% | 53.8 12% | 43.81 -9% | 53.6 12% |
| 4K Write (MB/s) | 168.9 | 130.2 -23% | 179.2 6% | 115.5 -32% | 126.8 -25% |
| 4K-64 Read (MB/s) | 1374 | 899 -35% | 2959 115% | 1692 23% | 1429 4% |
| 4K-64 Write (MB/s) | 2855 | 1164 -59% | 1891 -34% | 2162 -24% | 2177 -24% |
| Access Time Read * (ms) | 0.039 | 0.096 -146% | 0.027 31% | 0.056 -44% | 0.064 -64% |
| Access Time Write * (ms) | 0.122 | 0.031 75% | 0.154 -26% | 0.098 20% | 0.029 76% |
| Score Read (Points) | 1855 | 1158 -38% | 3587 93% | 1956 5% | 1778 -4% |
| Score Write (Points) | 3545 | 1478 -58% | 2490 -30% | 2537 -28% | 2464 -30% |
| Score Total (Points) | 6396 | 3233 -49% | 7821 22% | 5513 -14% | 5090 -20% |
| Copy ISO MB/s (MB/s) | 2261 | 3027 34% | 2236 -1% | ||
| Copy Program MB/s (MB/s) | 408.3 | 1177 188% | 690 69% | ||
| Copy Game MB/s (MB/s) | 1241 | 2170 75% | 1546 25% | ||
| CrystalDiskMark 5.2 / 6 | -46% | 8% | -40% | -34% | |
| Write 4K (MB/s) | 264.7 | 136.2 -49% | 295.6 12% | 163.1 -38% | 156.4 -41% |
| Read 4K (MB/s) | 74 | 59.9 -19% | 85.7 16% | 48.97 -34% | 66.7 -10% |
| Write Seq (MB/s) | 5268 | 1846 -65% | 4149 -21% | 2607 -51% | 2318 -56% |
| Read Seq (MB/s) | 2878 | 1714 -40% | 4203 46% | 2316 -20% | 2151 -25% |
| Write 4K Q32T1 (MB/s) | 501 | 344.2 -31% | 715 43% | 338 -33% | 525 5% |
| Read 4K Q32T1 (MB/s) | 819 | 582 -29% | 709 -13% | 475.6 -42% | 452.1 -45% |
| Write Seq Q32T1 (MB/s) | 5862 | 1874 -68% | 4681 -20% | 3090 -47% | 3055 -48% |
| Read Seq Q32T1 (MB/s) | 7060 | 2096 -70% | 6905 -2% | 3421 -52% | 3607 -49% |
| Media total (Programa/Opciones) | -43% /
-42% | 22% /
25% | -24% /
-19% | -25% /
-23% |
* ... más pequeño es mejor

Disk Throttling: DiskSpd Read Loop, Queue Depth 8
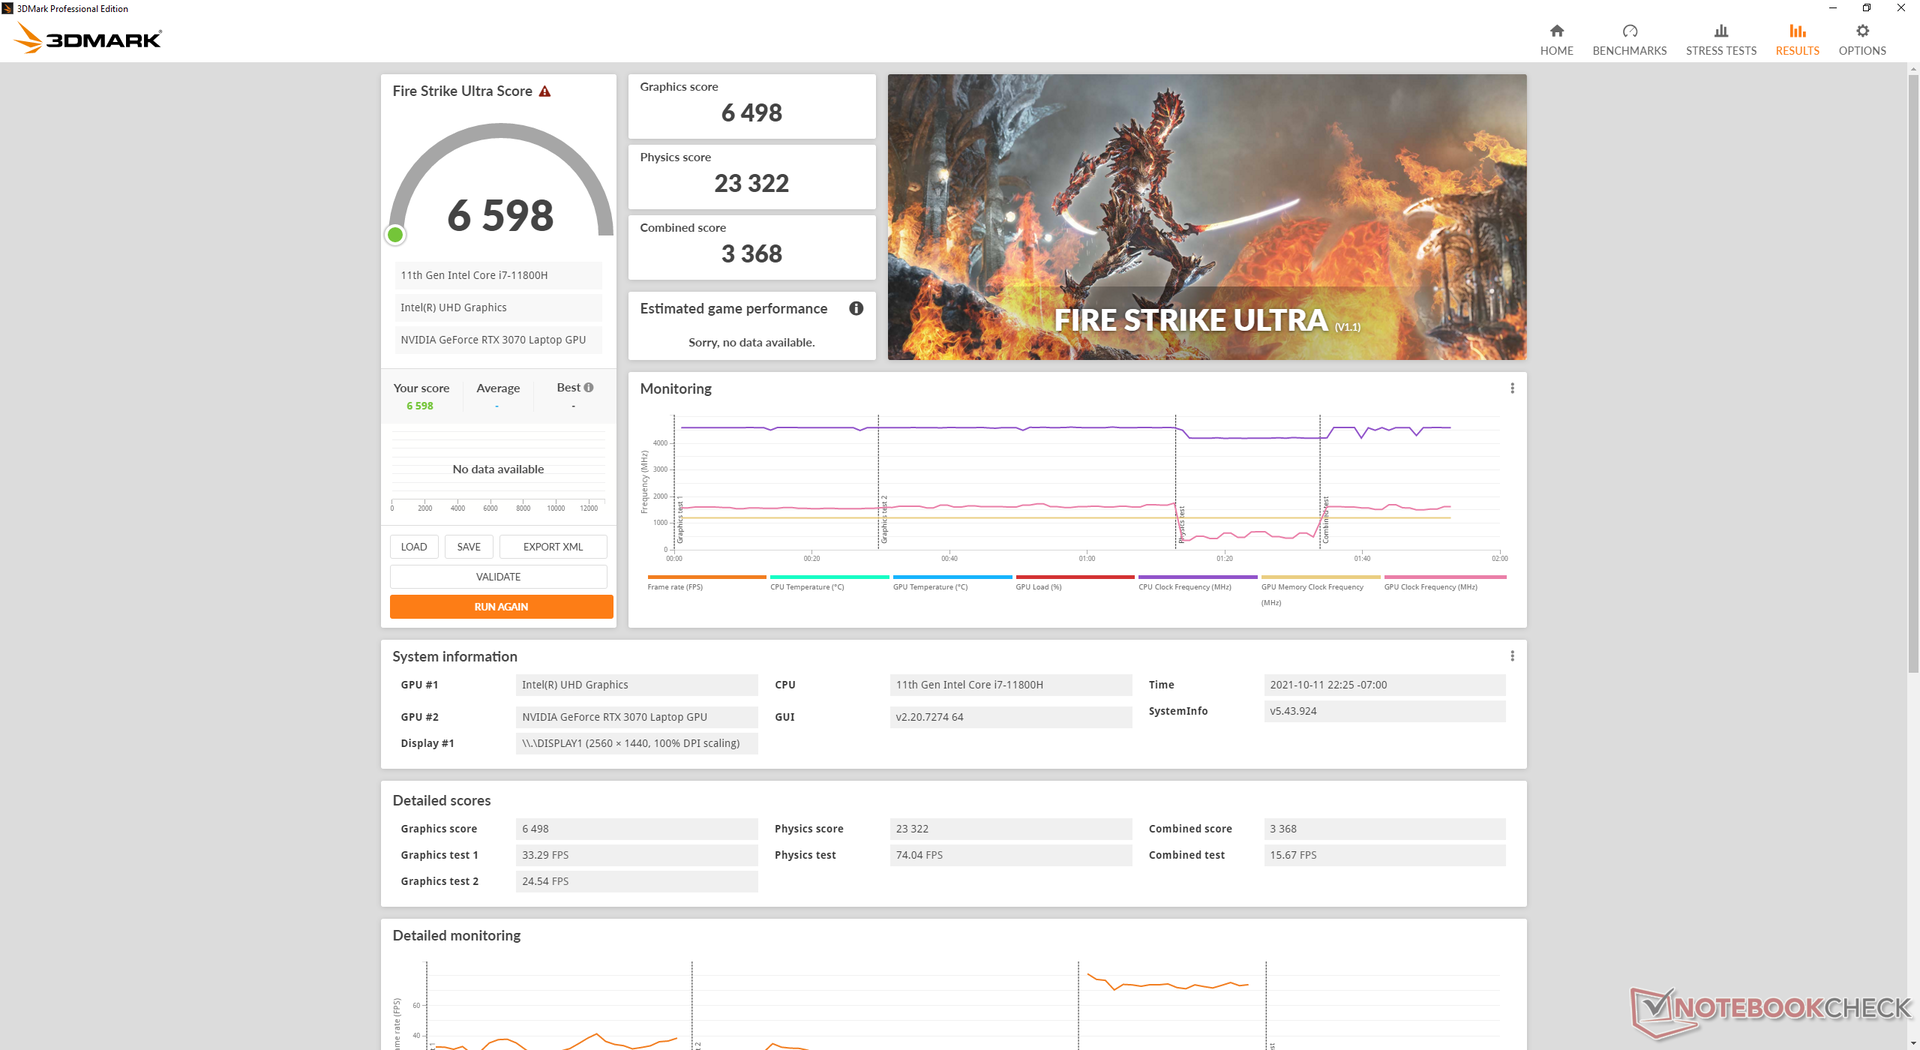
Rendimiento de la GPU - Cerca de una GeForce RTX 3080
El móvil GeForce RTX 3070 rinde donde esperamos que lo haga en relación a otros portátiles con la misma GPU si no es ligeramente más rápido. El rendimiento es incluso más rápido cuando se activa el "Modo Benchmark", aunque por un margen mínimo (26126 frente a 26907 puntos en Fire Strike).
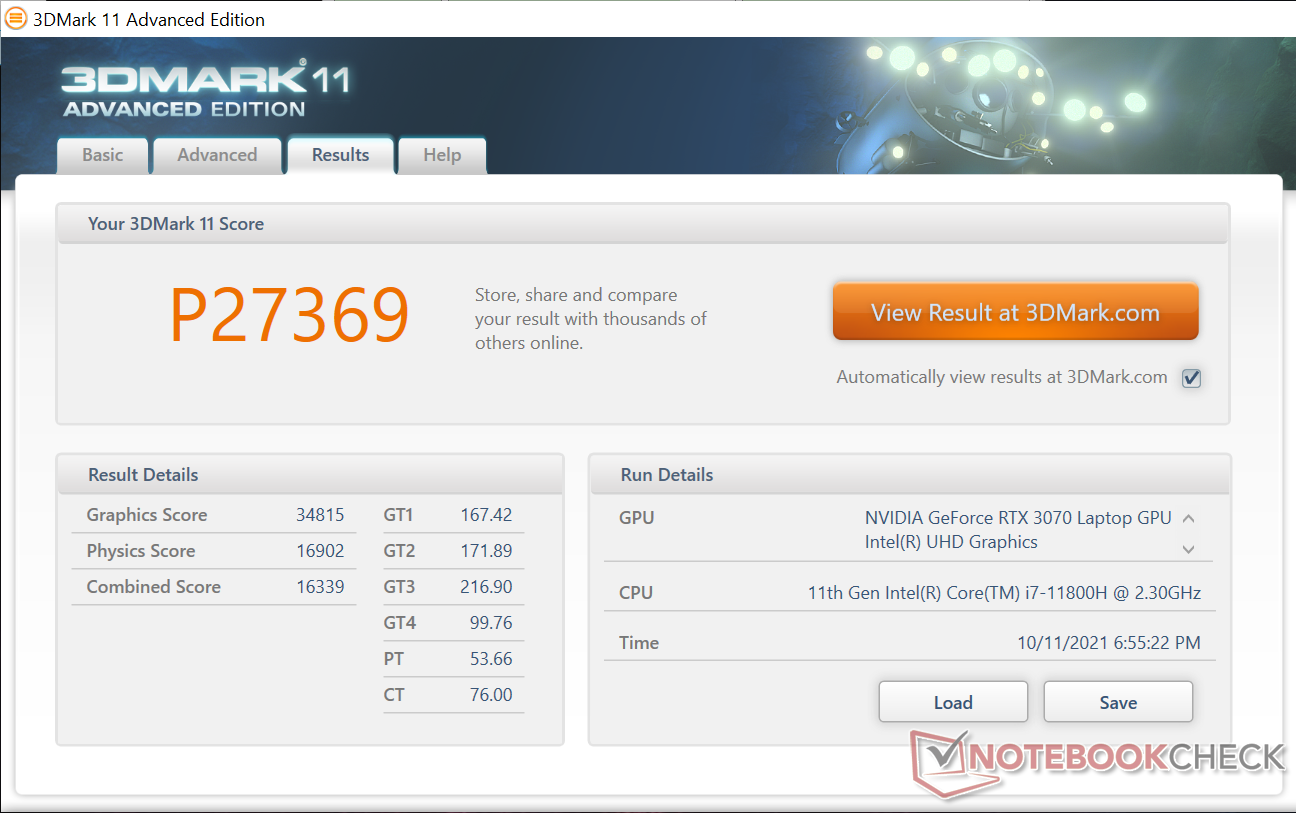
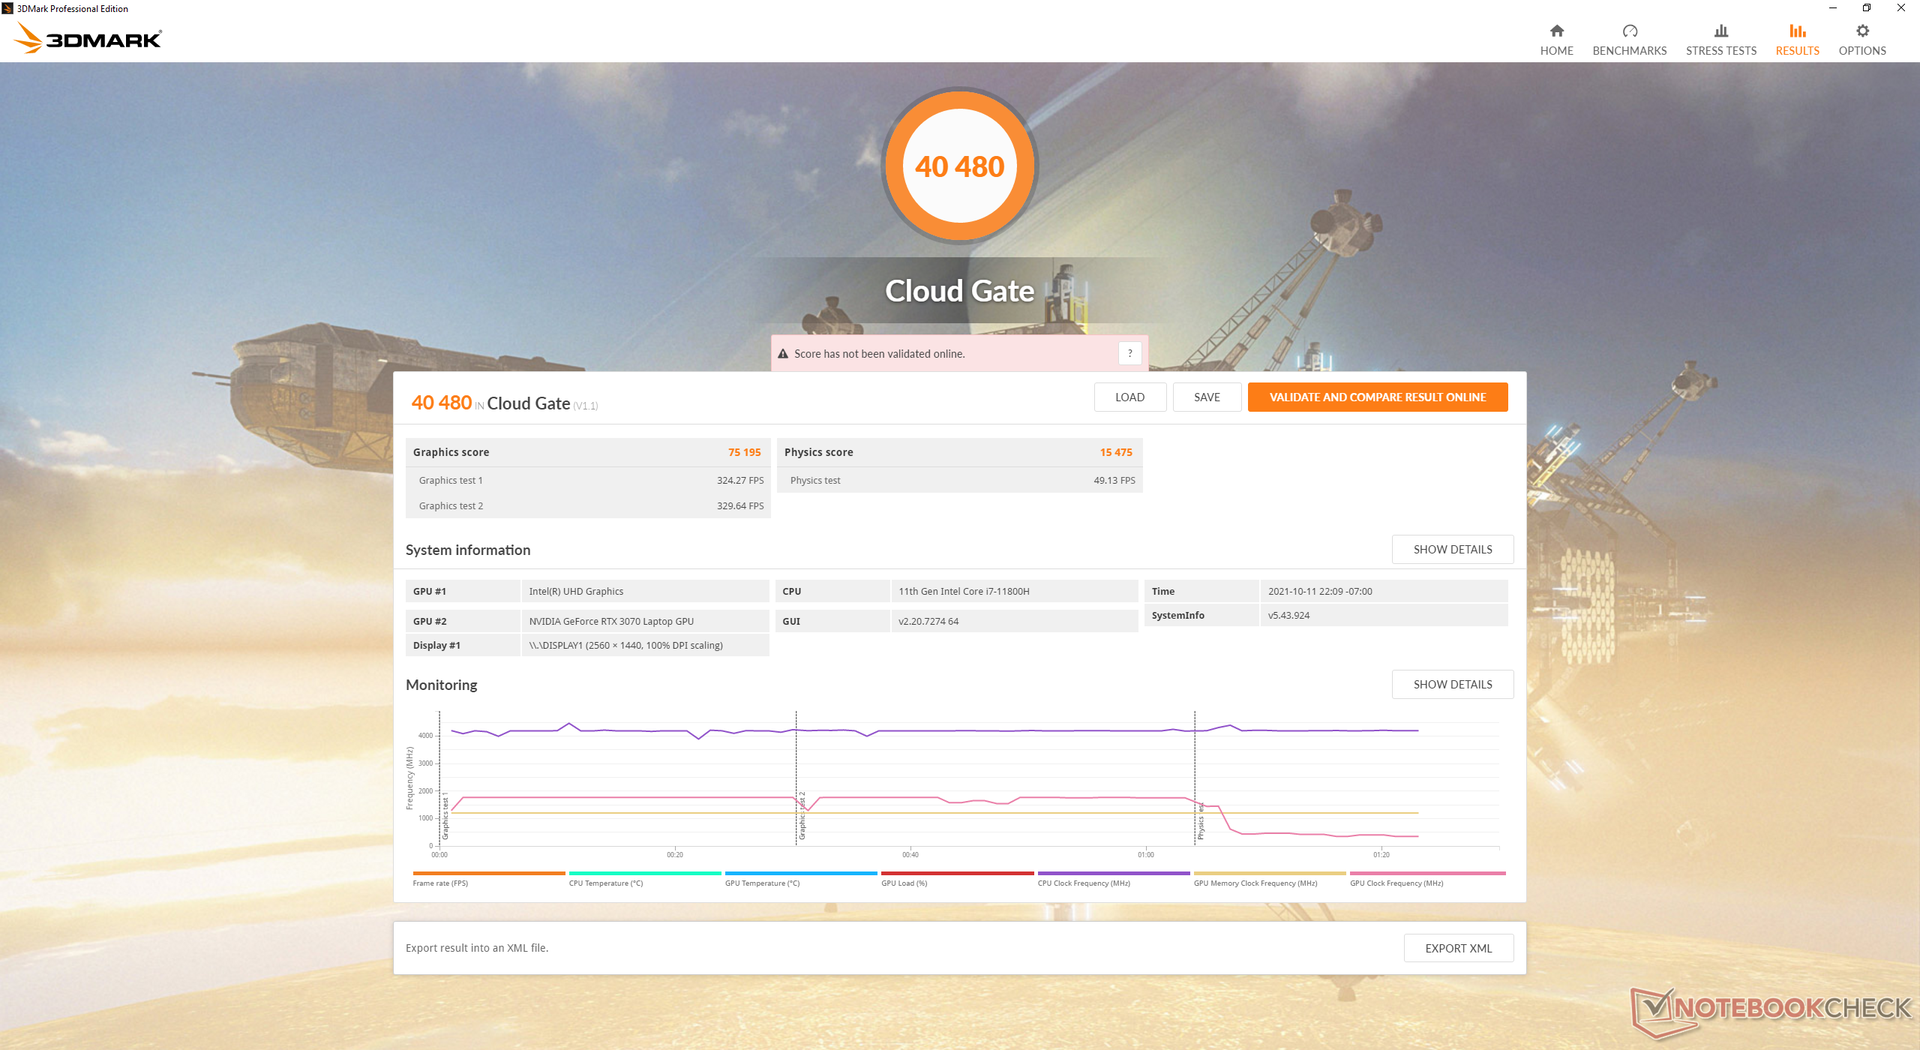

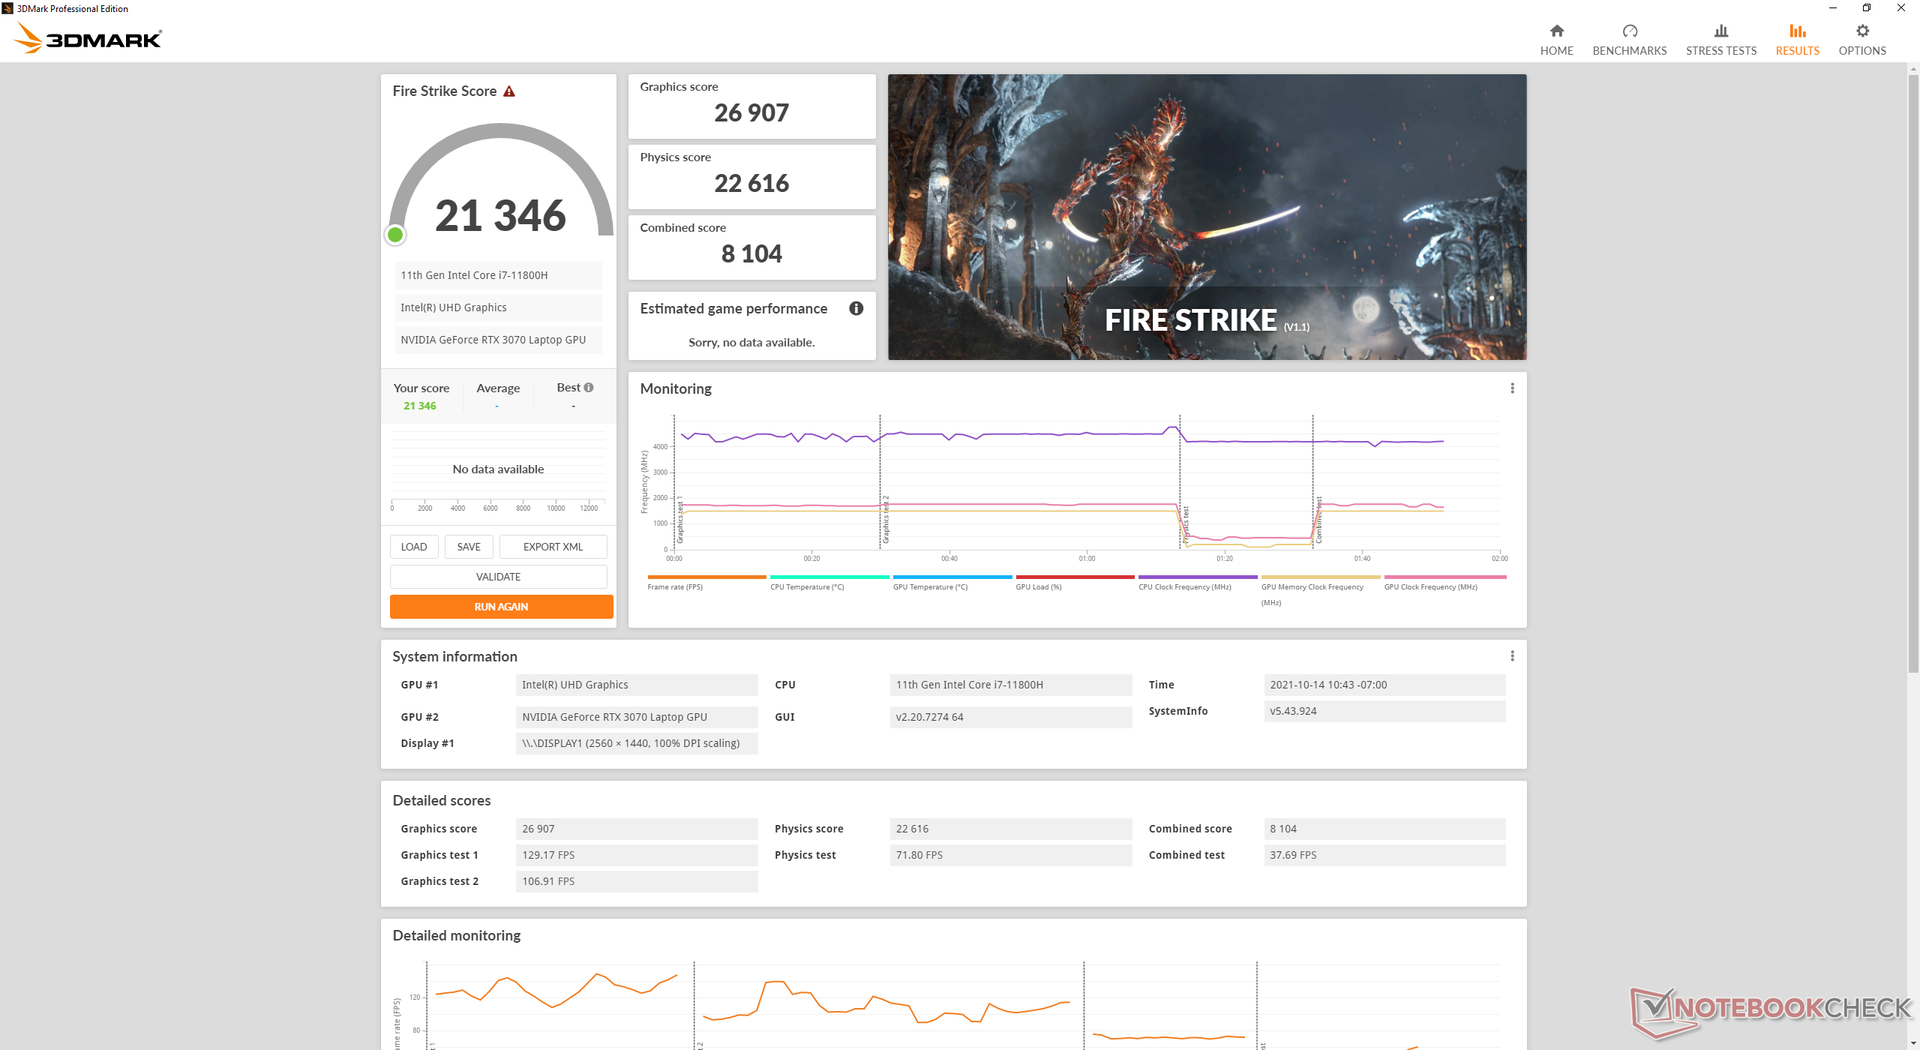
| 3DMark 11 Performance | 27369 puntos | |
| 3DMark Cloud Gate Standard Score | 40480 puntos | |
| 3DMark Fire Strike Score | 20893 puntos | |
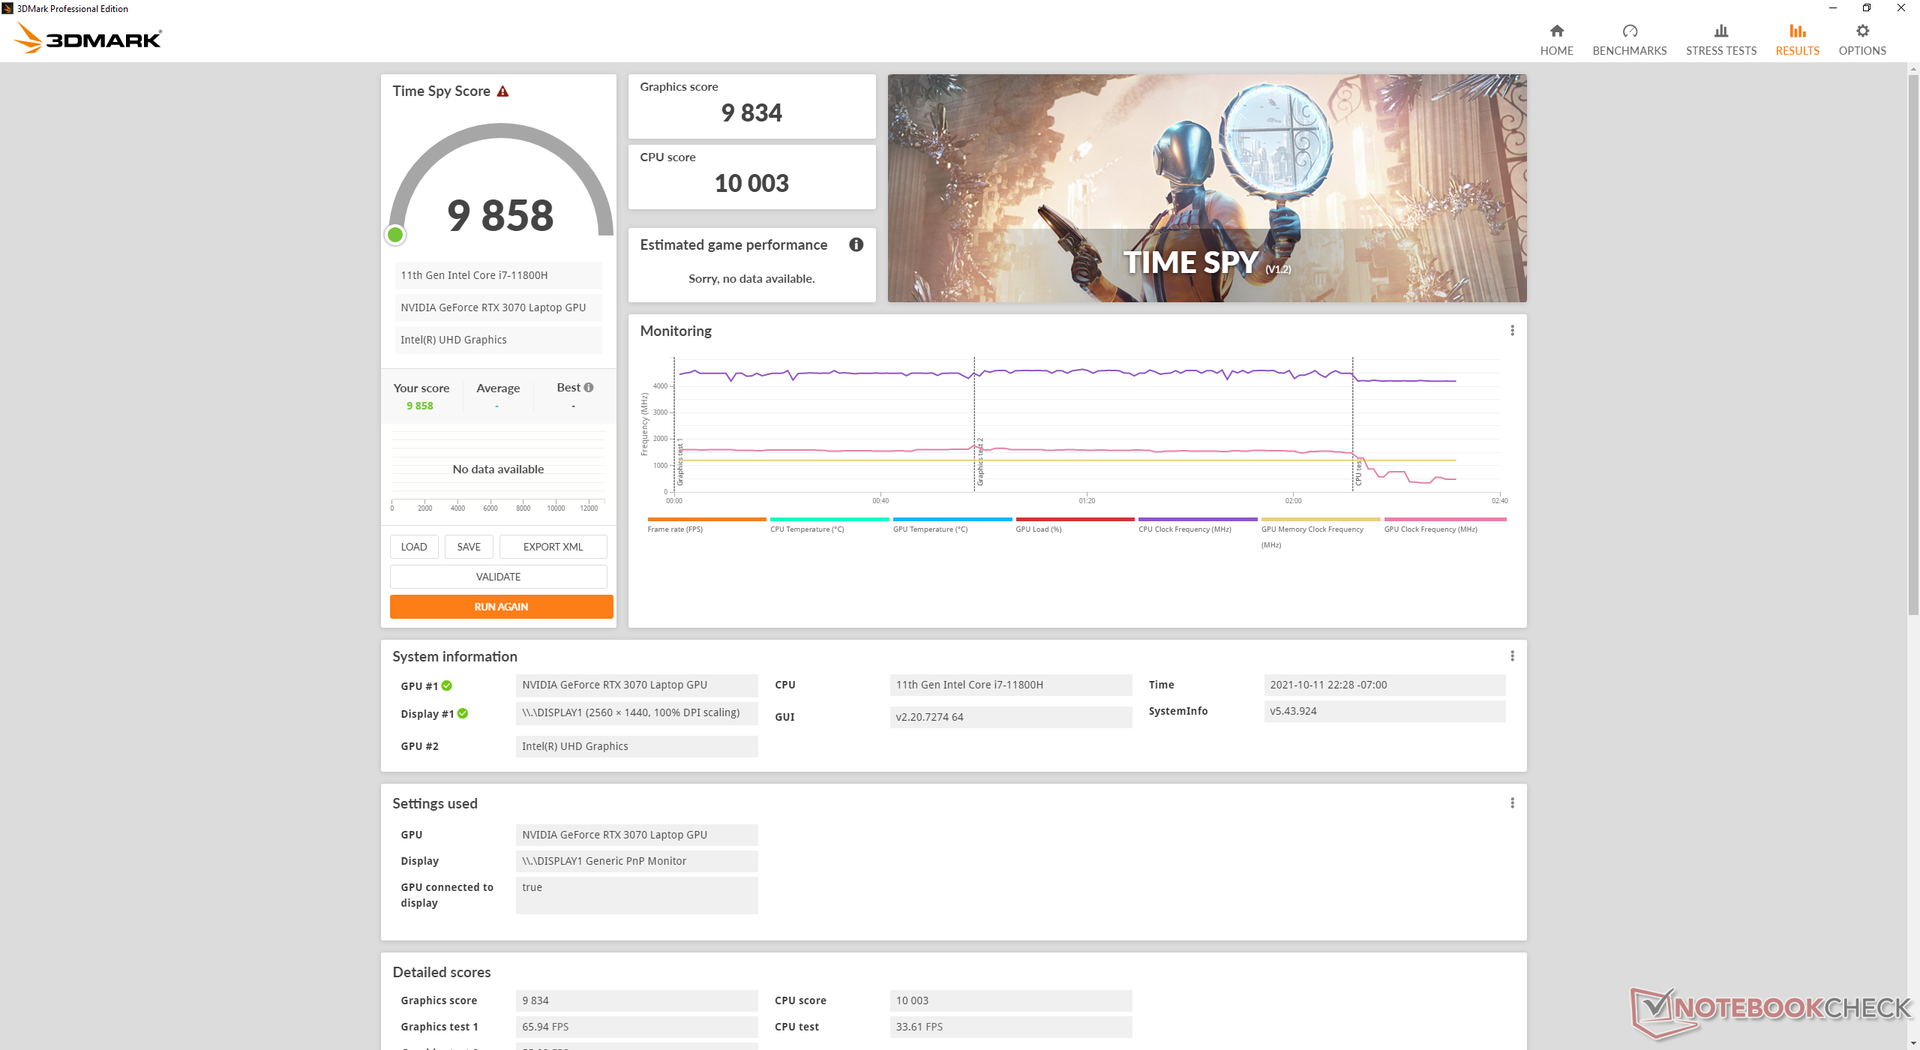
| 3DMark Time Spy Score | 9858 puntos | |
ayuda | ||
Witcher 3 FPS Chart
| bajo | medio | alto | ultra | QHD | |
|---|---|---|---|---|---|
| GTA V (2015) | 180 | 173 | 159 | 95.4 | 85.4 |
| The Witcher 3 (2015) | 376.6 | 279.6 | 181 | 94.8 | |
| Dota 2 Reborn (2015) | 160 | 141 | 134 | 127 | |
| Final Fantasy XV Benchmark (2018) | 171 | 125 | 93.5 | 71.9 | |
| X-Plane 11.11 (2018) | 103 | 94.2 | 75.2 | ||
| Far Cry 5 (2018) | 145 | 116 | 111 | 105 | 91 |
| Strange Brigade (2018) | 406 | 231 | 192 | 170 | 128 |
Emissions
Ruido del sistema - Loud Gamer
Los ventiladores hacen un excelente trabajo al permanecer silenciosos durante el mayor tiempo posible cuando están bajo cargas bajas o medias. Cuando se ejecuta el 3DMark 06, por ejemplo, el ruido del ventilador se mantiene justo por debajo de los 29 dB(A) en comparación con los más de 40 dB(A) del Blade 15 o el Zephyrus G15. Esto podría explicar las temperaturas superficiales más cálidas de lo habitual abajo cuando está en reposo en el escritorio o en la navegación web.
El ruido del ventilador cuando se juega es fuerte incluso para un portátil de juegos. Al ejecutar Witcher 3resulta en un ruido de ventilador estable de casi 53 dB(A) comparado con los 46 dB(A) del Blade 15 o GS66. El ruido del ventilador se vuelve aún más fuerte cuando se activa el Modo Benchmark con casi 55 dB(A).
| ADATA XPG Xenia 15 GeForce RTX 3070 Laptop GPU, i7-11800H, ADATA XPG Gammix S70 1TB | MSI Delta 15 A5EFK Radeon RX 6700M, R9 5900HX, Micron 2210 MTFDHBA1T0QFD | Alienware x15 RTX 3070 P111F GeForce RTX 3070 Laptop GPU, i7-11800H, WDC PC SN730 SDBPNTY-512G | Razer Blade 15 Advanced (Mid 2021) GeForce RTX 3080 Laptop GPU, i7-11800H, SSSTC CA6-8D1024 | MSI GS66 Stealth 10UG GeForce RTX 3070 Laptop GPU, i7-10870H, WDC PC SN730 SDBPNTY-1T00 | Asus ROG Zephyrus G15 GA503Q GeForce RTX 3080 Laptop GPU, R9 5900HS, SK Hynix HFM001TD3JX013N | |
|---|---|---|---|---|---|---|
| Noise | -18% | -2% | -5% | -25% | -13% | |
| apagado / medio ambiente * (dB) | 24.8 | 25 -1% | 24.1 3% | 25.1 -1% | 26.2 -6% | 25 -1% |
| Idle Minimum * (dB) | 24.9 | 25 -0% | 26.6 -7% | 25.3 -2% | 34 -37% | 26 -4% |
| Idle Average * (dB) | 24.9 | 30 -20% | 26.6 -7% | 25.3 -2% | 34 -37% | 27 -8% |
| Idle Maximum * (dB) | 24.9 | 40 -61% | 26.6 -7% | 25.3 -2% | 34 -37% | 31 -24% |
| Load Average * (dB) | 28.8 | 47 -63% | 30.9 -7% | 42 -46% | 47.2 -64% | 49 -70% |
| Witcher 3 ultra * (dB) | 52.7 | 48 9% | 49.9 5% | 45.6 13% | 46.3 12% | 49 7% |
| Load Maximum * (dB) | 54.9 | 51 7% | 53.5 3% | 51.6 6% | 58.2 -6% | 51 7% |
* ... más pequeño es mejor
Ruido
| Ocioso |
| 24.9 / 24.9 / 24.9 dB(A) |
| Carga |
| 28.8 / 54.9 dB(A) |
 | ||
30 dB silencioso 40 dB(A) audible 50 dB(A) ruidosamente alto |
||
min: | ||
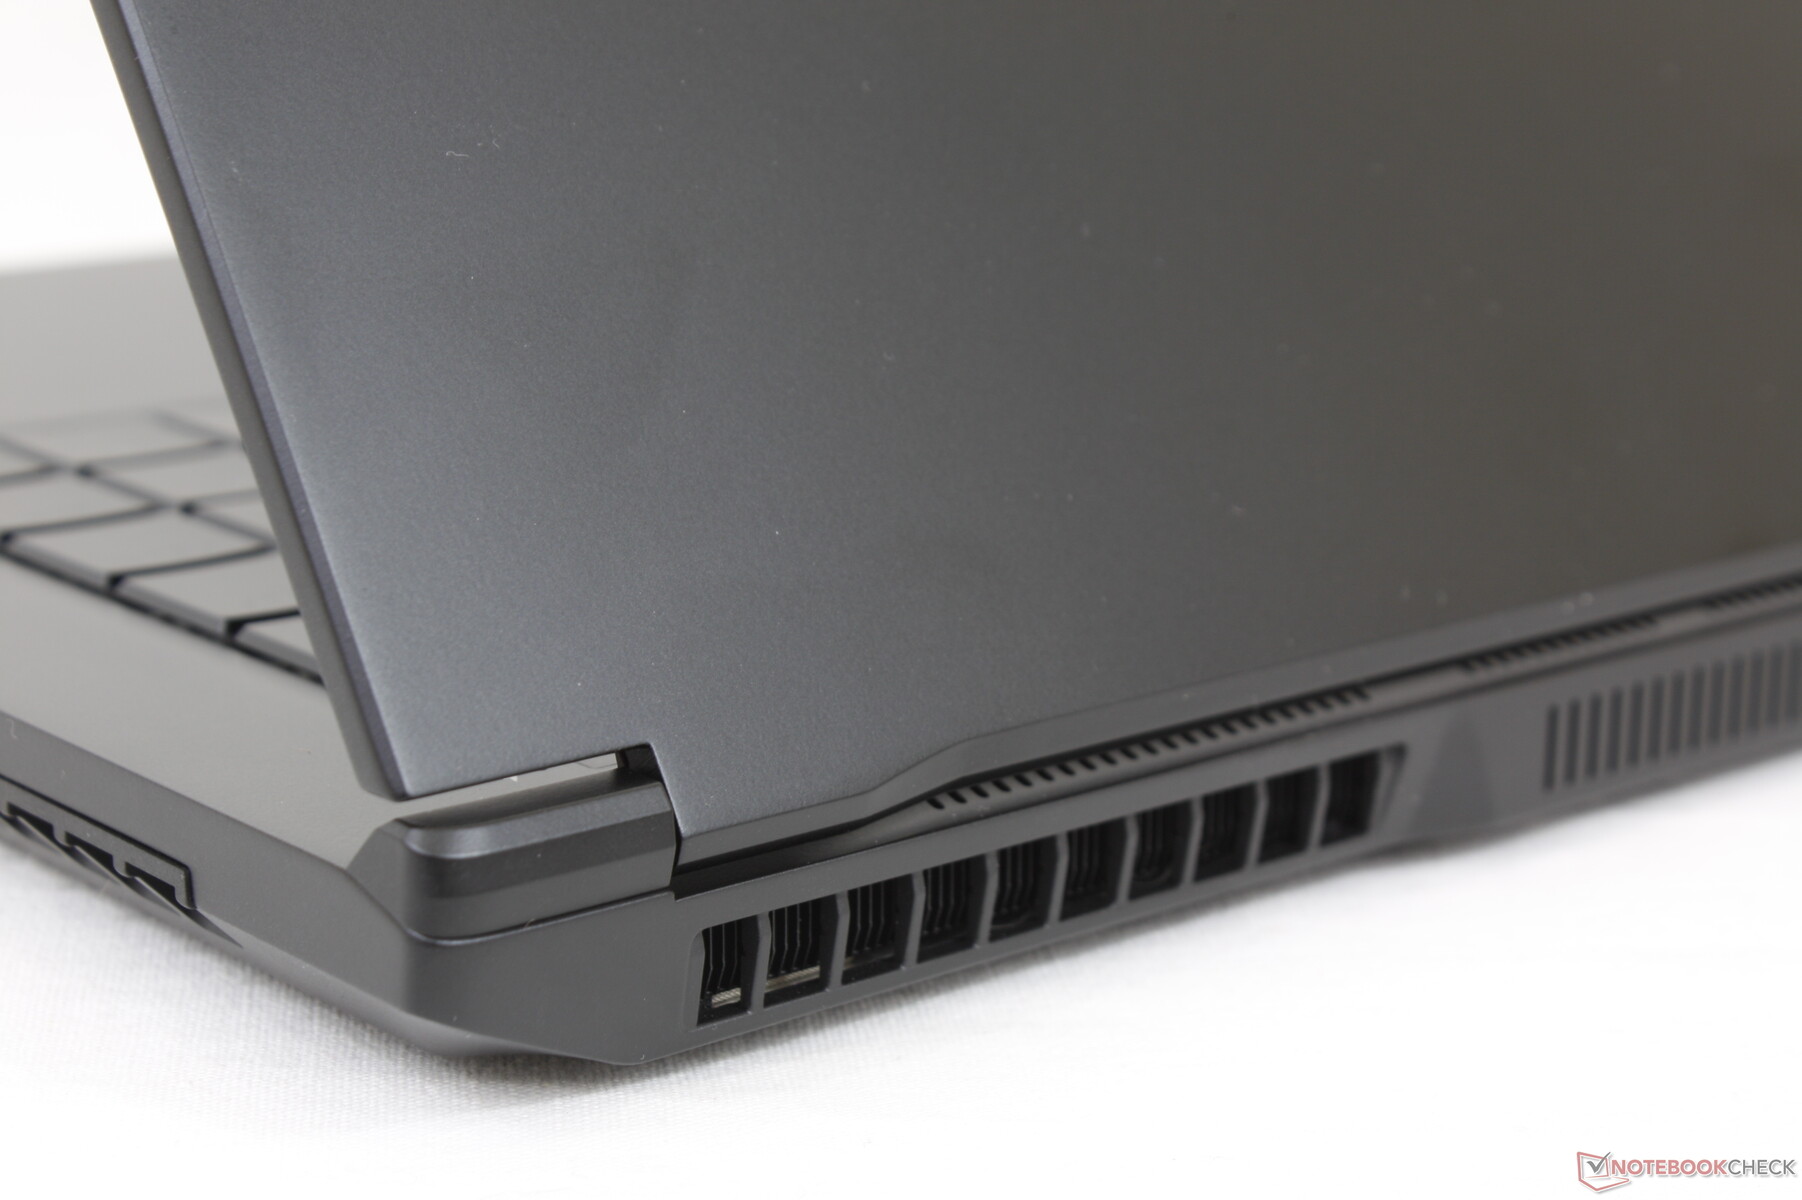
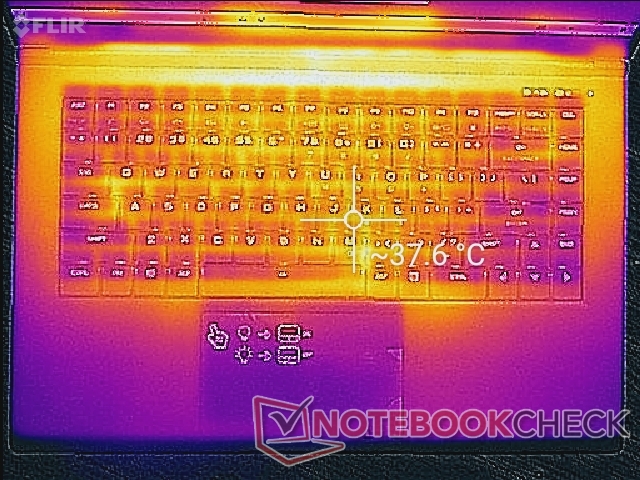
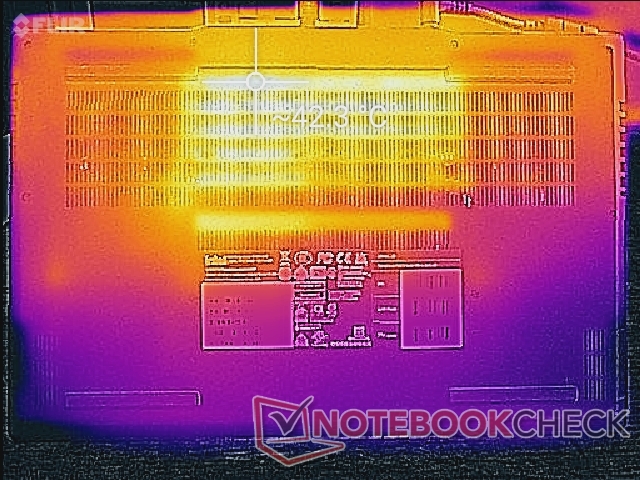
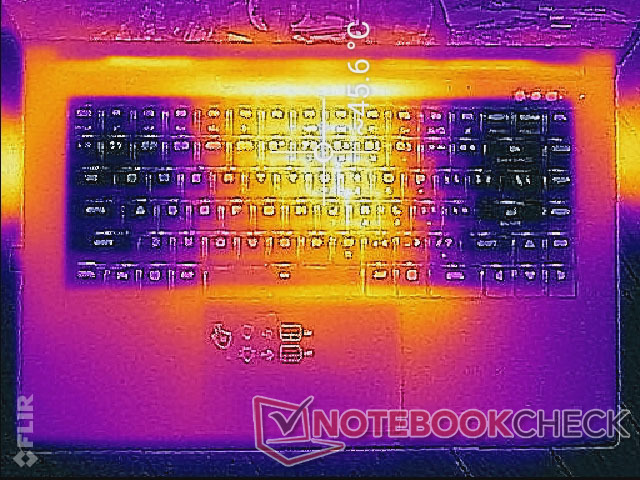
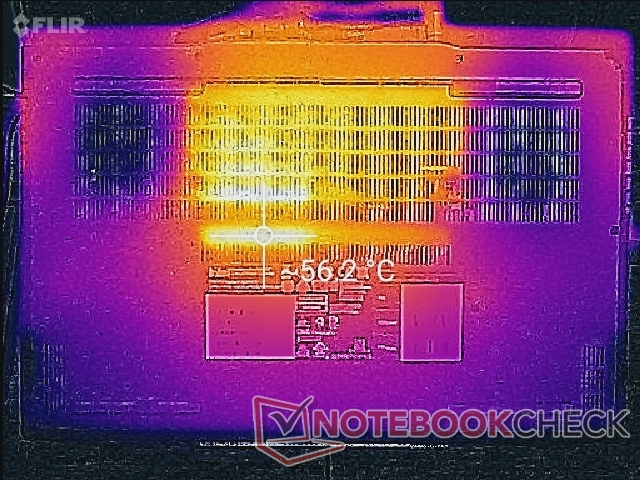
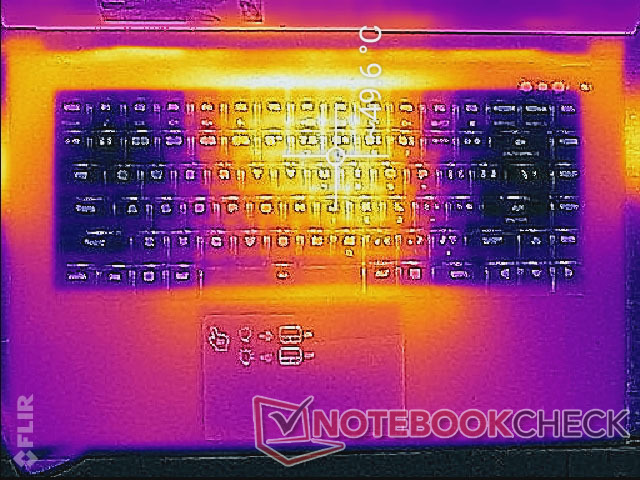
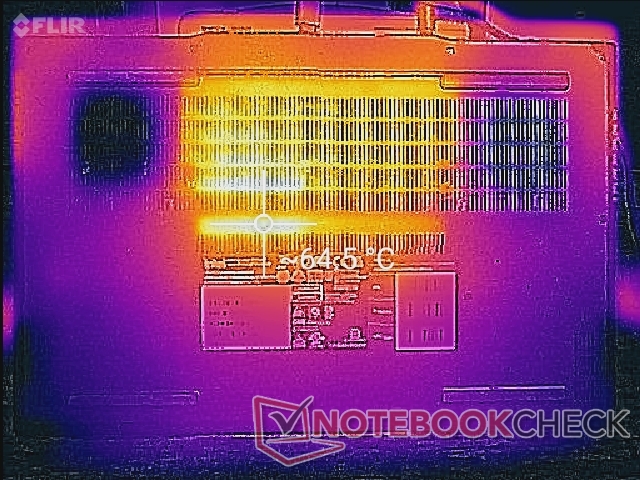
Temperatura - Mucha ventilación
Las temperaturas de la superficie suelen ser muy cálidas incluso en reposo en el escritorio, ya que los ventiladores tienden a estar inactivos. Los puntos calientes bajo este escenario pueden llegar a 38 C o 42 C en la parte superior e inferior del portátil, respectivamente. El centro del teclado puede alcanzar hasta 50 C cuando se juega, comparado con los 45 C del MSI GS66 o Razer Blade 15 Advanced.
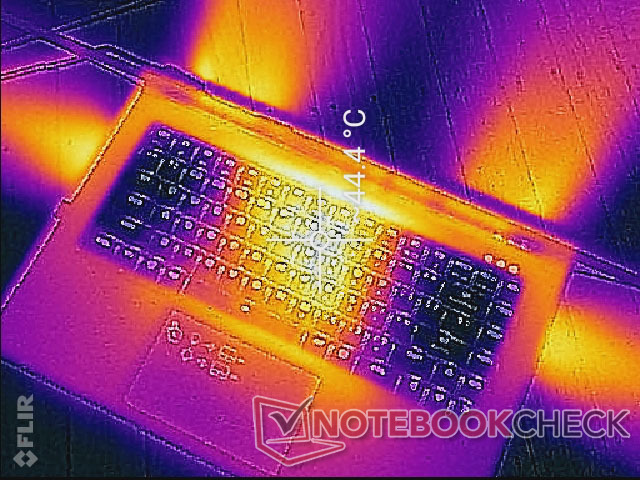
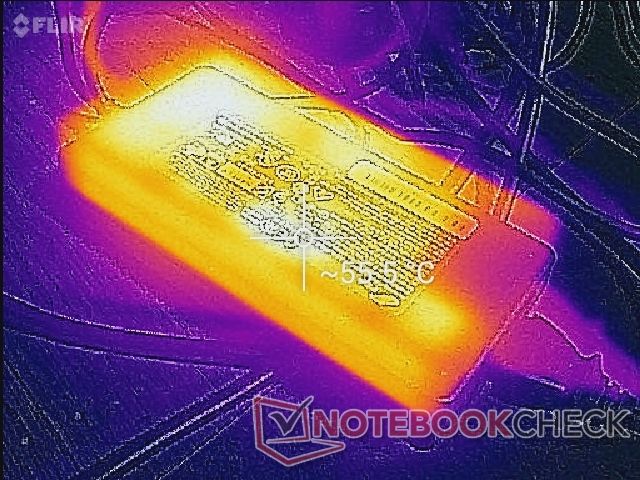
(-) La temperatura máxima en la parte superior es de 49 °C / 120 F, frente a la media de 40.4 °C / 105 F, que oscila entre 21.2 y 68.8 °C para la clase Gaming.
(-) El fondo se calienta hasta un máximo de 64.2 °C / 148 F, frente a la media de 43.2 °C / 110 F
(±) En reposo, la temperatura media de la parte superior es de 35 °C / 95# F, frente a la media del dispositivo de 33.9 °C / 93 F.
(±) Jugando a The Witcher 3, la temperatura media de la parte superior es de 33.4 °C / 92 F, frente a la media del dispositivo de 33.9 °C / 93 F.
(+) Los reposamanos y el panel táctil alcanzan como máximo la temperatura de la piel (34.4 °C / 93.9 F) y, por tanto, no están calientes.
(-) La temperatura media de la zona del reposamanos de dispositivos similares fue de 28.8 °C / 83.8 F (-5.6 °C / -10.1 F).
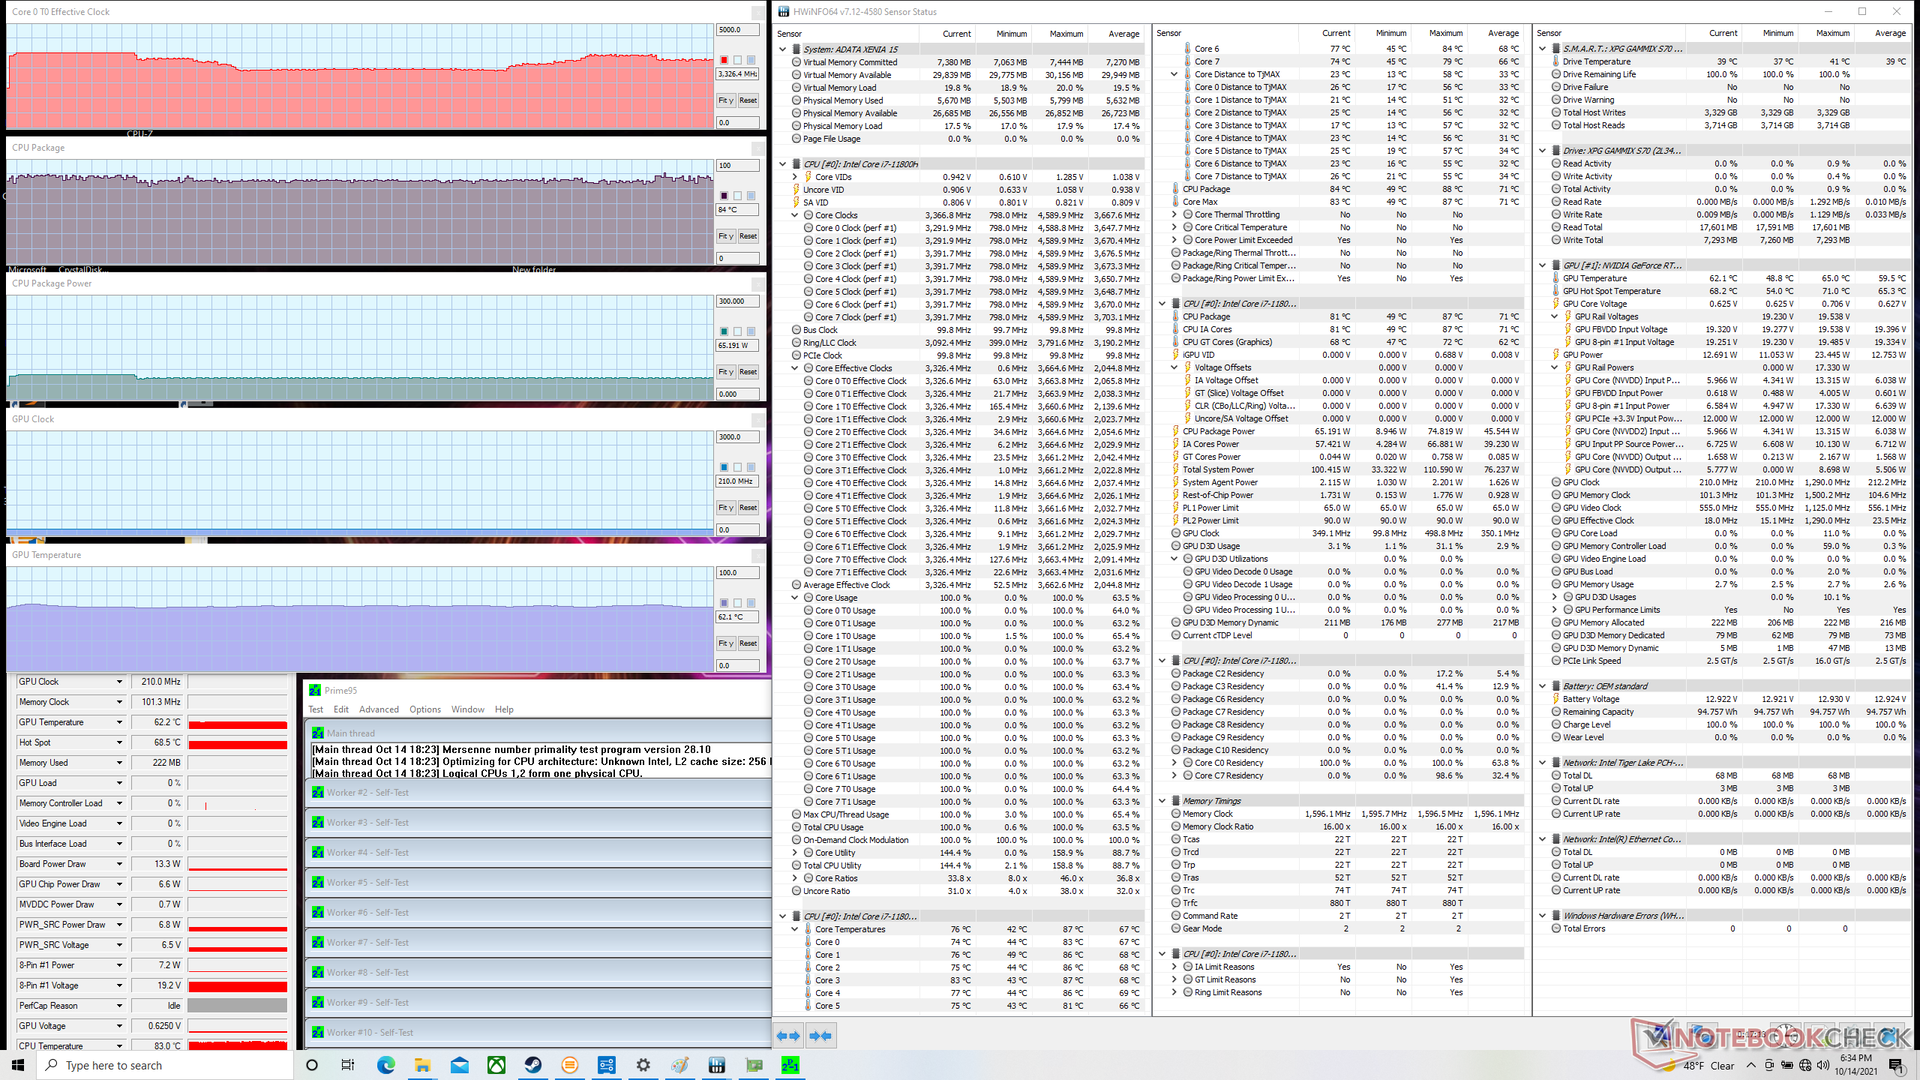
Prueba de esfuerzo
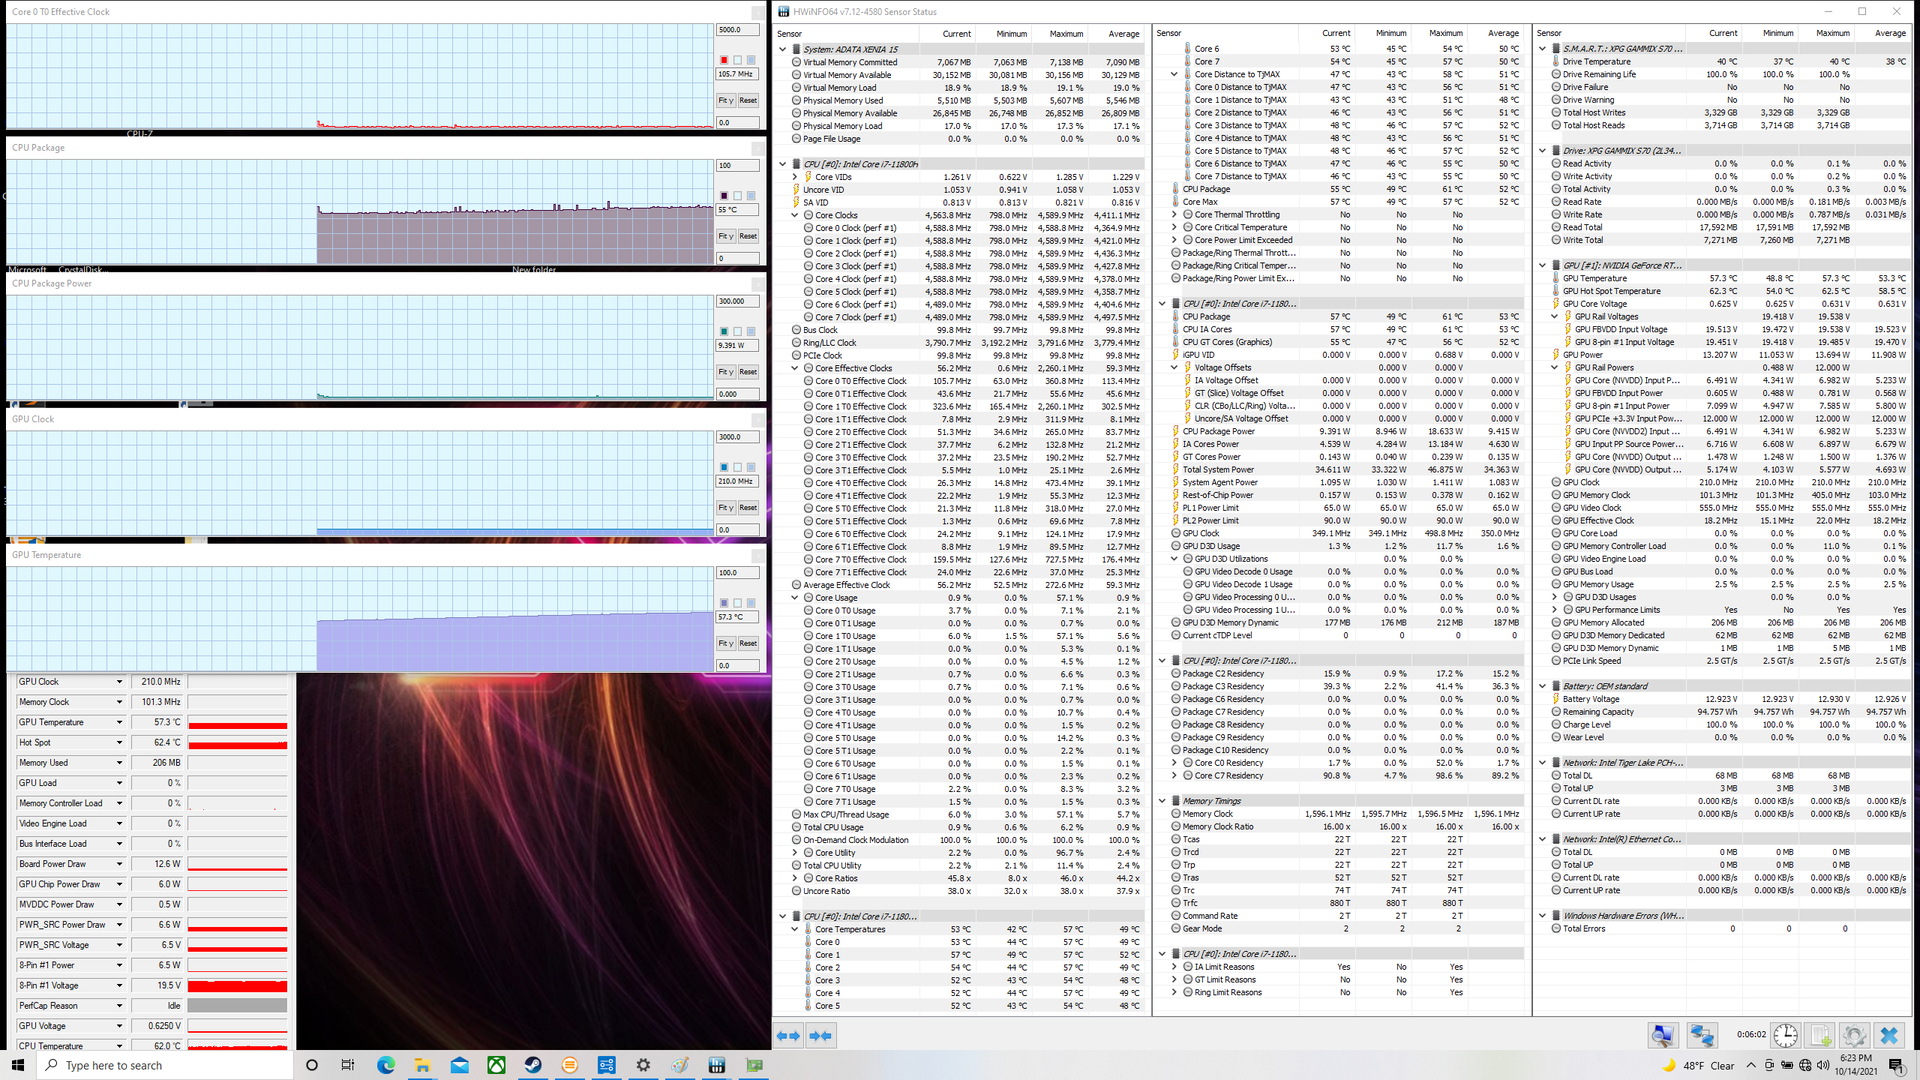
Cuando se estresa con Prime95, la CPU sube a 3,7 GHz durante el primer minuto más o menos antes de caer y ciclar entre 2,8 GHz y 3,5 GHz cada pocos minutos. La temperatura del núcleo se estabilizaba en torno a los 80 C, que es ligeramente más fría que la registrada en el MSI GS66 bajo cargas similares.
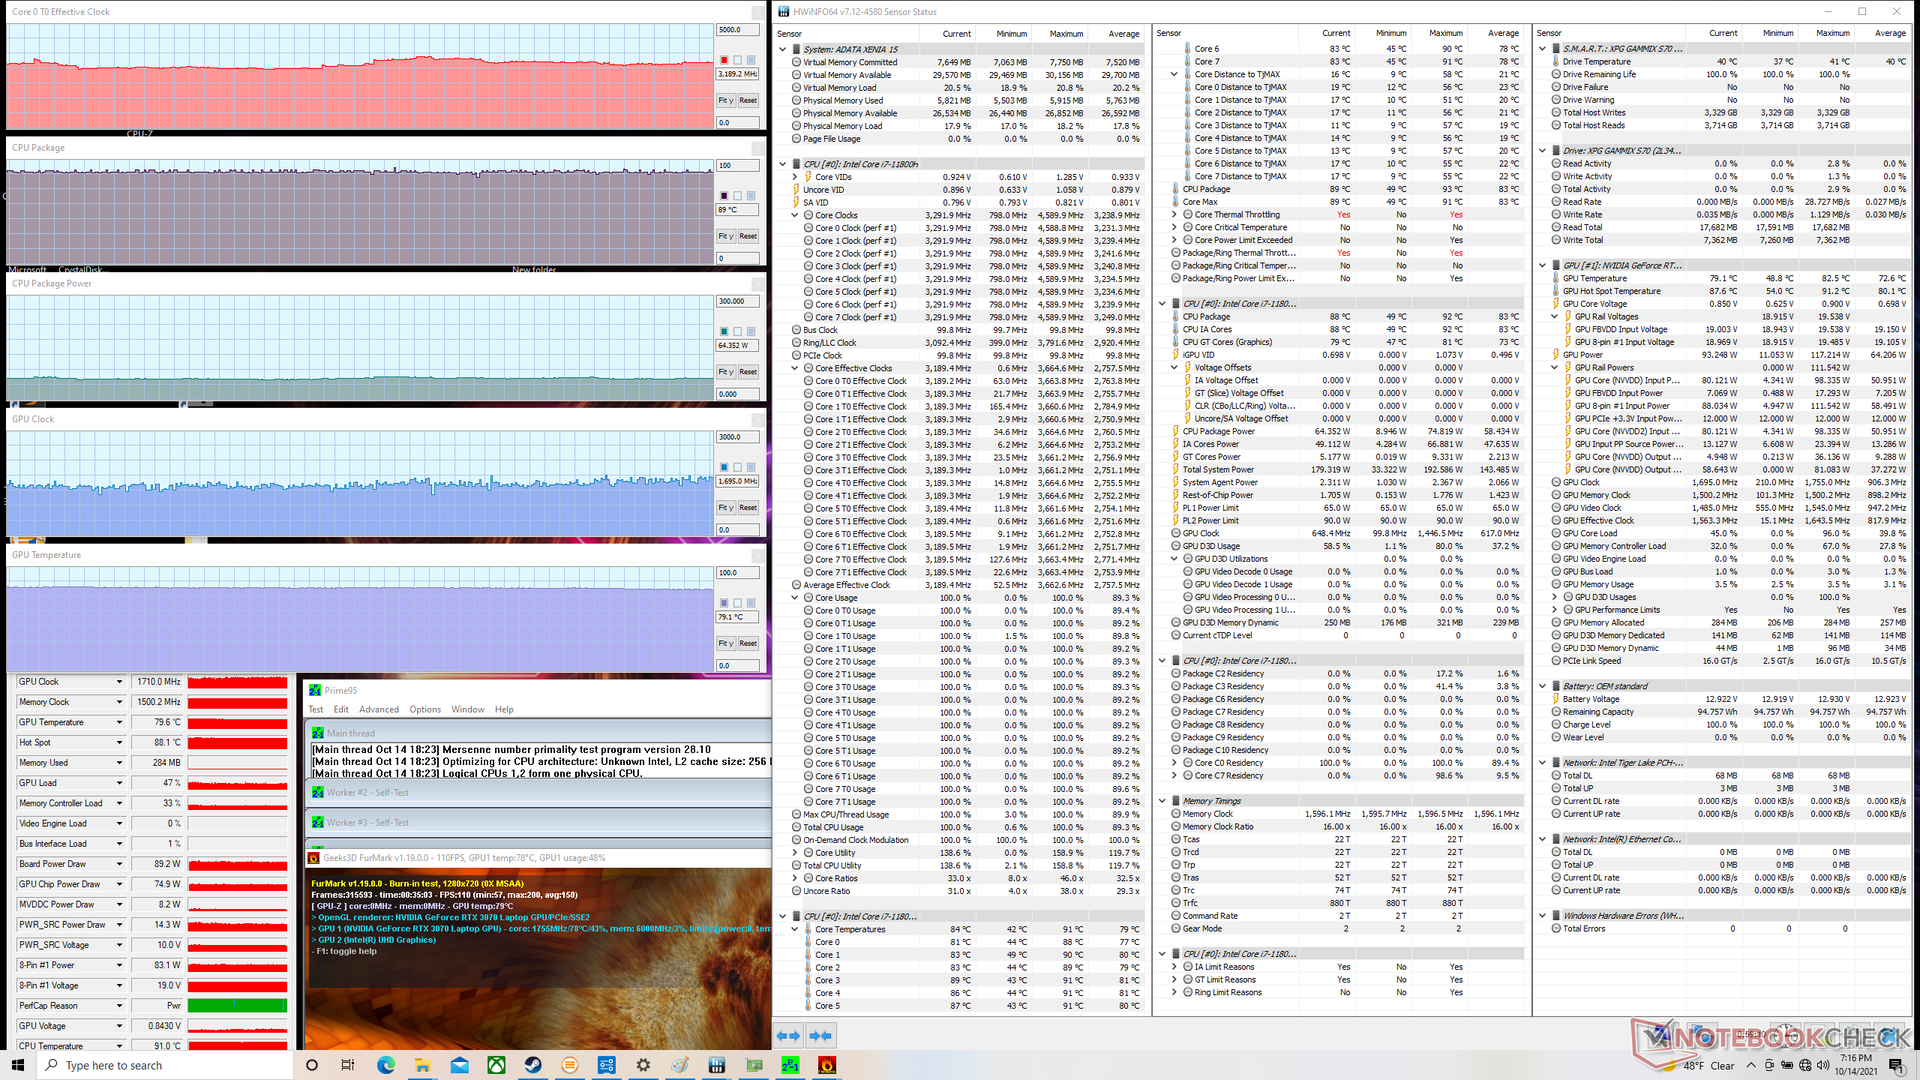
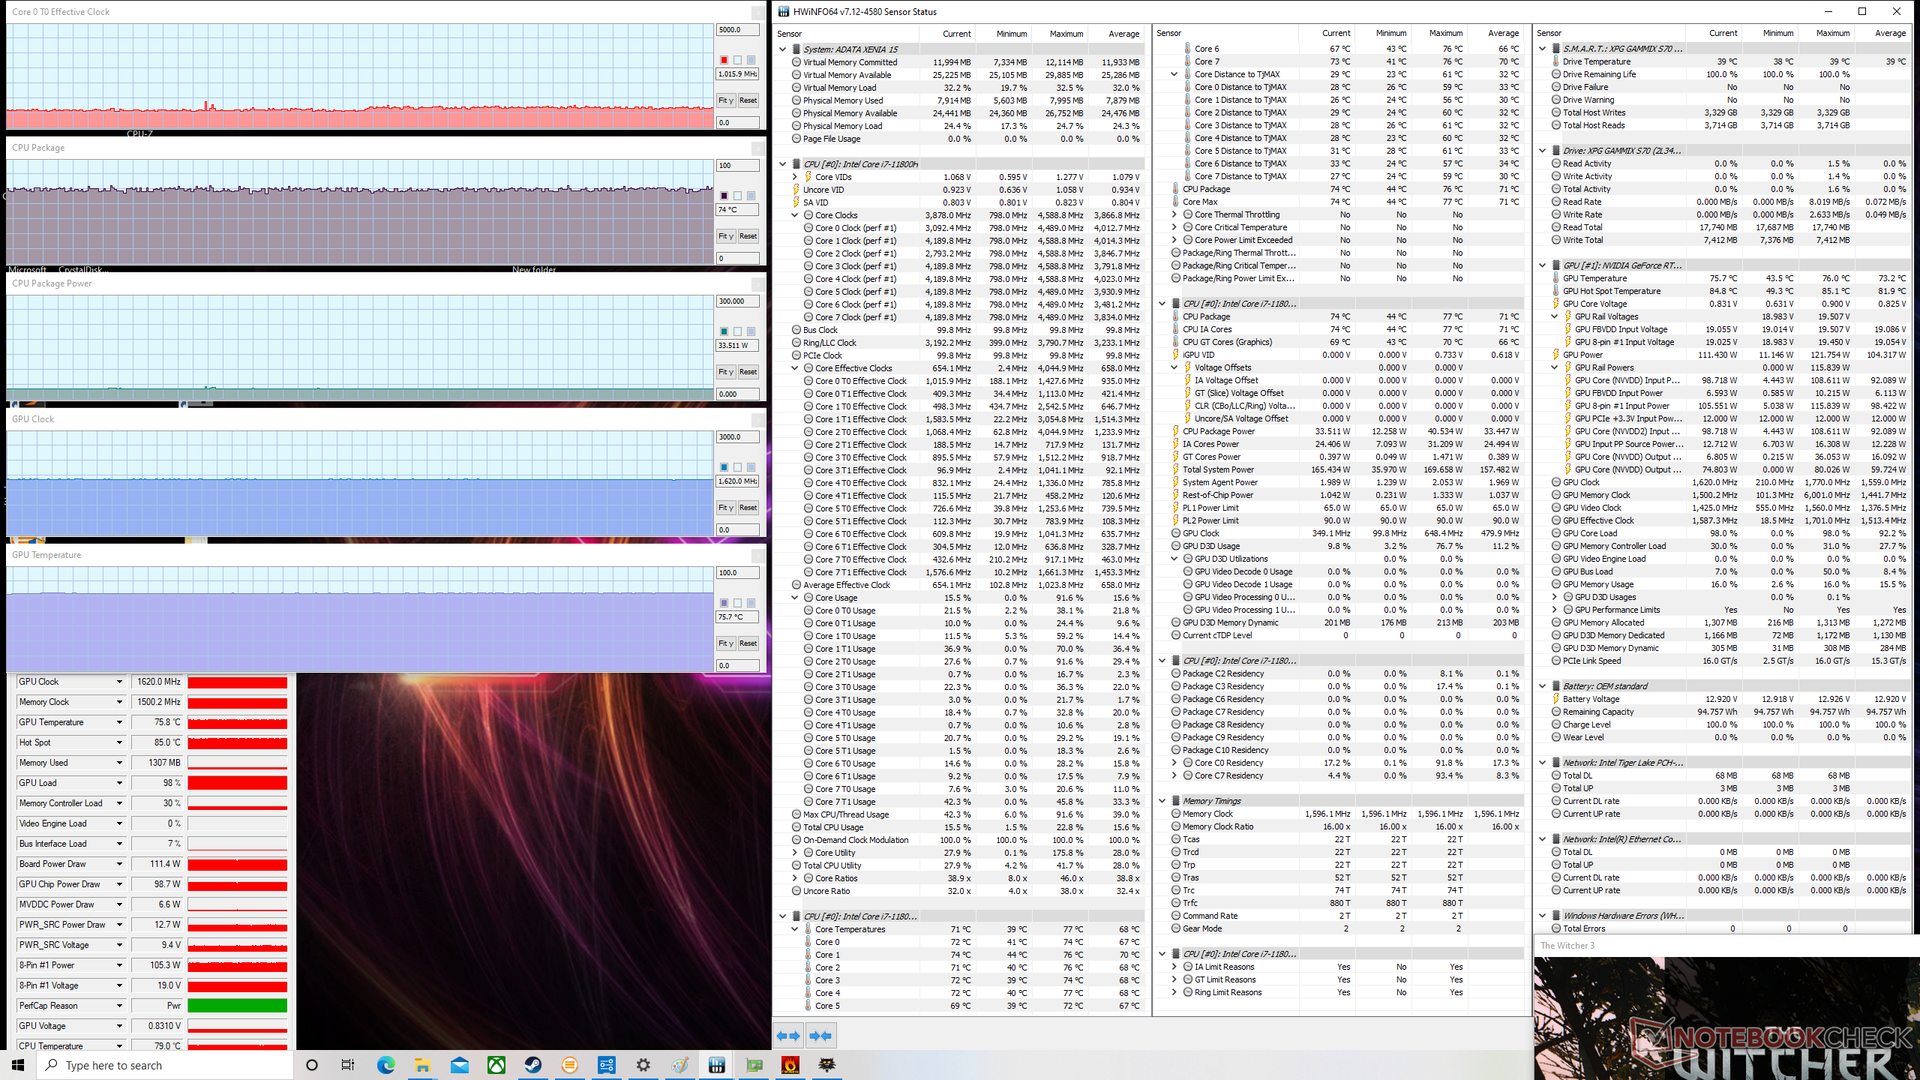
Las cosas se ponen interesantes cuando se prueba el modo Benchmark en los juegos. Al ejecutar Witcher 3 con el Modo Benchmark desactivado, la velocidad de reloj de la GPU se estabiliza y el consumo de energía de la placa es de 1620 MHz y 111 W, respectivamente, en comparación con 1725 MHz y 125 W con el Modo Benchmark activado. Por tanto, es necesario activar la función para exprimir al máximo el rendimiento de la GPU. La CPU y la GPU se estabilizan a 76 C y 81 C cuando se ejecutan Witcher 3 en el Modo Benchmark, respectivamente, que son cifras comparables a las del Razer Blade 15 Advanced.
Funcionar con batería limitará el rendimiento. Un Fire Strike ejecutado con baterías arrojaría unas puntuaciones de Física y Gráficos de 19060 y 18191 puntos, respectivamente, en comparación con los 22616 y 26907 puntos de la red eléctrica.

| Relojde la CPU(GHz) | Reloj dela GPU(MHz) | Temperatura media de la CPU (°C) | Temperaturamediade la GPU (°C) | |
| Sistema en reposo | 56 | 58 | ||
| EstrésPrime95 | 2,8 - 3,5 | -- | ~80 | 63 |
| Estrés de Prime95+ FurMark | ~3,2 | 1710 | 89 | 79 |
| Witcher 3 Estrés (modo de prueba desactivado) | 3.0+ | 1620 | 74 | 76 |
| Witcher 3 Estrés (Modo Benchmark activado) | 4.1+ | 1725 | 76 | 81 |
Altavoces - Difícil de oír cuando se juega
Los altavoces integrados están en el lado débil especialmente cuando se juega ya que los ventiladores pueden ser bastante fuertes. El volumen máximo también es más suave que en el GS66. Definitivamente querrás un par de auriculares cuando juegues para escuchar mejor el audio del juego.


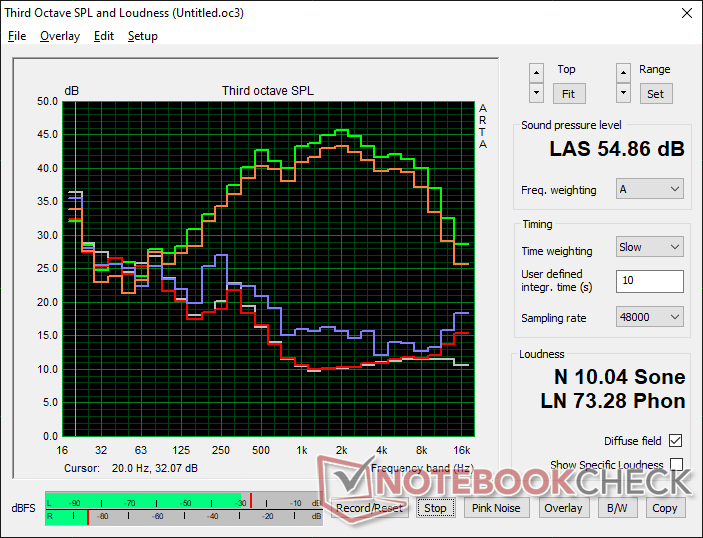
ADATA XPG Xenia 15 análisis de audio
(±) | la sonoridad del altavoz es media pero buena (77.6 dB)
Graves 100 - 315 Hz
(-) | casi sin bajos - de media 20.5% inferior a la mediana
(±) | la linealidad de los graves es media (12.7% delta a frecuencia anterior)
Medios 400 - 2000 Hz
(±) | medias más altas - de media 5.1% más altas que la mediana
(+) | los medios son lineales (5.7% delta a la frecuencia anterior)
Altos 2 - 16 kHz
(+) | máximos equilibrados - a sólo 1.9% de la mediana
(+) | los máximos son lineales (3.7% delta a la frecuencia anterior)
Total 100 - 16.000 Hz
(±) | la linealidad del sonido global es media (17.3% de diferencia con la mediana)
En comparación con la misma clase
» 47% de todos los dispositivos probados de esta clase eran mejores, 12% similares, 41% peores
» El mejor tuvo un delta de 6%, la media fue 18%, el peor fue ###max##%
En comparación con todos los dispositivos probados
» 33% de todos los dispositivos probados eran mejores, 8% similares, 59% peores
» El mejor tuvo un delta de 4%, la media fue 23%, el peor fue ###max##%
Apple MacBook 12 (Early 2016) 1.1 GHz análisis de audio
(+) | los altavoces pueden reproducir a un volumen relativamente alto (#83.6 dB)
Graves 100 - 315 Hz
(±) | lubina reducida - en promedio 11.3% inferior a la mediana
(±) | la linealidad de los graves es media (14.2% delta a frecuencia anterior)
Medios 400 - 2000 Hz
(+) | medios equilibrados - a sólo 2.4% de la mediana
(+) | los medios son lineales (5.5% delta a la frecuencia anterior)
Altos 2 - 16 kHz
(+) | máximos equilibrados - a sólo 2% de la mediana
(+) | los máximos son lineales (4.5% delta a la frecuencia anterior)
Total 100 - 16.000 Hz
(+) | el sonido global es lineal (10.2% de diferencia con la mediana)
En comparación con la misma clase
» 7% de todos los dispositivos probados de esta clase eran mejores, 2% similares, 90% peores
» El mejor tuvo un delta de 5%, la media fue 18%, el peor fue ###max##%
En comparación con todos los dispositivos probados
» 5% de todos los dispositivos probados eran mejores, 1% similares, 94% peores
» El mejor tuvo un delta de 4%, la media fue 23%, el peor fue ###max##%
Energy Management
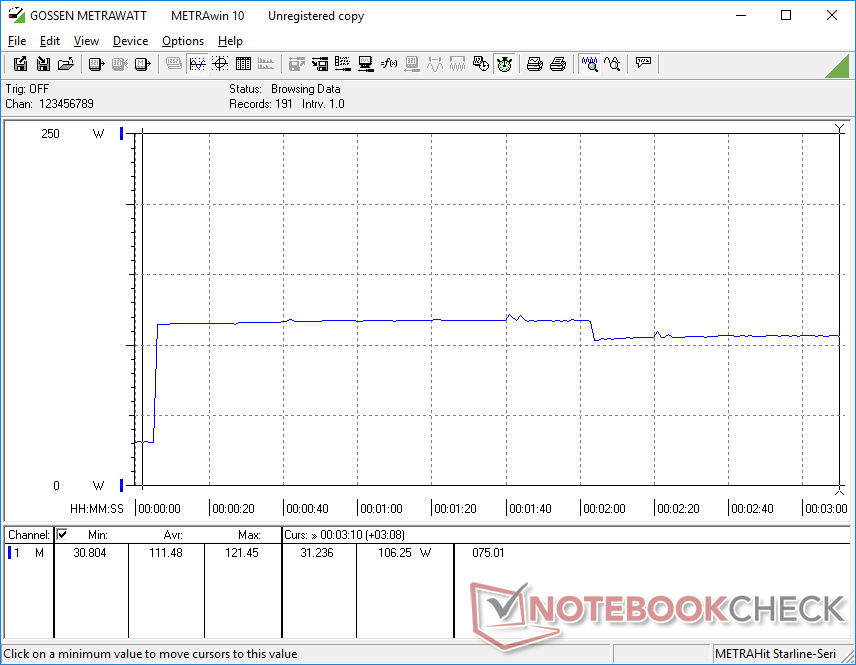
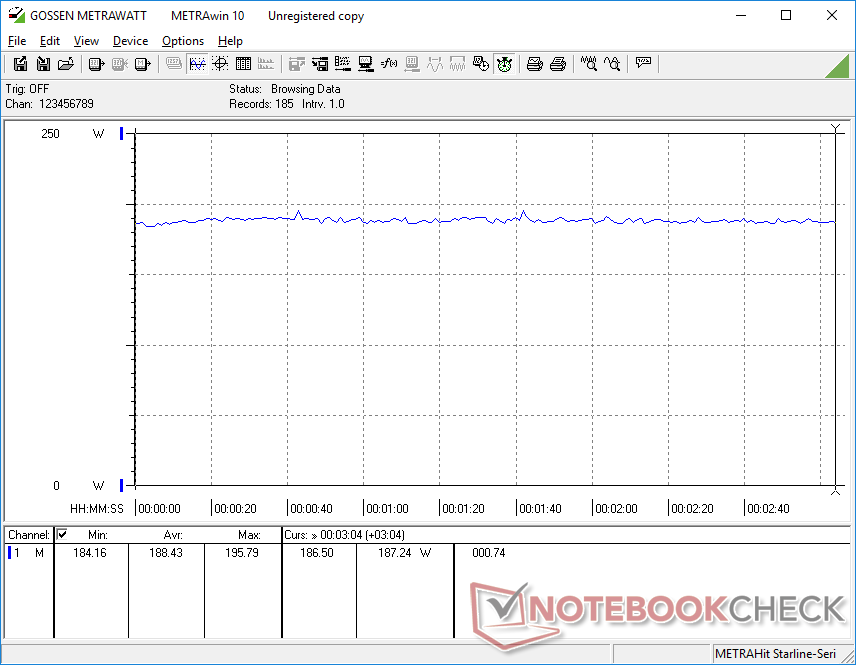
Consumo de energía
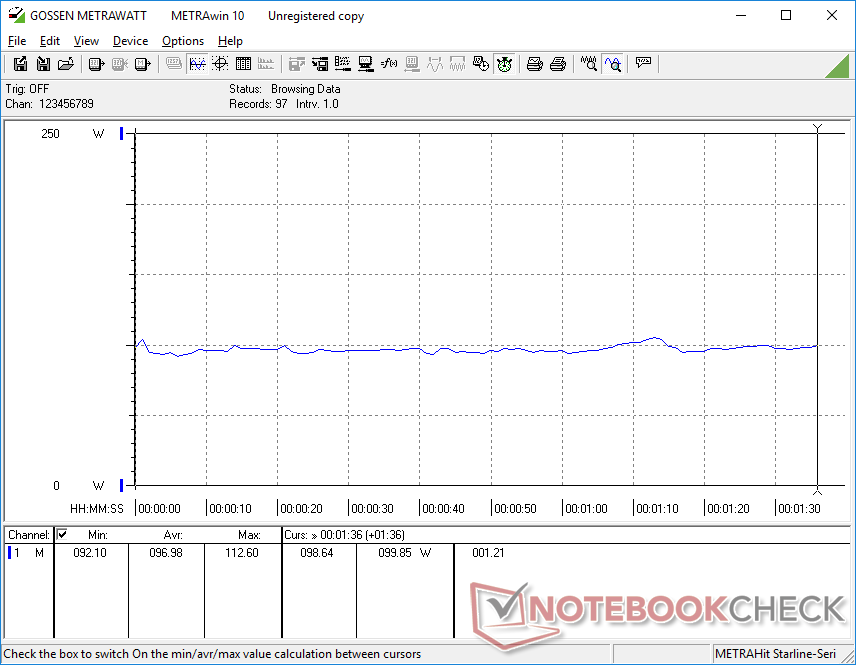
El sistema consume entre 8 W y 32 W con cargas bajas, dependiendo de la configuración del brillo, el perfil de energía y la configuración de la GPU. Si se ejecuta Witcher 3 consumiría alrededor de 188 W o incluso casi 200 W si está en el Modo Benchmark para ser más de lo que hemos registrado en muchos otros portátiles ultradelgados de 15.6 pulgadas GeForce RTX. El panel QHD de mayor resolución y el TGP objetivo de 125 W son probablemente los responsables de los mayores vatajes ya que otros portátiles de esta categoría de tamaño suelen venir con paneles FHD y GPUs de ~100 W en su lugar
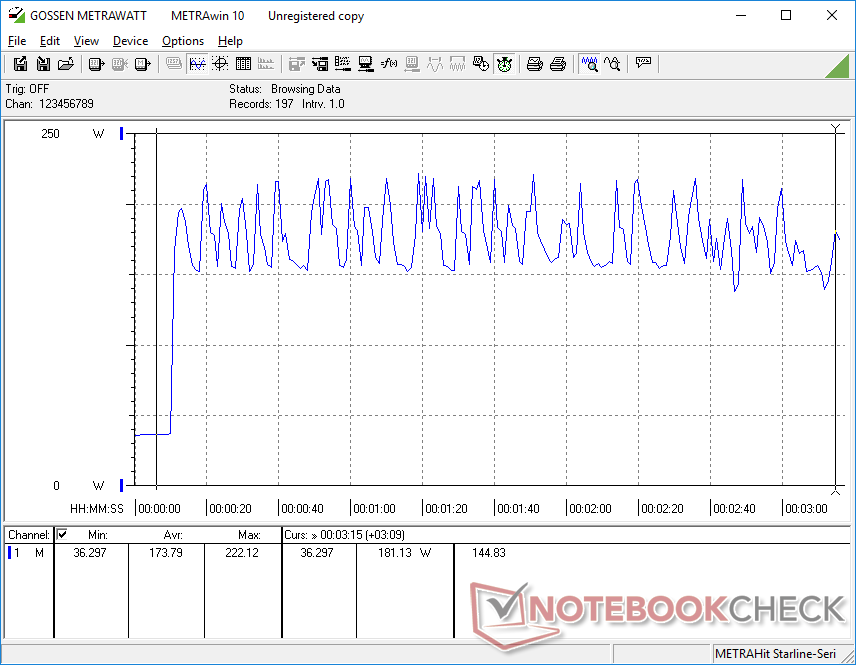
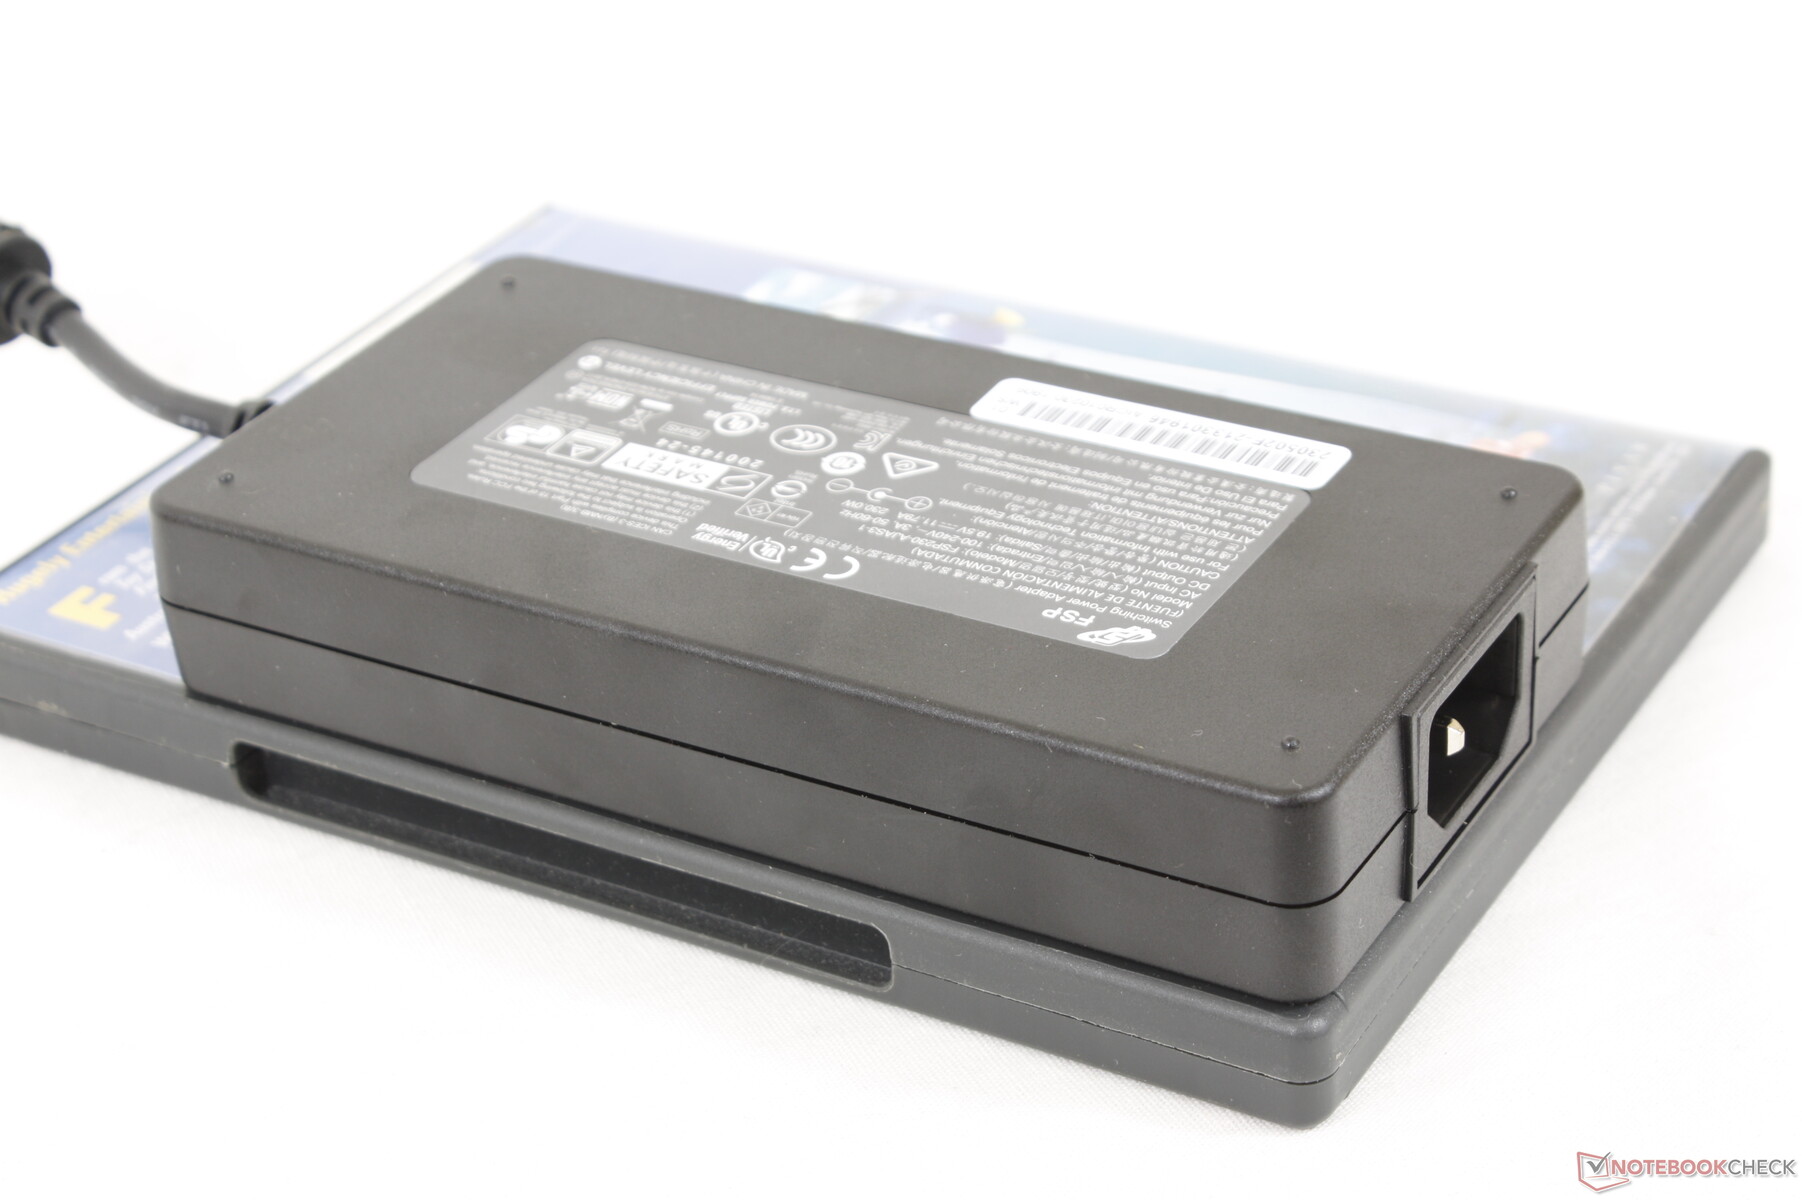
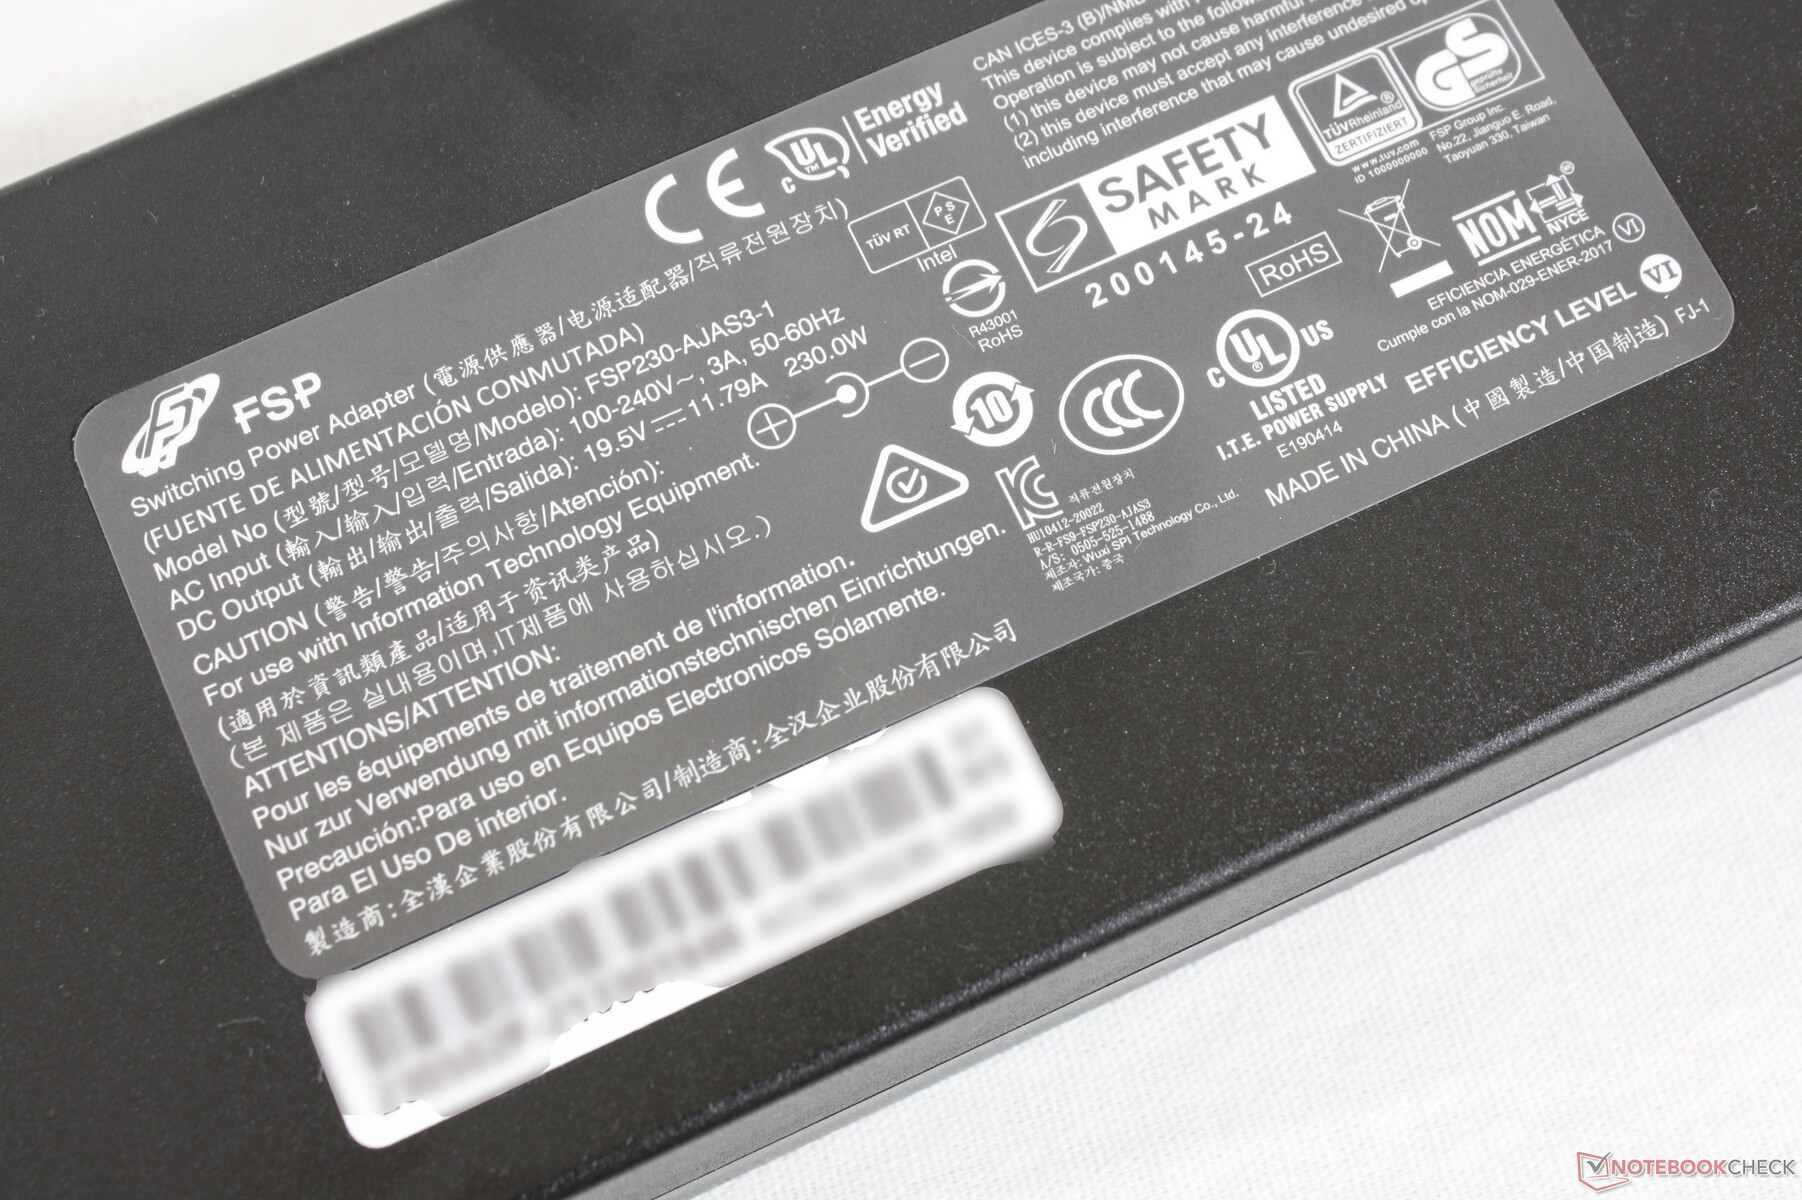
Registramos un consumo máximo de 222 W con el adaptador de CA de tamaño medio (~15.1 x 7.5 x 2.6 cm) de 230 W al ejecutar Prime95 y FurMark simultáneamente. El consumo fluctúa mucho entre 150 W y 222 W, probablemente por cuestiones térmicas. La batería también se cargará más lentamente cuando se ejecuten cargas tan altas, pero no se agotará lentamente con el tiempo.
| Off / Standby | |
| Ocioso | |
| Carga |
|
Clave:
min: | |
| ADATA XPG Xenia 15 i7-11800H, GeForce RTX 3070 Laptop GPU, ADATA XPG Gammix S70 1TB, IPS, 2560x1440, 15.6" | MSI Delta 15 A5EFK R9 5900HX, Radeon RX 6700M, Micron 2210 MTFDHBA1T0QFD, IPS-Level, 1920x1080, 15.6" | Alienware x15 RTX 3070 P111F i7-11800H, GeForce RTX 3070 Laptop GPU, WDC PC SN730 SDBPNTY-512G, IPS, 2560x1440, 15.6" | Razer Blade 15 Advanced (Mid 2021) i7-11800H, GeForce RTX 3080 Laptop GPU, SSSTC CA6-8D1024, IPS, 1920x1080, 15.6" | MSI GS66 Stealth 10UG i7-10870H, GeForce RTX 3070 Laptop GPU, WDC PC SN730 SDBPNTY-1T00, IPS, 1920x1080, 15.6" | Asus ROG Zephyrus G15 GA503Q R9 5900HS, GeForce RTX 3080 Laptop GPU, SK Hynix HFM001TD3JX013N, IPS-Level, 2560x1440, 15.6" | |
|---|---|---|---|---|---|---|
| Power Consumption | -3% | -21% | -34% | -6% | 15% | |
| Idle Minimum * (Watt) | 8.9 | 10 -12% | 15.7 -76% | 19.5 -119% | 12.9 -45% | 10 -12% |
| Idle Average * (Watt) | 14.4 | 18 -25% | 20.3 -41% | 23.3 -62% | 15.4 -7% | 12 17% |
| Idle Maximum * (Watt) | 31.1 | 25 20% | 43 -38% | 40.1 -29% | 27.1 13% | 17 45% |
| Load Average * (Watt) | 97 | 101 -4% | 94.4 3% | 98.9 -2% | 98.2 -1% | 108 -11% |
| Witcher 3 ultra * (Watt) | 188 | 187 1% | 167 11% | 174 7% | 164.9 12% | 123 35% |
| Load Maximum * (Watt) | 222.2 | 217 2% | 183.4 17% | 214 4% | 232.9 -5% | 182 18% |
* ... más pequeño es mejor
Power Consumption Witcher 3 / Stresstest
Duración de la batería - Batería grande de 94 Wh
Los tiempos de ejecución son más largos de lo esperado con casi 9 horas de uso real de la WLAN para ser más largos que lo que registramos en el MSI GS66 o el Alienware x15 por unas pocas horas cada uno.
La carga desde el vacío hasta la capacidad total lleva unos 100 minutos con el adaptador de CA incluido.
| ADATA XPG Xenia 15 i7-11800H, GeForce RTX 3070 Laptop GPU, 94 Wh | MSI Delta 15 A5EFK R9 5900HX, Radeon RX 6700M, 82 Wh | Alienware x15 RTX 3070 P111F i7-11800H, GeForce RTX 3070 Laptop GPU, 87 Wh | Razer Blade 15 Advanced (Mid 2021) i7-11800H, GeForce RTX 3080 Laptop GPU, 80 Wh | MSI GS66 Stealth 10UG i7-10870H, GeForce RTX 3070 Laptop GPU, 99.9 Wh | Asus ROG Zephyrus G15 GA503Q R9 5900HS, GeForce RTX 3080 Laptop GPU, 90 Wh | |
|---|---|---|---|---|---|---|
| Duración de Batería | -8% | -34% | -32% | 2% | -2% | |
| Reader / Idle (h) | 14 | 11.1 -21% | 9.7 -31% | 10.8 -23% | 12.1 -14% | |
| WiFi v1.3 (h) | 8.7 | 7.9 -9% | 6.1 -30% | 5.9 -32% | 7.1 -18% | 9.4 8% |
| Load (h) | 1.5 | 1.6 7% | 0.9 -40% | 2.2 47% | 1.5 0% |
Pro
Contra
Veredicto - Más rápido de lo que parece
El XPG Xenia 15 es un competidor sorprendentemente fuerte frente a los portátiles de juego ultrafinos de toda la vida, como el Razer Blade 15, MSI GS66o el Asus Zephyrus S15. El portátil de ADATA es capaz de incorporar un teclado mejor que cualquiera de los modelos mencionados e incluso un objetivo TGP más alto para exprimir más rendimiento de la GPU Nvidia. Las actualizaciones de memoria RAM y de almacenamiento para el usuario final son bienvenidas, mientras que los propietarios del GS66 se ven obligados a romper una pegatina antimanipulación sólo para quitar el panel inferior. La base también es bastante resistente y menos propensa a flexionarse o crujir que en el Zephyrus S15 o Lenovo Legion 7.
La pequeña huella, el alto objetivo TGP, la fuerte base, y la excelente pantalla 1440p 165 Hz llevan al XPG Xenia 15 a mayores alturas que otros portátiles de juego ultradelgados. La tapa tambaleante, los ventiladores extra ruidosos y los altavoces blandos lo hacen retroceder unos cuantos peldaños.
Meter una GPU de 125 W en un chasis ultrafino tiene sus inconvenientes. En particular, el ruido de los ventiladores cuando se juega es notablemente más fuerte que el de la competencia, hasta el punto de abrumar a los altavoces integrados. Mientras tanto, las bisagras no dejan una buena impresión, especialmente cuando se comparan con las bisagras más rígidas de la mayoría de los portátiles Asus Zephyrus. No estamos seguros de que las bisagras del Xenia 15 aguanten dos o tres años.
En general, estamos impresionados por el rendimiento que ofrece el Xenia 15, teniendo en cuenta que ocupa menos espacio que muchos otros portátiles de juego ultradelgados de 15,6 pulgadas. La pantalla de 1440p165 y el teclado clicable son de los mejores en esta clase de tamaño para juegos y otros.
Precio y disponibilidad
El ADATA XPG Xenia 15 con CPU Intel de 11ª generación es ahora disponible en Best Buy por 2499 dólares. Otros minoristas importantes aún no tienen existencias del Xenia 15 de 2021 y, en cambio, siguen vendiendo el modelo anterior con CPU Intel de 9ª generación en el momento de escribir este artículo.
ADATA XPG Xenia 15
- 10/18/2021 v7 (old)
Allen Ngo
Price comparison

