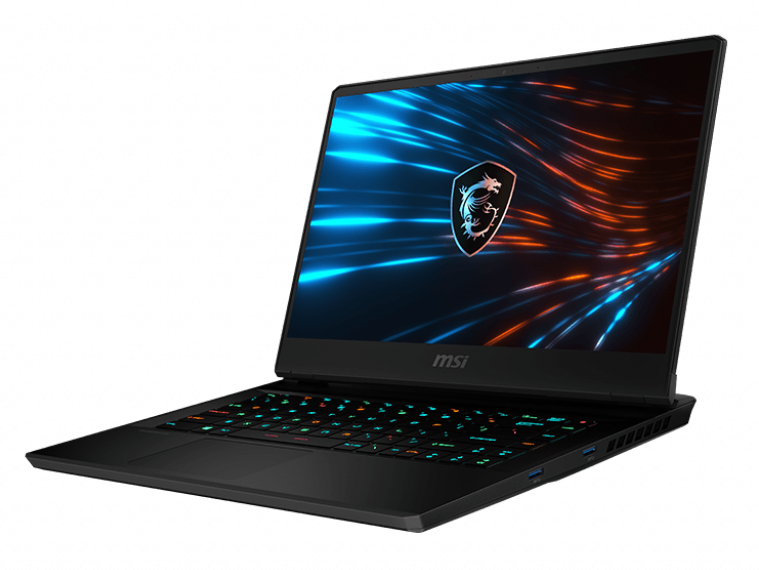
Análisis del portátil MSI GP66 Leopard 10UG: Una revisión completa de la serie
Presentado en a principios de este año junto con la serie Nvidia Ampere, la GP66 presenta un diseño totalmente nuevo respecto a la antigua GP65. Casi todo ha cambiado, desde el teclado hasta la solución de refrigeración, para representar el inicio de una nueva generación de la familia GP. Para los que no estén familiarizados, la serie GP es el hogar de los portátiles para juegos de gama media de MSI, por encima de las series GL y GF, más baratas, y por debajo de las series GE y GT, más caras.
Los SKUs van desde una CPU Intel Core-i7 10870H de 10ª generación con gráficos GeForce RTX 3060 hasta el Core i7-10875H con RTX 3080. Nuestra configuración de análisis es una configuración intermedia con el i7-10870H y la RTX 3070 por unos 2500 dólares, dependiendo de la RAM y el almacenamiento.
Entre los modelos de la competencia se encuentran otros portátiles para juegos de gama media superior de 15,6 pulgadas como el Gigabyte Aorus 15P, Asus ROG Zephyrus G15o el Lenovo Legion 7.
Más análisis de MSI:
potential competitors in comparison
Valoración | Fecha | Modelo | Peso | Altura | Tamaño | Resolución | Precio |
|---|---|---|---|---|---|---|---|
| 84.2 % v7 (old) | 04/2021 | MSI GP66 Leopard 10UG i7-10870H, GeForce RTX 3070 Laptop GPU | 2.3 kg | 23.4 mm | 15.60" | 1920x1080 | |
| 83.2 % v7 (old) | 05/2020 | MSI GP65 10SFK-047US i7-10750H, GeForce RTX 2070 Mobile | 2.3 kg | 27.5 mm | 15.60" | 1920x1080 | |
| 85.4 % v7 (old) | 04/2021 | Alienware m15 R4 i9-10980HK, GeForce RTX 3070 Laptop GPU | 2.3 kg | 20 mm | 15.60" | 1920x1080 | |
| 86.1 % v7 (old) | 02/2021 | Aorus 15P XC i7-10870H, GeForce RTX 3070 Laptop GPU | 2.2 kg | 27 mm | 15.60" | 1920x1080 | |
| 83.8 % v7 (old) | 02/2021 | Asus ROG Zephyrus G15 GA503Q R9 5900HS, GeForce RTX 3080 Laptop GPU | 2 kg | 20 mm | 15.60" | 2560x1440 | |
| 80.4 % v7 (old) | 03/2021 | MSI GF65 Thin 10UE i7-10750H, GeForce RTX 3060 Laptop GPU | 1.9 kg | 21.7 mm | 15.60" | 1920x1080 |
Caso
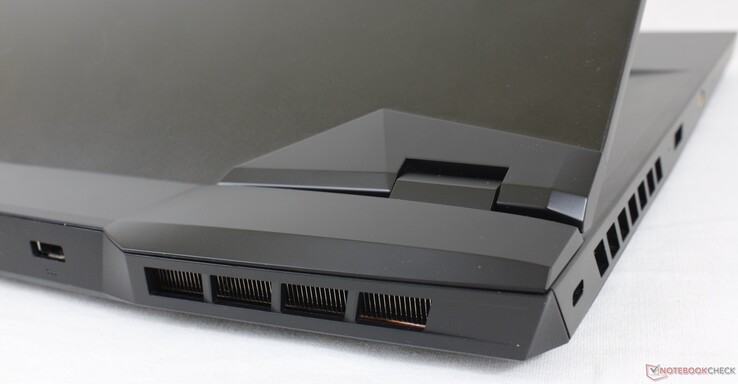
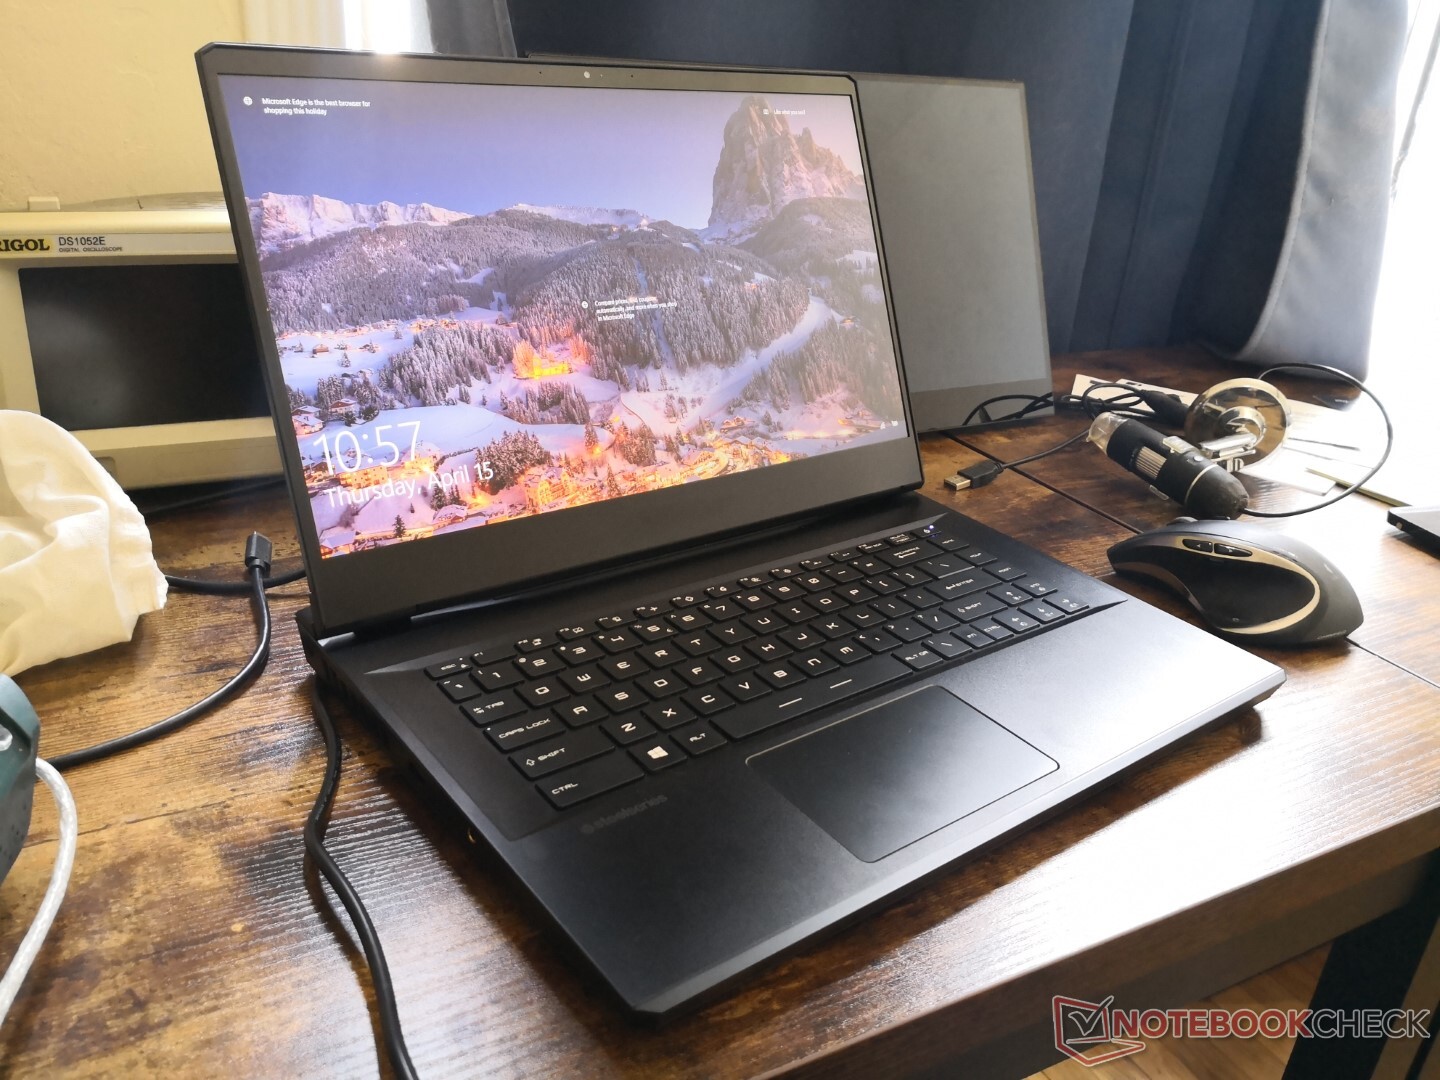
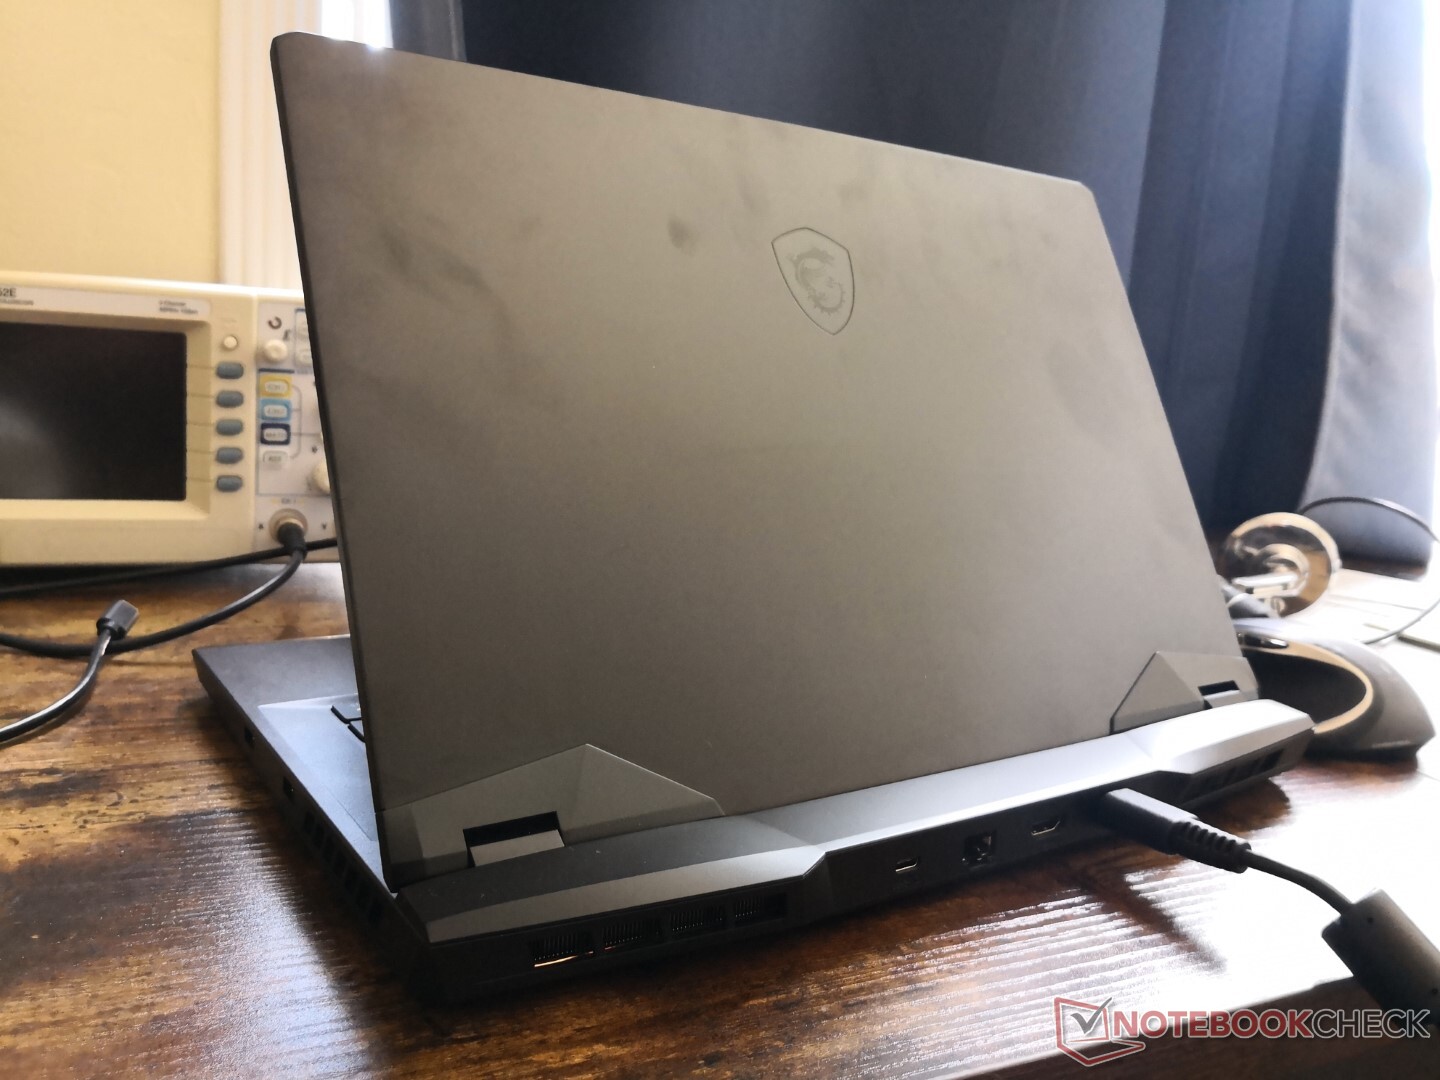
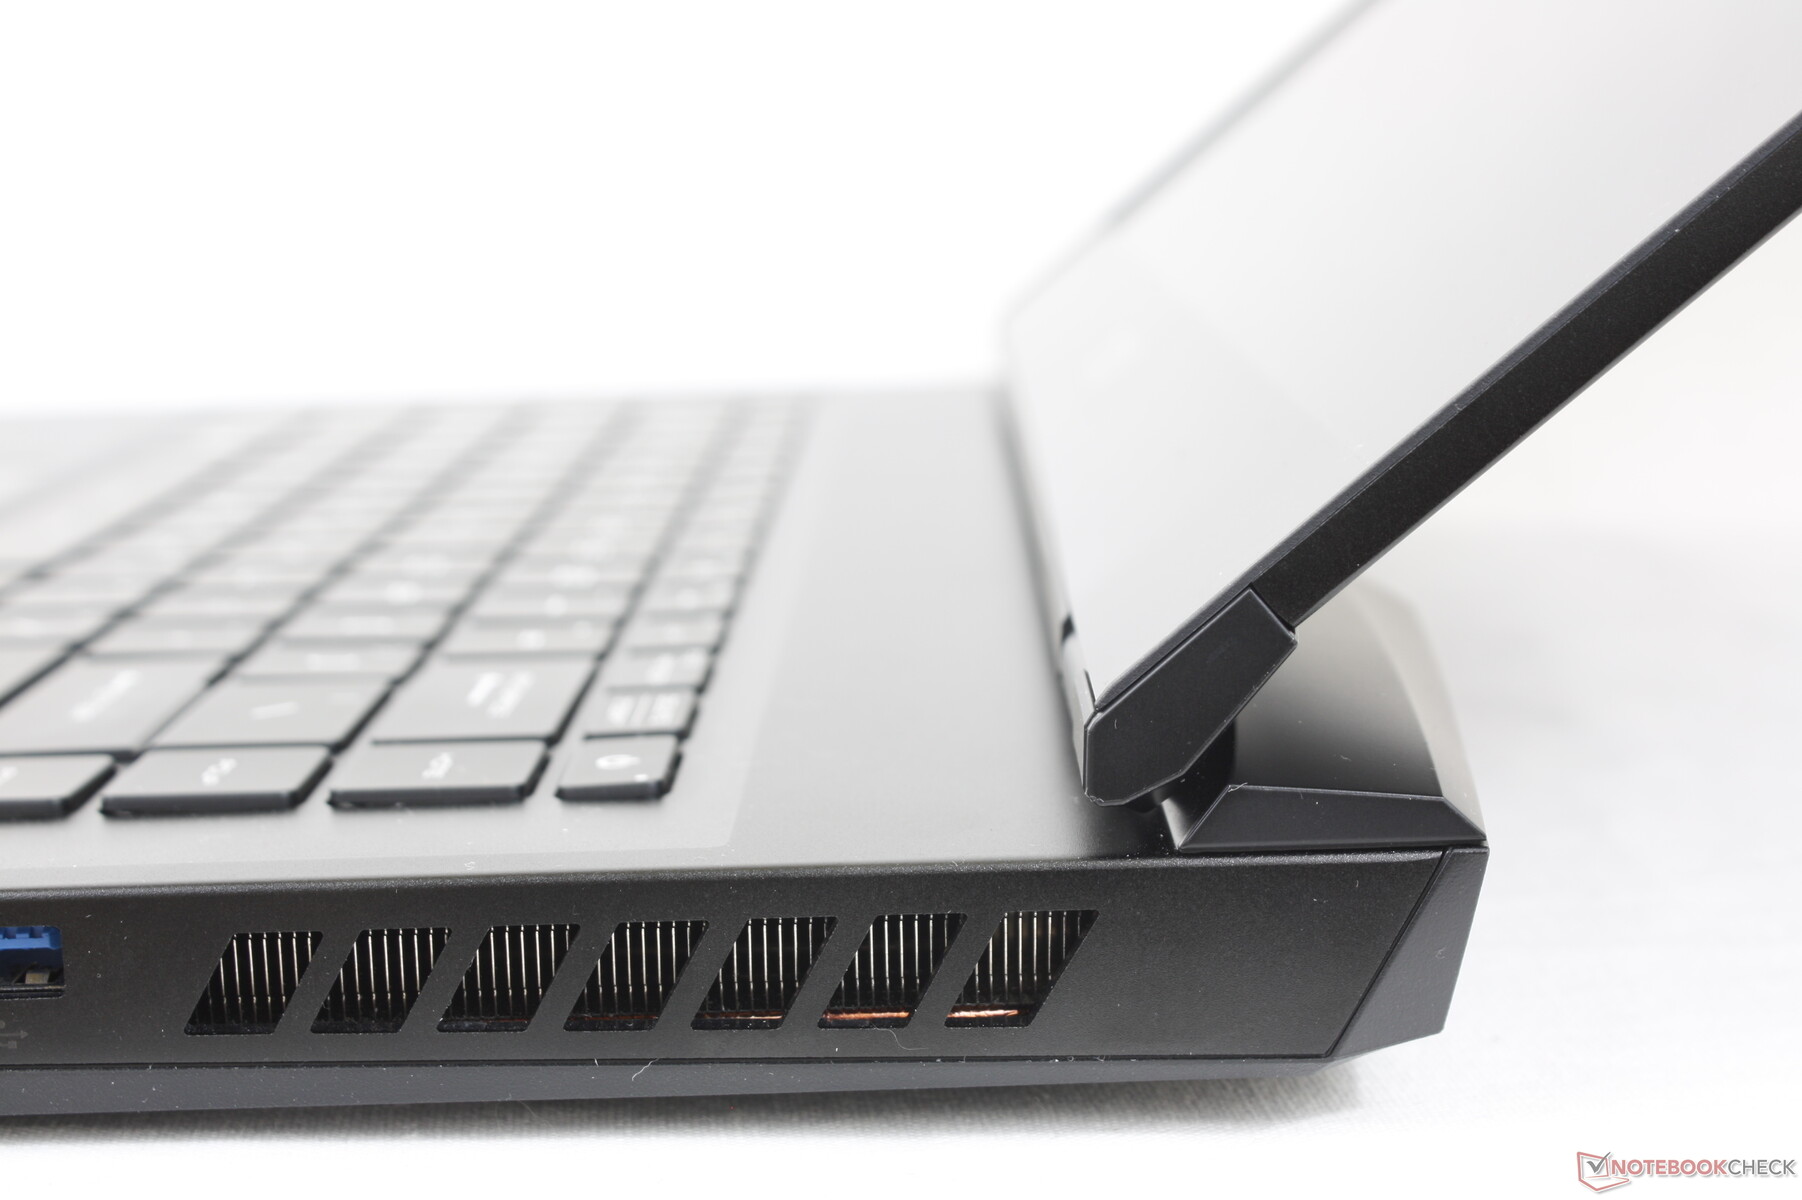
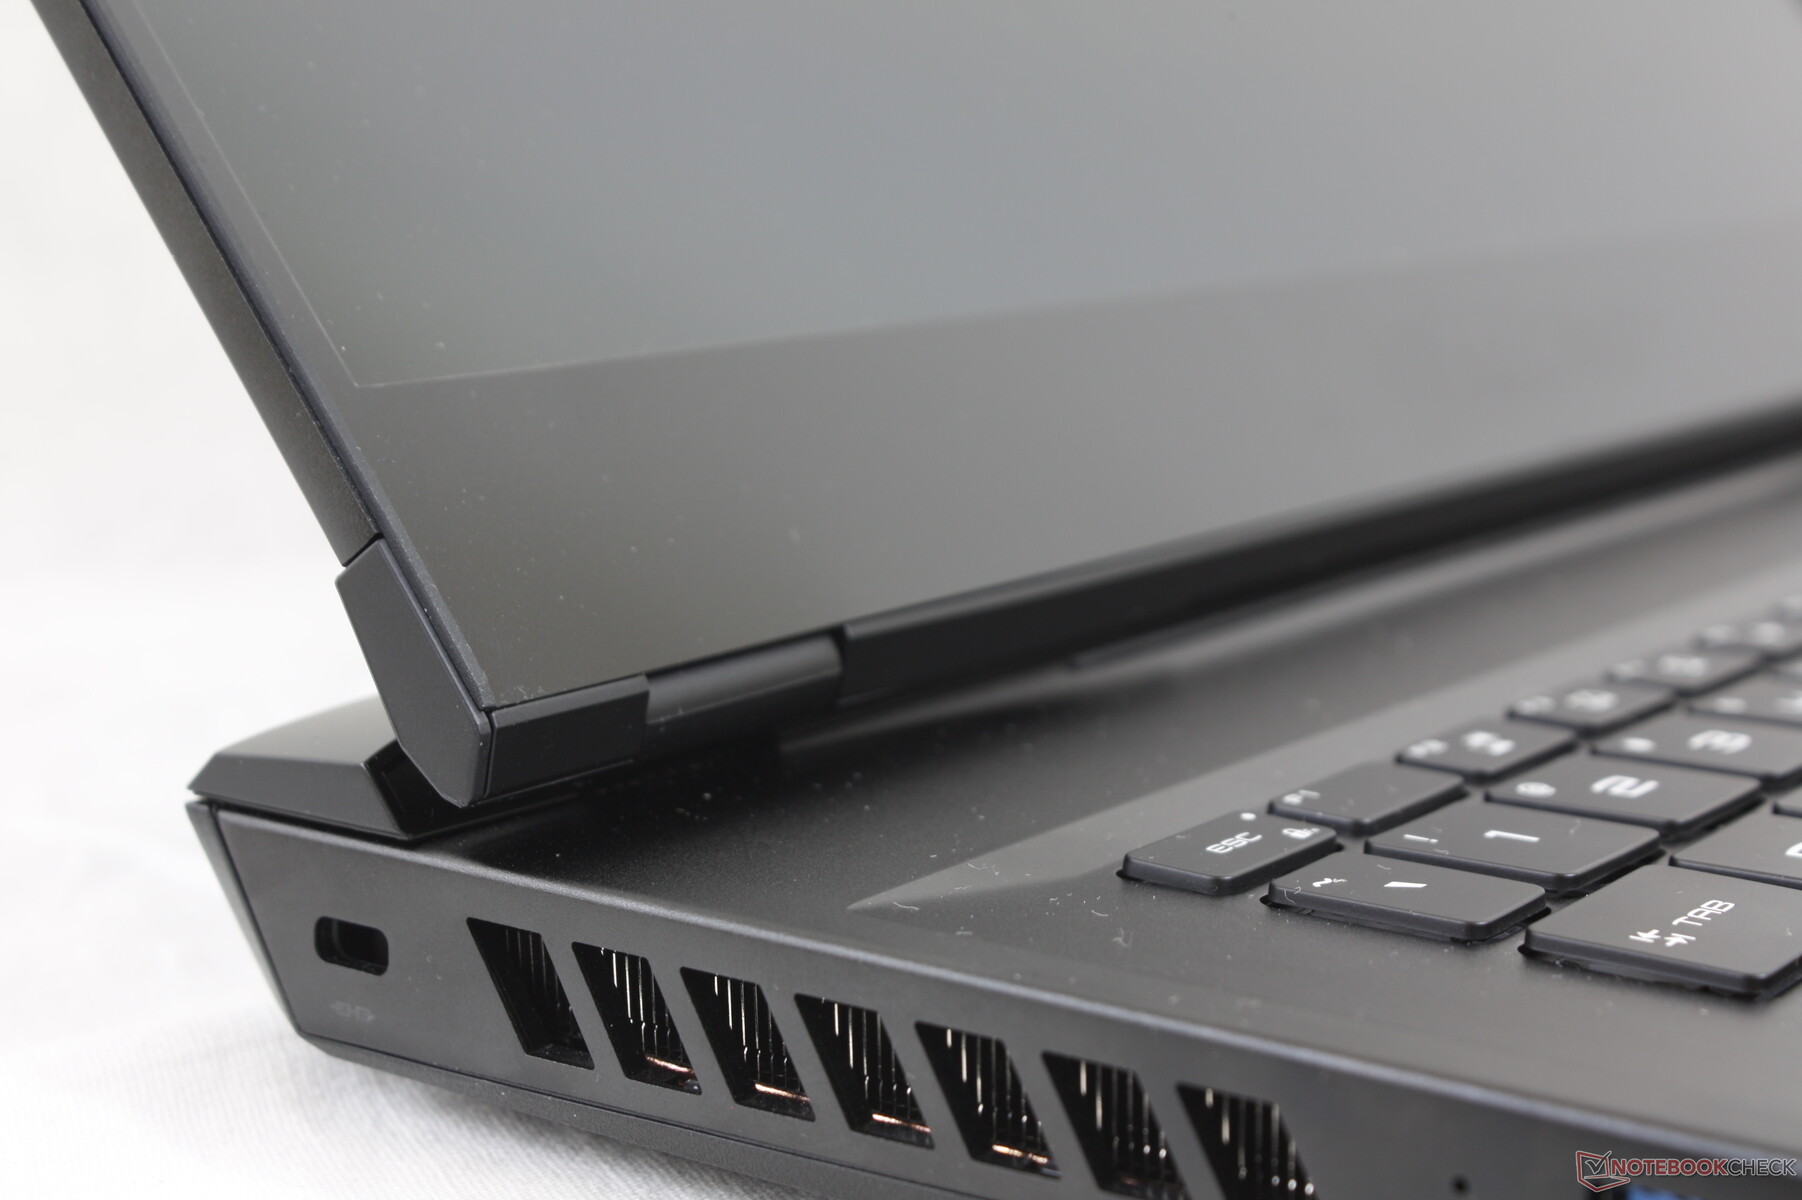
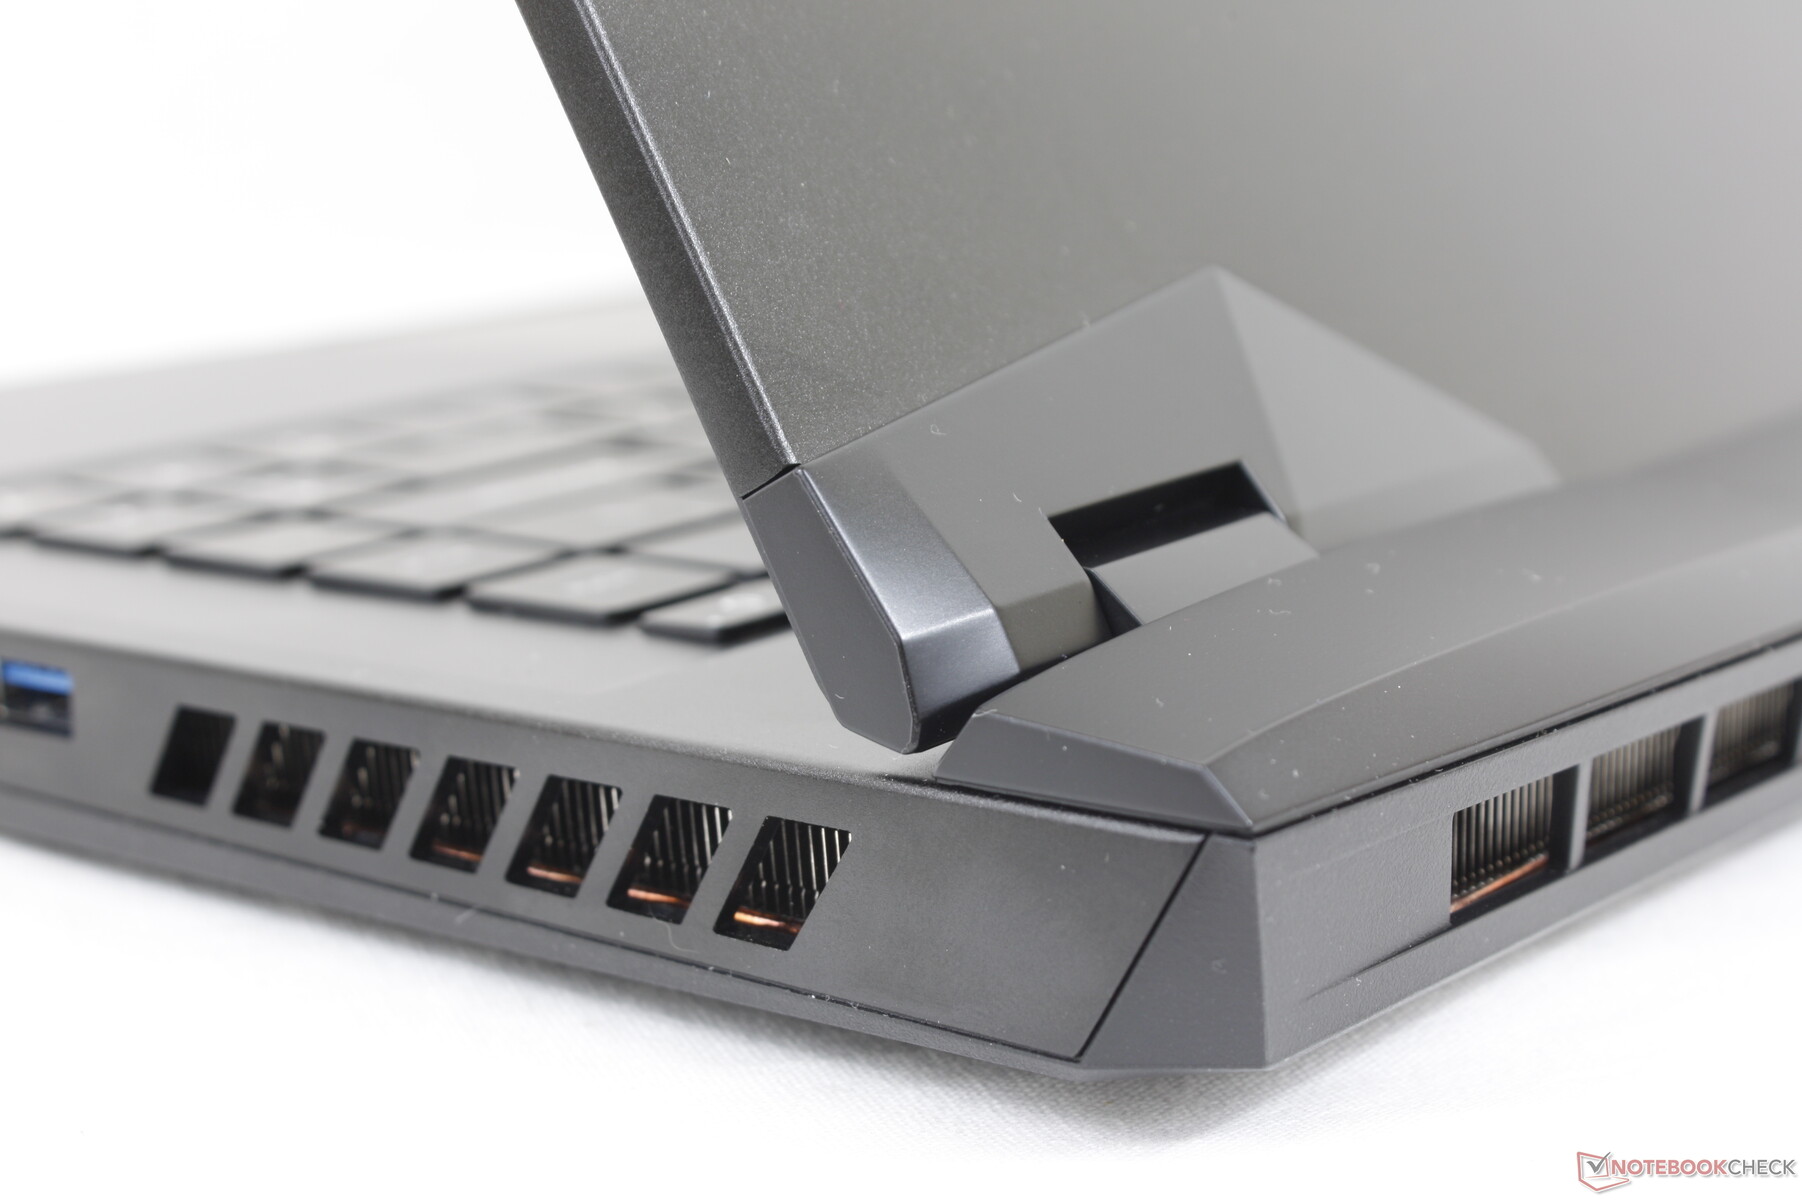
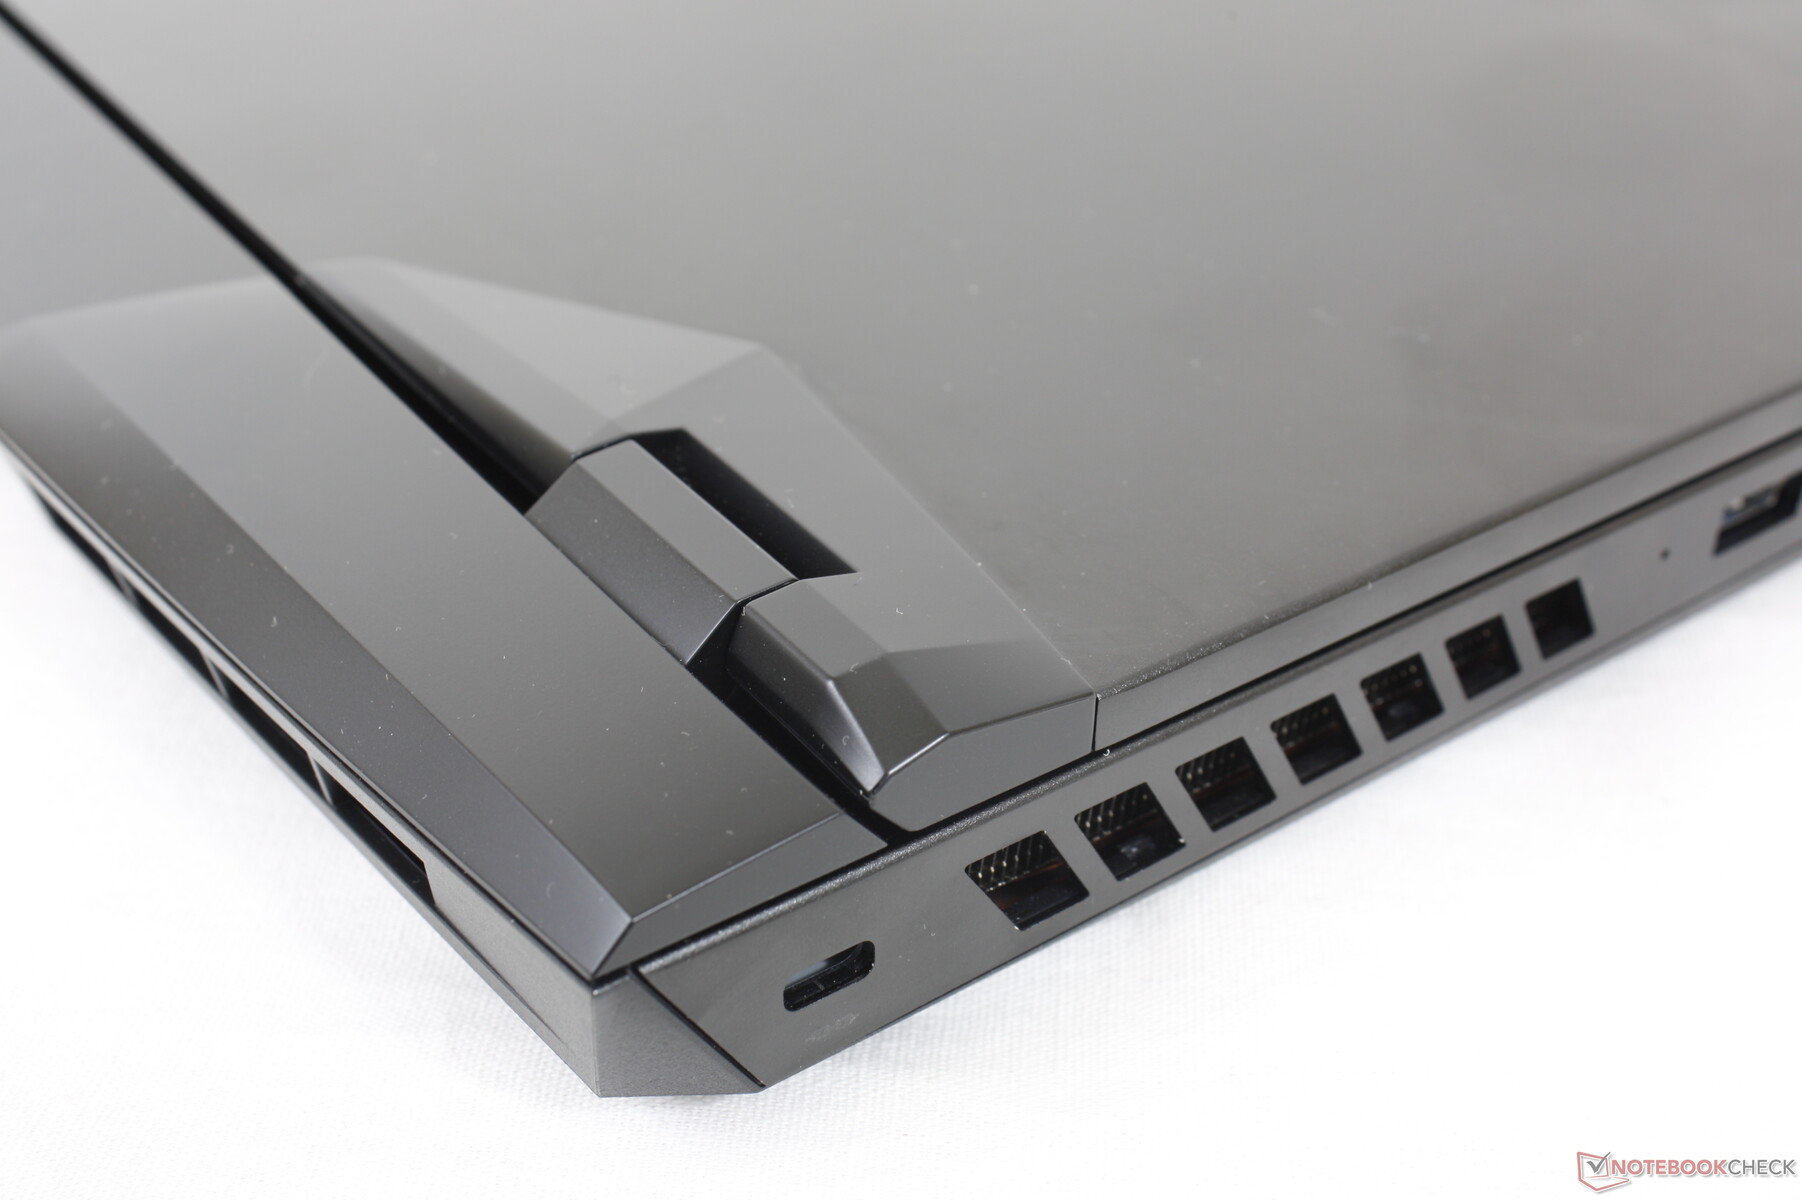
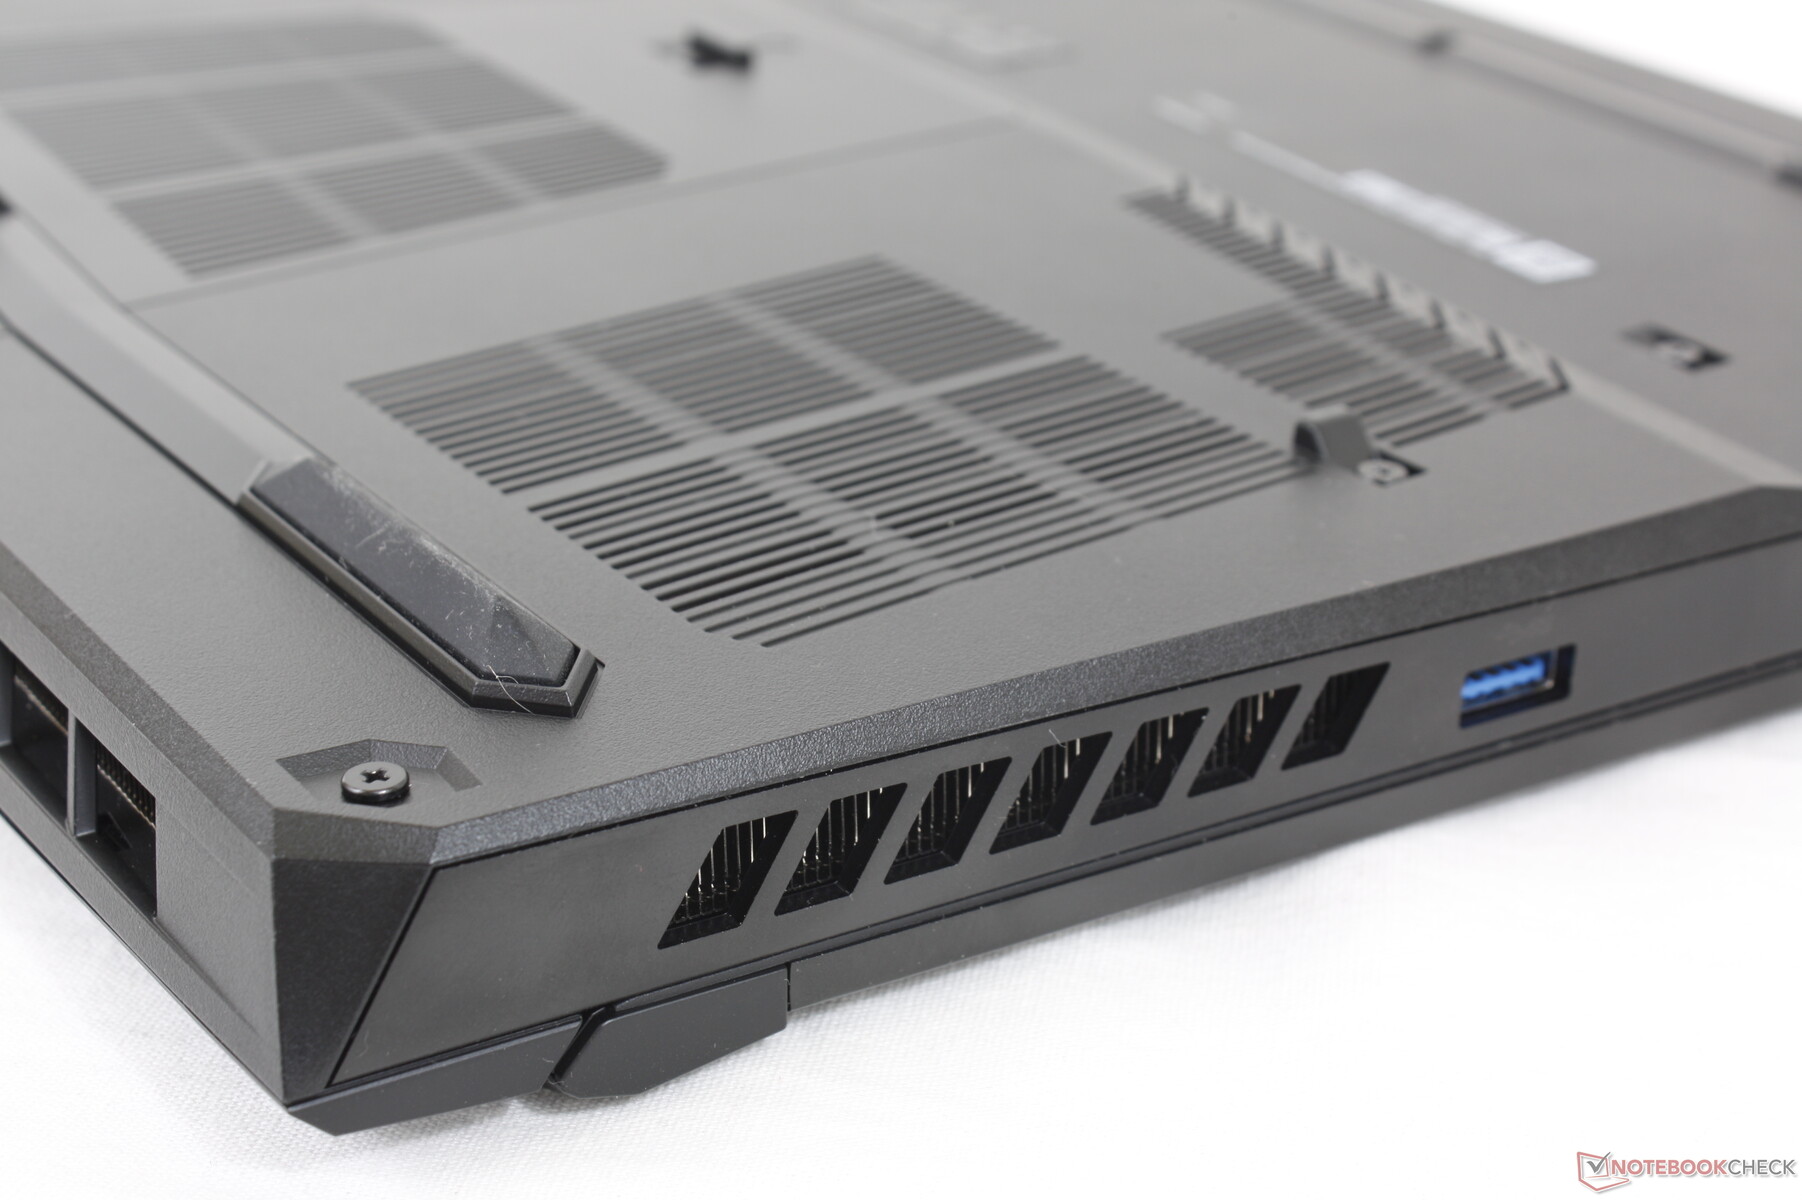
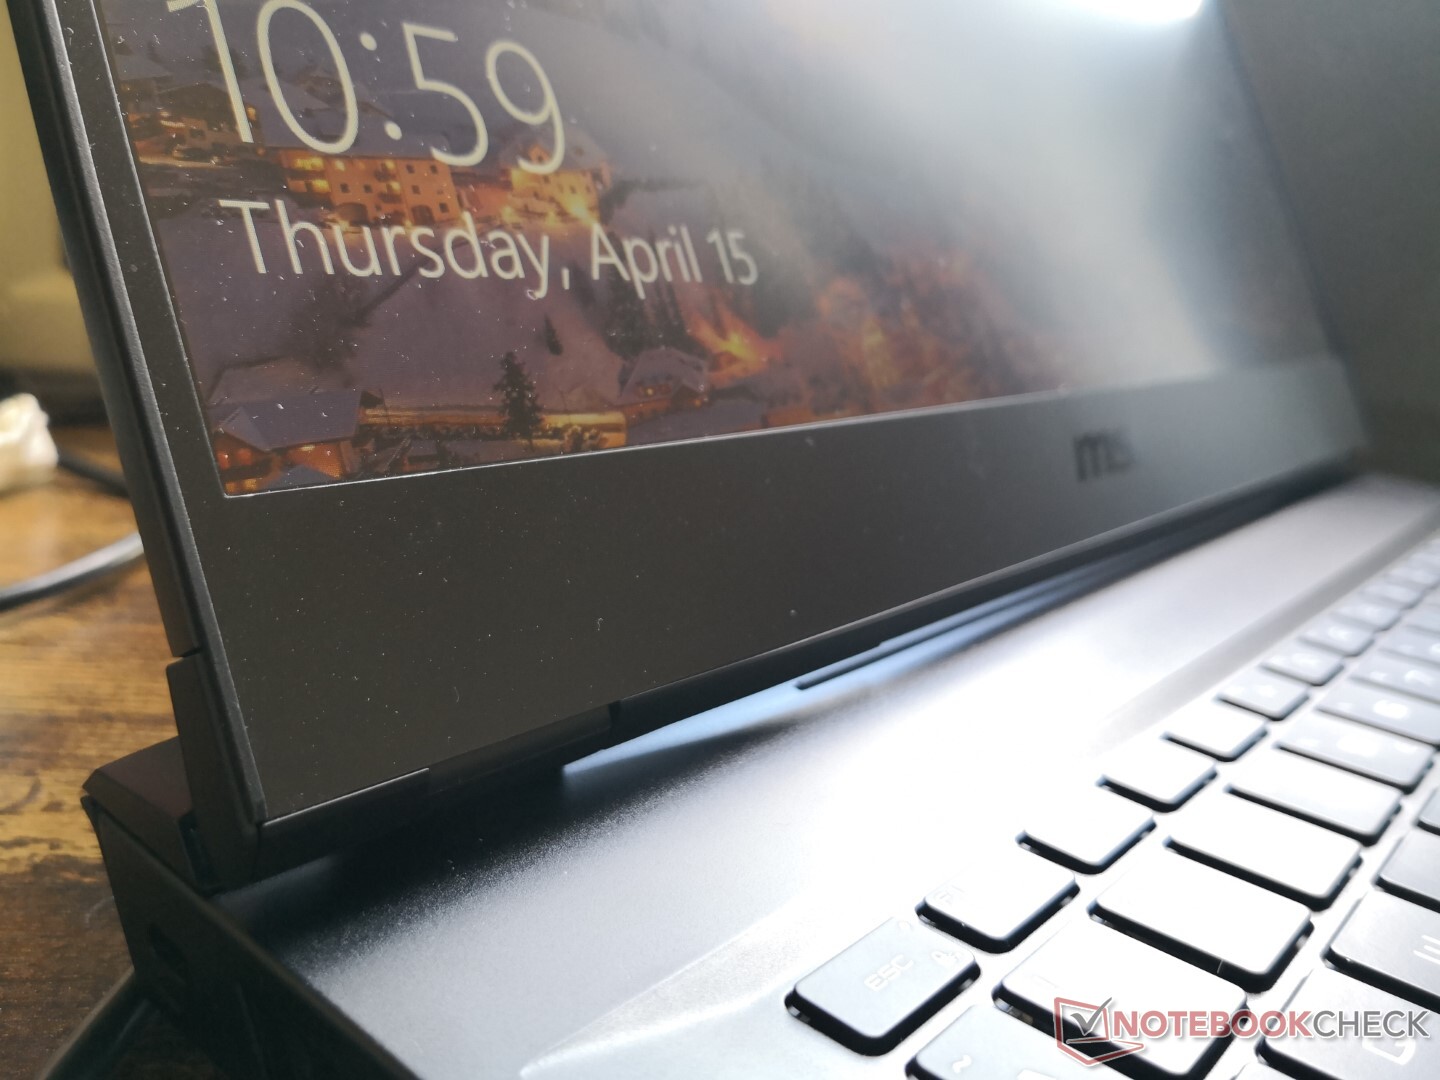
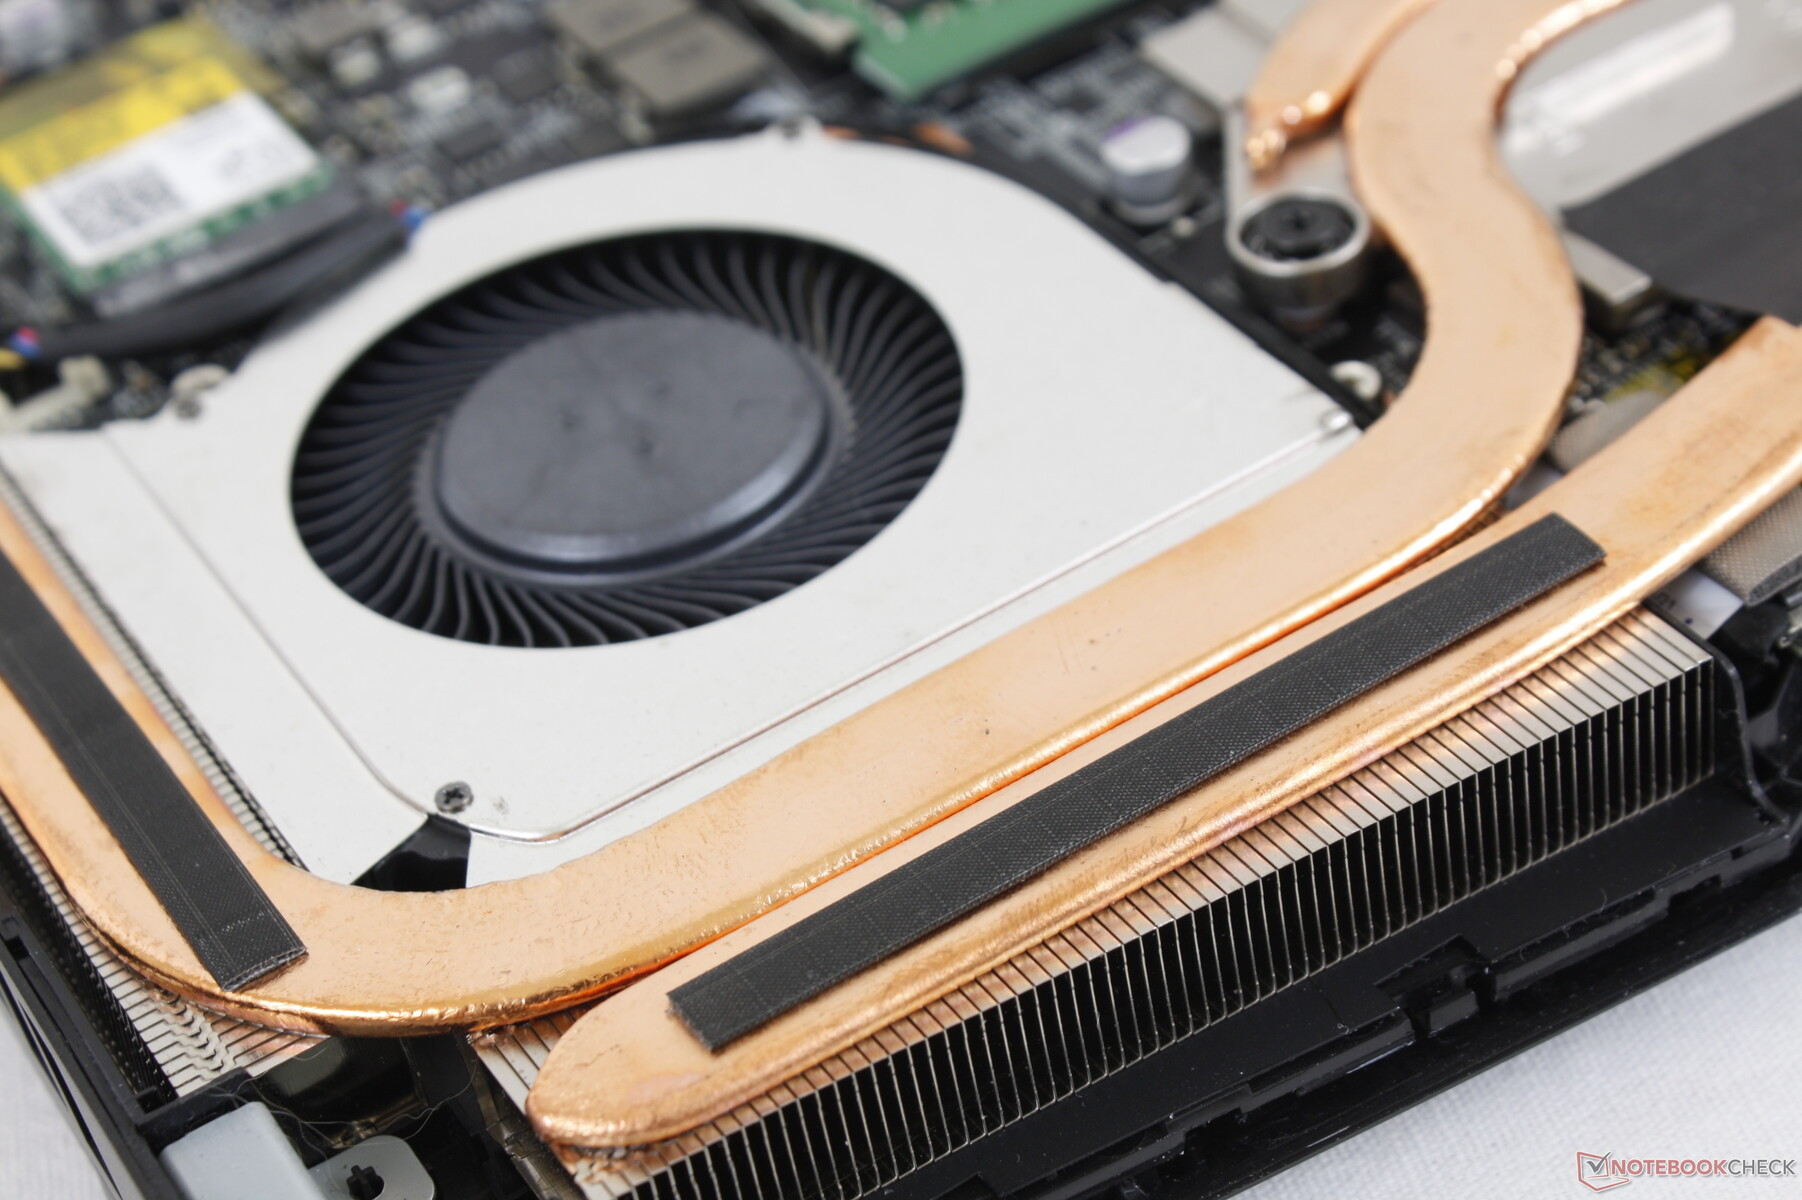
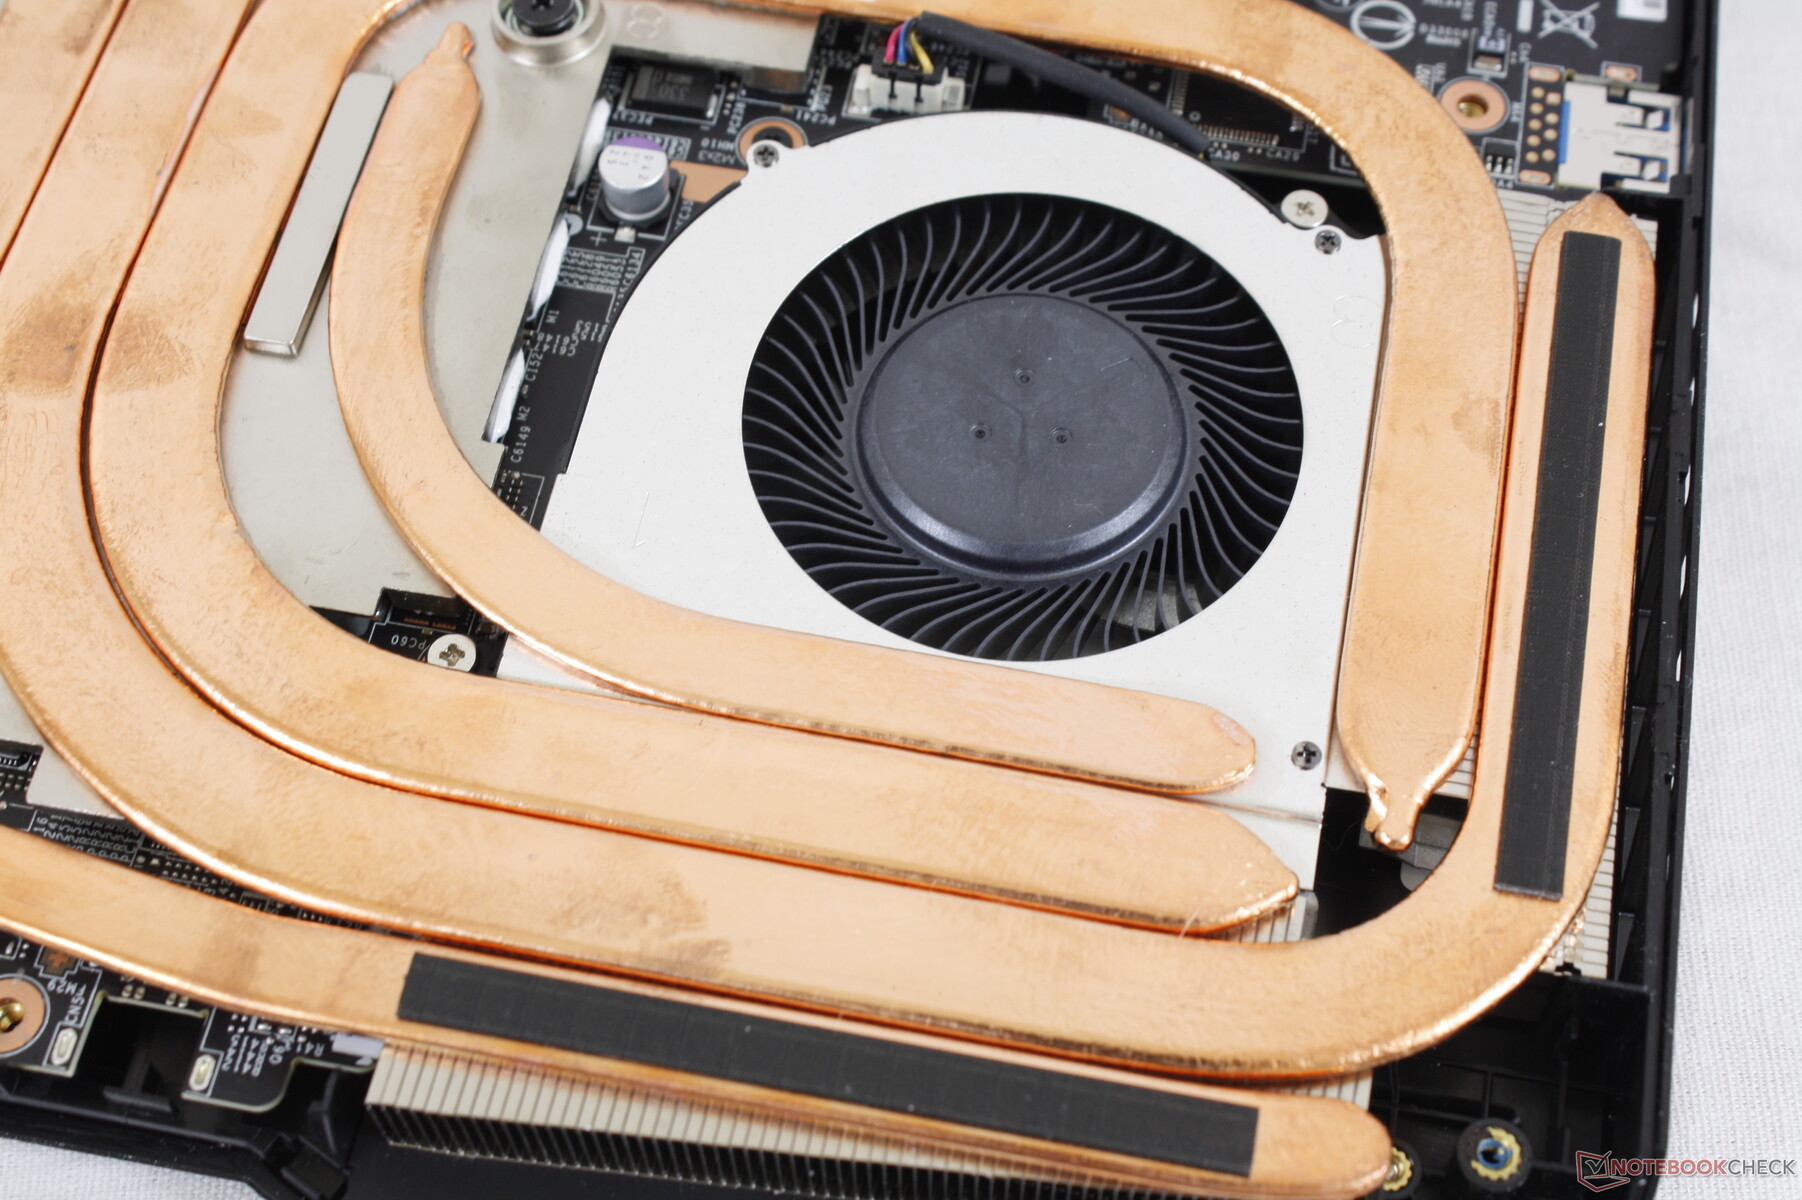
El mayor cambio físico de la GP65 a la GP66 es la parte trasera más grande para dar cabida a una solución de refrigeración más potente. Por lo demás, el diseño visual general puede describirse como un GE66 con sus similares tapas exteriores de metal liso pero con un esquema de color negro más oscuro. La barra de luz RGB a lo largo del borde frontal del GE66 no está presente en el GP66 mientras que la iluminación RGB por tecla se mantiene.
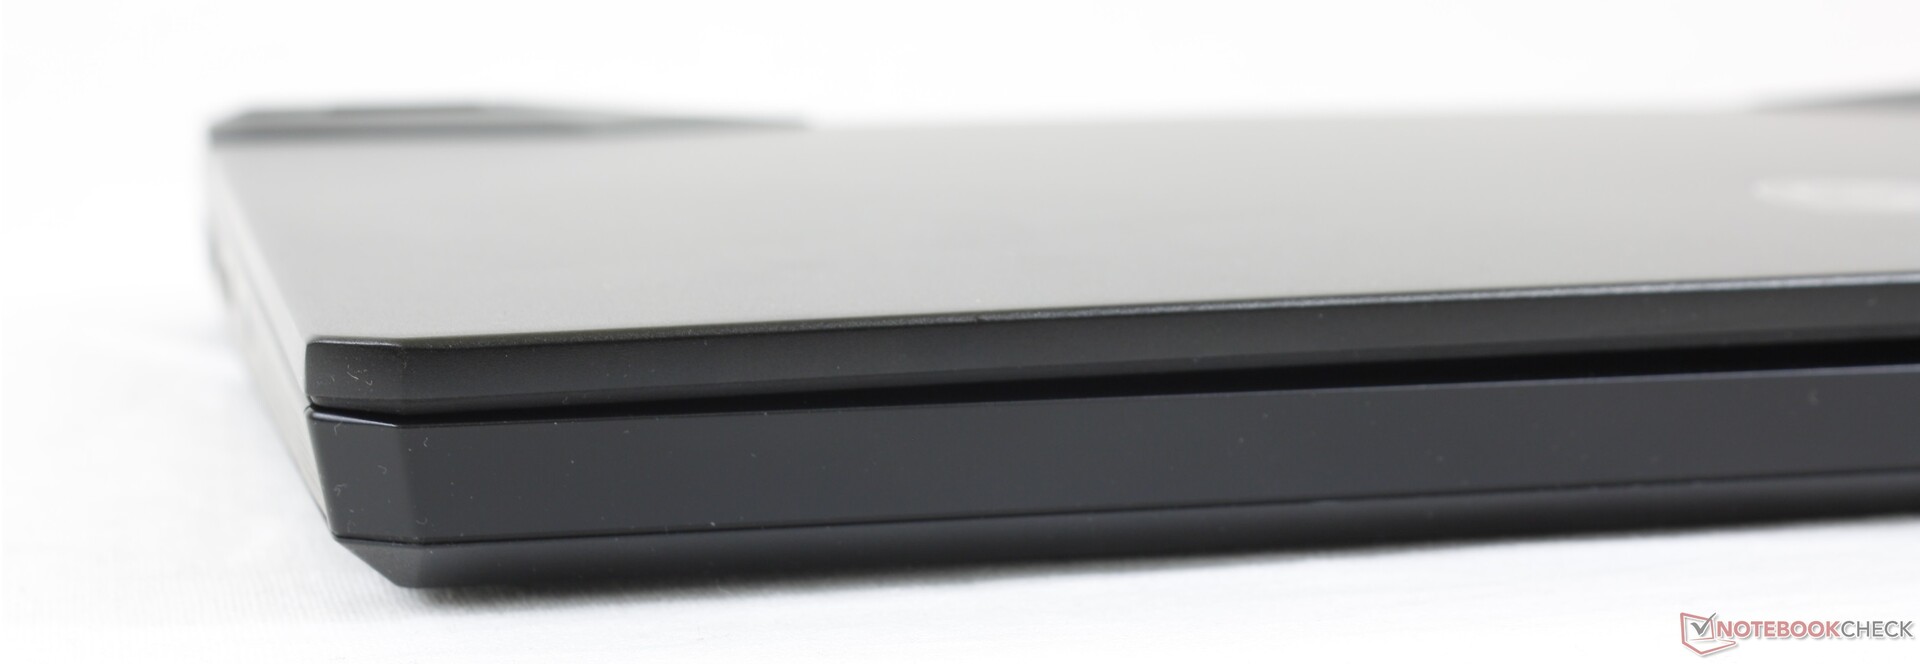
La calidad de construcción es excelente, especialmente para la base. La cubierta del teclado muestra una mínima flexión y crujido al doblar o girar sus esquinas frontales. La tapa, sin embargo, podría haber sido más rígida ya que las bisagras tienden a tambalearse al ajustar los ángulos. La tapa exterior también se flexiona más fácilmente que en el Asus ROG Strix G15 cuando se aplica presión en su centro.
El nuevo diseño es notablemente más largo que el antiguo GP65 en cuanto a longitud, debido a la nueva parte trasera del "motor a reacción". Por lo demás, el peso sigue siendo prácticamente el mismo de una generación a otra, con 2,3 kg, y el sistema es en realidad más delgado esta vez, unos 4 mm. El competidor Alienware m15 R4 es aún más grande, mientras que el Asus Zephyrus G15 GA503Q es más ligero y más pequeño.
Conectividad
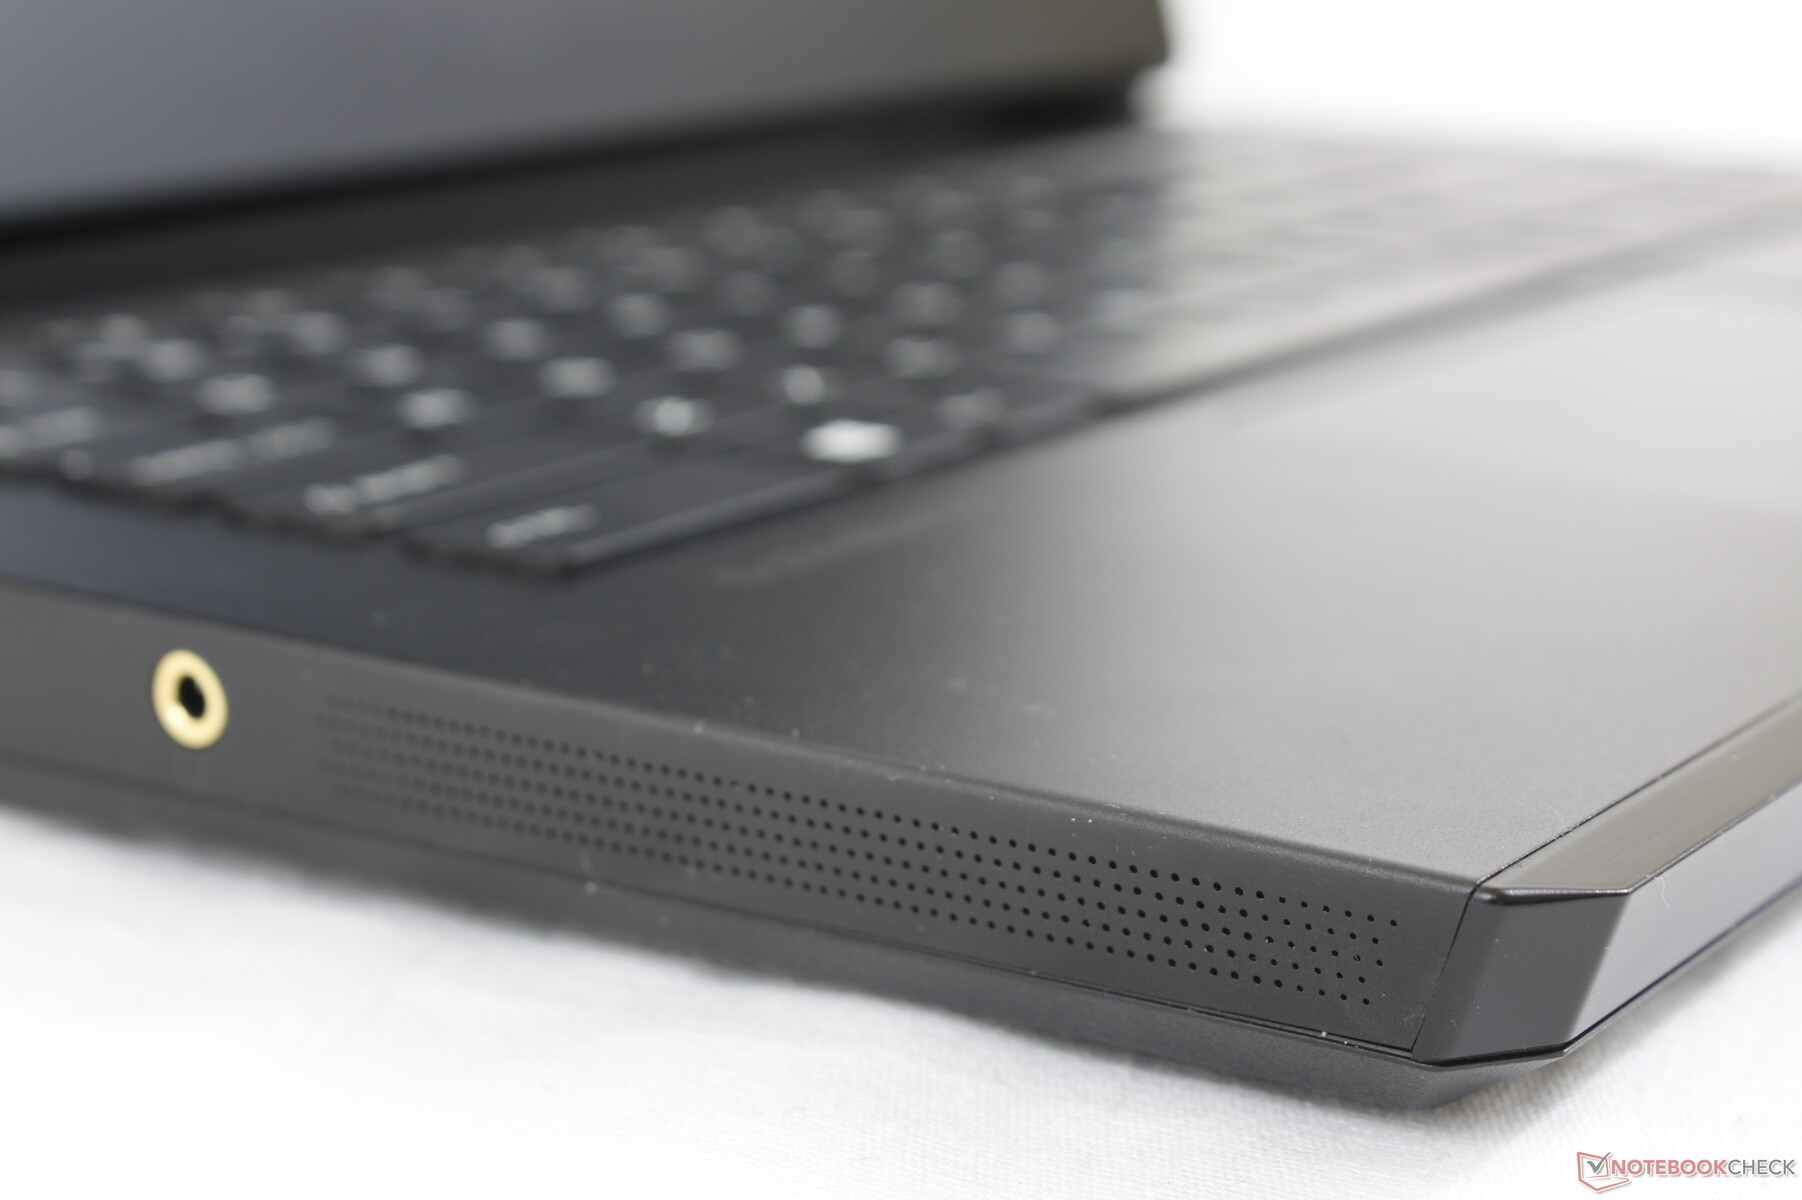
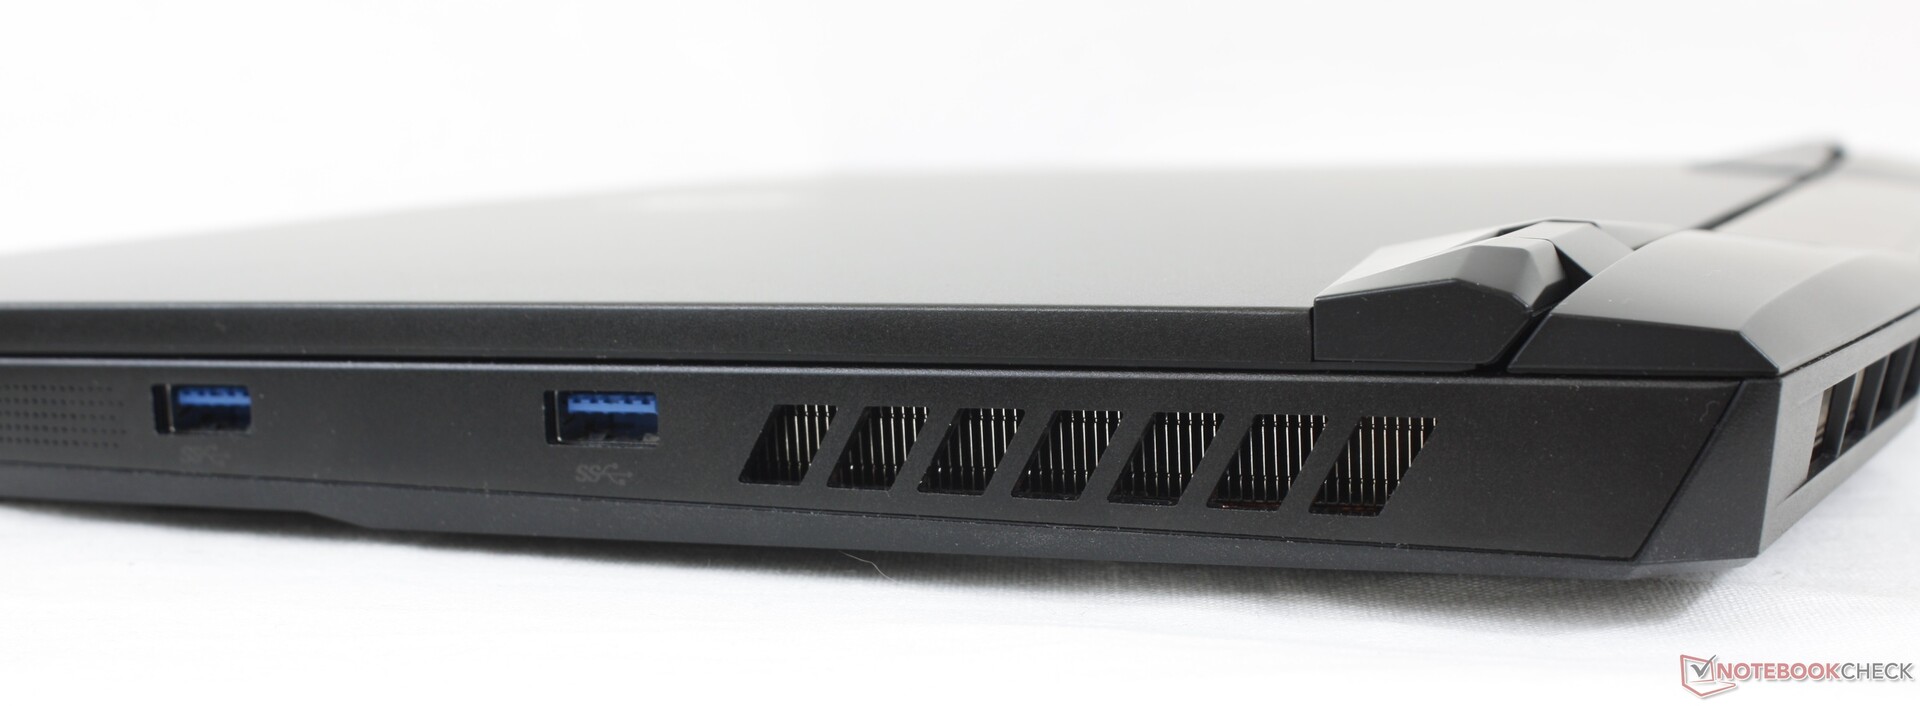
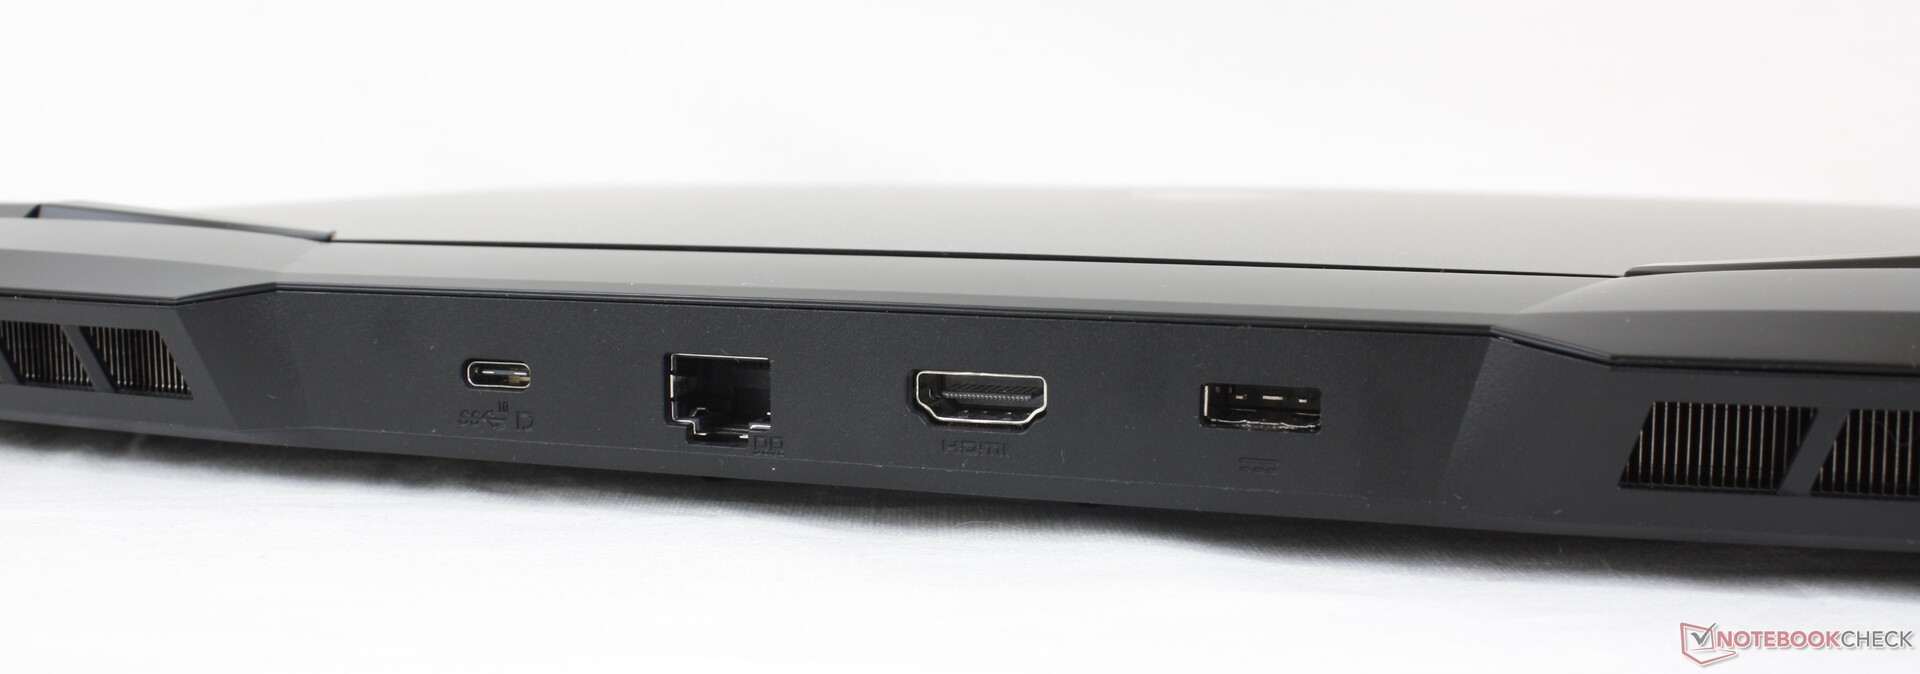
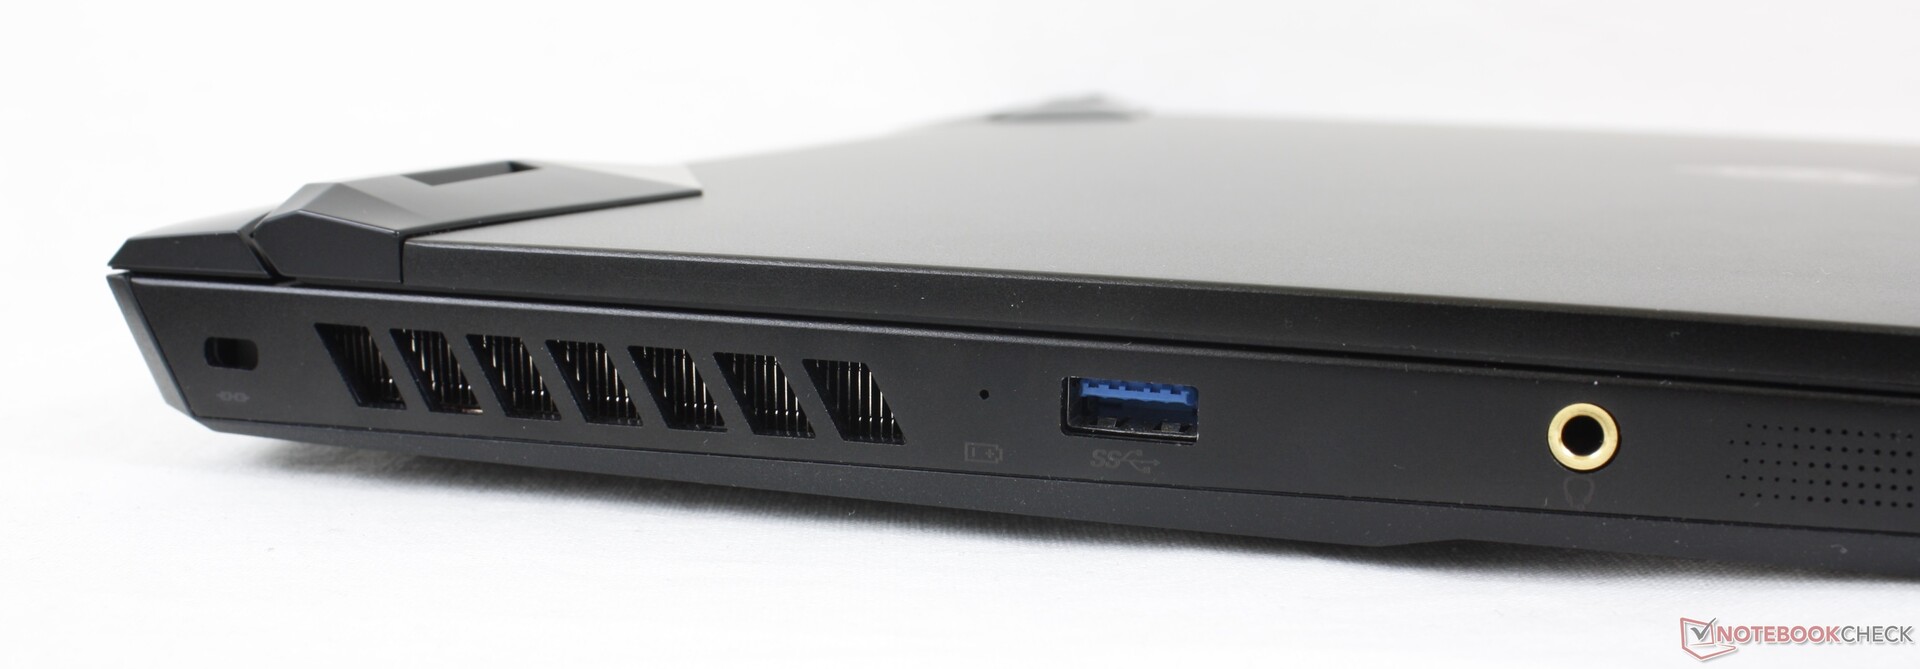
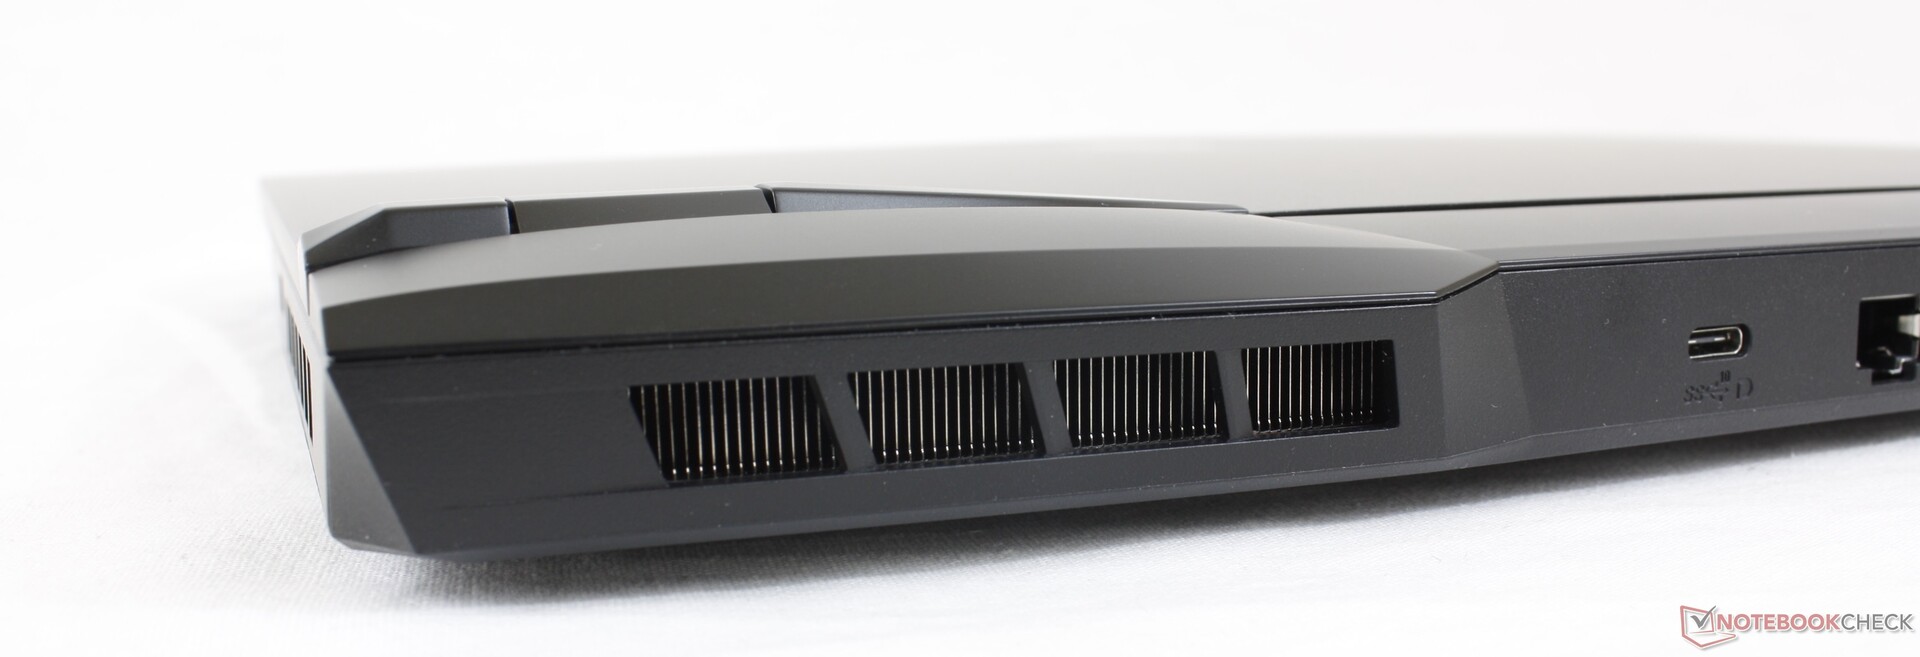
Las opciones de puertos y la posición han cambiado significativamente con respecto a la GP65. Por un lado, los puertos están ahora más uniformemente distribuidos a lo largo de los bordes izquierdo, derecho y trasero, mientras que en el GP65 estaban todos agrupados. En segundo lugar, los puertos de micrófono de 3,5 mm y mini-DisplayPort han desaparecido en favor de DisplayPort-sobre-USB-C. El HDMI se ha actualizado de 1.4 a 2.0 para soportar 4K60 y hay un puerto USB-A adicional para tres en total.
Hay que tener en cuenta que Thunderbolt y USB-C Power Delivery no son compatibles. Por tanto, los usuarios no pueden recargar el GP66 con adaptadores USB-C a diferencia de lo que ocurre en el Razer Blade 15 o el Alienware m15.
Comunicación
Cámara web


Mantenimiento
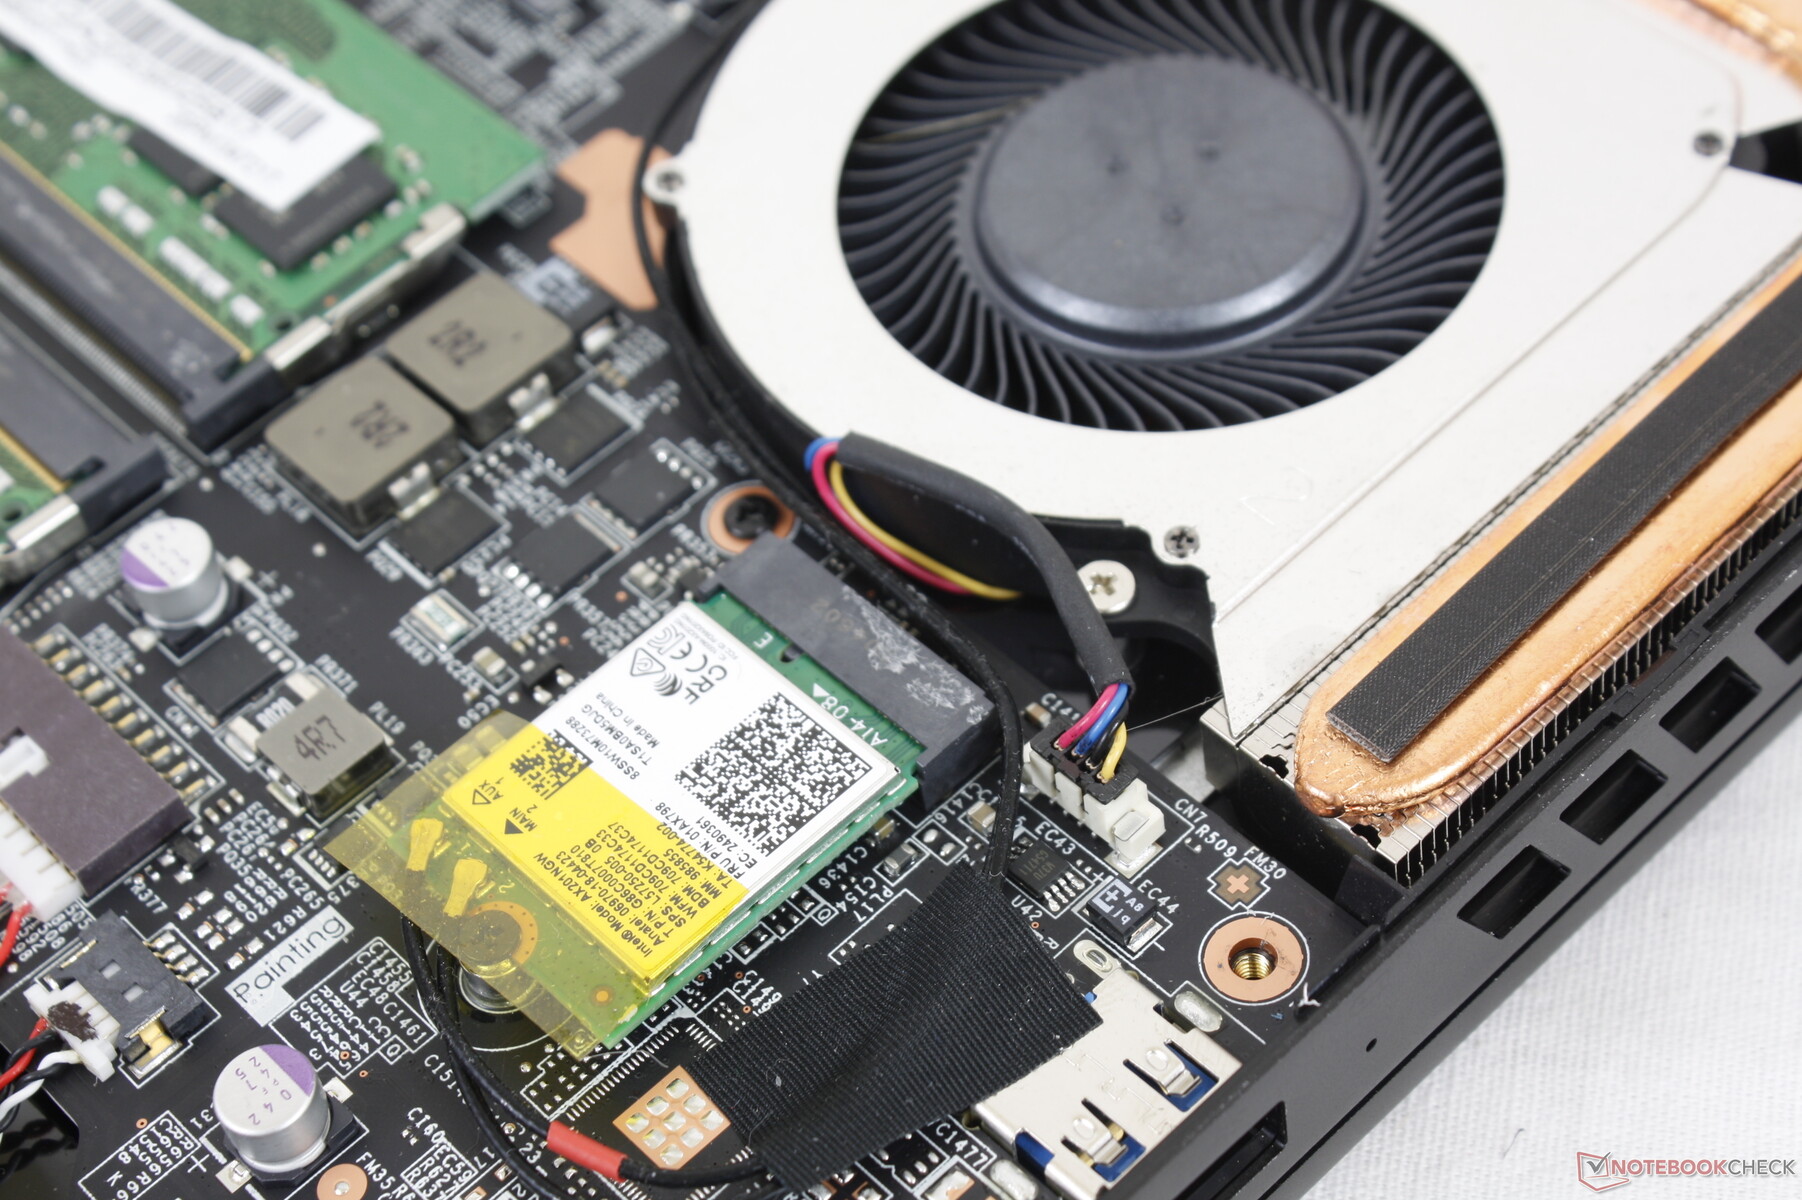
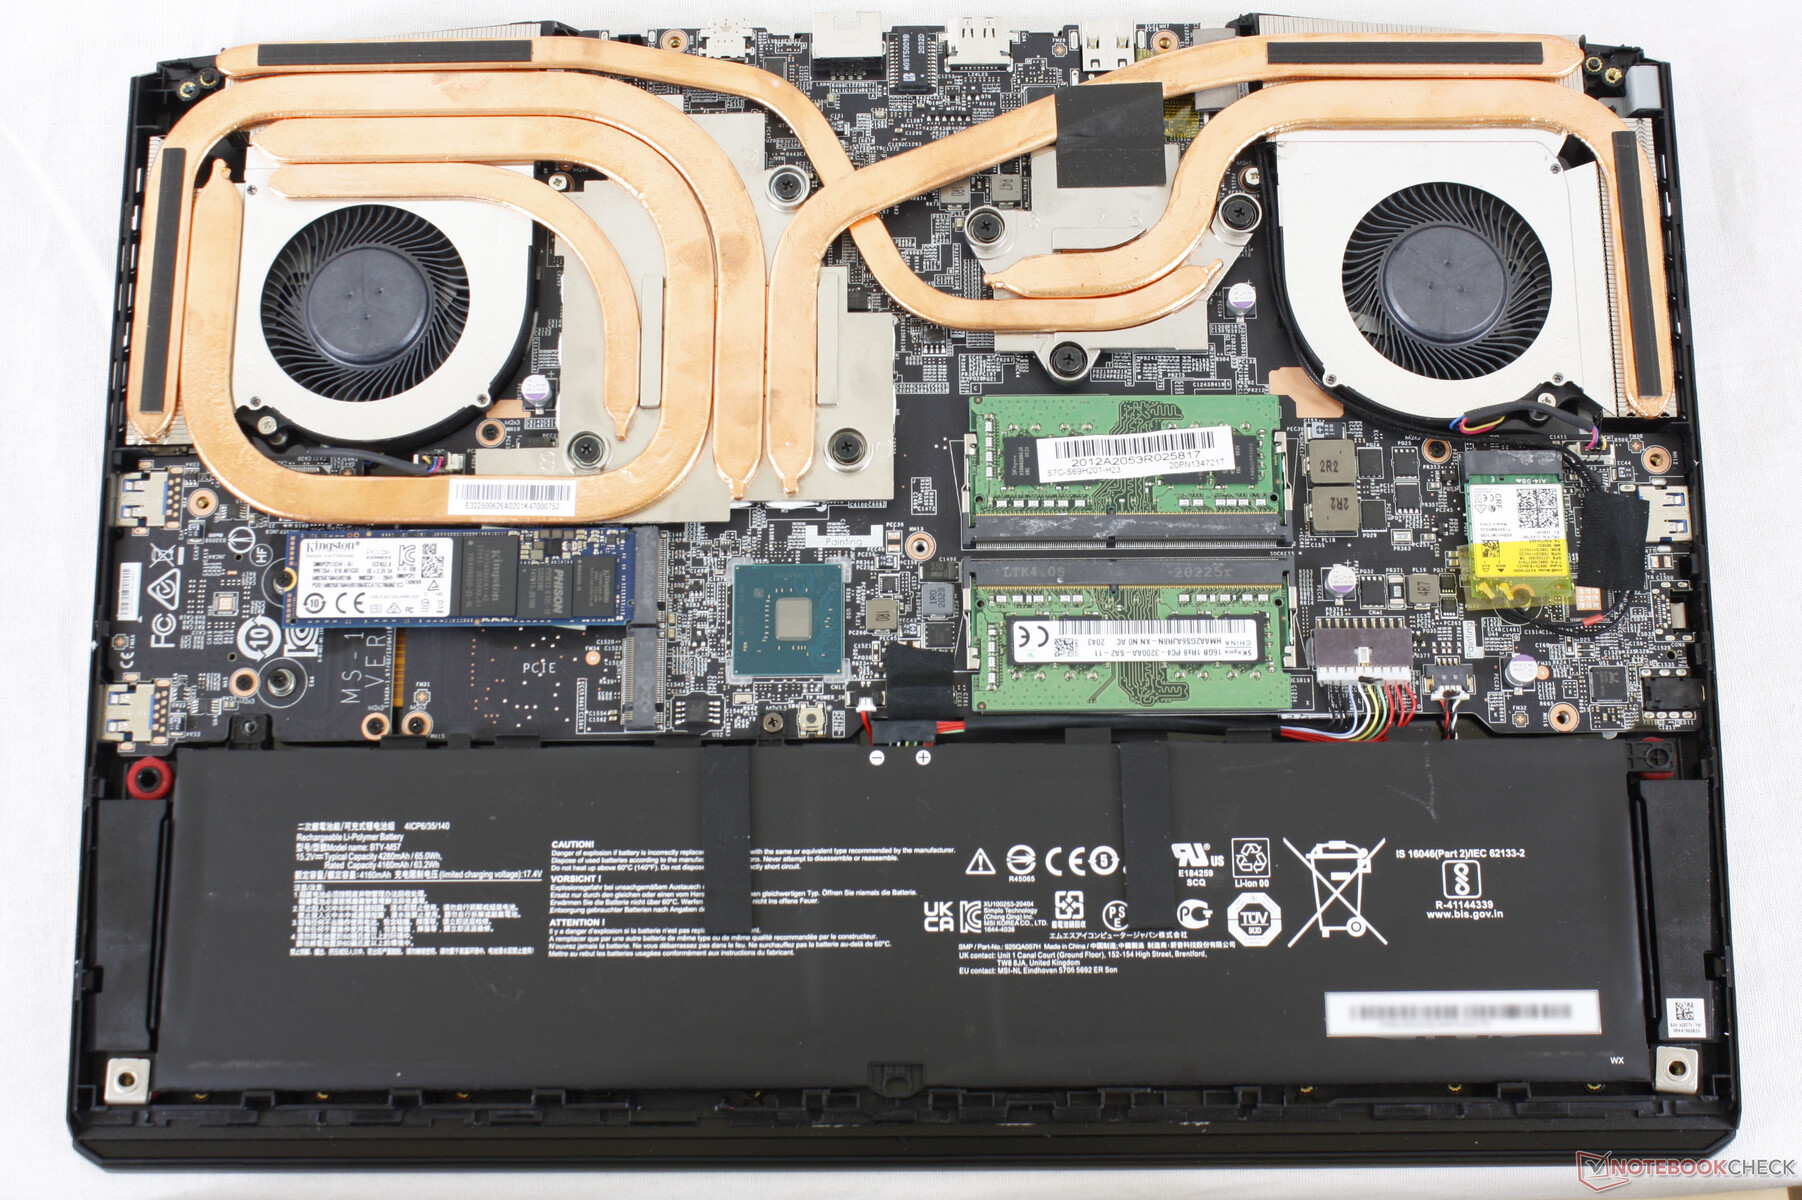
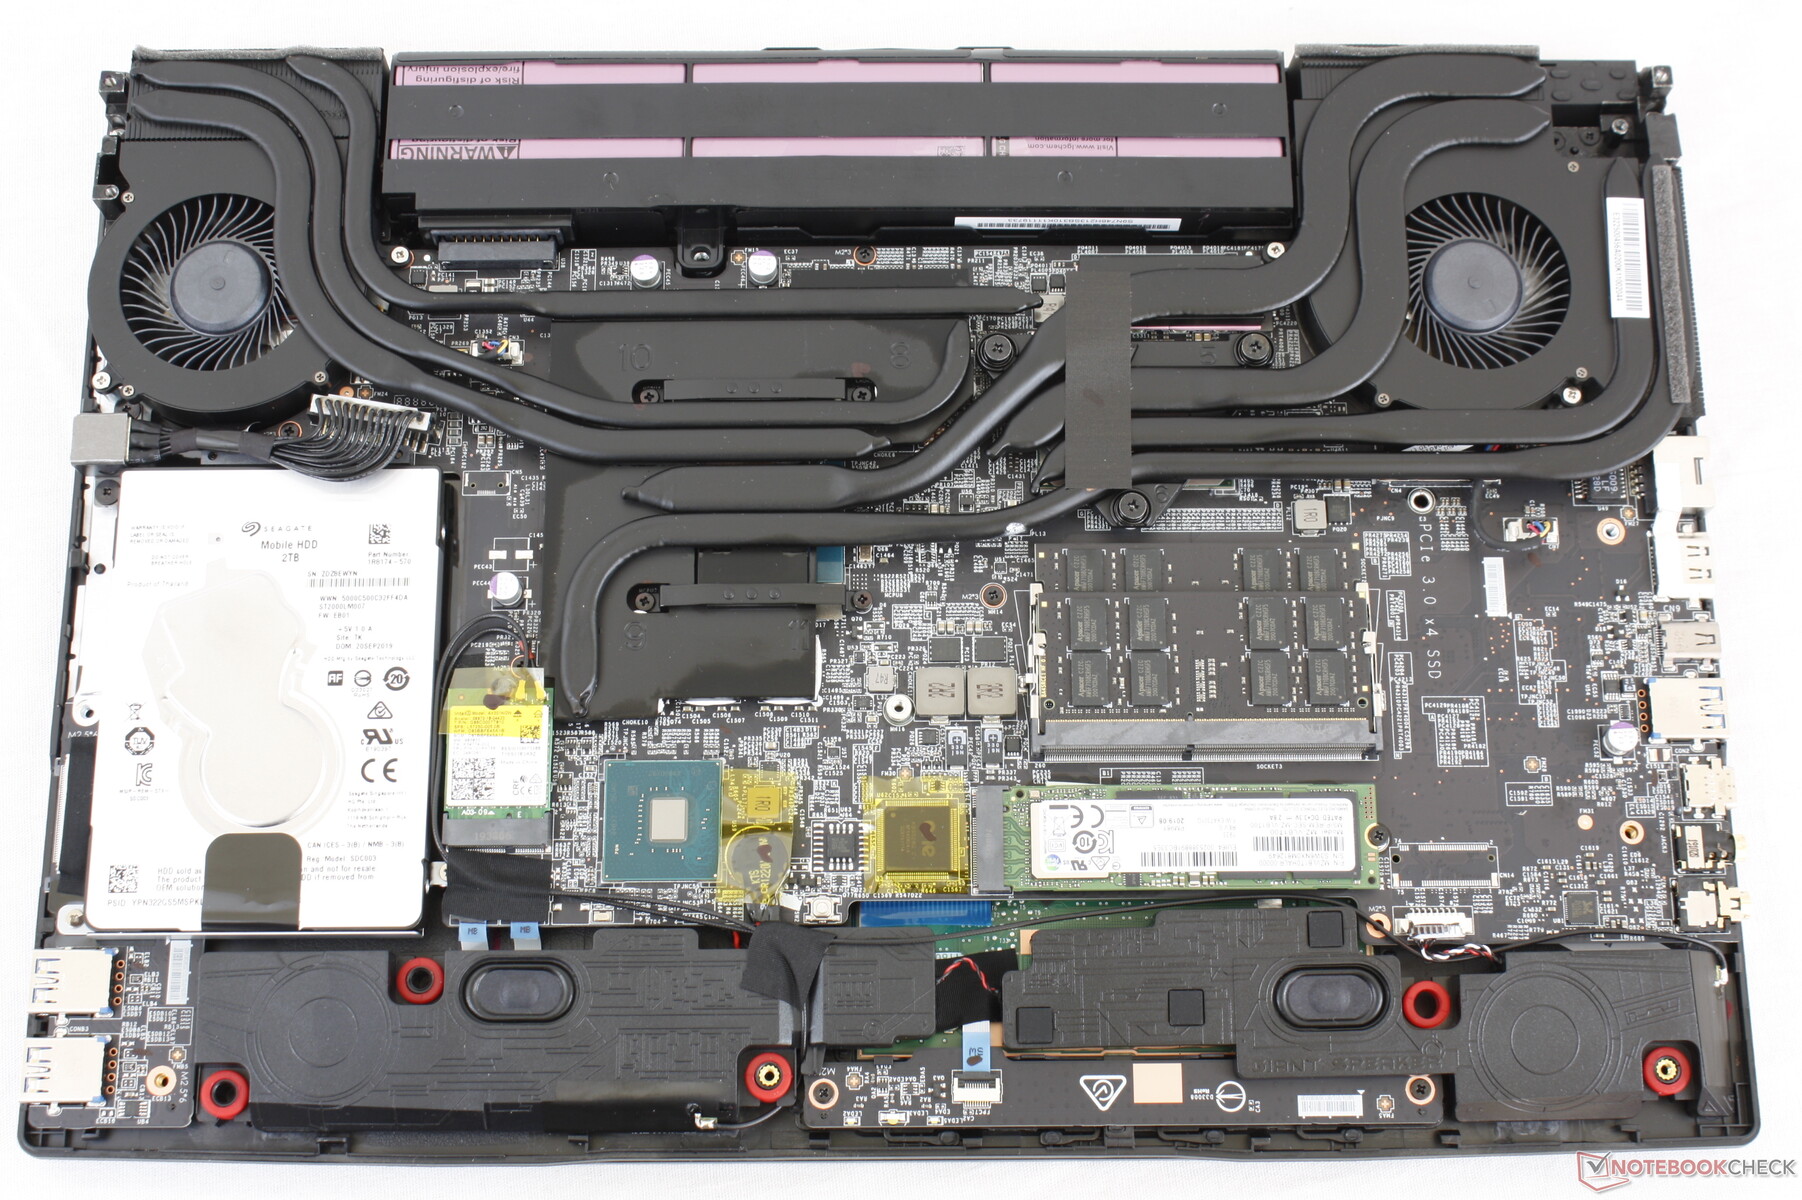
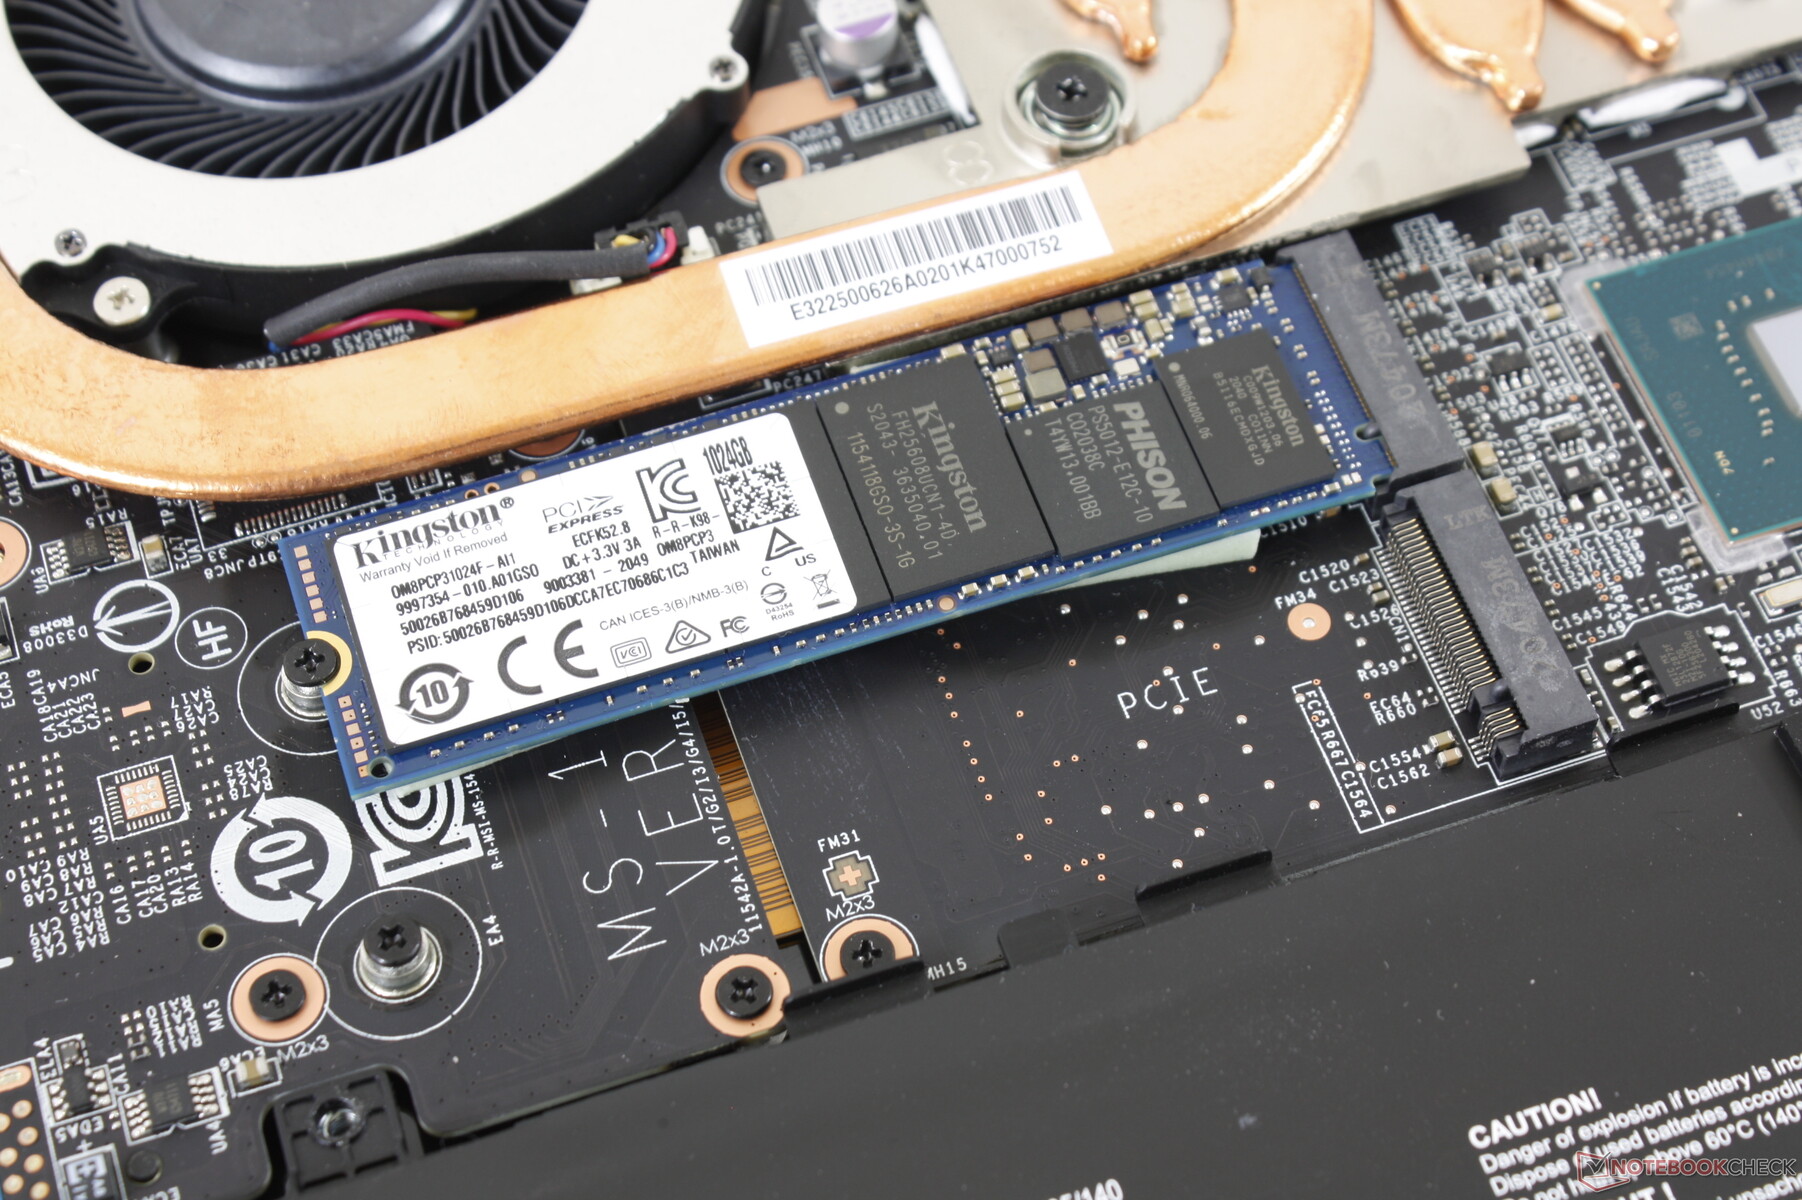
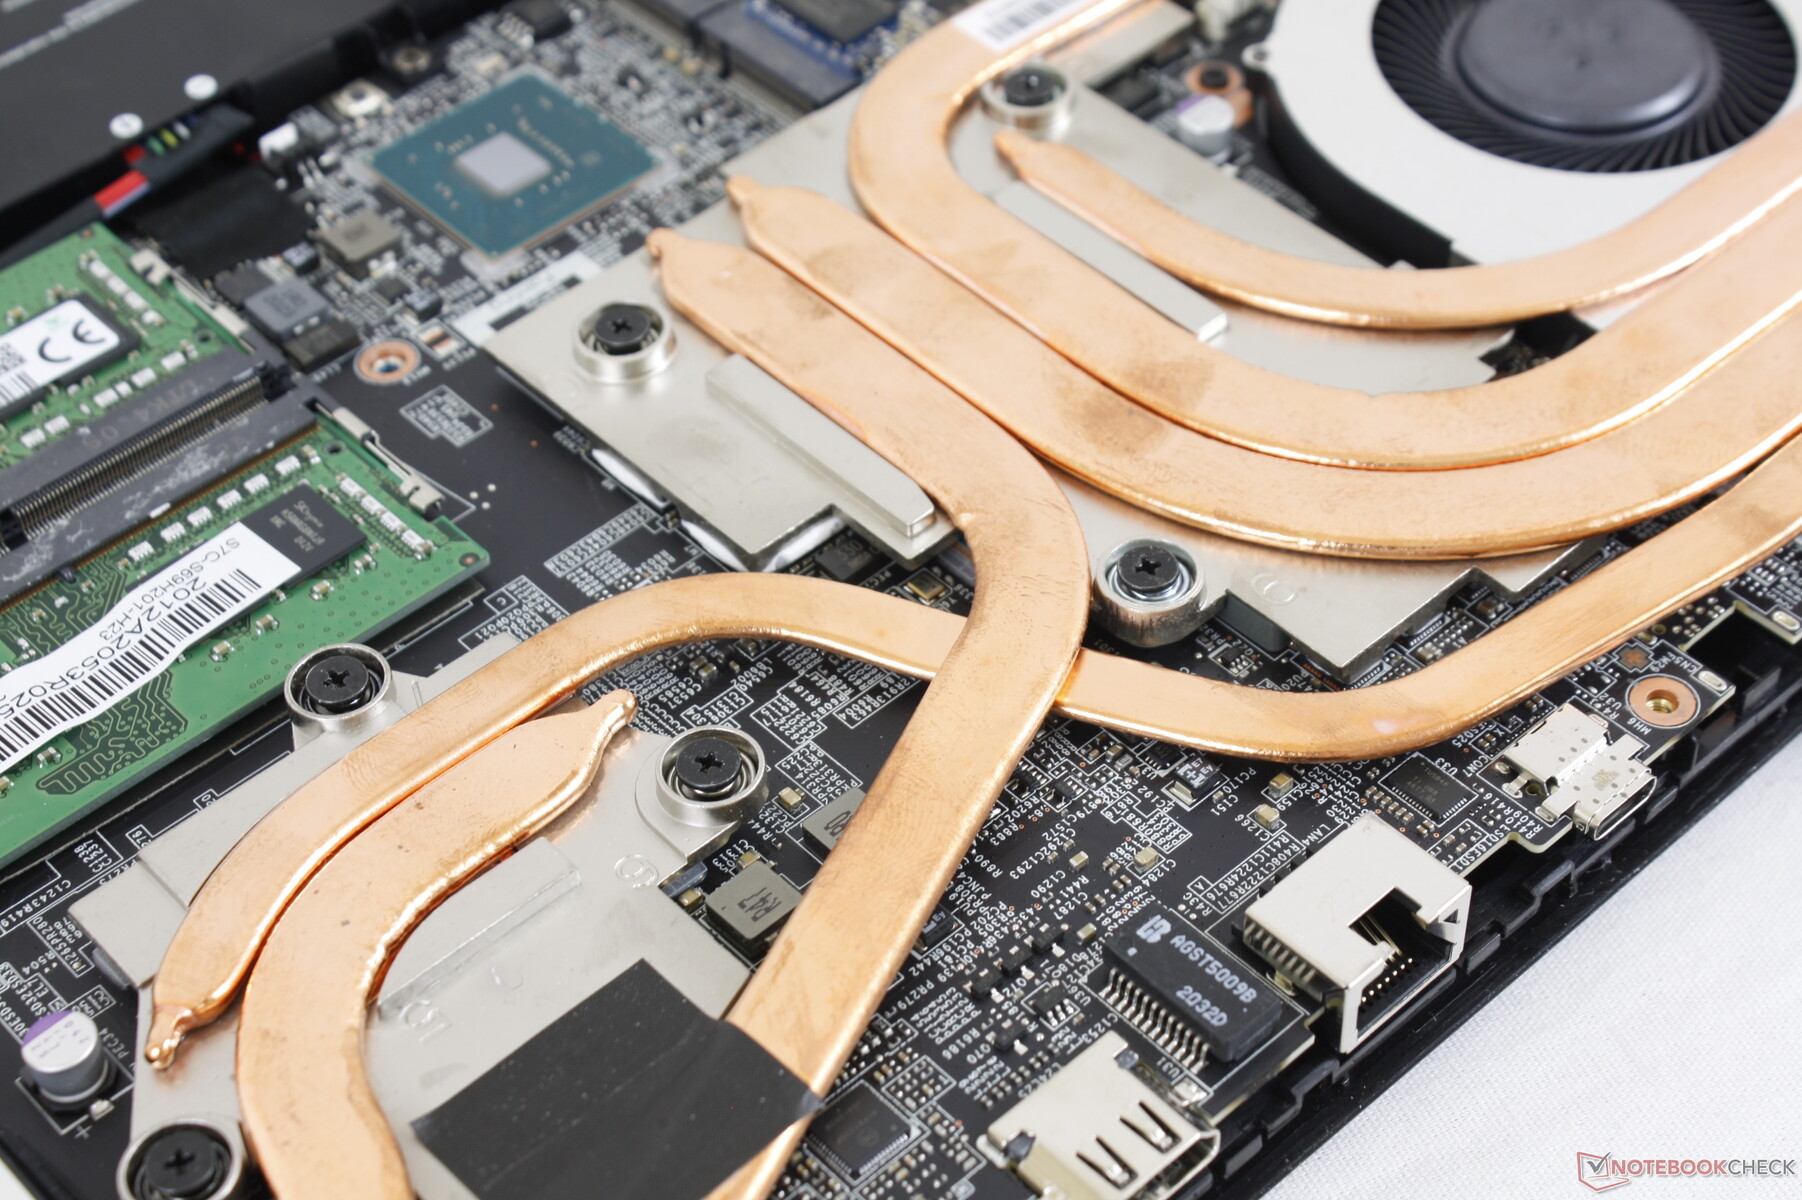
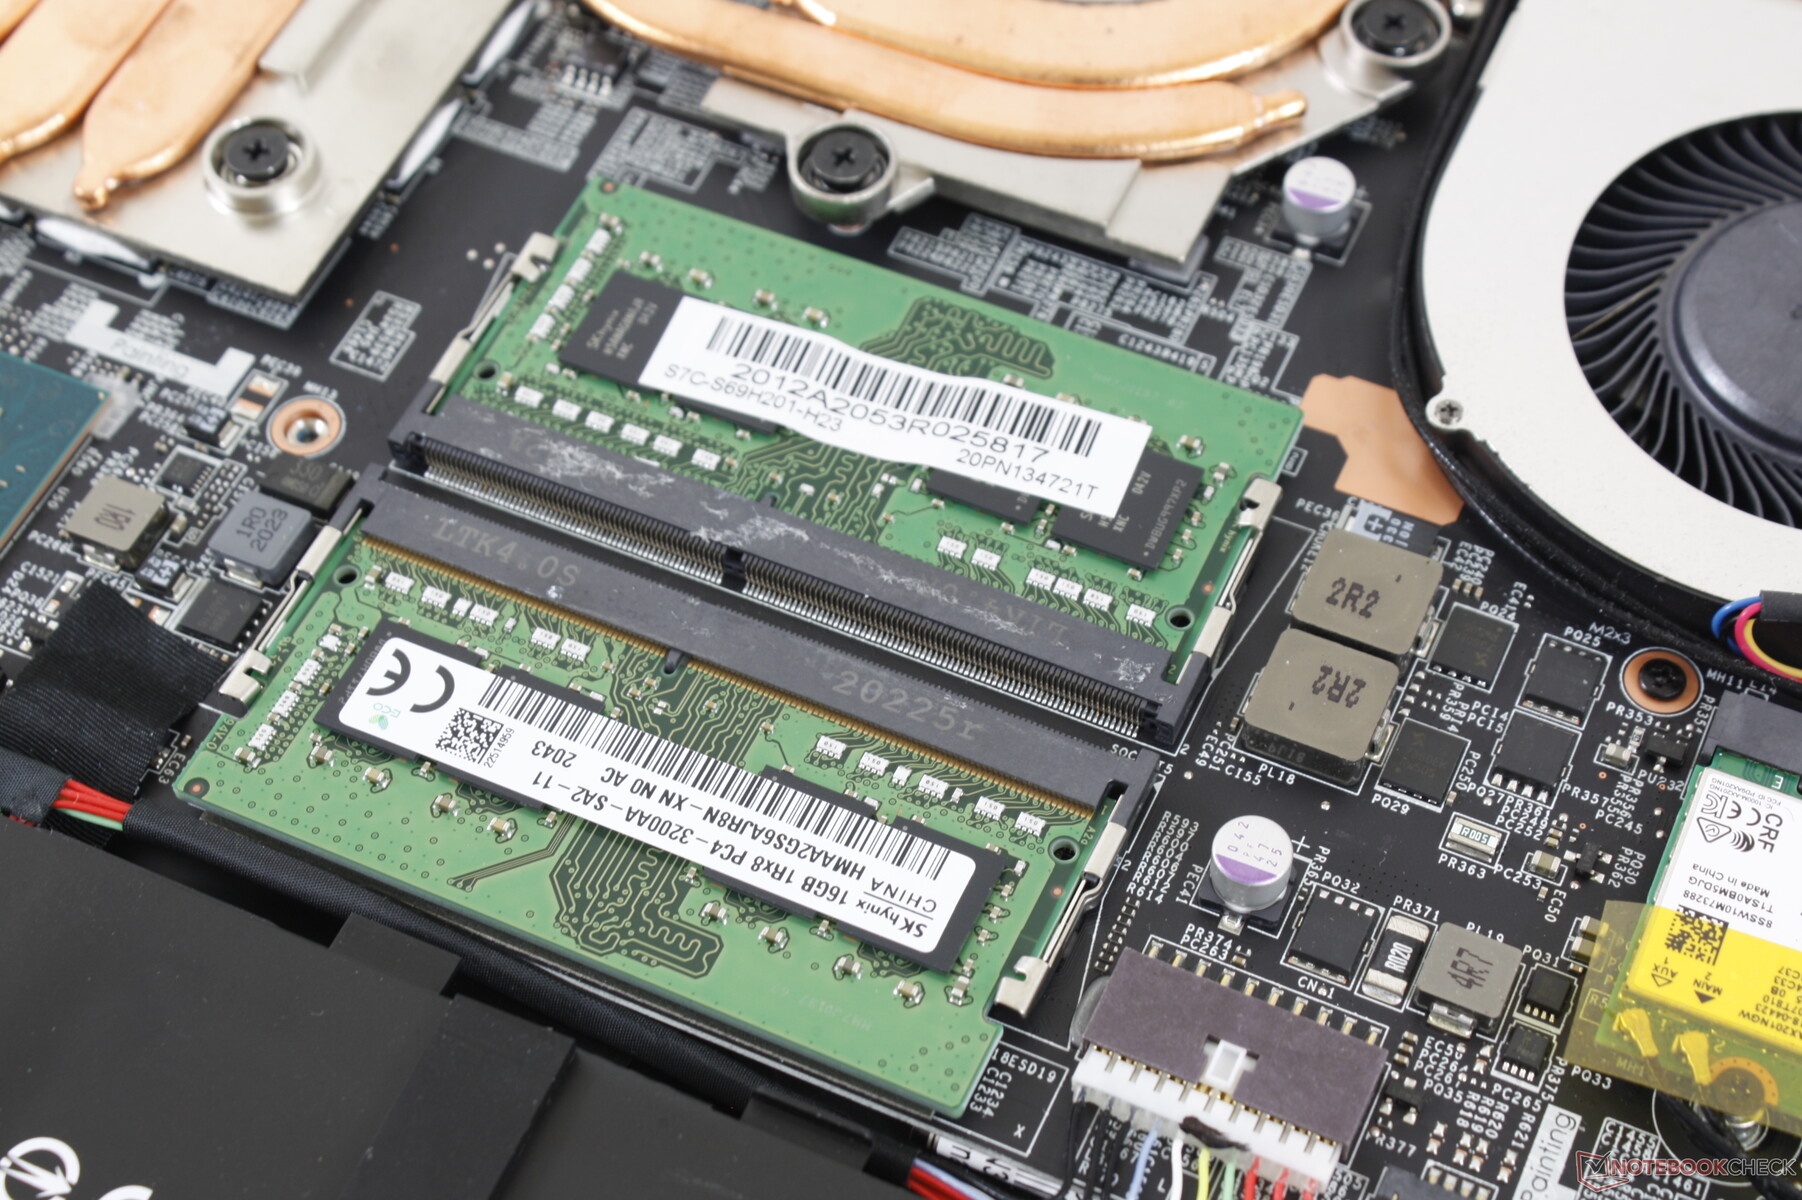
El mantenimiento es más difícil que en la GP65 porque el panel inferior de la GP66 está mucho más ajustado en los bordes y esquinas. Se necesita un borde afilado y una mano cuidadosa para retirar el panel con seguridad. Una vez dentro, los usuarios tendrán acceso directo a 2 ranuras M.2 2280, 2 SODIMM, la batería y el módulo WLAN.
Accesorios y garantía
No hay más extras en la caja que el adaptador de CA y la documentación. El paño de limpieza de terciopelo que se incluye con los portátiles de las series GS y GT no se incluye aquí.
Se aplica la garantía estándar de un año limitada del fabricante.
Dispositivos de entrada
Teclado
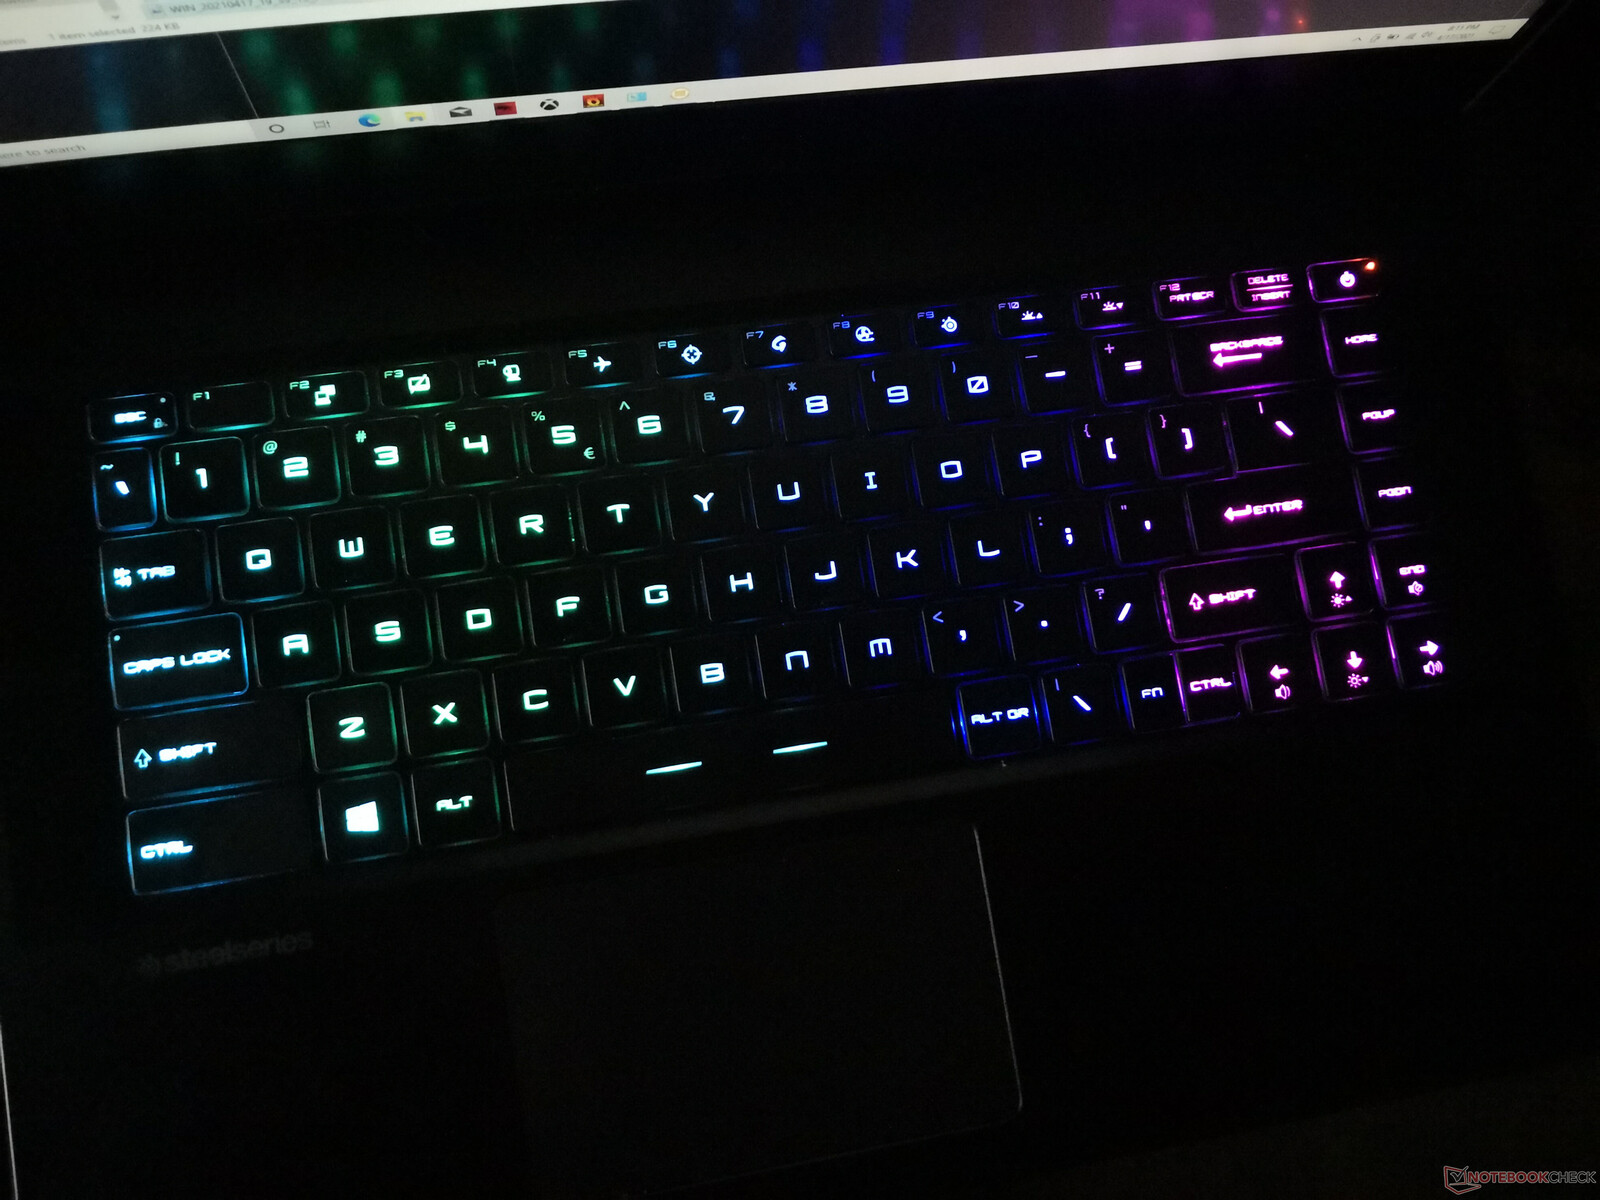
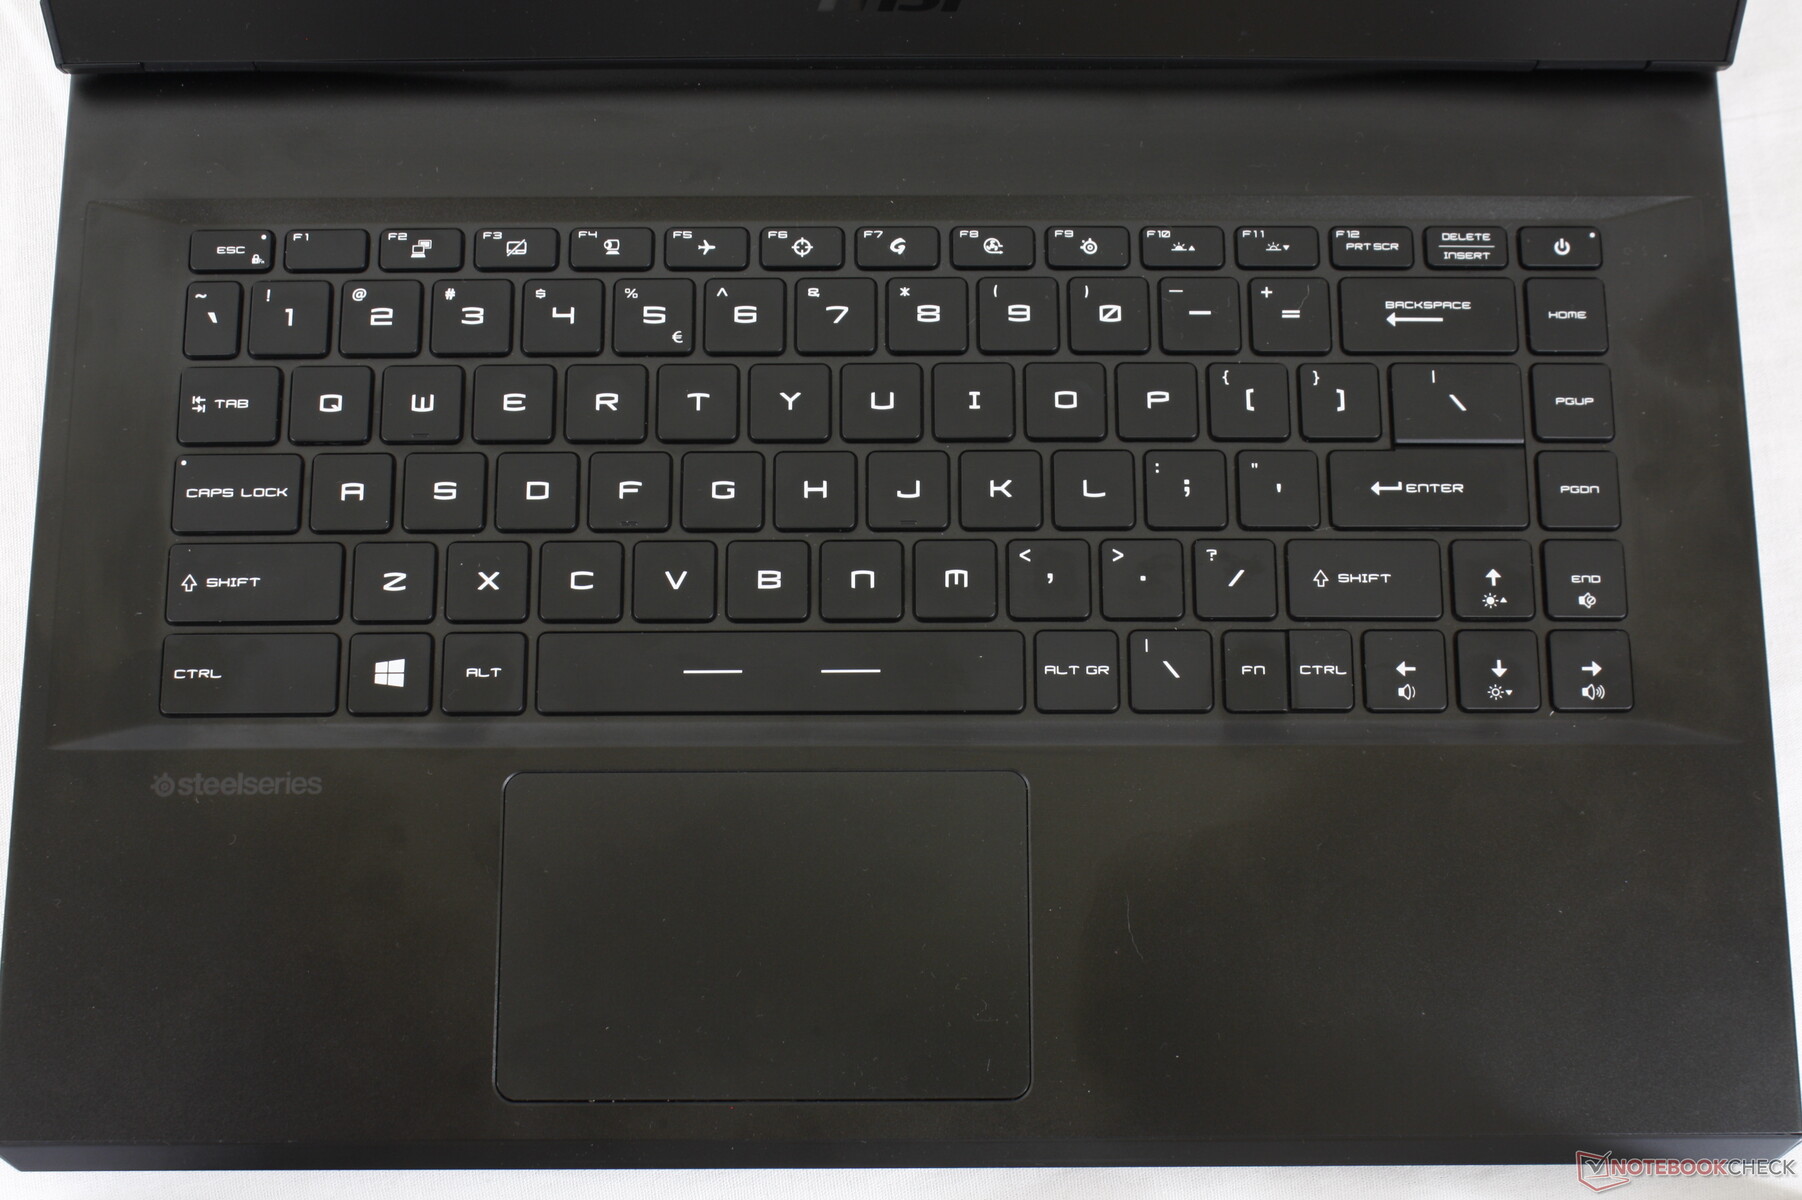
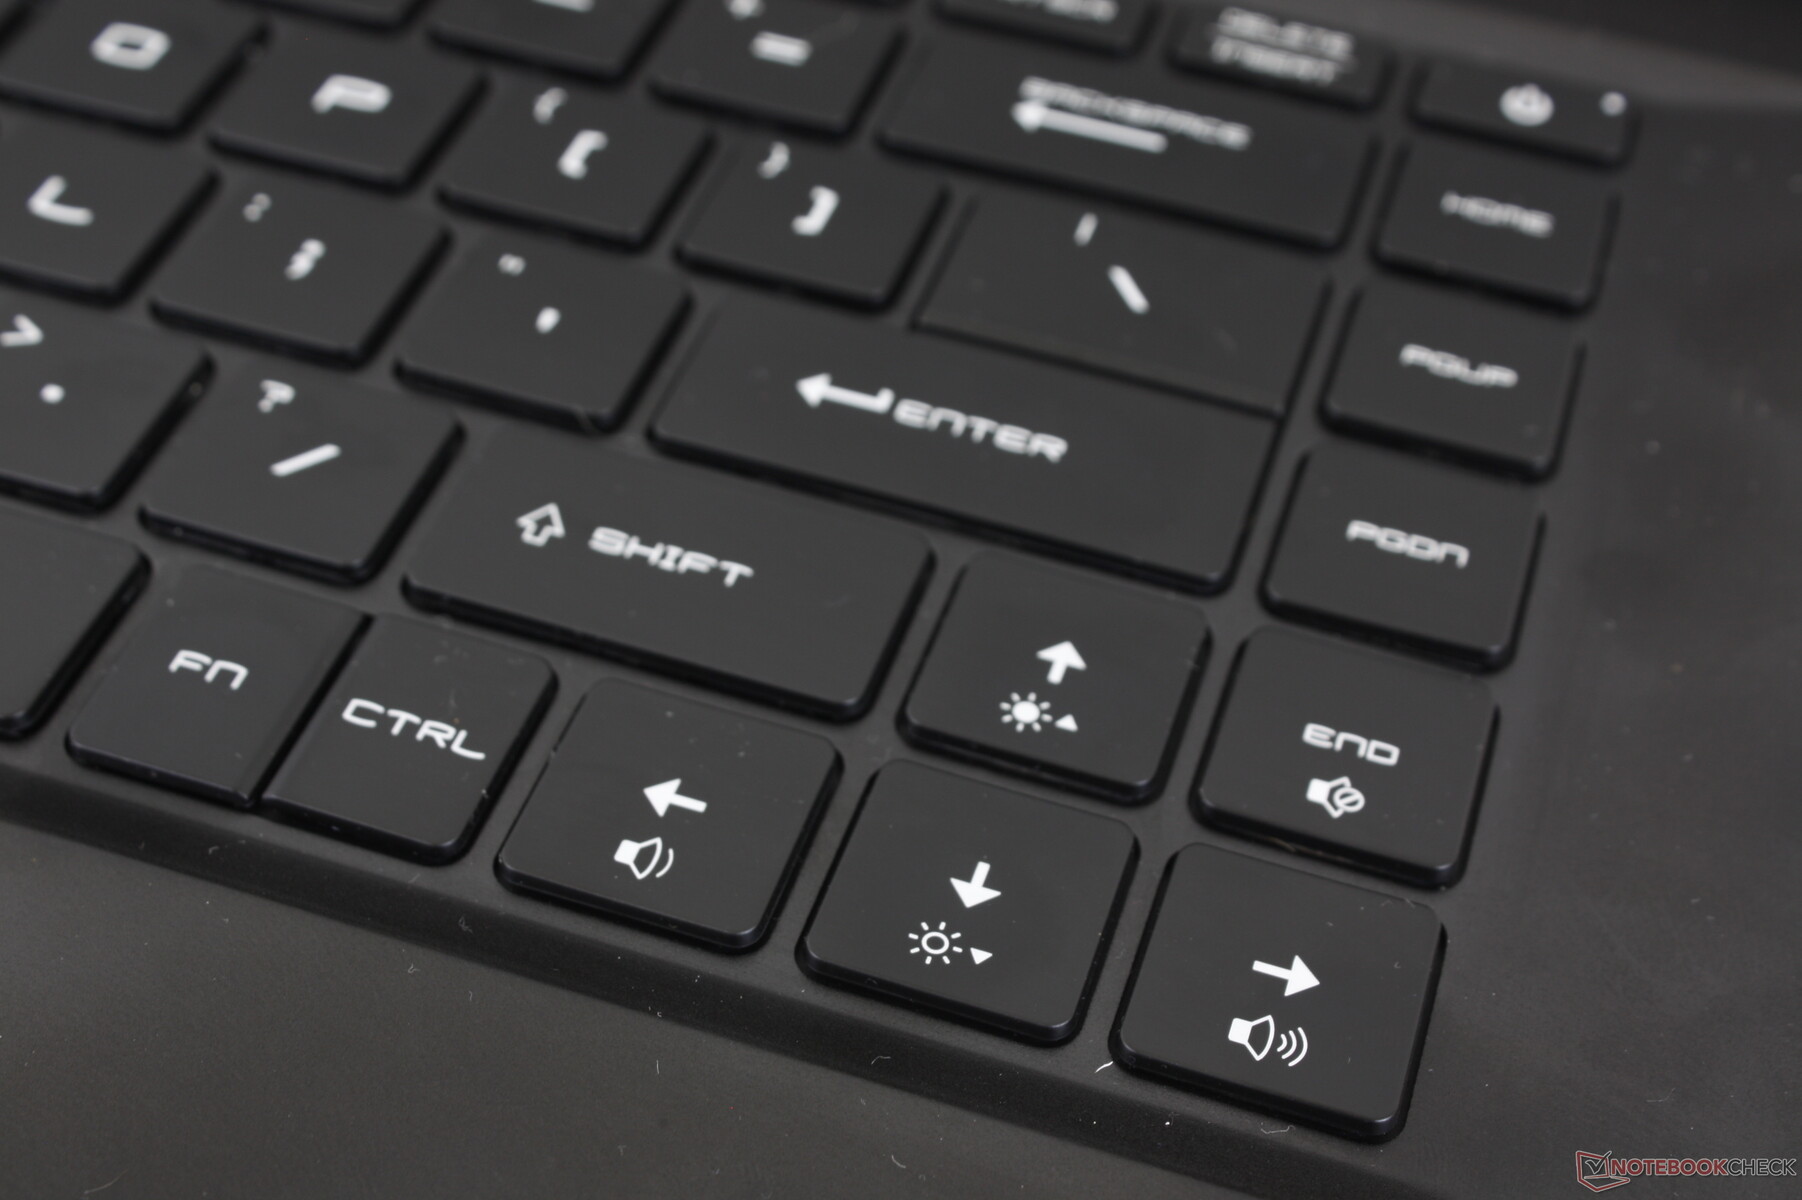
El teclado es idéntico al del GE66 y un gran cambio con respecto al GP65. El NumPad, por ejemplo, ya no existe y el recorrido es más corto con una respuesta más nítida. El ruido es también ligeramente más fuerte y agudo que antes, especialmente en lo que respecta a las teclas Espacio y Enter
Vuelve la iluminación RGB por tecla. Sin embargo, la iluminación podría ser más uniforme, ya que los símbolos de las teclas secundarias (es decir, !, @, #, etc.) no brillan tanto como los símbolos principales (1, 2, 3, etc.).
Panel táctil
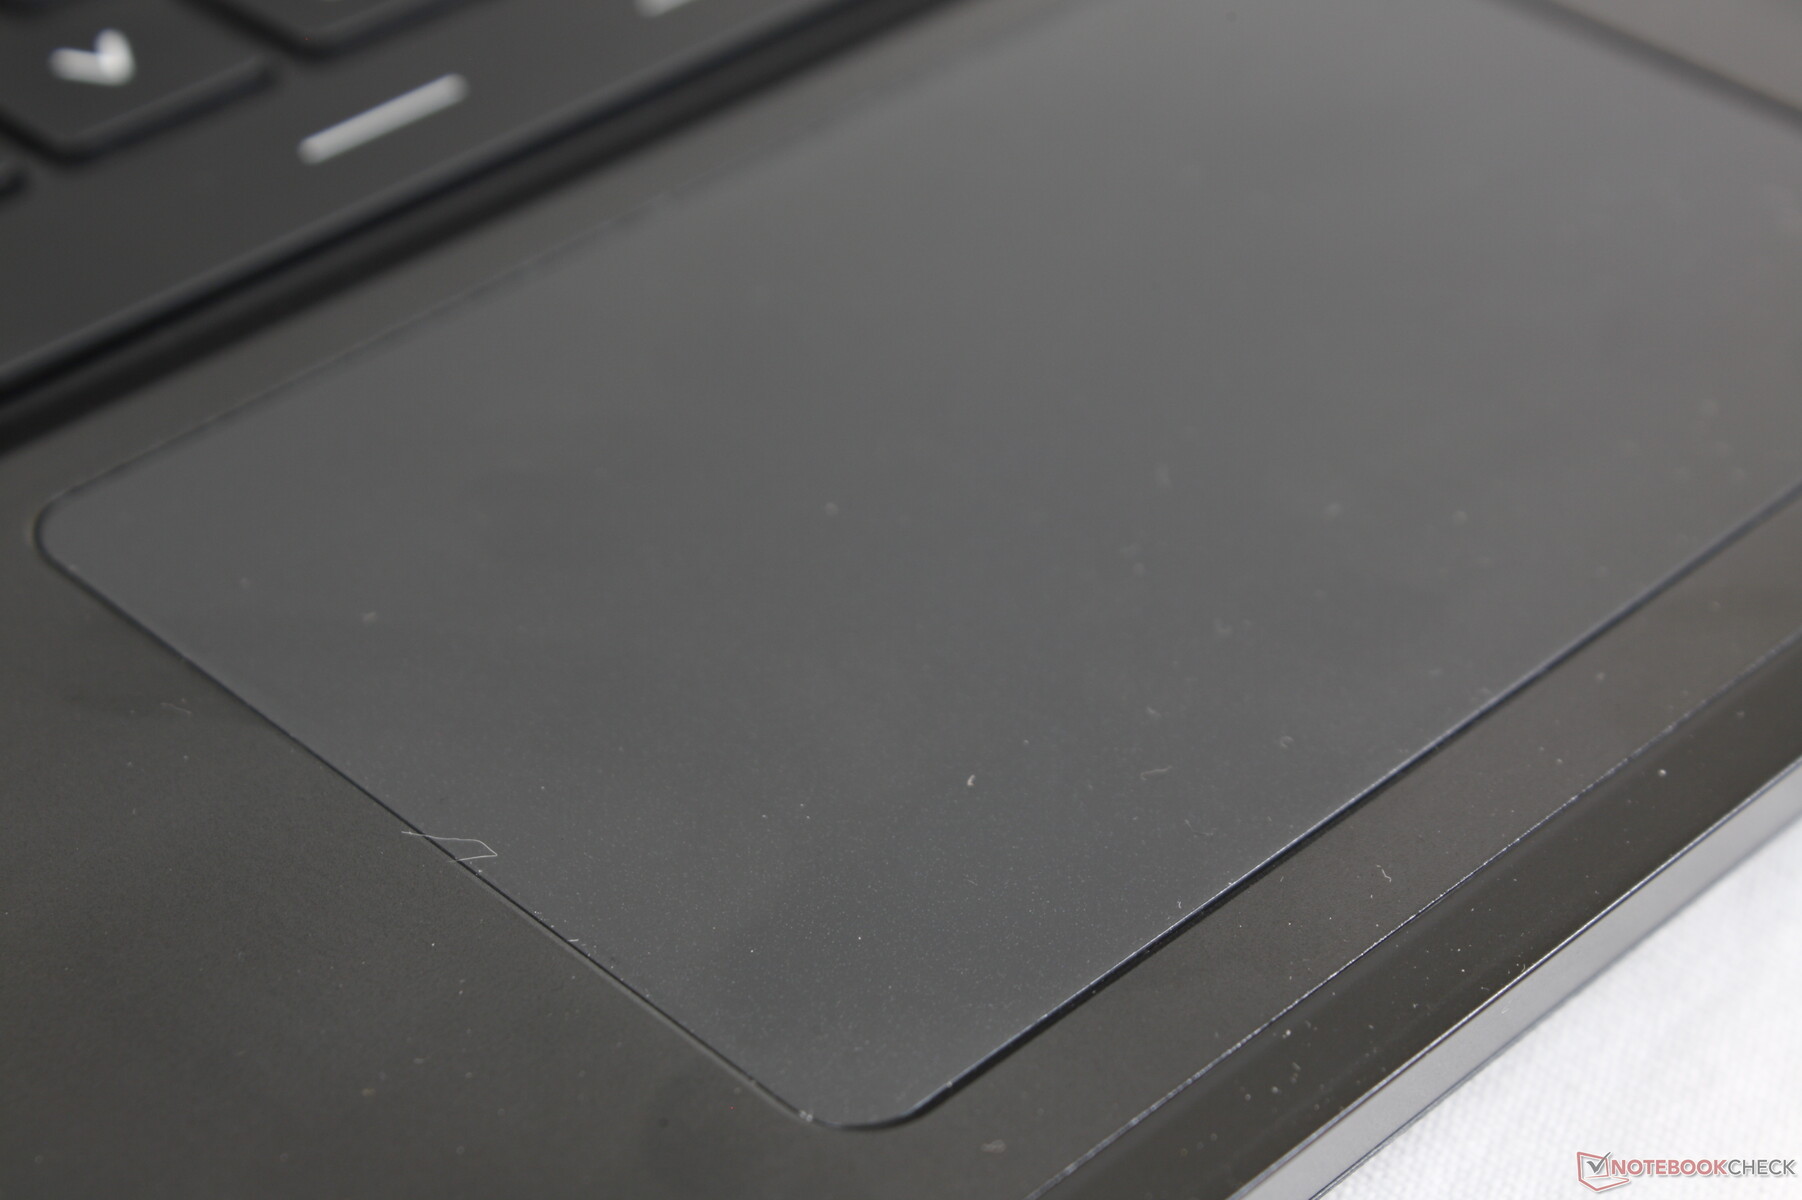
El clickpad de plástico es relativamente pequeño (10,5 x 6,5 cm) con un suave deslizamiento a velocidades medias-rápidas y apenas un poco de pegada a velocidades más lentaspara clics más precisos. Sus teclas de clic integradas son esponjosas y requieren más fuerza de la habitual para registrarse, lo que puede llegar a cansar si no se tiene un ratón externo. Aunque el nuevo clickpad es útil, echamos de menos los botones de ratón dedicados y el clickpad más firme del antiguo GP65.

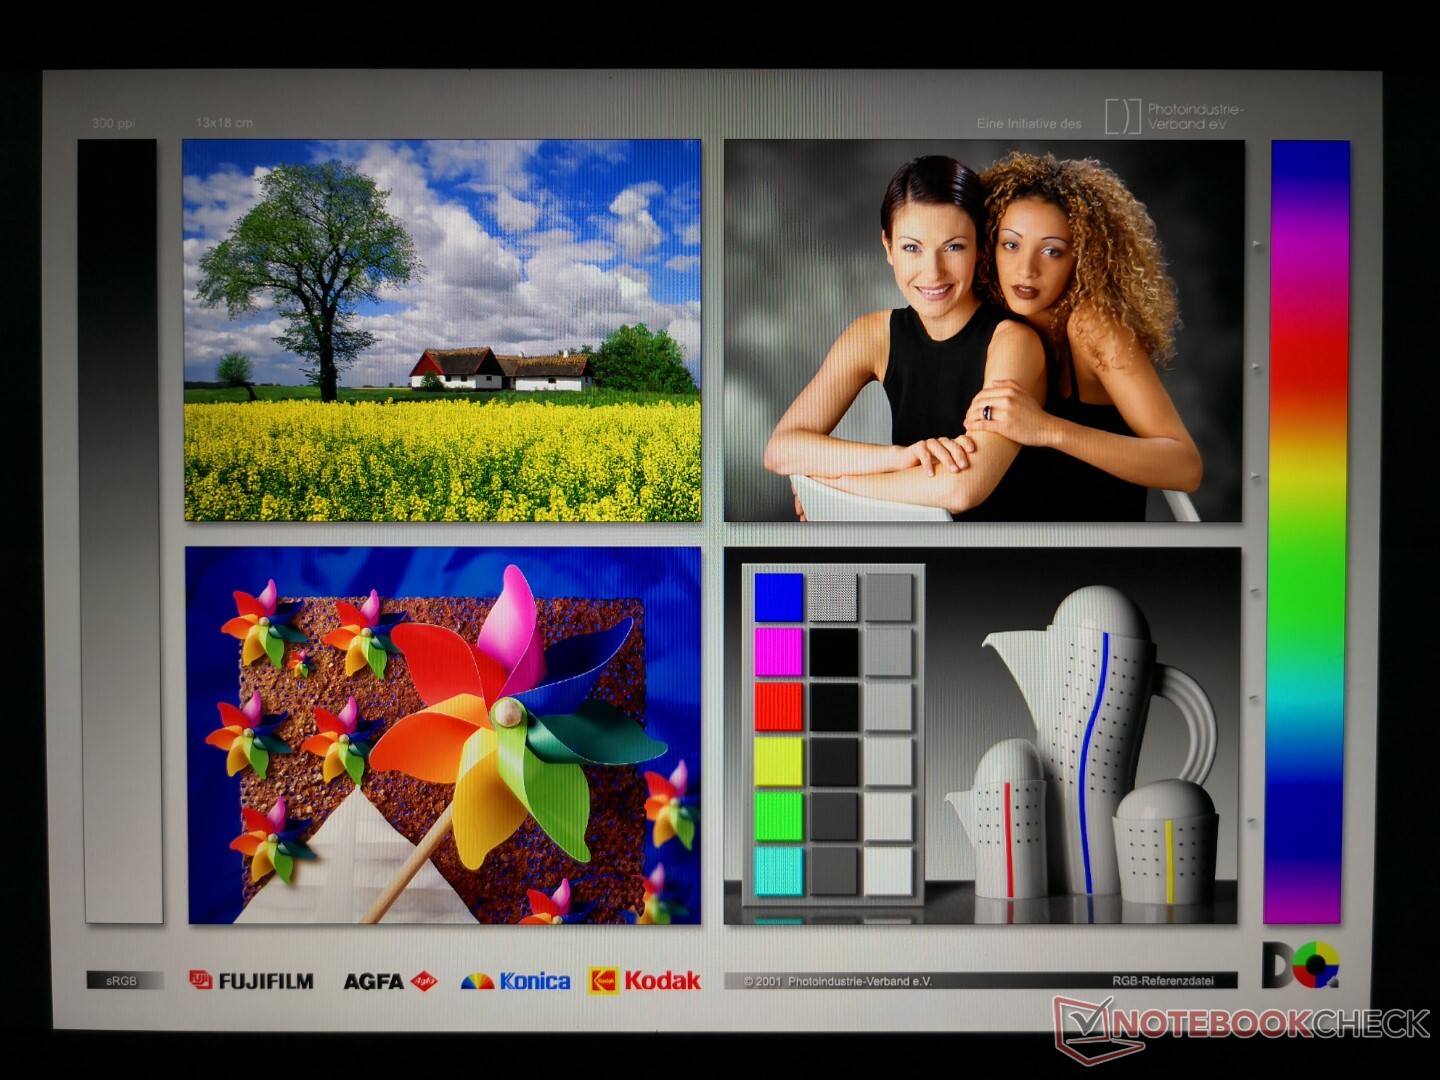
Mostrar
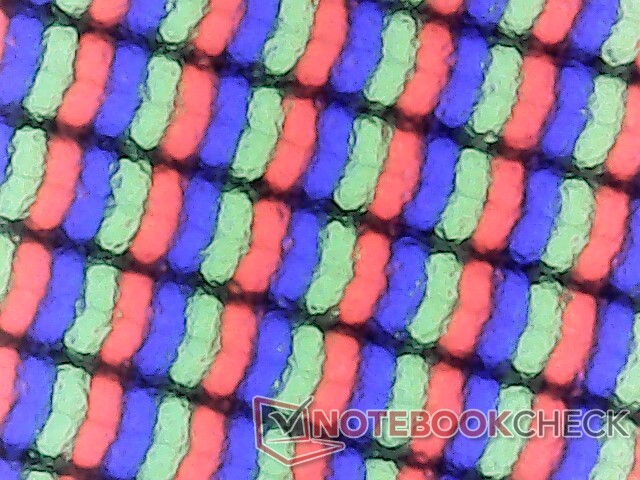
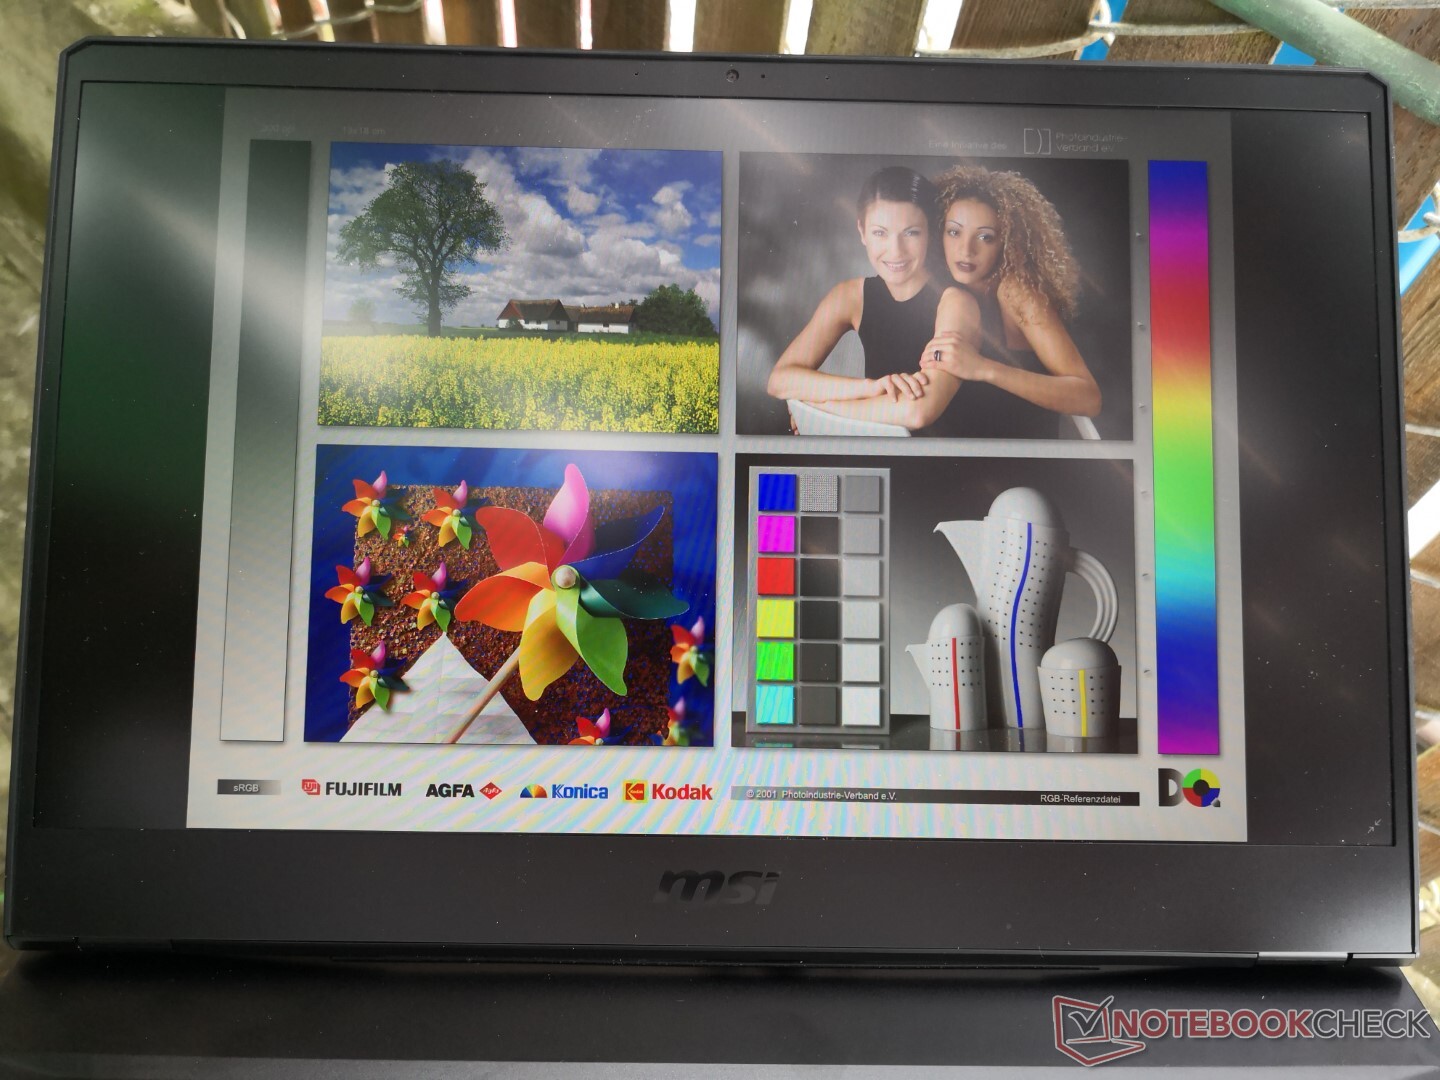
Nuestra configuración GP66 10UG utiliza el mismo panel Sharp LQ156M1JW03 de 240 Hz que se encuentra en el GE66 10SFS, GS65 Stealth 9SGRazer Blade 15 y Aorus 15P XC. Los colores, el contraste y los tiempos de respuesta son, por tanto, similares entre todos estos portátiles, lo que es bueno ya que muchos de estos modelos son sistemas de juego de gama alta.
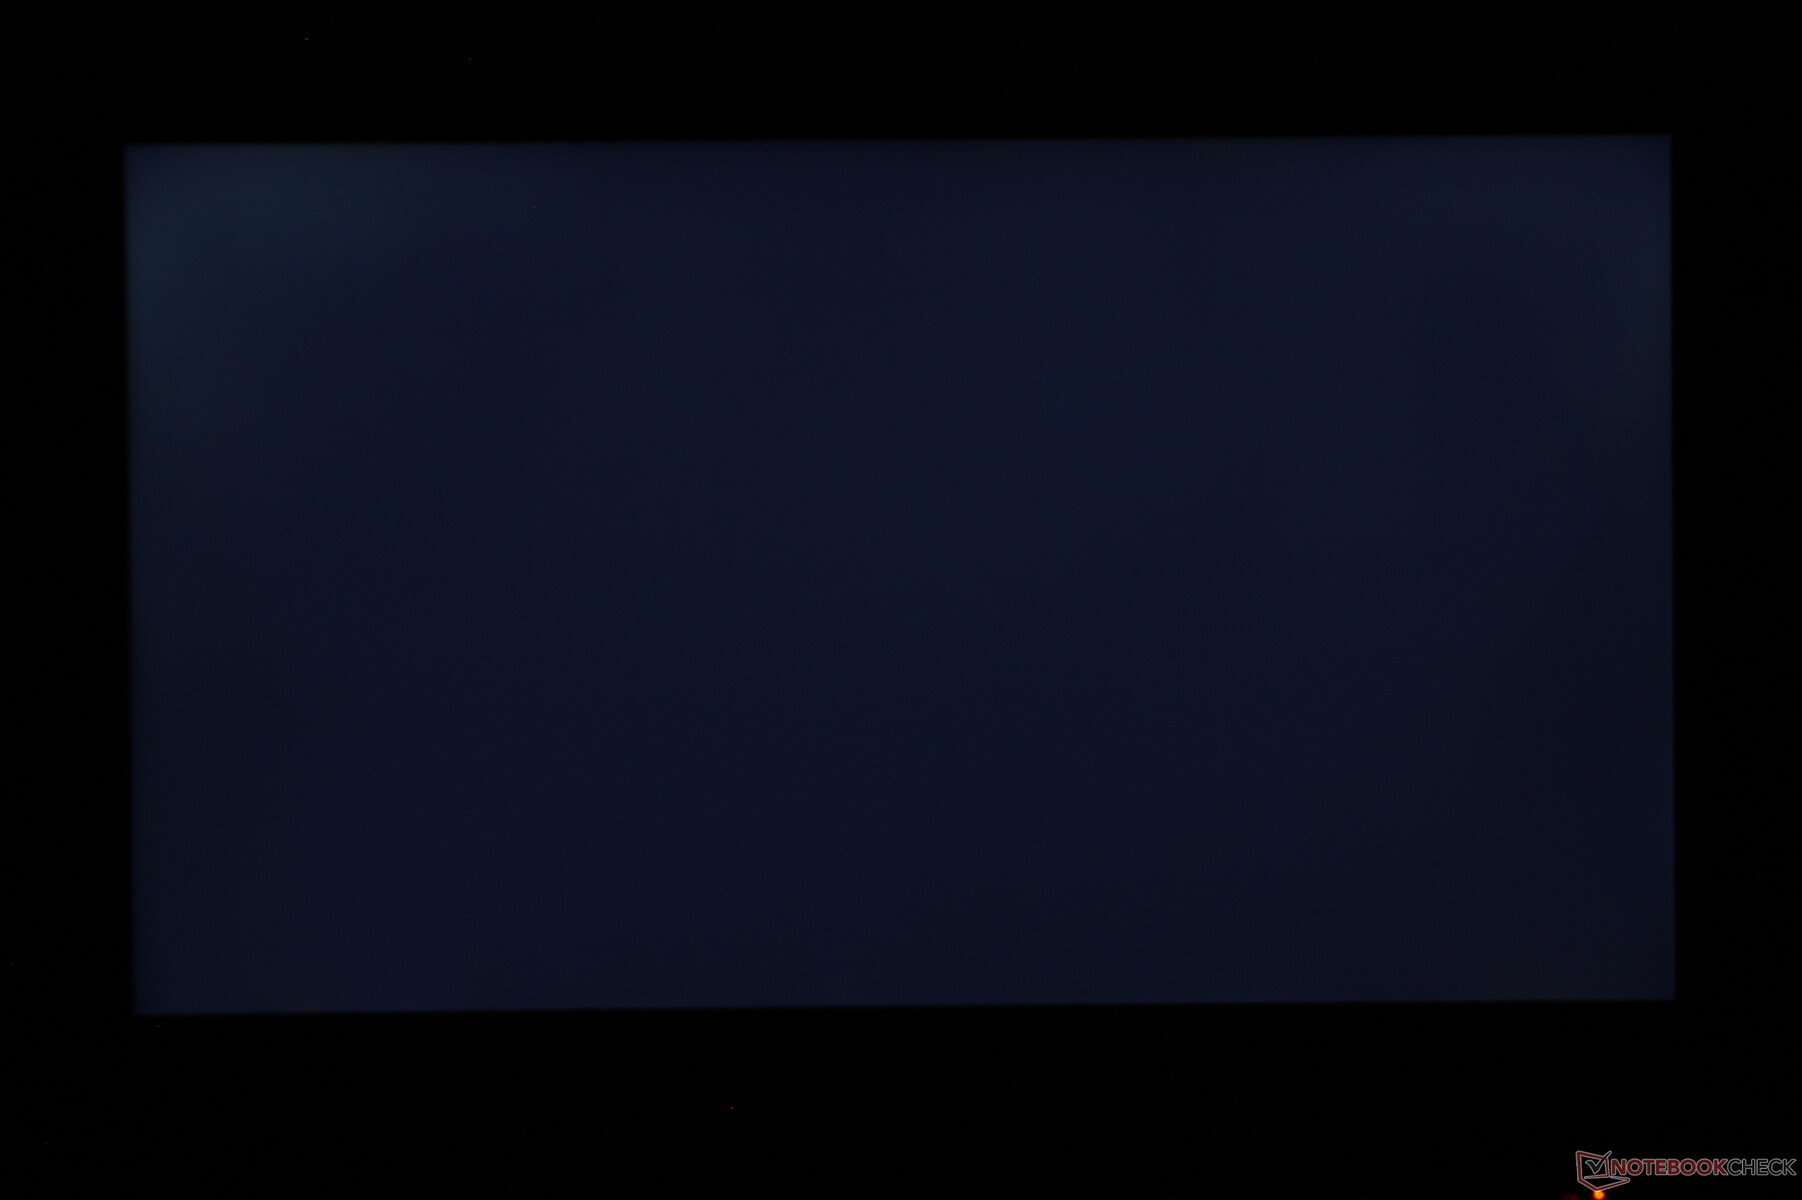
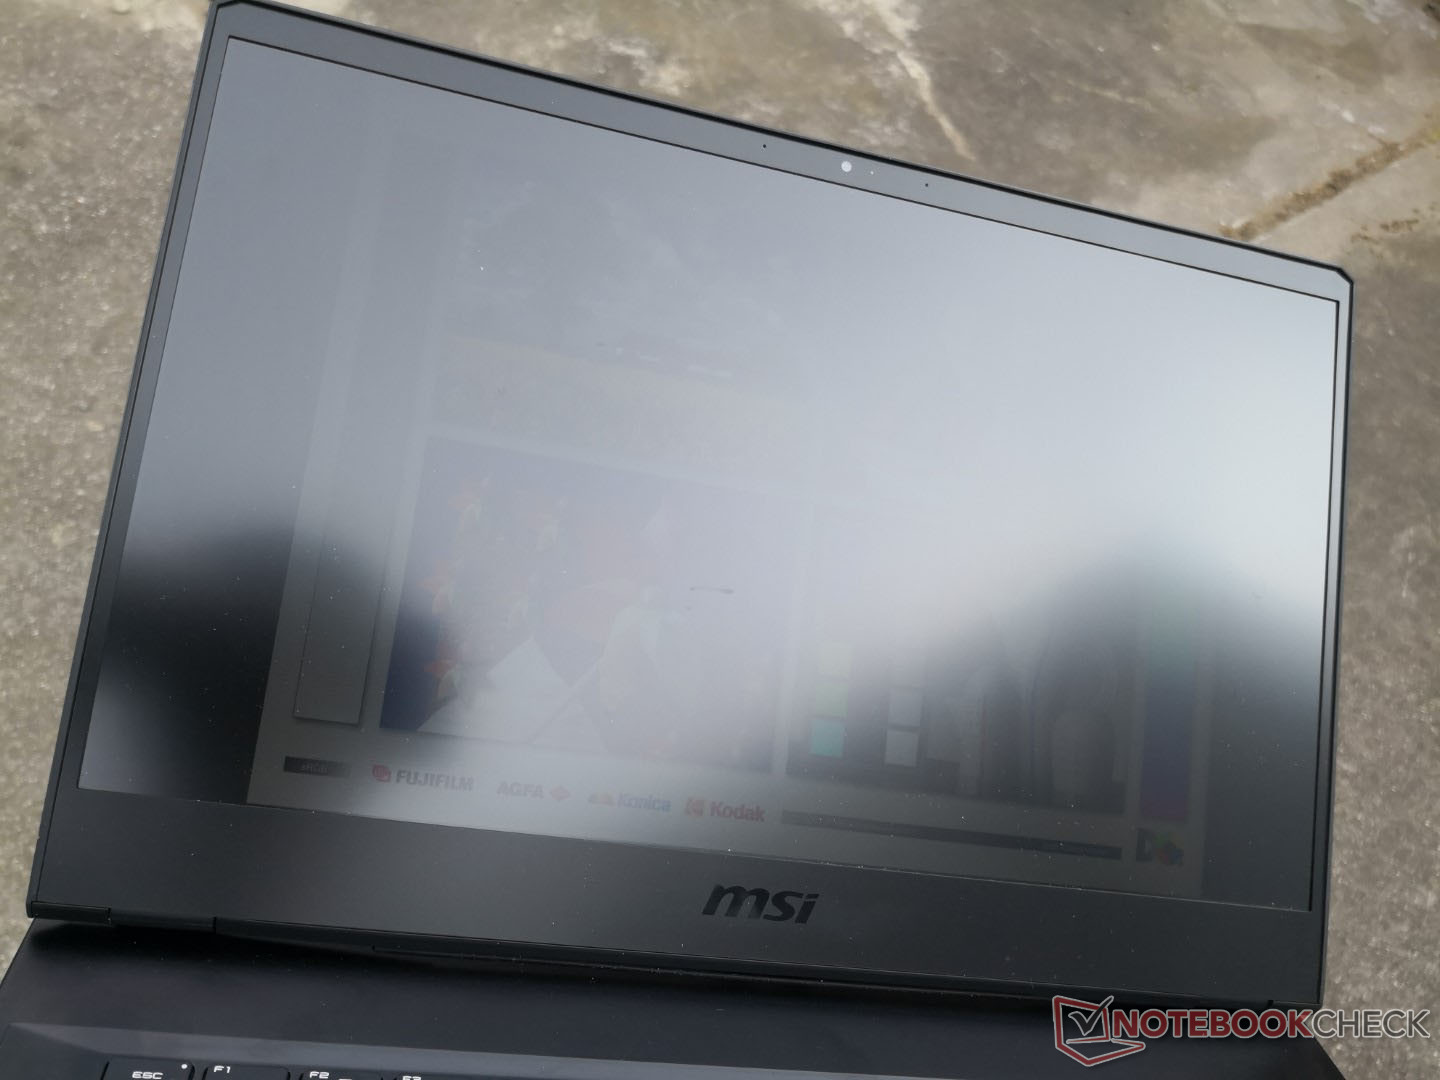
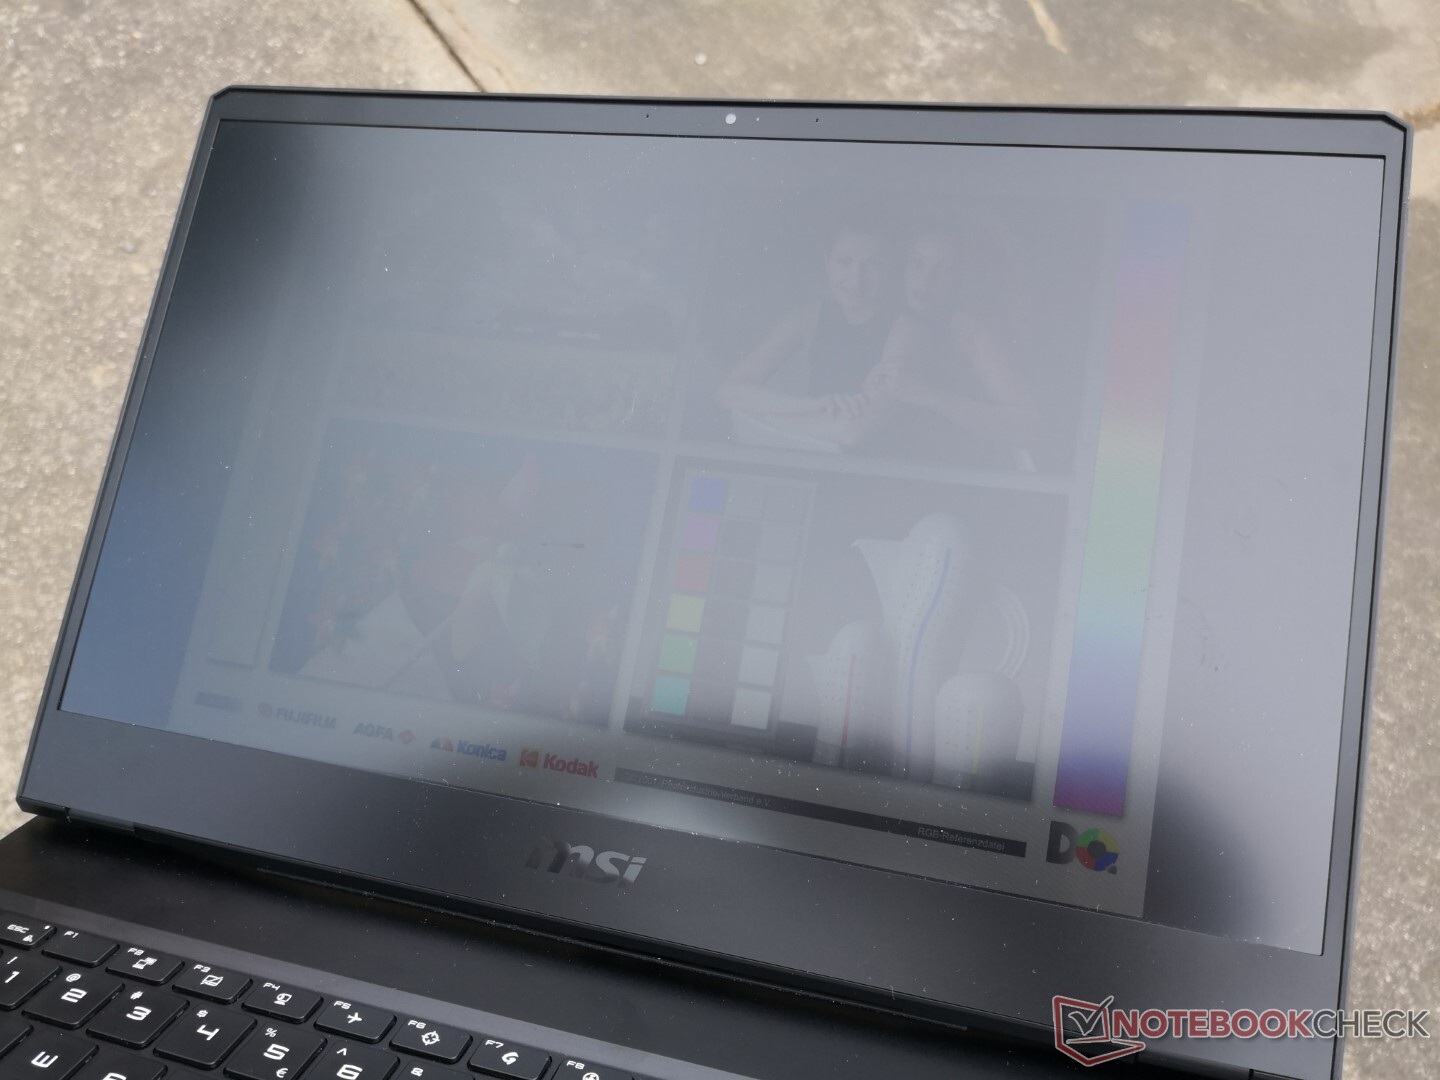
Una diferencia clave en la pantalla del GP66 cuando se compara con los portátiles antes mencionados es que es notablemente más tenue. El brillo máximo es de unos 210 nits, mientras que la mayoría de los portátiles para juegos tienen 300 nits o más.
| |||||||||||||||||||||||||
iluminación: 83 %
Brillo con batería: 225.9 cd/m²
Contraste: 982:1 (Negro: 0.23 cd/m²)
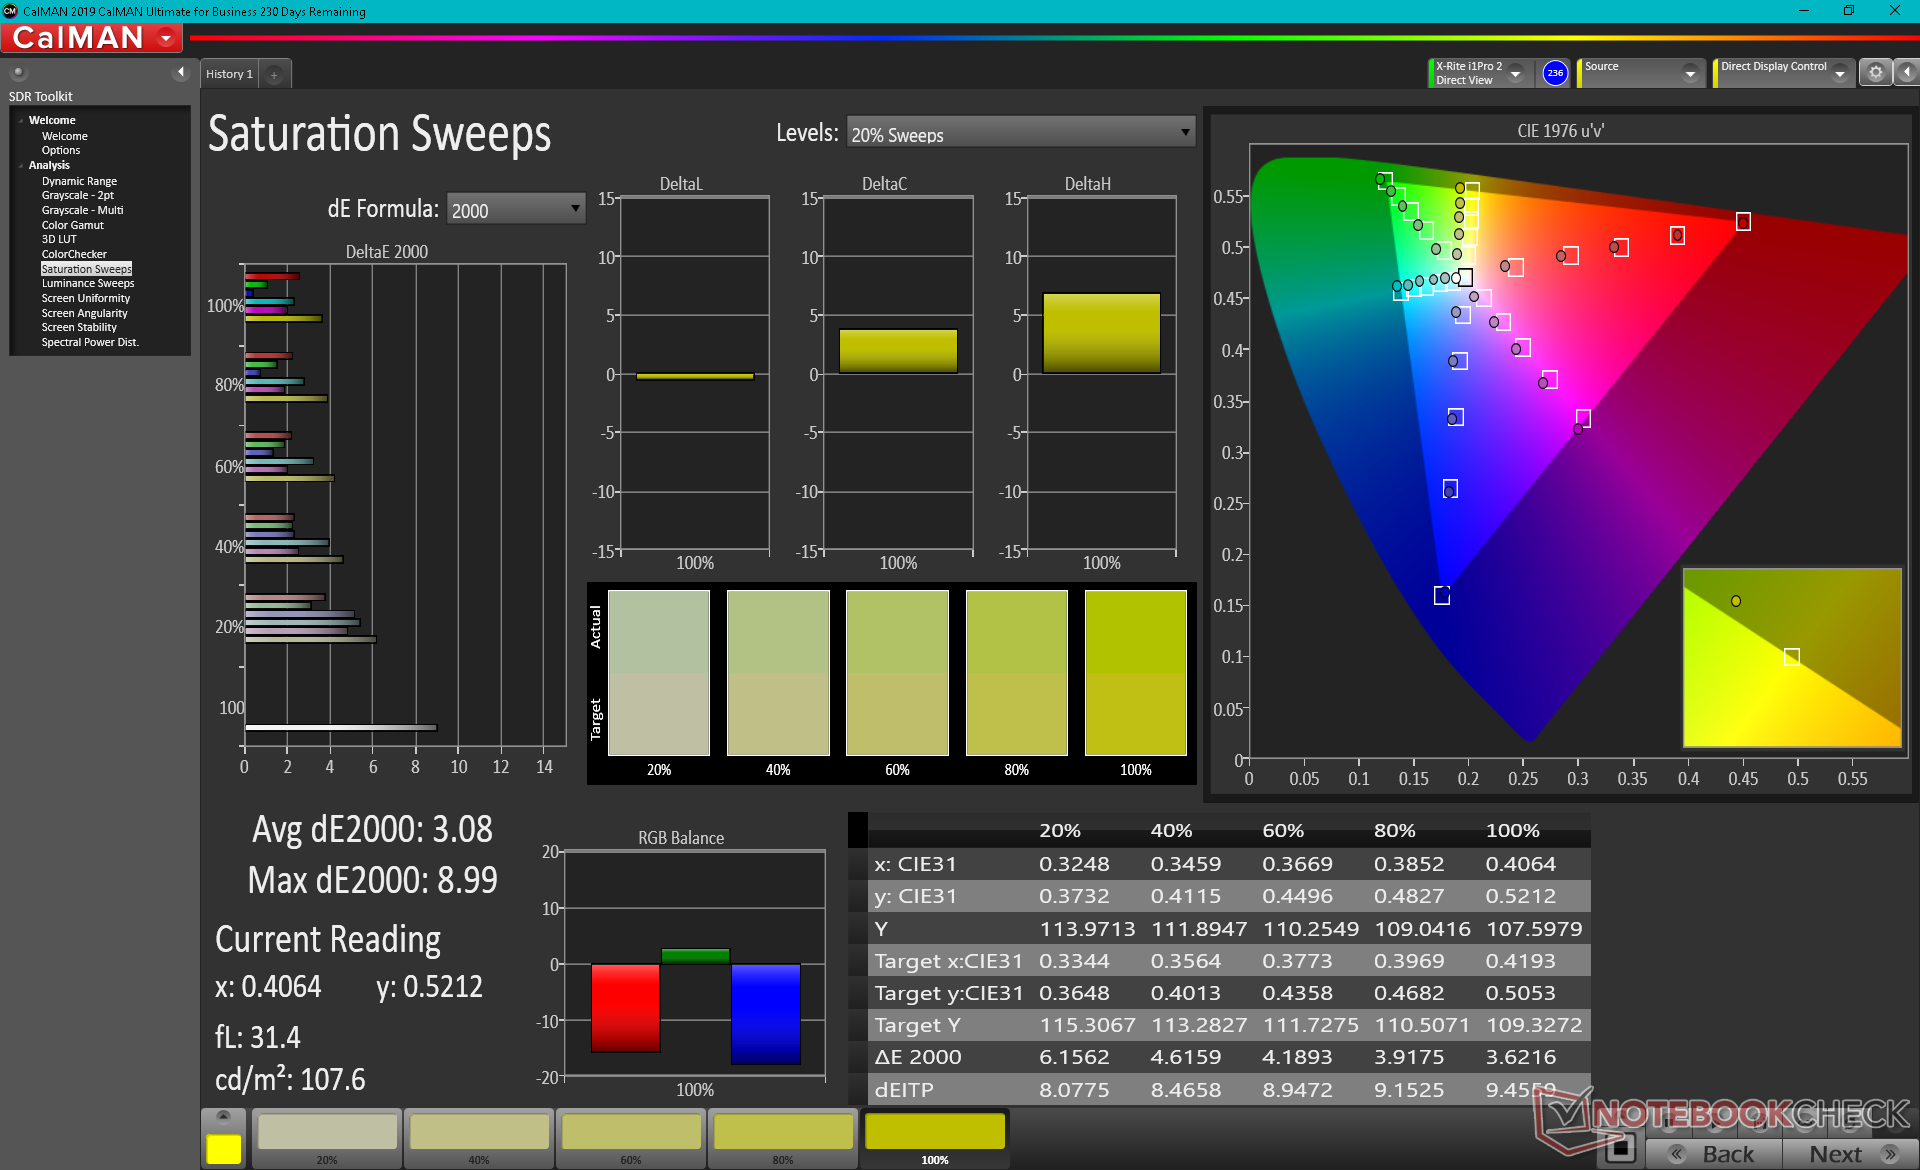
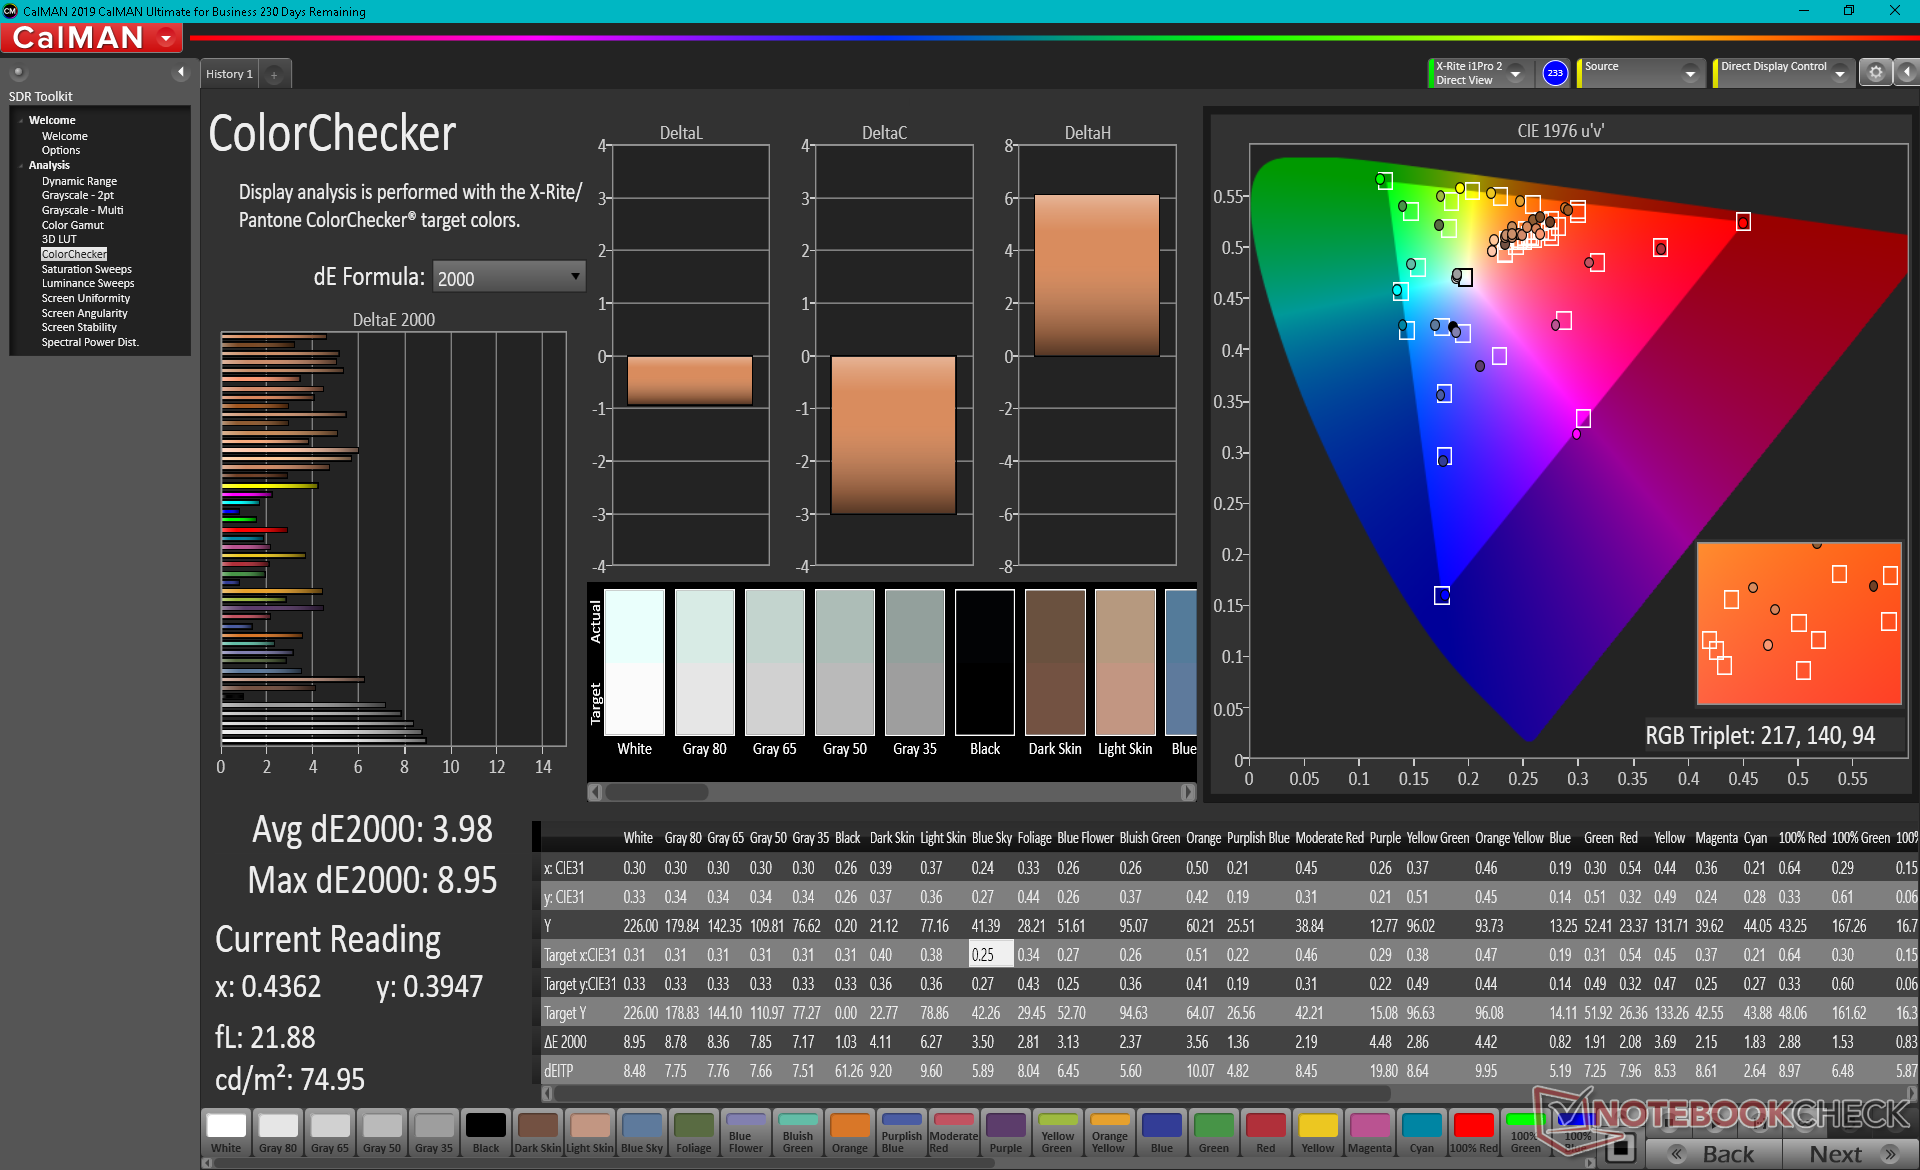
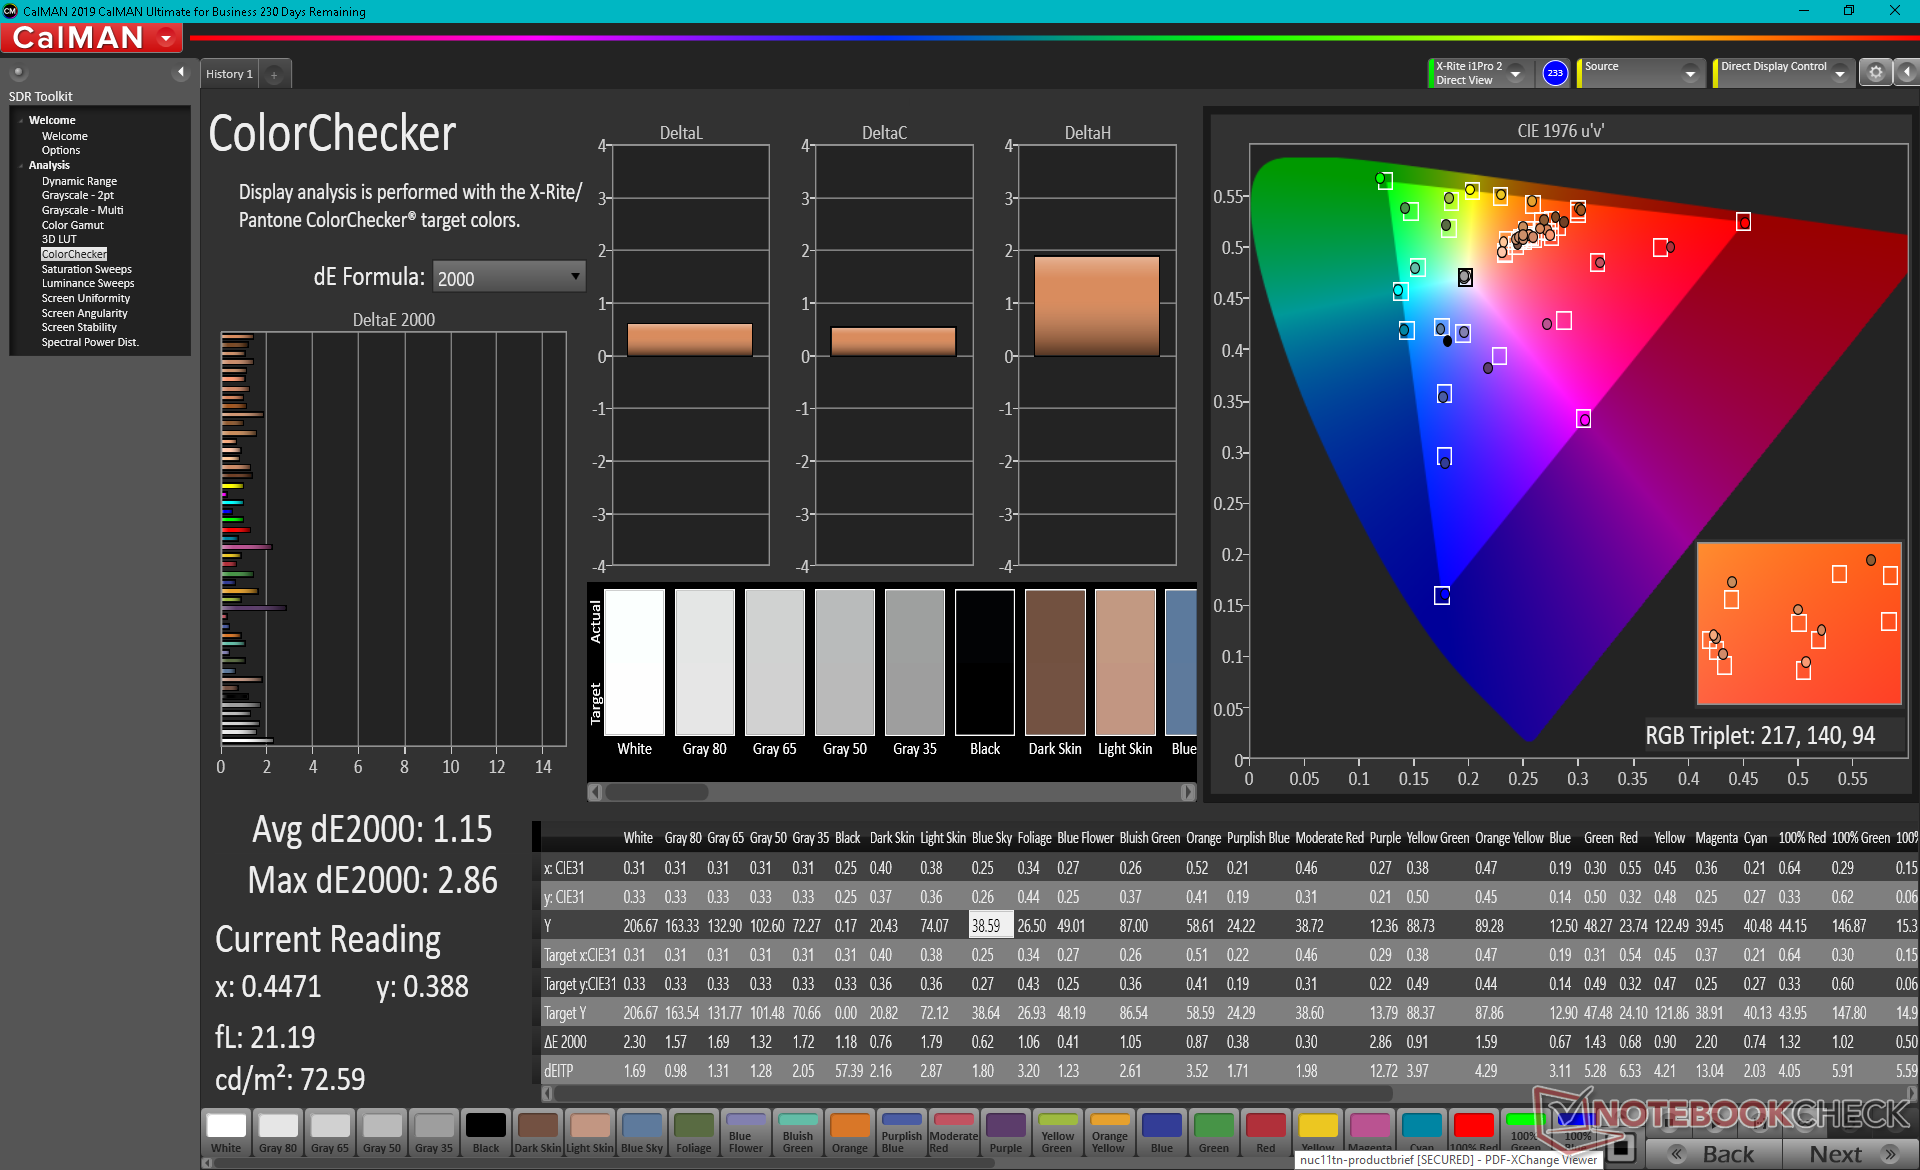
ΔE ColorChecker Calman: 3.98 | ∀{0.5-29.43 Ø4.72}
calibrated: 1.15
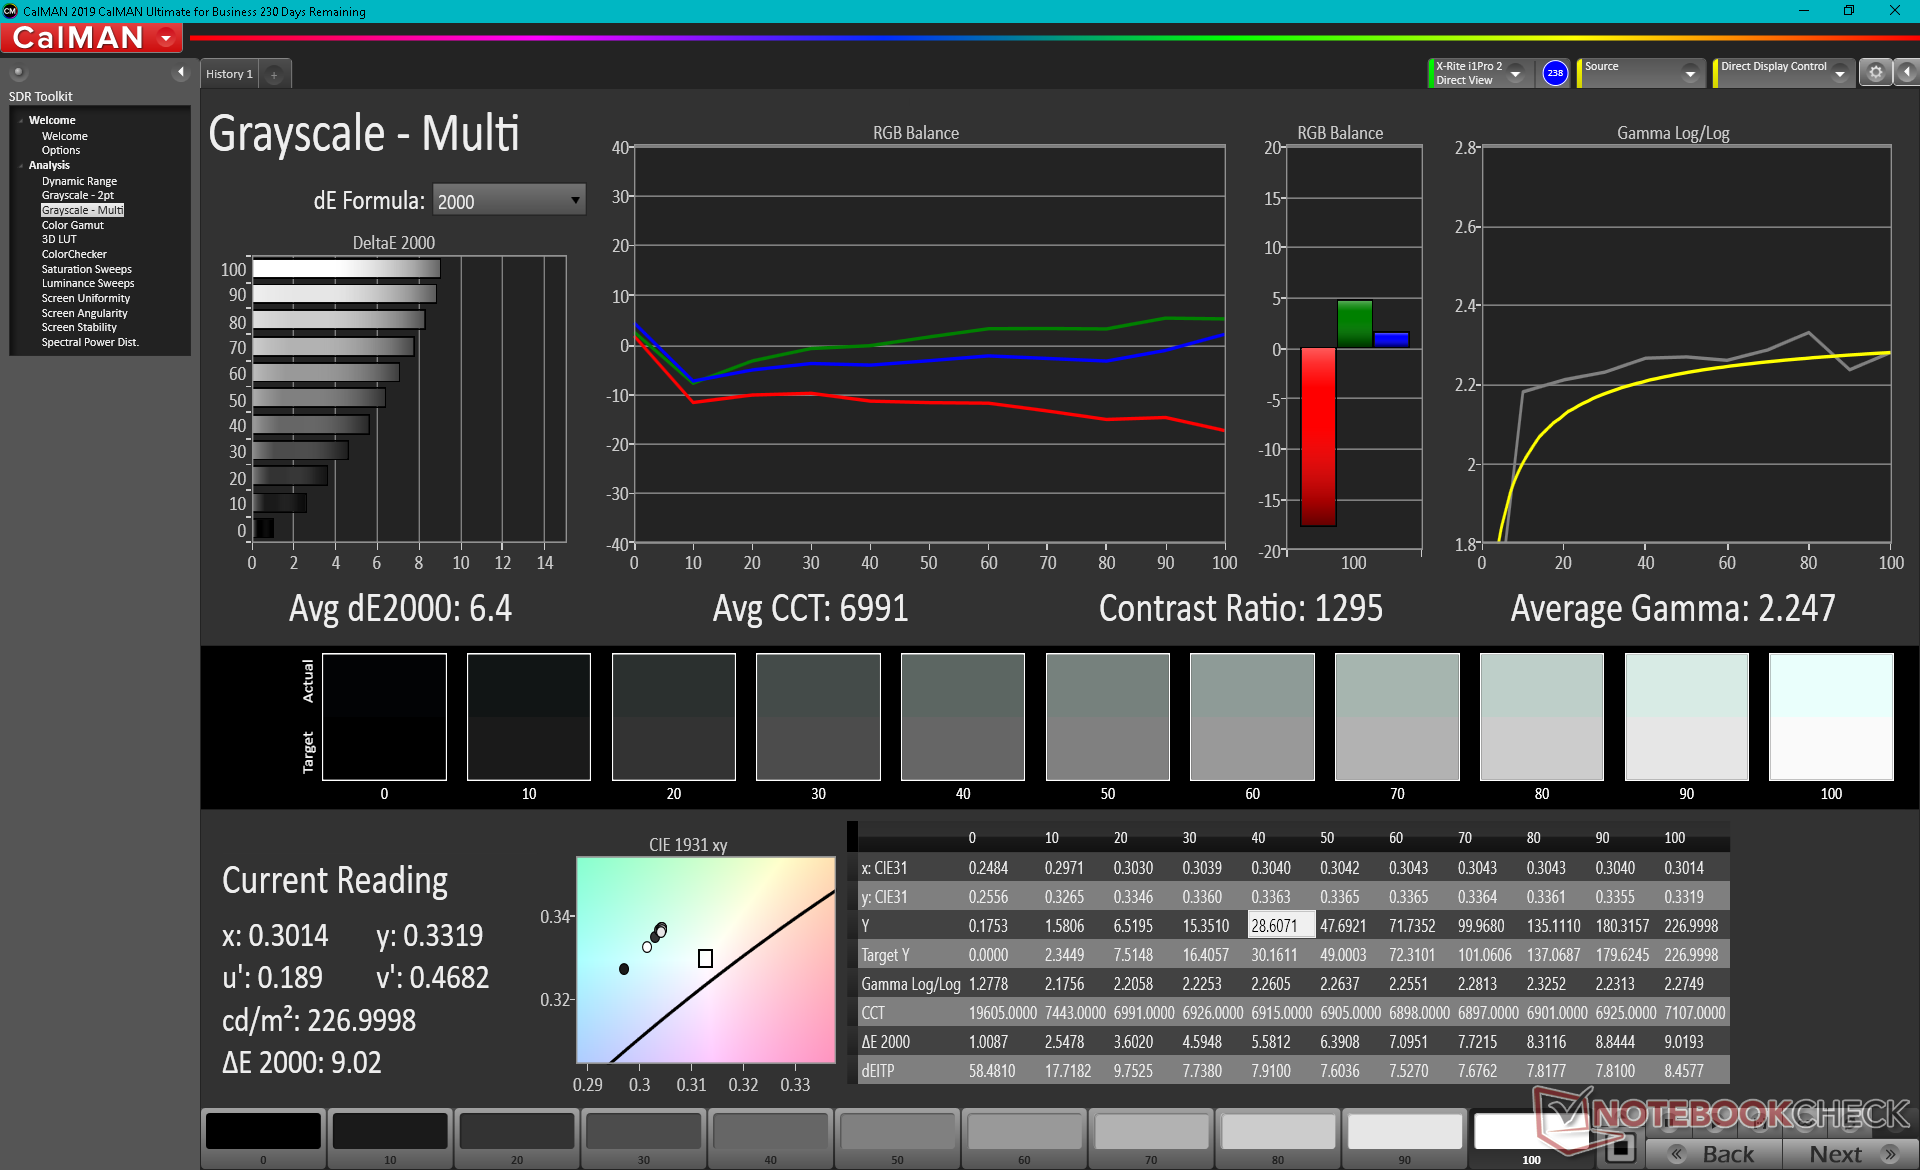
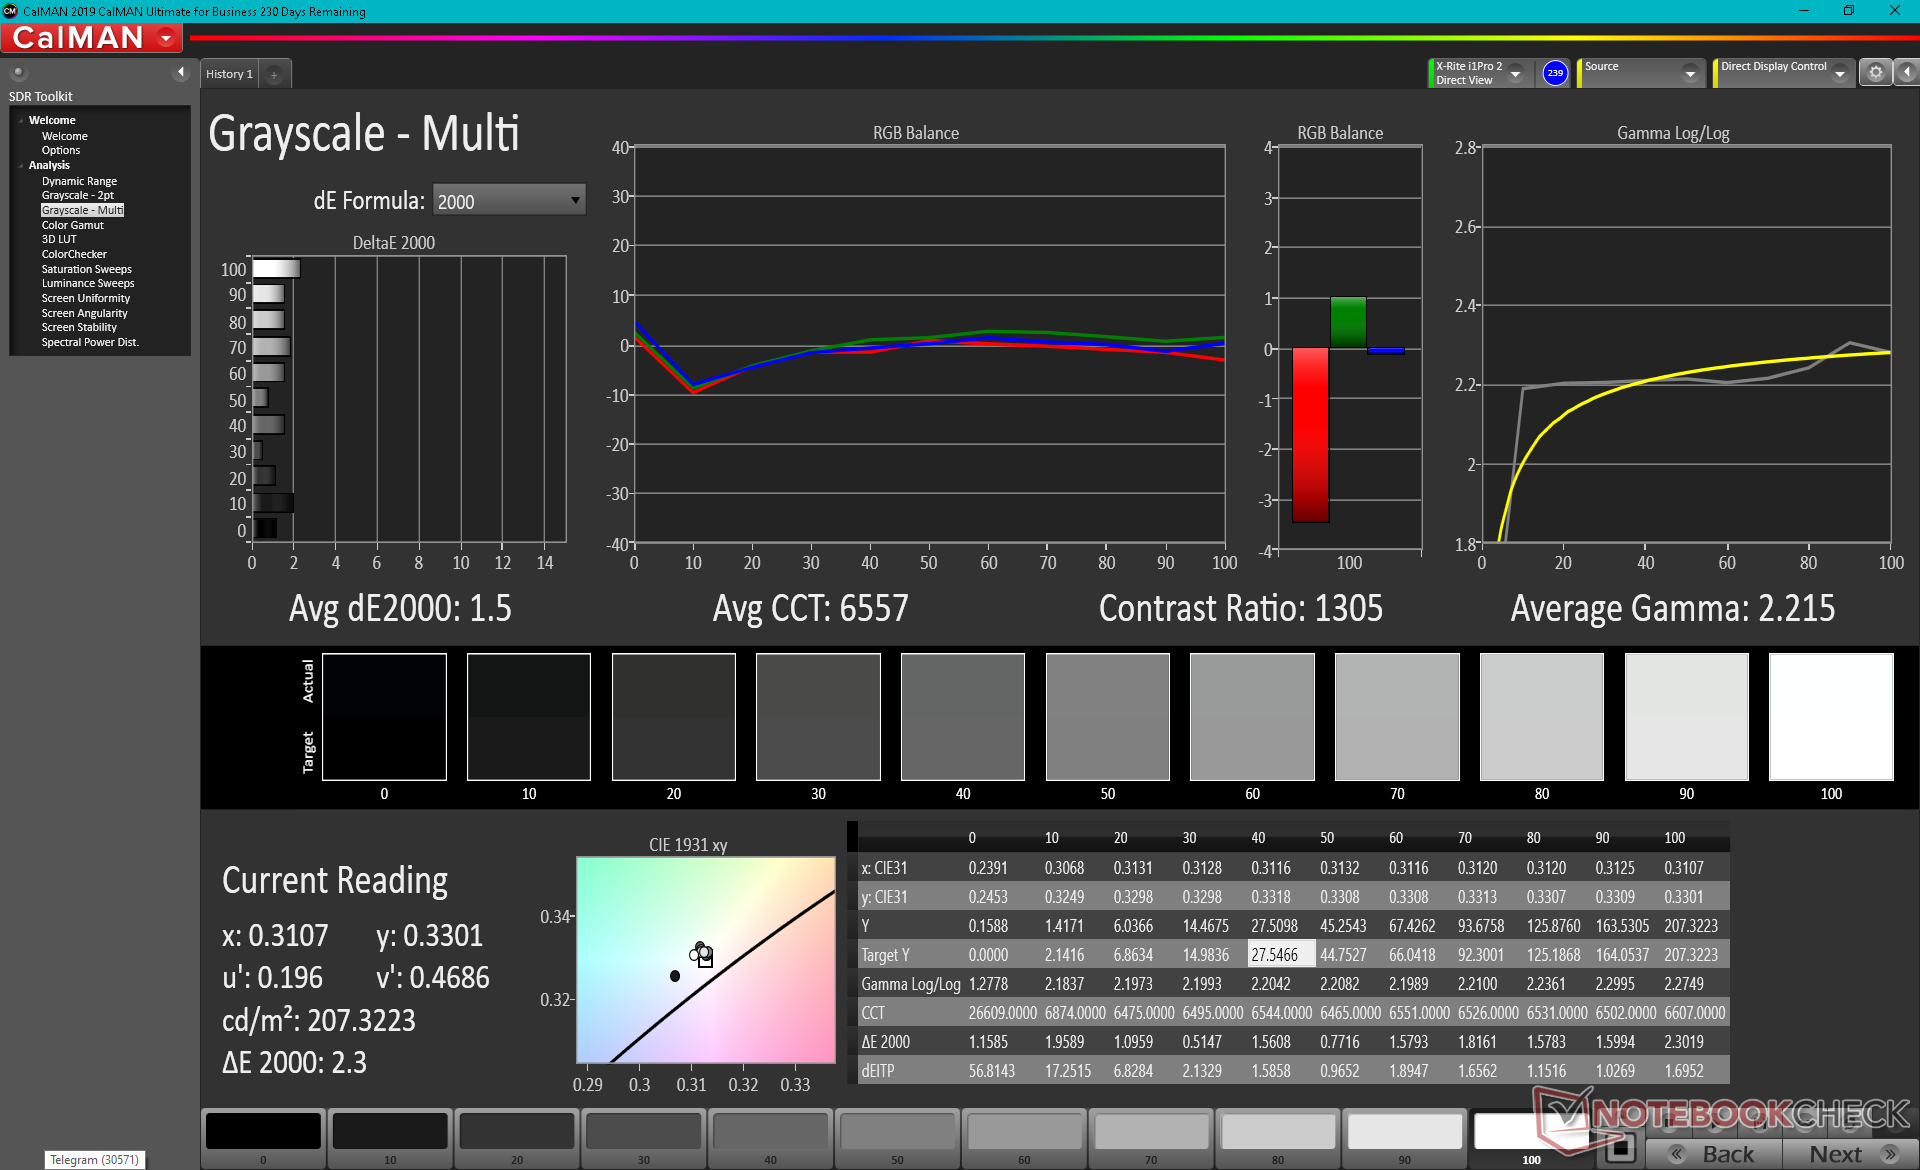
ΔE Greyscale Calman: 6.4 | ∀{0.09-98 Ø4.97}
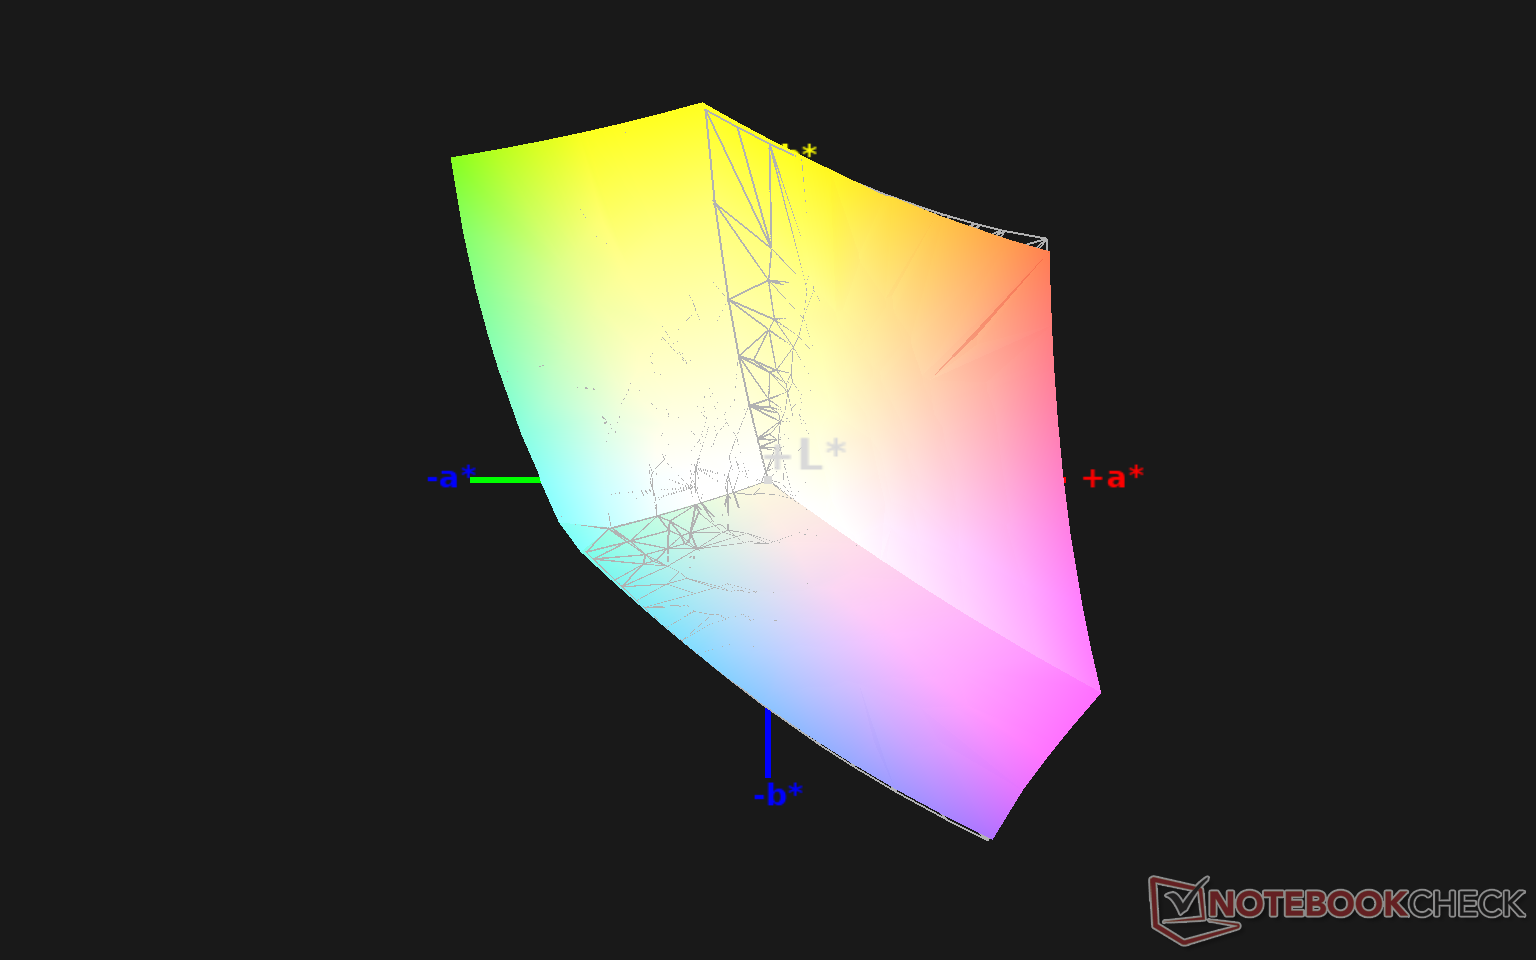
99.3% sRGB (Argyll 1.6.3 3D)
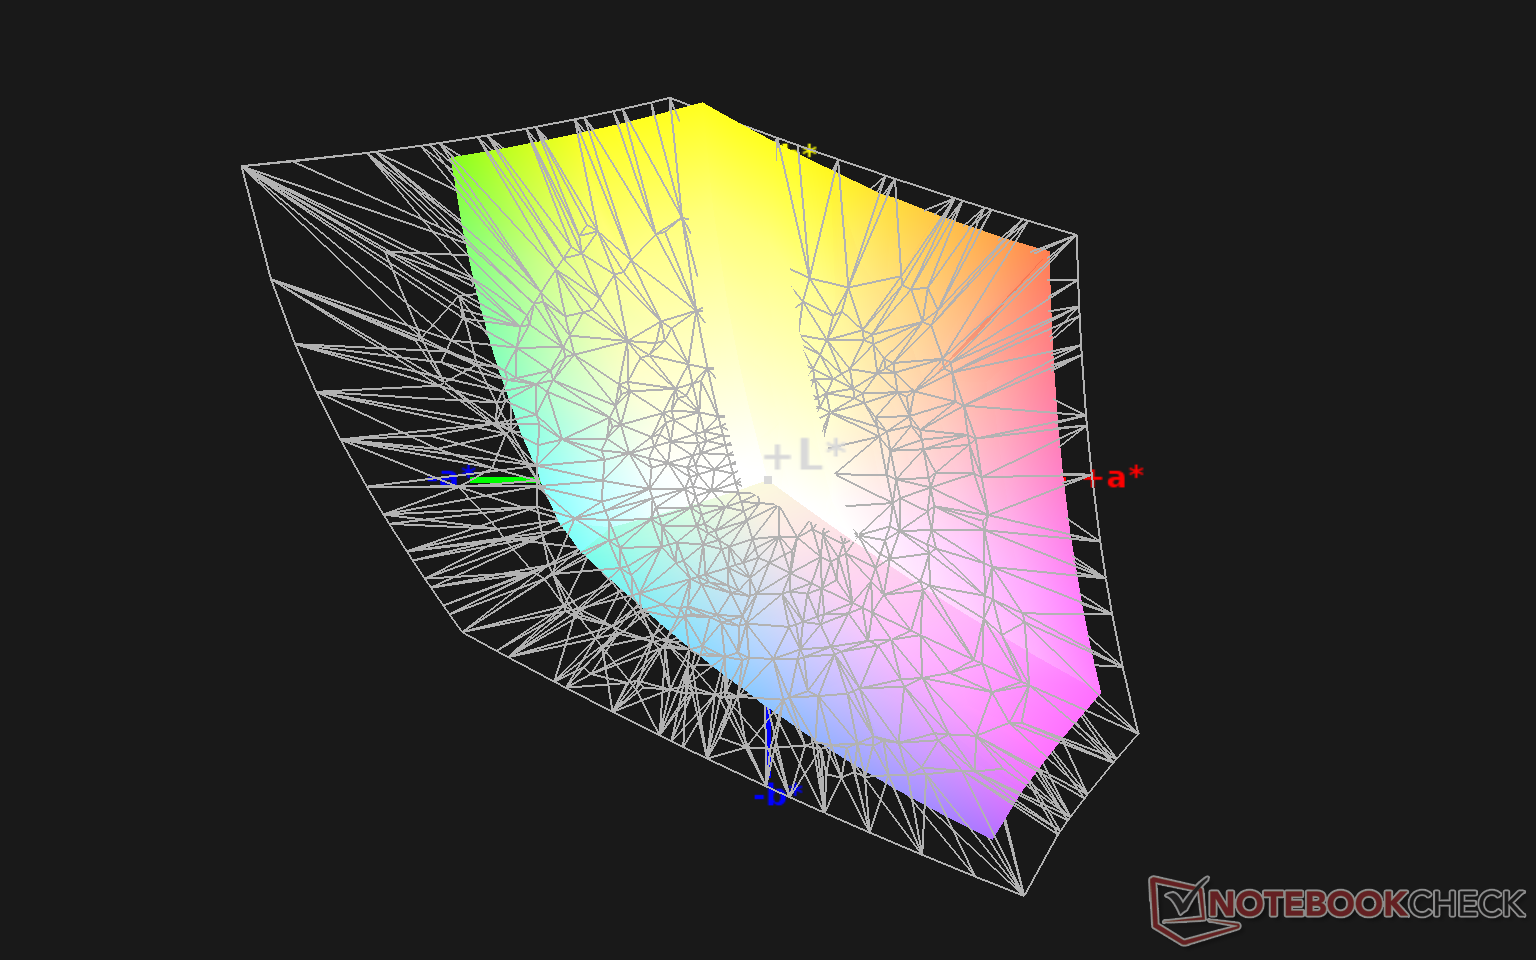
64.5% AdobeRGB 1998 (Argyll 1.6.3 3D)
70.4% AdobeRGB 1998 (Argyll 3D)
99.2% sRGB (Argyll 3D)
68.3% Display P3 (Argyll 3D)
Gamma: 2.25
CCT: 6991 K
| MSI GP66 Leopard 10UG Sharp LQ156M1JW03, IPS, 15.6", 1920x1080 | MSI GP65 10SFK-047US LG Philips LP156WFG-SPB3, IPS, 15.6", 1920x1080 | Alienware m15 R4 LG Philips LGD066E, IPS, 15.6", 1920x1080 | Aorus 15P XC Sharp LQ156M1JW03, IPS, 15.6", 1920x1080 | Asus ROG Zephyrus G15 GA503Q CMN N156KME-GNA (CMN152A), IPS-Level, 15.6", 2560x1440 | MSI GF65 Thin 10UE AU Optronics B156HAN08.4, IPS, 15.6", 1920x1080 | |
|---|---|---|---|---|---|---|
| Display | -7% | 1% | -2% | 22% | -44% | |
| Display P3 Coverage (%) | 68.3 | 63.5 -7% | 69.4 2% | 67.2 -2% | 97.3 42% | 37.65 -45% |
| sRGB Coverage (%) | 99.2 | 94.4 -5% | 99 0% | 98.7 -1% | 99.9 1% | 56.3 -43% |
| AdobeRGB 1998 Coverage (%) | 70.4 | 65.1 -8% | 70.5 0% | 68.6 -3% | 86.2 22% | 38.9 -45% |
| Response Times | -1% | 21% | 9% | 9% | -200% | |
| Response Time Grey 50% / Grey 80% * (ms) | 13.6 ? | 10.4 ? 24% | 7.4 ? 46% | 11.2 ? 18% | 8.8 ? 35% | 36.8 ? -171% |
| Response Time Black / White * (ms) | 9.6 ? | 12 ? -25% | 10 ? -4% | 9.6 ? -0% | 11.2 ? -17% | 31.6 ? -229% |
| PWM Frequency (Hz) | 23580 ? | 24040 ? | ||||
| Screen | -3% | 24% | 27% | 2% | -32% | |
| Brightness middle (cd/m²) | 225.9 | 384.9 70% | 333 47% | 298 32% | 327 45% | 266.5 18% |
| Brightness (cd/m²) | 211 | 358 70% | 303 44% | 278 32% | 309 46% | 262 24% |
| Brightness Distribution (%) | 83 | 87 5% | 86 4% | 88 6% | 89 7% | 91 10% |
| Black Level * (cd/m²) | 0.23 | 0.67 -191% | 0.29 -26% | 0.29 -26% | 0.33 -43% | 0.18 22% |
| Contrast (:1) | 982 | 574 -42% | 1148 17% | 1028 5% | 991 1% | 1481 51% |
| Colorchecker dE 2000 * | 3.98 | 2.43 39% | 1.8 55% | 0.96 76% | 4.49 -13% | 5.33 -34% |
| Colorchecker dE 2000 max. * | 8.95 | 4.58 49% | 4.49 50% | 3.22 64% | 8.42 6% | 18.28 -104% |
| Colorchecker dE 2000 calibrated * | 1.15 | 2.03 -77% | 1.13 2% | 0.83 28% | 2.27 -97% | 4.36 -279% |
| Greyscale dE 2000 * | 6.4 | 2.6 59% | 1.9 70% | 1.3 80% | 4.2 34% | 4.5 30% |
| Gamma | 2.25 98% | 2.2 100% | 2.265 97% | 2.242 98% | 2.173 101% | 2.35 94% |
| CCT | 6991 93% | 6981 93% | 6840 95% | 6519 100% | 7014 93% | 6289 103% |
| Color Space (Percent of AdobeRGB 1998) (%) | 64.5 | 59.7 -7% | 71 10% | 69 7% | 86 33% | 35.6 -45% |
| Color Space (Percent of sRGB) (%) | 99.3 | 93.9 -5% | 93 -6% | 91 -8% | 99 0% | 55.8 -44% |
| Media total (Programa/Opciones) | -4% /
-3% | 15% /
19% | 11% /
19% | 11% /
6% | -92% /
-55% |
* ... más pequeño es mejor
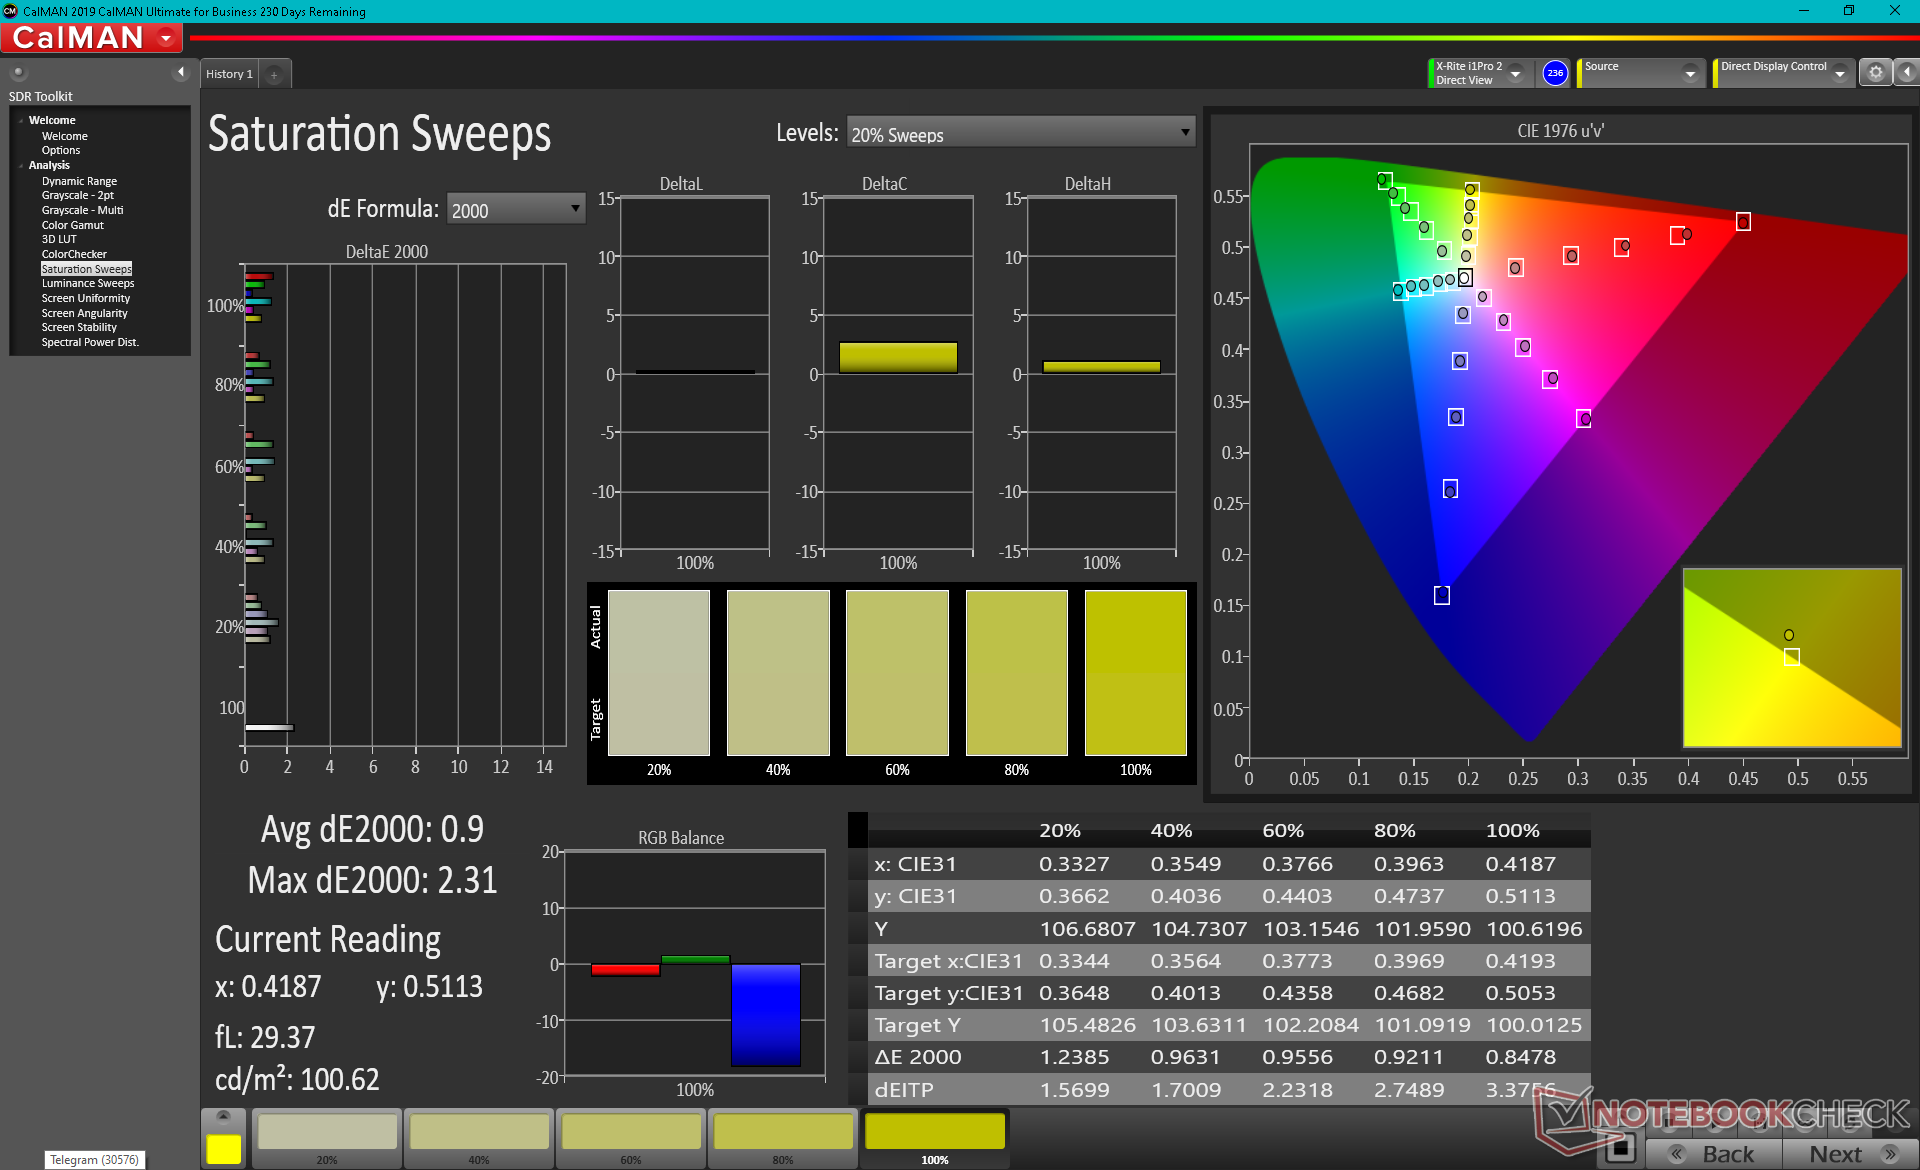
El espacio de color cubre todo el sRGB para ser comparable a la mayoría de portátiles de juego de gama alta. Nos alegramos de que MSI no esté usando uno de esos paneles Panda baratos que suelen tener colores mucho más pobres.
Las mediciones del colorímetro X-Rite muestran una pantalla no calibrada al sacarla de la caja, lo que es de esperar ya que el GP66 no es un portátil de juego calibrado por Pantone. La temperatura del color es demasiado fría y la precisión del color se resiente como resultado. Los colores mejoran significativamente una vez calibrados correctamente con valores finales de escala de grises y color deltaE de sólo 1,5 y 1,15, respectivamente. Recomendamos aplicar nuestro perfil ICM anterior para sacar el máximo partido a la pantalla si no tienes acceso a un colorímetro.
Tiempos de respuesta del display
| ↔ Tiempo de respuesta de Negro a Blanco | ||
|---|---|---|
| 9.6 ms ... subida ↗ y bajada ↘ combinada | ↗ 5.2 ms subida | 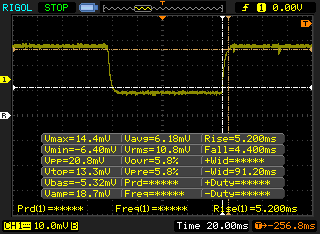 |
| ↘ 4.4 ms bajada | ||
| La pantalla mostró tiempos de respuesta rápidos en nuestros tests y debería ser adecuada para juegos. En comparación, todos los dispositivos de prueba van de ##min### (mínimo) a 240 (máximo) ms. » 26 % de todos los dispositivos son mejores. Esto quiere decir que el tiempo de respuesta medido es mejor que la media (19.8 ms) de todos los dispositivos testados. | ||
| ↔ Tiempo de respuesta 50% Gris a 80% Gris | ||
| 13.6 ms ... subida ↗ y bajada ↘ combinada | ↗ 7.6 ms subida | 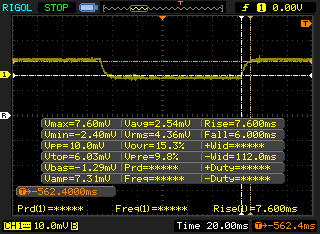 |
| ↘ 6 ms bajada | ||
| La pantalla mostró buenos tiempos de respuesta en nuestros tests pero podría ser demasiado lenta para los jugones competitivos. En comparación, todos los dispositivos de prueba van de ##min### (mínimo) a 636 (máximo) ms. » 27 % de todos los dispositivos son mejores. Esto quiere decir que el tiempo de respuesta medido es mejor que la media (31 ms) de todos los dispositivos testados. | ||
Parpadeo de Pantalla / PWM (Pulse-Width Modulation)
| Parpadeo de Pantalla / PWM detectado | 23580 Hz | ≤ 34 % de brillo | 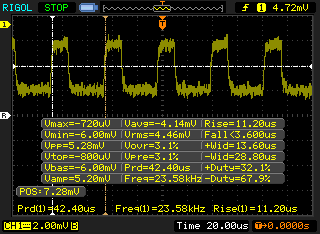 |
La retroiluminación del display parpadea a 23580 Hz (seguramente usa PWM - Pulse-Width Modulation) a un brillo del 34 % e inferior. Sobre este nivel de brillo no debería darse parpadeo / PWM. La frecuencia de 23580 Hz es bastante alta, por lo que la mayoría de gente sensible al parpadeo no debería ver parpadeo o tener fatiga visual. Comparación: 52 % de todos los dispositivos testados no usaron PWM para atenuar el display. Si se usó, medimos una media de 7765 (mínimo: 5 - máxmo: 343500) Hz. | |||
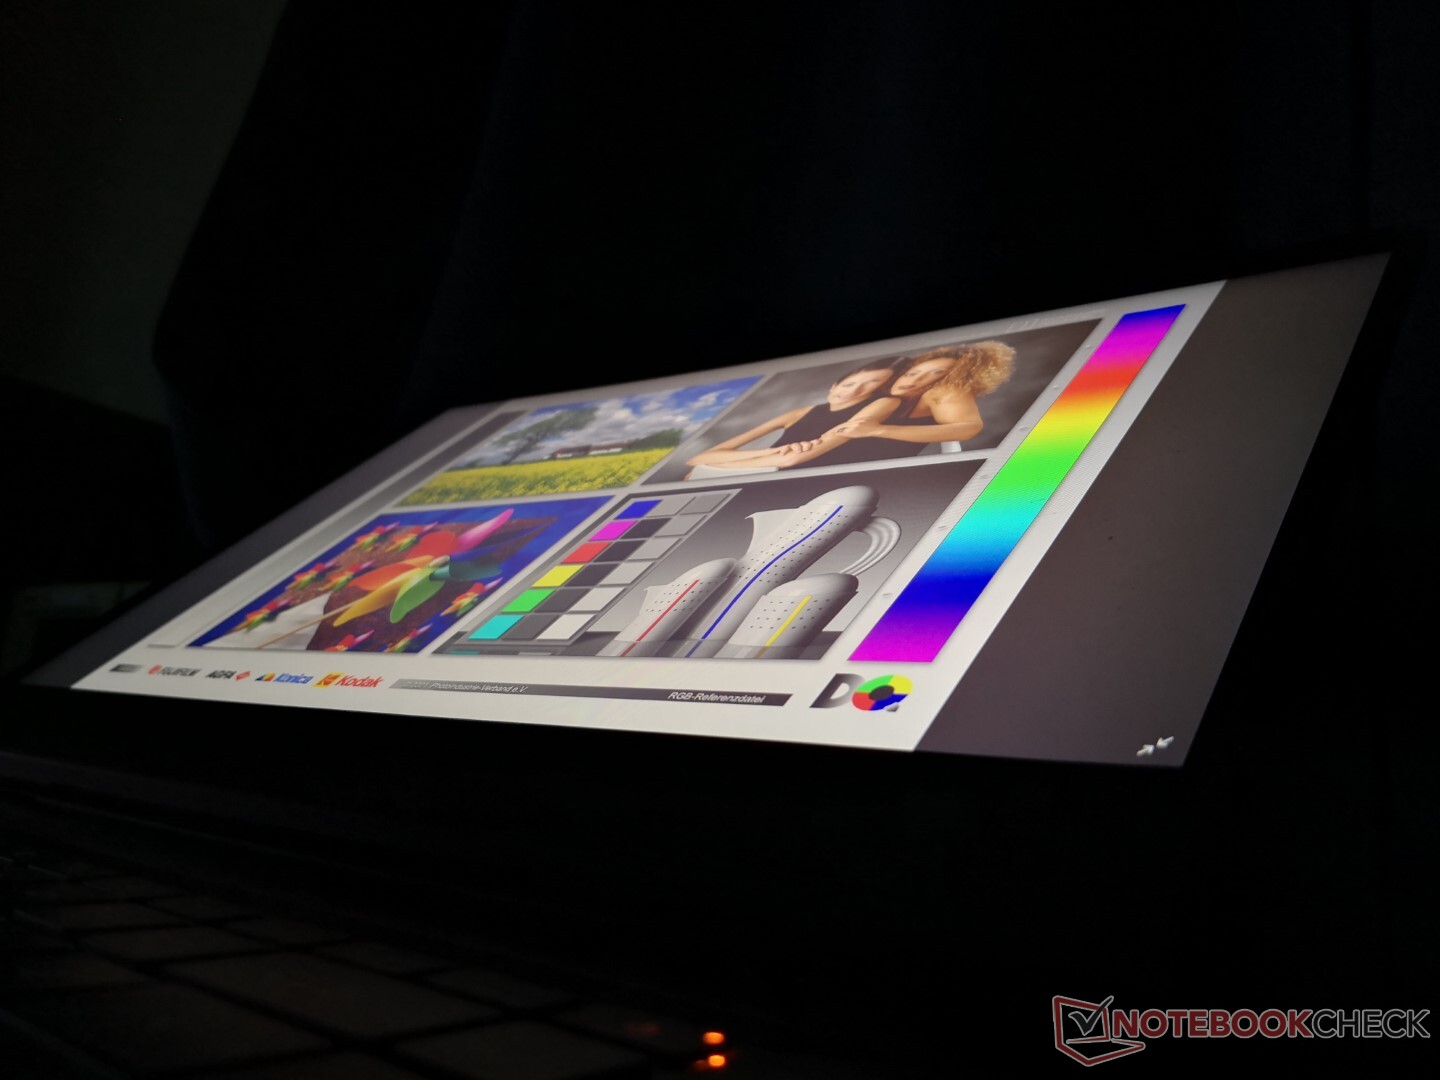
La visibilidad en exteriores es escasa, ya que la pantalla no es muy brillante. El resplandor es notable en la mayoría de las condiciones e incluso si se pudiera reducir, el contenido en pantalla aparecerá lavado de todos modos.
Rendimiento
MSI sólo ofrece las opciones Core i7-10870H y Core i7-10875H de 10ª generación en este momento, sin nada más. Sin embargo, habríamos estado bien con sólo una de esas opciones, ya que cualquier diferencia entre el i7-10870H y el i7-10875H es increíblemente menor. Los usuarios tendrán que buscar el más barato Bravo o Alpha para las opciones AMD.
Las gráficas van desde la GeForce RTX 3060 hasta la 3080 a 130 W TGP cada una. El cambio de gráficos, tanto automático como manual, está disponible a través del software Dragon Center. Recomendamos a los propietarios que se familiaricen con el Dragon Center, ya que las funciones clave se cambian aquí.
Hemos configurado nuestra unidad en modo de rendimiento extremo con la GPU Nvidia activa antes de ejecutar los benchmarks de rendimiento que aparecen a continuación.
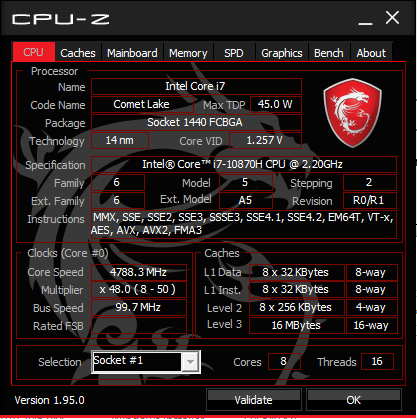
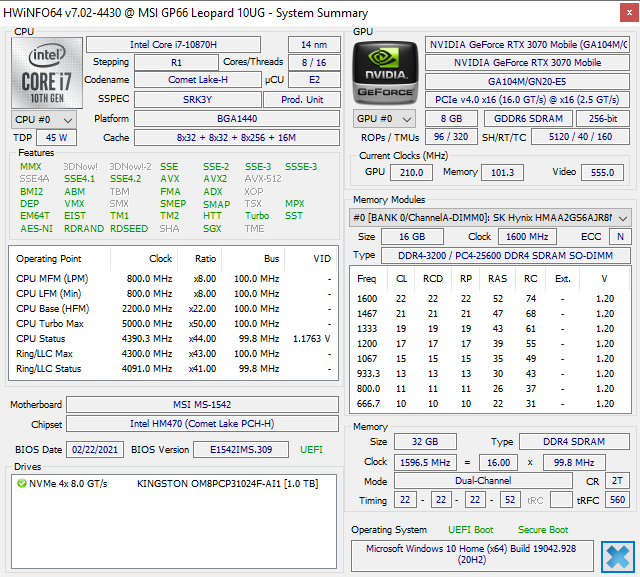
Procesador
El rendimiento de la CPU es excelente, con una decente sostenibilidad de Turbo Boost, como muestran los resultados de nuestro bucle CineBench R15 xT que aparecen a continuación. El rendimiento es incluso tan rápido como el más caro Core i9-10980HK en el Alienware m15 R4. Las diferencias entre el Core i7-10875H y Core i7-10870H son de apenas un par de puntos porcentuales.
Cinebench R15: CPU Multi 64Bit | CPU Single 64Bit
Blender: v2.79 BMW27 CPU
7-Zip 18.03: 7z b 4 -mmt1 | 7z b 4
Geekbench 5.5: Single-Core | Multi-Core
HWBOT x265 Benchmark v2.2: 4k Preset
LibreOffice : 20 Documents To PDF
R Benchmark 2.5: Overall mean
| LibreOffice / 20 Documents To PDF | |
| HP Pavilion Gaming 15-ec1206ng | |
| Schenker XMG Core 15 Ampere | |
| Medio Intel Core i7-10870H (46 - 64.4, n=12) | |
| Alienware m15 R4 | |
| MSI GP66 Leopard 10UG | |
| Razer Blade 15 Base Edition 2021, i7-10750H RTX 3060 | |
| Asus Zephyrus S15 GX502L | |
| MSI GT76 Titan DT 10SGS | |
| Asus ROG Zephyrus Duo 15 SE GX551QS | |
* ... más pequeño es mejor
Rendimiento del sistema
Los resultados de PCMark están donde esperamos que estén en relación con otros portátiles con la misma CPU y GPU. Las puntuaciones son sistemáticamente superiores a las del GP65 excepto en el benchmark Essentials, probablemente debido al SSD NVMe más lento de nuestra unidad de prueba GP66.
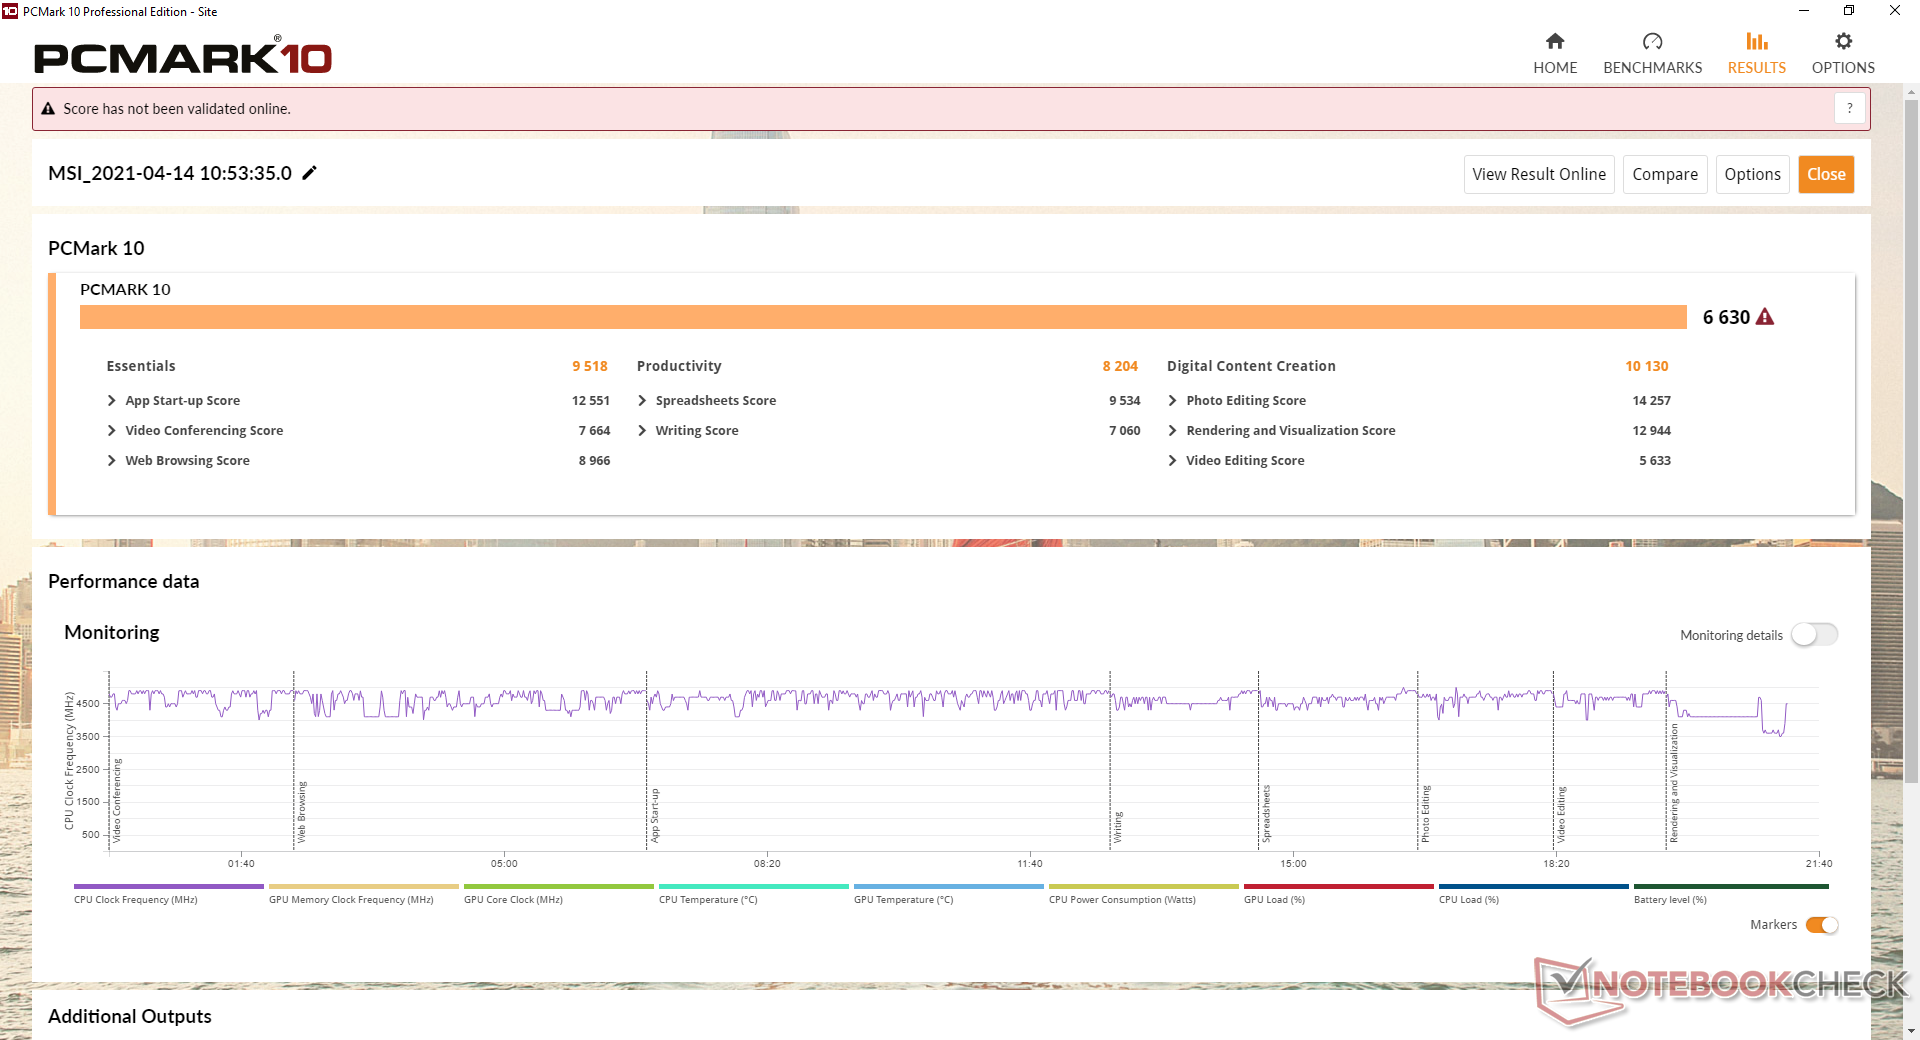
| PCMark 10 Score | 6630 puntos | |
ayuda | ||
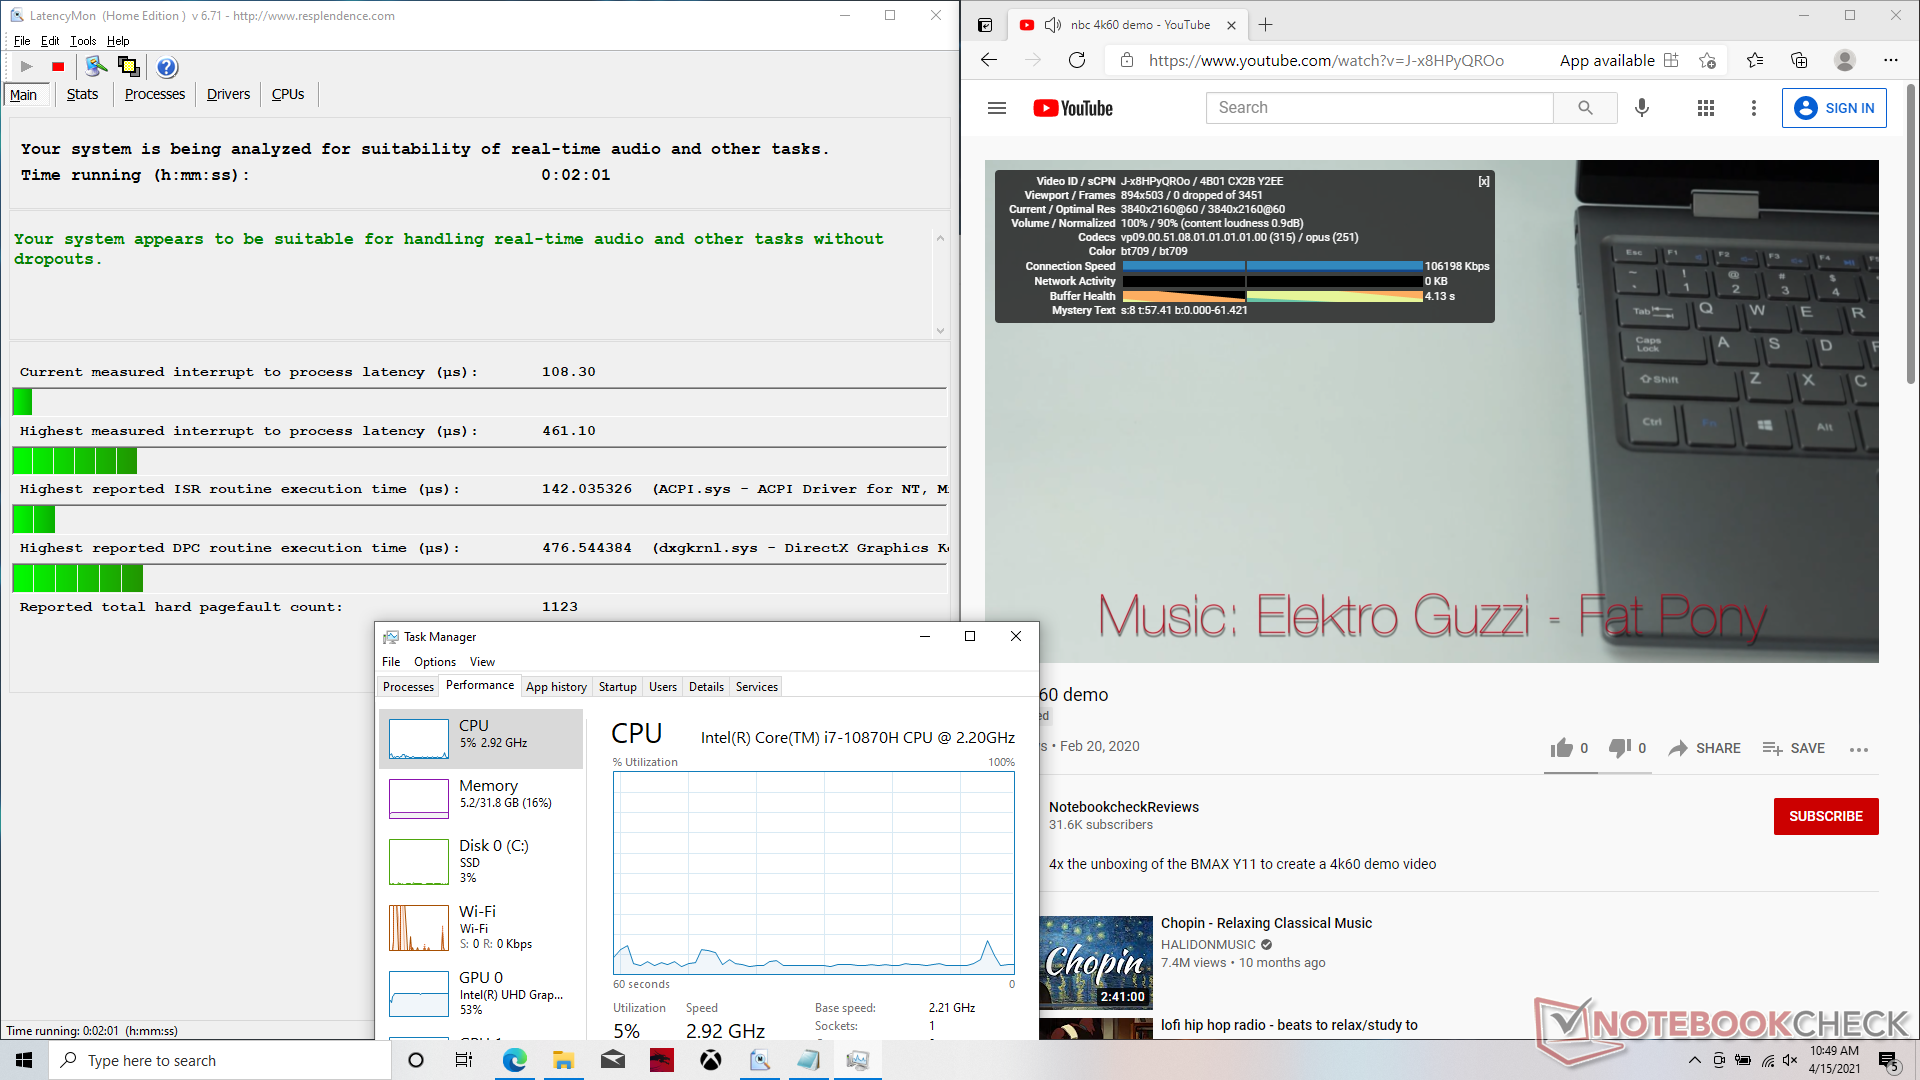
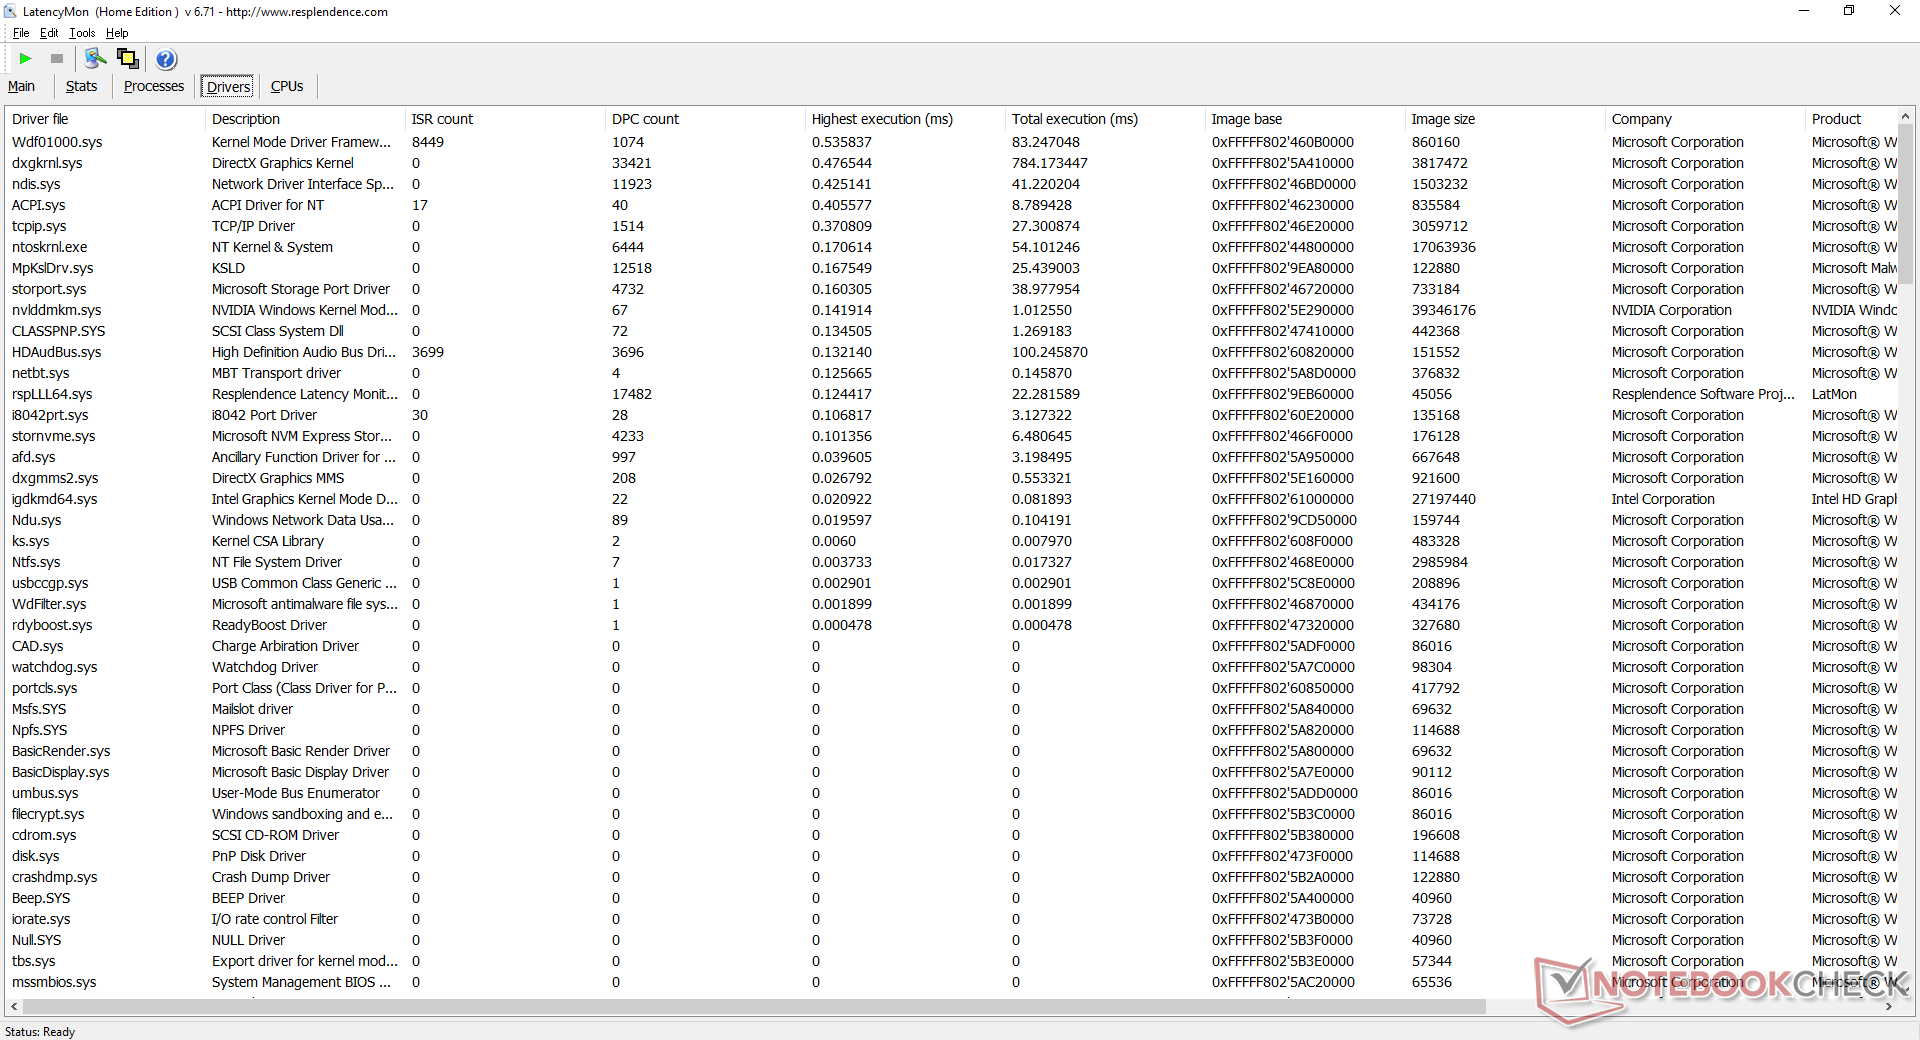
Latencia del CPD
LatencyMon no muestra problemas de latencia del CPD al abrir varias pestañas del navegador en nuestra página web. La reproducción de vídeo 4K a 60 FPS es fluida y sin caídas de frames, como cabe esperar de cualquier portátil de juegos.
| DPC Latencies / LatencyMon - interrupt to process latency (max), Web, Youtube, Prime95 | |
| Alienware m15 R4 | |
| Aorus 15P XC | |
| MSI GP65 10SFK-047US | |
| MSI GF65 Thin 10UE | |
| MSI GP66 Leopard 10UG | |
| Asus ROG Zephyrus G15 GA503Q | |
* ... más pequeño es mejor
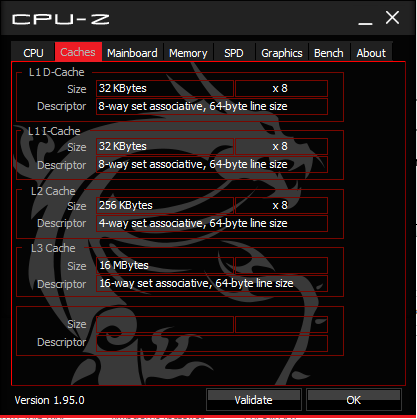
Dispositivos de almacenamiento
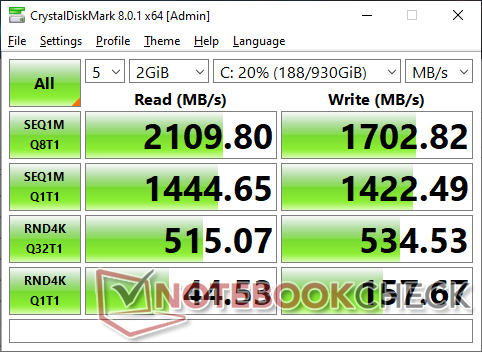
Mientras que el GP65 podía soportar hasta tres unidades internas (2x M.2, 1x 2.5-inch SATA III), el GP66 puede soportar hasta 2x unidades M.2 solamente. El Kingston OM8PCP31024F de 1 TB de nuestra unidad es una unidad NVMe de gama media que es más lenta que el Samsung PM981 y el Micron 2300
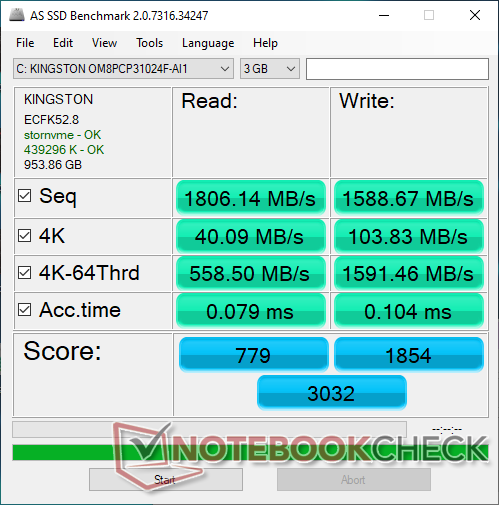
| MSI GP66 Leopard 10UG Kingston OM8PCP31024F | MSI GP65 10SFK-047US Samsung SSD PM981 MZVLB1T0HALR | Alienware m15 R4 Micron 2300 1TB MTFDHBA1T0TDV | Aorus 15P XC ESR512GTLCG-EAC-4 | Asus ROG Zephyrus G15 GA503Q SK Hynix HFM001TD3JX013N | MSI GF65 Thin 10UE Samsung SSD PM981 MZVLB1T0HALR | |
|---|---|---|---|---|---|---|
| AS SSD | 50% | 38% | 45% | 58% | 50% | |
| Seq Read (MB/s) | 1806 | 2066 14% | 2658 47% | 2694 49% | 2950 63% | 3002 66% |
| Seq Write (MB/s) | 1589 | 2418 52% | 2769 74% | 2327 46% | 1600 1% | 2420 52% |
| 4K Read (MB/s) | 40.09 | 54.2 35% | 46.07 15% | 47.77 19% | 53.6 34% | 48.46 21% |
| 4K Write (MB/s) | 103.8 | 129 24% | 87.2 -16% | 98.8 -5% | 126.8 22% | 114.3 10% |
| 4K-64 Read (MB/s) | 559 | 1865 234% | 1372 145% | 1746 212% | 1429 156% | 1873 235% |
| 4K-64 Write (MB/s) | 1591 | 1878 18% | 1247 -22% | 2267 42% | 2177 37% | 1882 18% |
| Access Time Read * (ms) | 0.079 | 0.042 47% | 0.052 34% | 0.079 -0% | 0.064 19% | 0.045 43% |
| Access Time Write * (ms) | 0.104 | 0.091 12% | 0.098 6% | 0.039 62% | 0.029 72% | 0.101 3% |
| Score Read (Points) | 779 | 2126 173% | 1684 116% | 2063 165% | 1778 128% | 2221 185% |
| Score Write (Points) | 1854 | 2249 21% | 1611 -13% | 2598 40% | 2464 33% | 2238 21% |
| Score Total (Points) | 3032 | 5482 81% | 4166 37% | 5698 88% | 5090 68% | 5565 84% |
| Copy ISO MB/s (MB/s) | 2674 | 2927 9% | 1877 -30% | 2421 -9% | ||
| Copy Program MB/s (MB/s) | 895 | 728 -19% | 555 -38% | 705 -21% | ||
| Copy Game MB/s (MB/s) | 1596 | 1614 1% | 1201 -25% | 1490 -7% | ||
| CrystalDiskMark 5.2 / 6 | 31% | 41% | 28% | 42% | 30% | |
| Write 4K (MB/s) | 153.2 | 145 -5% | 93.7 -39% | 130.2 -15% | 156.4 2% | 157.3 3% |
| Read 4K (MB/s) | 43.98 | 46.84 7% | 48.1 9% | 45.47 3% | 66.7 52% | 46.69 6% |
| Write Seq (MB/s) | 1527 | 2377 56% | 2785 82% | 2269 49% | 2318 52% | 2389 56% |
| Read Seq (MB/s) | 1112 | 2185 96% | 2598 134% | 1643 48% | 2151 93% | 2196 97% |
| Write 4K Q32T1 (MB/s) | 520 | 463.5 -11% | 481.9 -7% | 547 5% | 525 1% | 407.6 -22% |
| Read 4K Q32T1 (MB/s) | 516 | 527 2% | 521 1% | 654 27% | 452.1 -12% | 519 1% |
| Write Seq Q32T1 (MB/s) | 1697 | 2395 41% | 3362 98% | 2512 48% | 3055 80% | 2401 41% |
| Read Seq Q32T1 (MB/s) | 2110 | 3470 64% | 3200 52% | 3382 60% | 3607 71% | 3344 58% |
| Media total (Programa/Opciones) | 41% /
43% | 40% /
40% | 37% /
39% | 50% /
51% | 40% /
43% |
* ... más pequeño es mejor

Disk Throttling: DiskSpd Read Loop, Queue Depth 8
Rendimiento de la GPU
El rendimiento gráfico en bruto es sólo entre un 6 y un 9 por ciento más lento que la GeForce RTX 3080 de 130 W del Asus Zephyrus Duo 15 SE según las pruebas de referencia 3DMark. Los usuarios que se actualicen desde una antigua RTX 2070 verán ganancias notables de hasta un 35 o 40 por ciento. No obstante, un PC de sobremesa con una GeForce RTX 3070 "adecuada" es un 20% más rápido sigue siendo un 20 por ciento más rápido que nuestra Versión móvil de la RTX 3070.
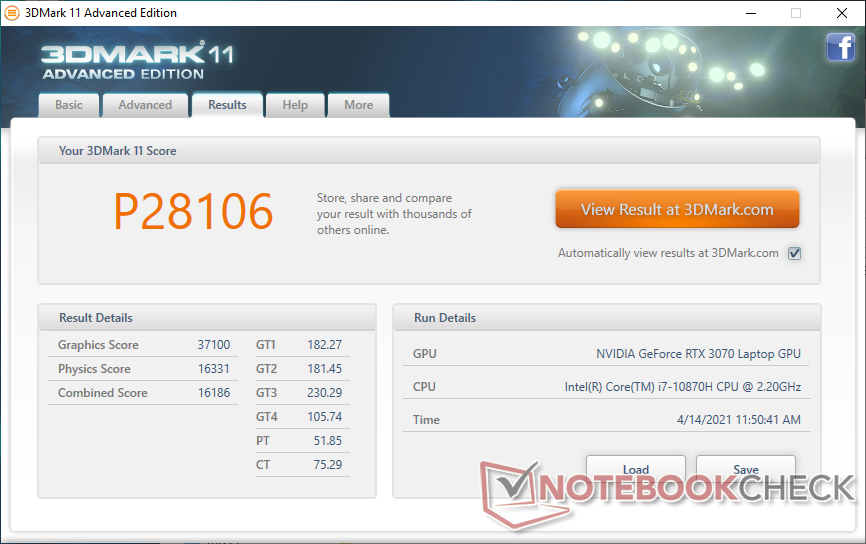
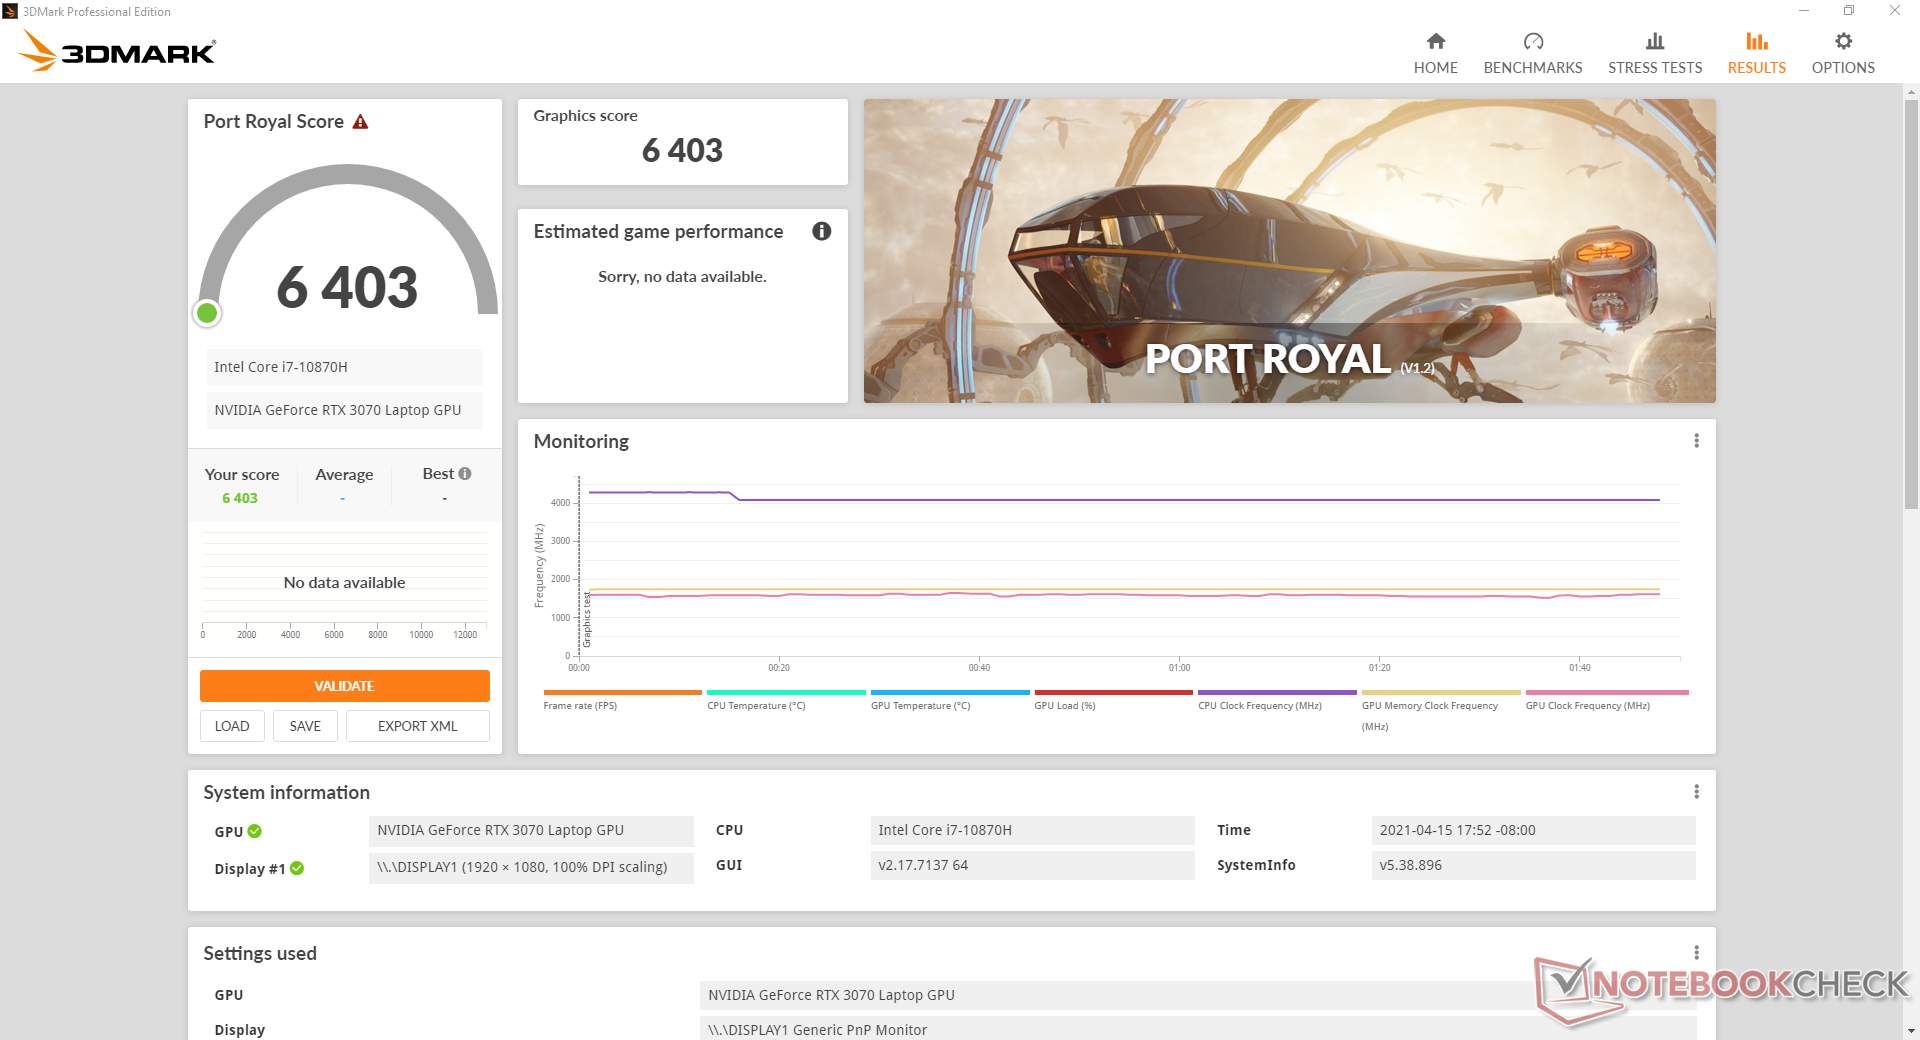
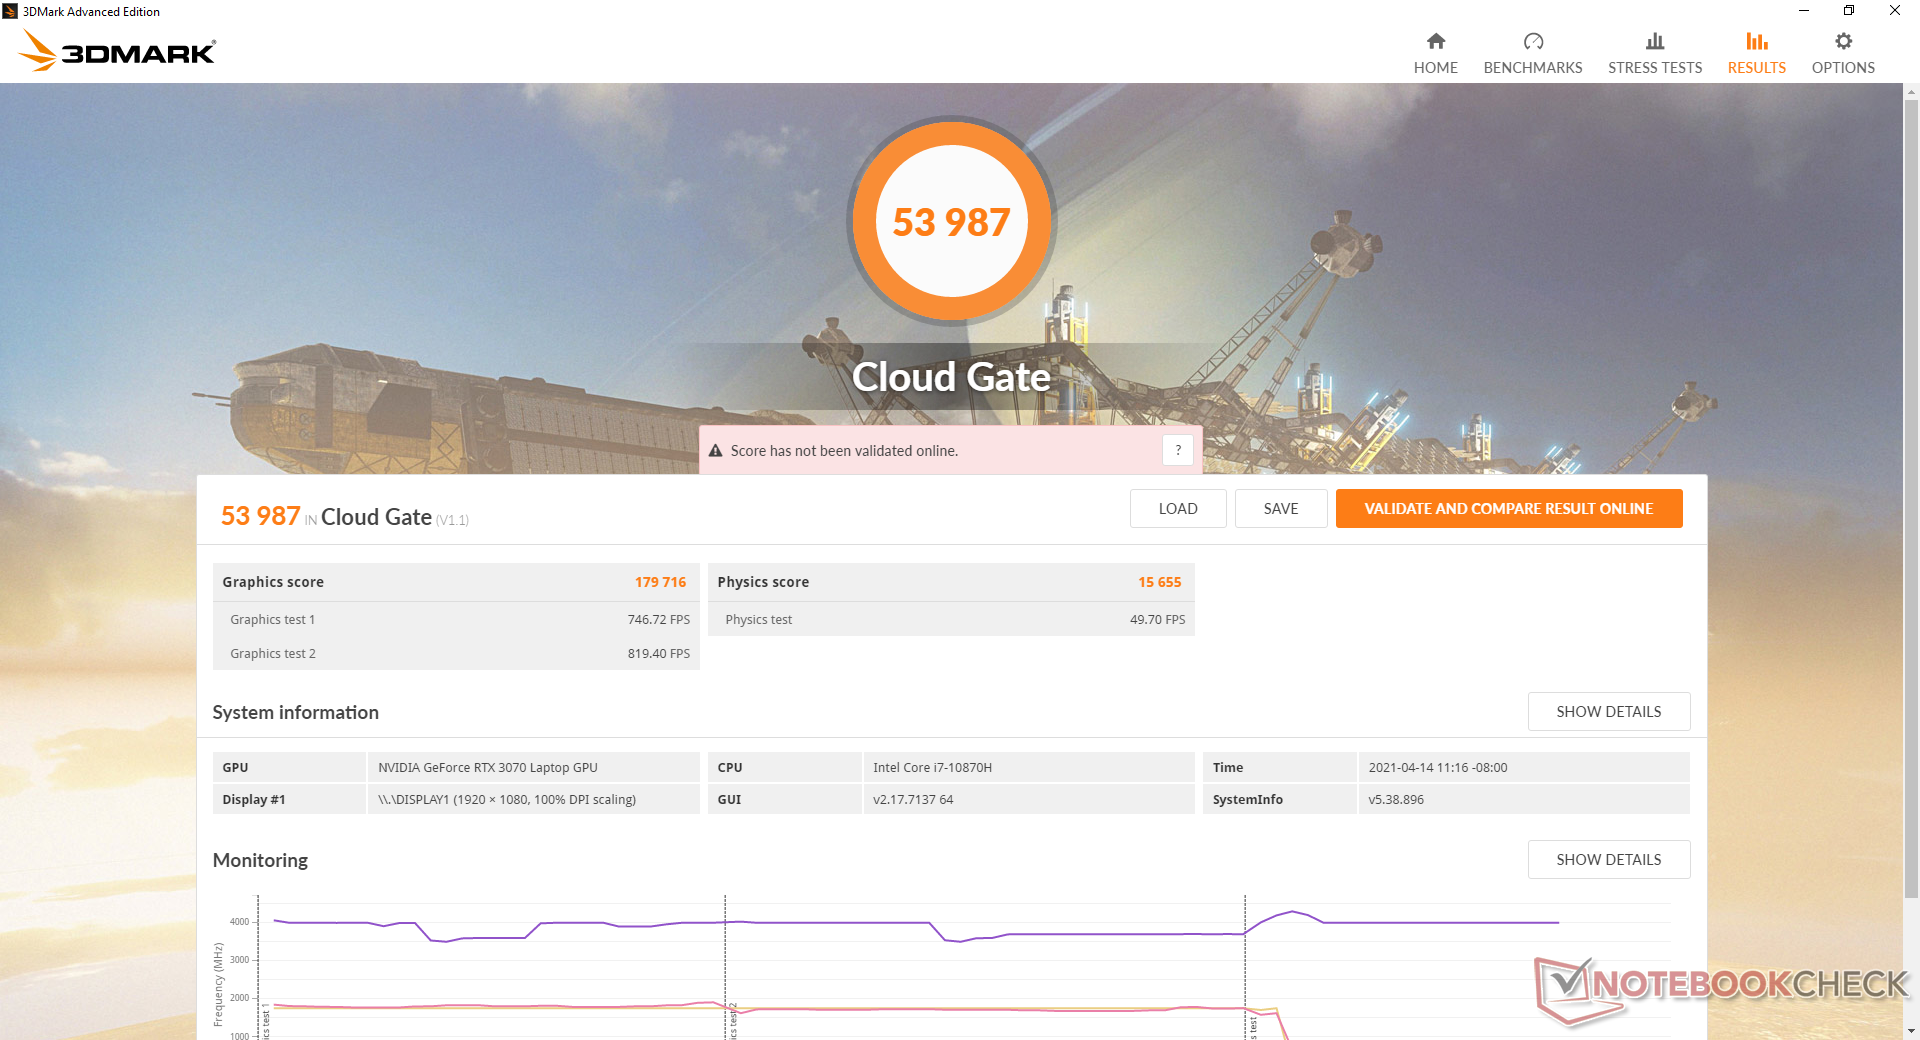
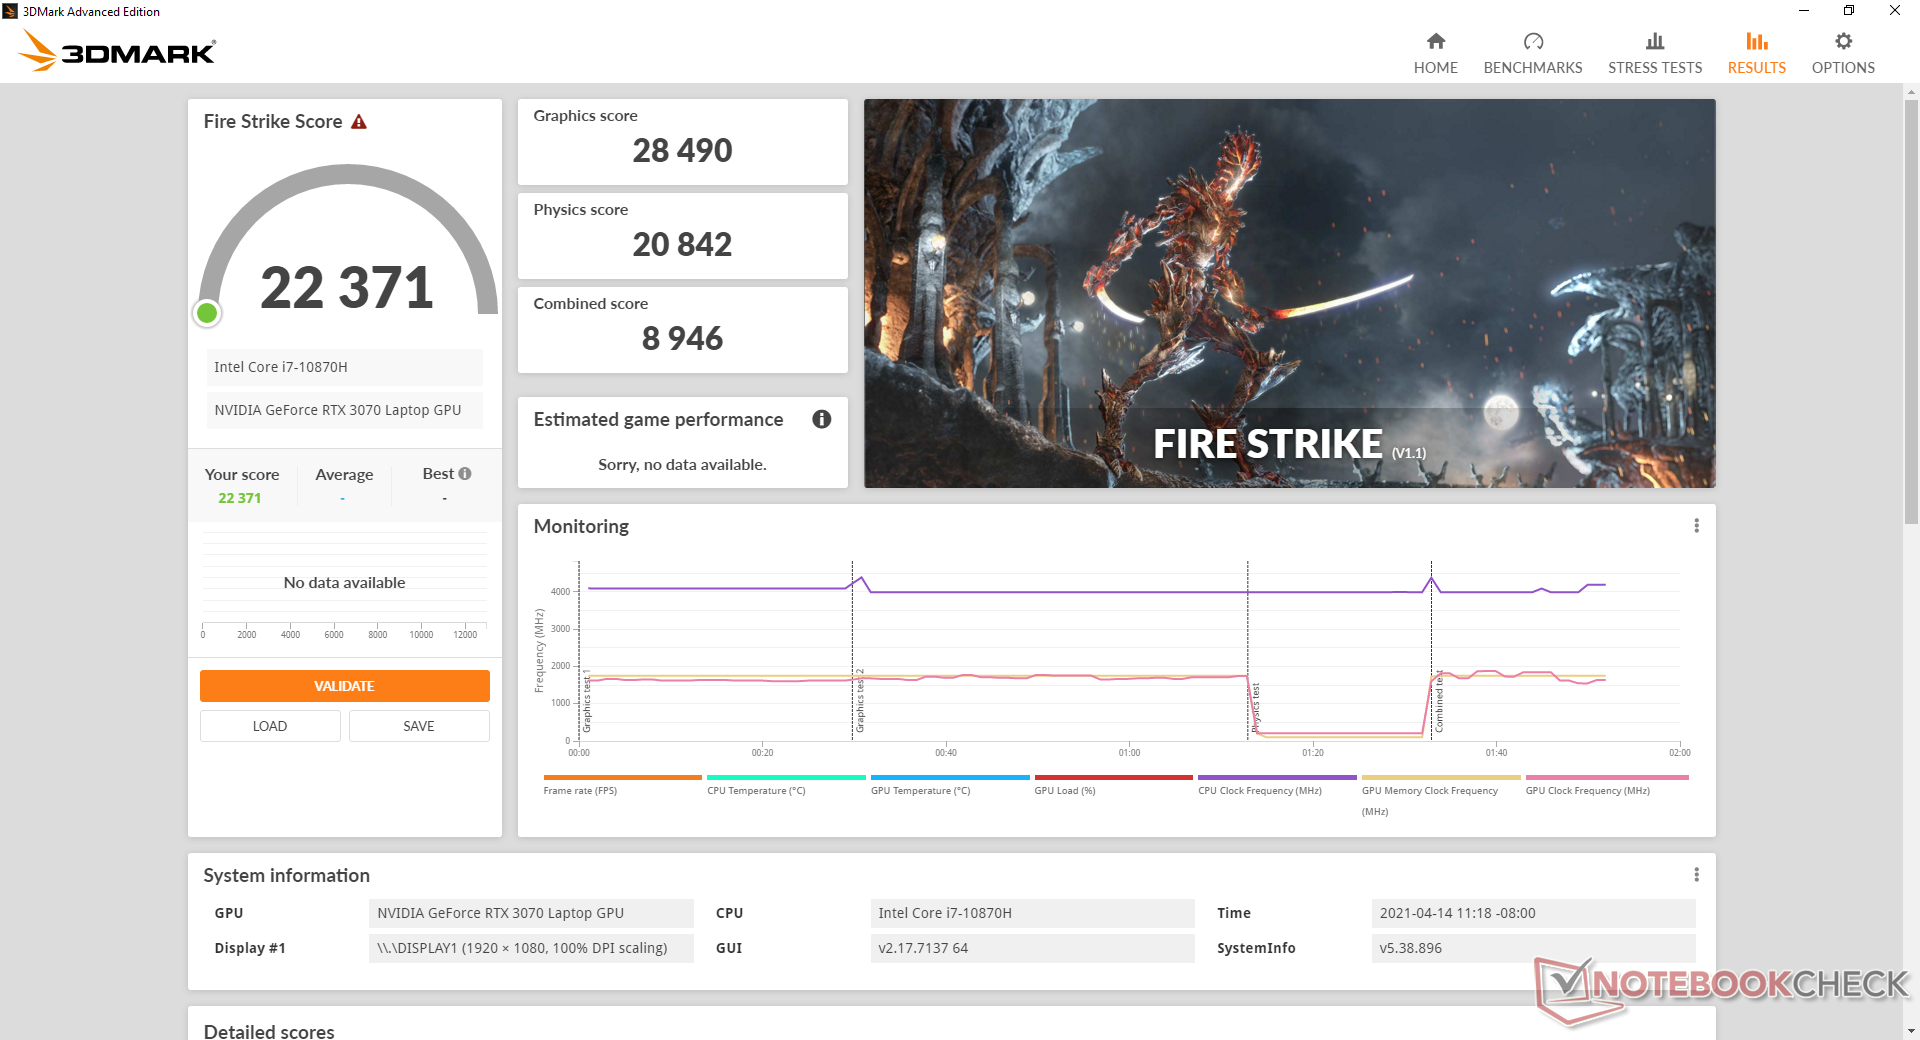
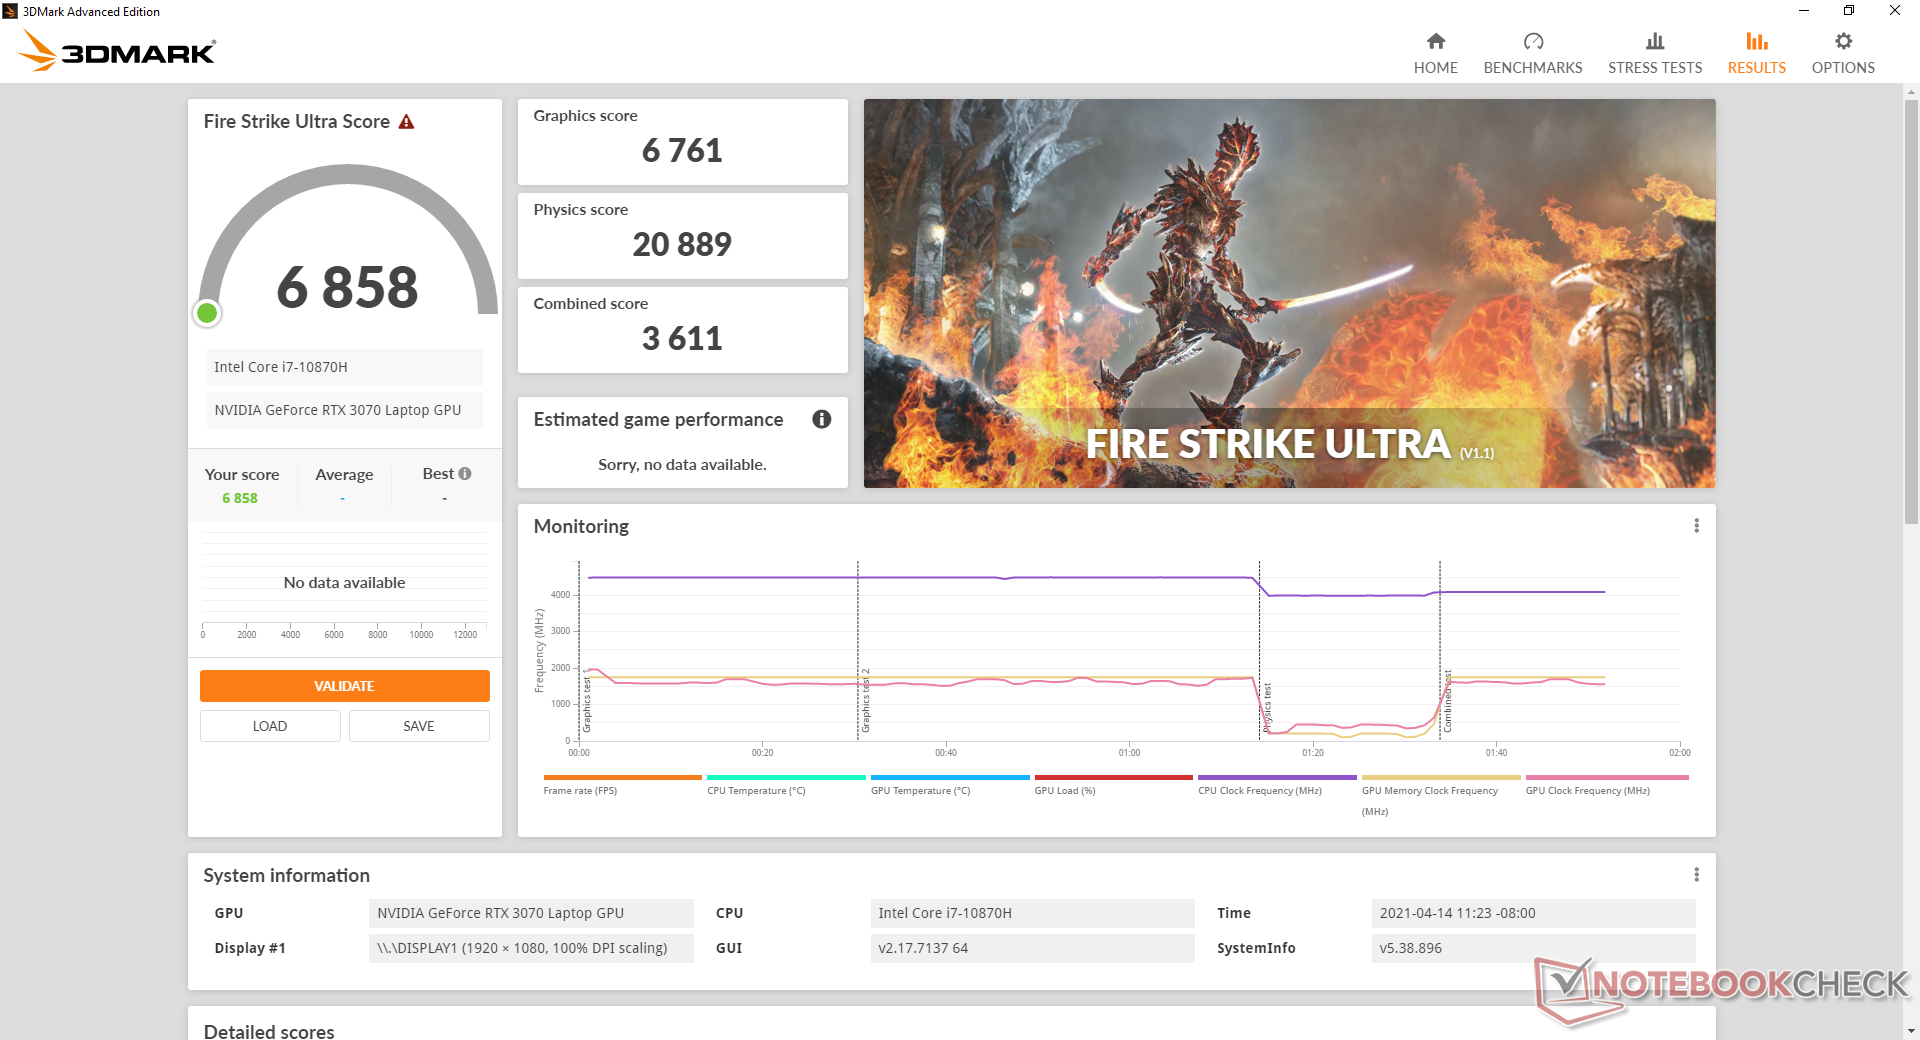
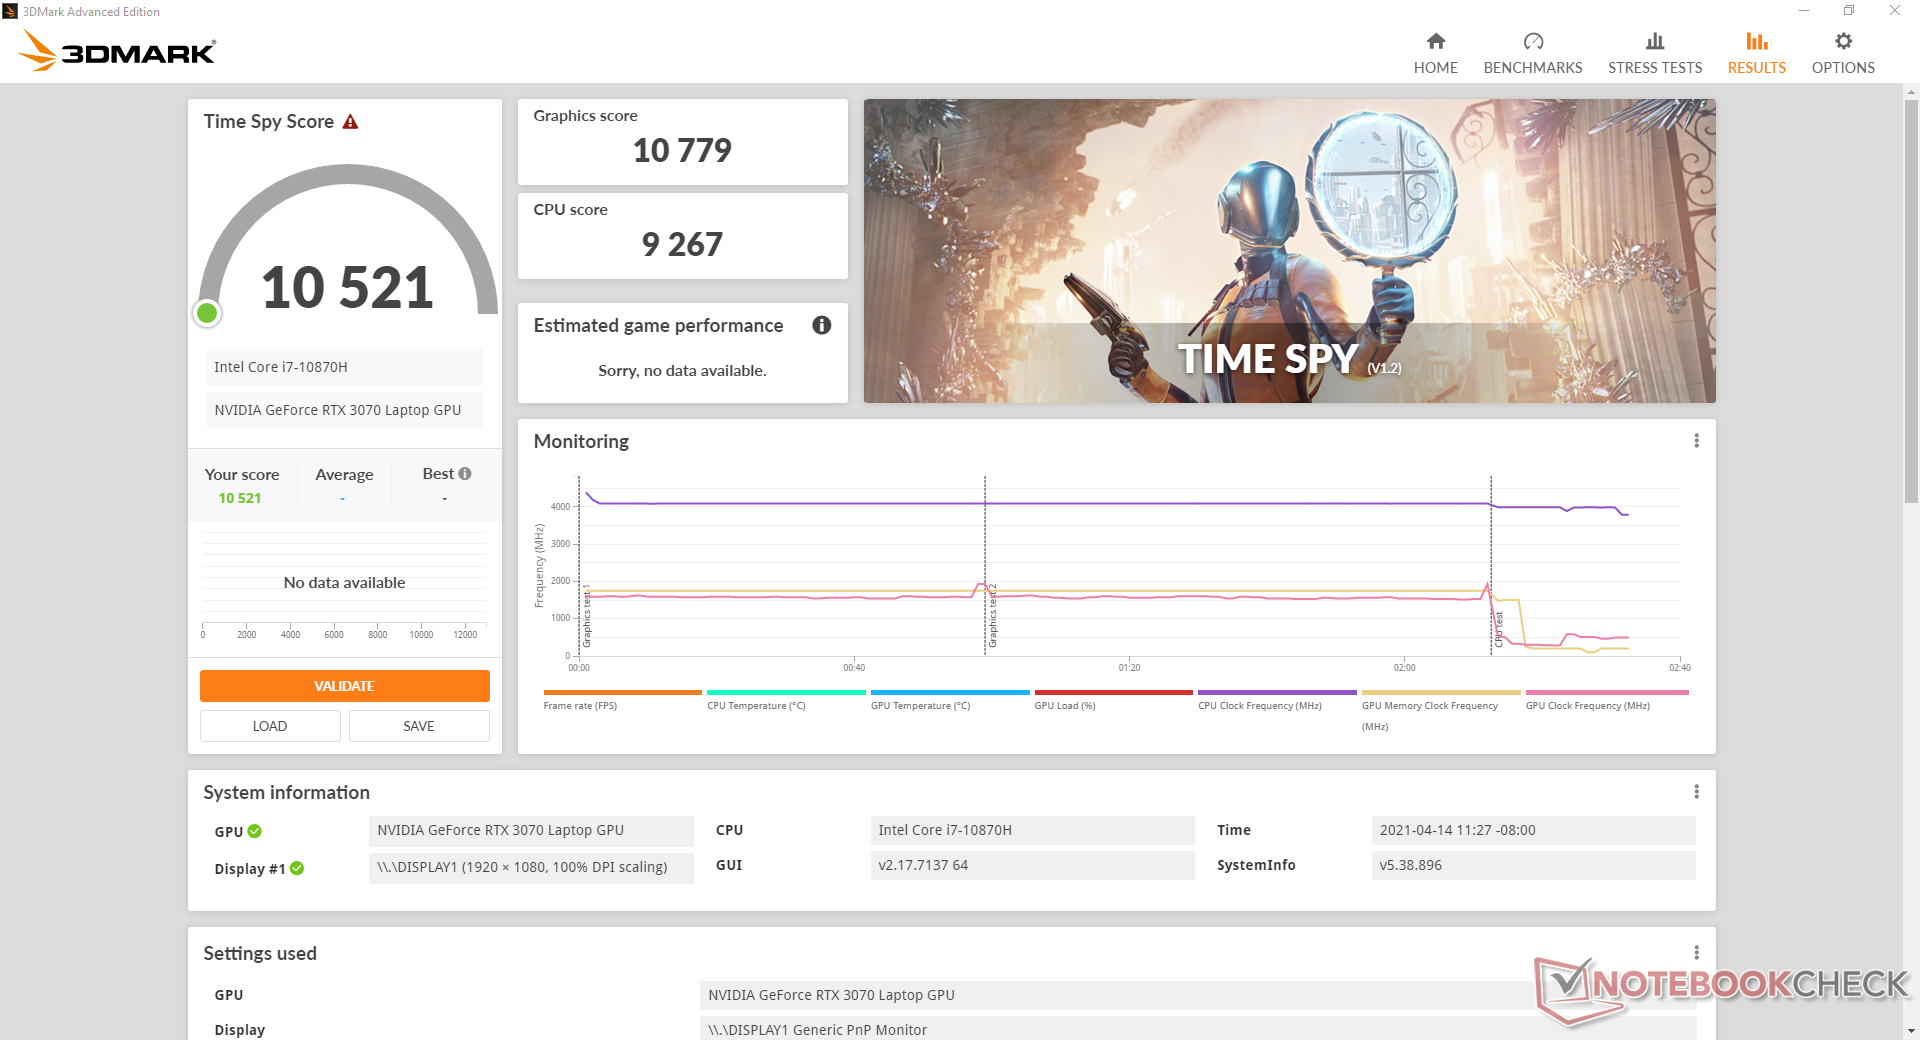
| 3DMark 11 Performance | 28106 puntos | |
| 3DMark Cloud Gate Standard Score | 53987 puntos | |
| 3DMark Fire Strike Score | 22371 puntos | |
| 3DMark Time Spy Score | 10521 puntos | |
ayuda | ||
| bajo | medio | alto | ultra | |
|---|---|---|---|---|
| GTA V (2015) | 181 | 166 | 96.6 | |
| The Witcher 3 (2015) | 362.7 | 298.1 | 206.9 | 107.9 |
| Dota 2 Reborn (2015) | 156 | 141 | 141 | 135 |
| Final Fantasy XV Benchmark (2018) | 175 | 142 | 103 | |
| X-Plane 11.11 (2018) | 116 | 104 | 85.7 | |
| Strange Brigade (2018) | 399 | 279 | 225 | 194 |
Emissions
Ruido del sistema
Los ventiladores estarán inactivos cuando el portátil esté en reposo en el escritorio sin otros programas activos. Sin embargo, incluso un ligero aumento de la utilización de la CPU hará que se ponga en marcha el ventilador de la CPU, por lo que el portátil no será verdaderamente silencioso en la mayoría de los escenarios del mundo real. Hemos podido registrar un ruido de 32,8 dB(A) cuando se navega por la web o se hace streaming de vídeo contra un fondo silencioso de 24,7 dB(A). Es suficiente para que se note, pero no es particularmente molesto.
El ruido del ventilador al jugar rondará los 48.8 dB(A) sin pulsaciones ni comportamiento errático de las RPM. Esto es más silencioso que lo que registramos en el antiguo GP65 mientras que está a la par con los últimos Alienware m15 R4, Aorus 15P, y Asus ROG Zephyrus G15 cada uno con gráficos RTX 30.
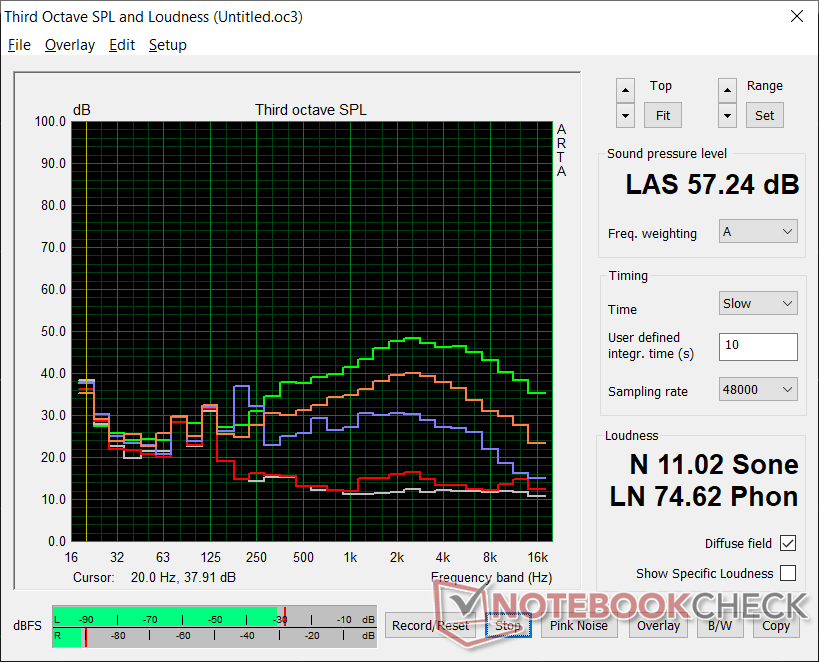
Si se activa Cooler Boost (es decir, el modo de ventilador máximo), el ruido del ventilador saltará inmediatamente a 57,2 dB(A) independientemente de la carga en pantalla. Es un aumento masivo del ruido del ventilador para una ganancia de rendimiento no muy grande, como se detalla en nuestra sección de pruebas de estrés.
Nuestra unidad de prueba muestra un ligero silbido de la bobina de 26,8 dB(A) contra un fondo de 24,7 dB(A).
| MSI GP66 Leopard 10UG GeForce RTX 3070 Laptop GPU, i7-10870H, Kingston OM8PCP31024F | MSI GP65 10SFK-047US GeForce RTX 2070 Mobile, i7-10750H, Samsung SSD PM981 MZVLB1T0HALR | Alienware m15 R4 GeForce RTX 3070 Laptop GPU, i9-10980HK, Micron 2300 1TB MTFDHBA1T0TDV | Aorus 15P XC GeForce RTX 3070 Laptop GPU, i7-10870H, ESR512GTLCG-EAC-4 | Asus ROG Zephyrus G15 GA503Q GeForce RTX 3080 Laptop GPU, R9 5900HS, SK Hynix HFM001TD3JX013N | MSI GF65 Thin 10UE GeForce RTX 3060 Laptop GPU, i7-10750H, Samsung SSD PM981 MZVLB1T0HALR | |
|---|---|---|---|---|---|---|
| Noise | -15% | -4% | -4% | -4% | -9% | |
| apagado / medio ambiente * (dB) | 24.7 | 29.3 -19% | 24 3% | 24 3% | 25 -1% | 24.7 -0% |
| Idle Minimum * (dB) | 26.8 | 31.9 -19% | 25 7% | 25 7% | 26 3% | 33.1 -24% |
| Idle Average * (dB) | 26.8 | 31.9 -19% | 26 3% | 29 -8% | 27 -1% | 33.1 -24% |
| Idle Maximum * (dB) | 26.8 | 33.5 -25% | 37 -38% | 34 -27% | 31 -16% | 33.1 -24% |
| Load Average * (dB) | 40.4 | 47 -16% | 48 -19% | 44 -9% | 49 -21% | 42.7 -6% |
| Witcher 3 ultra * (dB) | 48.8 | 53.8 -10% | 47 4% | 49 -0% | 49 -0% | 40.6 17% |
| Load Maximum * (dB) | 57.2 | 56.7 1% | 49 14% | 53 7% | 51 11% | 59.4 -4% |
* ... más pequeño es mejor
Ruido
| Ocioso |
| 26.8 / 26.8 / 26.8 dB(A) |
| Carga |
| 40.4 / 57.2 dB(A) |
 | ||
30 dB silencioso 40 dB(A) audible 50 dB(A) ruidosamente alto |
||
min: | ||
Temperatura
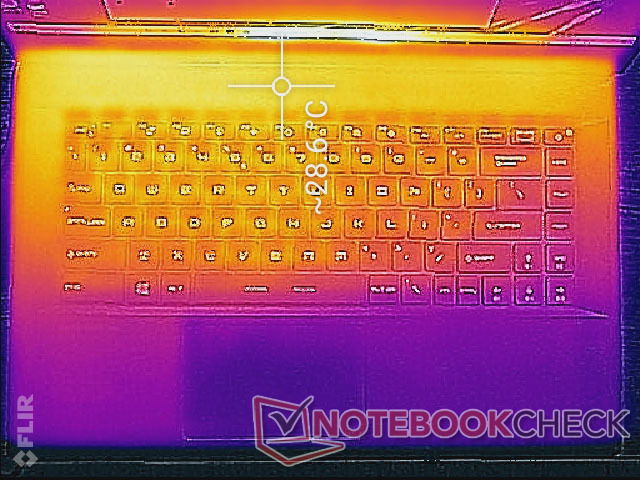
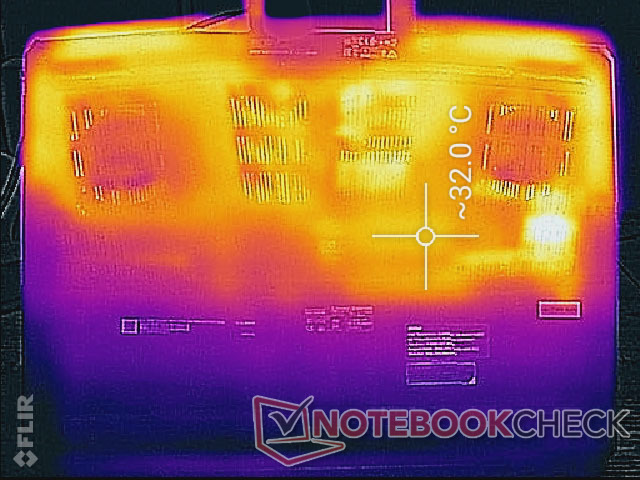
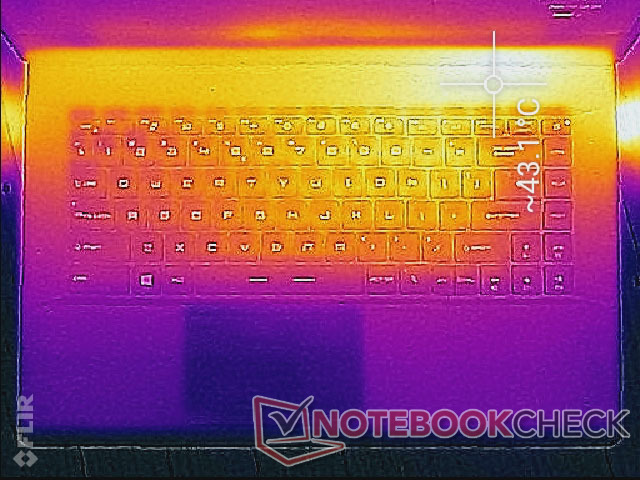
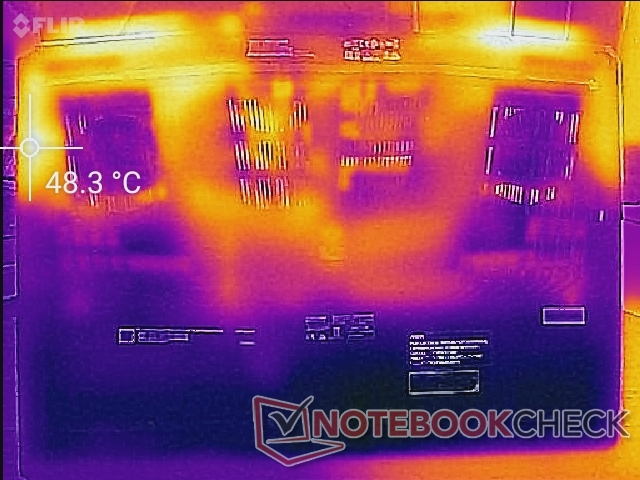
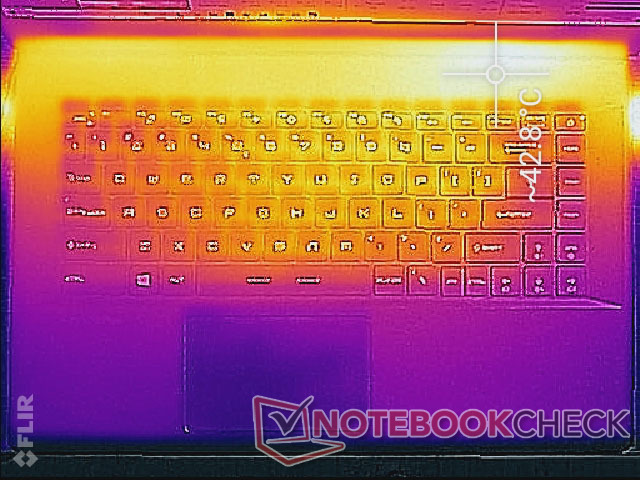
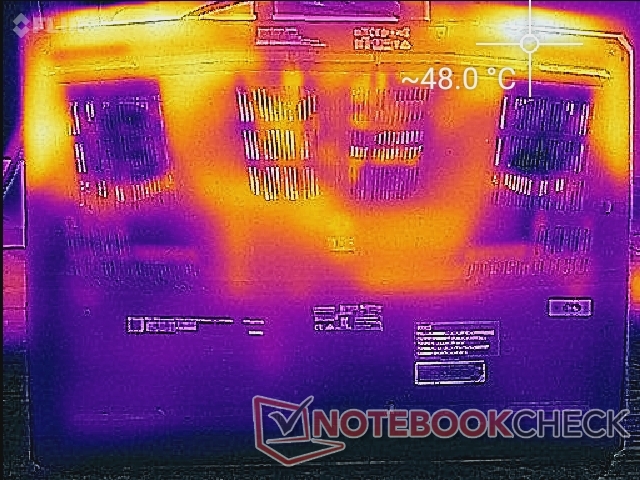
Las temperaturas de la superficie son ligeramente más frías que en la GP65. Al jugar, los puntos calientes del GP66 alcanzan los 43 C y 48 C en la parte superior e inferior de la base, respectivamente, en comparación con los 46 C a 50 C del GP65. Además, los puntos calientes se encuentran ahora por encima de la primera fila de teclas del teclado para una experiencia de escritura más fría, mientras que los puntos calientes del GP65 e incluso del GS66 están más cerca del centro del teclado.
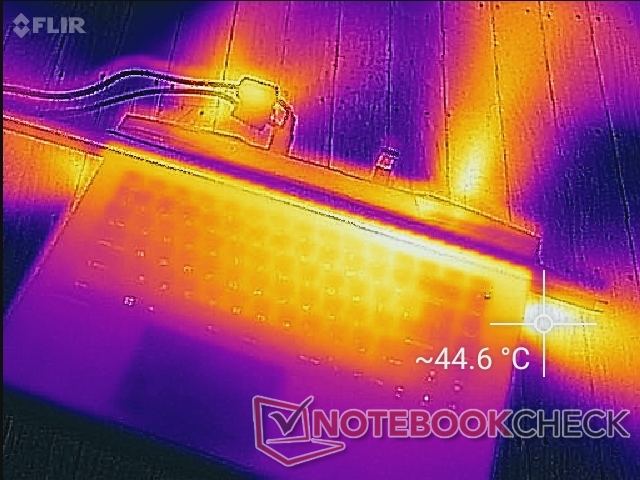
(±) La temperatura máxima en la parte superior es de 42.8 °C / 109 F, frente a la media de 40.4 °C / 105 F, que oscila entre 21.2 y 68.8 °C para la clase Gaming.
(-) El fondo se calienta hasta un máximo de 50 °C / 122 F, frente a la media de 43.2 °C / 110 F
(+) En reposo, la temperatura media de la parte superior es de 29.4 °C / 85# F, frente a la media del dispositivo de 33.9 °C / 93 F.
(±) Jugando a The Witcher 3, la temperatura media de la parte superior es de 33.4 °C / 92 F, frente a la media del dispositivo de 33.9 °C / 93 F.
(+) El reposamanos y el panel táctil están a una temperatura inferior a la de la piel, con un máximo de 25.8 °C / 78.4 F y, por tanto, son fríos al tacto.
(+) La temperatura media de la zona del reposamanos de dispositivos similares fue de 28.8 °C / 83.8 F (+3 °C / 5.4 F).
Prueba de esfuerzo
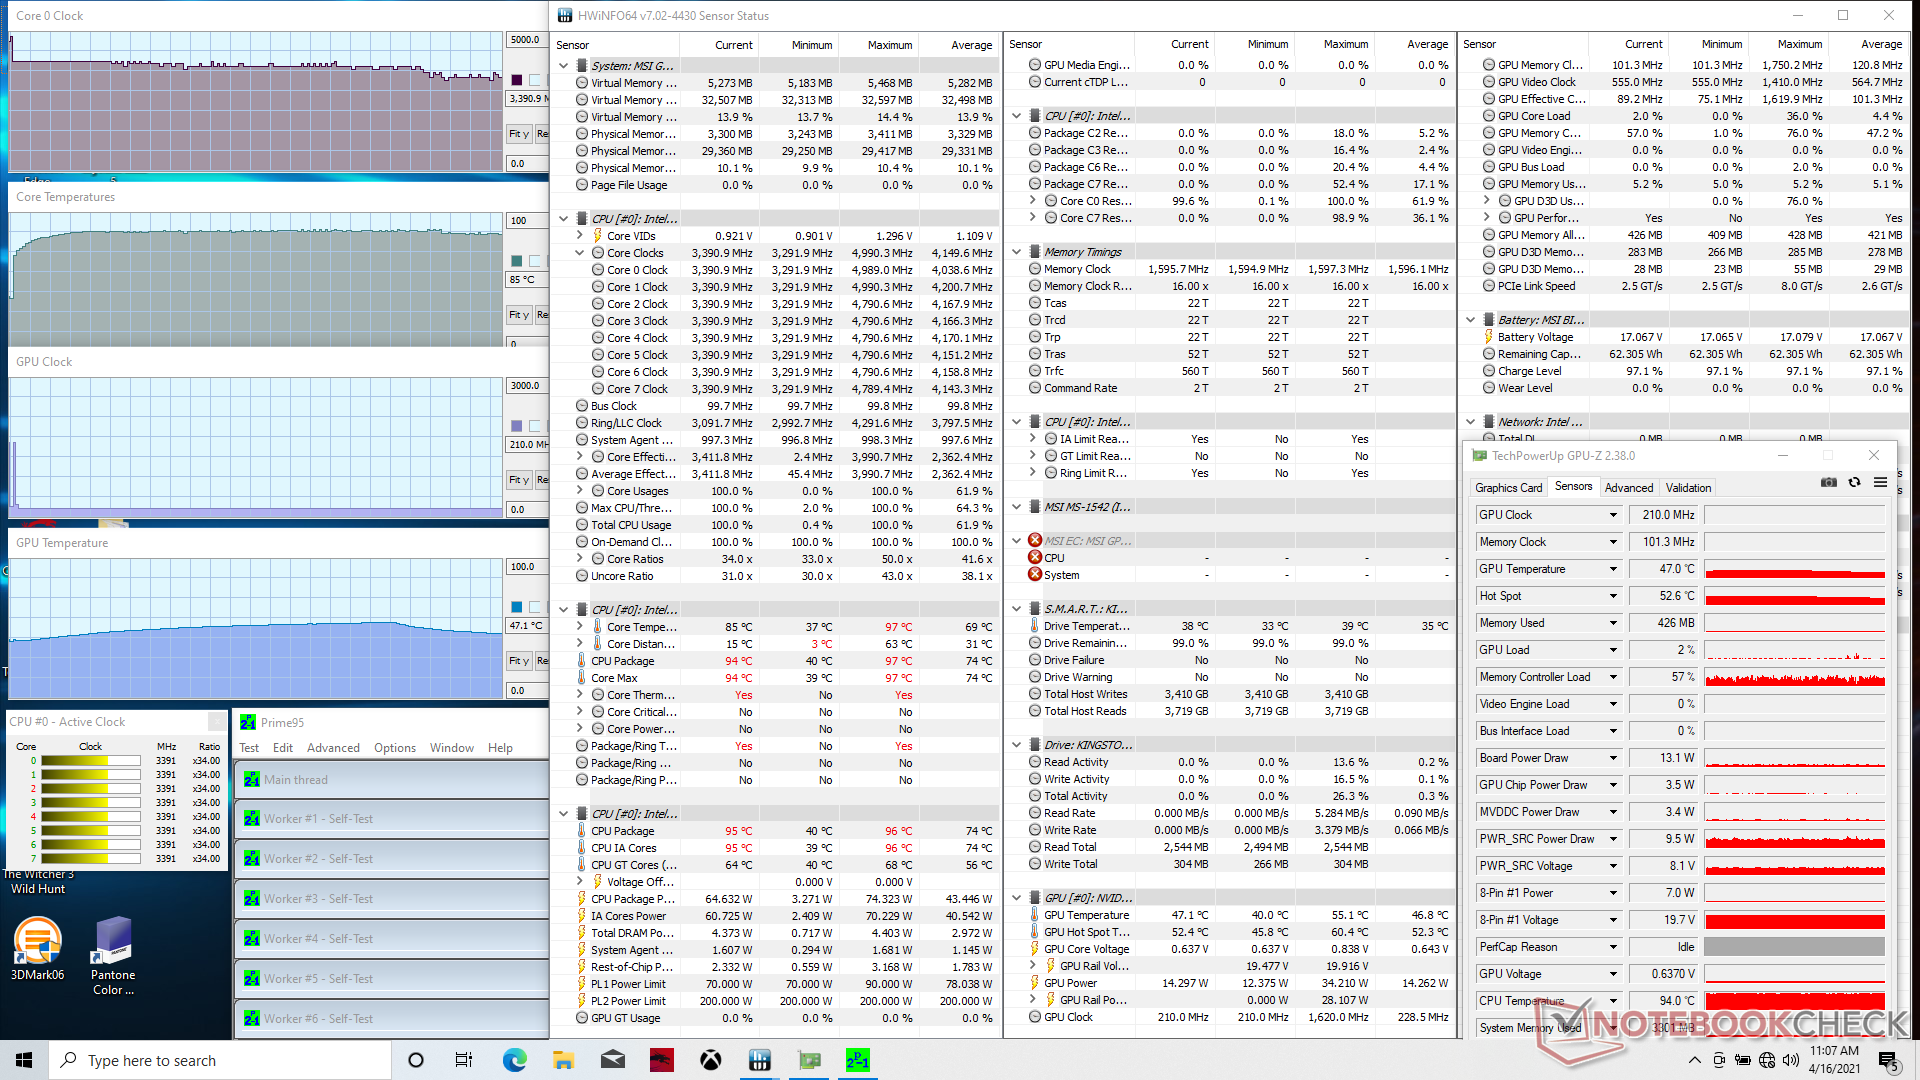
Al ejecutar Prime95 para estresar el procesador, las velocidades de reloj de la CPU aumentaban hasta 4 GHz hasta alcanzar una temperatura del núcleo de 88 C unos 20 segundos después. A partir de entonces, las velocidades de reloj caen constantemente y se estabilizan en el rango de 3,2 a 3,4 GHz para mantener una temperatura del núcleo ligeramente más fría de 85 C. La activación del modo Cooler Boost sólo produce cambios muy pequeños en las velocidades de reloj de la CPU y en la temperatura.
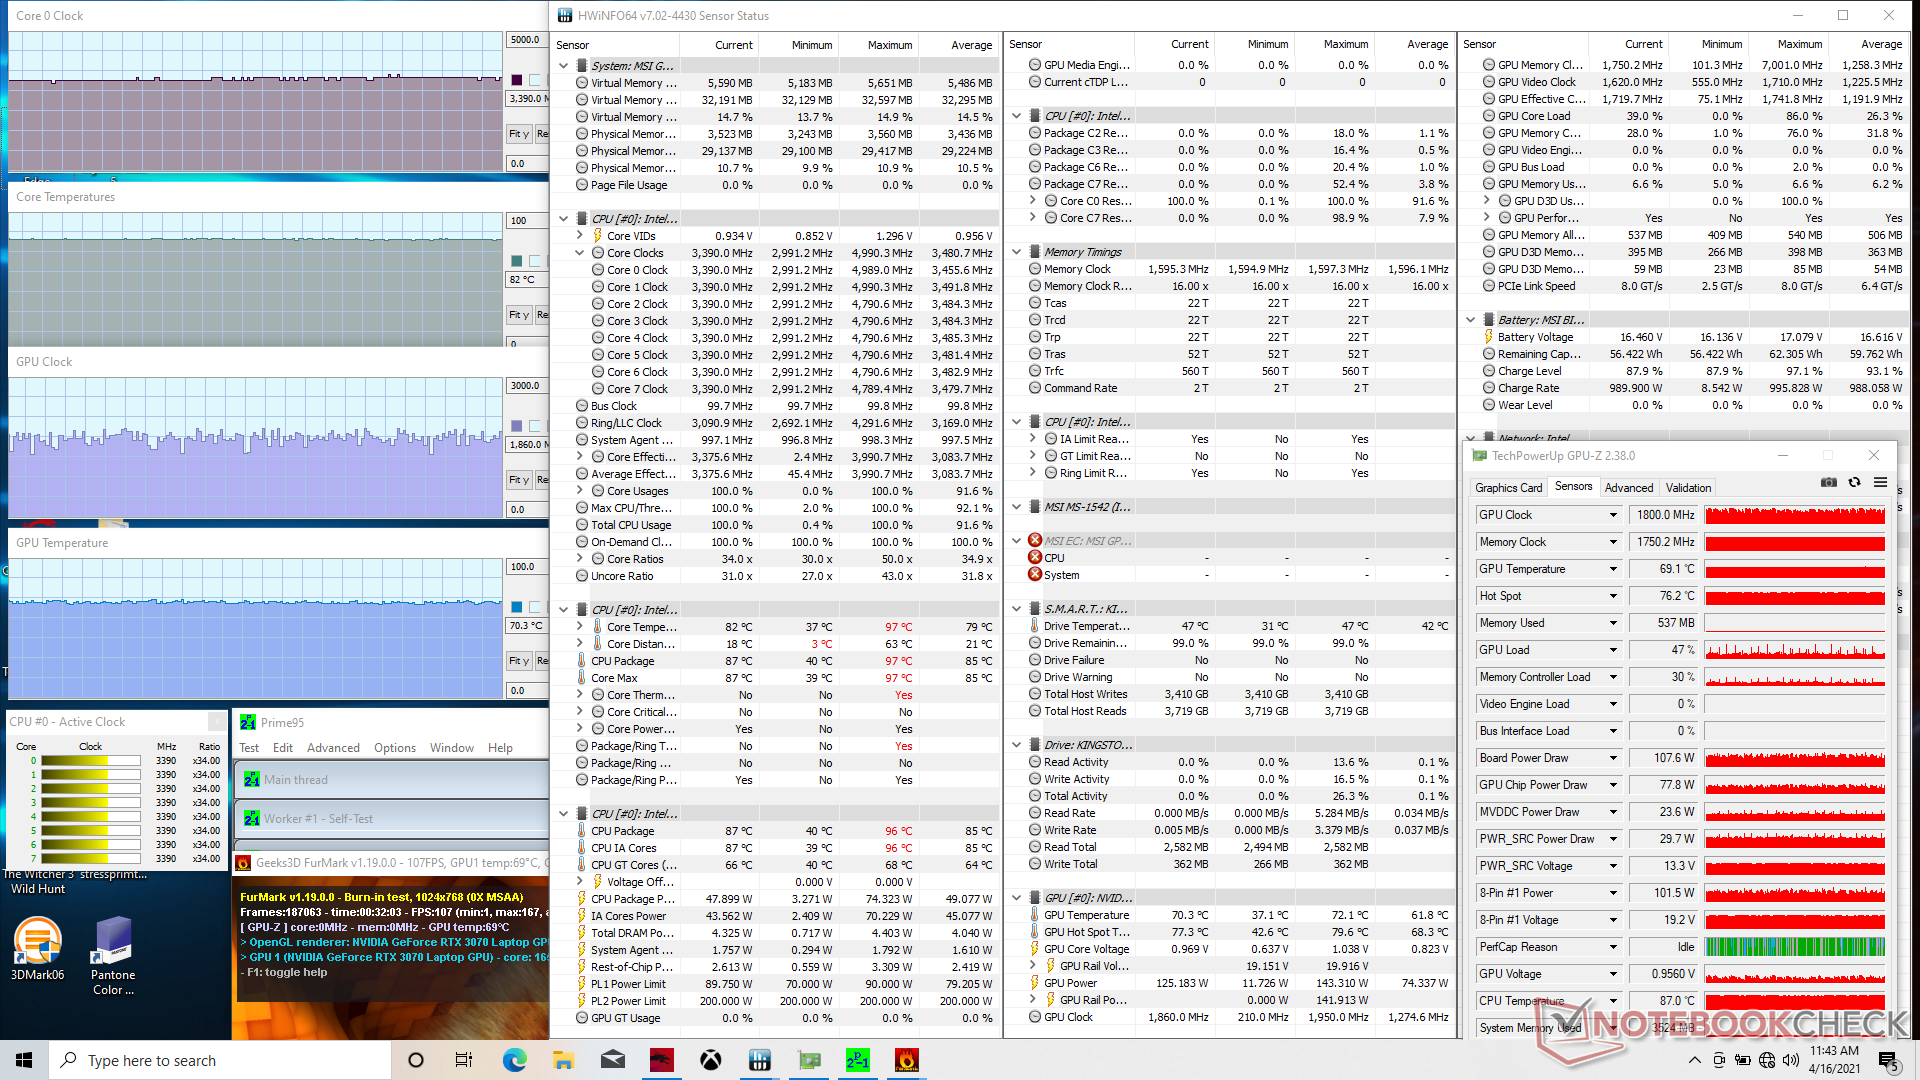
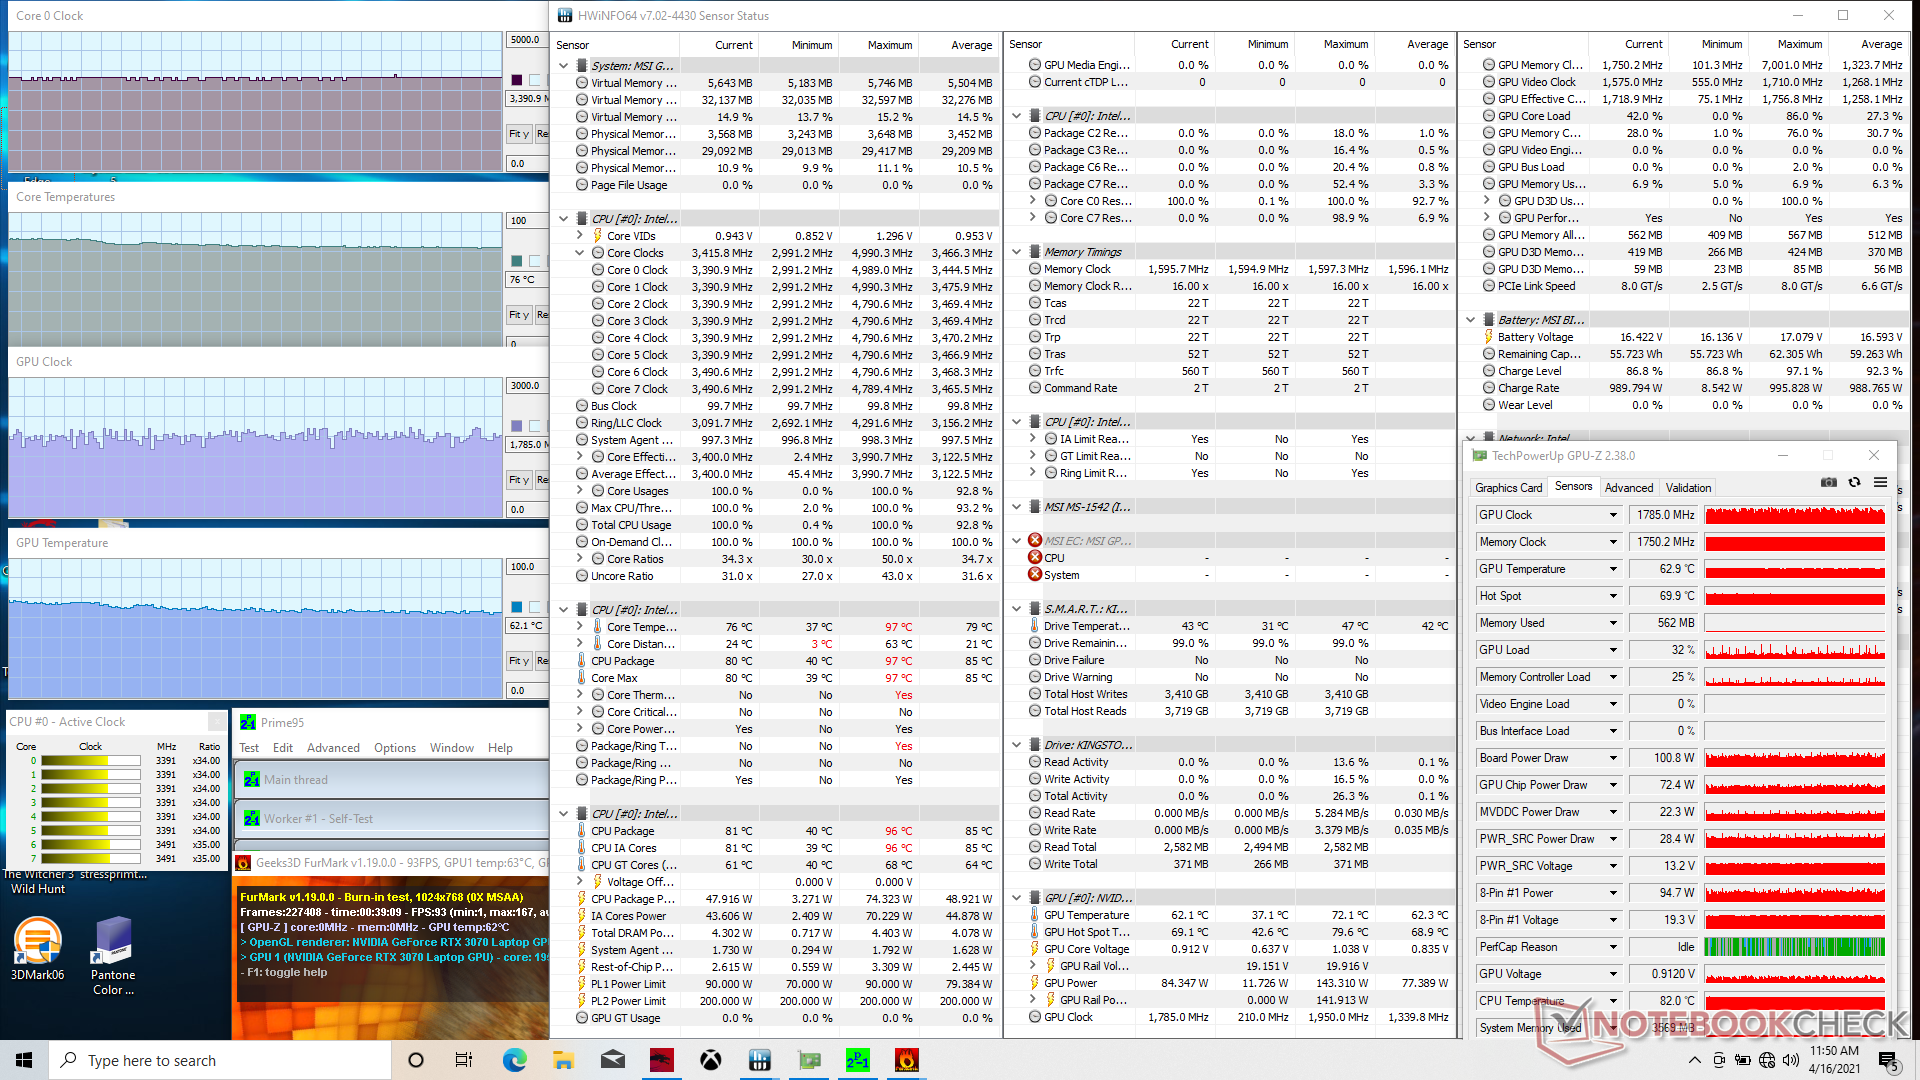
Al ejecutar Prime95 y FurMark simultáneamente, las temperaturas de la CPU y la GPU se mantienen estables en 82 C y 70 C, respectivamente. Si Cooler Boost está activado, las temperaturas de los núcleos caerían unos 8 C en cada caso.
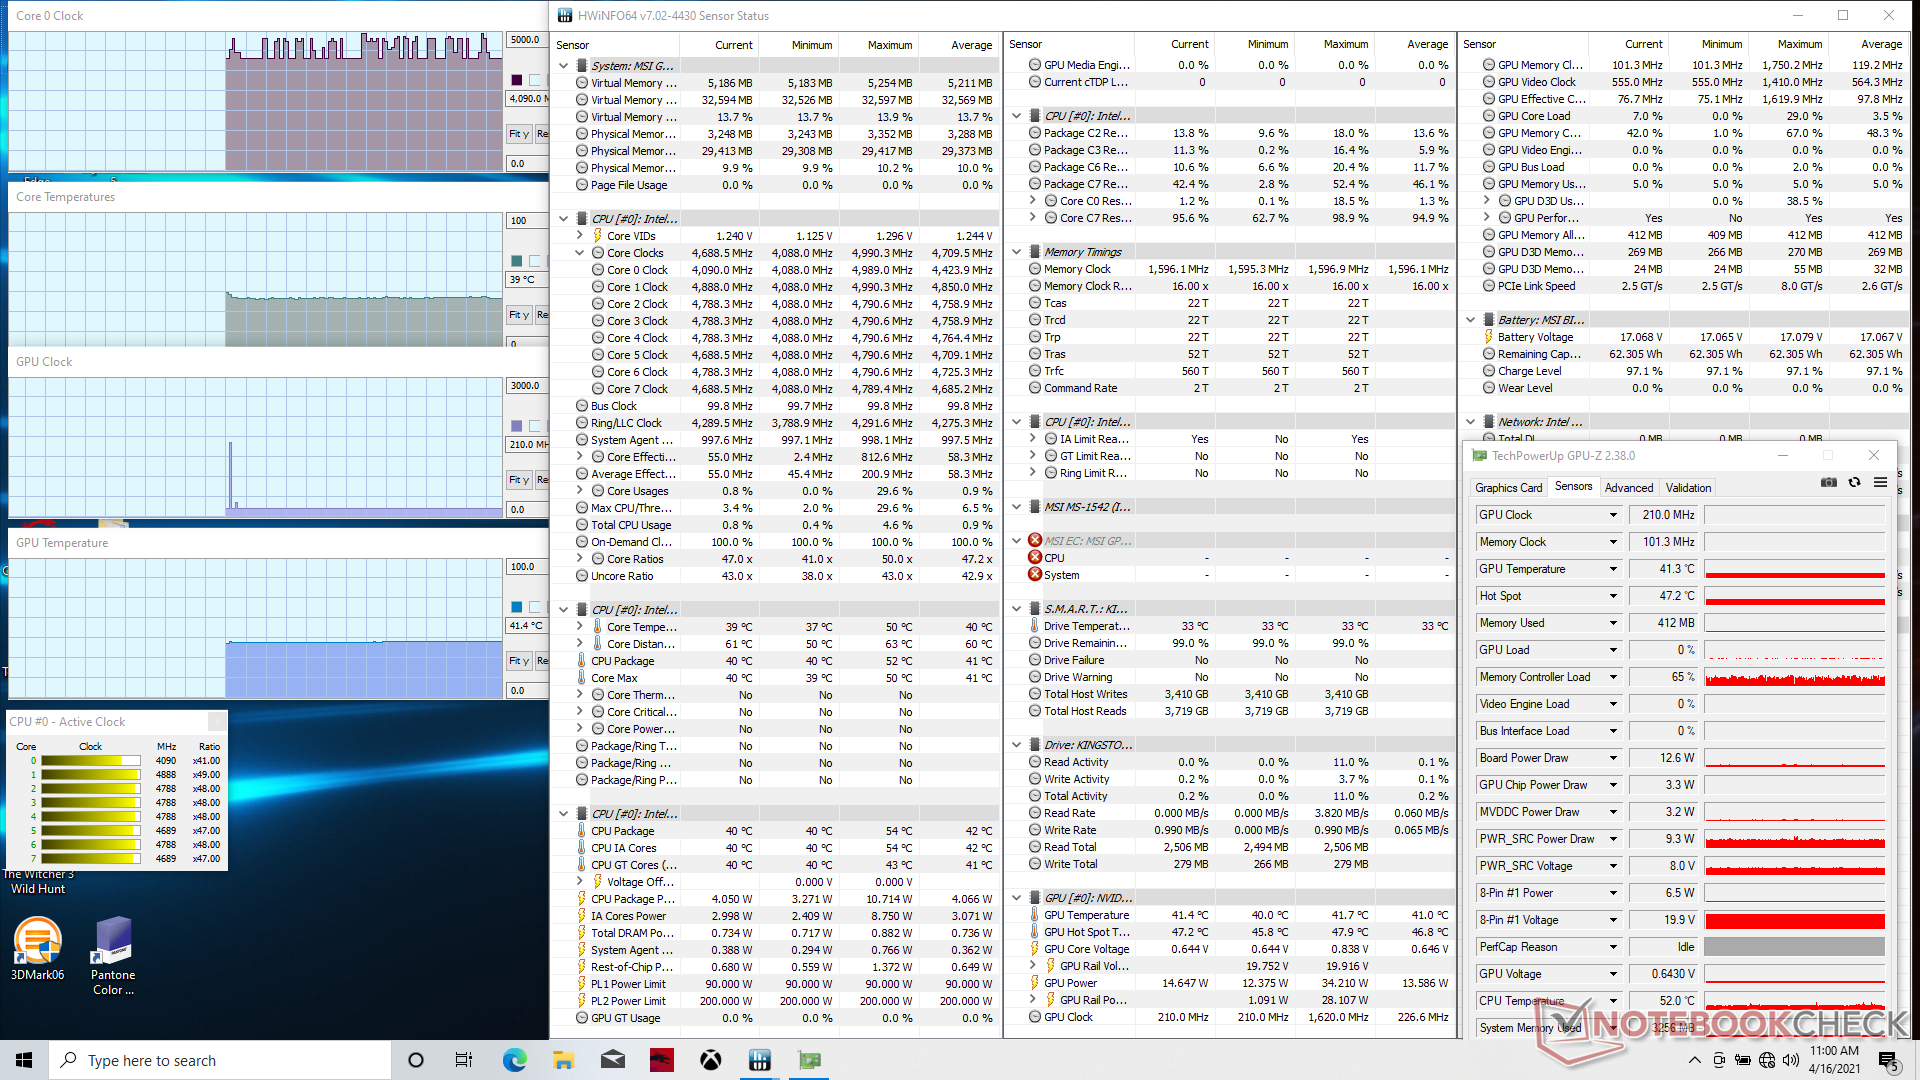
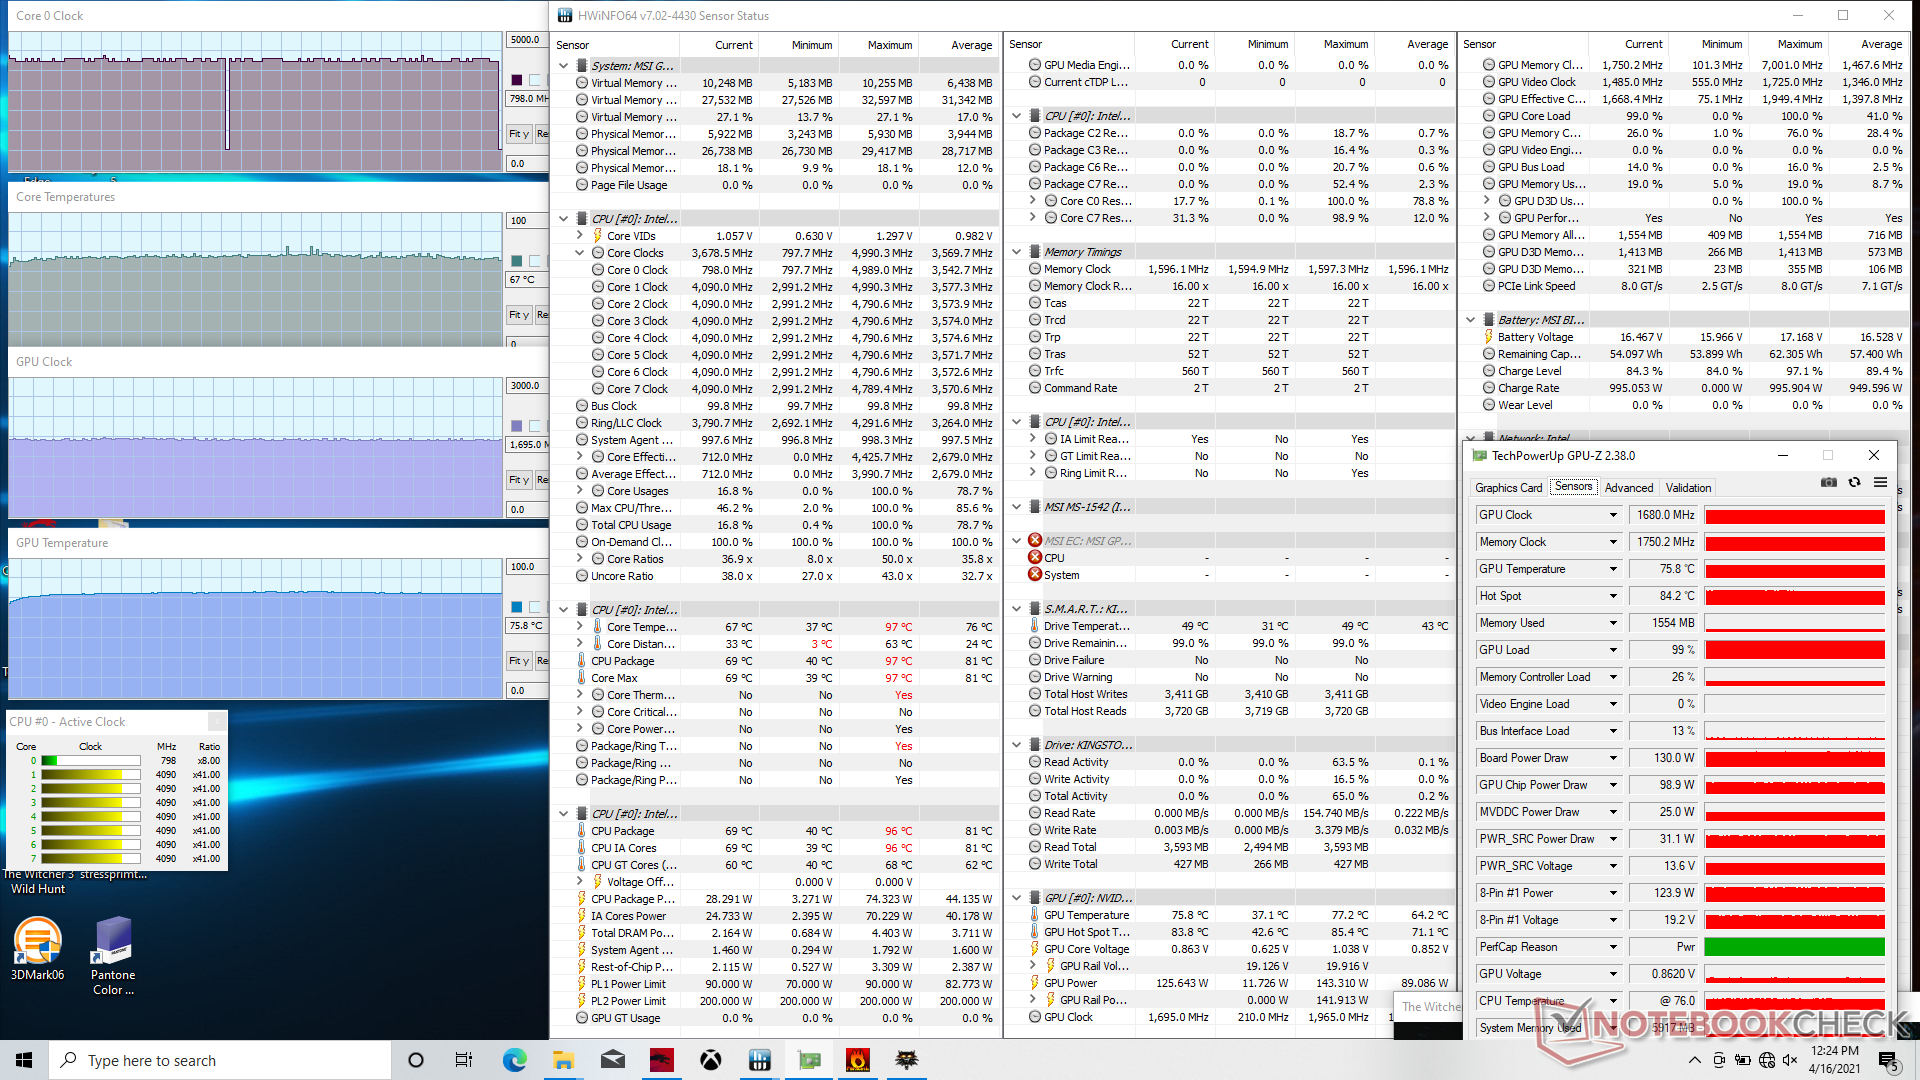
Cuando se ejecuta Witcher 3 para representar el estrés de los juegos en el mundo real, las temperaturas del núcleo se estabilizarían en el rango de 67 C a 76 C si Cooler Boost está desactivado y de 63 a 69 C si Cooler Boost está activado. La velocidad de reloj de la GPU también aumentaría ligeramente de 1680 MHz a 1755 MHz con un consumo de energía de la placa de 120 W a 130 W, tal como anuncia el fabricante. Si se ejecuta esta misma prueba en la GP65, las temperaturas de la CPU y la GPU serán de 96 C y 79 C.
El funcionamiento con baterías limitará el rendimiento. En una prueba de Fire Strike con la batería, las puntuaciones de Física y Gráficos fueron de 12004 y 6385 puntos, respectivamente, frente a los 20842 y 28490 puntos de la red eléctrica.
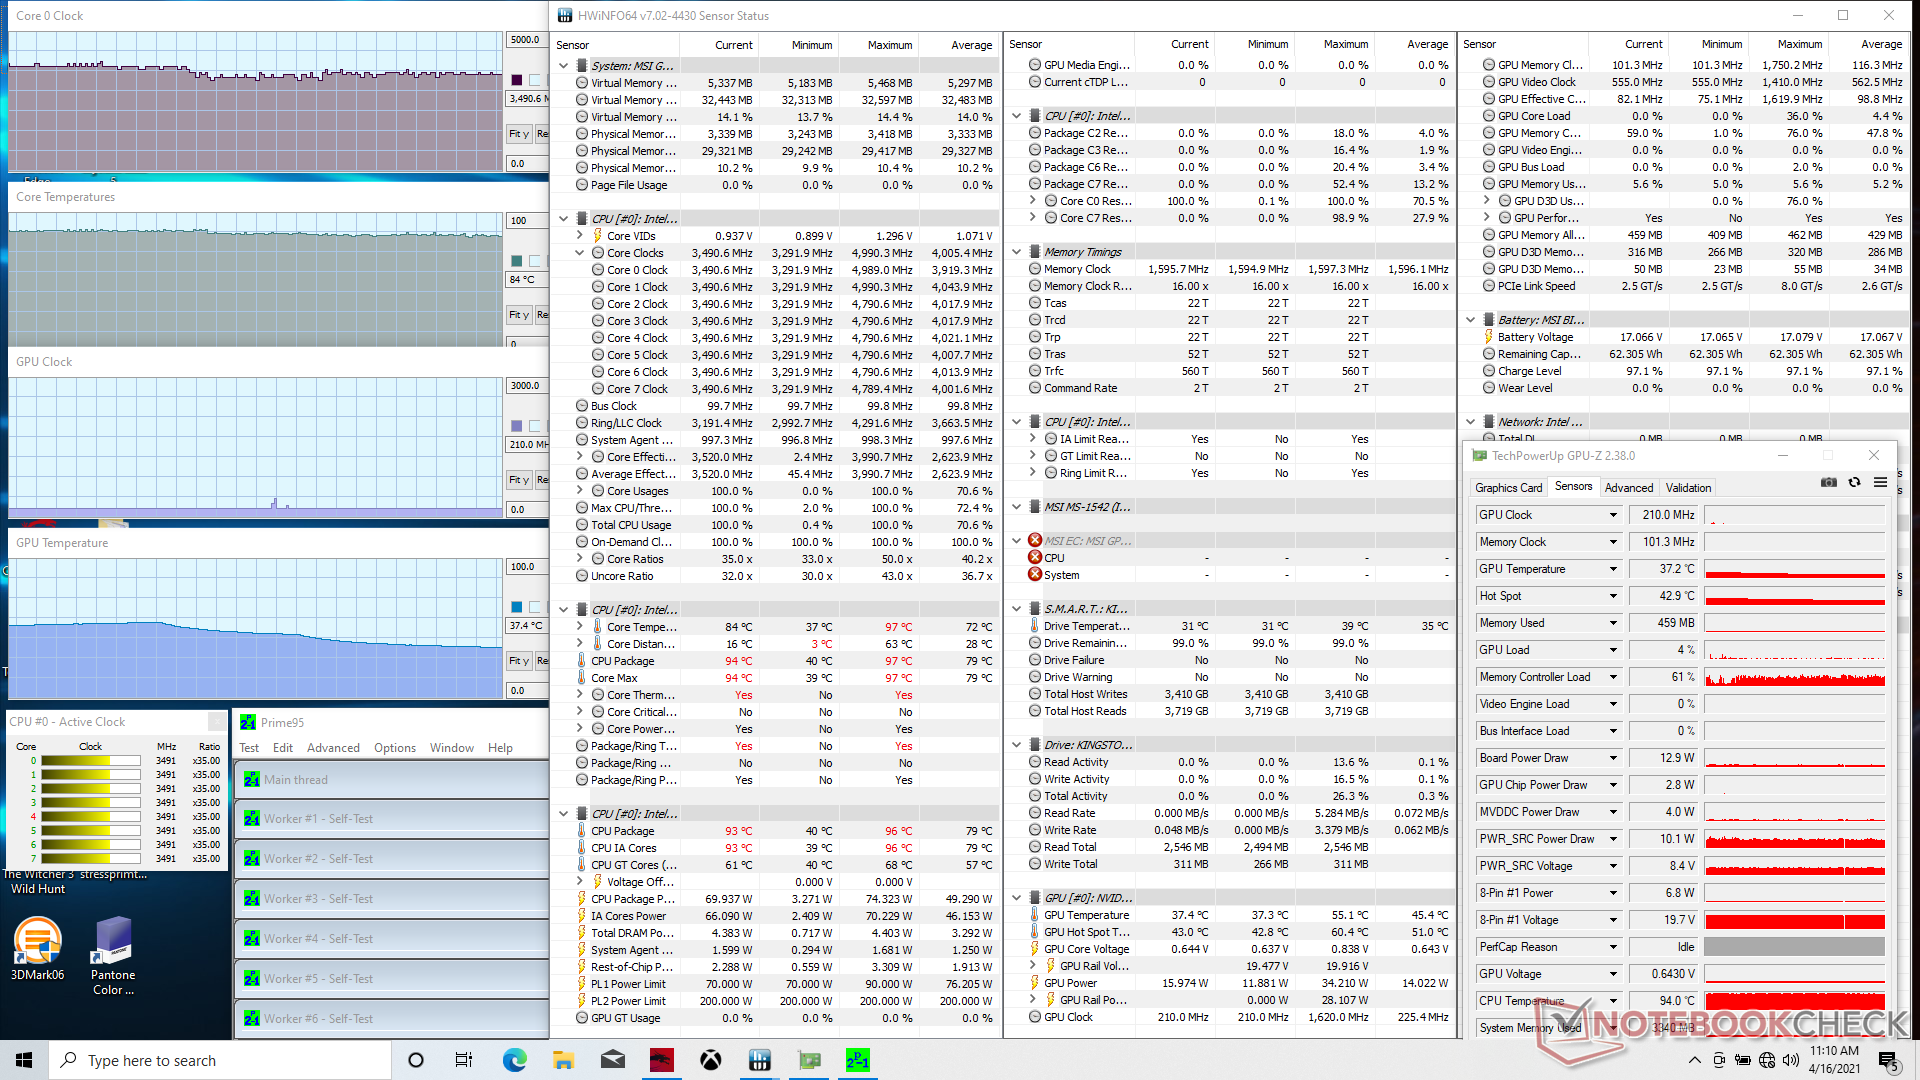

| Relojde la CPU(GHz) | Reloj dela GPU(MHz) | Temperatura media de la CPU (°C) | Temperaturamediade la GPU (°C) | |
| Sistema en reposo | 39 | 41 | ||
| Estrés Prime95 (Cooler Boostoff) | 3,2 - 3,4 | -- | 85 | 47 |
| Estrés de Prime95 (Cooler Boostactivado) | 3,3 - 3,5 | -- | 84 | 37 |
| Prime95+ FurMark Stress (Cooler Boost off) | 3,3 - 3,4 | ~1800 | 82 | 70 |
| Prime95 + FurMark Stress (Cooler Boost on) | 3.4 | ~1800 | 76 | 62 |
| Witcher 3 Estrés (Cooler Boost off) | 4.0 | 1680 | 67 | 76 |
| Witcher 3 Estrés (Cooler Boost activado) | 4.0 | 1755 | 63 | 69 |
Altavoces


MSI GP66 Leopard 10UG análisis de audio
(±) | la sonoridad del altavoz es media pero buena (81.3 dB)
Graves 100 - 315 Hz
(-) | casi sin bajos - de media 18.4% inferior a la mediana
(±) | la linealidad de los graves es media (11% delta a frecuencia anterior)
Medios 400 - 2000 Hz
(±) | medias más altas - de media 5.1% más altas que la mediana
(+) | los medios son lineales (4.6% delta a la frecuencia anterior)
Altos 2 - 16 kHz
(±) | máximos más altos - de media 5.9% más altos que la mediana
(±) | la linealidad de los máximos es media (9.2% delta a frecuencia anterior)
Total 100 - 16.000 Hz
(±) | la linealidad del sonido global es media (19.3% de diferencia con la mediana)
En comparación con la misma clase
» 65% de todos los dispositivos probados de esta clase eran mejores, 8% similares, 27% peores
» El mejor tuvo un delta de 6%, la media fue 18%, el peor fue ###max##%
En comparación con todos los dispositivos probados
» 47% de todos los dispositivos probados eran mejores, 8% similares, 46% peores
» El mejor tuvo un delta de 4%, la media fue 24%, el peor fue ###max##%
Apple MacBook 12 (Early 2016) 1.1 GHz análisis de audio
(+) | los altavoces pueden reproducir a un volumen relativamente alto (#83.6 dB)
Graves 100 - 315 Hz
(±) | lubina reducida - en promedio 11.3% inferior a la mediana
(±) | la linealidad de los graves es media (14.2% delta a frecuencia anterior)
Medios 400 - 2000 Hz
(+) | medios equilibrados - a sólo 2.4% de la mediana
(+) | los medios son lineales (5.5% delta a la frecuencia anterior)
Altos 2 - 16 kHz
(+) | máximos equilibrados - a sólo 2% de la mediana
(+) | los máximos son lineales (4.5% delta a la frecuencia anterior)
Total 100 - 16.000 Hz
(+) | el sonido global es lineal (10.2% de diferencia con la mediana)
En comparación con la misma clase
» 7% de todos los dispositivos probados de esta clase eran mejores, 2% similares, 91% peores
» El mejor tuvo un delta de 5%, la media fue 18%, el peor fue ###max##%
En comparación con todos los dispositivos probados
» 5% de todos los dispositivos probados eran mejores, 1% similares, 94% peores
» El mejor tuvo un delta de 4%, la media fue 24%, el peor fue ###max##%
Energy Management
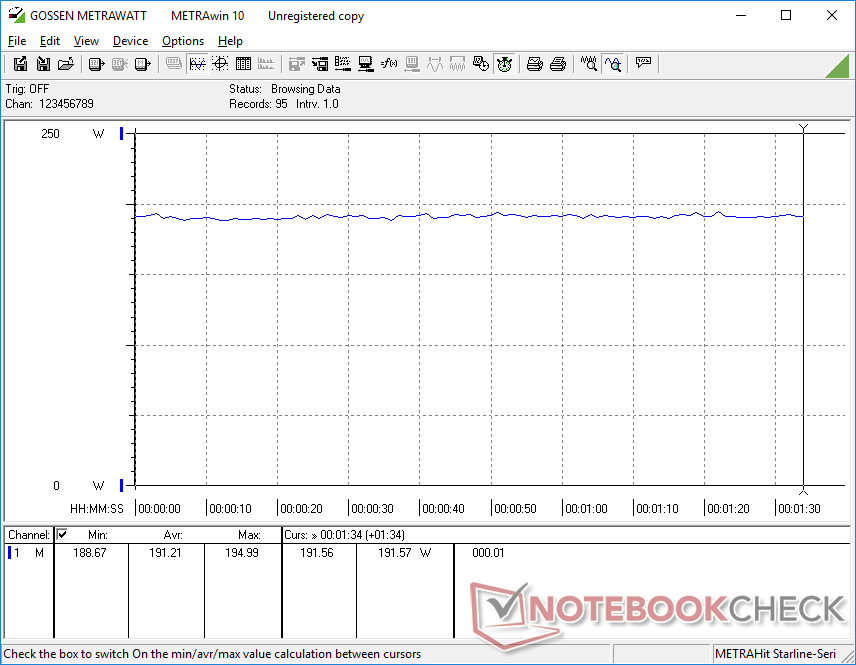
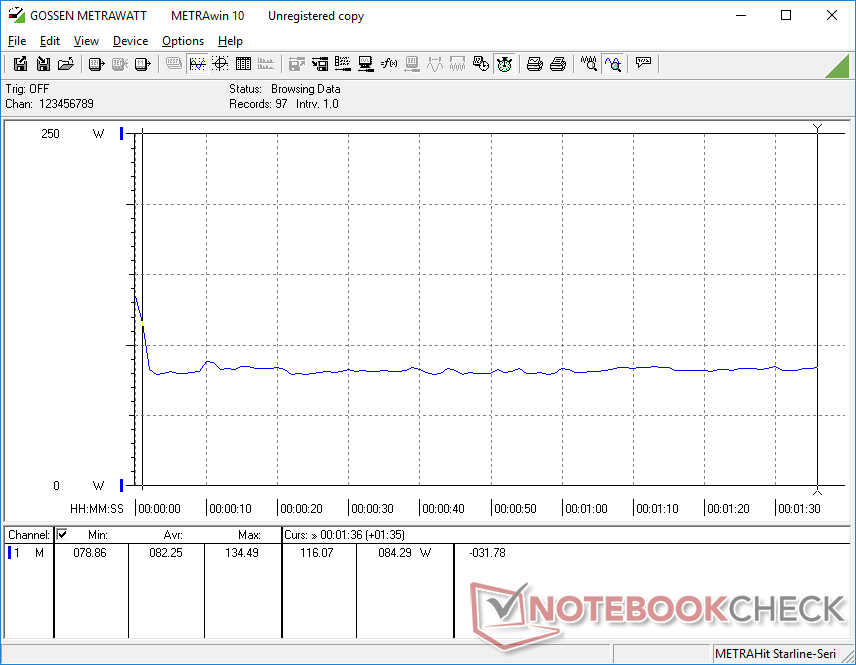
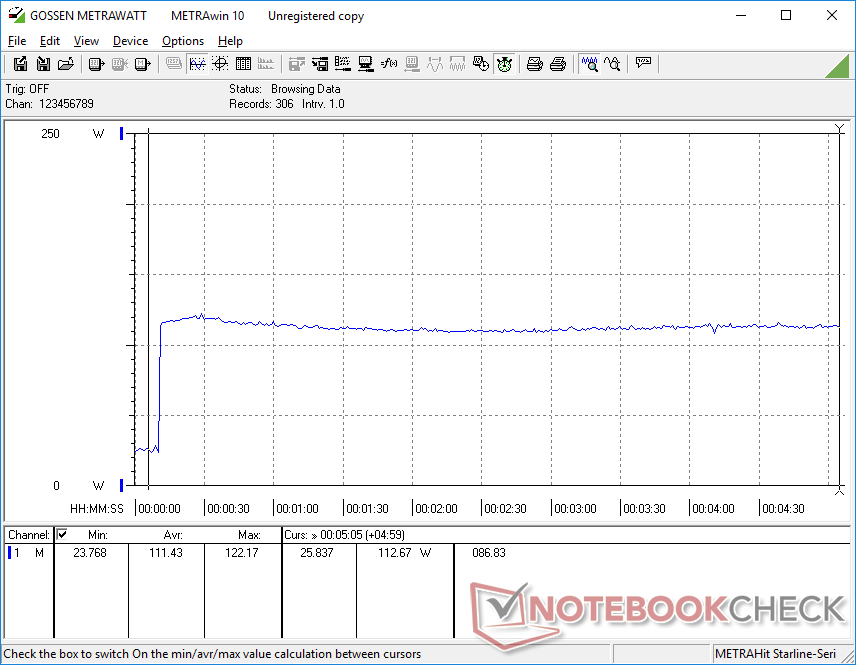
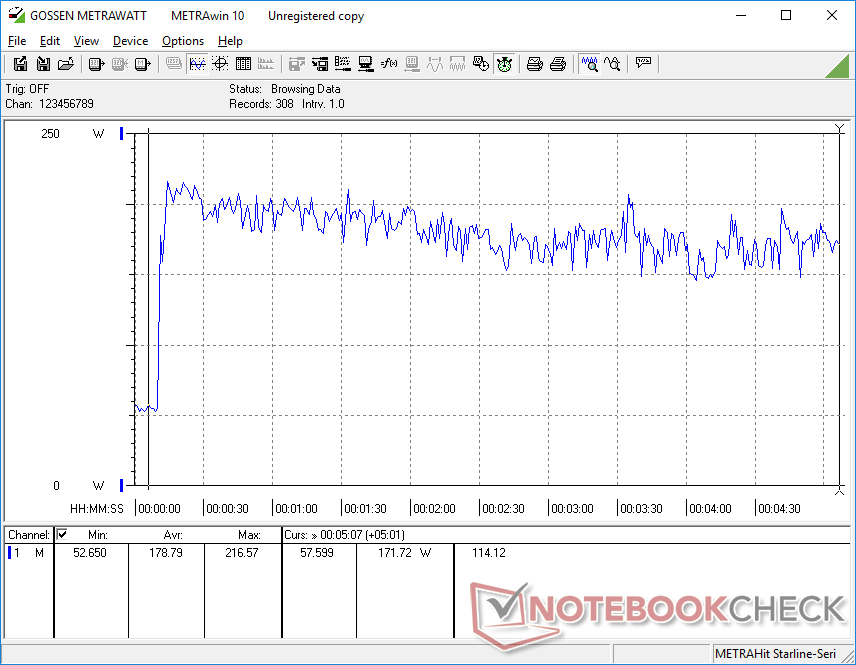
Consumo de energía
El consumo general de energía es mucho más parecido al de la GP65 de lo que esperábamos. Por ejemplo, en reposo en el escritorio consume entre 13 W y 23 W, lo que casi coincide con la GP65. Si se ejecuta Witcher 3 consumiría una media de 191 W, es decir, sólo un 3% más que en la GP65, mientras que ofrece un aumento del 40 al 45% en el rendimiento gráfico. El aumento de rendimiento por vatio de una generación a otra es impresionante en este sentido
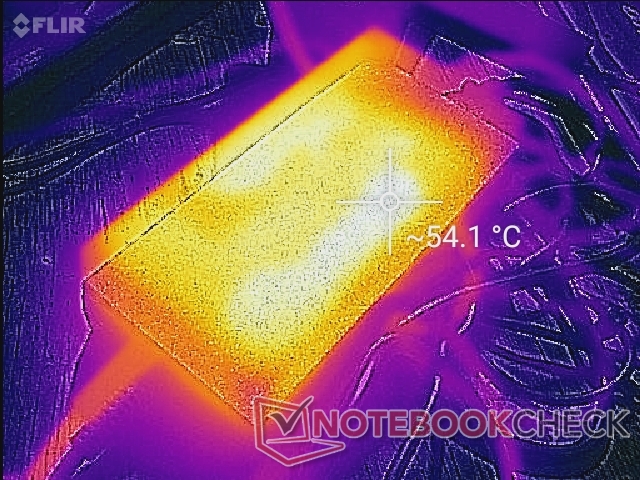
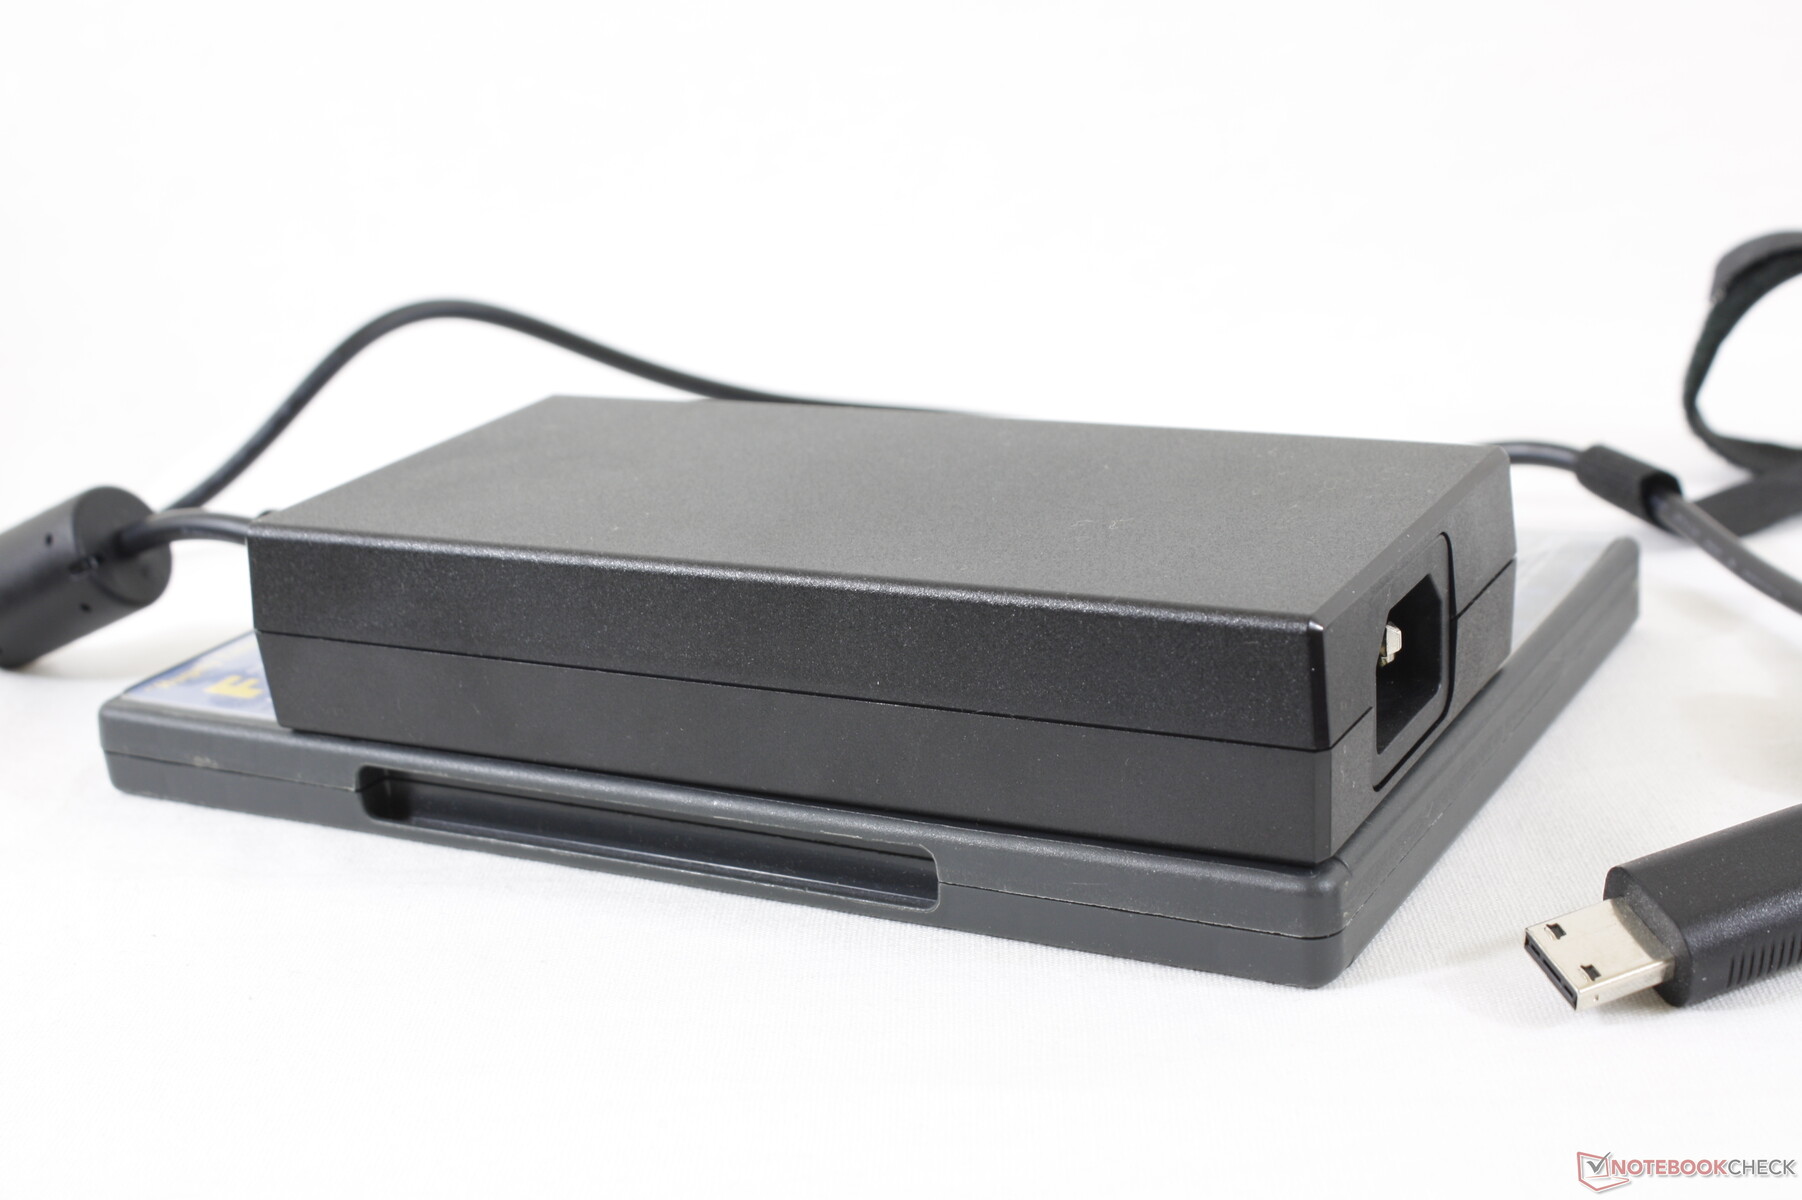
Hemos podido registrar un consumo máximo de 216 W con el adaptador de CA de 230 W de tamaño medio (~15,3 x 7,3 x 3,0 cm).
| Off / Standby | |
| Ocioso | |
| Carga |
|
Clave:
min: | |
| MSI GP66 Leopard 10UG i7-10870H, GeForce RTX 3070 Laptop GPU, Kingston OM8PCP31024F, IPS, 1920x1080, 15.6" | MSI GP65 10SFK-047US i7-10750H, GeForce RTX 2070 Mobile, Samsung SSD PM981 MZVLB1T0HALR, IPS, 1920x1080, 15.6" | Alienware m15 R4 i9-10980HK, GeForce RTX 3070 Laptop GPU, Micron 2300 1TB MTFDHBA1T0TDV, IPS, 1920x1080, 15.6" | Aorus 15P XC i7-10870H, GeForce RTX 3070 Laptop GPU, ESR512GTLCG-EAC-4, IPS, 1920x1080, 15.6" | Asus ROG Zephyrus G15 GA503Q R9 5900HS, GeForce RTX 3080 Laptop GPU, SK Hynix HFM001TD3JX013N, IPS-Level, 2560x1440, 15.6" | MSI GF65 Thin 10UE i7-10750H, GeForce RTX 3060 Laptop GPU, Samsung SSD PM981 MZVLB1T0HALR, IPS, 1920x1080, 15.6" | |
|---|---|---|---|---|---|---|
| Power Consumption | -2% | -68% | -8% | 21% | 29% | |
| Idle Minimum * (Watt) | 15.3 | 14.2 7% | 35 -129% | 14 8% | 10 35% | 5.4 65% |
| Idle Average * (Watt) | 21.2 | 18.8 11% | 39 -84% | 17 20% | 12 43% | 12.8 40% |
| Idle Maximum * (Watt) | 22.3 | 23.9 -7% | 48 -115% | 33 -48% | 17 24% | 19.5 13% |
| Load Average * (Watt) | 82.3 | 96.9 -18% | 135 -64% | 96 -17% | 108 -31% | 86.6 -5% |
| Witcher 3 ultra * (Watt) | 191.2 | 185 3% | 194 -1% | 179 6% | 123 36% | 115.7 39% |
| Load Maximum * (Watt) | 216.6 | 233.4 -8% | 252 -16% | 256 -18% | 182 16% | 175.2 19% |
* ... más pequeño es mejor
Duración de la batería
La capacidad de la batería ha aumentado de 51 Wh en el GP65 a 65 Wh en el GP66. La duración de la WLAN también es ahora mucho mayor, con algo más de 5 horas, para ser casi 1,5 horas más que lo que registramos en el GP65.
La duración máxima de la batería, sin embargo, podría haber sido mejor. Poniendo el sistema en modo Super Batería con el brillo al mínimo y la iGPU activa, el resultado sería una duración total de sólo 6,5 horas, que no es mucho más larga que nuestra configuración WLAN.
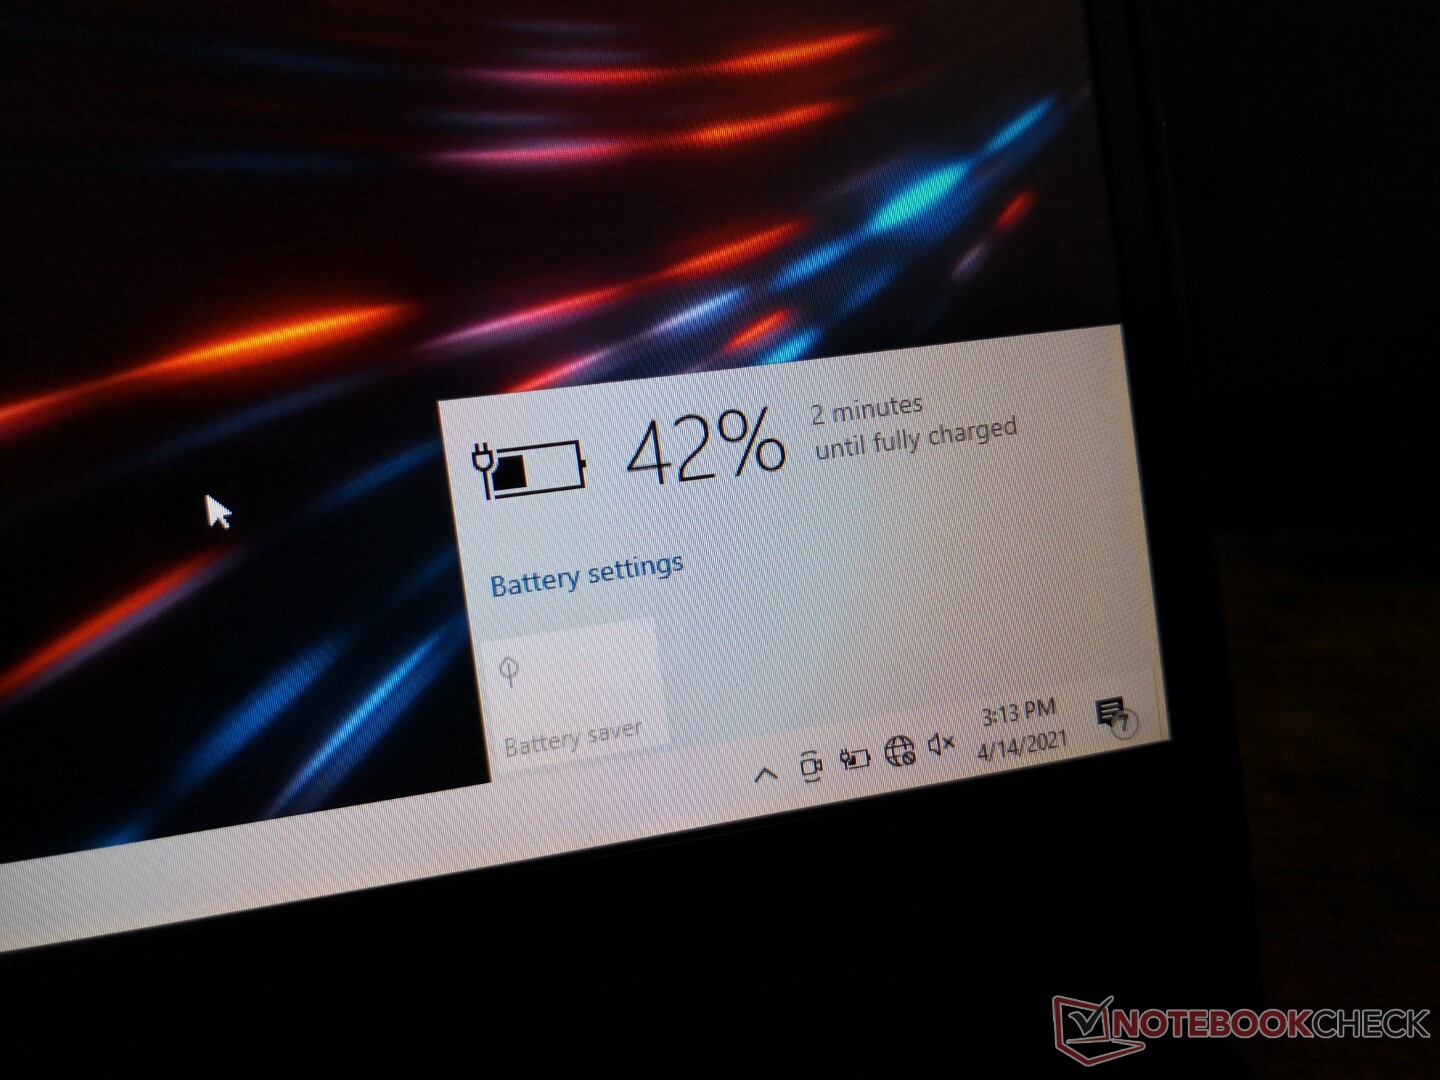
La velocidad de recarga desde el vacío hasta la capacidad total es muy lenta, más de 4 horas con el adaptador de CA incluido. Sospechamos que hay un error de carga porque el tiempo de recarga estimado también puede ser a veces inexacto. En comparación, la mayoría de los otros portátiles se recargan completamente en sólo 1,5 a 2 horas.
La batería se recarga aún más lentamente o no se recarga en absoluto cuando se ejecutan juegos. Por ejemplo, jugando Witcher 3 con un adaptador de CA y un 20% de carga de la batería durante una hora, la batería se cargará sólo un 23% (o un 3% en el transcurso de una hora).
| MSI GP66 Leopard 10UG i7-10870H, GeForce RTX 3070 Laptop GPU, 65 Wh | MSI GP65 10SFK-047US i7-10750H, GeForce RTX 2070 Mobile, 51 Wh | Alienware m15 R4 i9-10980HK, GeForce RTX 3070 Laptop GPU, 86 Wh | Aorus 15P XC i7-10870H, GeForce RTX 3070 Laptop GPU, 99 Wh | Asus ROG Zephyrus G15 GA503Q R9 5900HS, GeForce RTX 3080 Laptop GPU, 90 Wh | MSI GF65 Thin 10UE i7-10750H, GeForce RTX 3060 Laptop GPU, 51 Wh | |
|---|---|---|---|---|---|---|
| Duración de Batería | -27% | -34% | 42% | 72% | 23% | |
| Reader / Idle (h) | 6.6 | 3.7 -44% | 9.5 44% | 12.1 83% | 11.1 68% | |
| WiFi v1.3 (h) | 5.1 | 3.7 -27% | 2.7 -47% | 6.7 31% | 9.4 84% | 4.6 -10% |
| Load (h) | 1 | 0.9 -10% | 1.5 50% | 1.5 50% | 1.1 10% |
Pro
Contra
Veredicto
Después de dos años con el GP65 el GP66 es una renovación completa y una gran mejora en general. Puede que se haya hecho un poco más grande de una generación a otra, pero el aumento de tamaño parece justificado teniendo en cuenta el salto en el rendimiento gráfico, las mejoras en el ruido de los ventiladores, las temperaturas más bajas del núcleo, el diseño más elegante y la mayor duración de la batería. Las impresiones generales son muy parecidas a las del GE66, que se supone que es el modelo de gama alta.
El GP66 supera su peso de gama media para ser tan bueno como muchos modelos de gama alta.
Sin embargo, hay un gran asterisco por encima de "gama media", ya que el GP66 no es barato por el momento a pesar de su clasificación. Los precios oscilan entre 2500 y 3000 dólares para estar en la categoría de gama alta o entusiasta. Esperamos que esto sea sólo un problema de suministro que pueda resolverse en poco tiempo, ya que definitivamente podemos ver a la GP66 convirtiéndose en un modelo popular debido a sus atributos superiores a la media en general.
A pesar de su precio de gama alta, sigue siendo un portátil de juegos de gama media, por lo que los usuarios deben ser conscientes de sus carencias. No tiene Thunderbolt, cámara IR o lector de tarjetas SD, por ejemplo, y la pantalla es más tenue que la de la mayoría de portátiles para juegos. La lenta e inconsistente tasa de recarga de la batería merece sin duda un examen más detallado. Hasta entonces, no esperes que la batería se cargue a un ritmo decente cuando juegues.
Precio y disponibilidad
Sólo Newegg y Walmart tienen configuraciones de MSI GP66 en stock en el momento de escribir este artículo. La opción Newegg https://click.linksynergy.com/deeplink?id=taB4NgzQJ94&mid=44583&murl=https://www.newegg.com/black-msi-gp66-leopard-10ug-218/p/2WC-000C-04JB0es la más similar a nuestra unidad de análisis pero con el Core i7-10875H más rápido por $3000 USD mientras que Walmart tiene el SKU RTX 3080 con la mitad de la RAM del sistema por $3000 USD.
MSI GP66 Leopard 10UG
- 04/18/2021 v7 (old)
Allen Ngo
Price comparison

