

Notebookcheck Logo
Teaser

Reseña del HP HyperX Omen 16: una de las CPU de AMD más rápidas para los jugadores habituales

Un nuevo comienzo para HyperX.

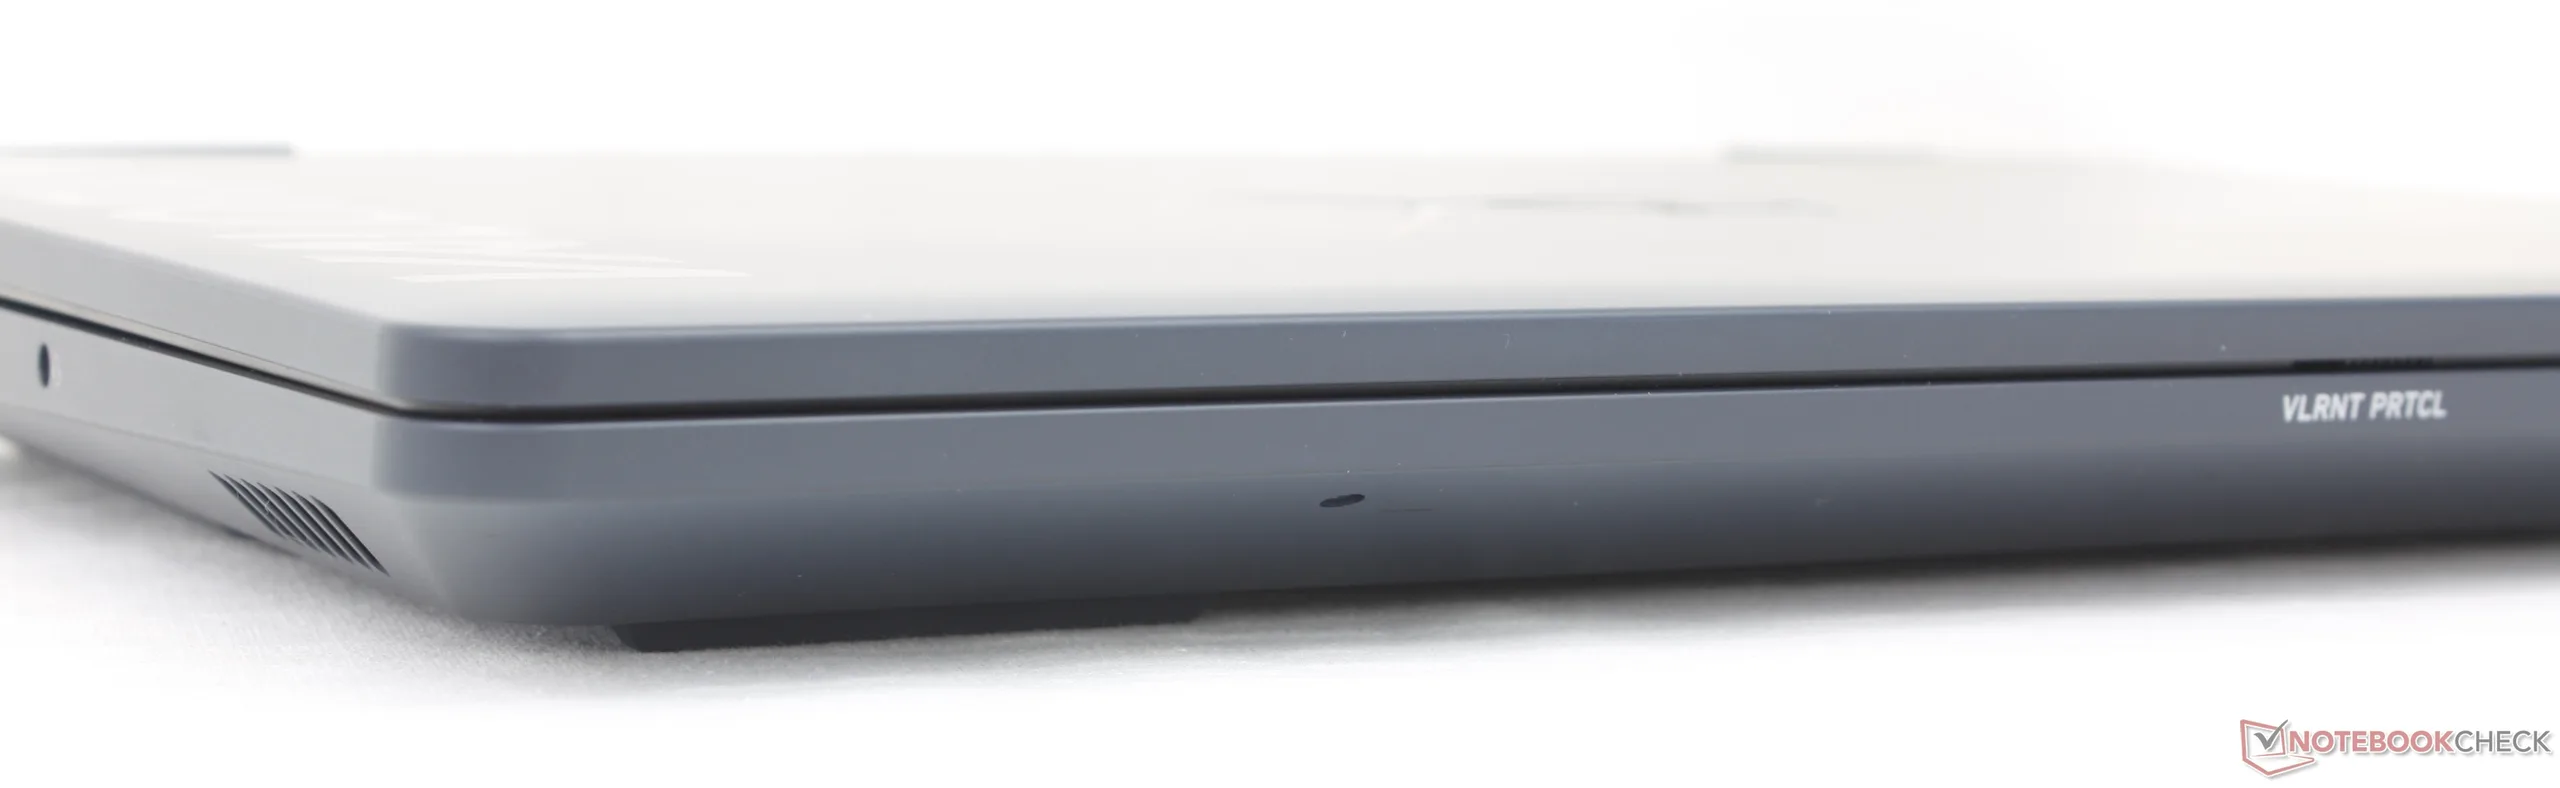
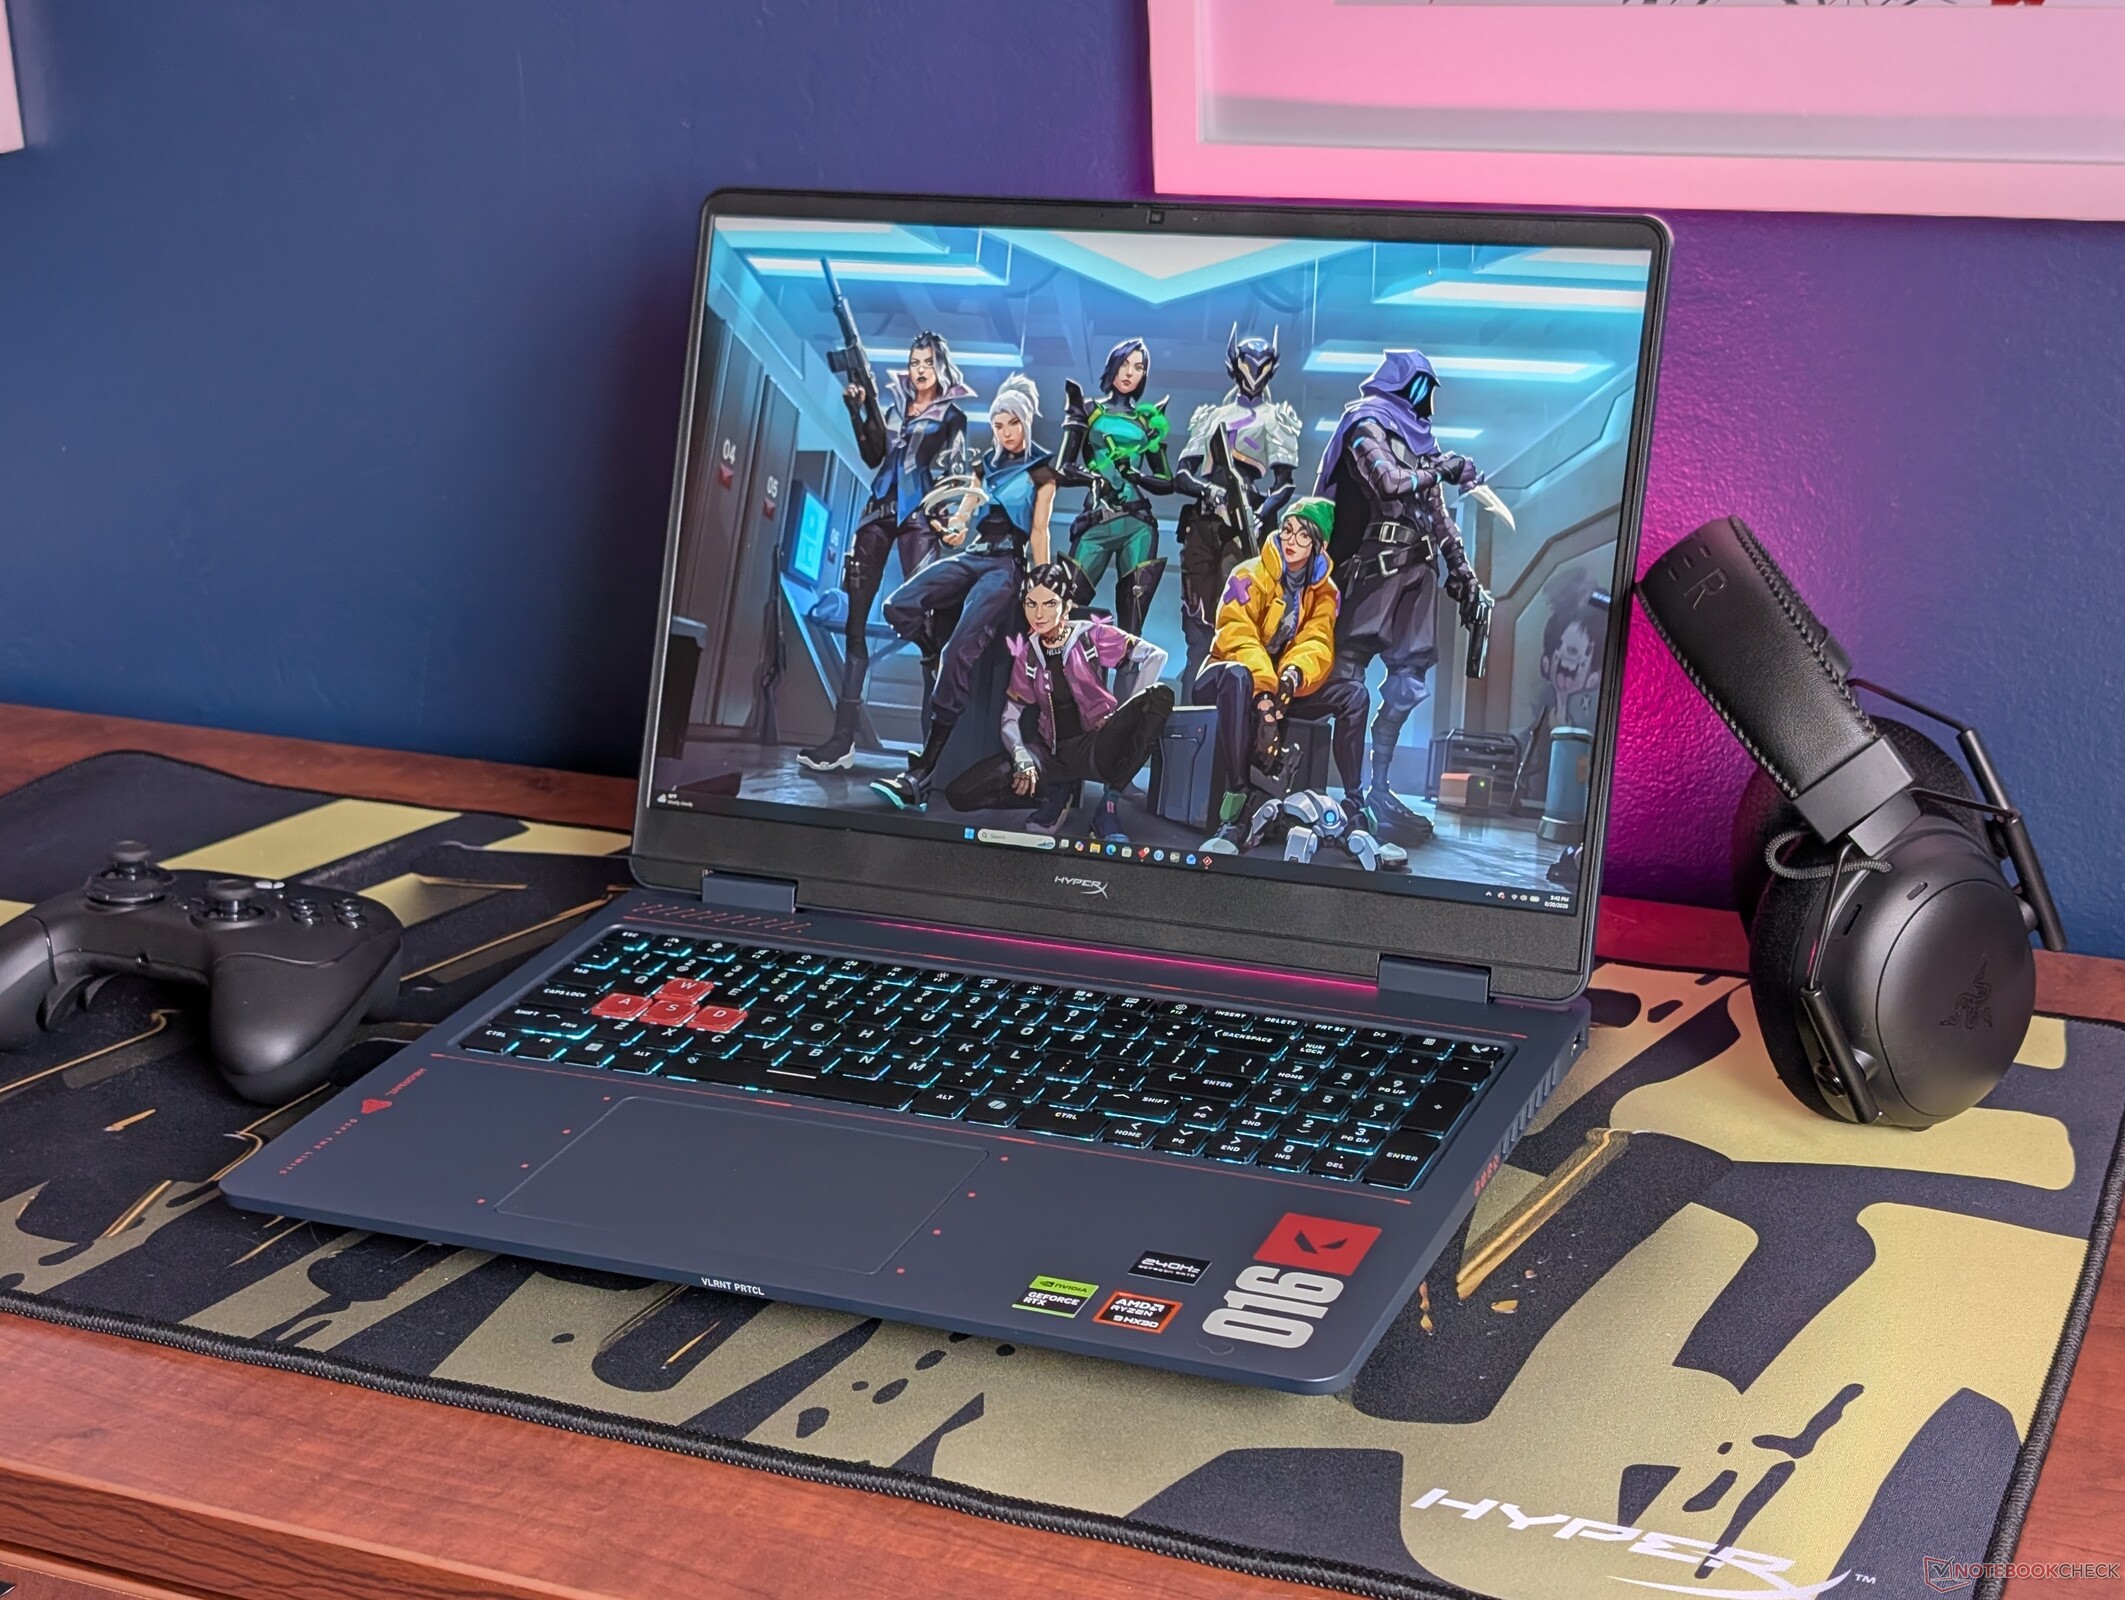
A pesar de reutilizar el mismo diseño de chasis y los mismos puertos que el Omen 16 de 2025, el modelo de 2026 incorpora una CPU más potente, una pantalla más rápida y de mayor resolución, y una disposición del teclado más clara que incluso los jugadores ocasionales podrán apreciar. Además, el diseño de la edición Valorant resulta sorprendentemente atractivo en un modelo que, por lo demás, es de gama media.
Allen Ngo, 👁 Allen Ngo (traducido por DeepL / Ninh Duy) Publicado 🇺🇸 🇳🇱 ...
AMD Geforce Gaming Laptop / Notebook

Veredicto: equilibrado para los FPS

En primer lugar, debemos felicitar a HP por haber diseñado un portátil para videojuegos temático que resulta realmente agradable a la vista. En la mayoría de los casos, las carcasas de edición limitada tienden a estar recargadas o a resultar llamativas, lo que puede hacer que pasen de moda con el tiempo. El HyperX Omen 16 Valorant Edition presenta una decoración minimalista y se basa más en una iconografía sencilla y colores discretos para representar el juego que en personajes complicados o gráficos llamativos. El aspecto resultante es, posiblemente, mejor que el del Omen 16 básico, siempre y cuando los usuarios puedan tolerar las inevitables manchas de huellas dactilares.

El propio «Valorant» también se adapta muy bien a las especificaciones de este equipo. Dado que el juego puede exigir bastante a la CPU cuando se buscan altas velocidades de fotogramas, el Ryzen 9 9955HX3D es uno de los mejores procesadores AMD portátiles para esta tarea. Prescindir de G-Sync y de la iluminación RGB por tecla es, sin duda, más aceptable que optar por una pantalla de menor calidad.

Más allá de las mejoras superficiales, el HyperX Omen 16 de 2026 no es, sin embargo, más que una actualización menor con respecto al Omen 16 de 2025, ya que la estructura subyacente y la placa base se mantienen prácticamente sin cambios. En cambio, son la CPU Zen 5 más rápida, la pantalla IPS mejorada y el teclado modificado los que ayudan a distinguir el modelo de 2026 del del año anterior. Tenga en cuenta que muchos de estos cambios conllevan unos niveles de consumo energético más elevados que antes, lo que se traduce en una menor autonomía de la batería en general. También se recomienda el uso de auriculares, ya que el ruido de los ventiladores puede resultar molesto si no se juega en modo «Equilibrado».

Pro

+ Fácil mantenimiento; admite 2 módulos SODIMM + 2 unidades SSD M.2
+ Pantalla IPS QHD de 240 Hz de alta calidad con gama completa de colores sRGB
+ Teclas cómodas con teclado numérico integrado
+ Rendimiento bruto de la CPU muy rápido
+ Aspecto visualmente atractivo de Valorant

Contra

- escasa autonomía de la batería; elevado consumo energético
- ventiladores muy ruidosos en el modo «Unleashed»
- los altavoces podrían tener más volumen
- iluminación de las teclas solo en tres zonas
- atrae las huellas dactilares
- sin G-Sync

Precio y disponibilidad

HP comercializa actualmente el HyperX Omen 16 Valorant Edition por 2250 dólares.

Amazon Logo
$1,590.89
HP OMEN MAX 16-ak0047nr 16" WQXGA 240Hz Gaming Laptop, AMD Ryzen AI 7 H 3

El HyperX Omen 16 de 2026 es un portátil para juegos de gama media destinado a sustituir al Omen 16 de 2025 del año pasado. HP ha ido renombrando progresivamente muchos de sus modelos Omen como HyperX, tal y como se reveló durante el CES 2026, por lo que el nuevo HyperX Omen 16 es uno de los primeros en lucir el nombre actualizado.

Nuestra unidad de prueba es la edición Valorant del HyperX Omen 16, con detalles en rojo a juego. Sin embargo, más allá de las diferencias superficiales, el chasis es, por lo demás, idéntico al del Omen 16 de 2025. La única configuración de la edición Valorant viene equipada con la relativamente poco común CPU AMD Ryzen 9 9955HX3D, una GPU GeForce RTX 5070 de 115 W y una pantalla IPS de 240 Hz y 1600p, por un precio aproximado de 2250 dólares.

Entre los competidores en este segmento se encuentran otros portátiles para juegos de 16 pulgadas de gama general, como el MSI Crosshair A16, el Lenovo Legion Pro 5 16 o el Alienware 16X Aurora.

Más reseñas de HP:

Especificaciones

HP HyperX Omen 16 16-ap1931nr
Procesador
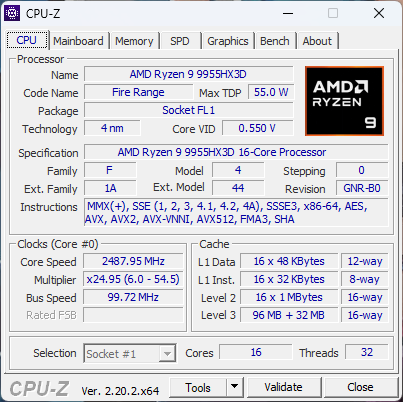
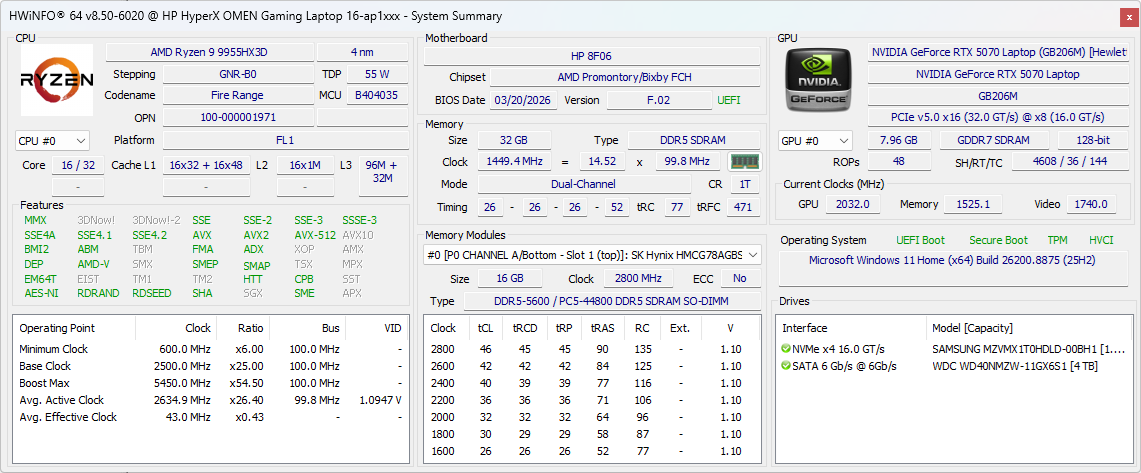
AMD Ryzen 9 9955HX3D 16c/32t, 16 x 5.4 GHz AMD Zen 5, 117 W PL2 / Short Burst, 105 W PL1 / Sustained, Fire Range-HX (Zen 5)
Adaptador gráfico
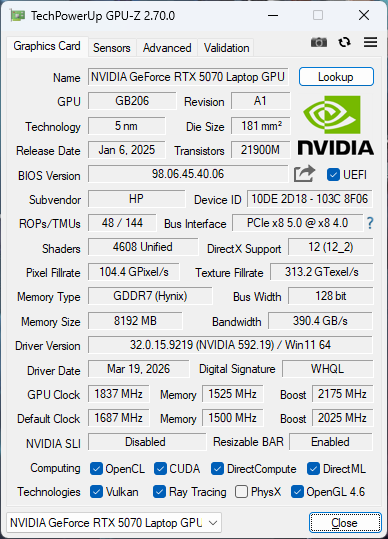
NVIDIA GeForce RTX 5070 Laptop - 8 GB VRAM, Núcleo: 2175 MHz, Memoría: 1525 MHz, 115 W TDP, GDDR7, 592.19, Advanced Optimus
Memoría
32 GB 
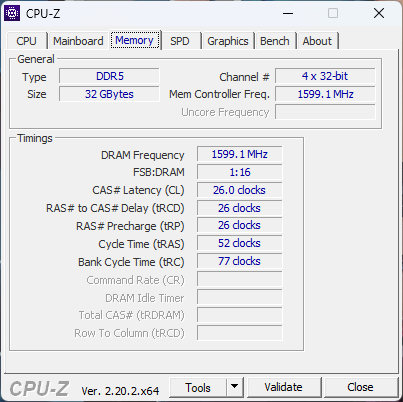
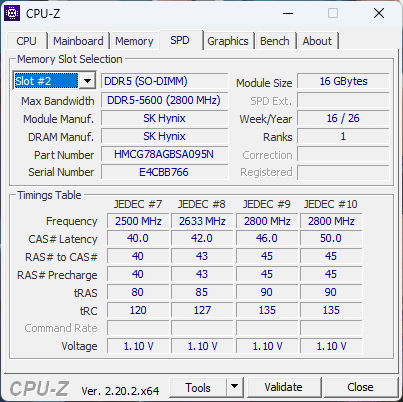
, SK Hynix, DDR5-5600, Dual-Channel, 2x SODIMM
pantalla
16.00 pulgadas 16:10, 2560 x 1600 pixels 189 PPI, BOE0CD1, IPS, lustroso: no, 240 Hz
Placa base
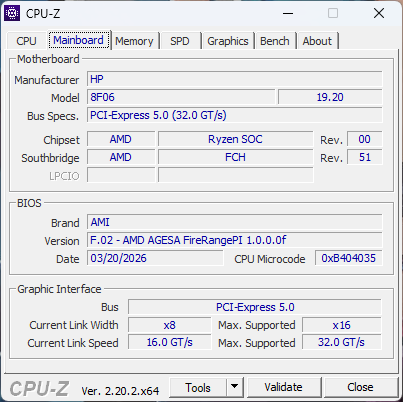
AMD Promontory/Bixby FCH
Tarjeta de sonido
AMD Zen - Audio Processor - HD Audio Controller
Conexiones
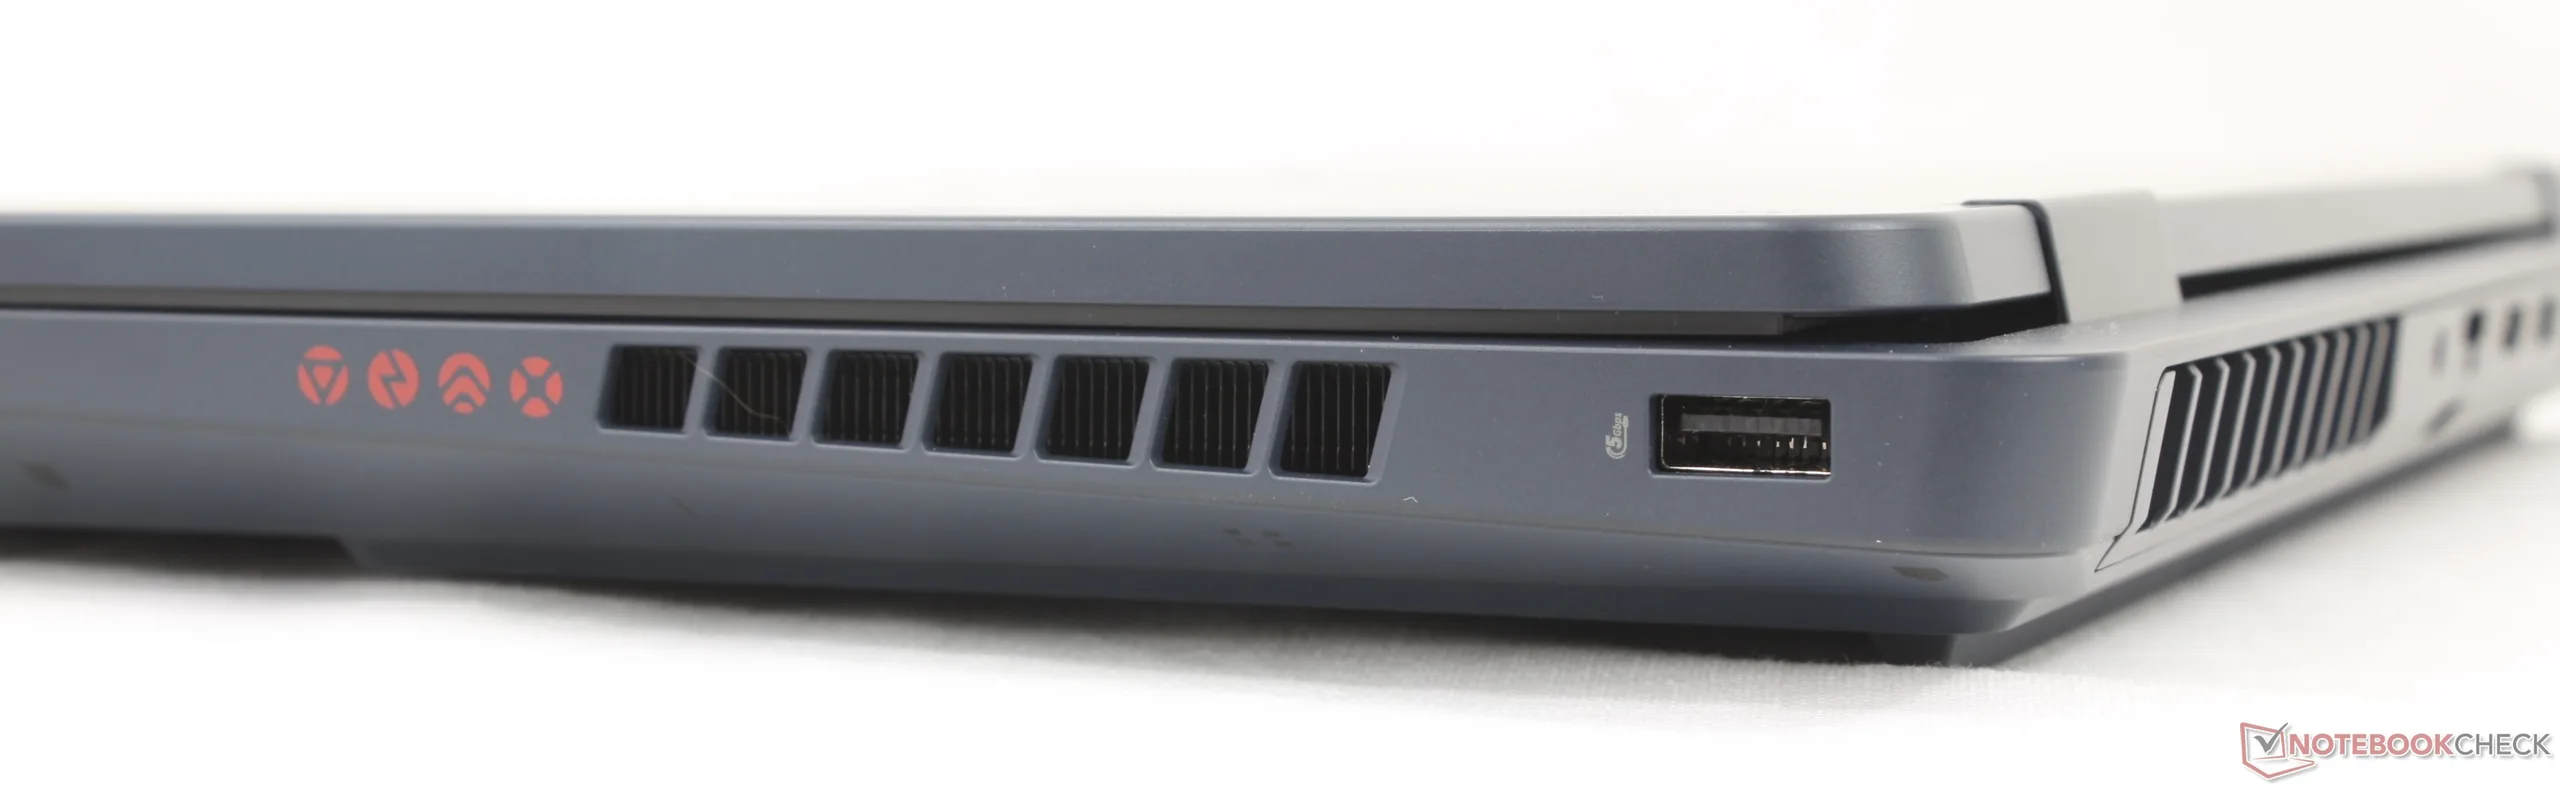
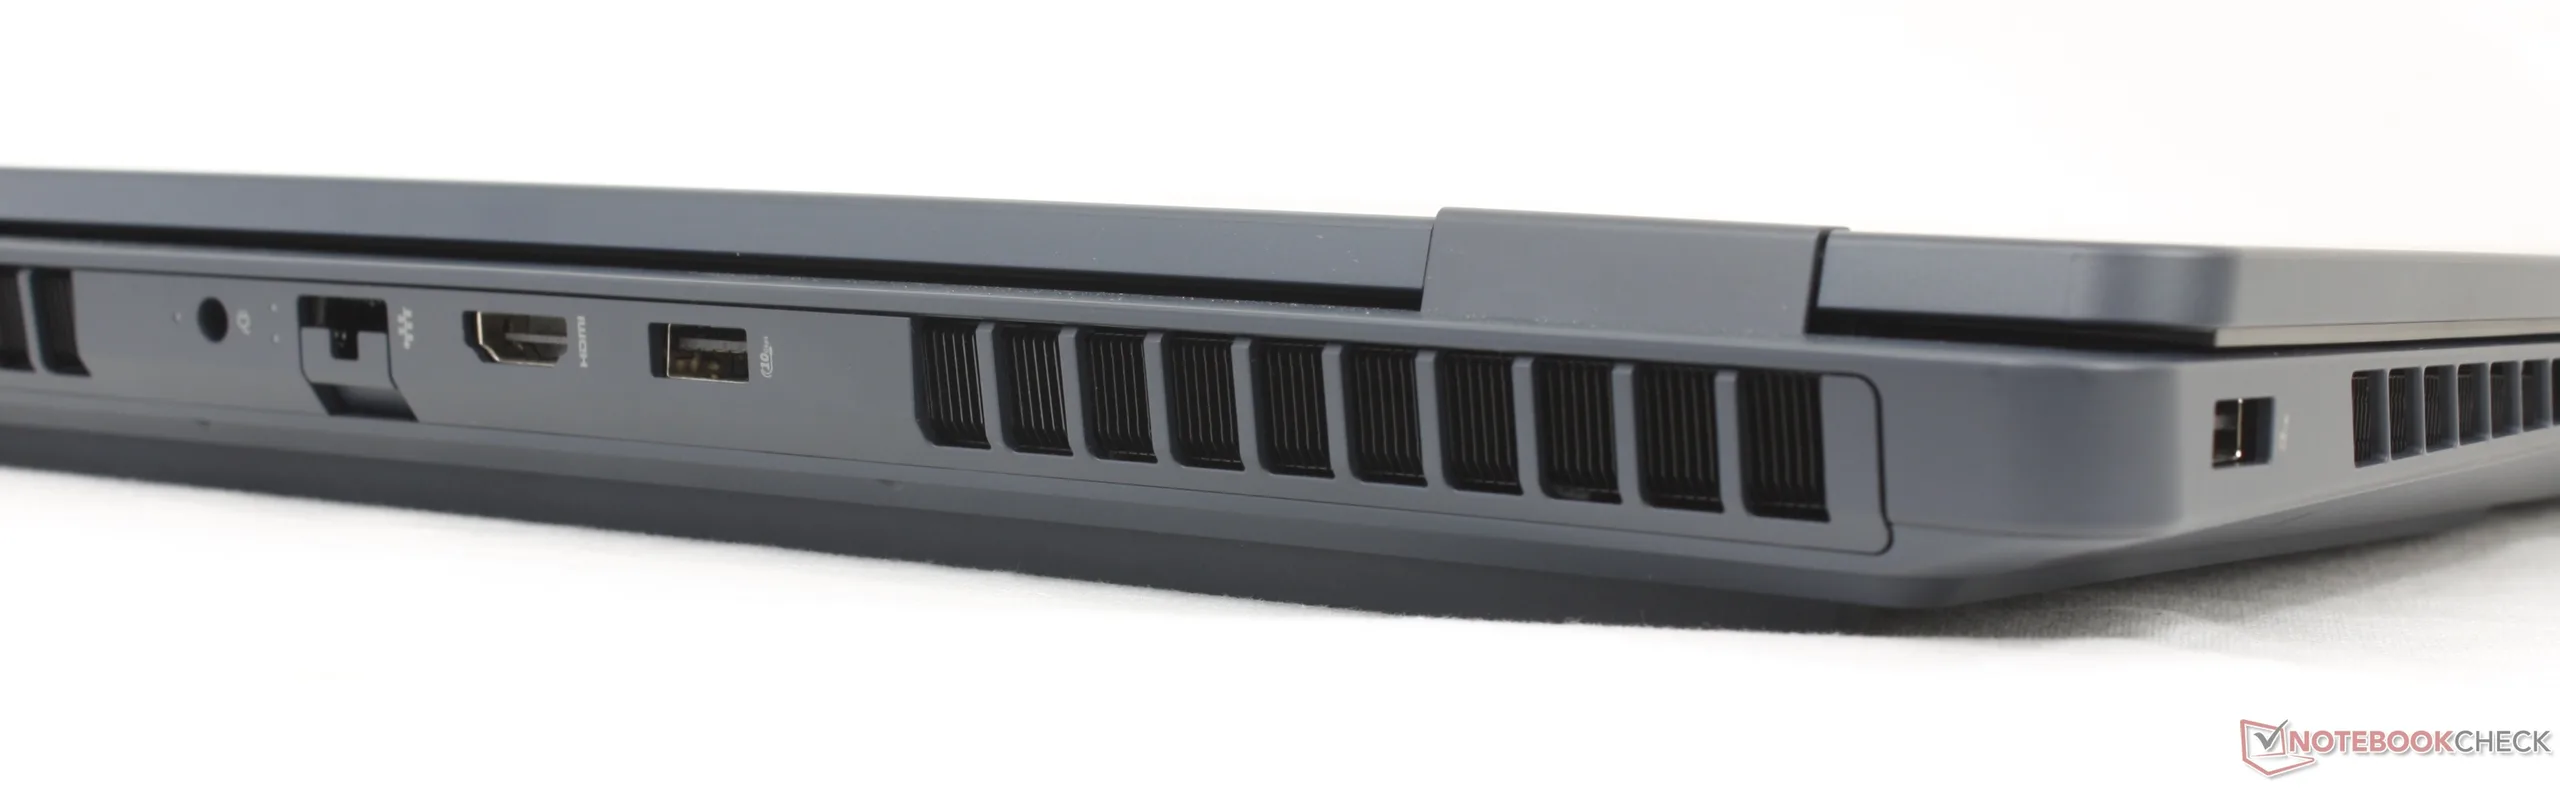
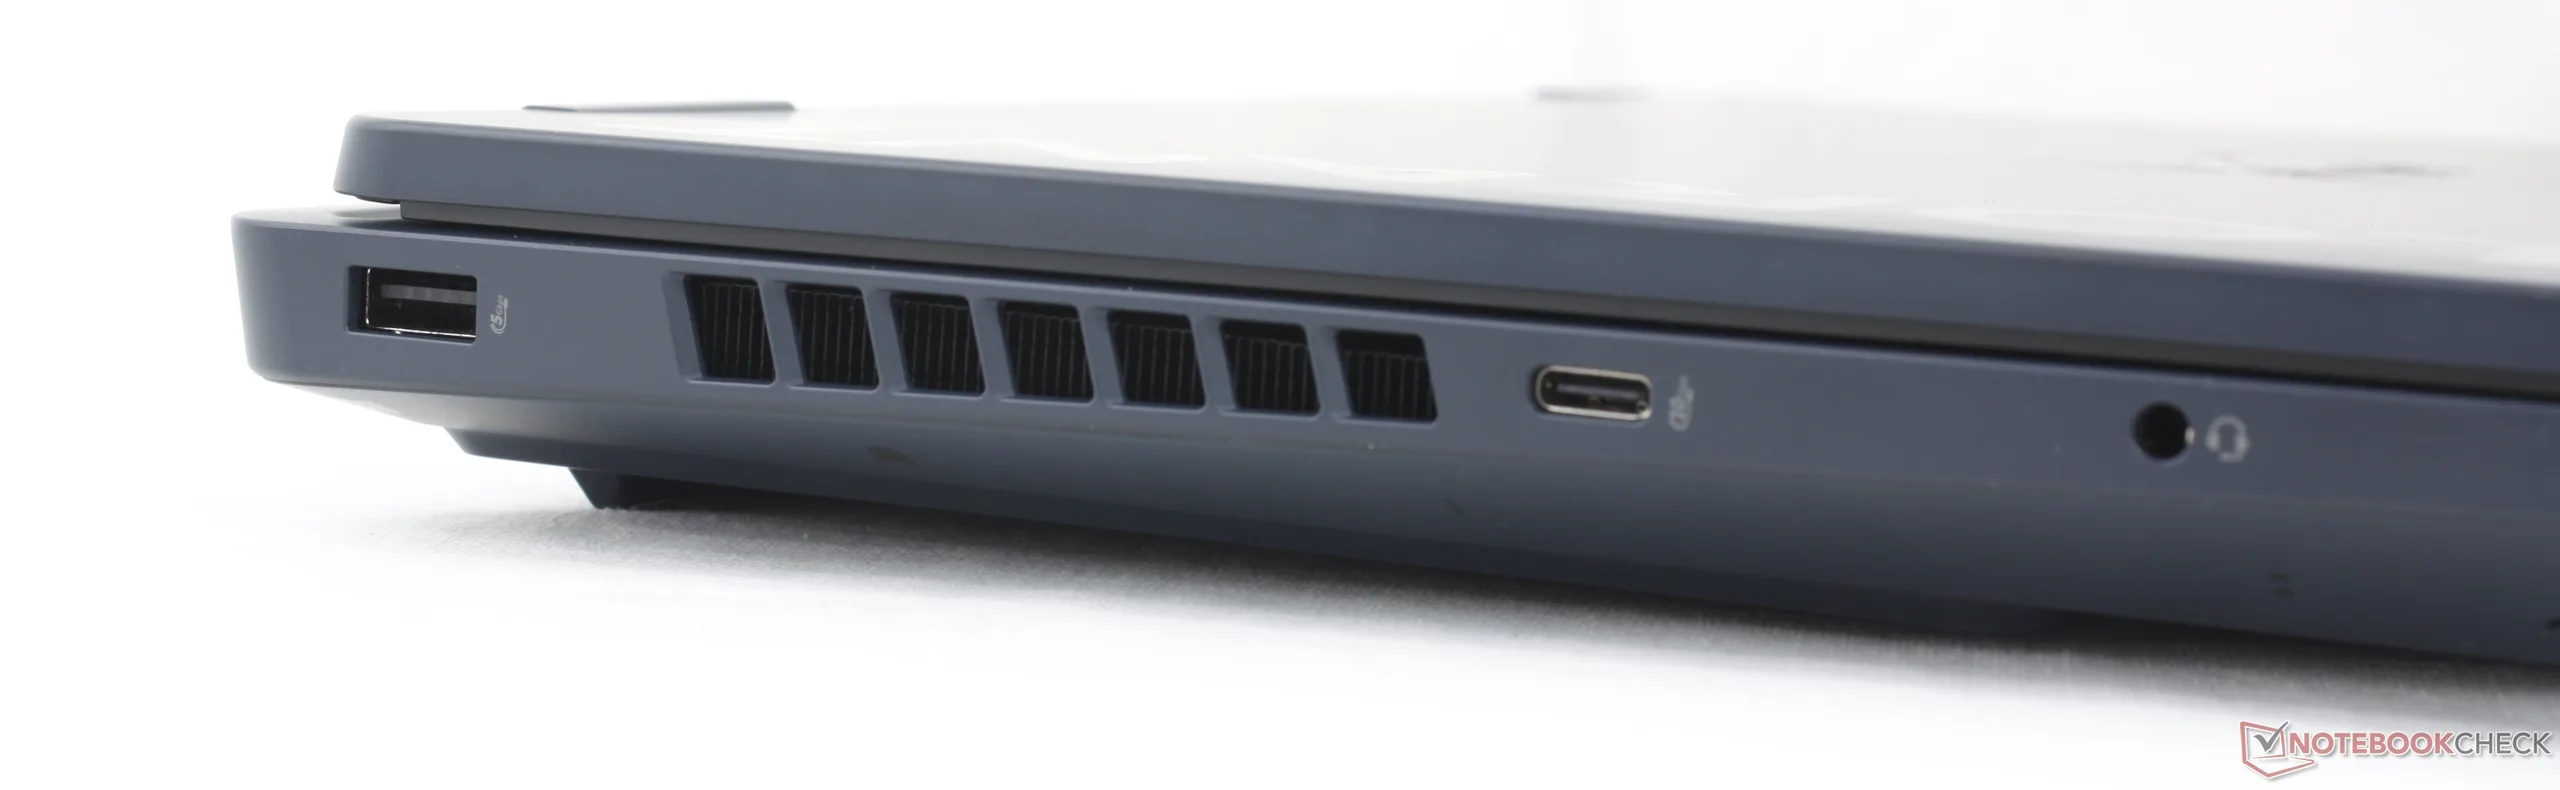
2 USB 3.0, 2 USB 3.1 Gen2, USB-C Power Delivery (PD), 1 HDMI, 1 DisplayPort, Audio Conexiones: 3.5 mm combo
Equipamento de red
Realtek RTL8168/8111 Gigabit-LAN (10/100/1000MBit/s), Mediatek Wi-Fi 7 MT7925 Wireless LAN Card (a/b/g/ac = Wi-Fi 5/ax = Wi-Fi 6/ Wi-Fi 6E 6 GHz be = Wi-Fi 7), Bluetooth 6.0
Tamaño
Alto x ancho x profundidad (en mm): 30 x 357 x 269
Battería
83 Wh Litio-Polimero, 8-cell
Sistema Operativo
Microsoft Windows 11 Home
Cámara
Webcam: 1080p30
Cámara principal: 2 MPix
Características adicionales
Altavoces: Stereo, Teclado: Chiclet, Luz de Teclado: si, HP Smart, Omen Gaming Hub, 12 Meses Garantía
Peso
2.439 kg, Suministro de Electricidad: 866 g
Precio
2250 USD
Amazon
Nota: El fabricante puede utilizar componentes de diferentes proveedores, incluidos paneles de visualización, unidades o lápices de memoria con especificaciones similares.


Caso

El chasis es idéntico al del modelo de 2025, pero presenta dos cambios importantes. En primer lugar, se ha rediseñado el teclado con teclas de flecha más grandes y una disposición más clara. En segundo lugar, los logotipos de Omen del bisel interior y la tapa exterior se han sustituido por los de HyperX. Por lo demás, el diseño básico no ha sufrido cambios, ni siquiera en lo que respecta a los puertos.
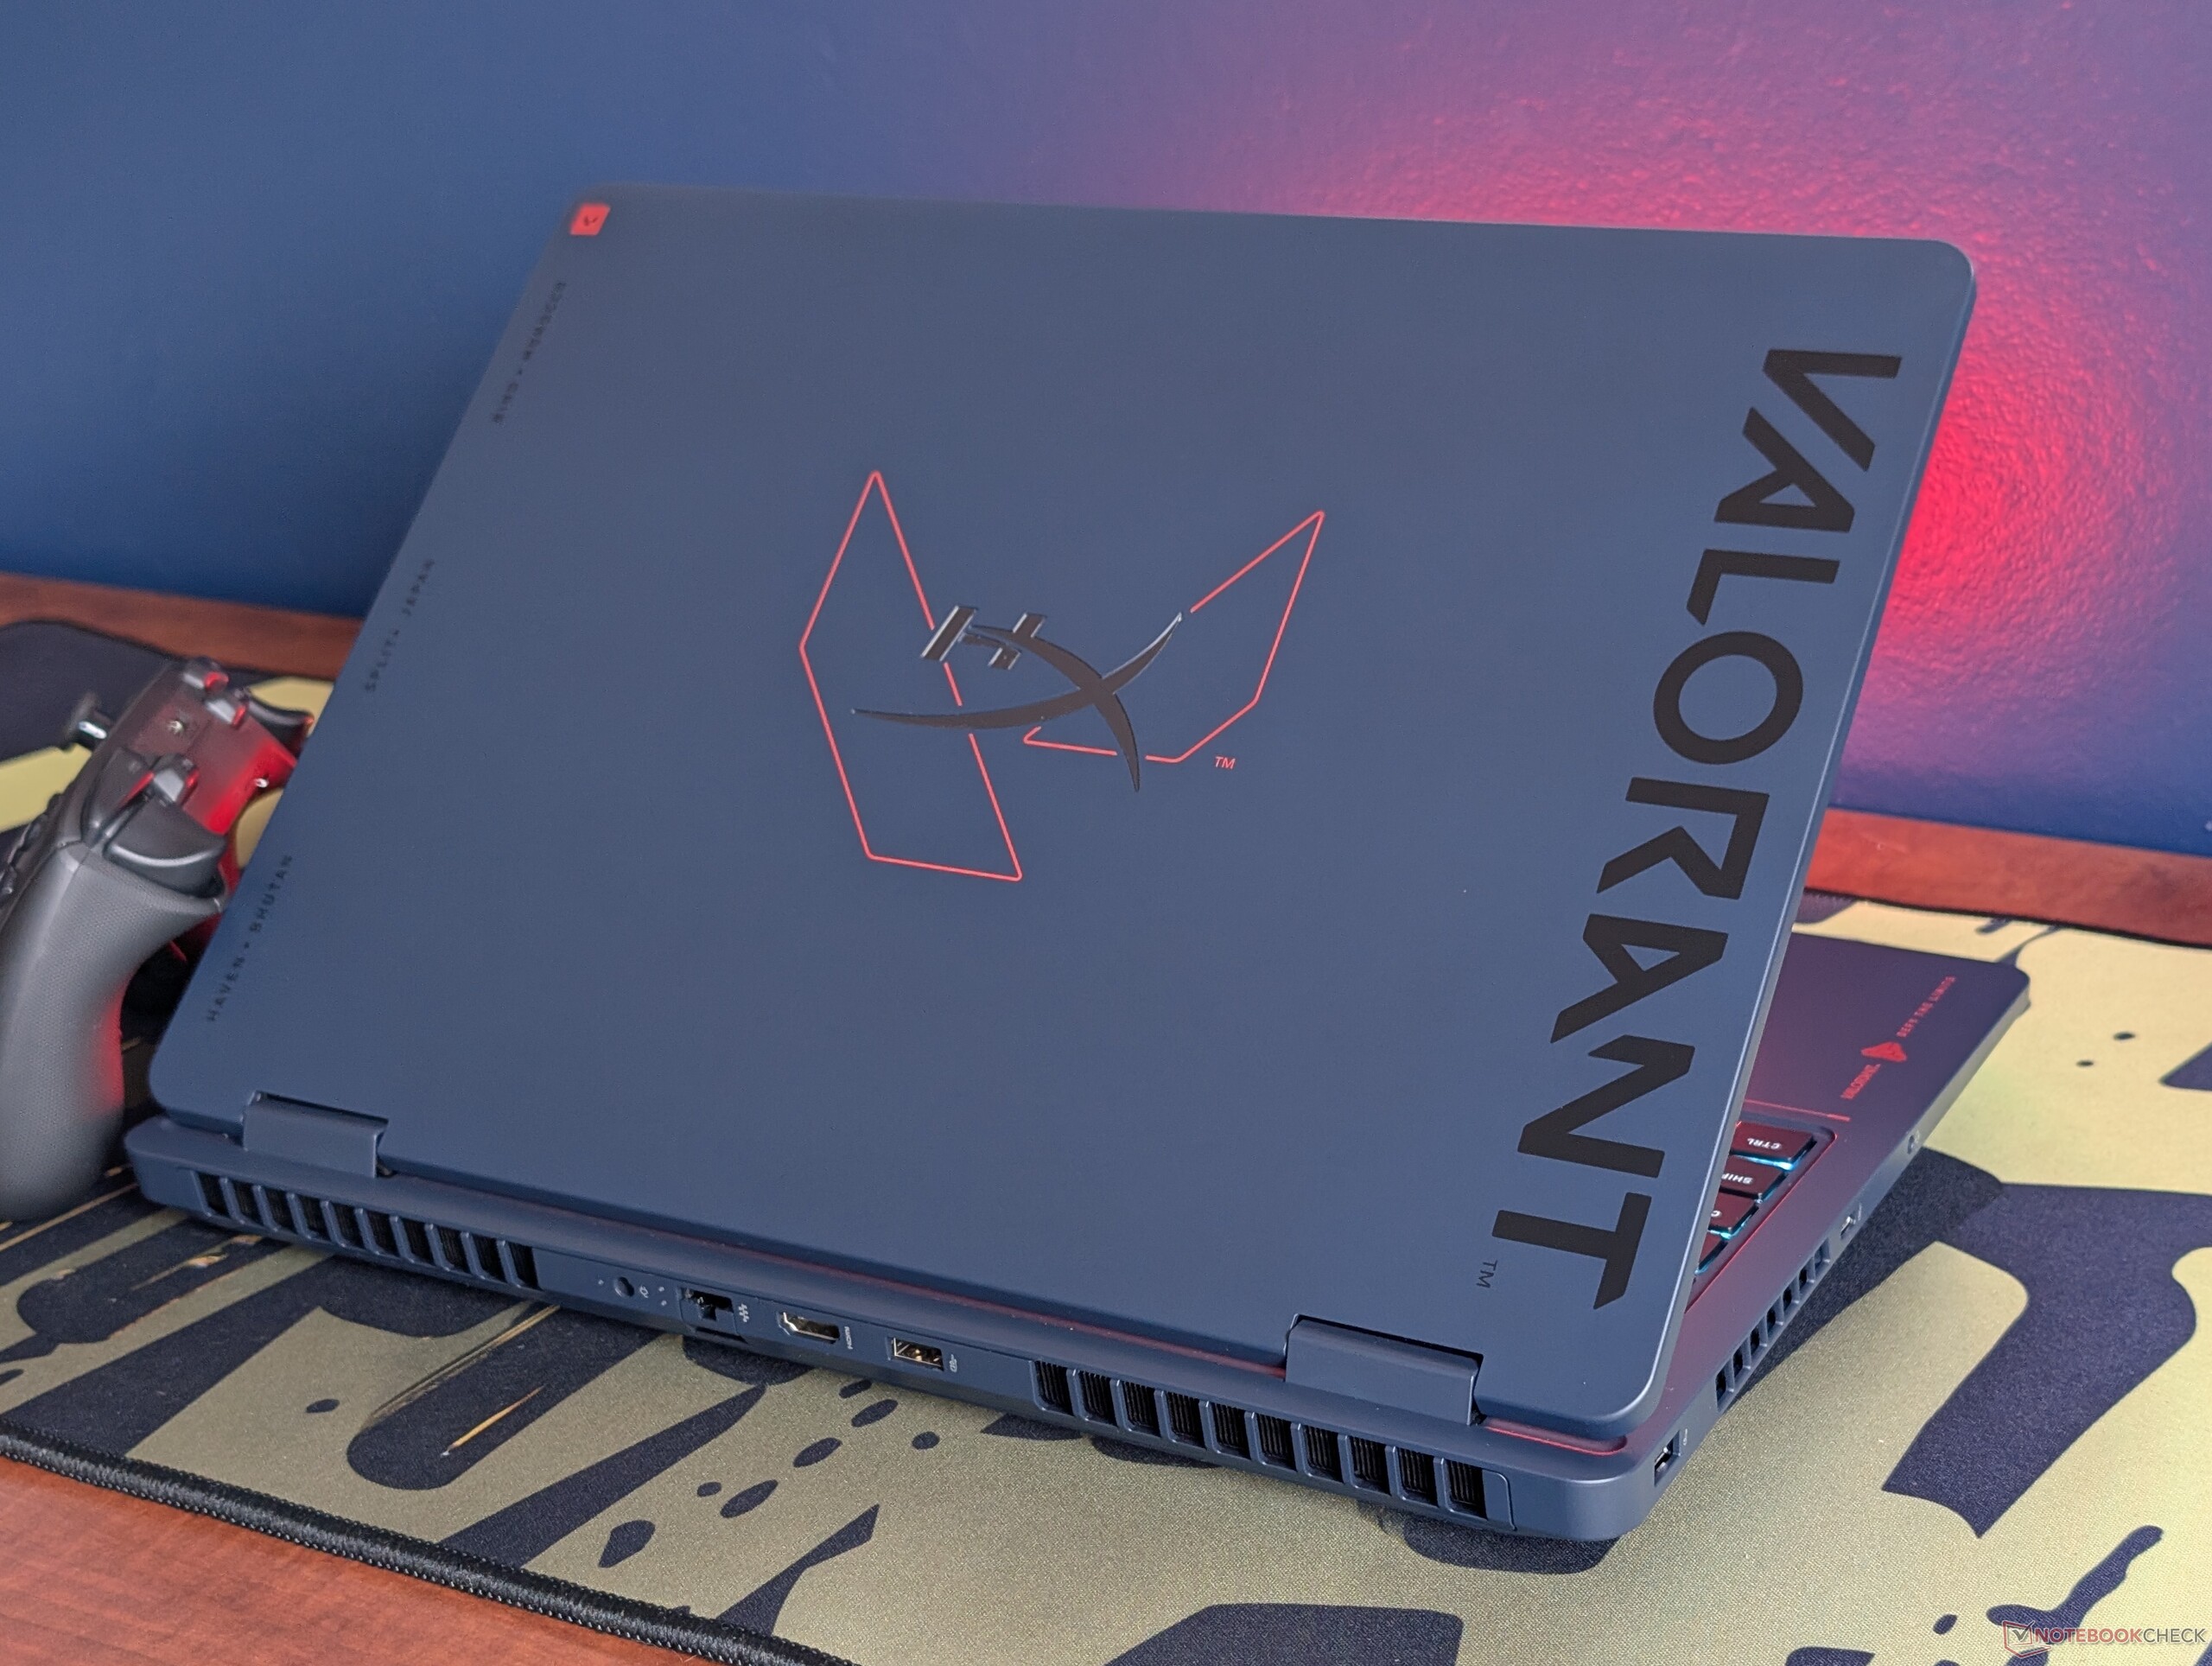
Comparación de tamaños

364.38 mm 268.06 mm 25.95 mm 2.3 kg363 mm 269.7 mm 25.55 mm 2.3 kg357 mm 269 mm 30 mm 2.4 kg357.5 mm 269 mm 23.7 mm 2.4 kg356.98 mm 265.43 mm 23.4 mm 2.6 kg354 mm 269 mm 25.7 mm 2.2 kg297 mm 210 mm 1 mm 5.7 g

Conectividad

Parte frontal: Sin puertos
Correcto: USB-A (5 Gbitps)
Parte trasera: adaptador de CA, RJ-45 (1 Gbps), HDMI 2.1, USB-A (10 Gbitps)
Izquierda: USB-A (5 Gbitps), USB-C (10 Gbitps), auriculares de 3,5 mm

Comunicación

Networking
iperf3 receive AXE11000 6GHz
HP HyperX Omen 16 16-ap1931nr
Mediatek Wi-Fi 7 MT7925 Wireless LAN Card
1744 (1715min - 1767max) MBit/s
MSI Crosshair A16 HX E8WGK
MediaTek Wi-Fi 6E MT7922 160MHz Wireless LAN Card
1693 (1555min - 1755max) MBit/s -3%
Alienware 16X Aurora Core Ultra 9 290HX Plus
Mediatek Wi-Fi 7 MT7925 Wireless LAN Card
1506 (1352min - 1594max) MBit/s -14%
iperf3 transmit AXE11000 6GHz
Lenovo Legion Pro 5 16IAX10, RTX 5070
Mediatek Wi-Fi 7 MT7925 Wireless LAN Card
1868 (897min - 1974max) MBit/s +18%
MSI Crosshair A16 HX E8WGK
MediaTek Wi-Fi 6E MT7922 160MHz Wireless LAN Card
1781 (1713min - 1841max) MBit/s +13%
Alienware 16X Aurora Core Ultra 9 290HX Plus
Mediatek Wi-Fi 7 MT7925 Wireless LAN Card
1611 (1515min - 1687max) MBit/s +2%
HP HyperX Omen 16 16-ap1931nr
Mediatek Wi-Fi 7 MT7925 Wireless LAN Card
1581 (1434min - 1686max) MBit/s
010020030040050060070080090010001100120013001400150016001700Tooltip
HP HyperX Omen 16 16-ap1931nr; iperf3 receive AXE11000 6GHz; iperf 3.1.3: Ø1744 (1715-1767) MBit/s
HP HyperX Omen 16 16-ap1931nr; iperf3 receive AXE11000; iperf 3.1.3: Ø1436 (1250-1633) MBit/s

Cámara web

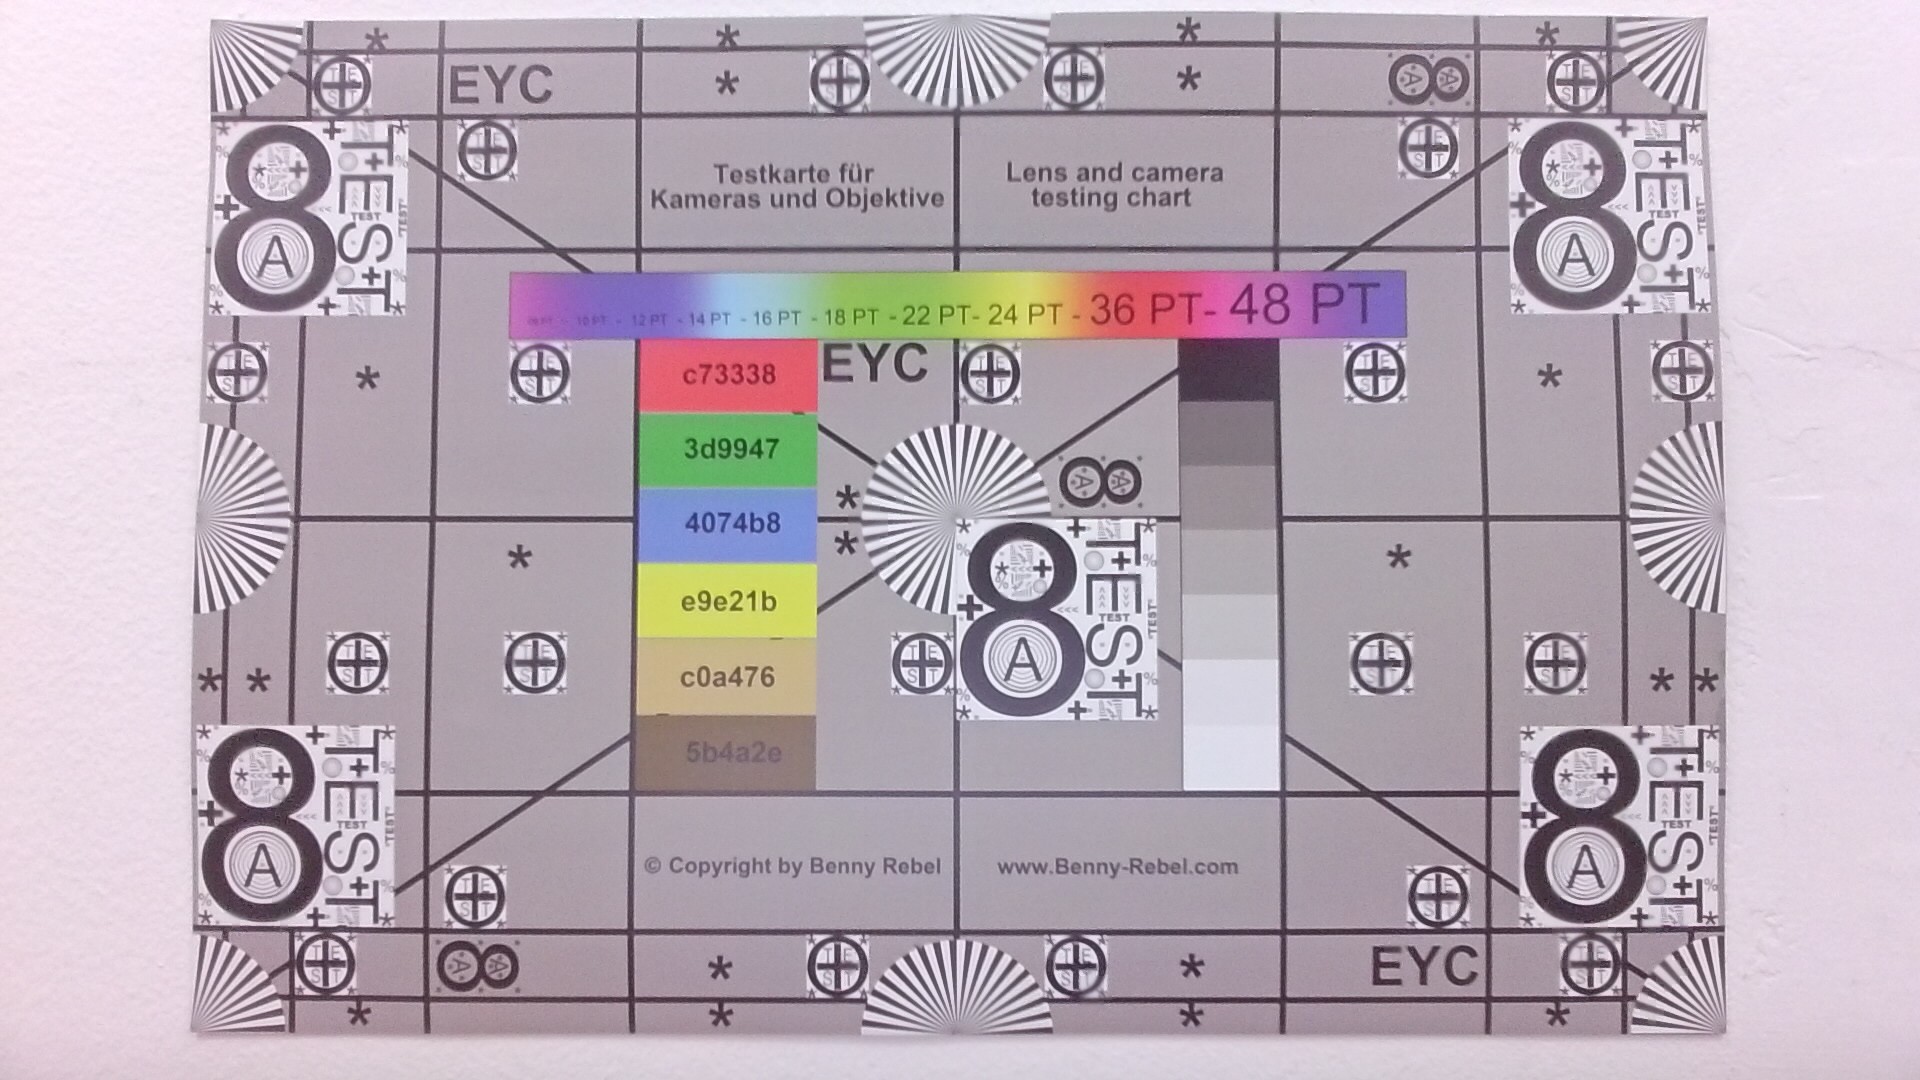
La cámara de 1080p incluye un obturador de privacidad integrado, pero no cuenta con infrarrojos.

ColorChecker
9.1 ∆E
12.1 ∆E
11.1 ∆E
16.4 ∆E
15.3 ∆E
16.6 ∆E
12.8 ∆E
13.2 ∆E
13.2 ∆E
11.2 ∆E
15.2 ∆E
22.5 ∆E
11.7 ∆E
17.8 ∆E
18.4 ∆E
15.5 ∆E
18.2 ∆E
24.1 ∆E
1.6 ∆E
10.2 ∆E
19.2 ∆E
20.7 ∆E
19.3 ∆E
10.8 ∆E
ColorChecker HP HyperX Omen 16 16-ap1931nr: 14.84 ∆E min: 1.57 - max: 24.1 ∆E

Mantenimiento

Al igual que ocurre con las pequeñas actualizaciones externas, el Omen 16 de 2026 es, internamente, bastante similar al modelo del año pasado, con características de actualización similares, como 2 SSD M.2 y 2 SODIMM.
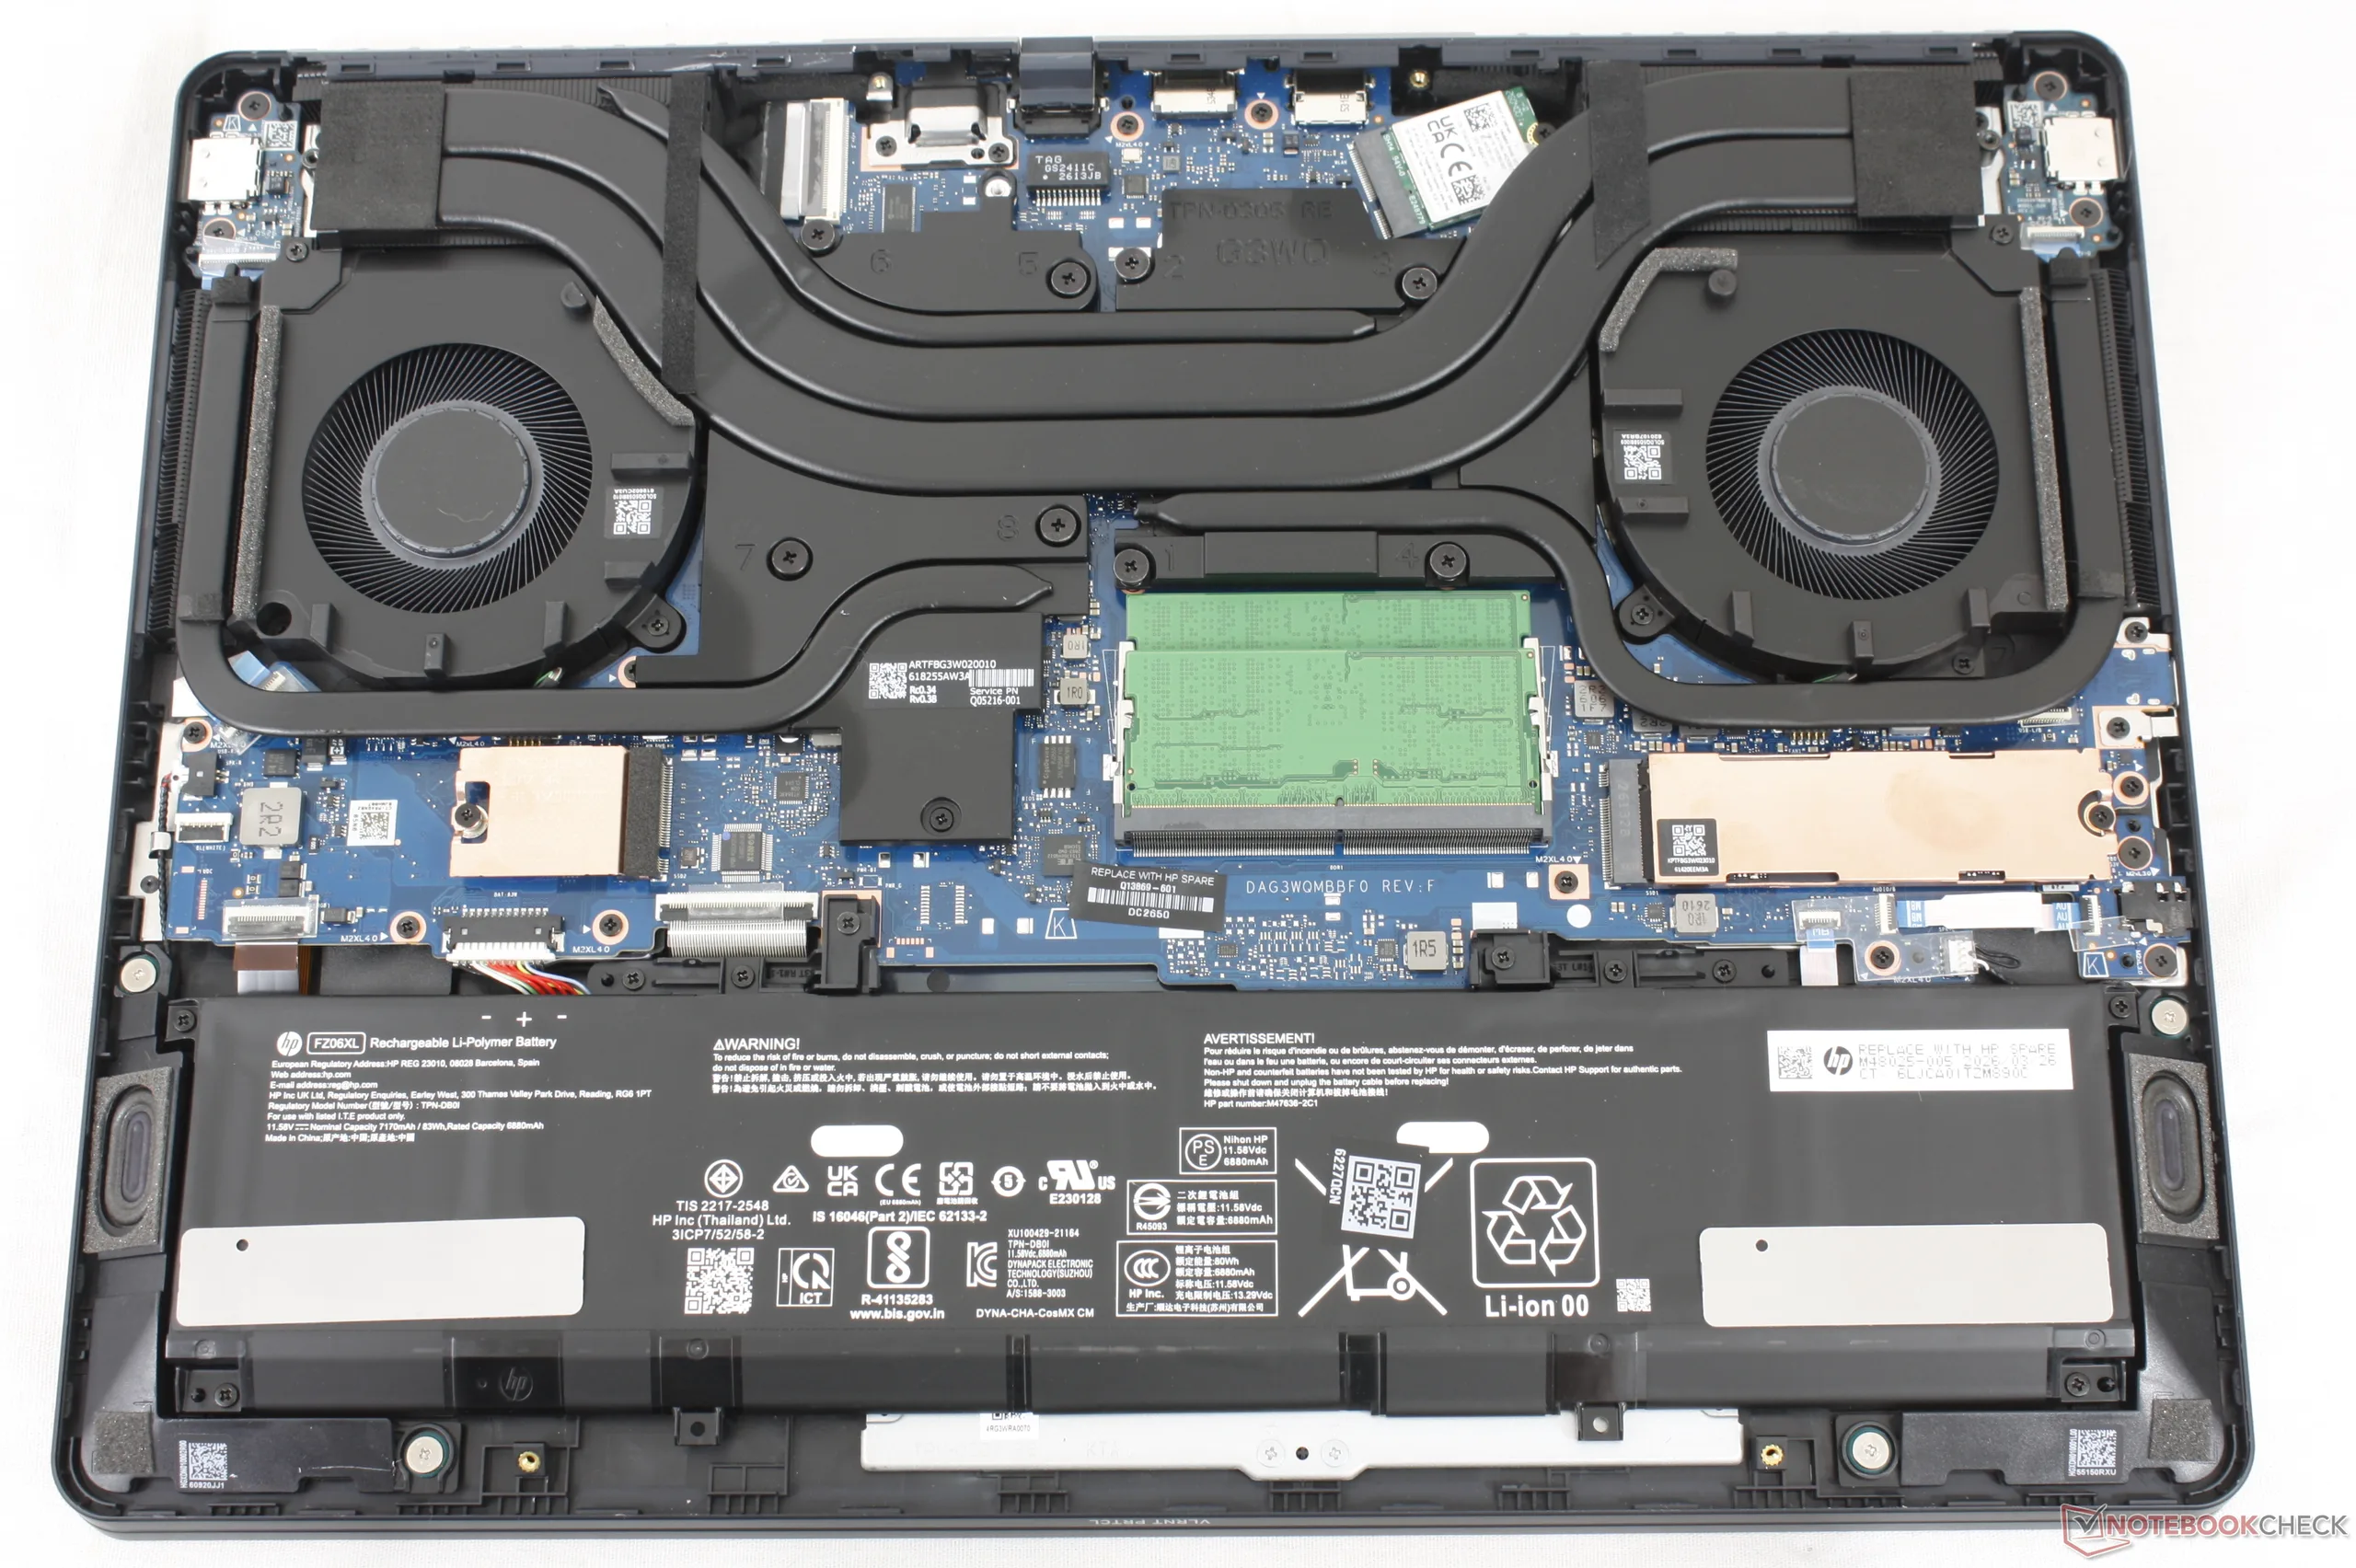
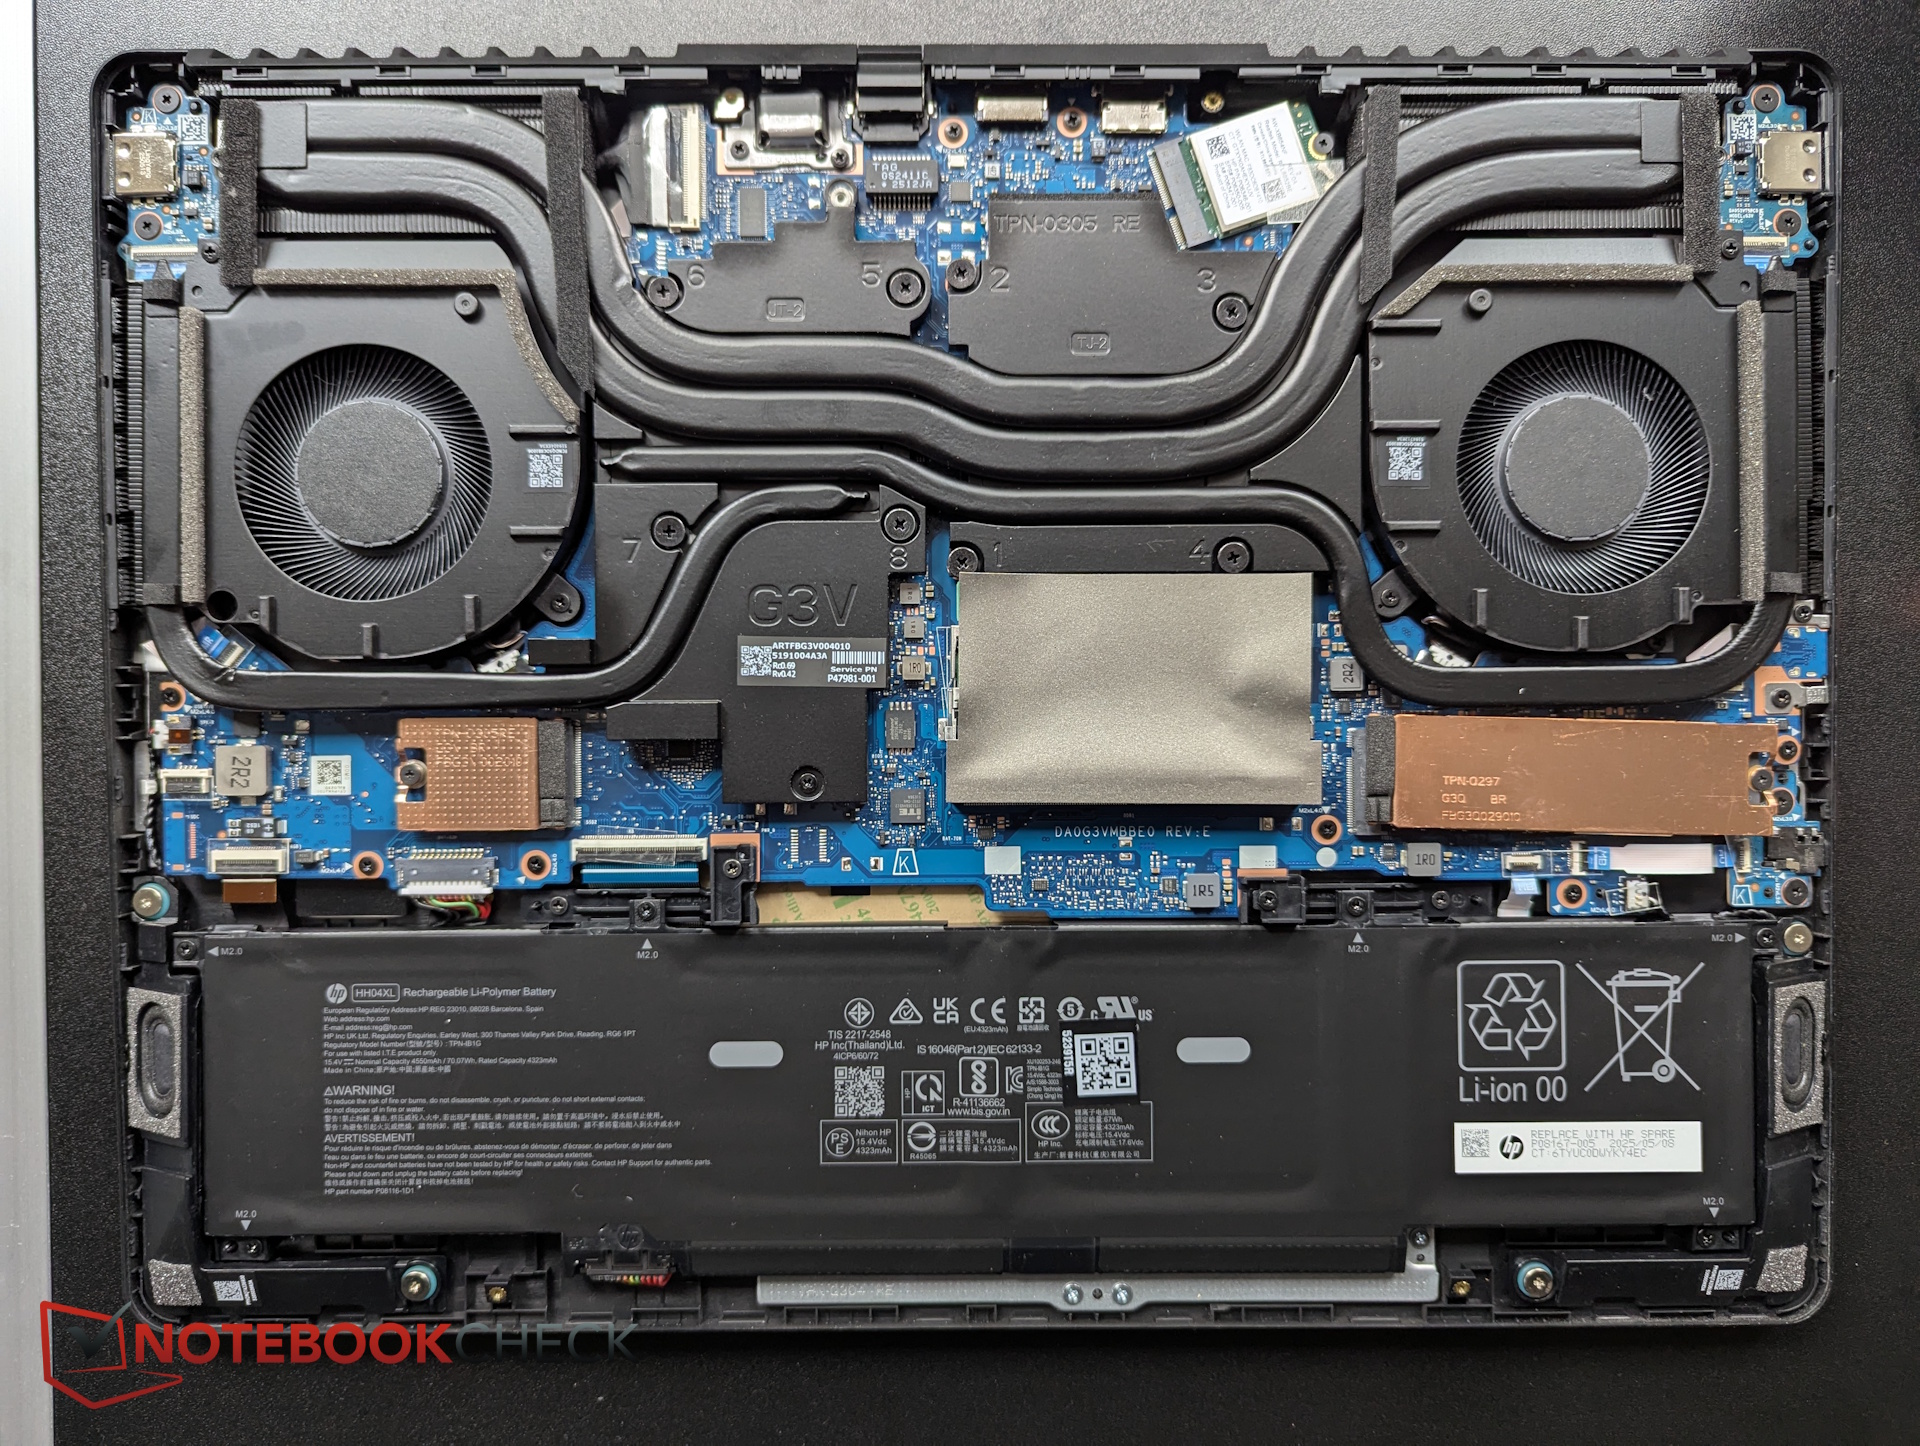
2026 Omen 16
2026 Omen 16
2025 Omen 16 a modo de comparación

Sostenibilidad

Las teclas del teclado están fabricadas con plásticos reciclados postconsumo, sin que se mencionen otras piezas ni las cantidades recicladas. El embalaje utiliza una pequeña cantidad de plástico para el envoltorio del adaptador de CA.

Accesorios y garantía

La caja no contiene ningún accesorio adicional, aparte del adaptador de CA y la documentación. Se aplica una garantía limitada del fabricante de un año si se adquiere en EE. UU.

Dispositivos de entrada

El teclado se ha rediseñado con respecto al Omen 16 de 2025 para incluir teclas de flecha más grandes y una disposición de fuentes más clara. El panel táctil, sin embargo, sigue siendo el mismo, con unas dimensiones de 12,5 x 8 cm.
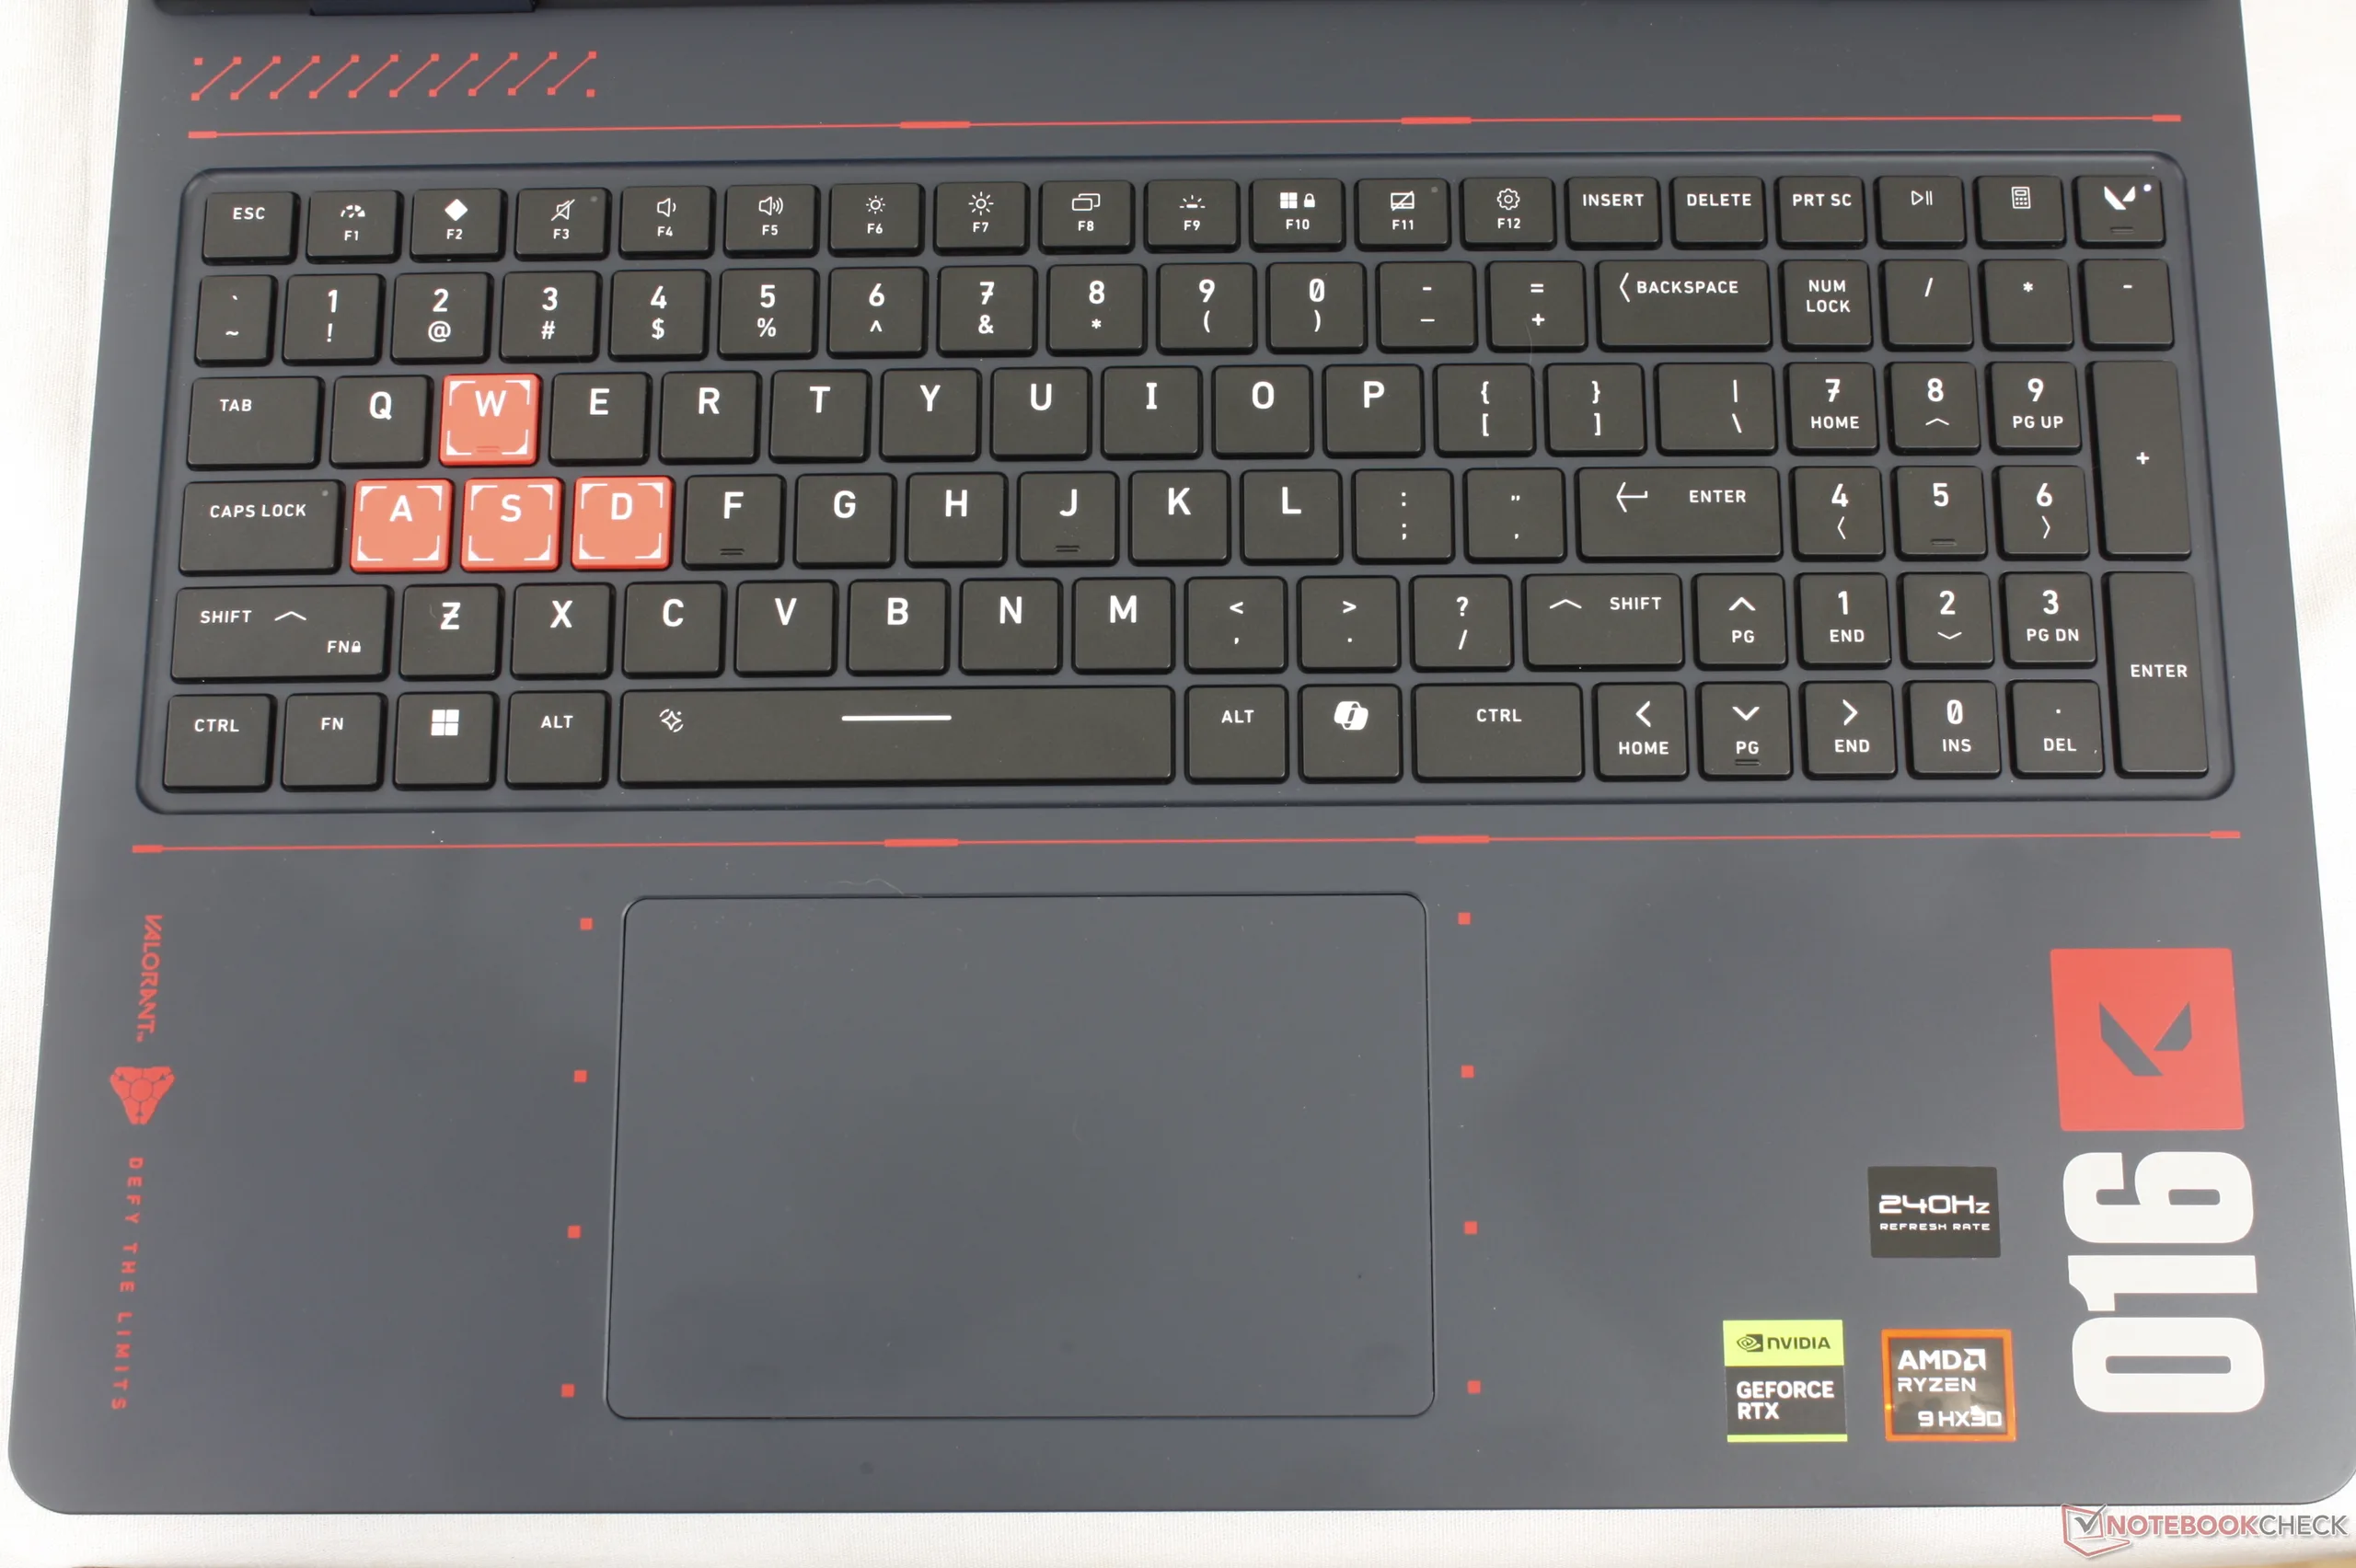
La iluminación RGB se limita a tres zonas, en lugar de ser RGB por tecla.

Visualización

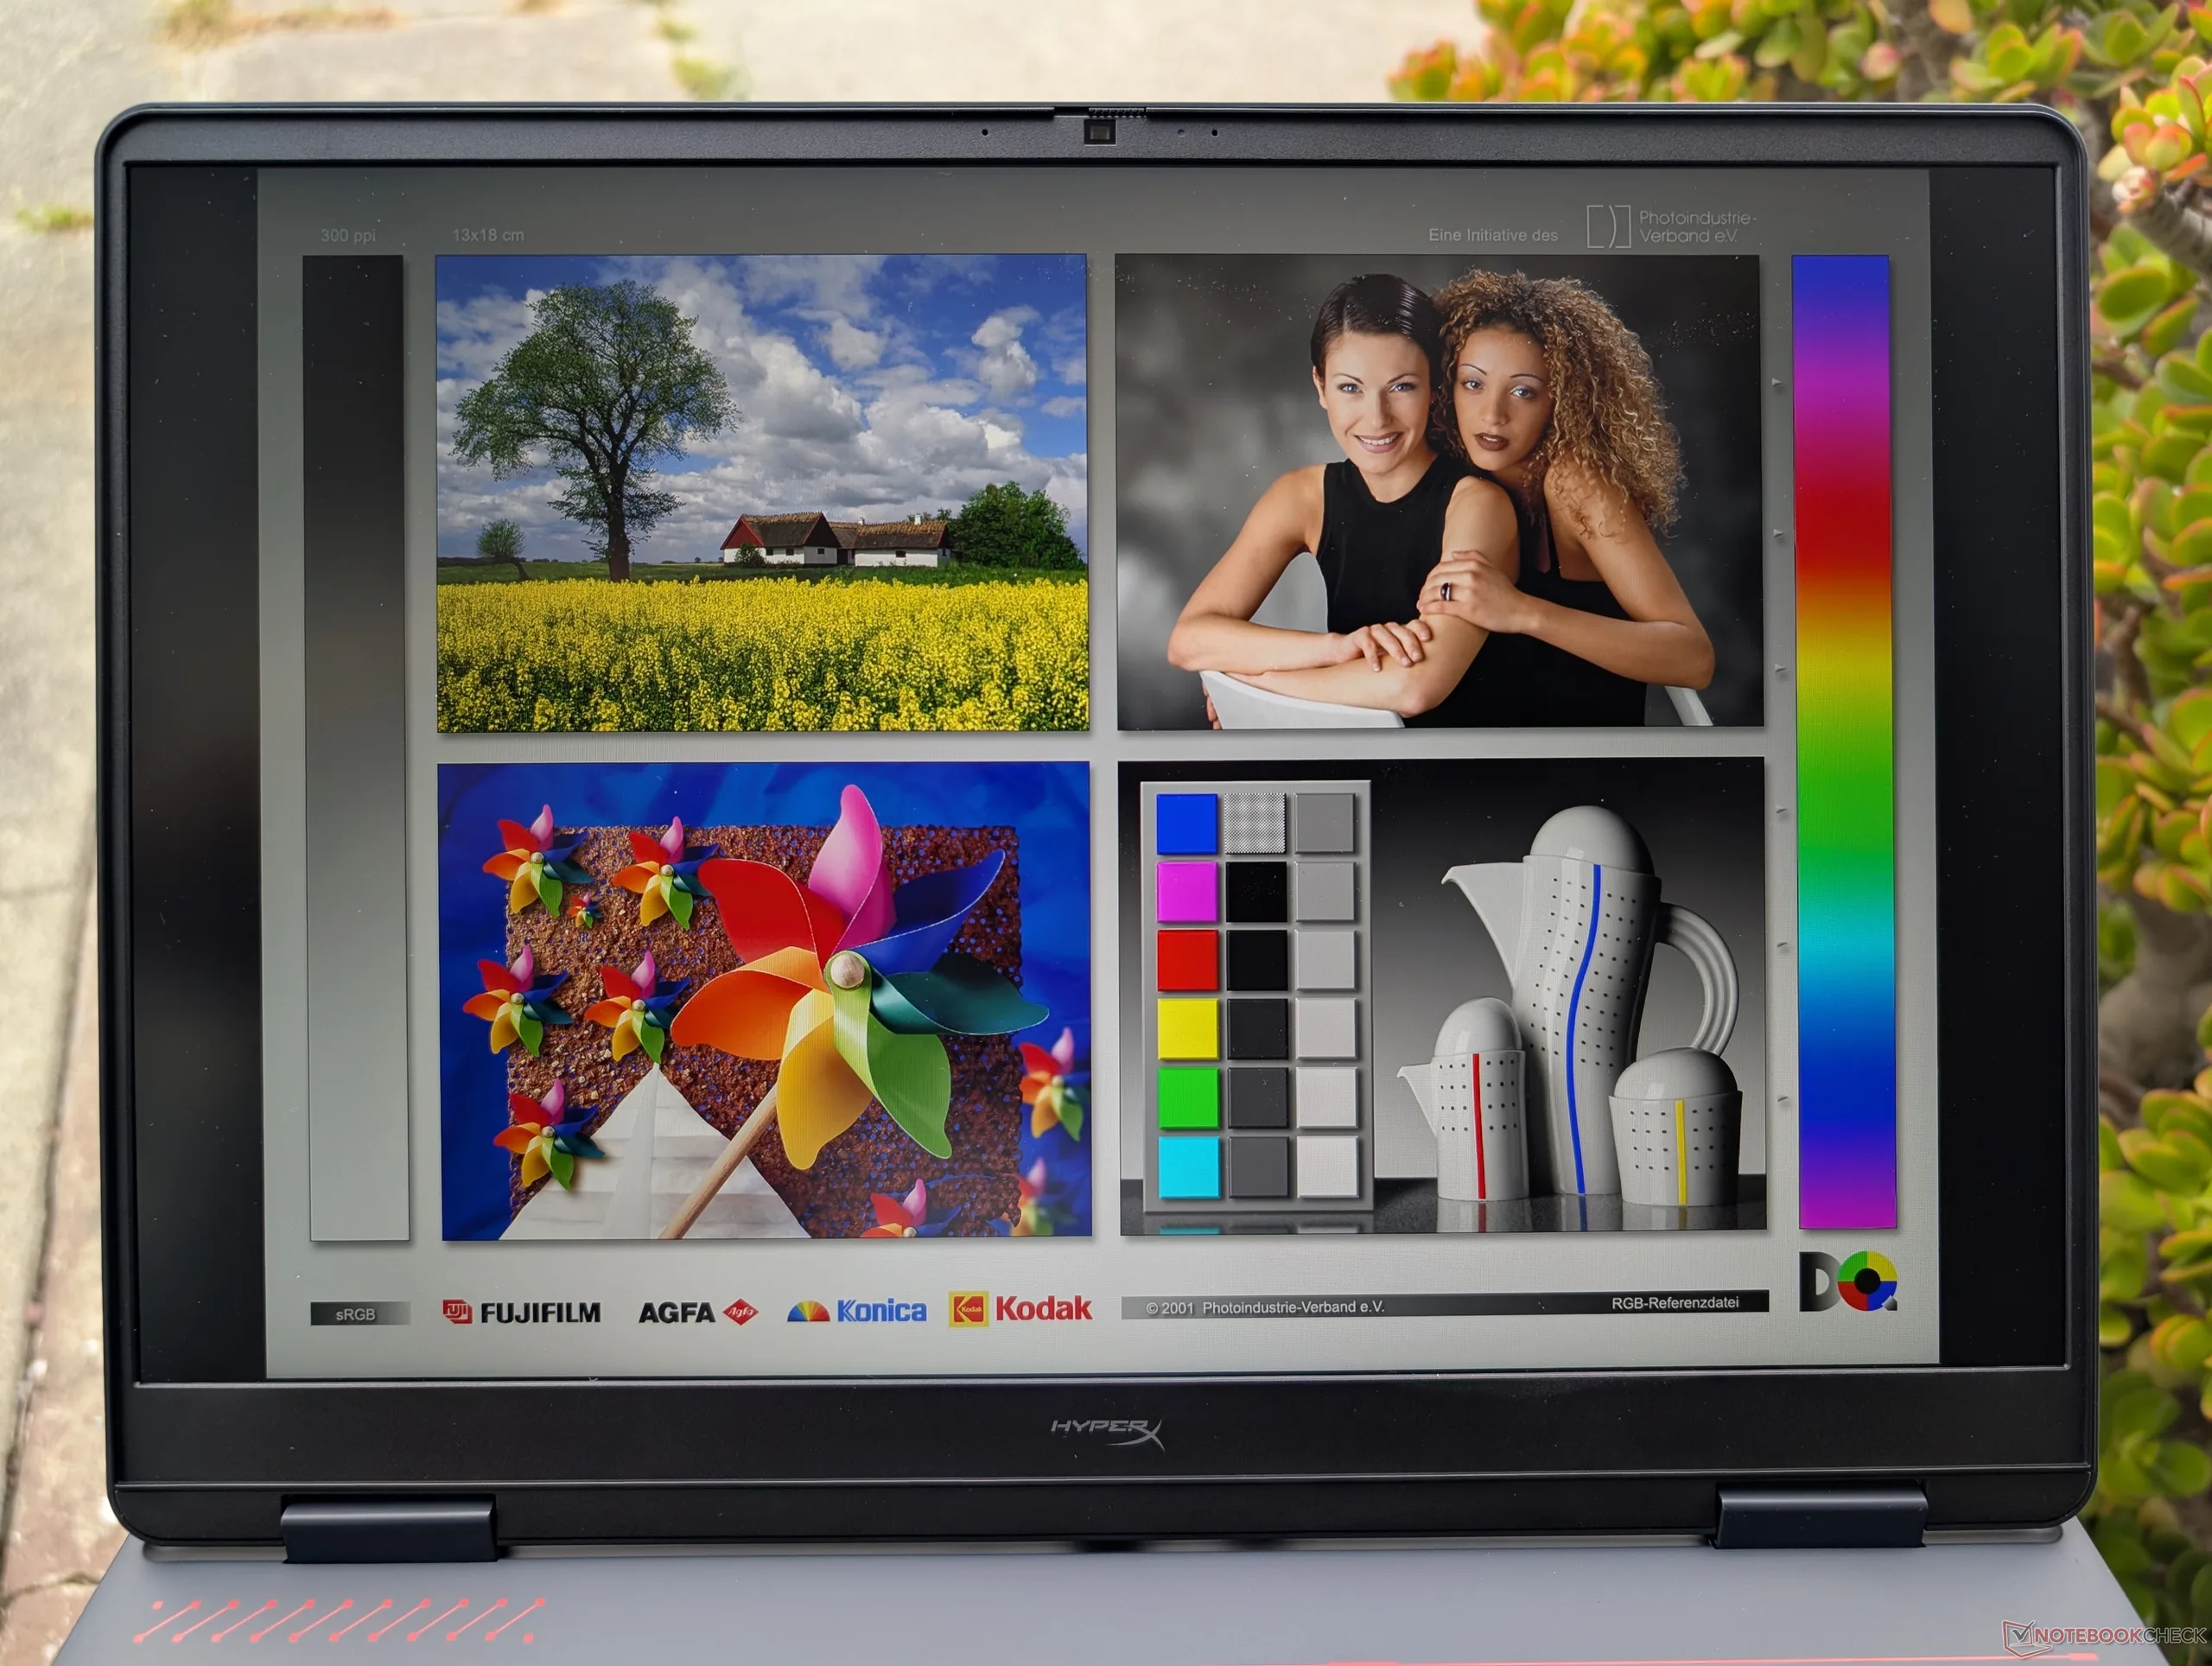
Puede que no sea OLED, pero la pantalla IPS está optimizada para juegos de ritmo rápido, gracias a su elevada frecuencia de actualización de 240 Hz, sus rápidos tiempos de respuesta en blanco y negro para reducir el efecto fantasma, los colores sRGB calibrados y una brillante retroiluminación de 500 nits. Lamentablemente, no es compatible con G-Sync ni con HDR; esto último se debe a los mediocres niveles de negro.


El panel mate presenta una textura ligeramente más granulada que su alternativa brillante
Se observa una ligera fuga de luz de fondo irregular en las esquinas.
512.1
cd/m²
549.4
cd/m²
552.5
cd/m²
546.6
cd/m²
569.7
cd/m²
557.7
cd/m²
539.3
cd/m²
532.8
cd/m²
546.6
cd/m²
Temperatura del cuarto
BOE0CD1 tested with X-Rite i1Pro 3
Máximo: 569.7 cd/m² (Nits) Médio: 545.2 cd/m² Minimum: 29.7 cd/m²
iluminación: 90 %
Brillo con batería: 569.7 cd/m²
Contraste: 1212:1 (Negro: 0.47 cd/m²)
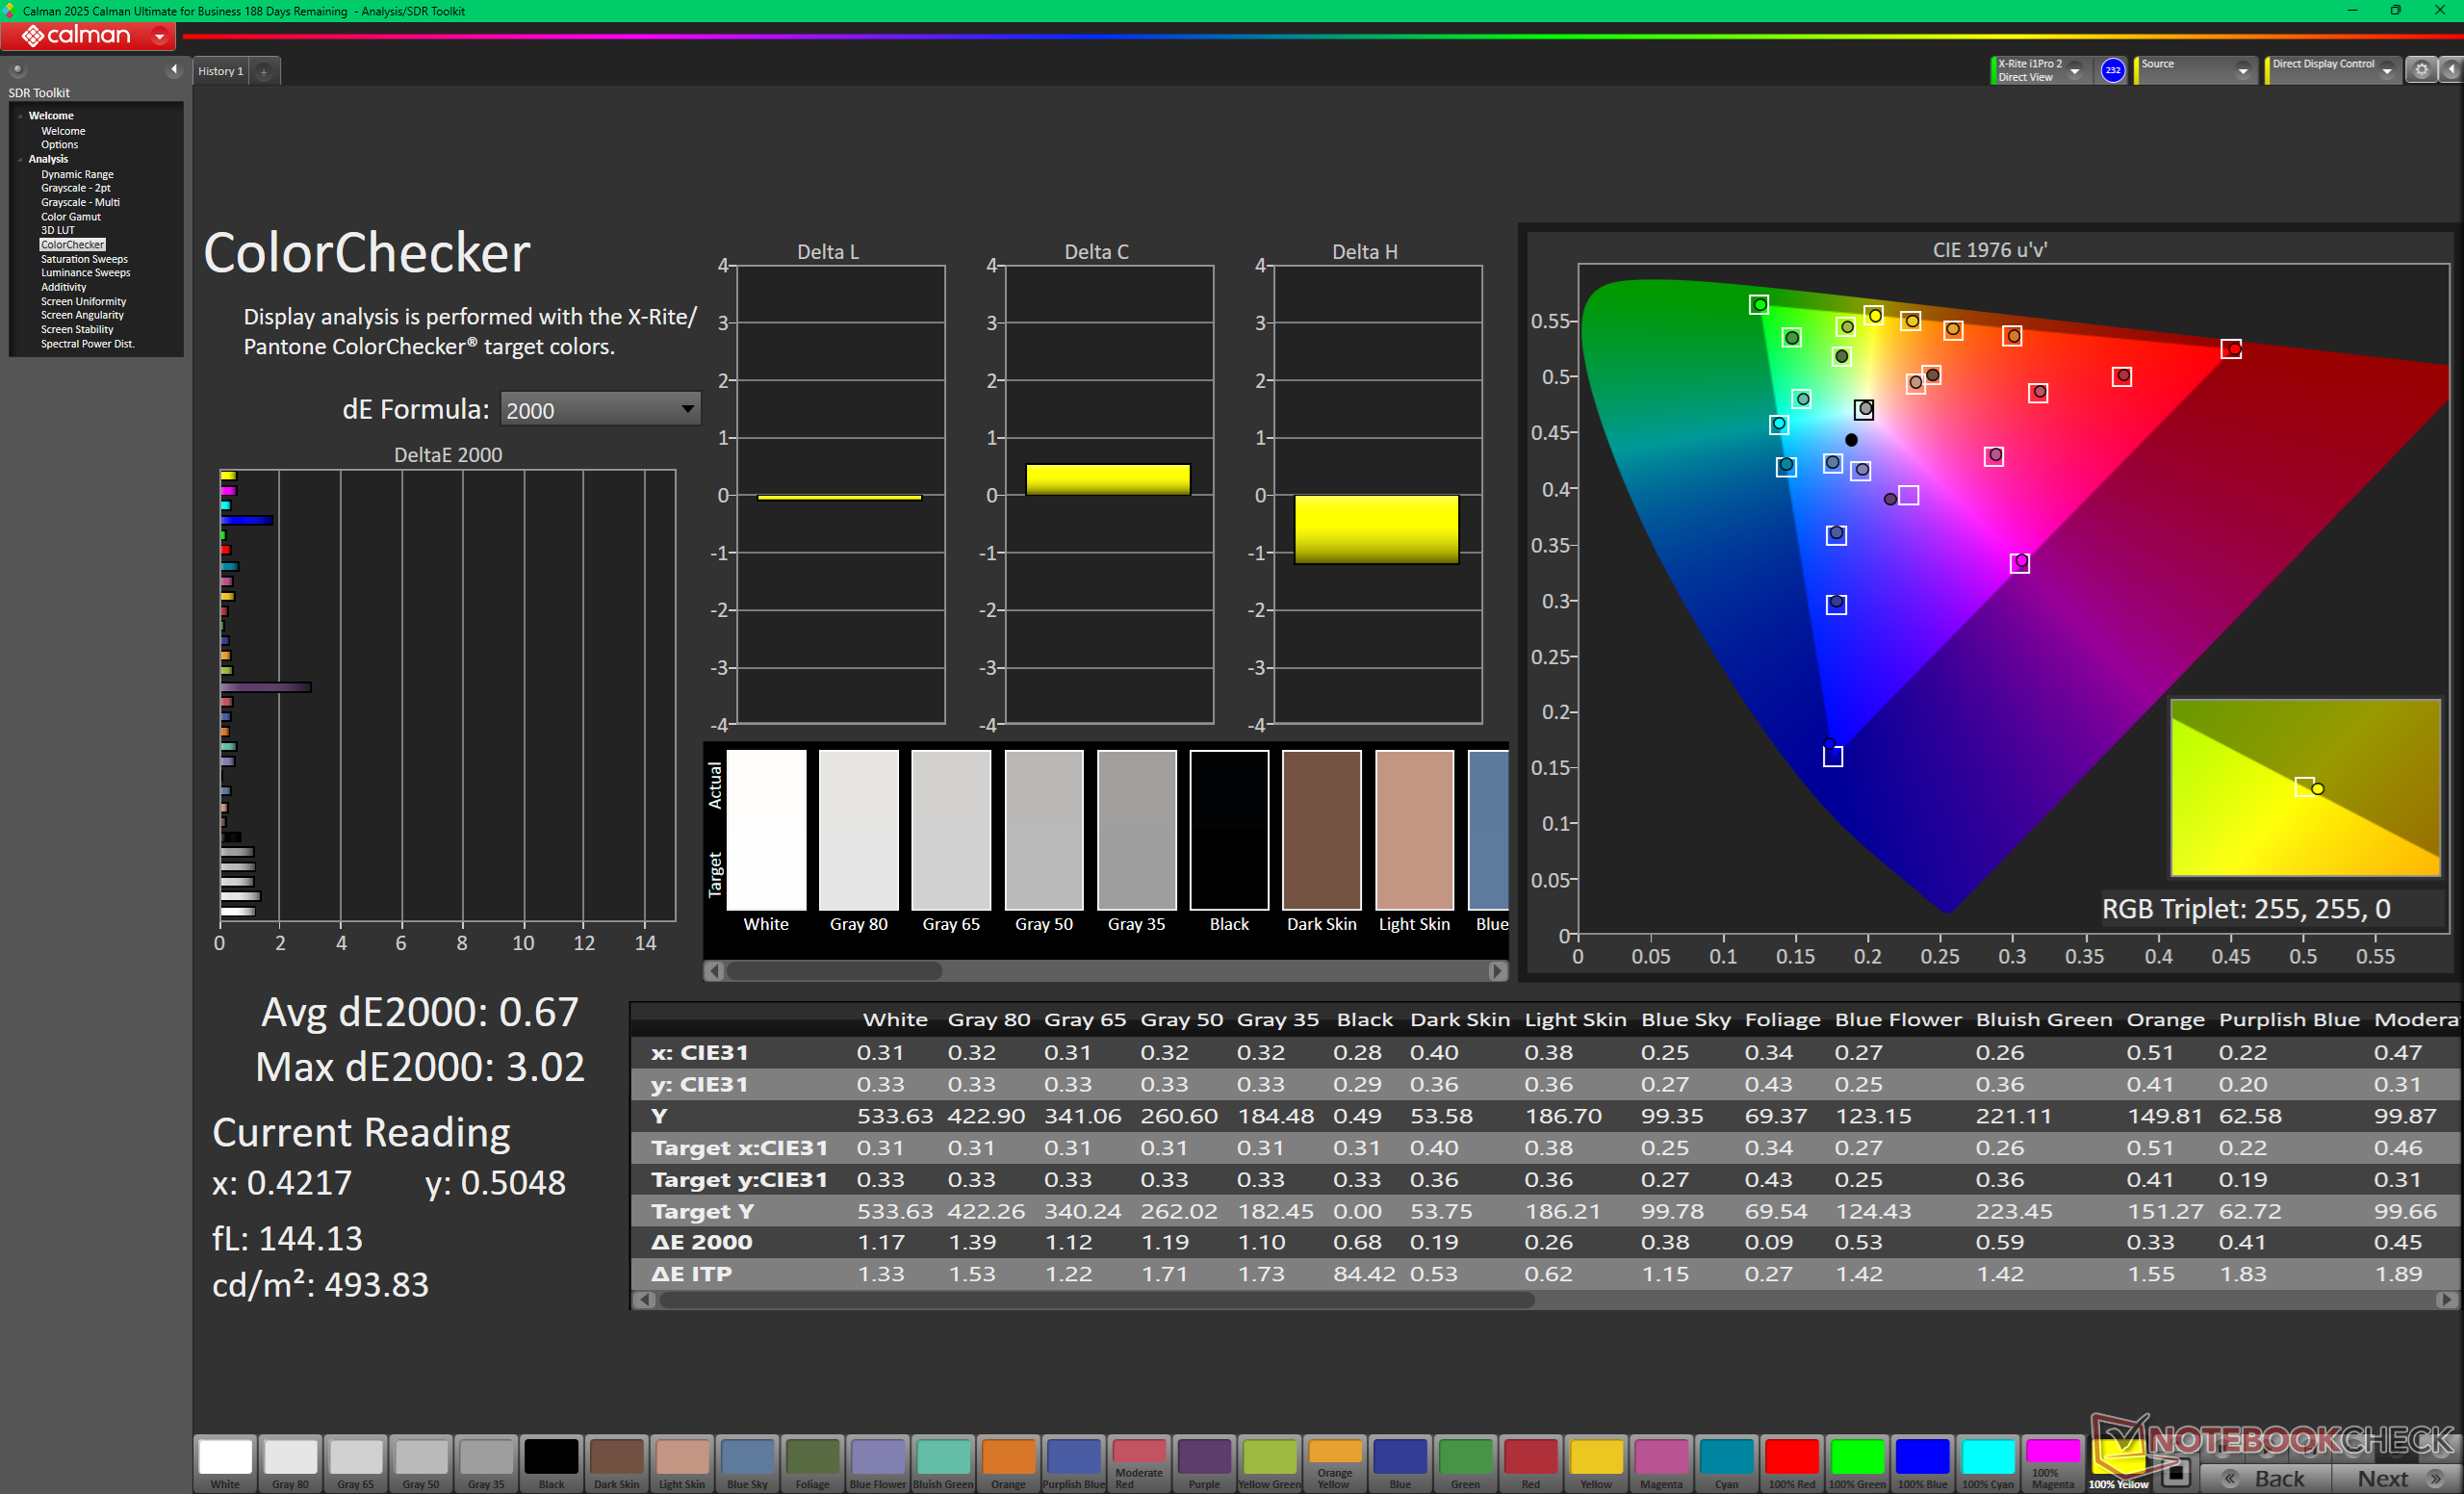
ΔE ColorChecker Calman: 3.31 | ∀{0.5-29.43 Ø4.7}
calibrated: 0.67
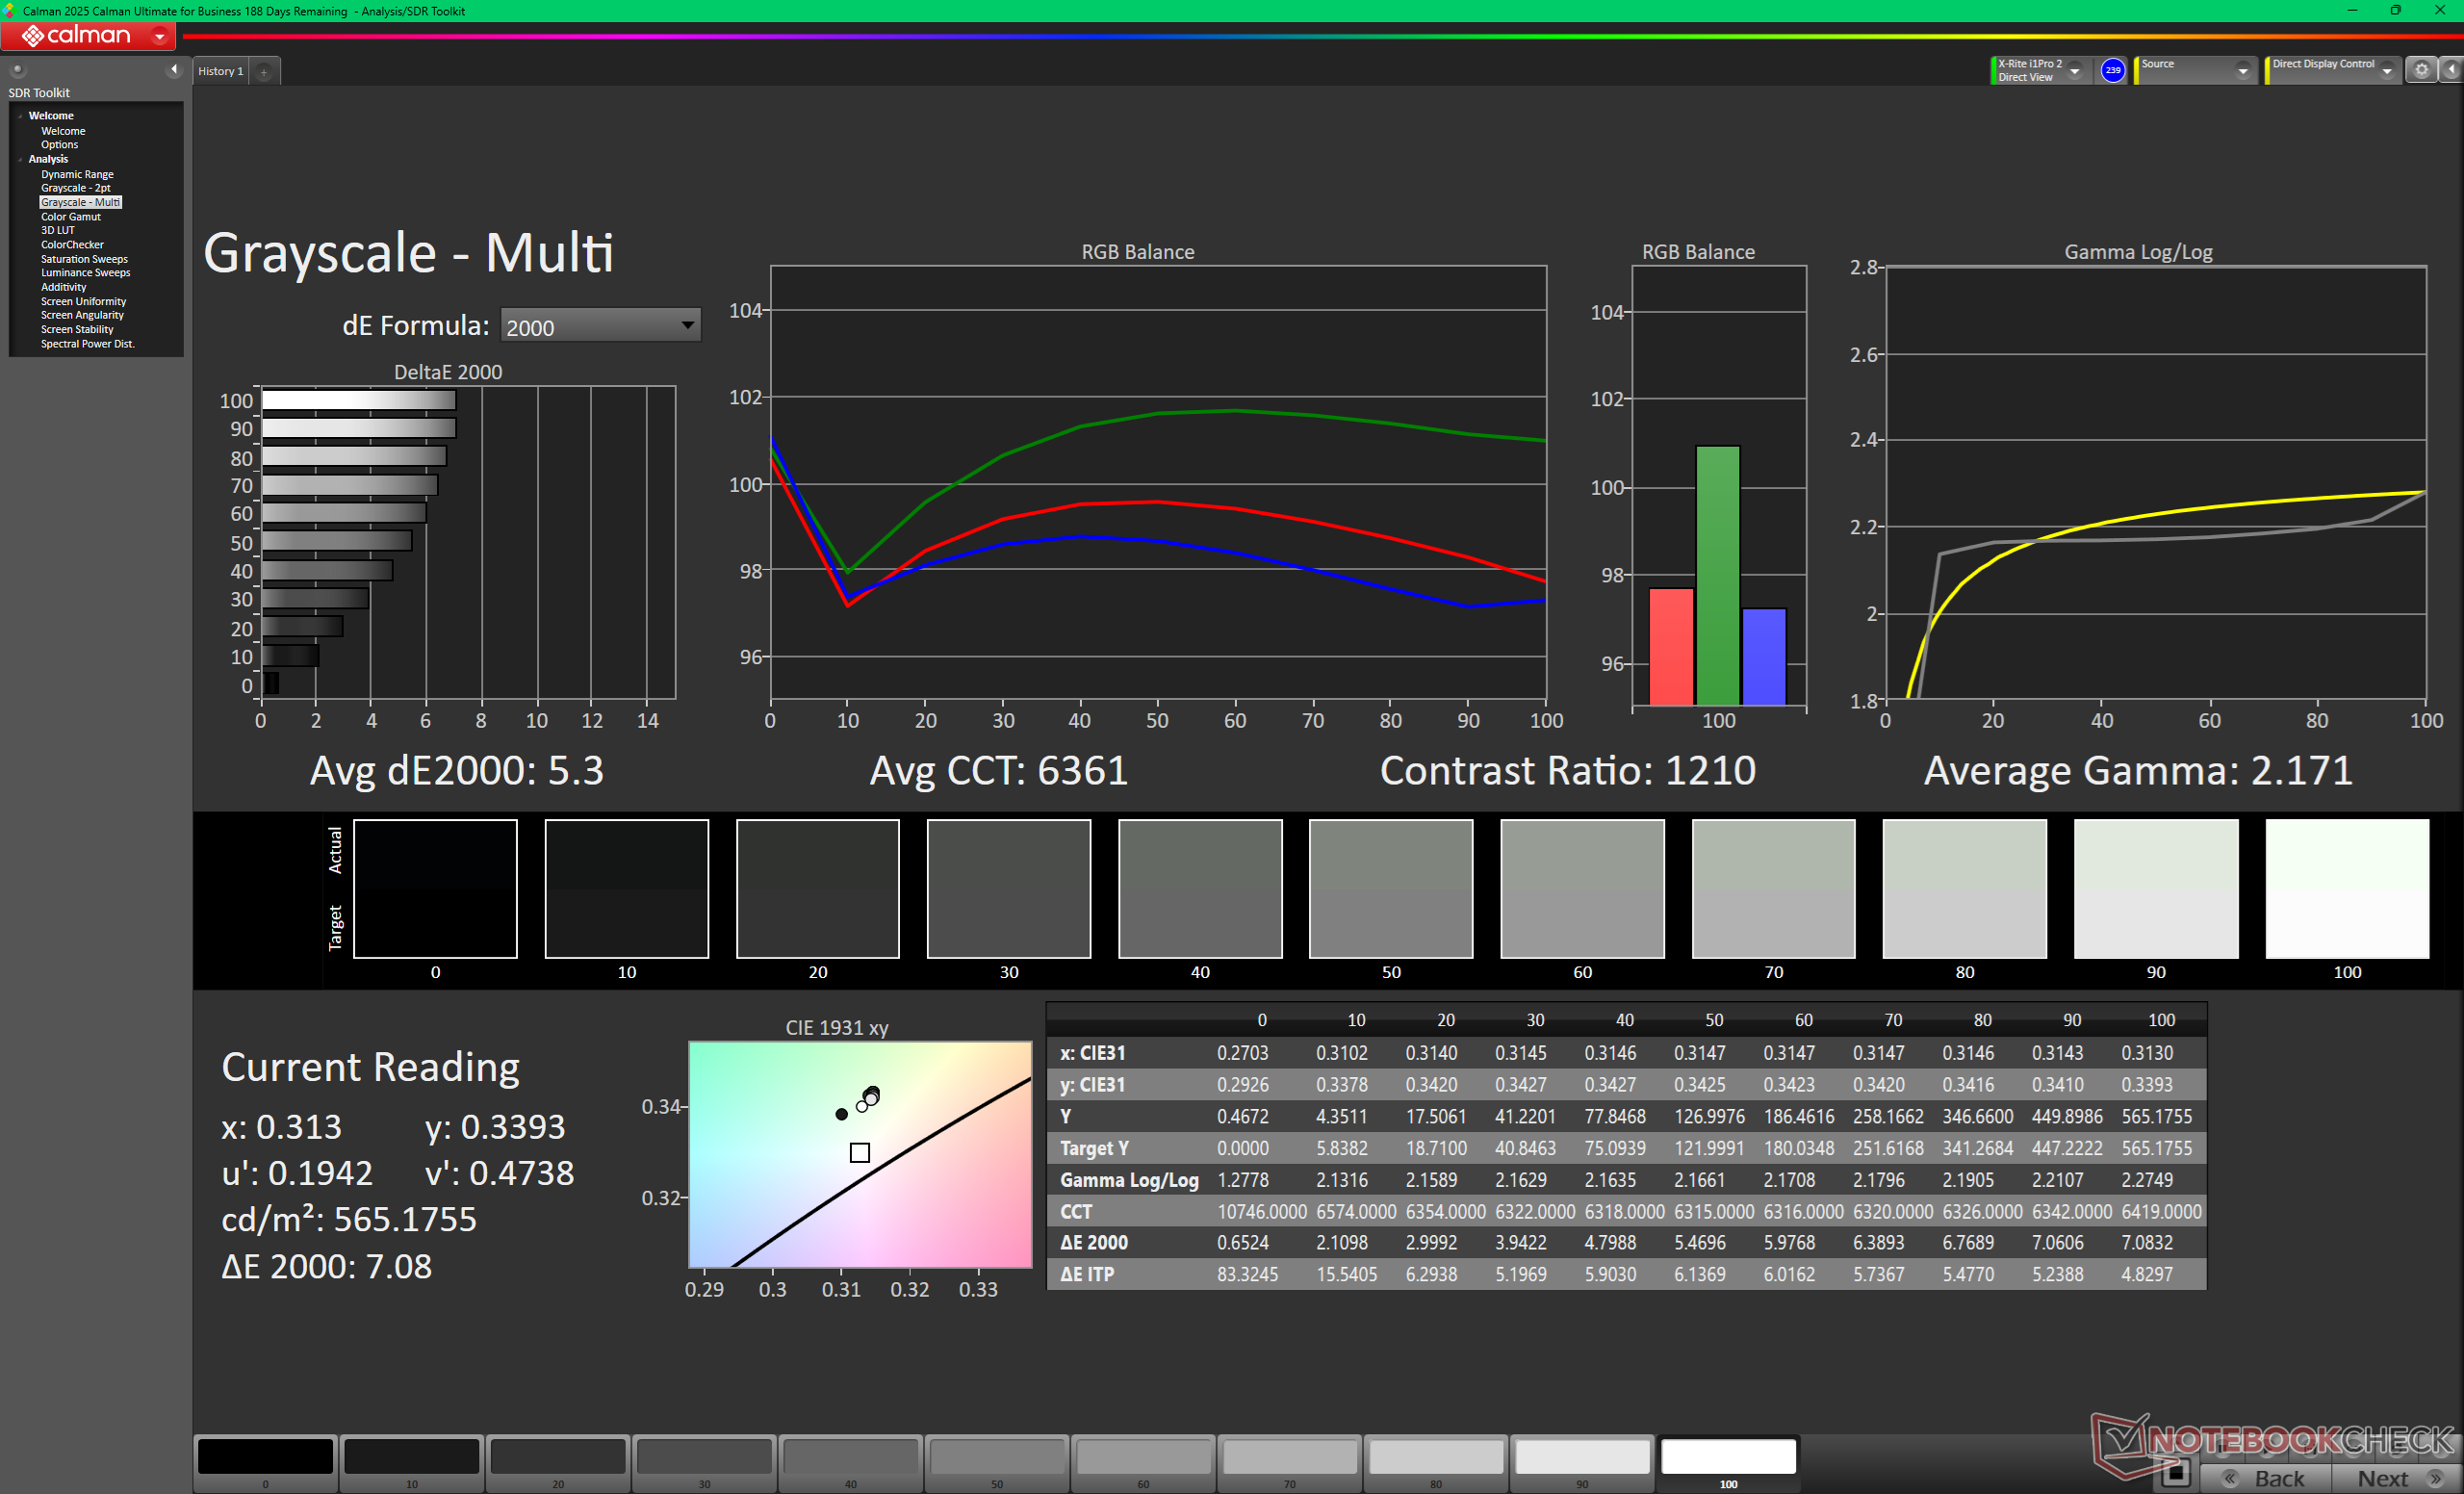
ΔE Greyscale Calman: 5.3 | ∀{0.09-98 Ø4.95}
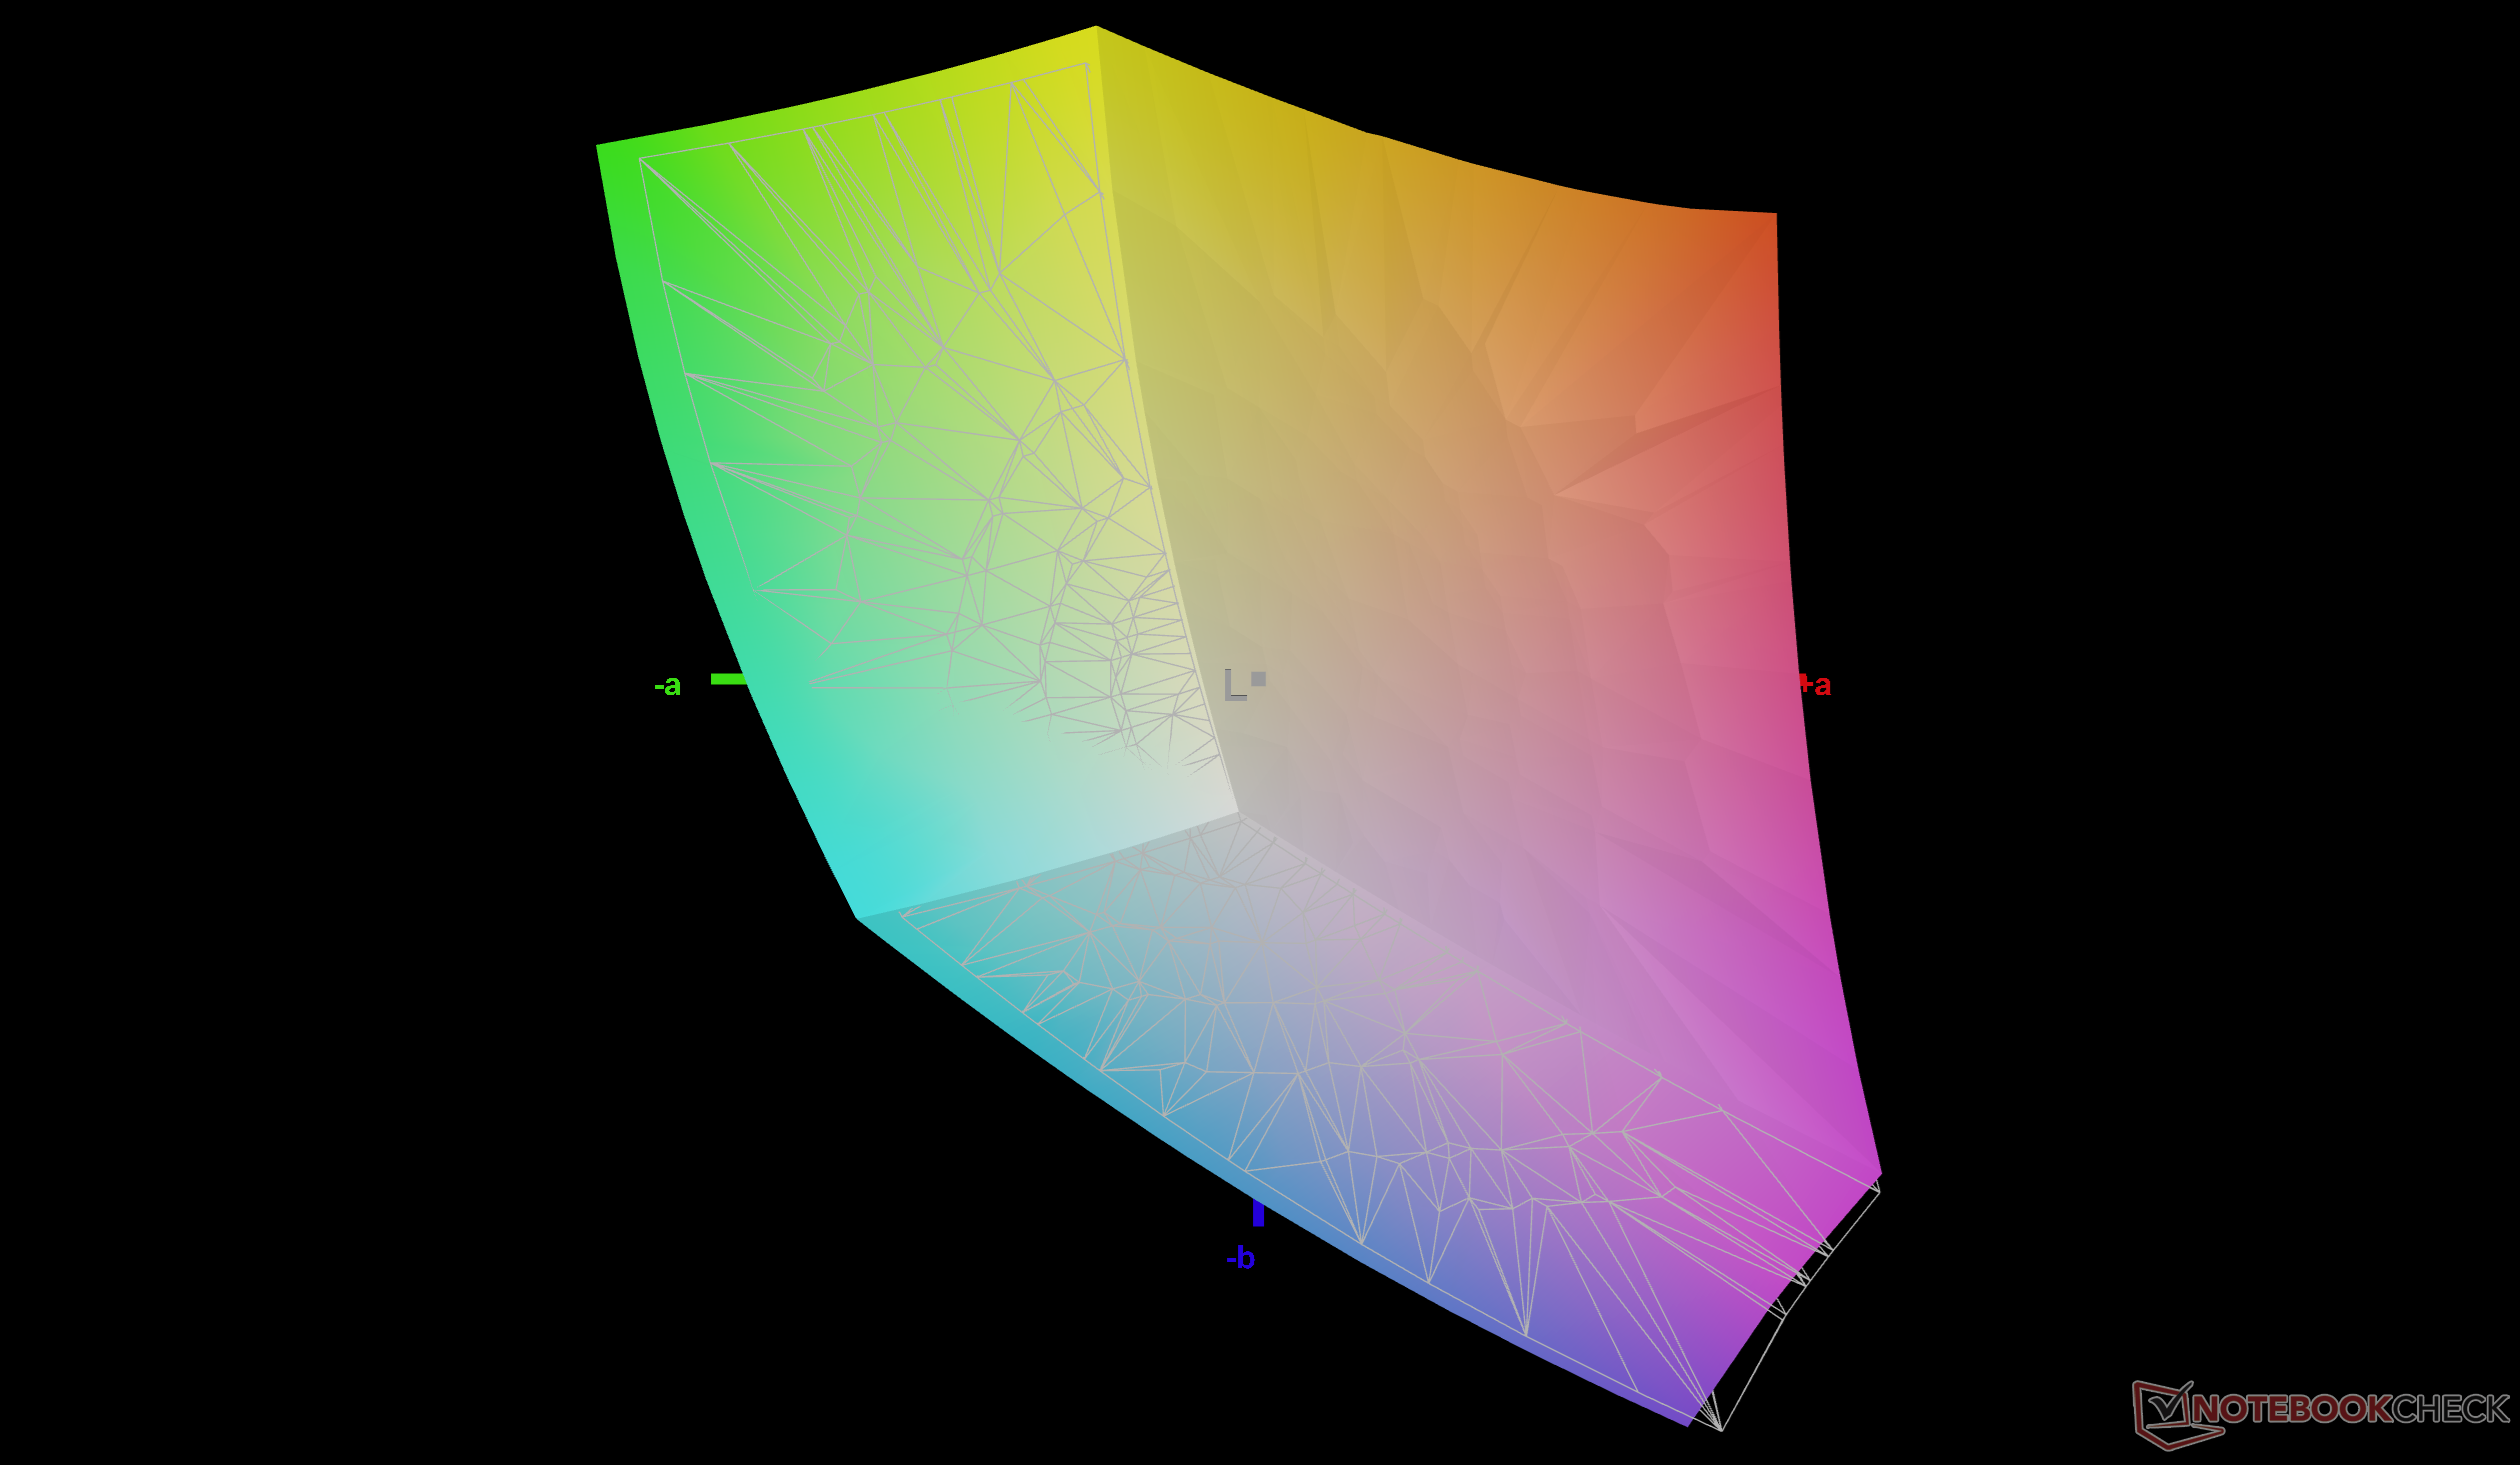
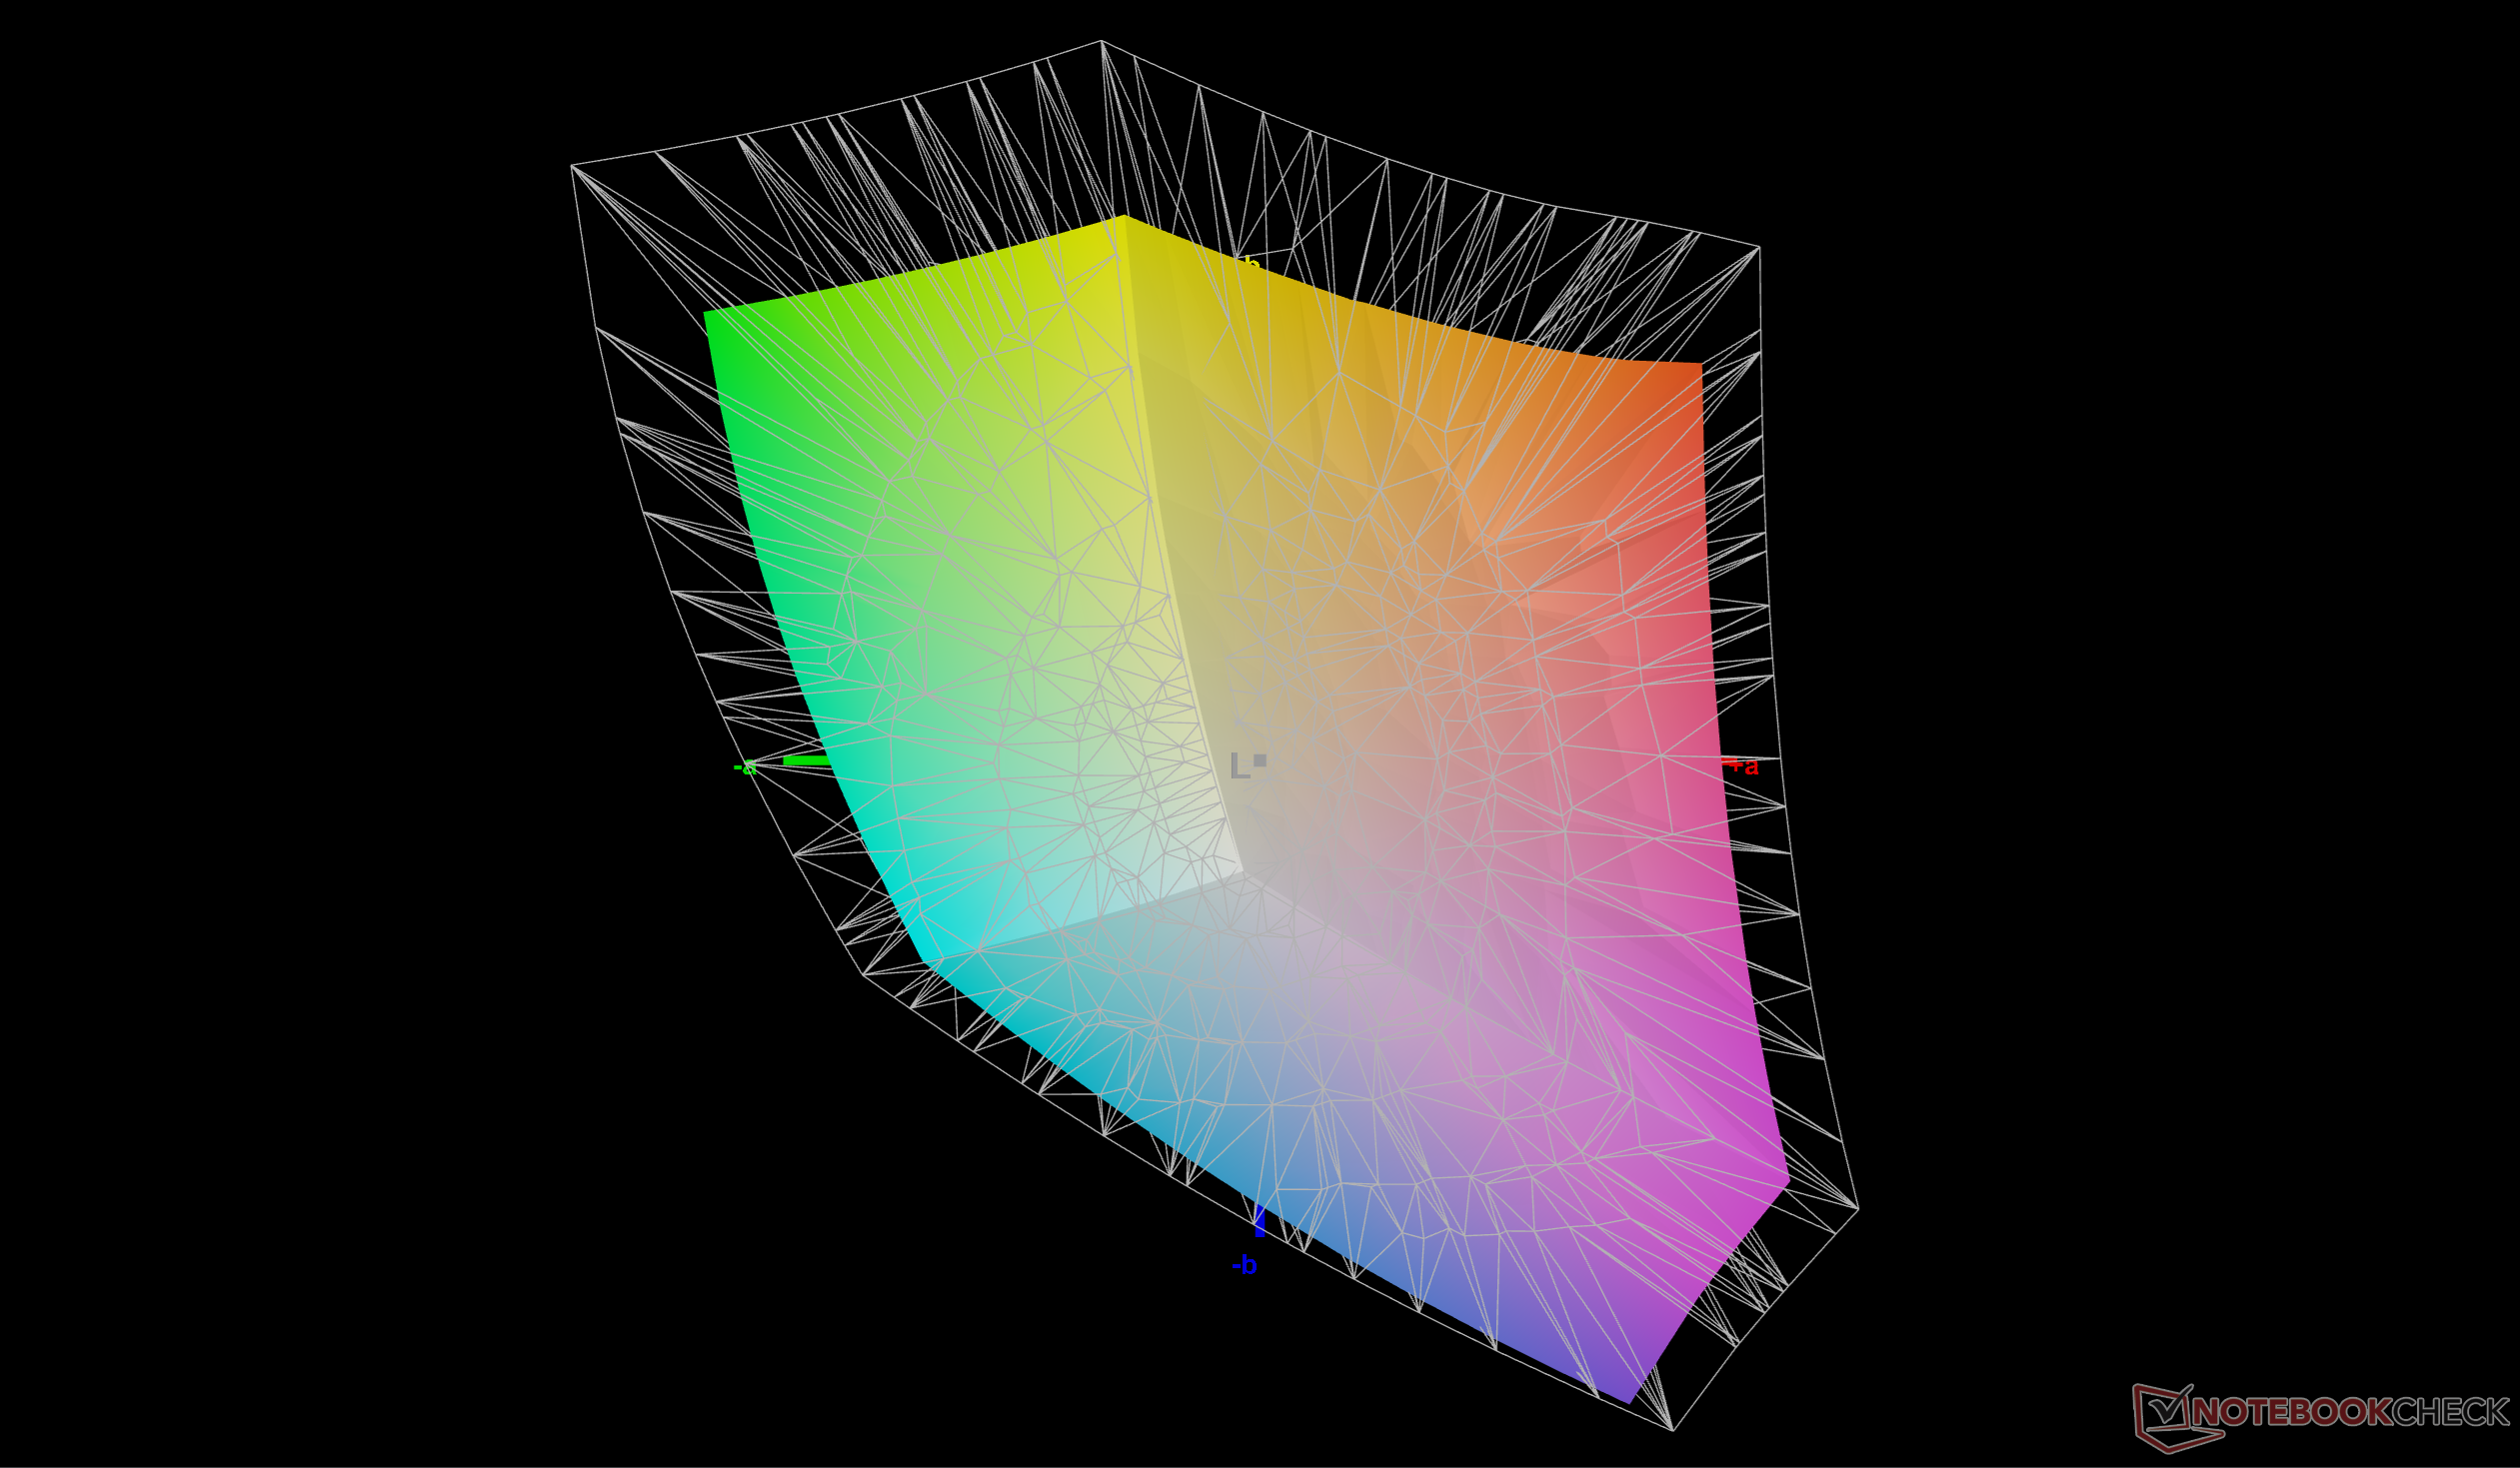
75% AdobeRGB 1998 (Argyll 3D)
98.8% sRGB (Argyll 3D)
73% Display P3 (Argyll 3D)
Gamma: 2.17
CCT: 6361 K
HP HyperX Omen 16 16-ap1931nr
BOE0CD1, IPS, 2560x1600, 16", 240 Hz
HP Omen 16-ap0091ng
AUODBB2, IPS, 1920x1200, 16", 144 Hz
MSI Crosshair A16 HX E8WGK
AU Optronics B160QAN02.3, IPS, 2560x1600, 16", 240 Hz
Alienware 16X Aurora Core Ultra 9 290HX Plus
Samsung 160HU05, OLED, 2560x1600, 16", 240 Hz
Lenovo Legion Pro 5 16IAX10, RTX 5070
ATNA60HS01-0 (Samsung SDC420A), OLED, 2650x1600, 16", 165 Hz
Asus TUF Gaming A16 FA608UP
MNG007DA5-3, IPS, 2560x1600, 16", 165 Hz
Display
-45%
14%
21%
21%
-4%
Display P3 Coverage (%)
73
40
-45%
94.9
30%
99.6
36%
99.3
36%
69.4
-5%
sRGB Coverage (%)
98.8
58.1
-41%
99.6
1%
100
1%
100
1%
97.2
-2%
AdobeRGB 1998 Coverage (%)
75
38.7
-48%
83.1
11%
93.9
25%
93.9
25%
71.9
-4%
Response Times
-237%
20%
96%
76%
21%
Response Time Grey 50% / Grey 80% * (ms)
5.6 ?(2.8, 2.8)
27.6 ?(12.9, 14.7)
-393%
4.2 ?(1.8, 2.4)
25%
0.29 ?(0.15, 0.14)
95%
2 ?(1, 1)
64%
6.3 ?(2.8, 3.5)
-13%
Response Time Black / White * (ms)
10.7 ?(5.5, 5.2)
19.4 ?(9.6, 9.8)
-81%
9.2 ?(4.9, 4.3)
14%
0.45 ?(0.23, 0.22)
96%
1.4 ?(0.8, 0.6)
87%
4.8 ?(1.7, 3.1)
55%
PWM Frequency (Hz)
1439.8 ?(100)
1300
PWM Amplitude * (%)
29
16.7
Screen
-77%
-14%
-3%
42%
15%
Brightness middle (cd/m²)
569.7
328
-42%
512.4
-10%
380.5
-33%
521
-9%
480
-16%
Brightness (cd/m²)
545
313
-43%
476
-13%
384
-30%
519
-5%
456
-16%
Brightness Distribution (%)
90
91
1%
89
-1%
98
9%
98
9%
91
1%
Black Level * (cd/m²)
0.47
0.26
45%
0.39
17%
0.075
84%
0.32
32%
Contrast (:1)
1212
1262
4%
1314
8%
6947
473%
1500
24%
Colorchecker dE 2000 *
3.31
4.73
-43%
4.65
-40%
3.27
1%
2.5
24%
1.4
58%
Colorchecker dE 2000 max. *
7.15
17.47
-144%
8.33
-17%
6.31
12%
4.85
32%
2.5
65%
Colorchecker dE 2000 calibrated *
0.67
4.22
-530%
1.3
-94%
1.1
-64%
2.5
-273%
1.3
-94%
Greyscale dE 2000 *
5.3
2.05
61%
3.9
26%
1
81%
3.17
40%
1.2
77%
Gamma
2.17 101%
2.63 84%
2.57 86%
2.23 99%
2.35 94%
2.16 102%
CCT
6361 102%
6718 97%
6813 95%
6410 101%
6454 101%
6620 98%
Media total (Programa/Opciones)
-120% / -93%
7% / -3%
38% / 19%
46% / 42%
11% / 12%

* ... más pequeño es mejor

vs. sRGB
vs. sRGB
vs. P3
vs. P3
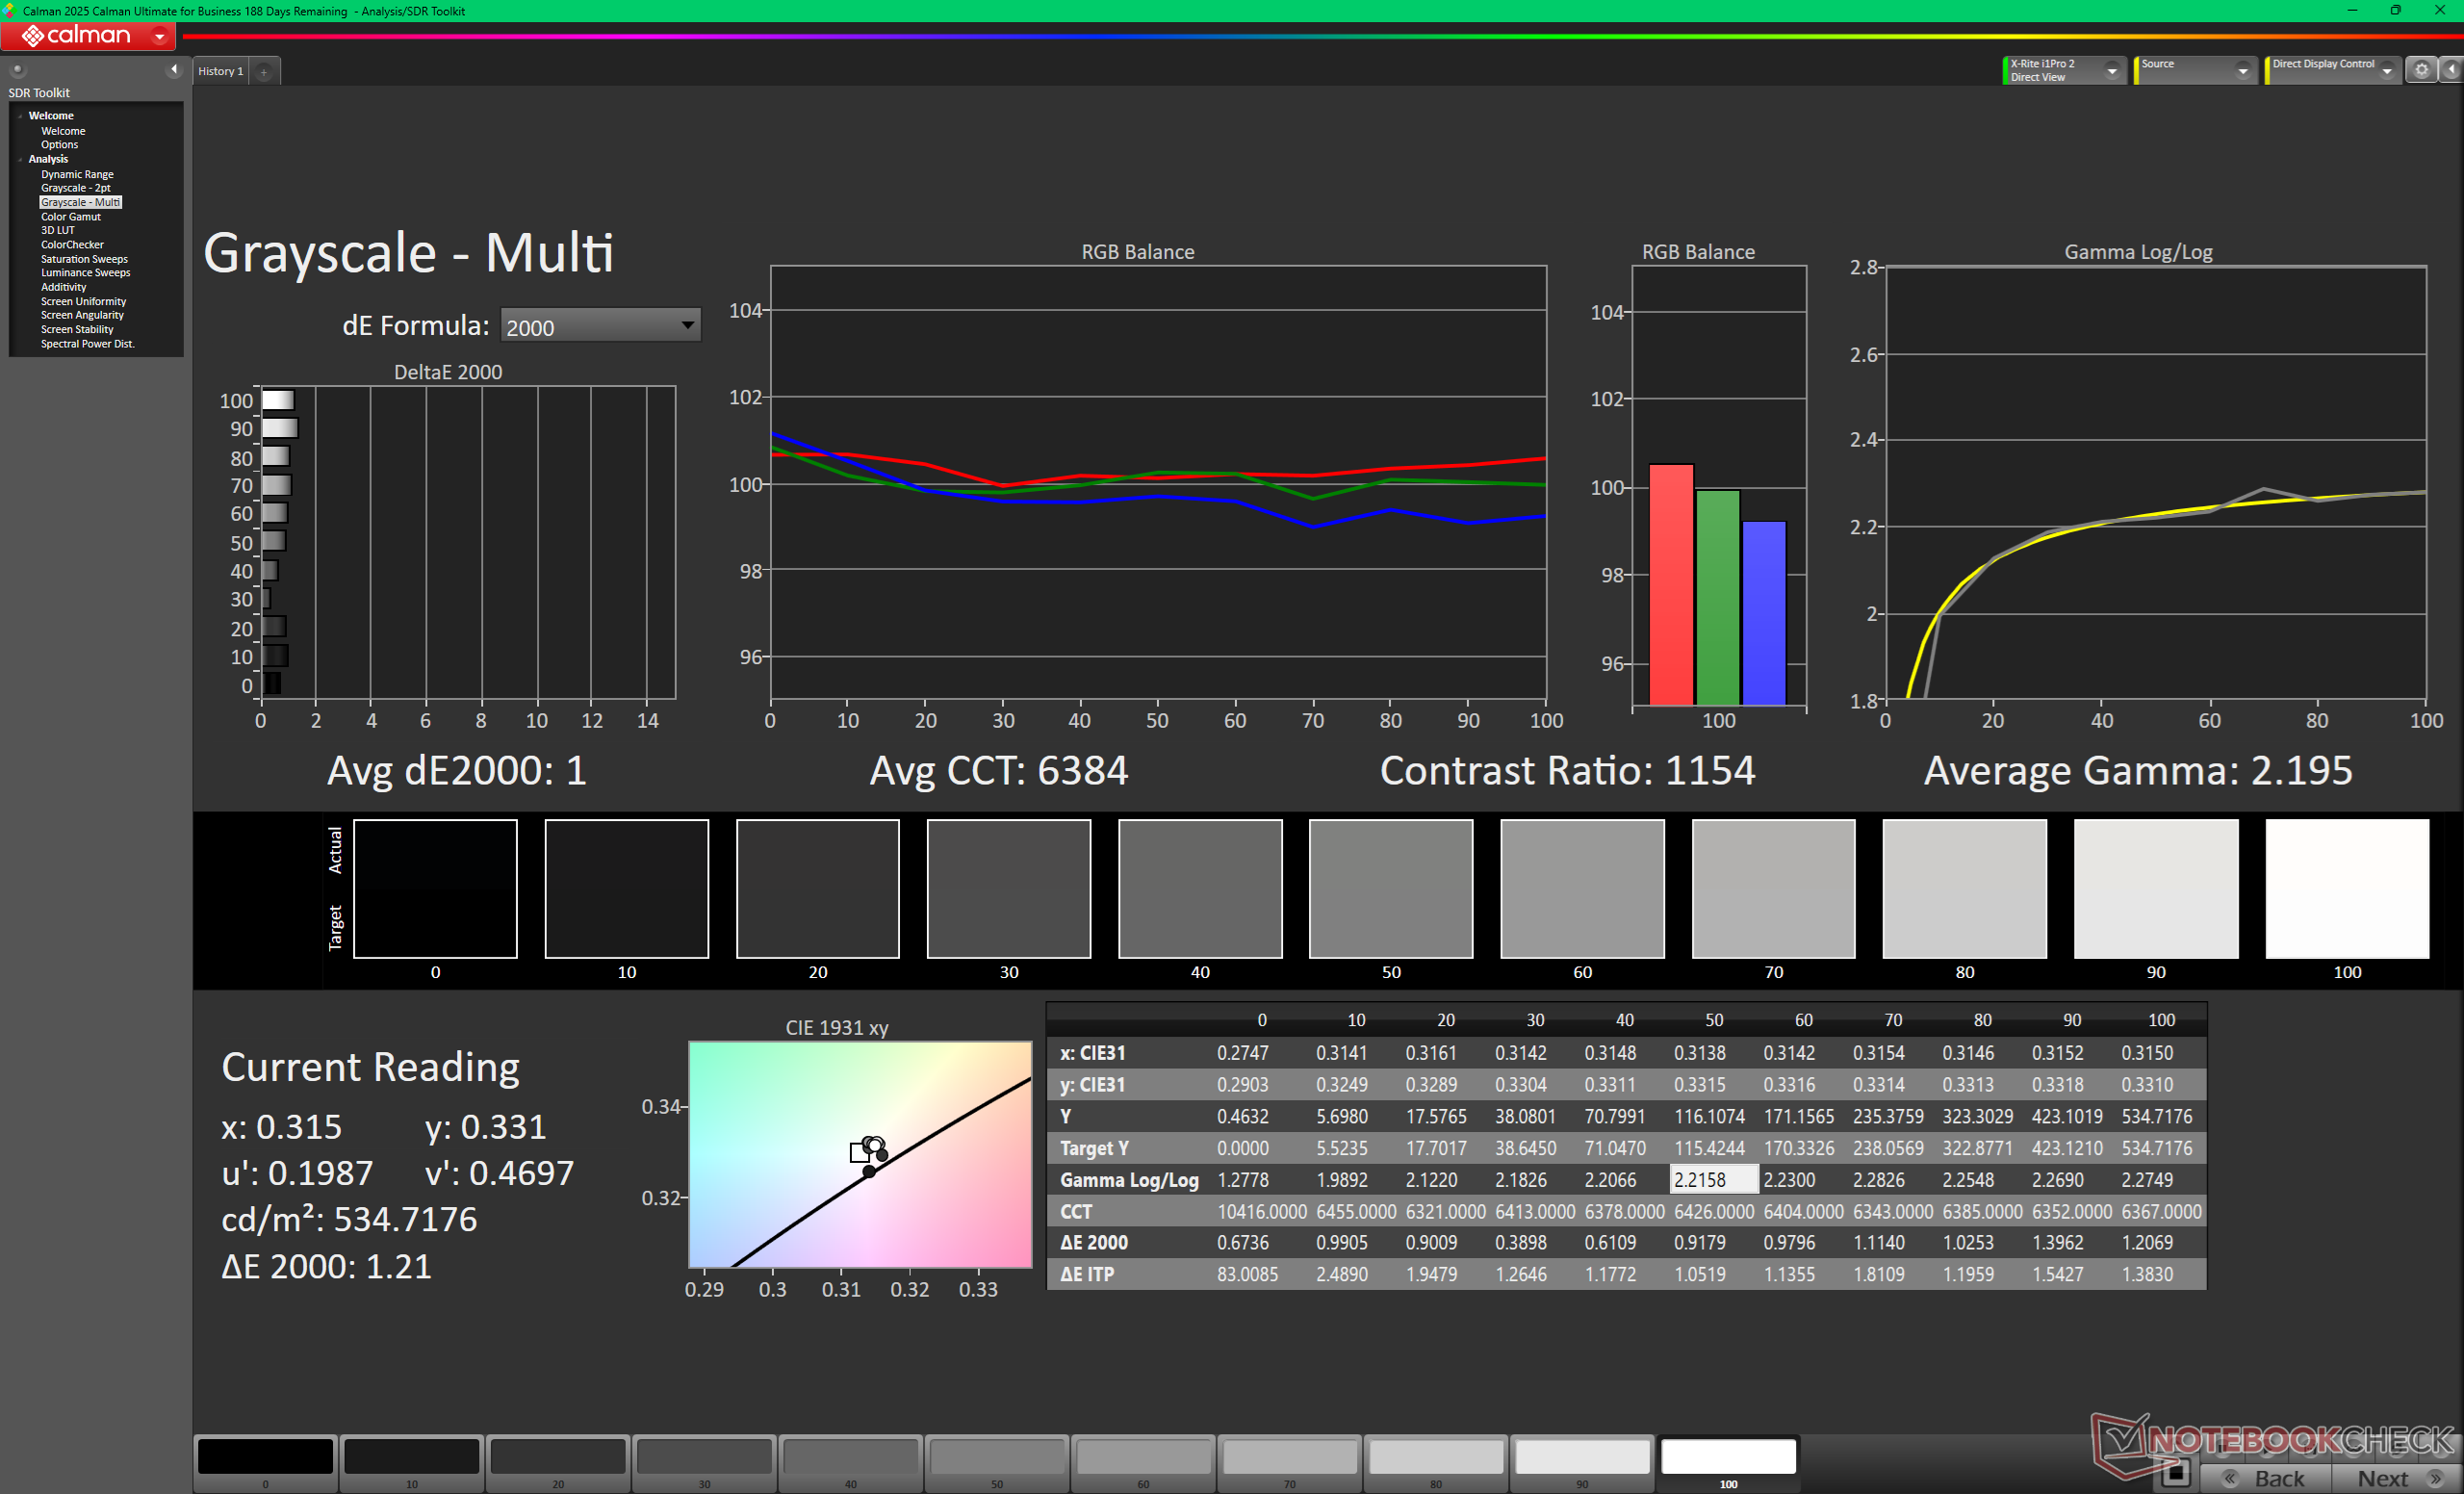
Escala de grises antes de la calibración (sRGB)
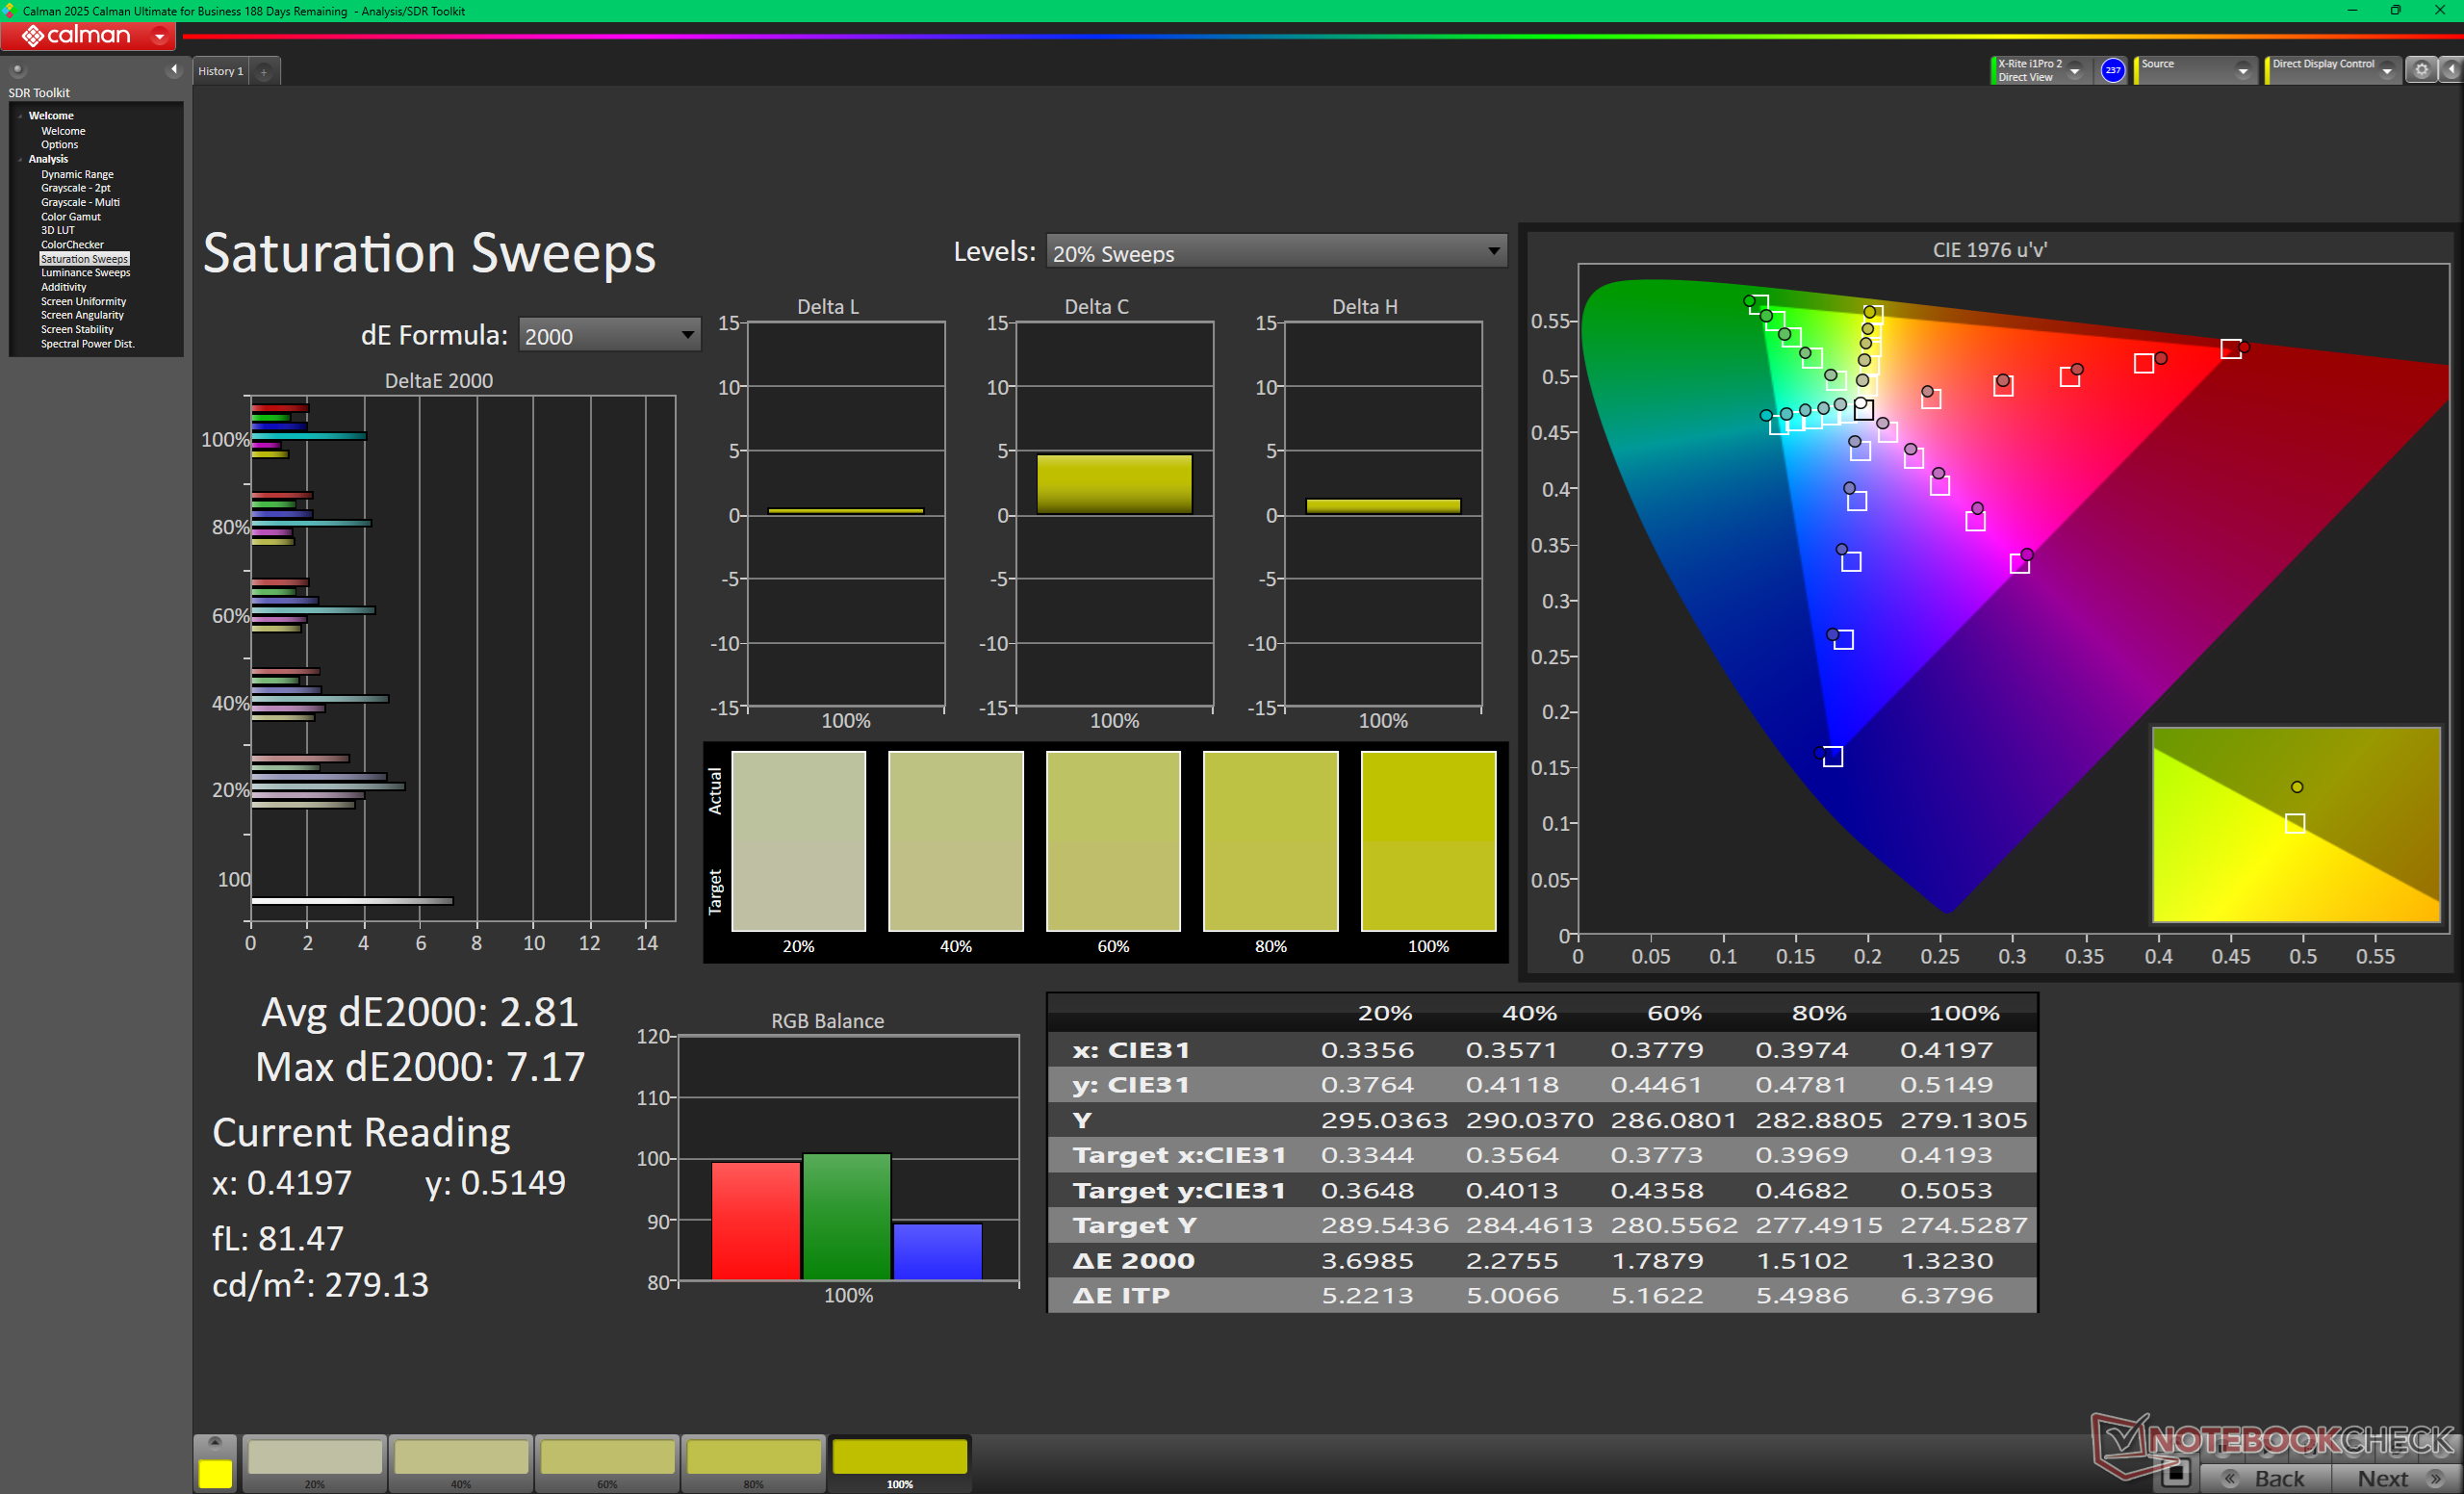
Barridos de saturación antes de la calibración (sRGB)
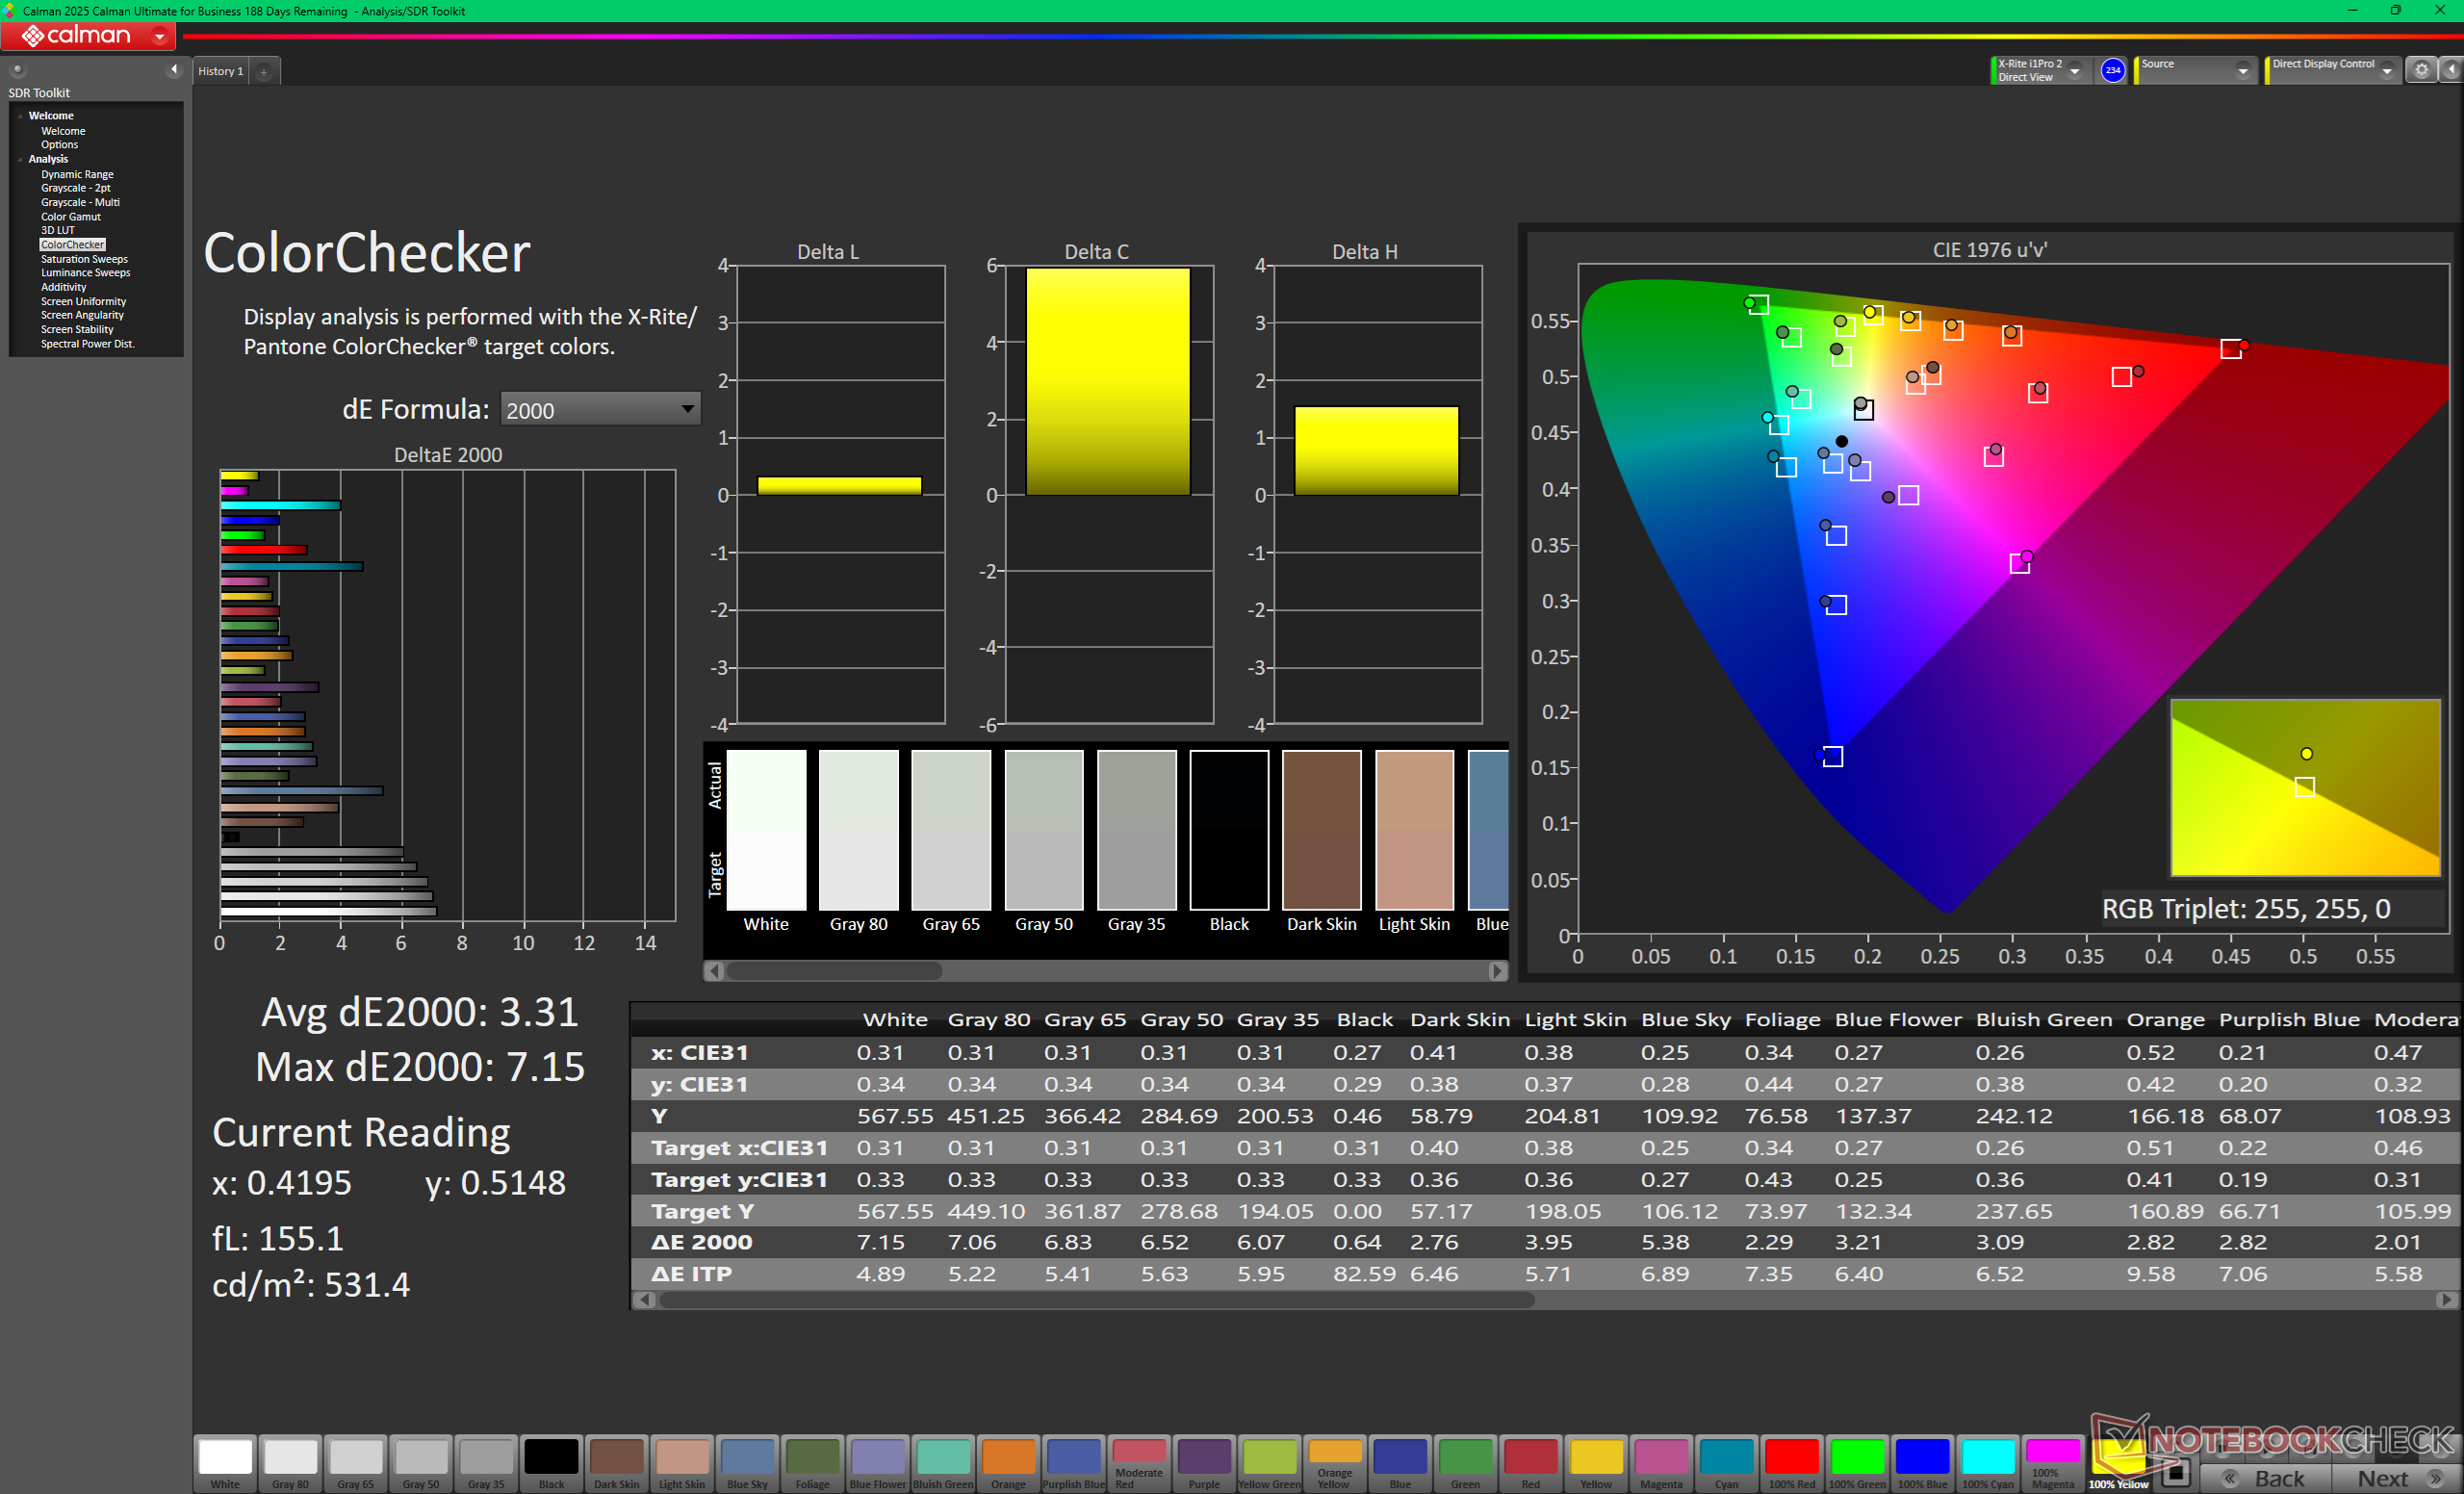
ColorChecker antes de la calibración (sRGB)
Escala de grises tras la calibración (sRGB)
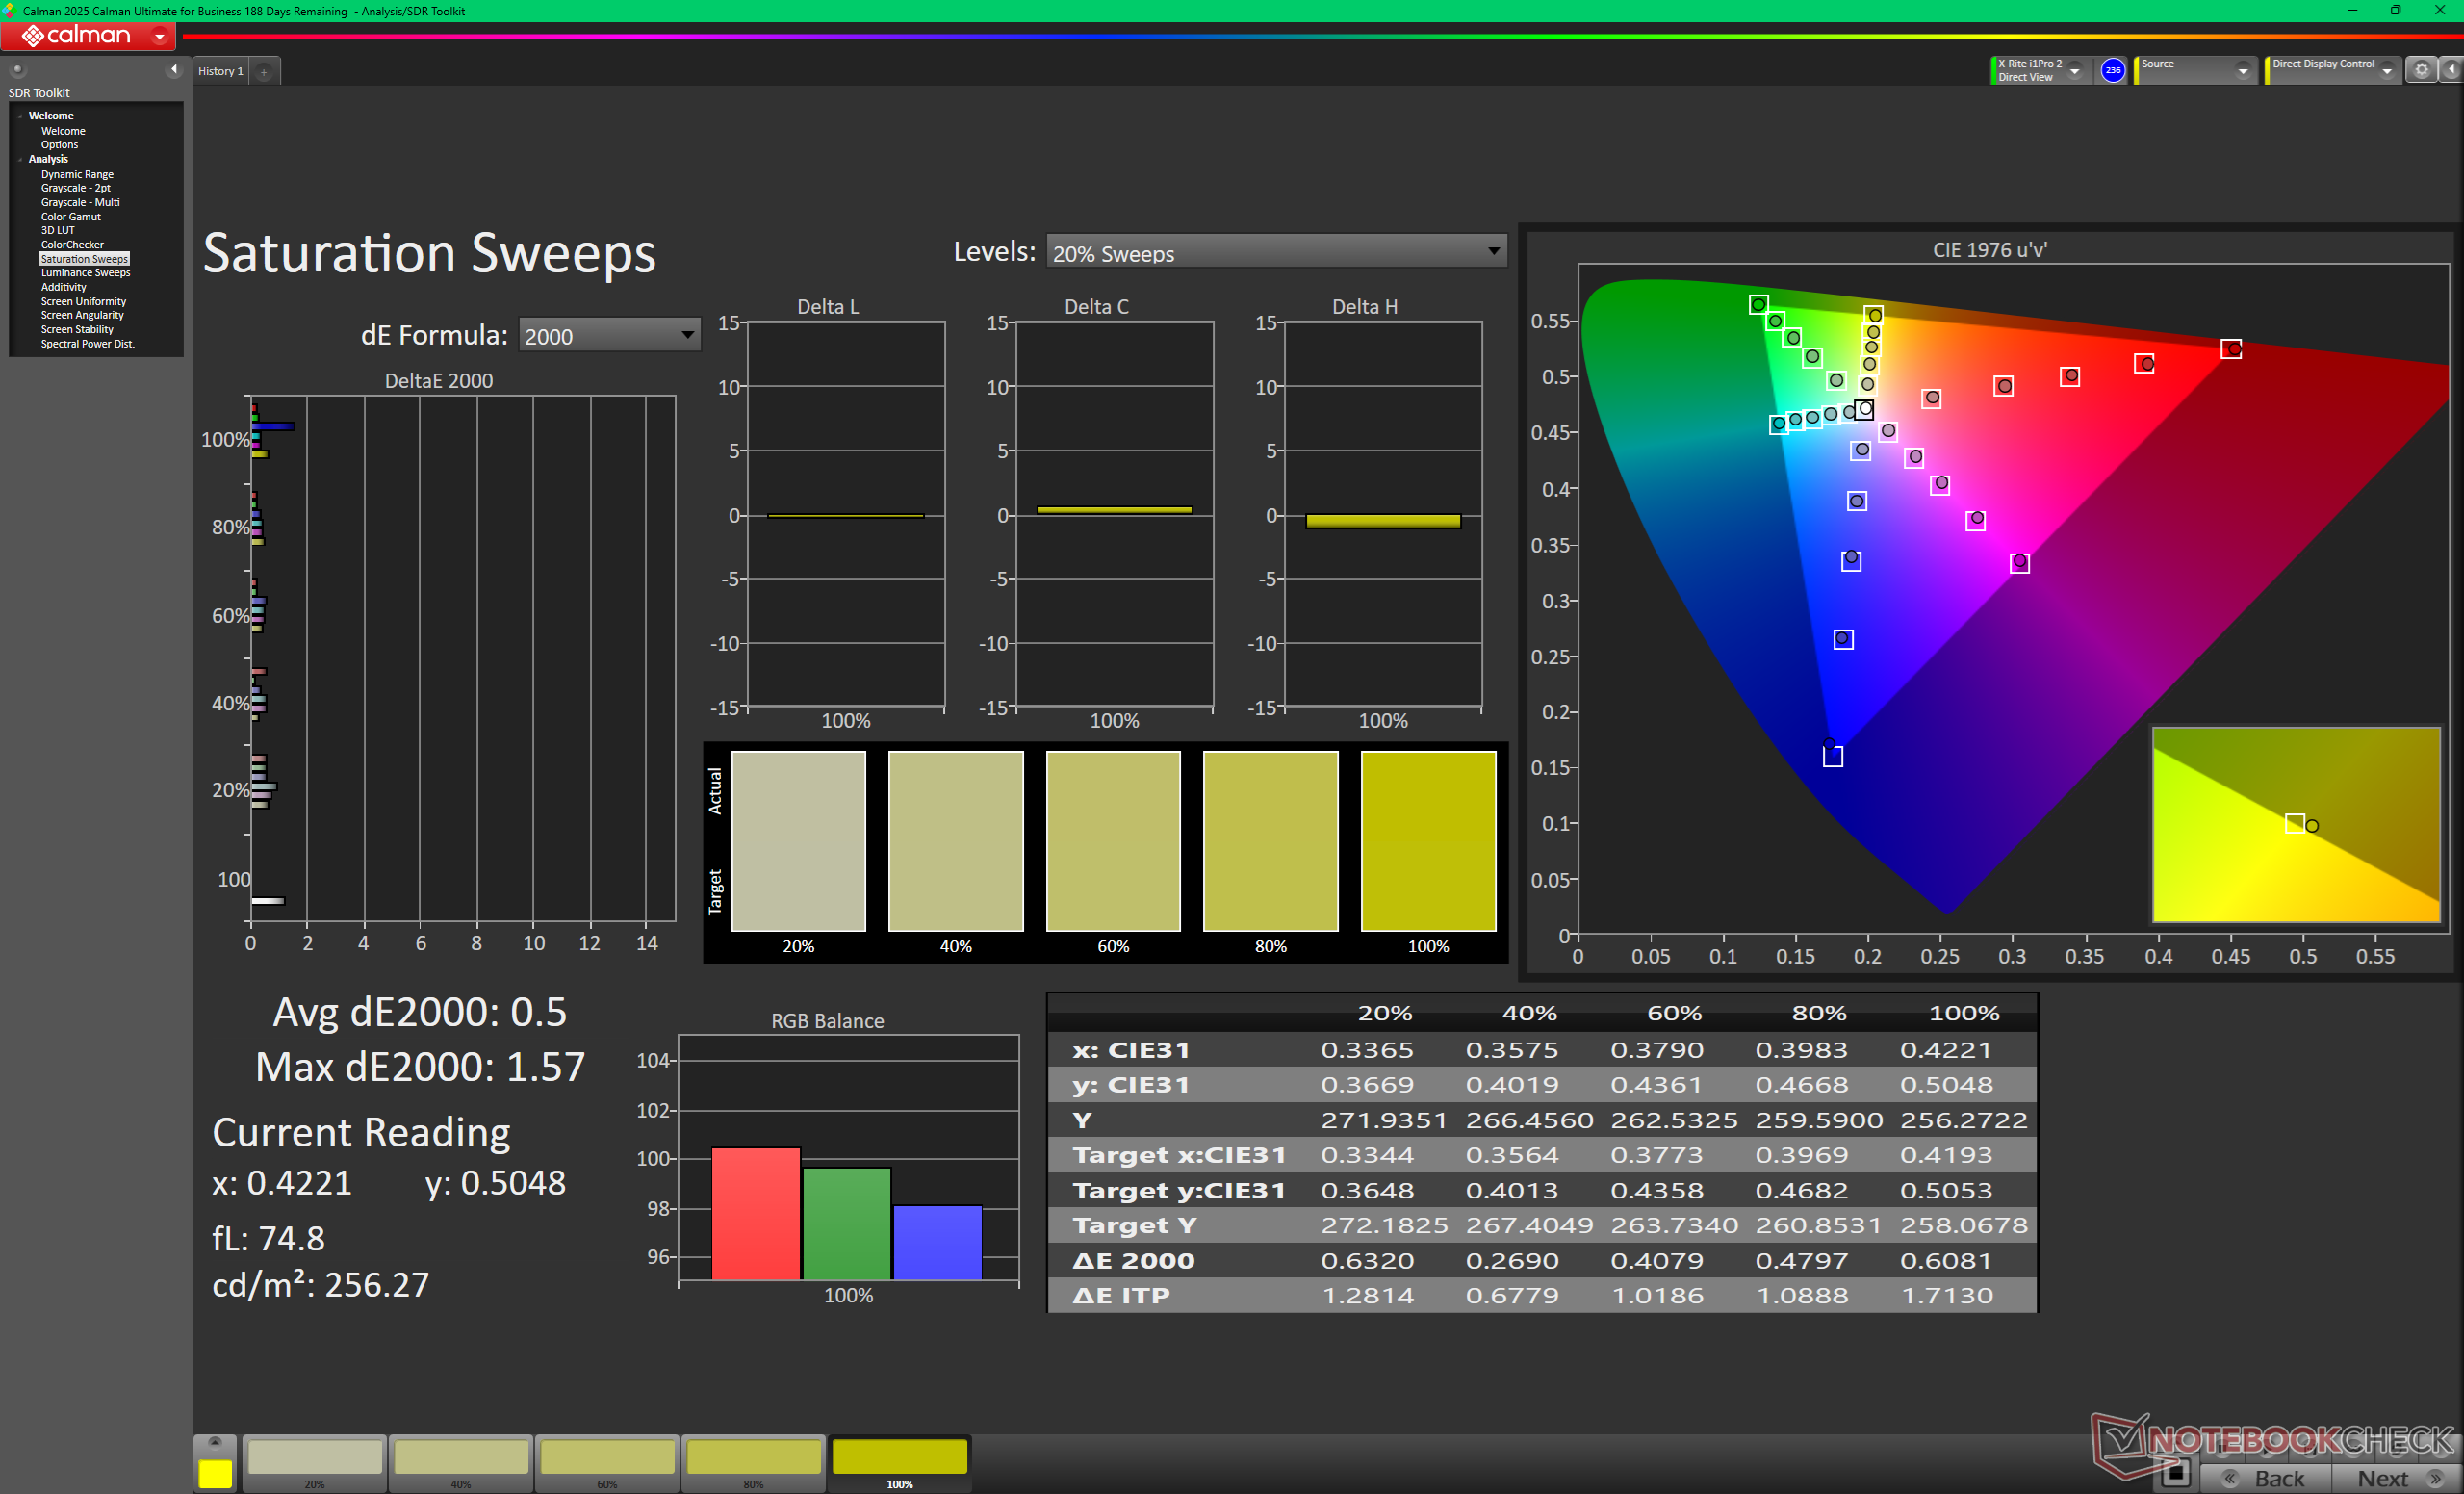
Barreduras de saturación tras la calibración (sRGB)
ColorChecker tras la calibración (sRGB)

Tiempos de respuesta del display

Los tiempos de respuesta del display muestran lo rápido que puede cambiar la pantalla de un color al siguiente. Tiempos lentos de respuesta pueden llevar a imágenes persistentes alrededor de objetos en movimiento o a displays borrosos. Particularmente los aficionados a los juegos 3D frenéticos deberían usar una pantalla con tiempos de respuesta rápidos.
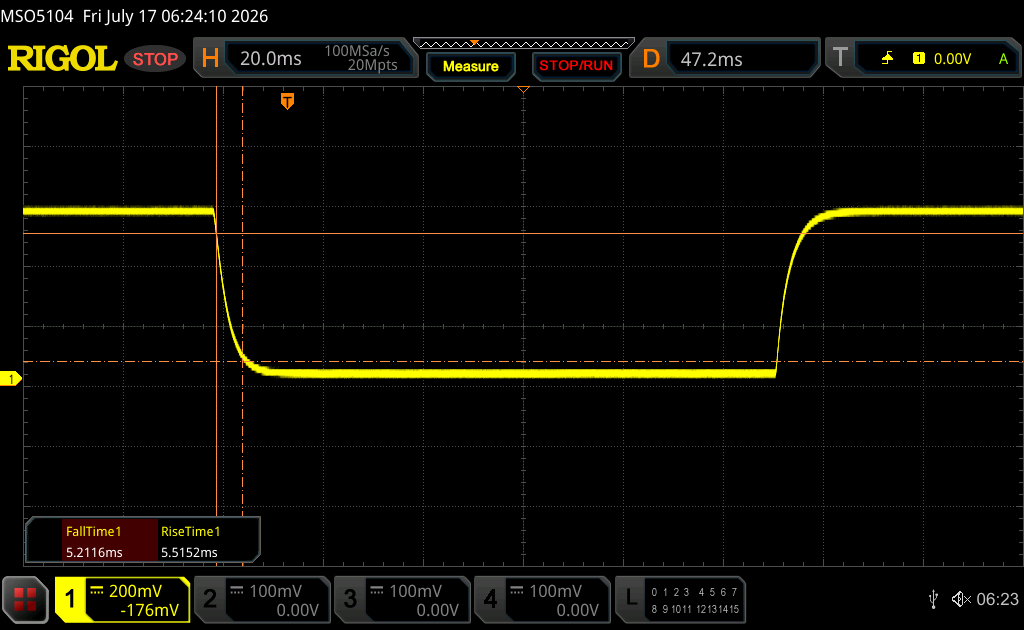
       Tiempo de respuesta de Negro a Blanco
10.7 ms ... subida ↗ y bajada ↘ combinada↗ 5.5 ms subida
↘ 5.2 ms bajada
La pantalla mostró buenos tiempos de respuesta en nuestros tests pero podría ser demasiado lenta para los jugones competitivos.
En comparación, todos los dispositivos de prueba van de ##min### (mínimo) a 240 (máximo) ms. » 29 % de todos los dispositivos son mejores.
Esto quiere decir que el tiempo de respuesta medido es mejor que la media (19.7 ms) de todos los dispositivos testados.
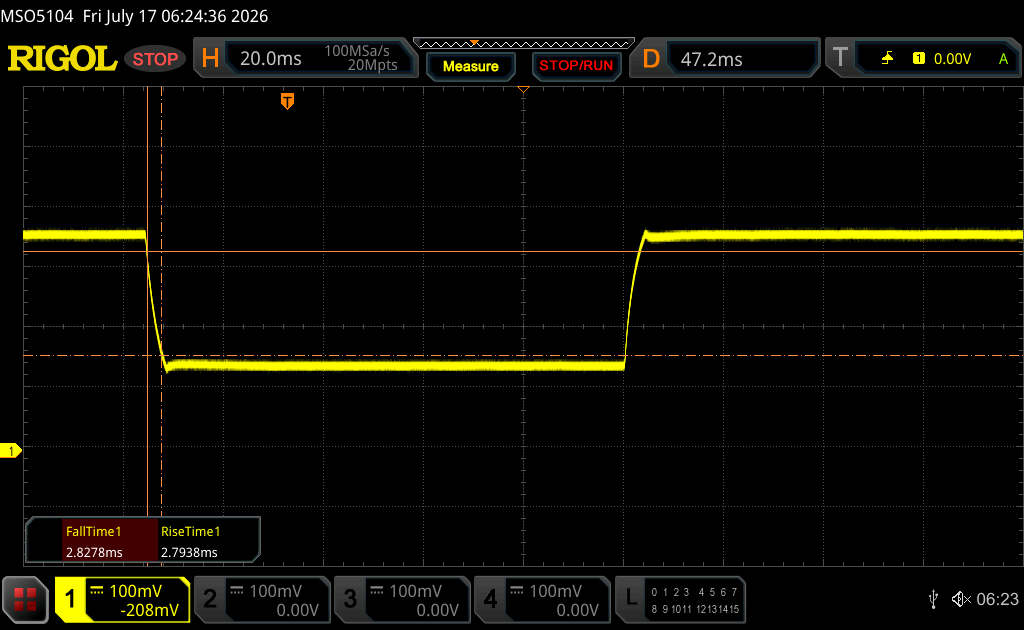
       Tiempo de respuesta 50% Gris a 80% Gris
5.6 ms ... subida ↗ y bajada ↘ combinada↗ 2.8 ms subida
↘ 2.8 ms bajada
La pantalla mostró tiempos de respuesta muy rápidos en nuestros tests y debería ser adecuada para juegos frenéticos.
En comparación, todos los dispositivos de prueba van de ##min### (mínimo) a 636 (máximo) ms. » 18 % de todos los dispositivos son mejores.
Esto quiere decir que el tiempo de respuesta medido es mejor que la media (30.8 ms) de todos los dispositivos testados.

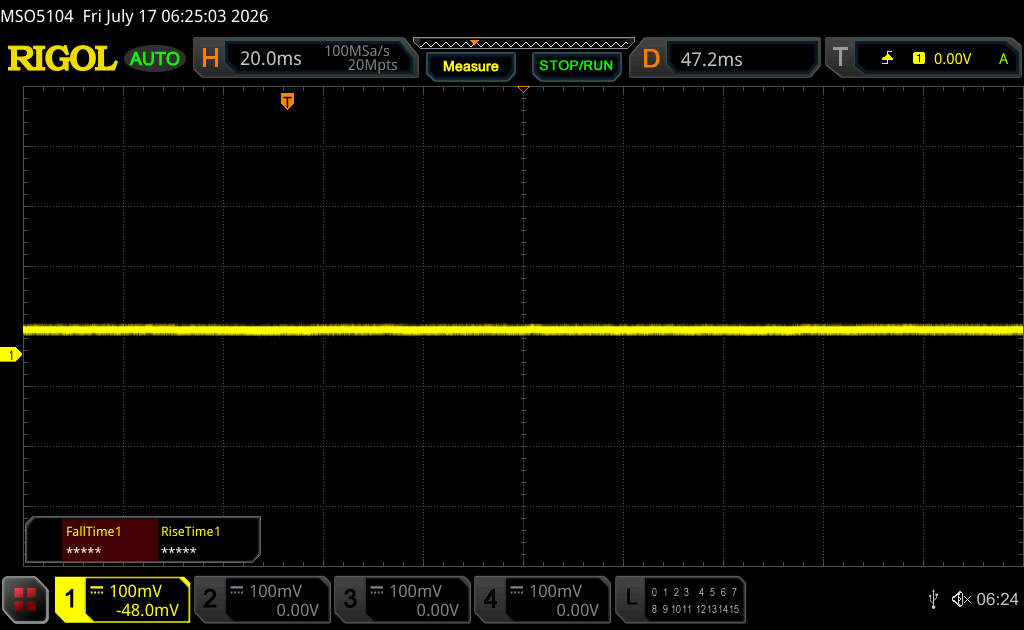
Parpadeo de Pantalla / PWM (Pulse-Width Modulation)

Para atenuar el brillo de pantalla algunos portátiles están encendiendo y apagando la retroiluminación muy rápidamente. Esto se hace a una frecuencia que no debiera detectarse a simple vista. Si la frecuencia es demasiado lenta, la gente sensible podría experimentar problemas visuales, dolores de cabeza e incluso ver parpadeos.
Parpadeo de Pantalla / PWM no detectado

Comparación: 52 % de todos los dispositivos testados no usaron PWM para atenuar el display. Si se usó, medimos una media de 7686 (mínimo: 5 - máxmo: 343500) Hz.

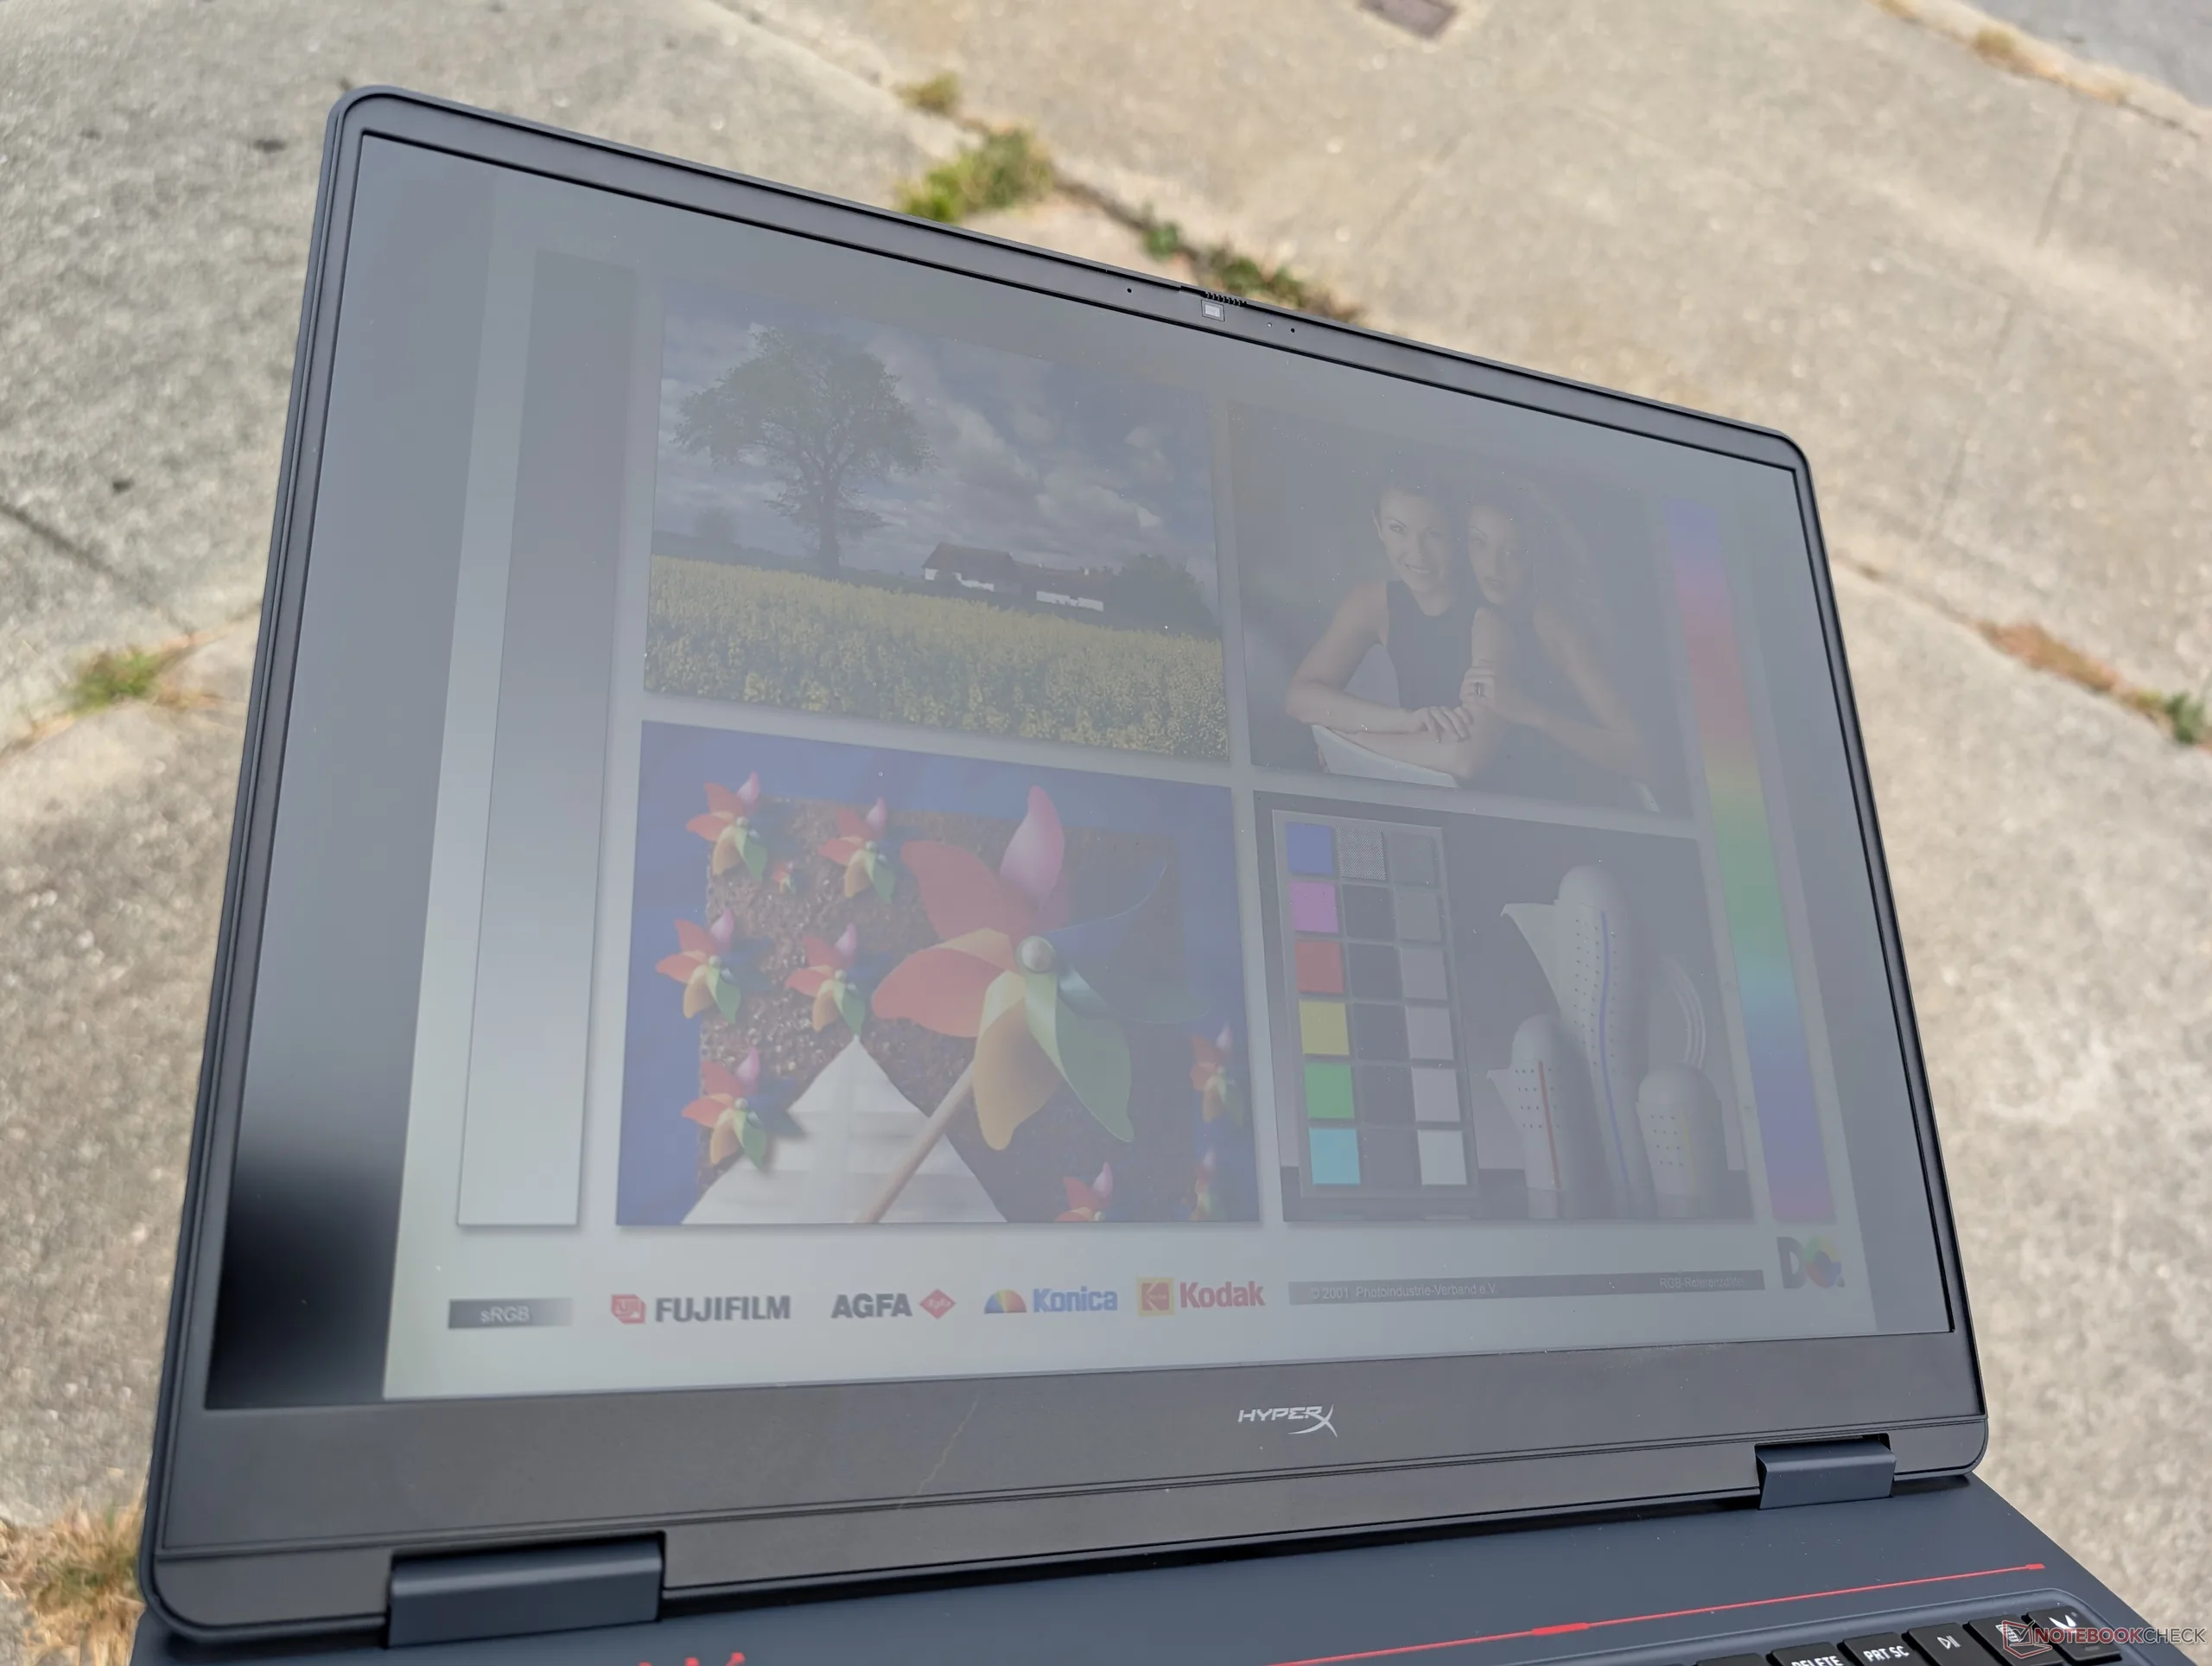
Al aire libre, bajo un cielo nublado pero luminoso
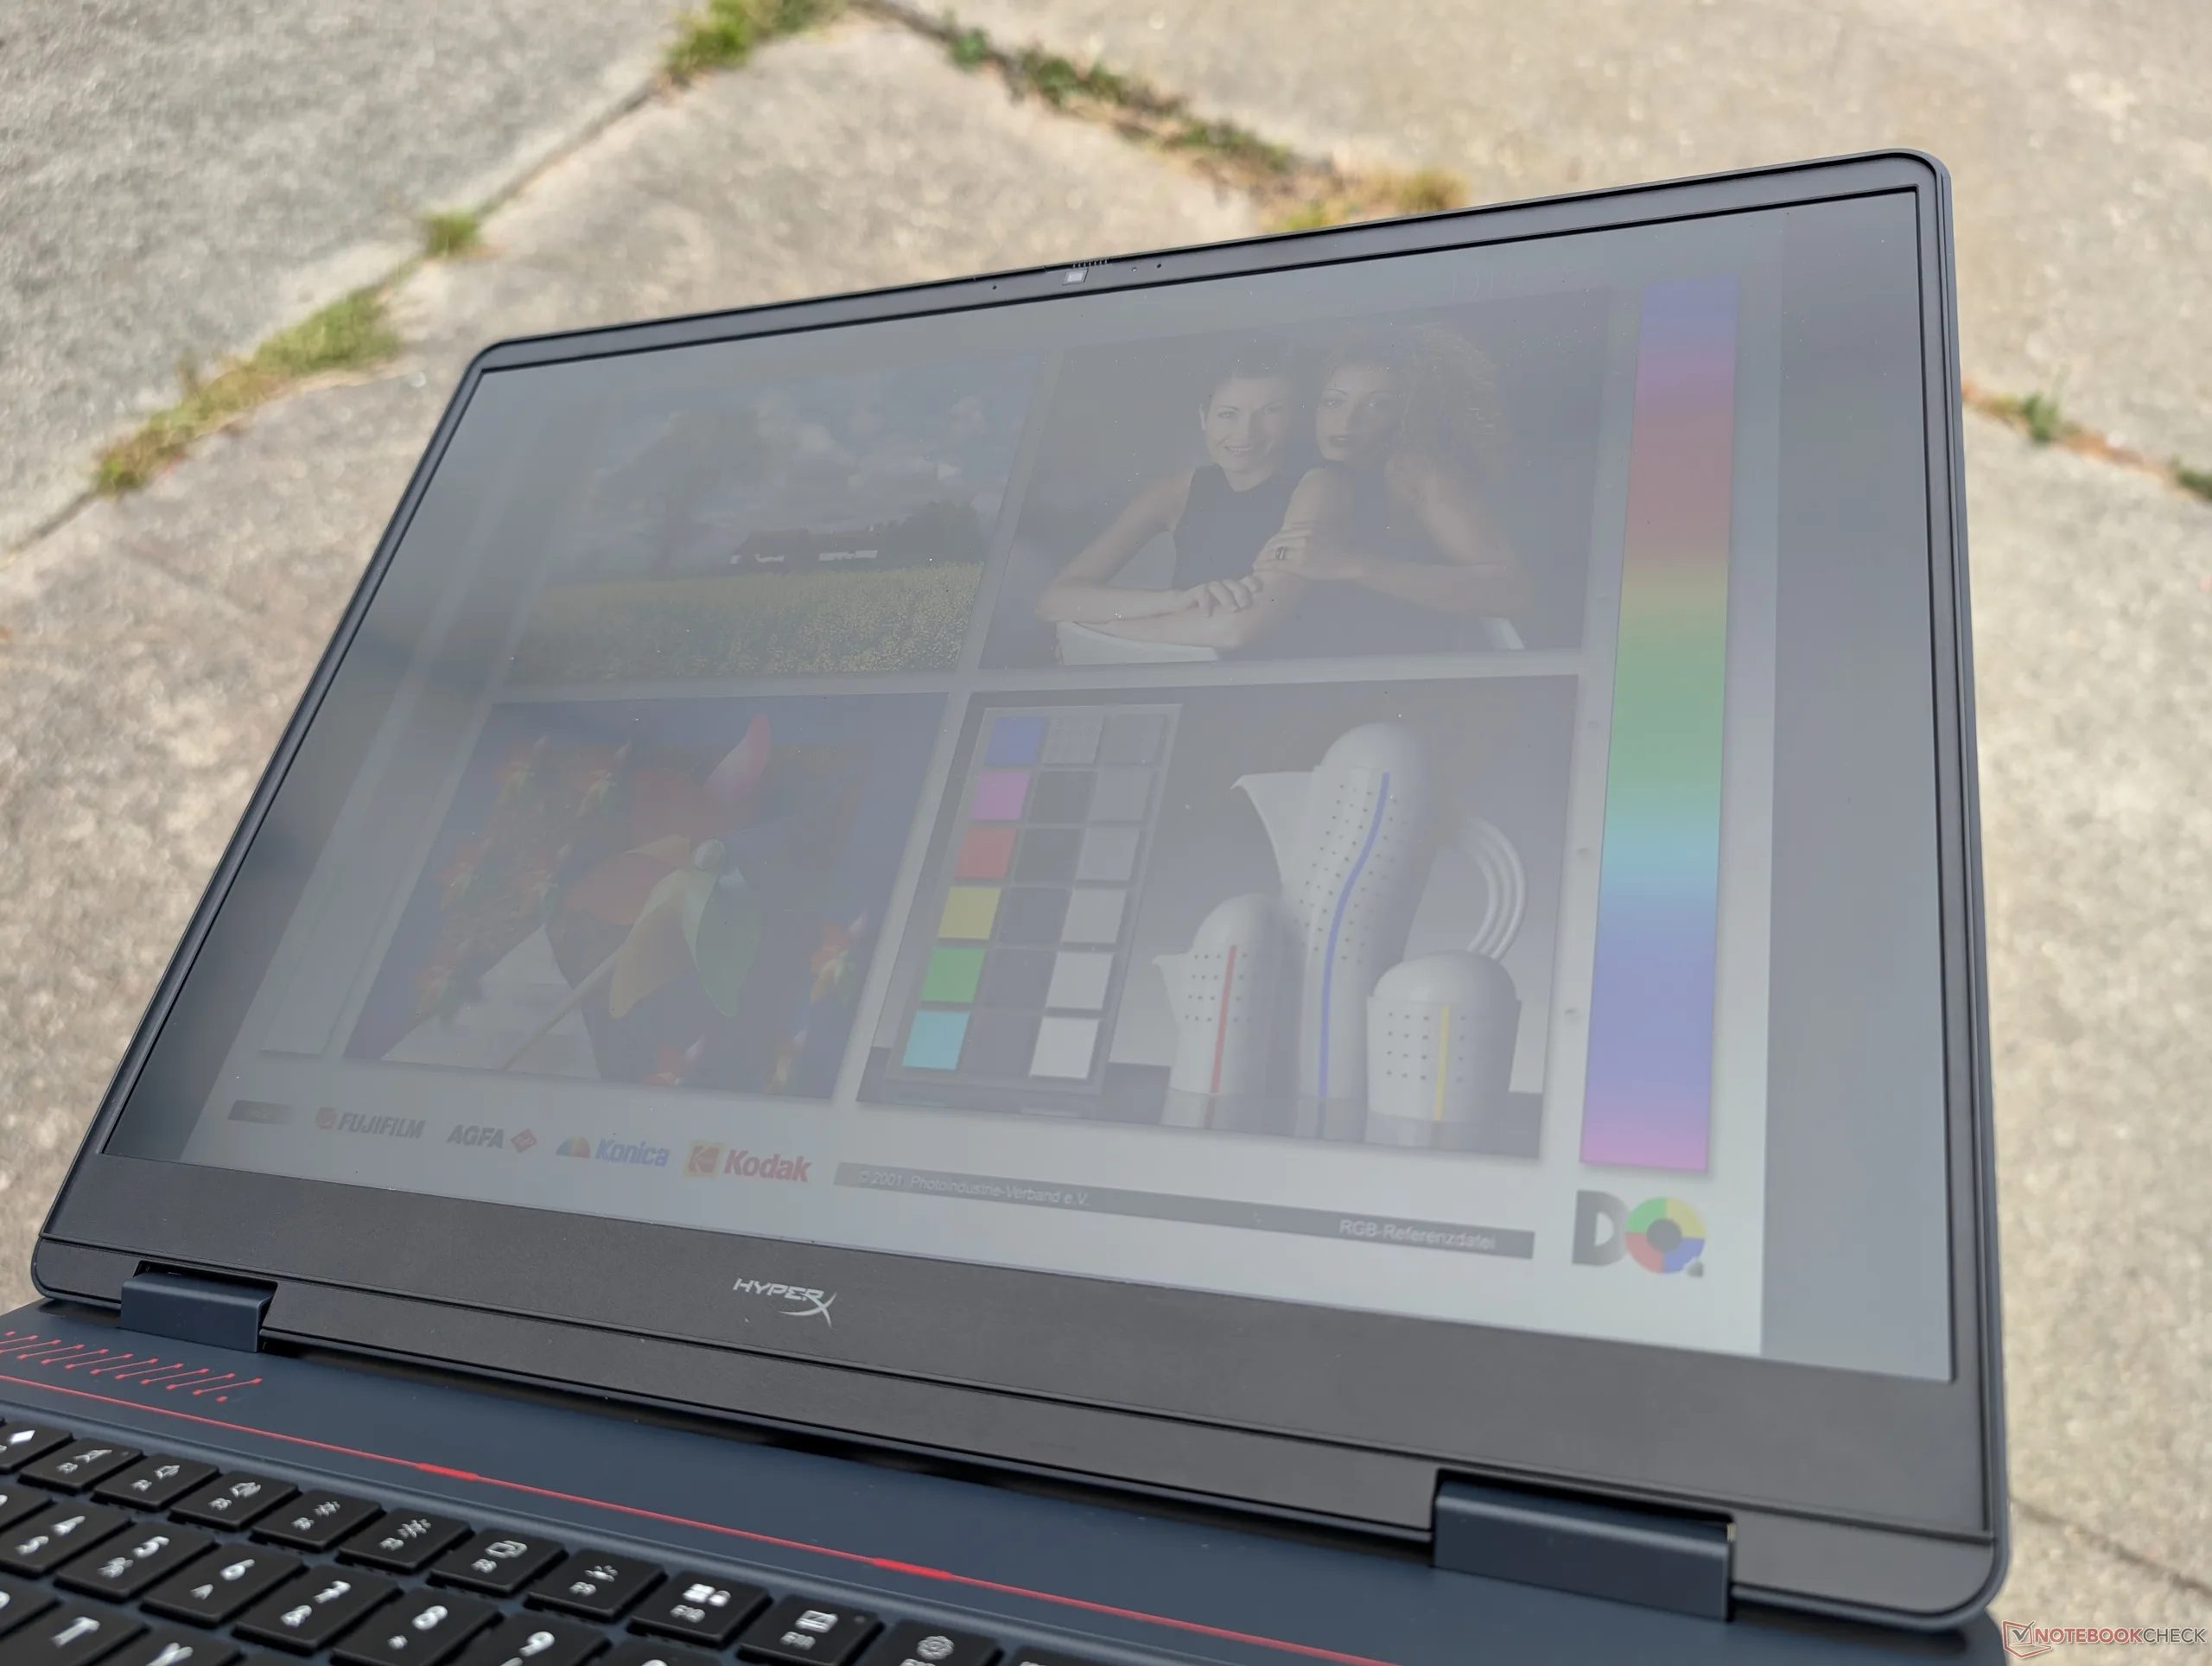
Al aire libre, a la sombra
Al aire libre, bajo un cielo nublado pero luminoso
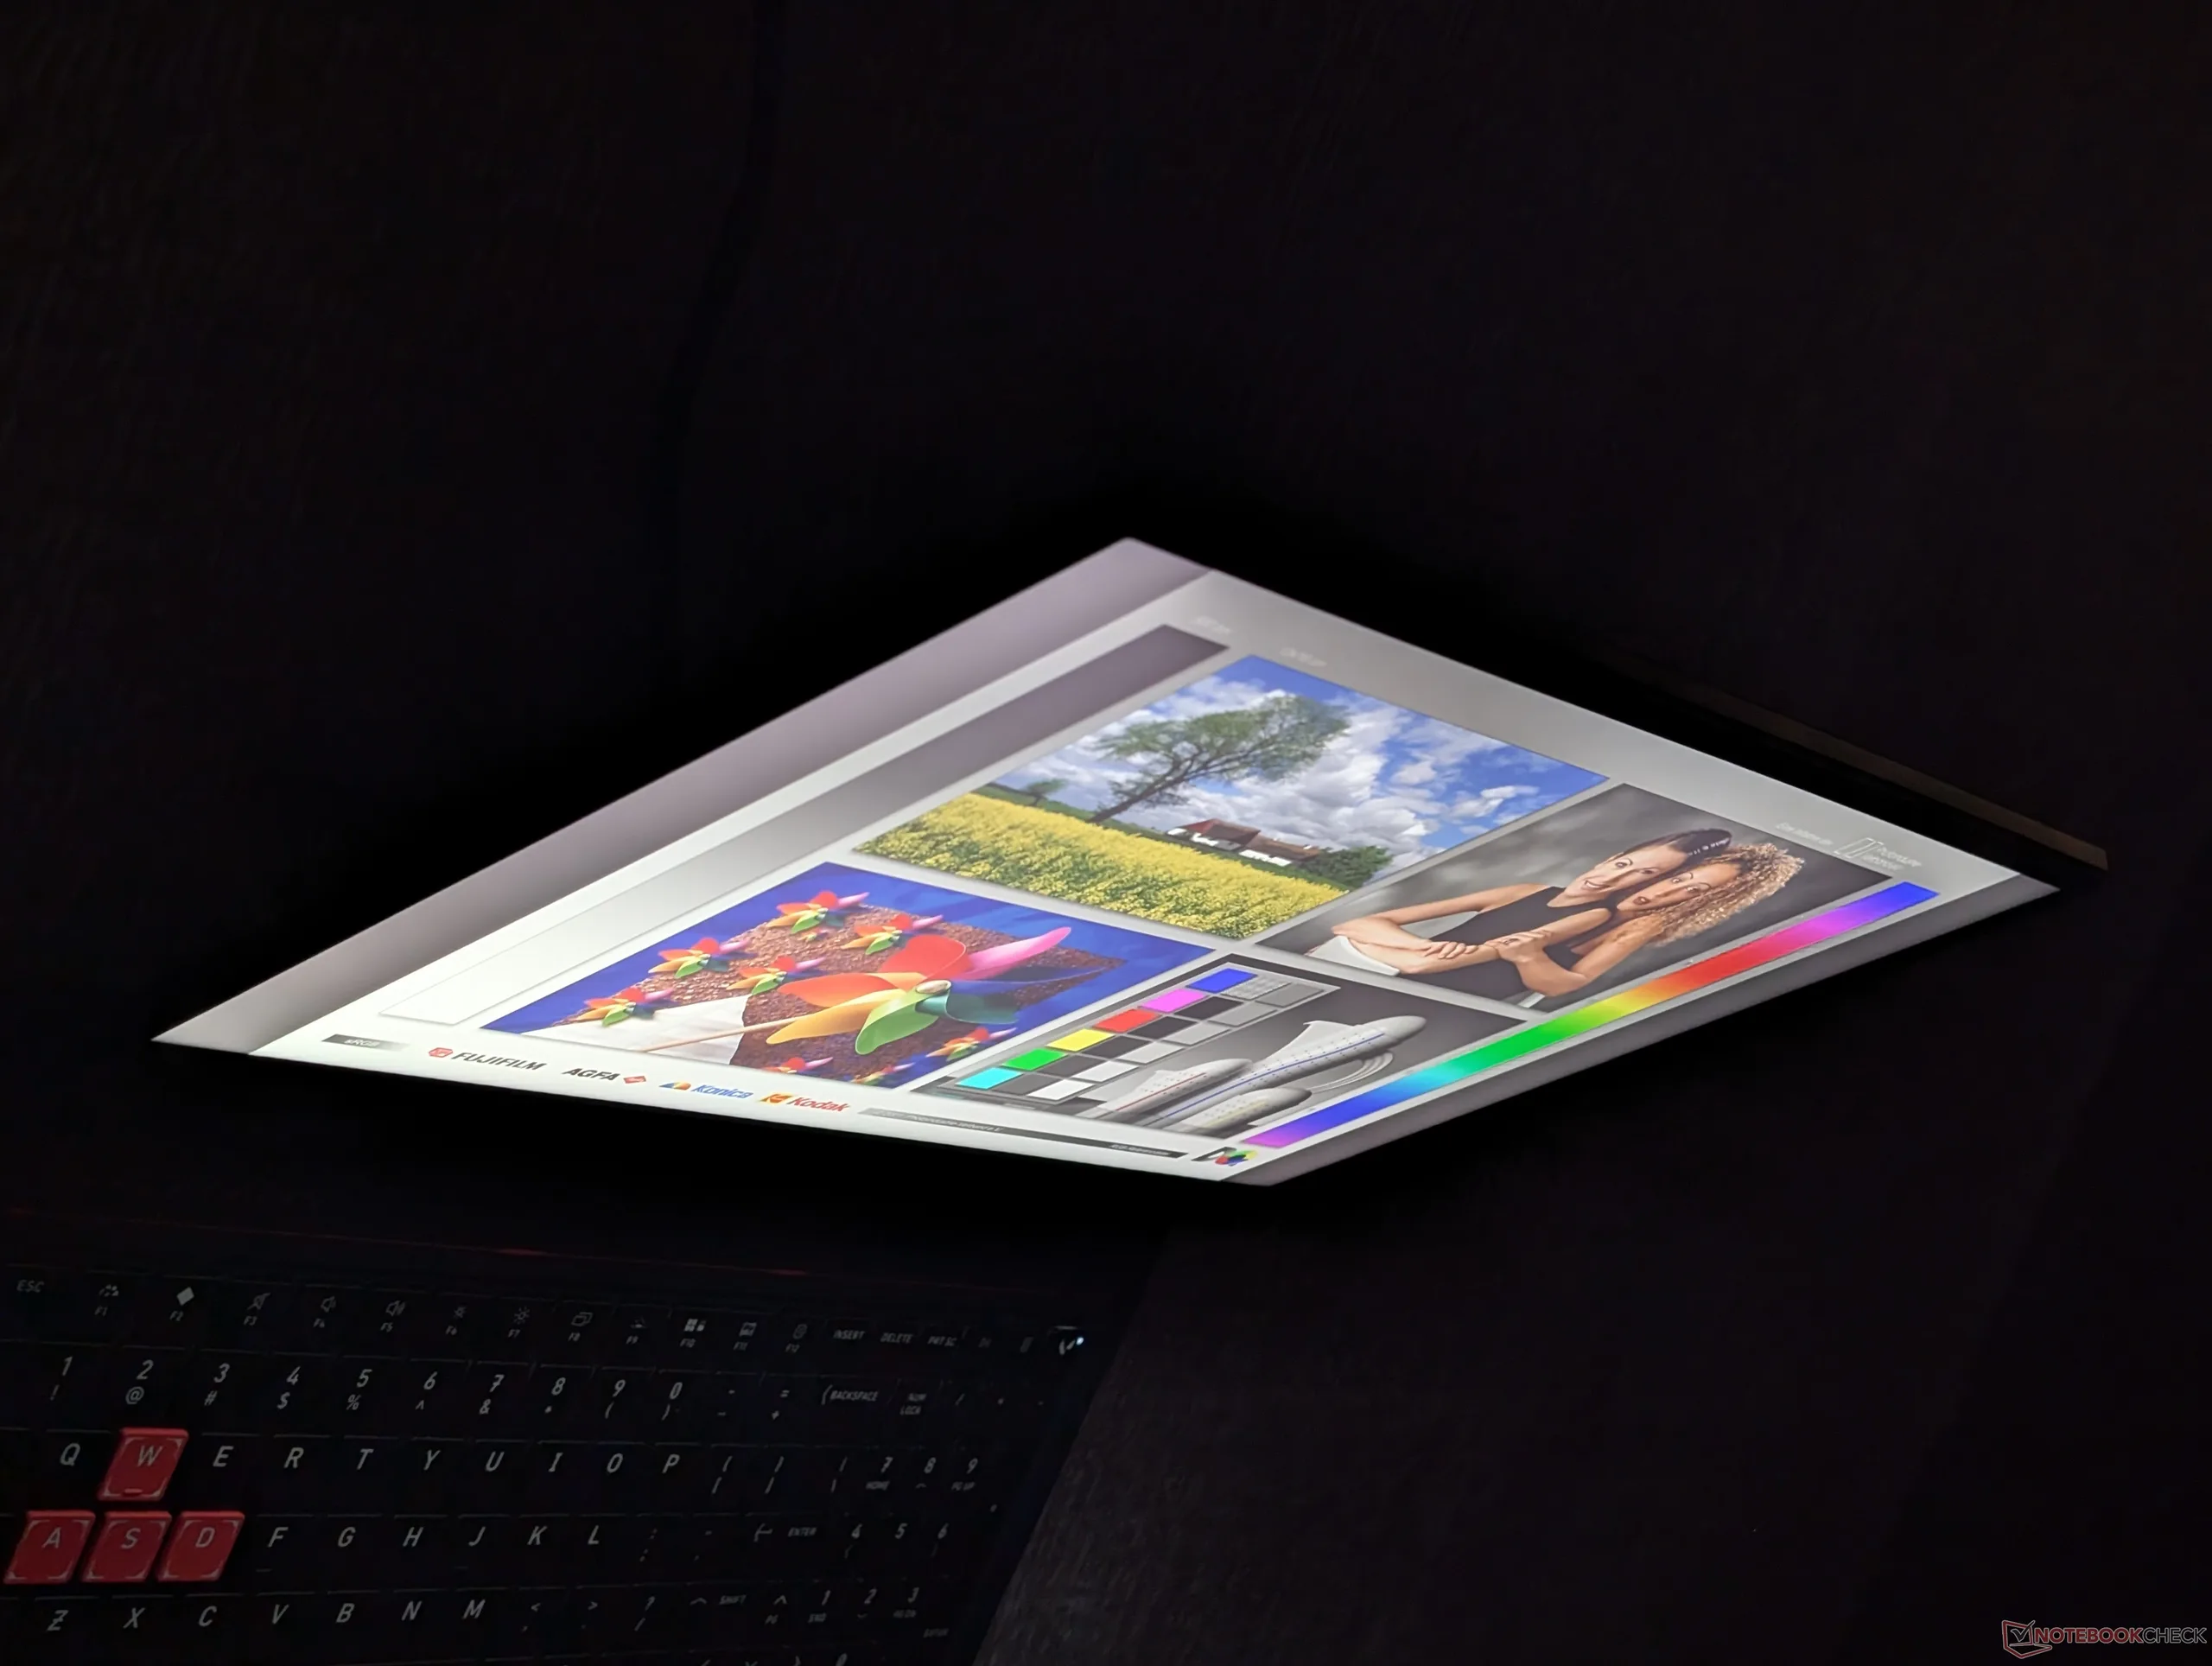
Amplios ángulos de visión IPS

Rendimiento

Condiciones de ensayo

Configuramos el sistema en modo «Unleashed» y en modo de tarjeta gráfica dedicada antes de ejecutar las pruebas de rendimiento que se indican a continuación.

Rendimiento del procesador

El rendimiento general del procesador es solo un poco más lento que el de los portátiles equipados con el Core Ultra 9 290HX Plus, como el Alienware 16X Aurora. Por lo demás, el Ryzen 9 9955HXD es prácticamente idéntico al Ryzen 9 9955HX, salvo por el tamaño de su caché L3.

Cinebench R15 Multi Loop

01202403604806007208409601080120013201440156016801800192020402160228024002520264027602880300031203240336034803600372038403960408042004320444045604680480049205040516052805400552056405760Tooltip
HP HyperX Omen 16 16-ap1931nr AMD Ryzen 9 9955HX3D: Ø5663 (5471.21-5839.42) Points
HP Omen 16-ap0091ng AMD Ryzen 9 8940HX: Ø4084 (4037.14-4295.53) Points
MSI Crosshair A16 HX E8WGK AMD Ryzen 9 8940HX: Ø5290 (5233.55-5355.47) Points
Alienware 16X Aurora Core Ultra 9 290HX Plus Intel Core Ultra 9 290HX Plus: Ø5102 (4340.28-5617.19) Points
Lenovo Legion Pro 5 16IAX10, RTX 5070 Intel Core Ultra 7 255HX: Ø4910 (4795.01-5190.09) Points
Asus TUF Gaming A16 FA608UP AMD Ryzen 7 260: Ø2740 (2520.16-2768.93) Points
CPU Performance rating: Percent
Cinebench R23: Multi Core | Single Core
Cinebench R20: CPU (Multi Core) | CPU (Single Core)
Cinebench R15: CPU Multi 64Bit | CPU Single 64Bit
Blender: v2.79 BMW27 CPU
7-Zip 18.03: 7z b 4 | 7z b 4 -mmt1
Geekbench 6.7: Multi-Core | Single-Core
Geekbench 5.5: Multi-Core | Single-Core
HWBOT x265 Benchmark v2.2: 4k Preset
LibreOffice : 20 Documents To PDF
R Benchmark 2.5: Overall mean
CPU Performance rating
Medio AMD Ryzen 9 9955HX3D
 
85 pt
Schenker XMG APEX 16 MAX
AMD Ryzen 9 9955HX
84.8 pt
Alienware 16X Aurora Core Ultra 9 290HX Plus
Intel Core Ultra 9 290HX Plus
83 pt
HP HyperX Omen 16 16-ap1931nr
AMD Ryzen 9 9955HX3D
82.4 pt
Acer Predator Helios Neo 16S AI PHN16S-71-94L9
Intel Core Ultra 9 275HX
77.6 pt
Lenovo Legion Pro 5 16IAX10, RTX 5070
Intel Core Ultra 7 255HX
77.5 pt
MSI Crosshair A16 HX E8WGK
AMD Ryzen 9 8940HX
75.6 pt
Lenovo Legion 9 16IRX9, RTX 4090
Intel Core i9-14900HX
67.1 pt
HP Omen 16-ap0091ng
AMD Ryzen 9 8940HX
65.6 pt
Alienware m16 R1 Intel
Intel Core i7-13700HX
59 pt
Asus TUF Gaming A16 FA608UP
AMD Ryzen 7 260
52.7 pt
Cinebench R23 / Multi Core
Medio AMD Ryzen 9 9955HX3D
  (36580 - 39266, n=4)
38042 Points +4%
Alienware 16X Aurora Core Ultra 9 290HX Plus
Intel Core Ultra 9 290HX Plus
37038 (32828min - 37037.5max) Points +1%
HP HyperX Omen 16 16-ap1931nr
AMD Ryzen 9 9955HX3D
36580 (35337.4min - 36580.1max) Points
Schenker XMG APEX 16 MAX
AMD Ryzen 9 9955HX
35960 Points -2%
Lenovo Legion Pro 5 16IAX10, RTX 5070
Intel Core Ultra 7 255HX
34005 Points -7%
MSI Crosshair A16 HX E8WGK
AMD Ryzen 9 8940HX
32745 (32277.9min - 32745.3max) Points -10%
Lenovo Legion 9 16IRX9, RTX 4090
Intel Core i9-14900HX
31889 Points -13%
Acer Predator Helios Neo 16S AI PHN16S-71-94L9
Intel Core Ultra 9 275HX
31727 Points -13%
HP Omen 16-ap0091ng
AMD Ryzen 9 8940HX
27145 Points -26%
Alienware m16 R1 Intel
Intel Core i7-13700HX
21889 Points -40%
Asus TUF Gaming A16 FA608UP
AMD Ryzen 7 260
17277 Points -53%
Cinebench R23 / Single Core
Alienware 16X Aurora Core Ultra 9 290HX Plus
Intel Core Ultra 9 290HX Plus
2330 Points +8%
Acer Predator Helios Neo 16S AI PHN16S-71-94L9
Intel Core Ultra 9 275HX
2250 Points +4%
Schenker XMG APEX 16 MAX
AMD Ryzen 9 9955HX
2172 Points +1%
Lenovo Legion Pro 5 16IAX10, RTX 5070
Intel Core Ultra 7 255HX
2163 Points 0%
Medio AMD Ryzen 9 9955HX3D
  (2150 - 2179, n=4)
2162 Points 0%
HP HyperX Omen 16 16-ap1931nr
AMD Ryzen 9 9955HX3D
2154 Points
Alienware m16 R1 Intel
Intel Core i7-13700HX
1933 Points -10%
HP Omen 16-ap0091ng
AMD Ryzen 9 8940HX
1917 Points -11%
MSI Crosshair A16 HX E8WGK
AMD Ryzen 9 8940HX
1886 Points -12%
Asus TUF Gaming A16 FA608UP
AMD Ryzen 7 260
1760 Points -18%
Lenovo Legion 9 16IRX9, RTX 4090
Intel Core i9-14900HX
1720 Points -20%
Cinebench R20 / CPU (Multi Core)
Medio AMD Ryzen 9 9955HX3D
  (14209 - 15177, n=4)
14831 Points +4%
Alienware 16X Aurora Core Ultra 9 290HX Plus
Intel Core Ultra 9 290HX Plus
14397 Points +1%
HP HyperX Omen 16 16-ap1931nr
AMD Ryzen 9 9955HX3D
14209 Points
Schenker XMG APEX 16 MAX
AMD Ryzen 9 9955HX
13963 Points -2%
Lenovo Legion Pro 5 16IAX10, RTX 5070
Intel Core Ultra 7 255HX
13056 Points -8%
MSI Crosshair A16 HX E8WGK
AMD Ryzen 9 8940HX
12785 Points -10%
Acer Predator Helios Neo 16S AI PHN16S-71-94L9
Intel Core Ultra 9 275HX
12542 Points -12%
Lenovo Legion 9 16IRX9, RTX 4090
Intel Core i9-14900HX
11960 Points -16%
HP Omen 16-ap0091ng
AMD Ryzen 9 8940HX
10439 Points -27%
Alienware m16 R1 Intel
Intel Core i7-13700HX
8062 Points -43%
Asus TUF Gaming A16 FA608UP
AMD Ryzen 7 260
6770 Points -52%
Cinebench R20 / CPU (Single Core)
Acer Predator Helios Neo 16S AI PHN16S-71-94L9
Intel Core Ultra 9 275HX
865 Points +2%
Alienware 16X Aurora Core Ultra 9 290HX Plus
Intel Core Ultra 9 290HX Plus
864 Points +2%
Schenker XMG APEX 16 MAX
AMD Ryzen 9 9955HX
856 Points +1%
HP HyperX Omen 16 16-ap1931nr
AMD Ryzen 9 9955HX3D
845 Points
Medio AMD Ryzen 9 9955HX3D
  (790 - 851, n=4)
833 Points -1%
Lenovo Legion Pro 5 16IAX10, RTX 5070
Intel Core Ultra 7 255HX
831 Points -2%
HP Omen 16-ap0091ng
AMD Ryzen 9 8940HX
745 Points -12%
Alienware m16 R1 Intel
Intel Core i7-13700HX
738 Points -13%
MSI Crosshair A16 HX E8WGK
AMD Ryzen 9 8940HX
736 Points -13%
Asus TUF Gaming A16 FA608UP
AMD Ryzen 7 260
679 Points -20%
Lenovo Legion 9 16IRX9, RTX 4090
Intel Core i9-14900HX
657 Points -22%
Cinebench R15 / CPU Multi 64Bit
Medio AMD Ryzen 9 9955HX3D
  (5839 - 6068, n=4)
5998 Points +3%
HP HyperX Omen 16 16-ap1931nr
AMD Ryzen 9 9955HX3D
5839 (5471.21min - 5839.42max) Points
Schenker XMG APEX 16 MAX
AMD Ryzen 9 9955HX
5624 (5340.45min - 5623.51max) Points -4%
Alienware 16X Aurora Core Ultra 9 290HX Plus
Intel Core Ultra 9 290HX Plus
5617 (4340.28min - 5617.19max) Points -4%
MSI Crosshair A16 HX E8WGK
AMD Ryzen 9 8940HX
5355 (5233.55min - 5355.47max) Points -8%
Lenovo Legion Pro 5 16IAX10, RTX 5070
Intel Core Ultra 7 255HX
5190 (4795.01min - 5190.09max) Points -11%
Lenovo Legion 9 16IRX9, RTX 4090
Intel Core i9-14900HX
4879 (4505.52min - 4878.64max) Points -16%
Acer Predator Helios Neo 16S AI PHN16S-71-94L9
Intel Core Ultra 9 275HX
4737 (4180.6min - 4737.09max) Points -19%
HP Omen 16-ap0091ng
AMD Ryzen 9 8940HX
4296 (4037.14min - 4295.53max) Points -26%
Alienware m16 R1 Intel
Intel Core i7-13700HX
3183 Points -45%
Asus TUF Gaming A16 FA608UP
AMD Ryzen 7 260
2769 (2520.16min - 2768.93max) Points -53%
Cinebench R15 / CPU Single 64Bit
Alienware 16X Aurora Core Ultra 9 290HX Plus
Intel Core Ultra 9 290HX Plus
340 Points +1%
Schenker XMG APEX 16 MAX
AMD Ryzen 9 9955HX
336 Points 0%
Acer Predator Helios Neo 16S AI PHN16S-71-94L9
Intel Core Ultra 9 275HX
335 Points 0%
HP HyperX Omen 16 16-ap1931nr
AMD Ryzen 9 9955HX3D
335 Points
Medio AMD Ryzen 9 9955HX3D
  (321 - 335, n=4)
330 Points -1%
Lenovo Legion Pro 5 16IAX10, RTX 5070
Intel Core Ultra 7 255HX
328 Points -2%
MSI Crosshair A16 HX E8WGK
AMD Ryzen 9 8940HX
301 Points -10%
HP Omen 16-ap0091ng
AMD Ryzen 9 8940HX
292 Points -13%
Alienware m16 R1 Intel
Intel Core i7-13700HX
277 Points -17%
Asus TUF Gaming A16 FA608UP
AMD Ryzen 7 260
275 Points -18%
Lenovo Legion 9 16IRX9, RTX 4090
Intel Core i9-14900HX
247 Points -26%
Blender / v2.79 BMW27 CPU
Asus TUF Gaming A16 FA608UP
AMD Ryzen 7 260
182 Seconds * -100%
Alienware m16 R1 Intel
Intel Core i7-13700HX
159 Seconds * -75%
HP Omen 16-ap0091ng
AMD Ryzen 9 8940HX
116 Seconds * -27%
Acer Predator Helios Neo 16S AI PHN16S-71-94L9
Intel Core Ultra 9 275HX
112 Seconds * -23%
Lenovo Legion 9 16IRX9, RTX 4090
Intel Core i9-14900HX
106 Seconds * -16%
Lenovo Legion Pro 5 16IAX10, RTX 5070
Intel Core Ultra 7 255HX
104 Seconds * -14%
MSI Crosshair A16 HX E8WGK
AMD Ryzen 9 8940HX
96 Seconds * -5%
Alienware 16X Aurora Core Ultra 9 290HX Plus
Intel Core Ultra 9 290HX Plus
94 Seconds * -3%
HP HyperX Omen 16 16-ap1931nr
AMD Ryzen 9 9955HX3D
91 Seconds *
Schenker XMG APEX 16 MAX
AMD Ryzen 9 9955HX
85 Seconds * +7%
Medio AMD Ryzen 9 9955HX3D
  (80 - 91, n=4)
83.3 Seconds * +8%
7-Zip 18.03 / 7z b 4
Medio AMD Ryzen 9 9955HX3D
  (130158 - 148086, n=4)
142262 MIPS +9%
Schenker XMG APEX 16 MAX
AMD Ryzen 9 9955HX
139824 MIPS +7%
MSI Crosshair A16 HX E8WGK
AMD Ryzen 9 8940HX
137645 MIPS +6%
HP HyperX Omen 16 16-ap1931nr
AMD Ryzen 9 9955HX3D
130158 MIPS
Lenovo Legion 9 16IRX9, RTX 4090
Intel Core i9-14900HX
125676 MIPS -3%
Lenovo Legion Pro 5 16IAX10, RTX 5070
Intel Core Ultra 7 255HX
104055 MIPS -20%
Alienware 16X Aurora Core Ultra 9 290HX Plus
Intel Core Ultra 9 290HX Plus
103986 MIPS -20%
HP Omen 16-ap0091ng
AMD Ryzen 9 8940HX
103455 MIPS -21%
Acer Predator Helios Neo 16S AI PHN16S-71-94L9
Intel Core Ultra 9 275HX
102844 MIPS -21%
Alienware m16 R1 Intel
Intel Core i7-13700HX
83449 MIPS -36%
Asus TUF Gaming A16 FA608UP
AMD Ryzen 7 260
72400 MIPS -44%
7-Zip 18.03 / 7z b 4 -mmt1
HP Omen 16-ap0091ng
AMD Ryzen 9 8940HX
7407 MIPS +6%
Schenker XMG APEX 16 MAX
AMD Ryzen 9 9955HX
7374 MIPS +6%
MSI Crosshair A16 HX E8WGK
AMD Ryzen 9 8940HX
7220 MIPS +4%
Medio AMD Ryzen 9 9955HX3D
  (6960 - 7382, n=4)
7198 MIPS +3%
Acer Predator Helios Neo 16S AI PHN16S-71-94L9
Intel Core Ultra 9 275HX
6981 MIPS 0%
HP HyperX Omen 16 16-ap1931nr
AMD Ryzen 9 9955HX3D
6960 MIPS
Lenovo Legion Pro 5 16IAX10, RTX 5070
Intel Core Ultra 7 255HX
6576 MIPS -6%
Alienware 16X Aurora Core Ultra 9 290HX Plus
Intel Core Ultra 9 290HX Plus
6562 MIPS -6%
Alienware m16 R1 Intel
Intel Core i7-13700HX
6409 MIPS -8%
Asus TUF Gaming A16 FA608UP
AMD Ryzen 7 260
6101 MIPS -12%
Lenovo Legion 9 16IRX9, RTX 4090
Intel Core i9-14900HX
5452 MIPS -22%
Geekbench 6.7 / Multi-Core
Medio AMD Ryzen 9 9955HX3D
  (19418 - 20551, n=6)
20040 Points +3%
Alienware 16X Aurora Core Ultra 9 290HX Plus
Intel Core Ultra 9 290HX Plus
19855 Points +2%
Schenker XMG APEX 16 MAX
AMD Ryzen 9 9955HX
19725 Points +2%
Acer Predator Helios Neo 16S AI PHN16S-71-94L9
Intel Core Ultra 9 275HX
19675 Points +1%
Lenovo Legion Pro 5 16IAX10, RTX 5070
Intel Core Ultra 7 255HX
19623 Points +1%
HP HyperX Omen 16 16-ap1931nr
AMD Ryzen 9 9955HX3D
19418 Points
Lenovo Legion 9 16IRX9, RTX 4090
Intel Core i9-14900HX
17499 Points -10%
MSI Crosshair A16 HX E8WGK
AMD Ryzen 9 8940HX
16483 Points -15%
Alienware m16 R1 Intel
Intel Core i7-13700HX
14402 Points -26%
Asus TUF Gaming A16 FA608UP
AMD Ryzen 7 260
13299 Points -32%
HP Omen 16-ap0091ng
AMD Ryzen 9 8940HX
11447 Points -41%
Geekbench 6.7 / Single-Core
Schenker XMG APEX 16 MAX
AMD Ryzen 9 9955HX
3259 Points +3%
Medio AMD Ryzen 9 9955HX3D
  (3146 - 3237, n=6)
3186 Points +1%
HP HyperX Omen 16 16-ap1931nr
AMD Ryzen 9 9955HX3D
3159 Points
Alienware 16X Aurora Core Ultra 9 290HX Plus
Intel Core Ultra 9 290HX Plus
3147 Points 0%
Acer Predator Helios Neo 16S AI PHN16S-71-94L9
Intel Core Ultra 9 275HX
3113 Points -1%
Lenovo Legion Pro 5 16IAX10, RTX 5070
Intel Core Ultra 7 255HX
3028 Points -4%
MSI Crosshair A16 HX E8WGK
AMD Ryzen 9 8940HX
2839 Points -10%
HP Omen 16-ap0091ng
AMD Ryzen 9 8940HX
2816 Points -11%
Asus TUF Gaming A16 FA608UP
AMD Ryzen 7 260
2673 Points -15%
Alienware m16 R1 Intel
Intel Core i7-13700HX
2638 Points -16%
Lenovo Legion 9 16IRX9, RTX 4090
Intel Core i9-14900HX
2419 Points -23%
Geekbench 5.5 / Multi-Core
Alienware 16X Aurora Core Ultra 9 290HX Plus
Intel Core Ultra 9 290HX Plus
23839 Points +12%
Medio AMD Ryzen 9 9955HX3D
  (21223 - 23669, n=4)
23005 Points +8%
Schenker XMG APEX 16 MAX
AMD Ryzen 9 9955HX
22716 Points +7%
Acer Predator Helios Neo 16S AI PHN16S-71-94L9
Intel Core Ultra 9 275HX
22082 Points +4%
Lenovo Legion 9 16IRX9, RTX 4090
Intel Core i9-14900HX
21642 Points +2%
HP HyperX Omen 16 16-ap1931nr
AMD Ryzen 9 9955HX3D
21223 Points
Lenovo Legion Pro 5 16IAX10, RTX 5070
Intel Core Ultra 7 255HX
20532 Points -3%
MSI Crosshair A16 HX E8WGK
AMD Ryzen 9 8940HX
19054 Points -10%
Alienware m16 R1 Intel
Intel Core i7-13700HX
14448 Points -32%
HP Omen 16-ap0091ng
AMD Ryzen 9 8940HX
13357 Points -37%
Asus TUF Gaming A16 FA608UP
AMD Ryzen 7 260
12239 Points -42%
Geekbench 5.5 / Single-Core
Schenker XMG APEX 16 MAX
AMD Ryzen 9 9955HX
2474 Points +6%
Medio AMD Ryzen 9 9955HX3D
  (2326 - 2406, n=4)
2379 Points +2%
HP HyperX Omen 16 16-ap1931nr
AMD Ryzen 9 9955HX3D
2326 Points
Alienware 16X Aurora Core Ultra 9 290HX Plus
Intel Core Ultra 9 290HX Plus
2282 Points -2%
Lenovo Legion Pro 5 16IAX10, RTX 5070
Intel Core Ultra 7 255HX
2211 Points -5%
Acer Predator Helios Neo 16S AI PHN16S-71-94L9
Intel Core Ultra 9 275HX
2196 Points -6%
MSI Crosshair A16 HX E8WGK
AMD Ryzen 9 8940HX
2025 Points -13%
HP Omen 16-ap0091ng
AMD Ryzen 9 8940HX
1961 Points -16%
Asus TUF Gaming A16 FA608UP
AMD Ryzen 7 260
1954 Points -16%
Alienware m16 R1 Intel
Intel Core i7-13700HX
1845 Points -21%
Lenovo Legion 9 16IRX9, RTX 4090
Intel Core i9-14900HX
1729 Points -26%
HWBOT x265 Benchmark v2.2 / 4k Preset
Medio AMD Ryzen 9 9955HX3D
  (39 - 43, n=4)
41.8 fps +7%
Schenker XMG APEX 16 MAX
AMD Ryzen 9 9955HX
39.7 fps +2%
HP HyperX Omen 16 16-ap1931nr
AMD Ryzen 9 9955HX3D
39 fps
Alienware 16X Aurora Core Ultra 9 290HX Plus
Intel Core Ultra 9 290HX Plus
38.2 fps -2%
Lenovo Legion Pro 5 16IAX10, RTX 5070
Intel Core Ultra 7 255HX
36.9 fps -5%
MSI Crosshair A16 HX E8WGK
AMD Ryzen 9 8940HX
35.7 fps -8%
Acer Predator Helios Neo 16S AI PHN16S-71-94L9
Intel Core Ultra 9 275HX
33.4 fps -14%
Lenovo Legion 9 16IRX9, RTX 4090
Intel Core i9-14900HX
30.7 fps -21%
HP Omen 16-ap0091ng
AMD Ryzen 9 8940HX
25.7 fps -34%
Alienware m16 R1 Intel
Intel Core i7-13700HX
22.4 fps -43%
Asus TUF Gaming A16 FA608UP
AMD Ryzen 7 260
21.4 fps -45%
LibreOffice / 20 Documents To PDF
Asus TUF Gaming A16 FA608UP
AMD Ryzen 7 260
57.1 s * -10%
Lenovo Legion 9 16IRX9, RTX 4090
Intel Core i9-14900HX
53.6 s * -3%
Medio AMD Ryzen 9 9955HX3D
  (44.9 - 71.8, n=5)
53.4 s * -3%
HP HyperX Omen 16 16-ap1931nr
AMD Ryzen 9 9955HX3D
51.9 s *
HP HyperX Omen 16 16-ap1931nr
AMD Ryzen 9 9955HX3D
51.9 s * -0%
Schenker XMG APEX 16 MAX
AMD Ryzen 9 9955HX
48.7 s * +6%
HP Omen 16-ap0091ng
AMD Ryzen 9 8940HX
45.9 s * +12%
Lenovo Legion Pro 5 16IAX10, RTX 5070
Intel Core Ultra 7 255HX
45.9 s * +12%
Alienware m16 R1 Intel
Intel Core i7-13700HX
45.4 s * +13%
Acer Predator Helios Neo 16S AI PHN16S-71-94L9
Intel Core Ultra 9 275HX
44.6 s * +14%
MSI Crosshair A16 HX E8WGK
AMD Ryzen 9 8940HX
43.6 s * +16%
Alienware 16X Aurora Core Ultra 9 290HX Plus
Intel Core Ultra 9 290HX Plus
39.4 s * +24%
R Benchmark 2.5 / Overall mean
Lenovo Legion 9 16IRX9, RTX 4090
Intel Core i9-14900HX
0.4859 sec * -35%
Asus TUF Gaming A16 FA608UP
AMD Ryzen 7 260
0.4479 sec * -24%
Alienware m16 R1 Intel
Intel Core i7-13700HX
0.4422 sec * -22%
MSI Crosshair A16 HX E8WGK
AMD Ryzen 9 8940HX
0.4286 sec * -19%
Lenovo Legion Pro 5 16IAX10, RTX 5070
Intel Core Ultra 7 255HX
0.4269 sec * -18%
HP Omen 16-ap0091ng
AMD Ryzen 9 8940HX
0.4215 sec * -17%
Acer Predator Helios Neo 16S AI PHN16S-71-94L9
Intel Core Ultra 9 275HX
0.401 sec * -11%
Alienware 16X Aurora Core Ultra 9 290HX Plus
Intel Core Ultra 9 290HX Plus
0.391 sec * -8%
HP HyperX Omen 16 16-ap1931nr
AMD Ryzen 9 9955HX3D
0.3611 sec *
Medio AMD Ryzen 9 9955HX3D
  (0.3552 - 0.3677, n=4)
0.3602 sec * -0%
Schenker XMG APEX 16 MAX
AMD Ryzen 9 9955HX
0.3439 sec * +5%

* ... más pequeño es mejor

Cinebench R15 CPU Multi 64Bit
5839 Points
Cinebench R15 OpenGL 64Bit
337 fps
Cinebench R15 Ref. Match 64Bit
99.6 %
Cinebench R15 CPU Single 64Bit
335 Points
Cinebench R20 CPU (Multi Core)
14209 Points
Cinebench R20 CPU (Single Core)
845 Points
Cinebench R23 Multi Core
36580 Points
Cinebench R23 Single Core
2154 Points
Cinebench 2024 CPU Multi Core
2015 Points
Cinebench 2024 CPU Single Core
128.2 Points
Cinebench 2026 CPU Multi
8296 Points
Cinebench 2026 CPU Single Thread
522 Points
ayuda
Performance rating
HP HyperX Omen 16 16-ap1931nr -1!
AMD Ryzen 9 9955HX3D, GeForce RTX 5070 Laptop
94.5 pt
Medio AMD Ryzen 9 9955HX3D
 
94.3 pt
MSI Crosshair A16 HX E8WGK -1!
AMD Ryzen 9 8940HX, GeForce RTX 5070 Laptop
75.7 pt
HP Omen 16-ap0091ng -1!
AMD Ryzen 9 8940HX, GeForce RTX 5060 Laptop
66 pt
Lenovo Legion Pro 5 16IAX10, RTX 5070 -1!
Intel Core Ultra 7 255HX, GeForce RTX 5070 Laptop
61.6 pt
Alienware 16X Aurora Core Ultra 9 290HX Plus -1!
Intel Core Ultra 9 290HX Plus, GeForce RTX 5070 Ti Laptop
59.8 pt
Asus TUF Gaming A16 FA608UP -1!
AMD Ryzen 7 260, GeForce RTX 5070 Laptop
47.3 pt
AIDA64 / FP32 Ray-Trace
Medio AMD Ryzen 9 9955HX3D
  (76012 - 84943, n=4)
80661 KRay/s +6%
HP HyperX Omen 16 16-ap1931nr
AMD Ryzen 9 9955HX3D, GeForce RTX 5070 Laptop (v8.20.8100)
76012 KRay/s
MSI Crosshair A16 HX E8WGK
AMD Ryzen 9 8940HX, GeForce RTX 5070 Laptop (v8.20.8100)
53747 KRay/s -29%
HP Omen 16-ap0091ng
AMD Ryzen 9 8940HX, GeForce RTX 5060 Laptop (v6.92.6600)
43311 KRay/s -43%
Alienware 16X Aurora Core Ultra 9 290HX Plus
Intel Core Ultra 9 290HX Plus, GeForce RTX 5070 Ti Laptop (v8.20.8100)
34761 KRay/s -54%
Lenovo Legion Pro 5 16IAX10, RTX 5070
Intel Core Ultra 7 255HX, GeForce RTX 5070 Laptop (v6.92.6600)
34250 KRay/s -55%
Asus TUF Gaming A16 FA608UP
AMD Ryzen 7 260, GeForce RTX 5070 Laptop (v6.92.6600)
28399 KRay/s -63%
AIDA64 / FPU Julia
HP HyperX Omen 16 16-ap1931nr
AMD Ryzen 9 9955HX3D, GeForce RTX 5070 Laptop (v8.20.8100)
358092 Points
Medio AMD Ryzen 9 9955HX3D
  (230738 - 372155, n=4)
299853 Points -16%
MSI Crosshair A16 HX E8WGK
AMD Ryzen 9 8940HX, GeForce RTX 5070 Laptop (v8.20.8100)
218716 Points -39%
Alienware 16X Aurora Core Ultra 9 290HX Plus
Intel Core Ultra 9 290HX Plus, GeForce RTX 5070 Ti Laptop (v8.20.8100)
174665 Points -51%
HP Omen 16-ap0091ng
AMD Ryzen 9 8940HX, GeForce RTX 5060 Laptop (v6.92.6600)
171374 Points -52%
Lenovo Legion Pro 5 16IAX10, RTX 5070
Intel Core Ultra 7 255HX, GeForce RTX 5070 Laptop (v6.92.6600)
167758 Points -53%
Asus TUF Gaming A16 FA608UP
AMD Ryzen 7 260, GeForce RTX 5070 Laptop (v6.92.6600)
117226 Points -67%
AIDA64 / CPU SHA3
Medio AMD Ryzen 9 9955HX3D
  (9393 - 9750, n=4)
9607 MB/s +2%
MSI Crosshair A16 HX E8WGK
AMD Ryzen 9 8940HX, GeForce RTX 5070 Laptop (v8.20.8100)
9427 MB/s 0%
HP HyperX Omen 16 16-ap1931nr
AMD Ryzen 9 9955HX3D, GeForce RTX 5070 Laptop (v8.20.8100)
9393 MB/s
Alienware 16X Aurora Core Ultra 9 290HX Plus
Intel Core Ultra 9 290HX Plus, GeForce RTX 5070 Ti Laptop (v8.20.8100)
8352 MB/s -11%
HP Omen 16-ap0091ng
AMD Ryzen 9 8940HX, GeForce RTX 5060 Laptop (v6.92.6600)
7988 MB/s -15%
Lenovo Legion Pro 5 16IAX10, RTX 5070
Intel Core Ultra 7 255HX, GeForce RTX 5070 Laptop (v6.92.6600)
7694 MB/s -18%
Asus TUF Gaming A16 FA608UP
AMD Ryzen 7 260, GeForce RTX 5070 Laptop (v6.92.6600)
5002 MB/s -47%
AIDA64 / CPU Queen
Medio AMD Ryzen 9 9955HX3D
  (171718 - 173351, n=2)
172535 Points
HP Omen 16-ap0091ng
AMD Ryzen 9 8940HX, GeForce RTX 5060 Laptop (v6.92.6600)
169334 Points
Lenovo Legion Pro 5 16IAX10, RTX 5070
Intel Core Ultra 7 255HX, GeForce RTX 5070 Laptop (v6.92.6600)
135237 Points
Asus TUF Gaming A16 FA608UP
AMD Ryzen 7 260, GeForce RTX 5070 Laptop (v6.92.6600)
119010 Points
AIDA64 / FPU SinJulia
Medio AMD Ryzen 9 9955HX3D
  (31654 - 33636, n=4)
32633 Points +3%
HP HyperX Omen 16 16-ap1931nr
AMD Ryzen 9 9955HX3D, GeForce RTX 5070 Laptop (v8.20.8100)
31654 Points
MSI Crosshair A16 HX E8WGK
AMD Ryzen 9 8940HX, GeForce RTX 5070 Laptop (v8.20.8100)
29886 Points -6%
HP Omen 16-ap0091ng
AMD Ryzen 9 8940HX, GeForce RTX 5060 Laptop (v6.92.6600)
26855 Points -15%
Asus TUF Gaming A16 FA608UP
AMD Ryzen 7 260, GeForce RTX 5070 Laptop (v6.92.6600)
15283 Points -52%
Alienware 16X Aurora Core Ultra 9 290HX Plus
Intel Core Ultra 9 290HX Plus, GeForce RTX 5070 Ti Laptop (v8.20.8100)
13687 Points -57%
Lenovo Legion Pro 5 16IAX10, RTX 5070
Intel Core Ultra 7 255HX, GeForce RTX 5070 Laptop (v6.92.6600)
12286 Points -61%
AIDA64 / FPU Mandel
HP HyperX Omen 16 16-ap1931nr
AMD Ryzen 9 9955HX3D, GeForce RTX 5070 Laptop (v8.20.8100)
189485 Points
Medio AMD Ryzen 9 9955HX3D
  (122088 - 196829, n=4)
158765 Points -16%
MSI Crosshair A16 HX E8WGK
AMD Ryzen 9 8940HX, GeForce RTX 5070 Laptop (v8.20.8100)
117231 Points -38%
Alienware 16X Aurora Core Ultra 9 290HX Plus
Intel Core Ultra 9 290HX Plus, GeForce RTX 5070 Ti Laptop (v8.20.8100)
91215 Points -52%
HP Omen 16-ap0091ng
AMD Ryzen 9 8940HX, GeForce RTX 5060 Laptop (v6.92.6600)
90684 Points -52%
Lenovo Legion Pro 5 16IAX10, RTX 5070
Intel Core Ultra 7 255HX, GeForce RTX 5070 Laptop (v6.92.6600)
87947 Points -54%
Asus TUF Gaming A16 FA608UP
AMD Ryzen 7 260, GeForce RTX 5070 Laptop (v6.92.6600)
63212 Points -67%
AIDA64 / CPU AES
MSI Crosshair A16 HX E8WGK
AMD Ryzen 9 8940HX, GeForce RTX 5070 Laptop (v8.20.8100)
175214 MB/s +15%
Medio AMD Ryzen 9 9955HX3D
  (152883 - 163423, n=4)
159710 MB/s +4%
HP HyperX Omen 16 16-ap1931nr
AMD Ryzen 9 9955HX3D, GeForce RTX 5070 Laptop (v8.20.8100)
152883 MB/s
HP Omen 16-ap0091ng
AMD Ryzen 9 8940HX, GeForce RTX 5060 Laptop (v6.92.6600)
150768 MB/s -1%
Alienware 16X Aurora Core Ultra 9 290HX Plus
Intel Core Ultra 9 290HX Plus, GeForce RTX 5070 Ti Laptop (v8.20.8100)
127585 MB/s -17%
Lenovo Legion Pro 5 16IAX10, RTX 5070
Intel Core Ultra 7 255HX, GeForce RTX 5070 Laptop (v6.92.6600)
115838 MB/s -24%
Asus TUF Gaming A16 FA608UP
AMD Ryzen 7 260, GeForce RTX 5070 Laptop (v6.92.6600)
90394 MB/s -41%
AIDA64 / CPU ZLib
Medio AMD Ryzen 9 9955HX3D
  (2324 - 2517, n=4)
2444 MB/s +5%
HP HyperX Omen 16 16-ap1931nr
AMD Ryzen 9 9955HX3D, GeForce RTX 5070 Laptop (v8.20.8100)
2324 MB/s
MSI Crosshair A16 HX E8WGK
AMD Ryzen 9 8940HX, GeForce RTX 5070 Laptop (v8.20.8100)
2122 MB/s -9%
Alienware 16X Aurora Core Ultra 9 290HX Plus
Intel Core Ultra 9 290HX Plus, GeForce RTX 5070 Ti Laptop (v8.20.8100)
1967 MB/s -15%
Lenovo Legion Pro 5 16IAX10, RTX 5070
Intel Core Ultra 7 255HX, GeForce RTX 5070 Laptop (v6.92.6600)
1850 MB/s -20%
HP Omen 16-ap0091ng
AMD Ryzen 9 8940HX, GeForce RTX 5060 Laptop (v6.92.6600)
1784 MB/s -23%
Asus TUF Gaming A16 FA608UP
AMD Ryzen 7 260, GeForce RTX 5070 Laptop (v6.92.6600)
1039 MB/s -55%
AIDA64 / FP64 Ray-Trace
Medio AMD Ryzen 9 9955HX3D
  (40864 - 45384, n=4)
43001 KRay/s +5%
HP HyperX Omen 16 16-ap1931nr
AMD Ryzen 9 9955HX3D, GeForce RTX 5070 Laptop (v8.20.8100)
40864 KRay/s
MSI Crosshair A16 HX E8WGK
AMD Ryzen 9 8940HX, GeForce RTX 5070 Laptop (v8.20.8100)
28773 KRay/s -30%
HP Omen 16-ap0091ng
AMD Ryzen 9 8940HX, GeForce RTX 5060 Laptop (v6.92.6600)
23193 KRay/s -43%
Alienware 16X Aurora Core Ultra 9 290HX Plus
Intel Core Ultra 9 290HX Plus, GeForce RTX 5070 Ti Laptop (v8.20.8100)
18611 KRay/s -54%
Lenovo Legion Pro 5 16IAX10, RTX 5070
Intel Core Ultra 7 255HX, GeForce RTX 5070 Laptop (v6.92.6600)
18315 KRay/s -55%
Asus TUF Gaming A16 FA608UP
AMD Ryzen 7 260, GeForce RTX 5070 Laptop (v6.92.6600)
15351 KRay/s -62%
AIDA64 / CPU PhotoWorxx
Lenovo Legion Pro 5 16IAX10, RTX 5070
Intel Core Ultra 7 255HX, GeForce RTX 5070 Laptop (v6.92.6600)
54070 MPixel/s +23%
Alienware 16X Aurora Core Ultra 9 290HX Plus
Intel Core Ultra 9 290HX Plus, GeForce RTX 5070 Ti Laptop (v8.20.8100)
51199 MPixel/s +16%
HP HyperX Omen 16 16-ap1931nr
AMD Ryzen 9 9955HX3D, GeForce RTX 5070 Laptop (v8.20.8100)
43964 MPixel/s
Medio AMD Ryzen 9 9955HX3D
  (38765 - 44266, n=4)
42507 MPixel/s -3%
Asus TUF Gaming A16 FA608UP
AMD Ryzen 7 260, GeForce RTX 5070 Laptop (v6.92.6600)
39936 MPixel/s -9%
MSI Crosshair A16 HX E8WGK
AMD Ryzen 9 8940HX, GeForce RTX 5070 Laptop (v8.20.8100)
35274 MPixel/s -20%
HP Omen 16-ap0091ng
AMD Ryzen 9 8940HX, GeForce RTX 5060 Laptop (v6.92.6600)
18283 MPixel/s -58%
AIDA64 / CPU CheckMate
Medio AMD Ryzen 9 9955HX3D
  (19603 - 20751, n=2)
20177 MP/s +3%
HP HyperX Omen 16 16-ap1931nr
AMD Ryzen 9 9955HX3D, GeForce RTX 5070 Laptop (v8.20.8100)
19603 MP/s
MSI Crosshair A16 HX E8WGK
AMD Ryzen 9 8940HX, GeForce RTX 5070 Laptop (v8.20.8100)
11788 MP/s -40%
Alienware 16X Aurora Core Ultra 9 290HX Plus
Intel Core Ultra 9 290HX Plus, GeForce RTX 5070 Ti Laptop (v8.20.8100)
7624 MP/s -61%

Rendimiento del sistema

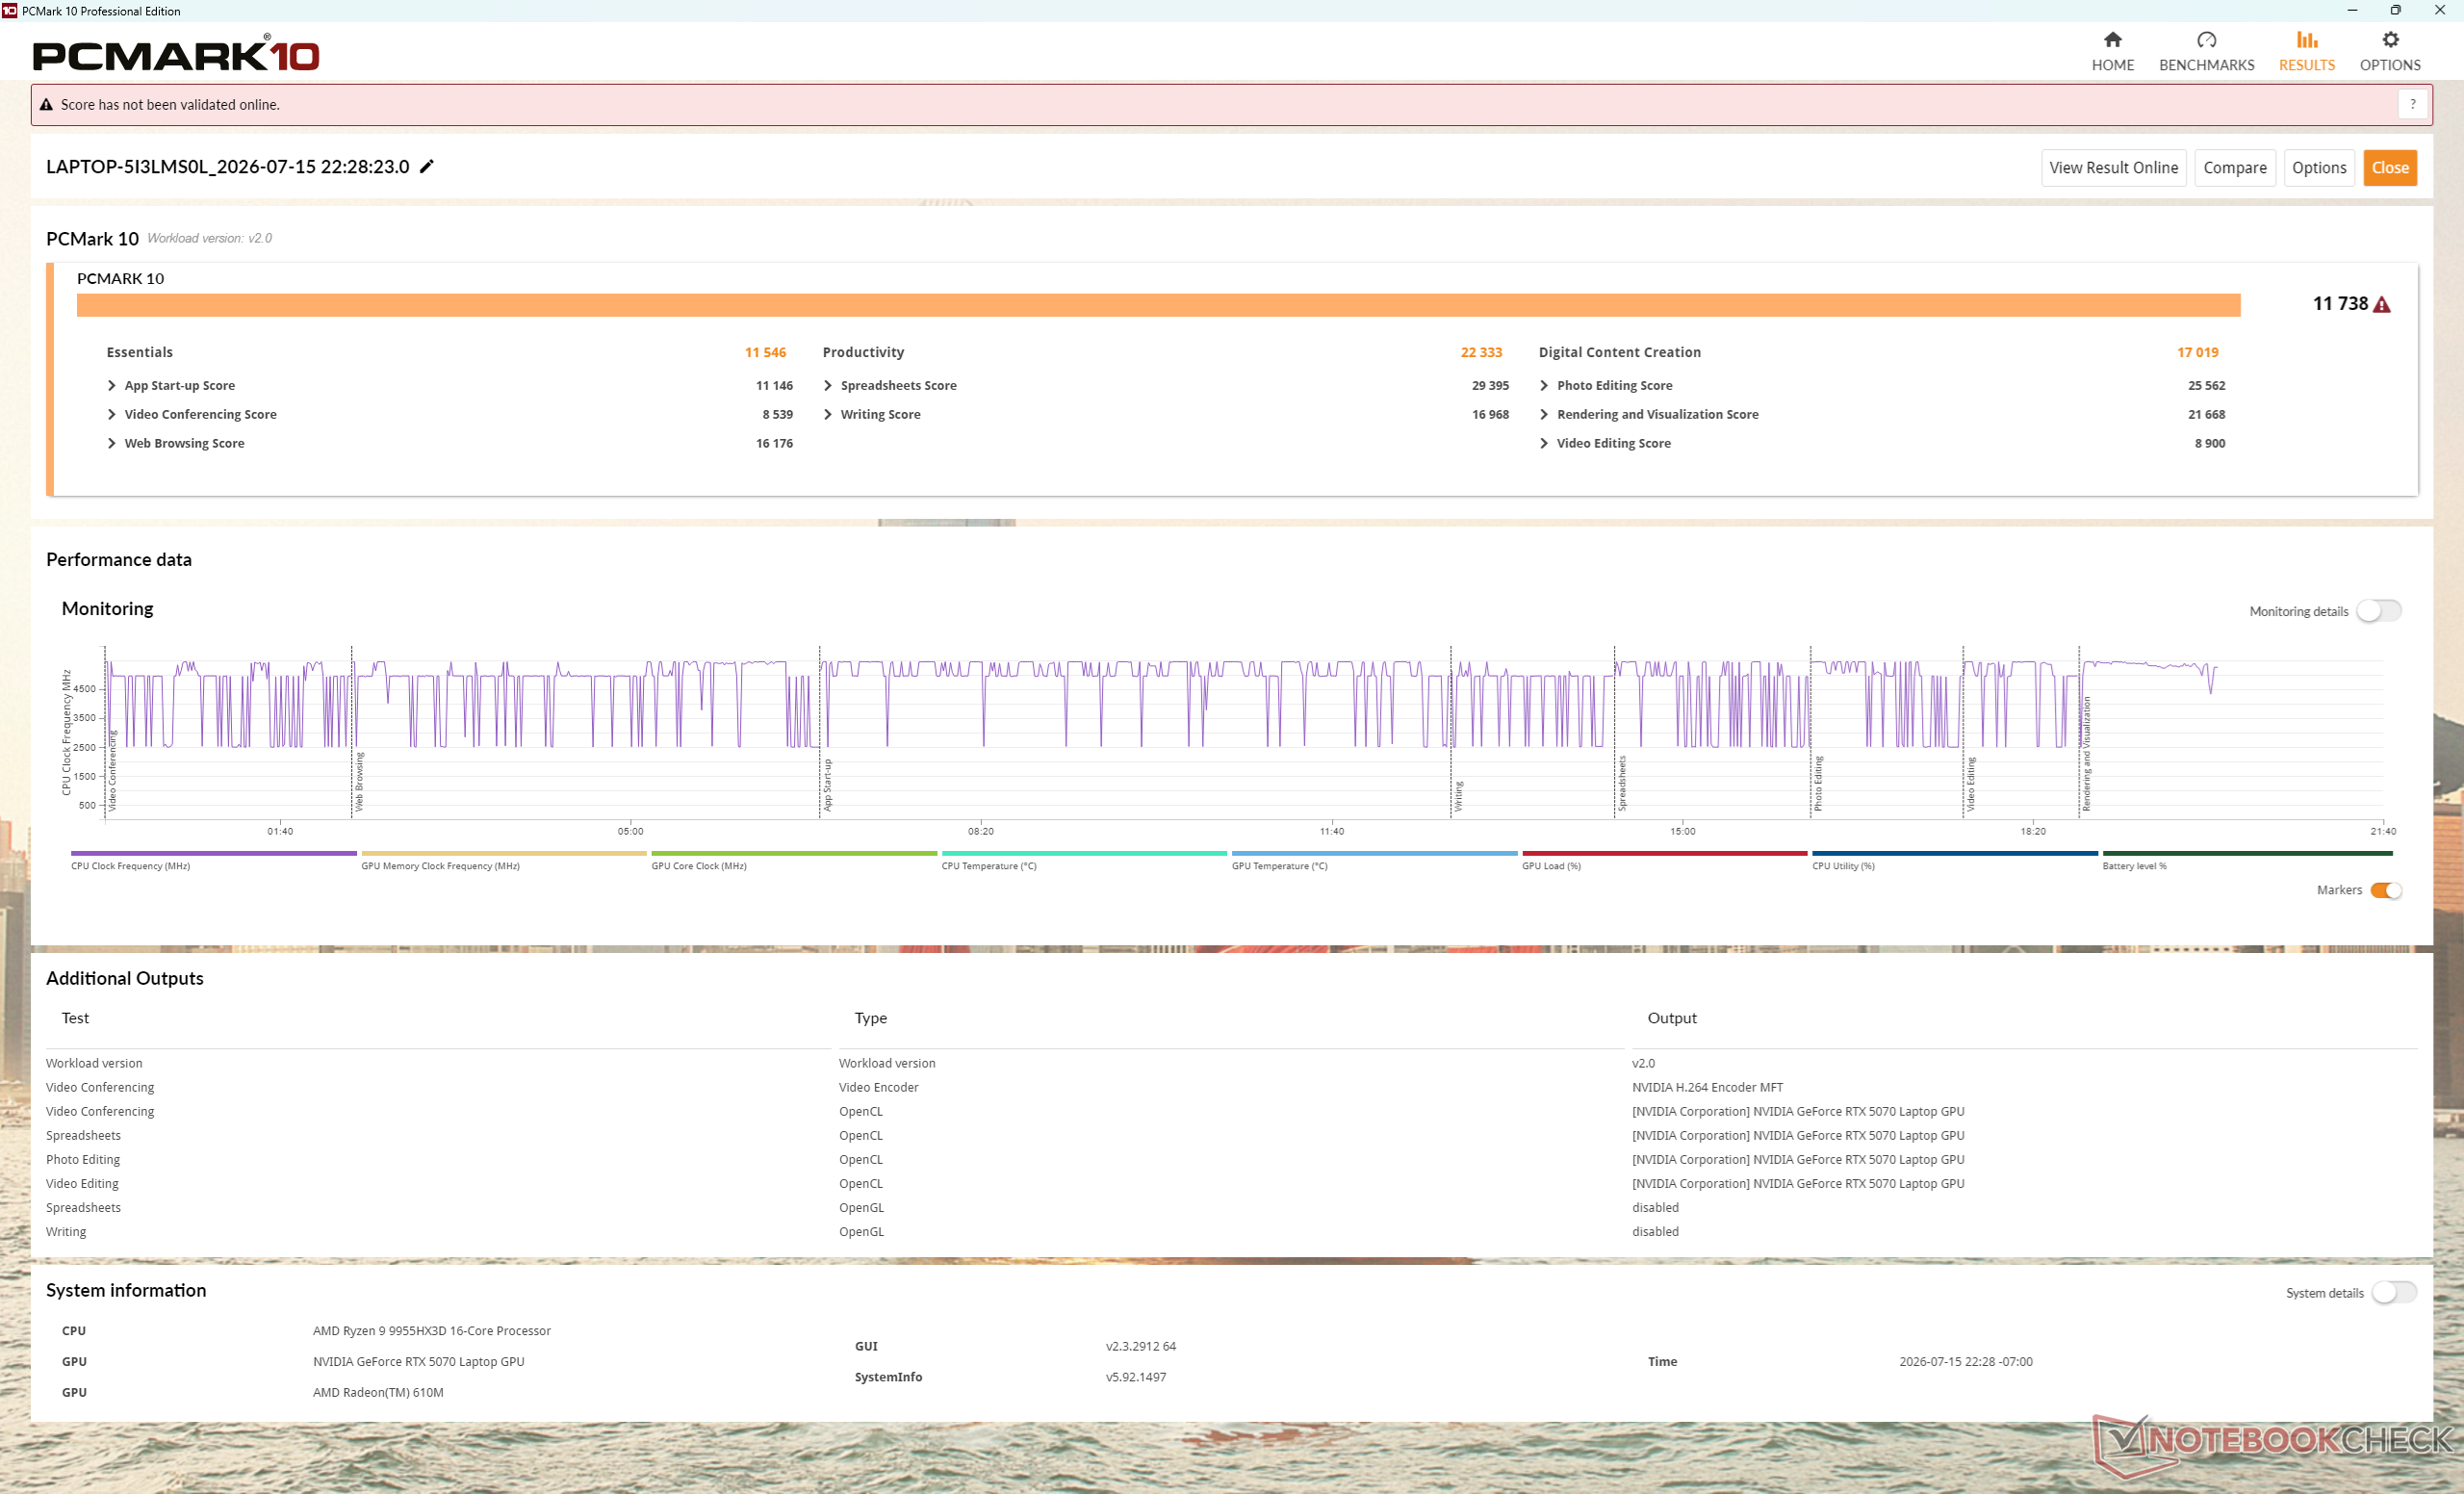
Excelente puntuación en PCMark 10, impulsada por la altísima subpuntuación en «Productividad» obtenida gracias a la CPU de 16 núcleos
Performance rating
Alienware 16X Aurora Core Ultra 9 290HX Plus
GeForce RTX 5070 Ti Laptop, Ultra 9 290HX Plus
92.6 pt
HP HyperX Omen 16 16-ap1931nr
GeForce RTX 5070 Laptop, R9 9955HX3D
85 pt
MSI Crosshair A16 HX E8WGK
GeForce RTX 5070 Laptop, R9 8940HX, Micron 2500 1TB MTFDKBA1T0QGN
84.5 pt
Lenovo Legion Pro 5 16IAX10, RTX 5070
GeForce RTX 5070 Laptop, Ultra 7 255HX, SK Hynix HFS001TEJ9X115N
80.7 pt
Asus TUF Gaming A16 FA608UP -4!
GeForce RTX 5070 Laptop, R7 260, Western Digital PC SN5000S SDEQNSJ-1T00
68.5 pt
HP Omen 16-ap0091ng
GeForce RTX 5060 Laptop, R9 8940HX, Samsung PM9C1b MZVL81T0HFLB-00BH1
68.1 pt
PCMark 10 / Score
HP HyperX Omen 16 16-ap1931nr
GeForce RTX 5070 Laptop, R9 9955HX3D
11738 Points
MSI Crosshair A16 HX E8WGK
GeForce RTX 5070 Laptop, R9 8940HX, Micron 2500 1TB MTFDKBA1T0QGN
11334 Points -3%
Alienware 16X Aurora Core Ultra 9 290HX Plus
GeForce RTX 5070 Ti Laptop, Ultra 9 290HX Plus
10891 Points -7%
Lenovo Legion Pro 5 16IAX10, RTX 5070
GeForce RTX 5070 Laptop, Ultra 7 255HX, SK Hynix HFS001TEJ9X115N
8910 Points -24%
HP Omen 16-ap0091ng
GeForce RTX 5060 Laptop, R9 8940HX, Samsung PM9C1b MZVL81T0HFLB-00BH1
8054 Points -31%
PCMark 10 / Essentials
Alienware 16X Aurora Core Ultra 9 290HX Plus
GeForce RTX 5070 Ti Laptop, Ultra 9 290HX Plus
11935 Points +3%
HP HyperX Omen 16 16-ap1931nr
GeForce RTX 5070 Laptop, R9 9955HX3D
11546 Points
MSI Crosshair A16 HX E8WGK
GeForce RTX 5070 Laptop, R9 8940HX, Micron 2500 1TB MTFDKBA1T0QGN
11393 Points -1%
Lenovo Legion Pro 5 16IAX10, RTX 5070
GeForce RTX 5070 Laptop, Ultra 7 255HX, SK Hynix HFS001TEJ9X115N
11229 Points -3%
HP Omen 16-ap0091ng
GeForce RTX 5060 Laptop, R9 8940HX, Samsung PM9C1b MZVL81T0HFLB-00BH1
10709 Points -7%
PCMark 10 / Productivity
HP HyperX Omen 16 16-ap1931nr
GeForce RTX 5070 Laptop, R9 9955HX3D
22333 Points
MSI Crosshair A16 HX E8WGK
GeForce RTX 5070 Laptop, R9 8940HX, Micron 2500 1TB MTFDKBA1T0QGN
21327 Points -5%
Alienware 16X Aurora Core Ultra 9 290HX Plus
GeForce RTX 5070 Ti Laptop, Ultra 9 290HX Plus
16565 Points -26%
Lenovo Legion Pro 5 16IAX10, RTX 5070
GeForce RTX 5070 Laptop, Ultra 7 255HX, SK Hynix HFS001TEJ9X115N
9938 Points -56%
HP Omen 16-ap0091ng
GeForce RTX 5060 Laptop, R9 8940HX, Samsung PM9C1b MZVL81T0HFLB-00BH1
9831 Points -56%
PCMark 10 / Digital Content Creation
Alienware 16X Aurora Core Ultra 9 290HX Plus
GeForce RTX 5070 Ti Laptop, Ultra 9 290HX Plus
17730 Points +4%
Lenovo Legion Pro 5 16IAX10, RTX 5070
GeForce RTX 5070 Laptop, Ultra 7 255HX, SK Hynix HFS001TEJ9X115N
17200 Points +1%
HP HyperX Omen 16 16-ap1931nr
GeForce RTX 5070 Laptop, R9 9955HX3D
17019 Points
MSI Crosshair A16 HX E8WGK
GeForce RTX 5070 Laptop, R9 8940HX, Micron 2500 1TB MTFDKBA1T0QGN
16259 Points -4%
HP Omen 16-ap0091ng
GeForce RTX 5060 Laptop, R9 8940HX, Samsung PM9C1b MZVL81T0HFLB-00BH1
13465 Points -21%
CrossMark / Overall
Alienware 16X Aurora Core Ultra 9 290HX Plus
GeForce RTX 5070 Ti Laptop, Ultra 9 290HX Plus
2390 Points +20%
Lenovo Legion Pro 5 16IAX10, RTX 5070
GeForce RTX 5070 Laptop, Ultra 7 255HX, SK Hynix HFS001TEJ9X115N
2056 Points +3%
MSI Crosshair A16 HX E8WGK
GeForce RTX 5070 Laptop, R9 8940HX, Micron 2500 1TB MTFDKBA1T0QGN
2011 Points +1%
HP HyperX Omen 16 16-ap1931nr
GeForce RTX 5070 Laptop, R9 9955HX3D
1990 Points
HP Omen 16-ap0091ng
GeForce RTX 5060 Laptop, R9 8940HX, Samsung PM9C1b MZVL81T0HFLB-00BH1
1903 Points -4%
Asus TUF Gaming A16 FA608UP
GeForce RTX 5070 Laptop, R7 260, Western Digital PC SN5000S SDEQNSJ-1T00
1712 Points -14%
CrossMark / Productivity
Alienware 16X Aurora Core Ultra 9 290HX Plus
GeForce RTX 5070 Ti Laptop, Ultra 9 290HX Plus
2254 Points +22%
Lenovo Legion Pro 5 16IAX10, RTX 5070
GeForce RTX 5070 Laptop, Ultra 7 255HX, SK Hynix HFS001TEJ9X115N
1926 Points +5%
MSI Crosshair A16 HX E8WGK
GeForce RTX 5070 Laptop, R9 8940HX, Micron 2500 1TB MTFDKBA1T0QGN
1869 Points +1%
HP HyperX Omen 16 16-ap1931nr
GeForce RTX 5070 Laptop, R9 9955HX3D
1843 Points
HP Omen 16-ap0091ng
GeForce RTX 5060 Laptop, R9 8940HX, Samsung PM9C1b MZVL81T0HFLB-00BH1
1831 Points -1%
Asus TUF Gaming A16 FA608UP
GeForce RTX 5070 Laptop, R7 260, Western Digital PC SN5000S SDEQNSJ-1T00
1648 Points -11%
CrossMark / Creativity
Alienware 16X Aurora Core Ultra 9 290HX Plus
GeForce RTX 5070 Ti Laptop, Ultra 9 290HX Plus
2571 Points +13%
Lenovo Legion Pro 5 16IAX10, RTX 5070
GeForce RTX 5070 Laptop, Ultra 7 255HX, SK Hynix HFS001TEJ9X115N
2317 Points +2%
MSI Crosshair A16 HX E8WGK
GeForce RTX 5070 Laptop, R9 8940HX, Micron 2500 1TB MTFDKBA1T0QGN
2298 Points +1%
HP HyperX Omen 16 16-ap1931nr
GeForce RTX 5070 Laptop, R9 9955HX3D
2267 Points
HP Omen 16-ap0091ng
GeForce RTX 5060 Laptop, R9 8940HX, Samsung PM9C1b MZVL81T0HFLB-00BH1
2112 Points -7%
Asus TUF Gaming A16 FA608UP
GeForce RTX 5070 Laptop, R7 260, Western Digital PC SN5000S SDEQNSJ-1T00
1879 Points -17%
CrossMark / Responsiveness
Alienware 16X Aurora Core Ultra 9 290HX Plus
GeForce RTX 5070 Ti Laptop, Ultra 9 290HX Plus
2289 Points +35%
Lenovo Legion Pro 5 16IAX10, RTX 5070
GeForce RTX 5070 Laptop, Ultra 7 255HX, SK Hynix HFS001TEJ9X115N
1748 Points +3%
HP HyperX Omen 16 16-ap1931nr
GeForce RTX 5070 Laptop, R9 9955HX3D
1691 Points
MSI Crosshair A16 HX E8WGK
GeForce RTX 5070 Laptop, R9 8940HX, Micron 2500 1TB MTFDKBA1T0QGN
1680 Points -1%
HP Omen 16-ap0091ng
GeForce RTX 5060 Laptop, R9 8940HX, Samsung PM9C1b MZVL81T0HFLB-00BH1
1562 Points -8%
Asus TUF Gaming A16 FA608UP
GeForce RTX 5070 Laptop, R7 260, Western Digital PC SN5000S SDEQNSJ-1T00
1454 Points -14%
WebXPRT 3 / Overall
Alienware 16X Aurora Core Ultra 9 290HX Plus
GeForce RTX 5070 Ti Laptop, Ultra 9 290HX Plus
375 Points +11%
HP HyperX Omen 16 16-ap1931nr
GeForce RTX 5070 Laptop, R9 9955HX3D
339 Points
Lenovo Legion Pro 5 16IAX10, RTX 5070
GeForce RTX 5070 Laptop, Ultra 7 255HX, SK Hynix HFS001TEJ9X115N
335 Points -1%
HP Omen 16-ap0091ng
GeForce RTX 5060 Laptop, R9 8940HX, Samsung PM9C1b MZVL81T0HFLB-00BH1
322 Points -5%
MSI Crosshair A16 HX E8WGK
GeForce RTX 5070 Laptop, R9 8940HX, Micron 2500 1TB MTFDKBA1T0QGN
322 Points -5%
Asus TUF Gaming A16 FA608UP
GeForce RTX 5070 Laptop, R7 260, Western Digital PC SN5000S SDEQNSJ-1T00
297 Points -12%
WebXPRT 4 / Overall
Alienware 16X Aurora Core Ultra 9 290HX Plus
GeForce RTX 5070 Ti Laptop, Ultra 9 290HX Plus
345 Points +8%
Lenovo Legion Pro 5 16IAX10, RTX 5070
GeForce RTX 5070 Laptop, Ultra 7 255HX, SK Hynix HFS001TEJ9X115N
326 Points +3%
HP HyperX Omen 16 16-ap1931nr
GeForce RTX 5070 Laptop, R9 9955HX3D
318 Points
MSI Crosshair A16 HX E8WGK
GeForce RTX 5070 Laptop, R9 8940HX, Micron 2500 1TB MTFDKBA1T0QGN
283 Points -11%
HP Omen 16-ap0091ng
GeForce RTX 5060 Laptop, R9 8940HX, Samsung PM9C1b MZVL81T0HFLB-00BH1
253 Points -20%
Asus TUF Gaming A16 FA608UP
GeForce RTX 5070 Laptop, R7 260, Western Digital PC SN5000S SDEQNSJ-1T00
239 Points -25%
Mozilla Kraken 1.1 / Total
Asus TUF Gaming A16 FA608UP
GeForce RTX 5070 Laptop, R7 260, Western Digital PC SN5000S SDEQNSJ-1T00
562 ms * -40%
HP Omen 16-ap0091ng
GeForce RTX 5060 Laptop, R9 8940HX, Samsung PM9C1b MZVL81T0HFLB-00BH1
509 ms * -27%
MSI Crosshair A16 HX E8WGK
GeForce RTX 5070 Laptop, R9 8940HX, Micron 2500 1TB MTFDKBA1T0QGN
474 ms * -18%
Lenovo Legion Pro 5 16IAX10, RTX 5070
GeForce RTX 5070 Laptop, Ultra 7 255HX, SK Hynix HFS001TEJ9X115N
429 ms * -7%
HP HyperX Omen 16 16-ap1931nr
GeForce RTX 5070 Laptop, R9 9955HX3D
402 ms *
Alienware 16X Aurora Core Ultra 9 290HX Plus
GeForce RTX 5070 Ti Laptop, Ultra 9 290HX Plus
394 ms * +2%
Geekbench AI / Quantized GPU 1.7
Alienware 16X Aurora Core Ultra 9 290HX Plus
GeForce RTX 5070 Ti Laptop, Ultra 9 290HX Plus
19163 Points +14%
MSI Crosshair A16 HX E8WGK
GeForce RTX 5070 Laptop, R9 8940HX, Micron 2500 1TB MTFDKBA1T0QGN
18147 Points +8%
Lenovo Legion Pro 5 16IAX10, RTX 5070
GeForce RTX 5070 Laptop, Ultra 7 255HX, SK Hynix HFS001TEJ9X115N
17210 Points +2%
HP HyperX Omen 16 16-ap1931nr
GeForce RTX 5070 Laptop, R9 9955HX3D
16797 Points
Asus TUF Gaming A16 FA608UP
GeForce RTX 5070 Laptop, R7 260, Western Digital PC SN5000S SDEQNSJ-1T00
16466 Points -2%
HP Omen 16-ap0091ng
GeForce RTX 5060 Laptop, R9 8940HX, Samsung PM9C1b MZVL81T0HFLB-00BH1
13288 Points -21%
Geekbench AI / Half Precision GPU 1.7
MSI Crosshair A16 HX E8WGK
GeForce RTX 5070 Laptop, R9 8940HX, Micron 2500 1TB MTFDKBA1T0QGN
45382 Points +17%
Alienware 16X Aurora Core Ultra 9 290HX Plus
GeForce RTX 5070 Ti Laptop, Ultra 9 290HX Plus
45324 Points +17%
Lenovo Legion Pro 5 16IAX10, RTX 5070
GeForce RTX 5070 Laptop, Ultra 7 255HX, SK Hynix HFS001TEJ9X115N
41962 Points +8%
HP HyperX Omen 16 16-ap1931nr
GeForce RTX 5070 Laptop, R9 9955HX3D
38675 Points
Asus TUF Gaming A16 FA608UP
GeForce RTX 5070 Laptop, R7 260, Western Digital PC SN5000S SDEQNSJ-1T00
38118 Points -1%
HP Omen 16-ap0091ng
GeForce RTX 5060 Laptop, R9 8940HX, Samsung PM9C1b MZVL81T0HFLB-00BH1
27029 Points -30%
Geekbench AI / Single Precision GPU 1.7
Alienware 16X Aurora Core Ultra 9 290HX Plus
GeForce RTX 5070 Ti Laptop, Ultra 9 290HX Plus
24661 Points +16%
MSI Crosshair A16 HX E8WGK
GeForce RTX 5070 Laptop, R9 8940HX, Micron 2500 1TB MTFDKBA1T0QGN
23474 Points +10%
Lenovo Legion Pro 5 16IAX10, RTX 5070
GeForce RTX 5070 Laptop, Ultra 7 255HX, SK Hynix HFS001TEJ9X115N
22431 Points +6%
HP HyperX Omen 16 16-ap1931nr
GeForce RTX 5070 Laptop, R9 9955HX3D
21259 Points
Asus TUF Gaming A16 FA608UP
GeForce RTX 5070 Laptop, R7 260, Western Digital PC SN5000S SDEQNSJ-1T00
21012 Points -1%
HP Omen 16-ap0091ng
GeForce RTX 5060 Laptop, R9 8940HX, Samsung PM9C1b MZVL81T0HFLB-00BH1
16368 Points -23%

* ... más pequeño es mejor

PCMark 10 Score
11738 puntos
ayuda
AIDA64 / Memory Copy
Lenovo Legion Pro 5 16IAX10, RTX 5070
Intel Core Ultra 7 255HX, GeForce RTX 5070 Laptop
85286 MB/s +35%
Alienware 16X Aurora Core Ultra 9 290HX Plus
Intel Core Ultra 9 290HX Plus, GeForce RTX 5070 Ti Laptop
76912 MB/s +22%
Asus TUF Gaming A16 FA608UP
AMD Ryzen 7 260, GeForce RTX 5070 Laptop
67750 MB/s +7%
HP HyperX Omen 16 16-ap1931nr
AMD Ryzen 9 9955HX3D, GeForce RTX 5070 Laptop
63072 MB/s
Medio AMD Ryzen 9 9955HX3D
  (56383 - 63173, n=4)
61040 MB/s -3%
MSI Crosshair A16 HX E8WGK
AMD Ryzen 9 8940HX, GeForce RTX 5070 Laptop
55263 MB/s -12%
HP Omen 16-ap0091ng
AMD Ryzen 9 8940HX, GeForce RTX 5060 Laptop
29102 MB/s -54%
AIDA64 / Memory Read
Lenovo Legion Pro 5 16IAX10, RTX 5070
Intel Core Ultra 7 255HX, GeForce RTX 5070 Laptop
95821 MB/s +44%
Alienware 16X Aurora Core Ultra 9 290HX Plus
Intel Core Ultra 9 290HX Plus, GeForce RTX 5070 Ti Laptop
84638 MB/s +28%
HP HyperX Omen 16 16-ap1931nr
AMD Ryzen 9 9955HX3D, GeForce RTX 5070 Laptop
66378 MB/s
MSI Crosshair A16 HX E8WGK
AMD Ryzen 9 8940HX, GeForce RTX 5070 Laptop
66207 MB/s 0%
Medio AMD Ryzen 9 9955HX3D
  (59750 - 66539, n=4)
64509 MB/s -3%
Asus TUF Gaming A16 FA608UP
AMD Ryzen 7 260, GeForce RTX 5070 Laptop
61170 MB/s -8%
HP Omen 16-ap0091ng
AMD Ryzen 9 8940HX, GeForce RTX 5060 Laptop
35634 MB/s -46%
AIDA64 / Memory Write
Asus TUF Gaming A16 FA608UP
AMD Ryzen 7 260, GeForce RTX 5070 Laptop
86401 MB/s +25%
Lenovo Legion Pro 5 16IAX10, RTX 5070
Intel Core Ultra 7 255HX, GeForce RTX 5070 Laptop
84882 MB/s +23%
Alienware 16X Aurora Core Ultra 9 290HX Plus
Intel Core Ultra 9 290HX Plus, GeForce RTX 5070 Ti Laptop
76094 MB/s +10%
HP HyperX Omen 16 16-ap1931nr
AMD Ryzen 9 9955HX3D, GeForce RTX 5070 Laptop
69285 MB/s
Medio AMD Ryzen 9 9955HX3D
  (59506 - 72898, n=4)
67780 MB/s -2%
MSI Crosshair A16 HX E8WGK
AMD Ryzen 9 8940HX, GeForce RTX 5070 Laptop
61853 MB/s -11%
HP Omen 16-ap0091ng
AMD Ryzen 9 8940HX, GeForce RTX 5060 Laptop
32239 MB/s -53%
AIDA64 / Memory Latency
Alienware 16X Aurora Core Ultra 9 290HX Plus
Intel Core Ultra 9 290HX Plus, GeForce RTX 5070 Ti Laptop
108.4 ns * -11%
Lenovo Legion Pro 5 16IAX10, RTX 5070
Intel Core Ultra 7 255HX, GeForce RTX 5070 Laptop
104.2 ns * -6%
Medio AMD Ryzen 9 9955HX3D
  (96.1 - 103.6, n=4)
99.5 ns * -2%
HP HyperX Omen 16 16-ap1931nr
AMD Ryzen 9 9955HX3D, GeForce RTX 5070 Laptop
98 ns *
Asus TUF Gaming A16 FA608UP
AMD Ryzen 7 260, GeForce RTX 5070 Laptop
93.8 ns * +4%
MSI Crosshair A16 HX E8WGK
AMD Ryzen 9 8940HX, GeForce RTX 5070 Laptop
87.1 ns * +11%
HP Omen 16-ap0091ng
AMD Ryzen 9 8940HX, GeForce RTX 5060 Laptop
83.5 ns * +15%

* ... más pequeño es mejor

Latencia del DPC
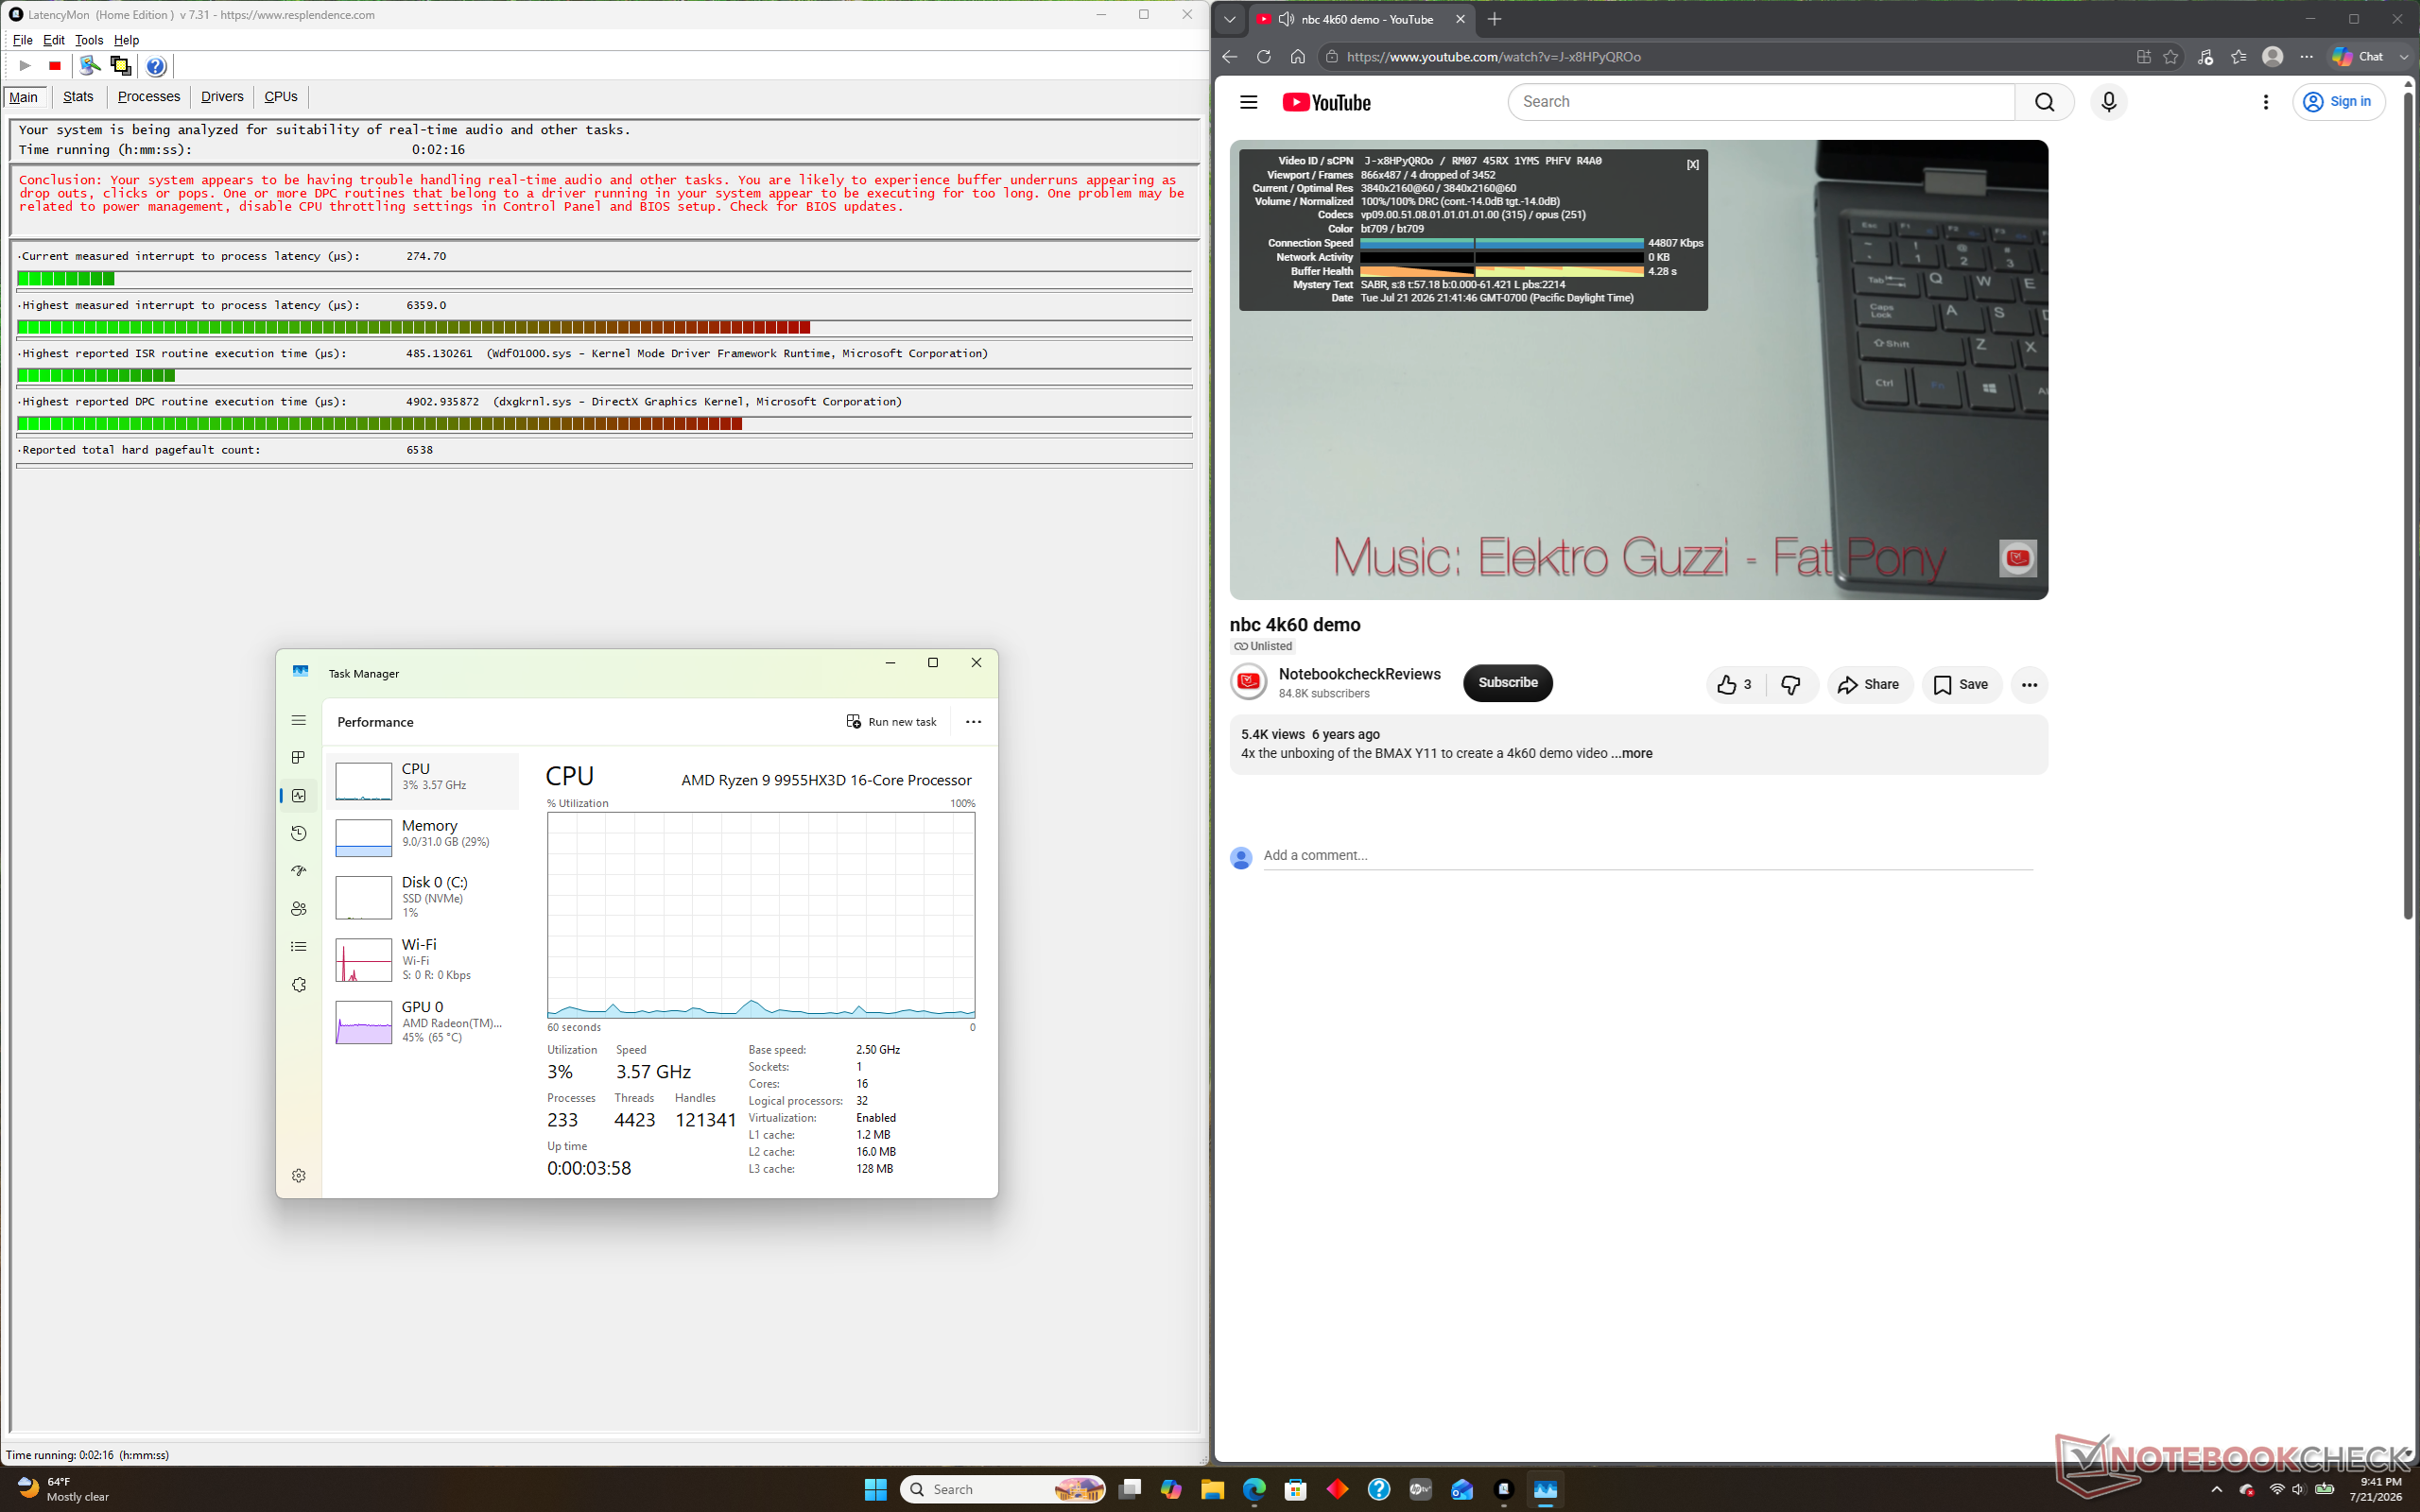
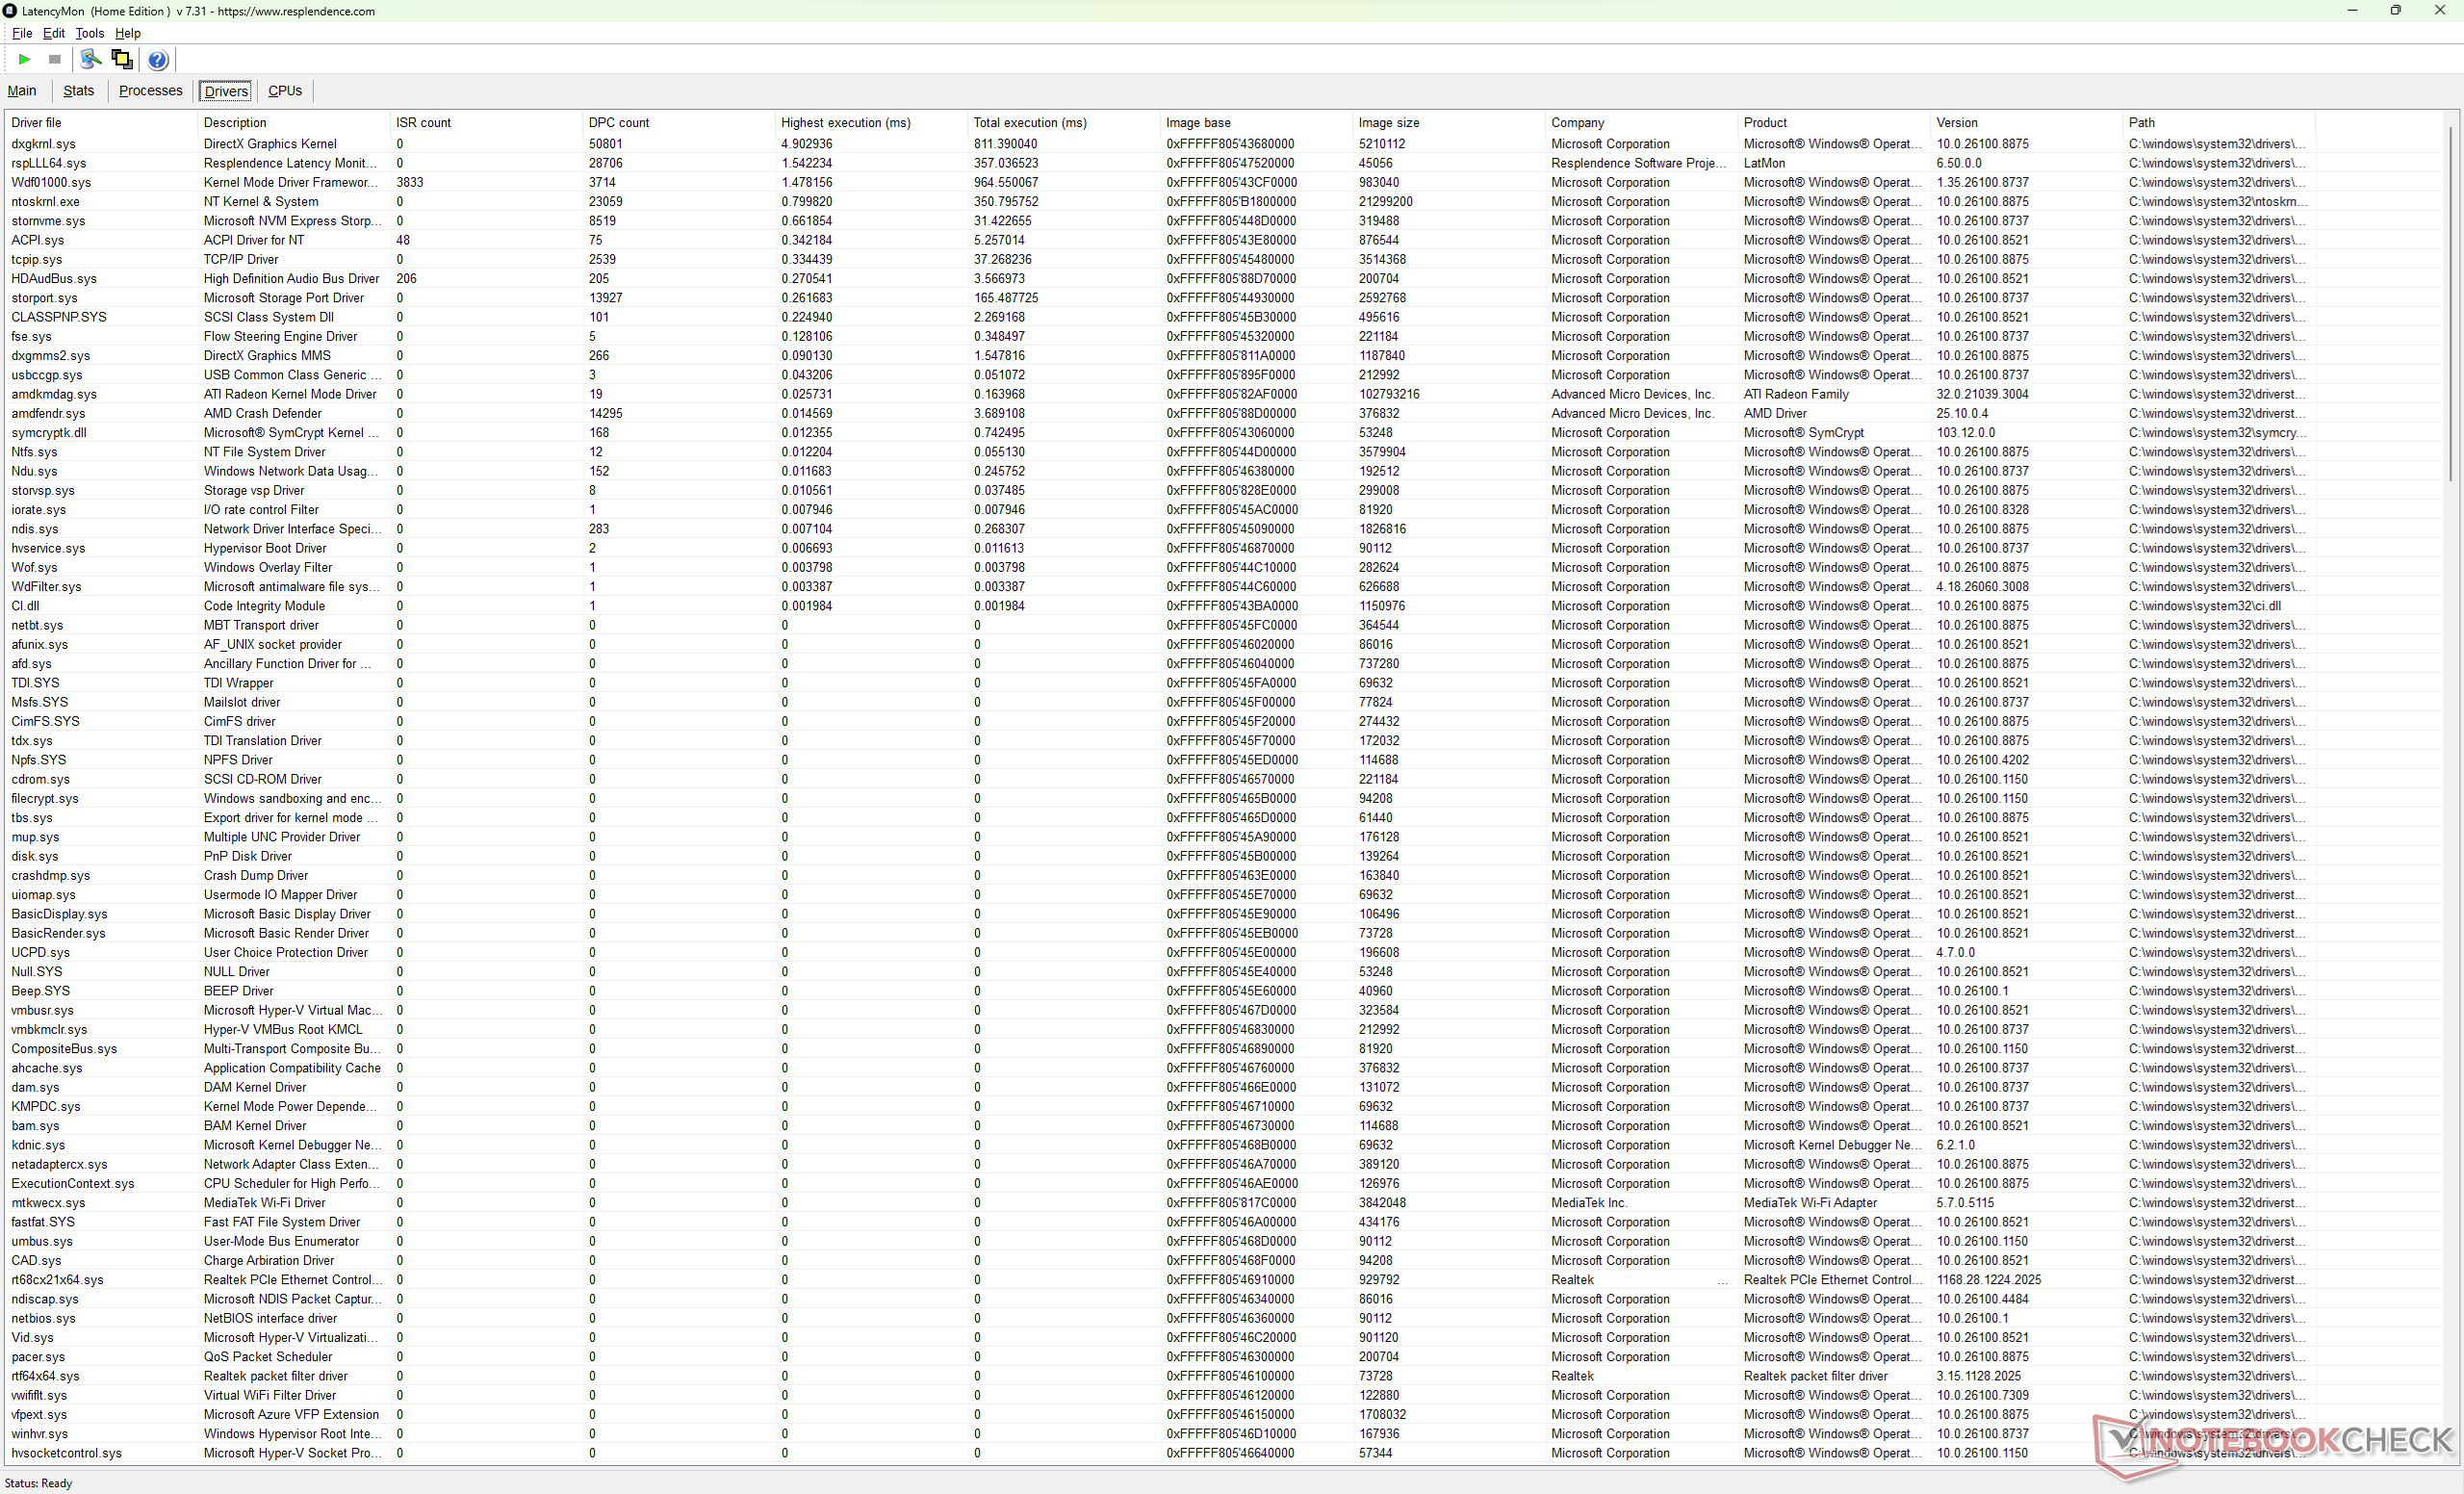
LatencyMon muestra problemas de DPC y 4 fotogramas perdidos al reproducir contenido de vídeo en 4K a 60, incluso tras varios intentos.
Lista de controladores
DPC Latencies / LatencyMon - interrupt to process latency (max), Web, Youtube, Prime95
HP HyperX Omen 16 16-ap1931nr
GeForce RTX 5070 Laptop, R9 9955HX3D
6359 μs *
Alienware 16X Aurora Core Ultra 9 290HX Plus
GeForce RTX 5070 Ti Laptop, Ultra 9 290HX Plus
4122.5 μs * +35%
MSI Crosshair A16 HX E8WGK
GeForce RTX 5070 Laptop, R9 8940HX, Micron 2500 1TB MTFDKBA1T0QGN
1690 μs * +73%
HP Omen 16-ap0091ng
GeForce RTX 5060 Laptop, R9 8940HX, Samsung PM9C1b MZVL81T0HFLB-00BH1
1425.3 μs * +78%
Lenovo Legion Pro 5 16IAX10, RTX 5070
GeForce RTX 5070 Laptop, Ultra 7 255HX, SK Hynix HFS001TEJ9X115N
810.5 μs * +87%
Asus TUF Gaming A16 FA608UP
GeForce RTX 5070 Laptop, R7 260, Western Digital PC SN5000S SDEQNSJ-1T00
563.8 μs * +91%

* ... más pequeño es mejor

Dispositivos de almacenamiento
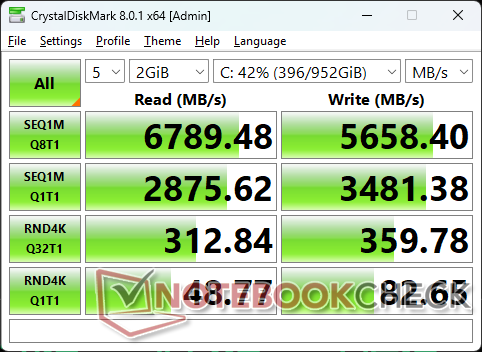
CDM 8
CDM 8
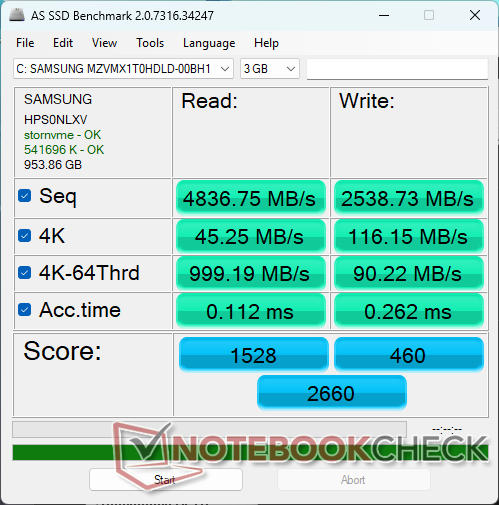
AS SSD
AS SSD
Sequential Read: 4836.75MB/s
Sequential Write: 2538.73MB/s
4K Read: 45.25MB/s
4K Write: 116.15MB/s
4K-64 Read: 999.19MB/s
4K-64 Write: 90.22MB/s
Access Time Read: 0.112ms
Access Time Write: 0.262ms
Copy ISO: 3127.57MB/s
Copy Program: 958.69MB/s
Copy Game: 287.74MB/s
Score Read: 1528Points
Score Write: 460Points
Score Total: 2660Points
Drive Performance rating - Percent
Alienware 16X Aurora Core Ultra 9 290HX Plus
 
95.5 pt
Lenovo Legion Pro 5 16IAX10, RTX 5070
SK Hynix HFS001TEJ9X115N
78.8 pt
MSI Crosshair A16 HX E8WGK
Micron 2500 1TB MTFDKBA1T0QGN
62.6 pt
HP Omen 16-ap0091ng
Samsung PM9C1b MZVL81T0HFLB-00BH1
55.5 pt
Asus TUF Gaming A16 FA608UP
Western Digital PC SN5000S SDEQNSJ-1T00
55.2 pt
HP HyperX Omen 16 16-ap1931nr
 
38.1 pt
DiskSpd
seq read
Lenovo Legion Pro 5 16IAX10, RTX 5070
SK Hynix HFS001TEJ9X115N
4778 (4600.31min - 4777.52max) MB/s +45%
Alienware 16X Aurora Core Ultra 9 290HX Plus
 
4669 (4086.52min - 4669.2max) MB/s +42%
HP HyperX Omen 16 16-ap1931nr
 
3291 (3274.91min - 3291.27max) MB/s
MSI Crosshair A16 HX E8WGK
Micron 2500 1TB MTFDKBA1T0QGN
3253 (3214.59min - 3253.1max) MB/s -1%
HP Omen 16-ap0091ng
Samsung PM9C1b MZVL81T0HFLB-00BH1
3031 (2761.74min - 3031.45max) MB/s -8%
Asus TUF Gaming A16 FA608UP
Western Digital PC SN5000S SDEQNSJ-1T00
1717 (1605.72min - 1717.49max) MB/s -48%
seq write
Alienware 16X Aurora Core Ultra 9 290HX Plus
 
5645 (1502.75min - 5644.73max) MB/s +258%
MSI Crosshair A16 HX E8WGK
Micron 2500 1TB MTFDKBA1T0QGN
4062 (3914.68min - 4062.45max) MB/s +157%
Asus TUF Gaming A16 FA608UP
Western Digital PC SN5000S SDEQNSJ-1T00
3830 (3464.7min - 3830.45max) MB/s +143%
HP Omen 16-ap0091ng
Samsung PM9C1b MZVL81T0HFLB-00BH1
3704 (3259.18min - 3704.34max) MB/s +135%
Lenovo Legion Pro 5 16IAX10, RTX 5070
SK Hynix HFS001TEJ9X115N
1793 (1679.19min - 1792.86max) MB/s +14%
HP HyperX Omen 16 16-ap1931nr
 
1578 (1318.06min - 1577.89max) MB/s
seq q8 t1 read
MSI Crosshair A16 HX E8WGK
Micron 2500 1TB MTFDKBA1T0QGN
7324 (6376.43min - 7324.33max) MB/s +2%
HP Omen 16-ap0091ng
Samsung PM9C1b MZVL81T0HFLB-00BH1
7258 (6649.77min - 7257.61max) MB/s +1%
HP HyperX Omen 16 16-ap1931nr
 
7169 (3534.12min - 7168.9max) MB/s
Lenovo Legion Pro 5 16IAX10, RTX 5070
SK Hynix HFS001TEJ9X115N
7146 (5921.52min - 7145.87max) MB/s 0%
Alienware 16X Aurora Core Ultra 9 290HX Plus
 
7035 (6225.19min - 7034.67max) MB/s -2%
Asus TUF Gaming A16 FA608UP
Western Digital PC SN5000S SDEQNSJ-1T00
6365 (5802.54min - 6364.58max) MB/s -11%
seq q8 t1 write
Alienware 16X Aurora Core Ultra 9 290HX Plus
 
6525 (6509.96min - 6524.66max) MB/s +80%
MSI Crosshair A16 HX E8WGK
Micron 2500 1TB MTFDKBA1T0QGN
6109 (6054.95min - 6109.42max) MB/s +68%
Lenovo Legion Pro 5 16IAX10, RTX 5070
SK Hynix HFS001TEJ9X115N
6086 (6054.06min - 6085.94max) MB/s +68%
HP Omen 16-ap0091ng
Samsung PM9C1b MZVL81T0HFLB-00BH1
5750 (5600.99min - 5749.76max) MB/s +59%
Asus TUF Gaming A16 FA608UP
Western Digital PC SN5000S SDEQNSJ-1T00
5576 (5054.3min - 5575.91max) MB/s +54%
HP HyperX Omen 16 16-ap1931nr
 
3626 (170.08min - 3625.89max) MB/s
4k q1 t1 read
Alienware 16X Aurora Core Ultra 9 290HX Plus
 
79.5 (77.33min - 79.48max) MB/s +61%
Asus TUF Gaming A16 FA608UP
Western Digital PC SN5000S SDEQNSJ-1T00
71.9 (71.68min - 71.87max) MB/s +45%
MSI Crosshair A16 HX E8WGK
Micron 2500 1TB MTFDKBA1T0QGN
63.4 (63.17min - 63.39max) MB/s +28%
Lenovo Legion Pro 5 16IAX10, RTX 5070
SK Hynix HFS001TEJ9X115N
61.5 (61.03min - 61.51max) MB/s +24%
HP Omen 16-ap0091ng
Samsung PM9C1b MZVL81T0HFLB-00BH1
51.7 (50.4min - 51.66max) MB/s +4%
HP HyperX Omen 16 16-ap1931nr
 
49.5 (48.58min - 49.45max) MB/s
4k q1 t1 write
Alienware 16X Aurora Core Ultra 9 290HX Plus
 
338 (317.84min - 337.66max) MB/s +188%
MSI Crosshair A16 HX E8WGK
Micron 2500 1TB MTFDKBA1T0QGN
165.1 (163.36min - 165.14max) MB/s +41%
Lenovo Legion Pro 5 16IAX10, RTX 5070
SK Hynix HFS001TEJ9X115N
154 (87.61min - 154.04max) MB/s +31%
Asus TUF Gaming A16 FA608UP
Western Digital PC SN5000S SDEQNSJ-1T00
143.8 (140.01min - 143.77max) MB/s +22%
HP HyperX Omen 16 16-ap1931nr
 
117.4 (92.53min - 117.43max) MB/s
HP Omen 16-ap0091ng
Samsung PM9C1b MZVL81T0HFLB-00BH1
96.7 (95.77min - 96.65max) MB/s -18%
4k q32 t16 read
Alienware 16X Aurora Core Ultra 9 290HX Plus
 
4999 (4701.95min - 4999.05max) MB/s +398%
Lenovo Legion Pro 5 16IAX10, RTX 5070
SK Hynix HFS001TEJ9X115N
4691 (4642.12min - 4690.75max) MB/s +368%
Asus TUF Gaming A16 FA608UP
Western Digital PC SN5000S SDEQNSJ-1T00
1036 (949.61min - 1035.55max) MB/s +3%
HP HyperX Omen 16 16-ap1931nr
 
1003 (969.75min - 1003.25max) MB/s
MSI Crosshair A16 HX E8WGK
Micron 2500 1TB MTFDKBA1T0QGN
994 (979.79min - 994.26max) MB/s -1%
HP Omen 16-ap0091ng
Samsung PM9C1b MZVL81T0HFLB-00BH1
889 (844.18min - 889.18max) MB/s -11%
4k q32 t16 write
Alienware 16X Aurora Core Ultra 9 290HX Plus
 
4388 (1358.14min - 4387.65max) MB/s +810%
Lenovo Legion Pro 5 16IAX10, RTX 5070
SK Hynix HFS001TEJ9X115N
4001 (3124.4min - 4001.37max) MB/s +730%
HP HyperX Omen 16 16-ap1931nr
 
482 (286.45min - 482.02max) MB/s
Asus TUF Gaming A16 FA608UP
Western Digital PC SN5000S SDEQNSJ-1T00
455 (405.09min - 455.15max) MB/s -6%
MSI Crosshair A16 HX E8WGK
Micron 2500 1TB MTFDKBA1T0QGN
436 (430.48min - 436.24max) MB/s -10%
HP Omen 16-ap0091ng
Samsung PM9C1b MZVL81T0HFLB-00BH1
356 (352.83min - 355.66max) MB/s -26%
AS SSD
Score Total
Alienware 16X Aurora Core Ultra 9 290HX Plus
 
9593 Points +261%
Lenovo Legion Pro 5 16IAX10, RTX 5070
SK Hynix HFS001TEJ9X115N
8115 Points +205%
MSI Crosshair A16 HX E8WGK
Micron 2500 1TB MTFDKBA1T0QGN
6234 Points +134%
HP Omen 16-ap0091ng
Samsung PM9C1b MZVL81T0HFLB-00BH1
5084 Points +91%
Asus TUF Gaming A16 FA608UP
Western Digital PC SN5000S SDEQNSJ-1T00
4498 Points +69%
HP HyperX Omen 16 16-ap1931nr
 
2660 Points
Score Read
Lenovo Legion Pro 5 16IAX10, RTX 5070
SK Hynix HFS001TEJ9X115N
3166 Points +107%
Alienware 16X Aurora Core Ultra 9 290HX Plus
 
2811 Points +84%
MSI Crosshair A16 HX E8WGK
Micron 2500 1TB MTFDKBA1T0QGN
1629 Points +7%
HP HyperX Omen 16 16-ap1931nr
 
1528 Points
HP Omen 16-ap0091ng
Samsung PM9C1b MZVL81T0HFLB-00BH1
1384 Points -9%
Asus TUF Gaming A16 FA608UP
Western Digital PC SN5000S SDEQNSJ-1T00
1333 Points -13%
Score Write
Alienware 16X Aurora Core Ultra 9 290HX Plus
 
5340 Points +1061%
MSI Crosshair A16 HX E8WGK
Micron 2500 1TB MTFDKBA1T0QGN
3890 Points +746%
Lenovo Legion Pro 5 16IAX10, RTX 5070
SK Hynix HFS001TEJ9X115N
3493 Points +659%
HP Omen 16-ap0091ng
Samsung PM9C1b MZVL81T0HFLB-00BH1
3046 Points +562%
Asus TUF Gaming A16 FA608UP
Western Digital PC SN5000S SDEQNSJ-1T00
2553 Points +455%
HP HyperX Omen 16 16-ap1931nr
 
460 Points
Seq Read
Alienware 16X Aurora Core Ultra 9 290HX Plus
 
5862.72 MB/s +21%
Lenovo Legion Pro 5 16IAX10, RTX 5070
SK Hynix HFS001TEJ9X115N
5856 MB/s +21%
MSI Crosshair A16 HX E8WGK
Micron 2500 1TB MTFDKBA1T0QGN
5611.82 MB/s +16%
HP HyperX Omen 16 16-ap1931nr
 
4836.75 MB/s
HP Omen 16-ap0091ng
Samsung PM9C1b MZVL81T0HFLB-00BH1
4595 MB/s -5%
Asus TUF Gaming A16 FA608UP
Western Digital PC SN5000S SDEQNSJ-1T00
4346 MB/s -10%
Seq Write
Alienware 16X Aurora Core Ultra 9 290HX Plus
 
5723.88 MB/s +125%
HP Omen 16-ap0091ng
Samsung PM9C1b MZVL81T0HFLB-00BH1
3249 MB/s +28%
MSI Crosshair A16 HX E8WGK
Micron 2500 1TB MTFDKBA1T0QGN
3051.42 MB/s +20%
Lenovo Legion Pro 5 16IAX10, RTX 5070
SK Hynix HFS001TEJ9X115N
2720 MB/s +7%
Asus TUF Gaming A16 FA608UP
Western Digital PC SN5000S SDEQNSJ-1T00
2619 MB/s +3%
HP HyperX Omen 16 16-ap1931nr
 
2538.73 MB/s
4K Read
Alienware 16X Aurora Core Ultra 9 290HX Plus
 
87.34 MB/s +93%
Asus TUF Gaming A16 FA608UP
Western Digital PC SN5000S SDEQNSJ-1T00
66.2 MB/s +46%
Lenovo Legion Pro 5 16IAX10, RTX 5070
SK Hynix HFS001TEJ9X115N
60 MB/s +33%
HP Omen 16-ap0091ng
Samsung PM9C1b MZVL81T0HFLB-00BH1
58.8 MB/s +30%
MSI Crosshair A16 HX E8WGK
Micron 2500 1TB MTFDKBA1T0QGN
58.74 MB/s +30%
HP HyperX Omen 16 16-ap1931nr
 
45.25 MB/s
4K Write
Alienware 16X Aurora Core Ultra 9 290HX Plus
 
284.01 MB/s +145%
Lenovo Legion Pro 5 16IAX10, RTX 5070
SK Hynix HFS001TEJ9X115N
250 MB/s +115%
MSI Crosshair A16 HX E8WGK
Micron 2500 1TB MTFDKBA1T0QGN
192.85 MB/s +66%
HP Omen 16-ap0091ng
Samsung PM9C1b MZVL81T0HFLB-00BH1
189.4 MB/s +63%
Asus TUF Gaming A16 FA608UP
Western Digital PC SN5000S SDEQNSJ-1T00
156.3 MB/s +35%
HP HyperX Omen 16 16-ap1931nr
 
116.15 MB/s
4K-64 Read
Lenovo Legion Pro 5 16IAX10, RTX 5070
SK Hynix HFS001TEJ9X115N
2520 MB/s +152%
Alienware 16X Aurora Core Ultra 9 290HX Plus
 
2137.32 MB/s +114%
MSI Crosshair A16 HX E8WGK
Micron 2500 1TB MTFDKBA1T0QGN
1008.8 MB/s +1%
HP HyperX Omen 16 16-ap1931nr
 
999.19 MB/s
HP Omen 16-ap0091ng
Samsung PM9C1b MZVL81T0HFLB-00BH1
866 MB/s -13%
Asus TUF Gaming A16 FA608UP
Western Digital PC SN5000S SDEQNSJ-1T00
832 MB/s -17%
4K-64 Write
Alienware 16X Aurora Core Ultra 9 290HX Plus
 
4483.37 MB/s +4869%
MSI Crosshair A16 HX E8WGK
Micron 2500 1TB MTFDKBA1T0QGN
3391.95 MB/s +3660%
Lenovo Legion Pro 5 16IAX10, RTX 5070
SK Hynix HFS001TEJ9X115N
2970 MB/s +3192%
HP Omen 16-ap0091ng
Samsung PM9C1b MZVL81T0HFLB-00BH1
2532 MB/s +2706%
Asus TUF Gaming A16 FA608UP
Western Digital PC SN5000S SDEQNSJ-1T00
2134 MB/s +2265%
HP HyperX Omen 16 16-ap1931nr
 
90.22 MB/s
Access Time Read
HP HyperX Omen 16 16-ap1931nr
 
0.112 ms *
HP Omen 16-ap0091ng
Samsung PM9C1b MZVL81T0HFLB-00BH1
0.098 ms * +12%
MSI Crosshair A16 HX E8WGK
Micron 2500 1TB MTFDKBA1T0QGN
0.078 ms * +30%
Asus TUF Gaming A16 FA608UP
Western Digital PC SN5000S SDEQNSJ-1T00
0.054 ms * +52%
Lenovo Legion Pro 5 16IAX10, RTX 5070
SK Hynix HFS001TEJ9X115N
0.052 ms * +54%
Alienware 16X Aurora Core Ultra 9 290HX Plus
 
0.042 ms * +62%
Access Time Write
HP HyperX Omen 16 16-ap1931nr
 
0.262 ms *
MSI Crosshair A16 HX E8WGK
Micron 2500 1TB MTFDKBA1T0QGN
0.06 ms * +77%
Alienware 16X Aurora Core Ultra 9 290HX Plus
 
0.041 ms * +84%
Asus TUF Gaming A16 FA608UP
Western Digital PC SN5000S SDEQNSJ-1T00
0.03 ms * +89%
HP Omen 16-ap0091ng
Samsung PM9C1b MZVL81T0HFLB-00BH1
0.022 ms * +92%
Lenovo Legion Pro 5 16IAX10, RTX 5070
SK Hynix HFS001TEJ9X115N
0.018 ms * +93%

* ... más pequeño es mejor

Limitación del disco: bucle de lectura de DiskSpd, profundidad de cola 8

0150300450600750900105012001350150016501800195021002250240025502700285030003150330034503600375039004050420043504500465048004950510052505400555057005850600061506300645066006750690070507200Tooltip
HP HyperX Omen 16 16-ap1931nr  ; diskspd 2.0.17 f: Ø6849 (4957.67-6914.73) MB/s
HP Omen 16-ap0091ng Samsung PM9C1b MZVL81T0HFLB-00BH1; diskspd 2.0.17 f: Ø7228 (5964.95-7269.15) MB/s

Rendimiento de la GPU

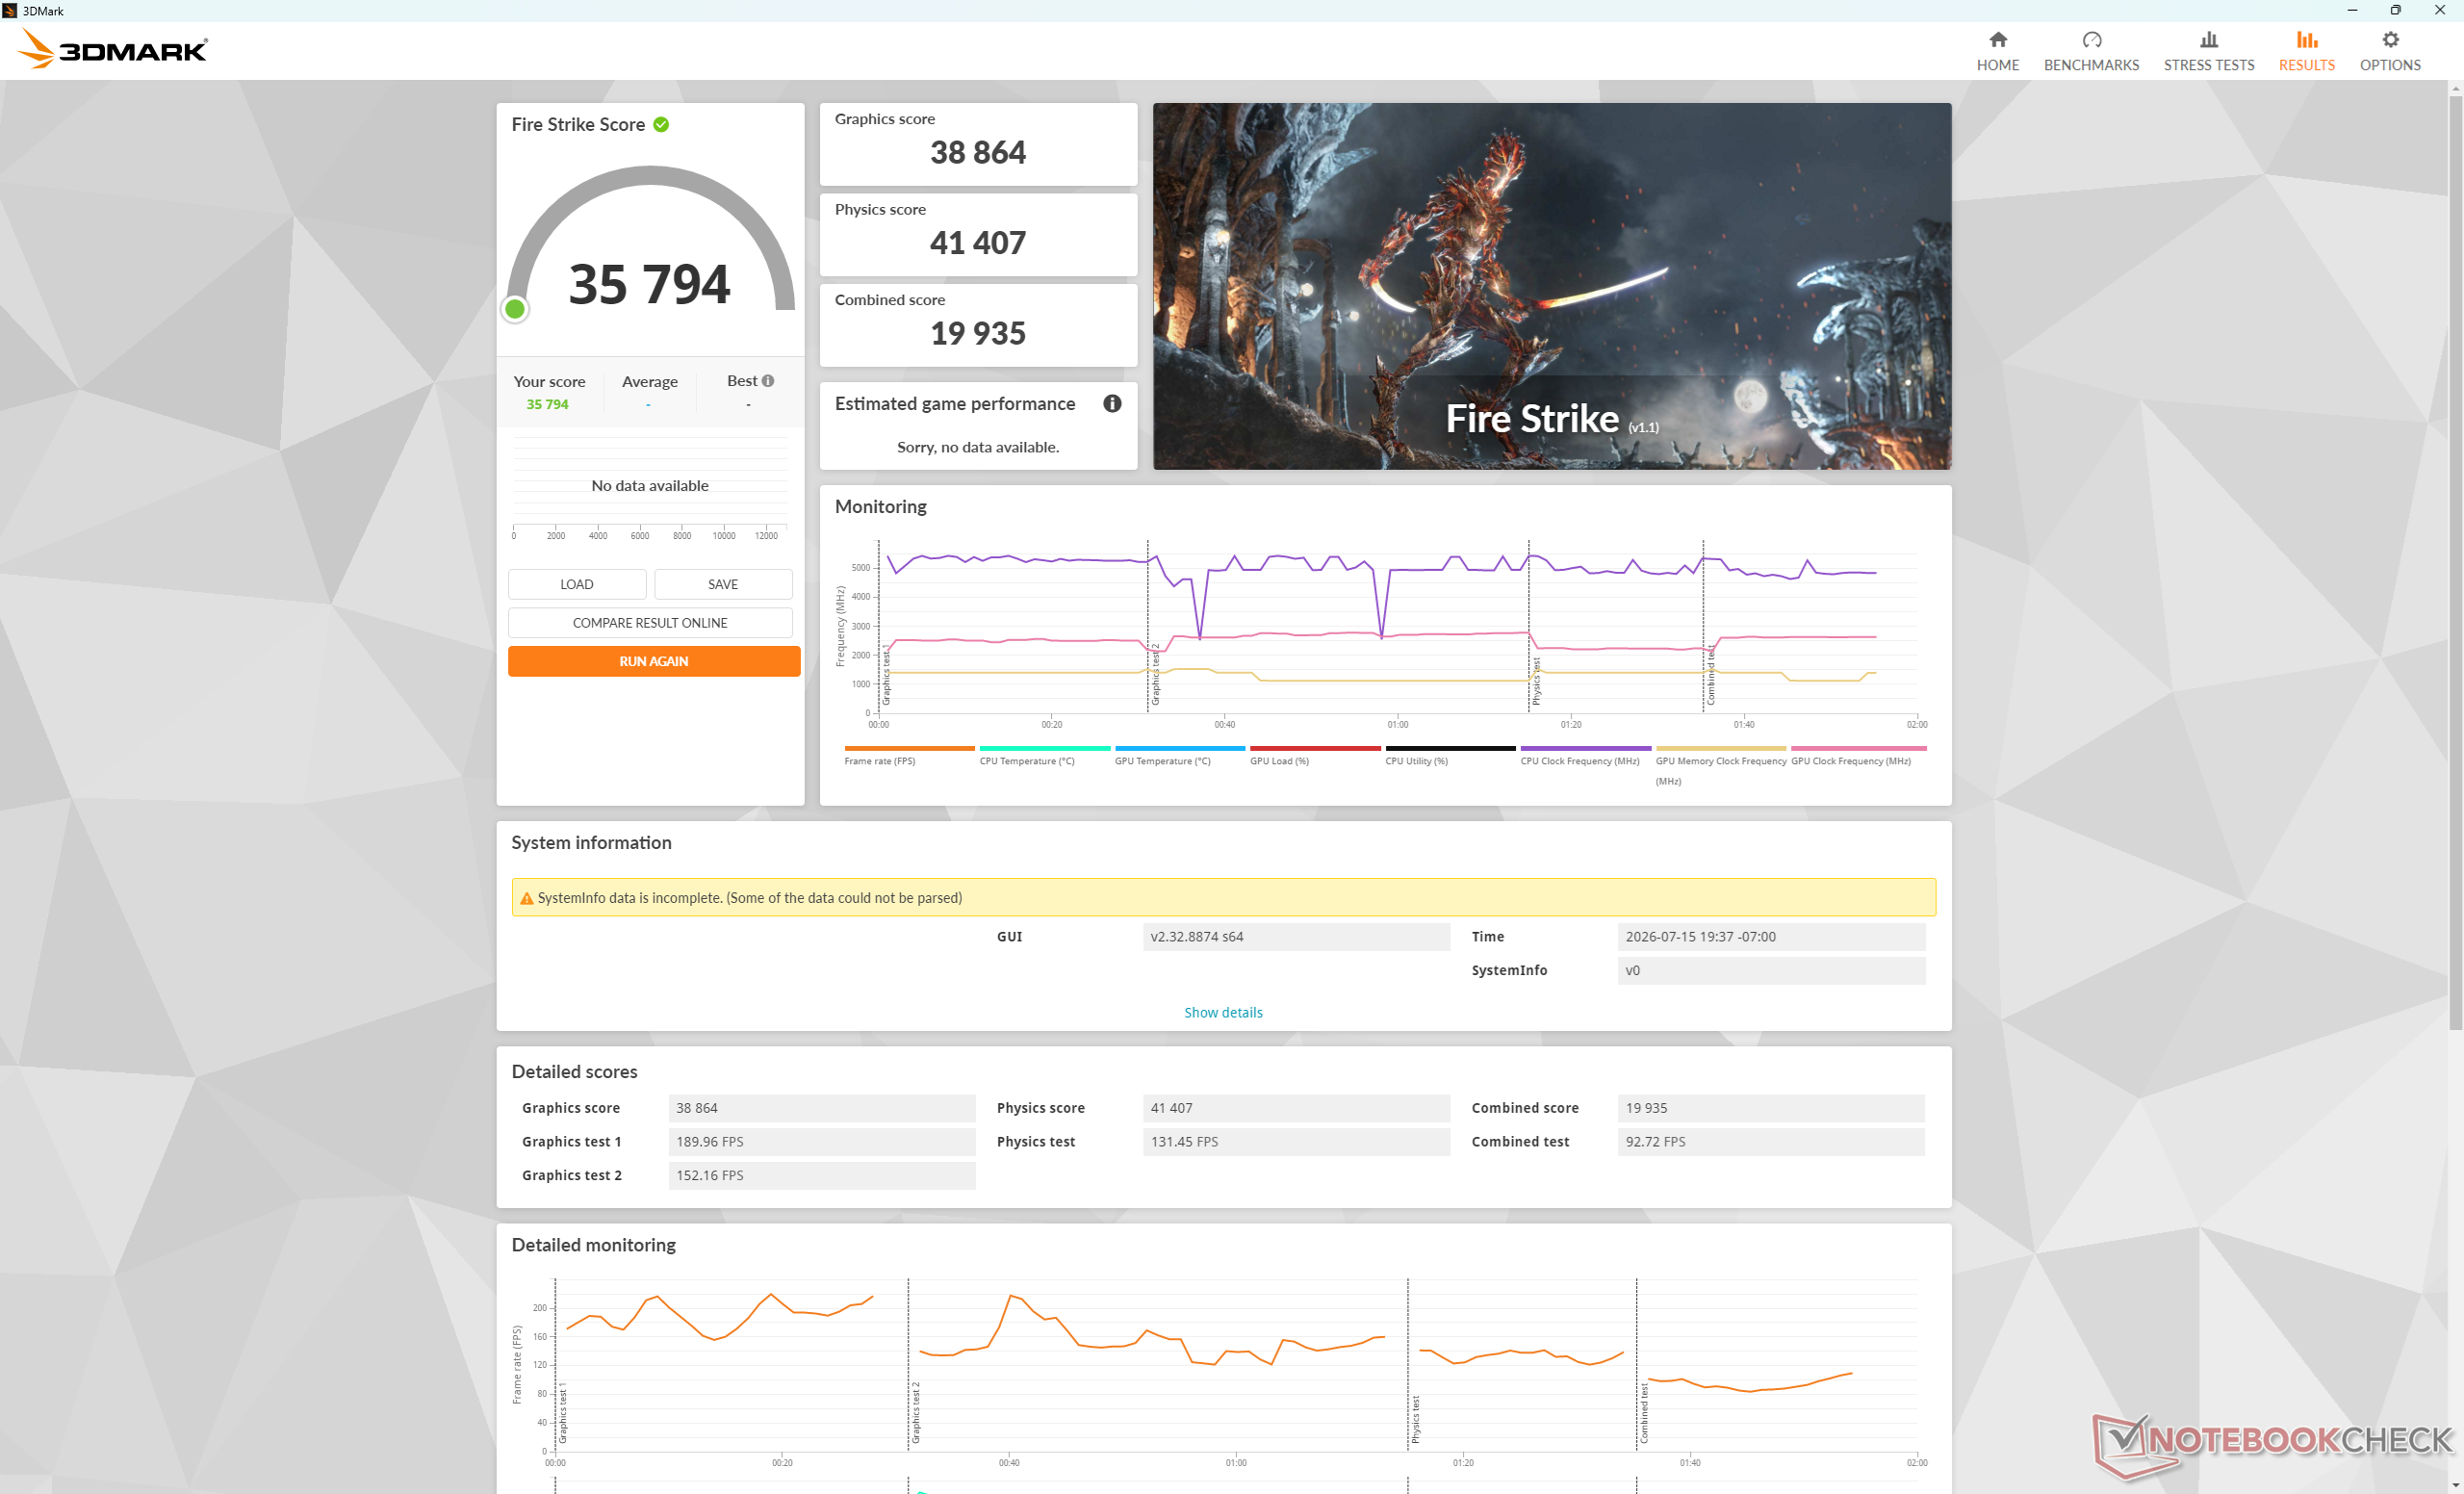
La GeForce RTX 5070 de 115 W funciona entre un 5 y un 10 por ciento más rápido que el portátil medio de nuestra base de datos con la misma opción de GPU. Recomendamos utilizar el modo «Rendimiento» o superior al jugar, ya que el modo «Equilibrado» reduciría el rendimiento gráfico hasta en un 13 por ciento, tal y como muestran nuestros resultados de Fire Strike que figuran a continuación.

Perfil de potenciaPuntuación de gráficosPuntuación de físicaPuntuación combinada
Modo «Unleashed»38 86441 40719 935
Modo «Performance»38 484 (-1 %)39 567 (-4 %)18 485 (-7 %)
Modo equilibrado33 847 (-13 %)33 778 (-18 %)16 119 (-19 %)
Alimentación por batería14 105 (-64 %)24 832 (-40 %)4124 (-79 %)
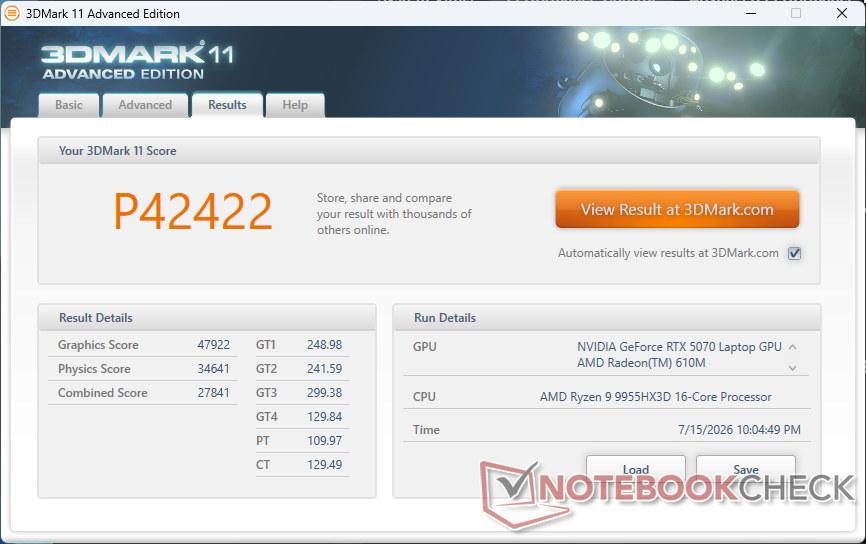
3DMark 11
3DMark 11
Fire Strike
Fire Strike
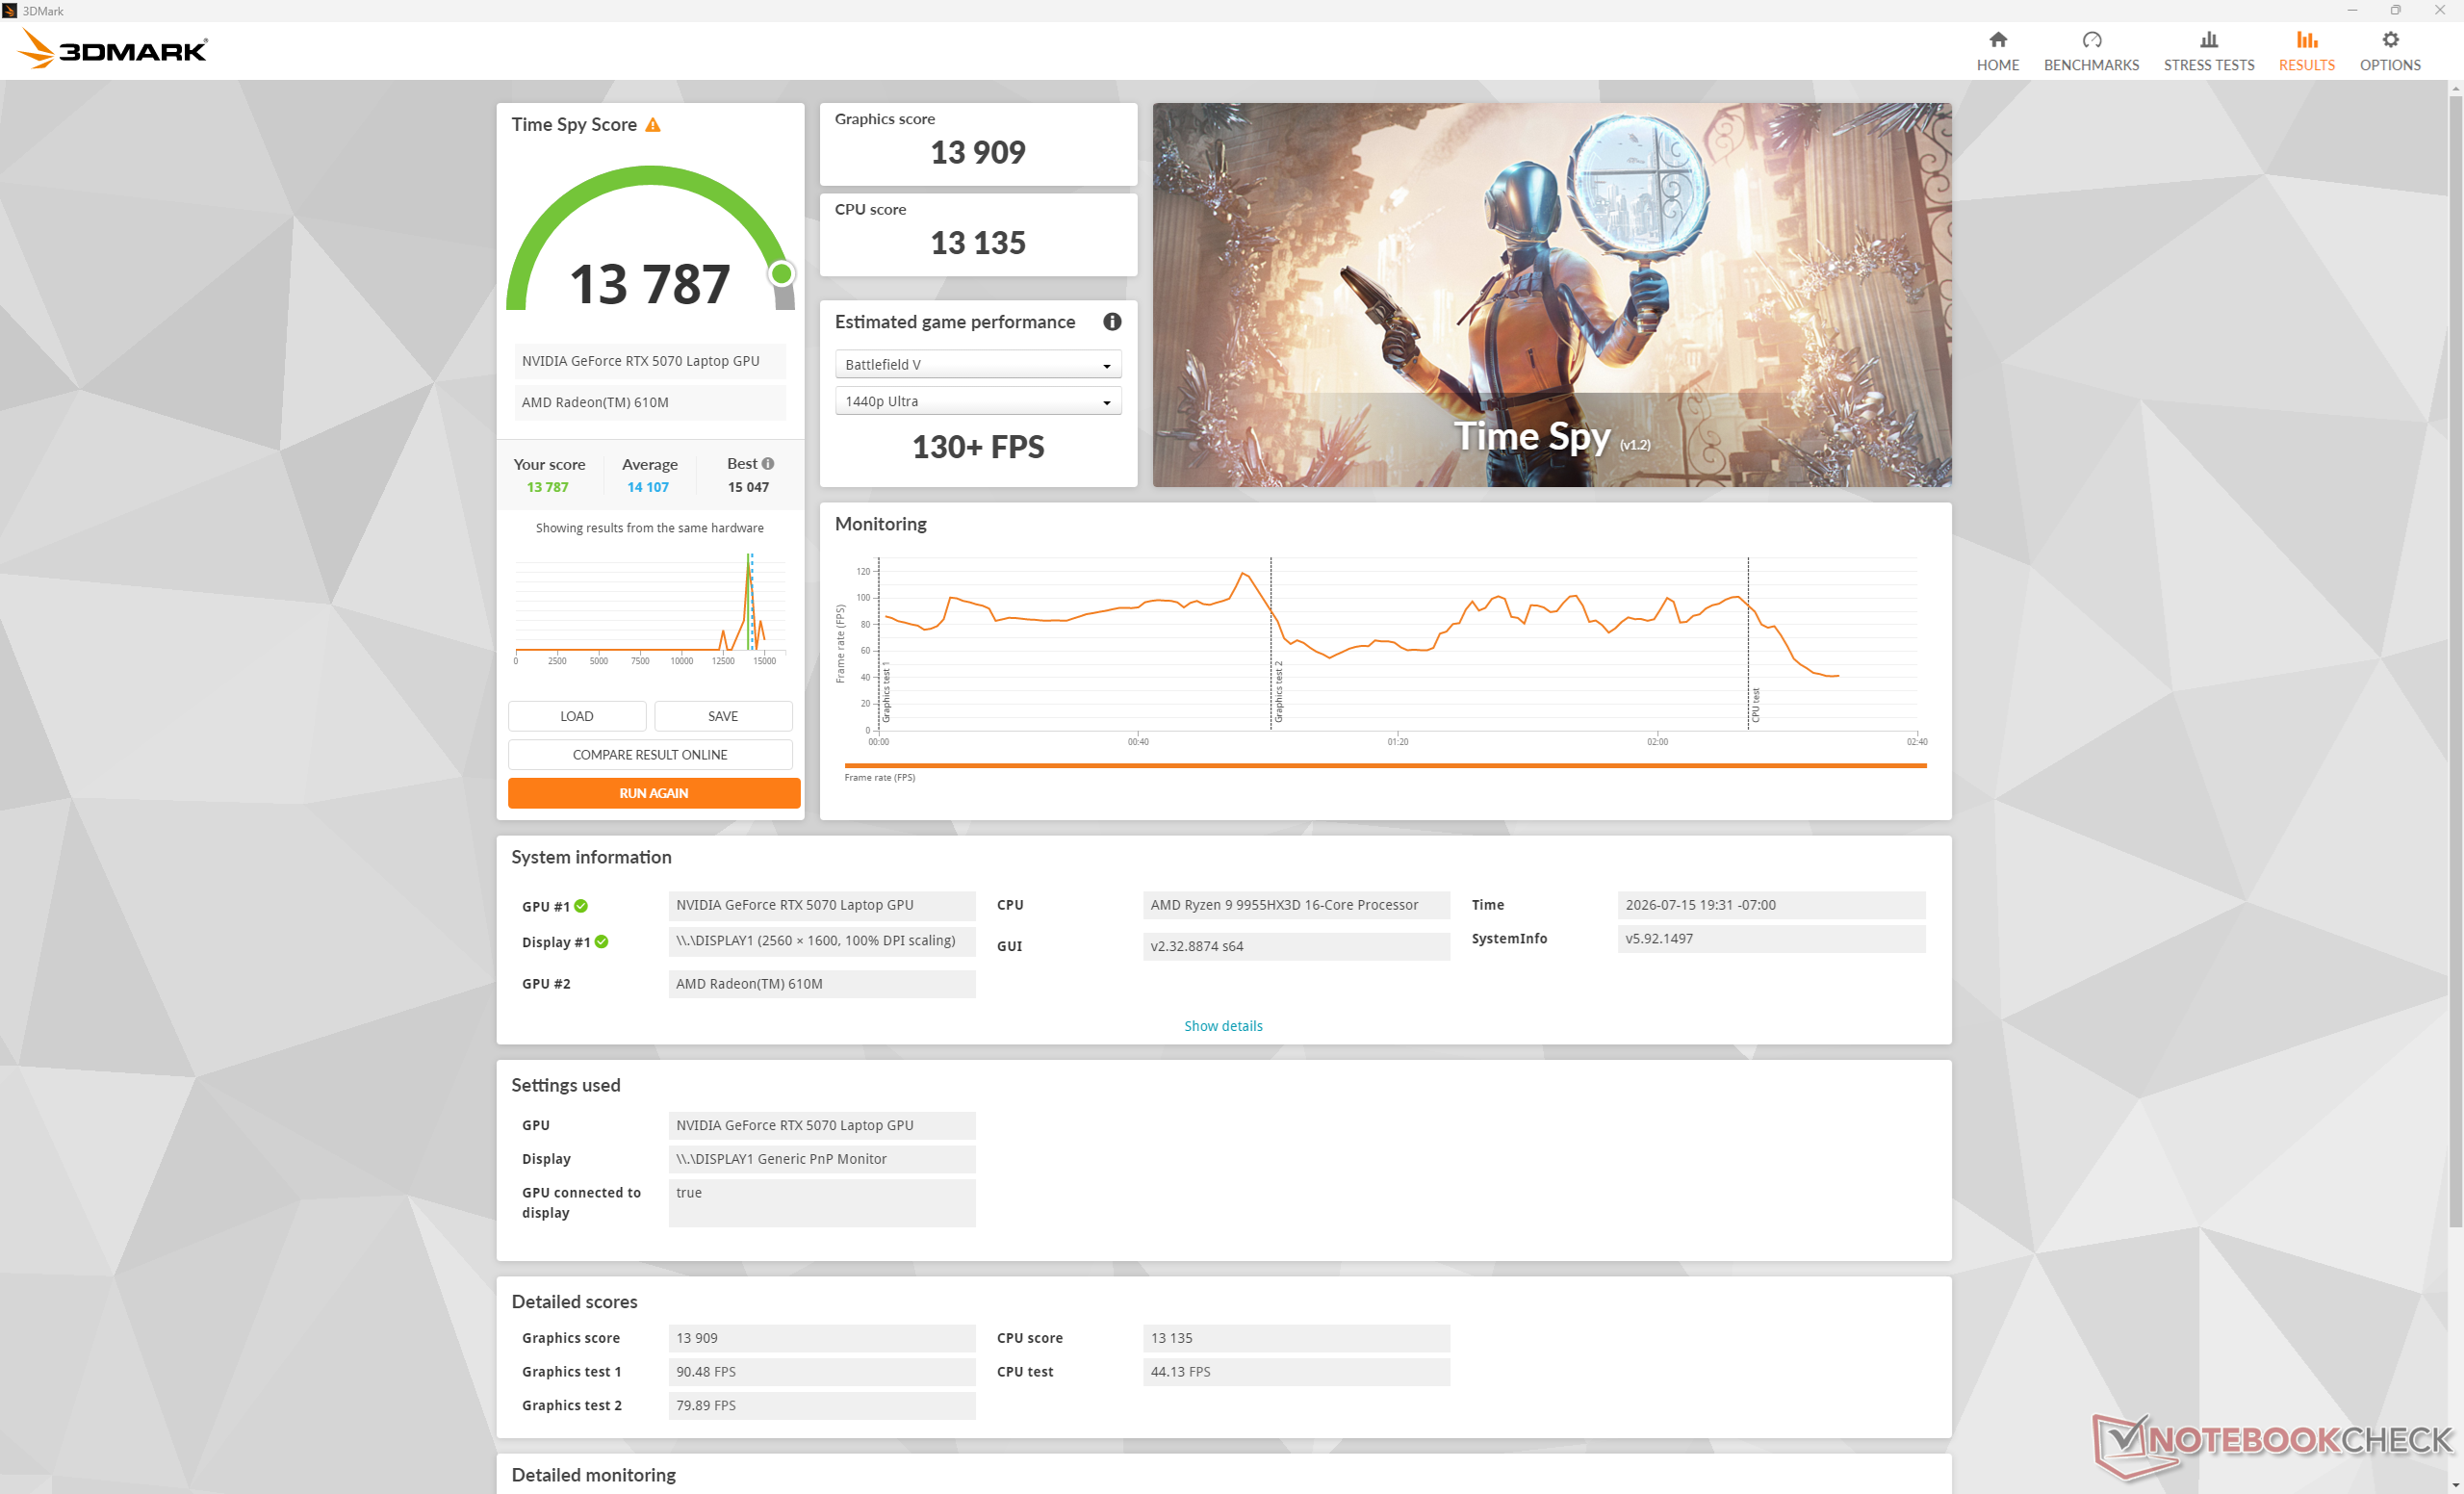
Time Spy
Time Spy
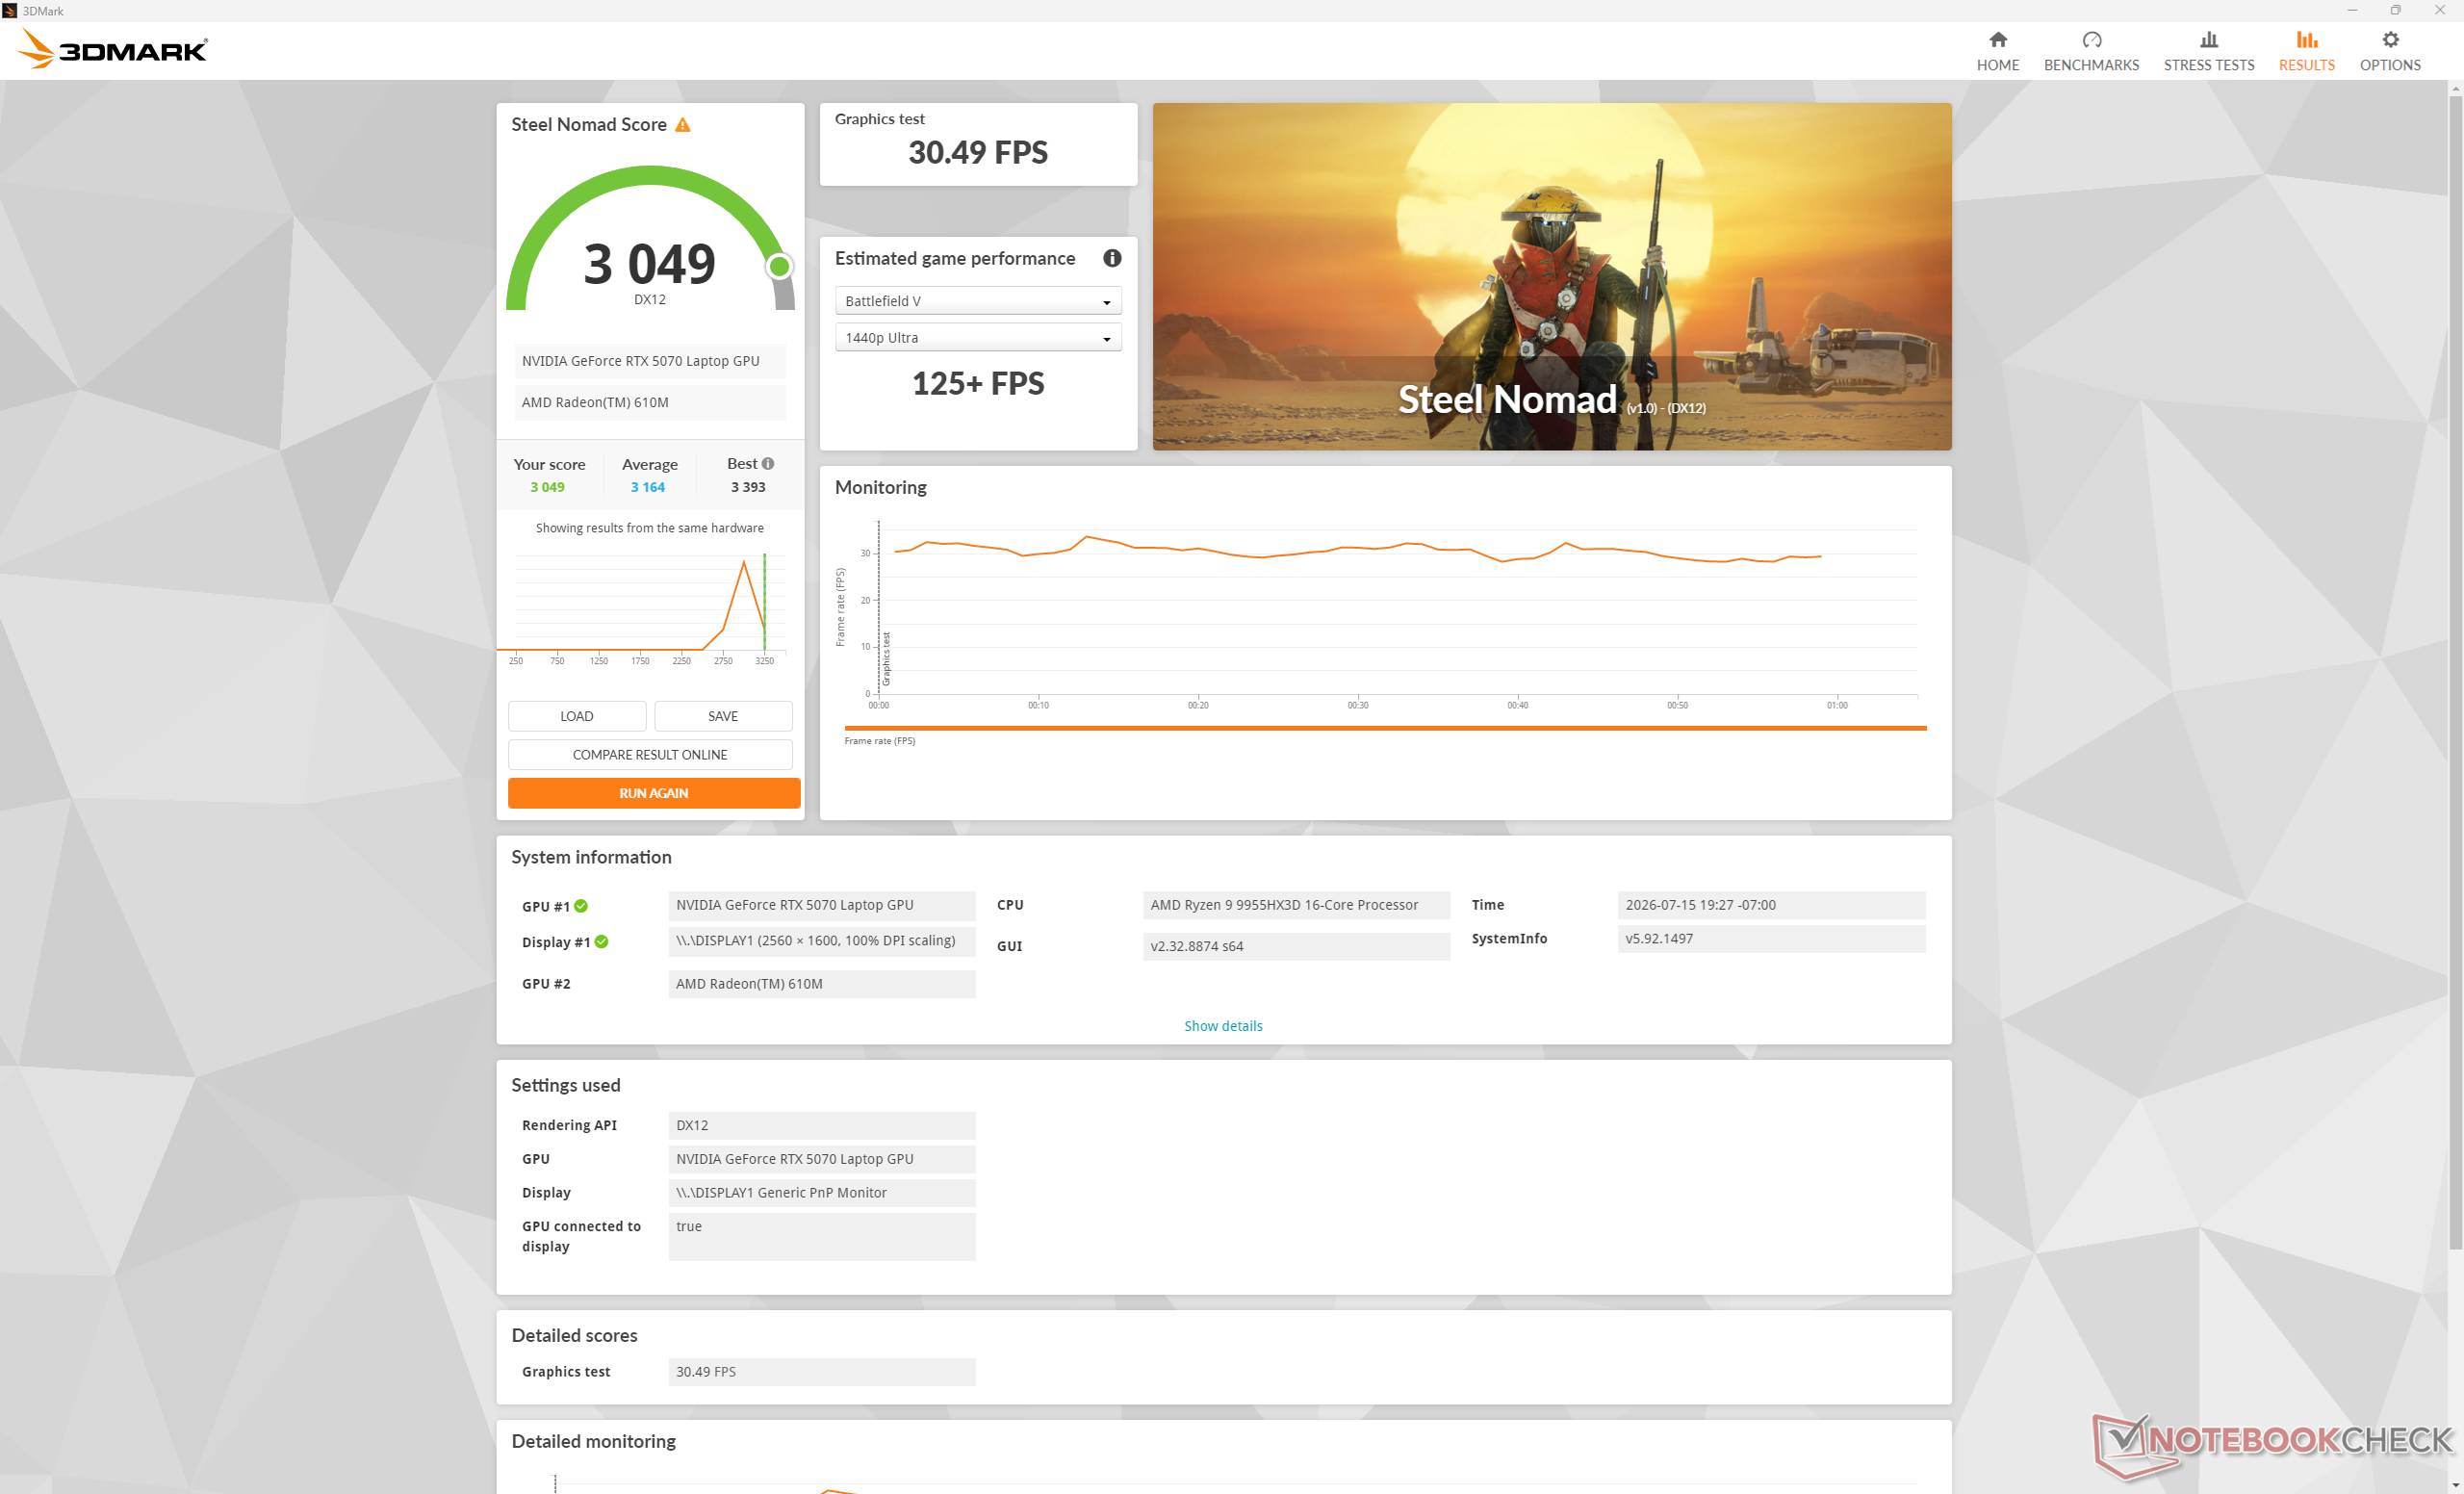
Steel Nomad
Steel Nomad
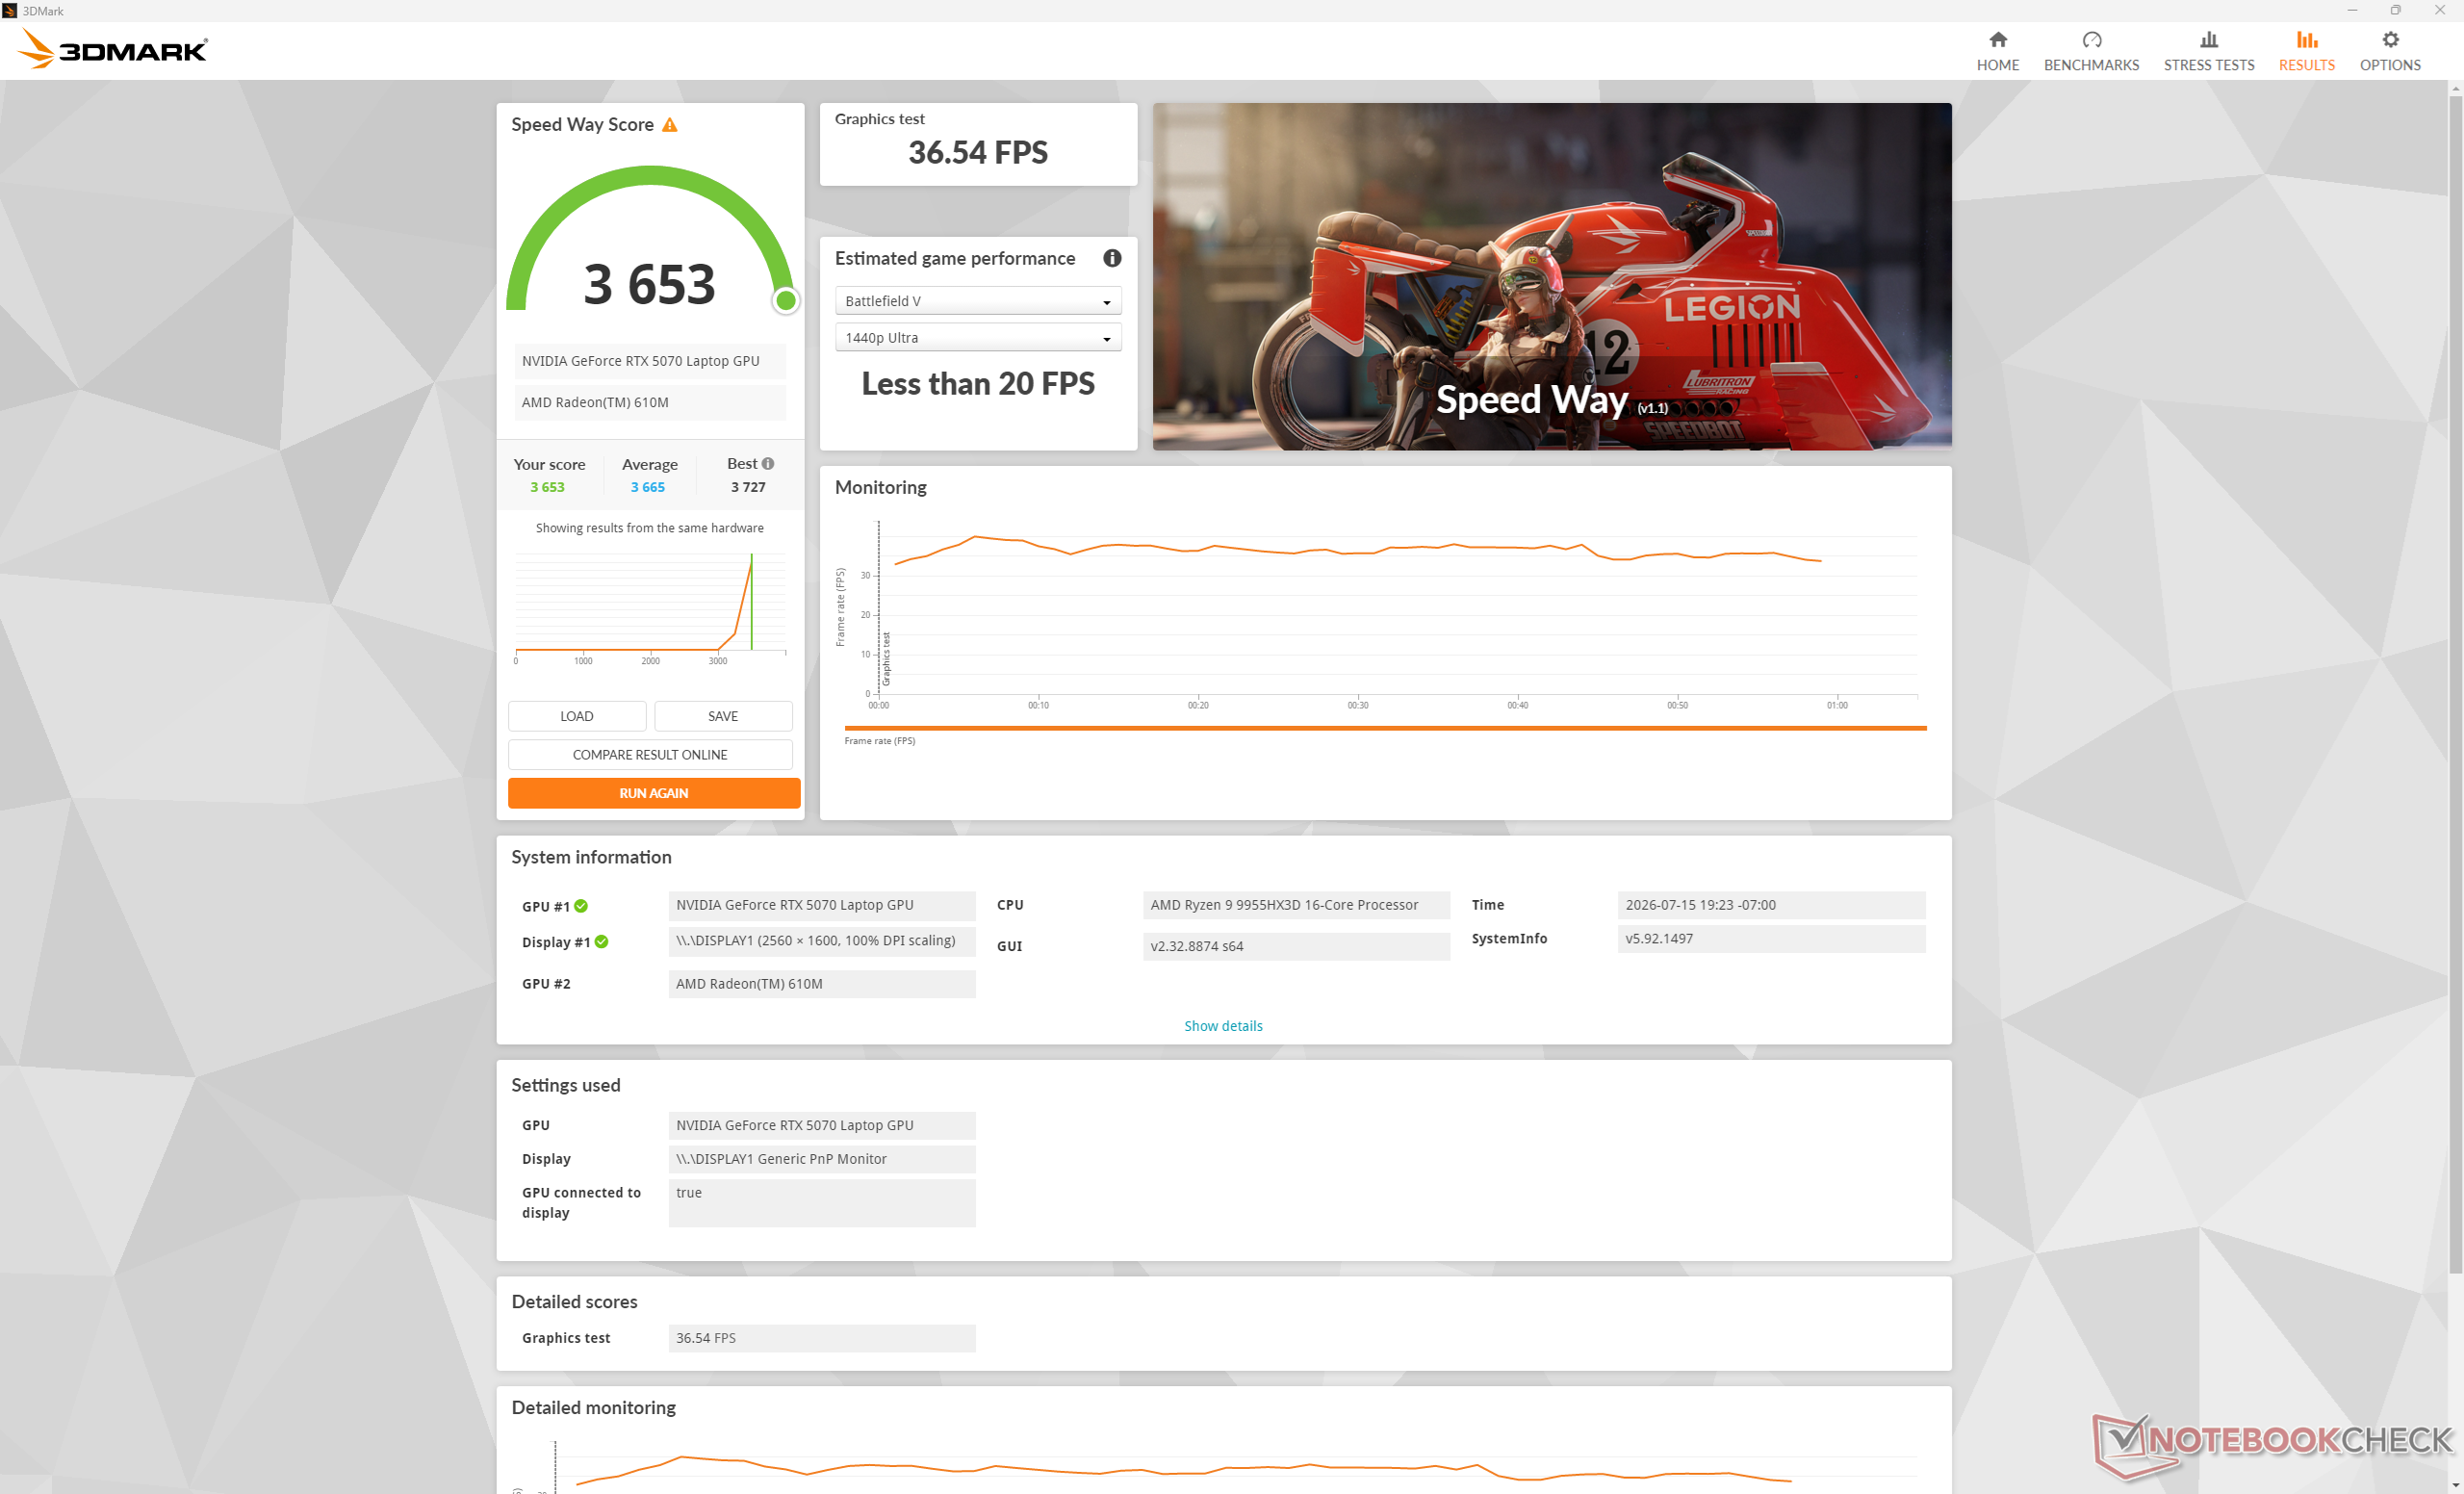
Speed Way
Speed Way
3DMark Performance rating - Percent
NVIDIA KFA2 GeForce RTX 5070 1-Click OC
NVIDIA GeForce RTX 5070, AMD Ryzen 7 9800X3D
99 pt
Lenovo Legion 9 16IRX9, RTX 4090 -2!
NVIDIA GeForce RTX 4090 Laptop GPU, Intel Core i9-14900HX
87.6 pt
Aorus Master 16 AM6J -2!
NVIDIA GeForce RTX 5080 Laptop, AMD Ryzen 9 9955HX3D
85.3 pt
Schenker XMG APEX 16 MAX -1!
NVIDIA GeForce RTX 5070 Ti Laptop, AMD Ryzen 9 9955HX
77.6 pt
Alienware 16X Aurora Core Ultra 9 290HX Plus
NVIDIA GeForce RTX 5070 Ti Laptop, Intel Core Ultra 9 290HX Plus
74 pt
Acer Predator Helios Neo 16S AI PHN16S-71-94L9 -2!
NVIDIA GeForce RTX 5070 Ti Laptop, Intel Core Ultra 9 275HX
66.5 pt
Lenovo Legion Pro 5 16IAX10, RTX 5070 -2!
NVIDIA GeForce RTX 5070 Laptop, Intel Core Ultra 7 255HX
64.7 pt
HP HyperX Omen 16 16-ap1931nr
NVIDIA GeForce RTX 5070 Laptop, AMD Ryzen 9 9955HX3D
63 pt
MSI Crosshair A16 HX E8WGK
NVIDIA GeForce RTX 5070 Laptop, AMD Ryzen 9 8940HX
63 pt
Medio NVIDIA GeForce RTX 5070 Laptop
 
59.2 pt
HP Omen 16-ap0091ng -2!
NVIDIA GeForce RTX 5060 Laptop, AMD Ryzen 9 8940HX
52.6 pt
Alienware m16 R1 Intel -1!
NVIDIA GeForce RTX 4060 Laptop GPU, Intel Core i7-13700HX
48.6 pt
3DMark 11 - 1280x720 Performance GPU
NVIDIA KFA2 GeForce RTX 5070 1-Click OC
NVIDIA GeForce RTX 5070, AMD Ryzen 7 9800X3D
71642 Points +49%
Lenovo Legion 9 16IRX9, RTX 4090
NVIDIA GeForce RTX 4090 Laptop GPU, Intel Core i9-14900HX
64341 Points +34%
Aorus Master 16 AM6J
NVIDIA GeForce RTX 5080 Laptop, AMD Ryzen 9 9955HX3D
61571 Points +28%
Schenker XMG APEX 16 MAX
NVIDIA GeForce RTX 5070 Ti Laptop, AMD Ryzen 9 9955HX
57140 Points +19%
Alienware 16X Aurora Core Ultra 9 290HX Plus
NVIDIA GeForce RTX 5070 Ti Laptop, Intel Core Ultra 9 290HX Plus
54767 Points +14%
Acer Predator Helios Neo 16S AI PHN16S-71-94L9
NVIDIA GeForce RTX 5070 Ti Laptop, Intel Core Ultra 9 275HX
49092 Points +2%
Lenovo Legion Pro 5 16IAX10, RTX 5070
NVIDIA GeForce RTX 5070 Laptop, Intel Core Ultra 7 255HX
48777 Points +2%
HP HyperX Omen 16 16-ap1931nr
NVIDIA GeForce RTX 5070 Laptop, AMD Ryzen 9 9955HX3D
47922 Points
MSI Crosshair A16 HX E8WGK
NVIDIA GeForce RTX 5070 Laptop, AMD Ryzen 9 8940HX
45691 Points -5%
Medio NVIDIA GeForce RTX 5070 Laptop
  (36721 - 49568, n=29)
44394 Points -7%
Alienware m16 R1 Intel
NVIDIA GeForce RTX 4060 Laptop GPU, Intel Core i7-13700HX
37496 Points -22%
HP Omen 16-ap0091ng
NVIDIA GeForce RTX 5060 Laptop, AMD Ryzen 9 8940HX
36563 Points -24%
3DMark
1920x1080 Fire Strike Graphics
NVIDIA KFA2 GeForce RTX 5070 1-Click OC
NVIDIA GeForce RTX 5070, AMD Ryzen 7 9800X3D
58426 Points +50%
Aorus Master 16 AM6J
NVIDIA GeForce RTX 5080 Laptop, AMD Ryzen 9 9955HX3D
46816 Points +20%
Schenker XMG APEX 16 MAX
NVIDIA GeForce RTX 5070 Ti Laptop, AMD Ryzen 9 9955HX
44206 Points +14%
Alienware 16X Aurora Core Ultra 9 290HX Plus
NVIDIA GeForce RTX 5070 Ti Laptop, Intel Core Ultra 9 290HX Plus
43581 Points +12%
Lenovo Legion 9 16IRX9, RTX 4090
NVIDIA GeForce RTX 4090 Laptop GPU, Intel Core i9-14900HX
43518 Points +12%
MSI Crosshair A16 HX E8WGK
NVIDIA GeForce RTX 5070 Laptop, AMD Ryzen 9 8940HX
38954 Points 0%
HP HyperX Omen 16 16-ap1931nr
NVIDIA GeForce RTX 5070 Laptop, AMD Ryzen 9 9955HX3D
38864 Points
Lenovo Legion Pro 5 16IAX10, RTX 5070
NVIDIA GeForce RTX 5070 Laptop, Intel Core Ultra 7 255HX
37831 Points -3%
Acer Predator Helios Neo 16S AI PHN16S-71-94L9
NVIDIA GeForce RTX 5070 Ti Laptop, Intel Core Ultra 9 275HX
36184 Points -7%
Medio NVIDIA GeForce RTX 5070 Laptop
  (28759 - 38954, n=34)
35449 Points -9%
HP Omen 16-ap0091ng
NVIDIA GeForce RTX 5060 Laptop, AMD Ryzen 9 8940HX
30913 Points -20%
Alienware m16 R1 Intel
NVIDIA GeForce RTX 4060 Laptop GPU, Intel Core i7-13700HX
27506 Points -29%
2560x1440 Time Spy Graphics
NVIDIA KFA2 GeForce RTX 5070 1-Click OC
NVIDIA GeForce RTX 5070, AMD Ryzen 7 9800X3D
22423 Points +61%
Lenovo Legion 9 16IRX9, RTX 4090
NVIDIA GeForce RTX 4090 Laptop GPU, Intel Core i9-14900HX
20416 Points +47%
Aorus Master 16 AM6J
NVIDIA GeForce RTX 5080 Laptop, AMD Ryzen 9 9955HX3D
19673 Points +41%
Schenker XMG APEX 16 MAX
NVIDIA GeForce RTX 5070 Ti Laptop, AMD Ryzen 9 9955HX
17914 Points +29%
Alienware 16X Aurora Core Ultra 9 290HX Plus
NVIDIA GeForce RTX 5070 Ti Laptop, Intel Core Ultra 9 290HX Plus
16458 Points +18%
Acer Predator Helios Neo 16S AI PHN16S-71-94L9
NVIDIA GeForce RTX 5070 Ti Laptop, Intel Core Ultra 9 275HX
14615 Points +5%
MSI Crosshair A16 HX E8WGK
NVIDIA GeForce RTX 5070 Laptop, AMD Ryzen 9 8940HX
14118 Points +2%
HP HyperX Omen 16 16-ap1931nr
NVIDIA GeForce RTX 5070 Laptop, AMD Ryzen 9 9955HX3D
13909 Points
Lenovo Legion Pro 5 16IAX10, RTX 5070
NVIDIA GeForce RTX 5070 Laptop, Intel Core Ultra 7 255HX
13510 Points -3%
Medio NVIDIA GeForce RTX 5070 Laptop
  (10851 - 14771, n=34)
13264 Points -5%
HP Omen 16-ap0091ng
NVIDIA GeForce RTX 5060 Laptop, AMD Ryzen 9 8940HX
11655 Points -16%
Alienware m16 R1 Intel
NVIDIA GeForce RTX 4060 Laptop GPU, Intel Core i7-13700HX
10591 Points -24%
2560x1440 Time Spy Score
NVIDIA KFA2 GeForce RTX 5070 1-Click OC
NVIDIA GeForce RTX 5070, AMD Ryzen 7 9800X3D
21110 Points +53%
Lenovo Legion 9 16IRX9, RTX 4090
NVIDIA GeForce RTX 4090 Laptop GPU, Intel Core i9-14900HX
20099 Points +46%
Aorus Master 16 AM6J
NVIDIA GeForce RTX 5080 Laptop, AMD Ryzen 9 9955HX3D
18453 Points +34%
Schenker XMG APEX 16 MAX
NVIDIA GeForce RTX 5070 Ti Laptop, AMD Ryzen 9 9955HX
17095 Points +24%
Alienware 16X Aurora Core Ultra 9 290HX Plus
NVIDIA GeForce RTX 5070 Ti Laptop, Intel Core Ultra 9 290HX Plus
16581 Points +20%
Acer Predator Helios Neo 16S AI PHN16S-71-94L9
NVIDIA GeForce RTX 5070 Ti Laptop, Intel Core Ultra 9 275HX
14888 Points +8%
MSI Crosshair A16 HX E8WGK
NVIDIA GeForce RTX 5070 Laptop, AMD Ryzen 9 8940HX
13964 Points +1%
Lenovo Legion Pro 5 16IAX10, RTX 5070
NVIDIA GeForce RTX 5070 Laptop, Intel Core Ultra 7 255HX
13880 Points +1%
HP HyperX Omen 16 16-ap1931nr
NVIDIA GeForce RTX 5070 Laptop, AMD Ryzen 9 9955HX3D
13787 Points
Medio NVIDIA GeForce RTX 5070 Laptop
  (11192 - 14448, n=34)
13120 Points -5%
HP Omen 16-ap0091ng
NVIDIA GeForce RTX 5060 Laptop, AMD Ryzen 9 8940HX
11484 Points -17%
Alienware m16 R1 Intel
NVIDIA GeForce RTX 4060 Laptop GPU, Intel Core i7-13700HX
11090 Points -20%
2560x1440 Speed Way Score
NVIDIA KFA2 GeForce RTX 5070 1-Click OC
NVIDIA GeForce RTX 5070, AMD Ryzen 7 9800X3D
5895 Points +61%
Alienware 16X Aurora Core Ultra 9 290HX Plus
NVIDIA GeForce RTX 5070 Ti Laptop, Intel Core Ultra 9 290HX Plus
4313 Points +18%
MSI Crosshair A16 HX E8WGK
NVIDIA GeForce RTX 5070 Laptop, AMD Ryzen 9 8940HX
3682 Points +1%
HP HyperX Omen 16 16-ap1931nr
NVIDIA GeForce RTX 5070 Laptop, AMD Ryzen 9 9955HX3D
3653 Points
Medio NVIDIA GeForce RTX 5070 Laptop
  (2796 - 3682, n=10)
3418 Points -6%
Alienware m16 R1 Intel
NVIDIA GeForce RTX 4060 Laptop GPU, Intel Core i7-13700HX
2591 Points -29%
Steel Nomad Score
NVIDIA KFA2 GeForce RTX 5070 1-Click OC
NVIDIA GeForce RTX 5070, AMD Ryzen 7 9800X3D
5521 Points +81%
NVIDIA KFA2 GeForce RTX 5070 1-Click OC
NVIDIA GeForce RTX 5070, AMD Ryzen 7 9800X3D
4866 Points +60%
Schenker XMG APEX 16 MAX
NVIDIA GeForce RTX 5070 Ti Laptop, AMD Ryzen 9 9955HX
3953 Points +30%
Alienware 16X Aurora Core Ultra 9 290HX Plus
NVIDIA GeForce RTX 5070 Ti Laptop, Intel Core Ultra 9 290HX Plus
3741 Points +23%
MSI Crosshair A16 HX E8WGK
NVIDIA GeForce RTX 5070 Laptop, AMD Ryzen 9 8940HX
3087 Points +1%
HP HyperX Omen 16 16-ap1931nr
NVIDIA GeForce RTX 5070 Laptop, AMD Ryzen 9 9955HX3D
3049 Points
Medio NVIDIA GeForce RTX 5070 Laptop
  (2441 - 3195, n=21)
2952 Points -3%
3DMark 11 Performance
42422 puntos
3DMark Cloud Gate Standard Score
77325 puntos
3DMark Fire Strike Score
35794 puntos
3DMark Time Spy Score
13787 puntos
3DMark Steel Nomad Score
3049 puntos
ayuda
Blender
v3.3 Classroom OPTIX/RTX
HP Omen 16-ap0091ng
NVIDIA GeForce RTX 5060 Laptop, AMD Ryzen 9 8940HX
21 Seconds * -24%
Asus TUF Gaming A16 FA608UP
NVIDIA GeForce RTX 5070 Laptop, AMD Ryzen 7 260
20 Seconds * -18%
Lenovo Legion Pro 5 16IAX10, RTX 5070
NVIDIA GeForce RTX 5070 Laptop, Intel Core Ultra 7 255HX
18 Seconds * -6%
MSI Crosshair A16 HX E8WGK
NVIDIA GeForce RTX 5070 Laptop, AMD Ryzen 9 8940HX
17 Seconds * -0%
HP HyperX Omen 16 16-ap1931nr
NVIDIA GeForce RTX 5070 Laptop, AMD Ryzen 9 9955HX3D
17 Seconds *
Alienware 16X Aurora Core Ultra 9 290HX Plus
NVIDIA GeForce RTX 5070 Ti Laptop, Intel Core Ultra 9 290HX Plus
14 Seconds * +18%
v3.3 Classroom CUDA
HP Omen 16-ap0091ng
NVIDIA GeForce RTX 5060 Laptop, AMD Ryzen 9 8940HX
38 Seconds * -27%
Asus TUF Gaming A16 FA608UP
NVIDIA GeForce RTX 5070 Laptop, AMD Ryzen 7 260
33.1 Seconds * -10%
MSI Crosshair A16 HX E8WGK
NVIDIA GeForce RTX 5070 Laptop, AMD Ryzen 9 8940HX
30 Seconds * -0%
HP HyperX Omen 16 16-ap1931nr
NVIDIA GeForce RTX 5070 Laptop, AMD Ryzen 9 9955HX3D
30 Seconds *
Lenovo Legion Pro 5 16IAX10, RTX 5070
NVIDIA GeForce RTX 5070 Laptop, Intel Core Ultra 7 255HX
29 Seconds * +3%
Alienware 16X Aurora Core Ultra 9 290HX Plus
NVIDIA GeForce RTX 5070 Ti Laptop, Intel Core Ultra 9 290HX Plus
25 Seconds * +17%
v3.3 Classroom CPU
Asus TUF Gaming A16 FA608UP
NVIDIA GeForce RTX 5070 Laptop, AMD Ryzen 7 260
292 Seconds * -112%
HP Omen 16-ap0091ng
NVIDIA GeForce RTX 5060 Laptop, AMD Ryzen 9 8940HX
195 Seconds * -41%
Lenovo Legion Pro 5 16IAX10, RTX 5070
NVIDIA GeForce RTX 5070 Laptop, Intel Core Ultra 7 255HX
171 Seconds * -24%
Alienware 16X Aurora Core Ultra 9 290HX Plus
NVIDIA GeForce RTX 5070 Ti Laptop, Intel Core Ultra 9 290HX Plus
155 Seconds * -12%
MSI Crosshair A16 HX E8WGK
NVIDIA GeForce RTX 5070 Laptop, AMD Ryzen 9 8940HX
150 Seconds * -9%
HP HyperX Omen 16 16-ap1931nr
NVIDIA GeForce RTX 5070 Laptop, AMD Ryzen 9 9955HX3D
138 Seconds *
v4.3 Barbershop CPU
Alienware 16X Aurora Core Ultra 9 290HX Plus
NVIDIA GeForce RTX 5070 Ti Laptop, Intel Core Ultra 9 290HX Plus
766 Seconds * -10%
MSI Crosshair A16 HX E8WGK
NVIDIA GeForce RTX 5070 Laptop, AMD Ryzen 9 8940HX
716 Seconds * -3%
HP HyperX Omen 16 16-ap1931nr
NVIDIA GeForce RTX 5070 Laptop, AMD Ryzen 9 9955HX3D
694 Seconds *
v4.3 Barbershop OPTIX
MSI Crosshair A16 HX E8WGK
NVIDIA GeForce RTX 5070 Laptop, AMD Ryzen 9 8940HX
86 Seconds * -1%
HP HyperX Omen 16 16-ap1931nr
NVIDIA GeForce RTX 5070 Laptop, AMD Ryzen 9 9955HX3D
85 Seconds *
Alienware 16X Aurora Core Ultra 9 290HX Plus
NVIDIA GeForce RTX 5070 Ti Laptop, Intel Core Ultra 9 290HX Plus
73 Seconds * +14%

* ... más pequeño es mejor

Performance rating - Percent
Alienware 16X Aurora Core Ultra 9 290HX Plus
Intel Core Ultra 9 290HX Plus, NVIDIA GeForce RTX 5070 Ti Laptop
97.7 pt
HP HyperX Omen 16 16-ap1931nr
AMD Ryzen 9 9955HX3D, NVIDIA GeForce RTX 5070 Laptop
92.3 pt
MSI Crosshair A16 HX E8WGK
AMD Ryzen 9 8940HX, NVIDIA GeForce RTX 5070 Laptop
89.2 pt
Lenovo Legion Pro 5 16IAX10, RTX 5070
Intel Core Ultra 7 255HX, NVIDIA GeForce RTX 5070 Laptop
86.4 pt
Asus TUF Gaming A16 FA608UP
AMD Ryzen 7 260, NVIDIA GeForce RTX 5070 Laptop
77.1 pt
HP Omen 16-ap0091ng
AMD Ryzen 9 8940HX, NVIDIA GeForce RTX 5060 Laptop
74.5 pt
Cyberpunk 2077 - 1920x1080 Ultra Preset (FSR off)
Alienware 16X Aurora Core Ultra 9 290HX Plus
Intel Core Ultra 9 290HX Plus, NVIDIA GeForce RTX 5070 Ti Laptop
114.9 (92.5min, 83.6P1) fps +6%
MSI Crosshair A16 HX E8WGK
AMD Ryzen 9 8940HX, NVIDIA GeForce RTX 5070 Laptop
112.1 (90.9min, 85.1P1) fps +3%
Asus TUF Gaming A16 FA608UP
AMD Ryzen 7 260, NVIDIA GeForce RTX 5070 Laptop
109.4 (88.6min) fps +1%
HP HyperX Omen 16 16-ap1931nr
AMD Ryzen 9 9955HX3D, NVIDIA GeForce RTX 5070 Laptop
108.8 (88.3min, 83.2P1) fps
Lenovo Legion Pro 5 16IAX10, RTX 5070
Intel Core Ultra 7 255HX, NVIDIA GeForce RTX 5070 Laptop
107 (88.7min) fps -2%
HP Omen 16-ap0091ng
AMD Ryzen 9 8940HX, NVIDIA GeForce RTX 5060 Laptop
86.6 (59min) fps -20%
Baldur's Gate 3 - 1920x1080 Ultra Preset AA:T
Alienware 16X Aurora Core Ultra 9 290HX Plus
Intel Core Ultra 9 290HX Plus, NVIDIA GeForce RTX 5070 Ti Laptop
159.3 (127.7min, 136P0.1, 144.7P1) fps +18%
HP HyperX Omen 16 16-ap1931nr
AMD Ryzen 9 9955HX3D, NVIDIA GeForce RTX 5070 Laptop
134.5 (79.5min, 79.7P0.1, 80P1) fps
MSI Crosshair A16 HX E8WGK
AMD Ryzen 9 8940HX, NVIDIA GeForce RTX 5070 Laptop
133.2 (79.7min, 79.7P0.1, 79.9P1) fps -1%
Lenovo Legion Pro 5 16IAX10, RTX 5070
Intel Core Ultra 7 255HX, NVIDIA GeForce RTX 5070 Laptop
130.6 fps -3%
Asus TUF Gaming A16 FA608UP
AMD Ryzen 7 260, NVIDIA GeForce RTX 5070 Laptop
127.5 fps -5%
HP Omen 16-ap0091ng
AMD Ryzen 9 8940HX, NVIDIA GeForce RTX 5060 Laptop
109.1 fps -19%
GTA V - 1920x1080 Highest AA:4xMSAA + FX AF:16x
HP HyperX Omen 16 16-ap1931nr
AMD Ryzen 9 9955HX3D, NVIDIA GeForce RTX 5070 Laptop
171.5 (1.578min, 111.1P1) fps
Alienware 16X Aurora Core Ultra 9 290HX Plus
Intel Core Ultra 9 290HX Plus, NVIDIA GeForce RTX 5070 Ti Laptop
159.2 (5.59min, 111.1P1) fps -7%
Lenovo Legion Pro 5 16IAX10, RTX 5070
Intel Core Ultra 7 255HX, NVIDIA GeForce RTX 5070 Laptop
153.2 (2.31min, 111.1P1) fps -11%
MSI Crosshair A16 HX E8WGK
AMD Ryzen 9 8940HX, NVIDIA GeForce RTX 5070 Laptop
152.6 (3.83min, 100P1) fps -11%
HP Omen 16-ap0091ng
AMD Ryzen 9 8940HX, NVIDIA GeForce RTX 5060 Laptop
127.5 (2.93min, 83.3P1) fps -26%
Asus TUF Gaming A16 FA608UP
AMD Ryzen 7 260, NVIDIA GeForce RTX 5070 Laptop
124.8 (4.67min, 90.9P1) fps -27%
Final Fantasy XV Benchmark - 1920x1080 High Quality
Alienware 16X Aurora Core Ultra 9 290HX Plus
Intel Core Ultra 9 290HX Plus, NVIDIA GeForce RTX 5070 Ti Laptop
161.1 fps +19%
Lenovo Legion Pro 5 16IAX10, RTX 5070
Intel Core Ultra 7 255HX, NVIDIA GeForce RTX 5070 Laptop
144.5 fps +7%
Asus TUF Gaming A16 FA608UP
AMD Ryzen 7 260, NVIDIA GeForce RTX 5070 Laptop
142.3 fps +5%
MSI Crosshair A16 HX E8WGK
AMD Ryzen 9 8940HX, NVIDIA GeForce RTX 5070 Laptop
140 fps +4%
HP HyperX Omen 16 16-ap1931nr
AMD Ryzen 9 9955HX3D, NVIDIA GeForce RTX 5070 Laptop
135.2 fps
HP Omen 16-ap0091ng
AMD Ryzen 9 8940HX, NVIDIA GeForce RTX 5060 Laptop
111 fps -18%
Strange Brigade - 1920x1080 ultra AA:ultra AF:16
Alienware 16X Aurora Core Ultra 9 290HX Plus
Intel Core Ultra 9 290HX Plus, NVIDIA GeForce RTX 5070 Ti Laptop
314 (155.9min, 229P1) fps +21%
HP HyperX Omen 16 16-ap1931nr
AMD Ryzen 9 9955HX3D, NVIDIA GeForce RTX 5070 Laptop
260 (56.4min, 196P1) fps
MSI Crosshair A16 HX E8WGK
AMD Ryzen 9 8940HX, NVIDIA GeForce RTX 5070 Laptop
258 (159.7min, 195.8P1) fps -1%
Lenovo Legion Pro 5 16IAX10, RTX 5070
Intel Core Ultra 7 255HX, NVIDIA GeForce RTX 5070 Laptop
246 (9min, 185.2P1) fps -5%
Asus TUF Gaming A16 FA608UP
AMD Ryzen 7 260, NVIDIA GeForce RTX 5070 Laptop
219 (128min, 164.3P1) fps -16%
HP Omen 16-ap0091ng
AMD Ryzen 9 8940HX, NVIDIA GeForce RTX 5060 Laptop
217.8 (86.3min, 152.5P1) fps -16%
Dota 2 Reborn - 1920x1080 ultra (3/3) best looking
HP HyperX Omen 16 16-ap1931nr
AMD Ryzen 9 9955HX3D, NVIDIA GeForce RTX 5070 Laptop
200 (161.1min) fps
Alienware 16X Aurora Core Ultra 9 290HX Plus
Intel Core Ultra 9 290HX Plus, NVIDIA GeForce RTX 5070 Ti Laptop
184.7 (155.7min) fps -8%
MSI Crosshair A16 HX E8WGK
AMD Ryzen 9 8940HX, NVIDIA GeForce RTX 5070 Laptop
183.3 (152.5min) fps -8%
Lenovo Legion Pro 5 16IAX10, RTX 5070
Intel Core Ultra 7 255HX, NVIDIA GeForce RTX 5070 Laptop
162.4 (136.4min) fps -19%
HP Omen 16-ap0091ng
AMD Ryzen 9 8940HX, NVIDIA GeForce RTX 5060 Laptop
161.6 (132.4min) fps -19%
Asus TUF Gaming A16 FA608UP
AMD Ryzen 7 260, NVIDIA GeForce RTX 5070 Laptop
123.2 (104.7min) fps -38%
X-Plane 11.11 - 1920x1080 high (fps_test=3)
HP HyperX Omen 16 16-ap1931nr
AMD Ryzen 9 9955HX3D, NVIDIA GeForce RTX 5070 Laptop
111.9 fps
Alienware 16X Aurora Core Ultra 9 290HX Plus
Intel Core Ultra 9 290HX Plus, NVIDIA GeForce RTX 5070 Ti Laptop
110.4 fps -1%
MSI Crosshair A16 HX E8WGK
AMD Ryzen 9 8940HX, NVIDIA GeForce RTX 5070 Laptop
104.8 fps -6%
Lenovo Legion Pro 5 16IAX10, RTX 5070
Intel Core Ultra 7 255HX, NVIDIA GeForce RTX 5070 Laptop
101.6 fps -9%
HP Omen 16-ap0091ng
AMD Ryzen 9 8940HX, NVIDIA GeForce RTX 5060 Laptop
93.9 fps -16%
Asus TUF Gaming A16 FA608UP
AMD Ryzen 7 260, NVIDIA GeForce RTX 5070 Laptop
80.7 fps -28%
GTA V - 2560x1440 Highest AA:4xMSAA + FX AF:16x
Schenker XMG APEX 16 MAX
AMD Ryzen 9 9955HX, NVIDIA GeForce RTX 5070 Ti Laptop
157.3 (3.68min, 111.1P1) fps +18%
Lenovo Legion 9 16IRX9, RTX 4090
Intel Core i9-14900HX, NVIDIA GeForce RTX 4090 Laptop GPU
138.9 (0.96min, 100P1) fps +4%
Alienware 16X Aurora Core Ultra 9 290HX Plus
Intel Core Ultra 9 290HX Plus, NVIDIA GeForce RTX 5070 Ti Laptop
134.4 (26.2min, 90.9P1) fps +1%
HP HyperX Omen 16 16-ap1931nr
AMD Ryzen 9 9955HX3D, NVIDIA GeForce RTX 5070 Laptop
133.2 (6.74min, 83.3P1) fps
MSI Crosshair A16 HX E8WGK
AMD Ryzen 9 8940HX, NVIDIA GeForce RTX 5070 Laptop
129.7 (6.57min, 83.3P1) fps -3%
Lenovo Legion Pro 5 16IAX10, RTX 5070
Intel Core Ultra 7 255HX, NVIDIA GeForce RTX 5070 Laptop
126 (4.91min, 90.9P1) fps -5%
Medio NVIDIA GeForce RTX 5070 Laptop
  (96 - 133.2, n=25)
116.4 fps -13%
Final Fantasy XV Benchmark
1920x1080 High Quality
NVIDIA KFA2 GeForce RTX 5070 1-Click OC
AMD Ryzen 7 9800X3D, NVIDIA GeForce RTX 5070
206 fps +52%
Lenovo Legion 9 16IRX9, RTX 4090
Intel Core i9-14900HX, NVIDIA GeForce RTX 4090 Laptop GPU
165.1 fps +22%
Alienware 16X Aurora Core Ultra 9 290HX Plus
Intel Core Ultra 9 290HX Plus, NVIDIA GeForce RTX 5070 Ti Laptop
161.1 fps +19%
Schenker XMG APEX 16 MAX
AMD Ryzen 9 9955HX, NVIDIA GeForce RTX 5070 Ti Laptop
158.2 fps +17%
Lenovo Legion Pro 5 16IAX10, RTX 5070
Intel Core Ultra 7 255HX, NVIDIA GeForce RTX 5070 Laptop
144.5 fps +7%
MSI Crosshair A16 HX E8WGK
AMD Ryzen 9 8940HX, NVIDIA GeForce RTX 5070 Laptop
140 fps +4%
HP HyperX Omen 16 16-ap1931nr
AMD Ryzen 9 9955HX3D, NVIDIA GeForce RTX 5070 Laptop
135.2 fps
Medio NVIDIA GeForce RTX 5070 Laptop
  (96 - 150.7, n=27)
133.7 fps -1%
HP Omen 16-ap0091ng
AMD Ryzen 9 8940HX, NVIDIA GeForce RTX 5060 Laptop
111 fps -18%
Alienware m16 R1 Intel
Intel Core i7-13700HX, NVIDIA GeForce RTX 4060 Laptop GPU
104.7 fps -23%
2560x1440 High Quality
NVIDIA KFA2 GeForce RTX 5070 1-Click OC
AMD Ryzen 7 9800X3D, NVIDIA GeForce RTX 5070
162.4 fps +62%
Lenovo Legion 9 16IRX9, RTX 4090
Intel Core i9-14900HX, NVIDIA GeForce RTX 4090 Laptop GPU
142 fps +42%
Schenker XMG APEX 16 MAX
AMD Ryzen 9 9955HX, NVIDIA GeForce RTX 5070 Ti Laptop
121.8 fps +22%
Alienware 16X Aurora Core Ultra 9 290HX Plus
Intel Core Ultra 9 290HX Plus, NVIDIA GeForce RTX 5070 Ti Laptop
120.3 fps +20%
Lenovo Legion Pro 5 16IAX10, RTX 5070
Intel Core Ultra 7 255HX, NVIDIA GeForce RTX 5070 Laptop
106.8 fps +7%
MSI Crosshair A16 HX E8WGK
AMD Ryzen 9 8940HX, NVIDIA GeForce RTX 5070 Laptop
102 fps +2%
HP HyperX Omen 16 16-ap1931nr
AMD Ryzen 9 9955HX3D, NVIDIA GeForce RTX 5070 Laptop
100.2 fps
Medio NVIDIA GeForce RTX 5070 Laptop
  (82.5 - 110, n=26)
99.2 fps -1%
Alienware m16 R1 Intel
Intel Core i7-13700HX, NVIDIA GeForce RTX 4060 Laptop GPU
77.1 fps -23%
X-Plane 11.11 - 1920x1080 high (fps_test=3)
NVIDIA KFA2 GeForce RTX 5070 1-Click OC
AMD Ryzen 7 9800X3D, NVIDIA GeForce RTX 5070
183.9 fps +64%
Aorus Master 16 AM6J
AMD Ryzen 9 9955HX3D, NVIDIA GeForce RTX 5080 Laptop
148.5 fps +33%
Lenovo Legion 9 16IRX9, RTX 4090
Intel Core i9-14900HX, NVIDIA GeForce RTX 4090 Laptop GPU
125.6 fps +12%
Alienware m16 R1 Intel
Intel Core i7-13700HX, NVIDIA GeForce RTX 4060 Laptop GPU
120.4 fps +8%
HP HyperX Omen 16 16-ap1931nr
AMD Ryzen 9 9955HX3D, NVIDIA GeForce RTX 5070 Laptop
111.9 fps
Alienware 16X Aurora Core Ultra 9 290HX Plus
Intel Core Ultra 9 290HX Plus, NVIDIA GeForce RTX 5070 Ti Laptop
110.4 fps -1%
Acer Predator Helios Neo 16S AI PHN16S-71-94L9
Intel Core Ultra 9 275HX, NVIDIA GeForce RTX 5070 Ti Laptop
109.4 fps -2%
Schenker XMG APEX 16 MAX
AMD Ryzen 9 9955HX, NVIDIA GeForce RTX 5070 Ti Laptop
105.6 fps -6%
MSI Crosshair A16 HX E8WGK
AMD Ryzen 9 8940HX, NVIDIA GeForce RTX 5070 Laptop
104.8 fps -6%
Lenovo Legion Pro 5 16IAX10, RTX 5070
Intel Core Ultra 7 255HX, NVIDIA GeForce RTX 5070 Laptop
101.6 fps -9%
Medio NVIDIA GeForce RTX 5070 Laptop
  (73.5 - 116.3, n=29)
94.7 fps -15%
HP Omen 16-ap0091ng
AMD Ryzen 9 8940HX, NVIDIA GeForce RTX 5060 Laptop
93.9 fps -16%
Strange Brigade
1920x1080 ultra AA:ultra AF:16
NVIDIA KFA2 GeForce RTX 5070 1-Click OC
AMD Ryzen 7 9800X3D, NVIDIA GeForce RTX 5070
437 (139min, 310P1) fps +68%
Lenovo Legion 9 16IRX9, RTX 4090
Intel Core i9-14900HX, NVIDIA GeForce RTX 4090 Laptop GPU
369 (5min, 269P1) fps +42%
Schenker XMG APEX 16 MAX
AMD Ryzen 9 9955HX, NVIDIA GeForce RTX 5070 Ti Laptop
340 (59.4min, 243P1) fps +31%
Alienware 16X Aurora Core Ultra 9 290HX Plus
Intel Core Ultra 9 290HX Plus, NVIDIA GeForce RTX 5070 Ti Laptop
314 (155.9min, 229P1) fps +21%
HP HyperX Omen 16 16-ap1931nr
AMD Ryzen 9 9955HX3D, NVIDIA GeForce RTX 5070 Laptop
260 (56.4min, 196P1) fps
MSI Crosshair A16 HX E8WGK
AMD Ryzen 9 8940HX, NVIDIA GeForce RTX 5070 Laptop
258 (159.7min, 195.8P1) fps -1%
Lenovo Legion Pro 5 16IAX10, RTX 5070
Intel Core Ultra 7 255HX, NVIDIA GeForce RTX 5070 Laptop
246 (9min, 185.2P1) fps -5%
Medio NVIDIA GeForce RTX 5070 Laptop
  (203 - 261, n=25)
240 fps -8%
HP Omen 16-ap0091ng
AMD Ryzen 9 8940HX, NVIDIA GeForce RTX 5060 Laptop
217.8 (86.3min, 152.5P1) fps -16%
Alienware m16 R1 Intel
Intel Core i7-13700HX, NVIDIA GeForce RTX 4060 Laptop GPU
190.3 (52.8min, 139.4P1) fps -27%
2560x1440 ultra AA:ultra AF:16
NVIDIA KFA2 GeForce RTX 5070 1-Click OC
AMD Ryzen 7 9800X3D, NVIDIA GeForce RTX 5070
318 (147.4min, 246P1) fps +86%
Lenovo Legion 9 16IRX9, RTX 4090
Intel Core i9-14900HX, NVIDIA GeForce RTX 4090 Laptop GPU
290 (38.6min, 219P1) fps +70%
Schenker XMG APEX 16 MAX
AMD Ryzen 9 9955HX, NVIDIA GeForce RTX 5070 Ti Laptop
236 (150.4min, 187.7P1) fps +38%
Alienware 16X Aurora Core Ultra 9 290HX Plus
Intel Core Ultra 9 290HX Plus, NVIDIA GeForce RTX 5070 Ti Laptop
210 (99.1min, 166.2P1) fps +23%
Lenovo Legion Pro 5 16IAX10, RTX 5070
Intel Core Ultra 7 255HX, NVIDIA GeForce RTX 5070 Laptop
177.4 (31.7min, 147.8P1) fps +4%
HP HyperX Omen 16 16-ap1931nr
AMD Ryzen 9 9955HX3D, NVIDIA GeForce RTX 5070 Laptop
170.6 (115.5min, 139.3P1) fps
MSI Crosshair A16 HX E8WGK
AMD Ryzen 9 8940HX, NVIDIA GeForce RTX 5070 Laptop
170.4 (127.2min, 139P1) fps 0%
Medio NVIDIA GeForce RTX 5070 Laptop
  (137 - 230, n=23)
166.6 fps -2%
HP Omen 16-ap0091ng
AMD Ryzen 9 8940HX, NVIDIA GeForce RTX 5060 Laptop
155.7 fps -9%
Alienware m16 R1 Intel
Intel Core i7-13700HX, NVIDIA GeForce RTX 4060 Laptop GPU
128.5 (88.2min, 103.1P1) fps -25%
Baldur's Gate 3
1920x1080 Ultra Preset AA:T
NVIDIA KFA2 GeForce RTX 5070 1-Click OC
AMD Ryzen 7 9800X3D, NVIDIA GeForce RTX 5070
190.6 (164.5min, 170.2P0.1, 175.4P1) fps +42%
Aorus Master 16 AM6J
AMD Ryzen 9 9955HX3D, NVIDIA GeForce RTX 5080 Laptop
175 (65min) fps +30%
Alienware 16X Aurora Core Ultra 9 290HX Plus
Intel Core Ultra 9 290HX Plus, NVIDIA GeForce RTX 5070 Ti Laptop
159.3 (127.7min, 136P0.1, 144.7P1) fps +18%
Schenker XMG APEX 16 MAX
AMD Ryzen 9 9955HX, NVIDIA GeForce RTX 5070 Ti Laptop
155.6 (107.2min, 130P0.1, 140P1) fps +16%
HP HyperX Omen 16 16-ap1931nr
AMD Ryzen 9 9955HX3D, NVIDIA GeForce RTX 5070 Laptop
134.5 (79.5min, 79.7P0.1, 80P1) fps
MSI Crosshair A16 HX E8WGK
AMD Ryzen 9 8940HX, NVIDIA GeForce RTX 5070 Laptop
133.2 (79.7min, 79.7P0.1, 79.9P1) fps -1%
Lenovo Legion Pro 5 16IAX10, RTX 5070
Intel Core Ultra 7 255HX, NVIDIA GeForce RTX 5070 Laptop
130.6 fps -3%
Acer Predator Helios Neo 16S AI PHN16S-71-94L9
Intel Core Ultra 9 275HX, NVIDIA GeForce RTX 5070 Ti Laptop
122.8 (52.2min, 71.3P0.1, 104.9P1) fps -9%
Medio NVIDIA GeForce RTX 5070 Laptop
  (87.3 - 141.4, n=34)
121.6 fps -10%
HP Omen 16-ap0091ng
AMD Ryzen 9 8940HX, NVIDIA GeForce RTX 5060 Laptop
109.1 fps -19%
2560x1440 Ultra Preset AA:T
NVIDIA KFA2 GeForce RTX 5070 1-Click OC
AMD Ryzen 7 9800X3D, NVIDIA GeForce RTX 5070
138.3 (120.1min, 122.3P0.1, 125.1P1) fps +48%
Aorus Master 16 AM6J
AMD Ryzen 9 9955HX3D, NVIDIA GeForce RTX 5080 Laptop
123 (79min) fps +32%
Schenker XMG APEX 16 MAX
AMD Ryzen 9 9955HX, NVIDIA GeForce RTX 5070 Ti Laptop
110.5 (92.1min, 95.8P0.1, 99P1) fps +18%
Alienware 16X Aurora Core Ultra 9 290HX Plus
Intel Core Ultra 9 290HX Plus, NVIDIA GeForce RTX 5070 Ti Laptop
109.5 (15.7min, 54.3P0.1, 93.4P1) fps +17%
HP HyperX Omen 16 16-ap1931nr
AMD Ryzen 9 9955HX3D, NVIDIA GeForce RTX 5070 Laptop
93.4 (60min, 72.2P0.1, 79.6P1) fps
MSI Crosshair A16 HX E8WGK
AMD Ryzen 9 8940HX, NVIDIA GeForce RTX 5070 Laptop
90.3 (60min, 60P0.1, 79.6P1) fps -3%
Lenovo Legion Pro 5 16IAX10, RTX 5070
Intel Core Ultra 7 255HX, NVIDIA GeForce RTX 5070 Laptop
90 fps -4%
Medio NVIDIA GeForce RTX 5070 Laptop
  (61 - 96.4, n=31)
83.9 fps -10%
HP Omen 16-ap0091ng
AMD Ryzen 9 8940HX, NVIDIA GeForce RTX 5060 Laptop
75.5 fps -19%
2560x1440 Ultra Preset + Quality DLSS
Alienware 16X Aurora Core Ultra 9 290HX Plus
Intel Core Ultra 9 290HX Plus, NVIDIA GeForce RTX 5070 Ti Laptop
157.7 (17.7min, 106.2P0.1, 144.9P1) fps +16%
HP HyperX Omen 16 16-ap1931nr
AMD Ryzen 9 9955HX3D, NVIDIA GeForce RTX 5070 Laptop
136.3 (79.7min, 79.8P0.1, 80P1) fps
Lenovo Legion Pro 5 16IAX10, RTX 5070
Intel Core Ultra 7 255HX, NVIDIA GeForce RTX 5070 Laptop
135.8 fps 0%
MSI Crosshair A16 HX E8WGK
AMD Ryzen 9 8940HX, NVIDIA GeForce RTX 5070 Laptop
129.6 (79.7min, 79.7P0.1, 79.9P1) fps -5%
Medio NVIDIA GeForce RTX 5070 Laptop
  (97.7 - 140, n=10)
127.5 fps -6%
HP Omen 16-ap0091ng
AMD Ryzen 9 8940HX, NVIDIA GeForce RTX 5060 Laptop
114.3 fps -16%
Cyberpunk 2077
1920x1080 High Preset (FSR off)
NVIDIA KFA2 GeForce RTX 5070 1-Click OC
AMD Ryzen 7 9800X3D, NVIDIA GeForce RTX 5070
187.6 (156.6min) fps +52%
Aorus Master 16 AM6J
AMD Ryzen 9 9955HX3D, NVIDIA GeForce RTX 5080 Laptop
169.3 (139min) fps +37%
Schenker XMG APEX 16 MAX
AMD Ryzen 9 9955HX, NVIDIA GeForce RTX 5070 Ti Laptop
140.6 (116.9min) fps +14%
Alienware 16X Aurora Core Ultra 9 290HX Plus
Intel Core Ultra 9 290HX Plus, NVIDIA GeForce RTX 5070 Ti Laptop
126.1 (103min, 95.3P1) fps +2%
MSI Crosshair A16 HX E8WGK
AMD Ryzen 9 8940HX, NVIDIA GeForce RTX 5070 Laptop
124.8 (103.1min, 96.5P1) fps +1%
HP HyperX Omen 16 16-ap1931nr
AMD Ryzen 9 9955HX3D, NVIDIA GeForce RTX 5070 Laptop
123.7 (103.3min, 97.1P1) fps
Lenovo Legion Pro 5 16IAX10, RTX 5070
Intel Core Ultra 7 255HX, NVIDIA GeForce RTX 5070 Laptop
122 (103.1min) fps -1%
Acer Predator Helios Neo 16S AI PHN16S-71-94L9
Intel Core Ultra 9 275HX, NVIDIA GeForce RTX 5070 Ti Laptop
112 (94min) fps -9%
Medio NVIDIA GeForce RTX 5070 Laptop
  (84.5 - 124.8, n=27)
111.1 fps -10%
HP Omen 16-ap0091ng
AMD Ryzen 9 8940HX, NVIDIA GeForce RTX 5060 Laptop
95.3 fps -23%
1920x1080 Ultra Preset (FSR off)
NVIDIA KFA2 GeForce RTX 5070 1-Click OC
AMD Ryzen 7 9800X3D, NVIDIA GeForce RTX 5070
170.3 (140.8min) fps +57%
Aorus Master 16 AM6J
AMD Ryzen 9 9955HX3D, NVIDIA GeForce RTX 5080 Laptop
144.5 (116min) fps +33%
Schenker XMG APEX 16 MAX
AMD Ryzen 9 9955HX, NVIDIA GeForce RTX 5070 Ti Laptop
128 (103min) fps +18%
Lenovo Legion 9 16IRX9, RTX 4090
Intel Core i9-14900HX, NVIDIA GeForce RTX 4090 Laptop GPU
127 (70.6min) fps +17%
Alienware 16X Aurora Core Ultra 9 290HX Plus
Intel Core Ultra 9 290HX Plus, NVIDIA GeForce RTX 5070 Ti Laptop
114.9 (92.5min, 83.6P1) fps +6%
MSI Crosshair A16 HX E8WGK
AMD Ryzen 9 8940HX, NVIDIA GeForce RTX 5070 Laptop
112.1 (90.9min, 85.1P1) fps +3%
HP HyperX Omen 16 16-ap1931nr
AMD Ryzen 9 9955HX3D, NVIDIA GeForce RTX 5070 Laptop
108.8 (88.3min, 83.2P1) fps
Lenovo Legion Pro 5 16IAX10, RTX 5070
Intel Core Ultra 7 255HX, NVIDIA GeForce RTX 5070 Laptop
107 (88.7min) fps -2%
Acer Predator Helios Neo 16S AI PHN16S-71-94L9
Intel Core Ultra 9 275HX, NVIDIA GeForce RTX 5070 Ti Laptop
100.8 (80min) fps -7%
Medio NVIDIA GeForce RTX 5070 Laptop
  (81.5 - 112.1, n=34)
99.4 fps -9%
HP Omen 16-ap0091ng
AMD Ryzen 9 8940HX, NVIDIA GeForce RTX 5060 Laptop
86.6 (59min) fps -20%
1920x1080 Ray Tracing Ultra Preset (DLSS off)
NVIDIA KFA2 GeForce RTX 5070 1-Click OC
AMD Ryzen 7 9800X3D, NVIDIA GeForce RTX 5070
75 (65.9min) fps +56%
Alienware 16X Aurora Core Ultra 9 290HX Plus
Intel Core Ultra 9 290HX Plus, NVIDIA GeForce RTX 5070 Ti Laptop
52.5 (45min, 42.4P1) fps +9%
MSI Crosshair A16 HX E8WGK
AMD Ryzen 9 8940HX, NVIDIA GeForce RTX 5070 Laptop
48.5 (42.4min, 40.5P1) fps +1%
HP HyperX Omen 16 16-ap1931nr
AMD Ryzen 9 9955HX3D, NVIDIA GeForce RTX 5070 Laptop
48 (41.9min, 40P1) fps
Medio NVIDIA GeForce RTX 5070 Laptop
  (35.3 - 48.5, n=7)
44.6 fps -7%
2560x1440 Ultra Preset (FSR off)
NVIDIA KFA2 GeForce RTX 5070 1-Click OC
AMD Ryzen 7 9800X3D, NVIDIA GeForce RTX 5070
111.8 (94.3min) fps +63%
Aorus Master 16 AM6J
AMD Ryzen 9 9955HX3D, NVIDIA GeForce RTX 5080 Laptop
99.8 (84min) fps +46%
Lenovo Legion 9 16IRX9, RTX 4090
Intel Core i9-14900HX, NVIDIA GeForce RTX 4090 Laptop GPU
86 (70.4min) fps +26%
Schenker XMG APEX 16 MAX
AMD Ryzen 9 9955HX, NVIDIA GeForce RTX 5070 Ti Laptop
82.9 (69.5min) fps +21%
Alienware 16X Aurora Core Ultra 9 290HX Plus
Intel Core Ultra 9 290HX Plus, NVIDIA GeForce RTX 5070 Ti Laptop
75.1 (61.7min, 58.1P1) fps +10%
MSI Crosshair A16 HX E8WGK
AMD Ryzen 9 8940HX, NVIDIA GeForce RTX 5070 Laptop
68.8 (58.4min, 56.1P1) fps +1%
HP HyperX Omen 16 16-ap1931nr
AMD Ryzen 9 9955HX3D, NVIDIA GeForce RTX 5070 Laptop
68.4 (58min, 55.5P1) fps
Lenovo Legion Pro 5 16IAX10, RTX 5070
Intel Core Ultra 7 255HX, NVIDIA GeForce RTX 5070 Laptop
68.3 (58.1min) fps 0%
Medio NVIDIA GeForce RTX 5070 Laptop
  (51.9 - 68.8, n=31)
63.3 fps -7%
HP Omen 16-ap0091ng
AMD Ryzen 9 8940HX, NVIDIA GeForce RTX 5060 Laptop
56.1 fps -18%
2560x1440 Ultra Preset DLSS4 quality no FG
NVIDIA KFA2 GeForce RTX 5070 1-Click OC
AMD Ryzen 7 9800X3D, NVIDIA GeForce RTX 5070
128.7 (111.7min) fps +61%
Schenker XMG APEX 16 MAX
AMD Ryzen 9 9955HX, NVIDIA GeForce RTX 5070 Ti Laptop
96.1 (82.8min) fps +20%
Alienware 16X Aurora Core Ultra 9 290HX Plus
Intel Core Ultra 9 290HX Plus, NVIDIA GeForce RTX 5070 Ti Laptop
86.9 (74.9min, 70.5P1) fps +9%
MSI Crosshair A16 HX E8WGK
AMD Ryzen 9 8940HX, NVIDIA GeForce RTX 5070 Laptop
81.9 (71.5min, 67.2P1) fps +3%
Lenovo Legion Pro 5 16IAX10, RTX 5070
Intel Core Ultra 7 255HX, NVIDIA GeForce RTX 5070 Laptop
80.7 (70.5min) fps +1%
HP HyperX Omen 16 16-ap1931nr
AMD Ryzen 9 9955HX3D, NVIDIA GeForce RTX 5070 Laptop
79.9 (69.7min, 66.3P1) fps
Medio NVIDIA GeForce RTX 5070 Laptop
  (61.4 - 81.9, n=18)
74.3 fps -7%
HP Omen 16-ap0091ng
AMD Ryzen 9 8940HX, NVIDIA GeForce RTX 5060 Laptop
65.2 fps -18%
F1 24
1920x1080 Ultra High Preset AA:T AF:16x
NVIDIA KFA2 GeForce RTX 5070 1-Click OC
AMD Ryzen 7 9800X3D, NVIDIA GeForce RTX 5070
138.2 (96min, 107P1) fps +56%
Lenovo Legion 9 16IRX9, RTX 4090
Intel Core i9-14900HX, NVIDIA GeForce RTX 4090 Laptop GPU
113.6 (14min, 69P1) fps +28%
Schenker XMG APEX 16 MAX
AMD Ryzen 9 9955HX, NVIDIA GeForce RTX 5070 Ti Laptop
110.6 (70min, 84P1) fps +25%
Alienware 16X Aurora Core Ultra 9 290HX Plus
Intel Core Ultra 9 290HX Plus, NVIDIA GeForce RTX 5070 Ti Laptop
97.7 (64min, 74P1) fps +10%
MSI Crosshair A16 HX E8WGK
AMD Ryzen 9 8940HX, NVIDIA GeForce RTX 5070 Laptop
94.7 (68min, 75P1) fps +7%
HP HyperX Omen 16 16-ap1931nr
AMD Ryzen 9 9955HX3D, NVIDIA GeForce RTX 5070 Laptop
88.6 (68min, 70P1) fps
Medio NVIDIA GeForce RTX 5070 Laptop
  (63.8 - 94.7, n=19)
83.5 fps -6%
2560x1440 Ultra High Preset AA:T AF:16x
NVIDIA KFA2 GeForce RTX 5070 1-Click OC
AMD Ryzen 7 9800X3D, NVIDIA GeForce RTX 5070
88.3 (71min, 72P1) fps +58%
Lenovo Legion 9 16IRX9, RTX 4090
Intel Core i9-14900HX, NVIDIA GeForce RTX 4090 Laptop GPU
72.1 (2min, 56P1) fps +29%
Schenker XMG APEX 16 MAX
AMD Ryzen 9 9955HX, NVIDIA GeForce RTX 5070 Ti Laptop
72 (58min, 58P1) fps +29%
Alienware 16X Aurora Core Ultra 9 290HX Plus
Intel Core Ultra 9 290HX Plus, NVIDIA GeForce RTX 5070 Ti Laptop
62.8 (49min, 50P1) fps +12%
MSI Crosshair A16 HX E8WGK
AMD Ryzen 9 8940HX, NVIDIA GeForce RTX 5070 Laptop
59.3 (47min, 47P1) fps +6%
HP HyperX Omen 16 16-ap1931nr
AMD Ryzen 9 9955HX3D, NVIDIA GeForce RTX 5070 Laptop
56 (45min, 44P1) fps
Medio NVIDIA GeForce RTX 5070 Laptop
  (40.3 - 59.3, n=19)
52.3 fps -7%
2560x1440 Ultra High Preset + Quality DLSS AF:16x
NVIDIA KFA2 GeForce RTX 5070 1-Click OC
AMD Ryzen 7 9800X3D, NVIDIA GeForce RTX 5070
138.7 (103min, 109P1) fps +61%
Schenker XMG APEX 16 MAX
AMD Ryzen 9 9955HX, NVIDIA GeForce RTX 5070 Ti Laptop
112.4 (67min, 80P1) fps +31%
Alienware 16X Aurora Core Ultra 9 290HX Plus
Intel Core Ultra 9 290HX Plus, NVIDIA GeForce RTX 5070 Ti Laptop
99 (58min, 72P1) fps +15%
MSI Crosshair A16 HX E8WGK
AMD Ryzen 9 8940HX, NVIDIA GeForce RTX 5070 Laptop
93.1 (65min, 71P1) fps +8%
HP HyperX Omen 16 16-ap1931nr
AMD Ryzen 9 9955HX3D, NVIDIA GeForce RTX 5070 Laptop
86.1 (66min, 65P1) fps
Medio NVIDIA GeForce RTX 5070 Laptop
  (62.9 - 93.1, n=16)
80.9 fps -6%

Gráfico de FPS en modo «Ultra» de Cyberpunk 2077

05101520253035404550556065707580859095100105110Tooltip
HP HyperX Omen 16 16-ap1931nr R9 9955HX3D, GeForce RTX 5070 Laptop: Ø110.6 (102.1-113.7) fps
HP Omen 16-ap0091ng R9 8940HX, GeForce RTX 5060 Laptop: Ø78.2 (74.1-78.9) fps
bajomedioaltoultraQHD DLSSQHD
GTA V (2015) 188.1 187.9 188 171.5 133.2
Dota 2 Reborn (2015) 260 225 214 200
Final Fantasy XV Benchmark (2018) 229 182.2 135.2 100.2
X-Plane 11.11 (2018) 157.6 144 111.9
Strange Brigade (2018) 593 376 301 260 170.6
Valorant (2020) 641.5 397.2
Baldur's Gate 3 (2023) 134.5 136.3 93.4
Cyberpunk 2077 (2023) 177.6 148.7 123.7 108.8 79.9 68.4
F1 24 (2024) 383 327 250 88.6 86.1 56
Black Myth: Wukong (2024) 60 36 38 26

Emisiones

Ruido del sistema

El ruido del ventilador tiende a aumentar con frecuencia y de forma notable en los modos «Performance» o «Unleashed», incluso al navegar por Internet o reproducir vídeos en streaming. Por lo tanto, recomendamos utilizar el modo «Balanced» o un modo inferior cuando no se esté jugando.

El ruido del ventilador tiene un promedio de 43,4 dB(A), 49,7 dB(A) y 54,7 dB(A) al jugar en los modos «Equilibrado», «Rendimiento» y «Sin límites», respectivamente. 
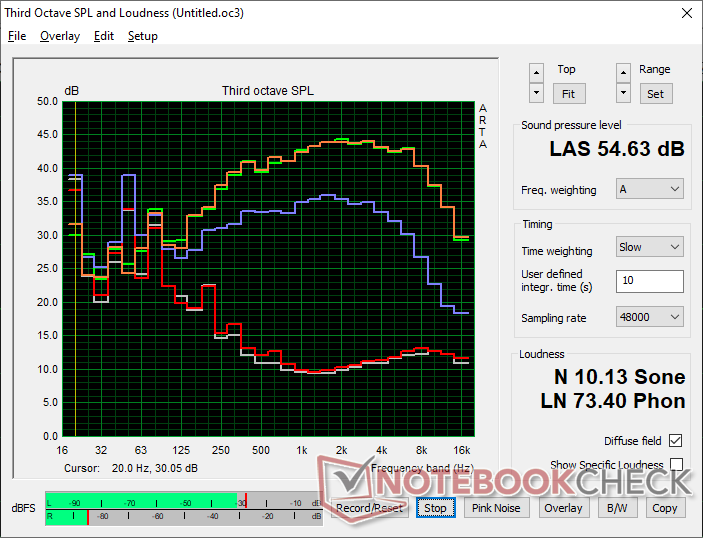
Perfil de ruido del ventilador (Blanco: fondo; Rojo: sistema inactivo; Azul: 3DMark 06; Naranja: Cyberpunk 2077; Verde: estrés con Prime95 + FurMark)

Ruido

Ocioso
24.2 / 24.2 / 25.3 dB(A)
Carga
45.7 / 54.7 dB(A)
  red to green bar
 
 
30 dB
silencioso
40 dB(A)
audible
50 dB(A)
ruidosamente alto
 
min: dark, med: mid, max: light   Earthworks M23R, Arta (15 cm de distancia)   ruido ambiental: 23.8 dB(A)
dB(A) 0102030405060708090Deep BassMiddle BassHigh BassLower RangeMidsHigher MidsLower HighsMid HighsUpper HighsSuper Highs2031.63936.838.430.1252426.72423.927.23123.725.3212023.44028.228.927.325.927.95024.43933.933.825.76328.13023.624.227.68033.233.13131.533.910028.527.922.422.429.212528.126.619.92129.21603327.819.118.832.820034.130.722.422.633.925037.53115.314.636.931539.431.716.7153940040.933.613.11241.150039.733.412.110.939.463041.633.612.710.840.88004133.310.79.841100042.434.99.89.542.7125043.235.49.59.443.3160043.935.99.99.443.9200043.935.410.39.844.4250043.834.610.510.343.631504434.911.210.943.9400043.133.411.410.943500042.532.111.811.642.4630042.930.212.712.142.9800040.326.713.212.340.41000037.422.712.812.637.41250034.219.412.212.334.21600029.718.411.710.829.2SPL54.745.724.223.754.6N10.25.40.60.510.1median 40.9median 32.1median 12.2median 11.6median 40.8Delta4.93.62.32.24.9hearing rangehide median Fan NoiseHP HyperX Omen 16 16-ap1931nr
HP HyperX Omen 16 16-ap1931nr
R9 9955HX3D, GeForce RTX 5070 Laptop
HP Omen 16-ap0091ng
R9 8940HX, GeForce RTX 5060 Laptop
MSI Crosshair A16 HX E8WGK
R9 8940HX, GeForce RTX 5070 Laptop
Alienware 16X Aurora Core Ultra 9 290HX Plus
Ultra 9 290HX Plus, GeForce RTX 5070 Ti Laptop
Lenovo Legion Pro 5 16IAX10, RTX 5070
Ultra 7 255HX, GeForce RTX 5070 Laptop
Asus TUF Gaming A16 FA608UP
R7 260, GeForce RTX 5070 Laptop
Noise
1%
-8%
-4%
5%
-12%
apagado / medio ambiente * (dB)
23.8
23
3%
23.4
2%
23.4
2%
23
3%
25.1
-5%
Idle Minimum * (dB)
24.2
23
5%
29.1
-20%
23.8
2%
23
5%
32.2
-33%
Idle Average * (dB)
24.2
23
5%
29.1
-20%
23.8
2%
23
5%
32.2
-33%
Idle Maximum * (dB)
25.3
27.64
-9%
29.1
-15%
31.4
-24%
23
9%
32.2
-27%
Load Average * (dB)
45.7
49.5
-8%
41.7
9%
48.7
-7%
43.85
4%
38.1
17%
Cyberpunk 2077 ultra * (dB)
54.7
49.5
10%
58.7
-7%
51.5
6%
50.27
8%
53.9
1%
Load Maximum * (dB)
54.7
52.73
4%
59
-8%
59.8
-9%
52.9
3%
57.1
-4%

* ... más pequeño es mejor

Temperatura
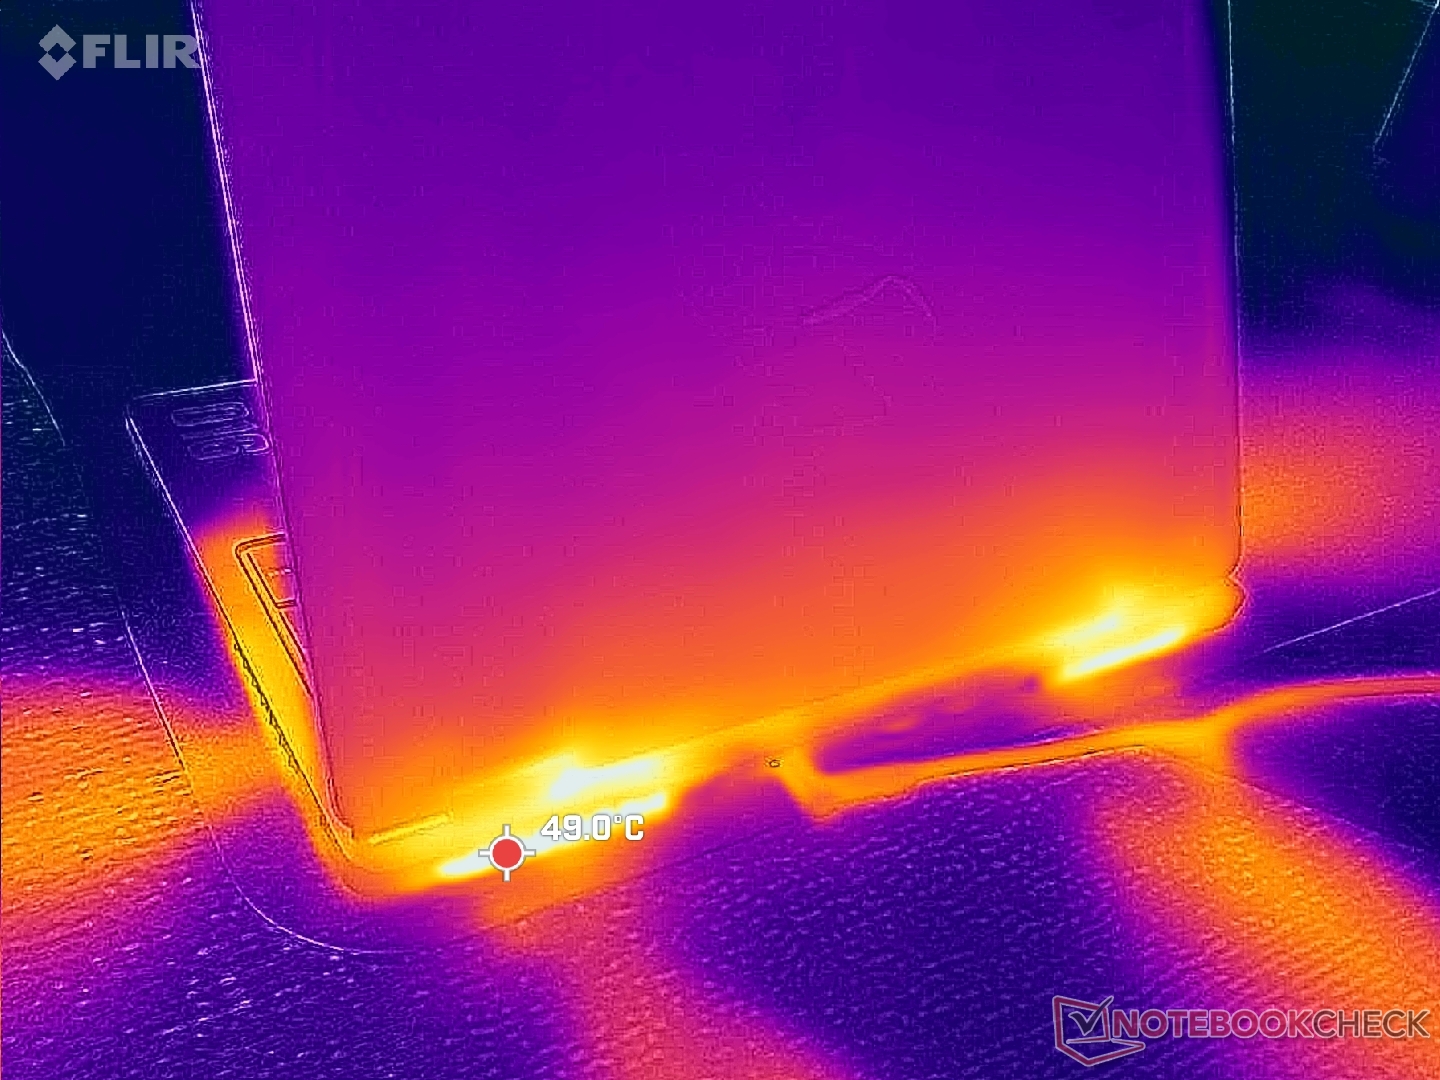
Cuatro conjuntos de salidas de escape a lo largo de la parte trasera y los laterales
El adaptador de CA alcanza más de 47 °C cuando se somete a cargas exigentes.
 39 °C39.4 °C36.8 °C 
 39 °C38.8 °C40.2 °C 
 27.8 °C29.2 °C27.8 °C 
Máximo: 40.2 °C
Médio: 35.3 °C
43 °C41 °C42.4 °C
37.4 °C39.4 °C39.4 °C
27.6 °C28.2 °C29 °C
Máximo: 43 °C
Médio: 36.4 °C
Conector de corriente  52 °C | Temperatura del cuarto 23 °C | Fluke 62 Mini IR Thermometer
(±) La temperatura media de la parte superior bajo carga máxima es de 35.3 °C / 96 F, en comparación con la media de 33.9 °C / 93 F de los dispositivos de la clase Gaming.
(±) La temperatura máxima en la parte superior es de 40.2 °C / 104 F, frente a la media de 40.4 °C / 105 F, que oscila entre 21.2 y 68.8 °C para la clase Gaming.
(±) El fondo se calienta hasta un máximo de 43 °C / 109 F, frente a la media de 43.2 °C / 110 F
(+) En reposo, la temperatura media de la parte superior es de 27.1 °C / 81# F, frente a la media del dispositivo de 33.9 °C / 93 F.
(+) 3: The average temperature for the upper side is 31.8 °C / 89 F, compared to the average of 33.9 °C / 93 F for the class Gaming.
(+) El reposamanos y el panel táctil están a una temperatura inferior a la de la piel, con un máximo de 29.2 °C / 84.6 F y, por tanto, son fríos al tacto.
(±) La temperatura media de la zona del reposamanos de dispositivos similares fue de 28.8 °C / 83.8 F (-0.4 °C / -0.8 F).
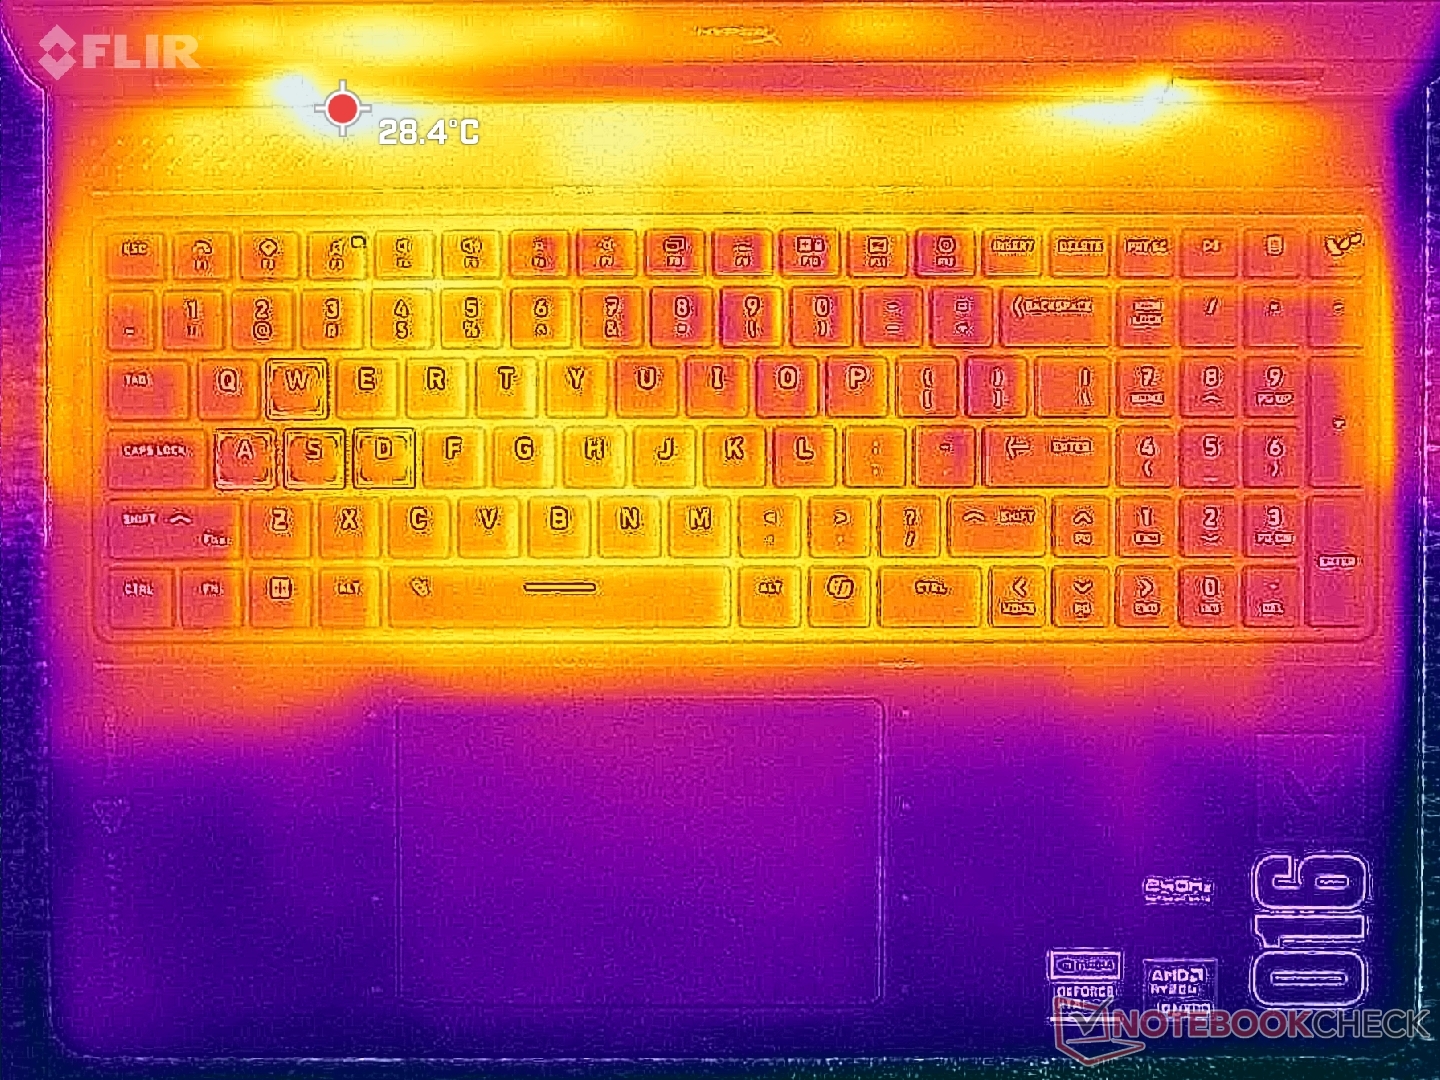
Sistema inactivo (portada C)
Sistema inactivo (tapa D)
El estrés de Cyberpunk 2077 (portada C)
Cyberpunk 2077: estrés (portada D)
Prueba de estrés con Prime95 y FurMark (nivel C)
Prueba de estrés con Prime95+FurMark (nivel D)
HP HyperX Omen 16 16-ap1931nr
R9 9955HX3D, GeForce RTX 5070 Laptop
HP Omen 16-ap0091ng
R9 8940HX, GeForce RTX 5060 Laptop
MSI Crosshair A16 HX E8WGK
R9 8940HX, GeForce RTX 5070 Laptop
Alienware 16X Aurora Core Ultra 9 290HX Plus
Ultra 9 290HX Plus, GeForce RTX 5070 Ti Laptop
Lenovo Legion Pro 5 16IAX10, RTX 5070
Ultra 7 255HX, GeForce RTX 5070 Laptop
Asus TUF Gaming A16 FA608UP
R7 260, GeForce RTX 5070 Laptop
Heat
7%
-9%
3%
-5%
9%
Maximum Upper Side * (°C)
40.2
36
10%
41.8
-4%
48.2
-20%
42
-4%
39.5
2%
Maximum Bottom * (°C)
43
37
14%
50.6
-18%
41
5%
44
-2%
45.1
-5%
Idle Upper Side * (°C)
30
30
-0%
30.8
-3%
28.2
6%
33
-10%
25.7
14%
Idle Bottom * (°C)
33
32
3%
36
-9%
26.2
21%
34
-3%
25.5
23%

* ... más pequeño es mejor

Prueba de estrés

La CPU alcanzaba los 4,1 GHz y los 118 W al ejecutar la prueba de estrés Prime95, antes de descender ligeramente a 3,8 GHz, 105 W y 76 °C poco después. El TGP alcanzaba una media de 93 W, 111 W y 111 W al ejecutar Cyberpunk 2077 en los modos «Equilibrado», «Rendimiento» y «Sin límites», respectivamente, lo que significa que los ventiladores más silenciosos del modo «Equilibrado» conllevan ligeras pérdidas de rendimiento al jugar.
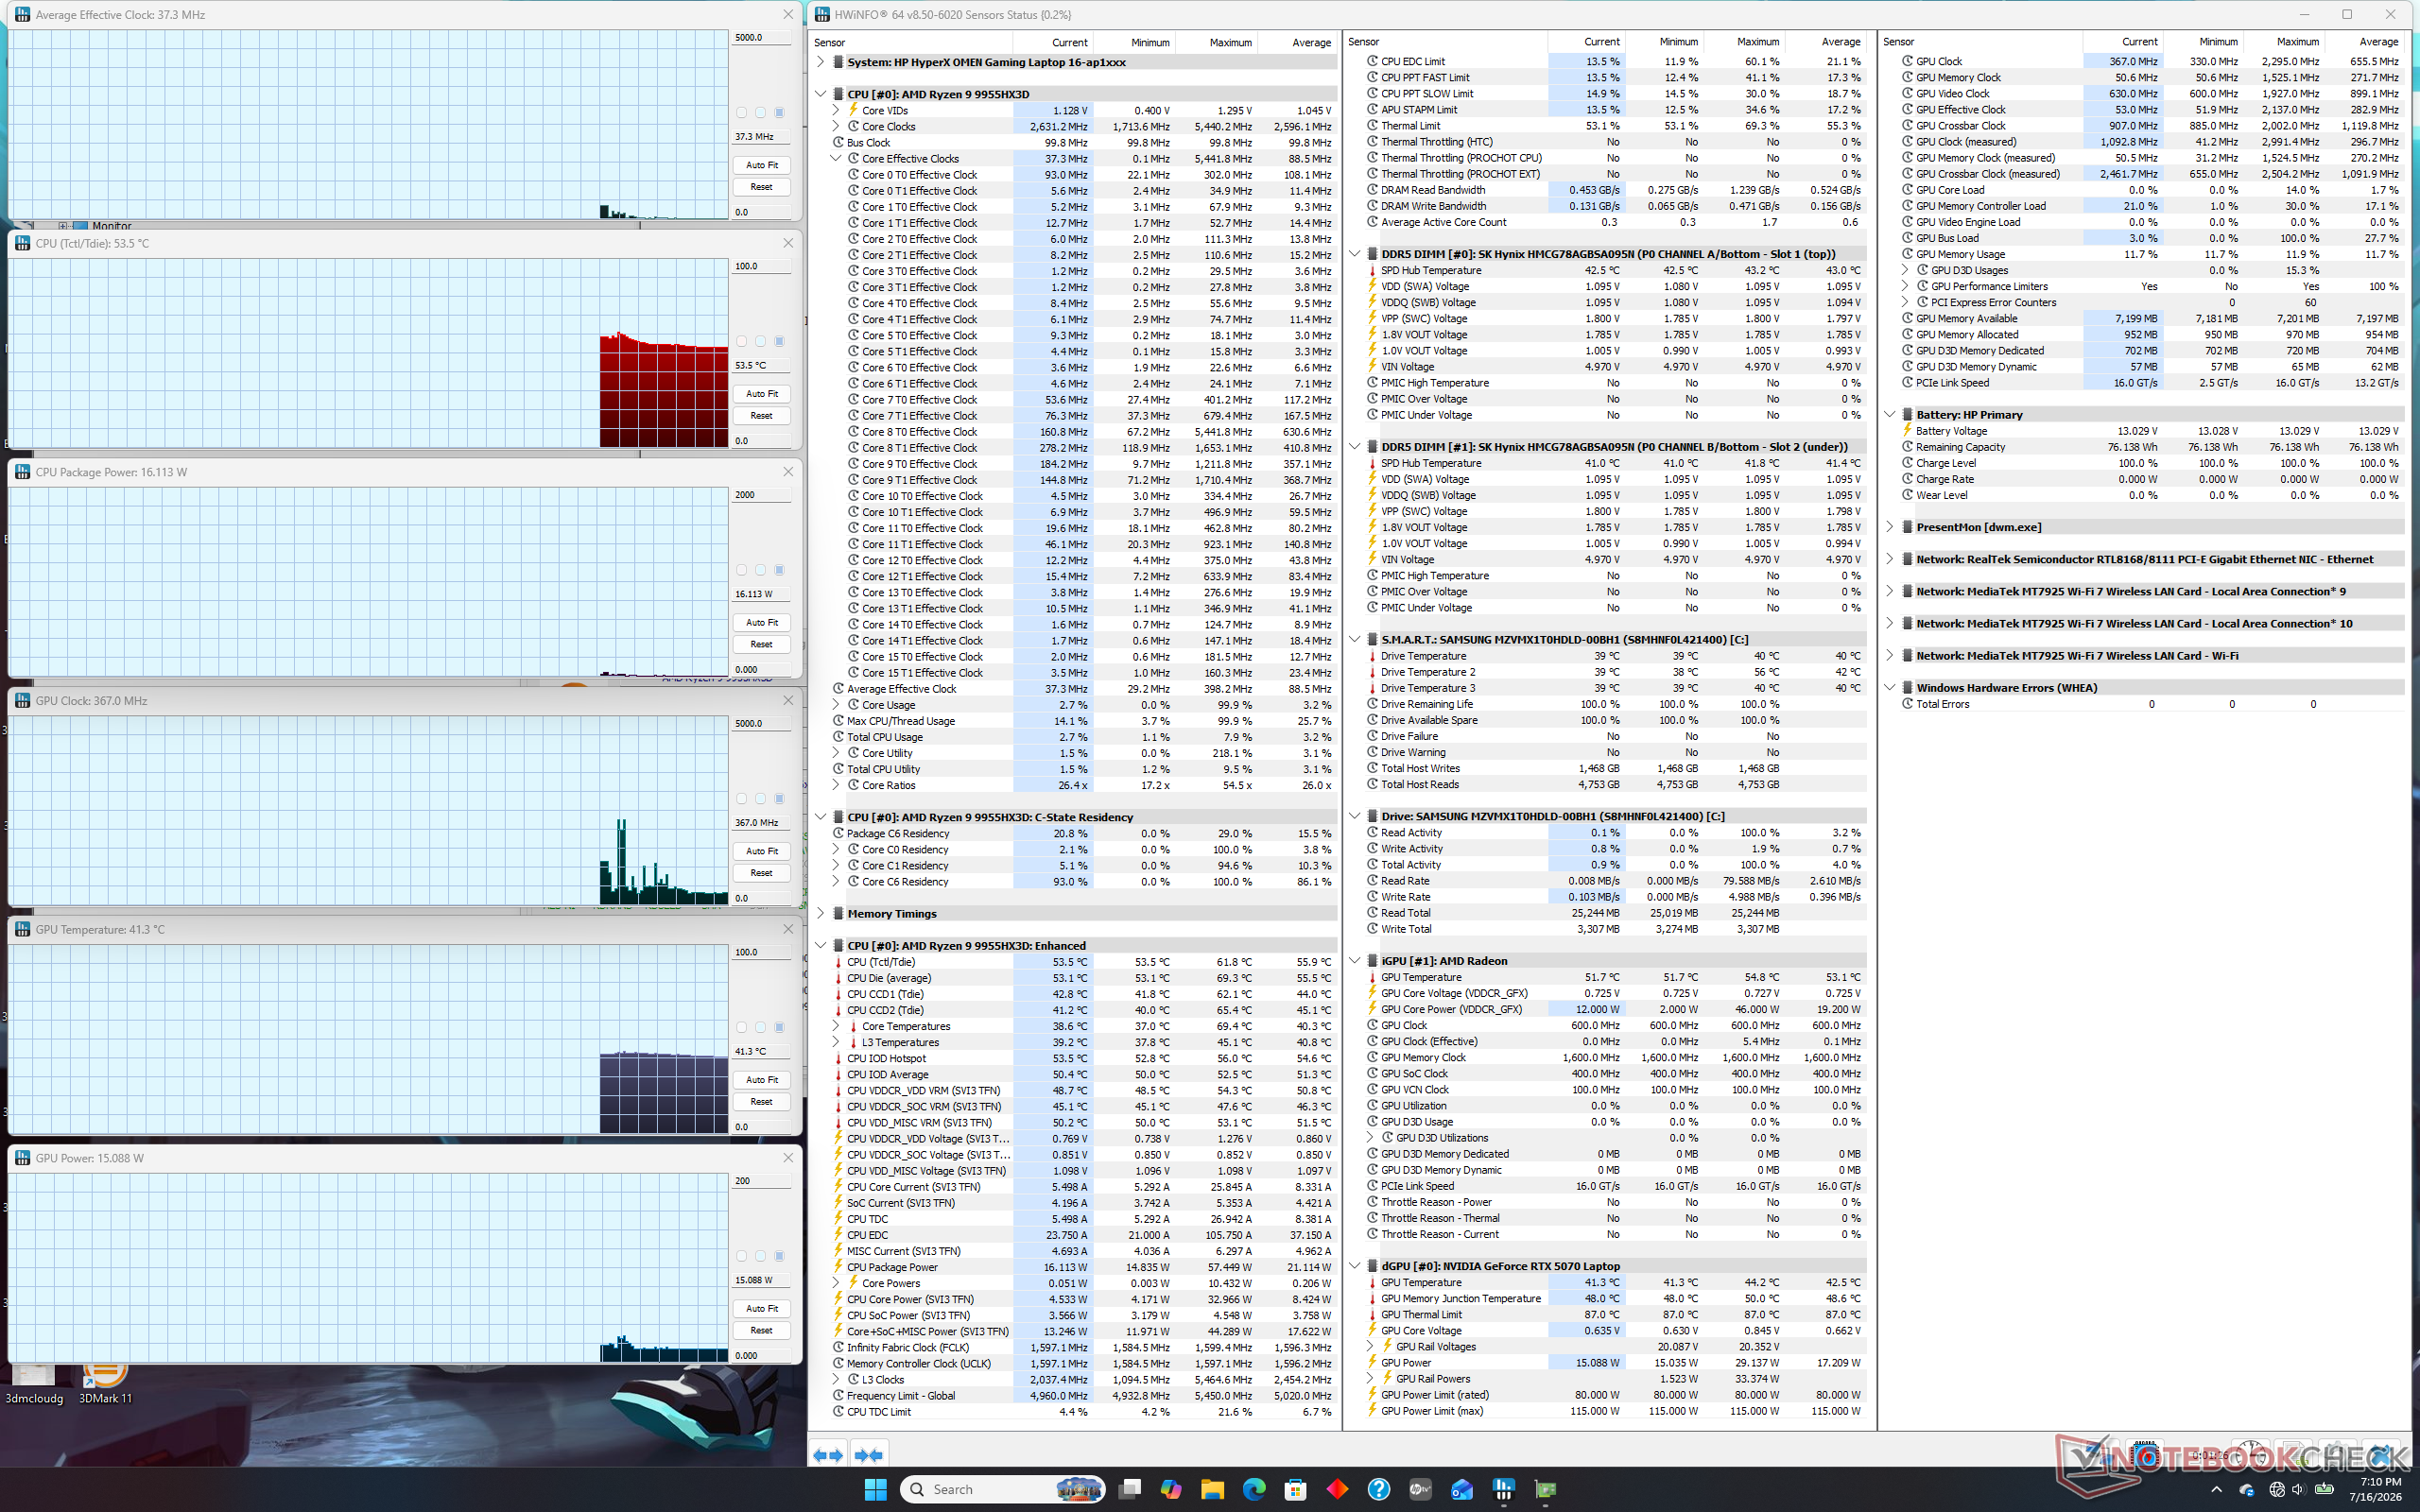
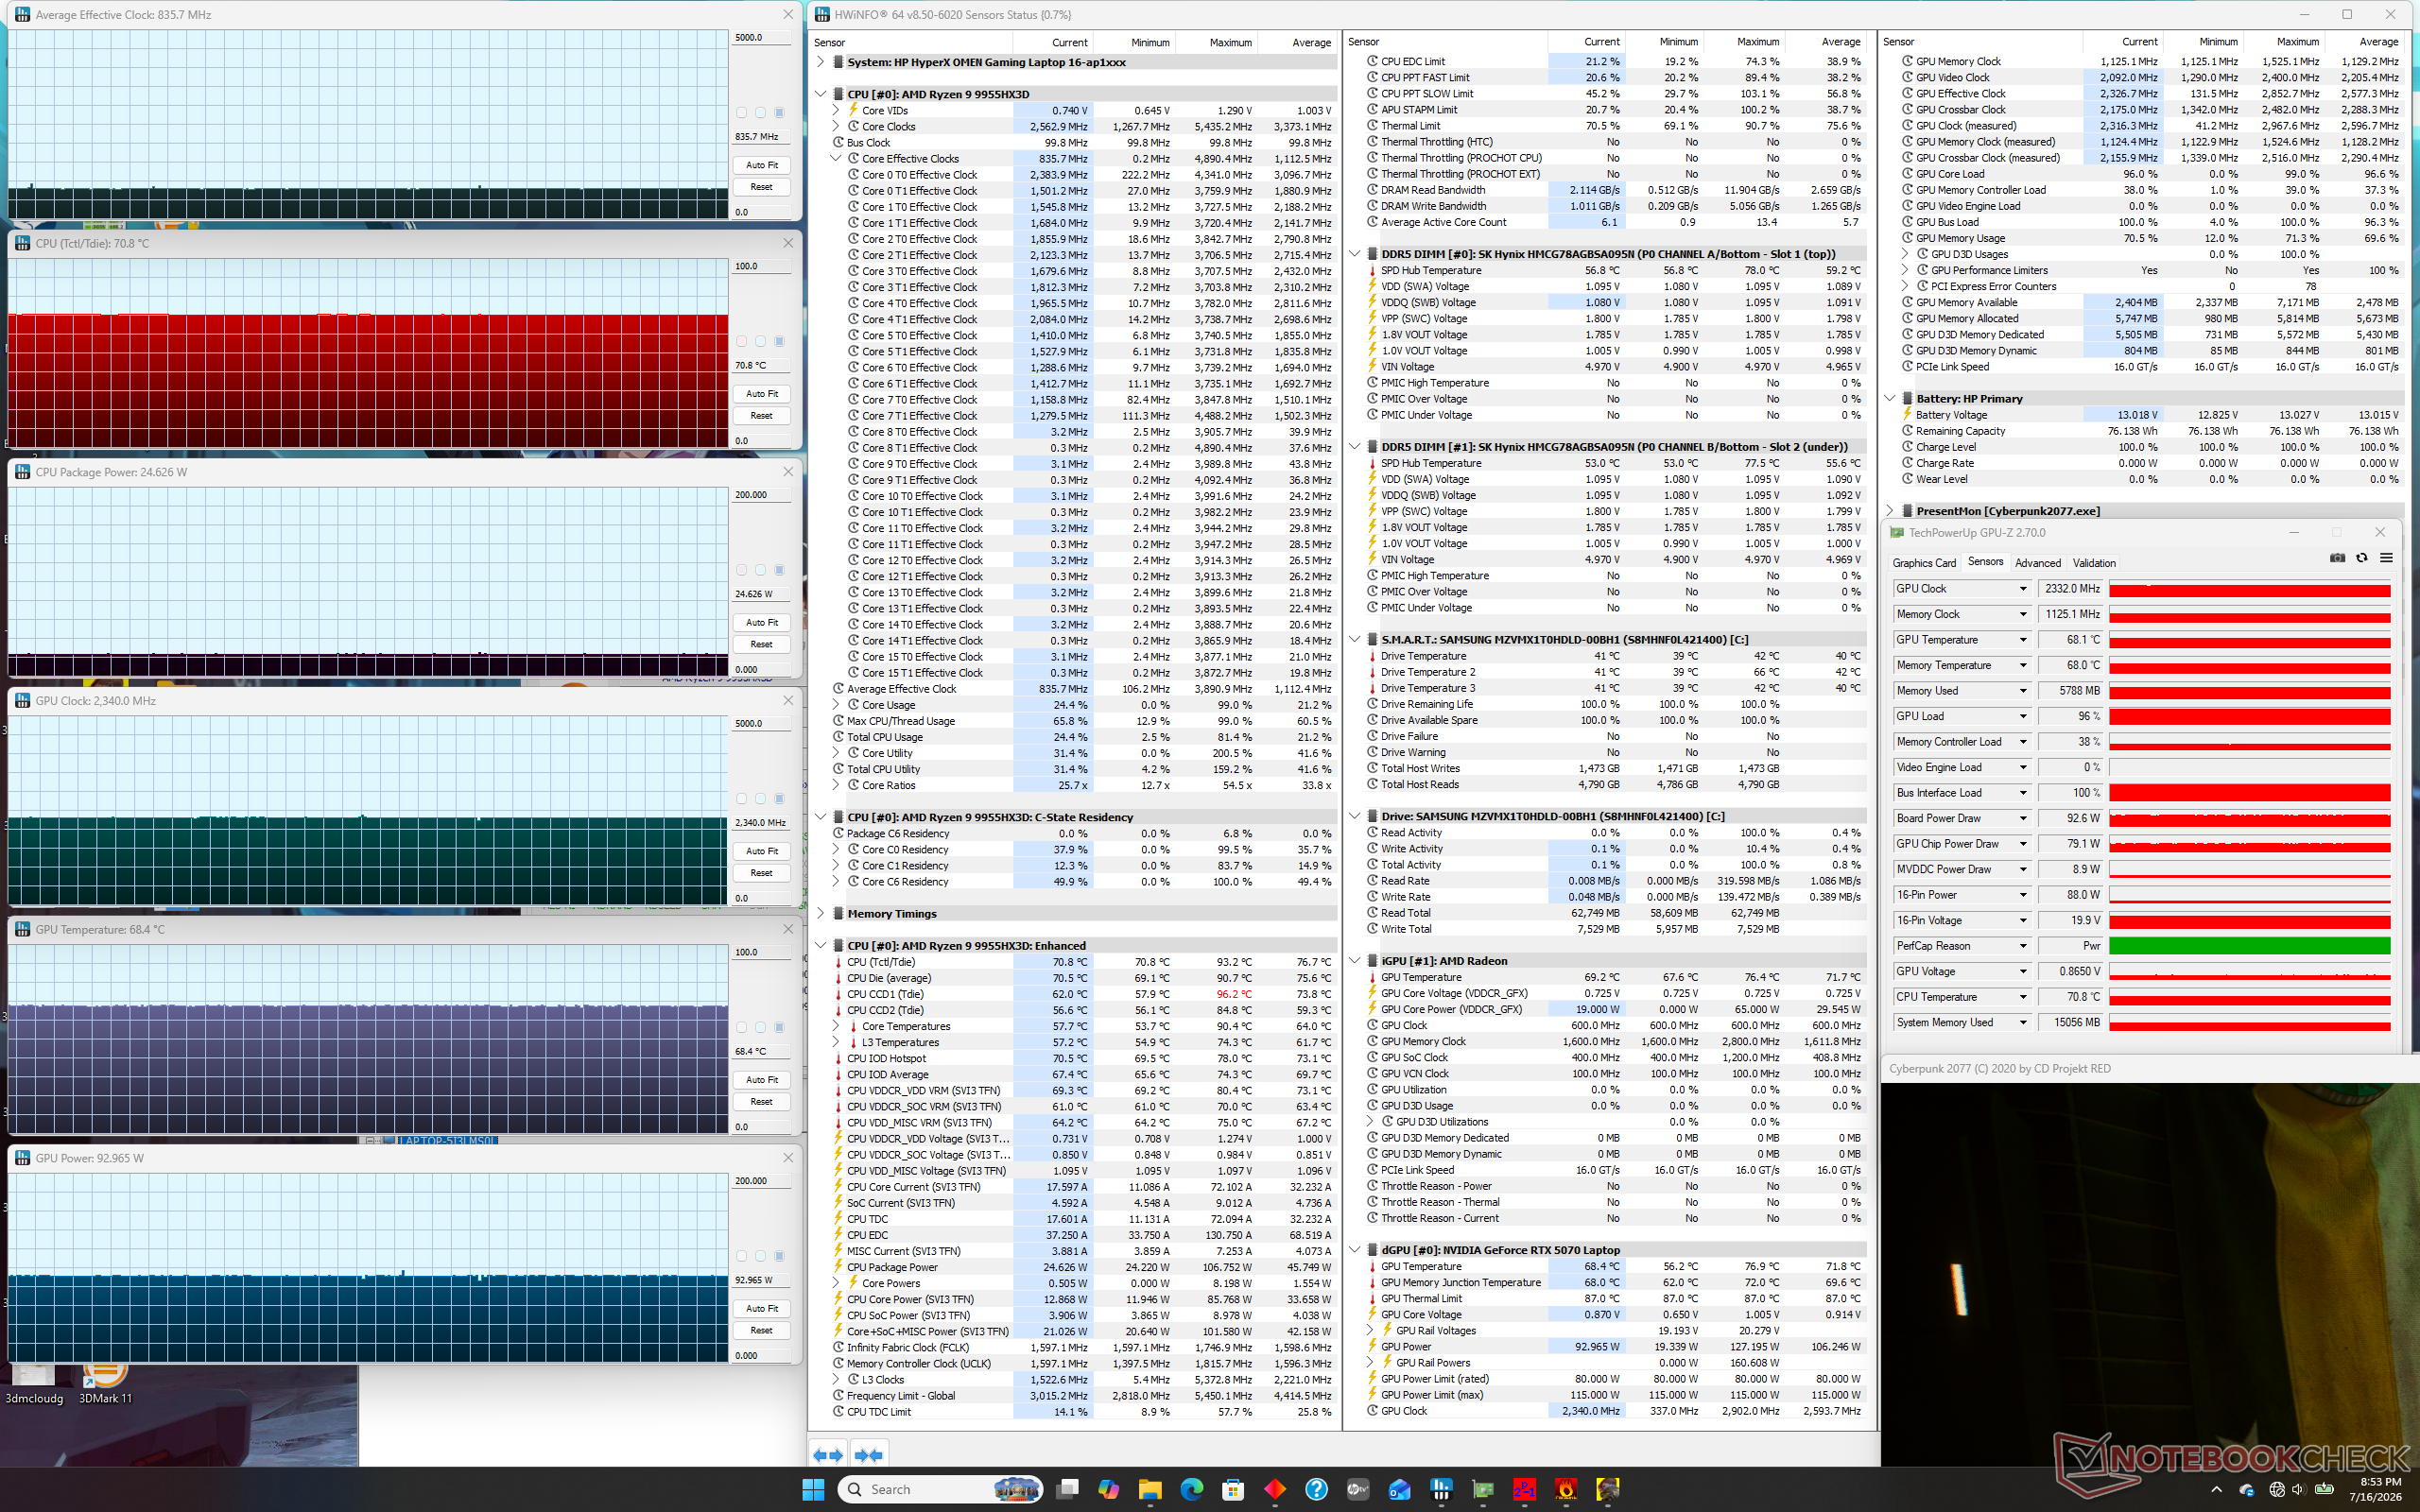
Sistema inactivo
Sistema inactivo
Cyberpunk 2077 (modo equilibrado)
Prueba de estrés con Prime95
Cyberpunk 2077 (modo de rendimiento)
Prueba de estrés con Prime95 y FurMark
Cyberpunk 2077 (modo Unleashed)
Frecuencia de la CPU (GHz) Frecuencia de la GPU (MHz) Temperatura media de la CPU (°C) Temperatura media de la GPU (°C) Sistema en reposo
--
367
54
41
Prueba de estrés
con Prime95
Prueba de estrés
con Prime95 + FurMark
3,3
2250
81
79
Prueba de estrés con Cyberpunk 2077 (modo equilibrado)
0,8
2340
71
68
Cyberpunk 2077: Prueba de estrés (modo Rendimiento)
1,2
2685
75
72
Cyberpunk 2077: Prueba de estrés (modo Desatado)
1,2
2455
89
74

Ponentes

El ruido rosa presenta un volumen máximo relativamente bajo, de 78 dB(A), ya que la mayoría de los portátiles multimedia de 16 pulgadas registran un promedio ligeramente superior a los 80 dB(A)
dB(A) 0102030405060708090Deep BassMiddle BassHigh BassLower RangeMidsHigher MidsLower HighsMid HighsUpper HighsSuper Highs2036.832.1252424.9312121.54027.3275033.924.96323.624.5803131.310022.428.612519.936.916019.146.620022.454.825015.359.731516.762.540013.165.950012.163.663012.766.780010.771.810009.870.312509.567.716009.968.2200010.368.4250010.563.8315011.264.6400011.466.3500011.863.7630012.762.3800013.263.31000012.8671250012.266.21600011.761.9SPL24.278.9N0.646.3median 12.2median 63.8Delta2.35.726.325.821.422.12624.925.127.622.532.523.448.72655.818.860.922.167.2267019.372.317.674.217.774.319.575.31571.711.871.311.27410.574.21072.710.17210.67210.97511.374.811.671.71269.71269.612.371.112.669.61270.111.269.824.784.70.666.6median 12median 71.73.42.2hearing rangehide median Pink NoiseHP HyperX Omen 16 16-ap1931nrApple MacBook Pro 16 2021 M1 Pro
Diagrama de frecuencia en comparación (¡las casillas de verificación se pueden marcar y desmarcar!)
HP HyperX Omen 16 16-ap1931nr análisis de audio

(±) | la sonoridad del altavoz es media pero buena (78.9 dB)
Graves 100 - 315 Hz
(-) | casi sin bajos - de media 15.6% inferior a la mediana
(±) | la linealidad de los graves es media (11.8% delta a frecuencia anterior)
Medios 400 - 2000 Hz
(+) | medios equilibrados - a sólo 4.1% de la mediana
(+) | los medios son lineales (4.5% delta a la frecuencia anterior)
Altos 2 - 16 kHz
(+) | máximos equilibrados - a sólo 1.2% de la mediana
(+) | los máximos son lineales (4.4% delta a la frecuencia anterior)
Total 100 - 16.000 Hz
(+) | el sonido global es lineal (13.3% de diferencia con la mediana)
En comparación con la misma clase
» 19% de todos los dispositivos probados de esta clase eran mejores, 5% similares, 76% peores
» El mejor tuvo un delta de 6%, la media fue 18%, el peor fue ###max##%
En comparación con todos los dispositivos probados
» 14% de todos los dispositivos probados eran mejores, 3% similares, 83% peores
» El mejor tuvo un delta de 4%, la media fue 23%, el peor fue ###max##%

Apple MacBook Pro 16 2021 M1 Pro análisis de audio

(+) | los altavoces pueden reproducir a un volumen relativamente alto (#84.7 dB)
Graves 100 - 315 Hz
(+) | buen bajo - sólo 3.8% lejos de la mediana
(+) | el bajo es lineal (5.2% delta a la frecuencia anterior)
Medios 400 - 2000 Hz
(+) | medios equilibrados - a sólo 1.3% de la mediana
(+) | los medios son lineales (2.1% delta a la frecuencia anterior)
Altos 2 - 16 kHz
(+) | máximos equilibrados - a sólo 1.9% de la mediana
(+) | los máximos son lineales (2.7% delta a la frecuencia anterior)
Total 100 - 16.000 Hz
(+) | el sonido global es lineal (4.6% de diferencia con la mediana)
En comparación con la misma clase
» 0% de todos los dispositivos probados de esta clase eran mejores, 0% similares, 100% peores
» El mejor tuvo un delta de 5%, la media fue 17%, el peor fue ###max##%
En comparación con todos los dispositivos probados
» 0% de todos los dispositivos probados eran mejores, 0% similares, 100% peores
» El mejor tuvo un delta de 4%, la media fue 23%, el peor fue ###max##%

Gestión energética

Consumo energético

El consumo total es muy elevado, en gran parte debido a la CPU Ryzen 9 9955HX3D. La ejecución de Prime95, por ejemplo, ya requeriría 180 W, una cifra superior a la de la mayoría de los demás portátiles para videojuegos en condiciones similares. Por lo tanto, no es de extrañar la duración relativamente corta de la batería que se menciona en la siguiente sección.
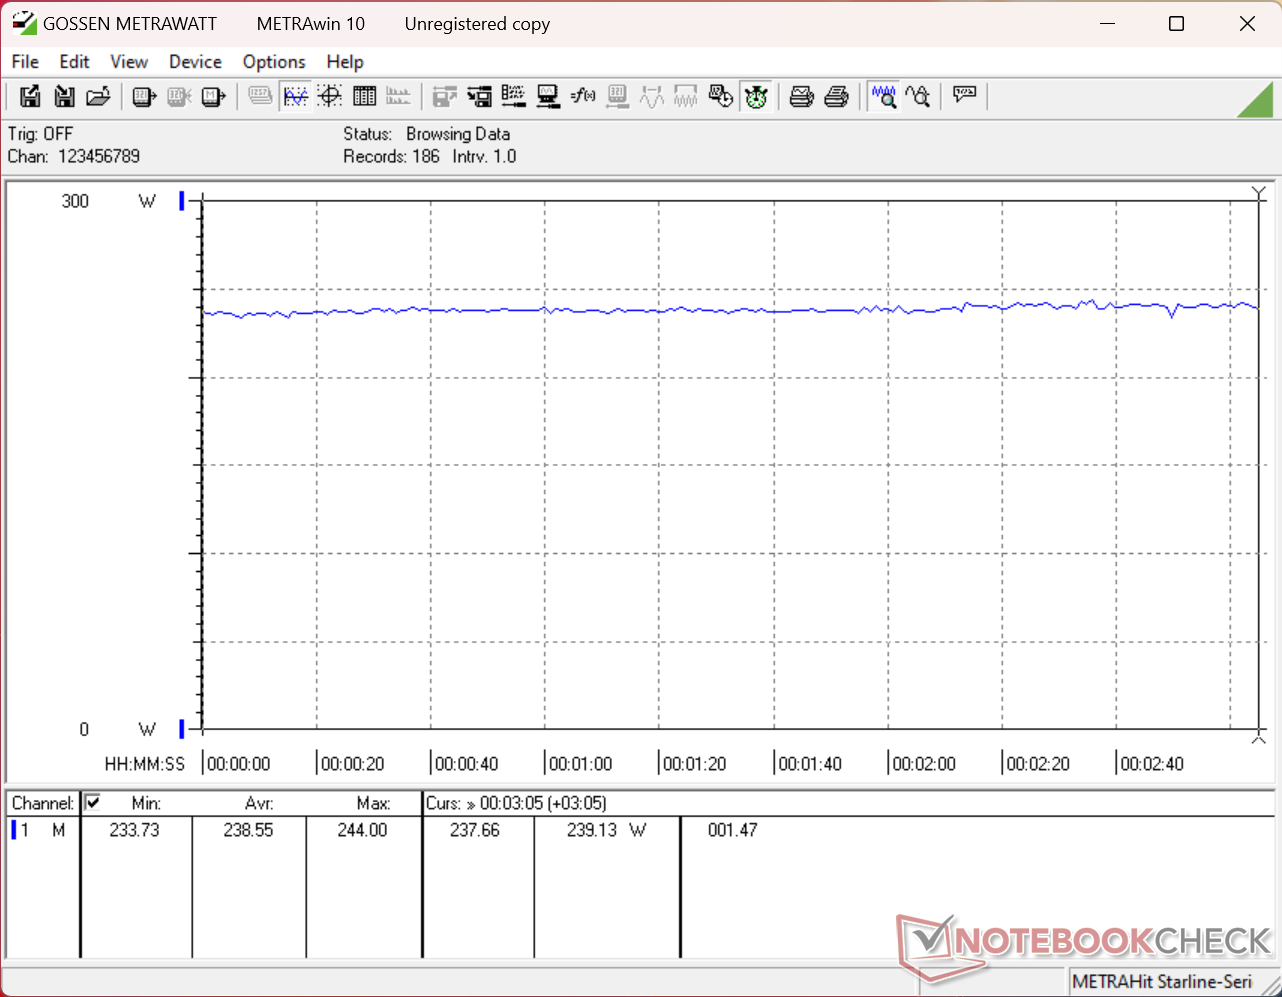
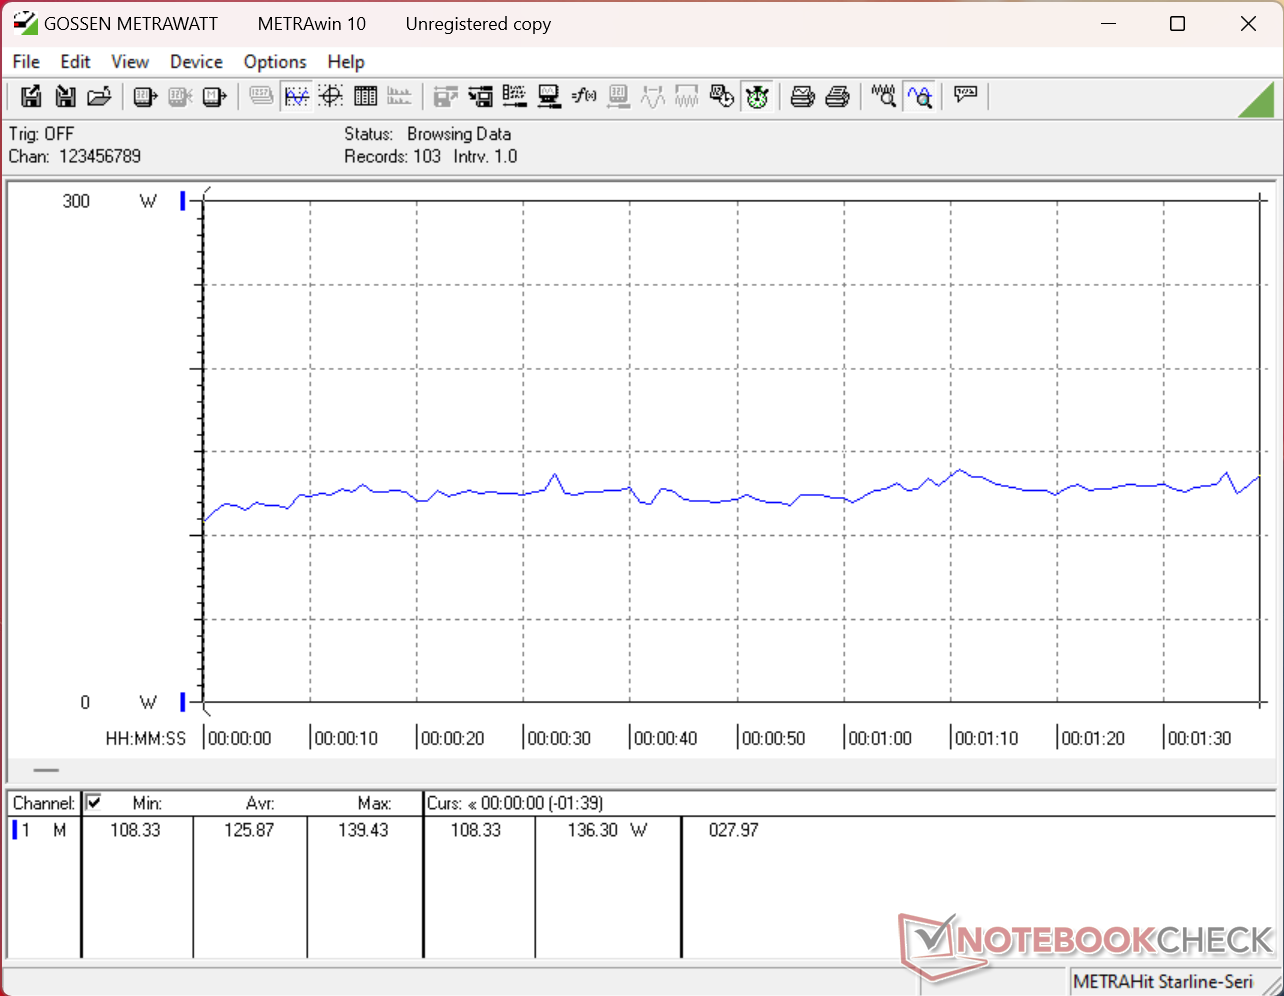
Consumo de «Cyberpunk 2077» en 1080p Ultra
Consumo de 3DMark06
Consumo de 3DMark06
El consumo se dispararía hasta los 198 W al iniciar la prueba de estrés de Prime95, para luego descender rápidamente hasta los 181 W.
La prueba de estrés con Prime95+FurMark se inició en el segundo 10. El sistema consume hasta 260 W del adaptador de CA de 280 W, de tamaño relativamente grande (~18 x 9 x 2,5 cm).
Consumo de corriente
Off / Standbydarklight 0.02 / 0.3 Watt
Ociosodarkmidlight 10.7 / 15.4 / 44.1 Watt
Carga midlight 125.9 / 269.2 Watt
 color bar
Clave: min: dark, med: mid, max: light        Metrahit Energy
HP HyperX Omen 16 16-ap1931nr
R9 9955HX3D, GeForce RTX 5070 Laptop, , IPS, 2560x1600, 16"
HP Omen 16-ap0091ng
R9 8940HX, GeForce RTX 5060 Laptop, Samsung PM9C1b MZVL81T0HFLB-00BH1, IPS, 1920x1200, 16"
MSI Crosshair A16 HX E8WGK
R9 8940HX, GeForce RTX 5070 Laptop, Micron 2500 1TB MTFDKBA1T0QGN, IPS, 2560x1600, 16"
Alienware 16X Aurora Core Ultra 9 290HX Plus
Ultra 9 290HX Plus, GeForce RTX 5070 Ti Laptop, , OLED, 2560x1600, 16"
Lenovo Legion Pro 5 16IAX10, RTX 5070
Ultra 7 255HX, GeForce RTX 5070 Laptop, SK Hynix HFS001TEJ9X115N, OLED, 2650x1600, 16"
Asus TUF Gaming A16 FA608UP
R7 260, GeForce RTX 5070 Laptop, Western Digital PC SN5000S SDEQNSJ-1T00, IPS, 2560x1600, 16"
Power Consumption
28%
-4%
20%
16%
37%
Idle Minimum * (Watt)
10.7
7.8
27%
12.3
-15%
6.9
36%
10.6
1%
4.6
57%
Idle Average * (Watt)
15.4
8.8
43%
17.1
-11%
8.1
47%
12.3
20%
9.8
36%
Idle Maximum * (Watt)
44.1
21.5
51%
42.4
4%
31
30%
18.6
58%
10.2
77%
Load Average * (Watt)
125.9
119
5%
130.2
-3%
131.6
-5%
104
17%
76.1
40%
Cyberpunk 2077 ultra external monitor * (Watt)
236
164.5
30%
242
-3%
172.1
27%
227
4%
198.1
16%
Cyberpunk 2077 ultra * (Watt)
239
192
20%
246
-3%
198.3
17%
231
3%
198.9
17%
Load Maximum * (Watt)
269.2
208
23%
264.3
2%
300.1
-11%
248
8%
235.2
13%

* ... más pequeño es mejor

Consumo energético en modo «Cyberpunk» / Prueba de estrés

0102030405060708090100110120130140150160170180190200210220230240250260Tooltip
HP HyperX Omen 16 16-ap1931nr R9 9955HX3D, GeForce RTX 5070 Laptop; 1280x720 Prime95 28.10 and Furmark 1.25: Ø258 (248-269) Watt
Lenovo Pro 9 16IPH11 Ultra 9 386H, GeForce RTX 5060 Laptop; 1280x720 Prime95 28.10 and Furmark 1.25: Ø186.7 (163.6-231) Watt
HP HyperX Omen 16 16-ap1931nr R9 9955HX3D, GeForce RTX 5070 Laptop; Idle 150cd/m2: Ø11.4 (9.29-17.2) Watt
Lenovo Pro 9 16IPH11 Ultra 9 386H, GeForce RTX 5060 Laptop; Idle 150cd/m2: Ø15.4 (14.7-17.6) Watt
HP HyperX Omen 16 16-ap1931nr R9 9955HX3D, GeForce RTX 5070 Laptop; Cyberpunk 2077 FHD ultra no FSR 150cd: Ø239 (234-244) Watt
Lenovo Pro 9 16IPH11 Ultra 9 386H, GeForce RTX 5060 Laptop; Cyberpunk 2077 FHD ultra no FSR 150cd: Ø161.2 (155-171.2) Watt

Consumo energético del monitor externo

05101520253035404550556065707580859095100105110115120125130135140145150155160165170175180185190195200205210215220225230235240245250Tooltip
HP HyperX Omen 16 16-ap1931nr R9 9955HX3D, GeForce RTX 5070 Laptop; Prime95 V2810 Stress (external Monitor): Ø179.6 (174.2-198.2) Watt
HP Omen 16-ap0091ng R9 8940HX, GeForce RTX 5060 Laptop; Prime95 V2810 Stress (external Monitor): Ø94.9 (92.08-120.03) Watt
HP Omen 16-ap0091ng R9 8940HX, GeForce RTX 5060 Laptop; Cinebench R15 Multi (external Monitor): Ø103.5 (94.29-121.45) Watt
HP HyperX Omen 16 16-ap1931nr R9 9955HX3D, GeForce RTX 5070 Laptop; Cinebench R23 Multi (external Monitor): Ø182.5 (172.2-202) Watt
HP Omen 16-ap0091ng R9 8940HX, GeForce RTX 5060 Laptop; Cinebench R23 Multi (external Monitor): Ø95.1 (82.09-122.09) Watt
HP HyperX Omen 16 16-ap1931nr R9 9955HX3D, GeForce RTX 5070 Laptop; 1280x720 FurMark 1.19 GPU Stress Test (external Monitor): Ø156.6 (146.9-164.1) Watt
HP Omen 16-ap0091ng R9 8940HX, GeForce RTX 5060 Laptop; 1280x720 FurMark 1.19 GPU Stress Test (external Monitor): Ø161.3 (147.46-176.63) Watt
HP HyperX Omen 16 16-ap1931nr R9 9955HX3D, GeForce RTX 5070 Laptop; Idle 1min (external Monitor): Ø10.7 (8.18-16.7) Watt
HP Omen 16-ap0091ng R9 8940HX, GeForce RTX 5060 Laptop; Idle 1min (external Monitor): Ø26.4 (17.347-34.44) Watt
HP HyperX Omen 16 16-ap1931nr R9 9955HX3D, GeForce RTX 5070 Laptop; Cyberpunk 2077 FHD ultra no FSR (external Monitor): Ø236 (223-250) Watt
HP Omen 16-ap0091ng R9 8940HX, GeForce RTX 5060 Laptop; Cyberpunk 2077 FHD ultra no FSR (external Monitor): Ø164.5 (161.25-168.08) Watt

Duración de la batería

Tiempo de Ejecución de la Batería
WiFi Websurfing
3h 54min
HP HyperX Omen 16 16-ap1931nr
R9 9955HX3D, GeForce RTX 5070 Laptop, 83 Wh
HP Omen 16-ap0091ng
R9 8940HX, GeForce RTX 5060 Laptop, 70 Wh
MSI Crosshair A16 HX E8WGK
R9 8940HX, GeForce RTX 5070 Laptop, 80 Wh
Alienware 16X Aurora Core Ultra 9 290HX Plus
Ultra 9 290HX Plus, GeForce RTX 5070 Ti Laptop, 96 Wh
Lenovo Legion Pro 5 16IAX10, RTX 5070
Ultra 7 255HX, GeForce RTX 5070 Laptop, 80 Wh
Asus TUF Gaming A16 FA608UP
R7 260, GeForce RTX 5070 Laptop, 90 Wh
Duración de Batería
28%
41%
90%
59%
233%
WiFi v1.3 (h)
3.9
5
28%
5.5
41%
7.4
90%
6.2
59%
13
233%
H.264 (h)
5.1
6.1
Load (h)
1.3
1.8

Valoración de Notebookcheck

El HyperX Omen 16 presenta únicamente cambios externos menores, pero incluye actualizaciones más importantes en la CPU y la pantalla, especialmente en lo que respecta a su potente CPU Ryzen 9 9955HX3D.

HP HyperX Omen 16 16-ap1931nr - 08/21/2026 v8
Allen Ngo

Acabado
86 / 98 → 88%
Teclado
91%
Ratón
88%
Conectividad
62 / 80 → 77%
Peso
60 / 10-68 → 86%
Battería
57 / 95 → 60%
Pantalla
83%
Rendimiento de juegos
92%
Rendimiento de la Aplicación
93%
AI Performance
96%
Temperatura
92 / 95 → 97%
Ruido
70 / 90 → 78%
Audio
74%
Cámara
38 / 75 → 51%
Médio
68%
85%
Gaming - media ponderada
CO2 Emissions
50%
Materials
40%
Packaging
50%
Power Use
88.3%
Repairability
42%
Software Updates
22.3%
Recycle Logo Total Sustainability Score: 48.8%

Comparación con posibles competidores

Imagen
Modelo
Precio
Peso
Altura
Pantalla
1.
84.9%
HP HyperX Omen 16 16-ap1931nr
AMD Ryzen 9 9955HX3D ⎘
NVIDIA GeForce RTX 5070 Laptop ⎘
32 GB Memoría
Amazon:
1. $1,909.00
HP Omen 16 Gaming AI Laptop ...
2. $1,099.99
HP Omen 16 Slim Gaming Lapto...
3. $1,590.89
HP OMEN MAX 16-ak0047nr 16" ...
Precio de catálogo: 2250 USD
2.4 kg30 mm16.00"
2560x1600
189 PPI
IPS
2.
82.5%
HP Omen 16-ap0091ng
HP Omen 16-ap0091ng
AMD Ryzen 9 8940HX ⎘
NVIDIA GeForce RTX 5060 Laptop ⎘
16 GB Memoría, 1000 GB SSD
Amazon: Precio de catálogo: 1500 Euro2.4 kg23.7 mm16.00"
1920x1200
162 PPI
IPS
3.
82.5%
MSI Crosshair A16 HX E8WGK
AMD Ryzen 9 8940HX ⎘
NVIDIA GeForce RTX 5070 Laptop ⎘
32 GB Memoría, 1024 GB SSD
Amazon: $2,699.00
Precio de catálogo: 2700 USD
2.3 kg25.55 mm16.00"
2560x1600
189 PPI
IPS
4.
86.1%
Alienware 16X Aurora Core Ultra 9 290HX Plus
Intel Core Ultra 9 290HX Plus ⎘
NVIDIA GeForce RTX 5070 Ti Laptop ⎘
32 GB Memoría
Amazon: Precio de catálogo: 3000 USD2.6 kg23.4 mm16.00"
2560x1600
189 PPI
OLED
5.
86.4%
Lenovo Legion Pro 5 16IAX10, RTX 5070
Intel Core Ultra 7 255HX ⎘
NVIDIA GeForce RTX 5070 Laptop ⎘
32 GB Memoría, 1024 GB SSD
Amazon: Precio de catálogo: 1800 Euro2.3 kg25.95 mm16.00"
2650x1600
189 PPI
OLED
6.
83.8%
Asus TUF Gaming A16 FA608UP
AMD Ryzen 7 260 ⎘
NVIDIA GeForce RTX 5070 Laptop ⎘
32 GB Memoría, 1024 GB SSD
Amazon: Precio de catálogo: 2199€2.2 kg25.7 mm16.00"
2560x1600
189 PPI
IPS

Transparencia

La selección de los dispositivos que se van a reseñar corre a cargo de nuestro equipo editorial. La muestra de prueba fue proporcionada al autor en calidad de préstamo por el fabricante o el minorista a los efectos de esta reseña. El prestamista no tuvo ninguna influencia en esta reseña, ni el fabricante recibió una copia de la misma antes de su publicación. No había ninguna obligación de publicar esta reseña. Como empresa de medios independiente, Notebookcheck no está sujeta a la autoridad de fabricantes, minoristas o editores.

Así es como prueba Notebookcheck

Cada año, Notebookcheck revisa de forma independiente cientos de portátiles y smartphones utilizando procedimientos estandarizados para asegurar que todos los resultados son comparables. Hemos desarrollado continuamente nuestros métodos de prueba durante unos 20 años y hemos establecido los estándares de la industria en el proceso. En nuestros laboratorios de pruebas, técnicos y editores experimentados utilizan equipos de medición de alta calidad. Estas pruebas implican un proceso de validación en varias fases. Nuestro complejo sistema de clasificación se basa en cientos de mediciones y puntos de referencia bien fundamentados, lo que mantiene la objetividad.
Google LogoAdd as a preferred source on Google
Mail Logo
> Análisis y pruebas de ordenadores portátiles y móviles teléfonos > Análisis > Reseña del HP HyperX Omen 16: una de las CPU de AMD más rápidas para los jugadores habituales
Allen Ngo, 2026-08-22 (Update: 2026-08-22)