Notebookcheck Logo

Intel Core Ultra 9 290HX Plus

Intel Ultra 9 290HX Plus

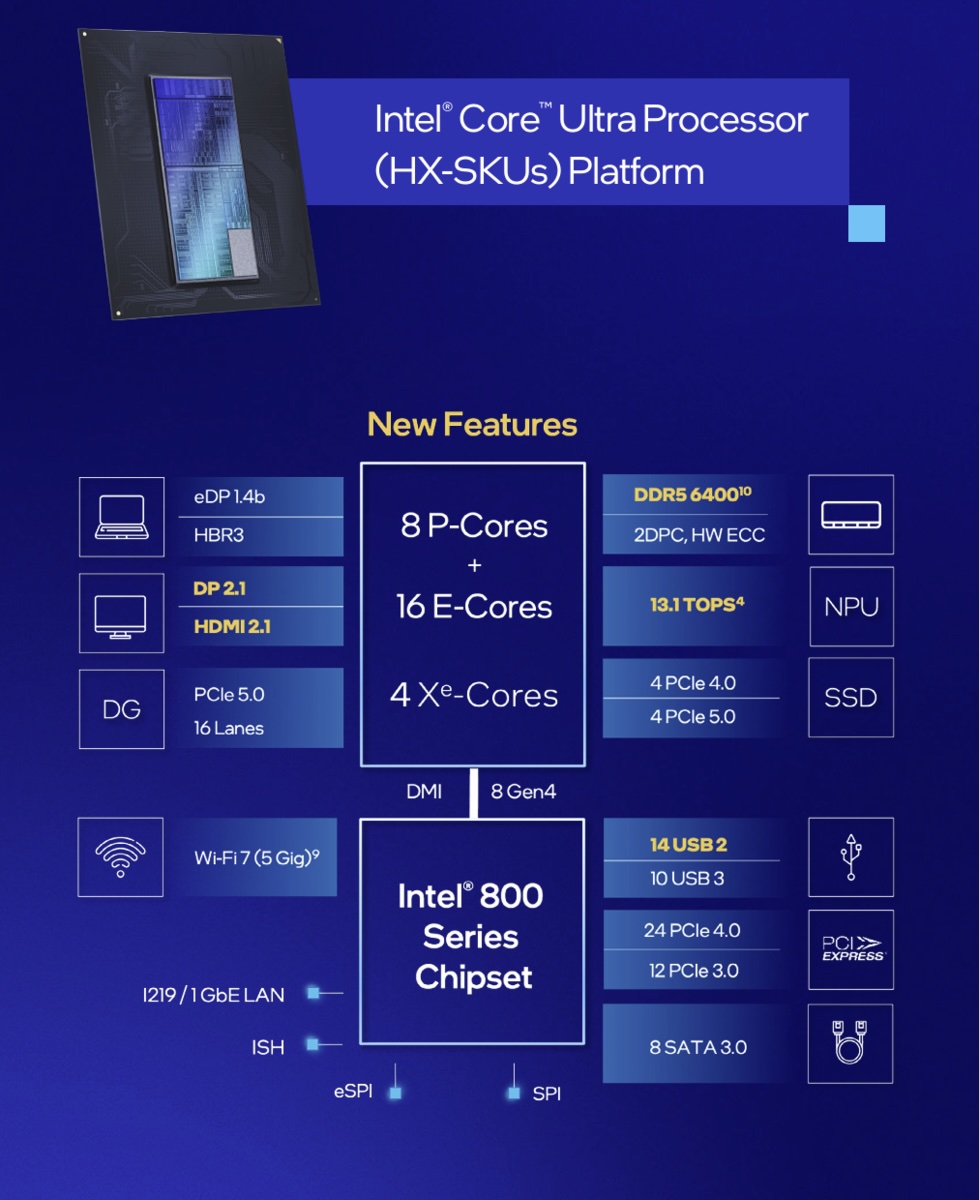
La Intel Core Ultra 9 285HX es una CPU móvil de gama alta para portátiles de juegos basada en la arquitectura Arrow Lake. Ofrece 24 núcleos que constan de 8 núcleos de rendimiento rápido con una velocidad de reloj de hasta 5,5 GHz y 16 núcleos de eficiencia menor con una velocidad de reloj de hasta 4,6 GHz. La CPU tiene acceso a 40 MB de caché L2 y 36 MB de caché L3 y está especificada con un TDP de 55 vatios.

El SoC integra una pequeña NPU dedicada denominada AI Boost con 13 TOPS (Int8) y soporta opcionalmente vPro Enterprise. El controlador de memoria integrado admite hasta 192 GB DDR5-6400 (doble canal, ECC opcional). La GPU integrada (iGPU) es una pequeña tarjeta gráfica Intel Graphics con cuatro núcleos Xe que funcionan a 300 - 2000 MHz.

Rendimiento - Gama alta

El rendimiento del Ultra 9 285HX debería estar ligeramente por debajo del similar Desktop Core Ultra 9 285K (de mayor reloj con hasta 5,7 GHz y más TDP con 125 vatios). Gracias a la mejora del IPC de los núcleos (especialmente de los núcleos de eficiencia), la CPU debería superar al antiguo Raptor Lake Core i9-14900HX (8 + 16 núcleos, máx. 5,8 / 4,1 GHz). Esto hace que la CPU sea ideal para tareas muy exigentes como los juegos de gama alta y la creación de contenidos.

Producción - TSMC y Foveros

Los chips Arrow Lake-HX se basan en los chips Arrow Lake-S de sobremesa y se componen de varios chiplets. La parte de la CPU se fabrica en TSMC en el moderno proceso N3B (3nm), la GPU también procede de TSMC en el proceso N5P. El SoC y la ficha de E/S se fabrican en el proceso N6 de TSMC. La baldosa base está fabricada por Intel en el proceso de 22 nm y lleva los chiplets individuales gracias al empaquetado 3D de Fovero.

Nombre códigoArrow Lake-HX
SerieIntel Arrow Lake

Serie: Arrow Lake Arrow Lake-HX

Intel Core Ultra 9 290HX Plus « 1.8 - 5.5 GHz24 / 24 cores36 MB L3
Intel Core Ultra 9 285HX2.1 - 5.5 GHz24 / 24 cores36 MB L3
Intel Core Ultra 9 275HX2.1 - 5.4 GHz24 / 24 cores36 MB L3
Intel Core Ultra 7 270HX Plus1.8 - 5.3 GHz20 / 20 cores36 MB L3
Intel Core Ultra 7 265HX2.3 - 5.3 GHz20 / 20 cores36 MB L3
Intel Core Ultra 7 255HX2.3 - 5.2 GHz20 / 20 cores36 MB L3
Intel Core Ultra 7 251HX2.5 - 5.1 GHz18 / 18 cores30 MB L3
Intel Core Ultra 5 235HX2.6 - 5.1 GHz14 / 14 cores26 MB L3
Intel Core Ultra 5 245HX2.6 - 5.1 GHz14 / 14 cores26 MB L3
Intel Core 7 245HX2.6 - 5.1 GHz14 / 14 cores26 MB L3
Velocidad de reloj1800 - 5500 MHz
Caché de Nivel 240 MB
Caché de Nivel 336 MB
Número de Núcleos/Subprocesos24 / 24
8 x 5.5 GHz Intel Lion Cove P-Core
16 x 4.7 GHz Intel Skymont E-Core
Consumo de Corriente (TDP = Thermal Design Power)55 Watt
TDP Turbo PL2160 Watt
Tecnología de producción3 nm
GPUIntel Graphics 4-Core iGPU (Meteor / Arrow Lake) (300 - 2000 MHz)
NPU / AI13 TOPS INT8
Chip AI36 TOPS INT8
64 Bitsoporte para 64 Bit
Architecturex86
Fecha de anuncio03/17/2026
Enlace de Producto (externo)www.intel.com

Benchmarks

Performance Rating - CB R15 + R20 + 7-Zip + X265 + Blender + 3DM11 CPU
48.3 pt (81%)
2.26 -95%
...
44.9 -7%
45.5 -6%
46.1 -5%
46.3 -4%
46.3 -4%
46.4 -4%
46.8 -3%
47.5 -2%
48 -1%
Intel Core Ultra 9 290HX Plus
48.3
AMD Ryzen 9 9955HX3D
48.9 1%
AMD Ryzen 9 9955HX
49.1 2%
max:
59.6 23%
0%
100%
Restrict / Search: Model: Max. age: years
Cinebench 2026 - Cinebench 2026 CPU Single Thread
min: 562     de promedio: 565     mediana: 565 (76%)     max: 568 Points
Cinebench 2026 - Cinebench 2026 CPU Multi
min: 7964     de promedio: 8381     mediana: 8381 (82%)     max: 8798 Points
Cinebench 2024 - Cinebench 2024 CPU Single Core
min: 135.9     de promedio: 136.6     mediana: 136.6 (1%)     max: 137.3 Points
Cinebench 2024 - Cinebench 2024 CPU Multi Core
min: 1954     de promedio: 2075     mediana: 2074.5 (39%)     max: 2195 Points
Cinebench R23 - Cinebench R23 Multi Core
min: 37038     de promedio: 38276     mediana: 38276 (36%)     max: 39514 Points
202 -99%
...
30428 -21%
31781 -17%
32782 -14%
33078 -14%
34474 -10%
35061 -8%
35766 -7%
36908 -4%
AMD Ryzen 9 9955HX
37800 -1%
Intel Core Ultra 9 290HX Plus
38276
AMD Ryzen 9 9955HX3D
39065 2%
max:
107681 181%
0%
100%
Restrict / Search: Model: Max. age: years
Cinebench R23 - Cinebench R23 Single Core
min: 2319     de promedio: 2325     mediana: 2324.5 (95%)     max: 2330 Points
74.4 -97%
...
2154 -7%
AMD Ryzen 9 9955HX3D
2172 -7%
2180 -6%
2188 -6%
2194 -6%
2202 -5%
2209 -5%
2213 -5%
2270 -2%
Intel Core Ultra 9 290HX Plus
2325
Apple M5 10-Core
2459 6%
0%
100%
Restrict / Search: Model: Max. age: years
Cinebench R20 - Cinebench R20 CPU (Single Core)
min: 864     de promedio: 871     mediana: 871 (94%)     max: 878 Points
Cinebench R20 - Cinebench R20 CPU (Multi Core)
min: 14397     de promedio: 14848     mediana: 14848 (36%)     max: 15299 Points
Cinebench R15 - Cinebench R15 CPU Multi 64 Bit
min: 5617     de promedio: 5769     mediana: 5768.5 (36%)     max: 5920 Points
32.5 -99%
...
4724 -18%
4807 -17%
4851 -16%
5247 -9%
5334 -8%
5363 -7%
5554 -4%
5600 -3%
5708 -1%
Intel Core Ultra 9 290HX Plus
5769
AMD Ryzen 9 9955HX
5877 2%
AMD Ryzen 9 9955HX3D
6043 5%
max:
15842 175%
0%
100%
Restrict / Search: Model: Max. age: years
012024036048060072084096010801200132014401560168018001920204021602280240025202640276028803000312032403360348036003720384039604080420043204440456046804800492050405160528054005520564057605880Tooltip
Cinebench R15 - Cinebench R15 CPU Single 64 Bit
min: 324     de promedio: 332     mediana: 332 (92%)     max: 340 Points
19 -94%
...
307 -8%
308 -7%
311 -6%
311.3 -6%
315.9 -5%
324 -2%
326 -2%
AMD Ryzen 9 9955HX3D
327 -2%
331.3 0%
Intel Core Ultra 9 290HX Plus
332
AMD Ryzen 9 9955HX
334.6 1%
...
332 0%
max:
Intel Core Ultra 9 285K
357.8 8%
0%
100%
Restrict / Search: Model: Max. age: years
7-Zip 18.03 - 7-Zip 18.03 Multi Thread 4 runs
min: 103986     de promedio: 110390     mediana: 110390 (63%)     max: 116793 MIPS
7-Zip 18.03 - 7-Zip 18.03 Single Thread 4 runs
min: 6562     de promedio: 6624     mediana: 6623.5 (75%)     max: 6685 MIPS
HWBOT x265 Benchmark v2.2 - HWBOT x265 4k Preset
min: 38.2     de promedio: 39.6     mediana: 39.6 (70%)     max: 40.9 fps
0510152025303540Tooltip
Blender - Blender 3.3 Classroom CPU *
min: 137     de promedio: 146     mediana: 146 (2%)     max: 155 Seconds
Blender - Blender 2.79 BMW27 CPU *
min: 88     de promedio: 91     mediana: 91 (1%)     max: 94 Seconds
R Benchmark 2.5 - R Benchmark 2.5 *
min: 0.391     de promedio: 0.4     mediana: 0.4 (8%)     max: 0.3951 sec
3DMark 11 - 3DM11 Performance Physics
min: 22894     de promedio: 25538     mediana: 25537.5 (63%)     max: 28181 Points
3DMark - 3DMark Cloud Gate Physics
min: 25337     de promedio: 25729     mediana: 25729 (65%)     max: 26121 Points
3DMark - 3DMark Fire Strike Standard Physics
min: 46054     de promedio: 48533     mediana: 48533 (87%)     max: 51012 Points
3DMark - 3DMark Time Spy CPU
min: 17318     de promedio: 17426     mediana: 17426 (73%)     max: 17534 Points
Geekbench 6.6 - Geekbench 6.6 Single-Core
min: 3147     de promedio: 3172     mediana: 3170 (73%)     max: 3198 puntos
Geekbench 6.6 - Geekbench 6.6 Multi-Core
min: 19855     de promedio: 20785     mediana: 20920 (71%)     max: 21581 puntos
533 -97%
...
18378 -12%
18766 -10%
AMD Ryzen 9 9955HX
18887 -9%
19106 -8%
19359 -7%
19741 -5%
AMD Ryzen 9 9955HX3D
20200 -3%
20487 -1%
20546 -1%
Intel Core Ultra 9 290HX Plus
20785
21254 2%
22527 8%
23166 11%
23204 12%
23384 13%
25760 24%
Apple M5 Pro 15-Core
25892 25%
Apple M5 Pro 18-Core
28436 37%
Apple M5 Max
29226 41%
0%
100%
Restrict / Search: Model: Max. age: years
Geekbench 5.5 - Geekbench 5.1 - 5.5 64 Bit Single-Core
min: 2282     de promedio: 2297     mediana: 2296.5 (77%)     max: 2311 puntos
Geekbench 5.5 - Geekbench 5.1 - 5.5 64 Bit Multi-Core
min: 23839     de promedio: 24141     mediana: 24141 (43%)     max: 24443 puntos
Mozilla Kraken 1.1 - Kraken 1.1 Total Score *
min: 391     de promedio: 392.5     mediana: 392.5 (0%)     max: 394 ms
WebXPRT 4 - WebXPRT 4 Score
min: 345     de promedio: 349.5     mediana: 349.5 (87%)     max: 354 Points
WebXPRT 3 - WebXPRT 3 Score
min: 375     de promedio: 378     mediana: 378 (63%)     max: 381 Points
CrossMark - CrossMark Overall
min: 2390     de promedio: 2400     mediana: 2399.5 (84%)     max: 2409 Points
Power Consumption - Prime95 Power Consumption - external Monitor *
min: 170.3     de promedio: 209.2     mediana: 209.2 (36%)     max: 248 Watt
0102030405060708090100110120130140150160170180190200210220230240250260Tooltip
Power Consumption - Cinebench R15 Multi Power Consumption - external Monitor *
min: 218     de promedio: 233     mediana: 233 (43%)     max: 248 Watt
05101520253035404550556065707580859095100105110115120125130135140145150155160165170175180185190195200205210215220225230235240245250Tooltip
Power Consumption - Idle Power Consumption - external Monitor *
min: 6.94     de promedio: 15.6     mediana: 15.6 (10%)     max: 24.3 Watt
0510152025303540Tooltip
Power Consumption - Idle Power Consumption 150cd 1min *
min: 6.52     de promedio: 15.4     mediana: 15.4 (11%)     max: 24.2 Watt
0510152025303540Tooltip
Power Consumption - Power Efficiency - Cinebench R15 Multi external Monitor
25.8 Points per Watt (19%)
- Gama de valores de las pruebas para esta tarjeta gráfica


red legend - Valores medios de las pruebas para esta tarjeta gráfica

* A menor número, mayor rendimiento

Amazon Logo
  • $3,709.00
    HIDevolution [2025] EVOC High Performance Systems X5802A (X580WNS-G) 18" QHD+ 240Hz, 2.7 GHz Ultra 9-290HX Plus, RTX 5080, 32 GB DDR5 RAM, 1 TB PCIe SSD, Windows 11 Pro
  • $5,999.00
    Eluktronics HYDROC 16 G2R RTX 5090 Gaming Laptop: Intel Core Ultra 9 290HX Plus, 16" QHD 300Hz Mini LED 1000-Nit HDR, WiFi 7, Win 11 Pro, 2026 Flagship Mobile Workstation Notebook (96, GB, 4, TB)
  • $1,399.00
    Dell 16 Plus Touchscreen Laptop Computer, Intel Core Ultra 9 288V, Copilot+ PC with on-Device AI, 32GB LPDDR5X RAM, 1TB PCIe SSD, WiFi 7, Backlit Keyboard, Windows 11 Home
  • $4,774.00
    HIDevolution [2025] EVOC High Performance Systems X5802A (X580WNS-G) 18" QHD+ 240Hz, 2.7 GHz Ultra 9-290HX Plus, RTX 5080, 96 GB DDR5 RAM, 2 TB PCIe SSD, Windows 11 Pro
  • $6,199.00
    HIDevolution [2025] EVOC High Performance Systems X5802B (X580WNS-G) 18" UHD+ 200Hz, 2.7 GHz Ultra 9-290HX Plus, RTX 5080, 128 GB DDR5 RAM, 8 TB PCIe SSD, Windows 11 Pro

v1.35
log 24. 23:19:01

#0 ran 0s before starting gpusingle class +0s ... 0s

#1 no ids found in url (should be separated by "_") +0s ... 0s

#2 not redirecting to Ajax server +0s ... 0s

#3 did not recreate cache, as it is less than 5 days old! Created at Fri, 22 May 2026 05:29:17 +0200 +0.003s ... 0.003s

#4 no comparison url found in template nbc.compare_page_2 needed +0.019s ... 0.021s

#5 no comparison url found in template nbc.compare_page_2 needed +0s ... 0.022s

#6 no comparison url found in template nbc.compare_page_2 needed +0s ... 0.022s

#7 no comparison url found in template nbc.compare_page_2 needed +0s ... 0.022s

#8 no comparison url found in template nbc.compare_page_2 needed +0s ... 0.022s

#9 no comparison url found in template nbc.compare_page_2 needed +0s ... 0.023s

#10 no comparison url found in template nbc.compare_page_2 needed +0s ... 0.023s

#11 no comparison url found in template nbc.compare_page_2 needed +0s ... 0.023s

#12 no comparison url found in template nbc.compare_page_2 needed +0s ... 0.023s

#13 composed specs +0.001s ... 0.024s

#14 did output specs +0s ... 0.024s

#15 getting avg benchmarks for device 20456 +0.032s ... 0.056s

#16 got single benchmarks 20456 +0.011s ... 0.067s

#17 got avg benchmarks for devices +0s ... 0.067s

#18 min, max, avg, median took s +1.202s ... 1.269s

#19 no comparison url found in template nbc.compare_page_2 needed +0.313s ... 1.582s

#20 return log +0s ... 1.582s

Análisis para el Intel Core Ultra 9 290HX Plus procesador

Análisis del Alienware 16X Aurora 2026: Nuevas características por un precio mayor

Análisis del Alienware 16X Aurora 2026: Nuevas características por un precio mayor

El Aurora 16X puede configurarse ahora con características más lujosas como OLED y la GeForce RTX 5070 Ti. Sin embargo, prepárese para pagar de paso más de 3.000 dólares por este portátil para juegos de gama media.
Intel Core Ultra 9 290HX Plus, NVIDIA GeForce RTX 5070 Ti Laptop, 16", 2.6 kg
Análisis del Alienware 16 Area-51: El nuevo Core Ultra 9 290HX Plus es todo potencia a cualquier precio

Análisis del Alienware 16 Area-51: El nuevo Core Ultra 9 290HX Plus es todo potencia a cualquier precio

Intel Arrow Lake-H sube el listón con una SKU aún más potente este año para sustituir a la Core Ultra 9 275HX. Sin embargo, exprimir más rendimiento de la misma arquitectura subyacente tiene sus consecuencias.
Intel Core Ultra 9 290HX Plus, NVIDIA GeForce RTX 5080 Laptop, 16", 3.3 kg

Alienware 16X Aurora Core Ultra 9 290HX Plus: NVIDIA GeForce RTX 5070 Ti Laptop, 16.00", 2.6 kg
   » Por qué merece la pena jugar en modo Equilibrado en lugar de Rendimiento en el Alienware 16X Aurora

   » 2026 Alienware 16X Aurora es tan caro que ahora rivaliza en precio con la serie Area-51

   » Alienware 16X Aurora por fin con la GeForce RTX 5070 Ti, pero las configuraciones pueden ser frustrantes

Alienware 16 Area-51 Core Ultra 9 290HX Plus: NVIDIA GeForce RTX 5080 Laptop, 16.00", 3.3 kg
   » El modo Overdrive super ruidoso del Alienware 16 es casi innecesario para jugar

   » La Core Ultra 9 290HX Plus es una de las CPU móviles más calientes con más de 100 C bajo carga

   » El nuevo Alienware 16 con Core Ultra 9 290HX Plus es locamente rápido, pero viene con consecuencias

   » La nueva opción OLED es exactamente lo que el Alienware 16 necesitaba si no fuera por un gran problema

Google LogoAdd as a preferred source on Google
Mail Logo

» Comparativa de CPUs móviles

Comparativa de todas las gamas de CPU.

» Lista de pruebas - Procesadores móviles

Lista de pruebas de todas las CPUs conocidas usadas en portátiles (CPUs de escritorio y portátiles)

Otras CPUs de la serie Arrow Lake

» Intel Core Ultra 7 270K Plus
   24x
» Intel Core Ultra 9 285K
   24x 3.2 GHz - 5.7 GHz
» Intel Core Ultra 7 265KF
   20x 3.3 GHz - 5.5 GHz
» Intel Core Ultra 7 265K
   20x 3.3 GHz - 5.5 GHz
» Intel Core Ultra 9 290HX Plus
   24x 1.8 GHz - 5.5 GHz
» Intel Core Ultra 9 285
   24x 1.9 GHz - 5.6 GHz
» Intel Core Ultra 9 285HX
   24x 2.1 GHz - 5.5 GHz
» Intel Core Ultra 9 275HX
   24x 2.1 GHz - 5.4 GHz
» Intel Core Ultra 5 250K Plus
   18x 4.2 GHz - 5.3 GHz
» Intel Core Ultra 7 270HX Plus
   20x 1.8 GHz - 5.3 GHz
» Intel Core Ultra 7 265HX
   20x 2.3 GHz - 5.3 GHz
» Intel Core Ultra 7 255HX
   20x 2.3 GHz - 5.2 GHz
» Intel Core Ultra 5 245KF
   14x 3.6 GHz - 5.2 GHz
» Intel Core Ultra 5 245K
   14x 4.2 GHz - 5.2 GHz
» Intel Core Ultra 5 245
   14x 3 GHz - 5.1 GHz
» Intel Core Ultra 5 235
   14x 3.4 GHz - 5 GHz
» Intel Core Ultra 9 285H
   16x 4.5 GHz - 5.4 GHz
» Intel Core Ultra 7 251HX
   18x 2.5 GHz - 5.1 GHz
» Intel Core Ultra 7 265H
   16x 4.5 GHz - 5.3 GHz
» Intel Core Ultra 7 255H
   16x 4.4 GHz - 5.1 GHz
» Intel Core Ultra 5 235HX
   14x 2.6 GHz - 5.1 GHz
» Intel Core Ultra 5 225F
   10x 3.3 GHz - 4.9 GHz
» Intel Core Ultra 5 245HX
   14x 2.6 GHz - 5.1 GHz
» Intel Core 7 245HX
   14x 2.6 GHz - 5.1 GHz
» Intel Core Ultra 5 225H
   14x 4.3 GHz - 4.9 GHz
» Intel Core Ultra 5 225
   10x 3.3 GHz - 4.9 GHz
» Intel Core Ultra 5 235H
   14x 4.4 GHz - 5.1 GHz
» Intel Core Ultra 7 265U
   12x 2.4 GHz - 5.3 GHz
» Intel Core Ultra 7 255U
   12x 3.8 GHz - 4.8 GHz
» Intel Core Ultra 5 225U
   12x 2.4 GHz - 4.8 GHz
» Intel Core Ultra 5 235U
   12x 2.4 GHz - 4.9 GHz

CPUs de alrededor

+ Intel Core Ultra 7 255U
   1.7 GHz - 5.2 GHz
+ AMD Ryzen 9 9955HX3D
   16x 2.5 GHz - 5.4 GHz
+ Apple M5 Pro 15-Core
   15x 3.05 GHz - 4.61 GHz
+ Apple M4 Max 14-Core
   14x 2.59 GHz - 4.51 GHz
» Intel Core Ultra 9 290HX Plus
   24x 1.8 GHz - 5.5 GHz
- AMD Ryzen 9 9955HX
   16x 2.5 GHz - 5.4 GHz
- Intel Core Ultra 9 285HX
   24x 2.1 GHz - 5.5 GHz
- Intel Core Ultra 9 275HX
   24x 2.1 GHz - 5.4 GHz
- Apple M4 Pro 14-Core
   14x 2.59 GHz - 4.51 GHz
Klaus Hinum (Update: 2026-03-17)