Análises de portátiles con NVIDIA GeForce RTX 2070 Mobile tarjeta gráfica
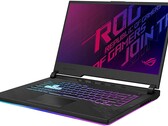
Review del portátil Asus ROG Strix G15 G512LW: Mucho mejor que el G512LI
El sistema Asus utiliza metal líquido para su CPU en lugar de la pasta térmica tradicional. Aunque la sostenibilidad de Turbo Boost es excelente, las temperaturas del núcleo se mantienen blandas a unos 80 C cuando se juega.
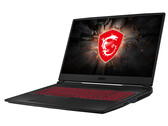
Intel Core i7-10750H, NVIDIA GeForce RTX 2070 Mobile, 15.6", 2.3 kgReview del Leopardo MSI GL75: Exitoso portátil para juegos con una pantalla de 144 Hz
Con el GL75 Leopard, MSI cuenta con un potente portátil para juegos de 17,3 pulgadas en su gama, que lleva todos los juegos modernos sin problemas a la sensible pantalla Full HD (144 Hz, IPS). El resto del equipo también es correcto: 16 GB de memoria (modo de doble canal), un SSD NVMe y un disco duro de 1 TB.
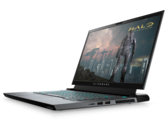
Intel Core i7-10750H, NVIDIA GeForce RTX 2070 Mobile, 17.3", 2.6 kgReview del portátil Dell Alienware m15 R3: La cámara de vapor salva el día
Puede parecer igual por fuera, pero es una bestia diferente por dentro. La temperatura de la CPU es mucho más fría ahora para abordar una de nuestras mayores preocupaciones sobre el Alienware m15 R2 del año pasado.
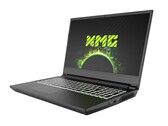
Intel Core i7-10750H, NVIDIA GeForce RTX 2070 Mobile, 15.6", 2.3 kgReview del portátil Schenker XMG Apex 15 (Clevo NH57AF1): Extremadamente rápido, extremadamente ruidoso
El XMG Apex 15 de Schenker Technologies es un portátil de alta gama muy inusual. Después de todo, ¿con qué frecuencia encuentras procesadores AMD conectados a través de un enchufe en los portátiles? Averigua qué fortalezas y debilidades tiene este exótico dispositivo en nuestra review.
AMD Ryzen 9 3900, NVIDIA GeForce RTX 2070 Mobile, 15.6", 2.7 kgReview del portátil MSI GP65 10SFK: El Core i7 de Intel de la 10ª generación deja su huella
MSI ha superado a la mayoría de los fabricantes de equipos originales en el mercado con los últimos procesadores Comet Lake-H de Intel. Después de haber comprobado el Core i5-10300H y el Core i9-10980HK, veamos cómo encaja el Core i7-10750H en la línea.
Intel Core i7-10750H, NVIDIA GeForce RTX 2070 Mobile, 15.6", 2.3 kgSchenker XMG Pro 15: Intel Core i7-9750H, 15.60", 2.5 kg
análise » Review del portátil Schenker XMG Pro 15 (Clevo PB51RF-G): Diversión y juegos
MSI GE65 Raider 9SF-049US: Intel Core i9-9880H, 15.60", 2.3 kg
análise » Review del portátil MSI GE65 Raider 9SF: Enormes mejoras sobre el GE63
Asus Strix Scar III G531GW-AZ062T: Intel Core i7-9750H, 15.60", 2.4 kg
análise » Review de Asus ROG Strix Scar III G531GW: Con una pantalla rápida de 240 Hz
Eurocom Nightsky RX15: Intel Core i9-9980HK, 15.60", 2.5 kg
análise » Review del portátil Eurocom Nightsky RX15 (Clevo PB51RF, Core i9, 4K OLED)
Asus ASUS ROG Strix SCAR III G731GW-XB74: Intel Core i7-9750H, 17.30", 2.9 kg
análise » Review de Asus ROG Strix Hero III G731GW - un portátil colorido con compromisos
Eurocom Nightsky RX17: Intel Core i7-9750H, 17.30", 2.9 kg
análise » Review del portátil Eurocom Nightsky RX17 (Clevo PB70RC/PB71RC)
Asus Strix Scar III G531GW: Intel Core i9-9880H, 15.60", 2.3 kg
análise » Review del ASUS ROG Strix SCAR III G531GW (Core i9-9880H, RTX 2070)
Asus Zephyrus S GX502GW: Intel Core i7-9750H, 15.60", 2.1 kg
análise » Review del ASUS ROG Zephyrus S GX502GW (Core i7-9750H, RTX 2070)
Aorus 15 X9: Intel Core i7-8750H, 15.60", 2.4 kg
análise » Review del Aorus 15 (i7-8750H, RTX 2070)
Schenker XMG Neo 17: Intel Core i7-8750H, 17.30", 2.5 kg
análise » Review del Schenker XMG Neo 17 (Core i7-8750H, GeForce RTX 2070) Tongfang GK7CP7S
MSI GE75 8SF: Intel Core i7-8750H, 17.30", 2.6 kg
análise » Review del MSI GE75 Raider 8SF (i7-8750H, RTX 2070)
Schenker XMG Ultra 15 Turing: Intel Core i7-9700K, 15.60", 3.5 kg
análise » Review del Schenker XMG Ultra 15 (i7-9700K, RTX 2070) Clevo P751TM1-G
Asus ROG Strix Scar II GL704GW: Intel Core i7-8750H, 17.30", 2.9 kg
análise » Review del ASUS ROG Strix Scar II GL704GW (Core i7-8750H, RTX 2070)
MSI GE75 Raider 10SF-286: Intel Core i7-10875H, 17.30", 2.6 kg
análise externo » MSI GE75 Raider 10SF-286
MSI GE66 Raider 10SF: Intel Core i7-10870H, 15.60", 2.4 kg
análise externo » MSI GE66 Raider 10SF
MSI GL65 Leopard 10SFK-062: Intel Core i7-10750H, 15.60", 2.3 kg
análise externo » MSI GL65 Leopard 10SFK-062
Asus Zephyrus S17 GX701LWS-EV029T: Intel Core i7-10750H, 17.30", 2.6 kg
análise externo » Asus Zephyrus S17 GX701LWS-EV029T
Asus ROG Strix G15 G512LW: Intel Core i7-10750H, 15.60", 2.3 kg
análise externo » Asus ROG Strix G15 G512LW
Dell G5 15 5500, i7-10750H RTX 2070: Intel Core i7-10750H, 15.60", 2.4 kg
análise externo » Dell G5 15 5500, i7-10750H RTX 2070
HP Omen 15-dh1020tx: Intel Core i7-10750H, 15.60", 2.4 kg
análise externo » HP Omen 15-dh1020tx
MSI GL65 Leopard 10SFR-483XES: Intel Core i7-10750H, 15.60", 2.4 kg
análise externo » MSI GL65 Leopard 10SFR-483XES
Acer Predator Triton 300 PT315-52-73S0: Intel Core i7-10750H, 15.60", 2 kg
análise externo » Acer Predator Triton 300 PT315-52-73S0
Asus ROG Strix G15 G512LW-HN069: Intel Core i7-10750H, 15.60", 2.4 kg
análise externo » Asus ROG Strix G15 G512LW-HN069
MSI GP65 Leopard 10SFK-495XES: Intel Core i7-10750H, 15.60"
análise externo » MSI GP65 Leopard 10SFK-495XES
Acer Predator Helios 300 PH317-54-77RQ: Intel Core i7-10750H, 17.30", 2.9 kg
análise externo » Acer Predator Helios 300 PH317-54-77RQ
MSI GE66 Raider 10SF-056XES: Intel Core i7-10750H, 15.60"
análise externo » MSI GE66 Raider 10SF-056XES
MSI GL75 10SFK-060XES: Intel Core i7-10750H, 17.30", 2.6 kg
análise externo » MSI GL75 10SFK-060XES
HP Omen 15-dc1016no: Intel Core i7-8750H, 15.60", 2.4 kg
análise externo » HP Omen 15-dc1016no
Alienware m15 R3 P87F: Intel Core i7-10750H, 15.60", 2.3 kg
análise externo » Alienware m15 R3 P87F
MSI GL75 10SFR-221 Leopard: Intel Core i7-10750H, 17.30", 2.6 kg
análise externo » MSI GL75 10SFR-221 Leopard
Asus Strix G17 G712LW-EV251T: Intel Core i7-10750H, 17.30", 2.9 kg
análise externo » Asus Strix G17 G712LW-EV251T
Asus Strix Scar 17 G732LW-EV050T: Intel Core i7-10875H, 17.30", 2.9 kg
análise externo » Asus Strix Scar 17 G732LW-EV050T
Asus Strix Scar 15 G532LW-AZ056T: Intel Core i7-10875H, 15.60", 2.6 kg
análise externo » Asus Strix Scar 15 G532LW-AZ056T
MSI GE65 Raider 9SF-003ES: Intel Core i7-9750H, 15.60", 2.3 kg
análise externo » MSI GE65 Raider 9SF-003ES
MSI GL75 9SFK-1248: Intel Core i7-9750H, 17.30", 2.5 kg
análise externo » MSI GL75 9SFK-1248
MSI GP65 10SFK-047US: Intel Core i7-10750H, 15.60", 2.3 kg
análise externo » MSI GP65 10SFK-047US
MSI GE63 Raider RGB 8SF-031XES: Intel Core i7-8750H, 15.60", 2.4 kg
análise externo » MSI GE63 Raider RGB 8SF-031XES
Asus ROG Zephyrus M15 GU502LW-HC130T: Intel Core i7-10750H, 15.60", 2 kg
análise externo » Asus ROG Zephyrus M GU502LW-HC130T
Origin PC Eon15-X 2020, R9 3900, RTX 2070: AMD Ryzen 9 3900, 15.60", 2.7 kg
análise externo » Origin PC Eon15-X 2020, R9 3900, RTX 2070
Schenker XMG Apex 15 Ryzen 9 3950X, RTX 2070: AMD Ryzen 9 3950X, 15.60", 2.6 kg
análise externo » Schenker XMG Apex 15 Ryzen 9 3950X, RTX 2070
Asus Strix G15 G512LW-HN038: Intel Core i7-10750H, 15.60", 2.4 kg
análise externo » Asus Strix G15 G512LW-HN038
Acer Predator Helios 300 PH317-53-750A: Intel Core i7-9750H, 17.30", 2.9 kg
análise externo » Acer Predator Helios 300 PH317-53-750A
MSI GE65 Raider 9SF-049US: Intel Core i9-9880H, 15.60", 2.3 kg
análise externo » MSI GE65 Raider 9SF-049US
Acer Predator Helios 700 PH717-71-914K: Intel Core i9-9980HK, 17.30", 4.5 kg
análise externo » Acer Predator Helios 700 PH717-71-914K
Asus ROG Strix G531GW-AL137: Intel Core i7-9750H, 15.60", 2.4 kg
análise externo » Asus ROG Strix G531GW-AL137
Asus ROG Zephyrus S GX701GWR-H6089R: Intel Core i7-9750H, 17.30", 2.7 kg
análise externo » Asus ROG Zephyrus S GX701GWR-H6089R
Asus ROG Zephyrus S GX502GW-AZ064T: Intel Core i7-9750H, 15.60", 2 kg
análise externo » Asus ROG Zephyrus S GX502GW-AZ064T
Acer Predator Helios 700 PH717-71-95MA: Intel Core i9-9980HK, 17.30", 4.9 kg
análise externo » Acer Predator Helios 700 PH717-71-95MA
Asus ROG Strix Scar III G531GW-AZ150T: Intel Core i9-9880H, 15.60", 2.6 kg
análise externo » Asus ROG Strix Scar III G531GW-AZ150T
MSI GL65 9SFK-286XES: Intel Core i7-9750H, 15.60", 2.3 kg
análise externo » MSI GL65 9SFK-286XES
HP Omen 15-dh0022nf : Intel Core i7-9750H, 15.60", 2.6 kg
análise externo » HP Omen 15-dh0022nf
Asus ROG Strix G731GW-EV010T : Intel Core i7-9750H, 17.30", 2.9 kg
análise externo » Asus ROG Strix G731GW-EV010T
MSI GE65 Raider 9SF-006: Intel Core i7-9750H, 15.60", 2.3 kg
análise externo » MSI GE65 Raider 9SF-006
HP Omen 17-cb0040nr: Intel Core i7-9750H, 17.30", 3.3 kg
análise externo » HP Omen 17-cb0040nr
Asus ROG Zephyrus S GX502GW-ES004T: Intel Core i7-9750H, 15.60", 2 kg
análise externo » Asus ROG Zephyrus S GX502GW-ES004T
MSI GE75 Raider 8SF-032ES: Intel Core i7-8750H, 17.30", 2.7 kg
análise externo » MSI GE75 Raider 8SF-032ES
Acer Predator Helios 700 PH717-71-7091: Intel Core i7-9750H, 17.30", 4.5 kg
análise externo » Acer Predator Helios 700 PH717-71-7091
HP Omen 17-cb0006ng: Intel Core i7-9750H, 17.30", 3.3 kg
análise externo » HP Omen 17-cb0006ng
MSI GT76 9SF-013: Intel Core i7-9750H, 17.30", 4.5 kg
análise externo » MSI GT76 9SF-013
MSI GP75 Leopard 9SF-1037XES: Intel Core i7-9750H, 17.30", 2.6 kg
análise externo » MSI GP75 Leopard 9SF-1037XES
Asus ASUS ROG Strix SCAR III G731GW-XB74: Intel Core i7-9750H, 17.30", 2.9 kg
análise externo » Asus ASUS ROG Strix SCAR III G731GW-XB74
MSI GE65 9SF-006: Intel Core i9-9880H, 15.60", 2.3 kg
análise externo » MSI GE65 9SF-006
Asus Zephyrus S GX701GW-EV047R: Intel Core i7-8750H, 17.30", 2.7 kg
análise externo » Asus Zephyrus S GX701GW-EV047R
Acer Predator Helios 300 PH317-53-75YB: Intel Core i7-9750H, 17.30", 2.9 kg
análise externo » Acer Predator Helios 300 PH317-53-75YB
Asus Strix Scar 3 G531GW-DB76: Intel Core i7-9750H, 15.60", 2.6 kg
análise externo » Asus Strix Scar 3 G531GW-DB76
Asus ROG Strix HERO III G531GW-ES013T: Intel Core i7-9750H, 15.60", 2.4 kg
análise externo » Asus ROG Strix HERO III G531GW-ES013T
HP Omen 15-dc1001ns: Intel Core i7-8750H, 15.60", 2.5 kg
análise externo » HP OMEN 15-dc1001ns
Asus ROG Strix Scar III G531GW-AZ015T: Intel Core i7-9750H, 15.60", 2.6 kg
análise externo » Asus ROG Strix Scar III G531GW-AZ015T
Asus ROG Strix G531GW-AL023T: Intel Core i7-9750H, 15.60", 2.6 kg
análise externo » Asus ROG Strix G531GW-AL023T
Asus ROG Zephyrus S GX502GW-ES002: Intel Core i7-9750H, 15.60", 2 kg
análise externo » Asus ROG Zephyrus S GX502GW-ES002
MSI GE75 Raider 049-HID4-US: Intel Core i7-8750H, 17.30", 2.6 kg
análise externo » MSI GE75 Raider 049-HID4-US
Schenker XMG Pro 17-M19msb: Intel Core i7-9750H, 17.30", 2.9 kg
análise externo » Schenker XMG Pro 17-M19msb
Acer Predator Helios 300 PH317-53-79S0: Intel Core i7-9750H, 17.30", 2.9 kg
análise externo » Acer Predator Helios 300 PH317-53-79S0
BTO Notebooks X-Book 15X990: Intel Core i9-9980HK, 15.60", 2.4 kg
análise externo » BTO Notebooks X-Book 15X990
Asus ROG Zephyrus S GX502GW-ES010T: Intel Core i7-9750H, 15.60", 2 kg
análise externo » Asus ROG Zephyrus S GX502GW-ES010T
Medion Erazer X17805-MD61499: Intel Core i7-9750H, 17.30", 2.6 kg
análise externo » Medion Erazer X17805-MD61499
Asus Zephyrus S GX701GWR-EV021R: Intel Core i7-8750H, 17.30", 2.7 kg
análise externo » Asus Zephyrus S GX701GWR-EV021R
Asus ROG Strix Scar III G531GW-ES081T: Intel Core i7-9750H, 15.60", 2.6 kg
análise externo » Asus ROG Strix Scar III G531GW-ES081T
MSI GE65 Raider-9SF, i7-8750H: Intel Core i7-8750H, 15.60", 2.3 kg
análise externo » MSI GE65 Raider-9SF, i7-8750H
Asus Strix Scar III G531GW: Intel Core i9-9880H, 15.60", 2.3 kg
análise externo » Asus Strix Scar III G531GW
HP Omen 17-cb0005ng: Intel Core i7-9750H, 17.30", 3.3 kg
análise externo » HP Omen 17-cb0005ng
MSI GS75 Stealth 8SF-099FR: Intel Core i7-8750H, 17.30", 2.3 kg
análise externo » MSI GS75 Stealth 8SF-099FR
BTO Notebooks X-Book 17X882: Intel Core i7-8750H, 17.30", 2.6 kg
análise externo » BTO Notebooks X-Book 17X882
Asus ROG Strix Scar II GL504GW-ES043: Intel Core i7-8750H, 15.60", 2.4 kg
análise externo » Asus ROG Strix Scar II GL504GW-ES043
MSI GS75 Stealth 8SF-099EN: Intel Core i7-8750H, 17.30", 2.3 kg
análise externo » MSI GS75 Stealth 8SF-099EN
Aorus 15 X9: Intel Core i7-8750H, 15.60", 2.4 kg
análise externo » Aorus 15 X9
Aorus 15-XA-F74CDW: Intel Core i7-9750H, 15.60", 2.4 kg
análise externo » Aorus 15-XA-F74CDW
Asus Zephyrus S GX502GW: Intel Core i7-9750H, 15.60", 2.1 kg
análise externo » Asus Zephyrus S GX502GW
Asus Strix Scar III G531GW-AZ062T: Intel Core i7-9750H, 15.60", 2.4 kg
análise externo » Asus Strix Scar III G531GW-AZ062T
Asus Zephyrus S GX502GW-ES006R: Intel Core i7-9750H, 15.60", 2 kg
análise externo » Asus Zephyrus S GX502GW-ES006R
Asus ROG Strix Scar II GL704GW: Intel Core i7-8750H, 17.30", 2.9 kg
análise externo » Asus ROG Strix Scar II GL704GW
MSI GE75 8SF: Intel Core i7-8750H, 17.30", 2.6 kg
análise externo » MSI GE75 8SF
Asus ROG Strix Scar II GL704GW-EV042T: Intel Core i7-8750H, 17.00", 2.9 kg
análise externo » Asus ROG Strix Scar II GL704GW-EV042T
MSI GE75 Raider 8SF-033XES: Intel Core i7-8750H, 17.30", 2.7 kg
análise externo » MSI GE75 Raider 8SF-033XES
Asus Zephyrus S GX735GW-EV005T: Intel Core i7-8750H, 17.30", 2.7 kg
análise externo » Asus Zephyrus S GX735GW-EV005T
Asus ROG Strix Scar II GL504GW-ES012T: Intel Core i7-8750H, 15.60", 2.4 kg
análise externo » Asus ROG Strix Scar II GL504GW-ES012T
Asus Strix GL504GW-DS74: Intel Core i7-8750H, 15.60", 2.5 kg
análise externo » Asus Strix GL504GW-DS74
Asus ROG Strix Scar II GL704GW-EV005T: Intel Core i7-8750H, 17.30", 2.9 kg
análise externo » Asus ROG Strix Scar II GL704GW-EV005T
Asus ROG Strix G15 G512LW: Intel Core i7-10750H, 15.60", 2.3 kg
» Asus ROG Strix G15 G512LW arregla el mayor problema que tenemos con el ROG Strix G15 G512LI