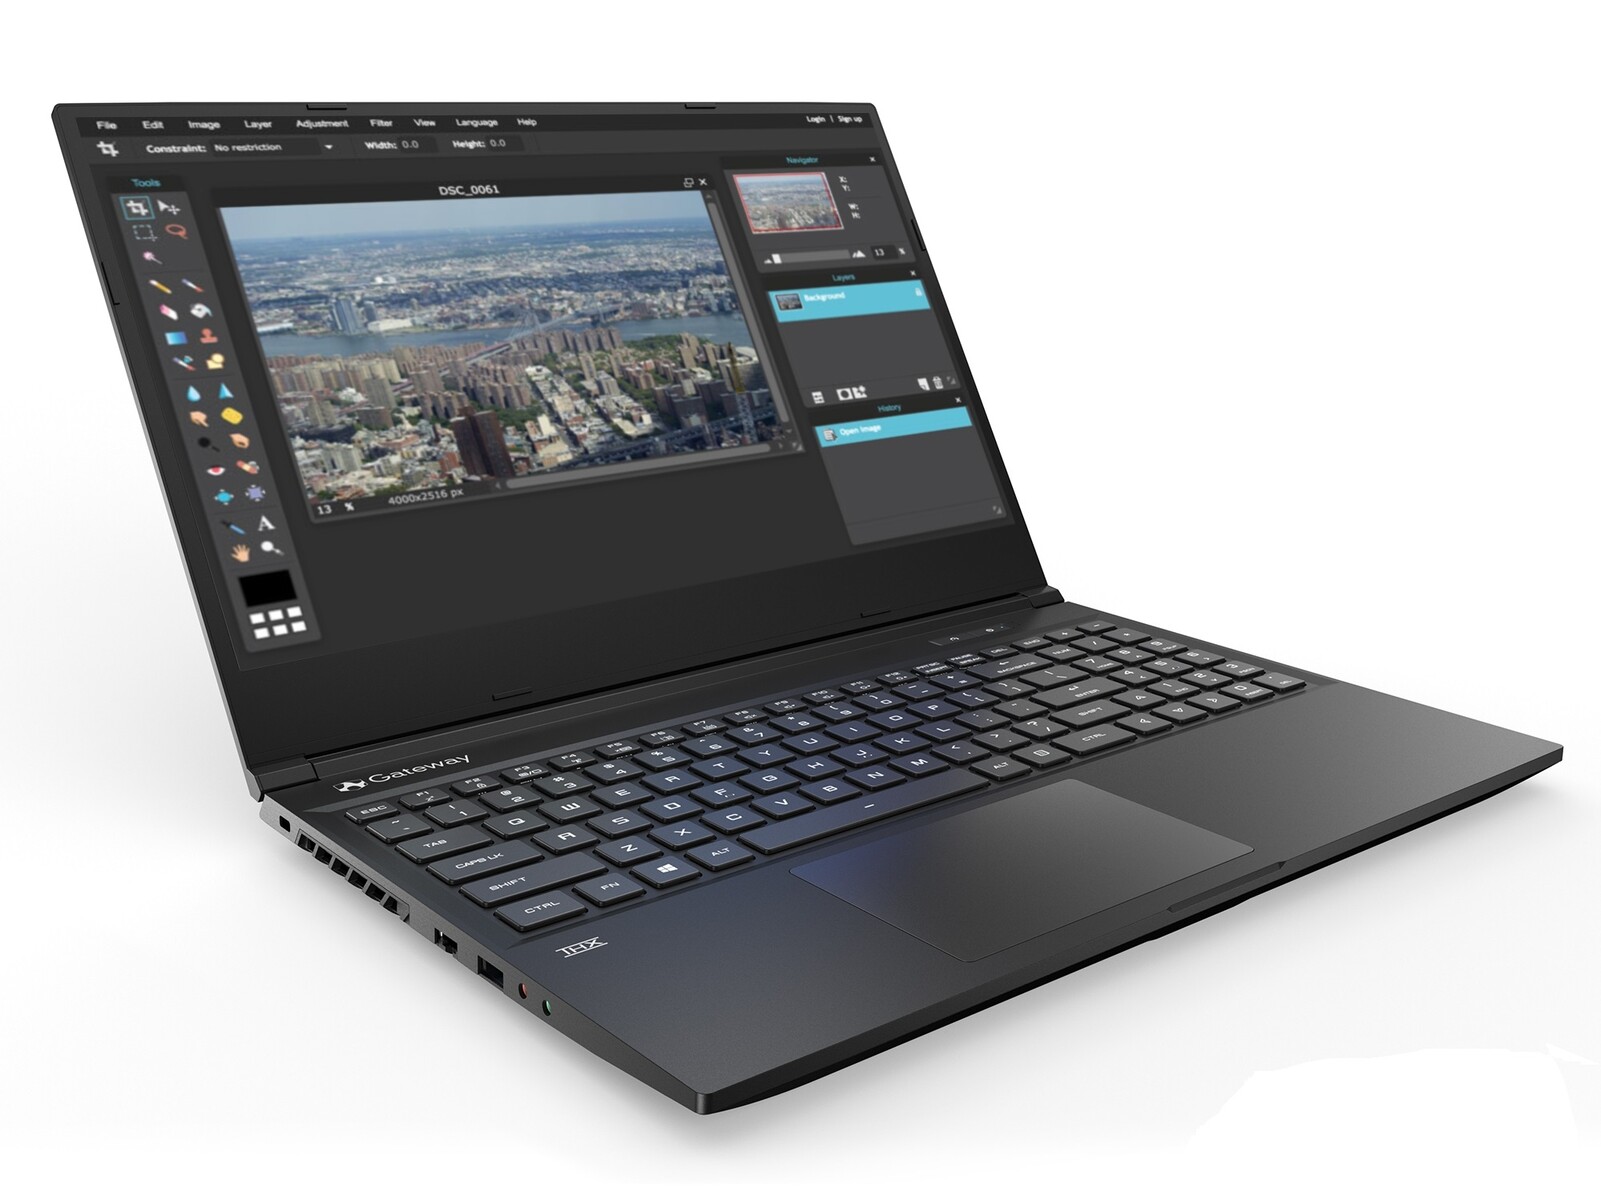
Review del portátil Walmart Gateway Creator Series 15: GeForce RTX 2060 por menos de $1000 USD
Gateway es la marca interna de Walmart de portátiles no muy diferentes de la serie Motile o la serie EVOO. El Gateway Creator 15 es un portátil para juegos asequible con su CPU Coffee Lake-H, GPU GeForce RTX 2060 y pantalla 1080p por sólo $999 USD. Un segundo modelo con el Ryzen 5 4600H y GTX 1650 también está disponible por 200 a 300 dólares menos.
Sin embargo, como veremos en esta reseña, el sistema Gateway recorta muchas esquinas para llegar a un precio tan bajo para un portátil de juegos. Vea nuestra reseña sobre el Schenker XMG Core 15 para obtener más información sobre el chasis y sus características físicas, ya que el Gateway Creator 15 utiliza un chasis Tongfang idéntico.
Las alternativas al Gateway Creator 15 incluyen otros portátiles para juegos de gama media y baja de 15,6 pulgadas como el Lenovo Legion 5, HP Pavilion Gaming 15, Dell G3 15, o el MSI GL65.
Valoración | Fecha | Modelo | Peso | Altura | Tamaño | Resolución | Precio |
|---|---|---|---|---|---|---|---|
| 82.1 % v7 (old) | 10/2020 | Gateway Creator Series 15.6 GWTN156-3BK i5-10300H, GeForce RTX 2060 Mobile | 2 kg | 19.9 mm | 15.60" | 1920x1080 | |
| 82.1 % v7 (old) | 09/2020 | Schenker XMG Core 15 GK5NR0O R7 4800H, GeForce RTX 2060 Mobile | 2 kg | 19.9 mm | 15.60" | 1920x1080 | |
| 83.7 % v7 (old) | 10/2020 | Aorus 5 KB i7-10750H, GeForce RTX 2060 Mobile | 2.1 kg | 28 mm | 15.60" | 1920x1080 | |
| 81.2 % v7 (old) | 09/2020 | Asus ROG Zephyrus G15 GA502IU-ES76 R7 4800HS, GeForce GTX 1660 Ti Max-Q | 2.1 kg | 19.9 mm | 15.60" | 1920x1080 | |
| 82.1 % v7 (old) | 09/2020 | HP Omen 15-ek0456ng i5-10300H, GeForce GTX 1660 Ti Mobile | 2.1 kg | 32 mm | 15.60" | 1920x1080 | |
| 84.2 % v7 (old) | 09/2019 | Razer Blade 15 GTX 1660 Ti i7-9750H, GeForce GTX 1660 Ti Mobile | 2.1 kg | 19.9 mm | 15.60" | 1920x1080 |
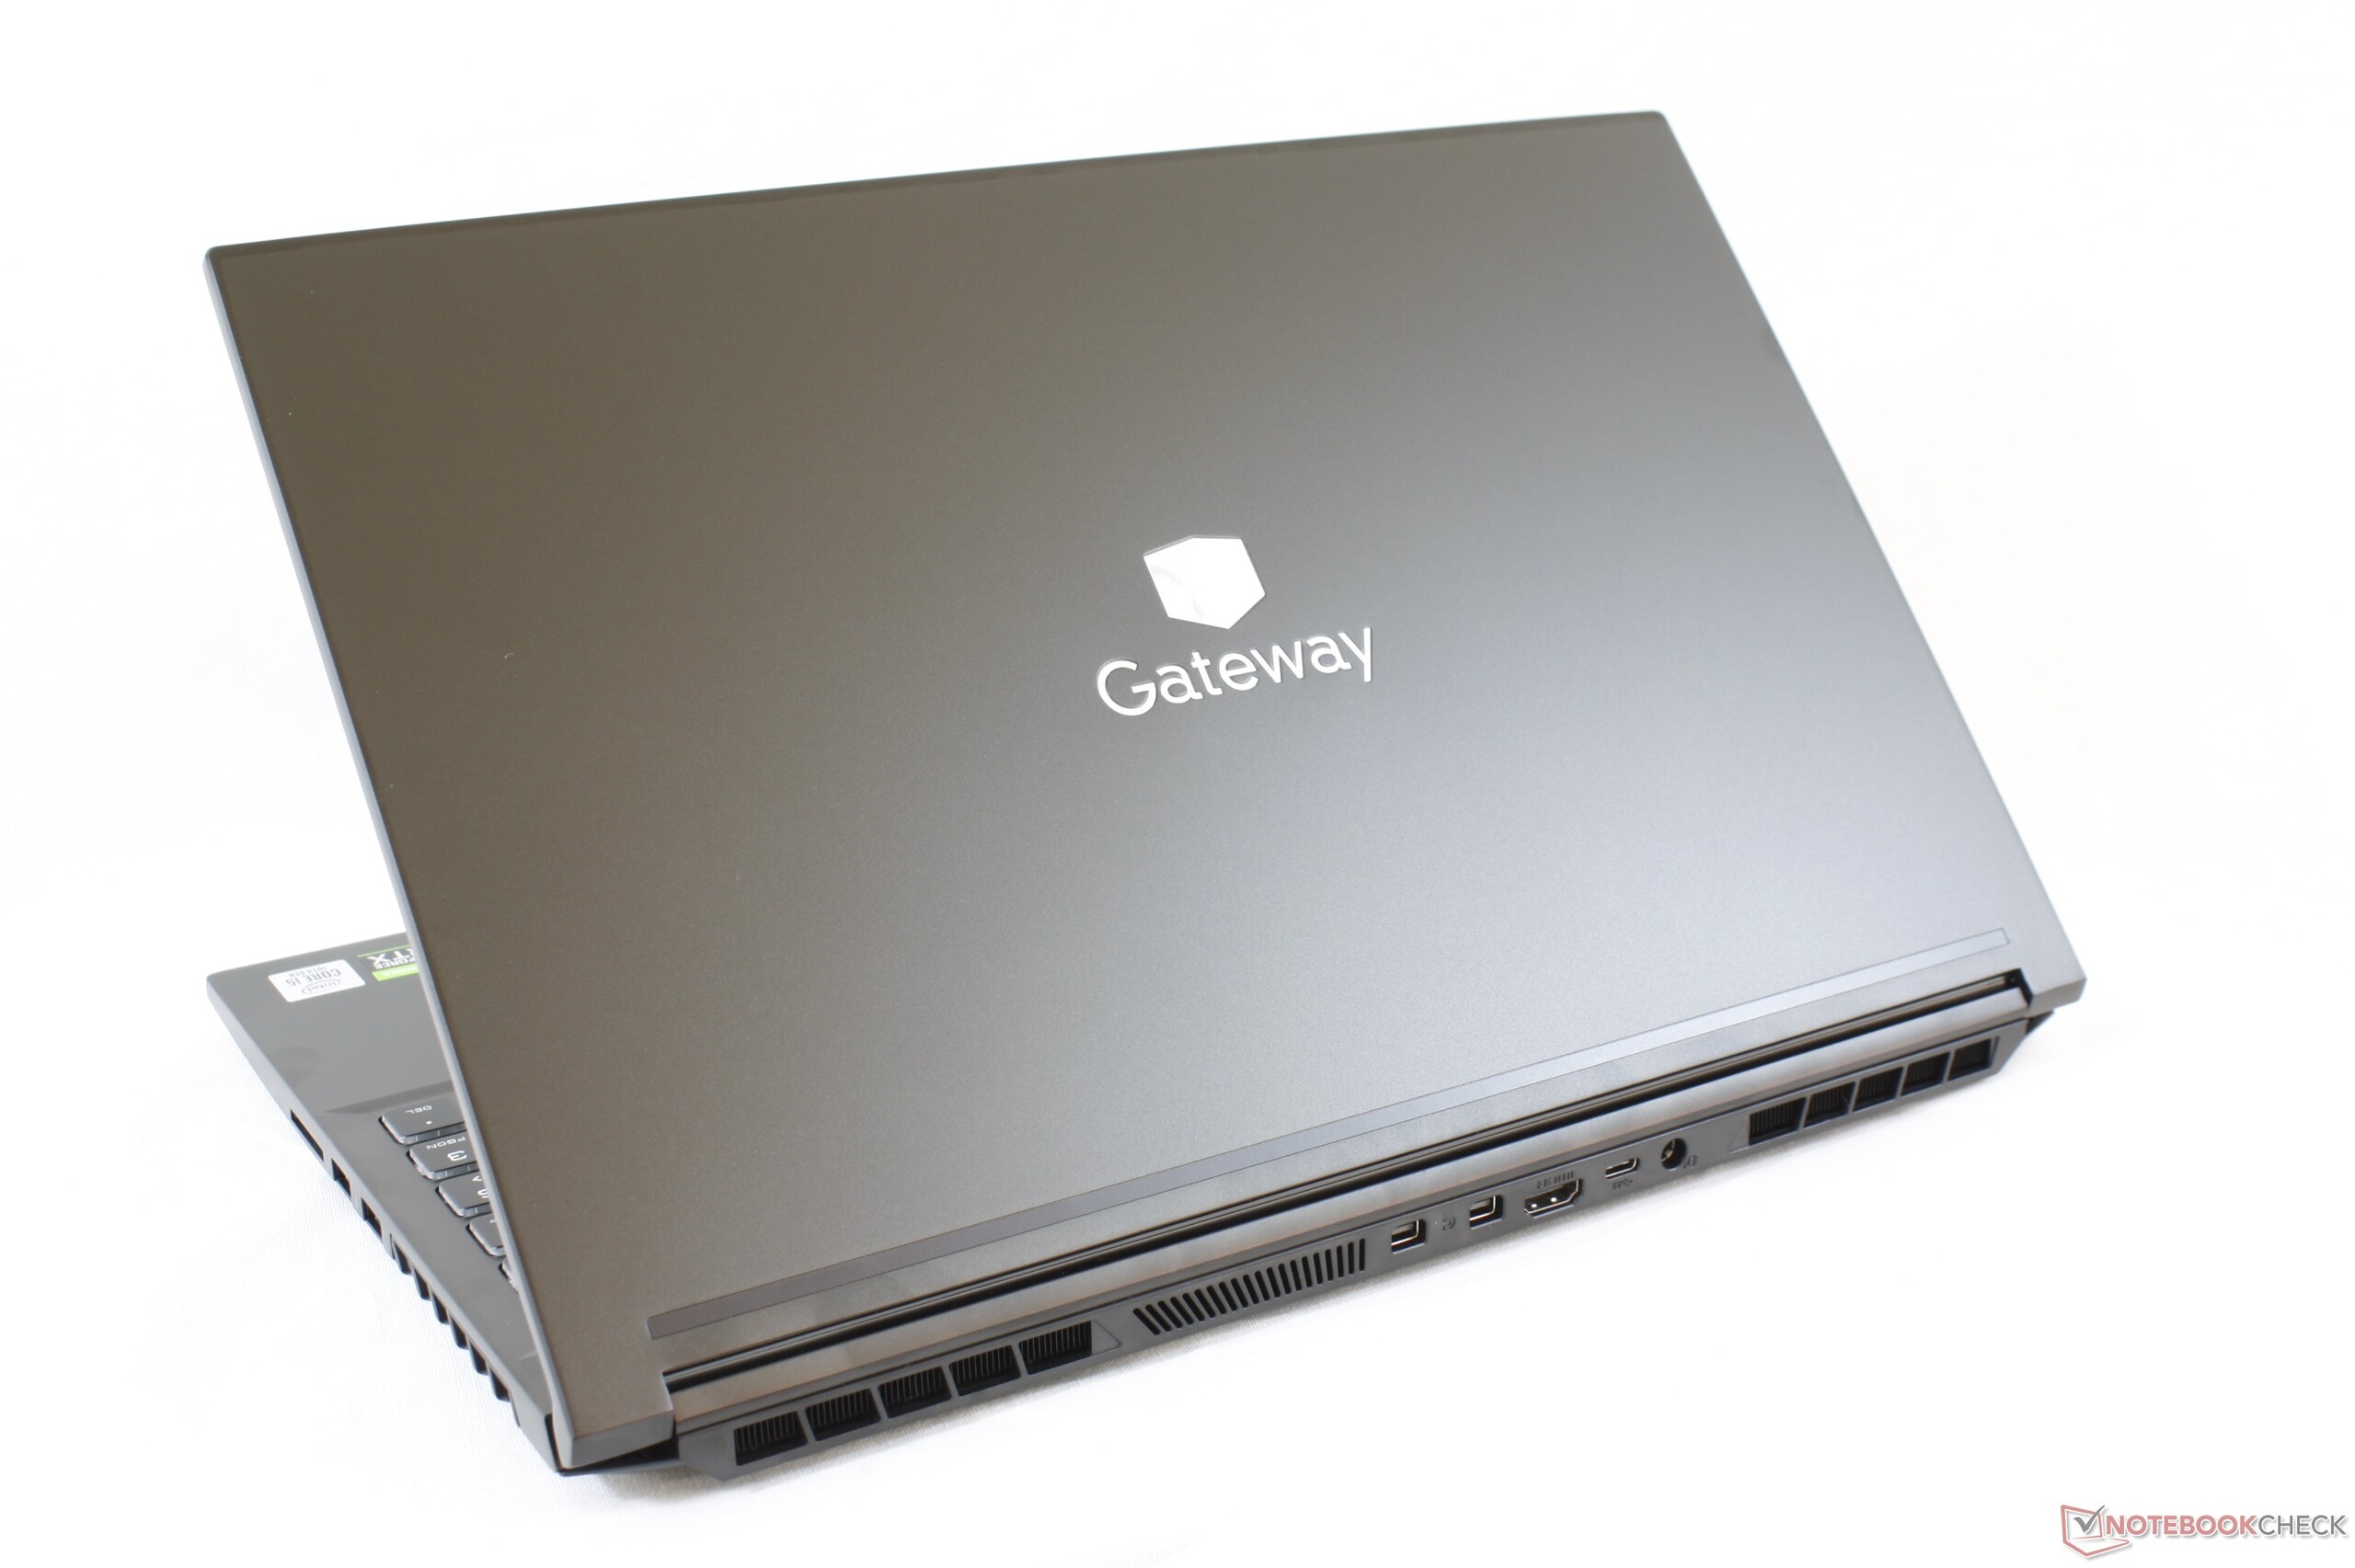
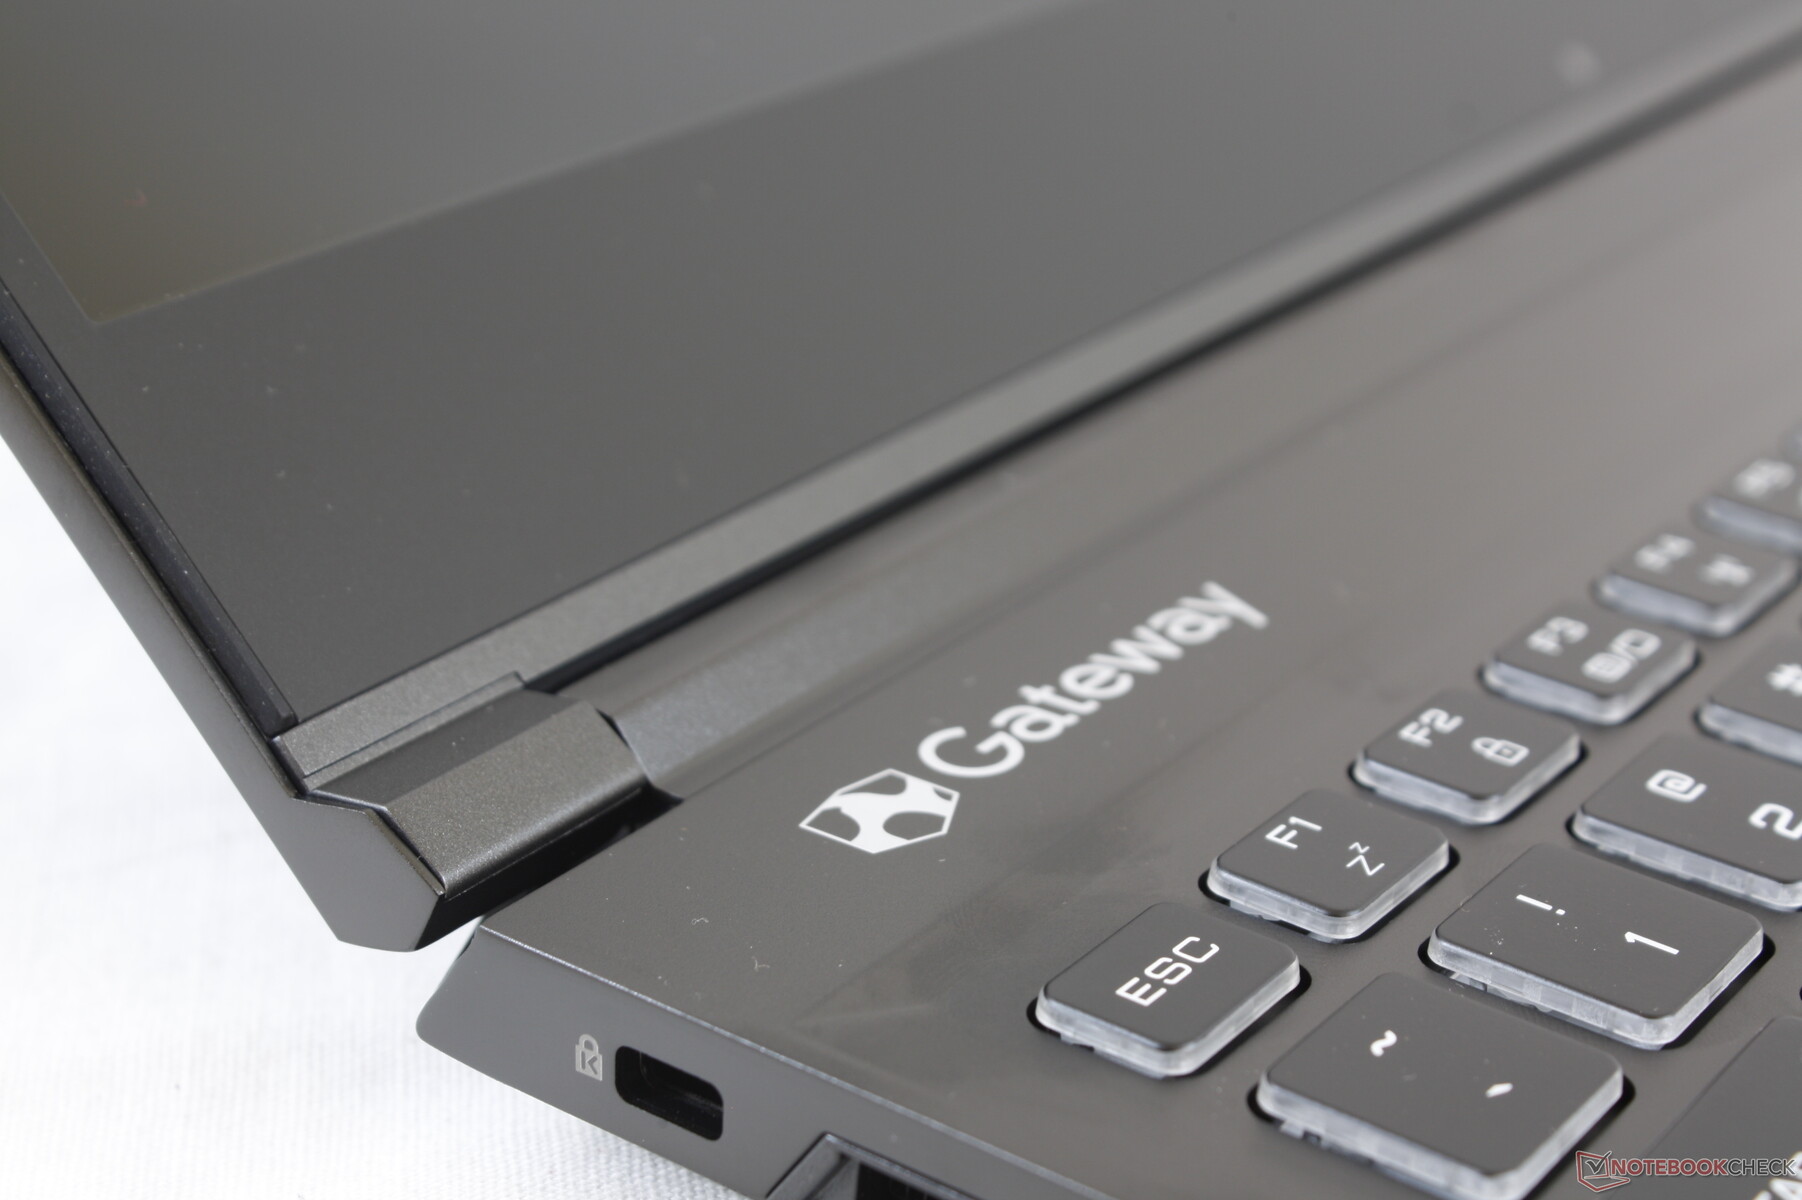
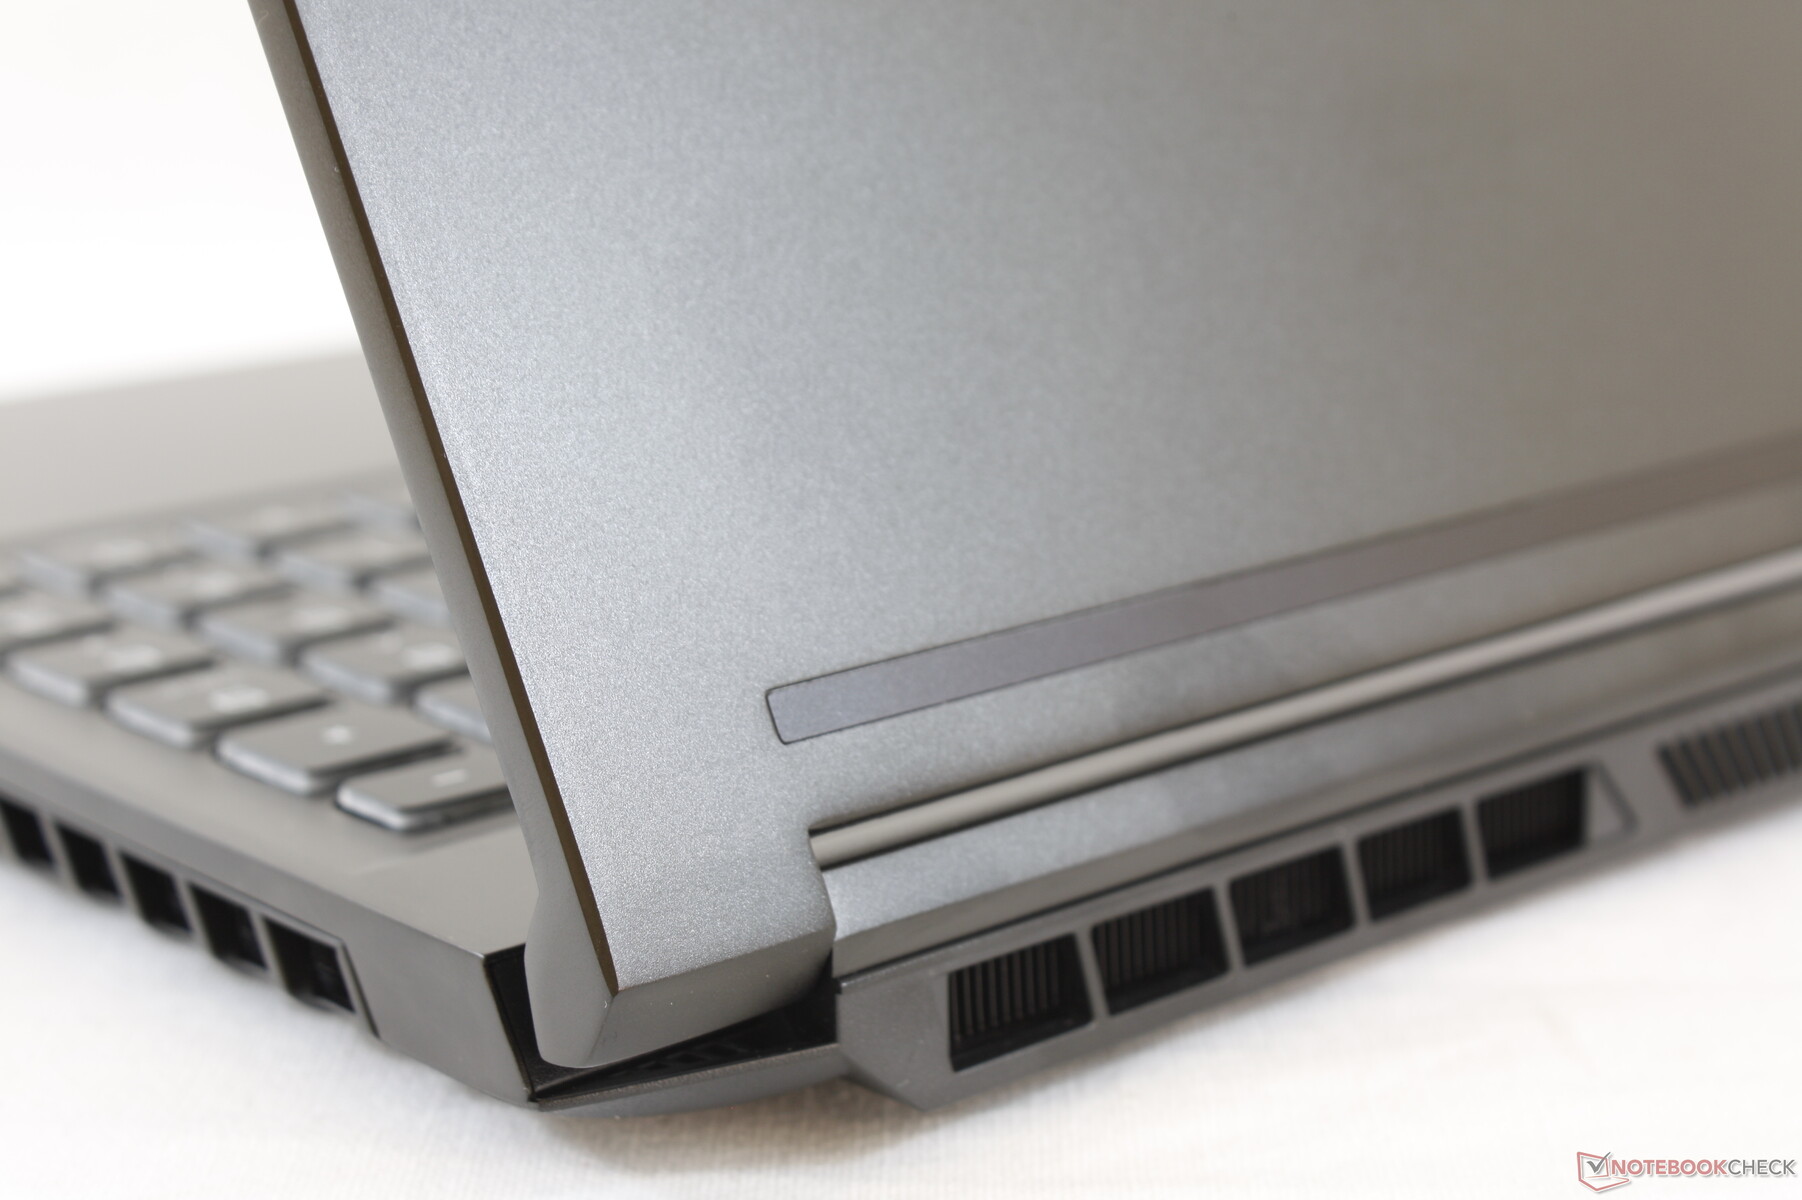
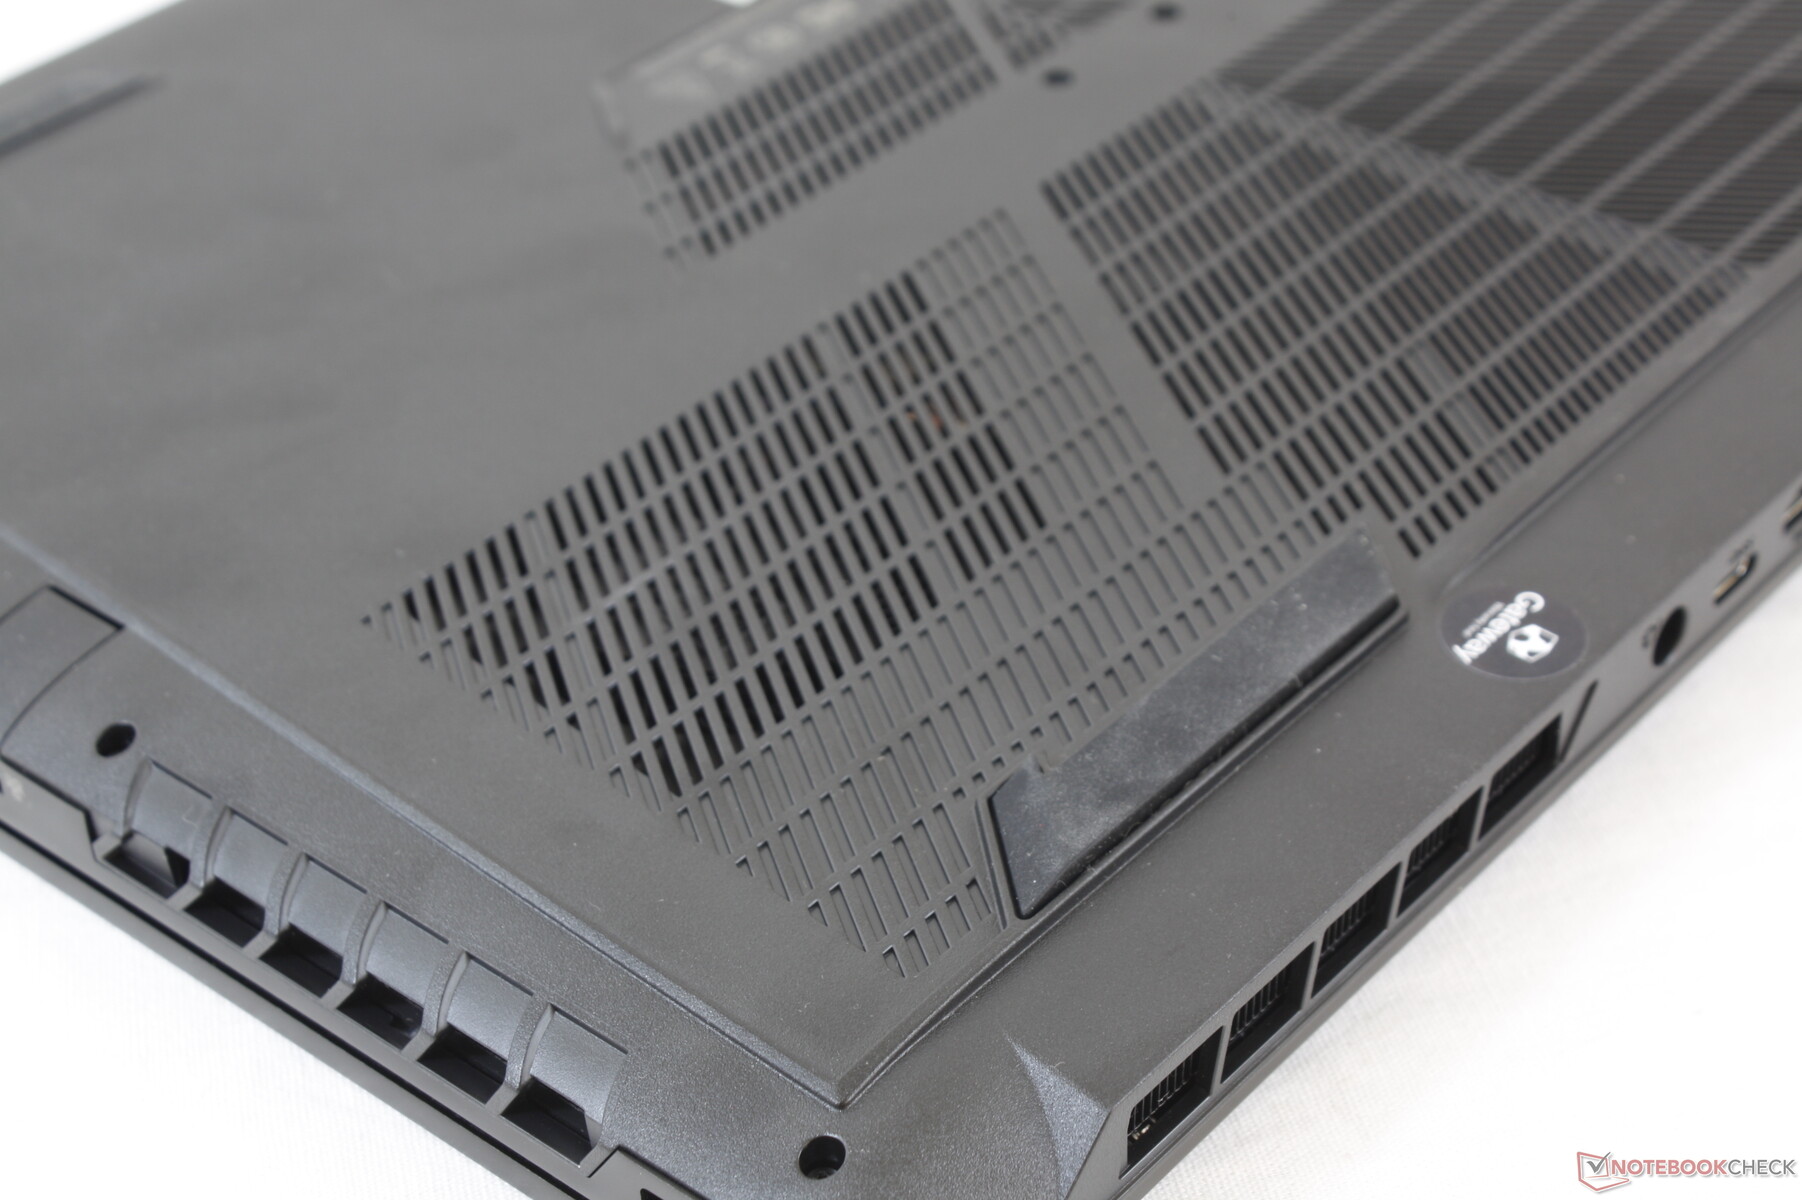
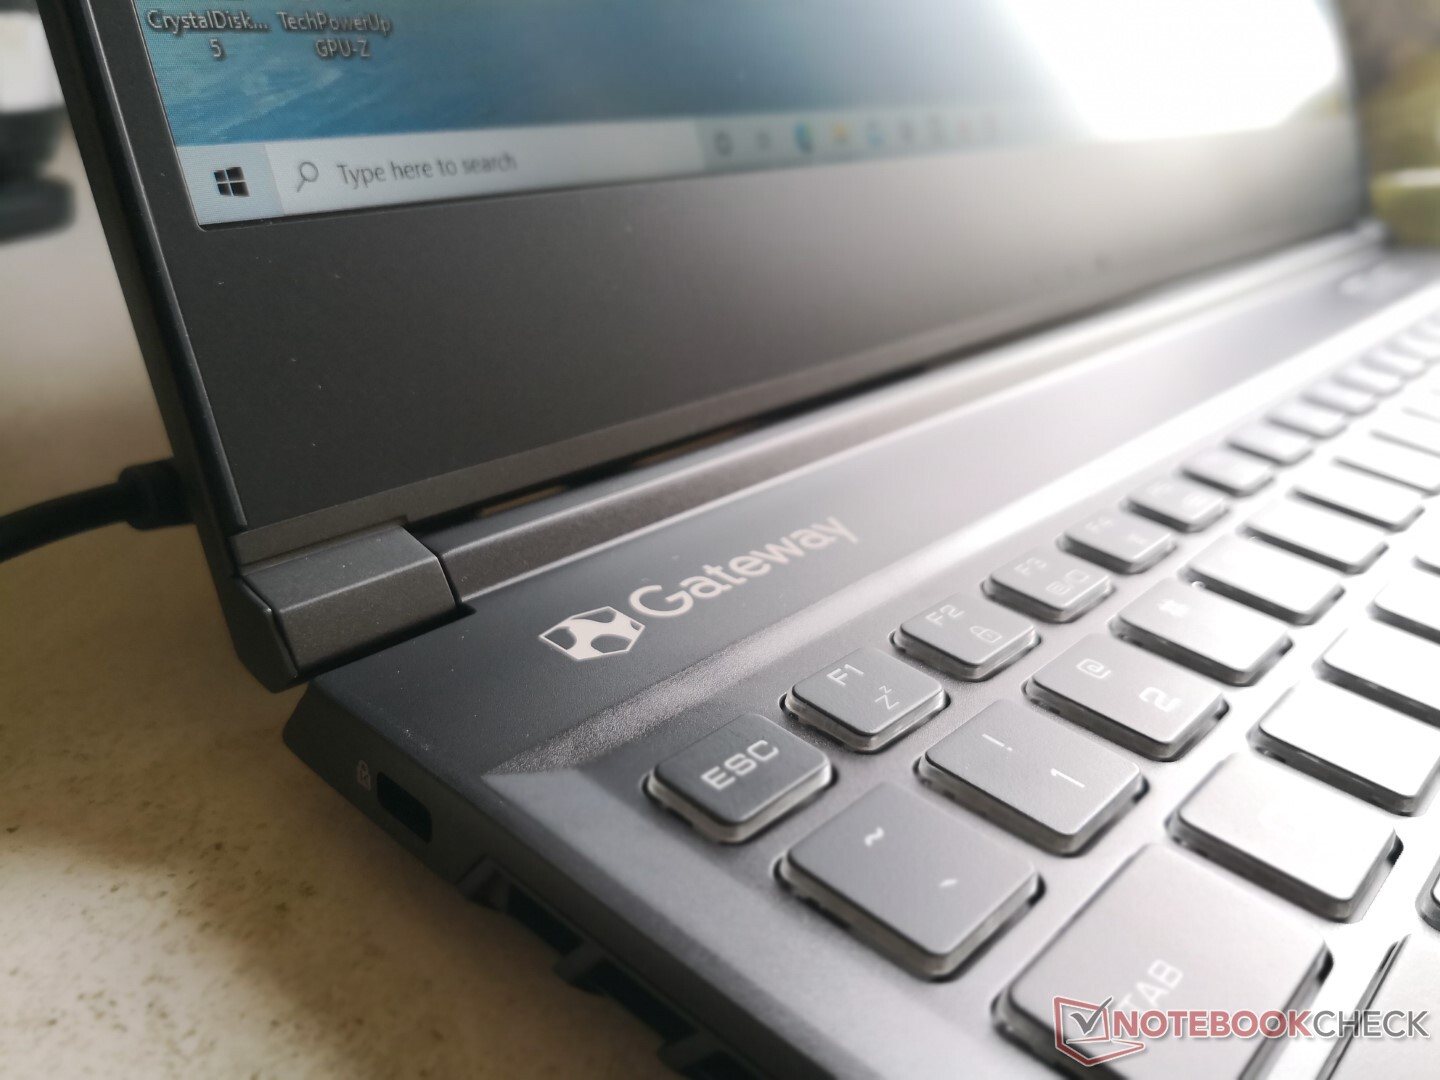
Carcasa
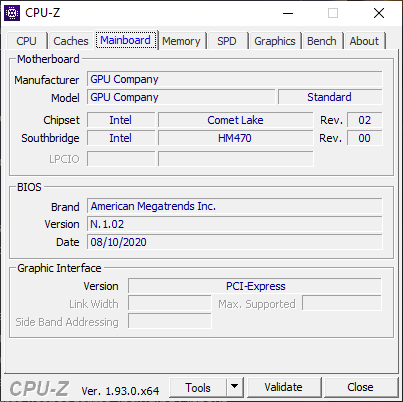
Gateway no diseña sus propios portátiles desde cero. En su lugar, el Gateway Creator 15 utiliza un chasis de etiqueta blanca de la ODM china Tongfang. Muchos revendedores usan este mismo diseño, incluyendo Eluktronics y Schenker.
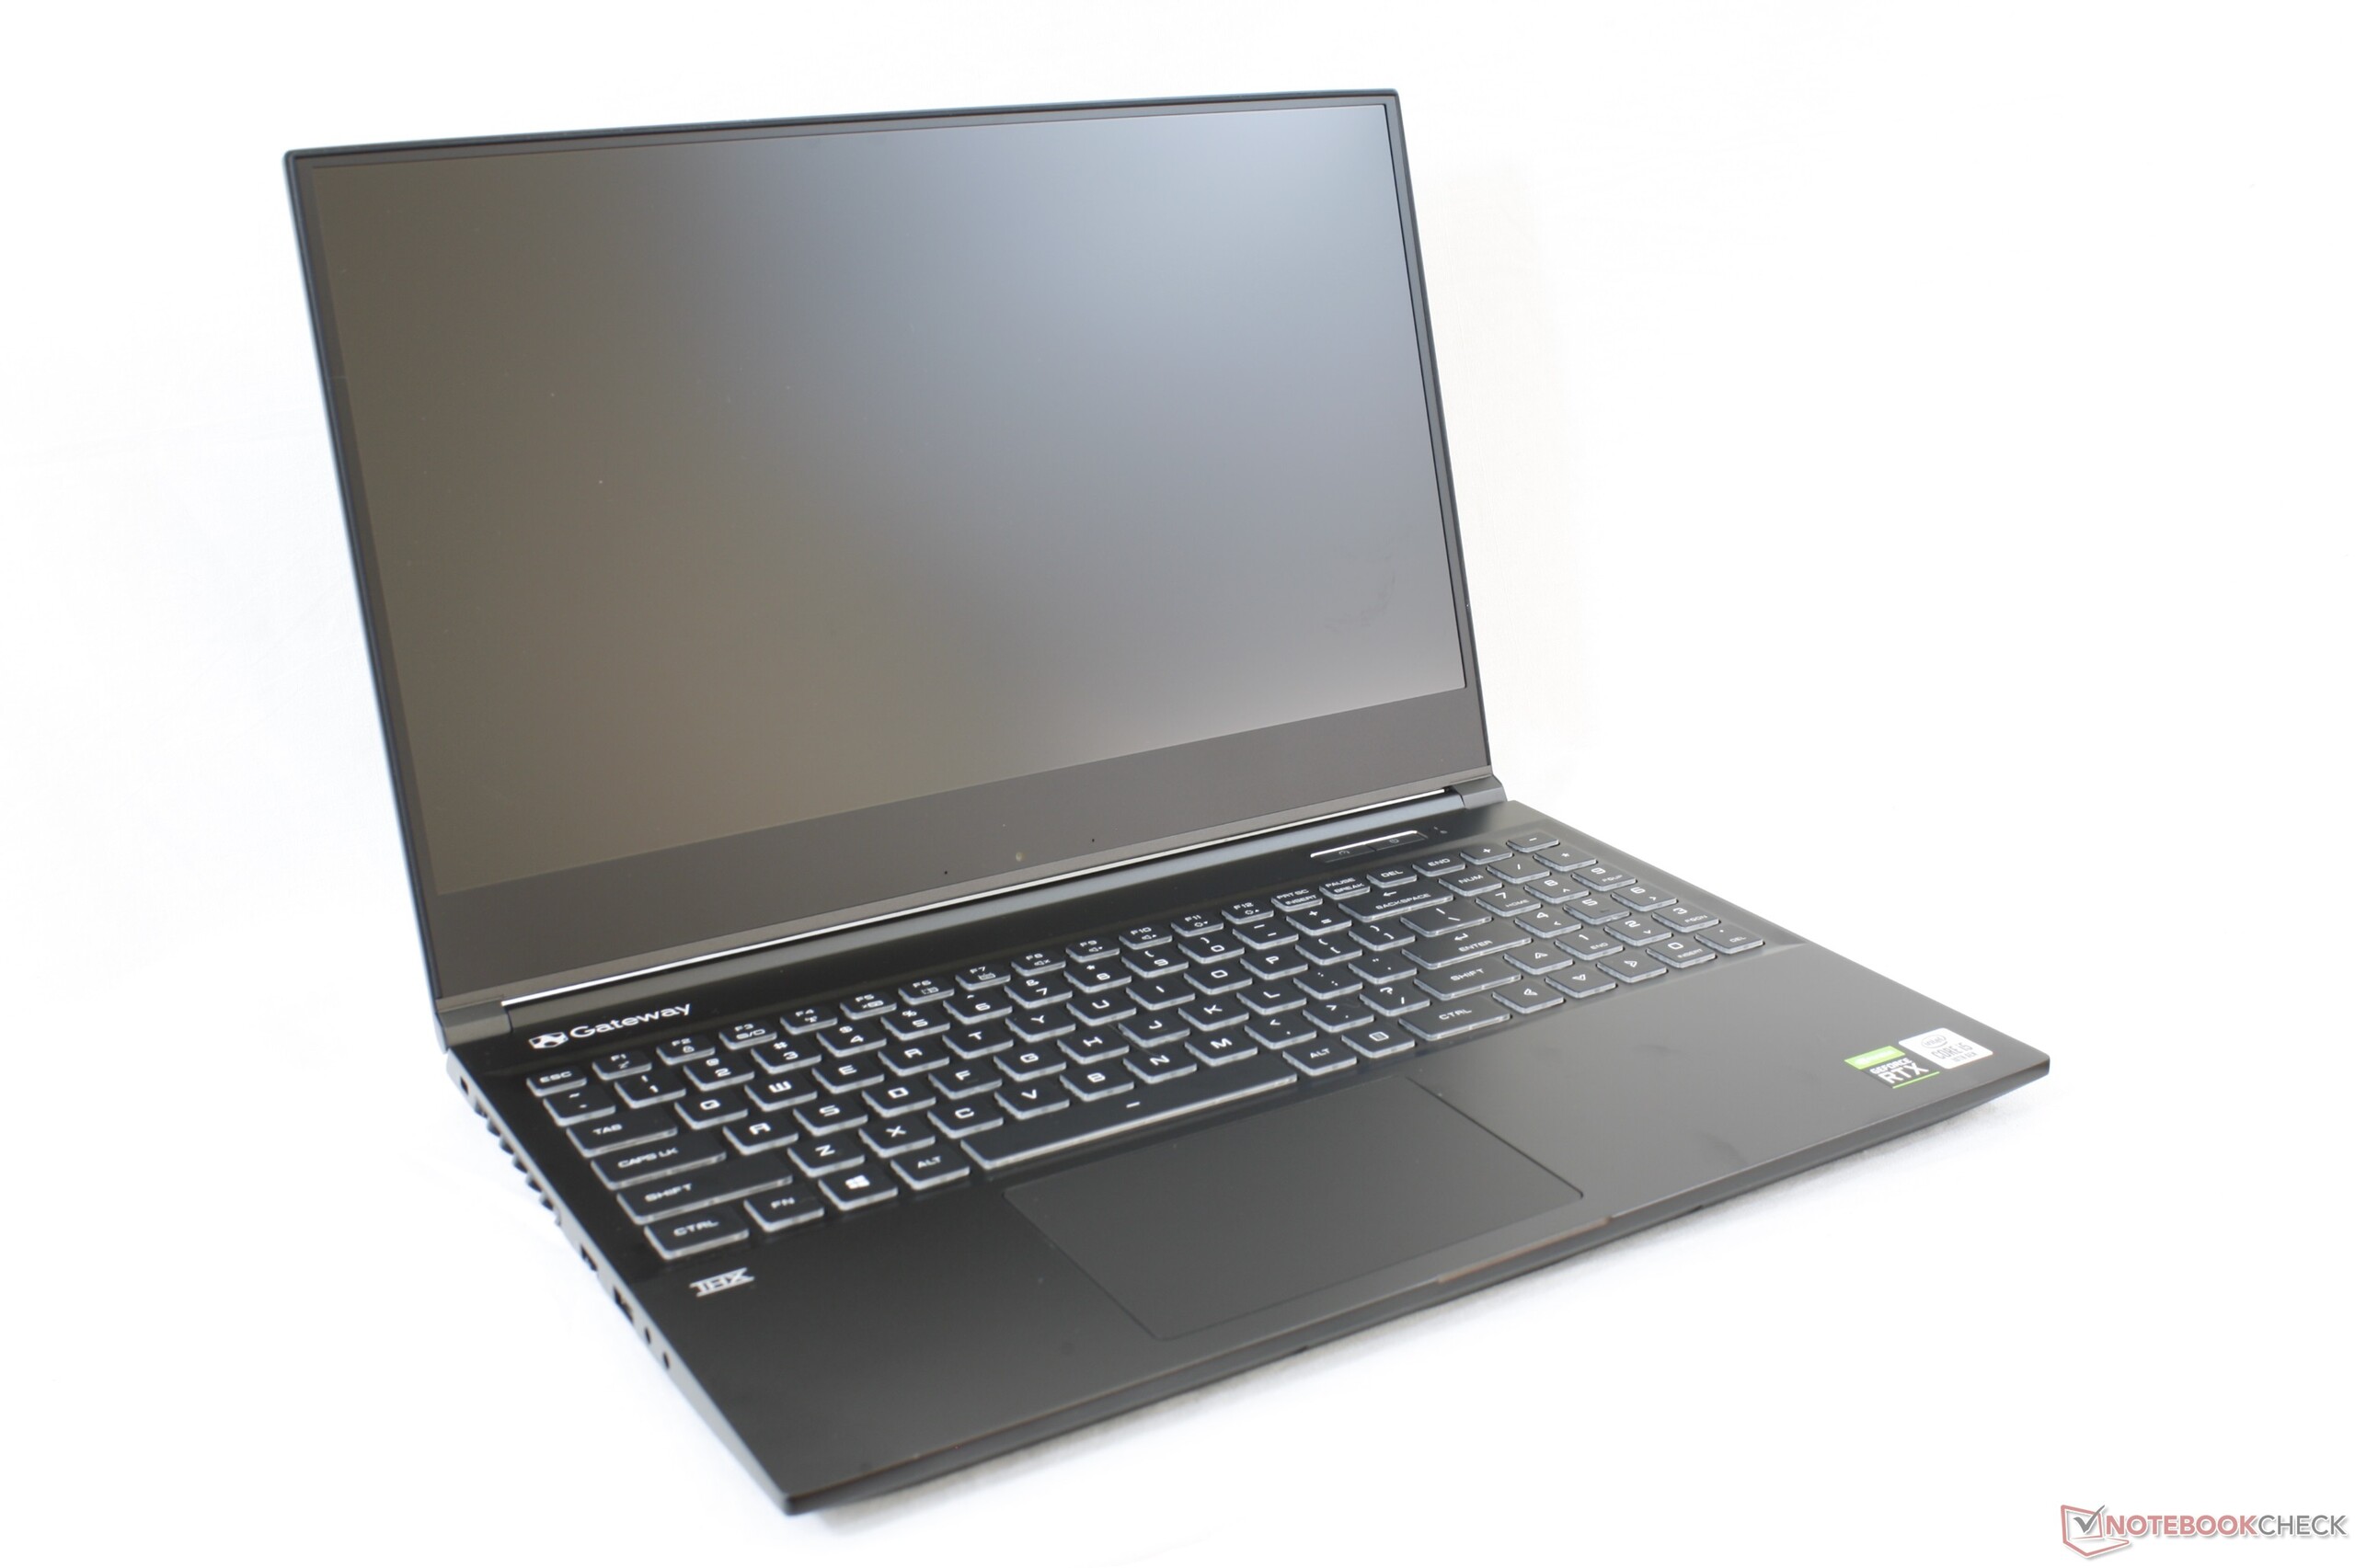
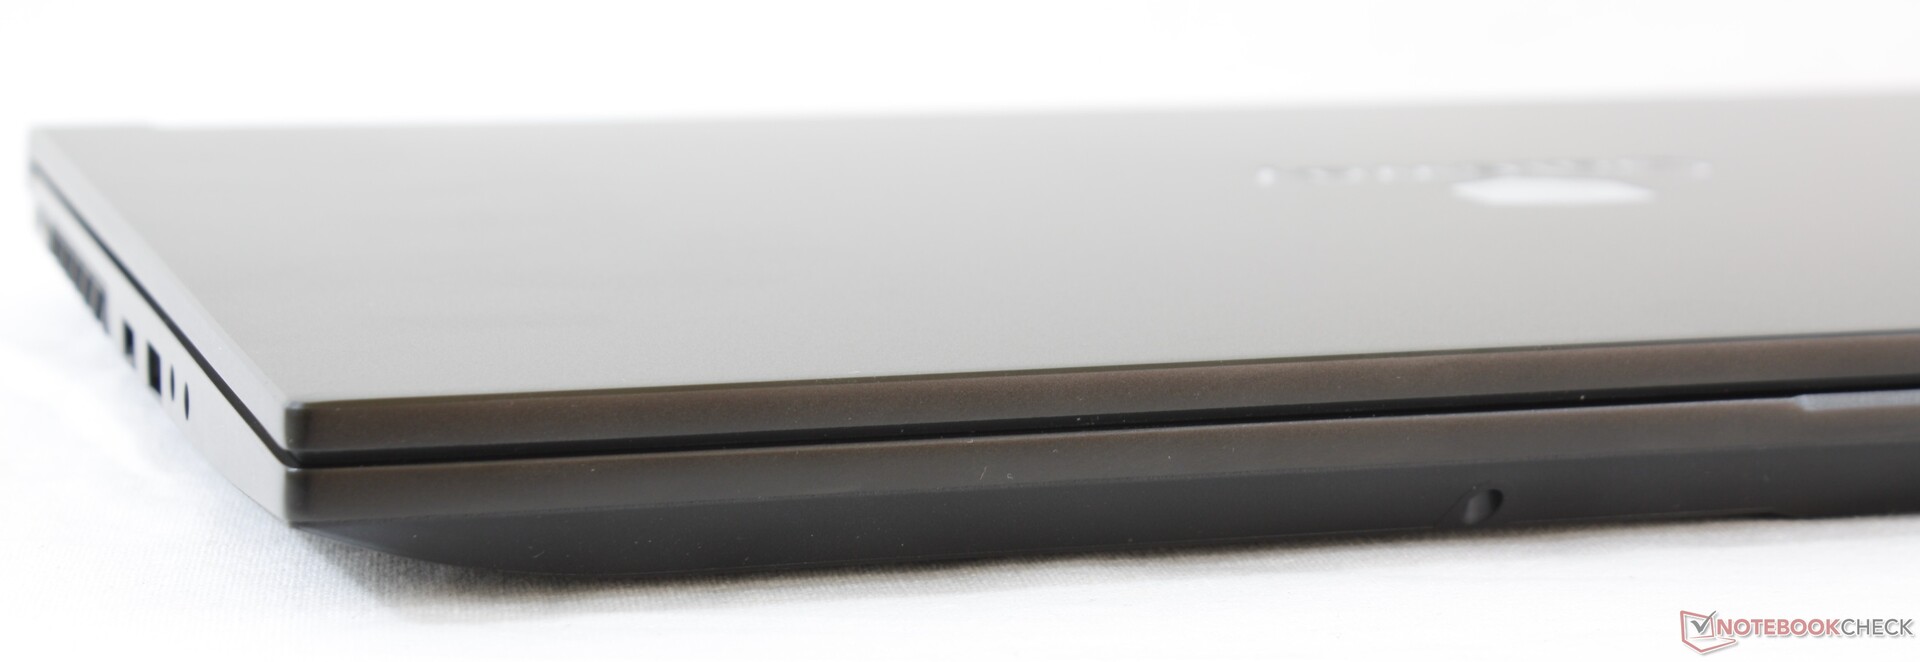
En términos de tamaño y peso, el Gateway es ligeramente más pequeño que el Asus Zephyrus G15 GA502 y pesa más o menos lo mismo que la mayoría de los otros delgados portátiles para juegos de 15,6 pulgadas. La Razer Blade 15 es aún más pequeña pero, por supuesto, más cara.
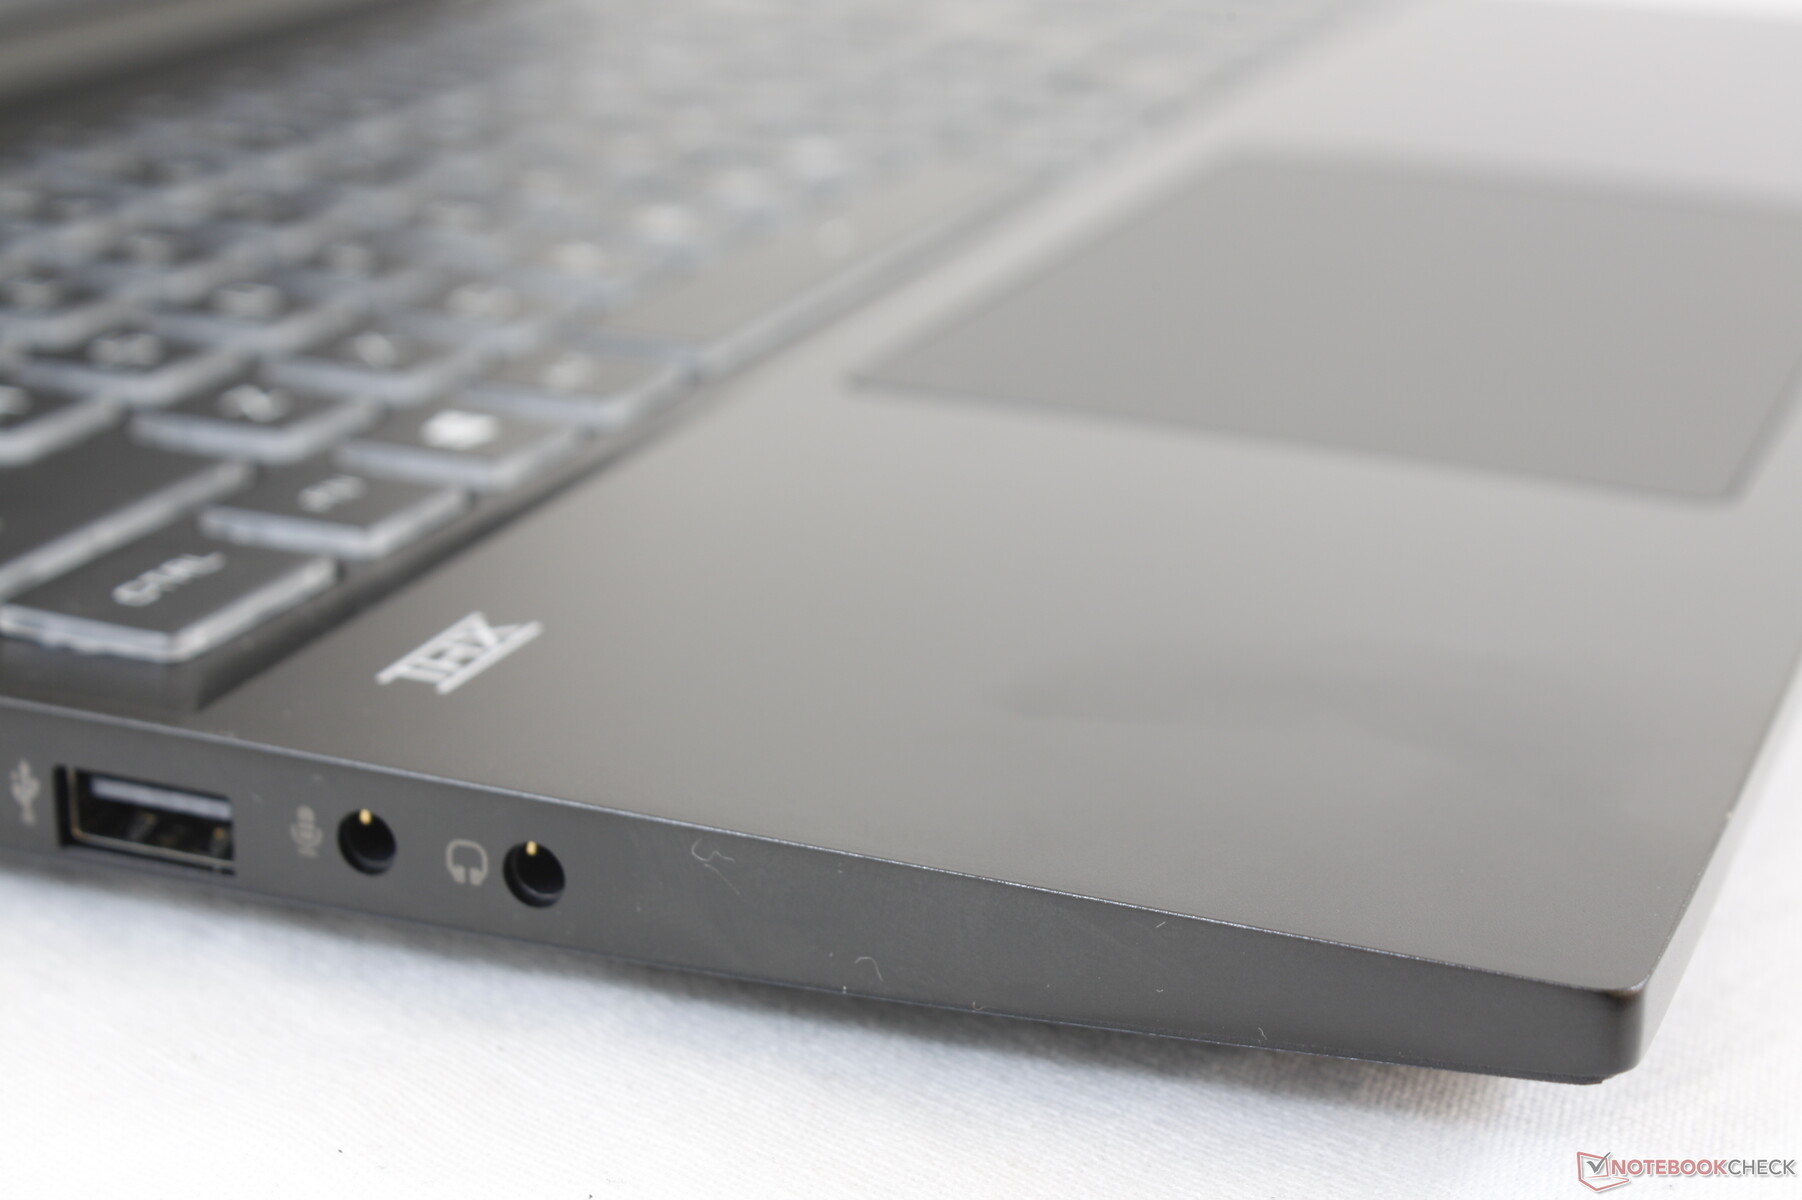
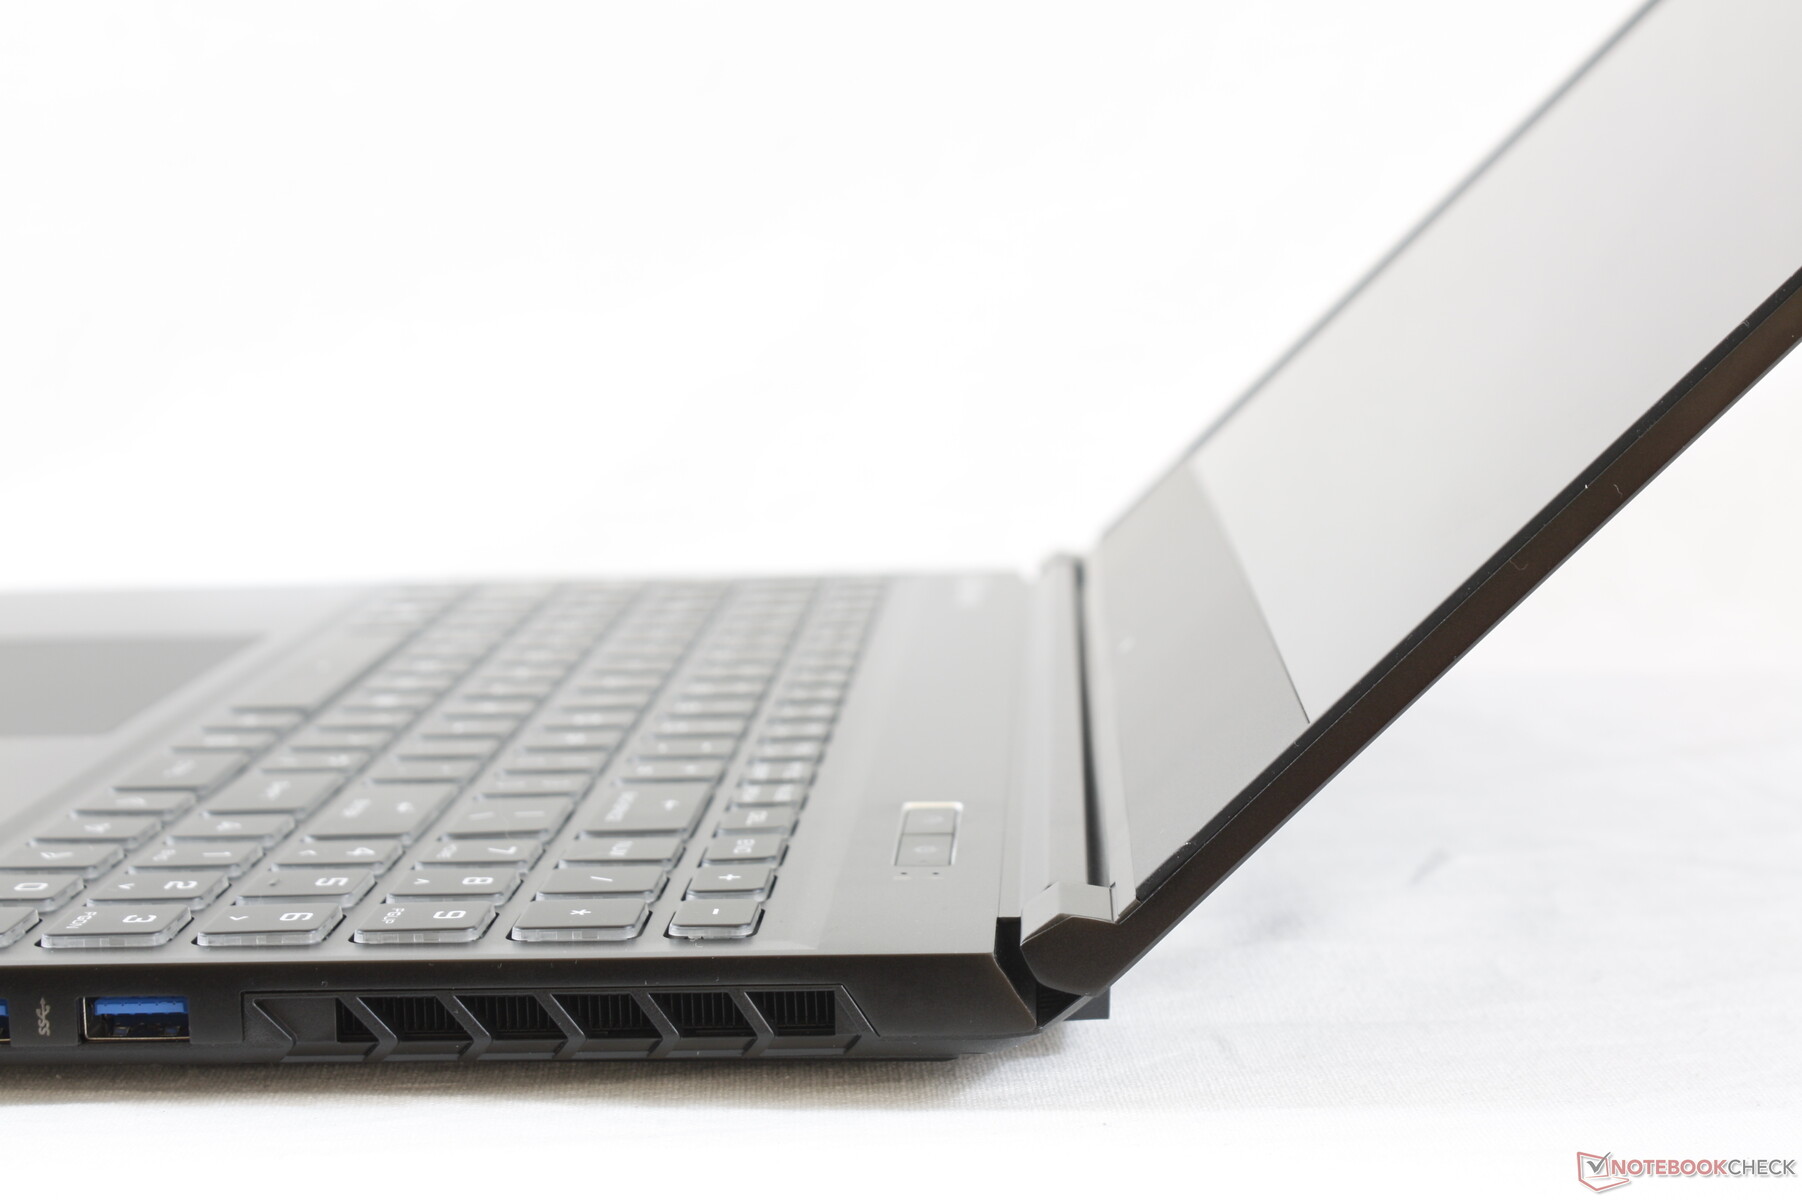
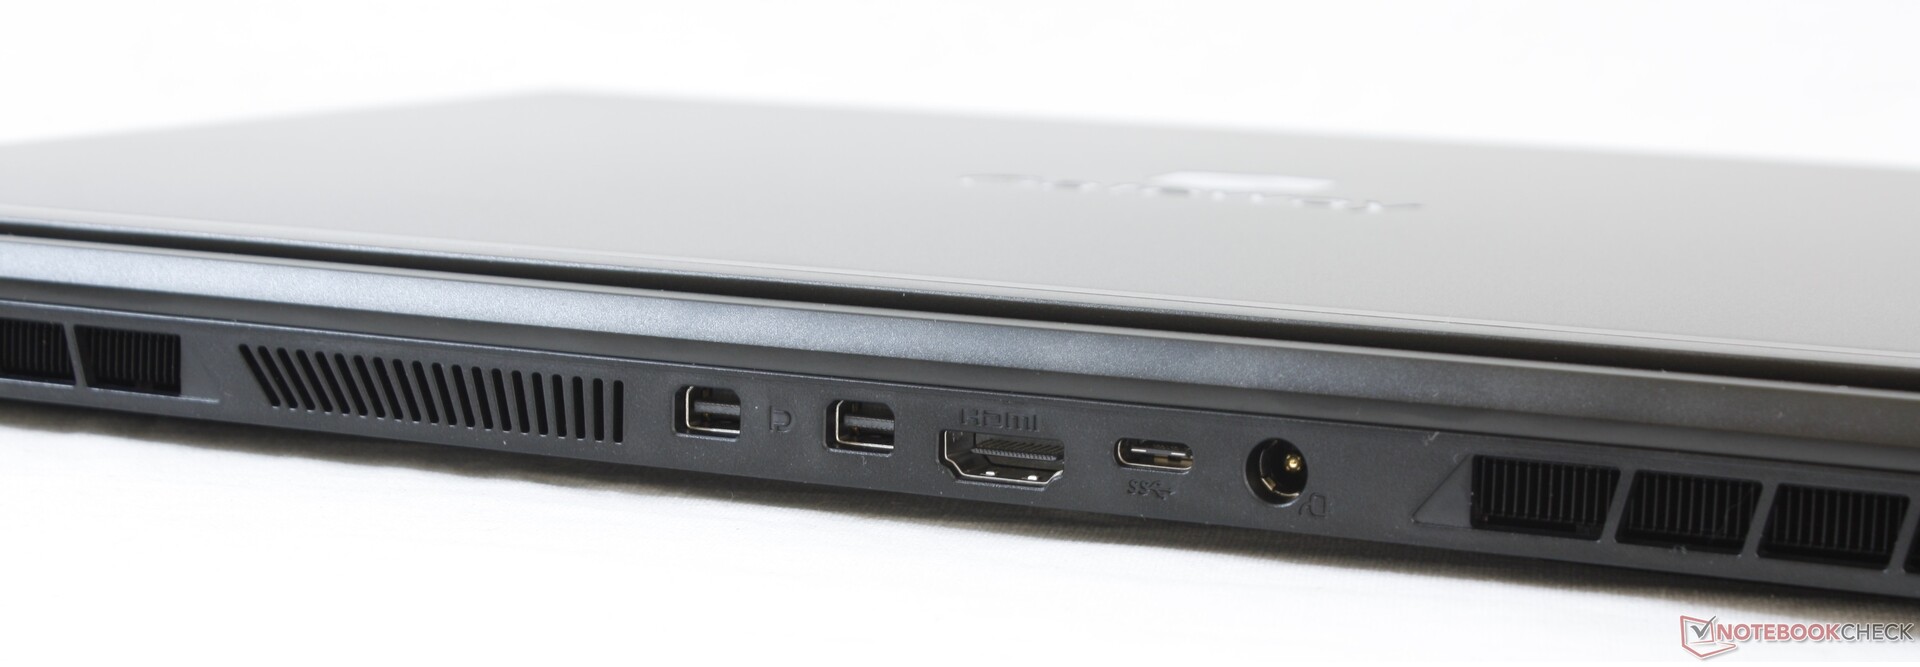
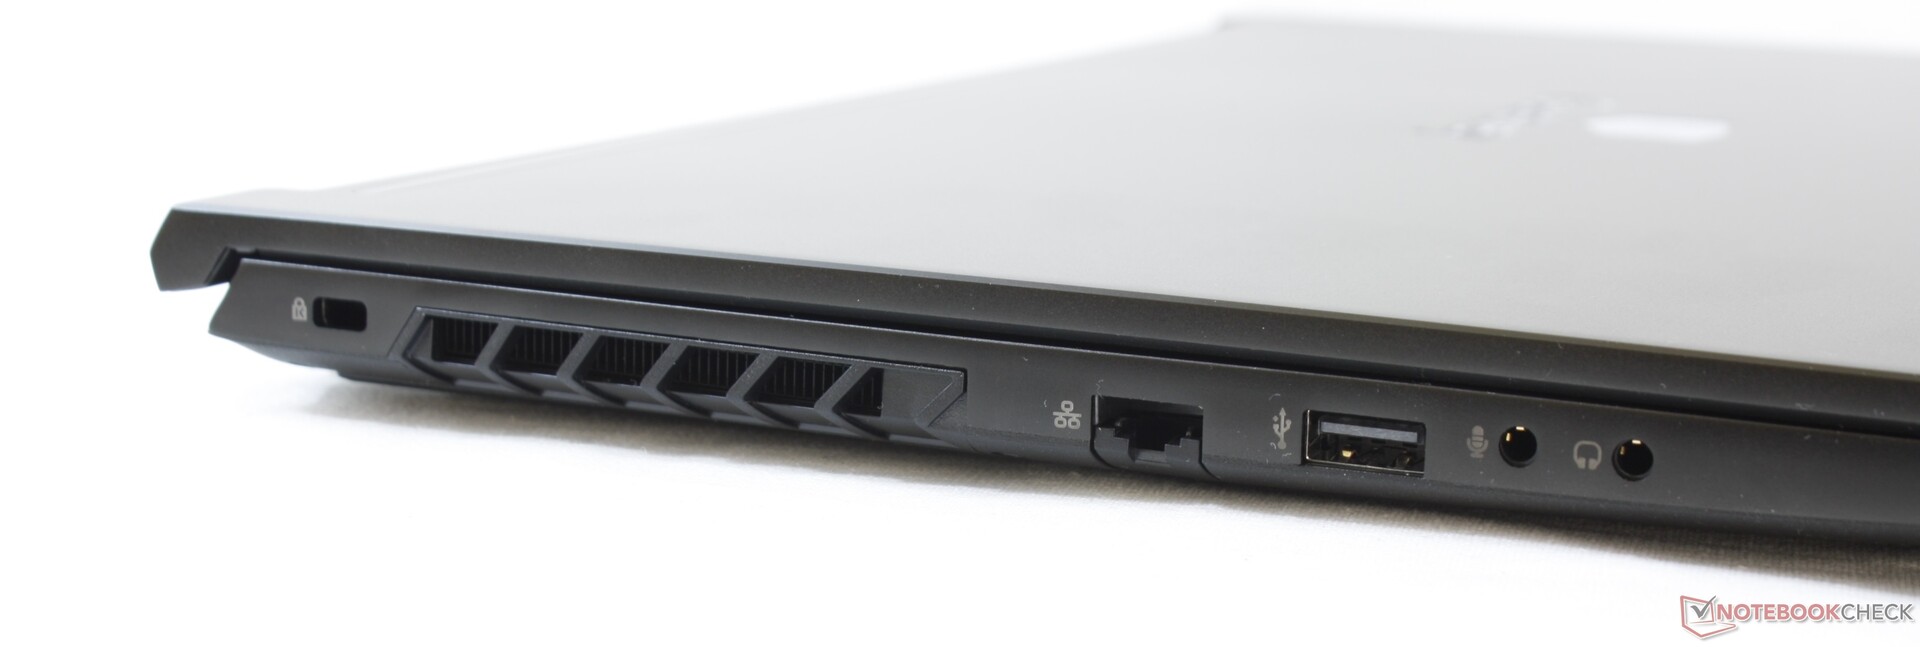
Conectividad
Los puertos duales de Mini-DisplayPort son la característica más notable aquí cuando se comparan con otros portátiles. Ten en cuenta que el puerto USB-C trasero no es compatible con la salida de vídeo.
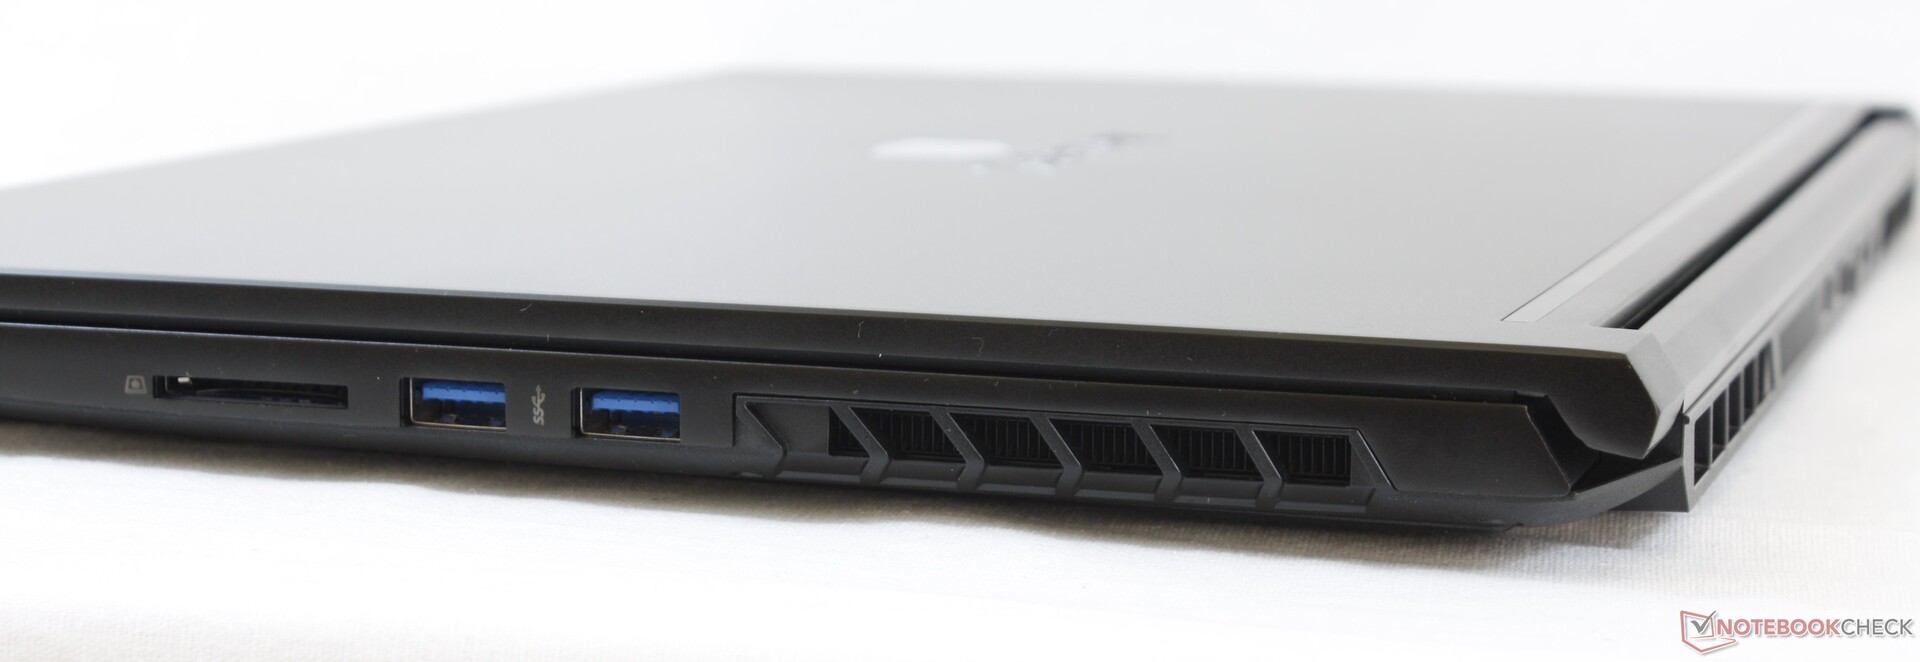
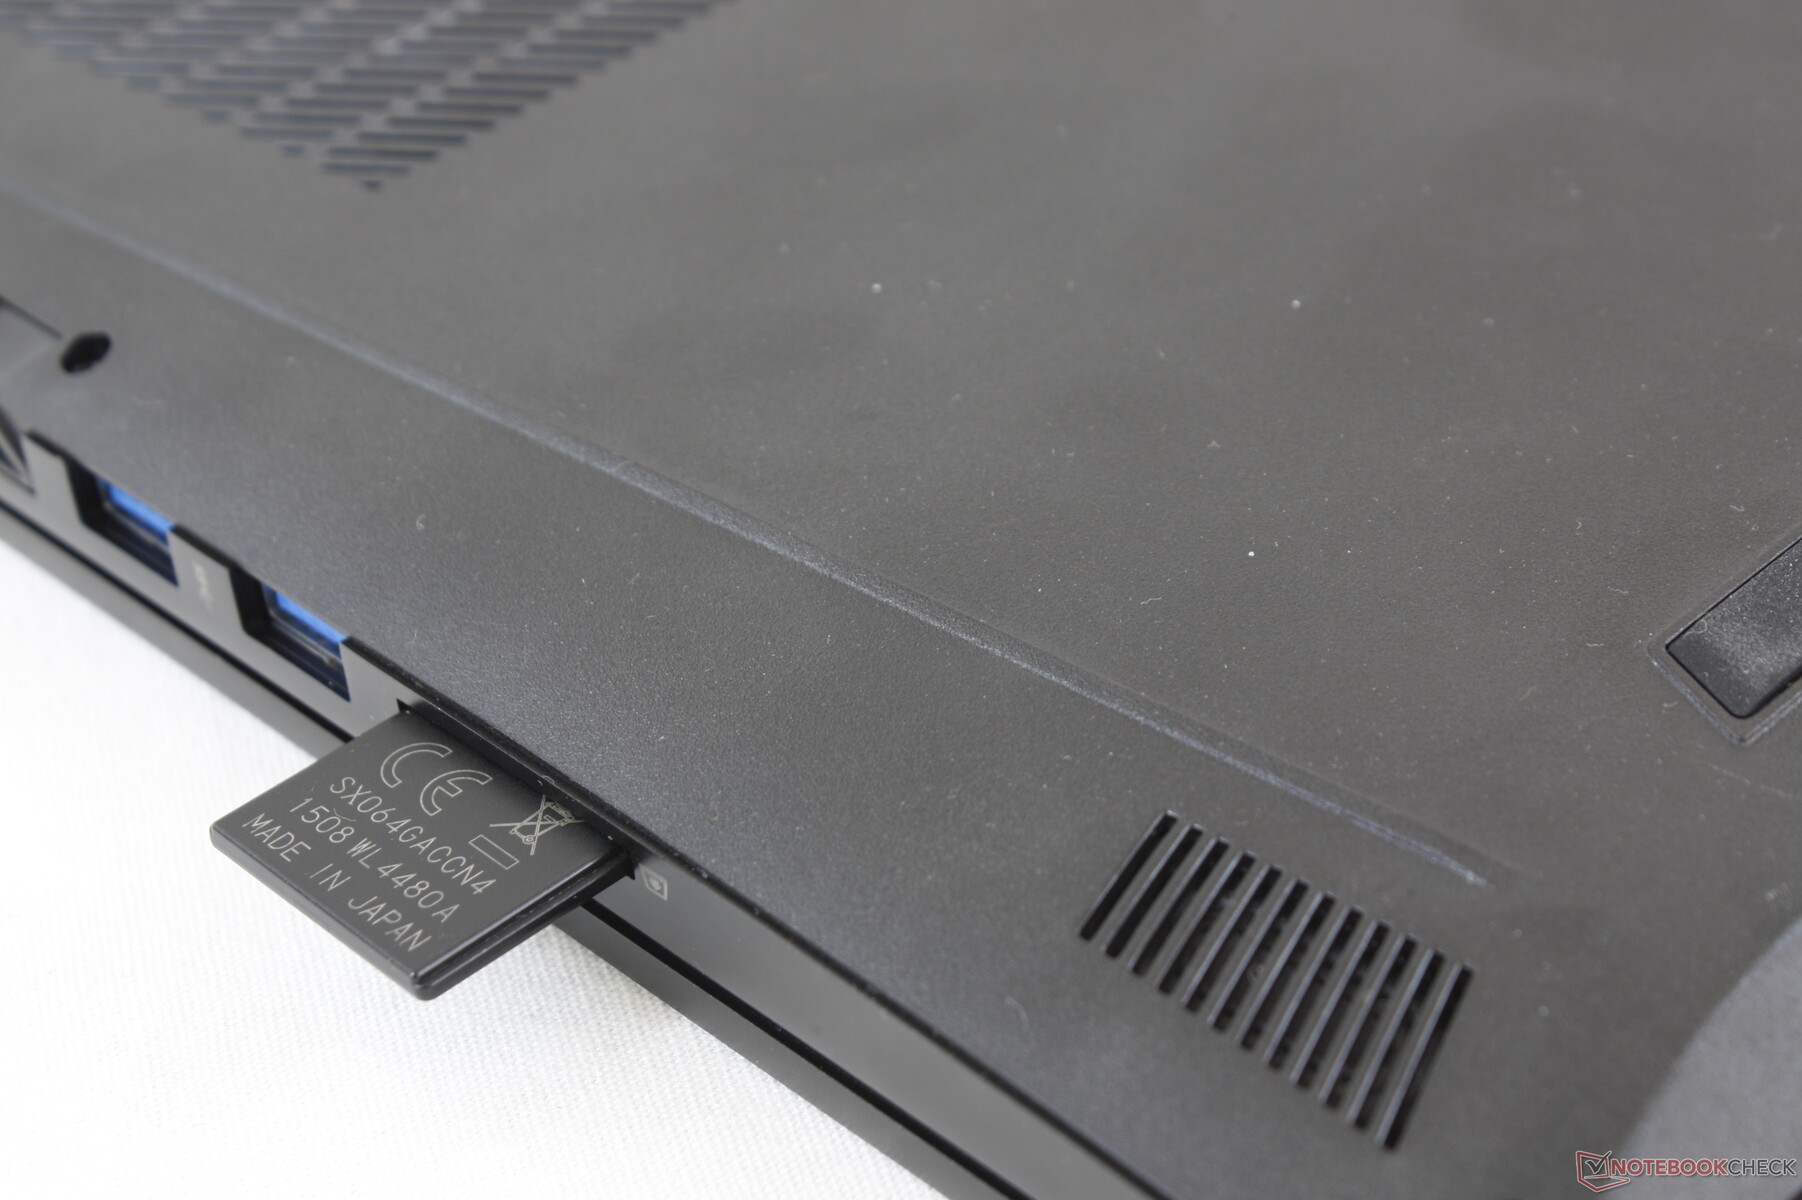
Lector de tarjetas SD
| SD Card Reader | |
| average JPG Copy Test (av. of 3 runs) | |
| Aorus 5 KB (Toshiba Exceria Pro SDXC 64 GB UHS-II) | |
| HP Omen 15-ek0456ng (Toshiba Exceria Pro SDXC 64 GB UHS-II) | |
| Schenker XMG Core 15 GK5NR0O (Toshiba Exceria Pro SDXC 64 GB UHS-II) | |
| Gateway Creator Series 15.6 GWTN156-3BK (Toshiba Exceria Pro SDXC 64 GB UHS-II) | |
| maximum AS SSD Seq Read Test (1GB) | |
| Aorus 5 KB (Toshiba Exceria Pro SDXC 64 GB UHS-II) | |
| HP Omen 15-ek0456ng (Toshiba Exceria Pro SDXC 64 GB UHS-II) | |
| Schenker XMG Core 15 GK5NR0O (Toshiba Exceria Pro SDXC 64 GB UHS-II) | |
| Gateway Creator Series 15.6 GWTN156-3BK (Toshiba Exceria Pro SDXC 64 GB UHS-II) | |
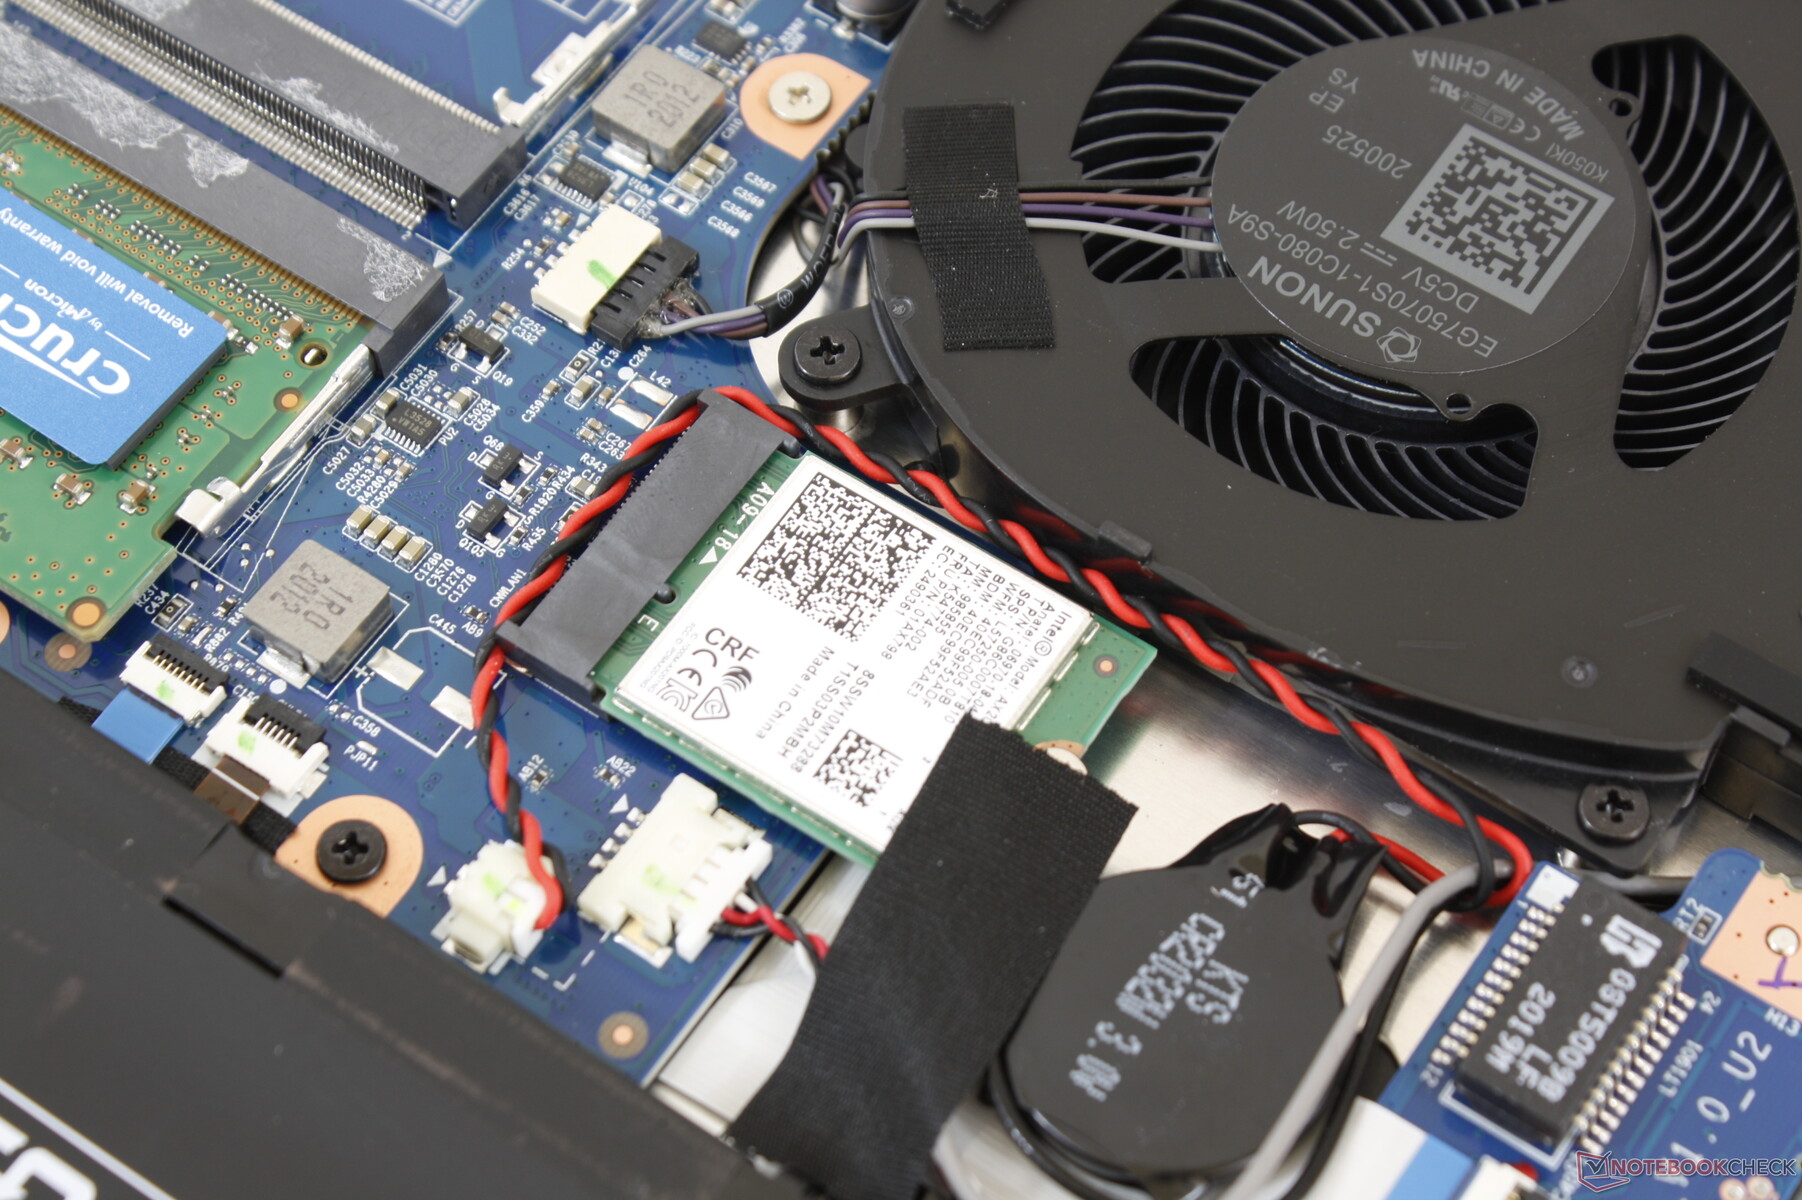
Comunicación
El Intel AX201 viene de serie para la conexión Wi-Fi 6 y Bluetooth 5.1. No tuvimos ningún problema cuando lo emparejamos con nuestro enrutador de prueba Netgear RAX200.
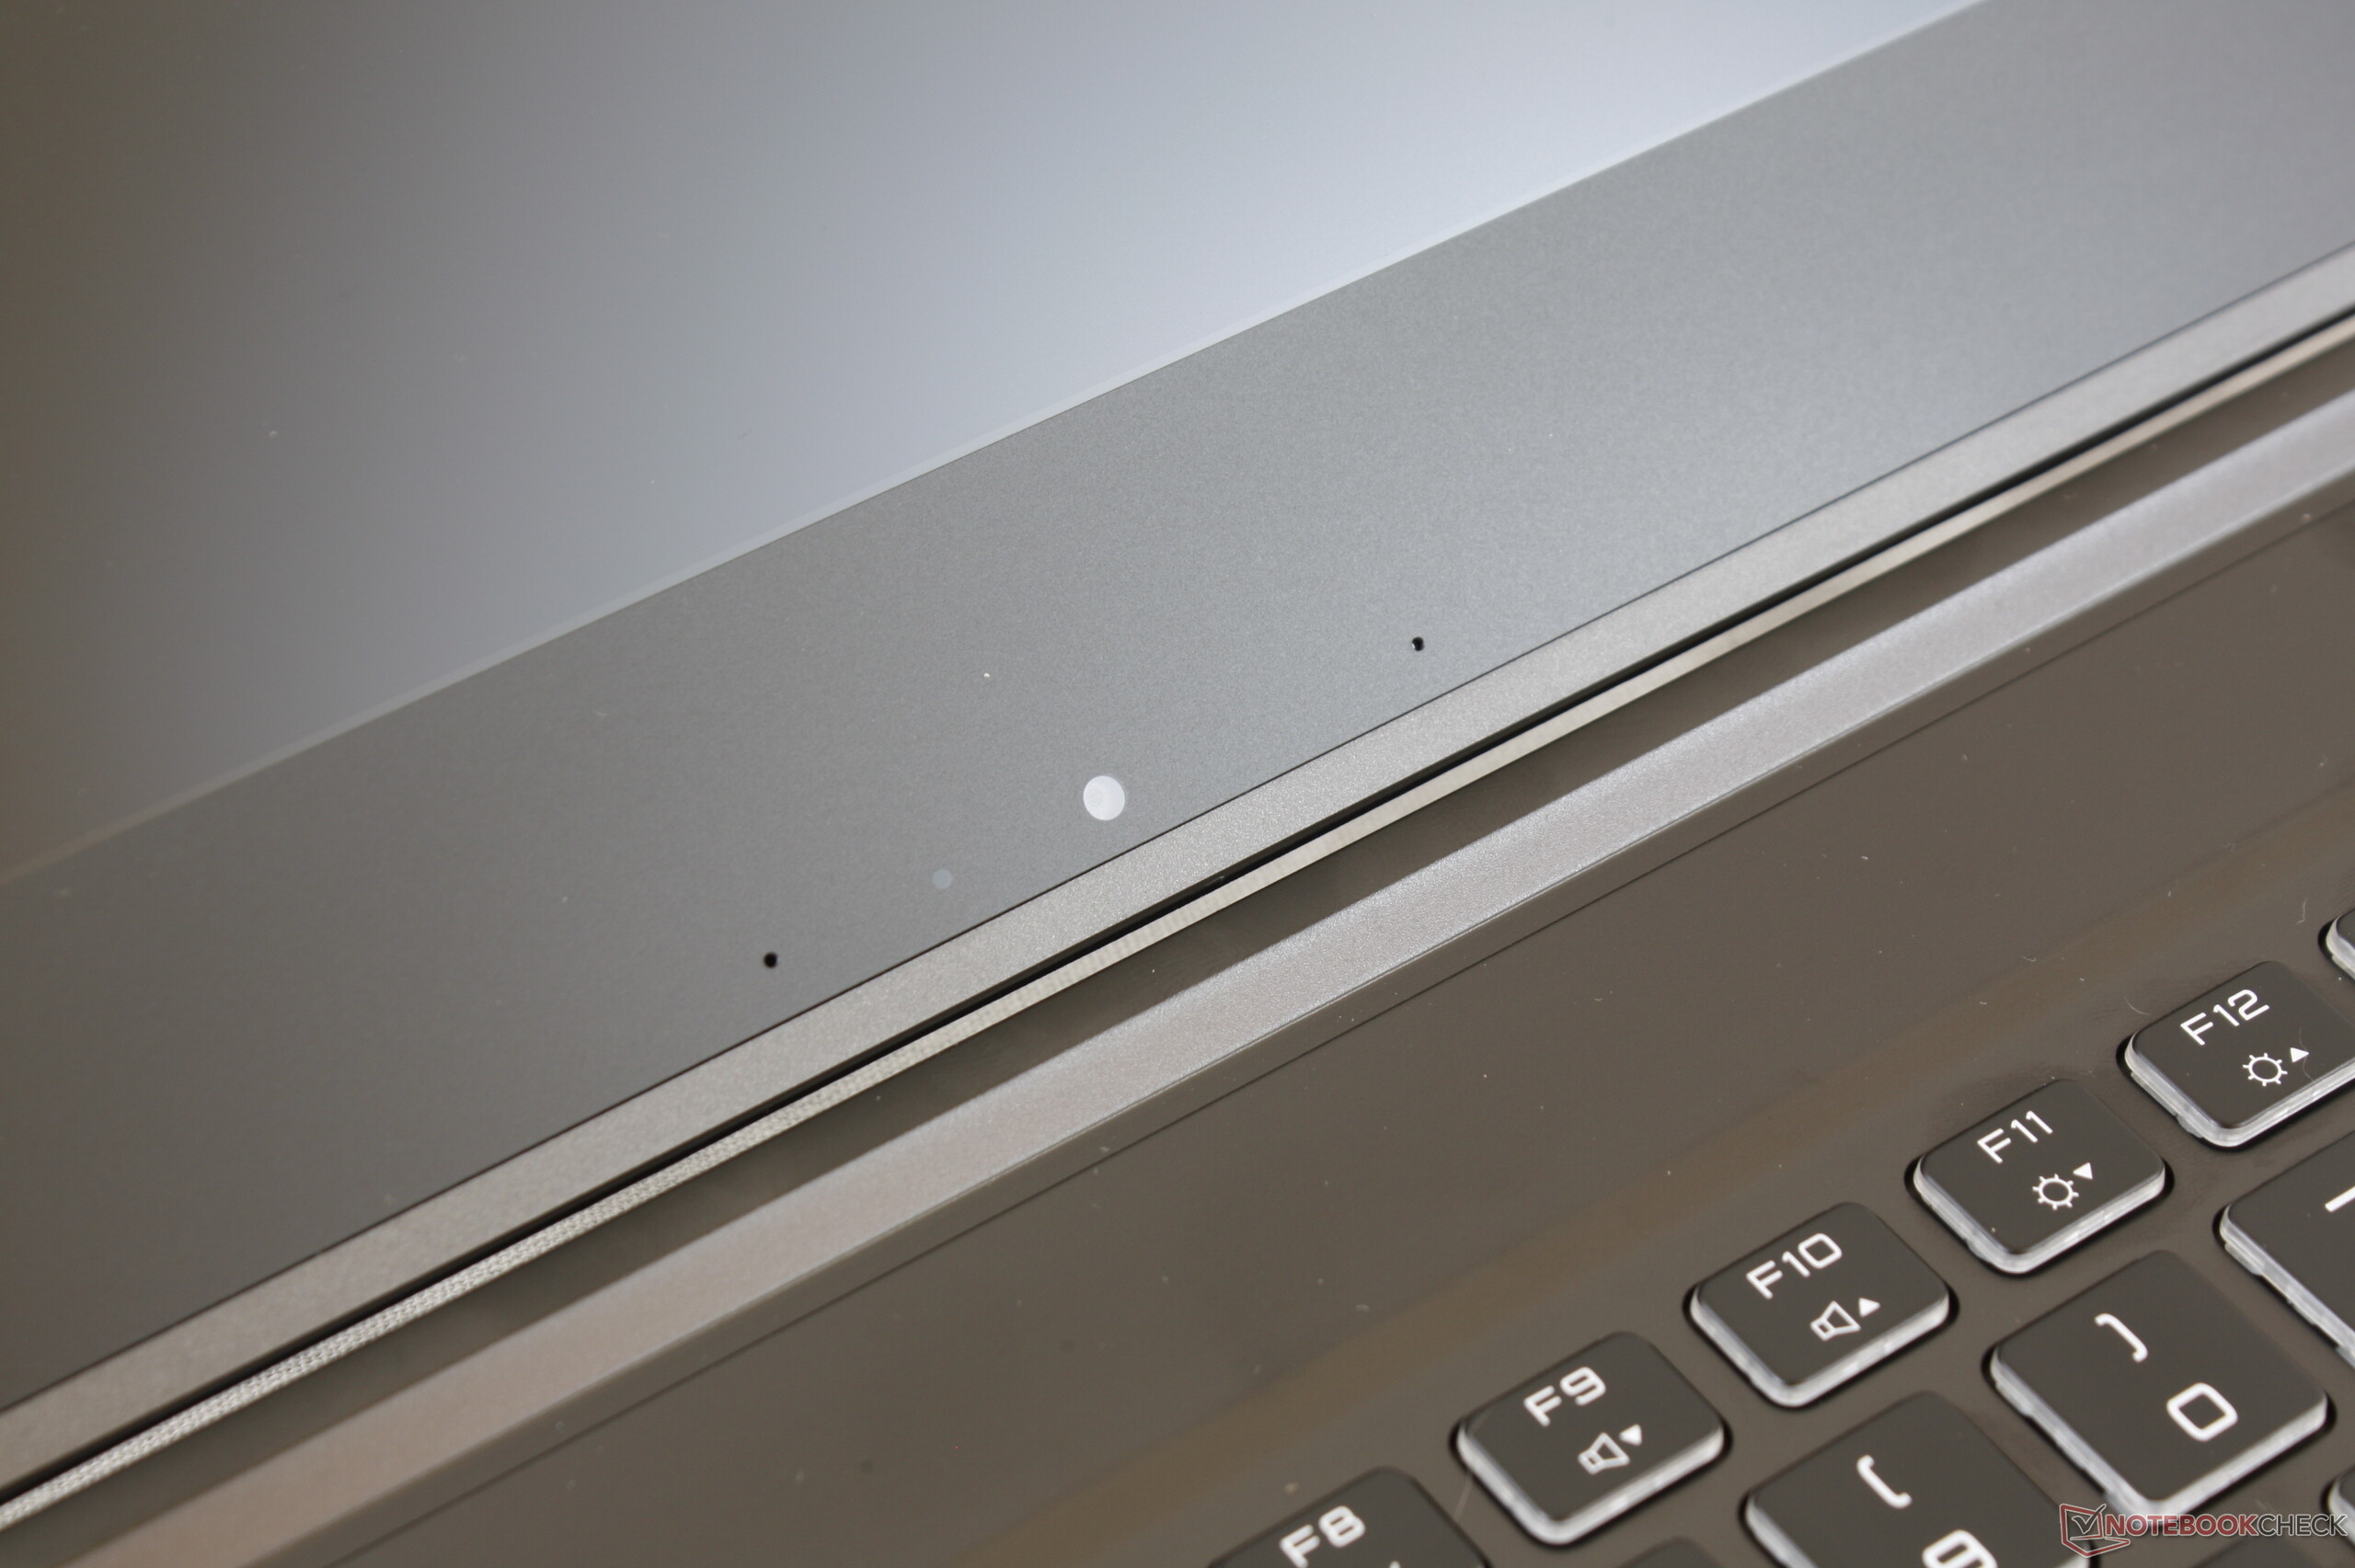
Webcam

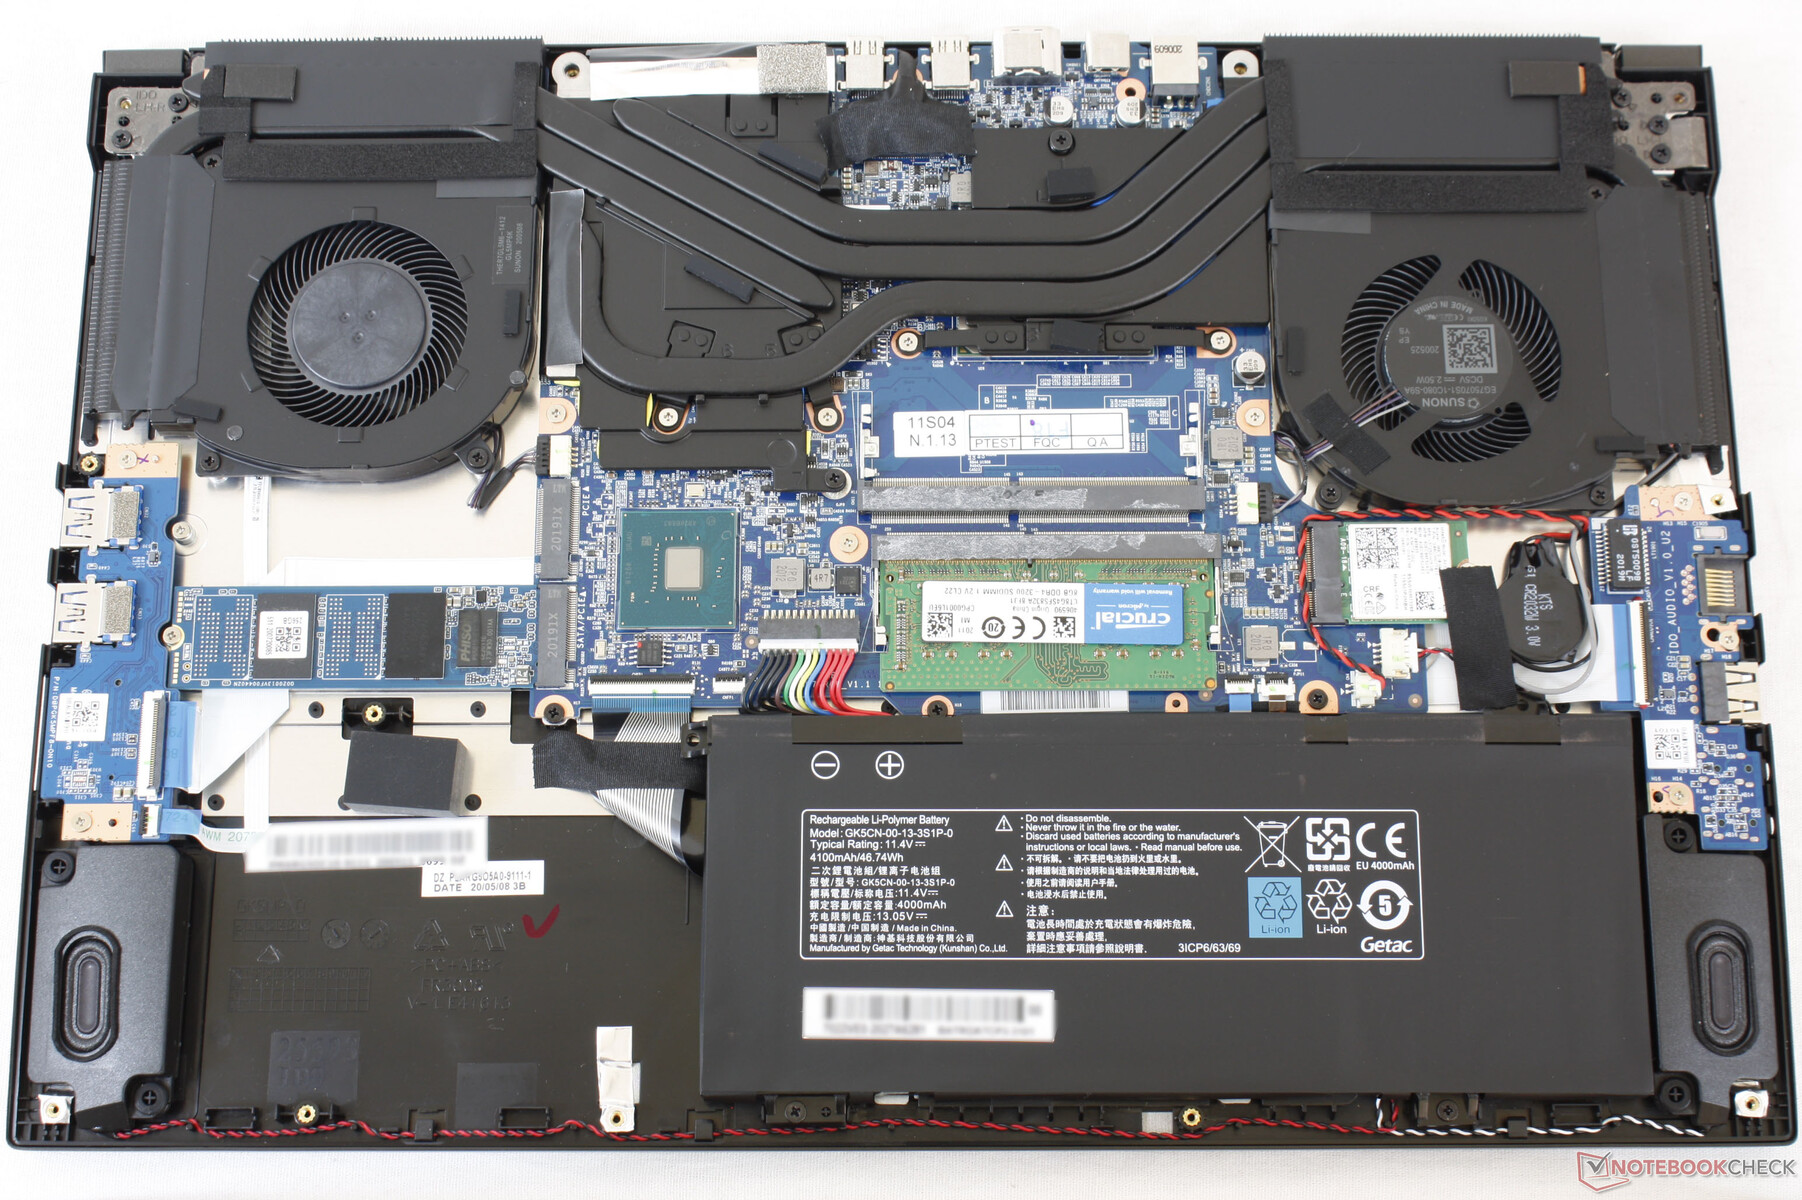
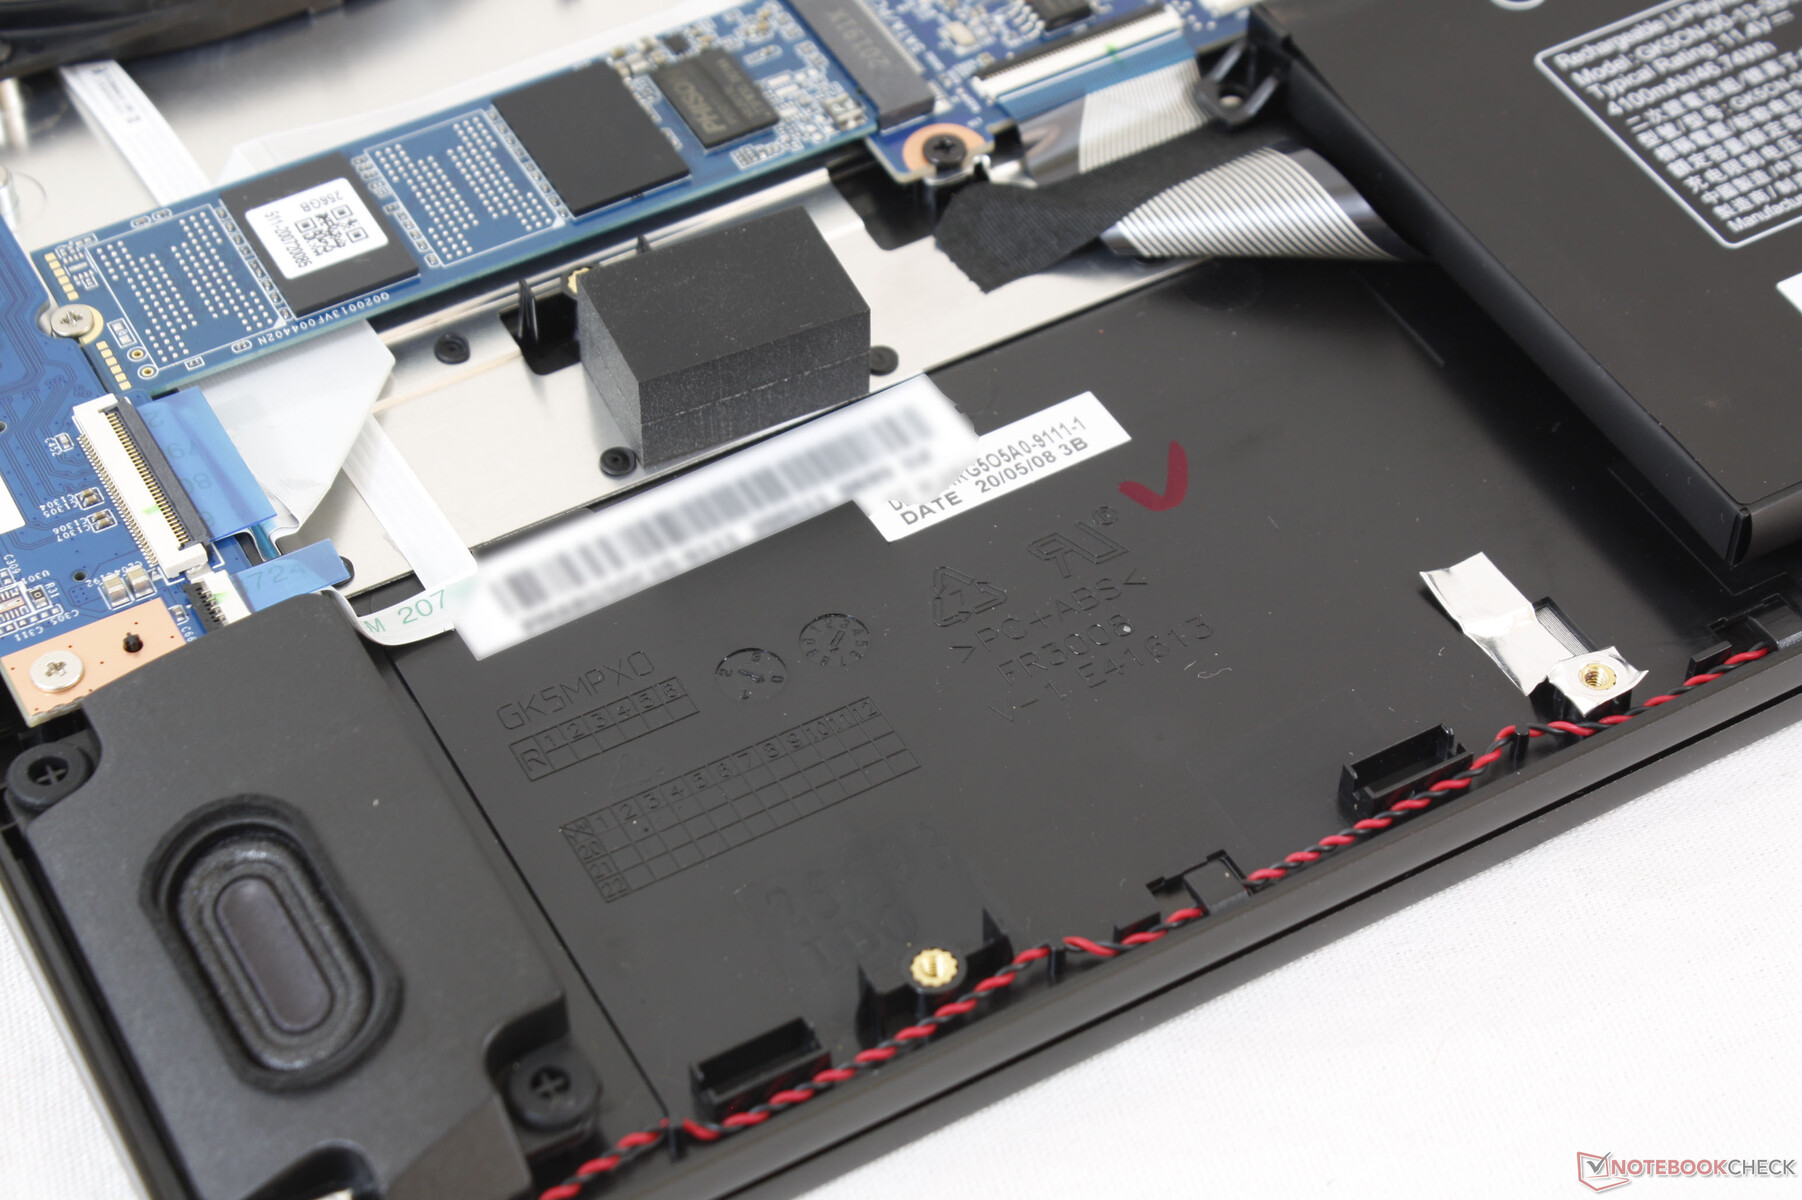
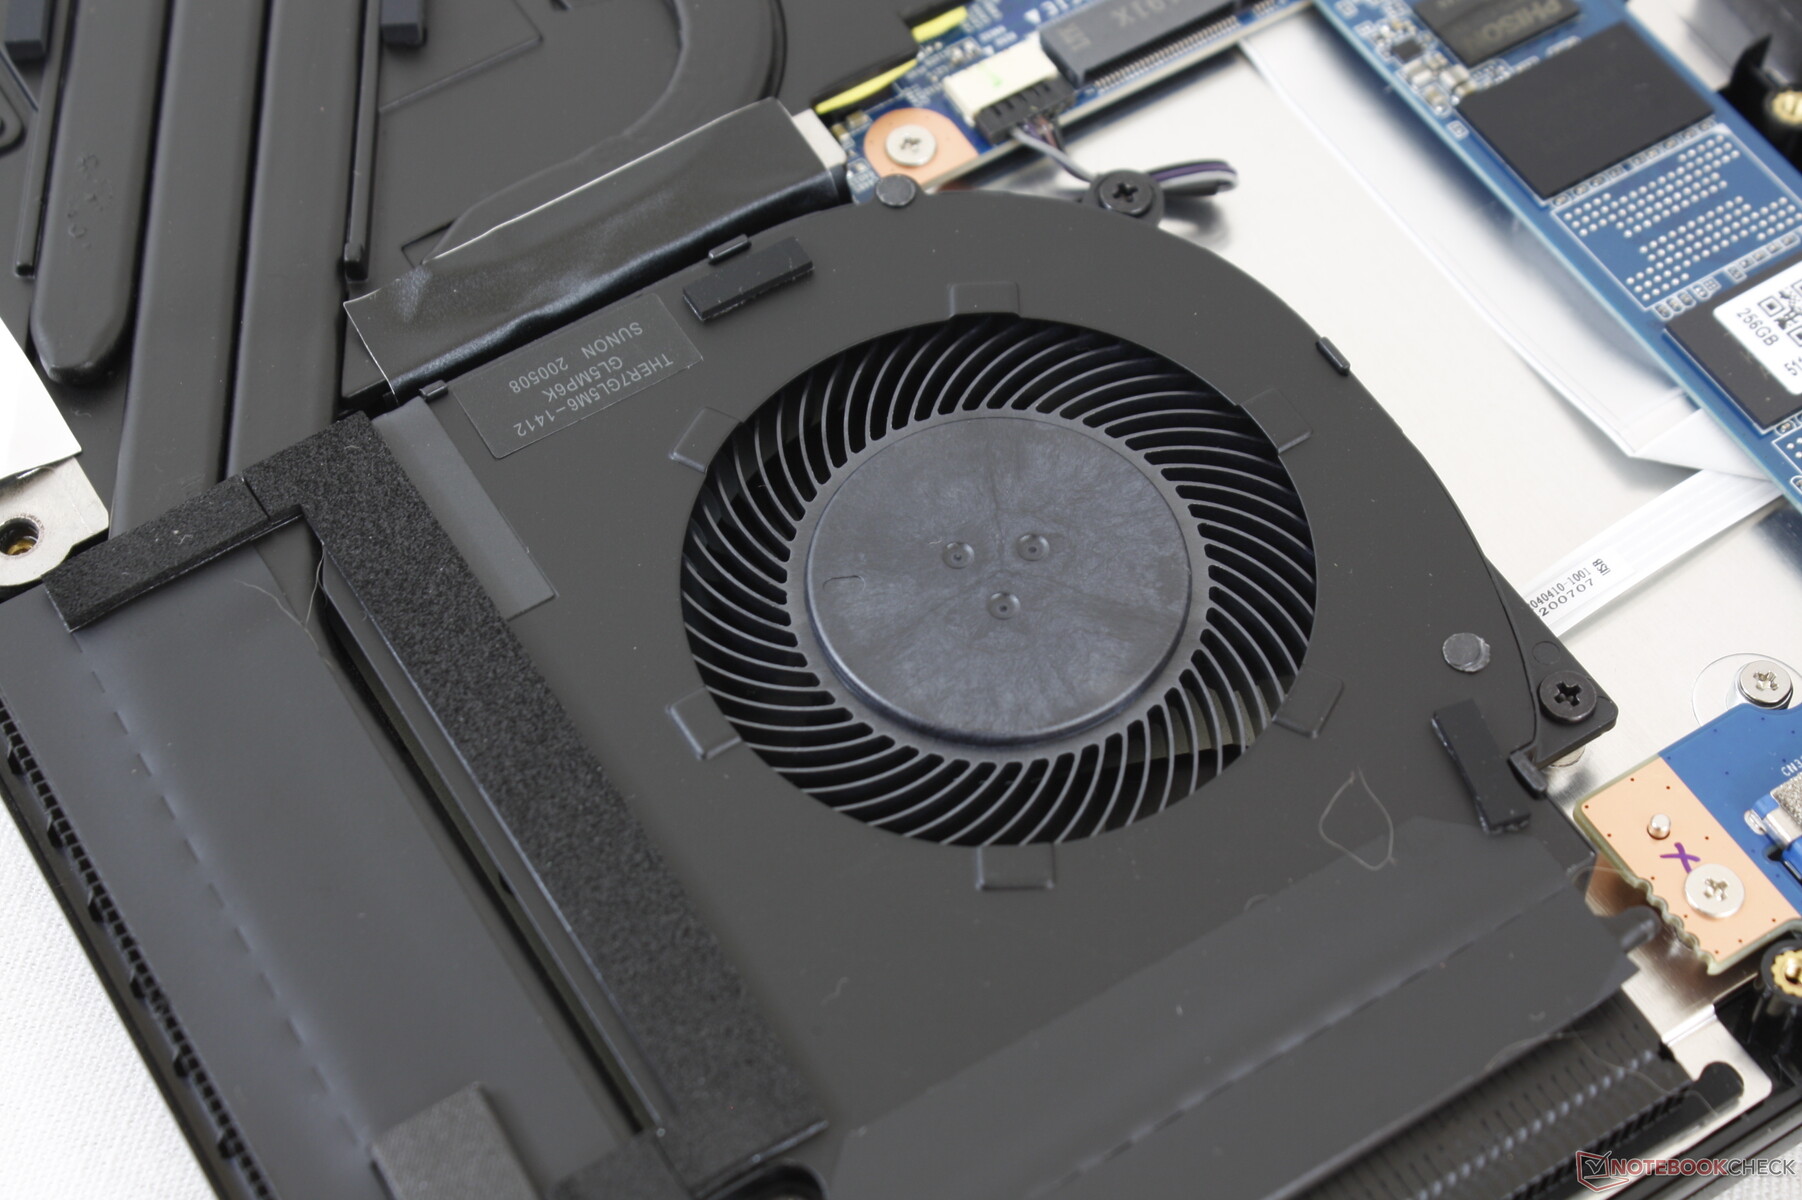
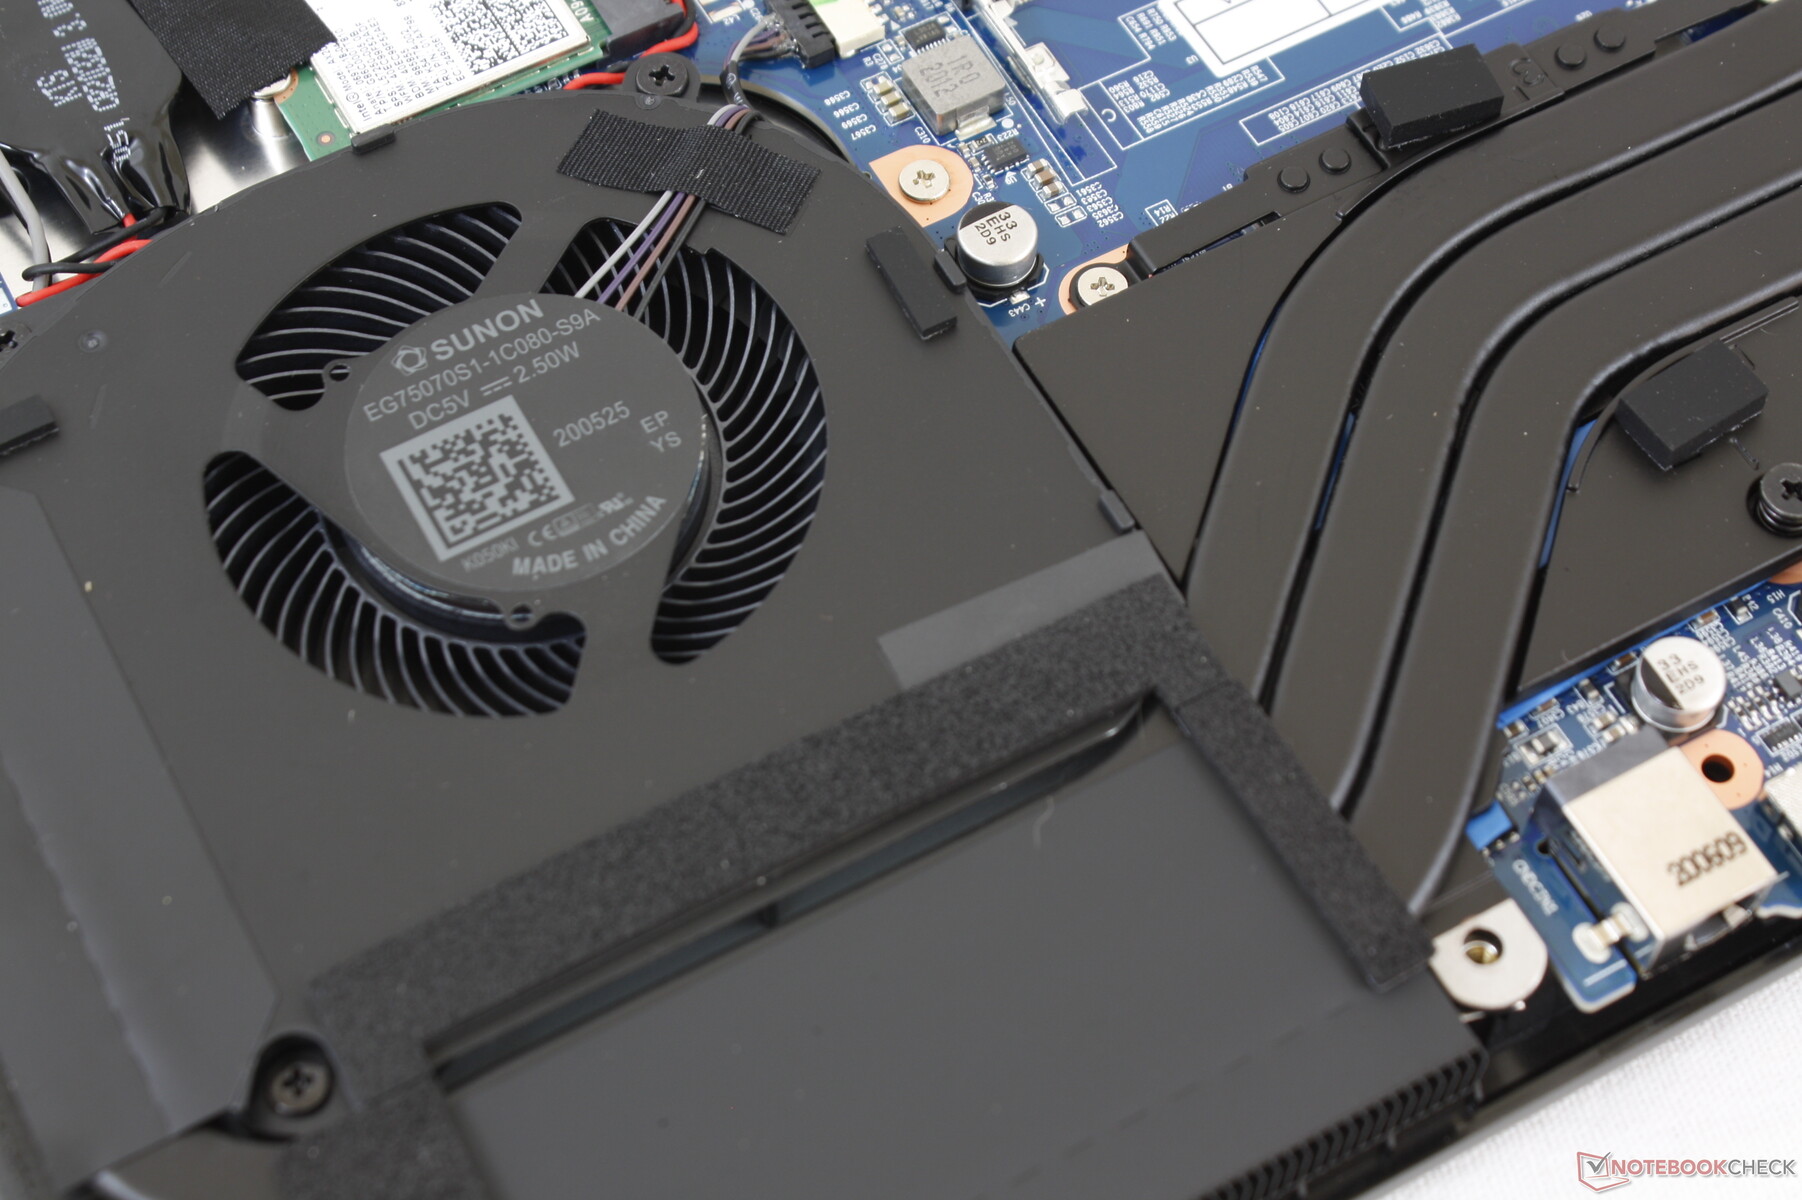
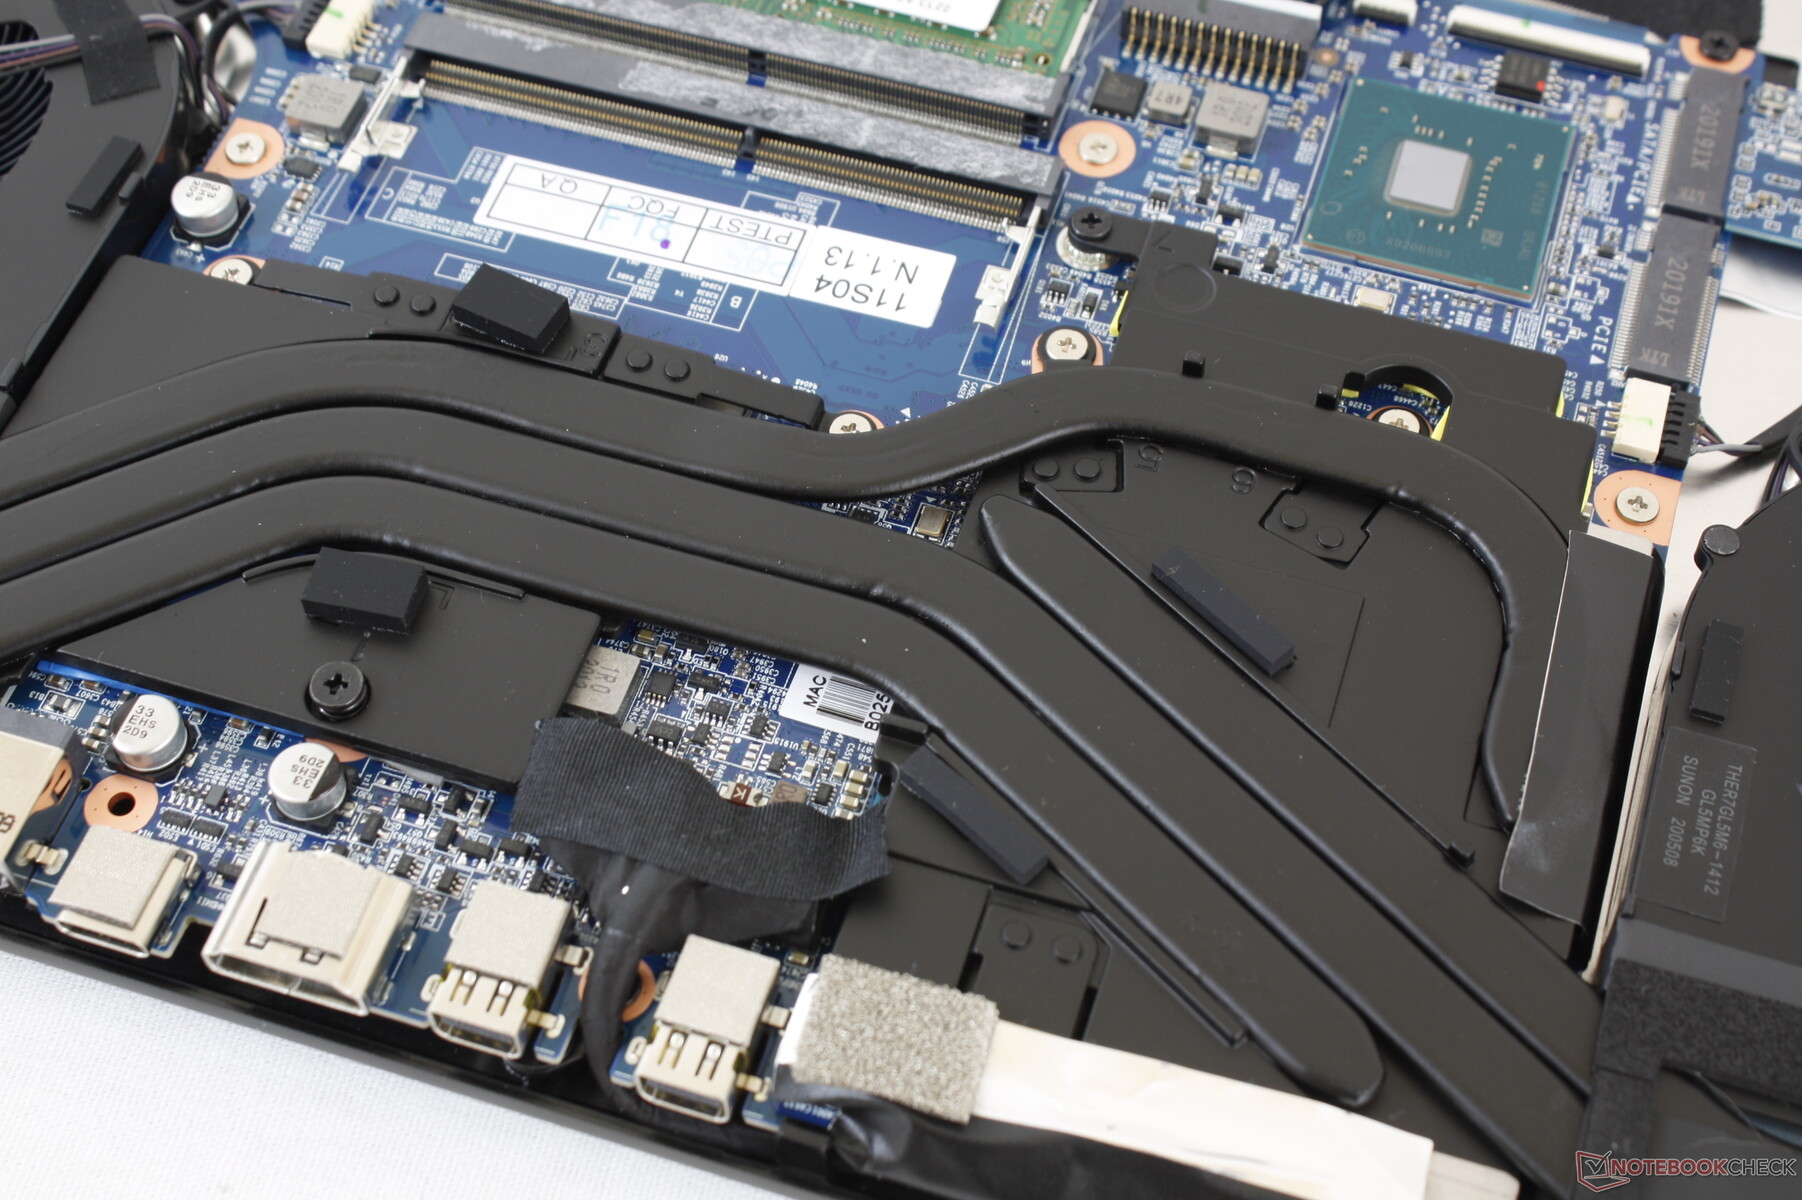
Mantenimiento
El panel inferior se quita fácilmente con un destornillador Philips. Desafortunadamente, los propietarios deben romper el sello de garantía para quitar el panel.
Accesorios y garantía
No hay extras físicos en la caja, pero Walmart ofrece un mes gratis de Game Pass de XBox para usuarios de PC. Se aplica la garantía limitada estándar de un año.
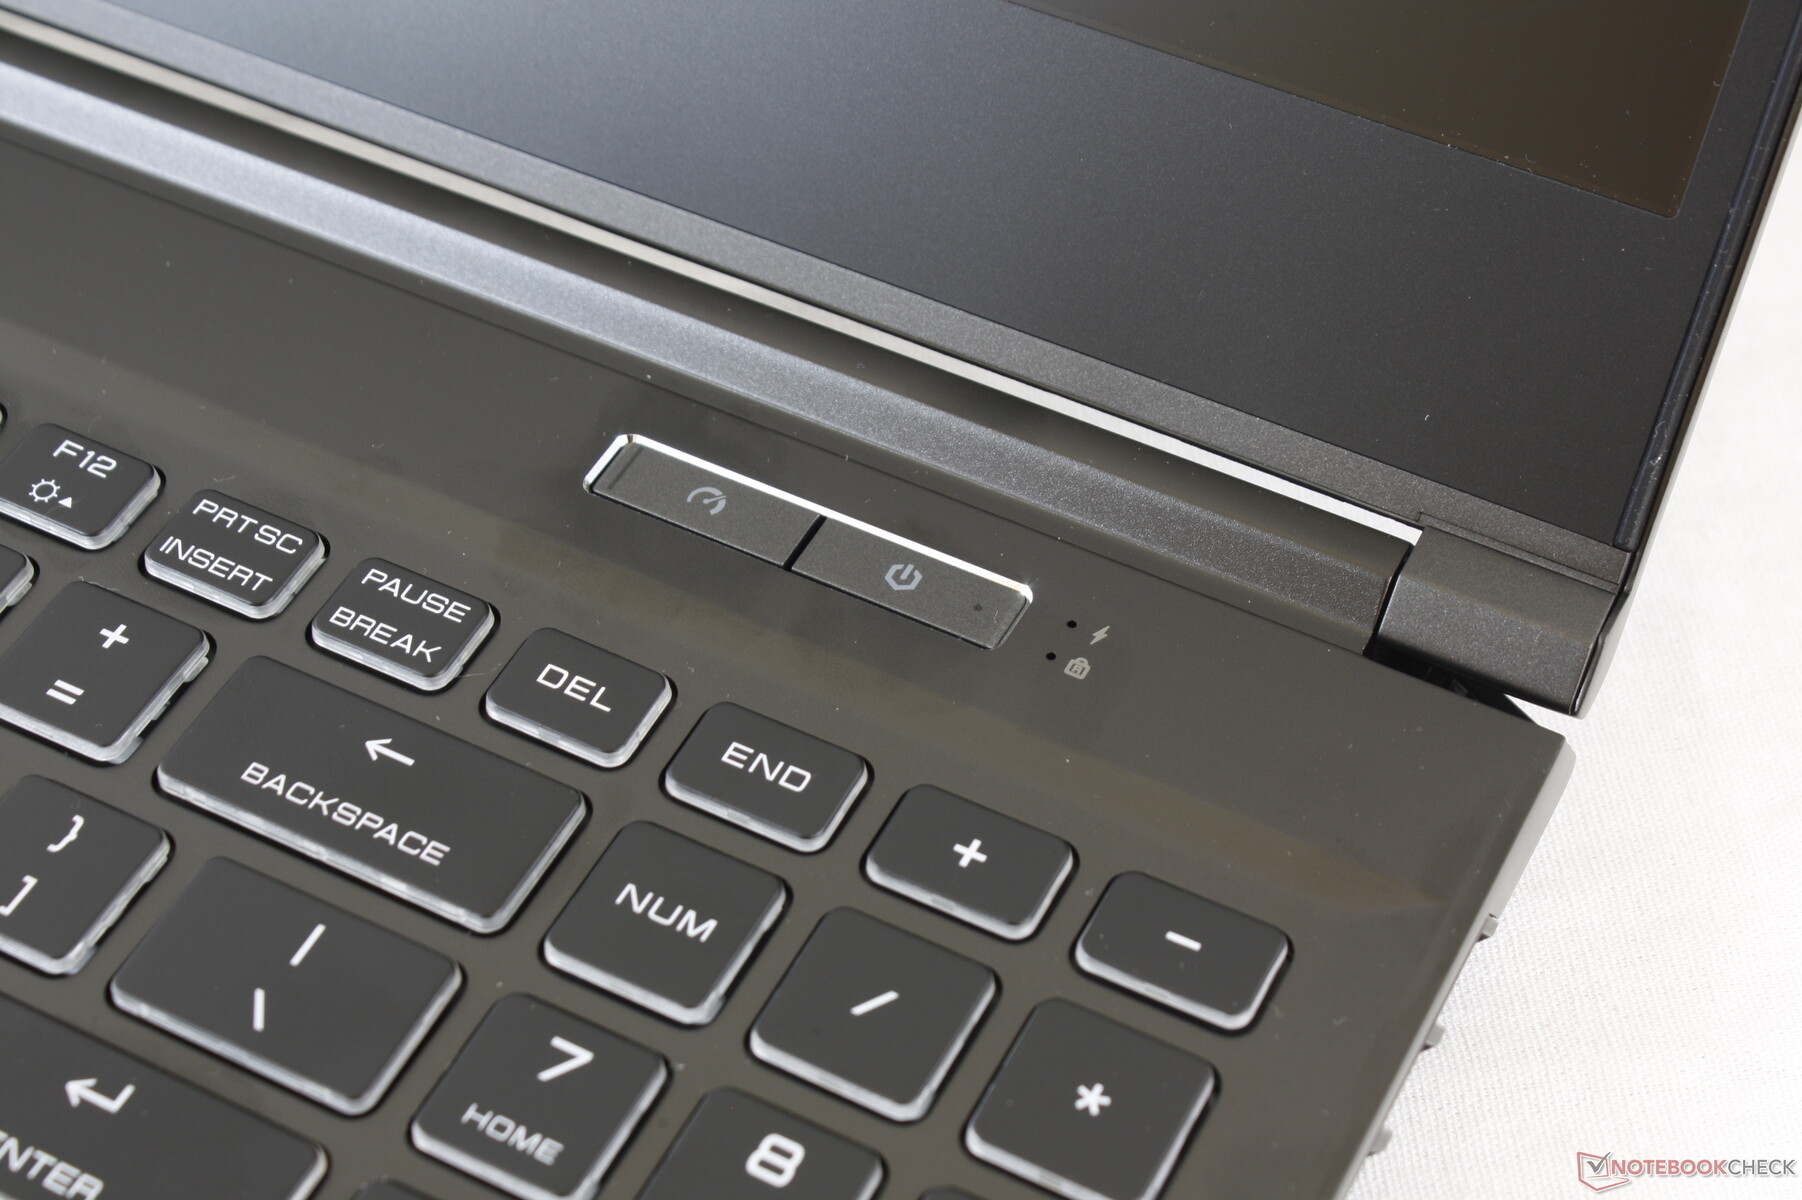
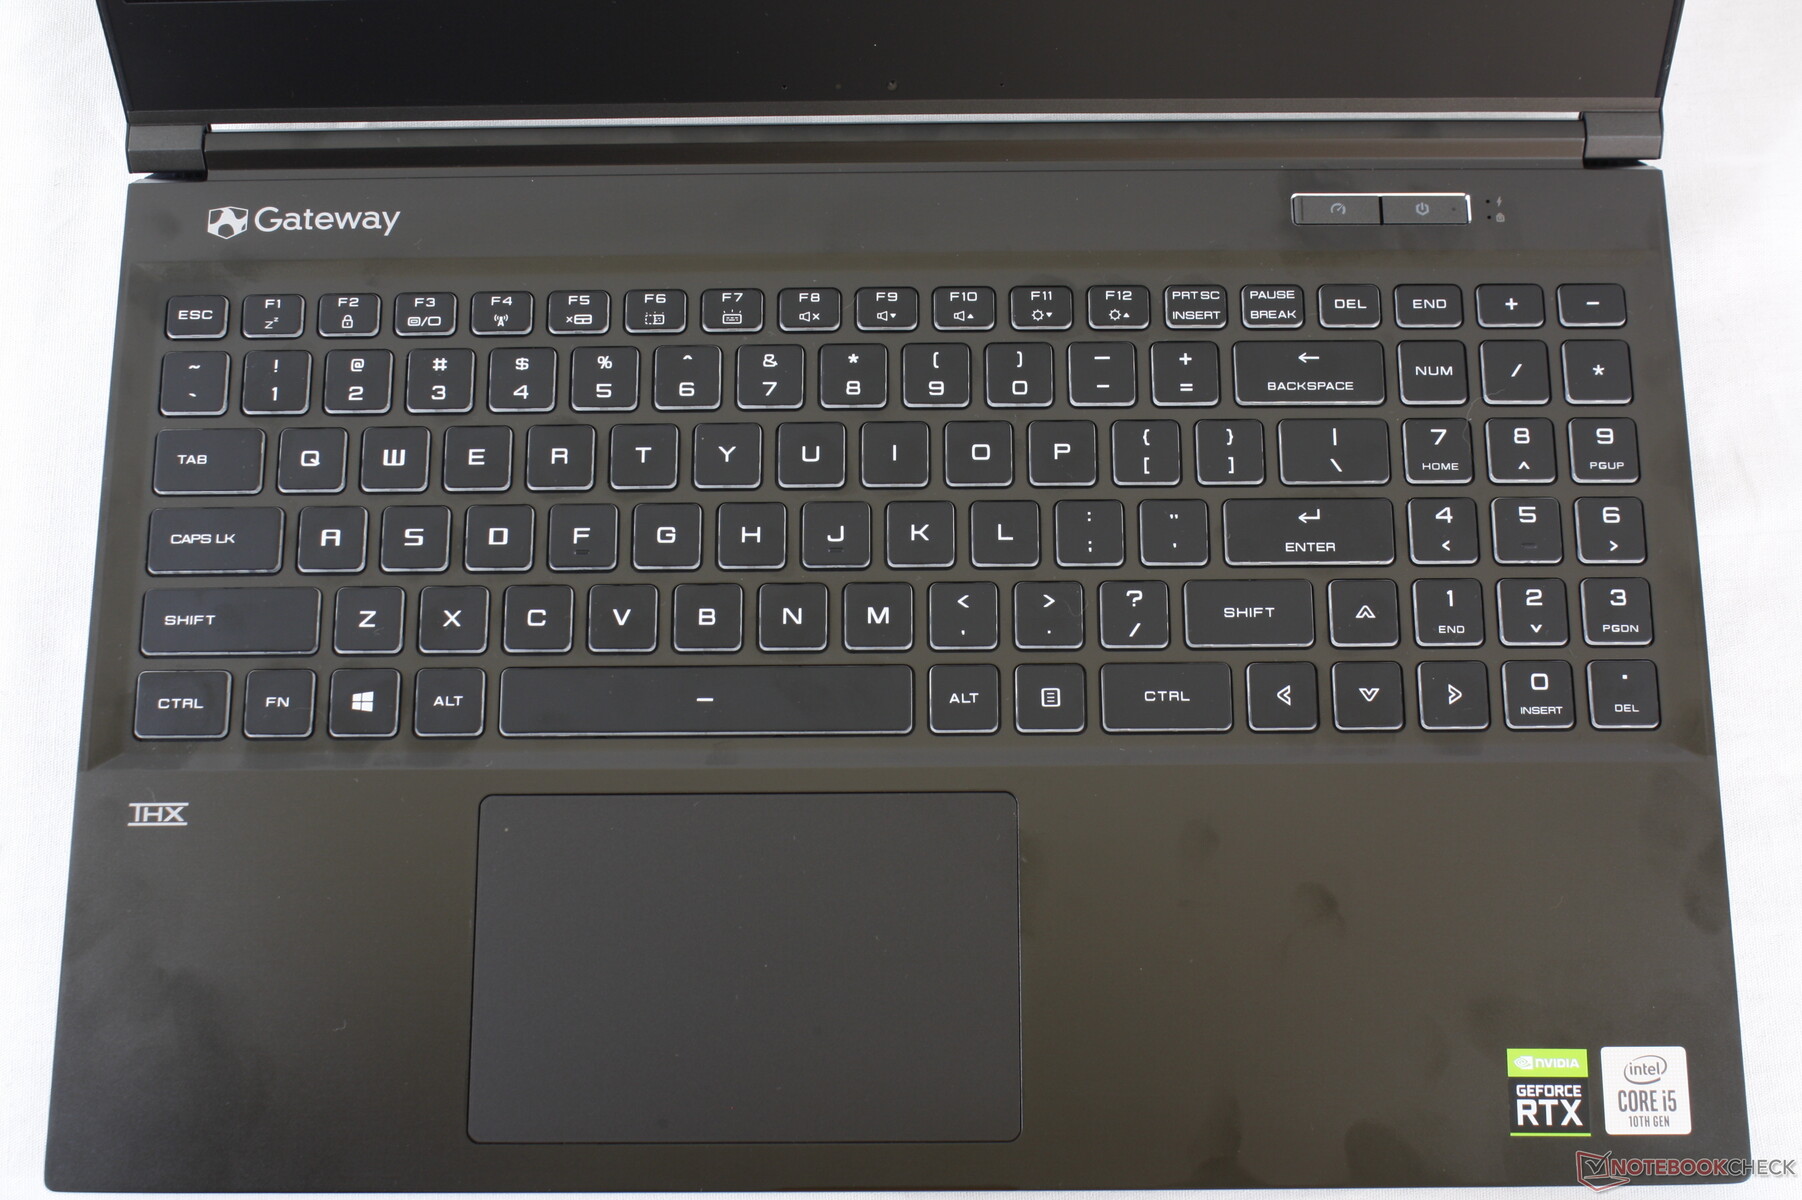
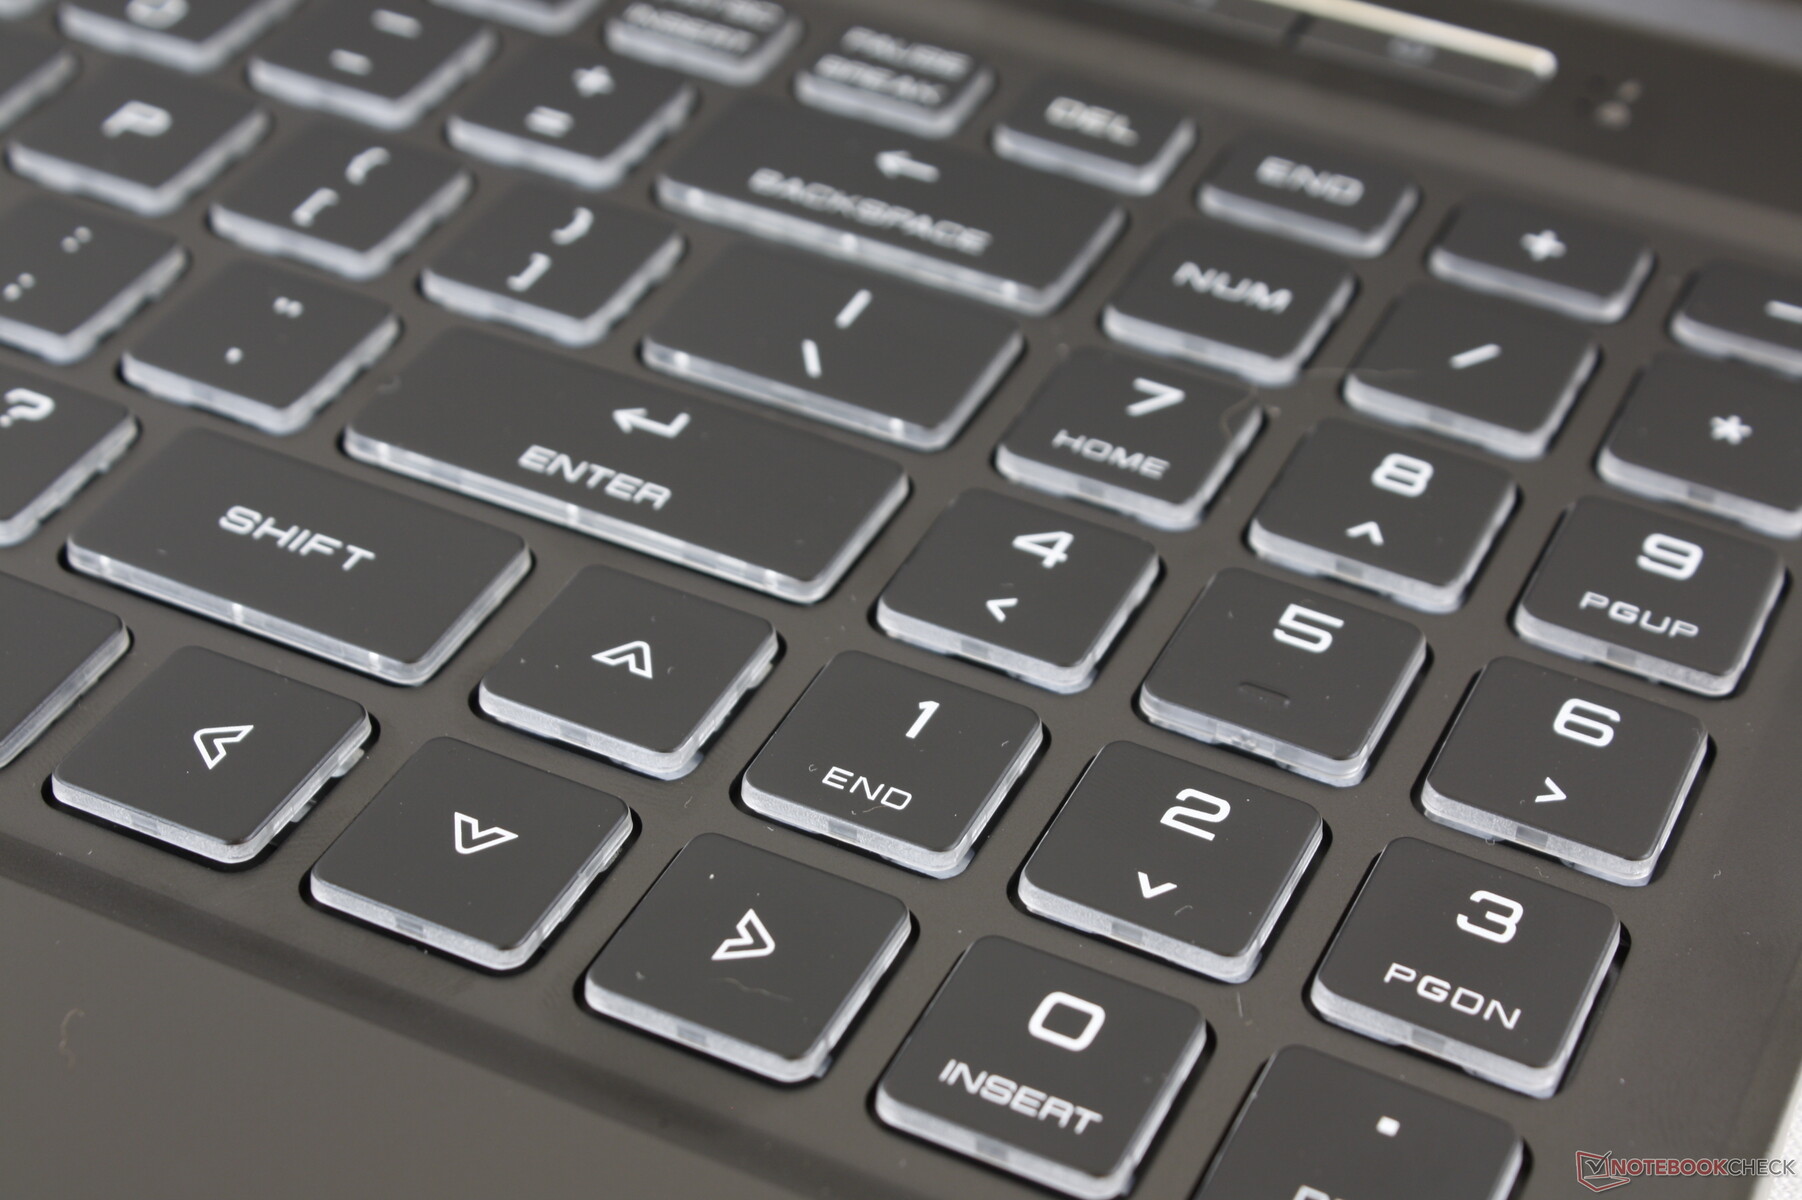
Dispositivos de entrada
Teclado
Describa el teclado: tamaño de las teclas, disposición del teclado. ¿Revolotea/cede bajo presión? Características (recubrimiento plateado, luz del teclado,...), háptica, recorrido de las teclas, pulsación,...

Display
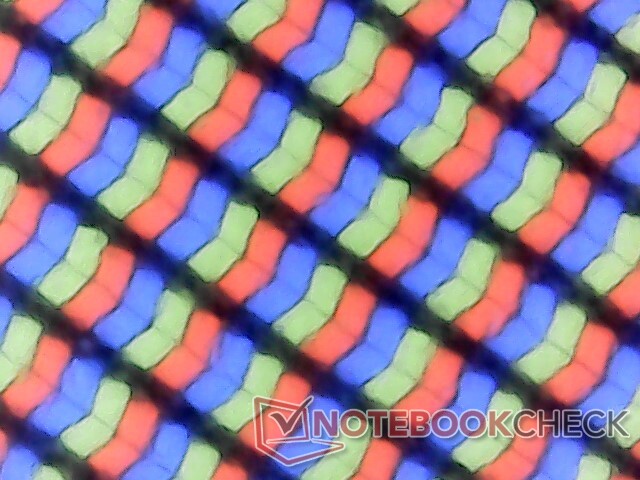
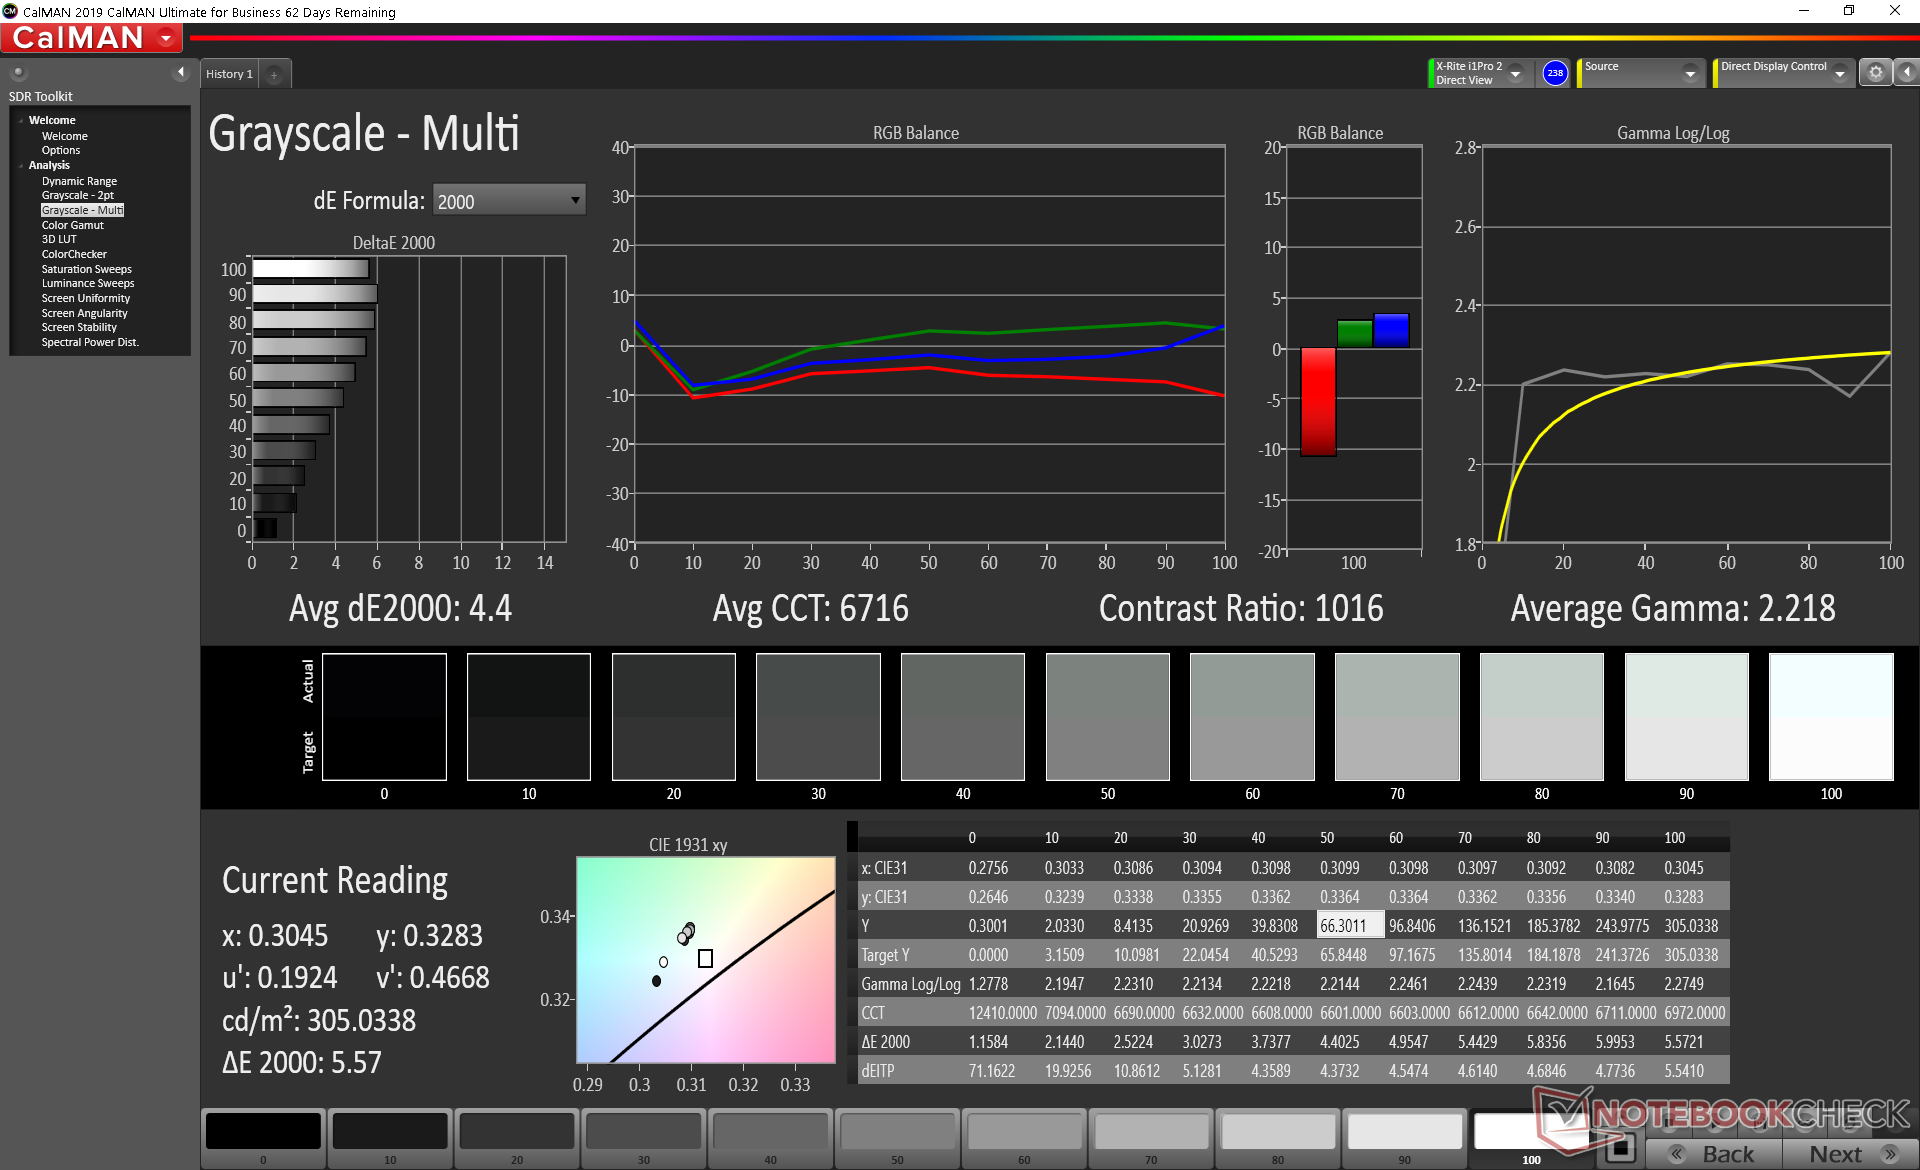
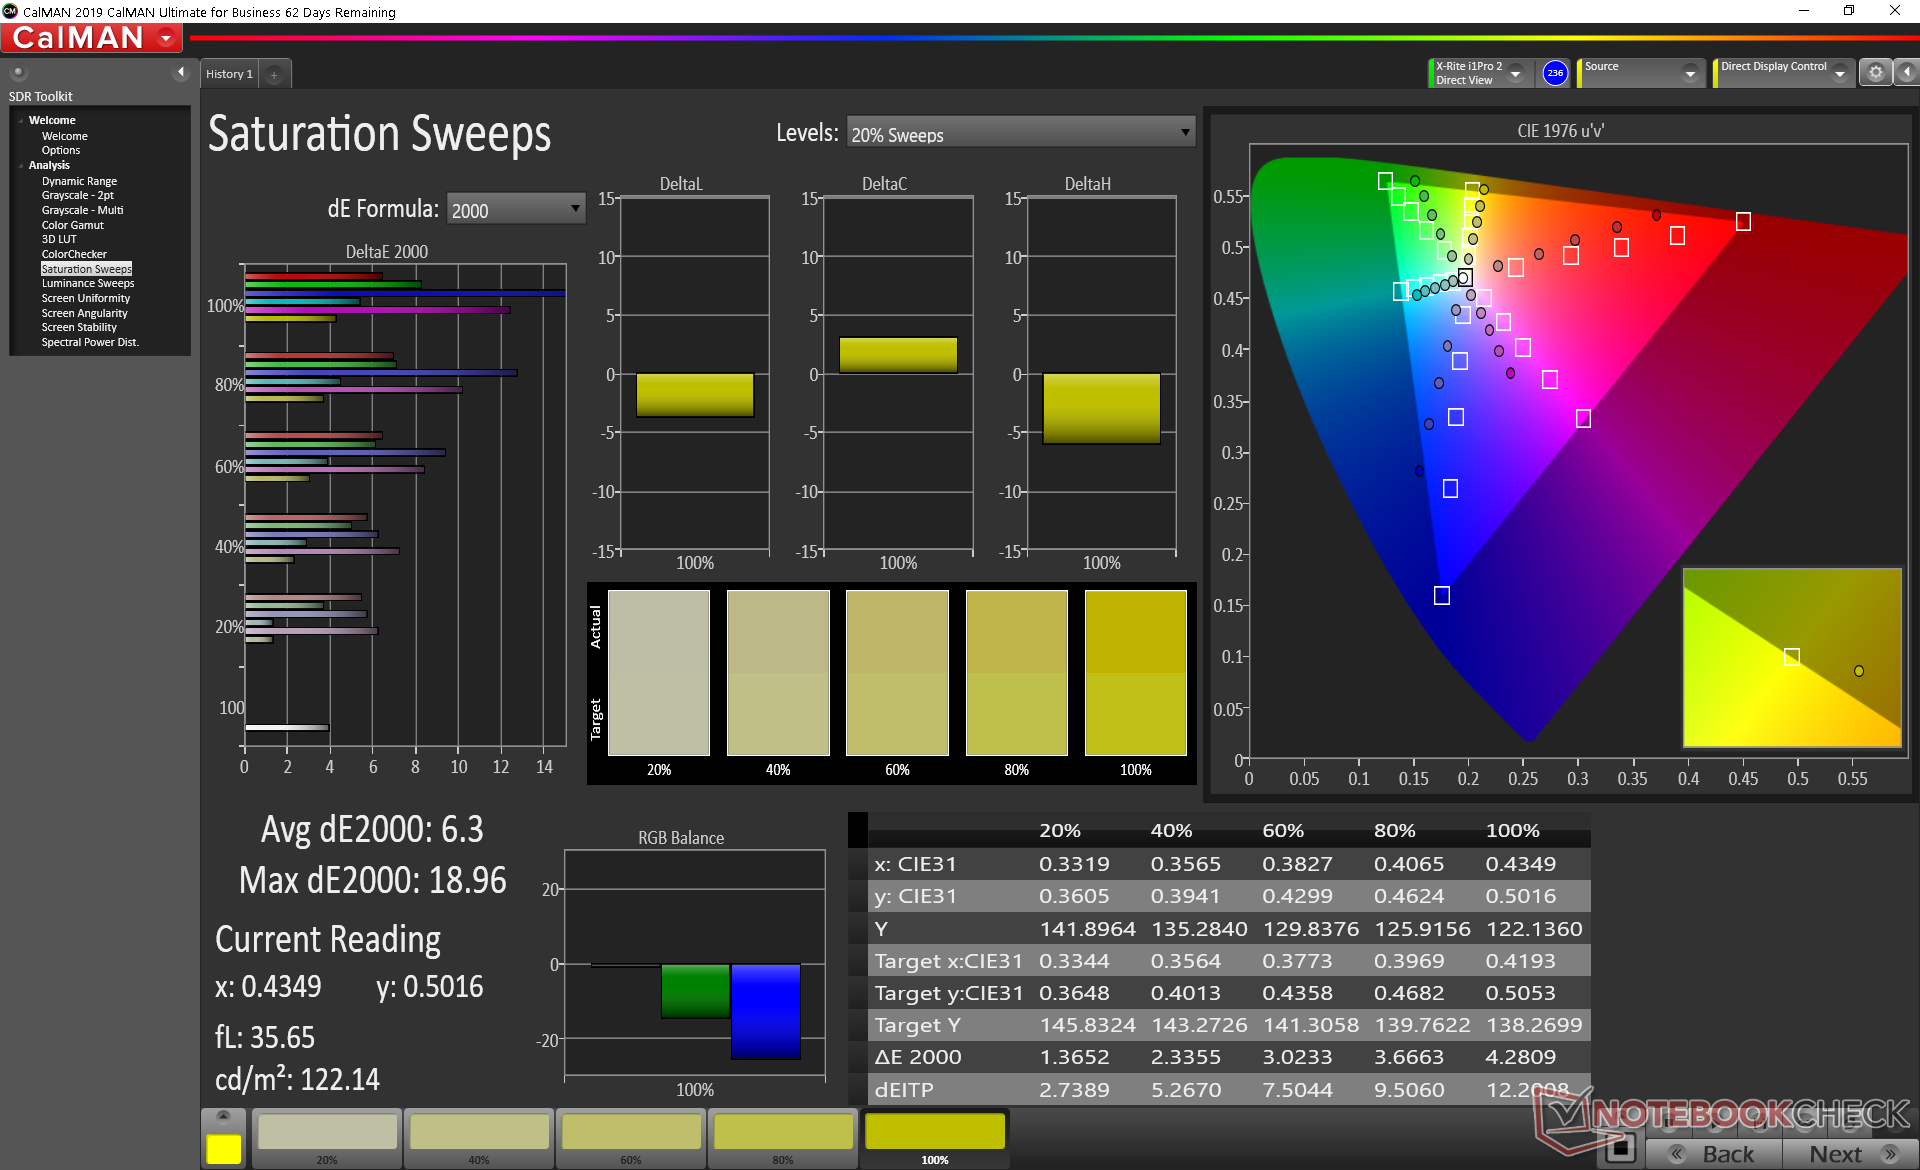
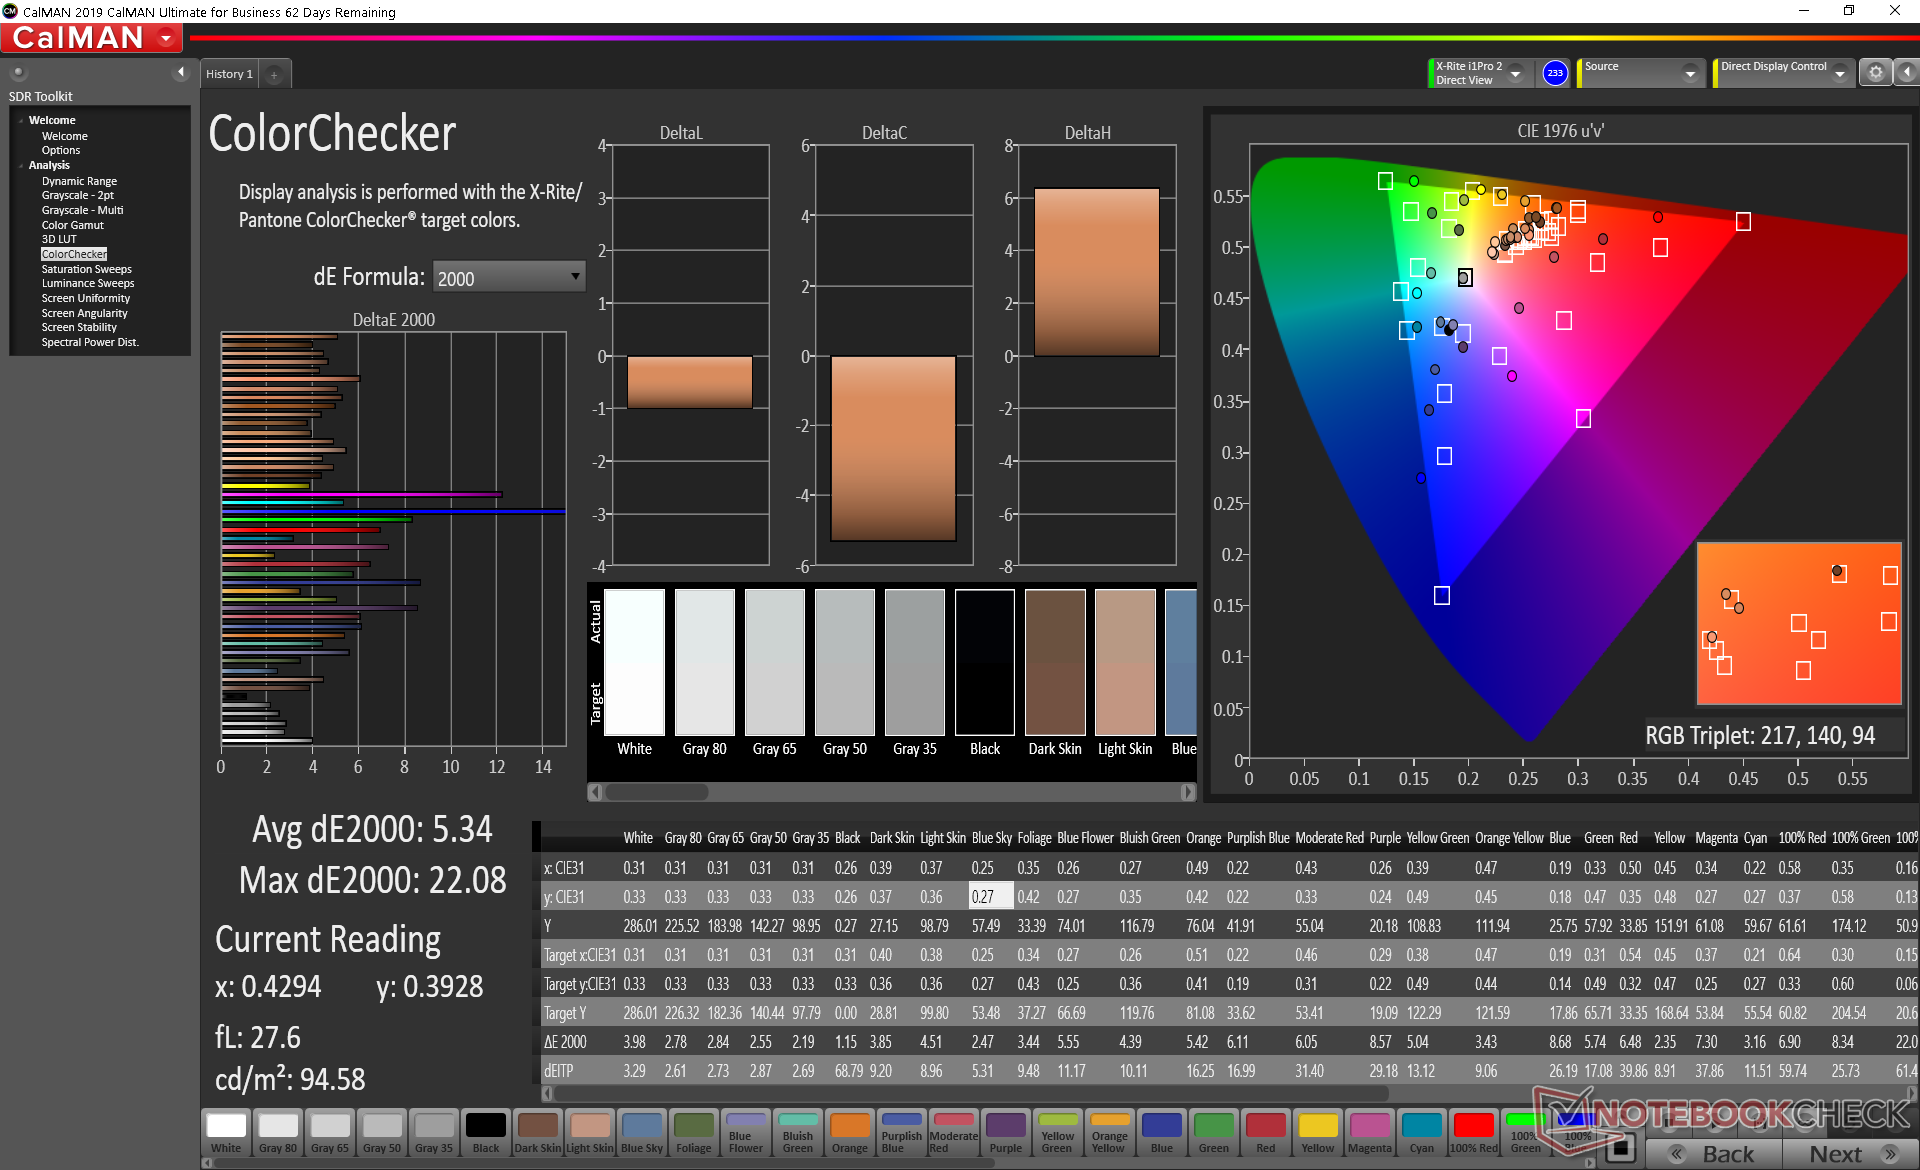
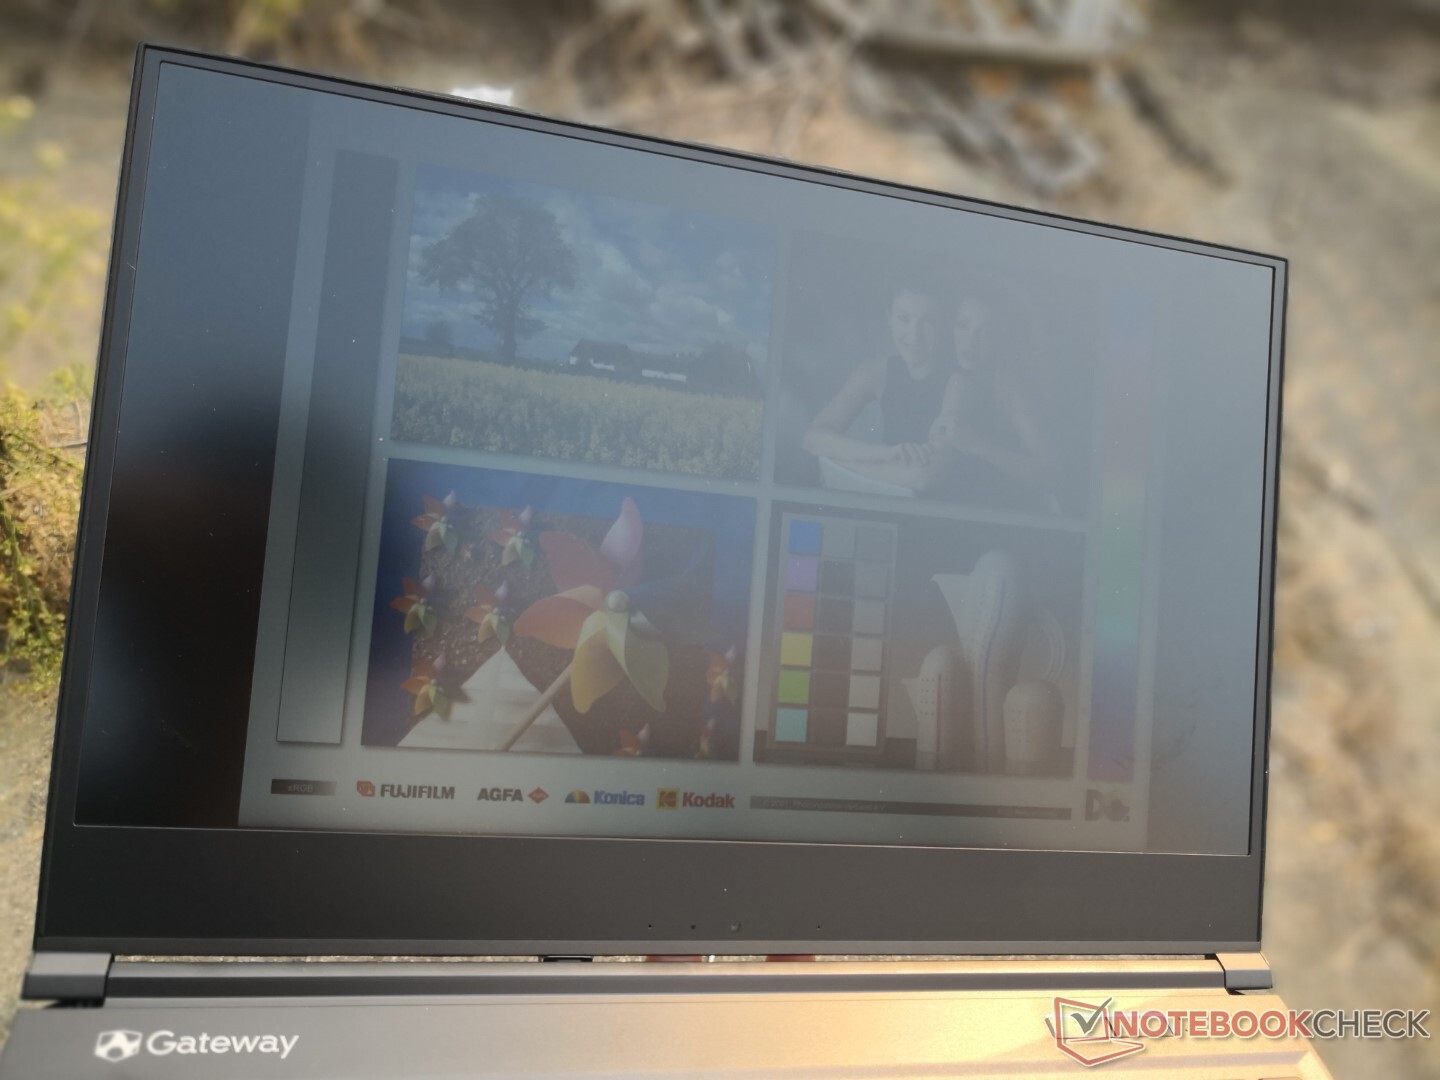
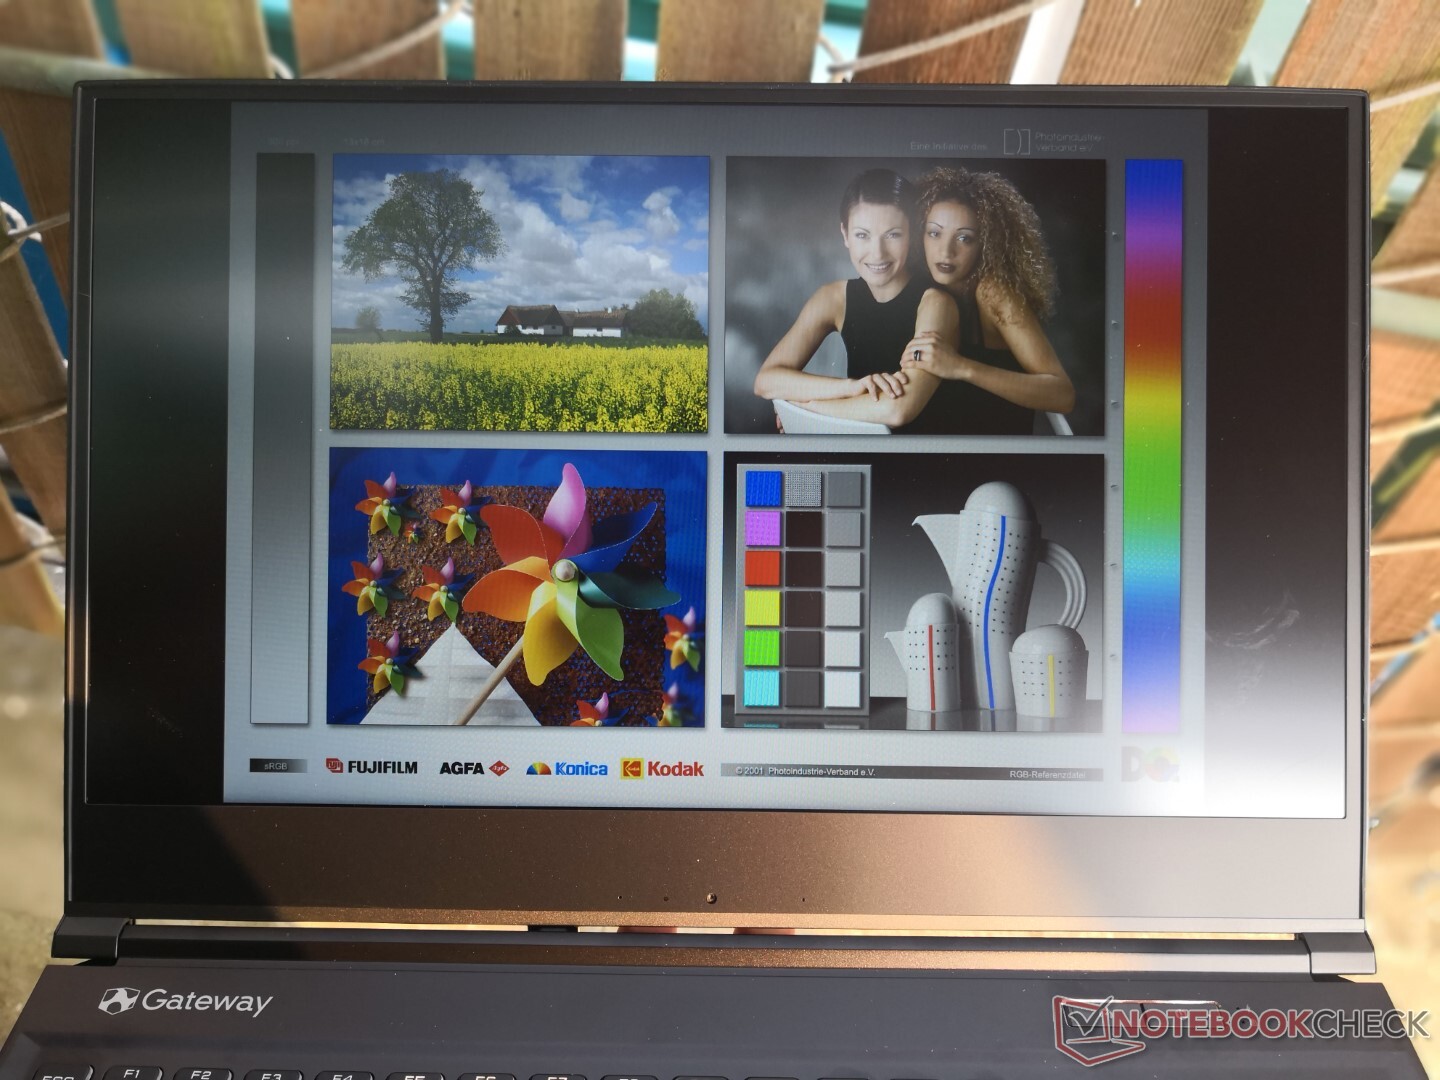
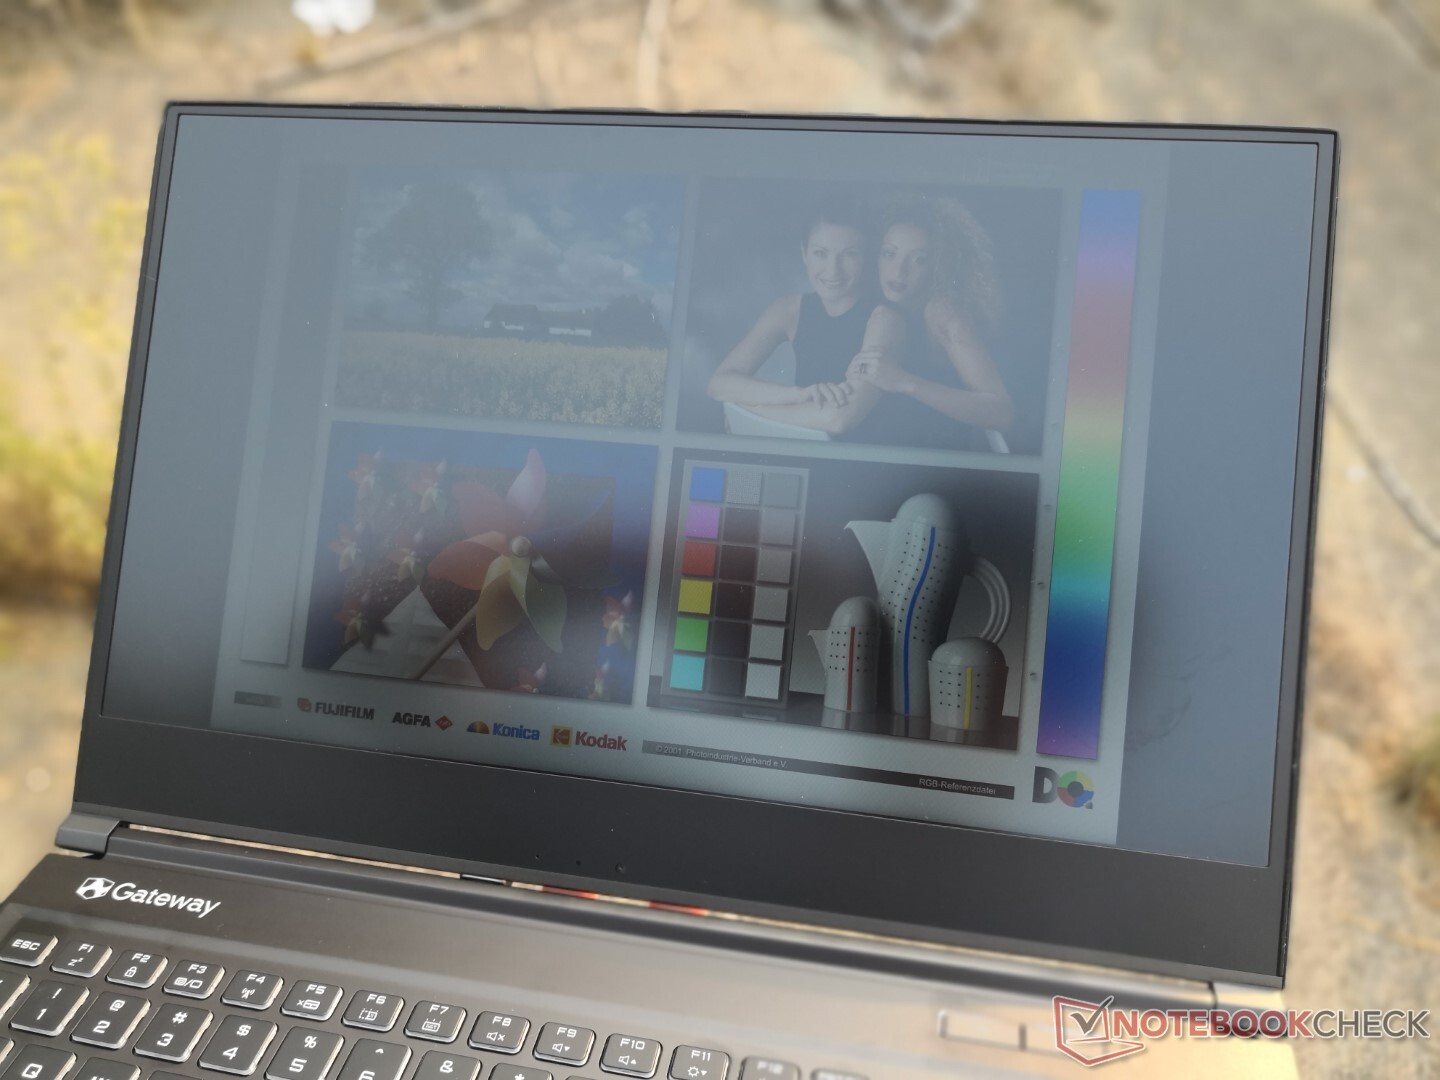
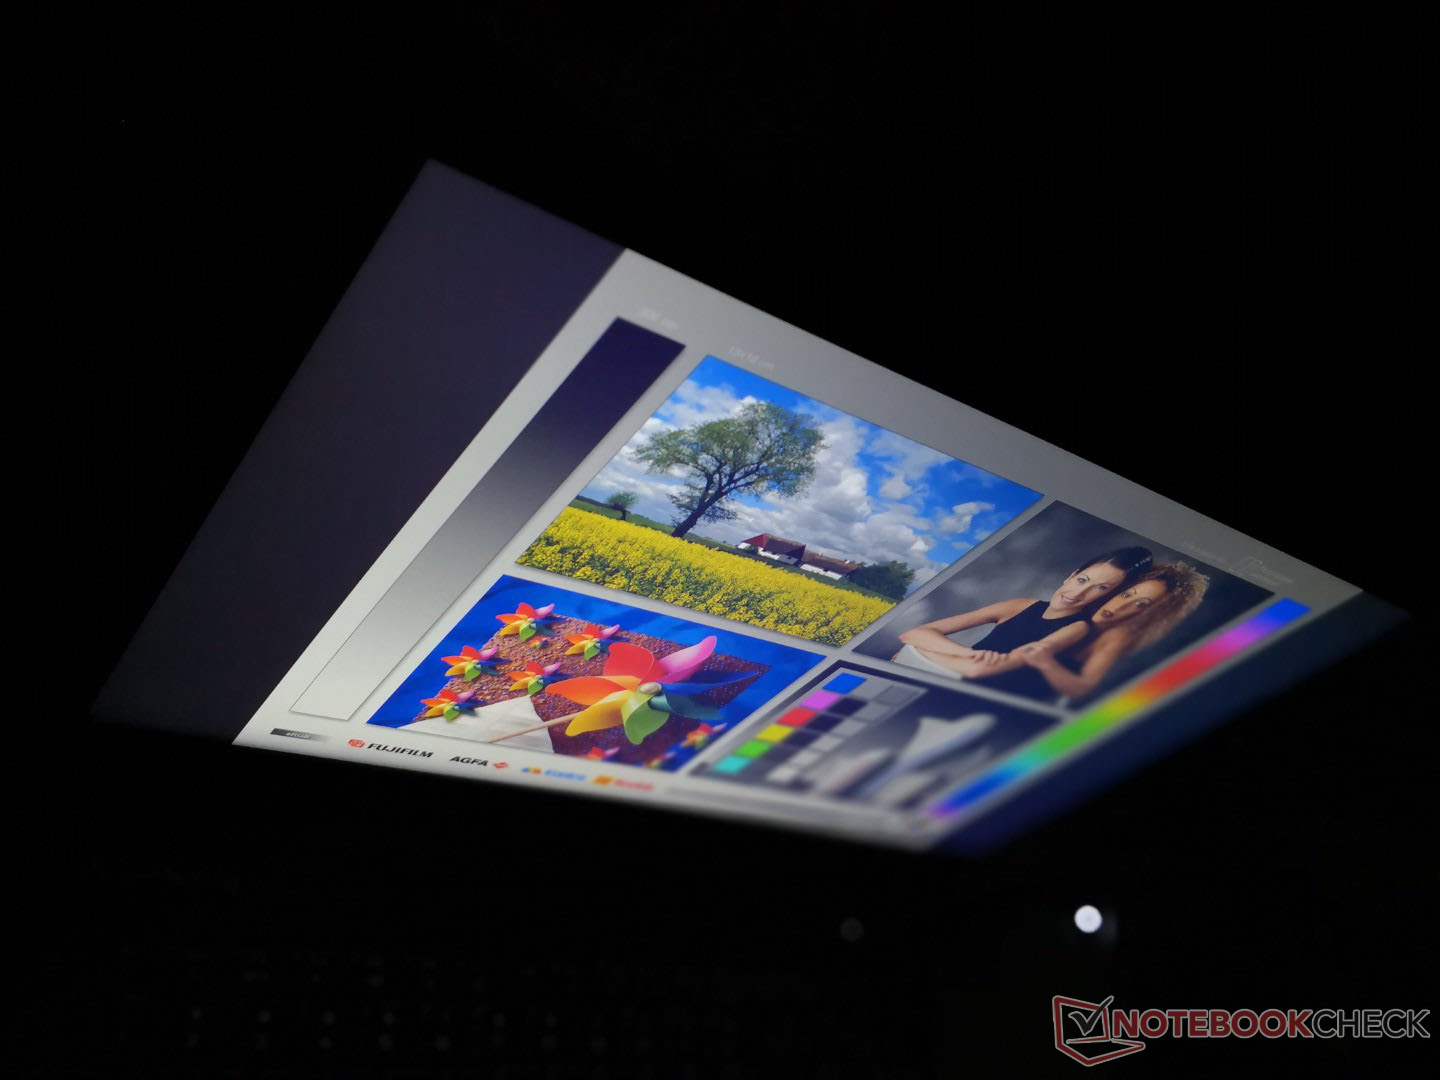
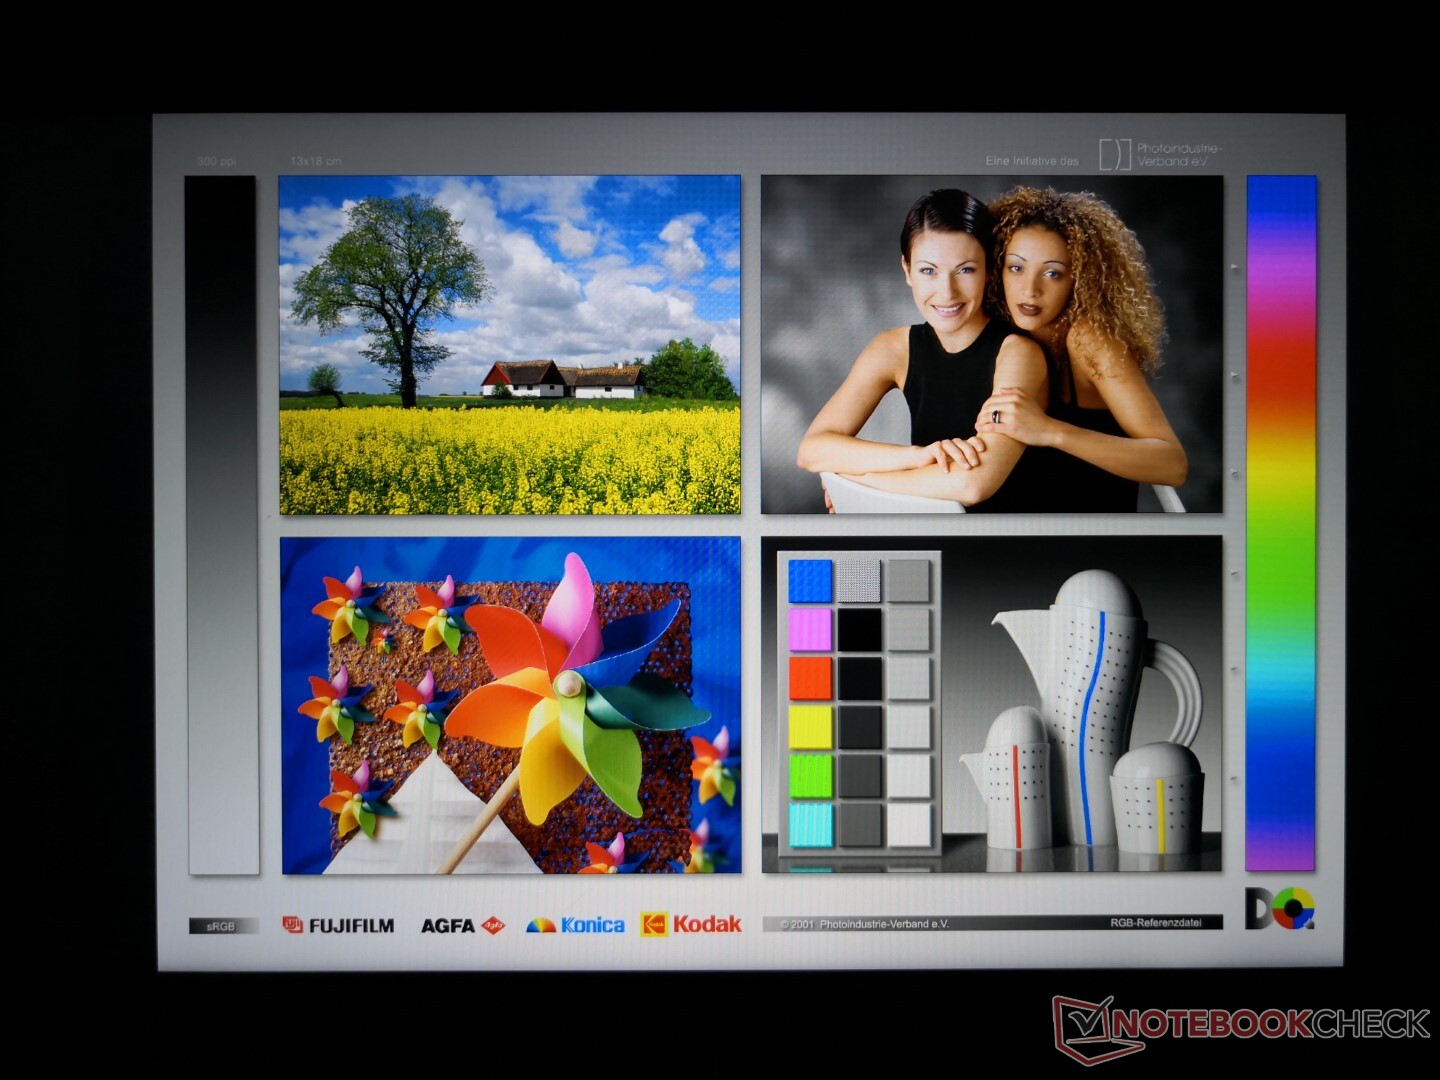
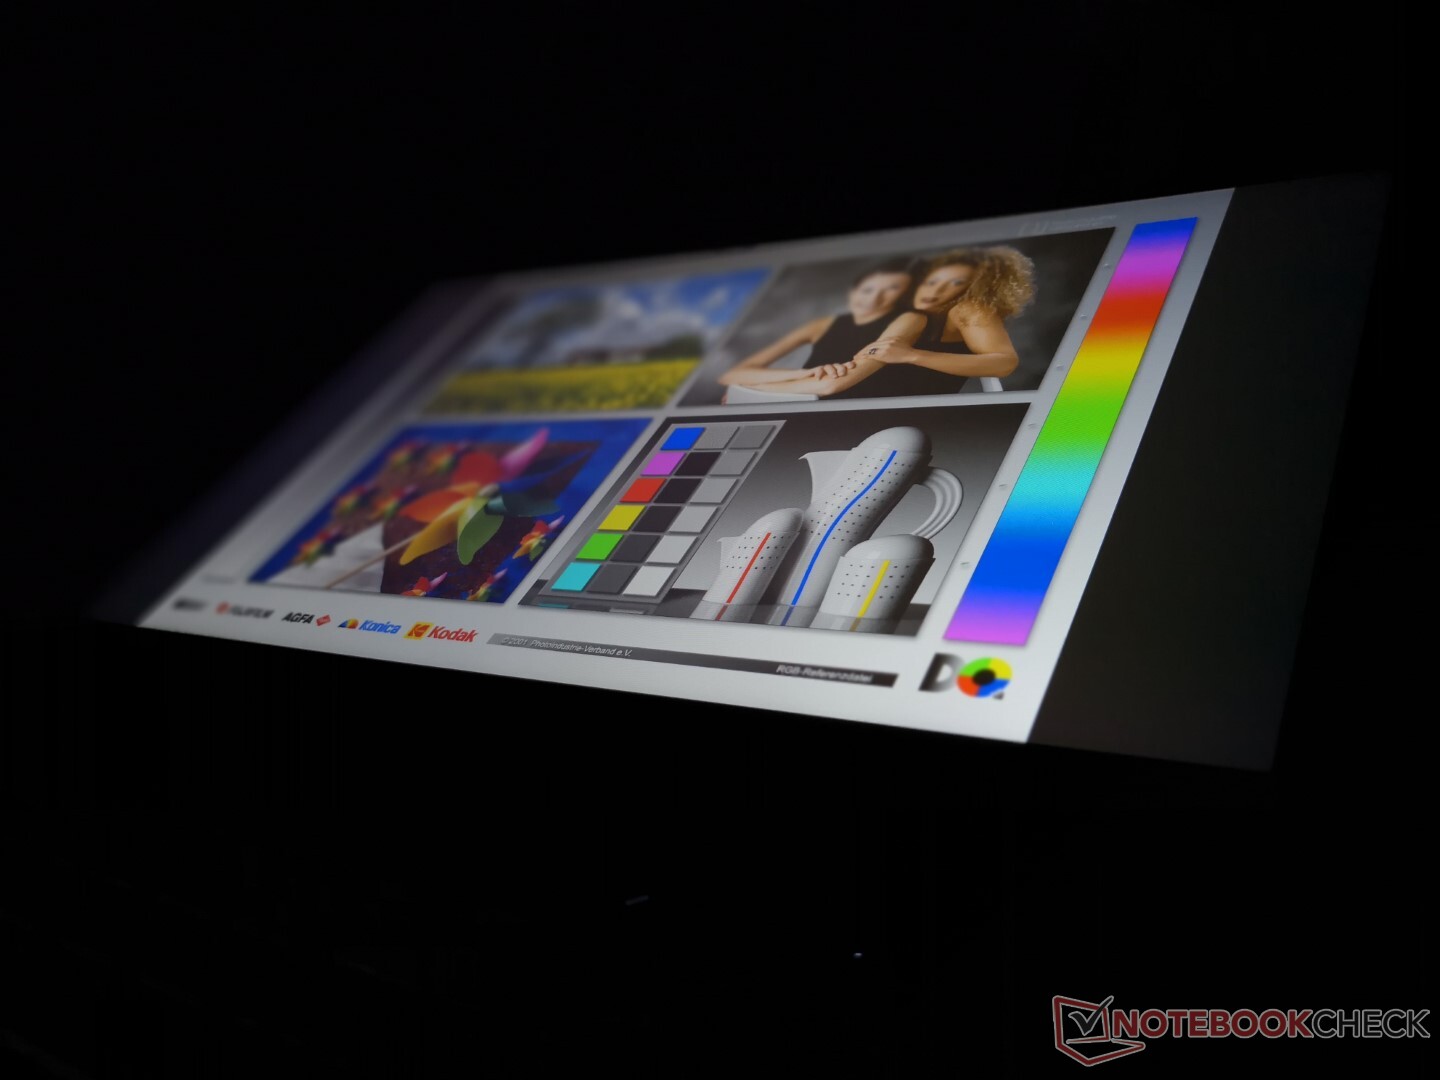
El sistema Gateway utiliza el mismo panel IPS BOE NV156FHM-NX1 1080p que se encuentra en los portátiles para juegos Lenovo IdeaPad Gaming 3i y Legion 5. Mientras que el brillo es promedio para la categoría, casi todo lo demás es mediocre incluyendo la relación de contraste, los colores y los tiempos de respuesta. Incluso subjetivamente, es obvio que se trata de una esquina cortada y no de una pantalla optimizada para juegos o creación de contenidos.


| |||||||||||||||||||||||||
iluminación: 84 %
Brillo con batería: 296.3 cd/m²
Contraste: 780:1 (Negro: 0.38 cd/m²)
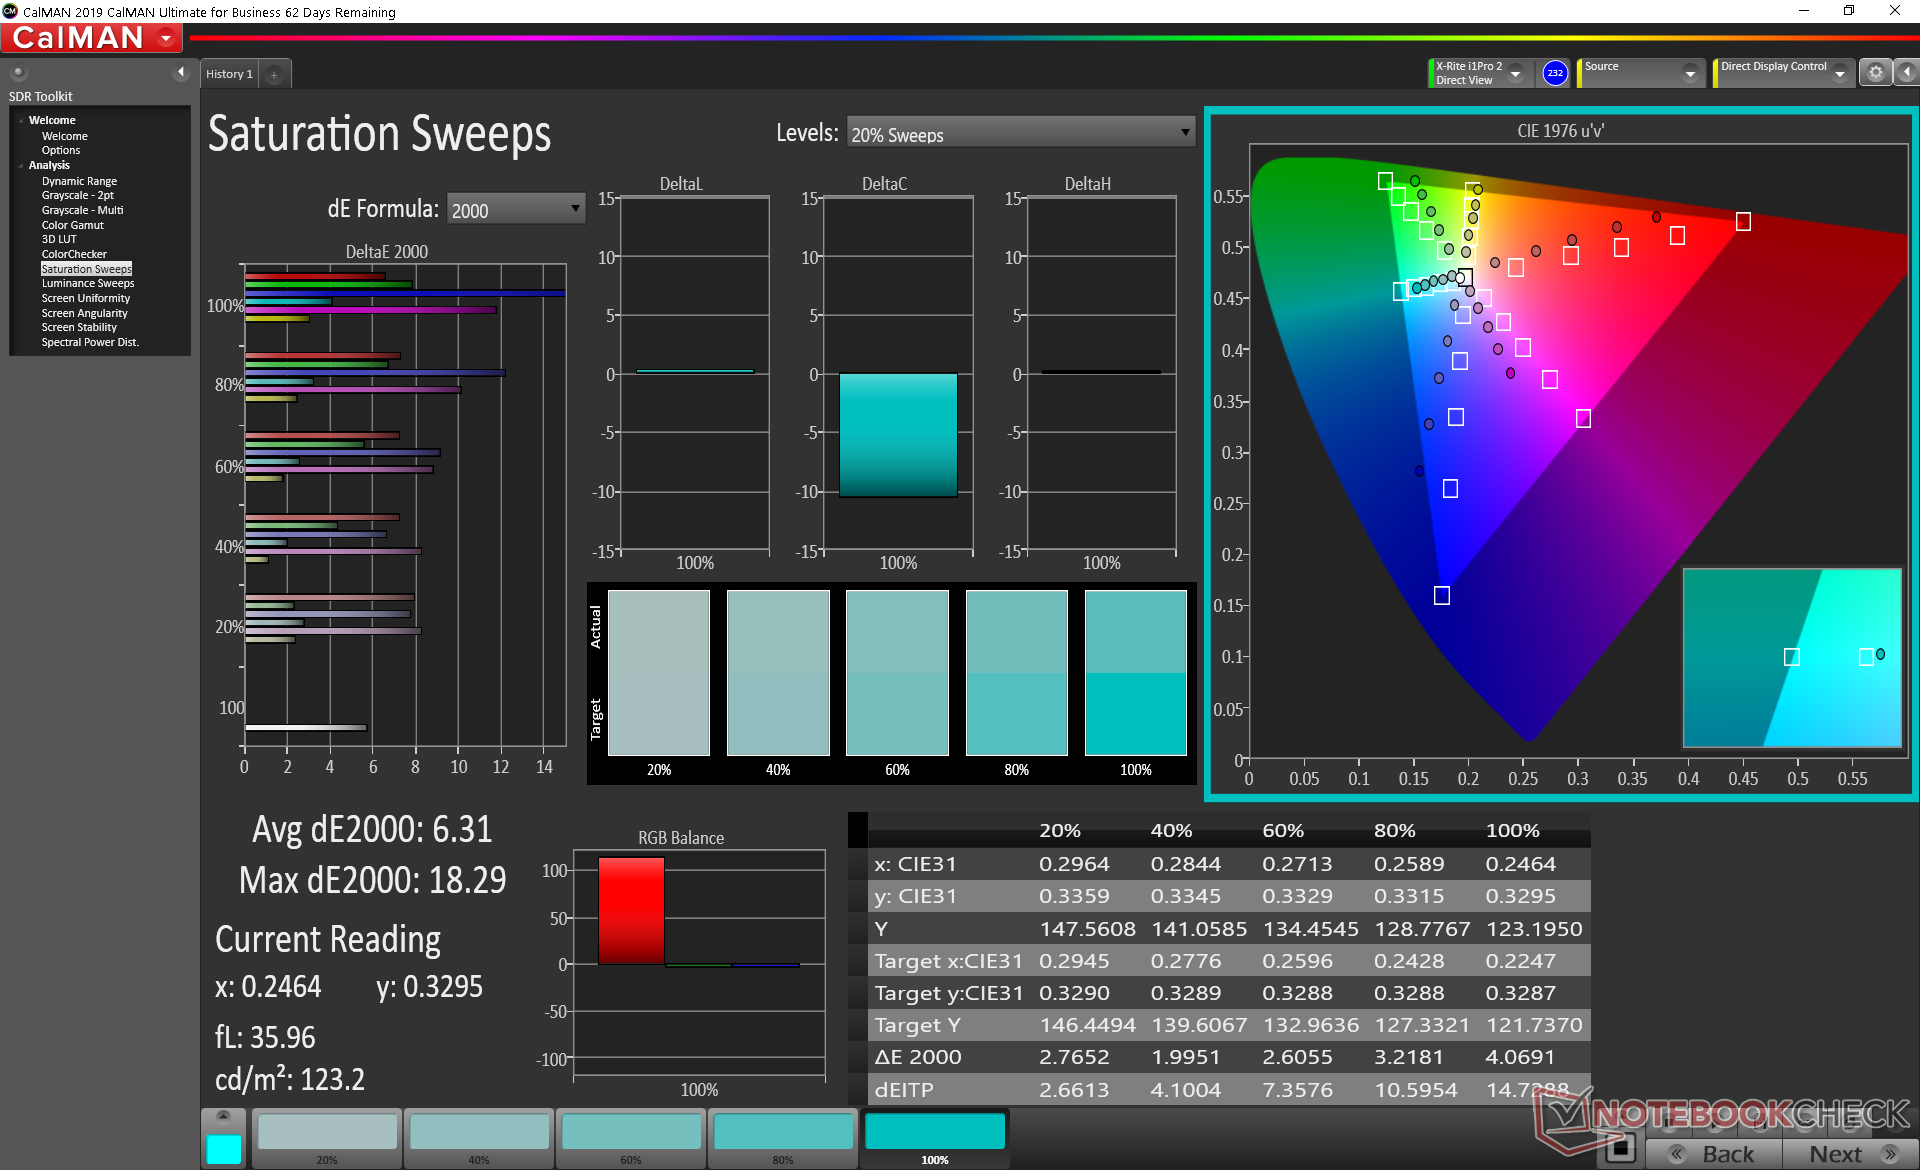
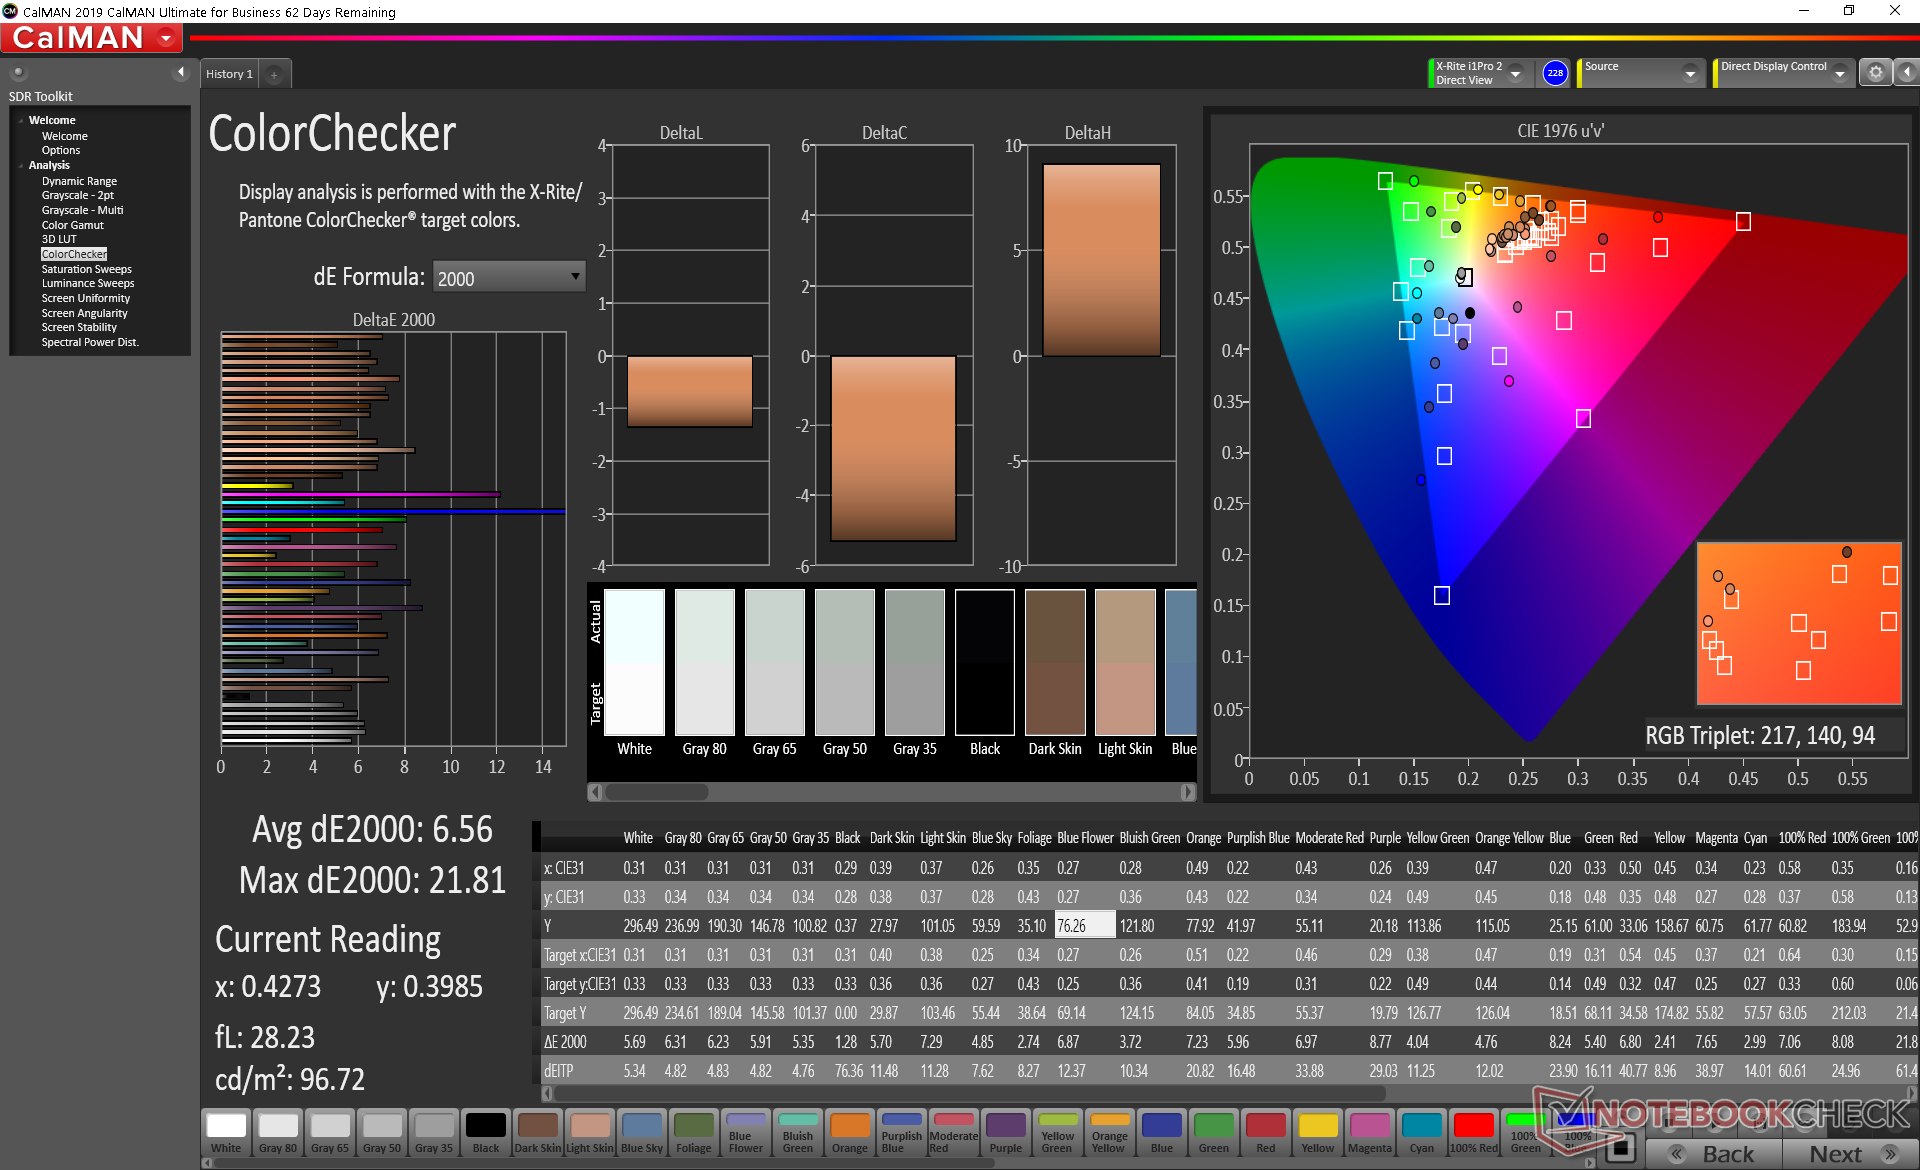
ΔE ColorChecker Calman: 6.56 | ∀{0.5-29.43 Ø4.71}
calibrated: 5.34
ΔE Greyscale Calman: 4.4 | ∀{0.09-98 Ø4.96}
57.6% sRGB (Argyll 1.6.3 3D)
37.3% AdobeRGB 1998 (Argyll 1.6.3 3D)
41.18% AdobeRGB 1998 (Argyll 3D)
58.4% sRGB (Argyll 3D)
39.86% Display P3 (Argyll 3D)
Gamma: 2.22
CCT: 6716 K
| Gateway Creator Series 15.6 GWTN156-3BK BOE NV156FHM-NX1, IPS, 15.6", 1920x1080 | Schenker XMG Core 15 GK5NR0O LM156LF-1F02, IPS, 15.6", 1920x1080 | Aorus 5 KB LG Philips LP156WFG-SPB2 (LGD05E8), IPS, 15.6", 1920x1080 | Asus ROG Zephyrus G15 GA502IU-ES76 Panda LM156LF-2F01, IPS, 15.6", 1920x1080 | HP Omen 15-ek0456ng LGD05FE, IPS, 15.6", 1920x1080 | Razer Blade 15 GTX 1660 Ti BOE NV156FHM-N4K, IPS, 15.6", 1920x1080 | |
|---|---|---|---|---|---|---|
| Display | 66% | 58% | -1% | 61% | ||
| Display P3 Coverage (%) | 39.86 | 67.2 69% | 63.4 59% | 38.9 -2% | 65.3 64% | |
| sRGB Coverage (%) | 58.4 | 95.9 64% | 92.8 59% | 58.5 0% | 91.8 57% | |
| AdobeRGB 1998 Coverage (%) | 41.18 | 68.5 66% | 64.8 57% | 40.22 -2% | 66.5 61% | |
| Response Times | 65% | 54% | 7% | 52% | 59% | |
| Response Time Grey 50% / Grey 80% * (ms) | 38.4 ? | 9.6 ? 75% | 14.4 ? 62% | 24.4 ? 36% | 17 ? 56% | 13.6 ? 65% |
| Response Time Black / White * (ms) | 20.8 ? | 9.6 ? 54% | 11.2 ? 46% | 25.6 ? -23% | 11 ? 47% | 10 ? 52% |
| PWM Frequency (Hz) | 200 ? | |||||
| Screen | 29% | 43% | 12% | 42% | 33% | |
| Brightness middle (cd/m²) | 296.3 | 312 5% | 318 7% | 255.9 -14% | 314 6% | 312.7 6% |
| Brightness (cd/m²) | 284 | 290 2% | 298 5% | 246 -13% | 293 3% | 305 7% |
| Brightness Distribution (%) | 84 | 87 4% | 87 4% | 89 6% | 87 4% | 90 7% |
| Black Level * (cd/m²) | 0.38 | 0.2 47% | 0.3 21% | 0.22 42% | 0.22 42% | 0.27 29% |
| Contrast (:1) | 780 | 1560 100% | 1060 36% | 1163 49% | 1427 83% | 1158 48% |
| Colorchecker dE 2000 * | 6.56 | 4.84 26% | 2.49 62% | 5.15 21% | 2.51 62% | 4.57 30% |
| Colorchecker dE 2000 max. * | 21.81 | 13.85 36% | 5.06 77% | 17.11 22% | 4.42 80% | 6.81 69% |
| Colorchecker dE 2000 calibrated * | 5.34 | 1.77 67% | 1.53 71% | 4.83 10% | 1.71 68% | 2.91 46% |
| Greyscale dE 2000 * | 4.4 | 9 -105% | 1.6 64% | 4.2 5% | 3.26 26% | 4.3 2% |
| Gamma | 2.22 99% | 2.105 105% | 2.211 100% | 2.16 102% | 2.42 91% | 2.29 96% |
| CCT | 6716 97% | 8099 80% | 6714 97% | 7500 87% | 6150 106% | 7098 92% |
| Color Space (Percent of AdobeRGB 1998) (%) | 37.3 | 68 82% | 65 74% | 36.9 -1% | 59.4 59% | |
| Color Space (Percent of sRGB) (%) | 57.6 | 92 60% | 89 55% | 58 1% | 91.3 59% | |
| Media total (Programa/Opciones) | 53% /
41% | 52% /
47% | 6% /
9% | 47% /
43% | 51% /
41% |
* ... más pequeño es mejor
El espacio de color se reduce a sólo el 58 por ciento de sRGB cuando la mayoría de los demás portátiles para juegos con el RTX 2060 cubren al menos el 90 por ciento de sRGB.
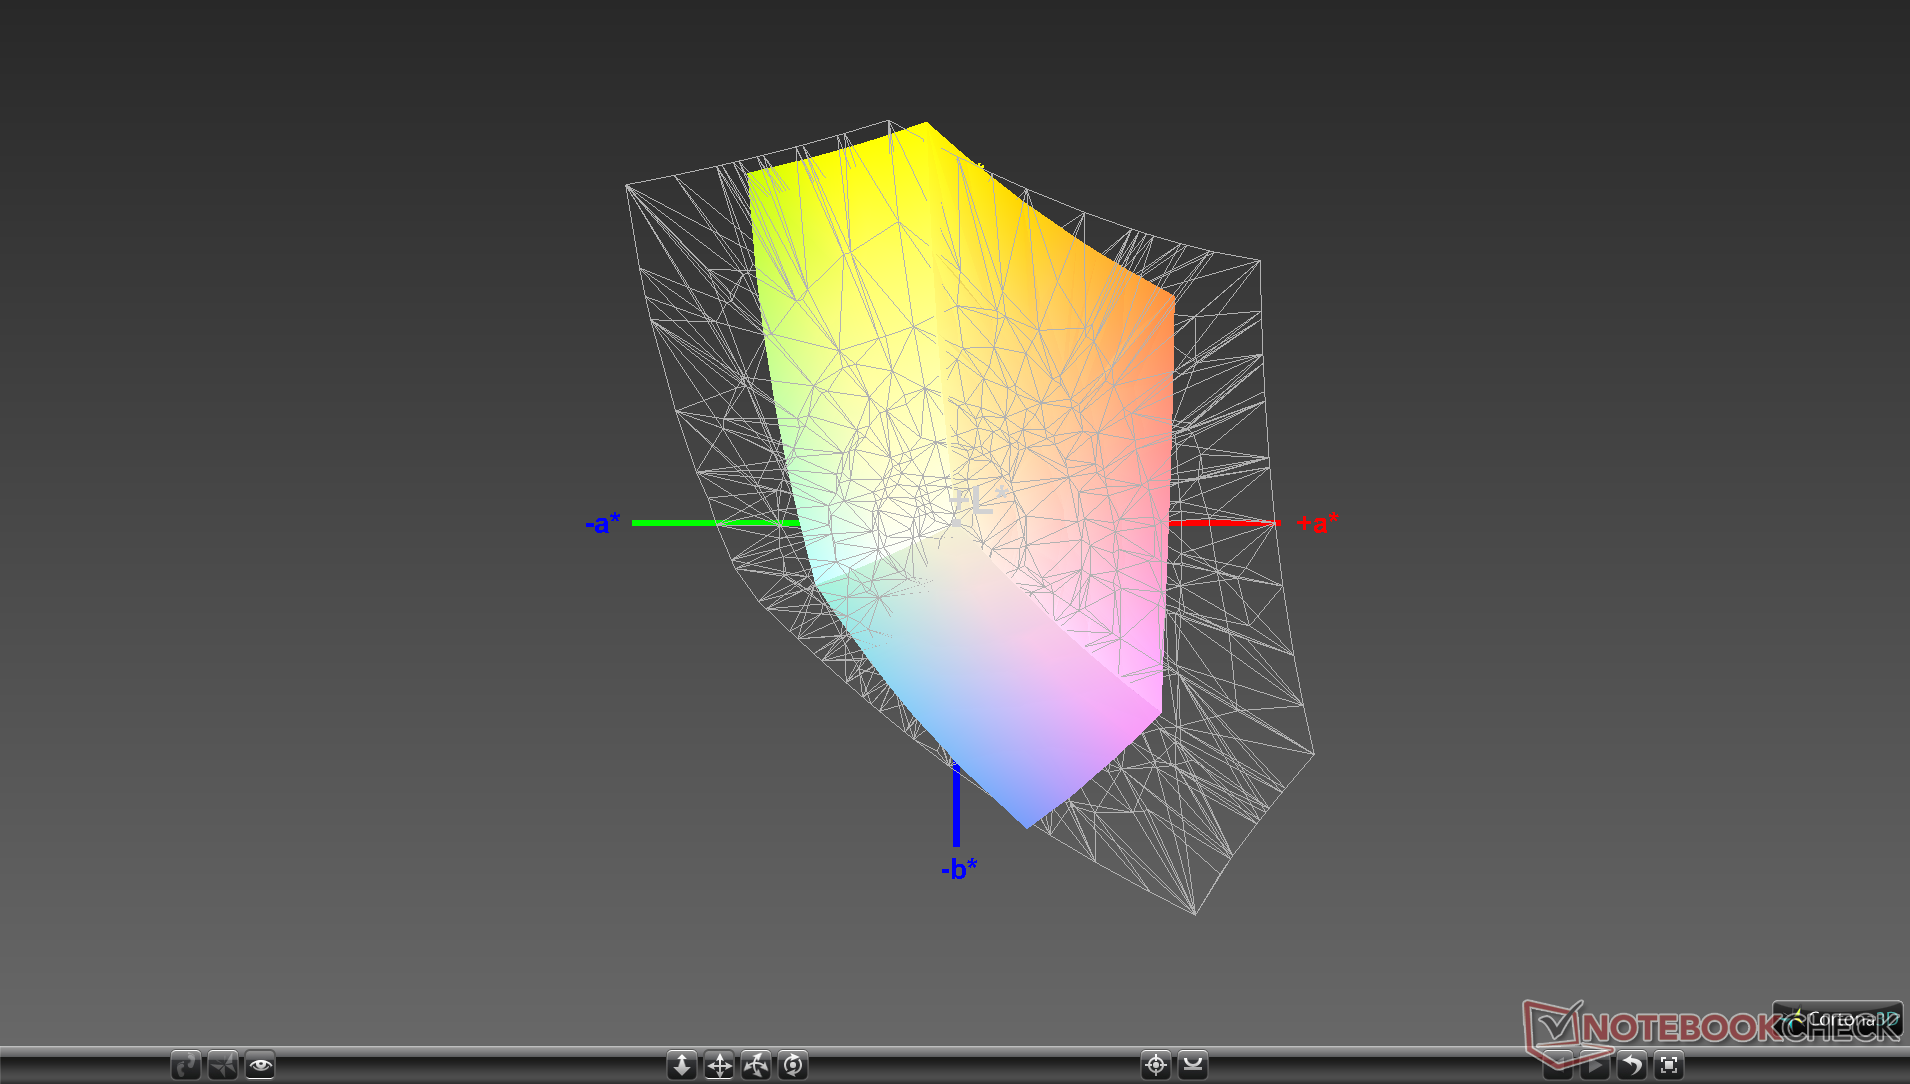
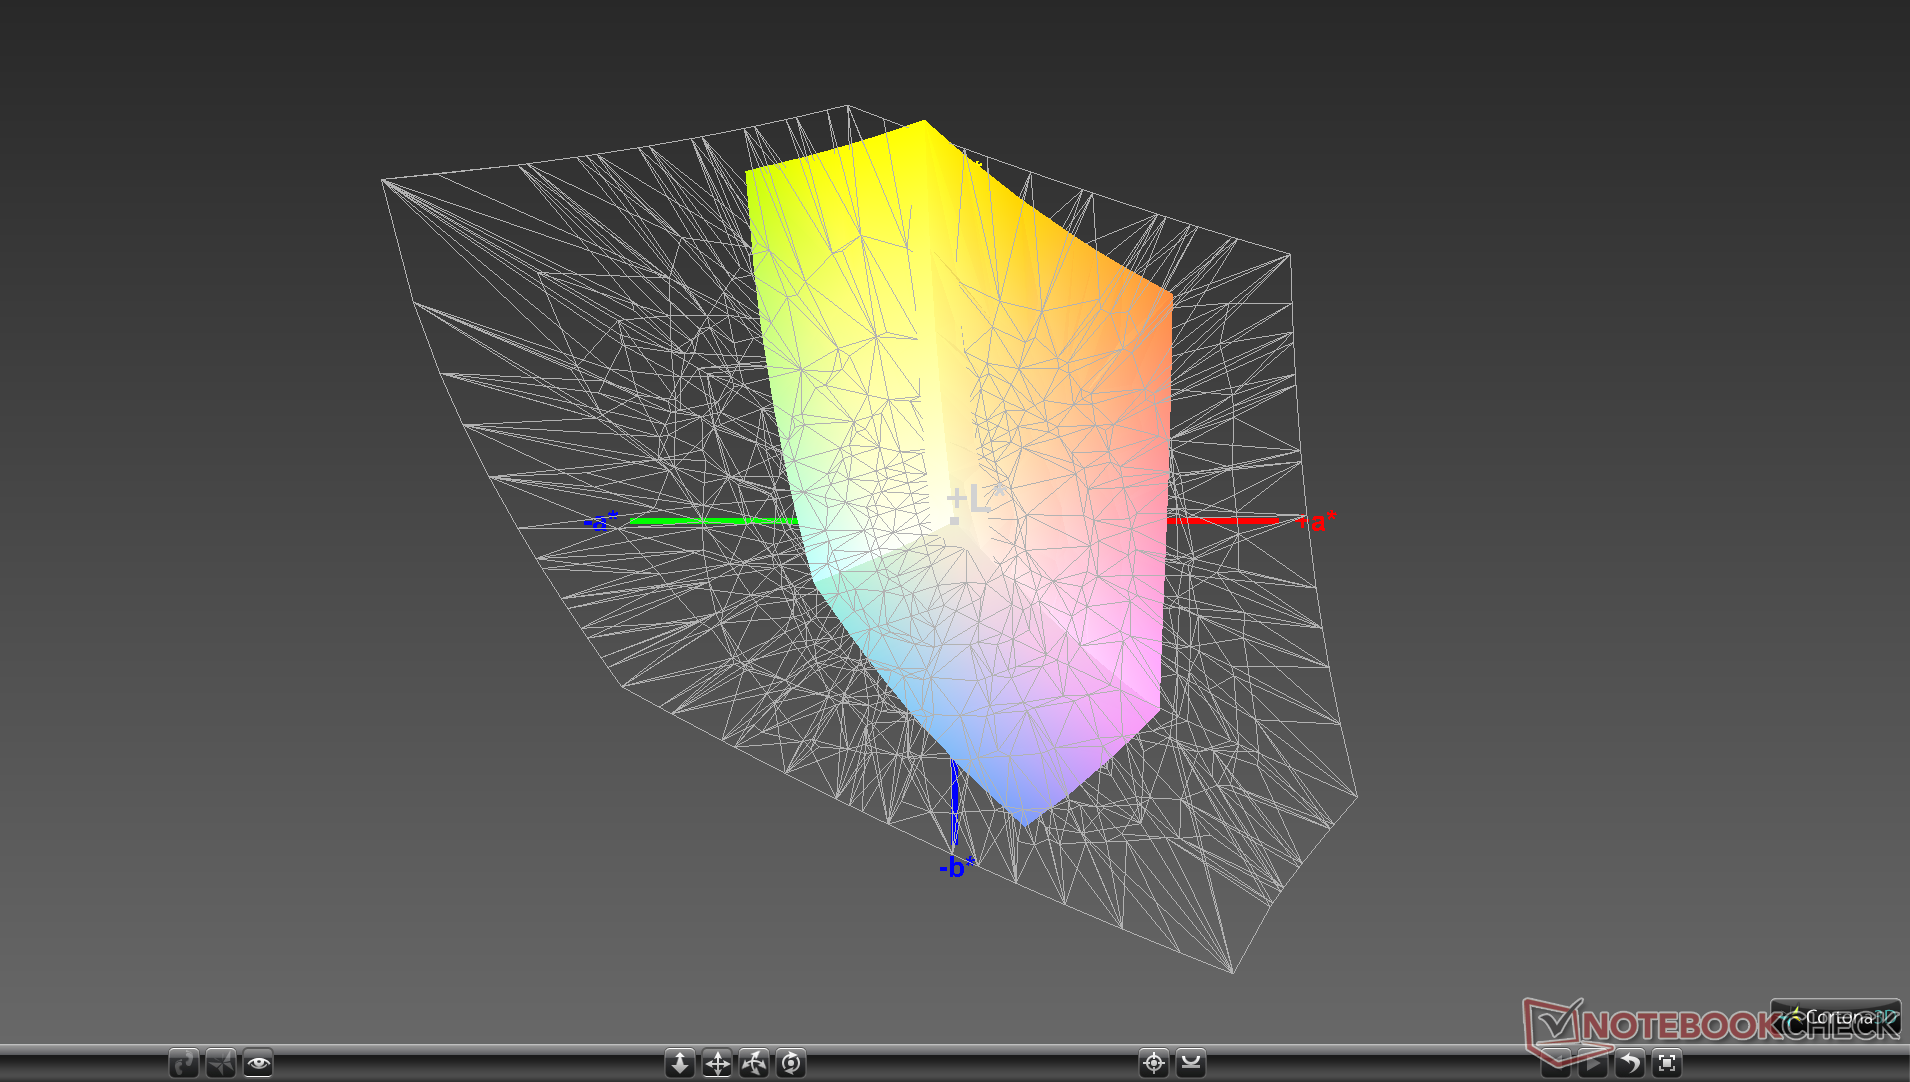
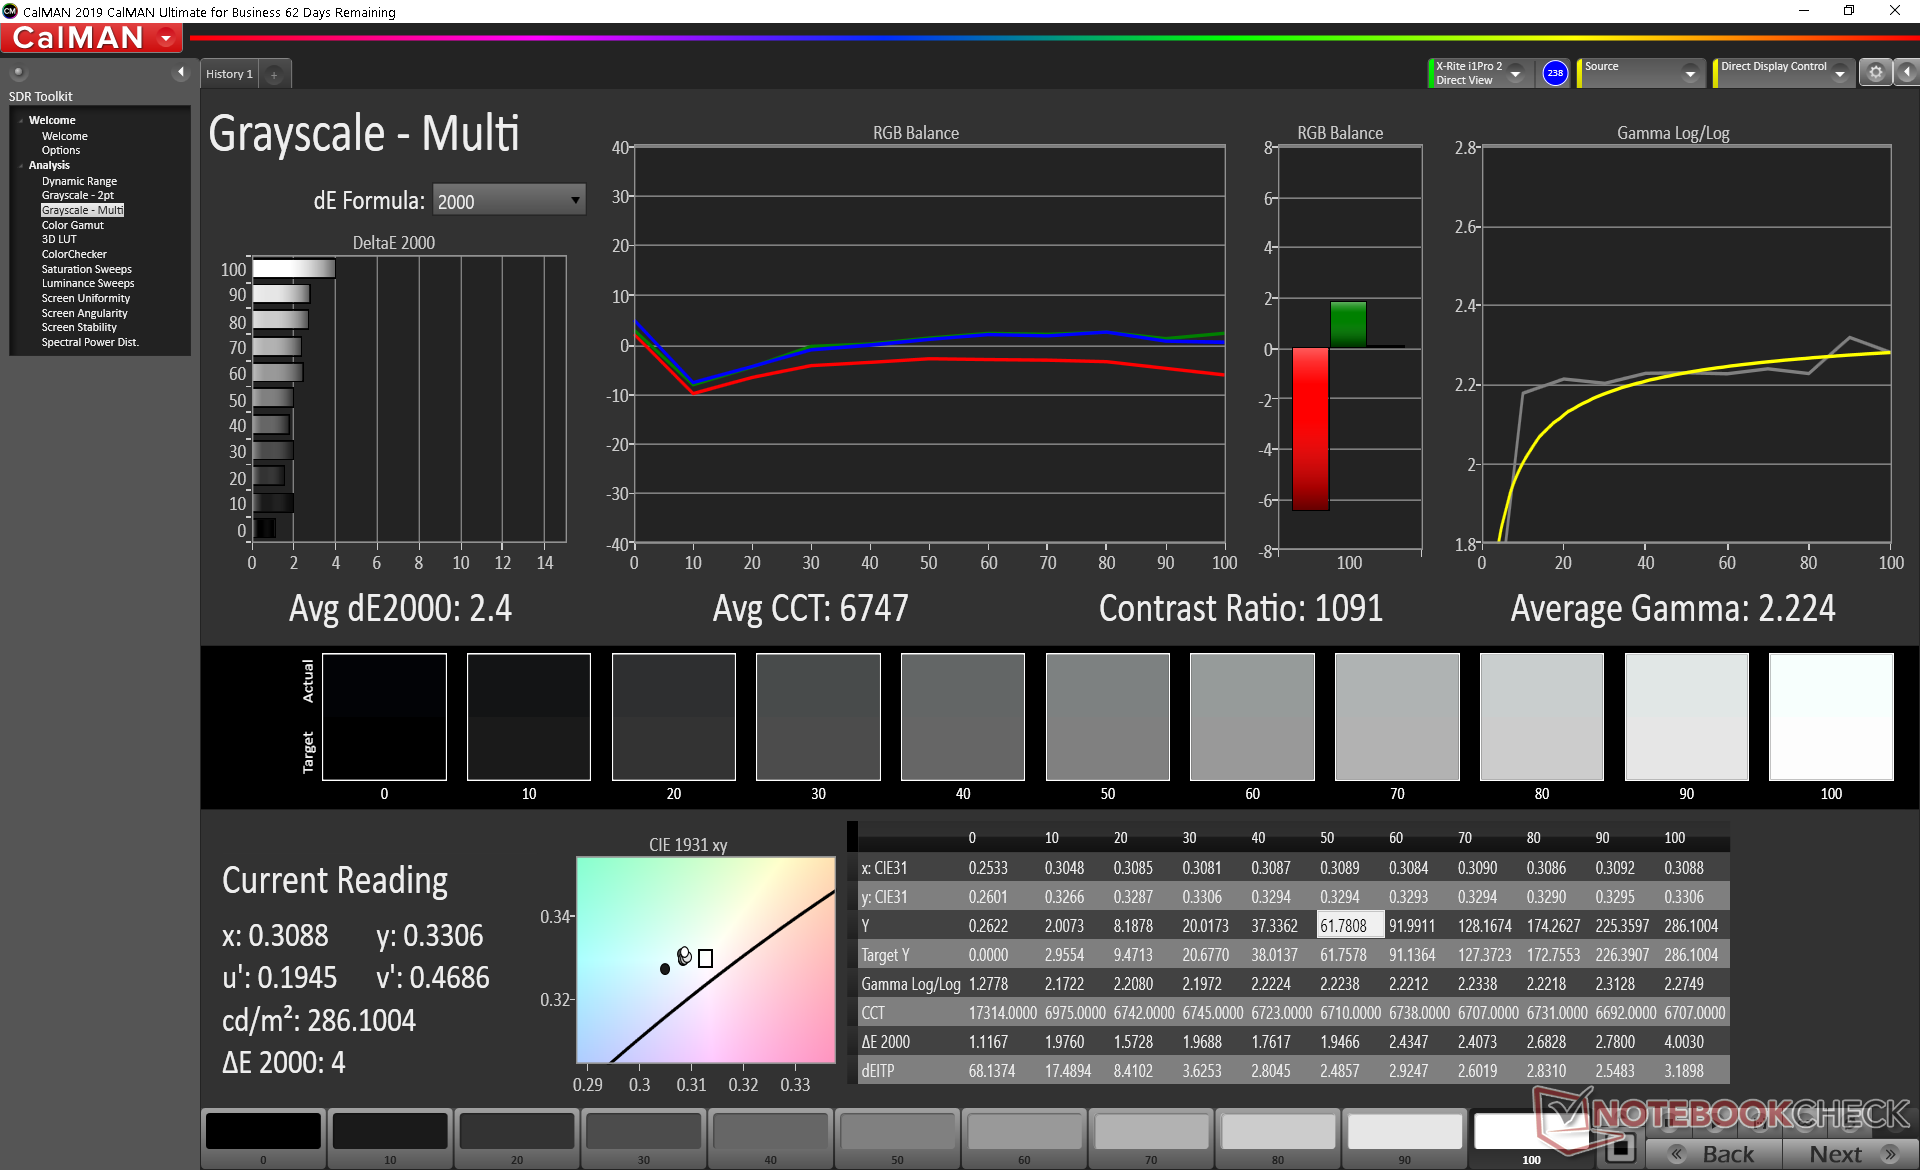
Las mediciones del colorímetro de X-Rite revelan valores decentes de escala de grises y color DeltaE de 4,4 y 6,56, respectivamente. Estos mejoran sólo marginalmente después de la calibración debido al estrecho espacio de color mencionado anteriormente. El color azul se representa con menos precisión de todos los colores primarios y secundarios.
Tiempos de respuesta del display
| ↔ Tiempo de respuesta de Negro a Blanco | ||
|---|---|---|
| 20.8 ms ... subida ↗ y bajada ↘ combinada | ↗ 10.8 ms subida | 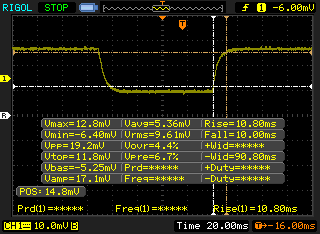 |
| ↘ 10 ms bajada | ||
| La pantalla mostró buenos tiempos de respuesta en nuestros tests pero podría ser demasiado lenta para los jugones competitivos. En comparación, todos los dispositivos de prueba van de ##min### (mínimo) a 240 (máximo) ms. » 46 % de todos los dispositivos son mejores. Eso quiere decir que el tiempo de respuesta es similar al dispositivo testado medio (19.8 ms). | ||
| ↔ Tiempo de respuesta 50% Gris a 80% Gris | ||
| 38.4 ms ... subida ↗ y bajada ↘ combinada | ↗ 18.8 ms subida | 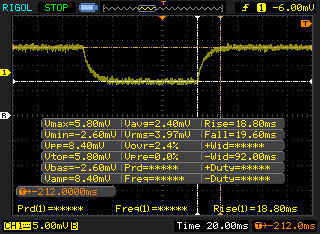 |
| ↘ 19.6 ms bajada | ||
| La pantalla mostró tiempos de respuesta lentos en nuestros tests y podría ser demasiado lenta para los jugones. En comparación, todos los dispositivos de prueba van de ##min### (mínimo) a 636 (máximo) ms. » 58 % de todos los dispositivos son mejores. Eso quiere decir que el tiempo de respuesta es peor que la media (30.9 ms) de todos los dispositivos testados. | ||
Parpadeo de Pantalla / PWM (Pulse-Width Modulation)
| Parpadeo de Pantalla / PWM no detectado | 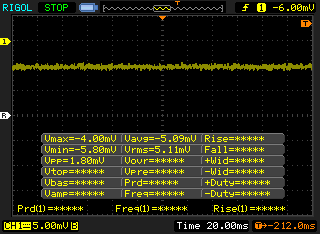 | ||
Comparación: 52 % de todos los dispositivos testados no usaron PWM para atenuar el display. Si se usó, medimos una media de 7748 (mínimo: 5 - máxmo: 343500) Hz. | |||
Rendimiento
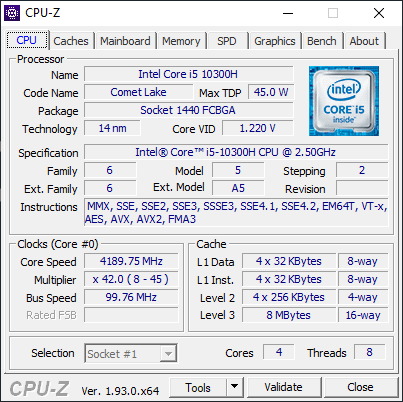
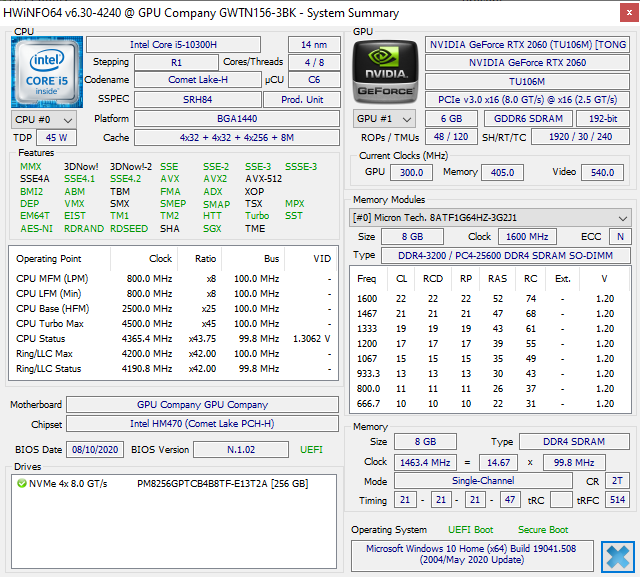
Un Core i5-10300H viene de serie en lugar del más común Core i7-10750H para mantener los precios bajo control. Aunque Walmart ofrece una opción de CPU Ryzen 5 4600H más rápida, ese modelo en particular sólo viene con la GPU GeForce GTX 1650 más lenta. En otras palabras, optar por el modelo de Intel le dará un CPU más lento pero un GPU más rápido mientras que la opción AMD le dará un CPU más rápido pero un GPU más lento.
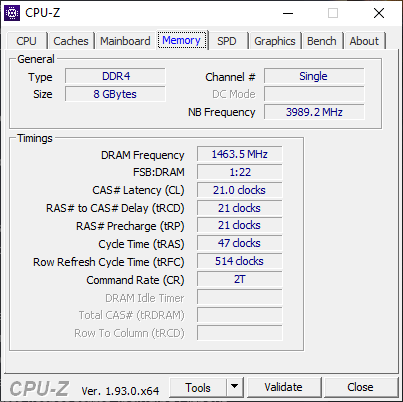
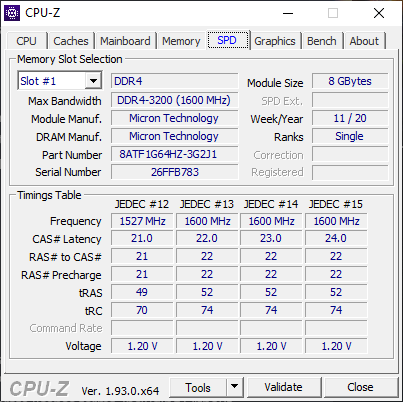
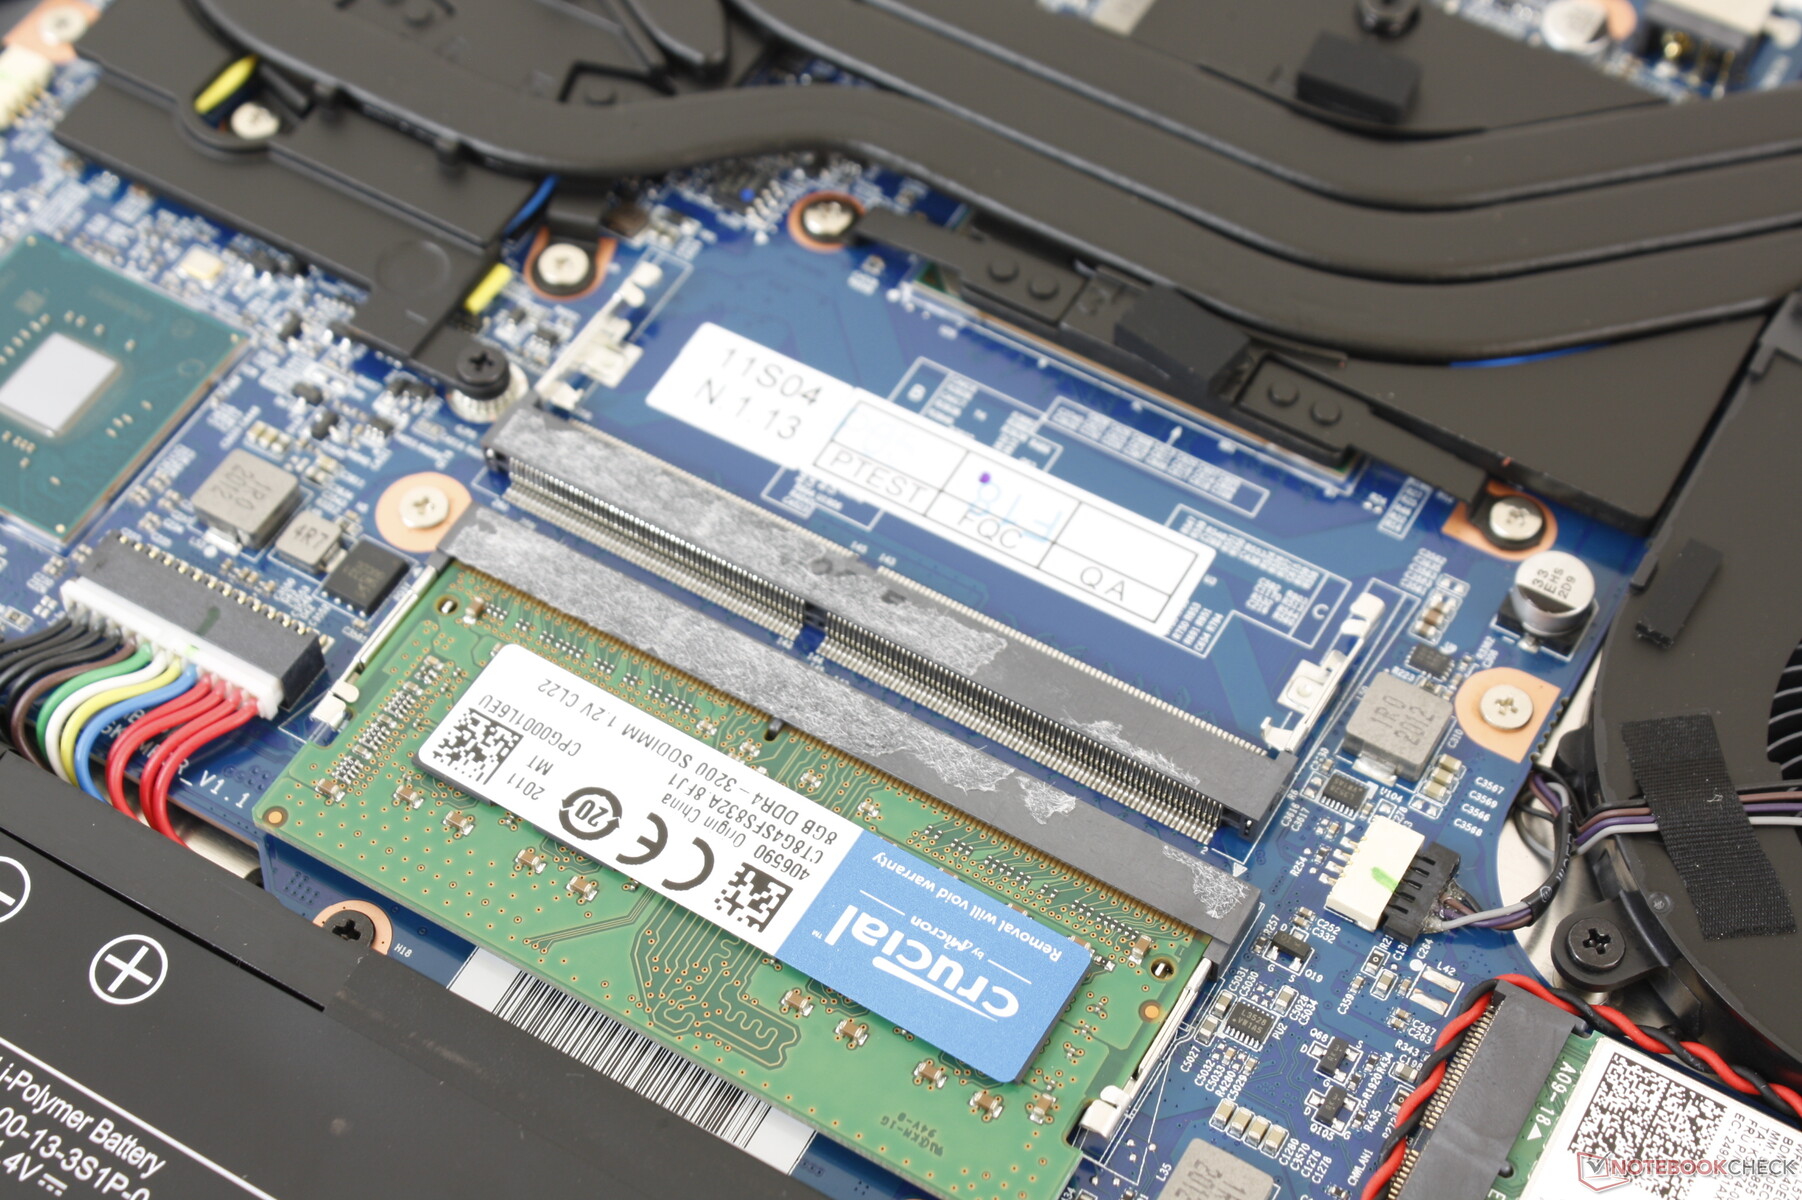
La memoria RAM del sistema es de sólo 8 GB de un solo canal DDR4-3200 que se puede expandir hasta 32 GB de doble canal.
Procesador
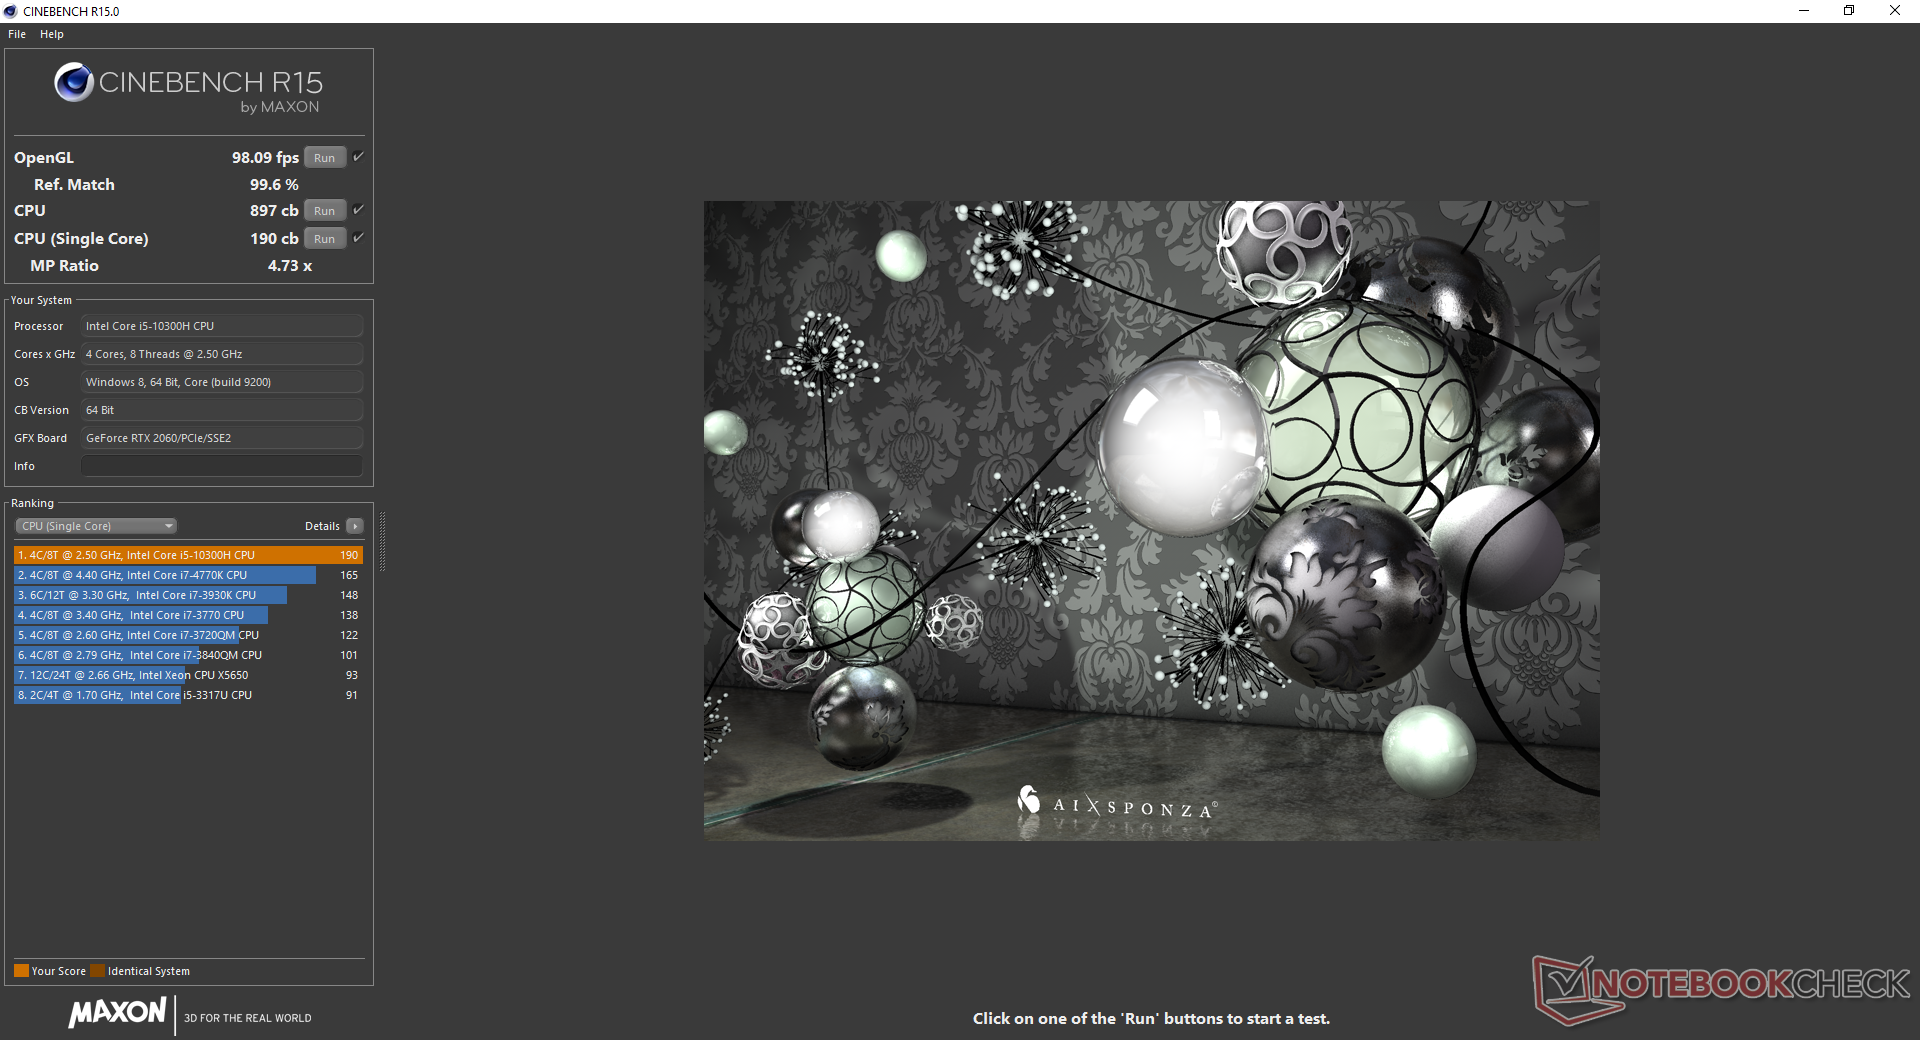
El rendimiento de la CPU está donde esperamos que esté en relación con el promedio del Core i5-10300H de nuestra base de datos. El rendimiento de los múltiples núcleos es más lento que el del Ryzen 5 4600H, Core i7-9750H y el Core i7-10750H, ya que el i5-10300H tiene menos núcleos e hilos.
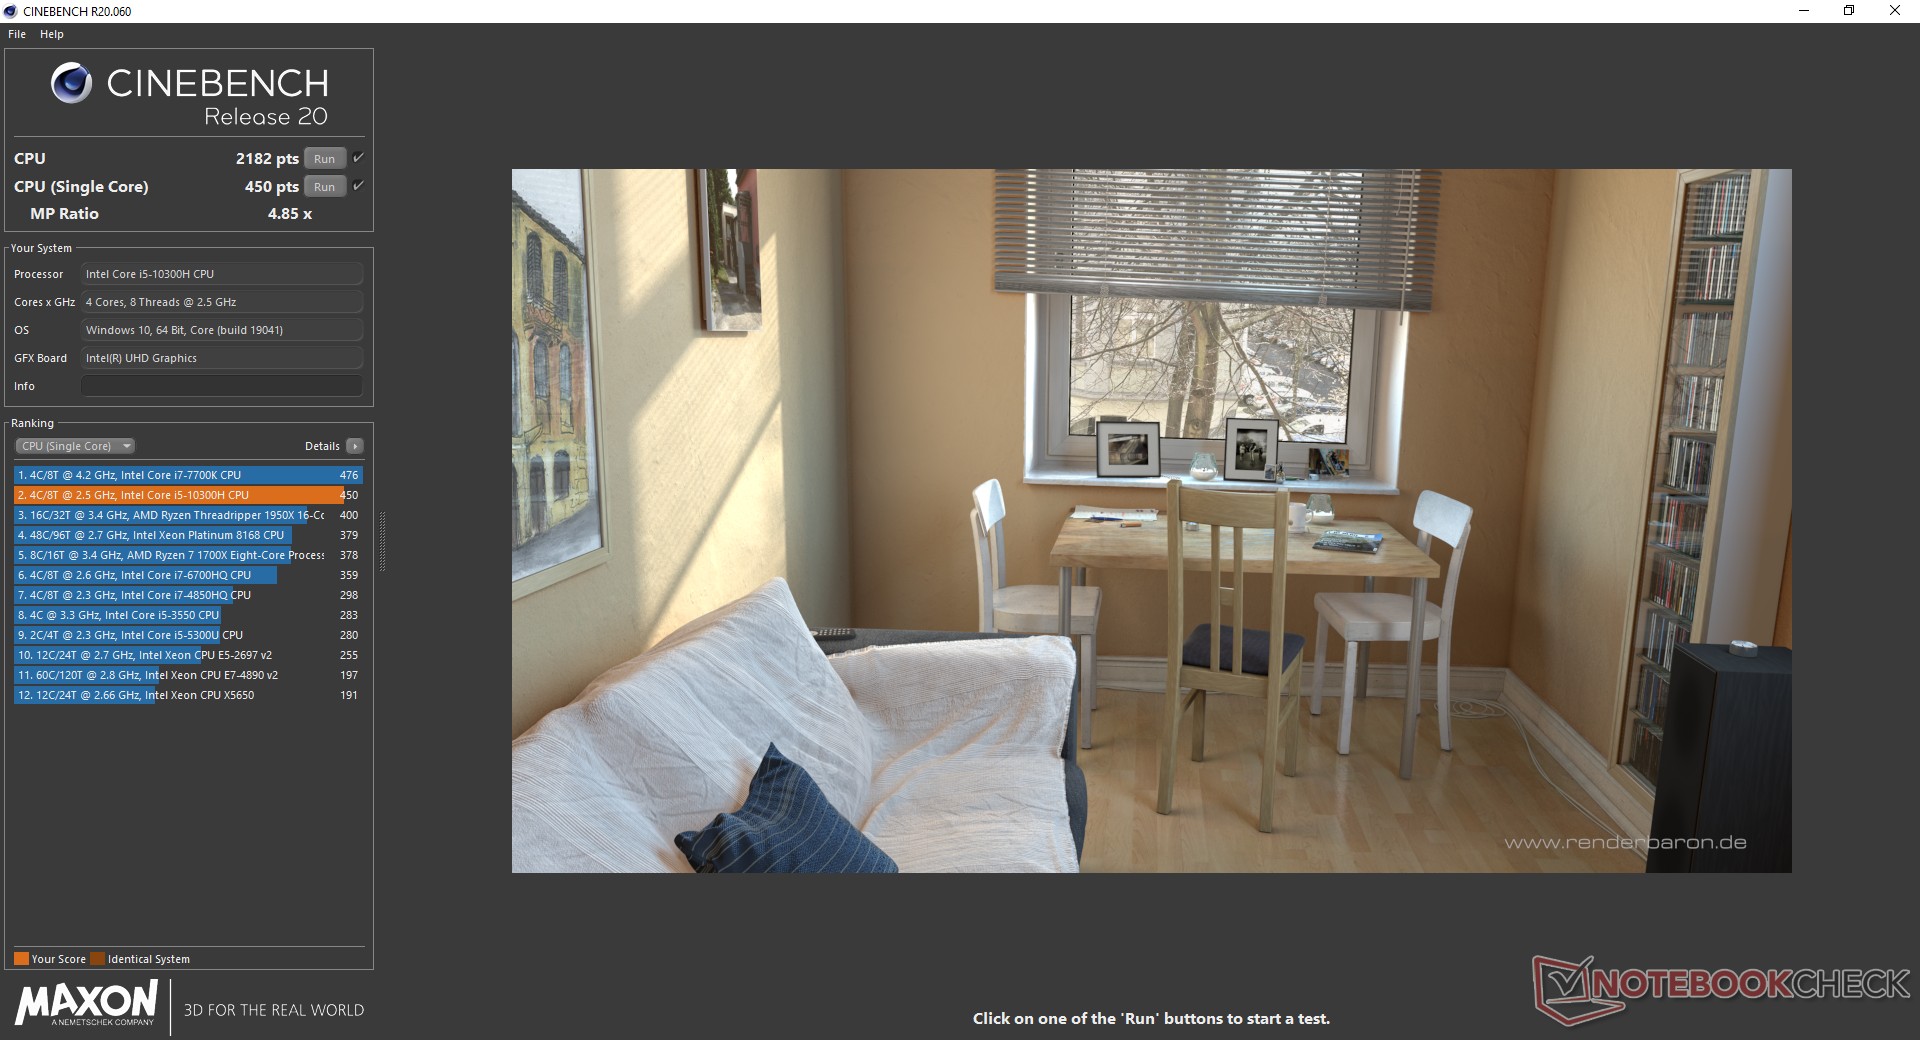
Cinebench R15: CPU Multi 64Bit | CPU Single 64Bit
Blender: v2.79 BMW27 CPU
7-Zip 18.03: 7z b 4 -mmt1 | 7z b 4
Geekbench 5.5: Single-Core | Multi-Core
HWBOT x265 Benchmark v2.2: 4k Preset
LibreOffice : 20 Documents To PDF
R Benchmark 2.5: Overall mean
| Cinebench R20 / CPU (Multi Core) | |
| Schenker XMG Core 15 GK5NR0O | |
| Asus Zephyrus S15 GX502L | |
| MSI GE66 Raider 10SFS | |
| Acer Nitro 5 AN515-44-R5FT | |
| Asus ROG Zephyrus M15 GU502L | |
| Schenker XMG Pro 15 | |
| Gateway Creator Series 15.6 GWTN156-3BK | |
| Medio Intel Core i5-10300H (1397 - 2240, n=15) | |
| MSI GF63 Thin 9SC | |
| MSI Alpha 15 A3DDK-034 | |
| Cinebench R20 / CPU (Single Core) | |
| MSI GE66 Raider 10SFS | |
| Schenker XMG Core 15 GK5NR0O | |
| Asus Zephyrus S15 GX502L | |
| Asus ROG Zephyrus M15 GU502L | |
| Medio Intel Core i5-10300H (312 - 470, n=15) | |
| Gateway Creator Series 15.6 GWTN156-3BK | |
| Acer Nitro 5 AN515-44-R5FT | |
| Schenker XMG Pro 15 | |
| MSI GF63 Thin 9SC | |
| MSI Alpha 15 A3DDK-034 | |
| Cinebench R15 / CPU Multi 64Bit | |
| Schenker XMG Core 15 GK5NR0O | |
| MSI GE66 Raider 10SFS | |
| Asus Zephyrus S15 GX502L | |
| Acer Nitro 5 AN515-44-R5FT | |
| Asus ROG Zephyrus M15 GU502L | |
| Schenker XMG Pro 15 | |
| Gateway Creator Series 15.6 GWTN156-3BK | |
| Medio Intel Core i5-10300H (536 - 921, n=17) | |
| MSI GF63 Thin 9SC | |
| MSI Alpha 15 A3DDK-034 | |
| Cinebench R15 / CPU Single 64Bit | |
| MSI GE66 Raider 10SFS | |
| Asus Zephyrus S15 GX502L | |
| Asus ROG Zephyrus M15 GU502L | |
| Schenker XMG Core 15 GK5NR0O | |
| Acer Nitro 5 AN515-44-R5FT | |
| Gateway Creator Series 15.6 GWTN156-3BK | |
| Schenker XMG Pro 15 | |
| Medio Intel Core i5-10300H (108 - 194, n=17) | |
| MSI GF63 Thin 9SC | |
| MSI Alpha 15 A3DDK-034 | |
| Blender / v2.79 BMW27 CPU | |
| Medio Intel Core i5-10300H (479 - 555, n=14) | |
| Gateway Creator Series 15.6 GWTN156-3BK | |
| Schenker XMG Pro 15 | |
| Asus ROG Zephyrus M15 GU502L | |
| Acer Nitro 5 AN515-44-R5FT | |
| MSI GE66 Raider 10SFS | |
| Asus Zephyrus S15 GX502L | |
| Schenker XMG Core 15 GK5NR0O | |
| 7-Zip 18.03 / 7z b 4 -mmt1 | |
| MSI GE66 Raider 10SFS | |
| Asus Zephyrus S15 GX502L | |
| Asus ROG Zephyrus M15 GU502L | |
| Medio Intel Core i5-10300H (2945 - 4956, n=14) | |
| Schenker XMG Core 15 GK5NR0O | |
| Schenker XMG Pro 15 | |
| Gateway Creator Series 15.6 GWTN156-3BK | |
| Acer Nitro 5 AN515-44-R5FT | |
| Geekbench 5.5 / Single-Core | |
| MSI GE66 Raider 10SFS | |
| Asus Zephyrus S15 GX502L | |
| Asus ROG Zephyrus M15 GU502L | |
| Schenker XMG Core 15 GK5NR0O | |
| Medio Intel Core i5-10300H (703 - 1241, n=16) | |
| Schenker XMG Pro 15 | |
| Acer Nitro 5 AN515-44-R5FT | |
| Gateway Creator Series 15.6 GWTN156-3BK | |
| MSI Alpha 15 A3DDK-034 | |
| Geekbench 5.5 / Multi-Core | |
| MSI GE66 Raider 10SFS | |
| Asus Zephyrus S15 GX502L | |
| Schenker XMG Core 15 GK5NR0O | |
| Asus ROG Zephyrus M15 GU502L | |
| Schenker XMG Pro 15 | |
| Acer Nitro 5 AN515-44-R5FT | |
| Medio Intel Core i5-10300H (2783 - 4728, n=16) | |
| Gateway Creator Series 15.6 GWTN156-3BK | |
| MSI Alpha 15 A3DDK-034 | |
| HWBOT x265 Benchmark v2.2 / 4k Preset | |
| Asus Zephyrus S15 GX502L | |
| MSI GE66 Raider 10SFS | |
| Schenker XMG Core 15 GK5NR0O | |
| Asus ROG Zephyrus M15 GU502L | |
| Acer Nitro 5 AN515-44-R5FT | |
| Schenker XMG Pro 15 | |
| Medio Intel Core i5-10300H (6.13 - 7.78, n=14) | |
| Gateway Creator Series 15.6 GWTN156-3BK | |
| LibreOffice / 20 Documents To PDF | |
| Acer Nitro 5 AN515-44-R5FT | |
| Schenker XMG Core 15 GK5NR0O | |
| Medio Intel Core i5-10300H (23.9 - 94, n=14) | |
| Asus ROG Zephyrus M15 GU502L | |
| Gateway Creator Series 15.6 GWTN156-3BK | |
| MSI GE66 Raider 10SFS | |
| Asus Zephyrus S15 GX502L | |
| R Benchmark 2.5 / Overall mean | |
| Gateway Creator Series 15.6 GWTN156-3BK | |
| Medio Intel Core i5-10300H (0.625 - 1.088, n=14) | |
| Schenker XMG Pro 15 | |
| Asus ROG Zephyrus M15 GU502L | |
| Acer Nitro 5 AN515-44-R5FT | |
| Asus Zephyrus S15 GX502L | |
| Schenker XMG Core 15 GK5NR0O | |
| MSI GE66 Raider 10SFS | |
* ... más pequeño es mejor
Rendimiento del sistema
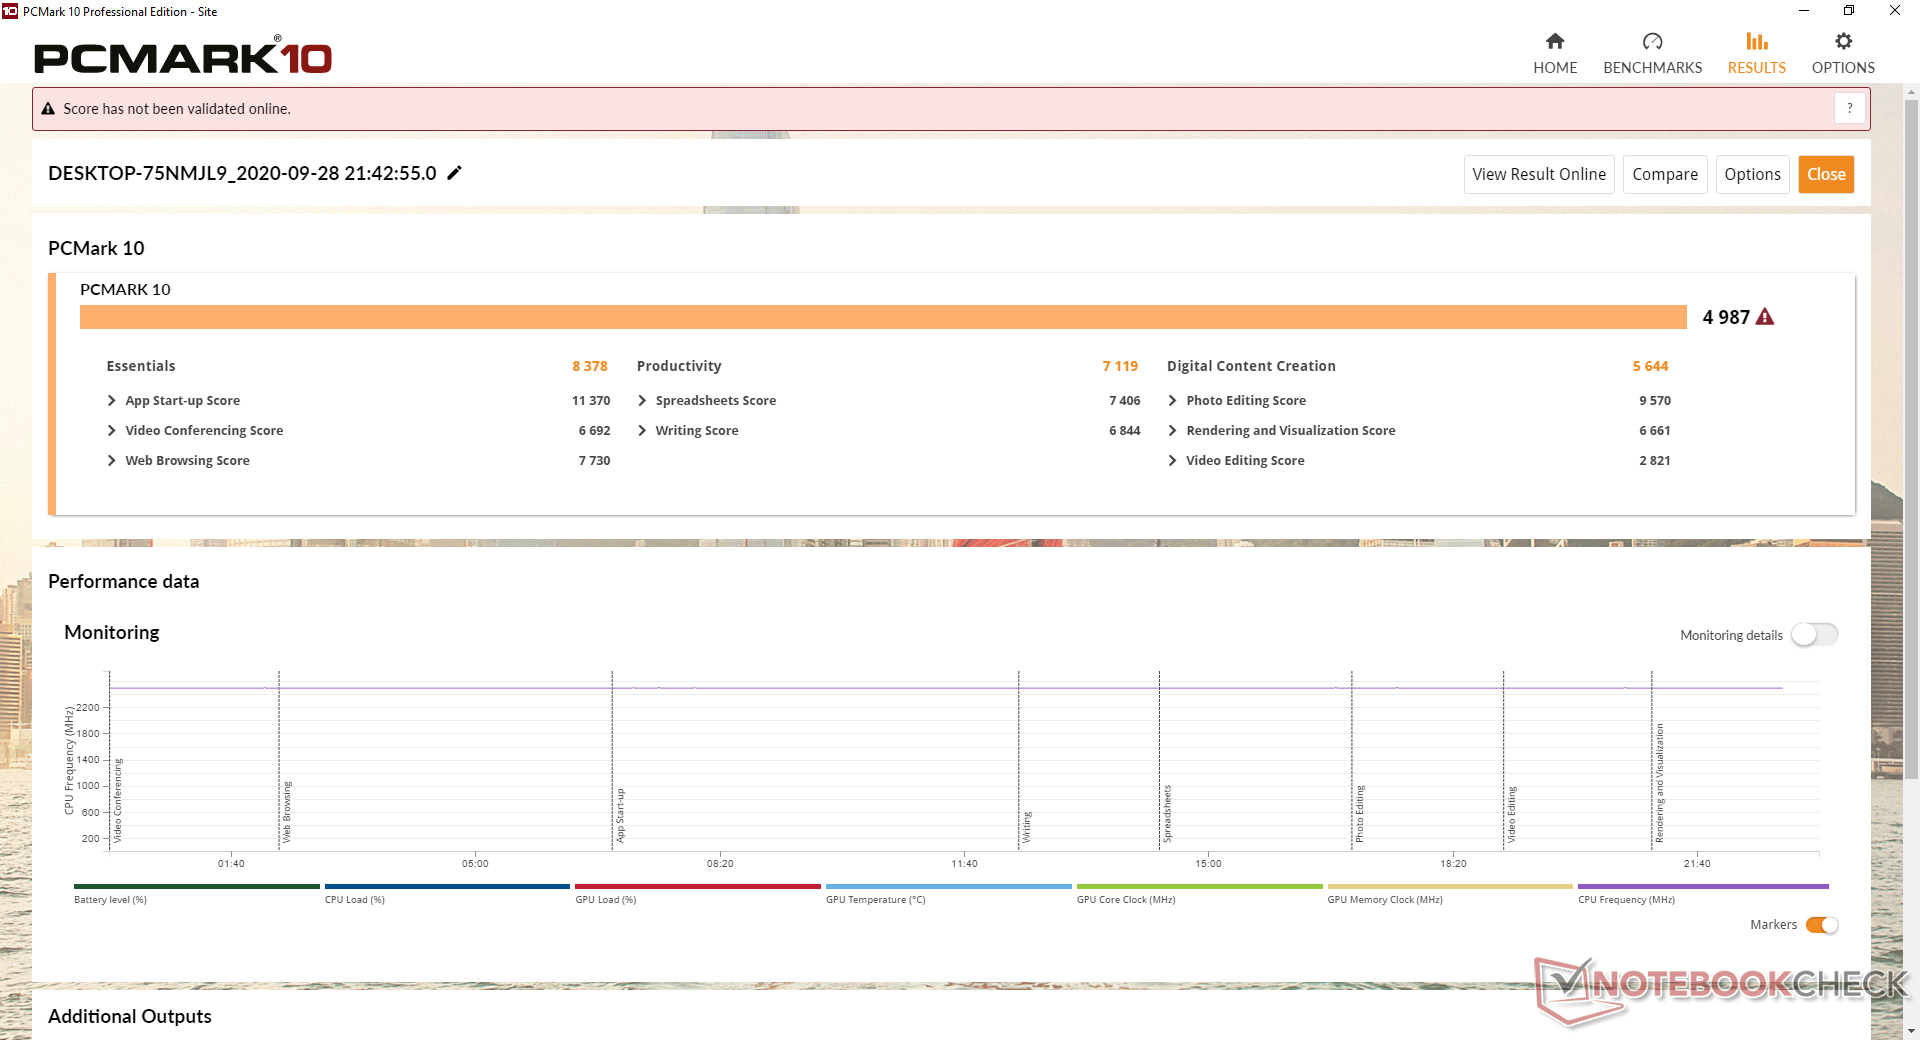
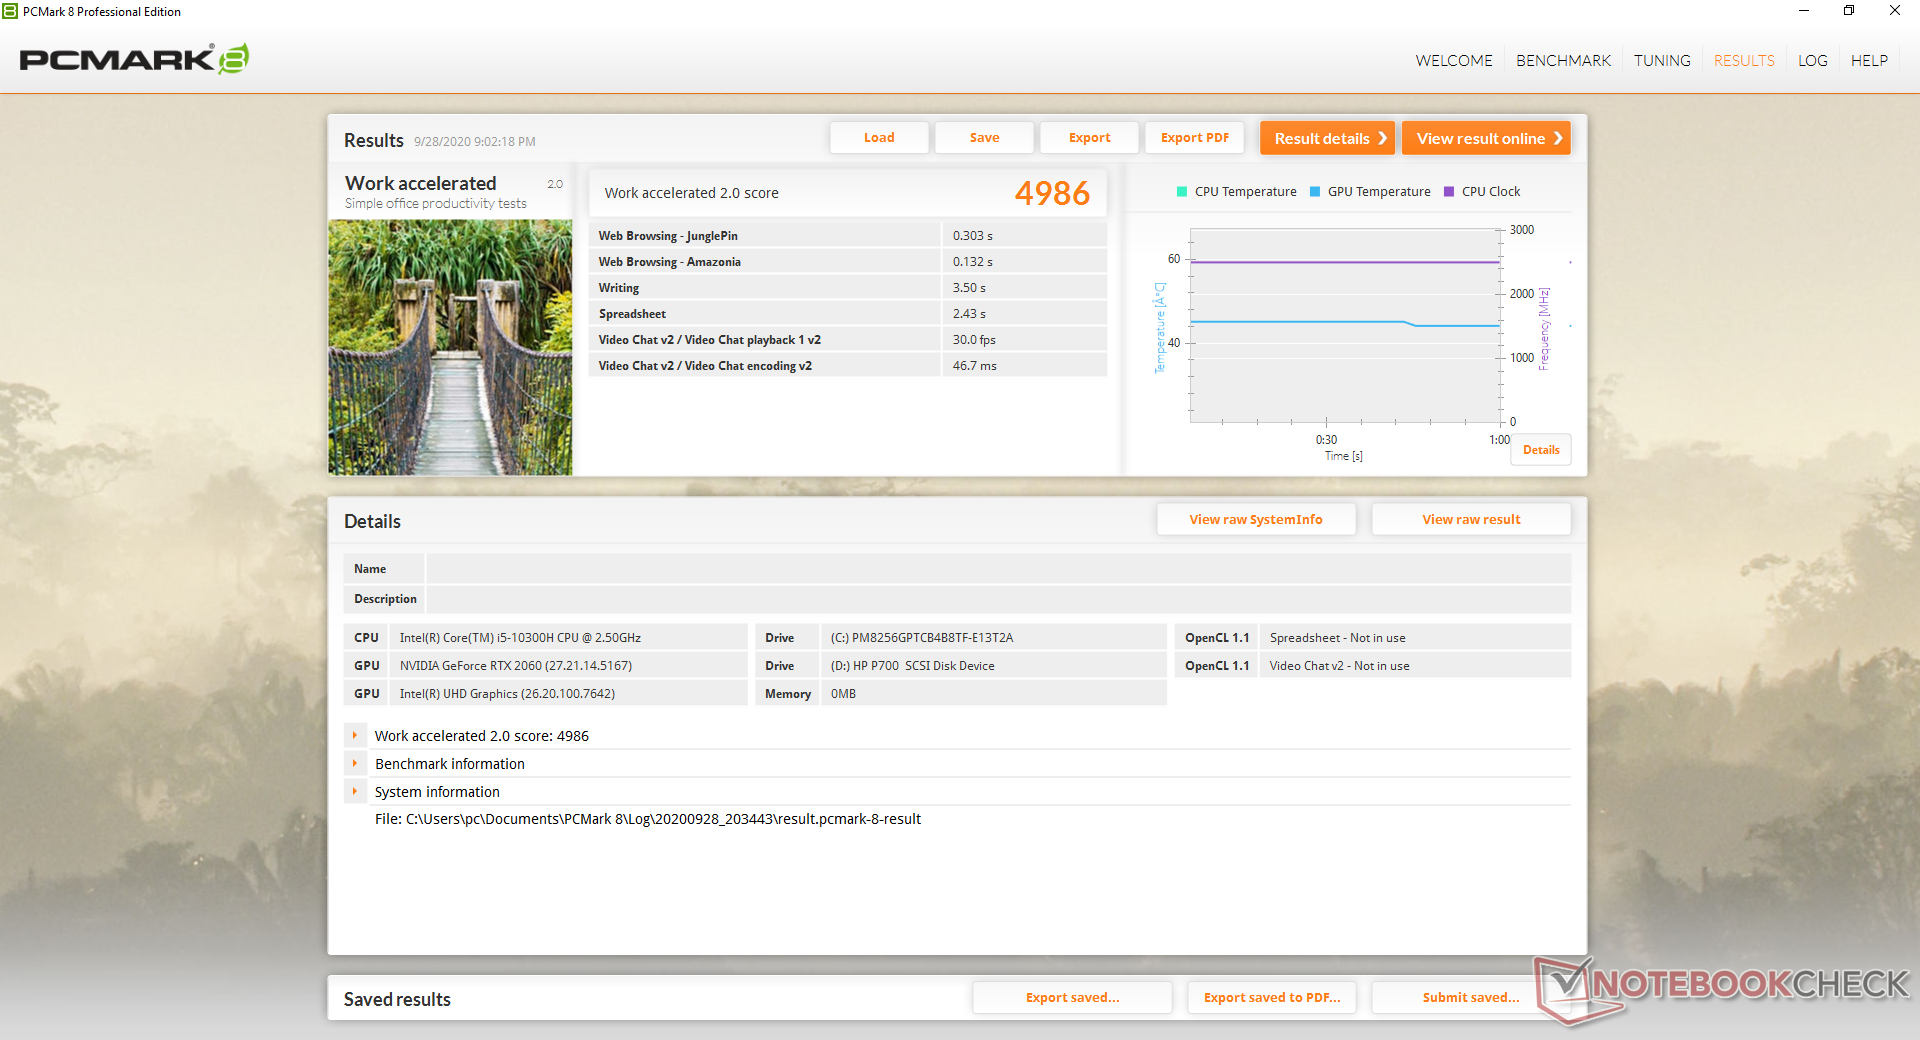
Los resultados de PCMark son inferiores a los de muchos portátiles para juegos Core i7 debido a la CPU Core i5, 8 GB de RAM de un solo canal y a la SSD NVMe de nivel básico. Aún así, las diferencias son en su mayoría pequeñas.
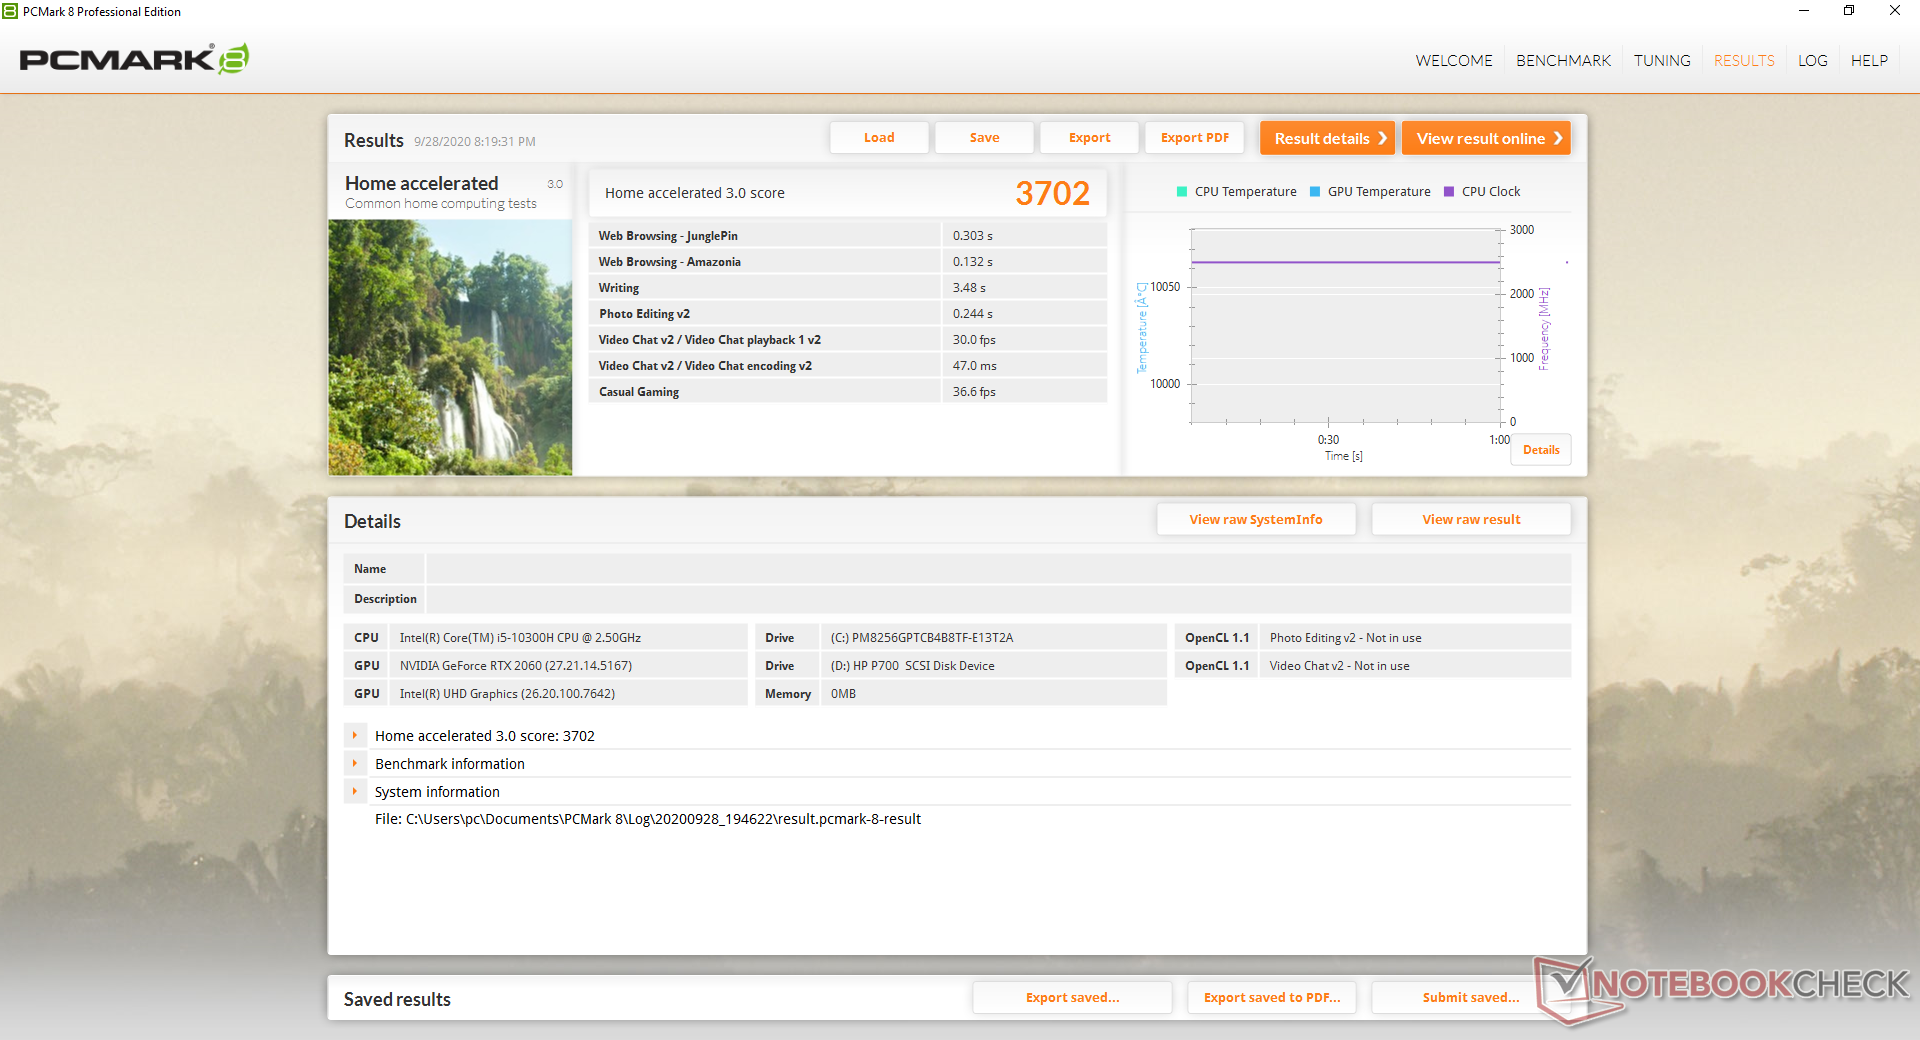
| PCMark 8 Home Score Accelerated v2 | 3702 puntos | |
| PCMark 8 Work Score Accelerated v2 | 4986 puntos | |
| PCMark 10 Score | 4987 puntos | |
ayuda | ||
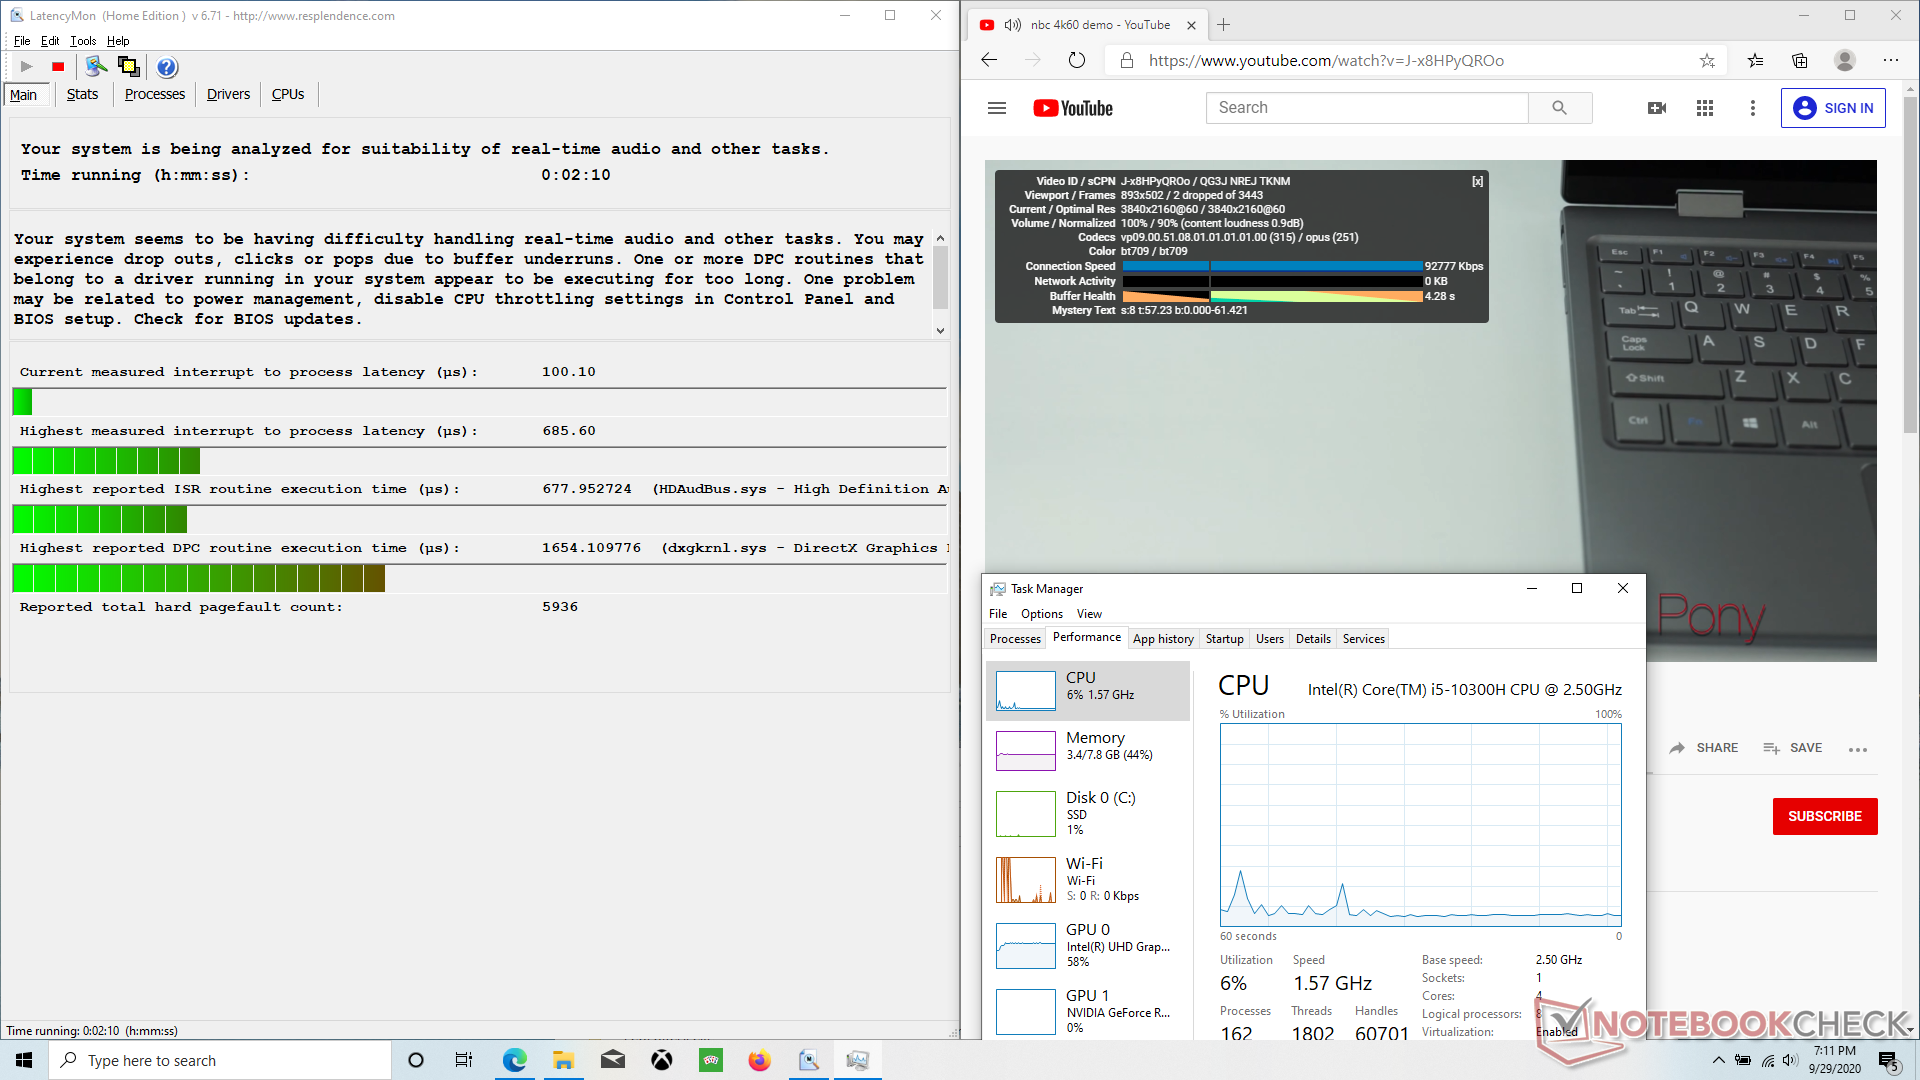
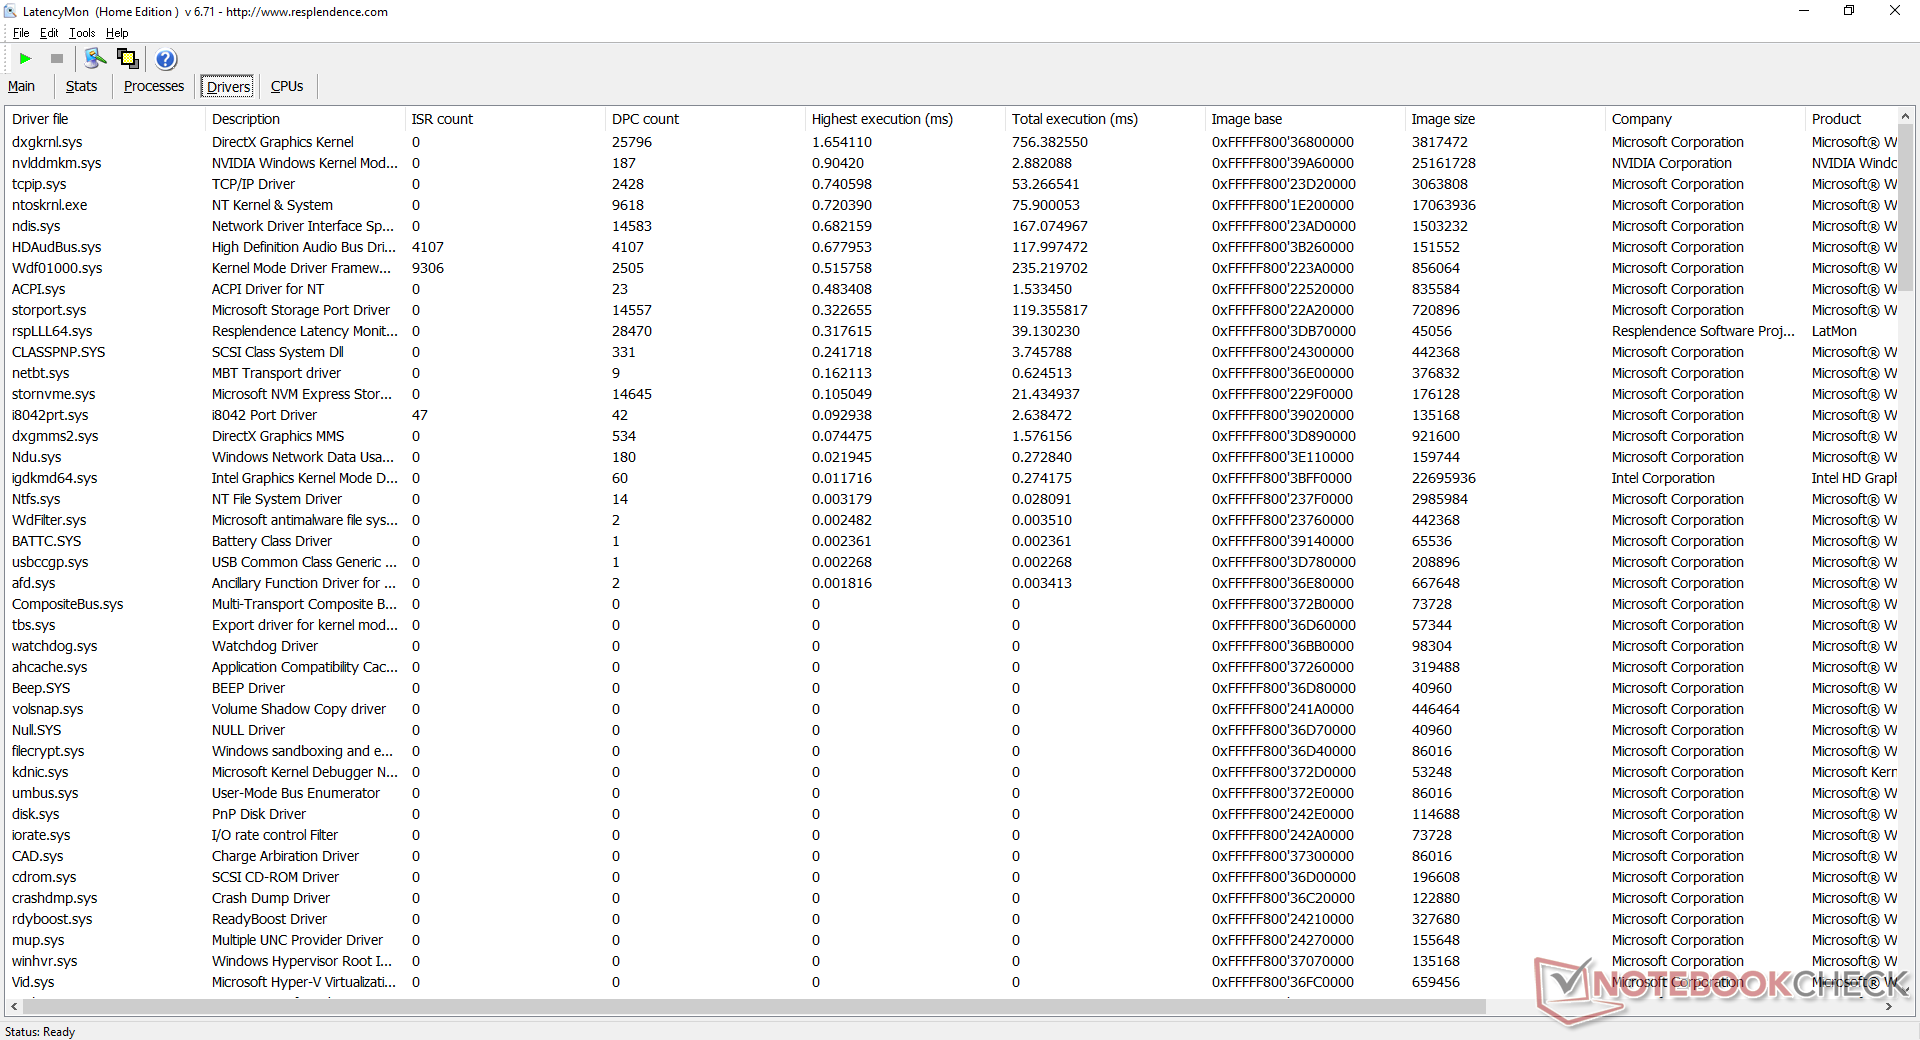
Latencia DPC
LatencyMon muestra los problemas de latencia del DPC al abrir varias pestañas en nuestra página principal. La reproducción de video 4K UHD a 60 FPS es de otra manera suave con sólo dos cuadros caídos durante nuestra prueba de un minuto en YouTube.
| DPC Latencies / LatencyMon - interrupt to process latency (max), Web, Youtube, Prime95 | |
| HP Omen 15-ek0456ng | |
| Schenker XMG Core 15 GK5NR0O | |
| Gateway Creator Series 15.6 GWTN156-3BK | |
| Aorus 5 KB | |
| Asus ROG Zephyrus G15 GA502IU-ES76 | |
* ... más pequeño es mejor
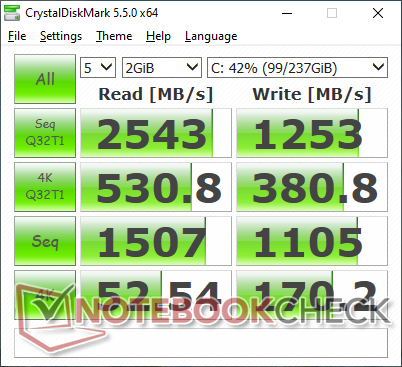
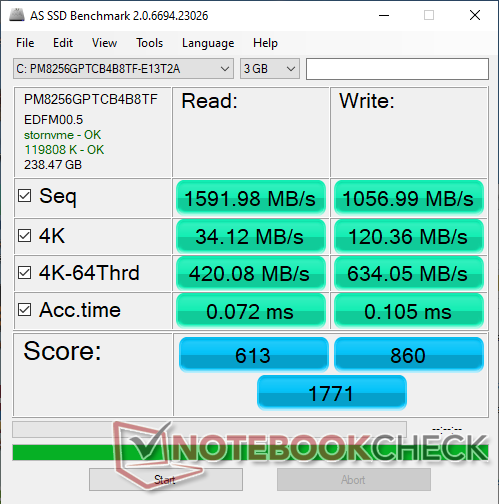
Dispositivos de almacenamiento
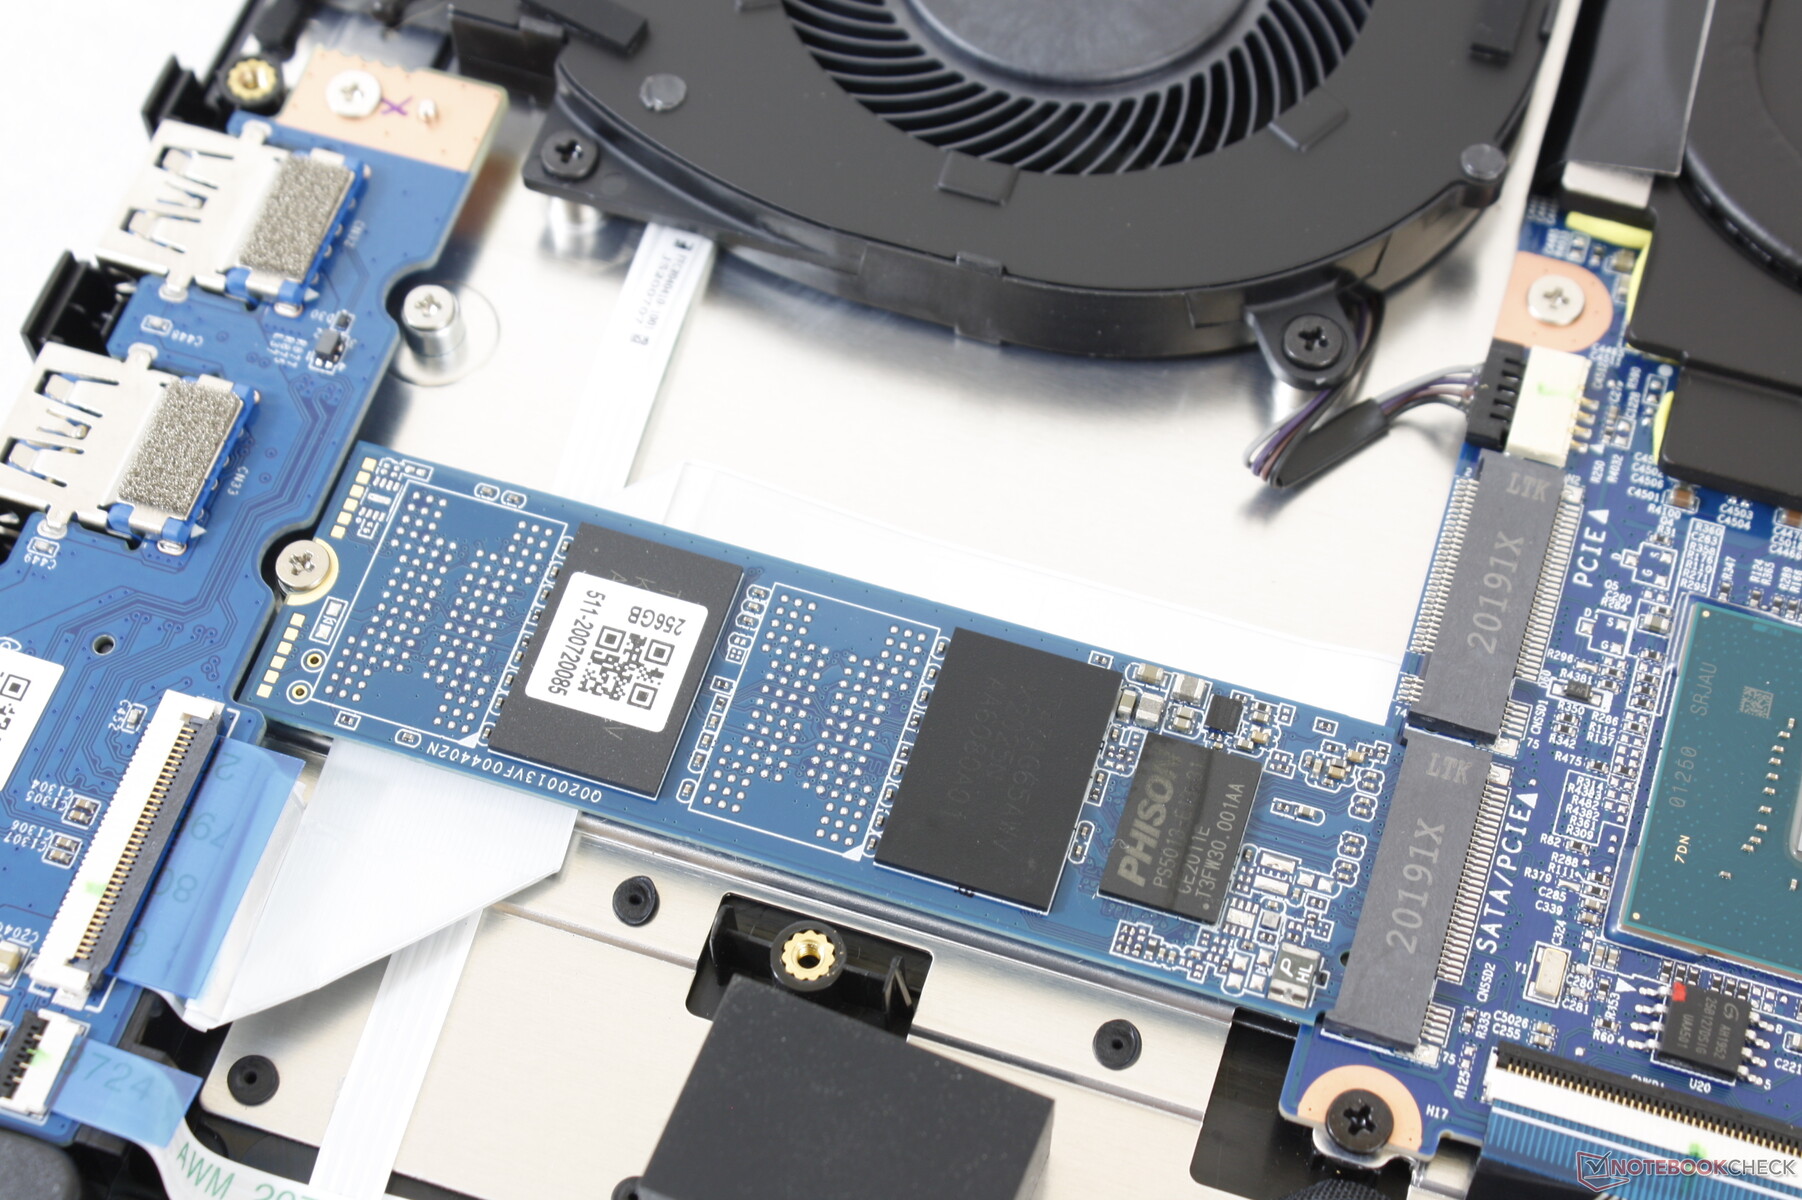
La capacidad de 256 GB es pequeña, especialmente para una computadora portátil destinada a los jugadores y creadores de contenidos. Además, el sistema utiliza un SSD NVMe más lento de Phison en lugar de las soluciones más caras de Samsung o Intel.
| Gateway Creator Series 15.6 GWTN156-3BK Phison PS5013 PM8256GPTCB4B8TF | Schenker XMG Core 15 GK5NR0O Samsung SSD 970 EVO Plus 500GB | Asus ROG Zephyrus G15 GA502IU-ES76 Intel SSD 660p 1TB SSDPEKNW010T8 | Razer Blade 15 GTX 1660 Ti Samsung SSD PM981 MZVLB256HAHQ | Dell G3 15 3500-G4DG2 SK Hynix BC511 HFM512GDJTNI | |
|---|---|---|---|---|---|
| AS SSD | 114% | 23% | 42% | 16% | |
| Seq Read (MB/s) | 1592 | 2836 78% | 1197 -25% | 1829 15% | 1305 -18% |
| Seq Write (MB/s) | 1057 | 2452 132% | 1637 55% | 1315 24% | 767 -27% |
| 4K Read (MB/s) | 34.12 | 60.4 77% | 56.3 65% | 51.3 50% | 41.84 23% |
| 4K Write (MB/s) | 120.4 | 190.5 58% | 159 32% | 106 -12% | 90.1 -25% |
| 4K-64 Read (MB/s) | 410.1 | 1283 213% | 583 42% | 917 124% | 773 88% |
| 4K-64 Write (MB/s) | 634 | 2298 262% | 838 32% | 1212 91% | 711 12% |
| Access Time Read * (ms) | 0.072 | 0.034 53% | 0.062 14% | 0.063 12% | 0.09 -25% |
| Access Time Write * (ms) | 0.105 | 0.02 81% | 0.128 -22% | 0.104 1% | 0.04 62% |
| Score Read (Points) | 613 | 1627 165% | 759 24% | 1152 88% | 945 54% |
| Score Write (Points) | 860 | 2734 218% | 1160 35% | 1450 69% | 878 2% |
| Score Total (Points) | 1771 | 5184 193% | 2350 33% | 3177 79% | 2290 29% |
| Copy ISO MB/s (MB/s) | 1255 | 2039 62% | 1376 10% | 1539 23% | |
| Copy Program MB/s (MB/s) | 508 | 438 -14% | 568 12% | 513 1% | |
| Copy Game MB/s (MB/s) | 986 | 1137 15% | 1180 20% | 1150 17% | |
| CrystalDiskMark 5.2 / 6 | 70% | 17% | 8% | -18% | |
| Write 4K (MB/s) | 170.2 | 233 37% | 189.6 11% | 135 -21% | 99.6 -41% |
| Read 4K (MB/s) | 52.5 | 54.5 4% | 61.7 18% | 41.1 -22% | 38.8 -26% |
| Write Seq (MB/s) | 1105 | 3050 176% | 1730 57% | 1427 29% | 1117 1% |
| Read Seq (MB/s) | 1507 | 3042 102% | 1620 7% | 1494 -1% | 1030 -32% |
| Write 4K Q32T1 (MB/s) | 380.8 | 520 37% | 474.2 25% | 494.9 30% | 445.2 17% |
| Read 4K Q32T1 (MB/s) | 531 | 546 3% | 528 -1% | 578 9% | 331.8 -38% |
| Write Seq Q32T1 (MB/s) | 1253 | 3241 159% | 1795 43% | 1417 13% | 1102 -12% |
| Read Seq Q32T1 (MB/s) | 2543 | 3538 39% | 1880 -26% | 3251 28% | 2227 -12% |
| Media total (Programa/Opciones) | 92% /
98% | 20% /
21% | 25% /
29% | -1% /
2% |
* ... más pequeño es mejor

Estrangulamiento del disco: DiskSpd Read Loop, Queue Depth 8
Rendimiento de la GPU
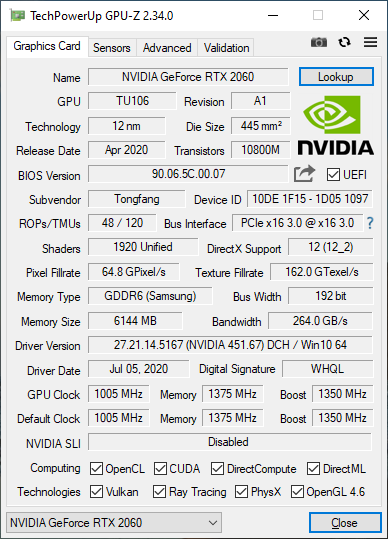
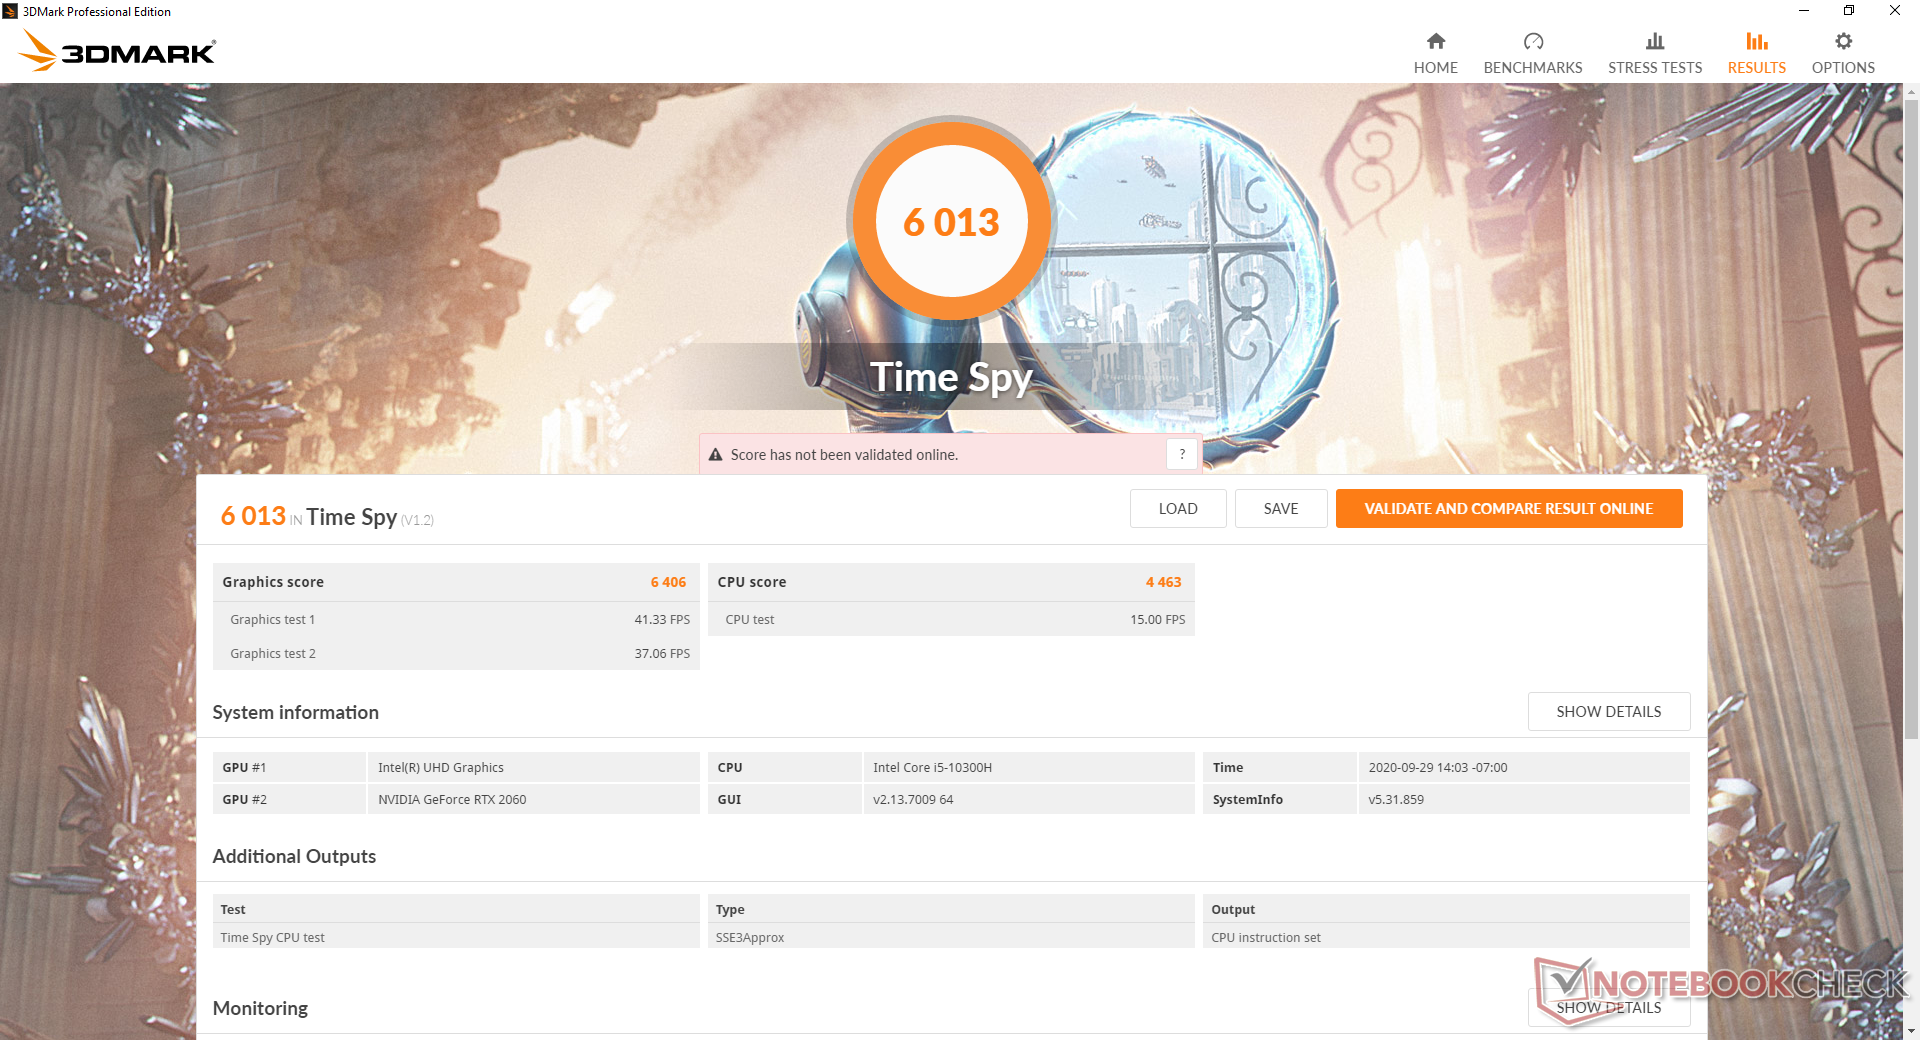
La GeForce RTX 2060 móvil sigue siendo una GPU increíble aunque sea de un 15 a un 25 por ciento más lenta que la RTX 2060 de sobremesa. Los déficits de rendimiento de los 8 GB de RAM del sistema y la CPU Core i5 son de menores a moderados cuando se ejecutan la mayoría de los juegos vinculados a la GPU.
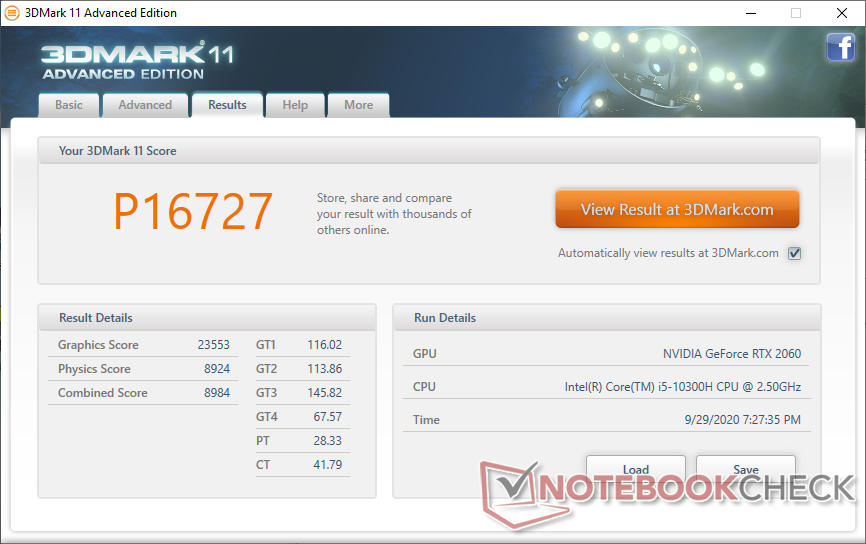
| 3DMark 11 Performance | 16727 puntos | |
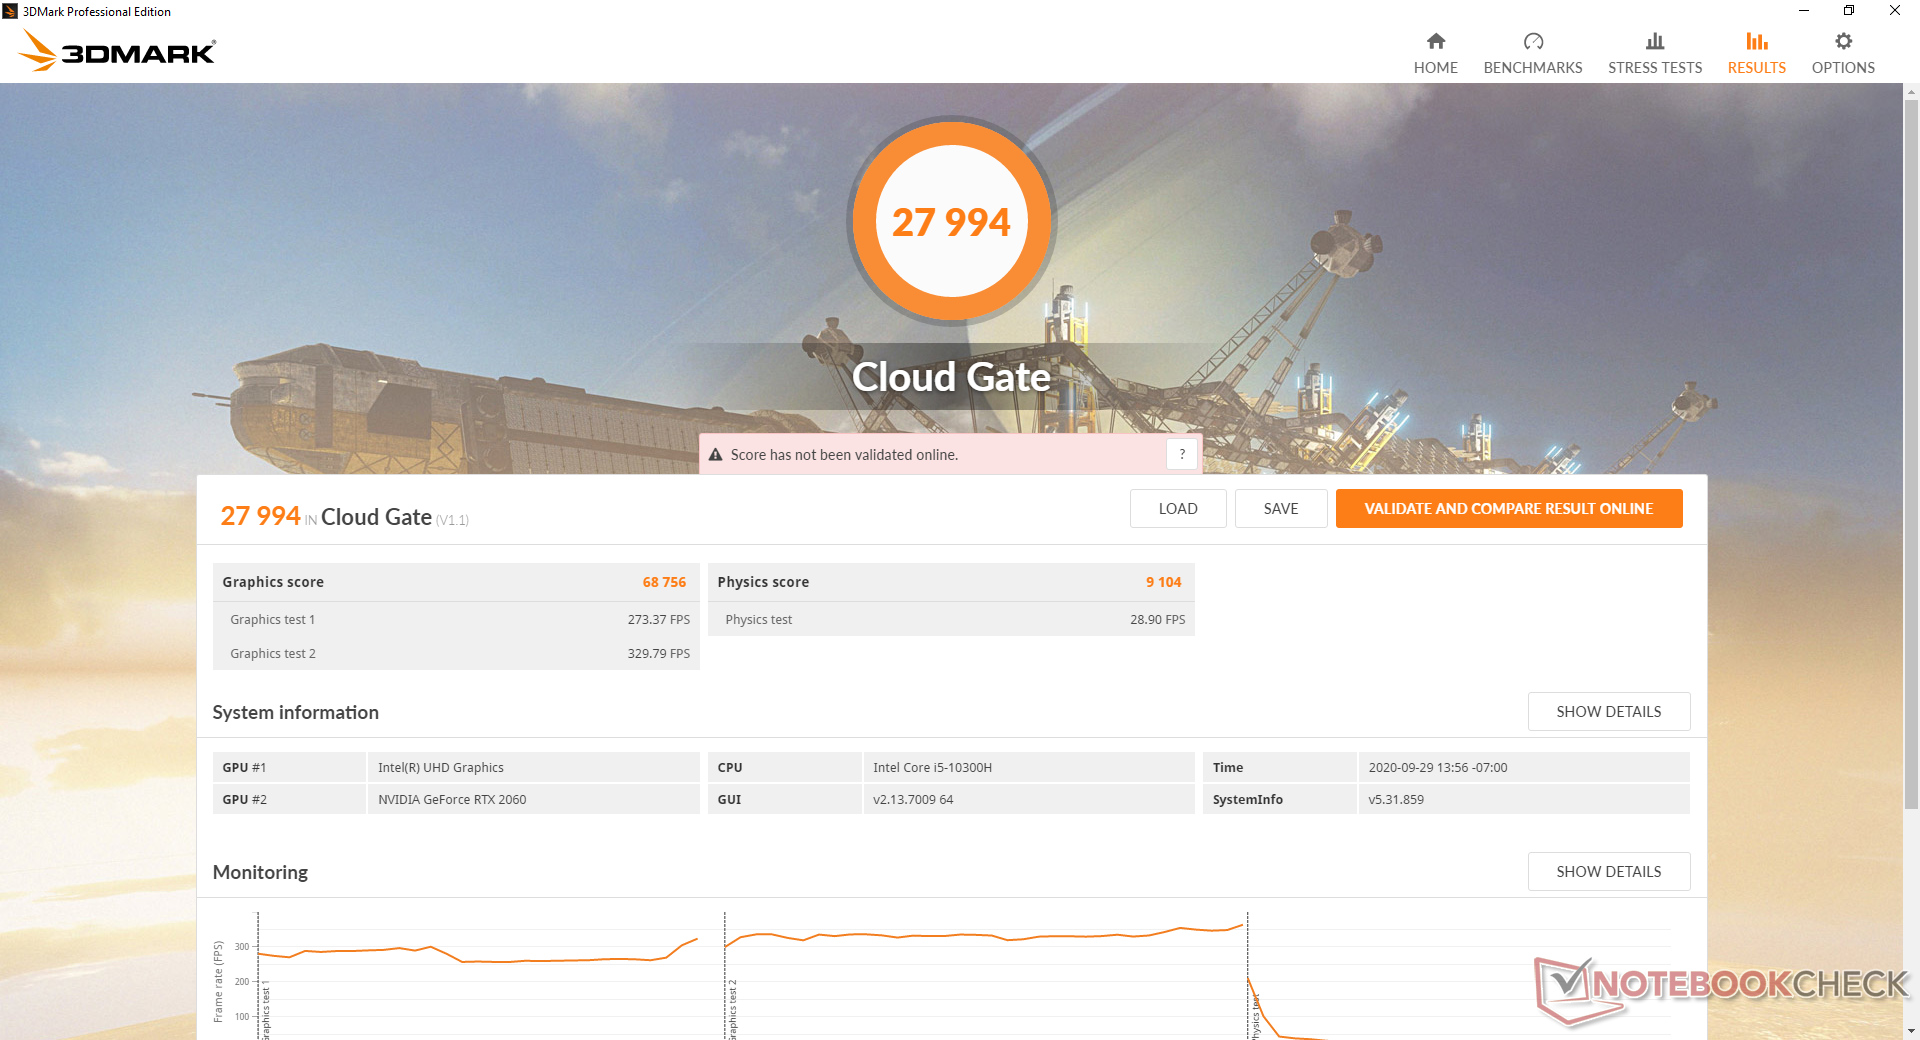
| 3DMark Cloud Gate Standard Score | 27994 puntos | |
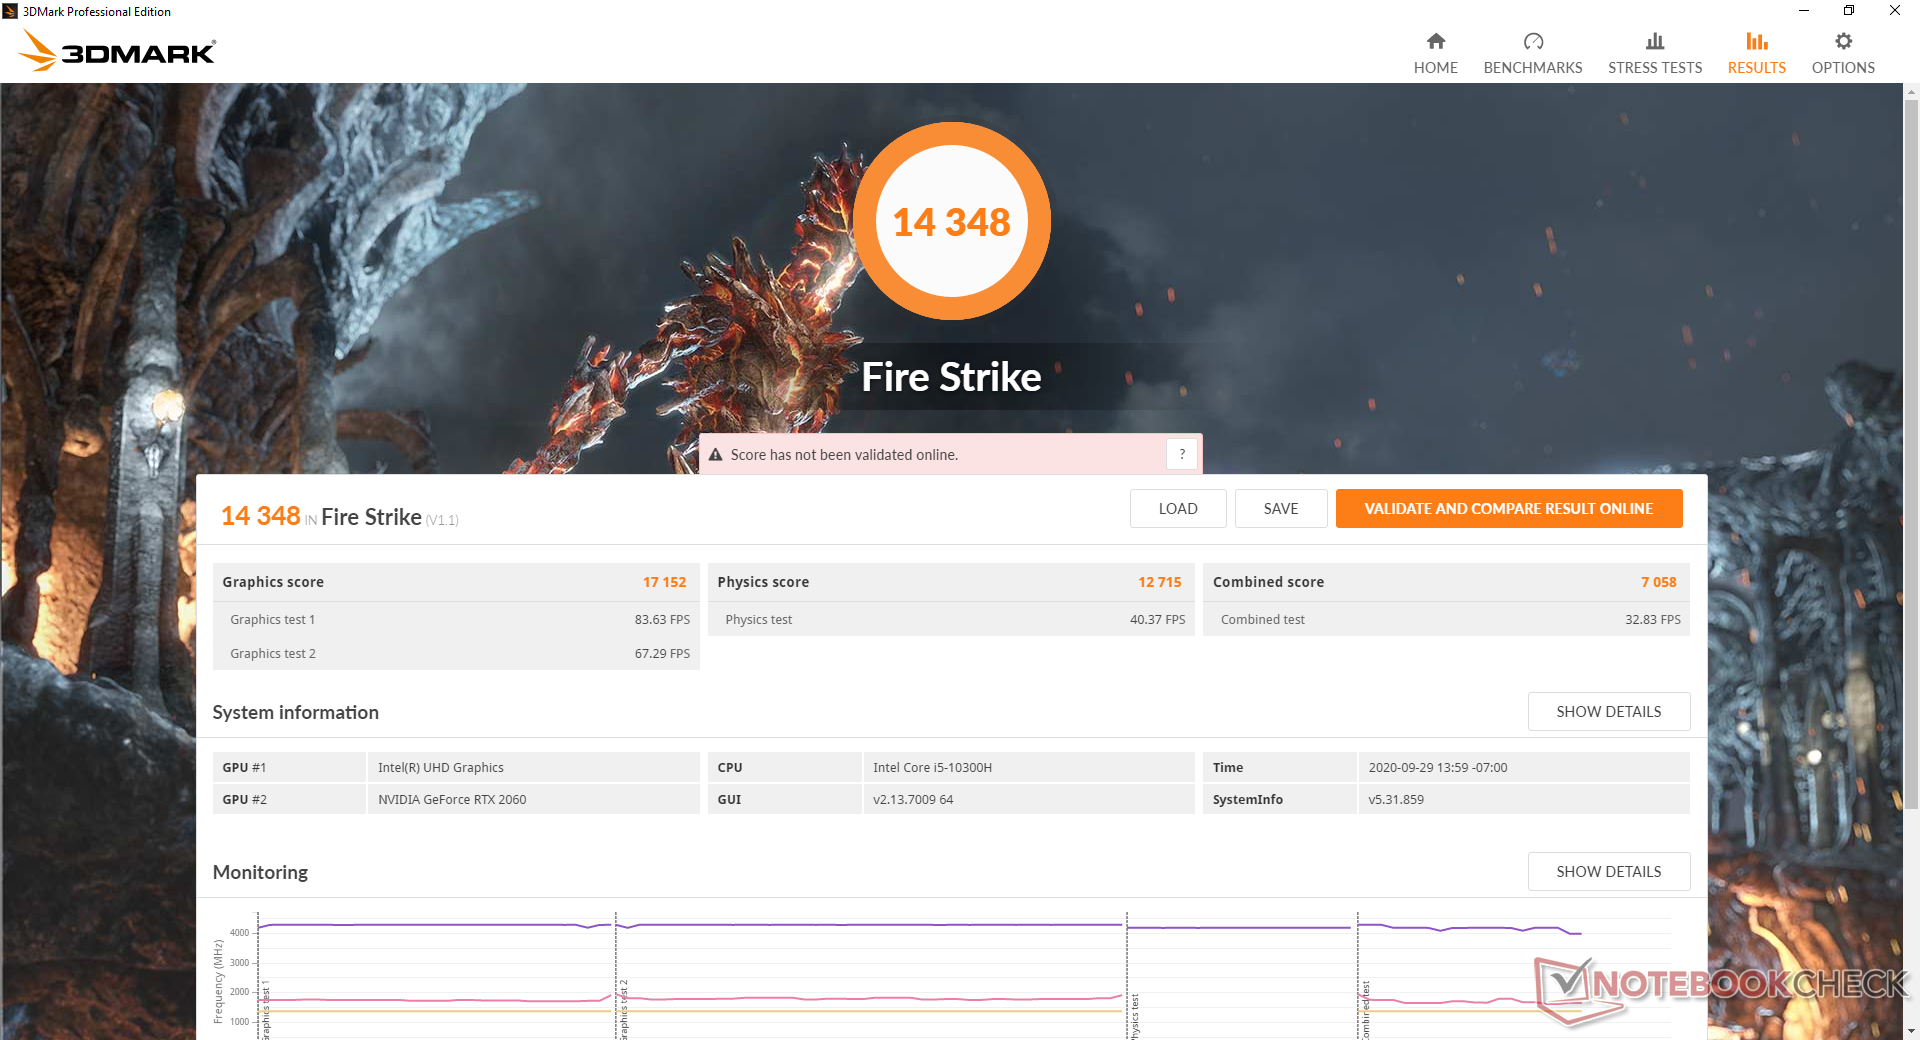
| 3DMark Fire Strike Score | 14348 puntos | |
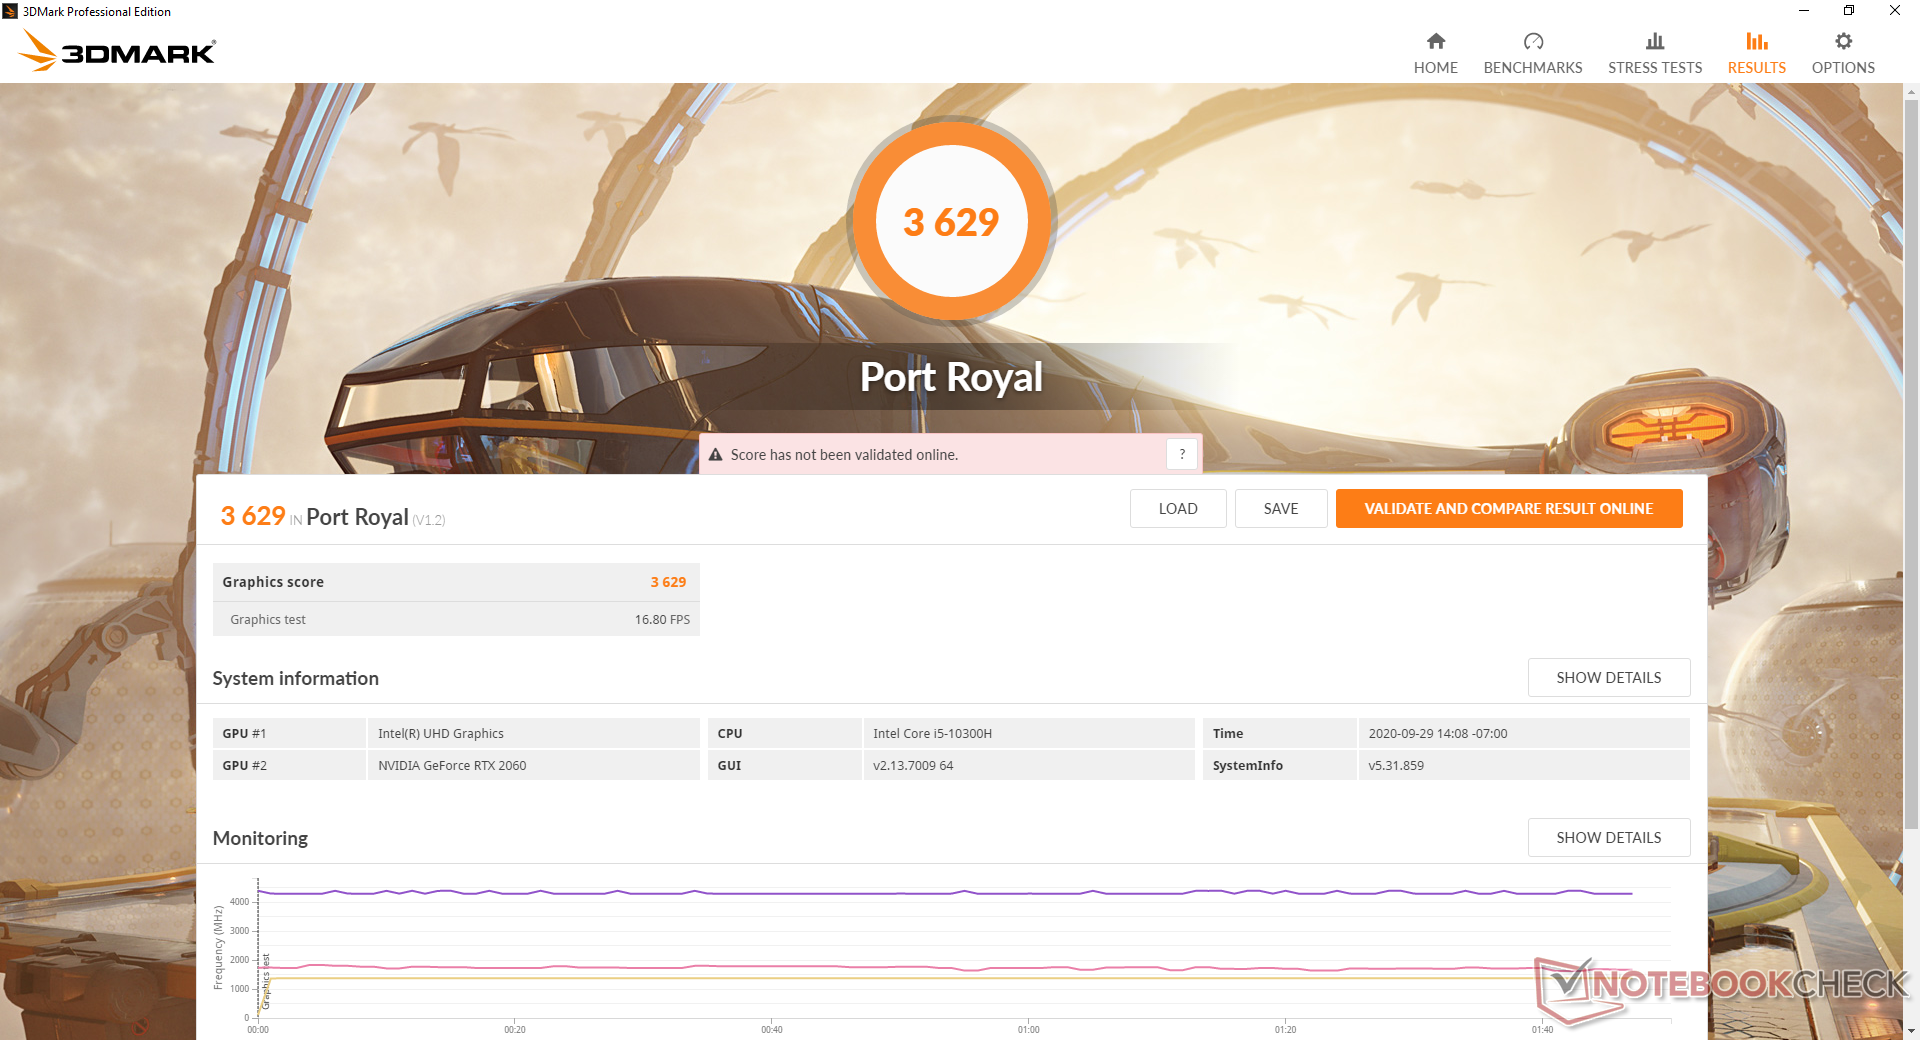
| 3DMark Time Spy Score | 6013 puntos | |
ayuda | ||
| bajo | medio | alto | ultra | |
|---|---|---|---|---|
| GTA V (2015) | 153 | 133 | 94.5 | 60 |
| The Witcher 3 (2015) | 194 | 159.1 | 111 | 63.2 |
| Dota 2 Reborn (2015) | 117 | 107 | 93.3 | 88.3 |
| Final Fantasy XV Benchmark (2018) | 98.4 | 74 | 60 | |
| X-Plane 11.11 (2018) | 75.8 | 63.5 | 56 | |
| Strange Brigade (2018) | 236 | 149 | 122 | 104 |
Emisiones
Ruido de sistema
El ruido del ventilador está íntimamente ligado al Centro de Control preinstalado del Gateway. Hay tres modos disponibles: Modo Oficina, Modo Juego y Modo Turbo. Los ventiladores son silenciosos en el Modo Oficina hasta 32 dB(A) sobre un fondo de 26,5 dB(A) cuando navegan por la web o transmiten vídeo. Sin embargo, en el modo de juego o en el modo turbo, los fans se vuelven muy ruidosos muy rápidamente a más de 55 dB(A) cuando juegan. Casi no hay diferencia entre el modo de juego y el modo turbo, por lo que es mejor utilizar la consola en el modo turbo cuando se juega.
| Gateway Creator Series 15.6 GWTN156-3BK GeForce RTX 2060 Mobile, i5-10300H, Phison PS5013 PM8256GPTCB4B8TF | Schenker XMG Core 15 GK5NR0O GeForce RTX 2060 Mobile, R7 4800H, Samsung SSD 970 EVO Plus 500GB | Aorus 5 KB GeForce RTX 2060 Mobile, i7-10750H, ADATA XPG SX8200 Pro (ASX8200PNP-512GT) | Asus ROG Zephyrus G15 GA502IU-ES76 GeForce GTX 1660 Ti Max-Q, R7 4800HS, Intel SSD 660p 1TB SSDPEKNW010T8 | HP Omen 15-ek0456ng GeForce GTX 1660 Ti Mobile, i5-10300H, Toshiba XG6 KXG60ZNV512G | Razer Blade 15 GTX 1660 Ti GeForce GTX 1660 Ti Mobile, i7-9750H, Samsung SSD PM981 MZVLB256HAHQ | |
|---|---|---|---|---|---|---|
| Noise | 6% | 0% | 6% | 2% | 2% | |
| apagado / medio ambiente * (dB) | 26.5 | 25 6% | 25 6% | 26.3 1% | 27 -2% | 28.5 -8% |
| Idle Minimum * (dB) | 26.5 | 26 2% | 26 2% | 26.7 -1% | 32.4 -22% | 30.3 -14% |
| Idle Average * (dB) | 26.5 | 30 -13% | 30 -13% | 26.7 -1% | 32.4 -22% | 30.5 -15% |
| Idle Maximum * (dB) | 32.4 | 32 1% | 34 -5% | 31.9 2% | 32.4 -0% | 30.5 6% |
| Load Average * (dB) | 55.4 | 46 17% | 53 4% | 38.9 30% | 32.5 41% | 41 26% |
| Witcher 3 ultra * (dB) | 55.3 | 48 13% | 51 8% | 51 8% | 47.2 15% | 48 13% |
| Load Maximum * (dB) | 55.3 | 48 13% | 56 -1% | 54.9 1% | 51.9 6% | 51.9 6% |
* ... más pequeño es mejor
Ruido
| Ocioso |
| 26.5 / 26.5 / 32.4 dB(A) |
| Carga |
| 55.4 / 55.3 dB(A) |
 | ||
30 dB silencioso 40 dB(A) audible 50 dB(A) ruidosamente alto |
||
min: | ||
Temperatura
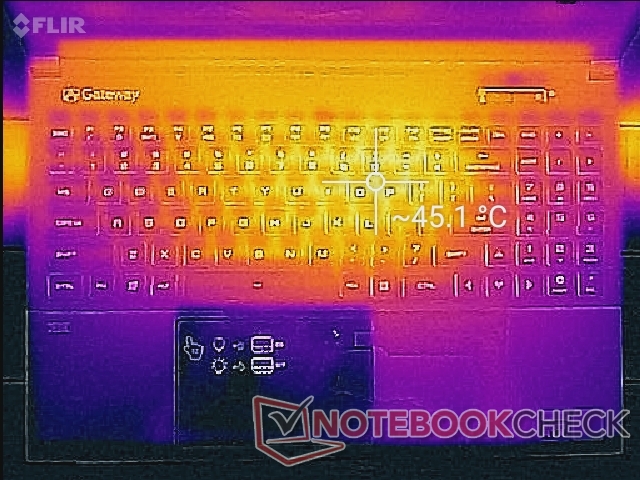
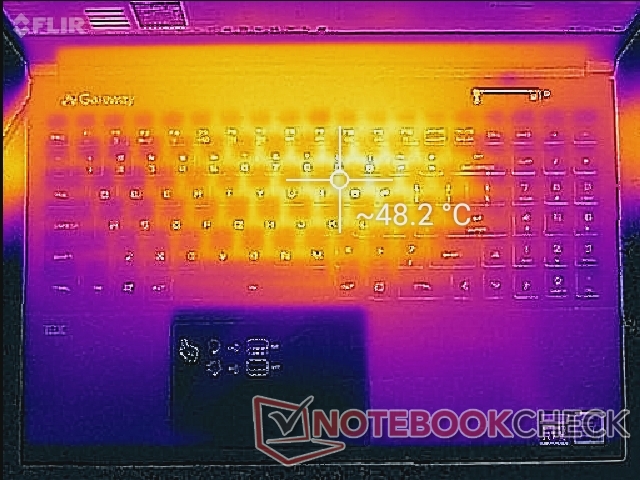
El desarrollo de la temperatura de la superficie es en gran medida simétrico, con puntos calientes que alcanzan más de 48 C cerca del centro del teclado cuando se juega. Los resultados son ligeramente más fríos que los que observamos en el Asus Zephyrus GA502.
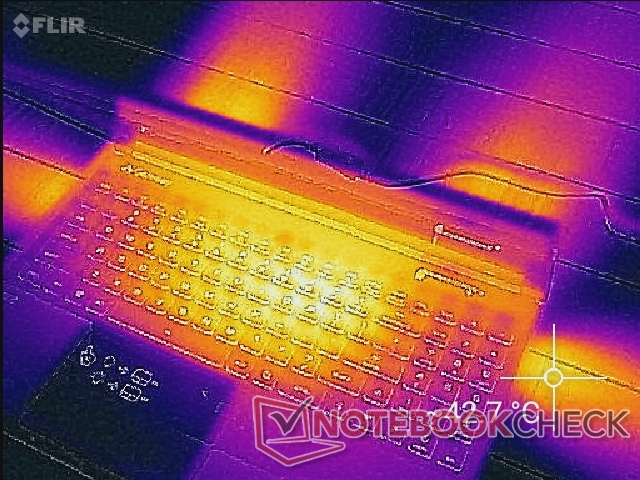
(-) La temperatura máxima en la parte superior es de 48.2 °C / 119 F, frente a la media de 40.4 °C / 105 F, que oscila entre 21.2 y 68.8 °C para la clase Gaming.
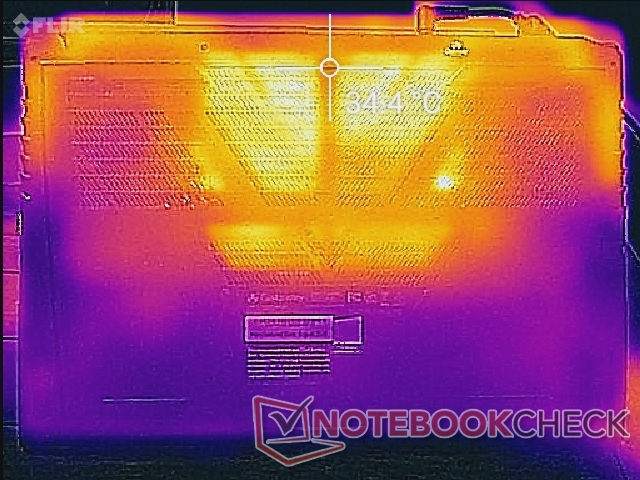
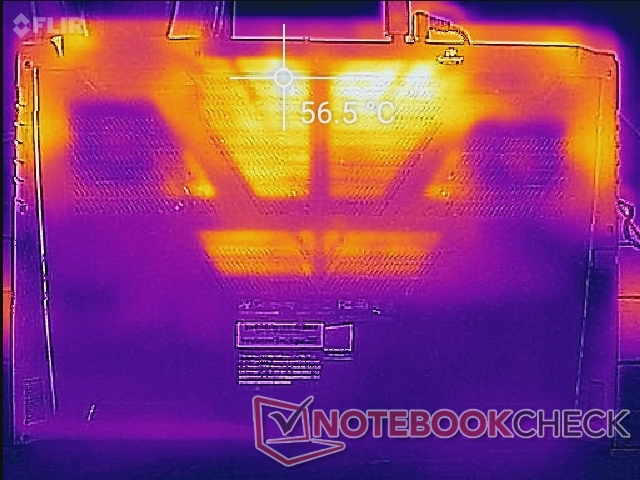
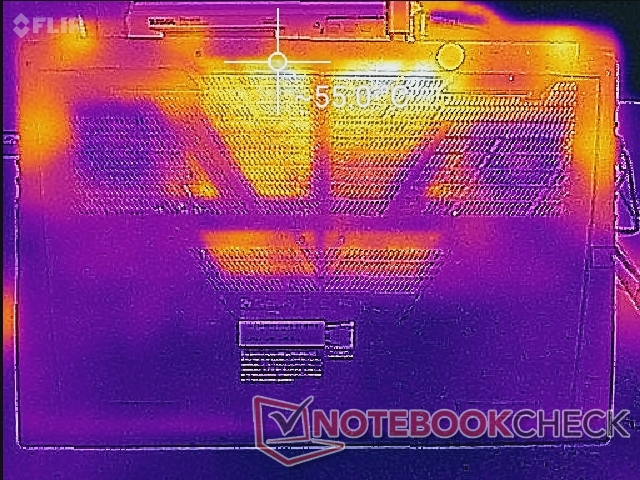
(-) El fondo se calienta hasta un máximo de 59.8 °C / 140 F, frente a la media de 43.2 °C / 110 F
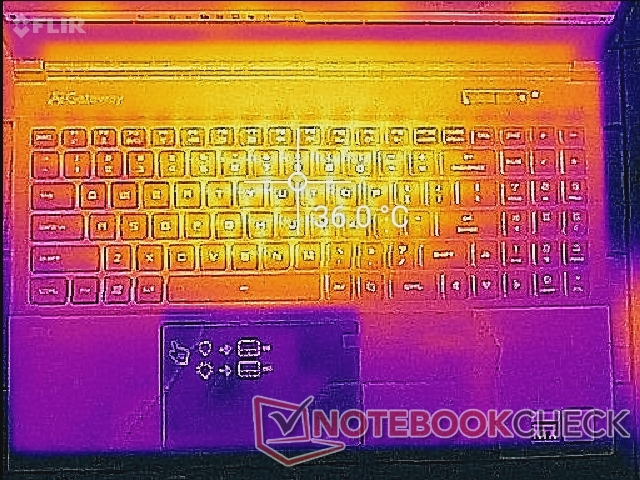
(±) En reposo, la temperatura media de la parte superior es de 33.1 °C / 92# F, frente a la media del dispositivo de 33.9 °C / 93 F.
(±) Jugando a The Witcher 3, la temperatura media de la parte superior es de 33.5 °C / 92 F, frente a la media del dispositivo de 33.9 °C / 93 F.
(+) El reposamanos y el panel táctil están a una temperatura inferior a la de la piel, con un máximo de 31.2 °C / 88.2 F y, por tanto, son fríos al tacto.
(-) La temperatura media de la zona del reposamanos de dispositivos similares fue de 28.8 °C / 83.8 F (-2.4 °C / -4.4 F).
Prueba de estrés
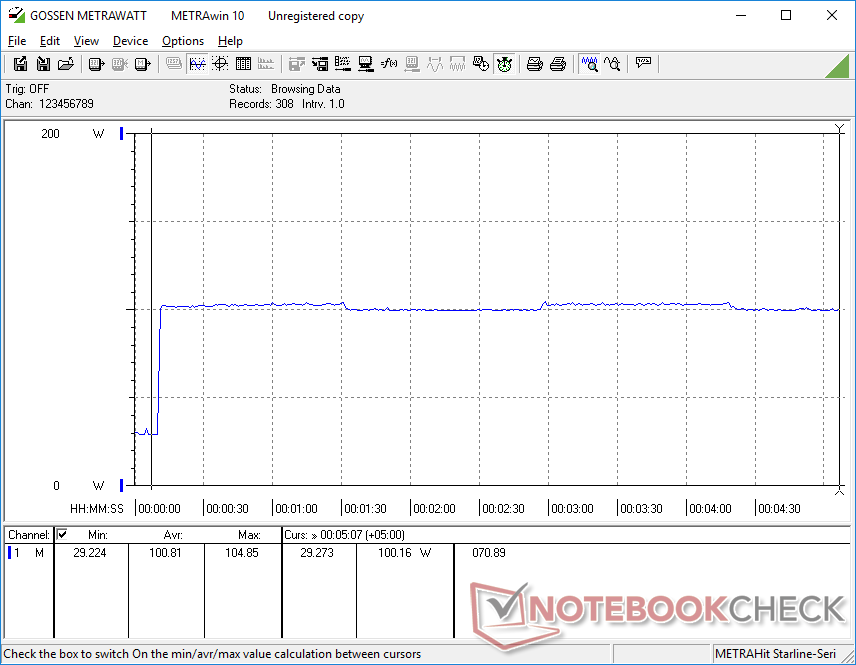
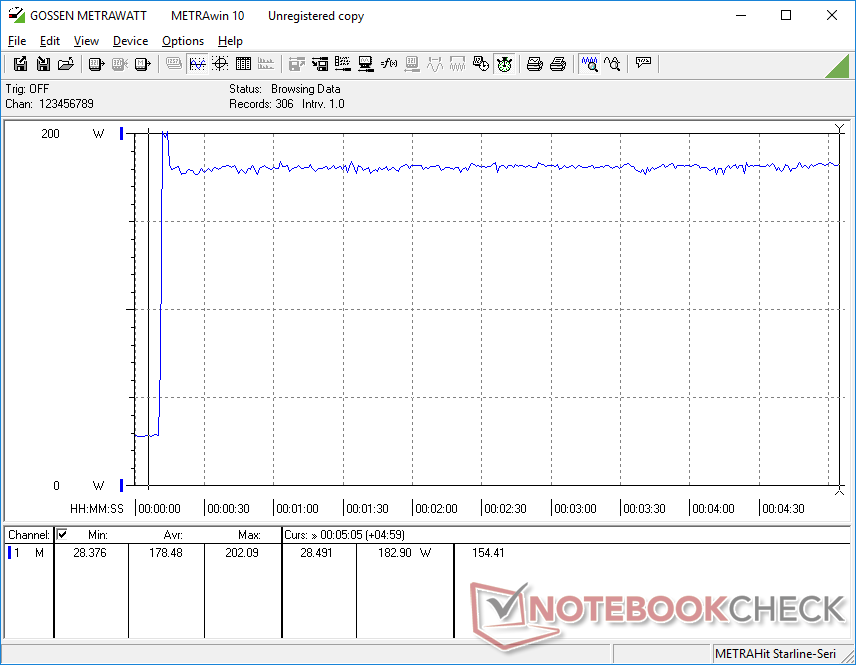
El funcionamiento de Prime95 hace que el CPU se estabilice a 4,2 GHz y 77 C sin que se produzcan caídas en la velocidad con el tiempo para una excelente sostenibilidad del Turbo Boost. Al ejecutar Witcher 3, las tasas de la CPU y la GPU se estabilizarían en 74 C y 70 C, respectivamente, en comparación con los 76 C y 73 C del Asus Zephyrus G15 GA502IU alimentado por AMD.
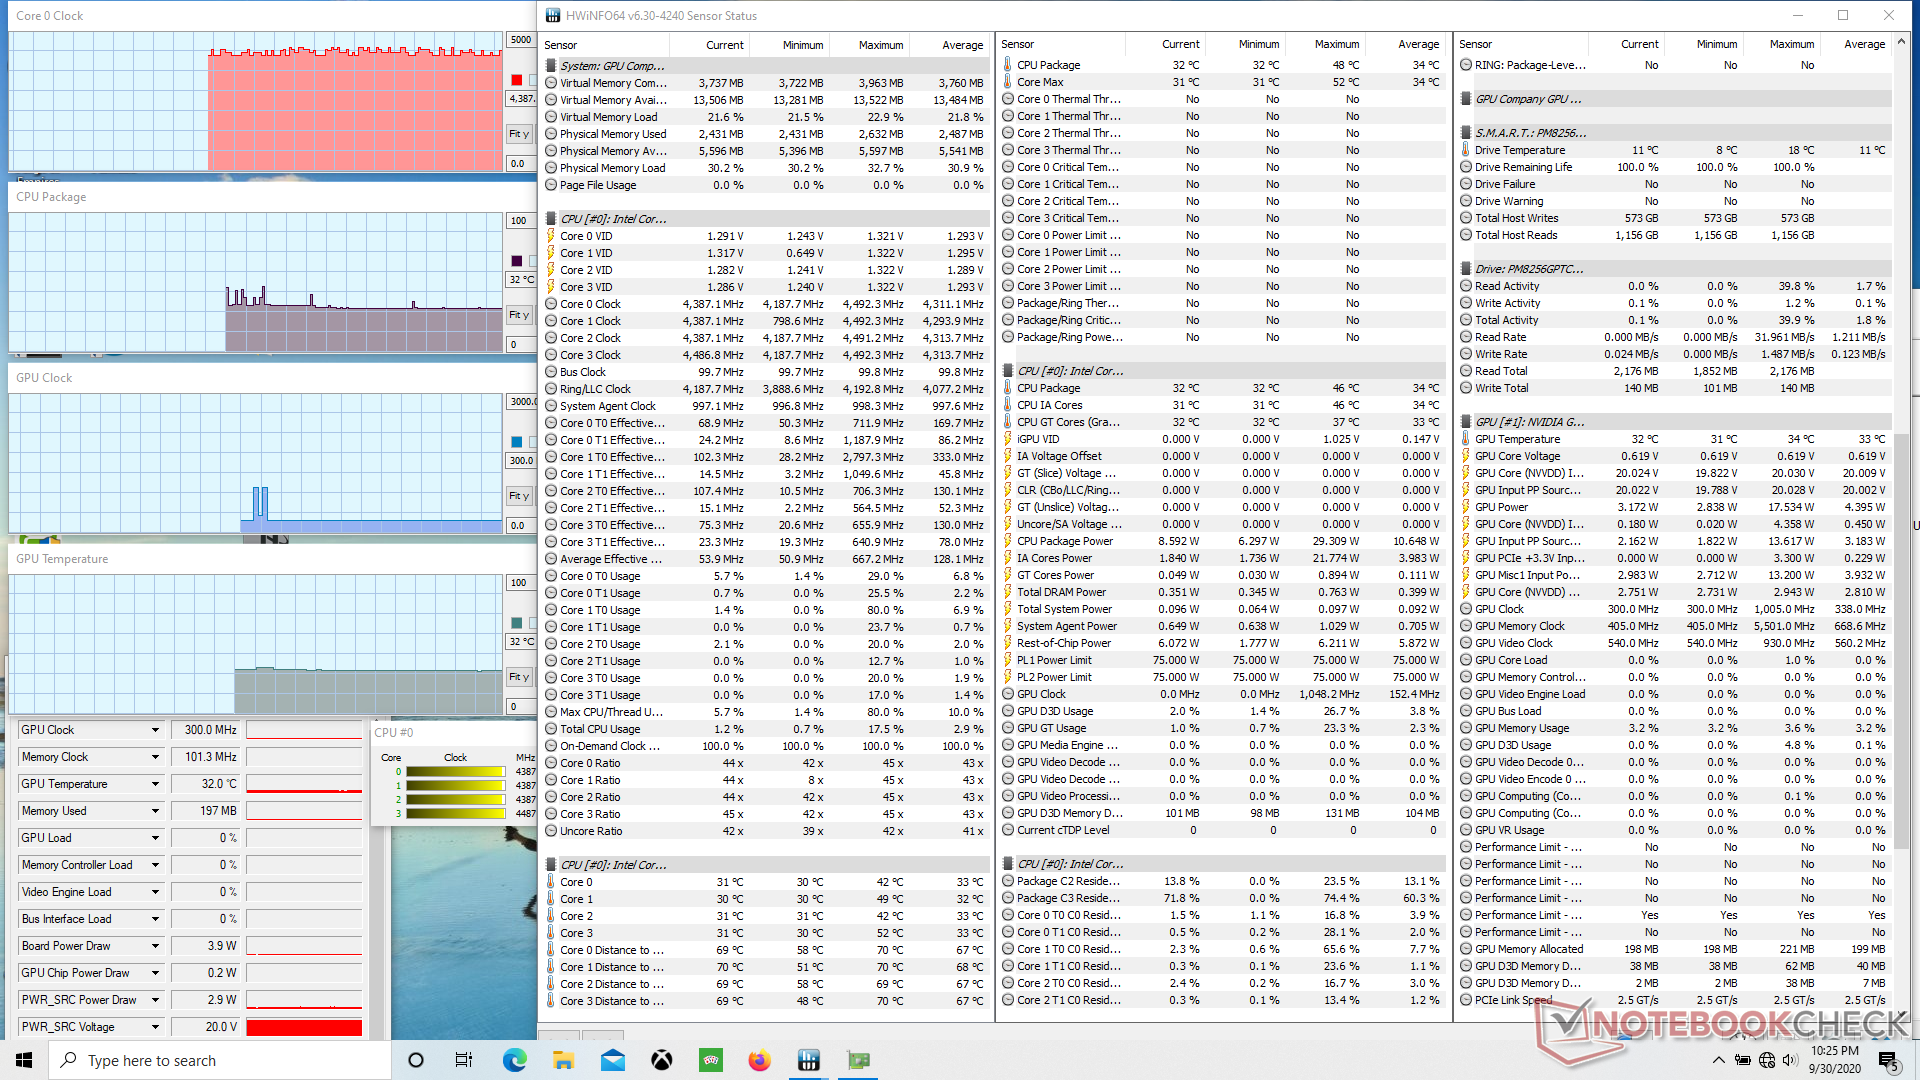
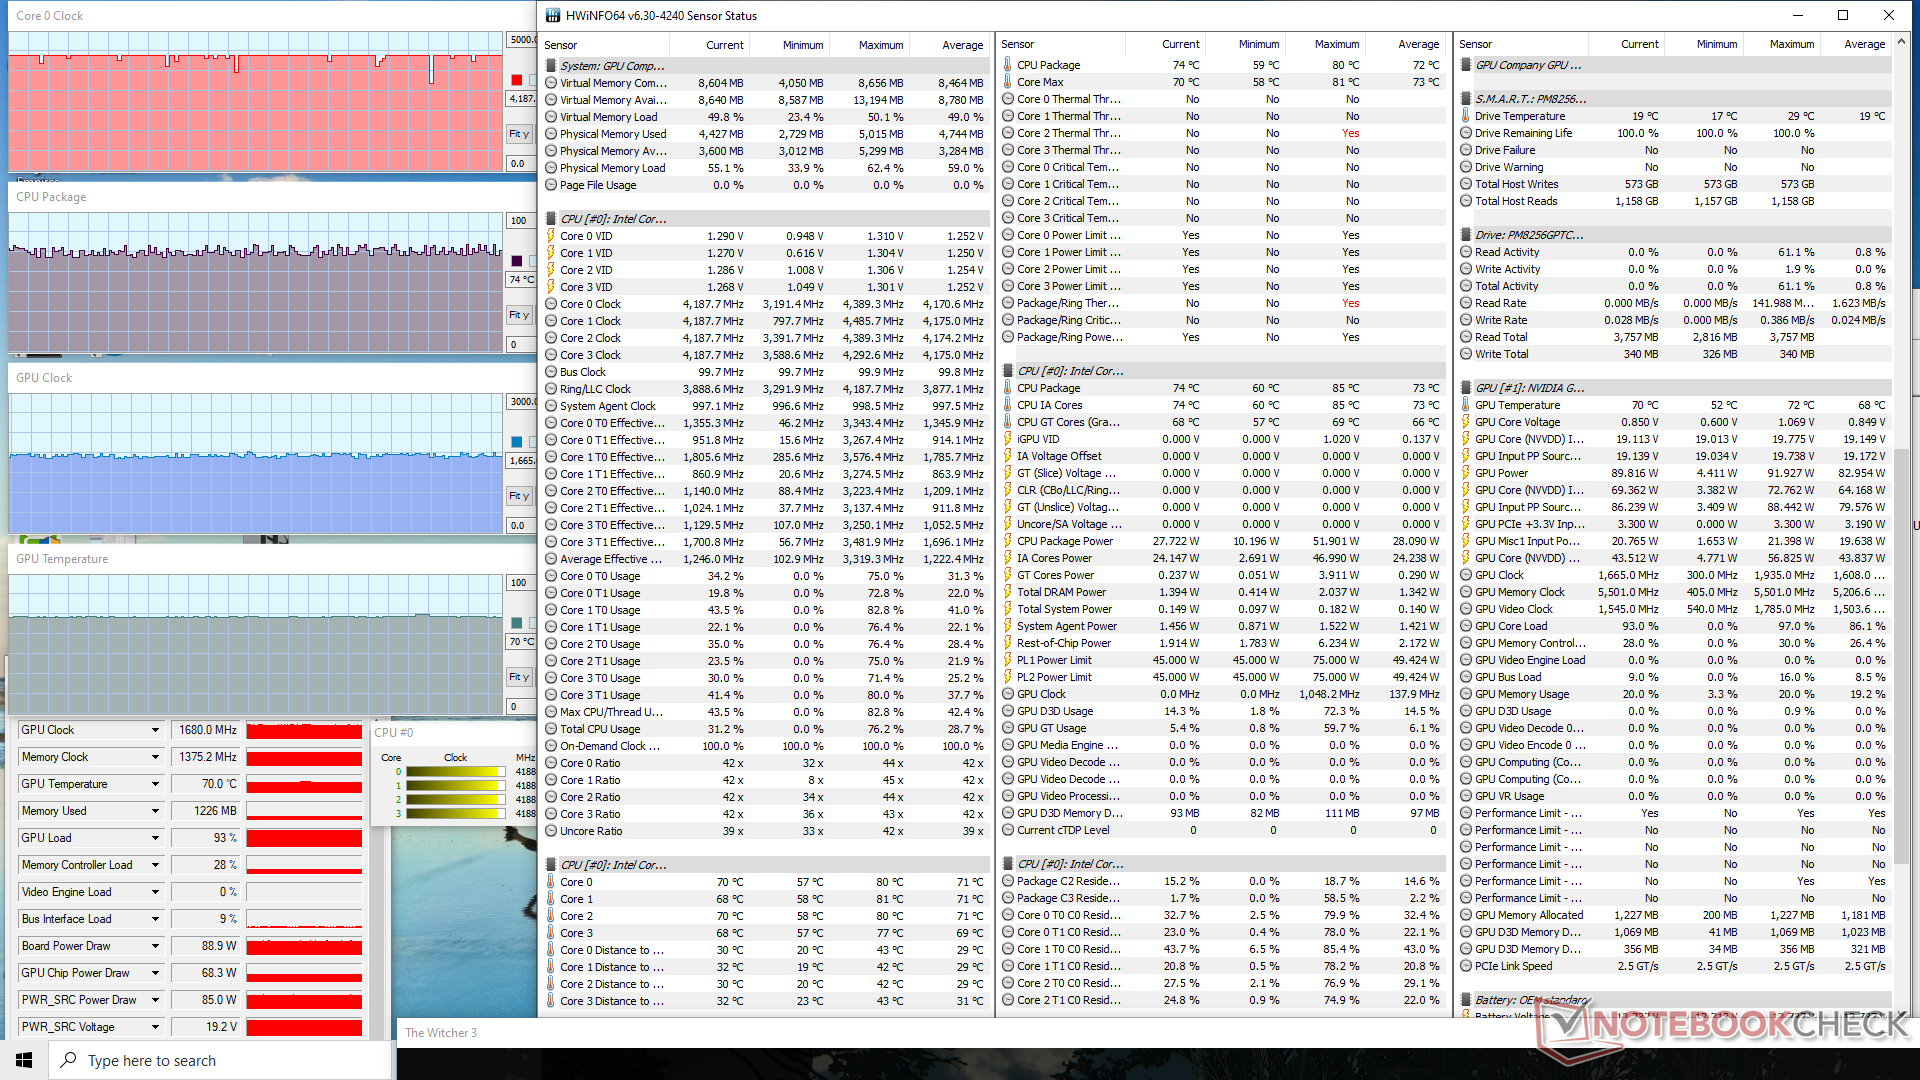
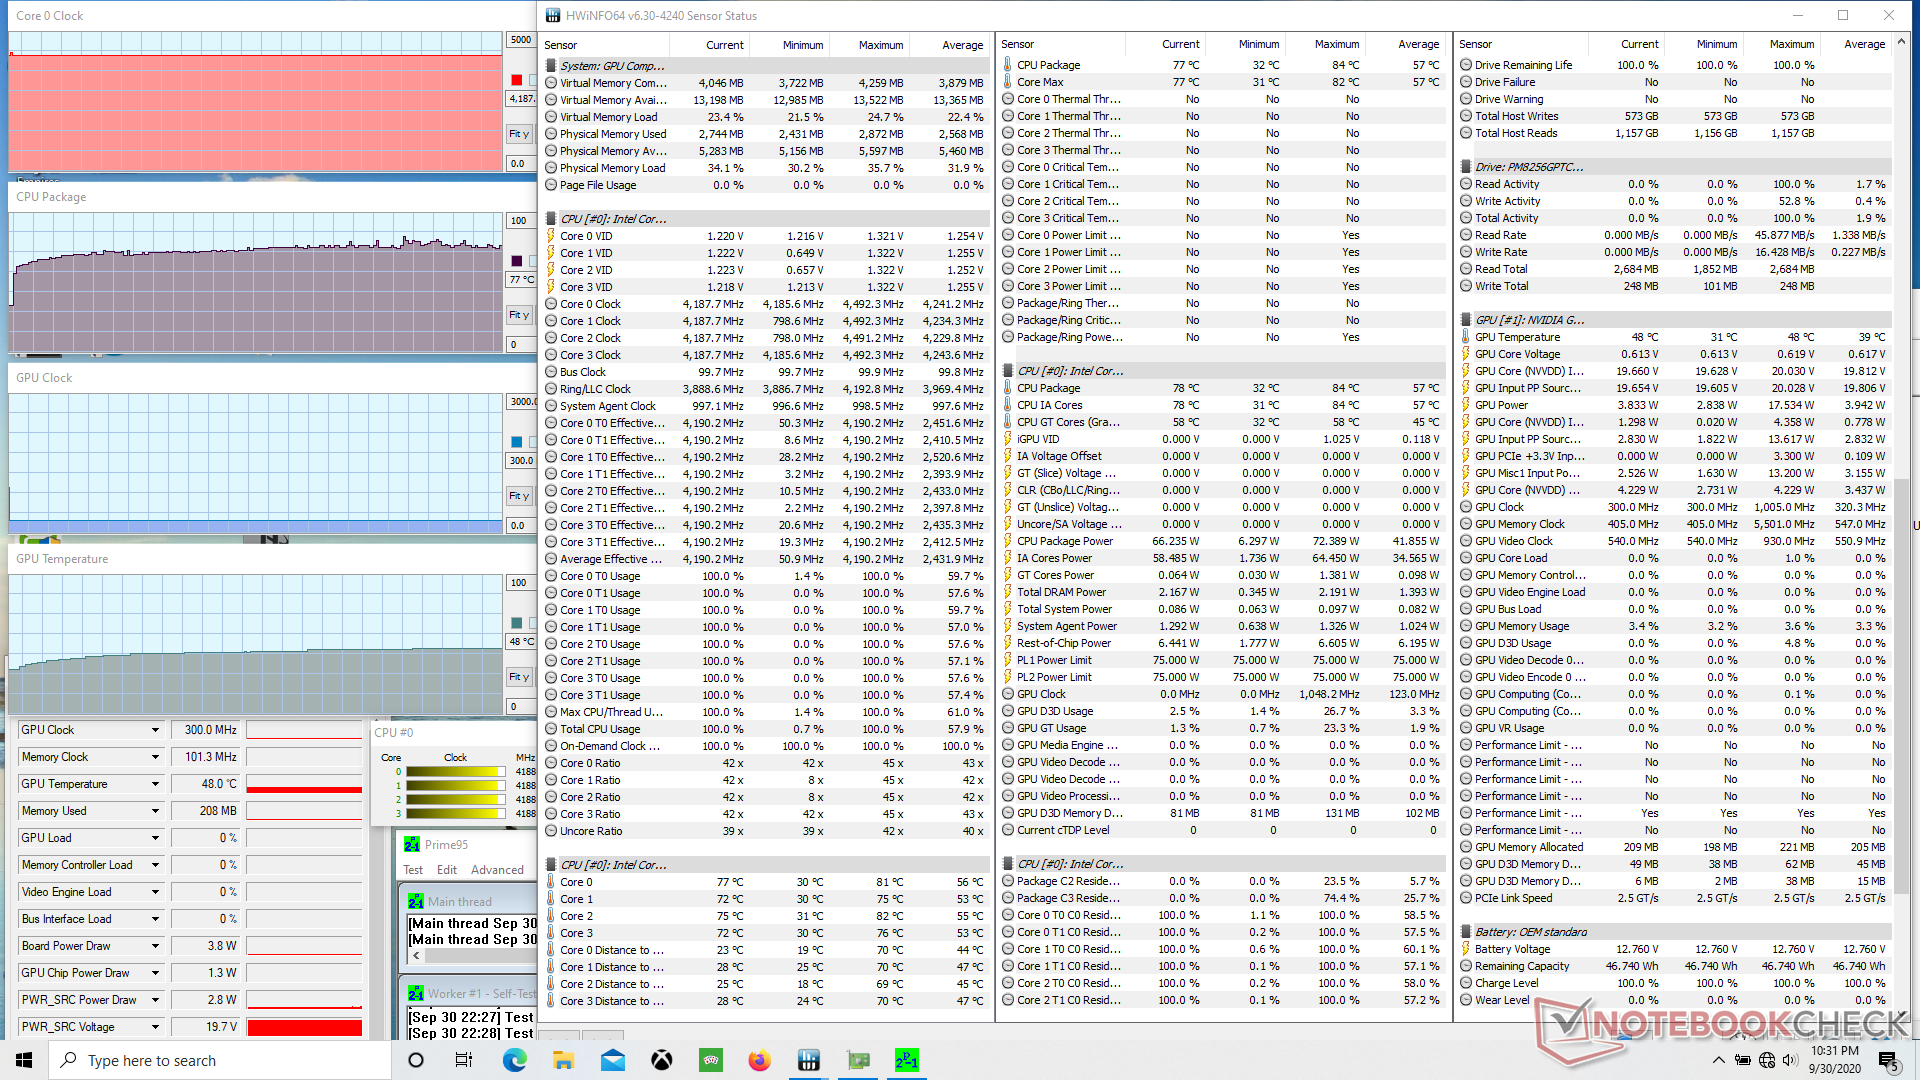
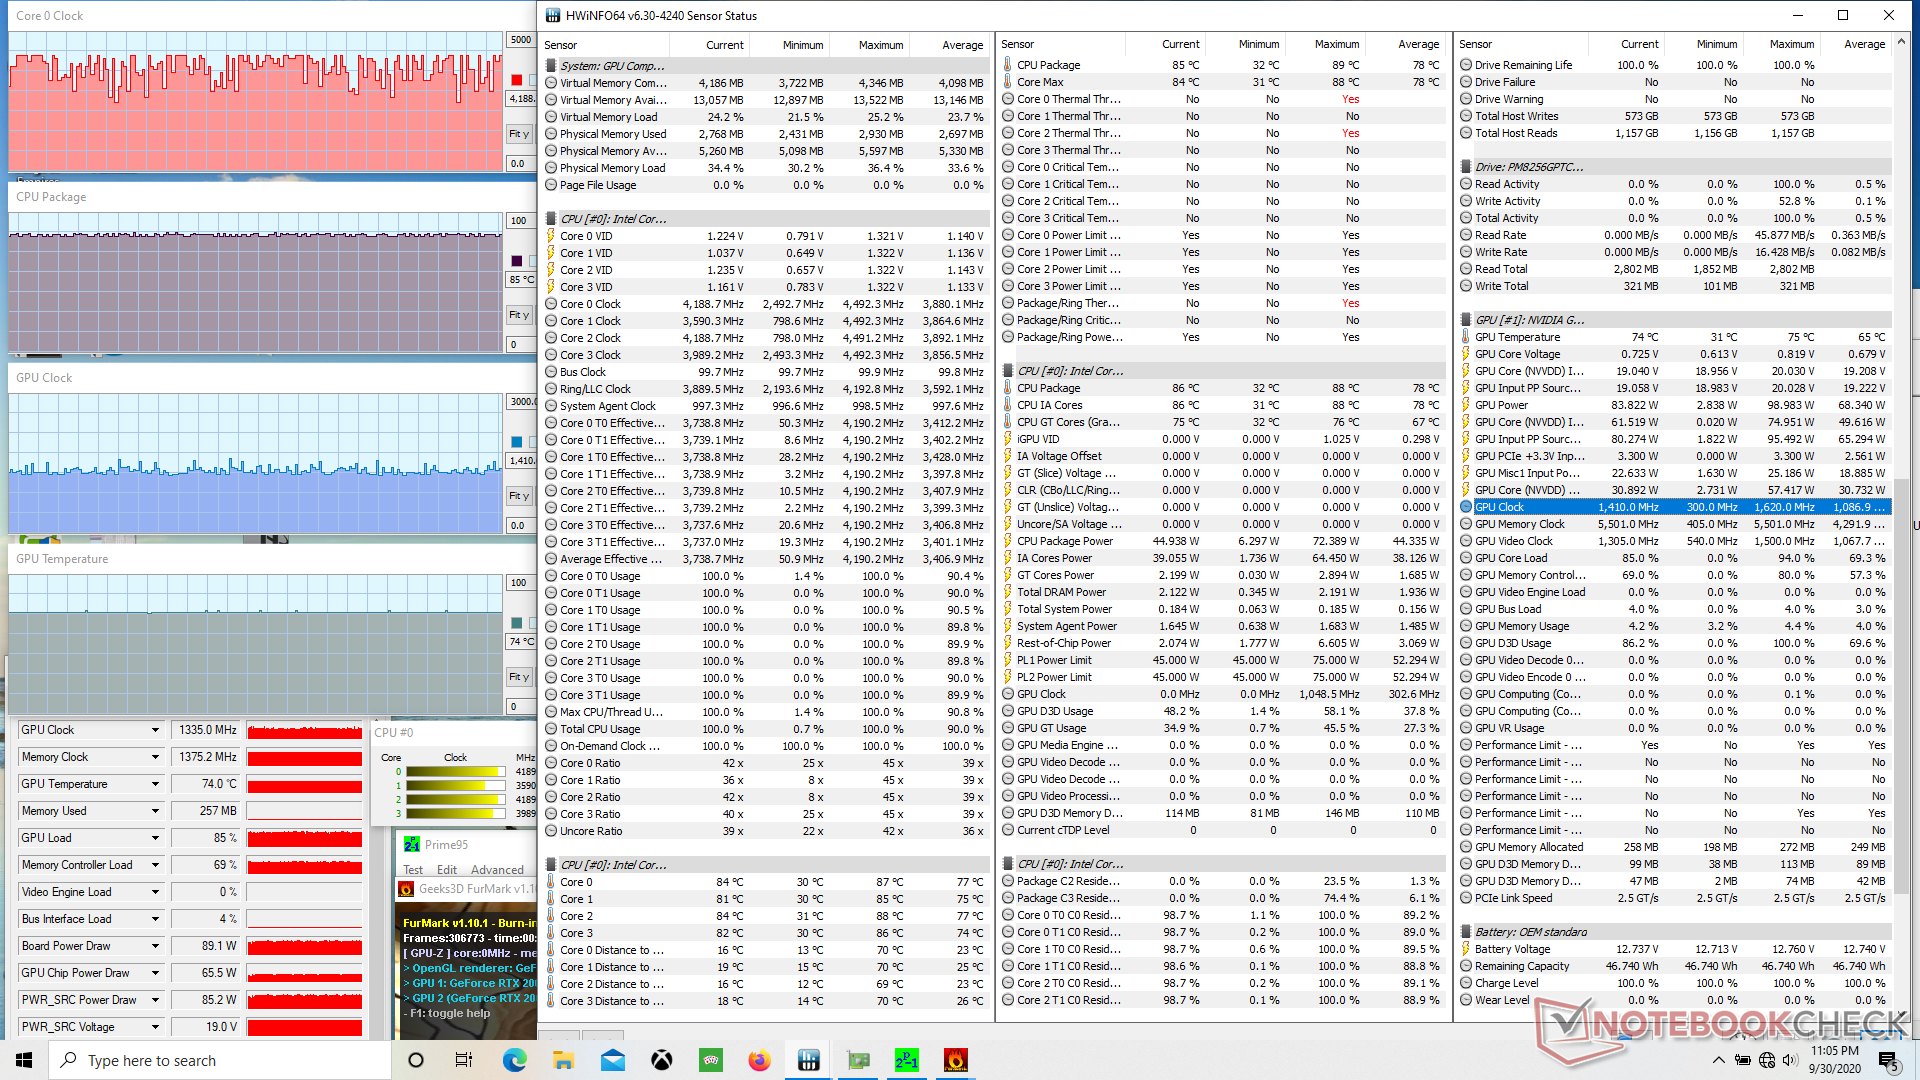
| CPU Clock (GHz) | GPU Clock (MHz) | Average CPU Temperature (°C) | Average GPU Temperature (°C) | |
| System Idle | -- | -- | 32 | 32 |
| Prime95 Stress | 4.2 | -- | 77 | 48 |
| Prime95 + FurMark Stress | 1.6 - 4.2 | 1335 | 85 | 74 |
| Witcher 3 Stress | 4.2 | 1680 | 74 | 70 |
Altavoces


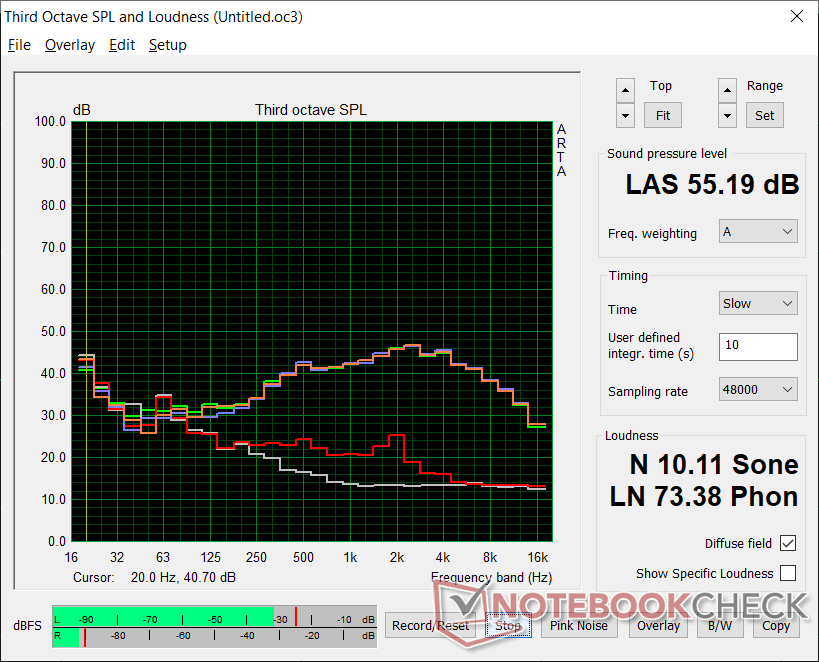
Gateway Creator Series 15.6 GWTN156-3BK análisis de audio
(+) | los altavoces pueden reproducir a un volumen relativamente alto (#82.9 dB)
Graves 100 - 315 Hz
(-) | casi sin bajos - de media 21.6% inferior a la mediana
(±) | la linealidad de los graves es media (14.3% delta a frecuencia anterior)
Medios 400 - 2000 Hz
(+) | medios equilibrados - a sólo 2.3% de la mediana
(+) | los medios son lineales (4% delta a la frecuencia anterior)
Altos 2 - 16 kHz
(+) | máximos equilibrados - a sólo 3.6% de la mediana
(+) | los máximos son lineales (6.3% delta a la frecuencia anterior)
Total 100 - 16.000 Hz
(±) | la linealidad del sonido global es media (17.2% de diferencia con la mediana)
En comparación con la misma clase
» 47% de todos los dispositivos probados de esta clase eran mejores, 11% similares, 42% peores
» El mejor tuvo un delta de 6%, la media fue 18%, el peor fue ###max##%
En comparación con todos los dispositivos probados
» 32% de todos los dispositivos probados eran mejores, 8% similares, 60% peores
» El mejor tuvo un delta de 4%, la media fue 23%, el peor fue ###max##%
Apple MacBook 12 (Early 2016) 1.1 GHz análisis de audio
(+) | los altavoces pueden reproducir a un volumen relativamente alto (#83.6 dB)
Graves 100 - 315 Hz
(±) | lubina reducida - en promedio 11.3% inferior a la mediana
(±) | la linealidad de los graves es media (14.2% delta a frecuencia anterior)
Medios 400 - 2000 Hz
(+) | medios equilibrados - a sólo 2.4% de la mediana
(+) | los medios son lineales (5.5% delta a la frecuencia anterior)
Altos 2 - 16 kHz
(+) | máximos equilibrados - a sólo 2% de la mediana
(+) | los máximos son lineales (4.5% delta a la frecuencia anterior)
Total 100 - 16.000 Hz
(+) | el sonido global es lineal (10.2% de diferencia con la mediana)
En comparación con la misma clase
» 7% de todos los dispositivos probados de esta clase eran mejores, 2% similares, 90% peores
» El mejor tuvo un delta de 5%, la media fue 18%, el peor fue ###max##%
En comparación con todos los dispositivos probados
» 5% de todos los dispositivos probados eran mejores, 1% similares, 94% peores
» El mejor tuvo un delta de 4%, la media fue 23%, el peor fue ###max##%
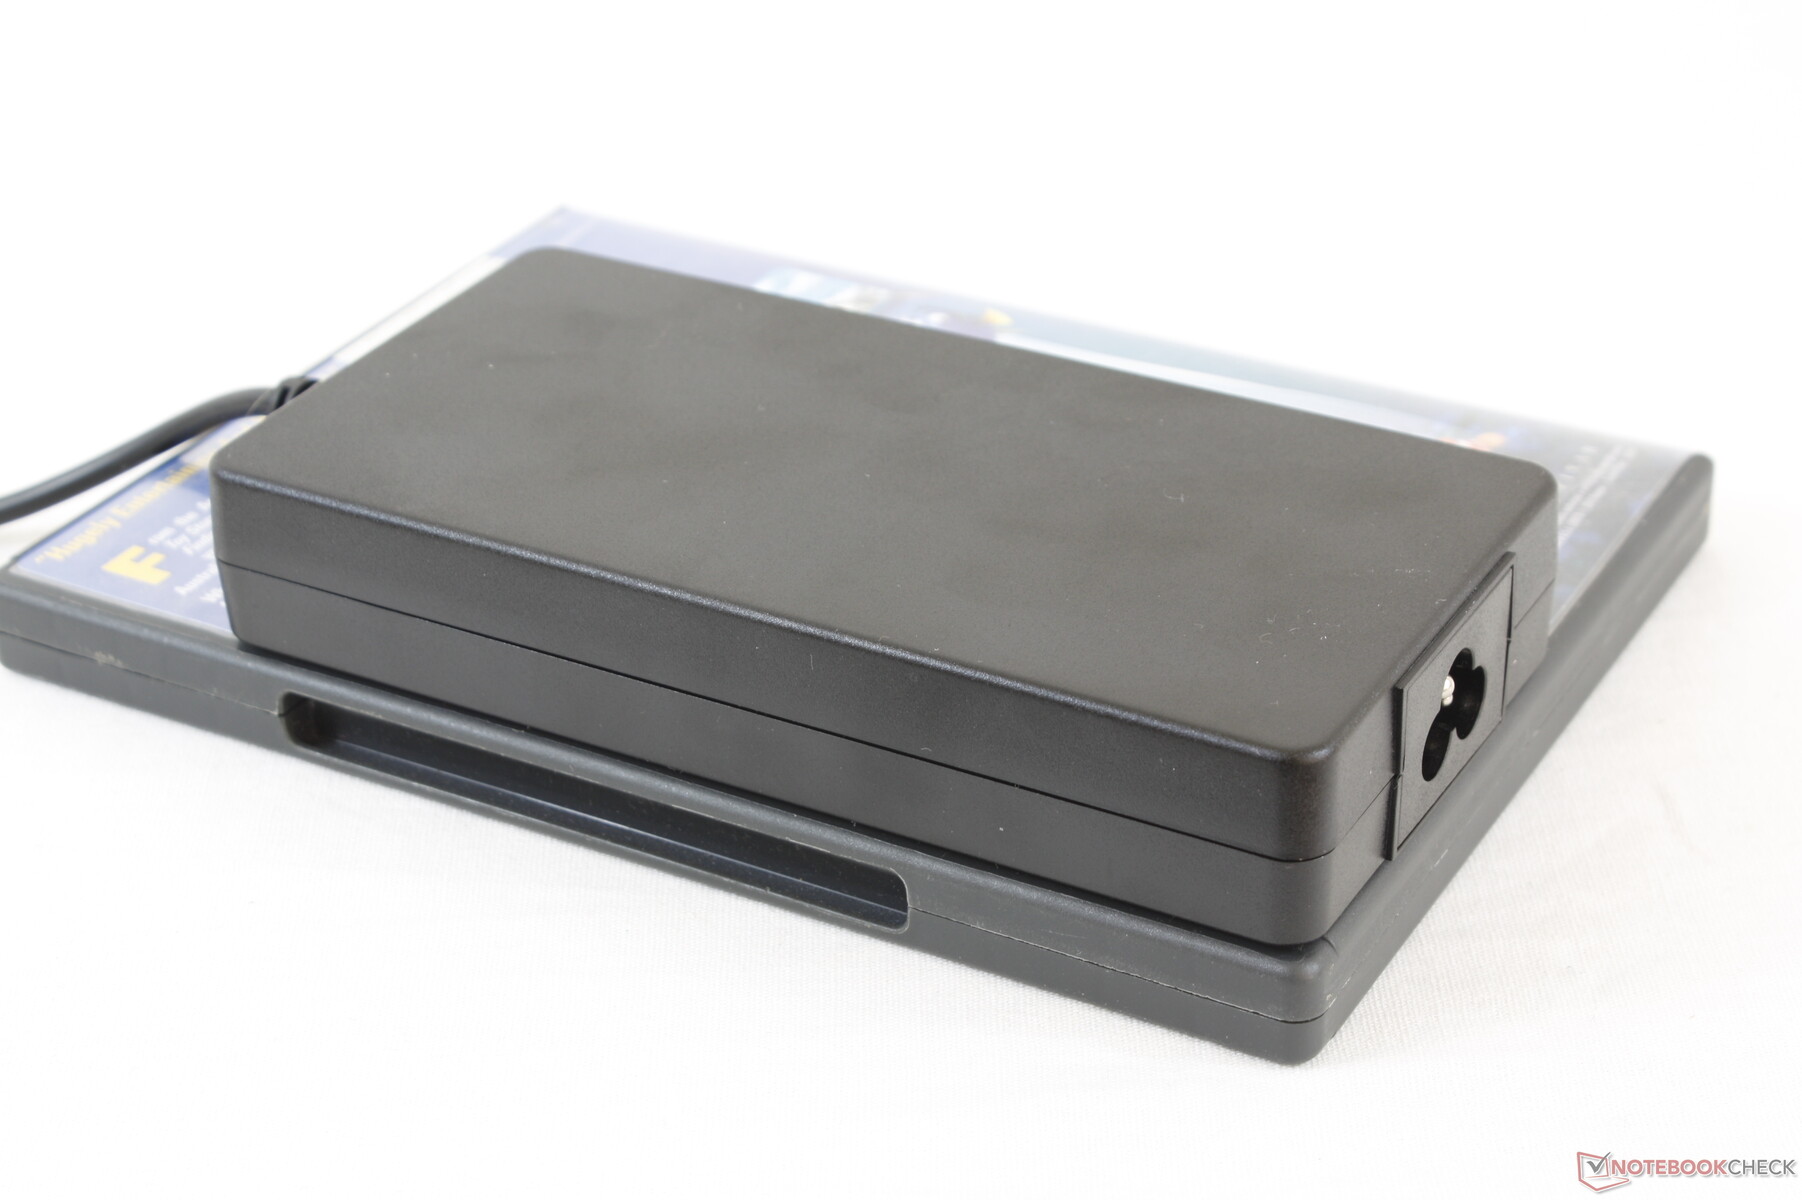
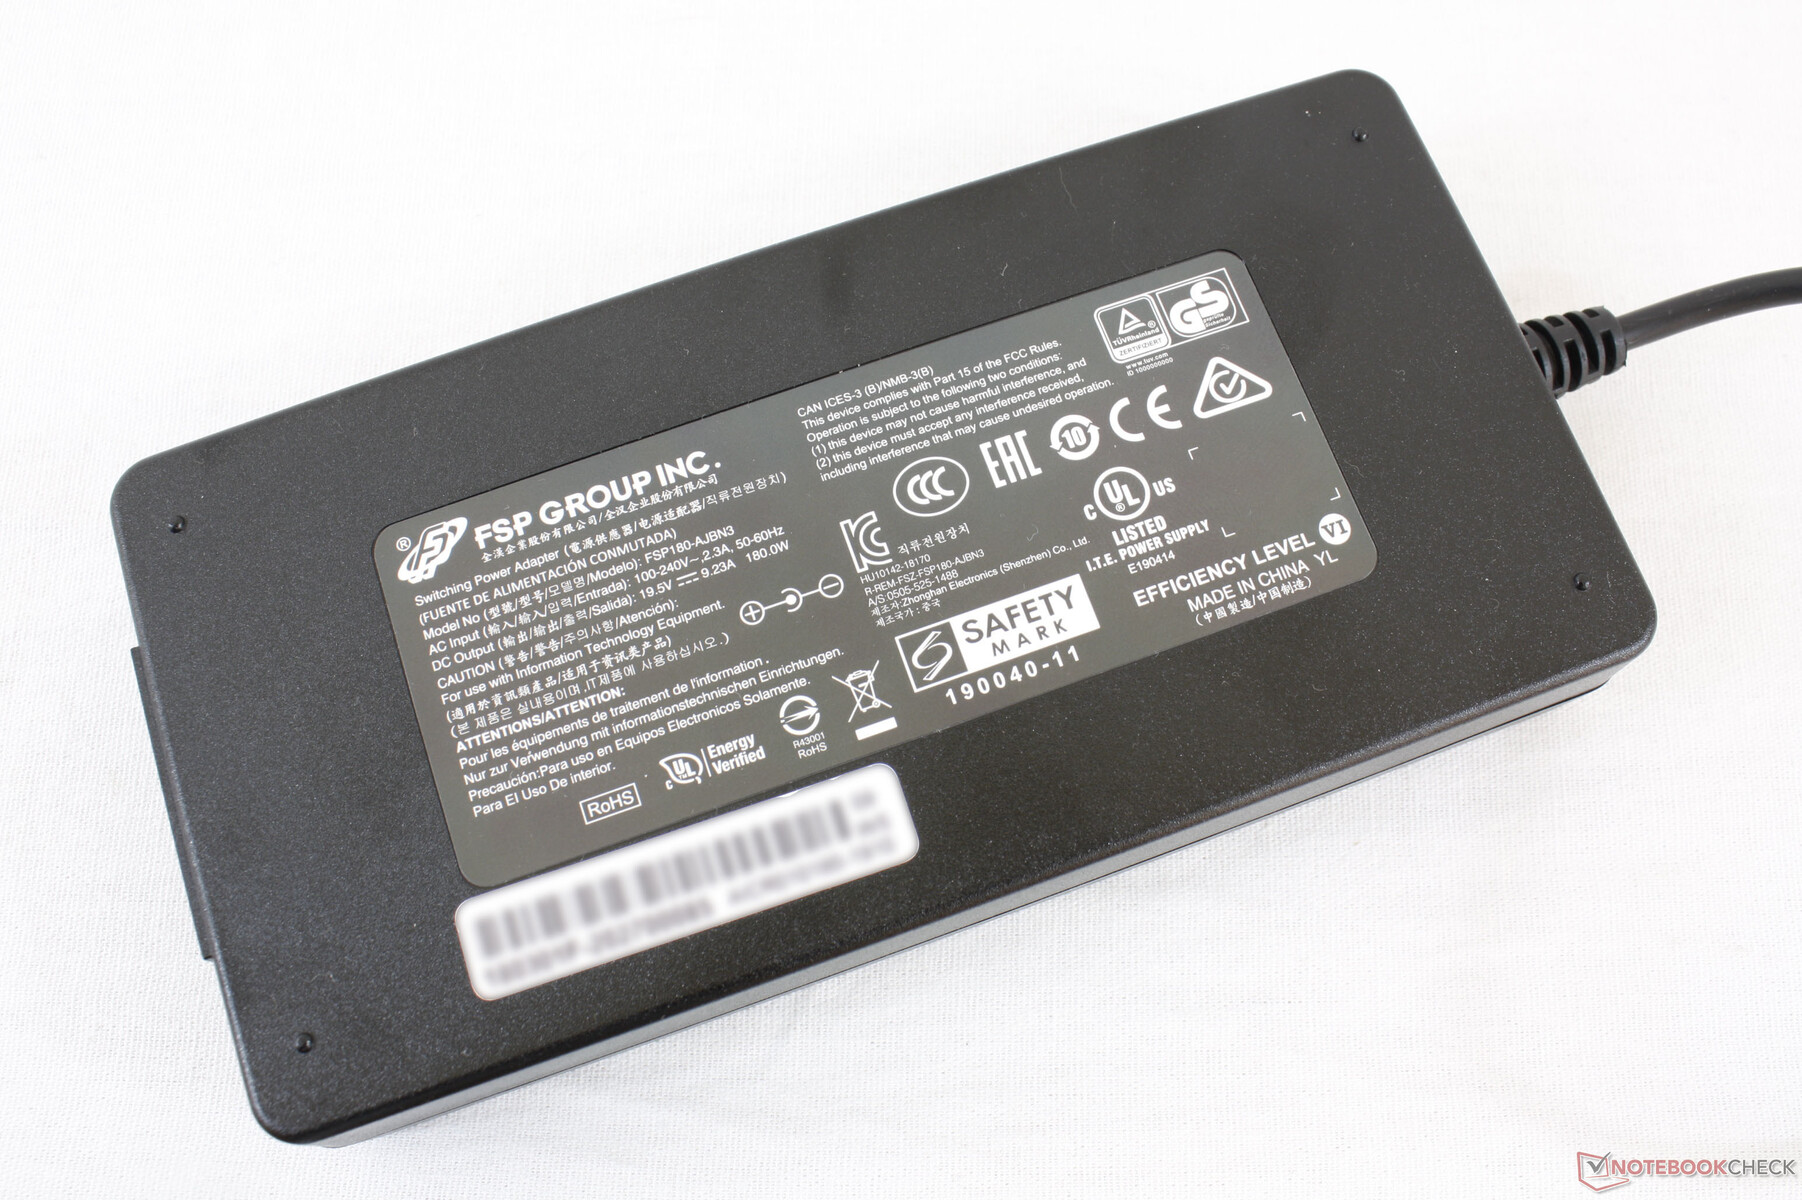
Gestión de la energía
Consumo de energía
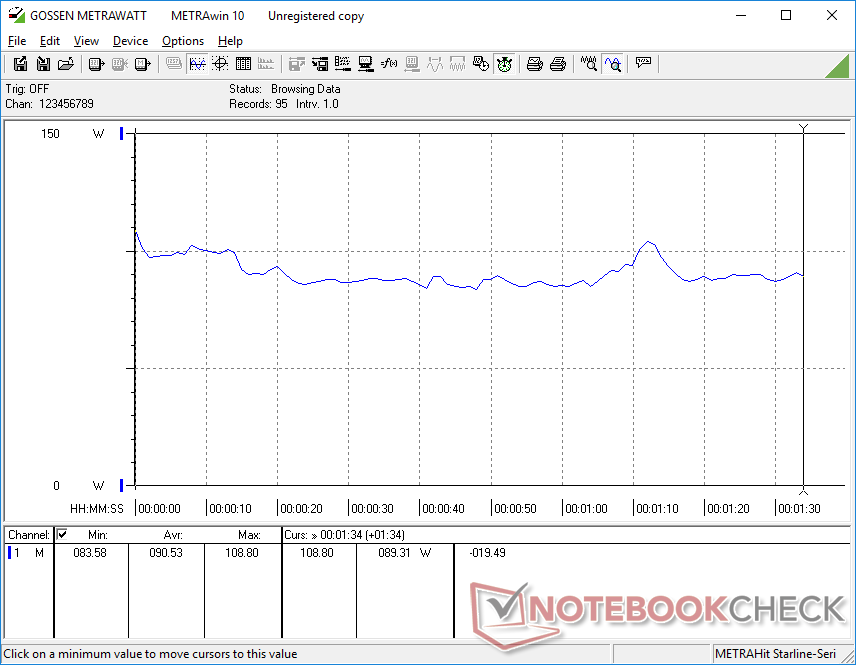
La inactividad en el escritorio demandará entre 10 W y 17 W dependiendo del perfil de potencia y el nivel de brillo. El consumo saltaría a 32 W si se inicia la GPU Nvidia, por lo que recomendamos explotar Optimus para optimizar la duración de la batería.
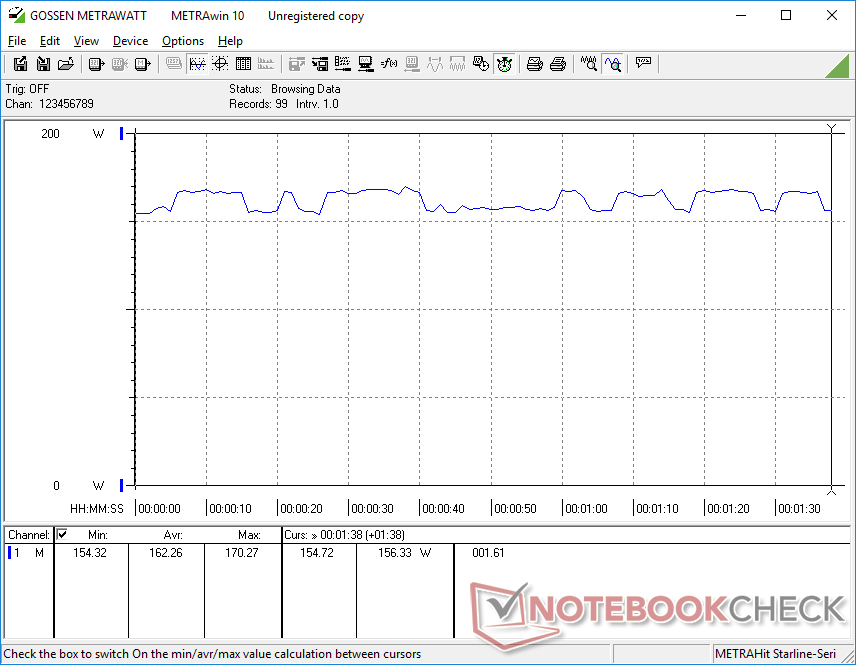
El consumo de energía es mayor de lo esperado, 162 W cuando se ejecuta Witcher 3. El Aorus 5 con la misma GPU pero con una CPU Core i7 más rápida, por ejemplo, consume sólo 138 W cuando está en condiciones similares. El Schenker XMG Core 15 con el Ryzen 7 4800H, más eficiente en cuanto a consumo de energía, consume incluso menos cuando juega.
| Off / Standby | |
| Ocioso | |
| Carga |
|
Clave:
min: | |
| Gateway Creator Series 15.6 GWTN156-3BK i5-10300H, GeForce RTX 2060 Mobile, Phison PS5013 PM8256GPTCB4B8TF, IPS, 1920x1080, 15.6" | Schenker XMG Core 15 GK5NR0O R7 4800H, GeForce RTX 2060 Mobile, Samsung SSD 970 EVO Plus 500GB, IPS, 1920x1080, 15.6" | Aorus 5 KB i7-10750H, GeForce RTX 2060 Mobile, ADATA XPG SX8200 Pro (ASX8200PNP-512GT), IPS, 1920x1080, 15.6" | Asus ROG Zephyrus G15 GA502IU-ES76 R7 4800HS, GeForce GTX 1660 Ti Max-Q, Intel SSD 660p 1TB SSDPEKNW010T8, IPS, 1920x1080, 15.6" | HP Omen 15-ek0456ng i5-10300H, GeForce GTX 1660 Ti Mobile, Toshiba XG6 KXG60ZNV512G, IPS, 1920x1080, 15.6" | Razer Blade 15 GTX 1660 Ti i7-9750H, GeForce GTX 1660 Ti Mobile, Samsung SSD PM981 MZVLB256HAHQ, IPS, 1920x1080, 15.6" | |
|---|---|---|---|---|---|---|
| Power Consumption | 8% | 8% | 47% | 15% | -29% | |
| Idle Minimum * (Watt) | 9.9 | 12 -21% | 8 19% | 5.1 48% | 9.2 7% | 18.7 -89% |
| Idle Average * (Watt) | 17 | 14 18% | 12 29% | 8.4 51% | 14.6 14% | 30.7 -81% |
| Idle Maximum * (Watt) | 31.9 | 20 37% | 21 34% | 9.1 71% | 18.1 43% | 33.9 -6% |
| Load Average * (Watt) | 90.5 | 103 -14% | 128 -41% | 55.1 39% | 84 7% | 93.4 -3% |
| Witcher 3 ultra * (Watt) | 162.3 | 125 23% | 138 15% | 97.5 40% | 142 13% | 158.9 2% |
| Load Maximum * (Watt) | 202.1 | 193 5% | 217 -7% | 140.2 31% | 194 4% | 195.3 3% |
* ... más pequeño es mejor
Duración de la batería
Los tiempos de ejecución son buenos para un portátil de juegos con más de 8 horas de uso de WLAN en el mundo real cuando está en el perfil de potencia equilibrada con la iGPU activa. La recarga de vacío a plena capacidad toma casi dos horas.
| Gateway Creator Series 15.6 GWTN156-3BK i5-10300H, GeForce RTX 2060 Mobile, 46.74 Wh | Schenker XMG Core 15 GK5NR0O R7 4800H, GeForce RTX 2060 Mobile, 62 Wh | Aorus 5 KB i7-10750H, GeForce RTX 2060 Mobile, 48.96 Wh | Asus ROG Zephyrus G15 GA502IU-ES76 R7 4800HS, GeForce GTX 1660 Ti Max-Q, 76 Wh | HP Omen 15-ek0456ng i5-10300H, GeForce GTX 1660 Ti Mobile, 70.91 Wh | Razer Blade 15 GTX 1660 Ti i7-9750H, GeForce GTX 1660 Ti Mobile, 65 Wh | |
|---|---|---|---|---|---|---|
| Duración de Batería | -27% | -41% | -35% | -20% | -32% | |
| WiFi v1.3 (h) | 8.1 | 5.9 -27% | 4.8 -41% | 5.3 -35% | 6.5 -20% | 5.5 -32% |
| Reader / Idle (h) | 7.8 | 9 | 7.1 | 11.7 | ||
| Load (h) | 1.5 | 1 | 1.9 | 1.7 |
Pro
Contra
Veredicto
Un portátil delgado y ligero con gráficos Intel de 10ª generación y GeForce RTX 2060 por menos de 1000 dólares es comprensiblemente tentador. Sin embargo, hay demasiados recortes que hacen caer el sistema Gateway. El espacio de color, por ejemplo, es sólo una fracción del sRGB que la mayoría de los artistas digitales se resisten. En segundo lugar, el "ghosting" es notable debido a los tiempos de respuesta promedio que impactarán en los juegos. Para un portátil dirigido a jugadores y creadores, estos inconvenientes serán difíciles de pasar por alto.
Por último, los míseros 8 GB de RAM del sistema y los 256 GB de SSD tienen la mitad de tamaño que la mayoría de los demás portátiles para juegos de este mismo rango de precio. Añadir más RAM y almacenamiento por sí mismo es un proceso fácil en este chasis, pero lamentablemente esto anulará la garantía.
Un modelo aún mejor de Gateway Creator habría sido ofrecer la CPU Ryzen 5 4600H, la GPU GeForce RTX 2060 y una pantalla de 1080p de mayor calidad por el mismo o similar precio de 1000 dólares..
El Gateway Creator 15 es una ganga si sus intenciones son maximizar el rendimiento por dólar y el rendimiento por peso. Sólo ten en cuenta que estarás atrapado con una pantalla mediocre y un mínimo de memoria RAM y almacenamiento hasta que la garantía termine.
Gateway Creator Series 15.6 GWTN156-3BK
- 10/02/2020 v7 (old)
Allen Ngo
Price comparison
