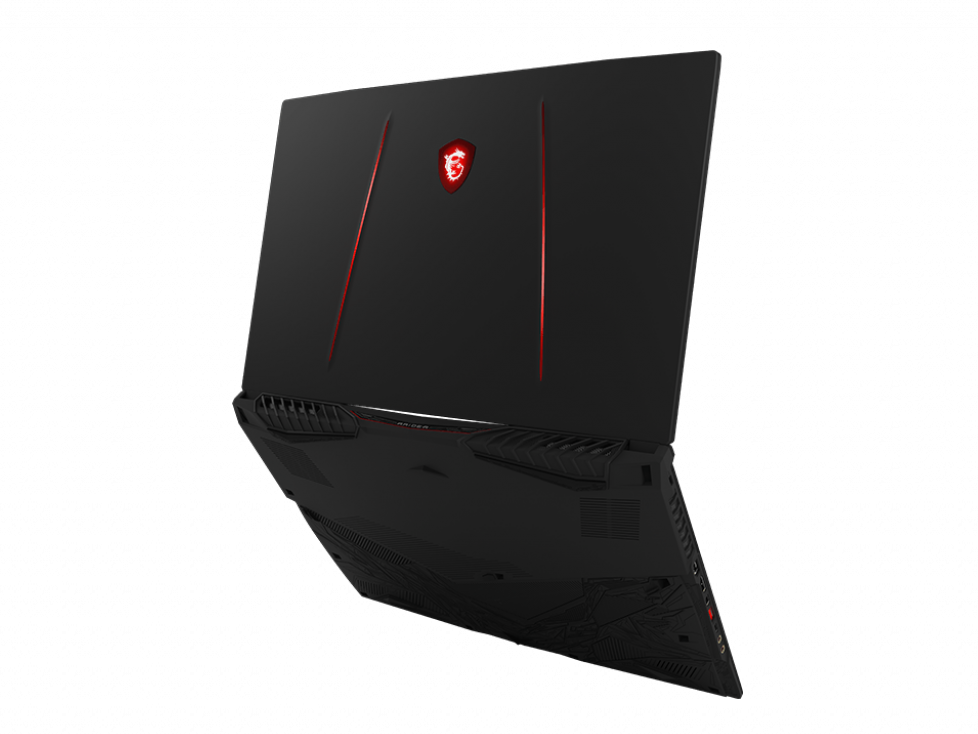
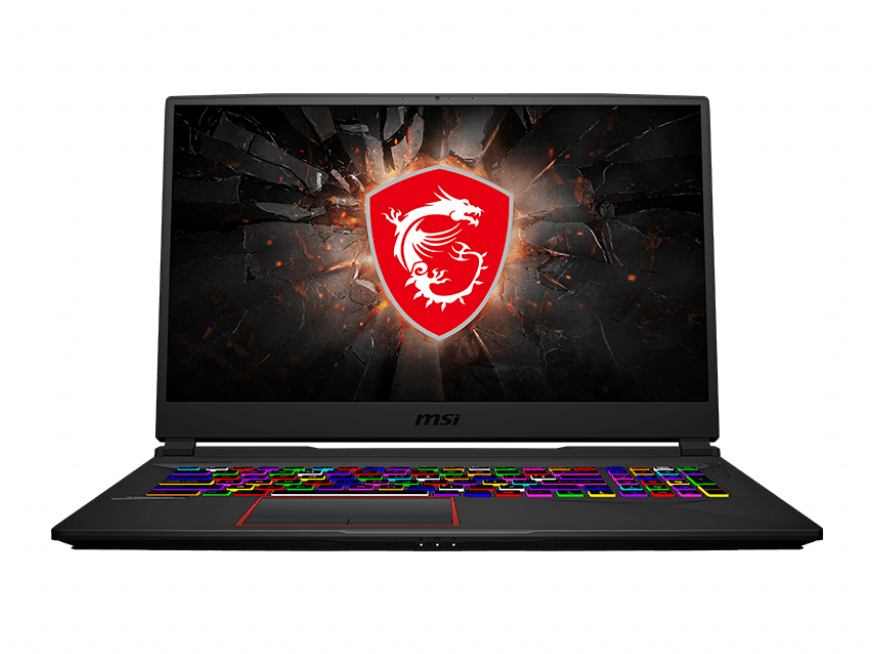
Review del portátil MSI GE75 Raider 10SE: Core i7 de la 10ª generación y GeForce RTX Combo
El MSI GE75 Raider 10SE es la actualización del Comet Lake-H de Intel de 10ª generación a la 9ª generación del Coffee Lake-H GE75 9SE del año pasado. Las características del chasis son por lo demás idénticas, por lo que recomendamos consultar nuestras revisiones existentes sobre el GEGE75 9SG, 8SG, o 8SF para saber más sobre el teclado, los puertos, los altavoces y otras características físicas del portátil. Esta página se centrará en el rendimiento del último sistema MSI y en cómo se compara con otros competidores de gama media y alta de 17,3 pulgadas.
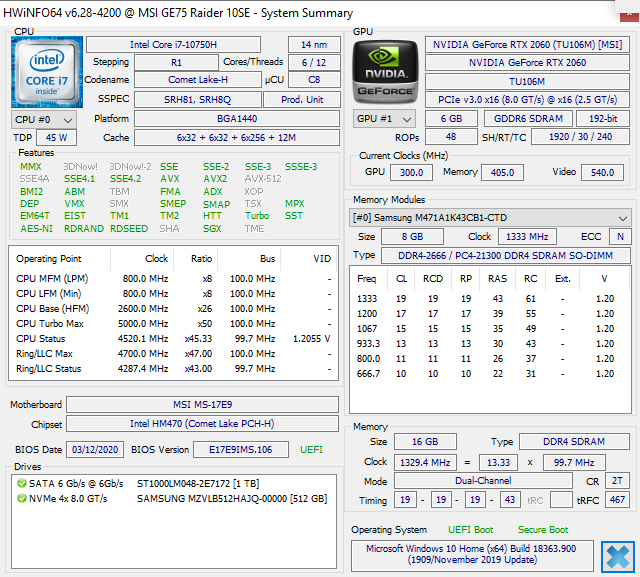
Nuestra unidad configurada es una oferta básica con su pantalla de 144 Hz 1080p, CPU Core i7-10750H de 6 núcleos y GPU GeForce RTX 2060 por aproximadamente $1800 USD. Los usuarios pueden configurar con una pantalla 1080p de hasta 300 Hz, una CPU Core i9-10980HK de 8 núcleos desbloqueada y una GPU GeForce RTX 2080 Super por aproximadamente $3000 USD. Las opciones de almacenamiento y RAM variarán mucho entre las versiones.
Más reviews de MSI:
Valoración | Fecha | Modelo | Peso | Altura | Tamaño | Resolución | Precio |
|---|---|---|---|---|---|---|---|
| 85.1 % v7 (old) | 07/2020 | MSI GE75 Raider 10SE-008US i7-10750H, GeForce RTX 2060 Mobile | 2.6 kg | 27.5 mm | 17.30" | 1920x1080 | |
| 82.9 % v7 (old) | 06/2019 | MSI GS75 Stealth 9SG i7-9750H, GeForce RTX 2080 Max-Q | 2.3 kg | 18.9 mm | 17.30" | 1920x1080 | |
| 86 % v7 (old) | 09/2019 | Asus Strix Hero III G731GV i7-9750H, GeForce RTX 2060 Mobile | 2.9 kg | 26.2 mm | 17.30" | 1920x1080 | |
| 83.2 % v7 (old) | 10/2019 | Lenovo Legion Y740-17IRH i7-9750H, GeForce RTX 2060 Mobile | 3 kg | 23 mm | 17.30" | 1920x1080 | |
| 89.4 % v6 (old) | 08/2019 | Razer Blade Pro 17 RTX 2060 i7-9750H, GeForce RTX 2060 Mobile | 2.8 kg | 19.9 mm | 17.30" | 1920x1080 | |
| 86.5 % v7 (old) | 05/2020 | Aorus 17G XB i7-10875H, GeForce RTX 2070 Super Max-Q | 2.7 kg | 26 mm | 17.30" | 1920x1080 |
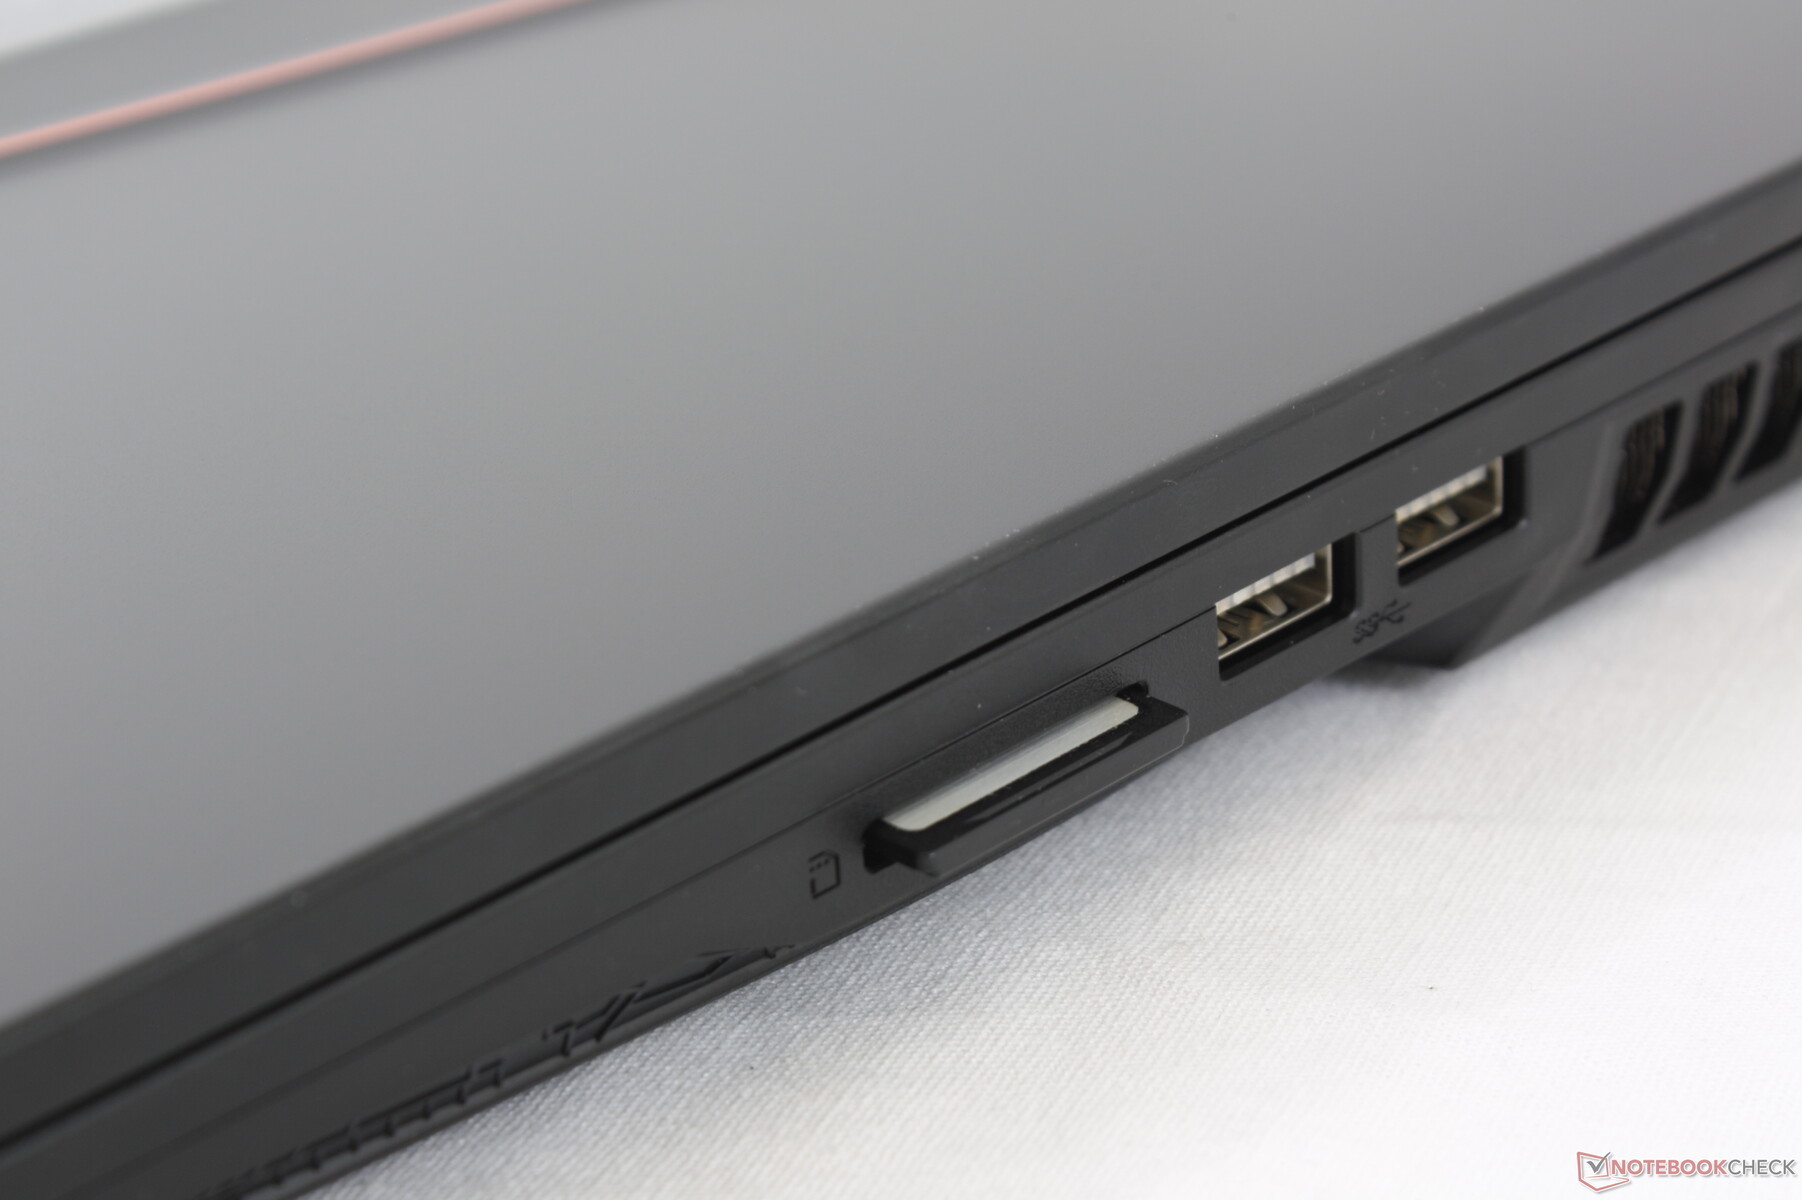
Carcasa
Lector de tarjetas SD
| SD Card Reader | |
| average JPG Copy Test (av. of 3 runs) | |
| Aorus 17G XB (Toshiba Exceria Pro SDXC 64 GB UHS-II) | |
| Gigabyte Aero 17 HDR XB (Toshiba Exceria Pro SDXC 64 GB UHS-II) | |
| Dell XPS 15 9500 Core i7 4K UHD (Toshiba Exceria Pro SDXC 64 GB UHS-II) | |
| Razer Blade Pro 17 RTX 2060 (Toshiba Exceria Pro SDXC 64 GB UHS-II) | |
| MSI GT73VR 7RF-296 (Toshiba Exceria Pro SDXC 64 GB UHS-II) | |
| MSI GE75 Raider 10SE-008US (Toshiba Exceria Pro SDXC 64 GB UHS-II) | |
| maximum AS SSD Seq Read Test (1GB) | |
| Aorus 17G XB (Toshiba Exceria Pro SDXC 64 GB UHS-II) | |
| Gigabyte Aero 17 HDR XB (Toshiba Exceria Pro SDXC 64 GB UHS-II) | |
| MSI GT73VR 7RF-296 (Toshiba Exceria Pro SDXC 64 GB UHS-II) | |
| Razer Blade Pro 17 RTX 2060 (Toshiba Exceria Pro SDXC 64 GB UHS-II) | |
| Dell XPS 15 9500 Core i7 4K UHD (Toshiba Exceria Pro SDXC 64 GB UHS-II) | |
| MSI GE75 Raider 10SE-008US (Toshiba Exceria Pro SDXC 64 GB UHS-II) | |
Comunicación
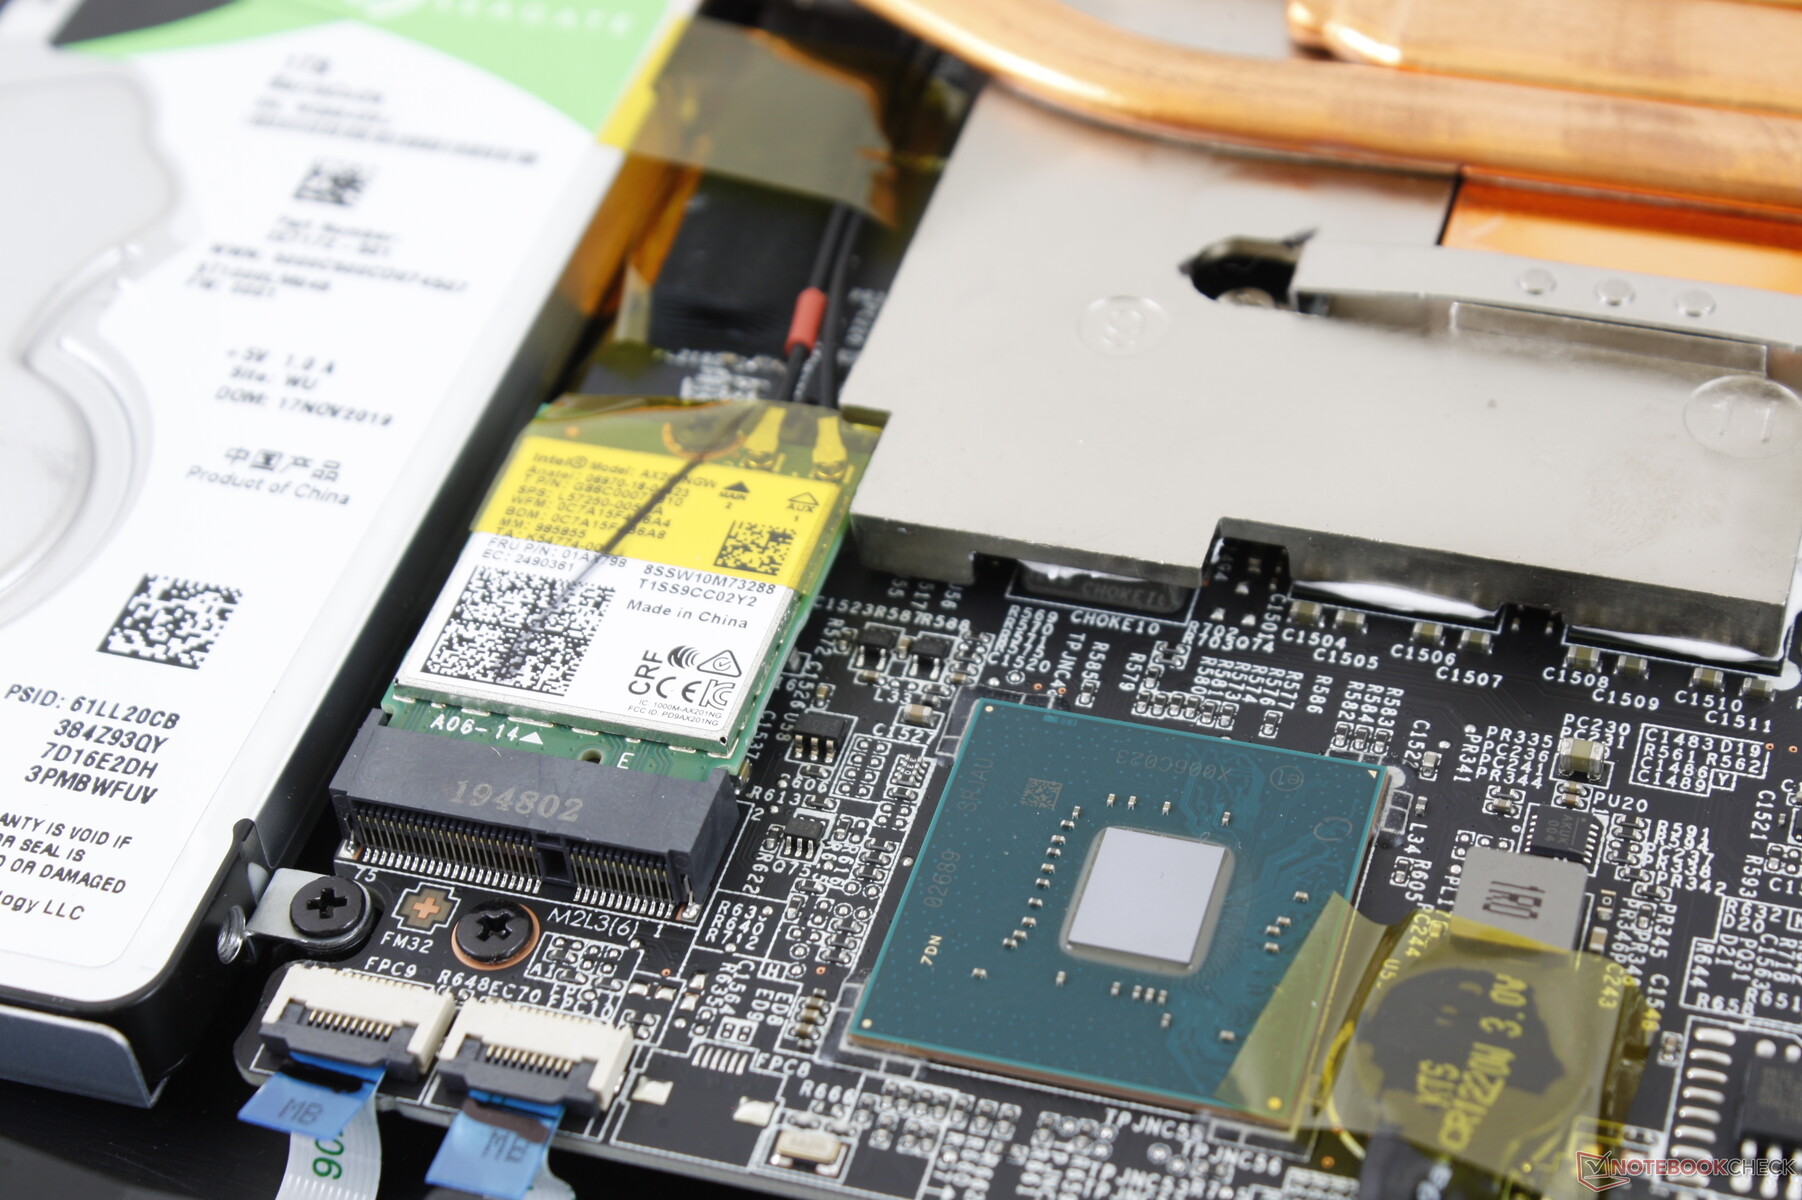
El Intel AX201 viene de serie para la conectividad Bluetooth 5.1 y Wi-Fi 6. No experimentamos ningún problema cuando lo emparejamos con nuestro enrutador de prueba Netgear RAX200.
Webcam


Mantenimiento
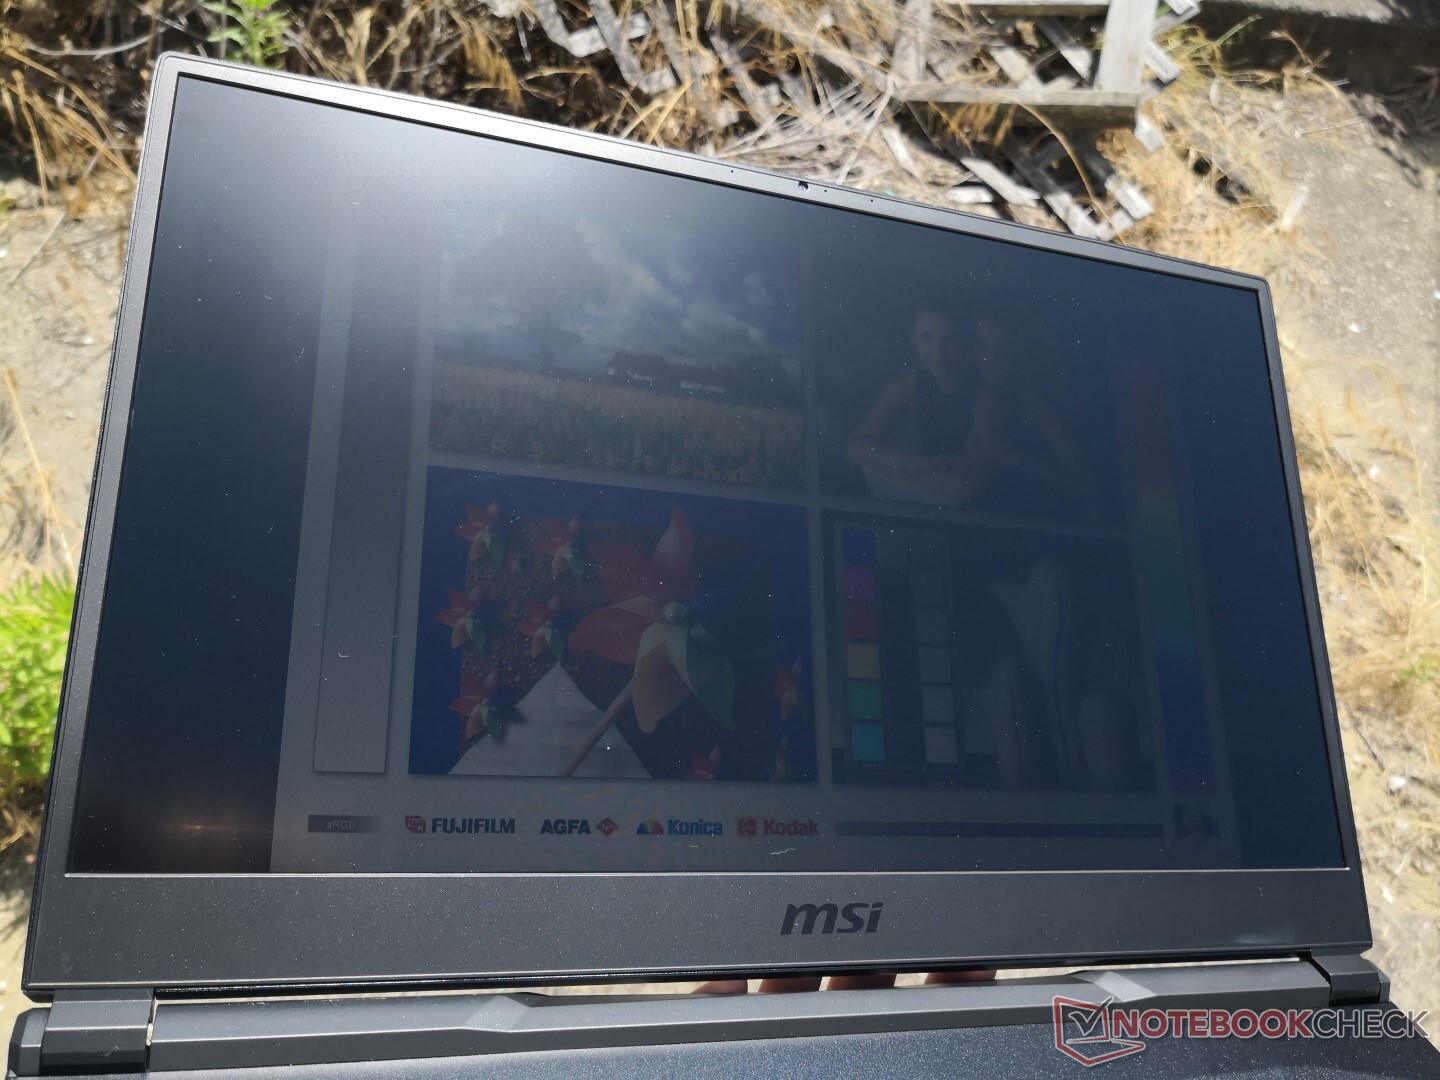
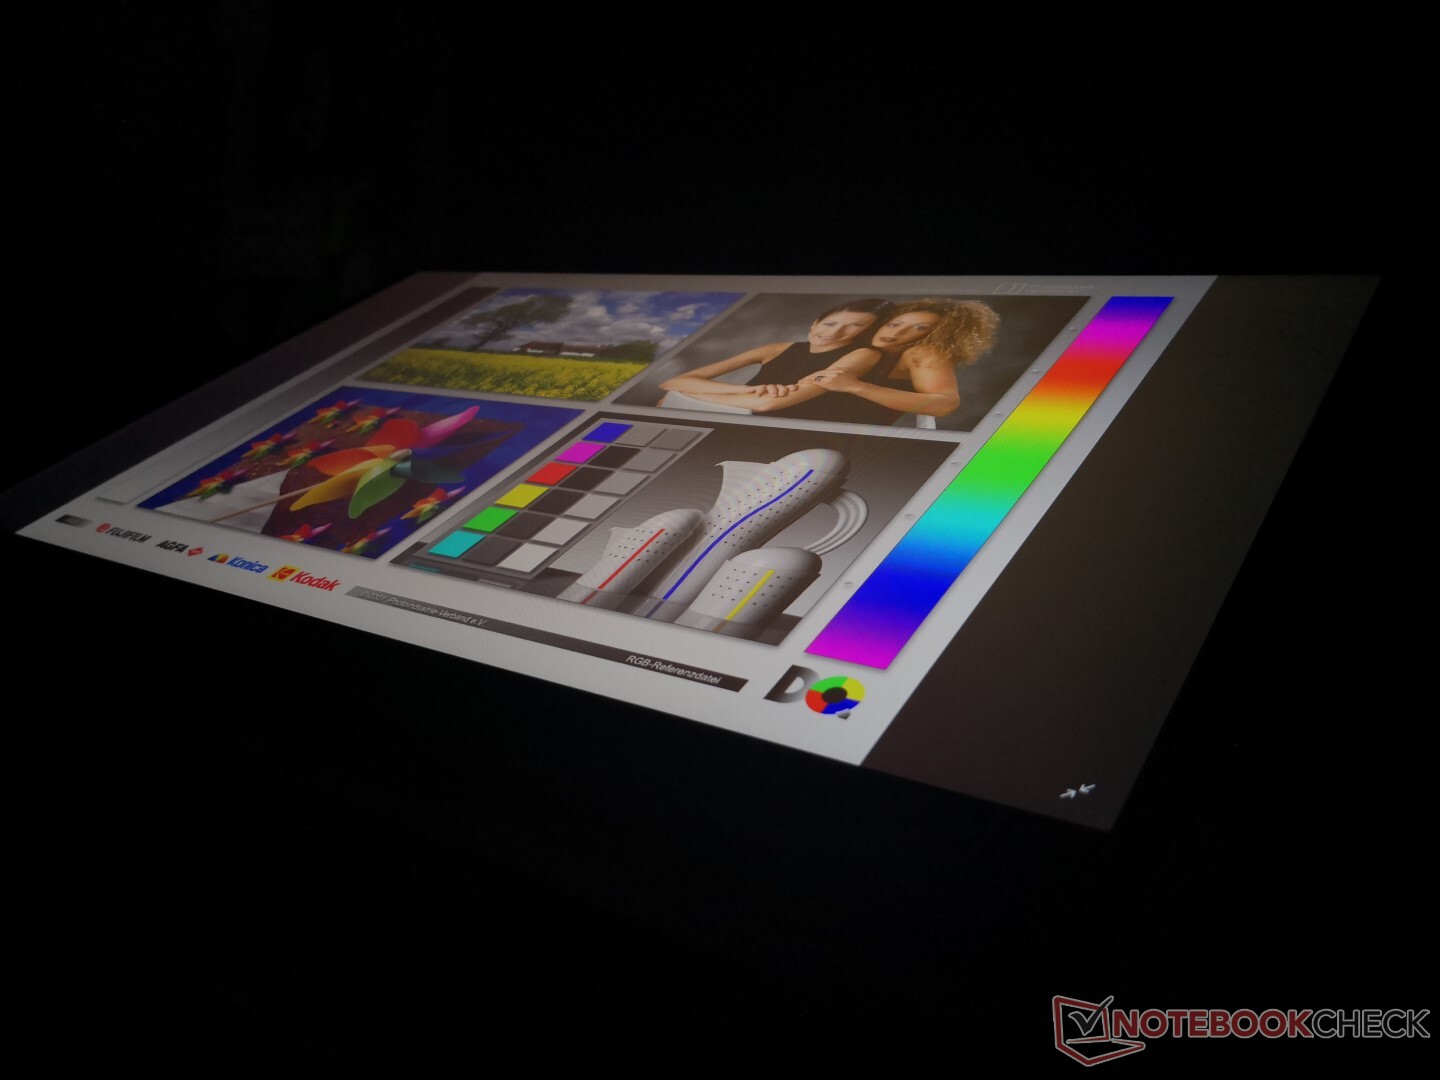
Display
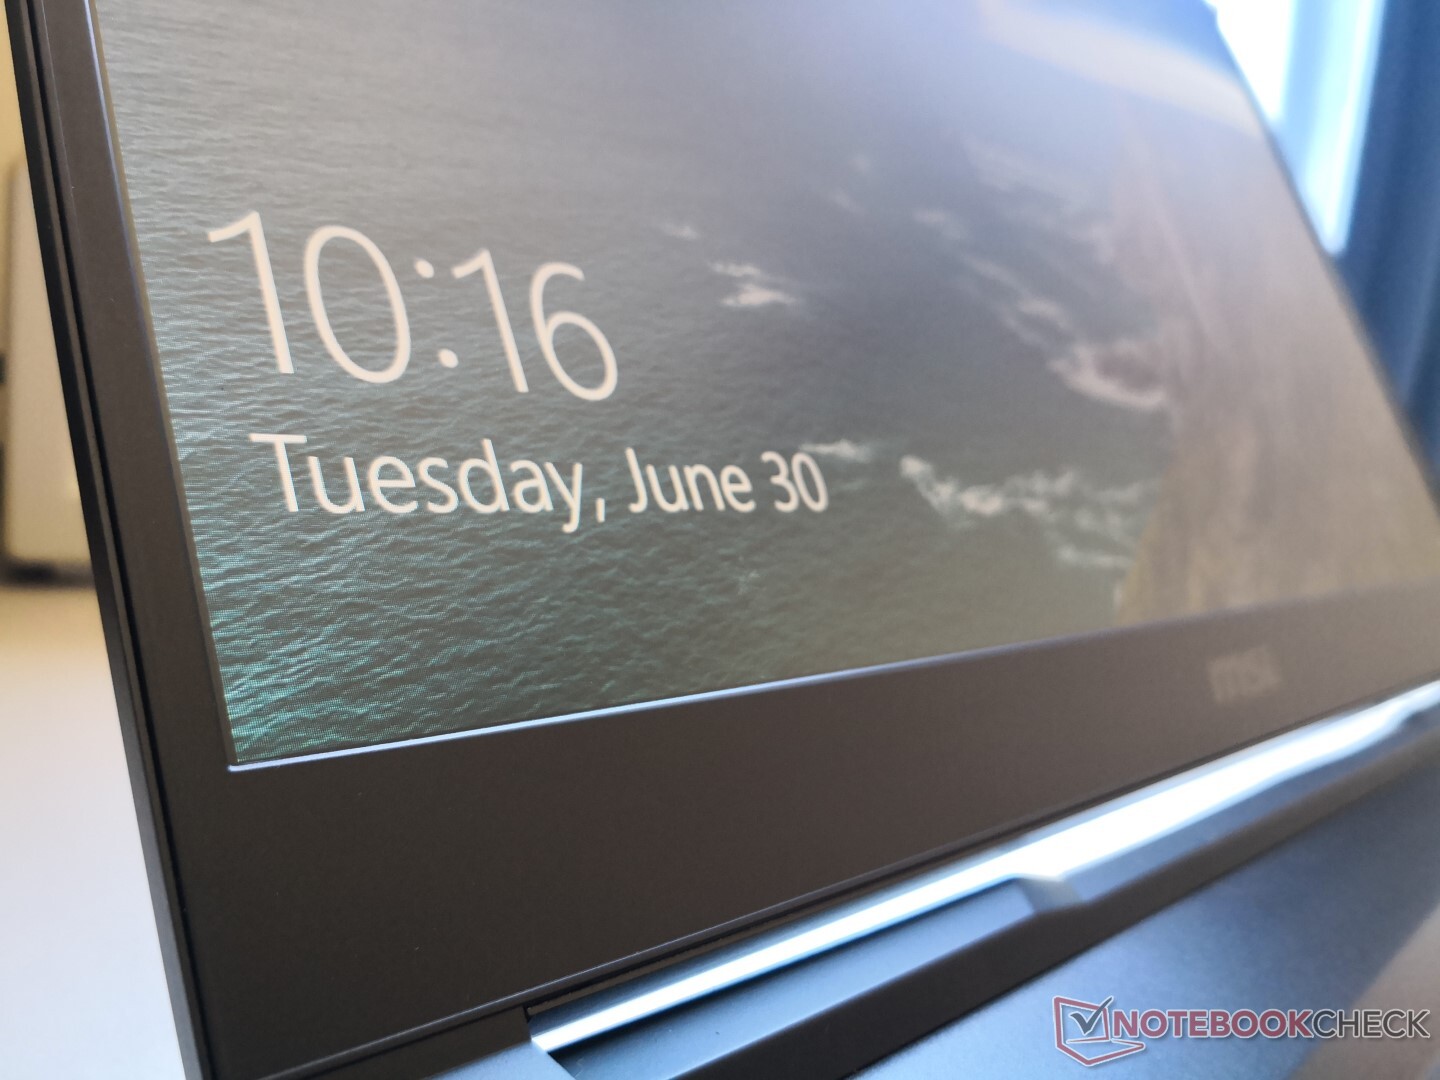
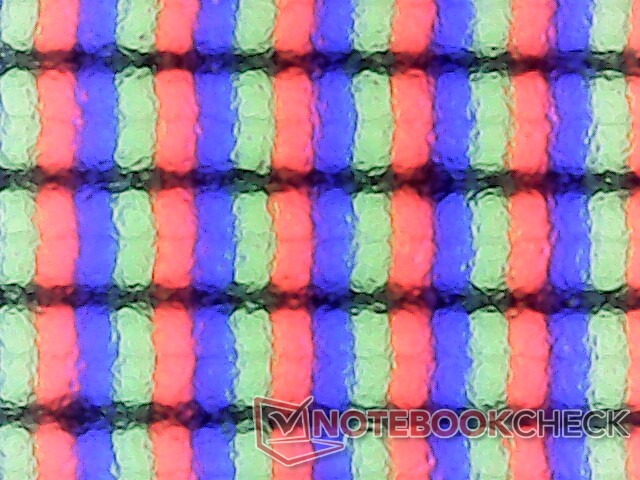
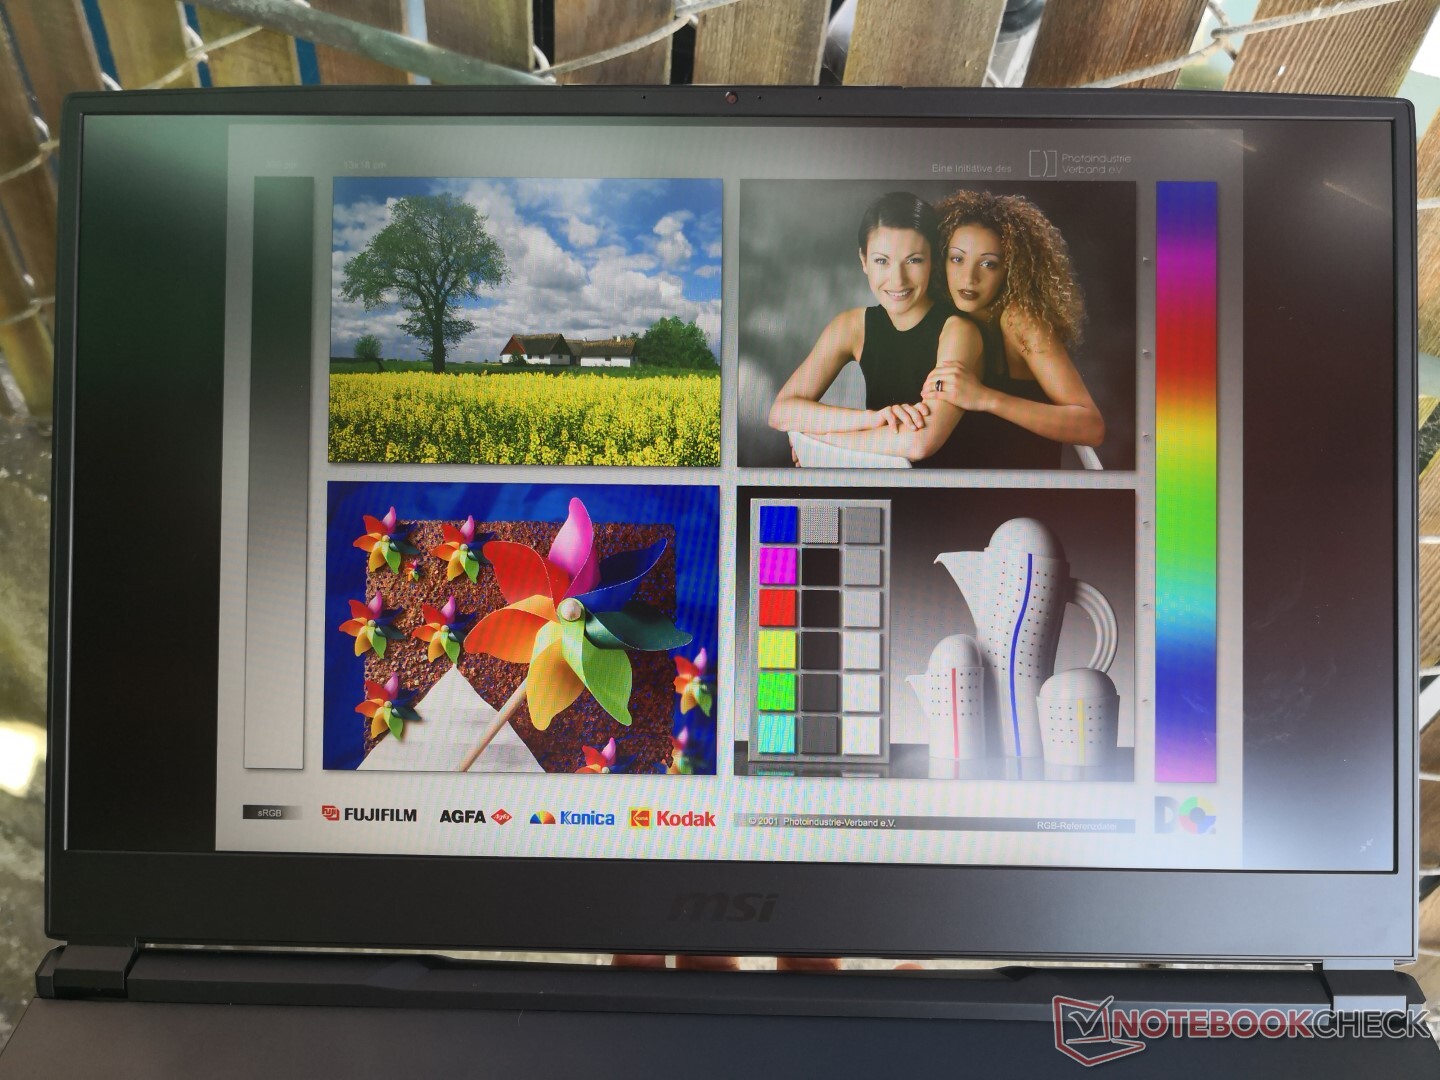
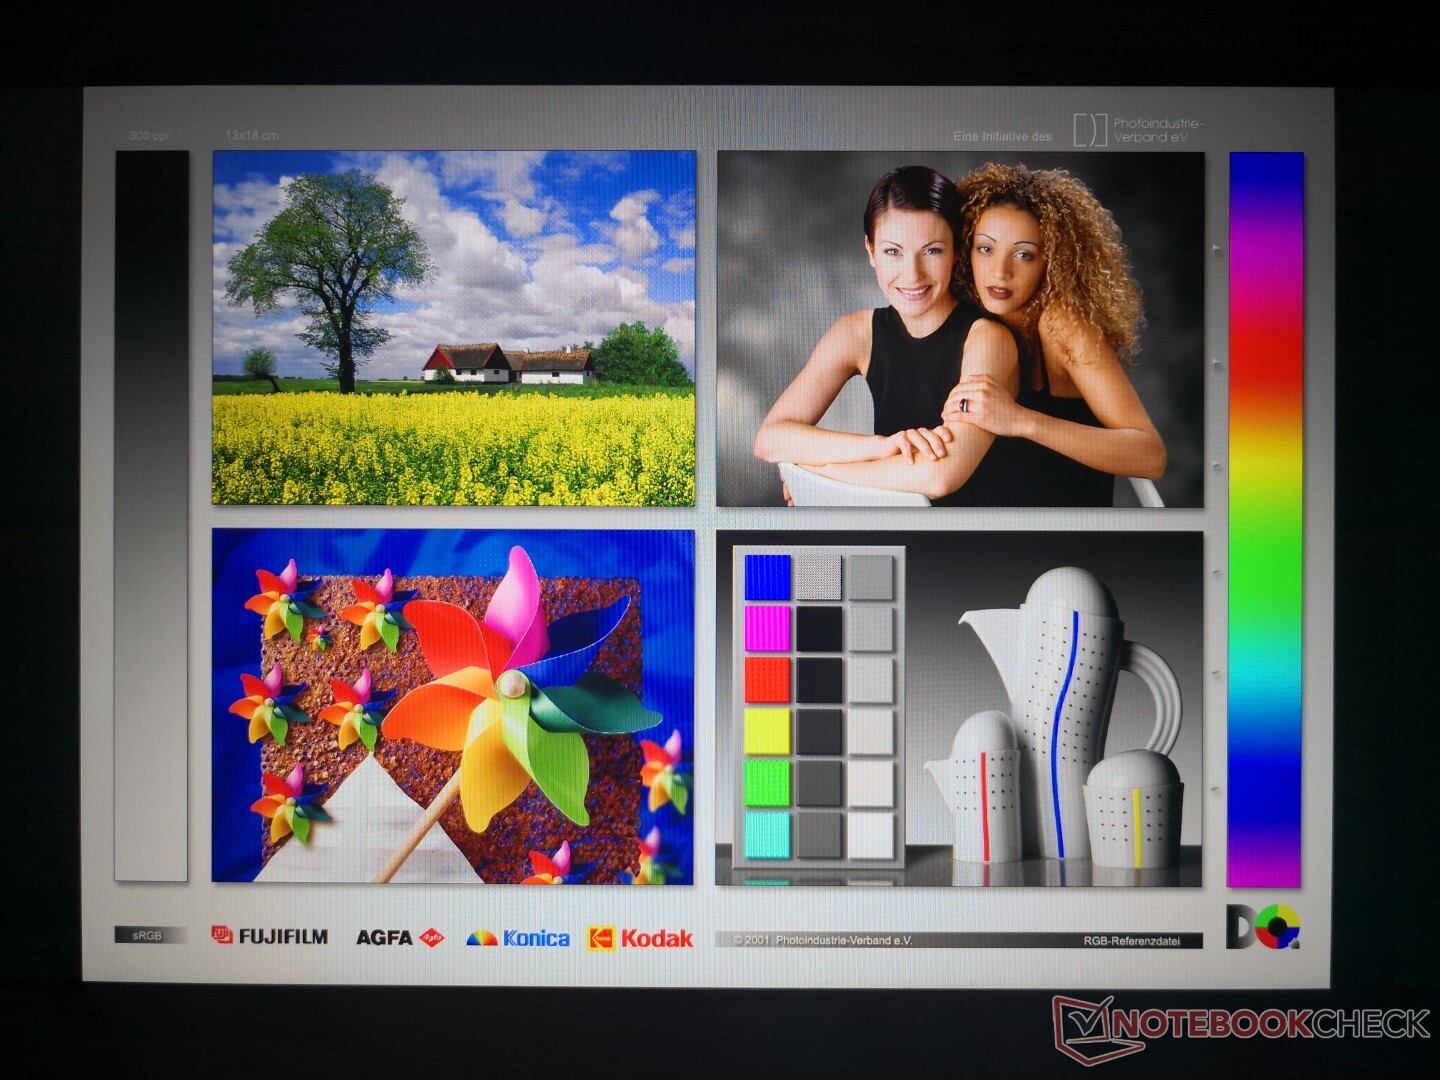
Nuestra unidad 2020 utiliza el mismo panel de alta gama de 144 Hz Chi Mei N173HCE-G33 que se encuentra en los modelos GE75 de 2019 y 2018. De hecho, MSI utiliza este mismo panel para su serie GS75 más delgada, así como para características similares entre ellos, como se muestra en nuestra tabla de abajo. Los tiempos de respuesta negro-blanco y gris-gris, en particular, son muy rápidos para una experiencia ultrasuave y casi libre de fantasmas en los juegos.
MSI ofrece una opción de panel de 300 Hz que sospechamos será del mismo fabricante que el del reciente Razer Blade Pro 17.
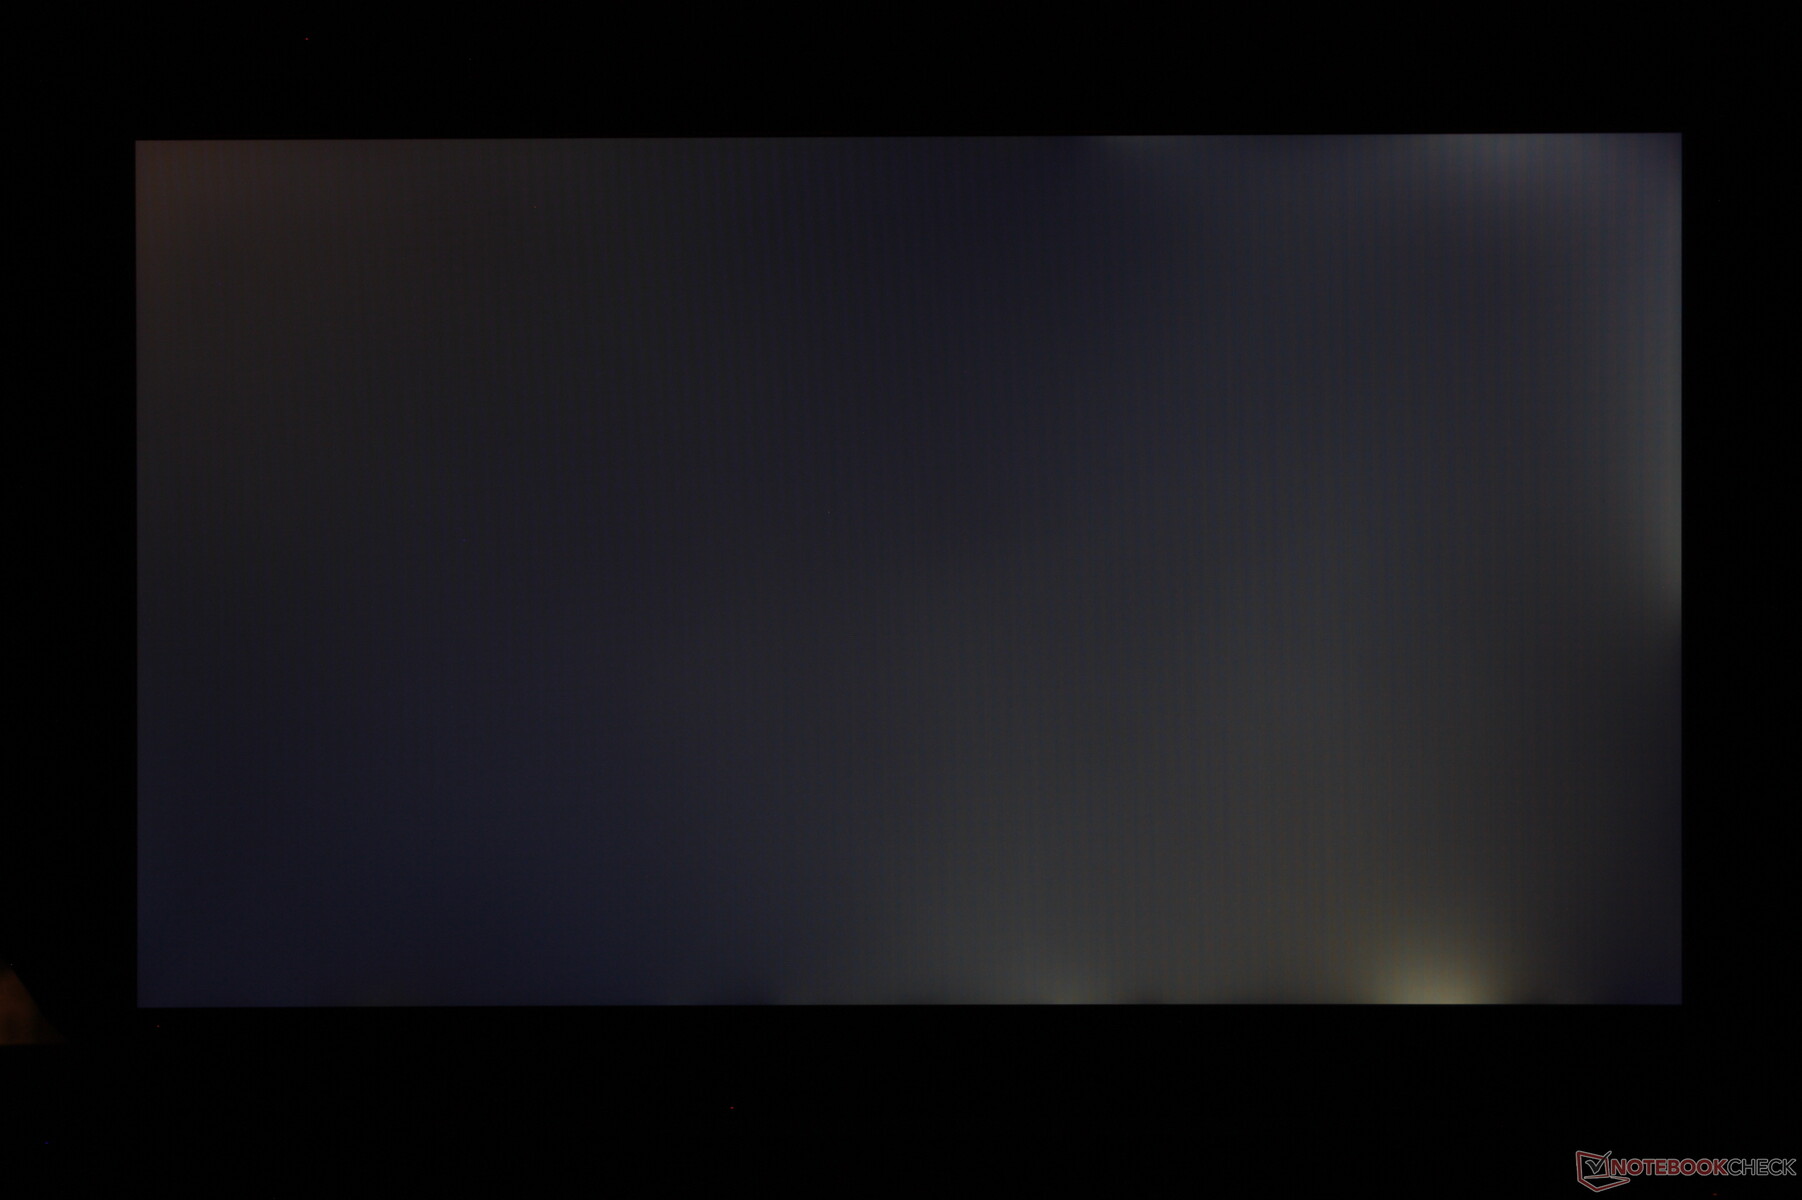
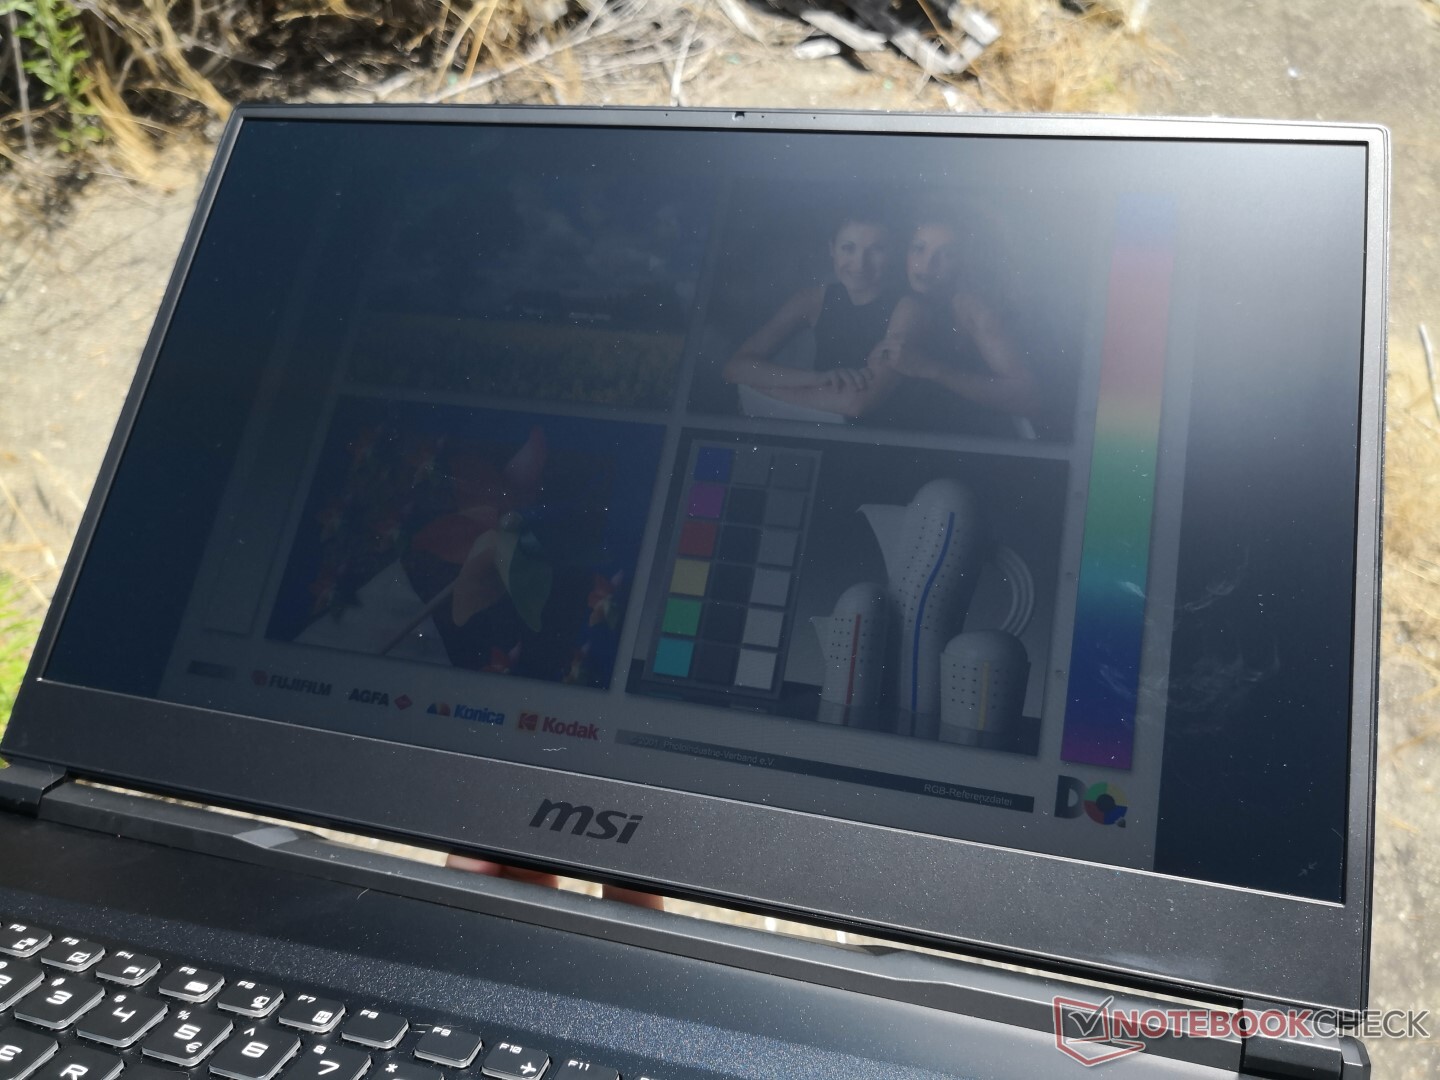
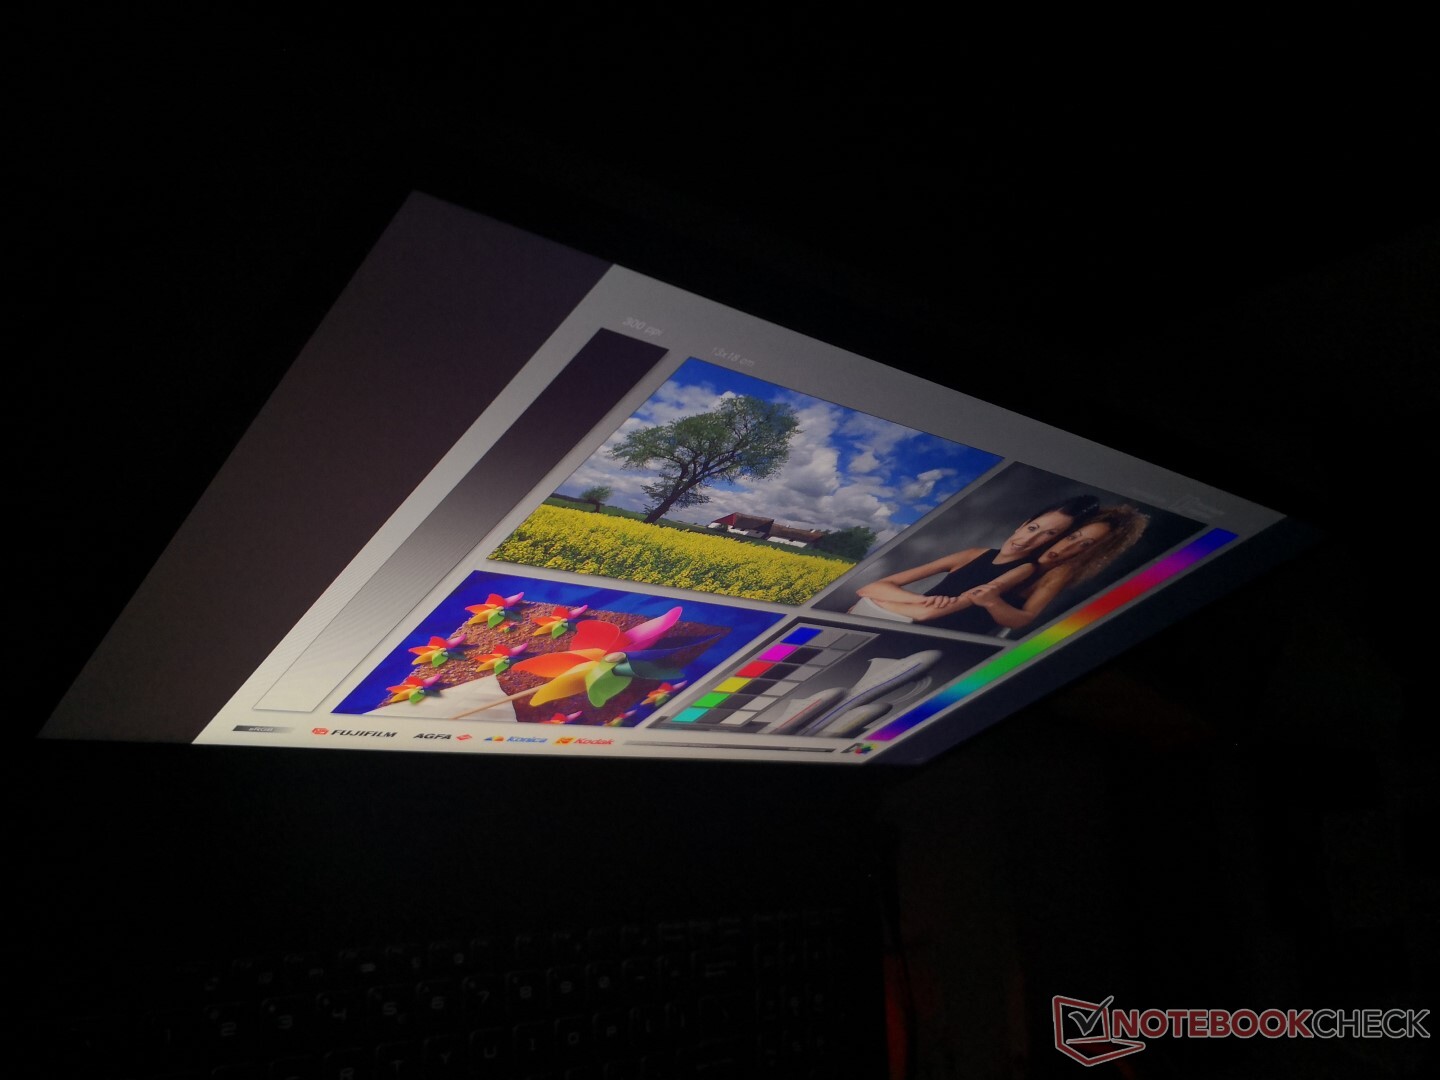
La modulación de ancho de pulso está presente en niveles de brillo muy bajos y nos decepciona ver que la luz de fondo moderada sangra por los bordes y las esquinas, especialmente en un portátil para juegos tan caro. Este es definitivamente un aspecto que MSI debe mejorar en el futuro.
| |||||||||||||||||||||||||
iluminación: 81 %
Brillo con batería: 337.9 cd/m²
Contraste: 1165:1 (Negro: 0.29 cd/m²)
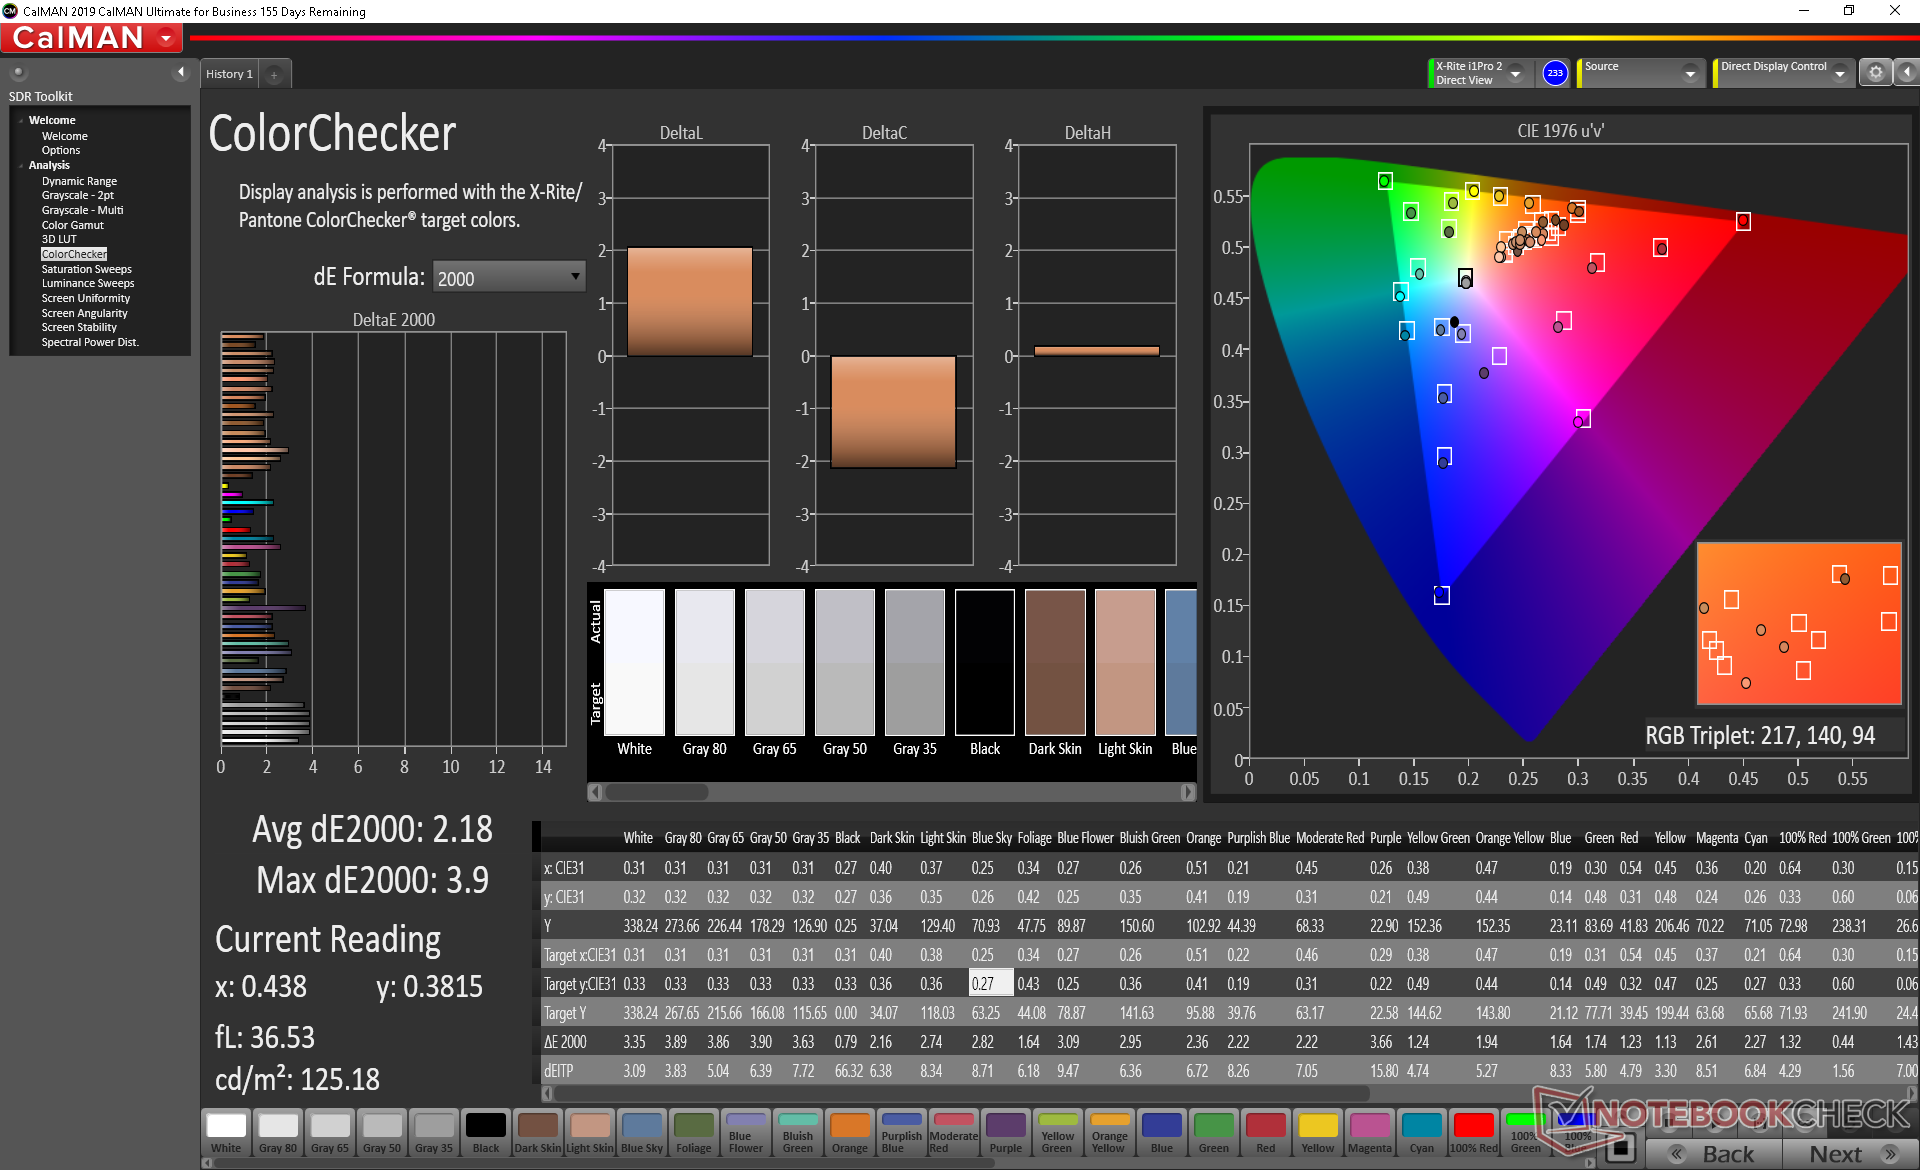
ΔE ColorChecker Calman: 2.18 | ∀{0.5-29.43 Ø4.73}
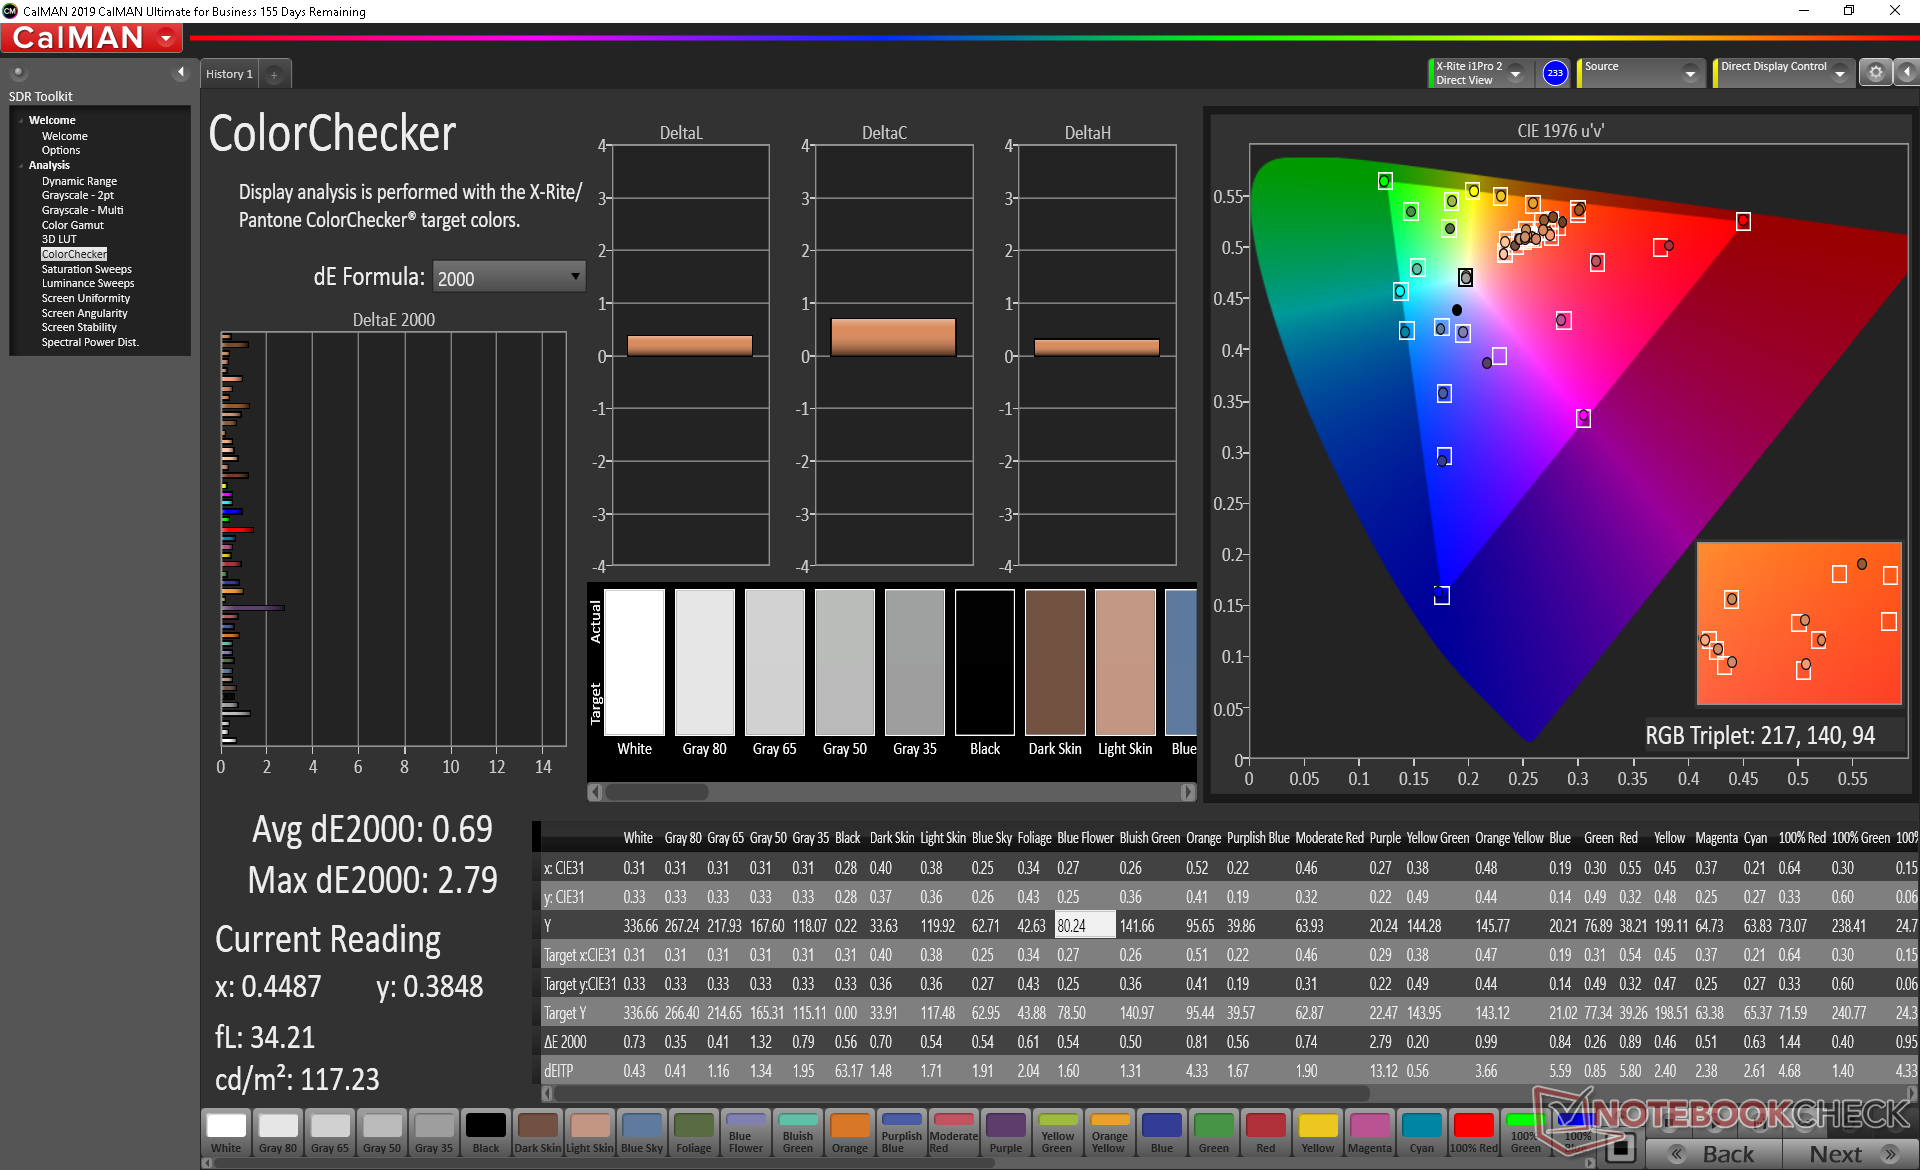
calibrated: 0.69
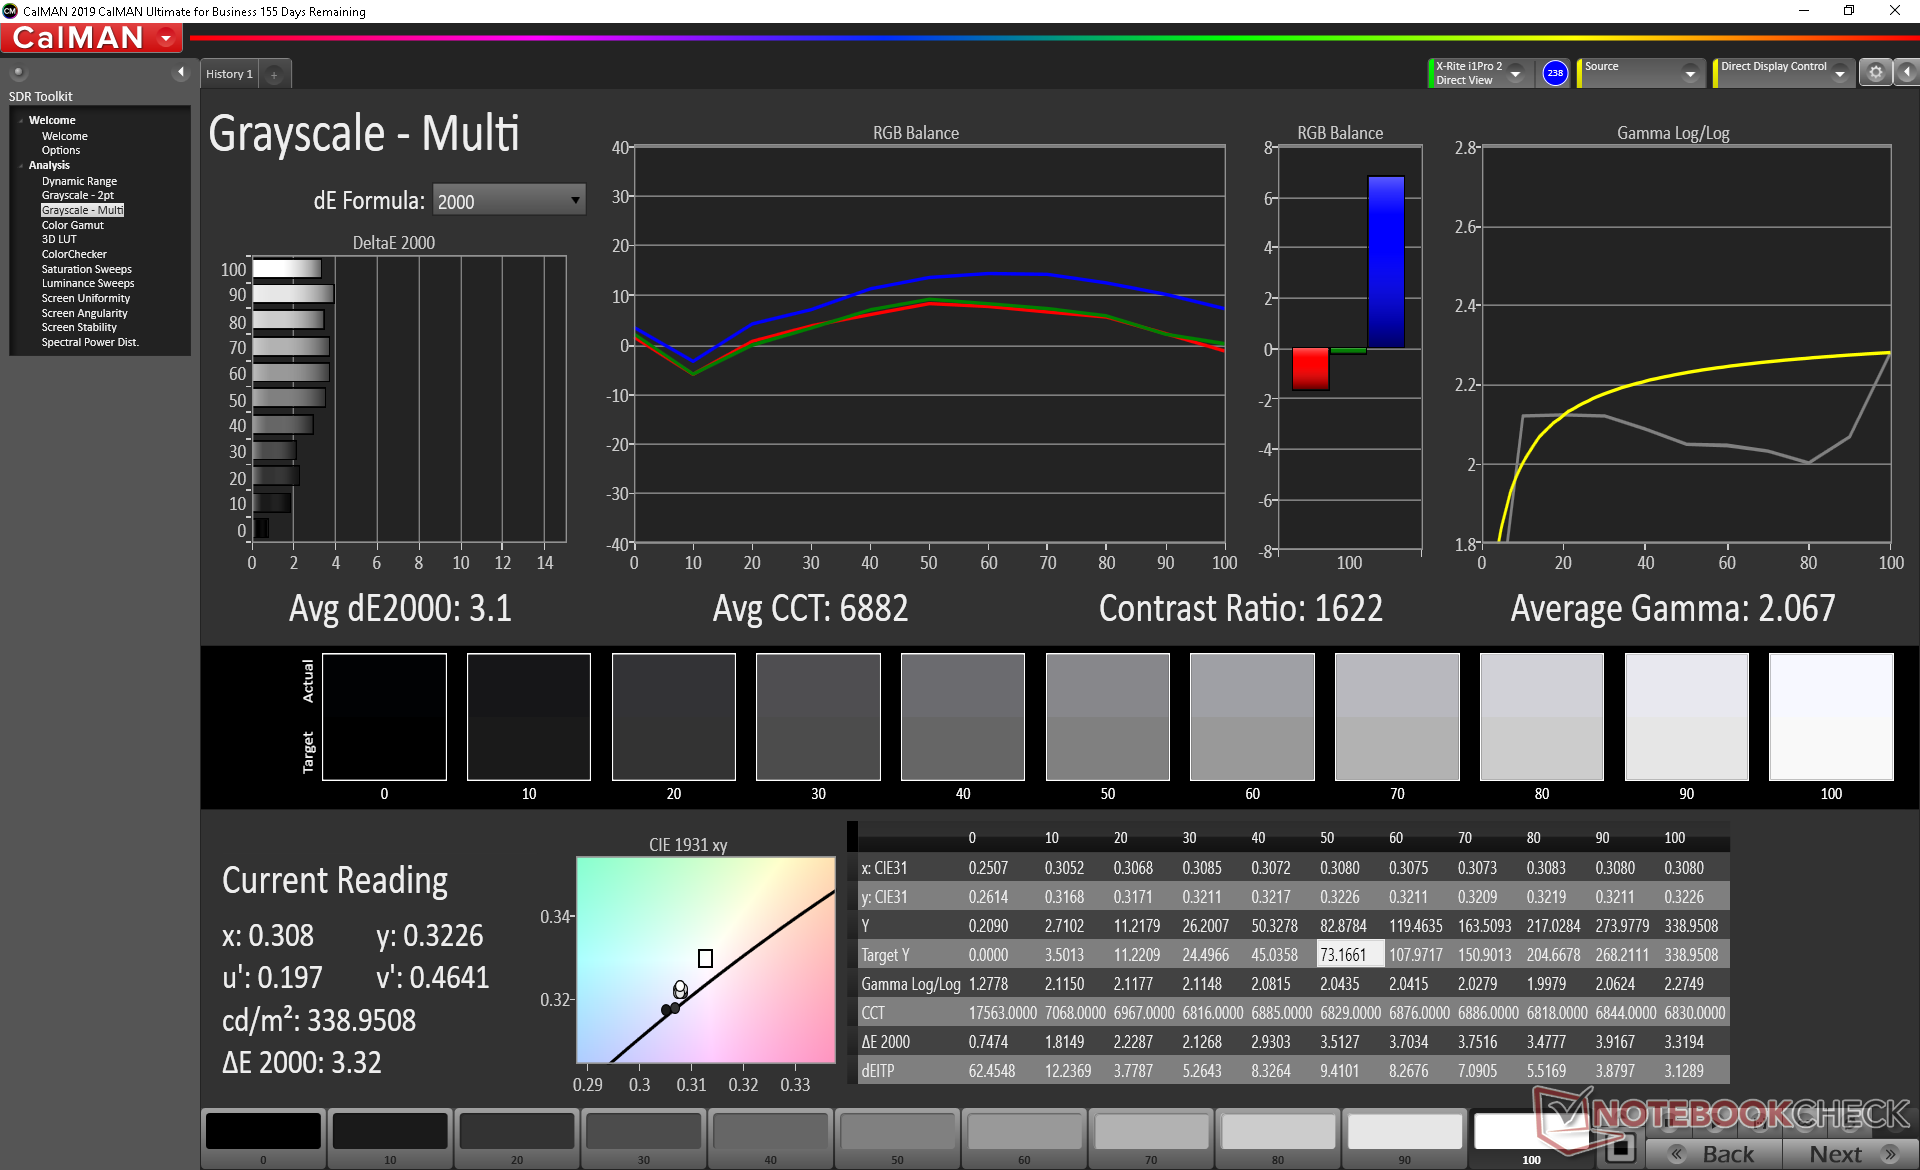
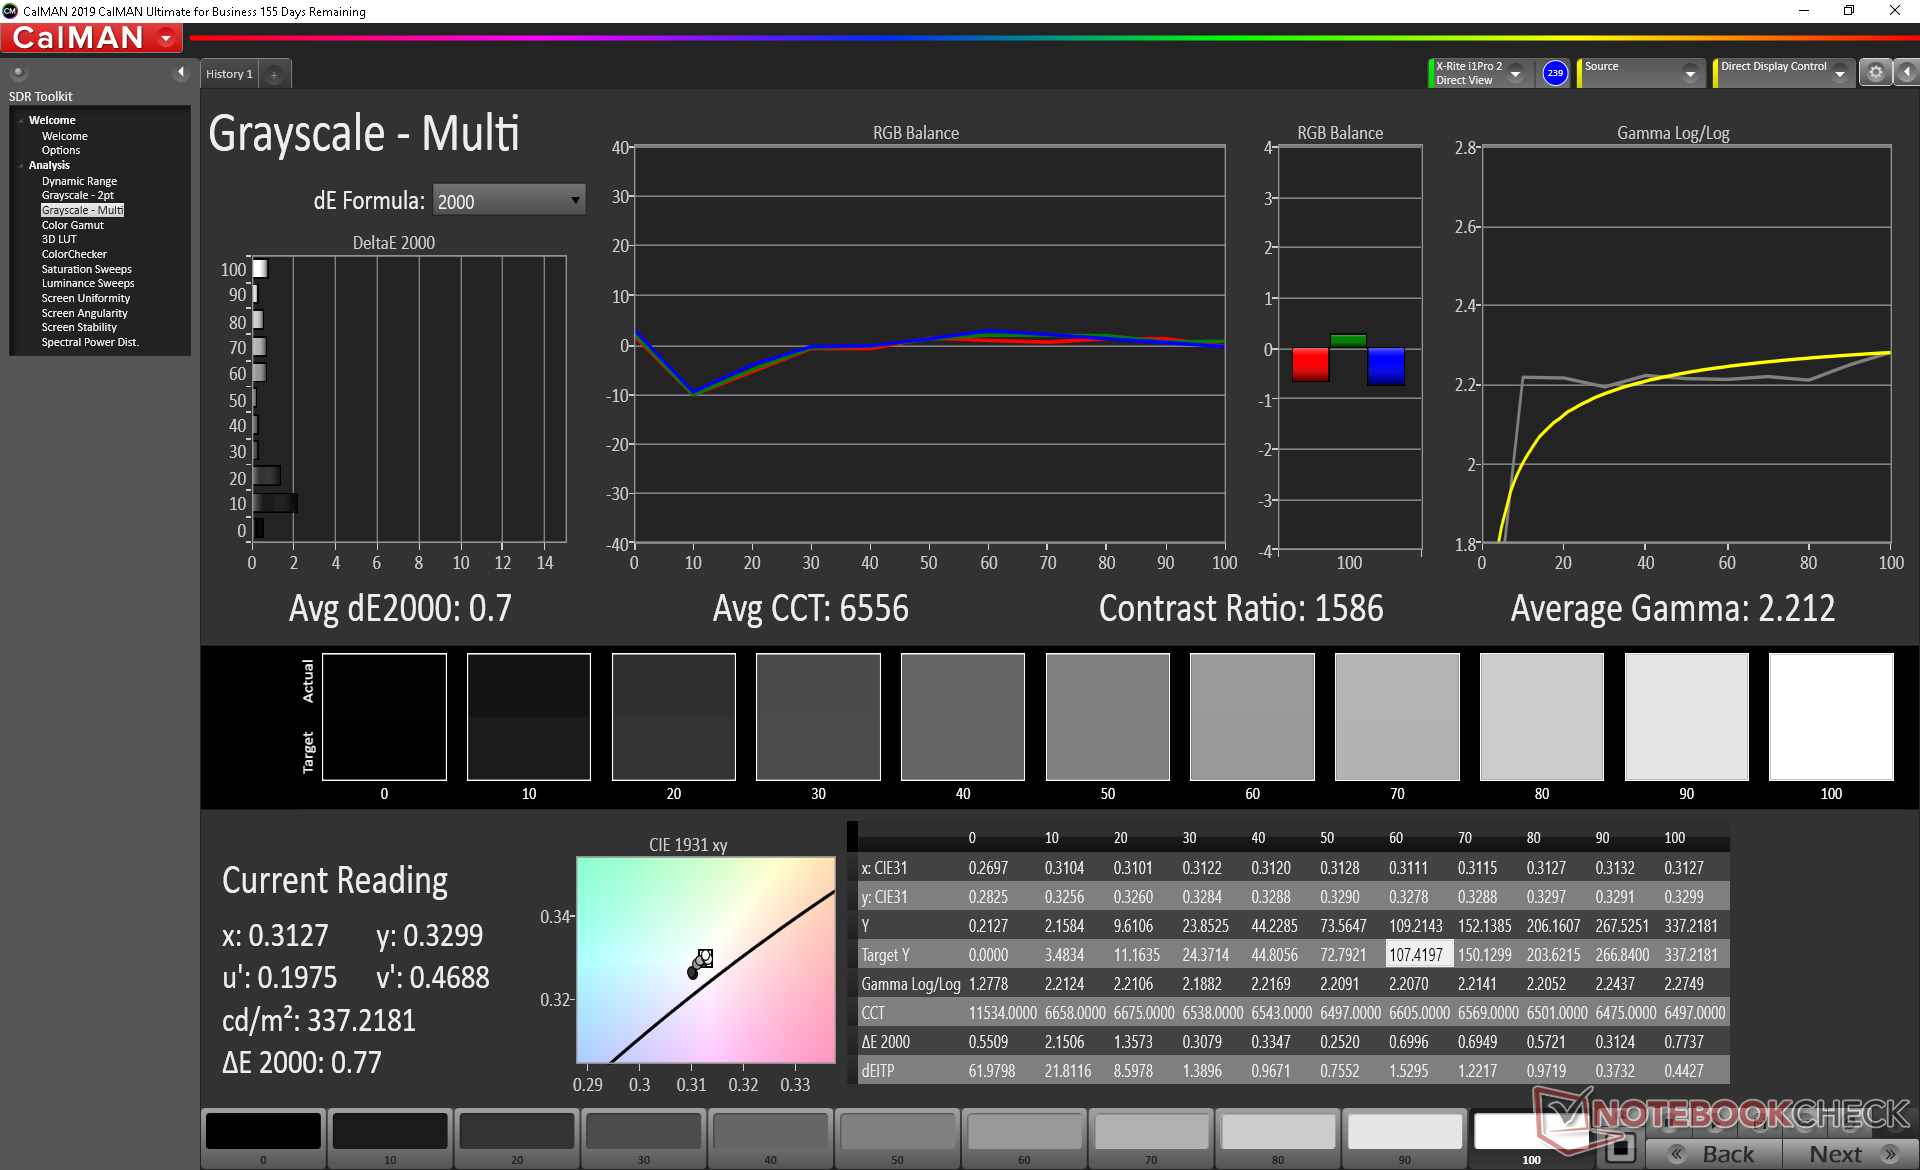
ΔE Greyscale Calman: 3.1 | ∀{0.09-98 Ø4.97}
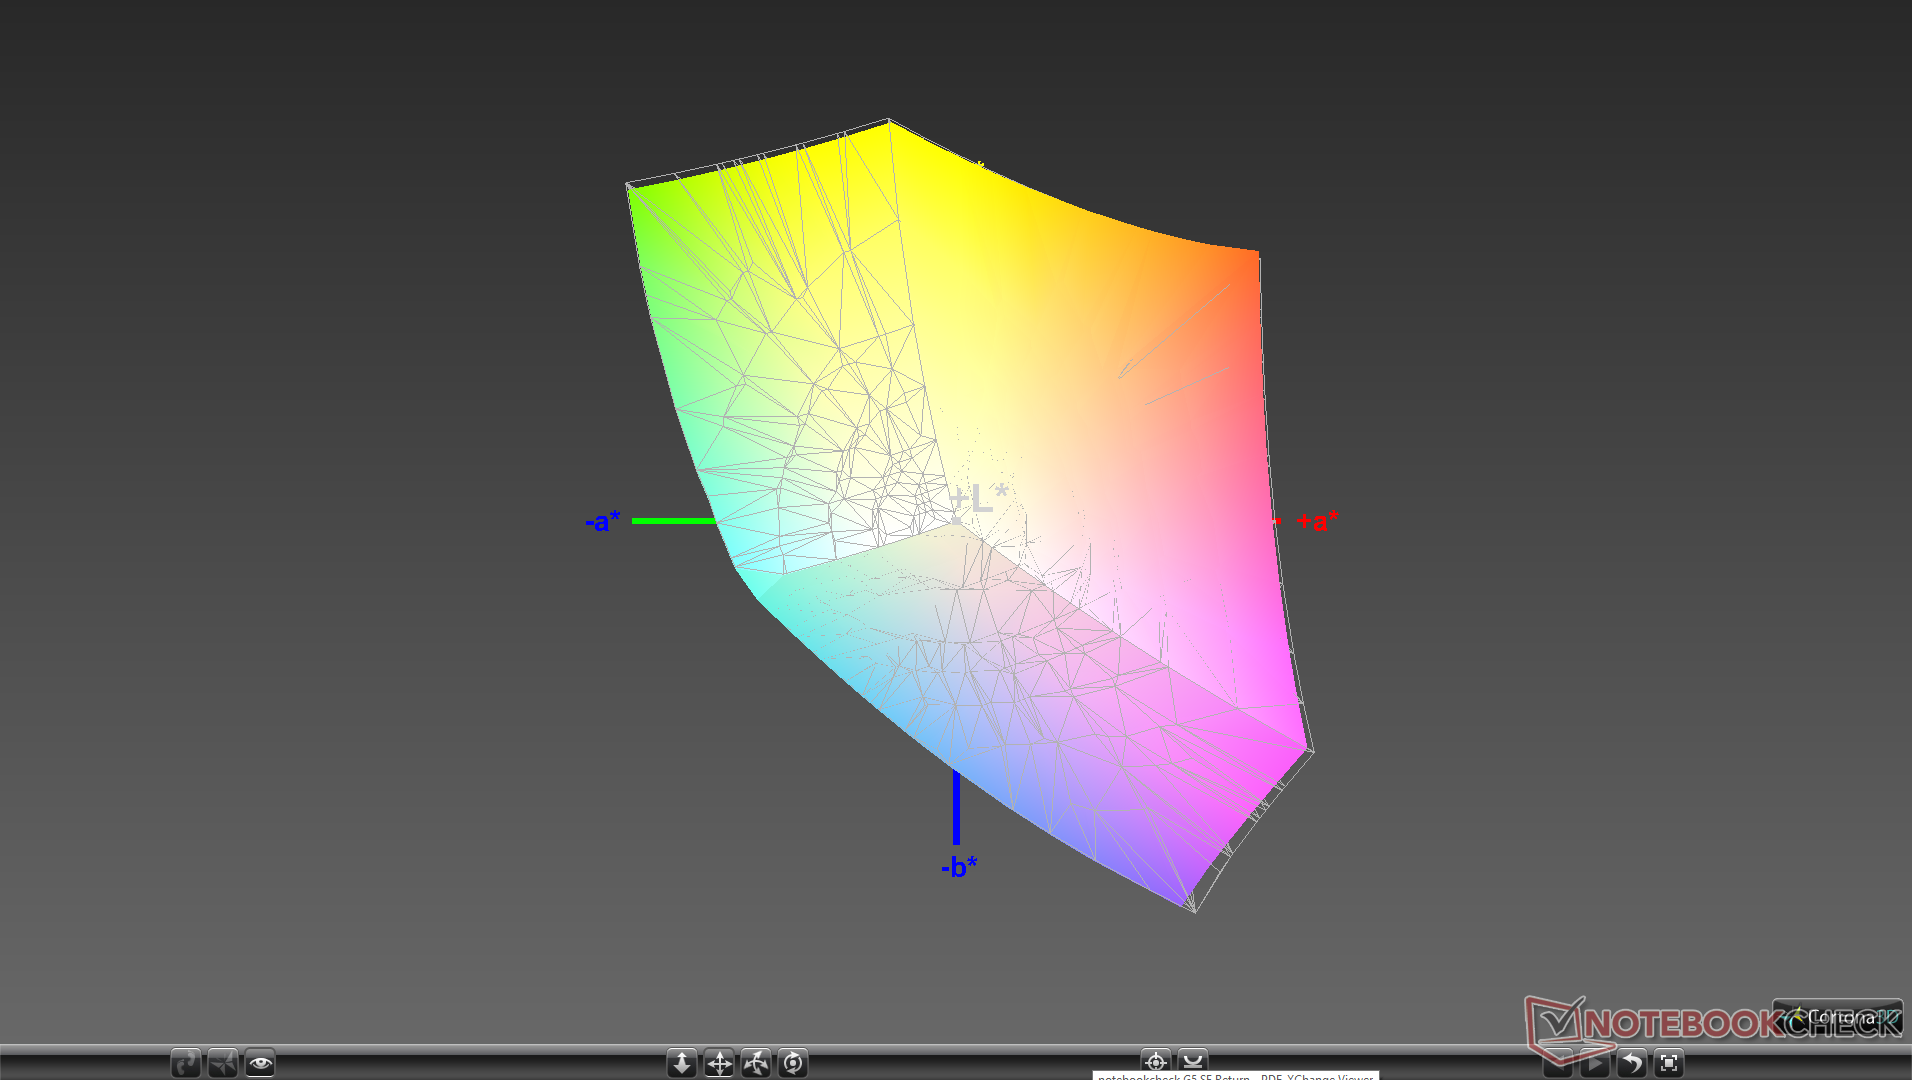
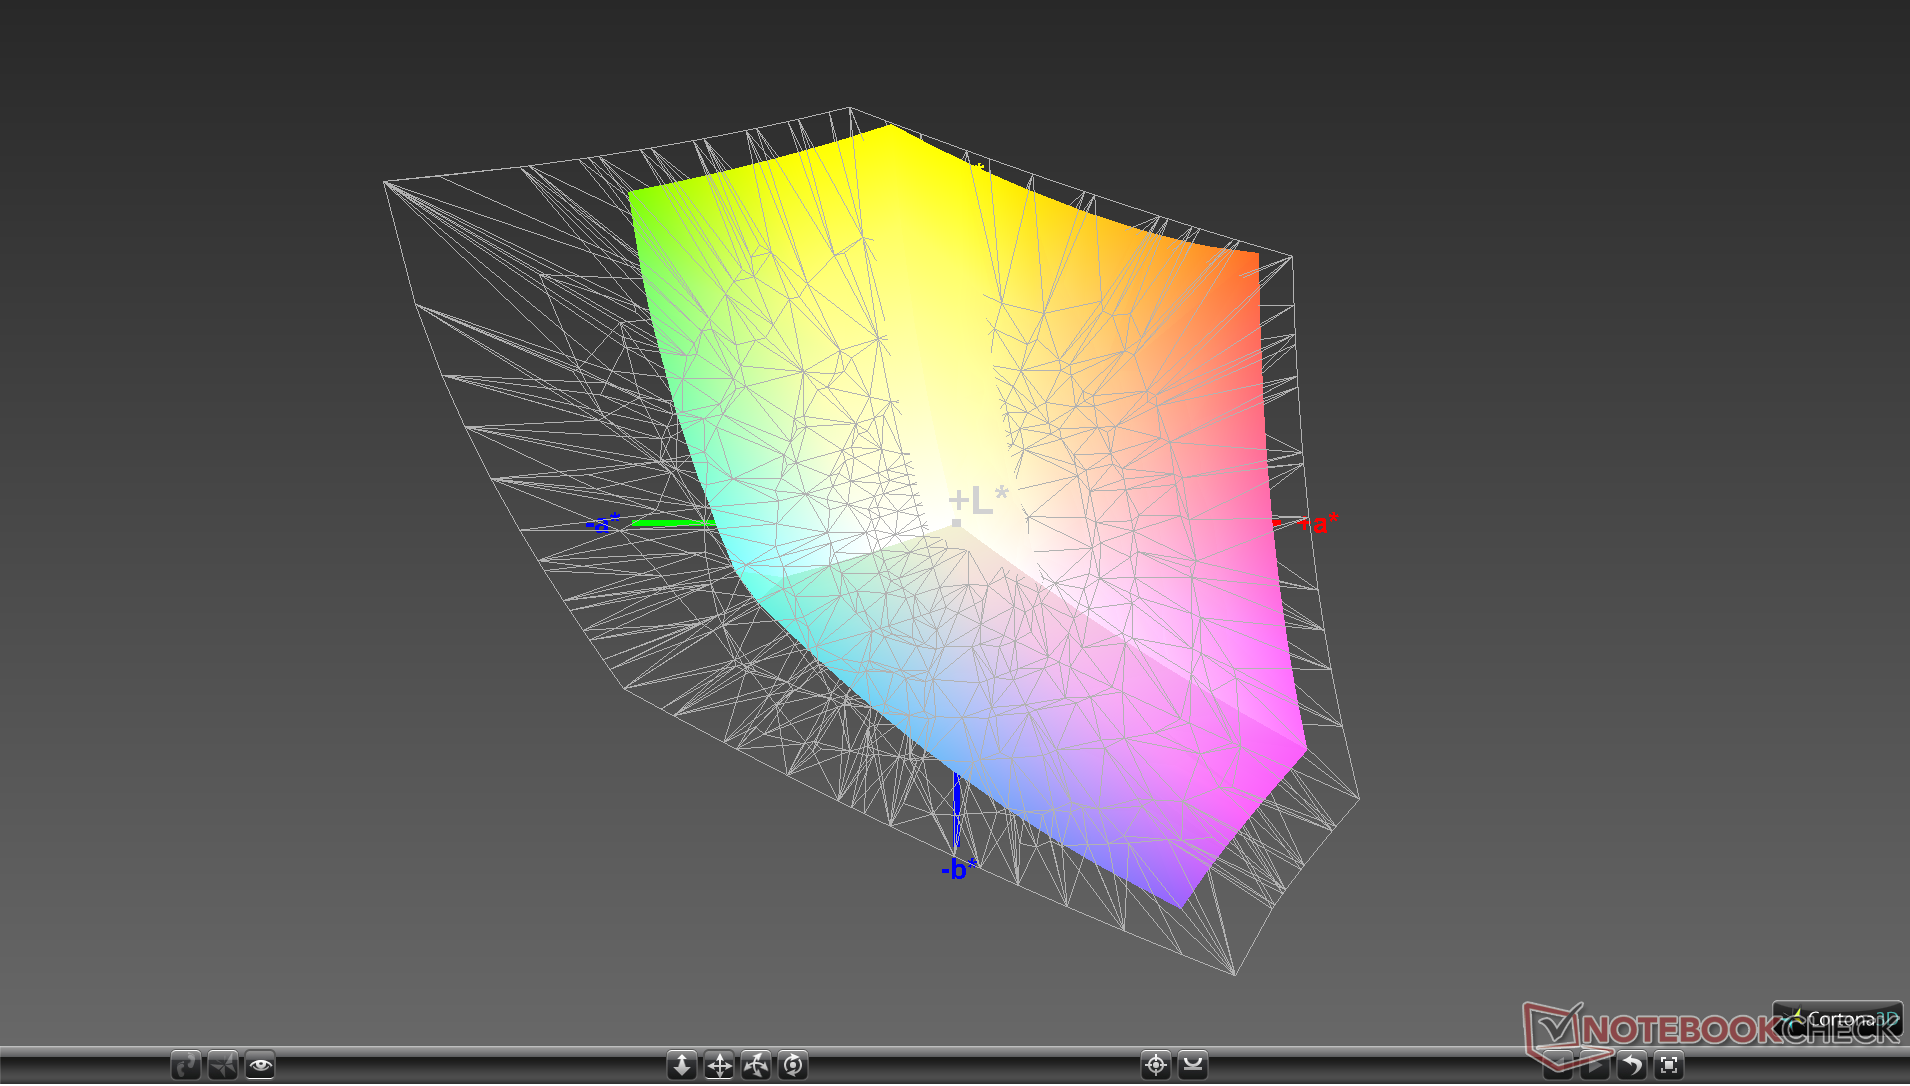
98.2% sRGB (Argyll 1.6.3 3D)
62% AdobeRGB 1998 (Argyll 1.6.3 3D)
67.8% AdobeRGB 1998 (Argyll 3D)
98.1% sRGB (Argyll 3D)
65.6% Display P3 (Argyll 3D)
Gamma: 2.07
CCT: 6882 K
| MSI GE75 Raider 10SE-008US Chi Mei N173HCE-G33, IPS, 17.3", 1920x1080 | MSI GS75 Stealth 9SG Chi Mei N173HCE-G33 (CMN175C), IPS, 17.3", 1920x1080 | Asus Strix Hero III G731GV AU Optronics AUO B173HAN04.0, IPS, 17.3", 1920x1080 | Lenovo Legion Y740-17IRH LG Philips LP173WFG-SPD2 (LGD05E0), IPS, 17.3", 1920x1080 | Razer Blade Pro 17 RTX 2060 AU Optronics B173HAN04.0, IPS, 17.3", 1920x1080 | Aorus 17G XB AU Optronics B173HAN05.0 (AUO509D), IPS, 17.3", 1920x1080 | |
|---|---|---|---|---|---|---|
| Display | -5% | -7% | -2% | -8% | 5% | |
| Display P3 Coverage (%) | 65.6 | 62.6 -5% | 62.9 -4% | 64.8 -1% | 61.1 -7% | 70.6 8% |
| sRGB Coverage (%) | 98.1 | 93.5 -5% | 87.2 -11% | 96 -2% | 89.4 -9% | 97.2 -1% |
| AdobeRGB 1998 Coverage (%) | 67.8 | 64.7 -5% | 63.8 -6% | 65.8 -3% | 62.5 -8% | 72.8 7% |
| Response Times | -10% | -18% | -73% | 0% | -86% | |
| Response Time Grey 50% / Grey 80% * (ms) | 6.8 ? | 7.2 ? -6% | 6.8 ? -0% | 14.8 ? -118% | 6.8 ? -0% | 16 ? -135% |
| Response Time Black / White * (ms) | 8.8 ? | 10 ? -14% | 12 ? -36% | 11.2 ? -27% | 8.8 ? -0% | 12 ? -36% |
| PWM Frequency (Hz) | 25000 ? | 25510 ? | ||||
| Screen | 11% | -52% | -24% | -30% | 11% | |
| Brightness middle (cd/m²) | 337.9 | 366 8% | 312.3 -8% | 282 -17% | 300.4 -11% | 293 -13% |
| Brightness (cd/m²) | 305 | 343 12% | 297 -3% | 261 -14% | 289 -5% | 285 -7% |
| Brightness Distribution (%) | 81 | 91 12% | 91 12% | 87 7% | 93 15% | 95 17% |
| Black Level * (cd/m²) | 0.29 | 0.29 -0% | 0.21 28% | 0.27 7% | 0.32 -10% | 0.24 17% |
| Contrast (:1) | 1165 | 1262 8% | 1487 28% | 1044 -10% | 939 -19% | 1221 5% |
| Colorchecker dE 2000 * | 2.18 | 1.51 31% | 3.6 -65% | 3.18 -46% | 2.32 -6% | 1.27 42% |
| Colorchecker dE 2000 max. * | 3.9 | 3.22 17% | 6.74 -73% | 8.39 -115% | 3.81 2% | 2.24 43% |
| Colorchecker dE 2000 calibrated * | 0.69 | 0.71 -3% | 3.95 -472% | 0.95 -38% | 2.95 -328% | 1.06 -54% |
| Greyscale dE 2000 * | 3.1 | 1.93 38% | 3.1 -0% | 4.1 -32% | 1.5 52% | 1.34 57% |
| Gamma | 2.07 106% | 2.38 92% | 2.26 97% | 2.55 86% | 2.3 96% | 2.38 92% |
| CCT | 6882 94% | 6881 94% | 7002 93% | 7260 90% | 6764 96% | 6542 99% |
| Color Space (Percent of AdobeRGB 1998) (%) | 62 | 60 -3% | 56.6 -9% | 61 -2% | 57.4 -7% | 73 18% |
| Color Space (Percent of sRGB) (%) | 98.2 | 94 -4% | 86.6 -12% | 96 -2% | 89 -9% | 94 -4% |
| Media total (Programa/Opciones) | -1% /
5% | -26% /
-39% | -33% /
-26% | -13% /
-22% | -23% /
-2% |
* ... más pequeño es mejor
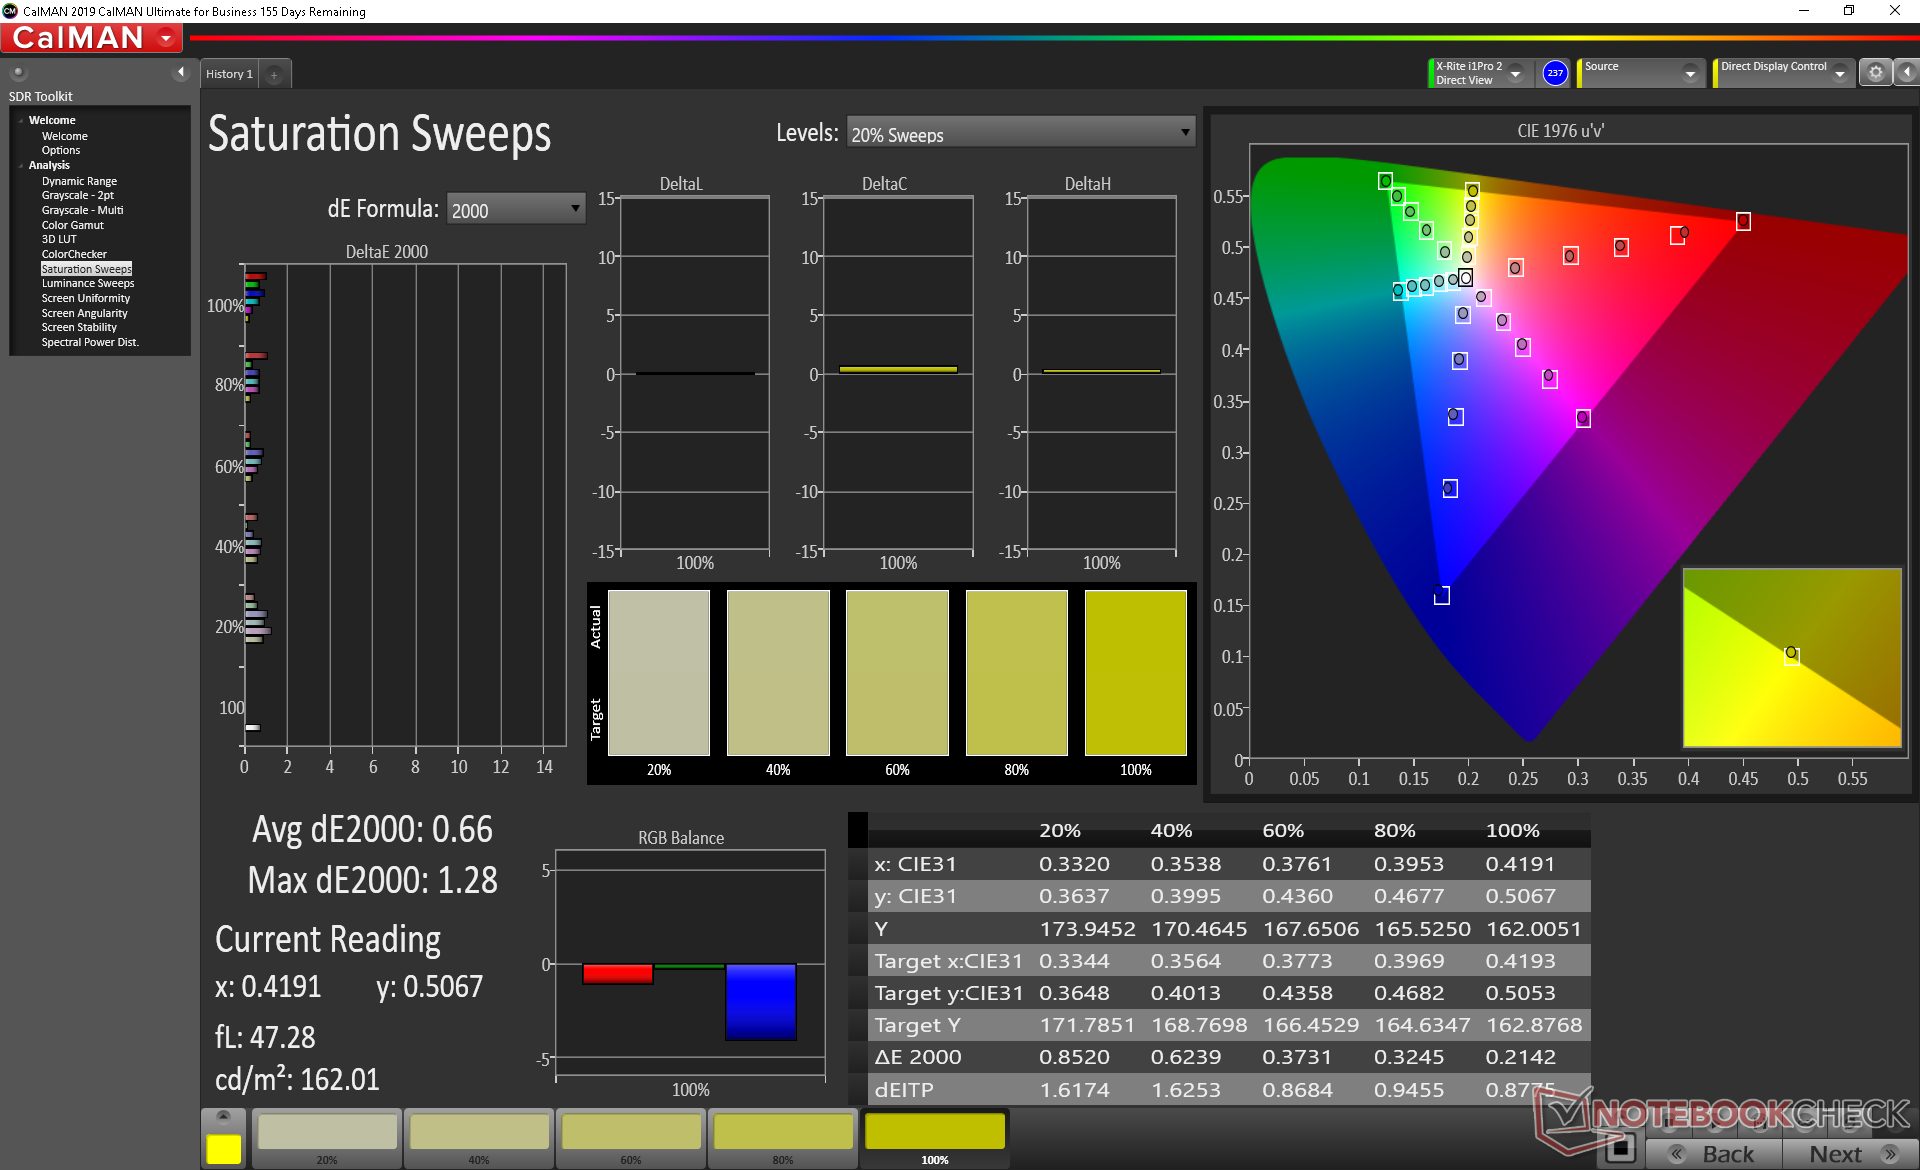
El espacio de color cubre todo el sRGB, que es típico de la mayoría de los portátiles para juegos de alta gama en estos días. Otros modelos como el Gigabyte Aorus 17G XB pueden ofrecer opciones de color más profundas, pero suelen tener tiempos de respuesta más lentos.
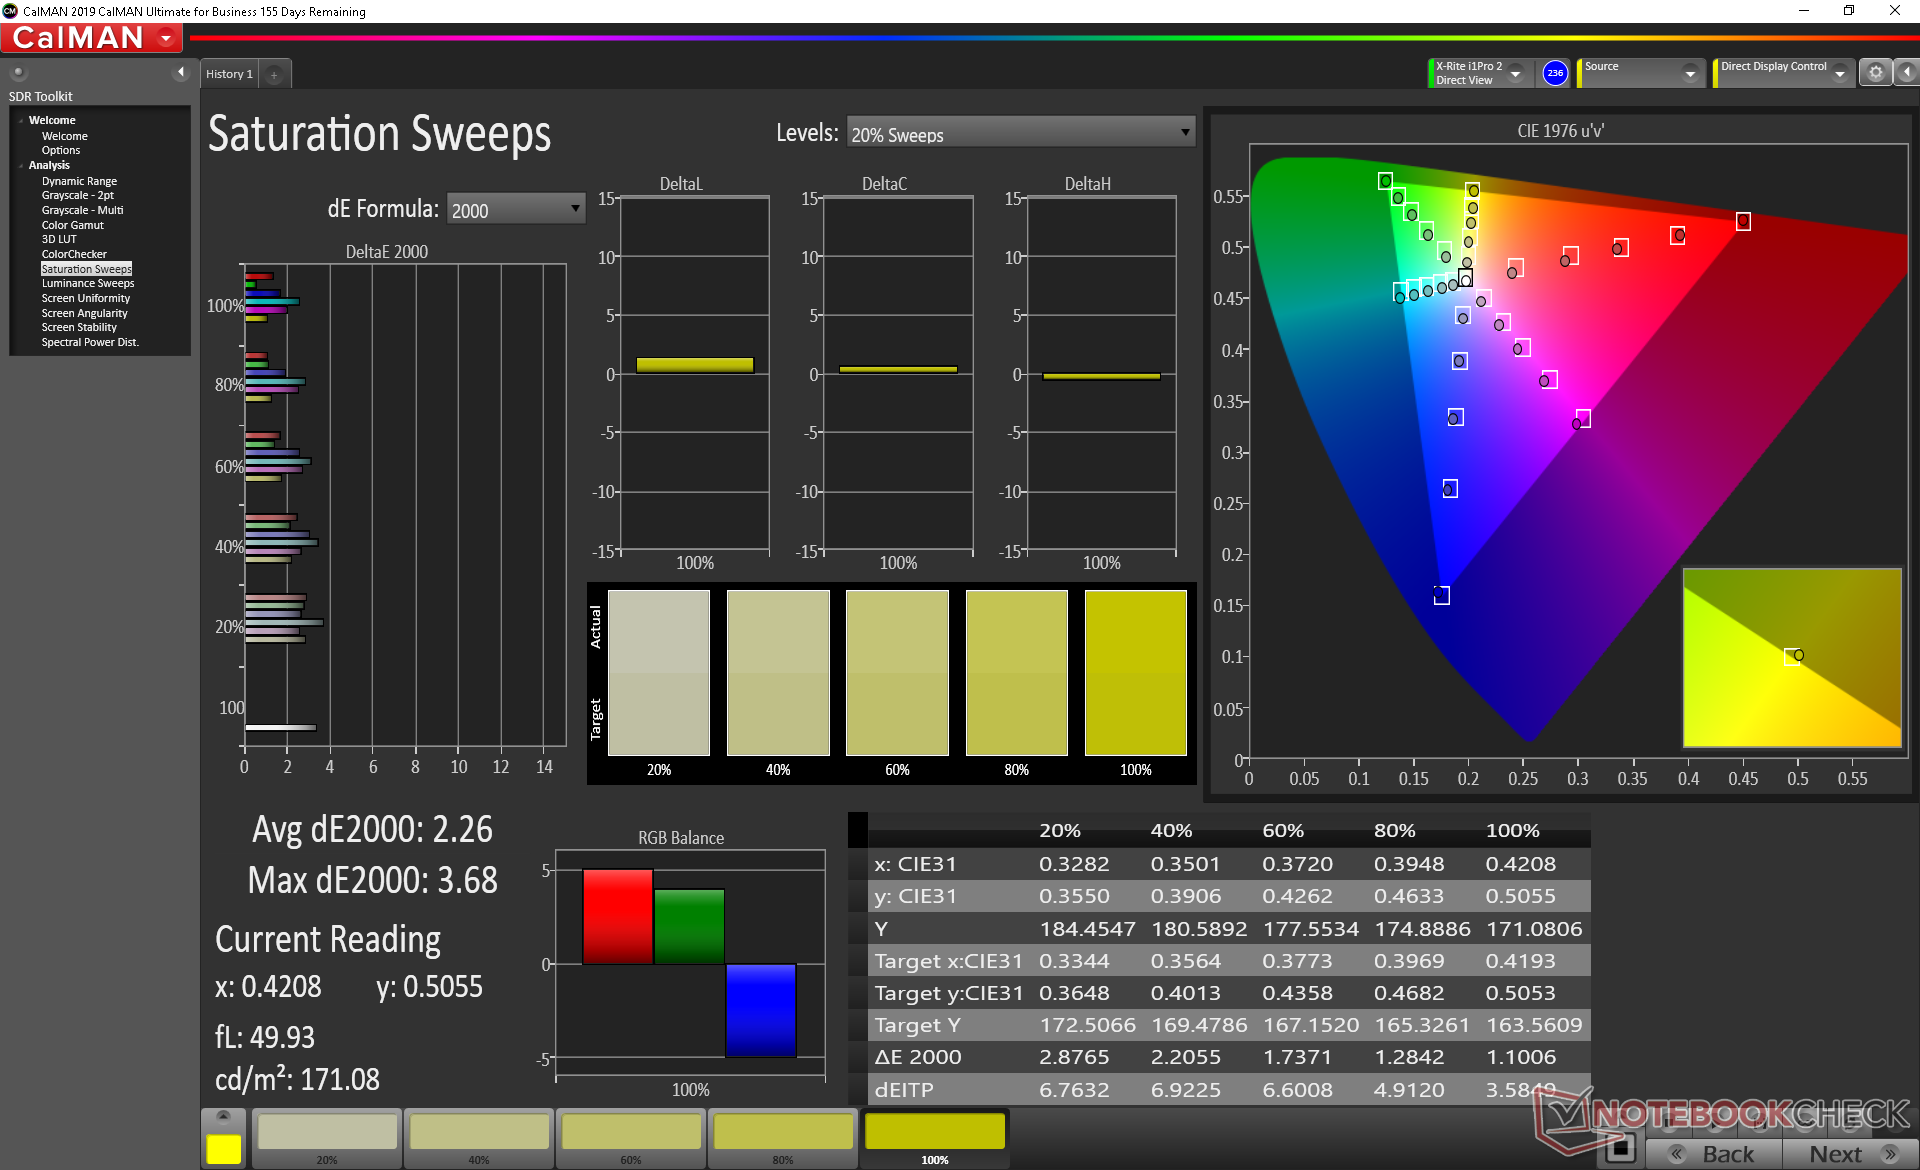
Las mediciones con un colorímetro muestran una pantalla bien calibrada fuera de la caja. Calibrar el panel nosotros mismos mejoraría la escala de grises y los colores aún más con valores finales promedio de DeltaE de sólo 0,7 y 0,69, respectivamente, contra el espectro sRGB.
Tiempos de respuesta del display
| ↔ Tiempo de respuesta de Negro a Blanco | ||
|---|---|---|
| 8.8 ms ... subida ↗ y bajada ↘ combinada | ↗ 4.4 ms subida | 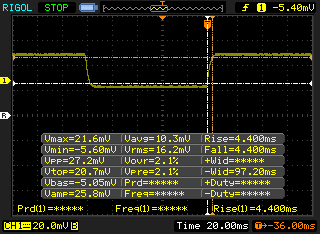 |
| ↘ 4.4 ms bajada | ||
| La pantalla mostró tiempos de respuesta rápidos en nuestros tests y debería ser adecuada para juegos. En comparación, todos los dispositivos de prueba van de ##min### (mínimo) a 240 (máximo) ms. » 24 % de todos los dispositivos son mejores. Esto quiere decir que el tiempo de respuesta medido es mejor que la media (19.9 ms) de todos los dispositivos testados. | ||
| ↔ Tiempo de respuesta 50% Gris a 80% Gris | ||
| 6.8 ms ... subida ↗ y bajada ↘ combinada | ↗ 3.4 ms subida | 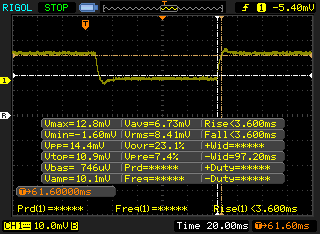 |
| ↘ 3.4 ms bajada | ||
| La pantalla mostró tiempos de respuesta muy rápidos en nuestros tests y debería ser adecuada para juegos frenéticos. En comparación, todos los dispositivos de prueba van de ##min### (mínimo) a 636 (máximo) ms. » 19 % de todos los dispositivos son mejores. Esto quiere decir que el tiempo de respuesta medido es mejor que la media (31.1 ms) de todos los dispositivos testados. | ||
Parpadeo de Pantalla / PWM (Pulse-Width Modulation)
| Parpadeo de Pantalla / PWM detectado | 25000 Hz | ≤ 18 % de brillo | 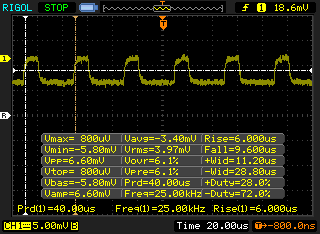 |
La retroiluminación del display parpadea a 25000 Hz (seguramente usa PWM - Pulse-Width Modulation) a un brillo del 18 % e inferior. Sobre este nivel de brillo no debería darse parpadeo / PWM. La frecuencia de 25000 Hz es bastante alta, por lo que la mayoría de gente sensible al parpadeo no debería ver parpadeo o tener fatiga visual. Comparación: 52 % de todos los dispositivos testados no usaron PWM para atenuar el display. Si se usó, medimos una media de 7794 (mínimo: 5 - máxmo: 343500) Hz. | |||
Rendimiento
Procesador
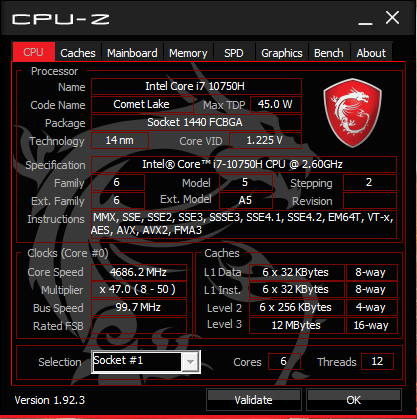
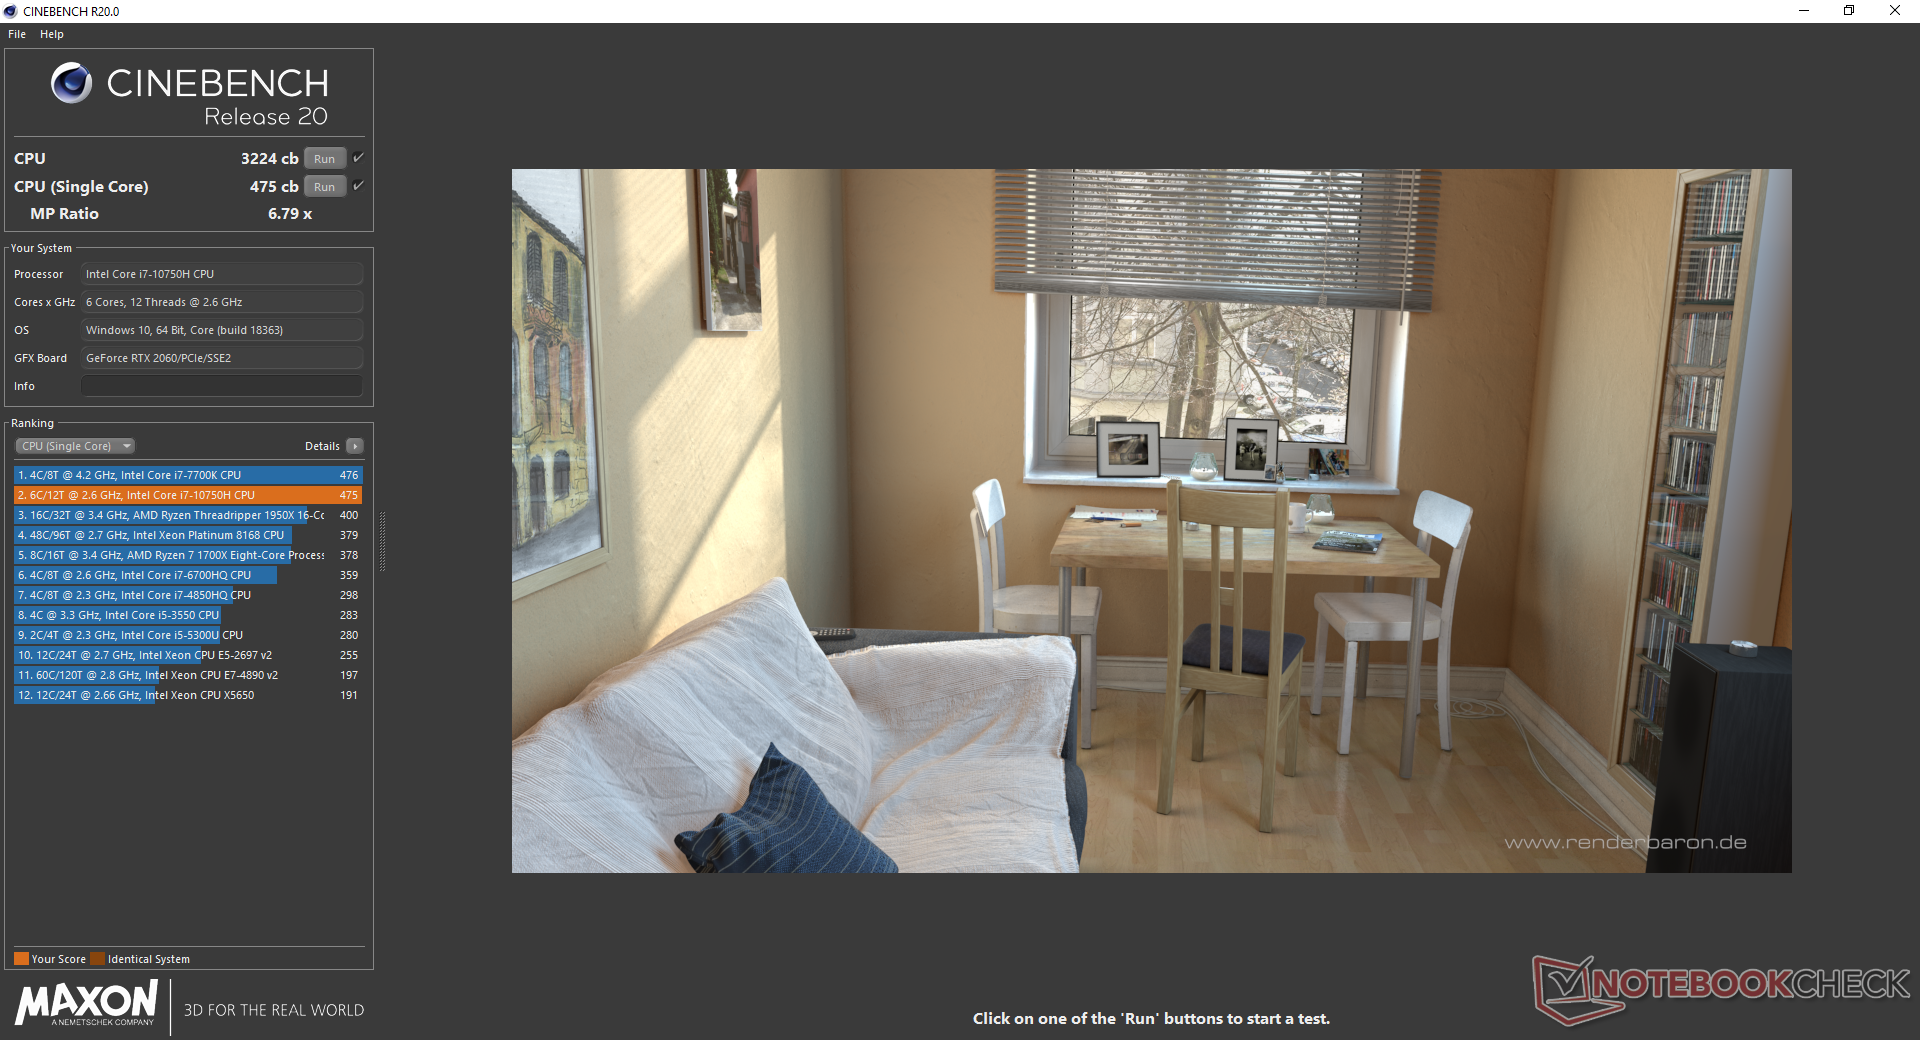
El rendimiento de la CPU está donde esperamos que esté en relación con otros portátiles Core i7-10750H, si no es ligeramente más rápido. Los usuarios verán un rendimiento multi-hilo un 15 o un 45 por ciento más rápido si se actualizan desde el Core i7-9750H o el Core i7-8750H, respectivamente. El rendimiento bruto está más o menos a la par con el menos costoso AMD Ryzen 5 4600H. MSI ofrece las opciones Core i7-10875H y Core i9-10980HK también para un rendimiento multihilo aproximadamente un 10 y un 25 por ciento más rápido, respectivamente.
Consulte nuestra página dedicada al Core i7-10750H para obtener más información técnica y comparaciones de referencia.
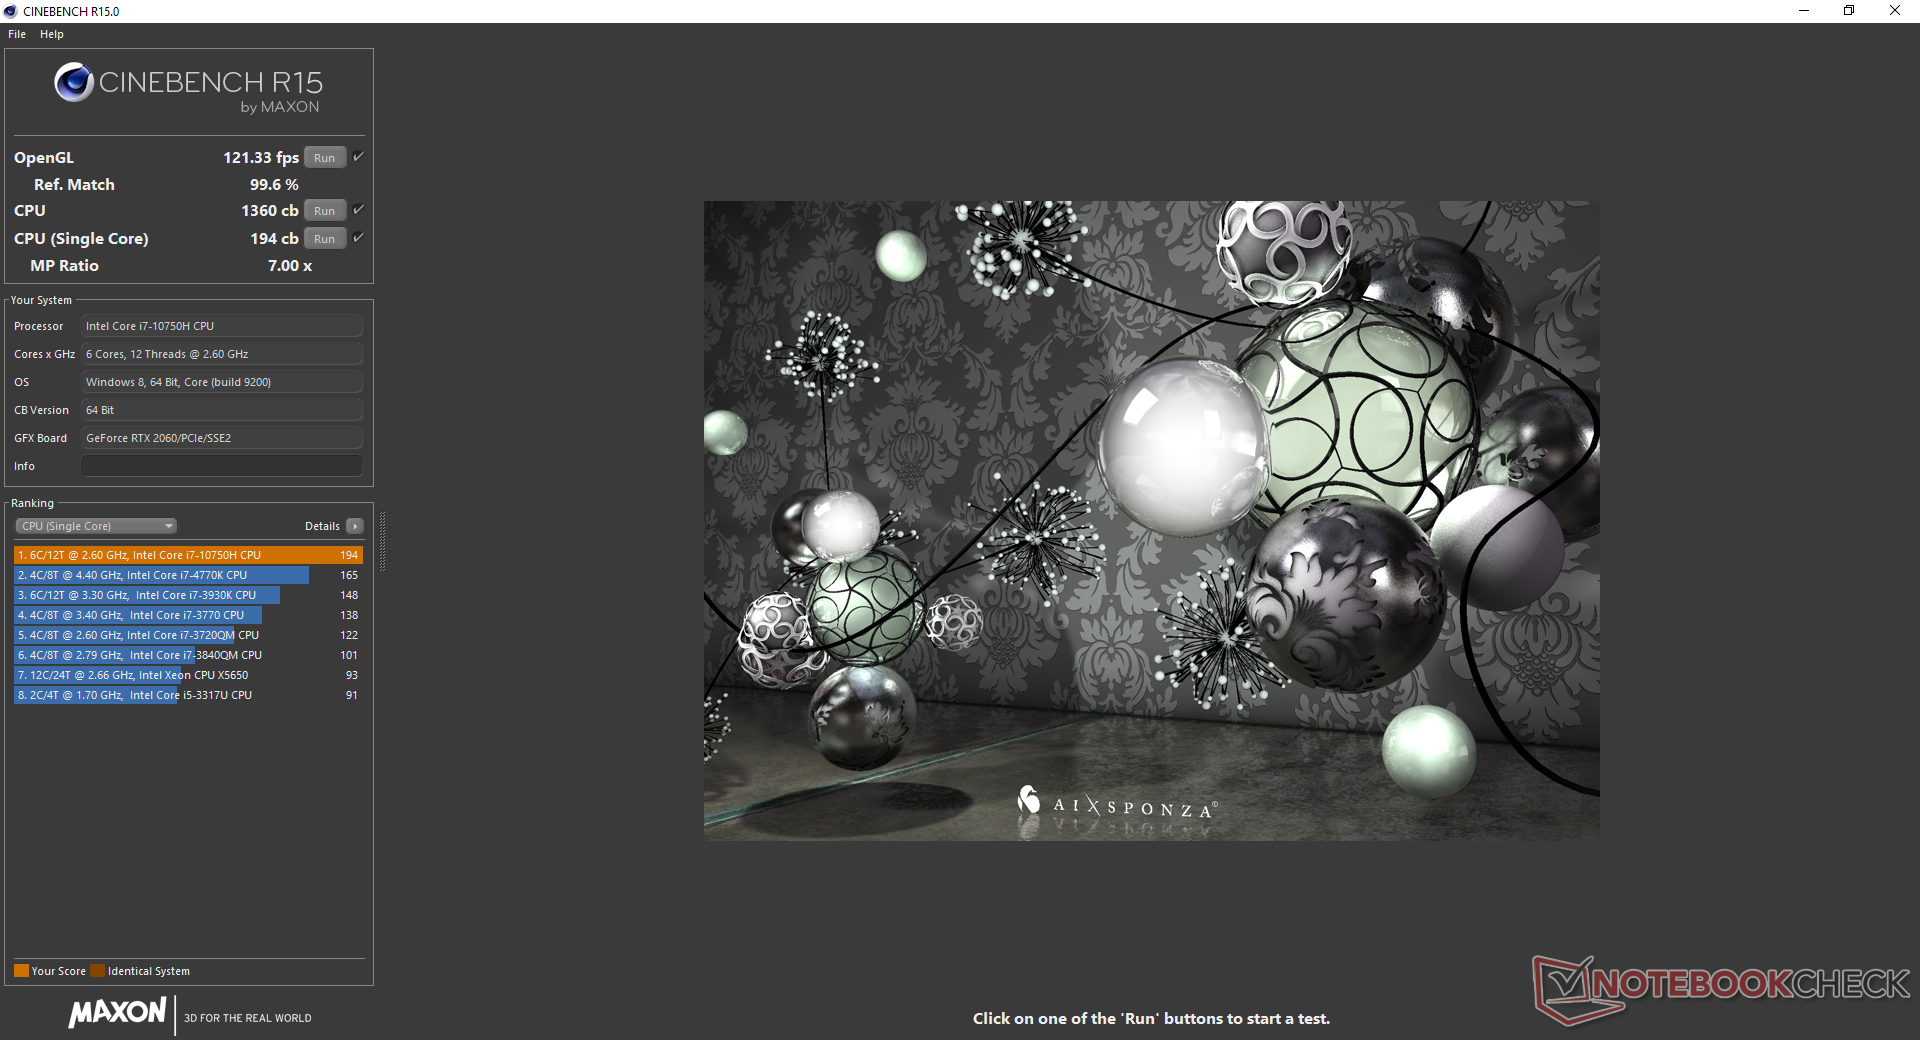
Cinebench R15: CPU Multi 64Bit | CPU Single 64Bit
Blender: v2.79 BMW27 CPU
7-Zip 18.03: 7z b 4 -mmt1 | 7z b 4
Geekbench 5.5: Single-Core | Multi-Core
HWBOT x265 Benchmark v2.2: 4k Preset
LibreOffice : 20 Documents To PDF
R Benchmark 2.5: Overall mean
| Geekbench 5.5 / Single-Core | |
| MSI GE66 Raider 10SFS | |
| Razer Blade Pro 17 RTX 2070 Max-Q 300 Hz | |
| Medio Intel Core i7-10750H (1114 - 1333, n=43) | |
| MSI GE75 Raider 10SE-008US | |
| MSI Bravo 17 A4DDR | |
| MSI GF75 Thin 10SCXR | |
| Lenovo Legion Y740-17IRHg-81UJ001VGE | |
| Acer Nitro 5 AN515-44-R5FT | |
| Geekbench 5.5 / Multi-Core | |
| MSI GE66 Raider 10SFS | |
| MSI Bravo 17 A4DDR | |
| Razer Blade Pro 17 RTX 2070 Max-Q 300 Hz | |
| MSI GE75 Raider 10SE-008US | |
| Medio Intel Core i7-10750H (4443 - 6674, n=43) | |
| Lenovo Legion Y740-17IRHg-81UJ001VGE | |
| Acer Nitro 5 AN515-44-R5FT | |
| MSI GF75 Thin 10SCXR | |
| HWBOT x265 Benchmark v2.2 / 4k Preset | |
| MSI Bravo 17 A4DDR | |
| MSI GE66 Raider 10SFS | |
| MSI GE75 9SG | |
| MSI GE75 Raider 10SE-008US | |
| Medio Intel Core i7-10750H (5.54 - 11.6, n=43) | |
| Lenovo Legion Y740-17IRHg-81UJ001VGE | |
| Acer Nitro 5 AN515-44-R5FT | |
| MSI GF75 Thin 10SCXR | |
| Asus ROG Zephyrus G15 GA502DU | |
| LibreOffice / 20 Documents To PDF | |
| MSI Bravo 17 A4DDR | |
| Acer Nitro 5 AN515-44-R5FT | |
| MSI GF75 Thin 10SCXR | |
| Razer Blade Pro 17 RTX 2070 Max-Q 300 Hz | |
| MSI GE75 Raider 10SE-008US | |
| MSI GE66 Raider 10SFS | |
| Medio Intel Core i7-10750H (43.1 - 99.2, n=43) | |
| R Benchmark 2.5 / Overall mean | |
| Lenovo Legion Y740-17IRHg-81UJ001VGE | |
| MSI GF75 Thin 10SCXR | |
| Acer Nitro 5 AN515-44-R5FT | |
| MSI GE75 Raider 10SE-008US | |
| Medio Intel Core i7-10750H (0.578 - 0.708, n=42) | |
| MSI Bravo 17 A4DDR | |
| MSI GE66 Raider 10SFS | |
* ... más pequeño es mejor
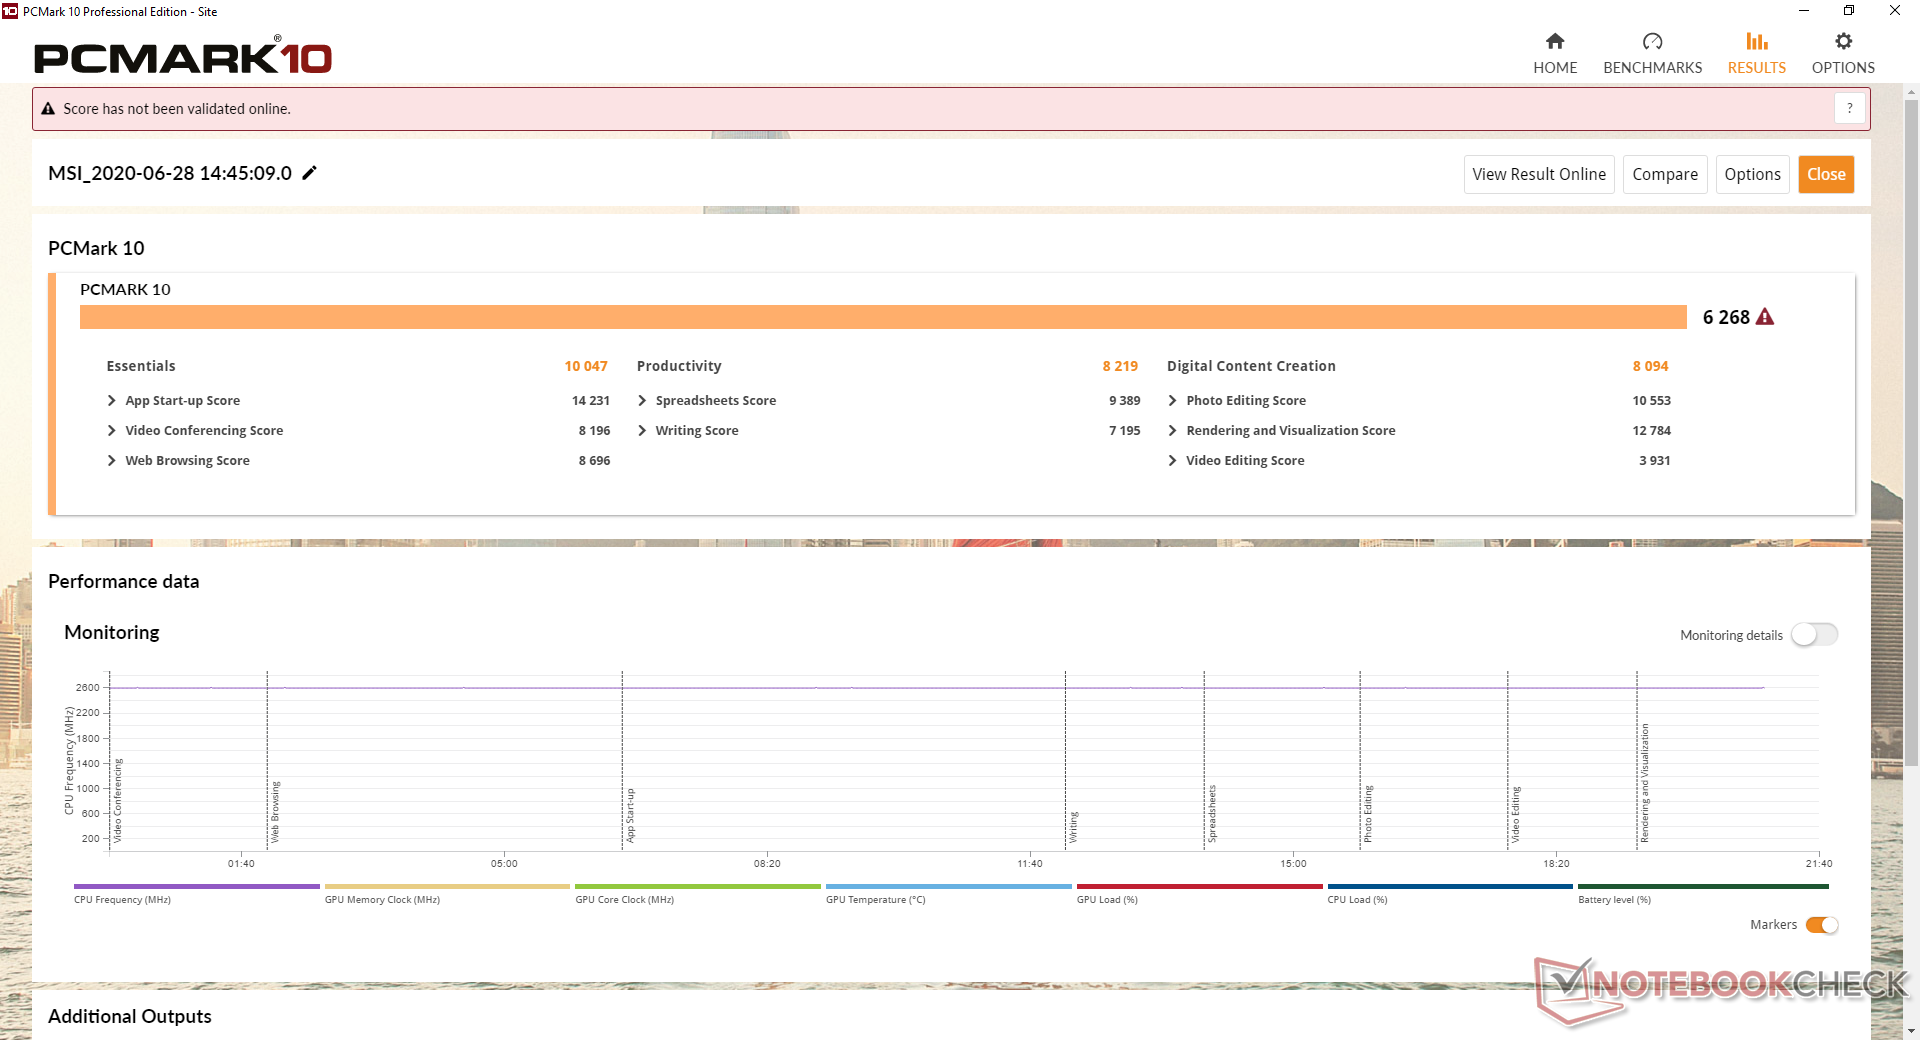
Rendimiento del sistema
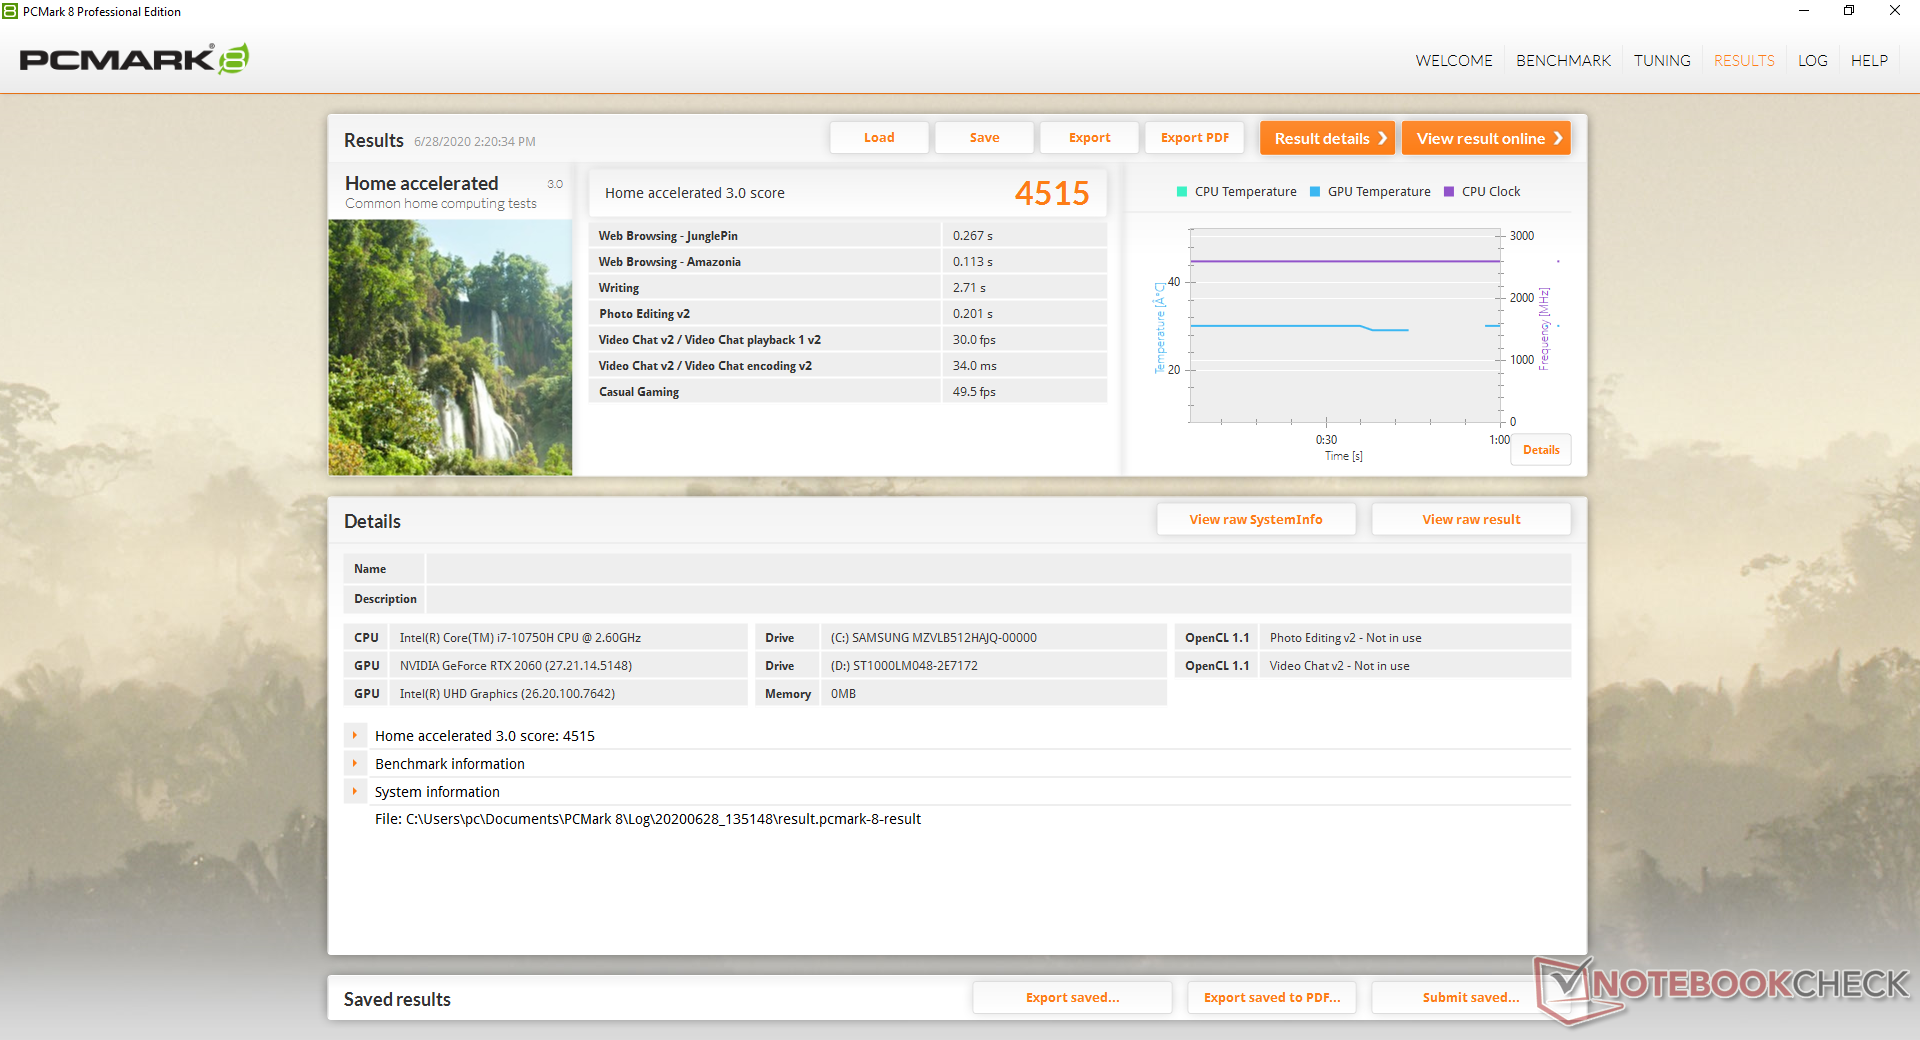
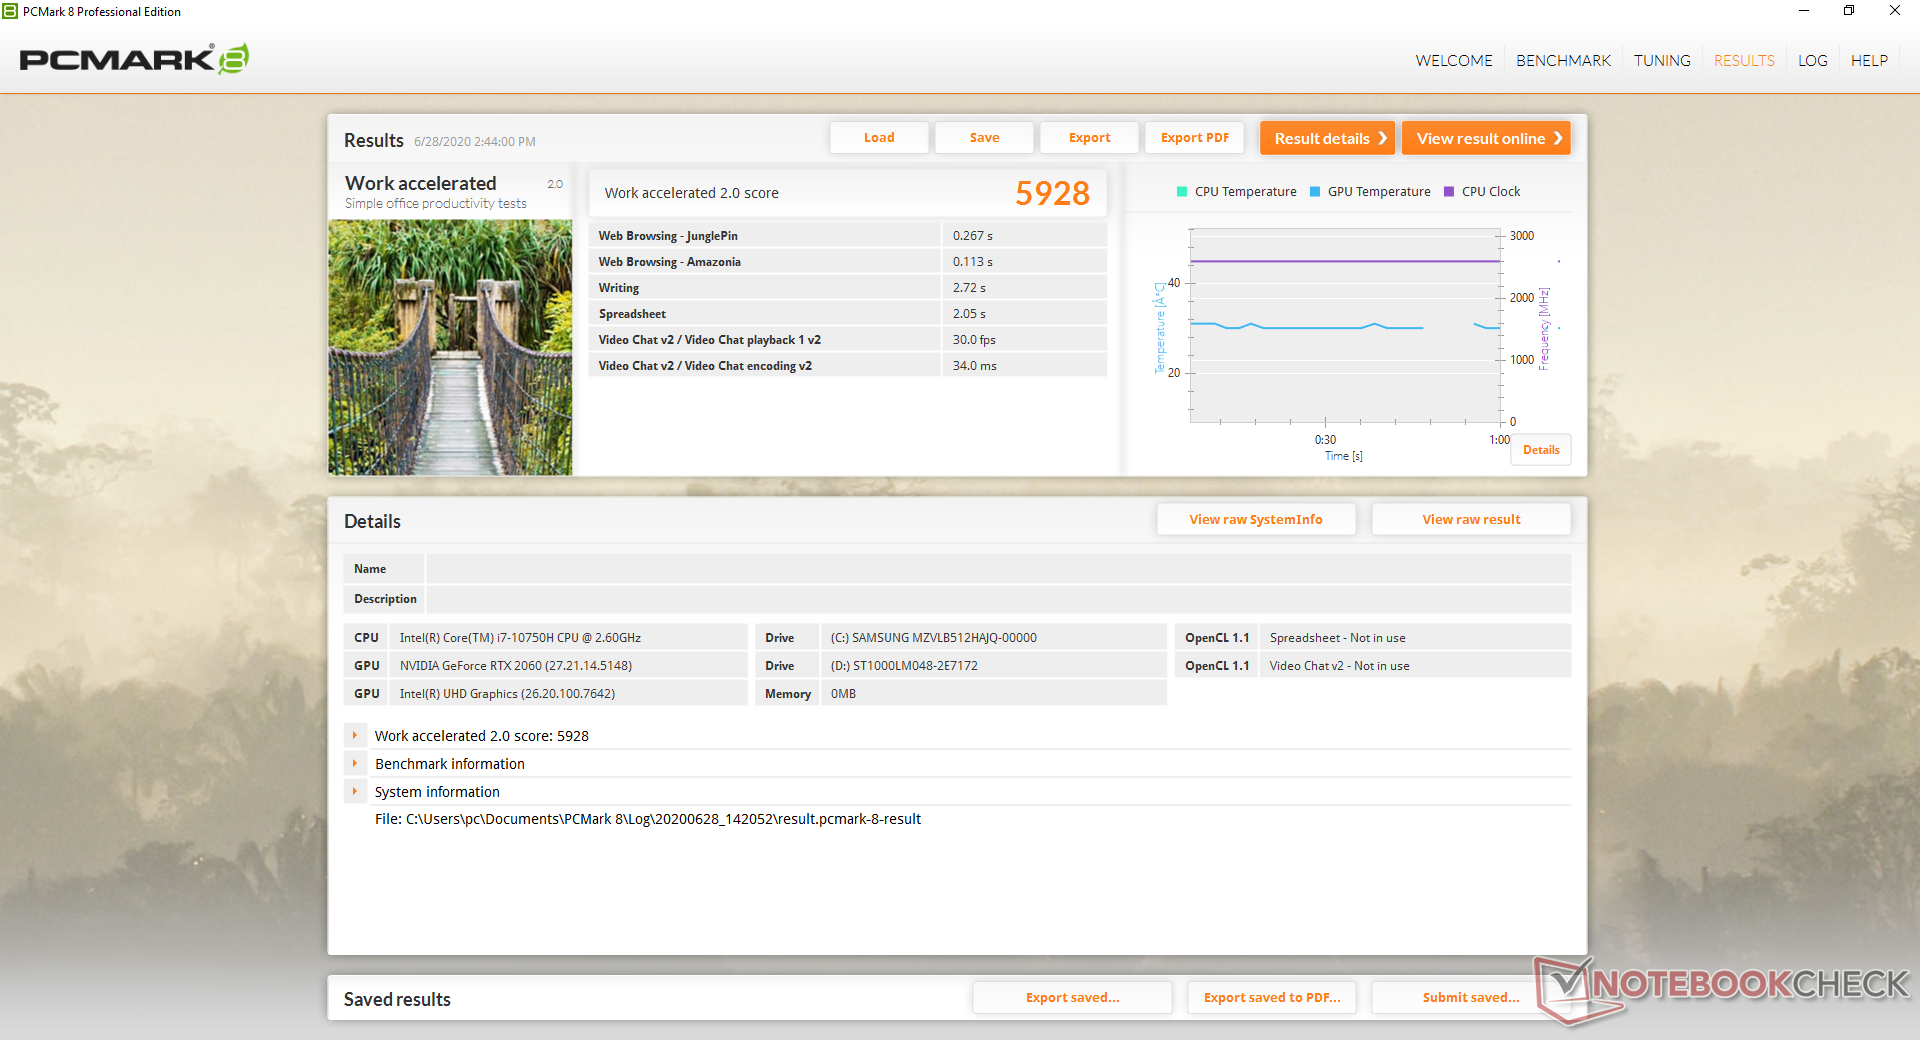
| PCMark 8 Home Score Accelerated v2 | 4515 puntos | |
| PCMark 8 Work Score Accelerated v2 | 5928 puntos | |
| PCMark 10 Score | 6268 puntos | |
ayuda | ||
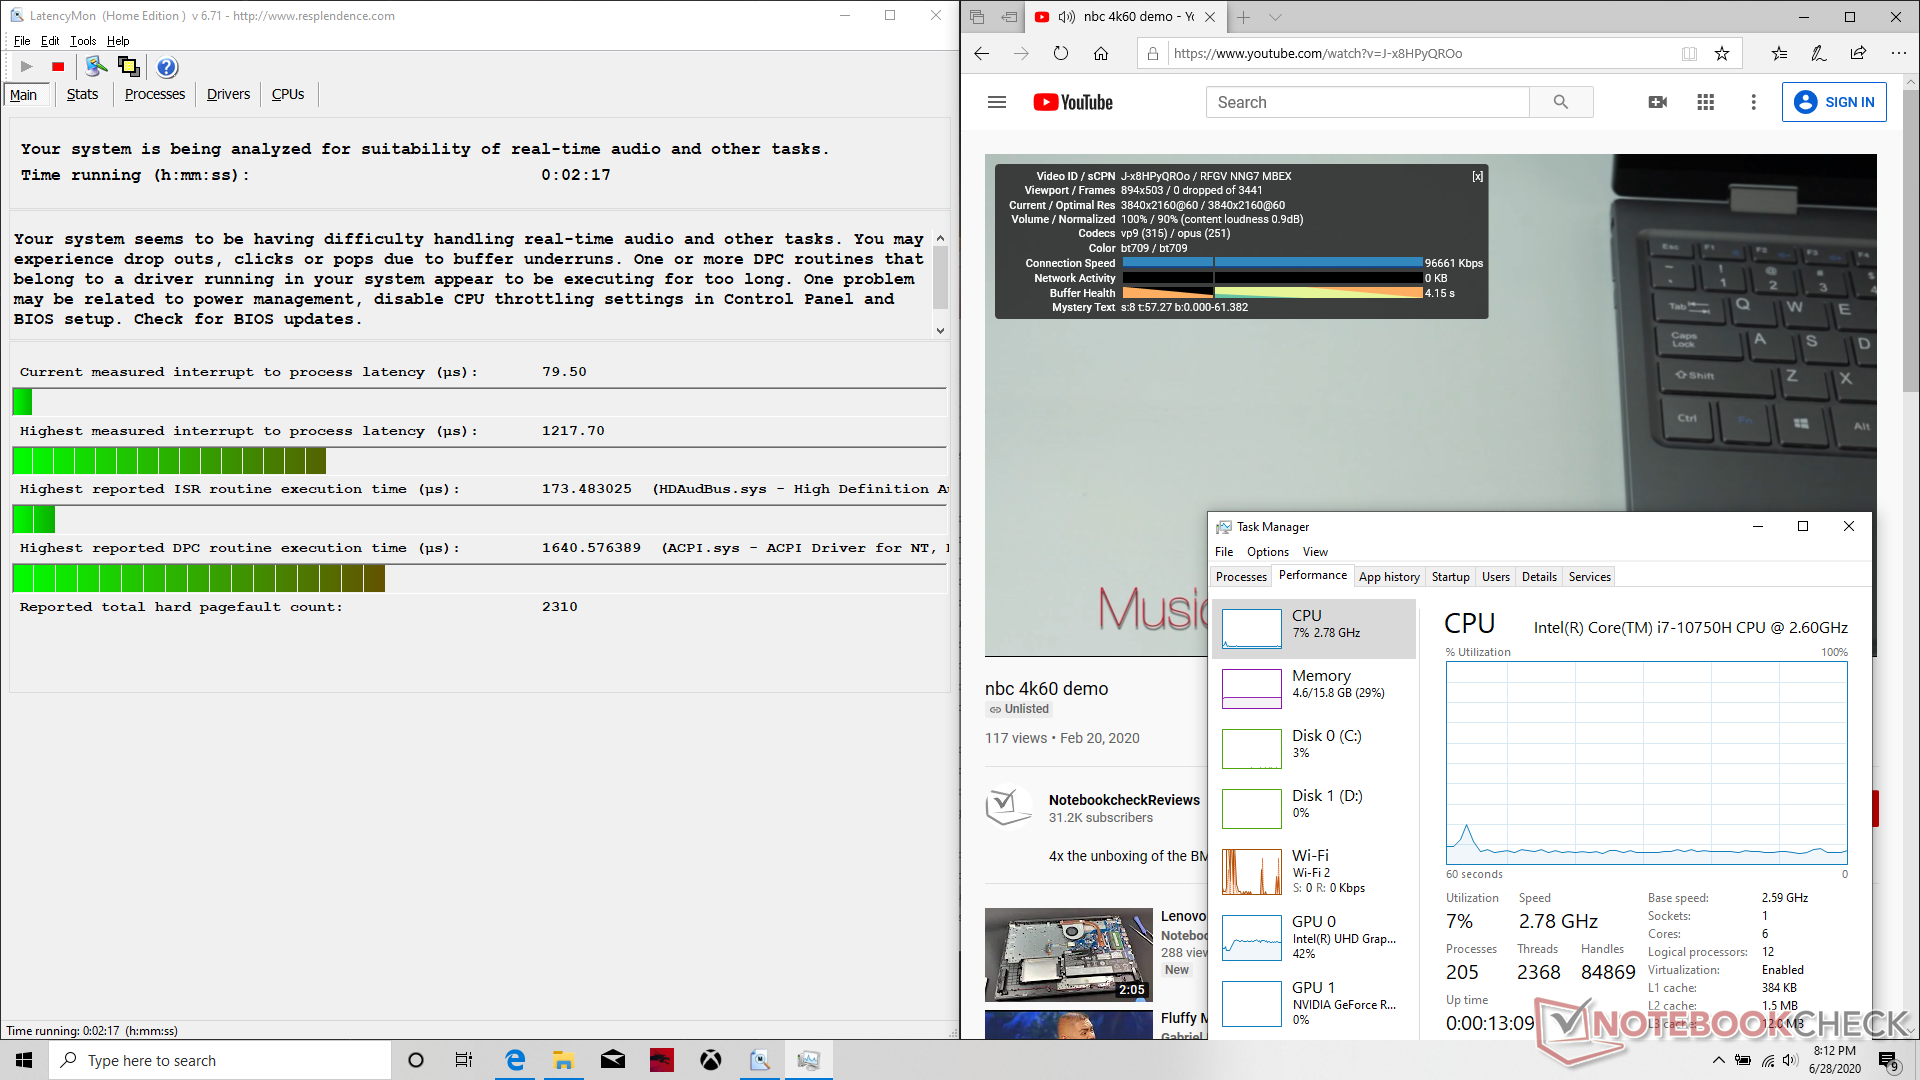
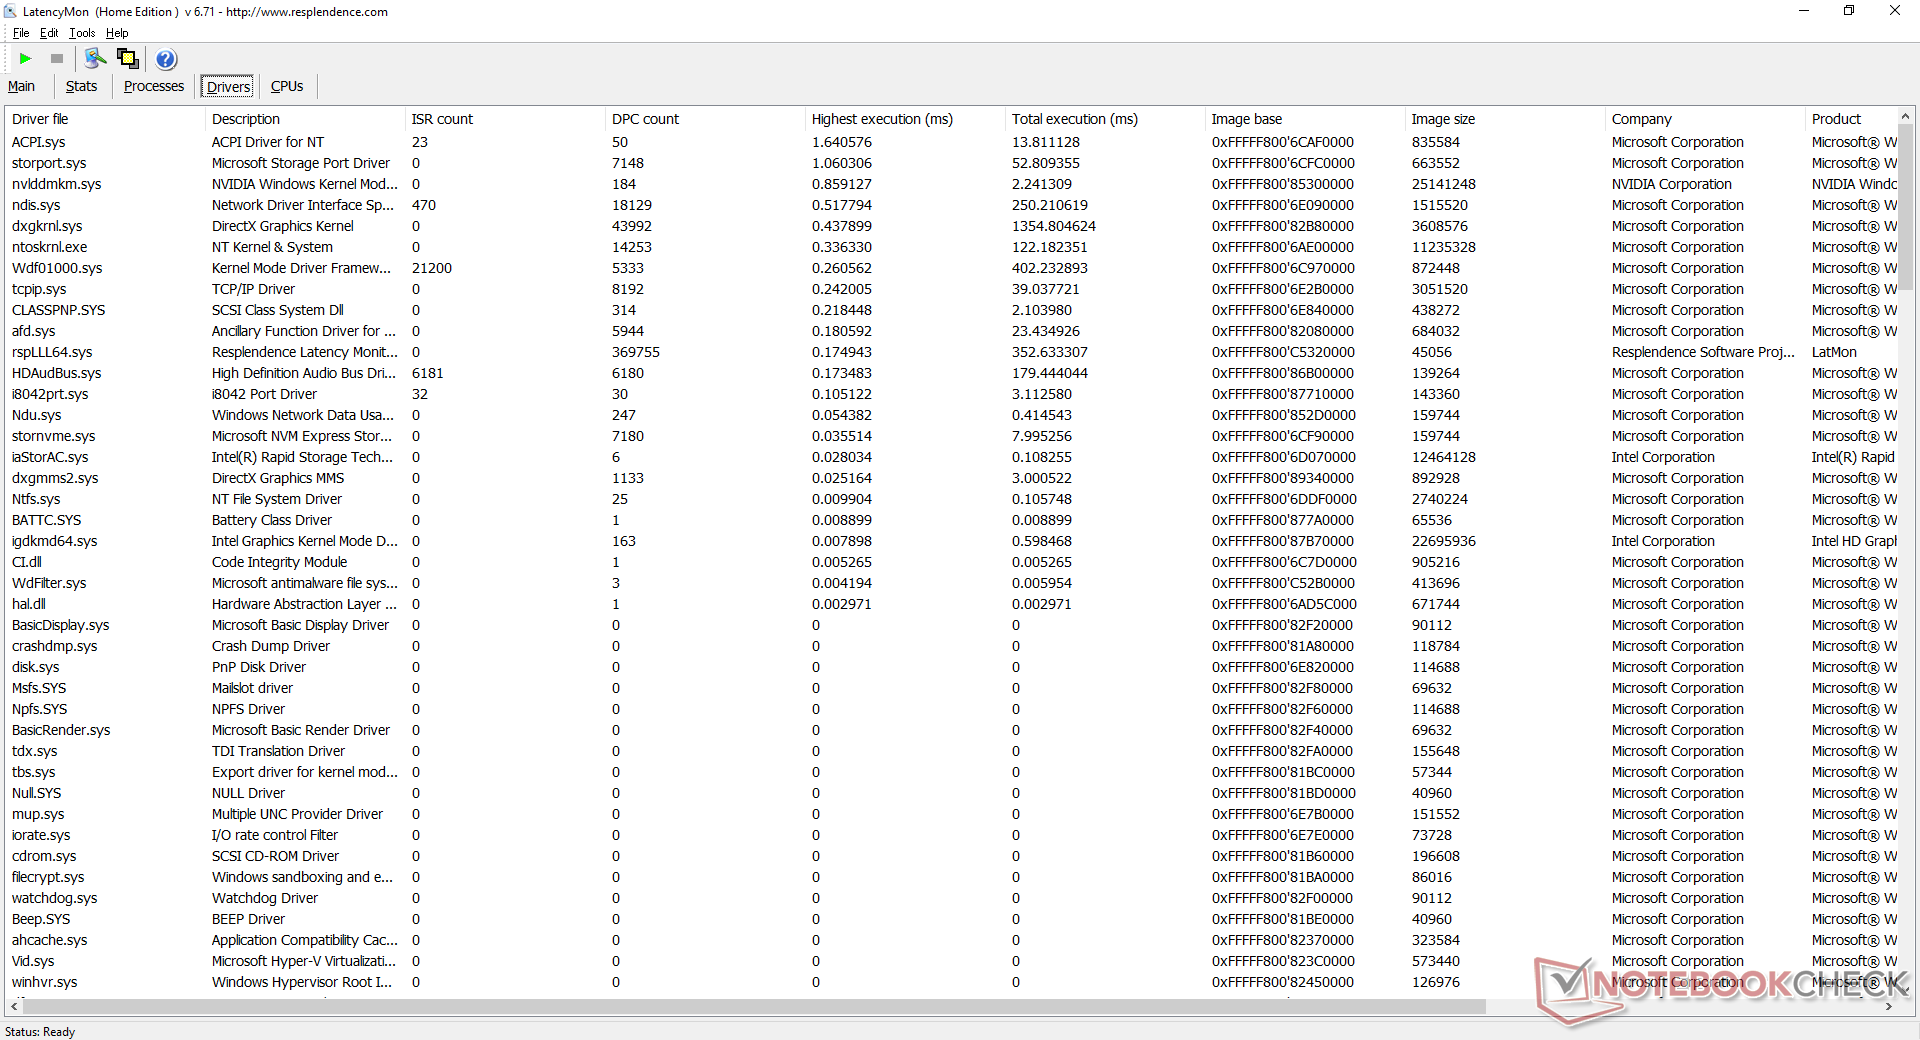
Latencia del DPC
LatencyMon muestra problemas menores de latencia de DPC al abrir varias pestañas en nuestra página principal. La reproducción de video de 4K en YouTube es, por lo demás, suave y sin caídas de cuadros.
| DPC Latencies / LatencyMon - interrupt to process latency (max), Web, Youtube, Prime95 | |
| Dell XPS 15 9500 Core i7 4K UHD | |
| Asus Zephyrus G14 GA401IV | |
| MSI GE75 Raider 10SE-008US | |
| Razer Blade Pro 17 RTX 2070 Max-Q 300 Hz | |
* ... más pequeño es mejor
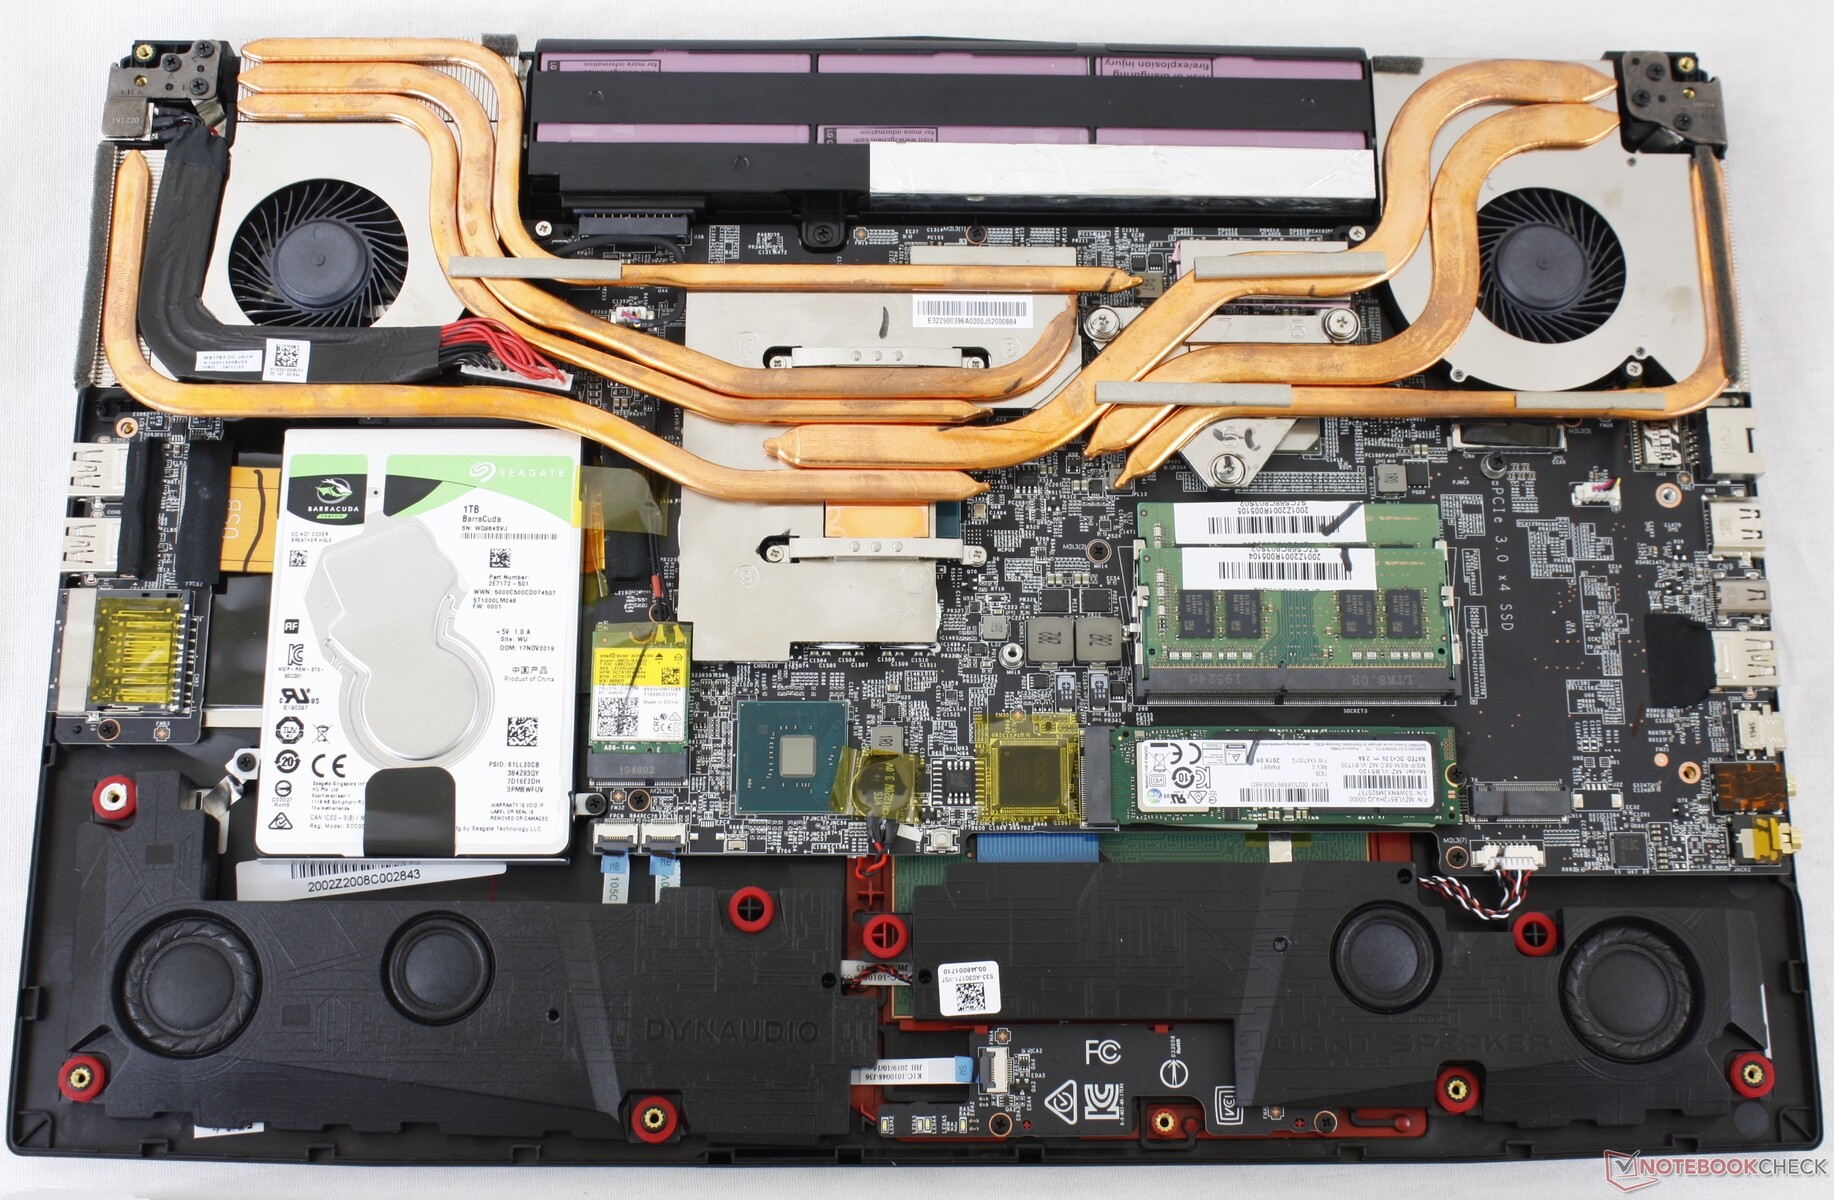
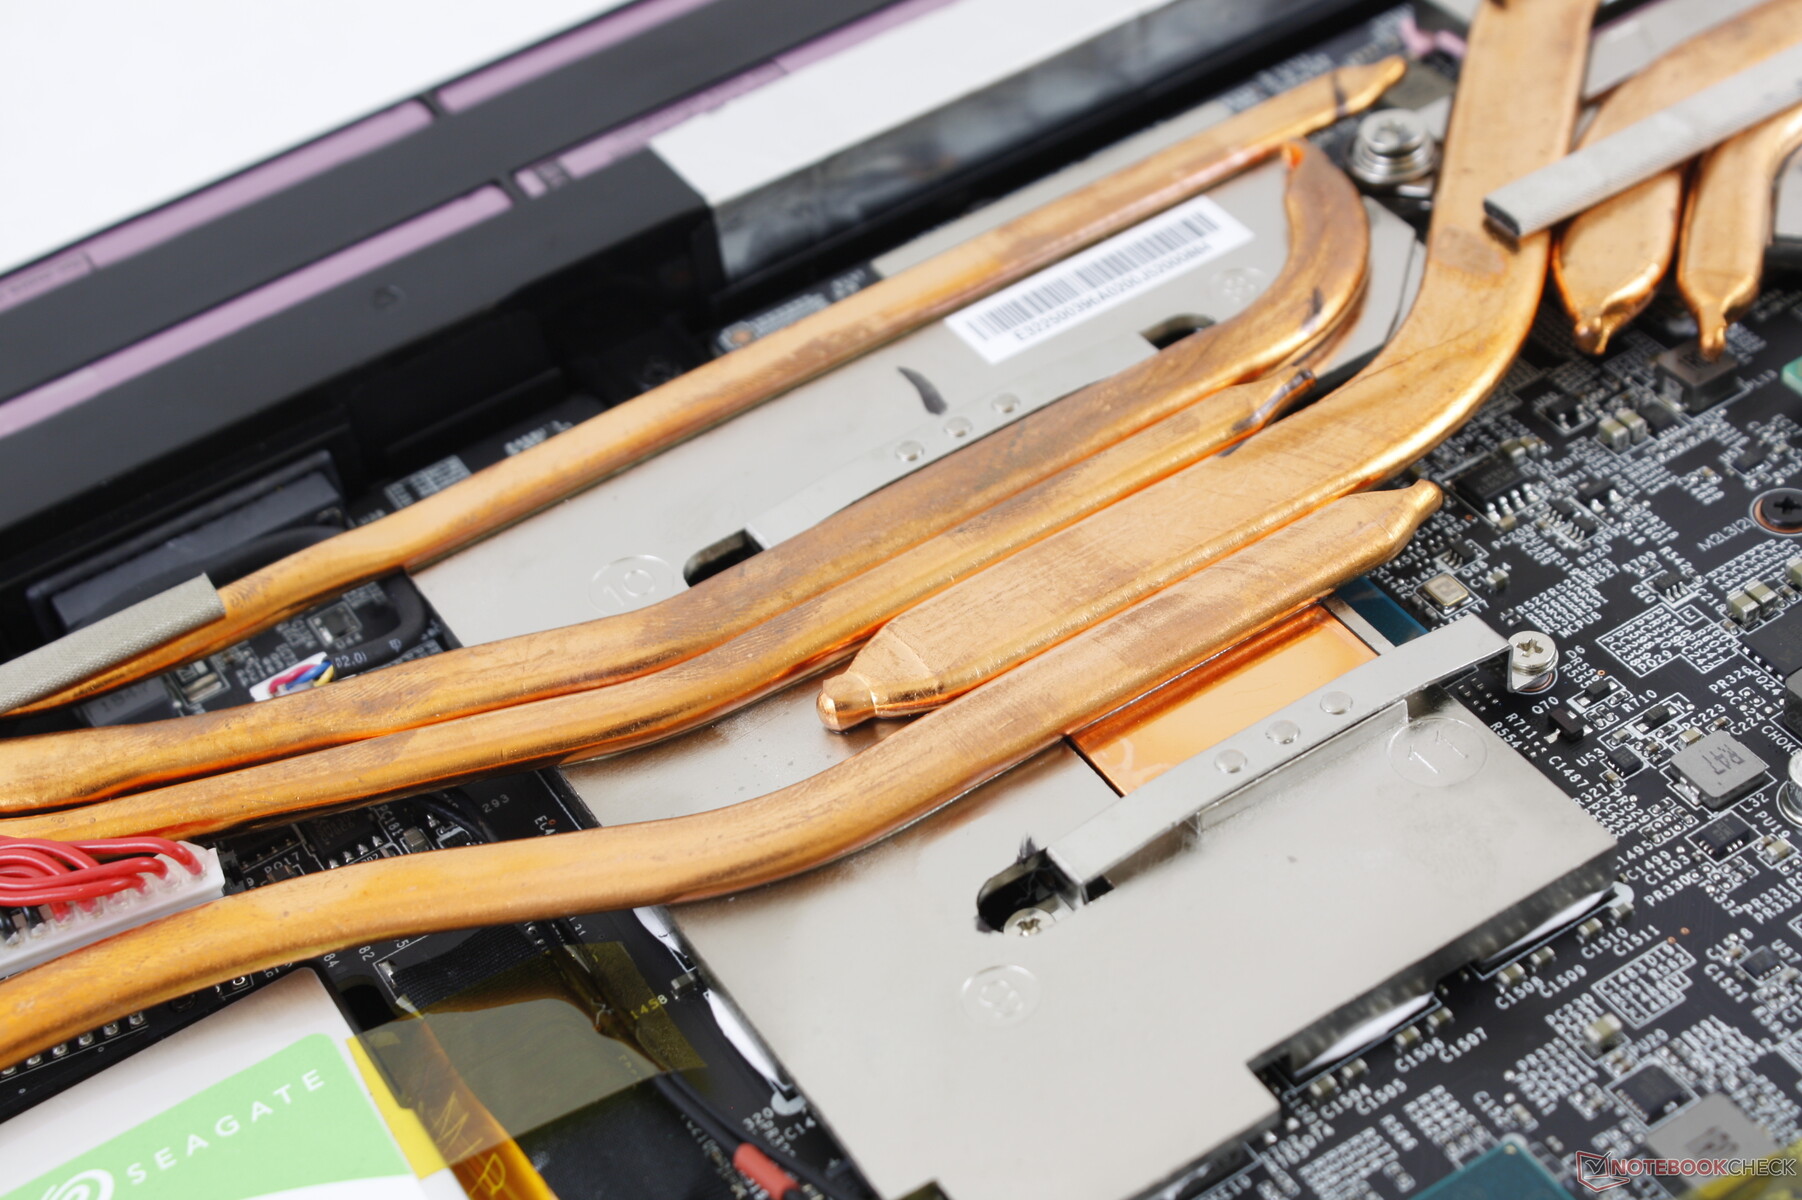
Dispositivos de almacenamiento
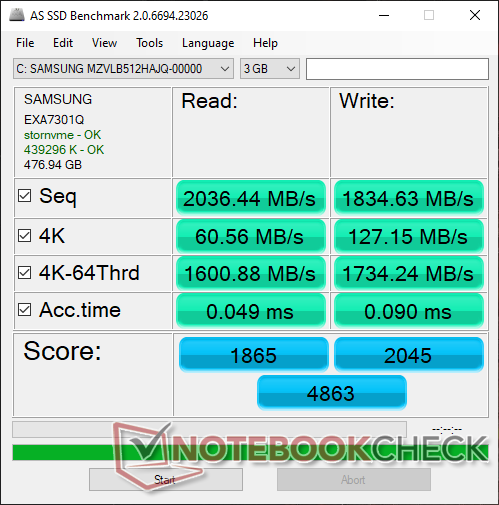
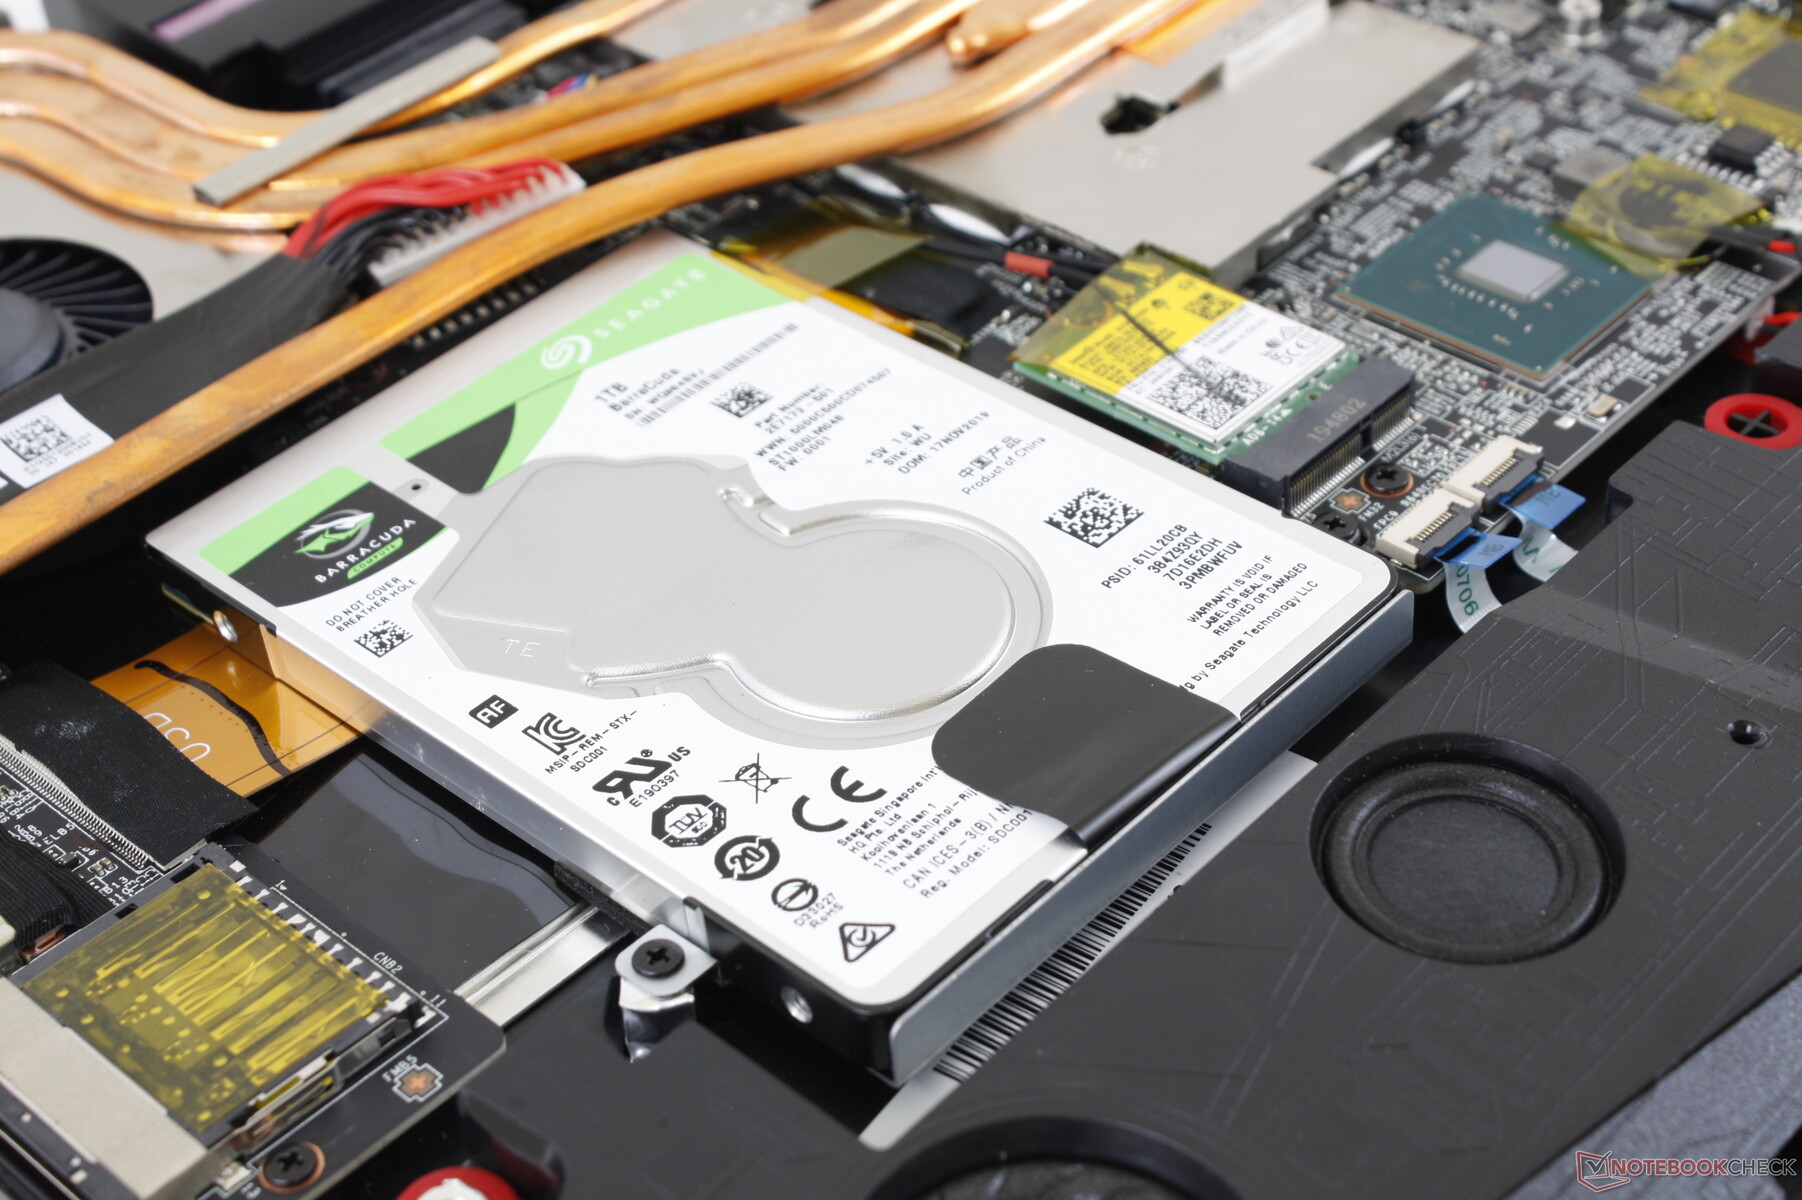
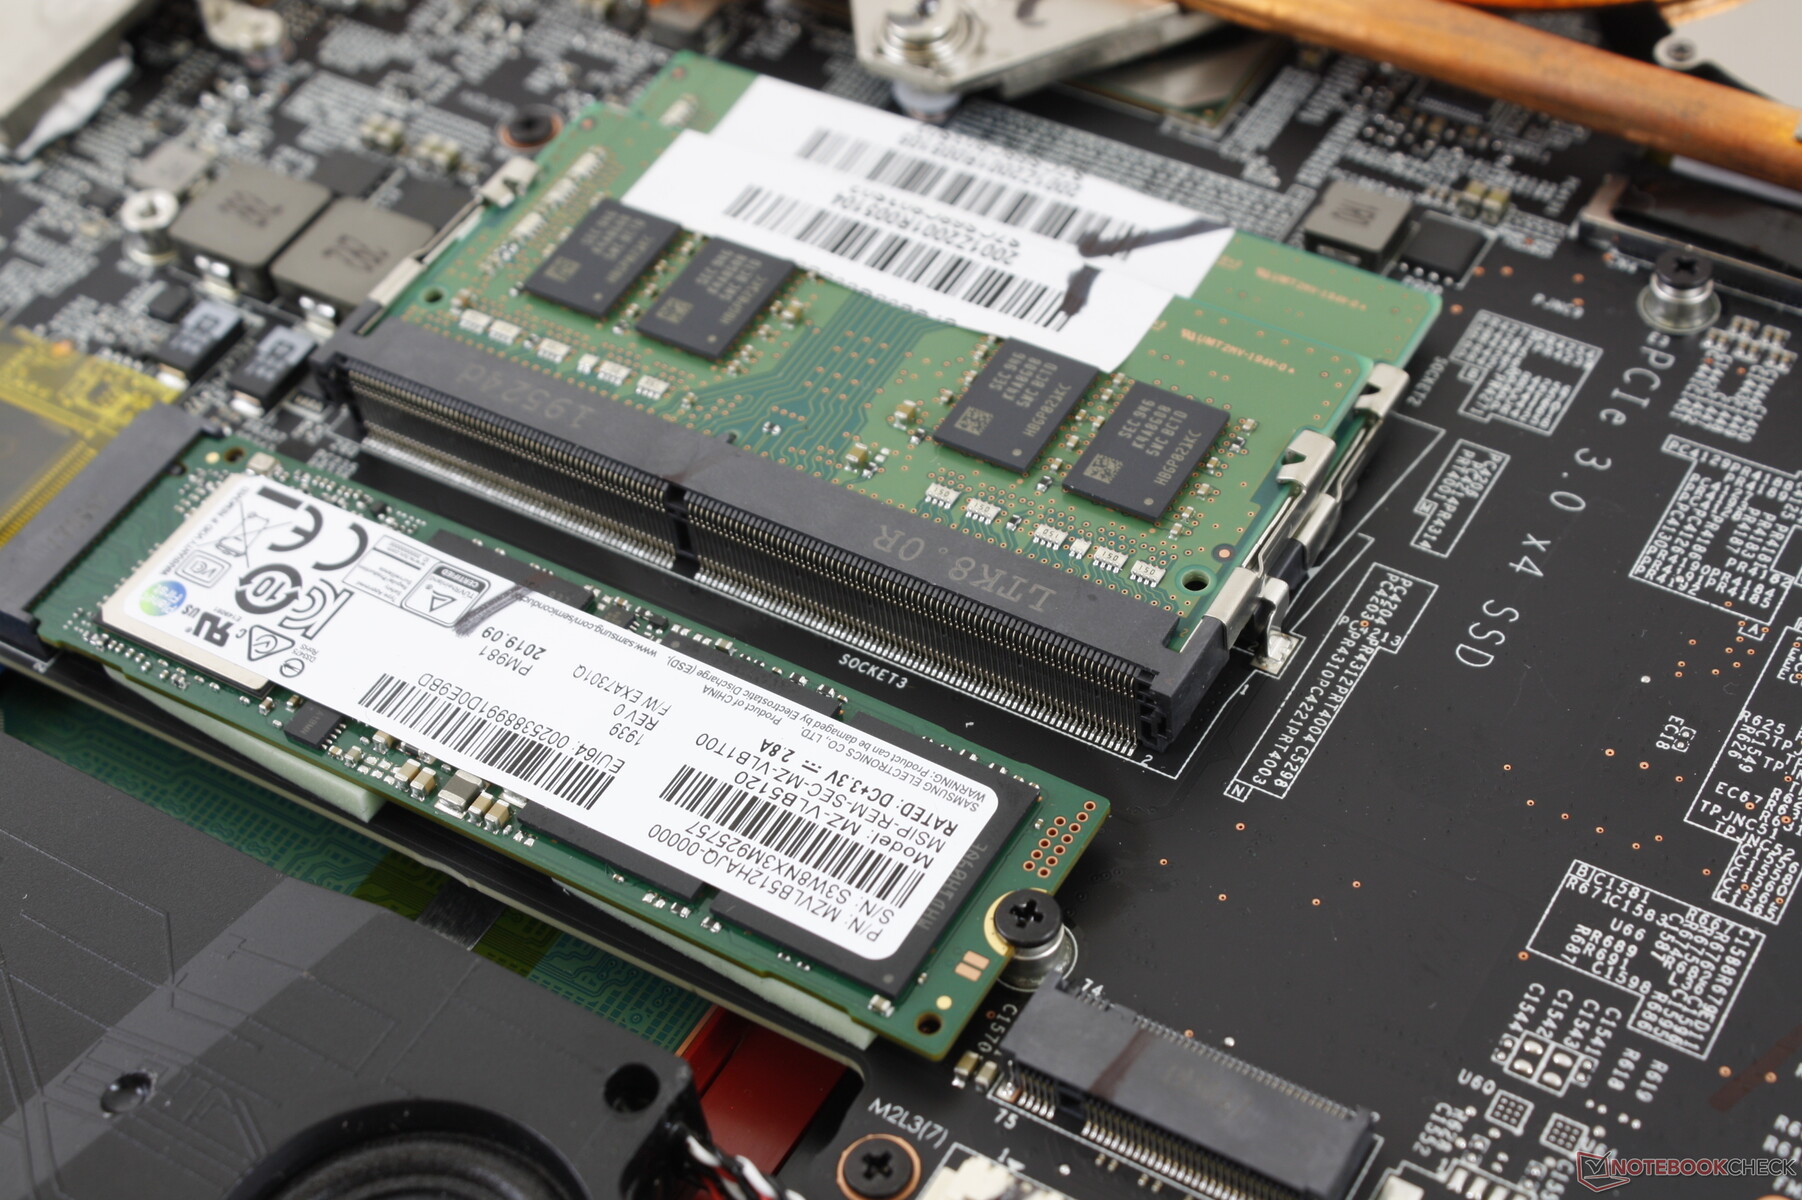
Los propietarios tienen acceso a dos ranuras M.2 2280 con compatibilidad RAID y una única bahía SATA III de 2,5 pulgadas. Nuestra unidad específica viene con el Samsung SSD PM981 MZVLB512HAJQ de alta gama, pero es posible utilizar unidades de otros fabricantes dependiendo de dónde decida comprar el GE75.
| MSI GE75 Raider 10SE-008US Samsung SSD PM981 MZVLB512HAJQ | MSI GS75 Stealth 9SG 2x Samsung SSD PM981 MZVLB1T0HALR (RAID 0) | Asus Strix Hero III G731GV Intel SSD 660p SSDPEKNW512G8 | Lenovo Legion Y740-17IRH WDC PC SN520 SDAPMUW-128G | Razer Blade Pro 17 RTX 2060 Samsung SSD PM981 MZVLB512HAJQ | Aorus 17G XB Samsung SSD PM981a MZVLB512HBJQ | |
|---|---|---|---|---|---|---|
| AS SSD | 6% | -27% | -60% | 5% | 2% | |
| Seq Read (MB/s) | 2036 | 2855 40% | 940 -54% | 1339 -34% | 1810 -11% | 1791 -12% |
| Seq Write (MB/s) | 1835 | 2687 46% | 921 -50% | 688 -63% | 1797 -2% | 2193 20% |
| 4K Read (MB/s) | 60.6 | 30.31 -50% | 48.05 -21% | 23.23 -62% | 48.43 -20% | 50.7 -16% |
| 4K Write (MB/s) | 127.2 | 96.3 -24% | 104.3 -18% | 98.8 -22% | 106 -17% | 116.8 -8% |
| 4K-64 Read (MB/s) | 1601 | 1460 -9% | 320.1 -80% | 300.9 -81% | 1156 -28% | 1525 -5% |
| 4K-64 Write (MB/s) | 1734 | 1224 -29% | 703 -59% | 204.6 -88% | 1748 1% | 1958 13% |
| Access Time Read * (ms) | 0.049 | 0.054 -10% | 0.079 -61% | 0.184 -276% | 0.057 -16% | 0.07 -43% |
| Access Time Write * (ms) | 0.09 | 0.038 58% | 0.046 49% | 0.037 59% | 0.035 61% | 0.032 64% |
| Score Read (Points) | 1865 | 1776 -5% | 462 -75% | 458 -75% | 1385 -26% | 1755 -6% |
| Score Write (Points) | 2045 | 1589 -22% | 900 -56% | 372 -82% | 2033 -1% | 2294 12% |
| Score Total (Points) | 4863 | 4259 -12% | 1616 -67% | 1038 -79% | 4135 -15% | 4972 2% |
| Copy ISO MB/s (MB/s) | 1900 | 2226 17% | 1416 -25% | 988 -48% | 1984 4% | |
| Copy Program MB/s (MB/s) | 205.5 | 426.4 107% | 569 177% | 327.2 59% | 588 186% | |
| Copy Game MB/s (MB/s) | 1419 | 1152 -19% | 971 -32% | 758 -47% | 835 -41% | |
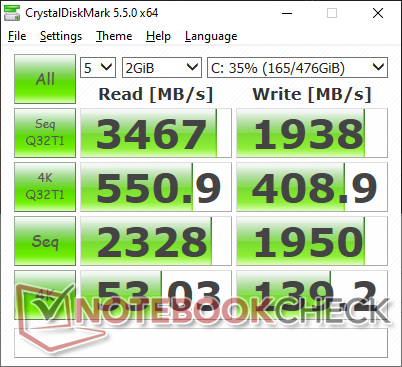
| CrystalDiskMark 5.2 / 6 | 8% | -27% | -49% | -10% | 9% | |
| Write 4K (MB/s) | 139.2 | 95.5 -31% | 129.3 -7% | 102.7 -26% | 124.1 -11% | 123.4 -11% |
| Read 4K (MB/s) | 53 | 42.59 -20% | 54.4 3% | 29.12 -45% | 44.75 -16% | 45.02 -15% |
| Write Seq (MB/s) | 1950 | 2851 46% | 978 -50% | 362.2 -81% | 1292 -34% | 2526 30% |
| Read Seq (MB/s) | 2328 | 2696 16% | 1447 -38% | 1010 -57% | 1272 -45% | 2062 -11% |
| Write 4K Q32T1 (MB/s) | 408.9 | 402.6 -2% | 476.8 17% | 298.1 -27% | 514 26% | 497.9 22% |
| Read 4K Q32T1 (MB/s) | 551 | 443.9 -19% | 338.1 -39% | 349.6 -37% | 596 8% | 579 5% |
| Write Seq Q32T1 (MB/s) | 1938 | 3420 76% | 982 -49% | 788 -59% | 1892 -2% | 2982 54% |
| Read Seq Q32T1 (MB/s) | 3467 | 3514 1% | 1622 -53% | 1490 -57% | 3209 -7% | 3440 -1% |
| Media total (Programa/Opciones) | 7% /
7% | -27% /
-27% | -55% /
-56% | -3% /
-0% | 6% /
5% |
* ... más pequeño es mejor

Estrangulamiento del disco: DiskSpd Read Loop, Queue Depth 8
Rendimiento de la GPU
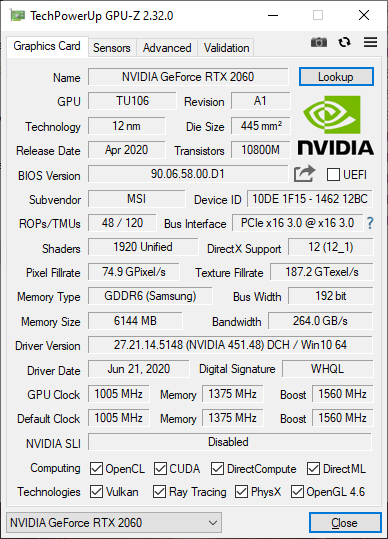
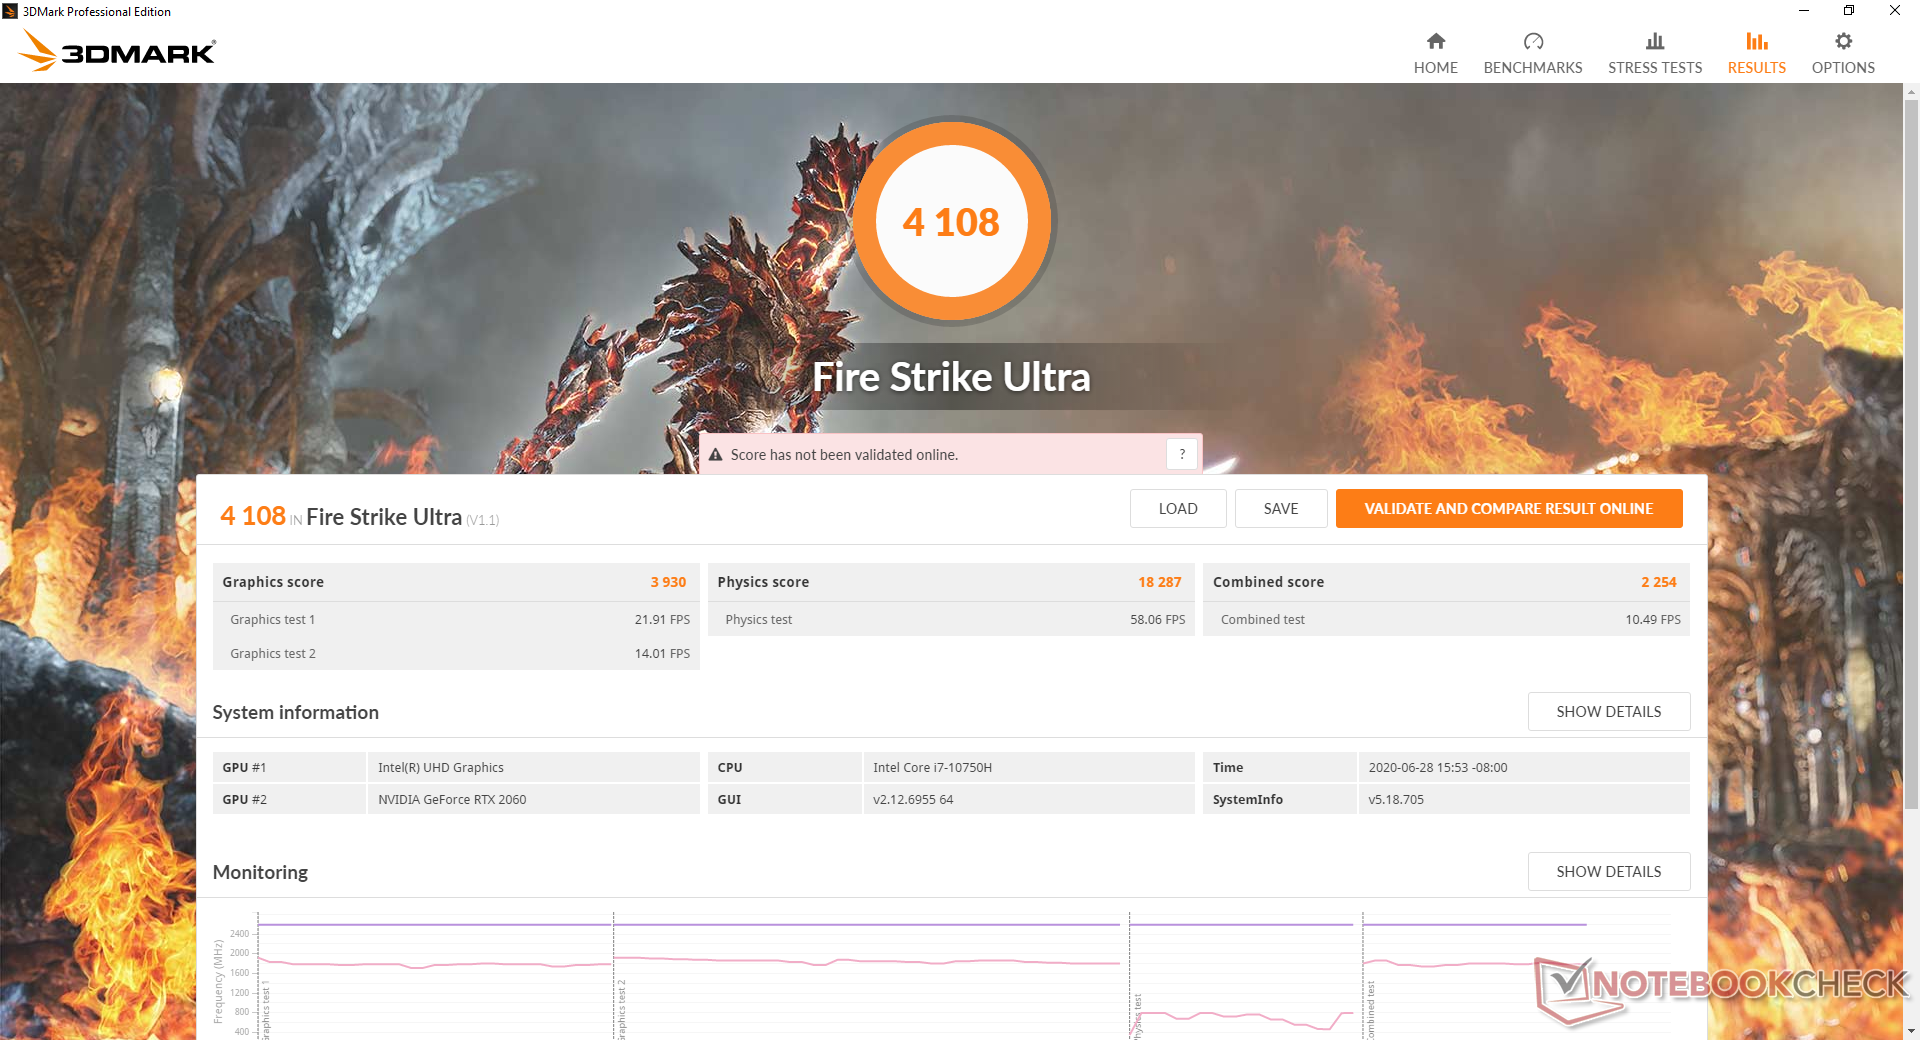
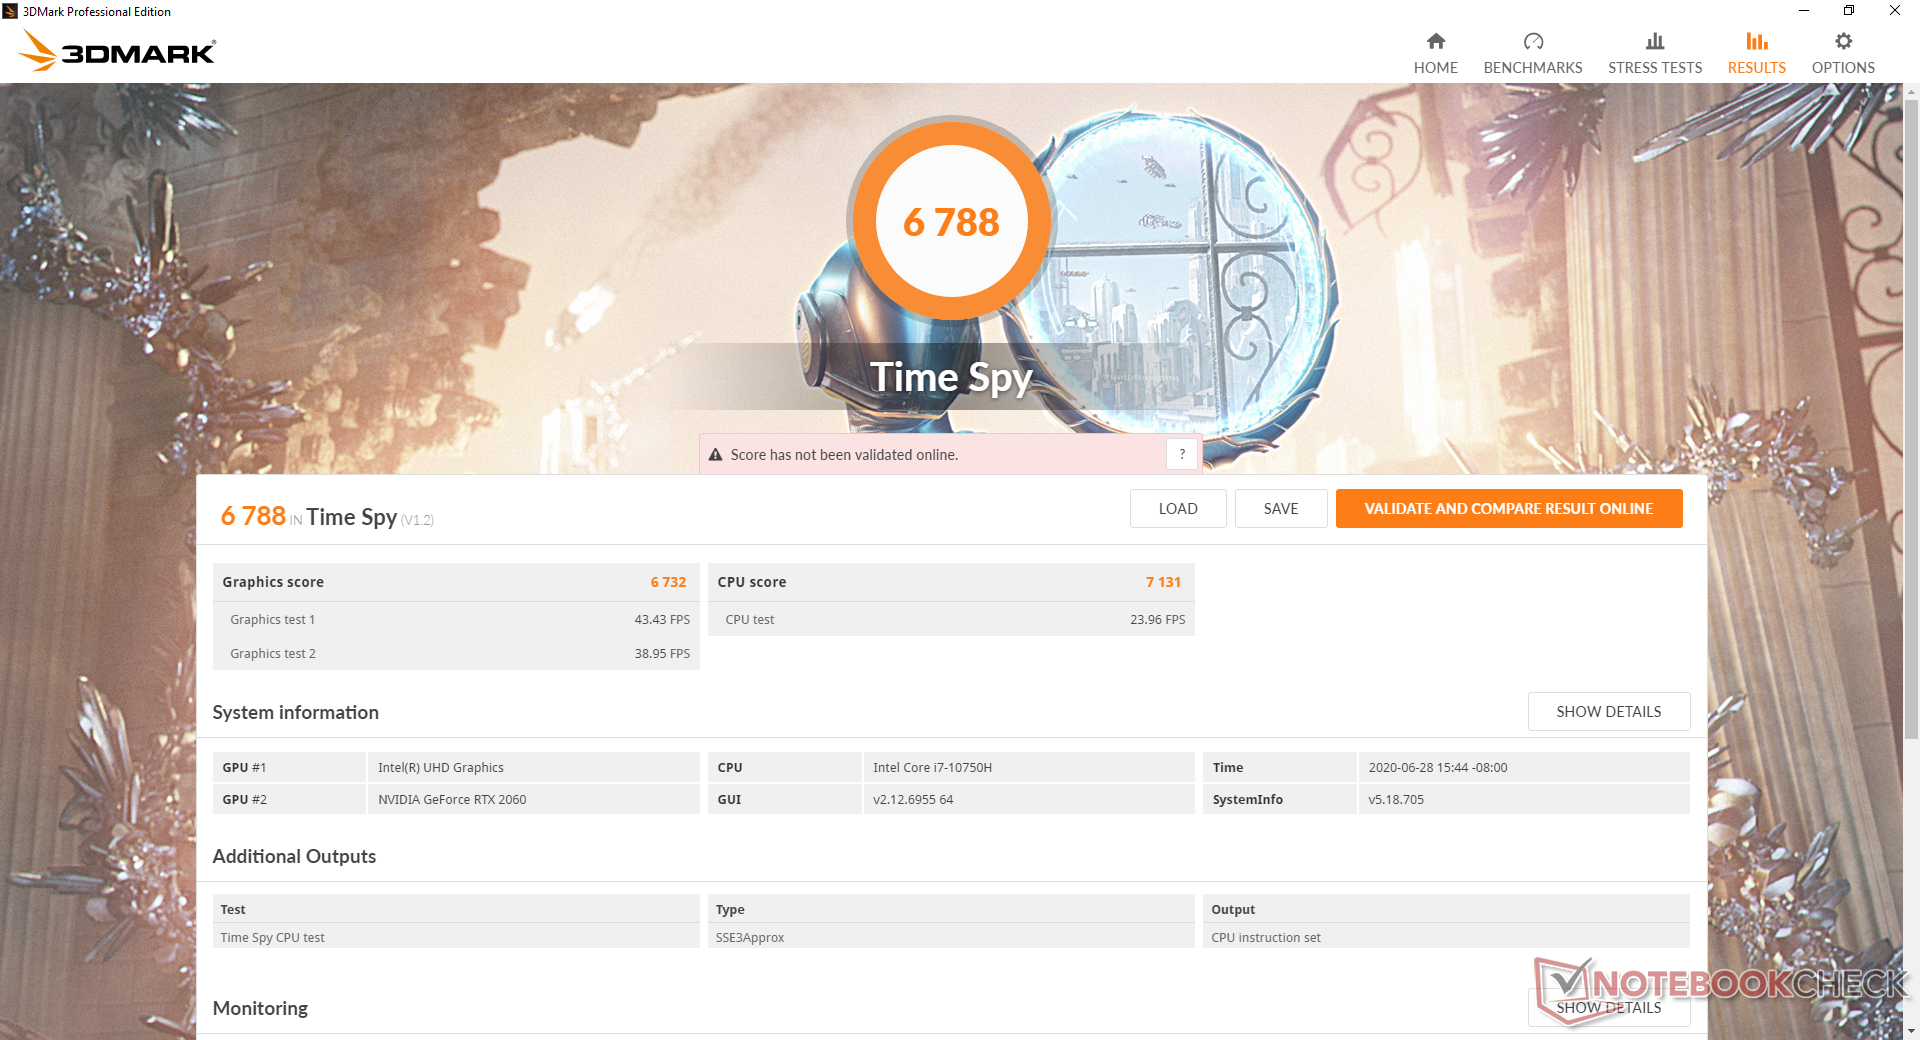
Los resultados de 3DMark son alrededor de un 10 por ciento más rápidos que el promedio de la GPU RTX 2060 de nuestra base de datos. La actualización a la opción RTX 2070 o RTX 2080 para el GE75 hará que los usuarios obtengan un rendimiento gráfico aproximadamente un 20 o un 50 por ciento más rápido, respectivamente.
Consulte nuestra página dedicada a la GeForce RTX 2060 móvil para obtener más información técnica y comparaciones de referencia.
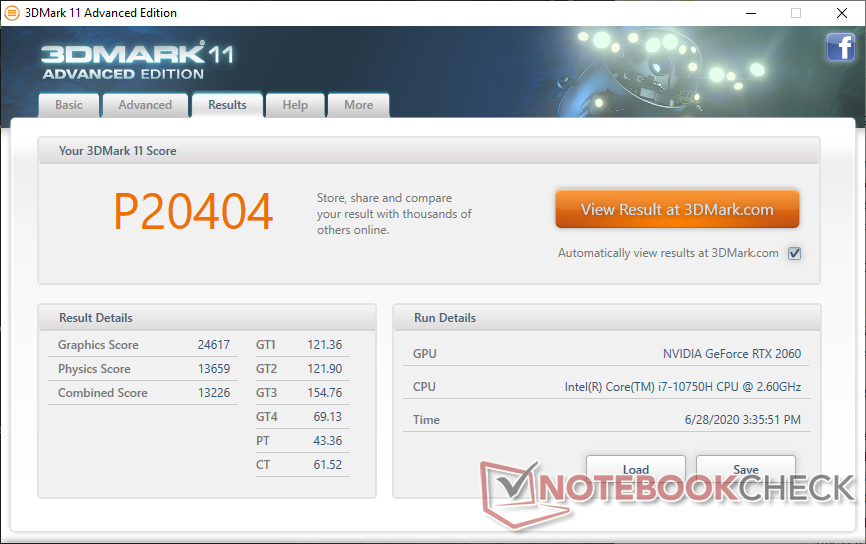
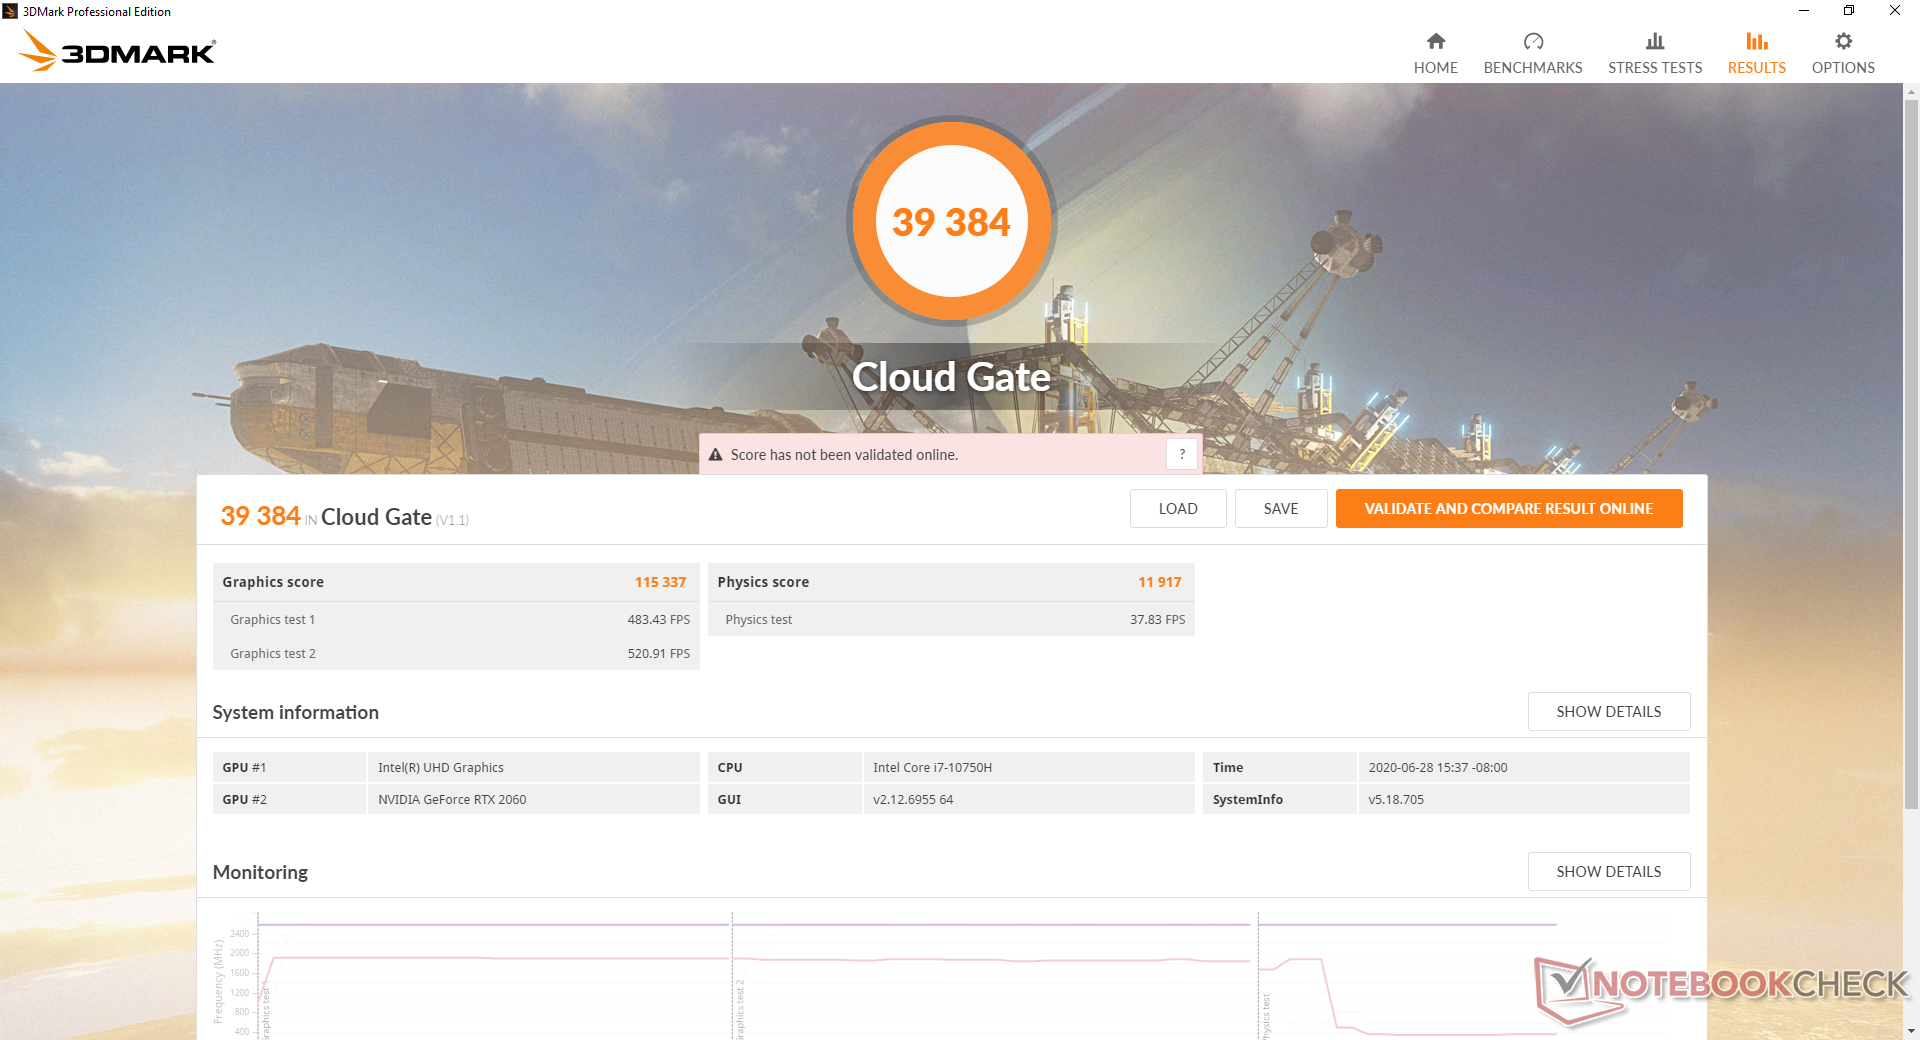
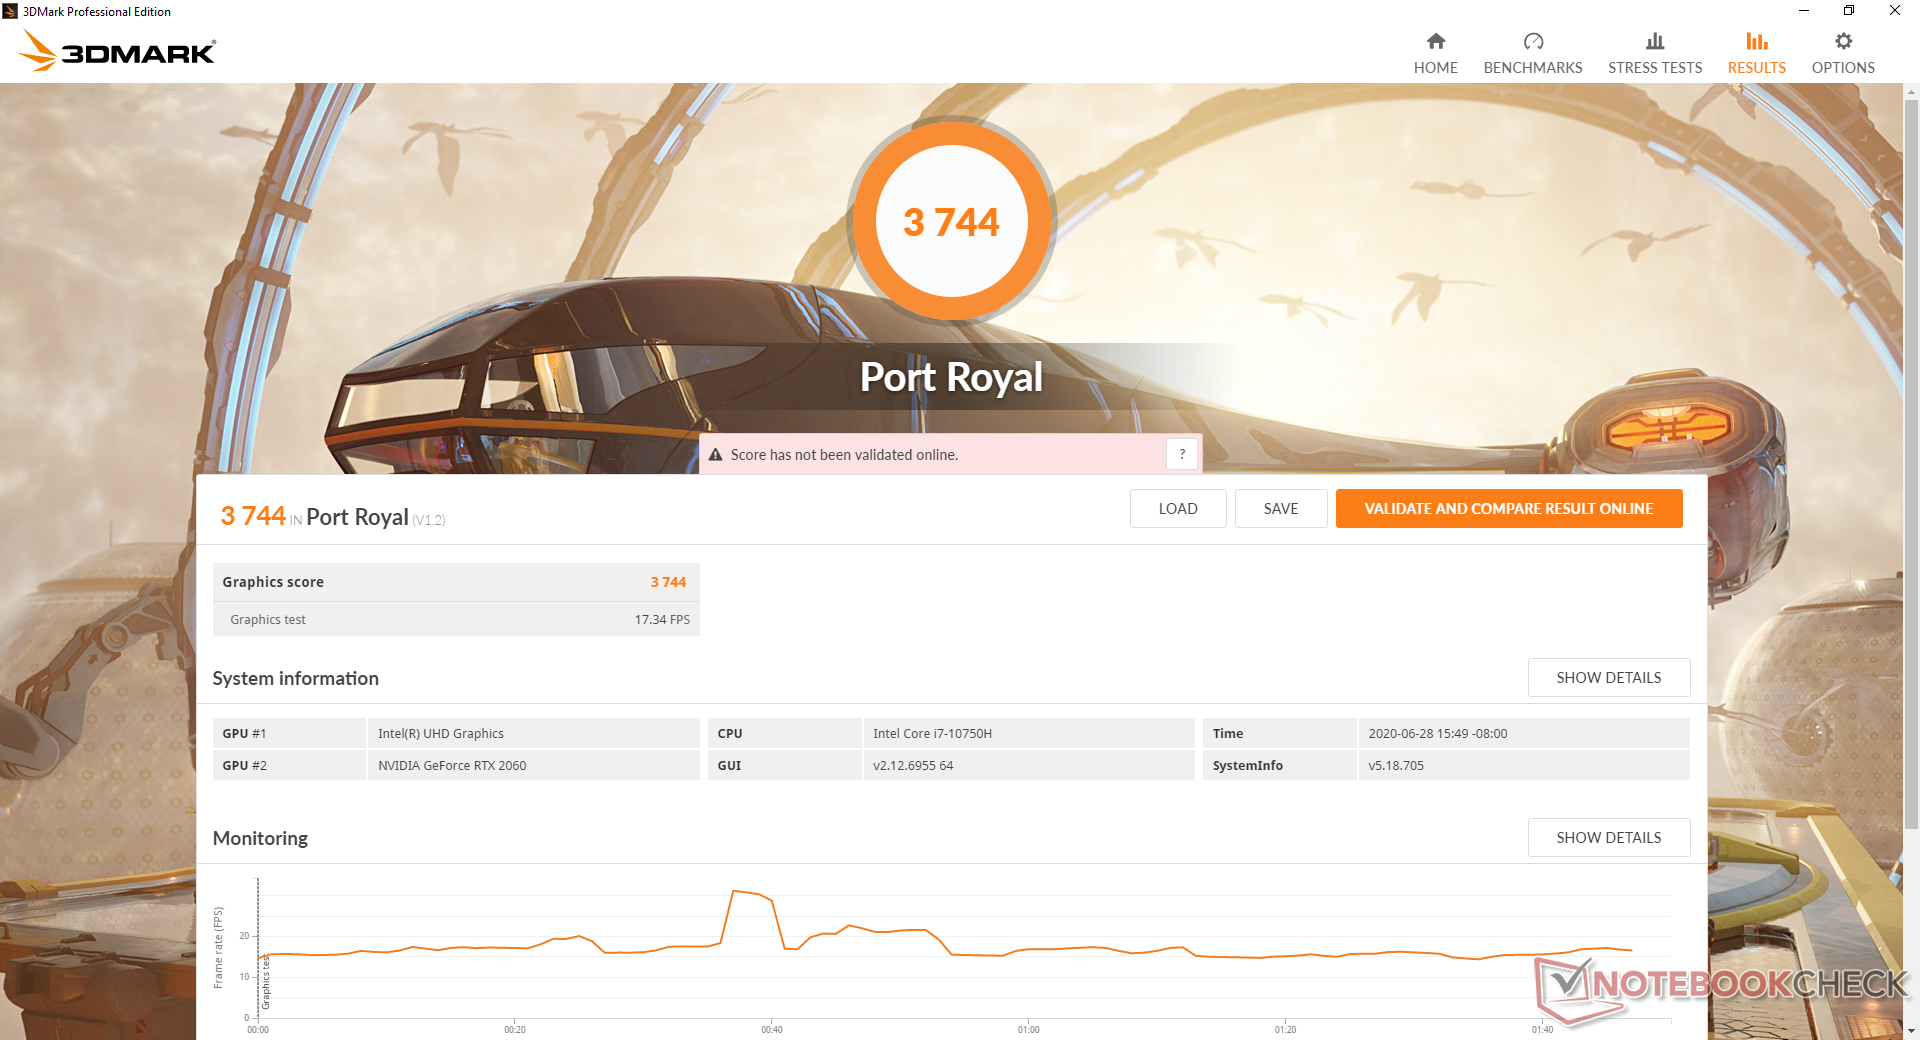
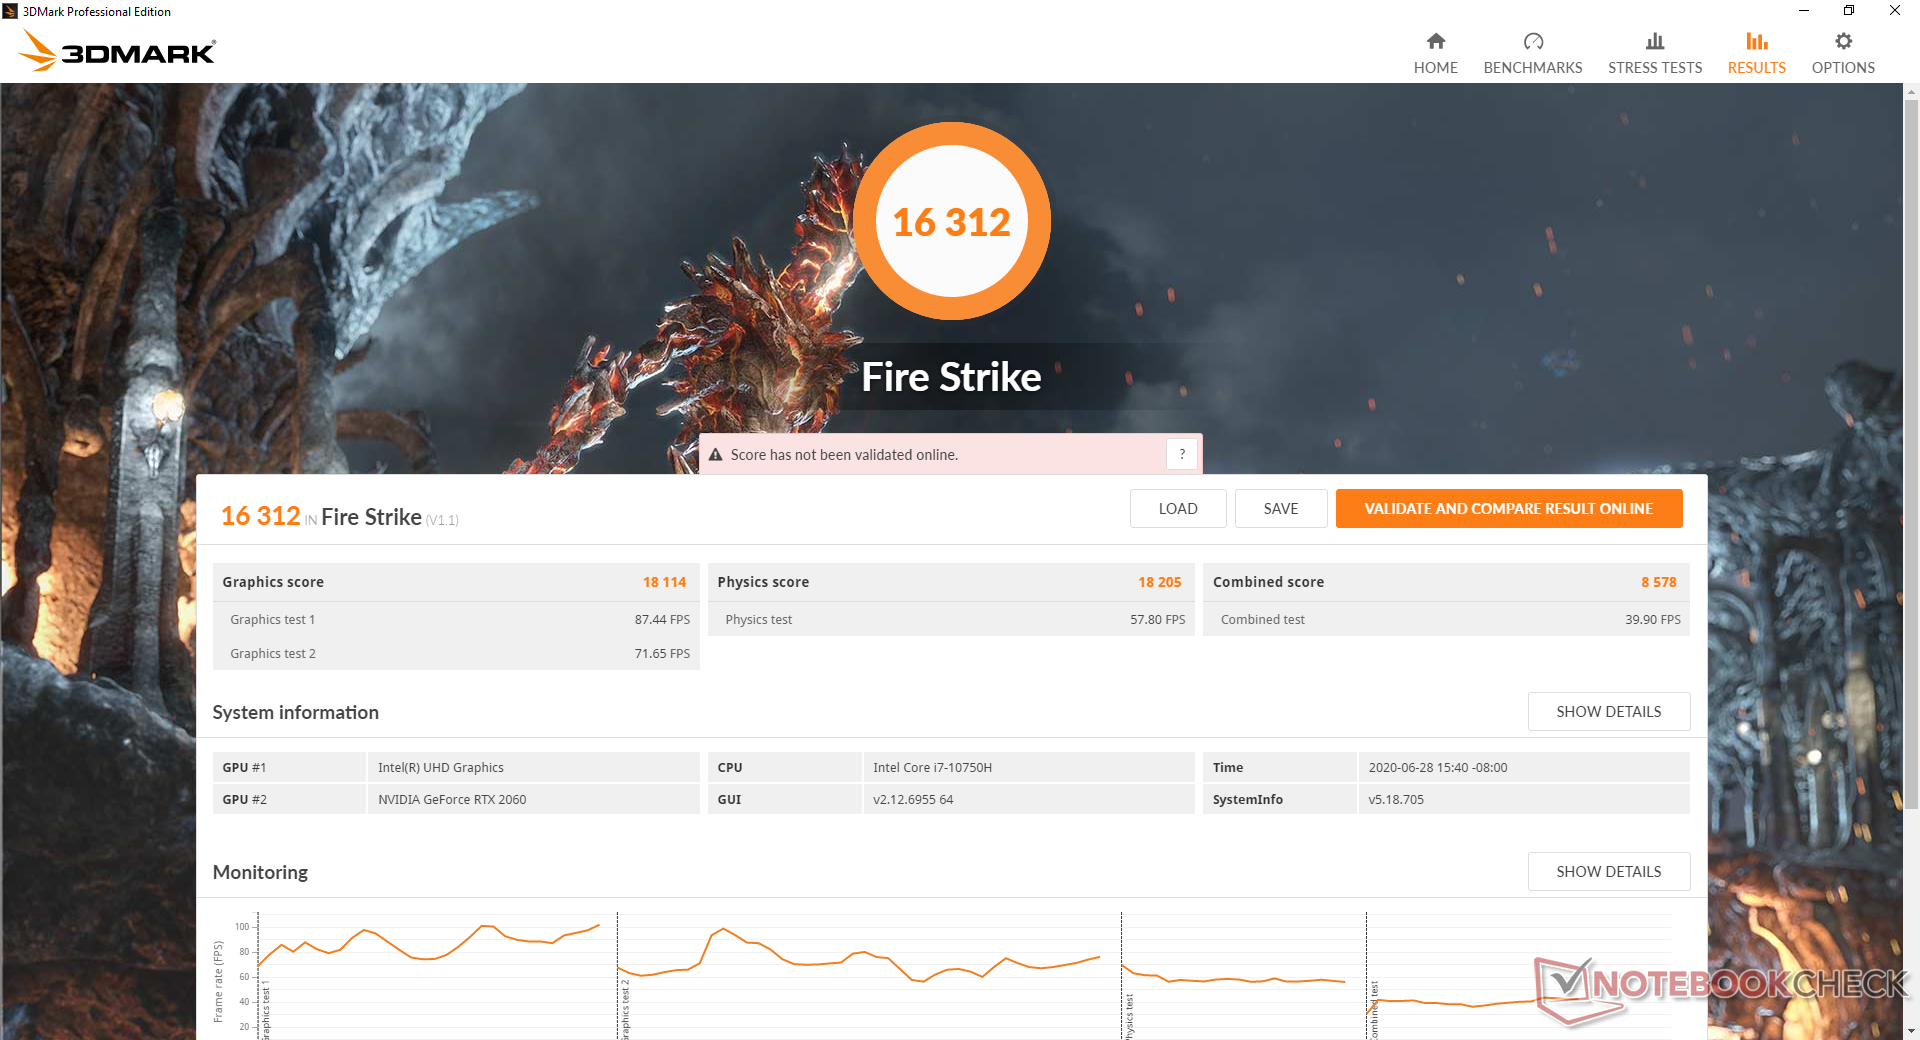
| 3DMark 11 Performance | 20404 puntos | |
| 3DMark Cloud Gate Standard Score | 39384 puntos | |
| 3DMark Fire Strike Score | 16312 puntos | |
| 3DMark Time Spy Score | 6788 puntos | |
ayuda | ||
| The Witcher 3 - 1920x1080 Ultra Graphics & Postprocessing (HBAO+) | |
| MSI GE75 9SG | |
| KFA2 GeForce RTX 2060 Super | |
| Aorus 17G XB | |
| MSI GE75 Raider 10SE-008US | |
| Schenker XMG Ultra 17 Coffee Lake Refresh | |
| Medio NVIDIA GeForce RTX 2060 Mobile (50.6 - 74, n=40) | |
| Asus Zephyrus G14 GA401IV | |
| Asus TUF A17 FA706IU-AS76 | |
| HP Omen 15-dc0015ng | |
| MSI GF75 Thin 10SCXR | |
| bajo | medio | alto | ultra | |
|---|---|---|---|---|
| The Witcher 3 (2015) | 293.5 | 214.9 | 123.9 | 65.9 |
| Dota 2 Reborn (2015) | 149 | 135 | 125 | 118 |
| X-Plane 11.11 (2018) | 103 | 90.6 | 77.2 | |
| Shadow of the Tomb Raider (2018) | 132 | 102 | 97 | 86 |
Emisiones
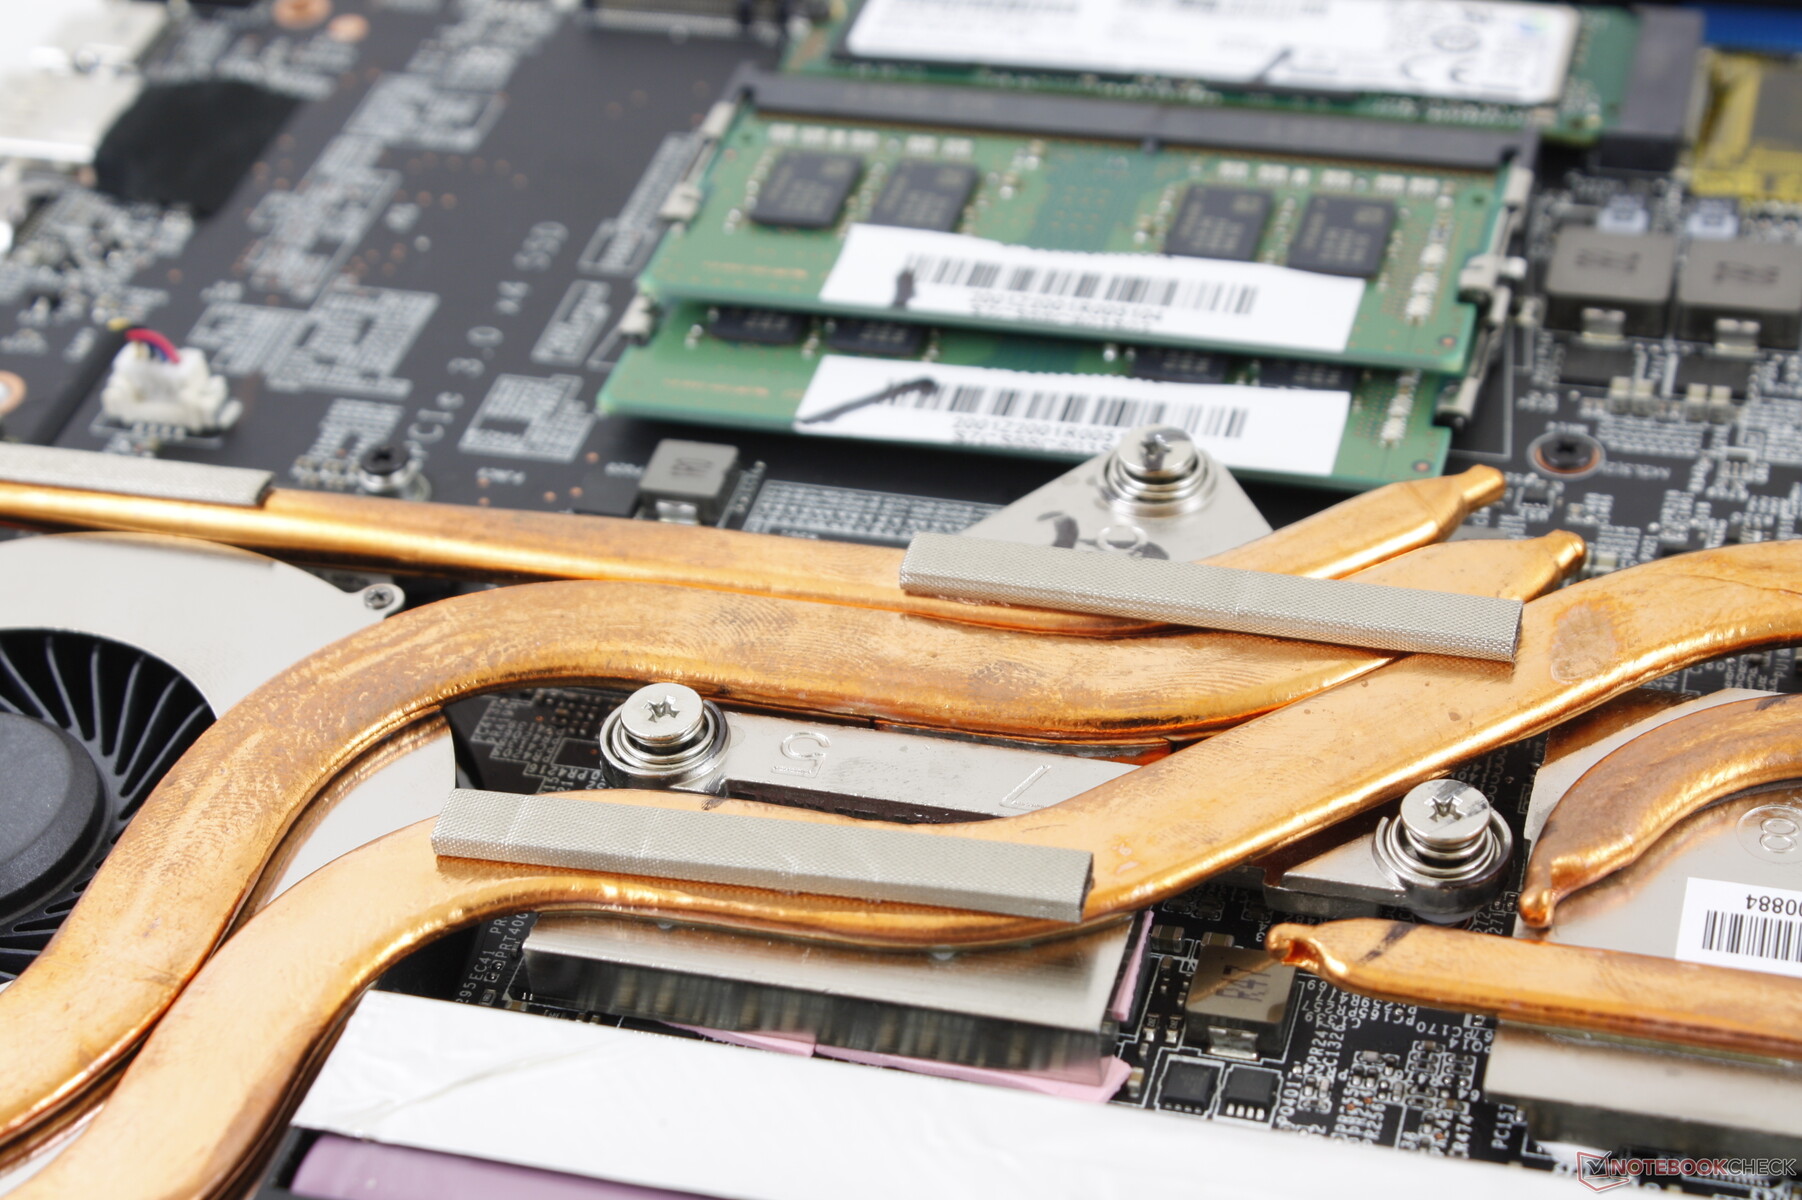
Ruido de sistema
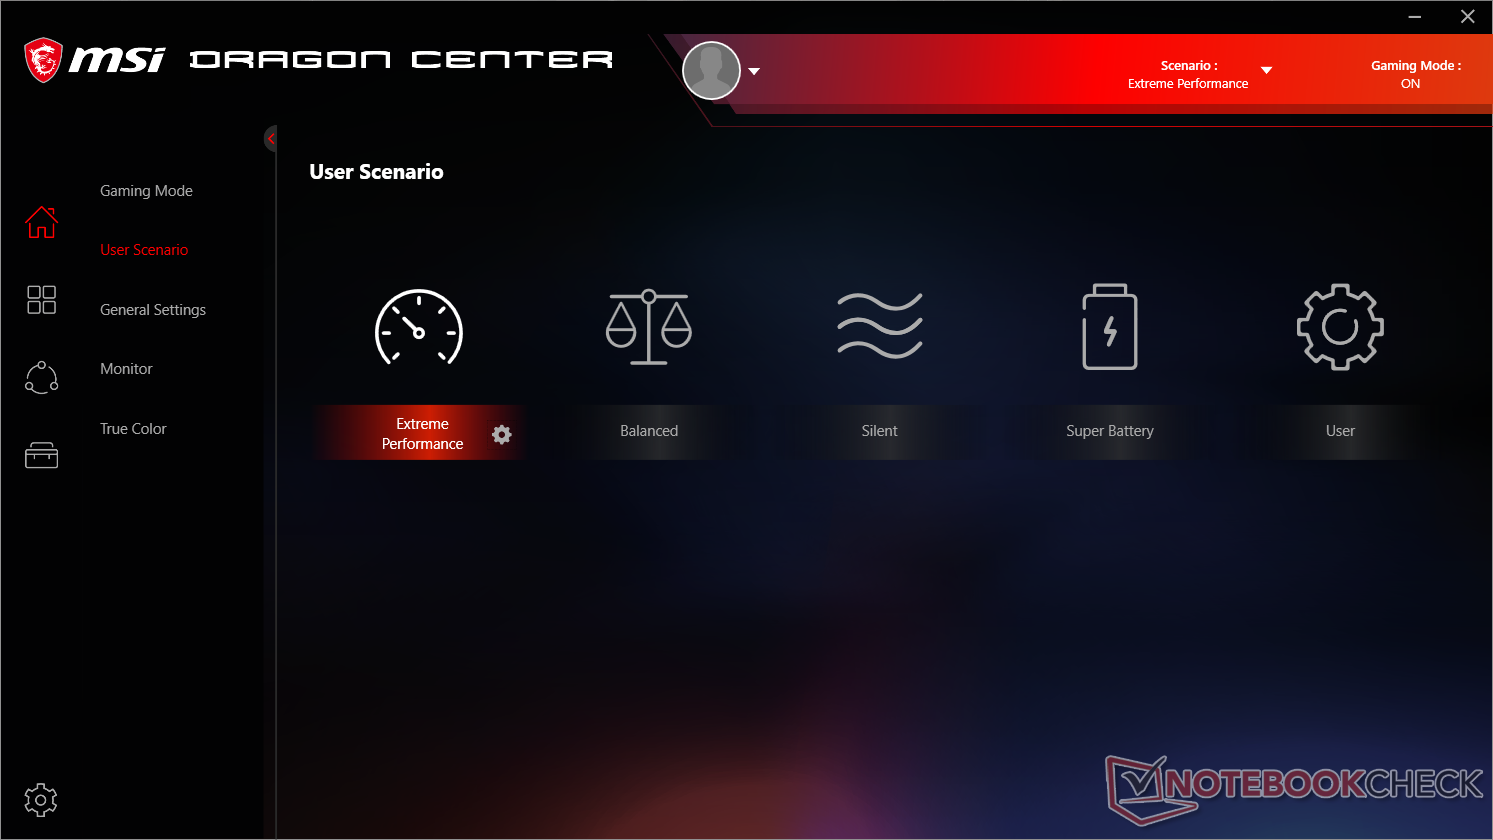
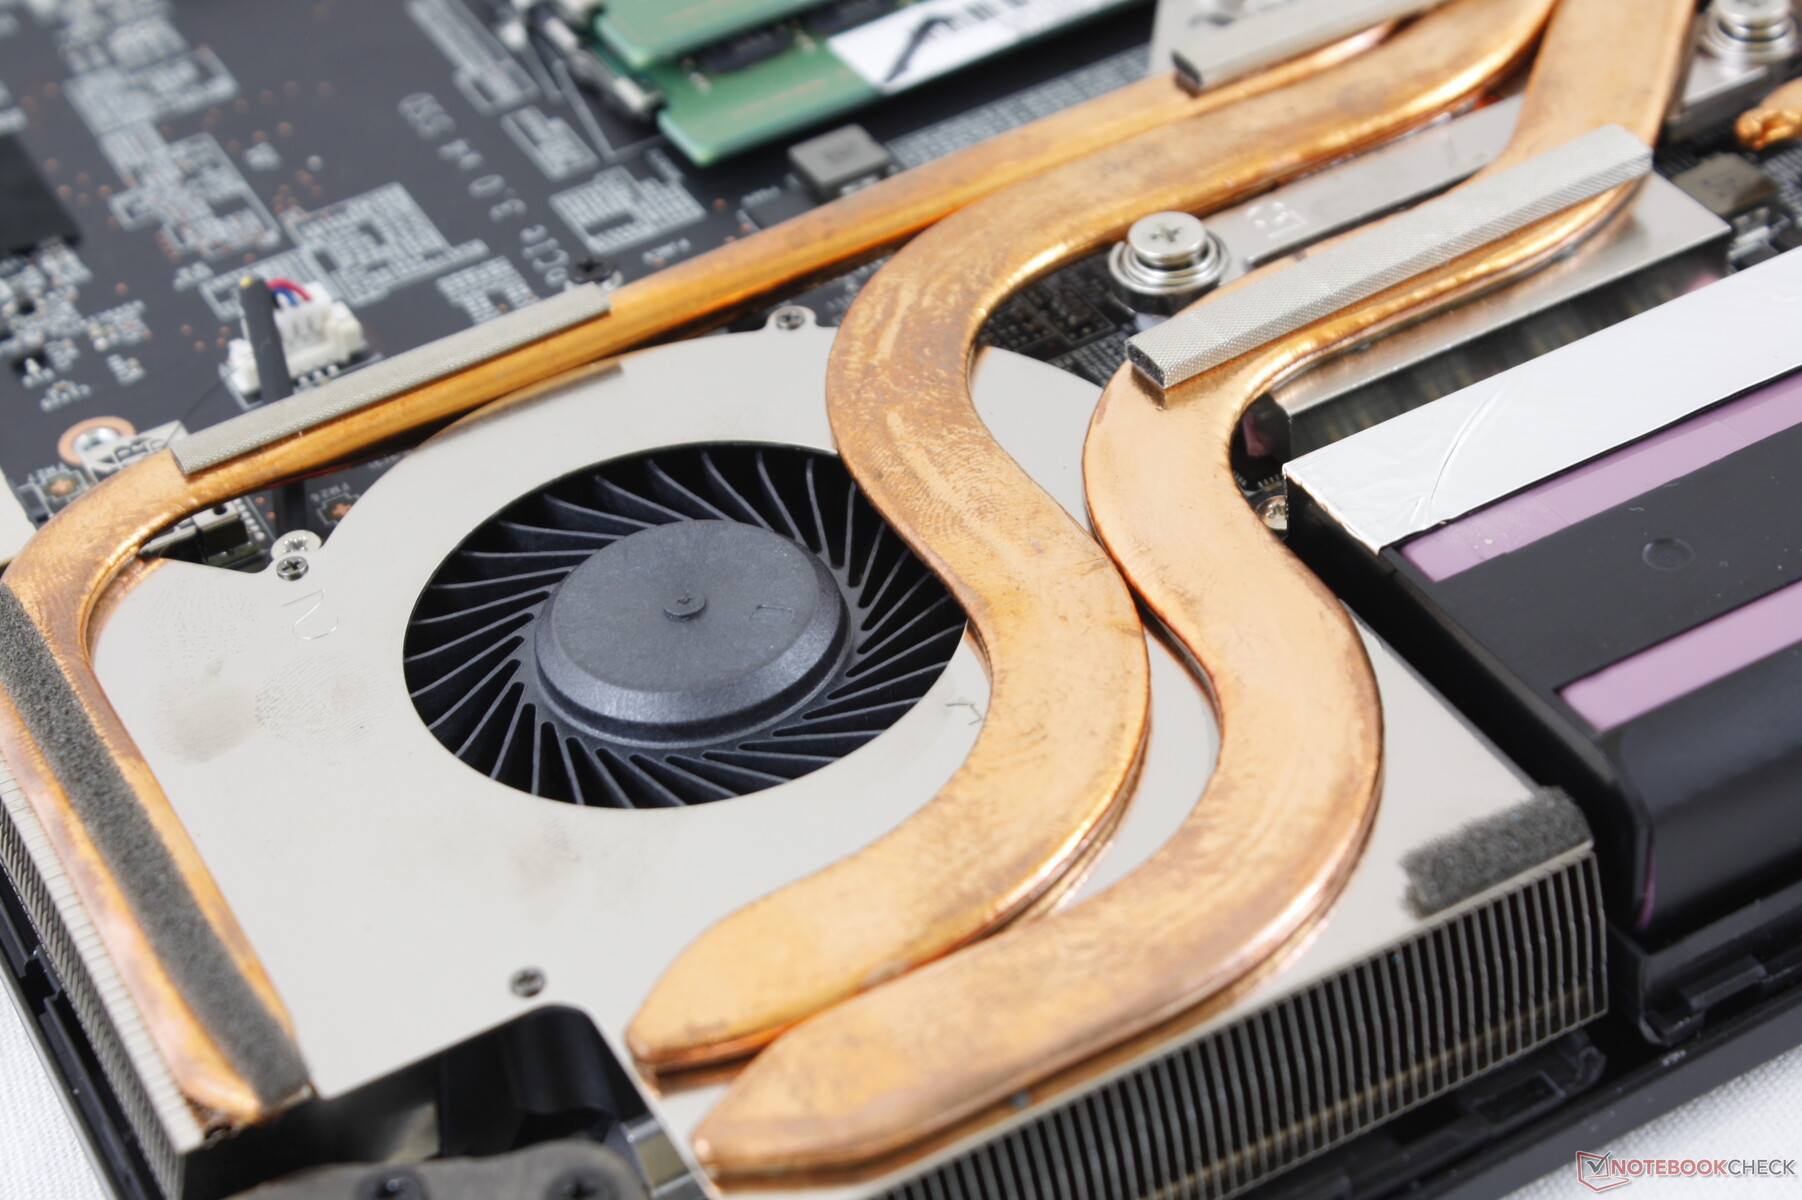
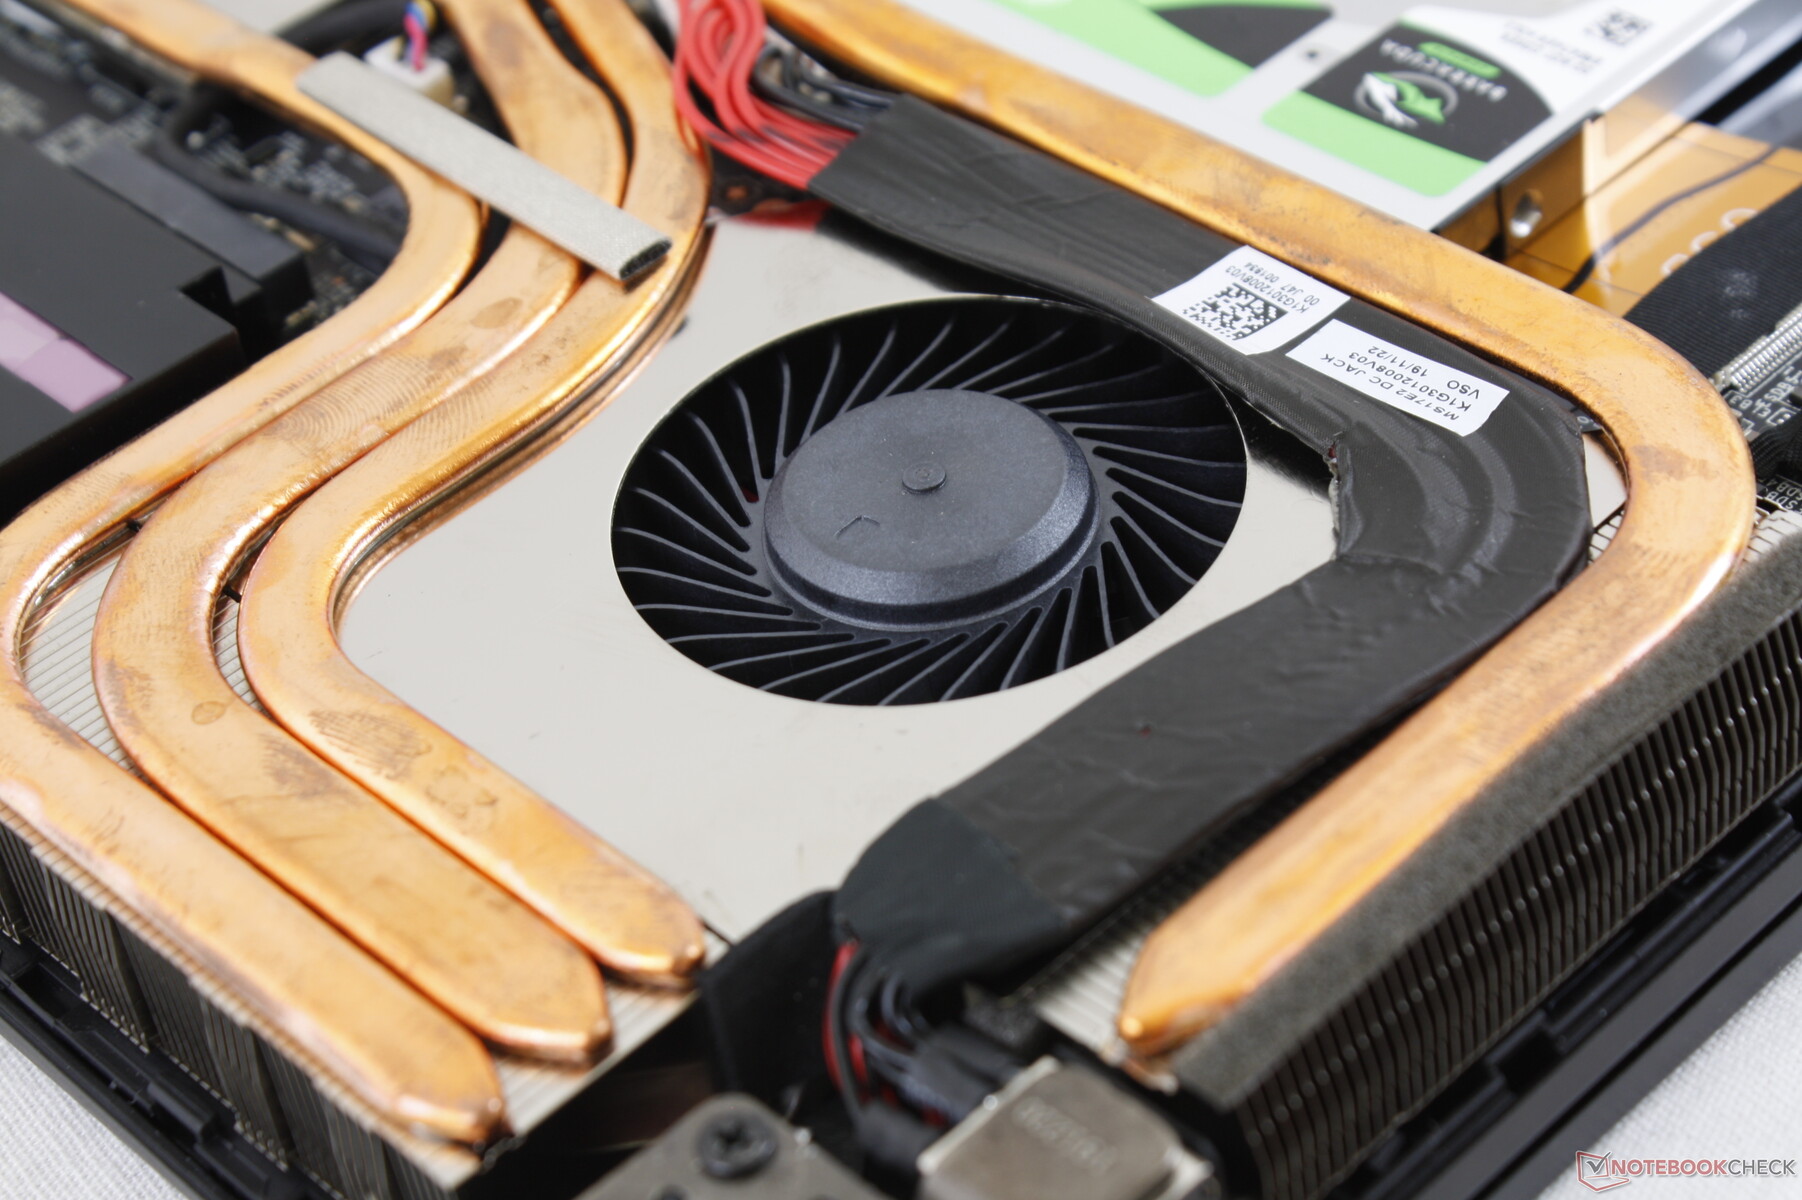
Tanto la solución de refrigeración como el ruido del ventilador siguen siendo idénticos a los del GE75 del año pasado. Curiosamente, el ruido del ventilador se vuelve esencialmente igual entre el GE75 10SE alimentado por el RTX 2060 y el GE75 9SG alimentado por el RTX 2080 cuando se juega a pesar de la gran diferencia de rendimiento de la GPU entre ellos. Los ventiladores casi siempre estarán activos incluso si están ajustados al perfil de potencia "Silencioso" del MSI.
Podemos notar un muy ligero ruido electrónico o el quejido de la bobina de nuestra unidad al colocar una oreja cerca de las teclas del teclado. Afortunadamente no es lo suficientemente agudo como para preocuparse, especialmente porque los ventiladores lo abrumarán.
| MSI GE75 Raider 10SE-008US GeForce RTX 2060 Mobile, i7-10750H, Samsung SSD PM981 MZVLB512HAJQ | MSI GS75 Stealth 9SG GeForce RTX 2080 Max-Q, i7-9750H, 2x Samsung SSD PM981 MZVLB1T0HALR (RAID 0) | Asus Strix Hero III G731GV GeForce RTX 2060 Mobile, i7-9750H, Intel SSD 660p SSDPEKNW512G8 | Lenovo Legion Y740-17IRH GeForce RTX 2060 Mobile, i7-9750H, WDC PC SN520 SDAPMUW-128G | Razer Blade Pro 17 RTX 2060 GeForce RTX 2060 Mobile, i7-9750H, Samsung SSD PM981 MZVLB512HAJQ | Aorus 17G XB GeForce RTX 2070 Super Max-Q, i7-10875H, Samsung SSD PM981a MZVLB512HBJQ | |
|---|---|---|---|---|---|---|
| Noise | -7% | -4% | -8% | 2% | -12% | |
| apagado / medio ambiente * (dB) | 28.4 | 30 -6% | 28.2 1% | 30 -6% | 28.2 1% | 30 -6% |
| Idle Minimum * (dB) | 30.2 | 31 -3% | 29.5 2% | 33 -9% | 28.2 7% | 35 -16% |
| Idle Average * (dB) | 30.2 | 32 -6% | 30.3 -0% | 34 -13% | 28.2 7% | 36 -19% |
| Idle Maximum * (dB) | 32 | 38 -19% | 31.9 -0% | 35 -9% | 28.2 12% | 41 -28% |
| Load Average * (dB) | 33.2 | 47 -42% | 50.4 -52% | 48 -45% | 43 -30% | 47 -42% |
| Witcher 3 ultra * (dB) | 55 | 48 13% | 50.1 9% | 46 16% | 48.4 12% | 48 13% |
| Load Maximum * (dB) | 55 | 49 11% | 50.1 9% | 49 11% | 53.4 3% | 49 11% |
* ... más pequeño es mejor
Ruido
| Ocioso |
| 30.2 / 30.2 / 32 dB(A) |
| Carga |
| 33.2 / 55 dB(A) |
 | ||
30 dB silencioso 40 dB(A) audible 50 dB(A) ruidosamente alto |
||
min: | ||
Temperatura
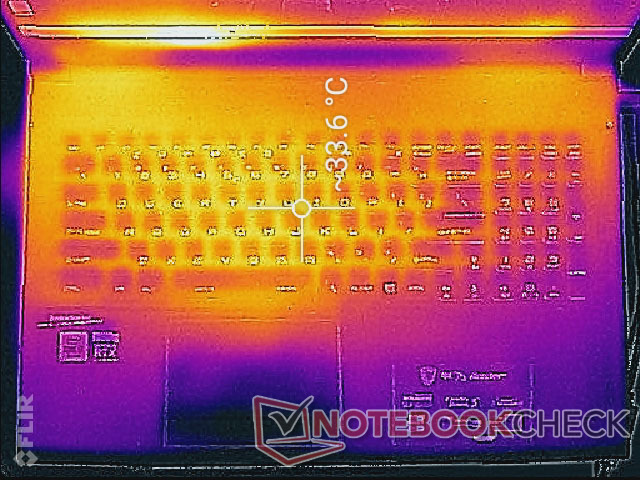
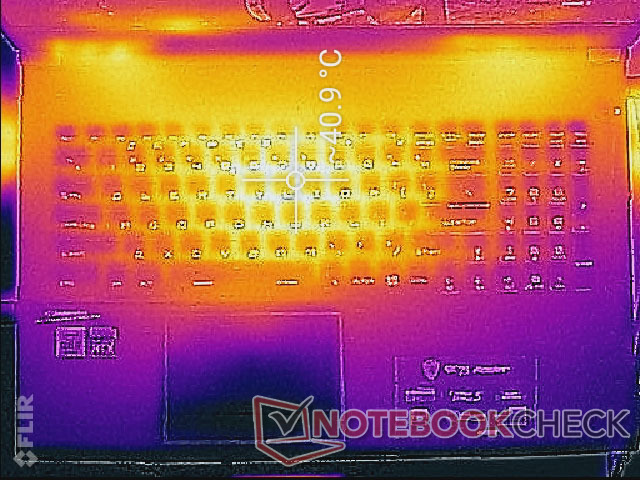
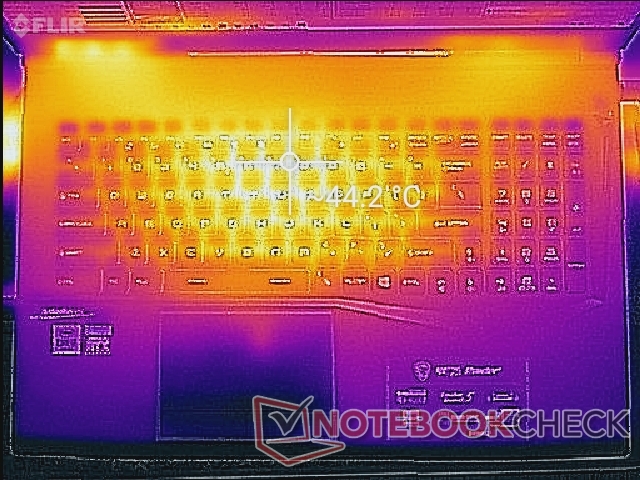
La base relativamente grande permite que los apoyos de la palma de la mano y el teclado de clic permanezcan fríos sin importar la carga de procesamiento, a diferencia de lo que observamos en la súper delgada Razer Blade Pro 17 o MSI GS75. Cuando se juega, estas áreas frontales permanecen por debajo de 30 C en promedio comparado con más de 40 C en las alternativas mencionadas. Los puntos calientes en el centro del teclado pueden alcanzar poco más de 44 C, pero las teclas principales WASD nunca se calientan incómodamente.
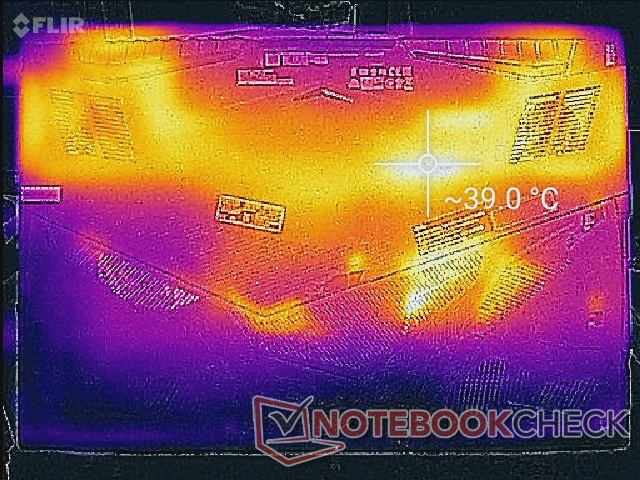
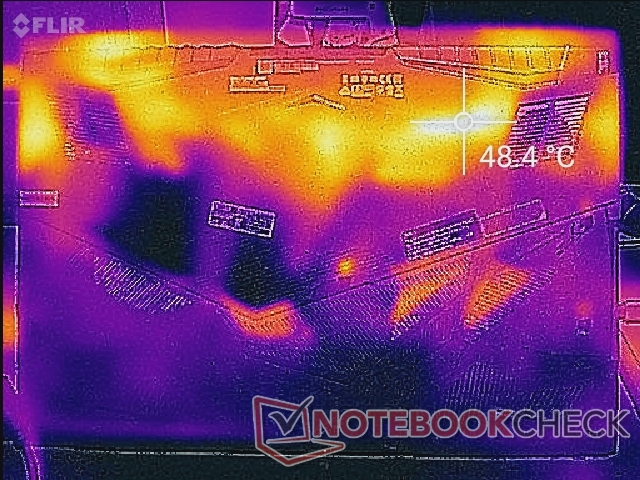
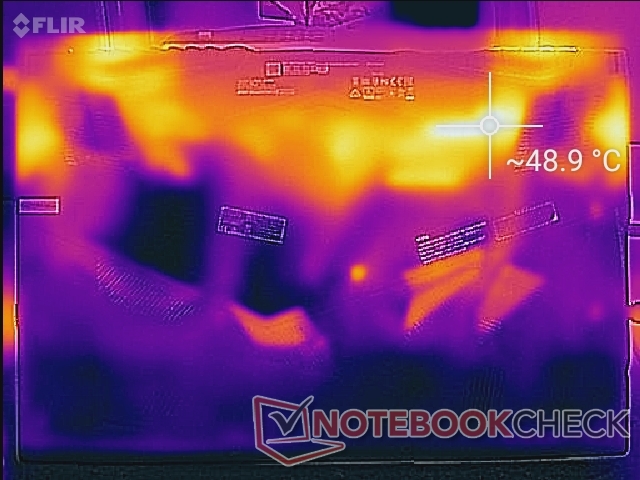
El exceso de calor sale de cuatro puntos diferentes a lo largo de los lados, así que asegúrate de dejar suficiente espacio para respirar alrededor del sistema.
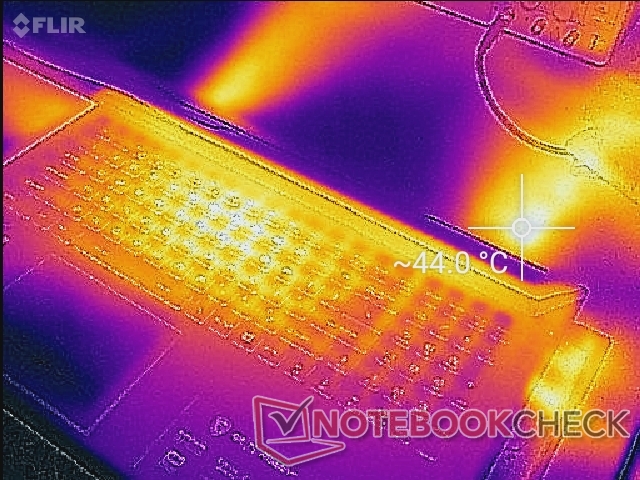
(±) La temperatura máxima en la parte superior es de 44.2 °C / 112 F, frente a la media de 40.4 °C / 105 F, que oscila entre 21.2 y 68.8 °C para la clase Gaming.
(-) El fondo se calienta hasta un máximo de 49 °C / 120 F, frente a la media de 43.2 °C / 110 F
(+) En reposo, la temperatura media de la parte superior es de 31.2 °C / 88# F, frente a la media del dispositivo de 33.9 °C / 93 F.
(±) Jugando a The Witcher 3, la temperatura media de la parte superior es de 33.6 °C / 92 F, frente a la media del dispositivo de 33.9 °C / 93 F.
(+) El reposamanos y el panel táctil están a una temperatura inferior a la de la piel, con un máximo de 29.2 °C / 84.6 F y, por tanto, son fríos al tacto.
(±) La temperatura media de la zona del reposamanos de dispositivos similares fue de 28.8 °C / 83.8 F (-0.4 °C / -0.8 F).
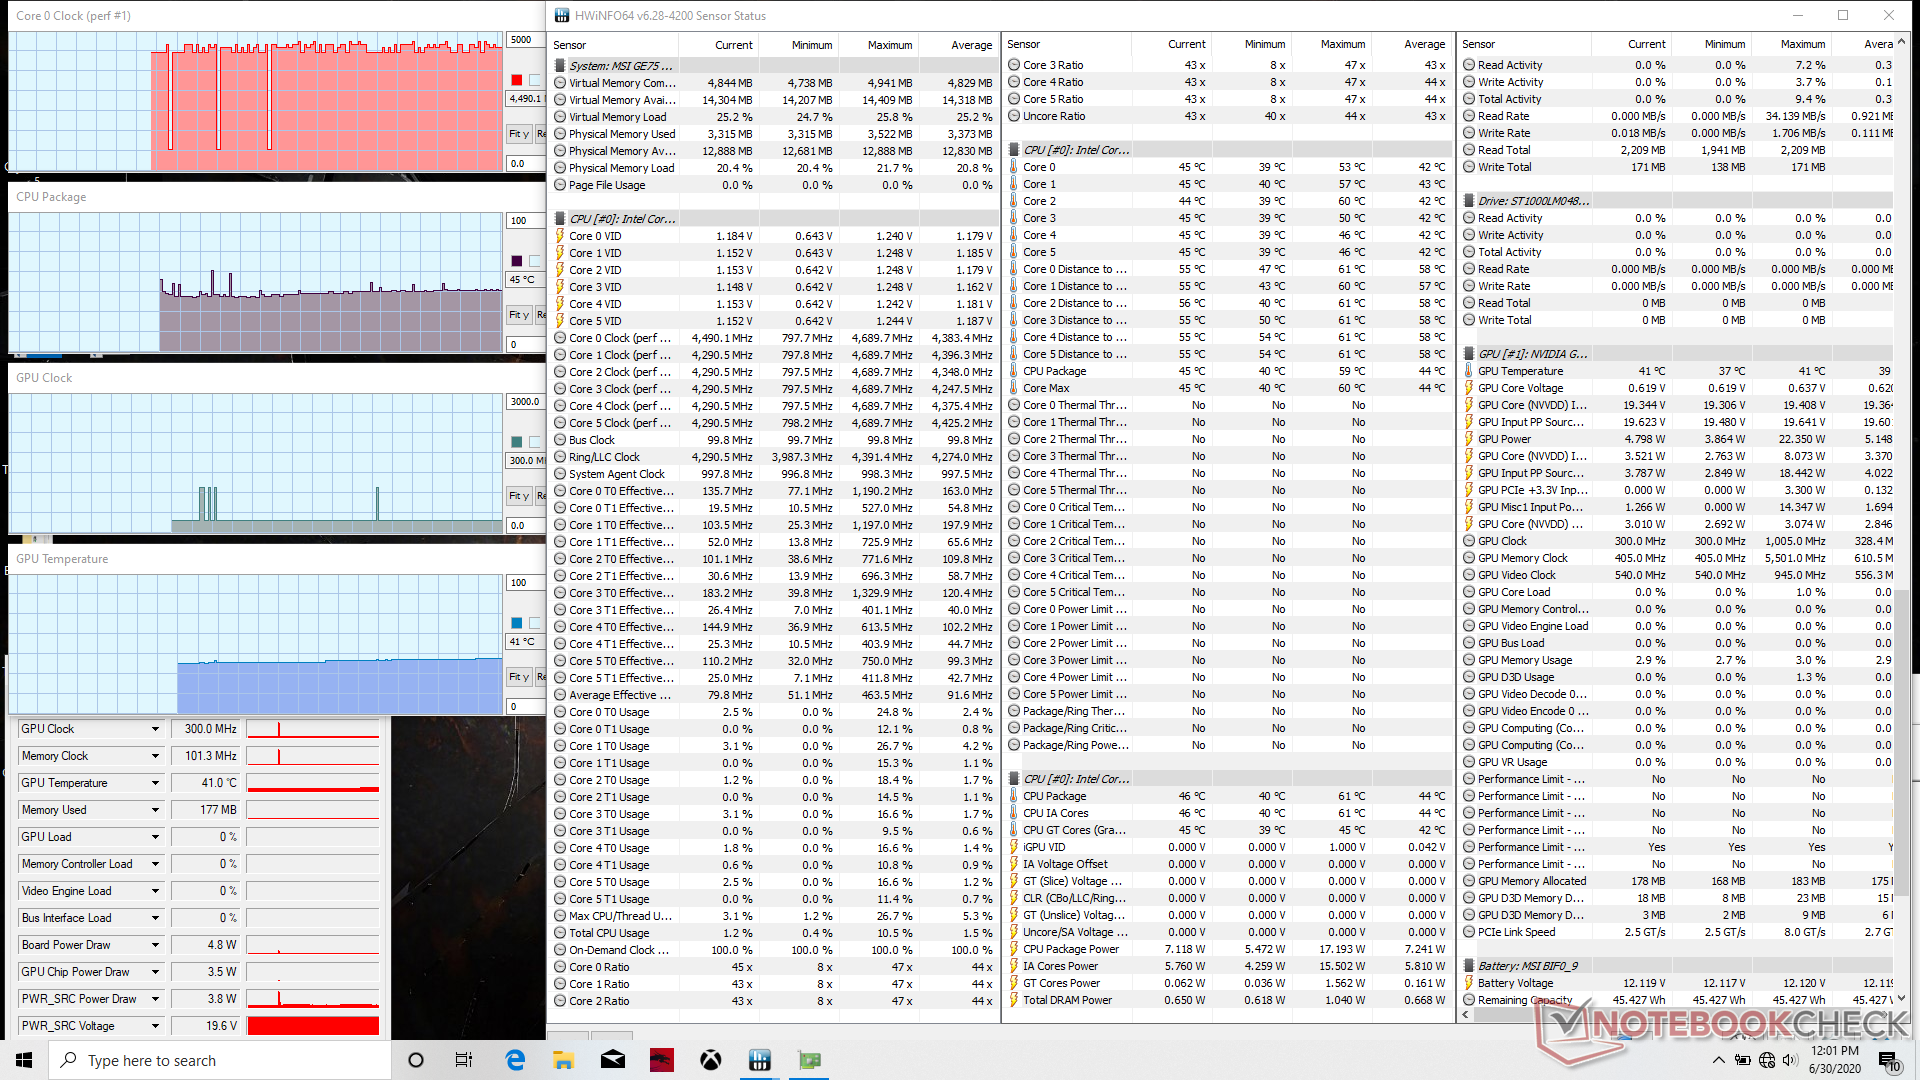
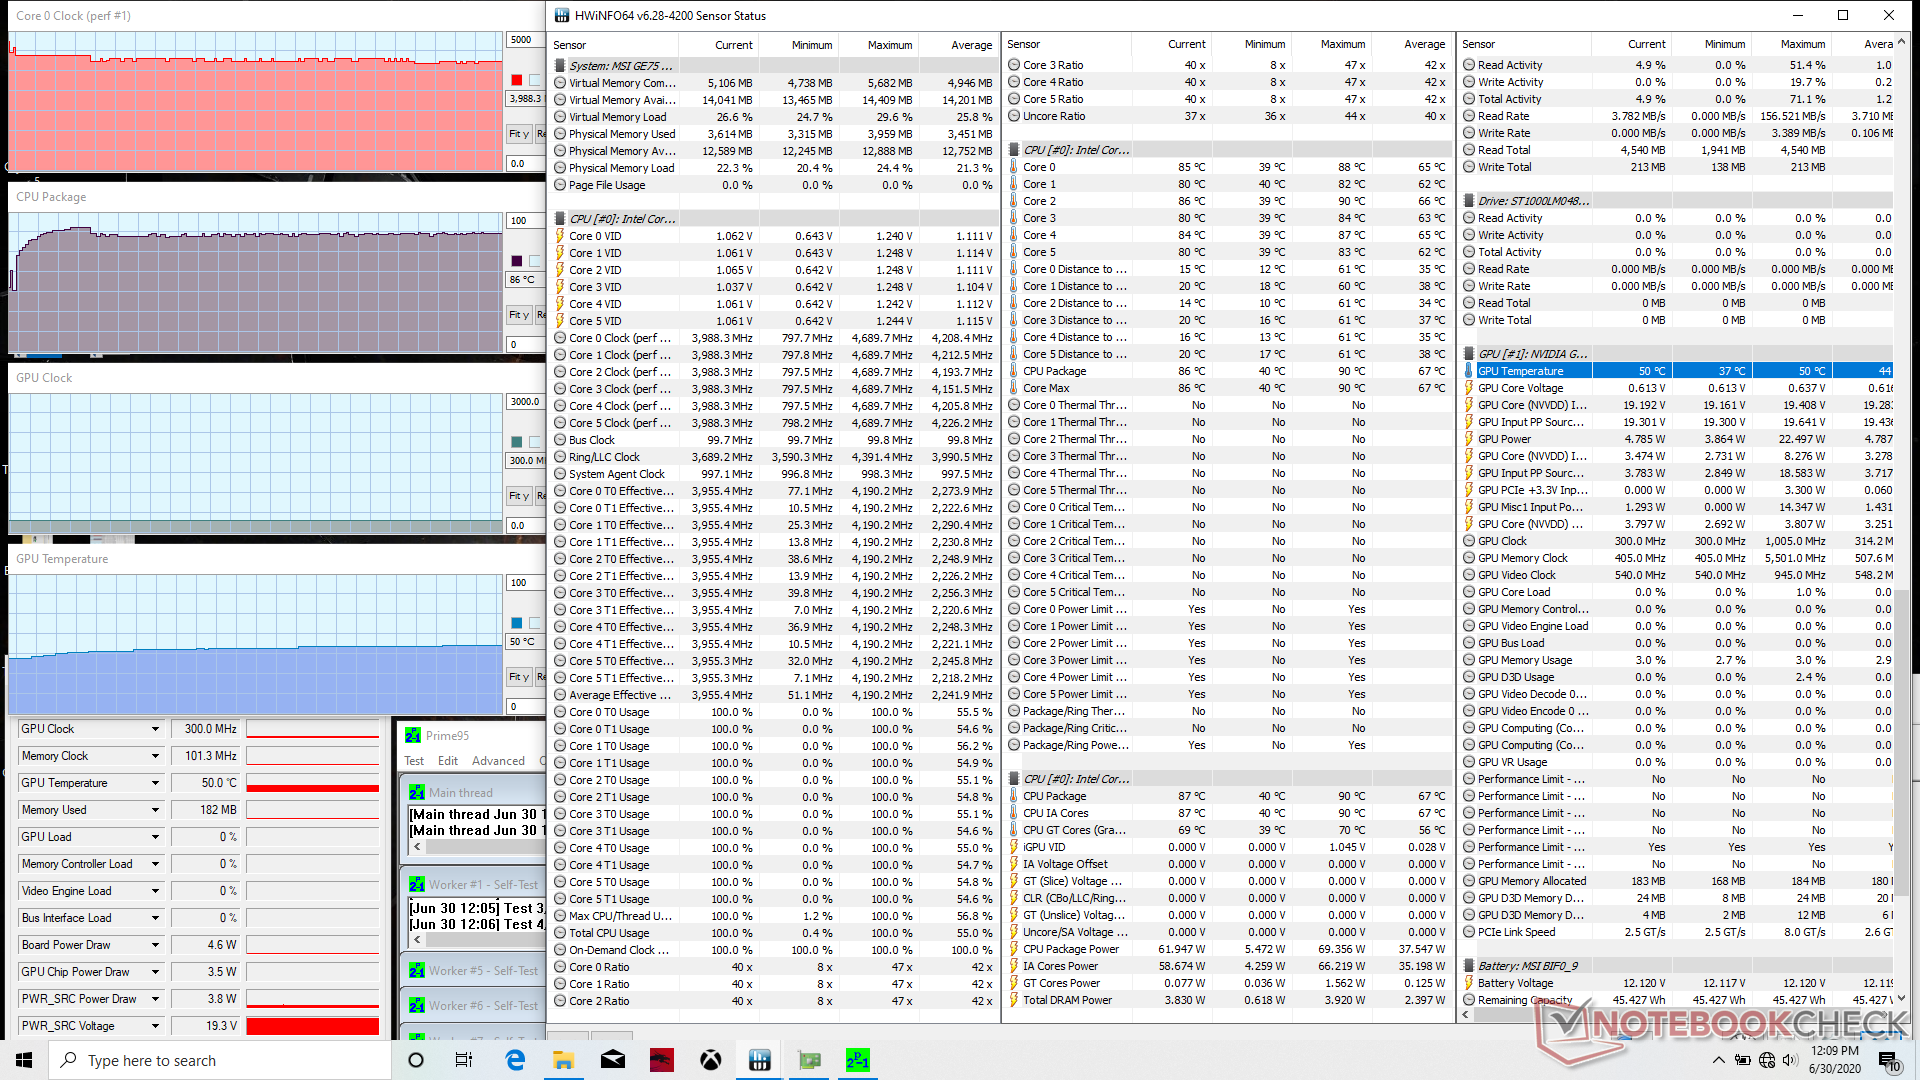
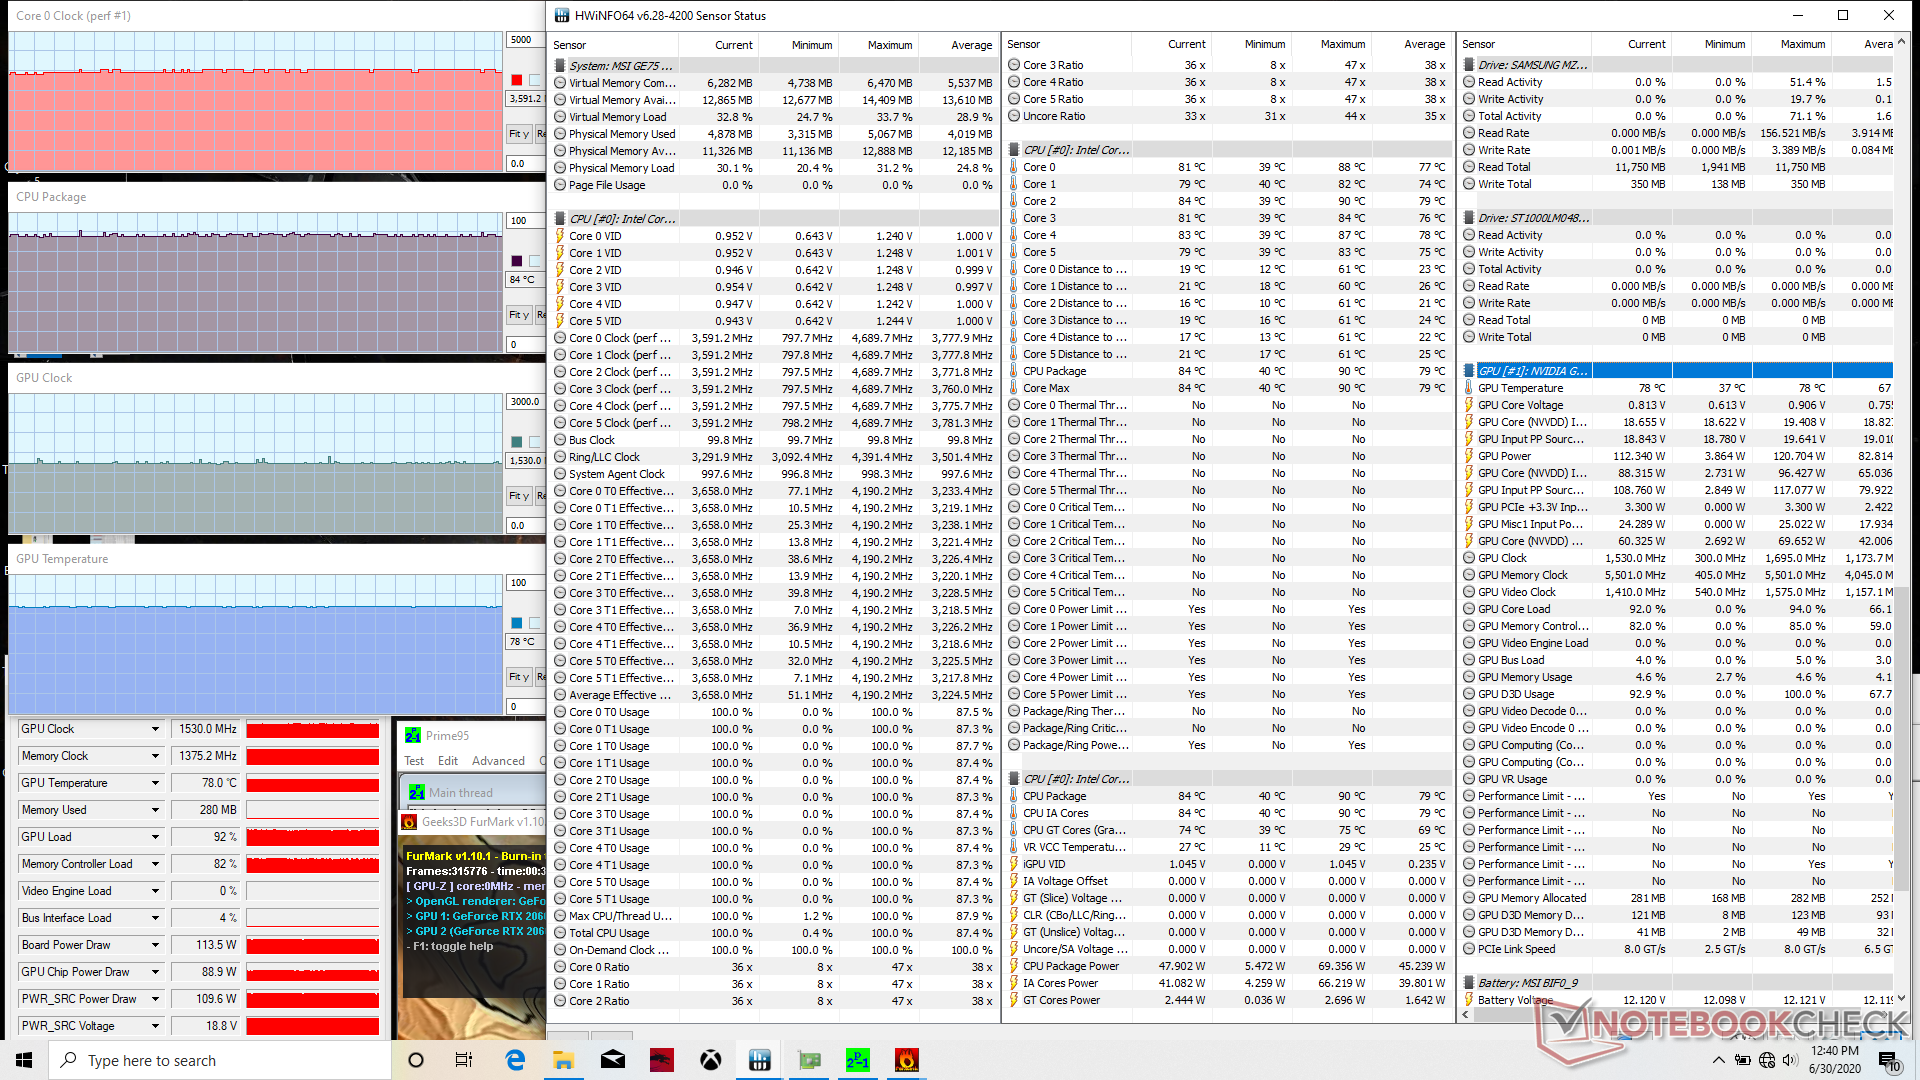
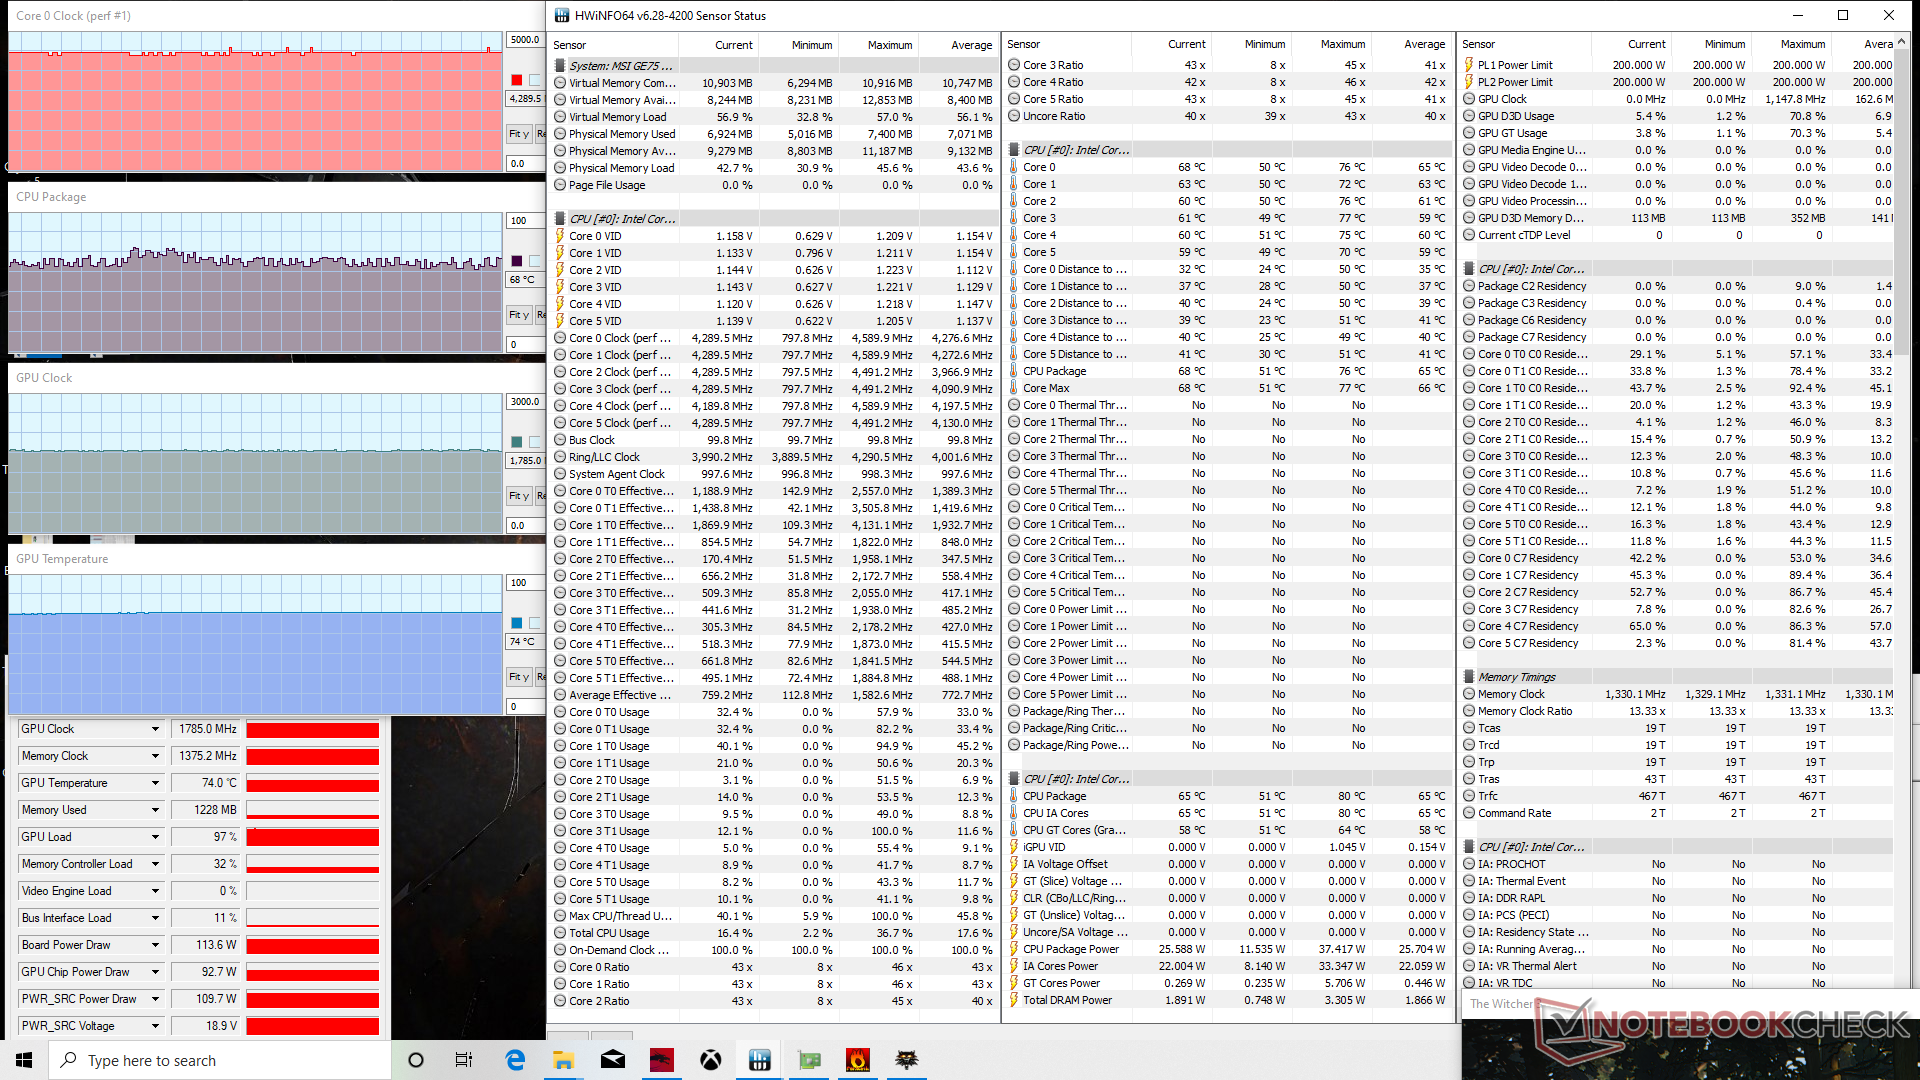
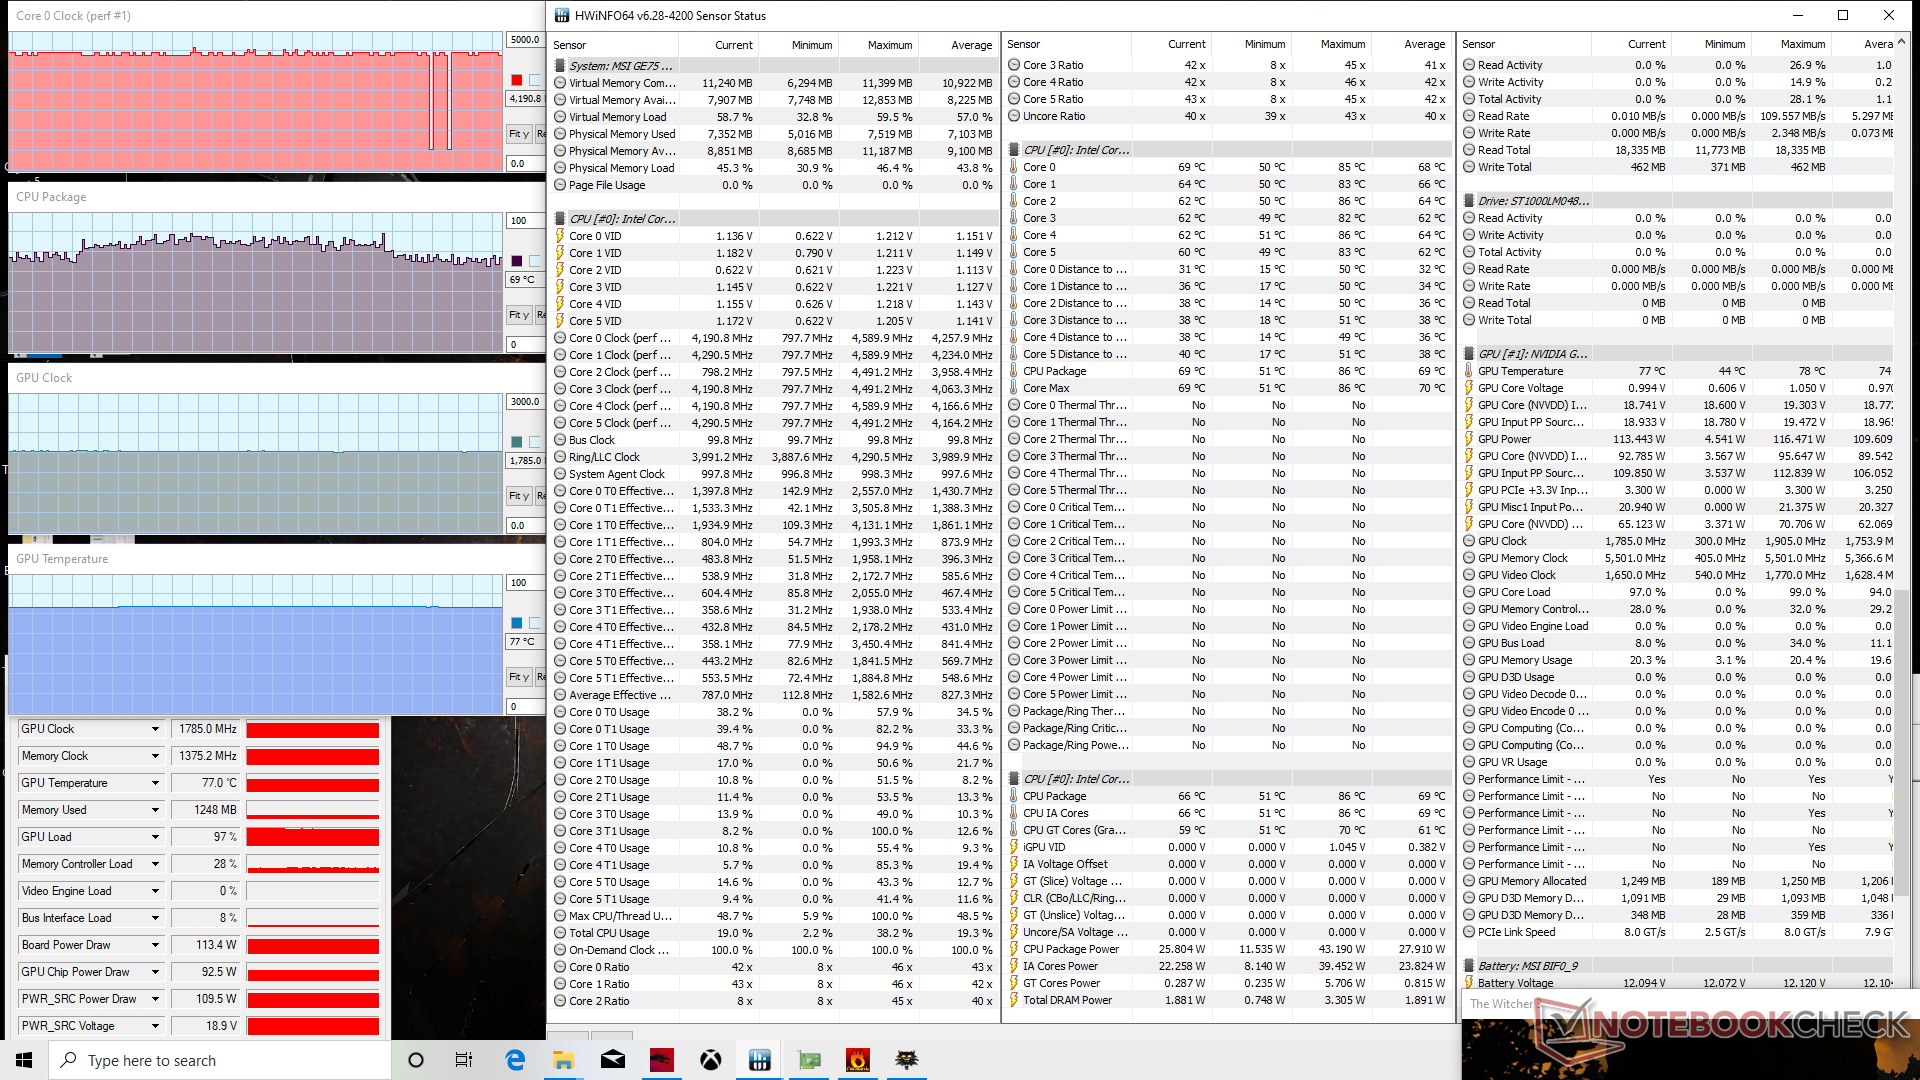
Prueba de estrés
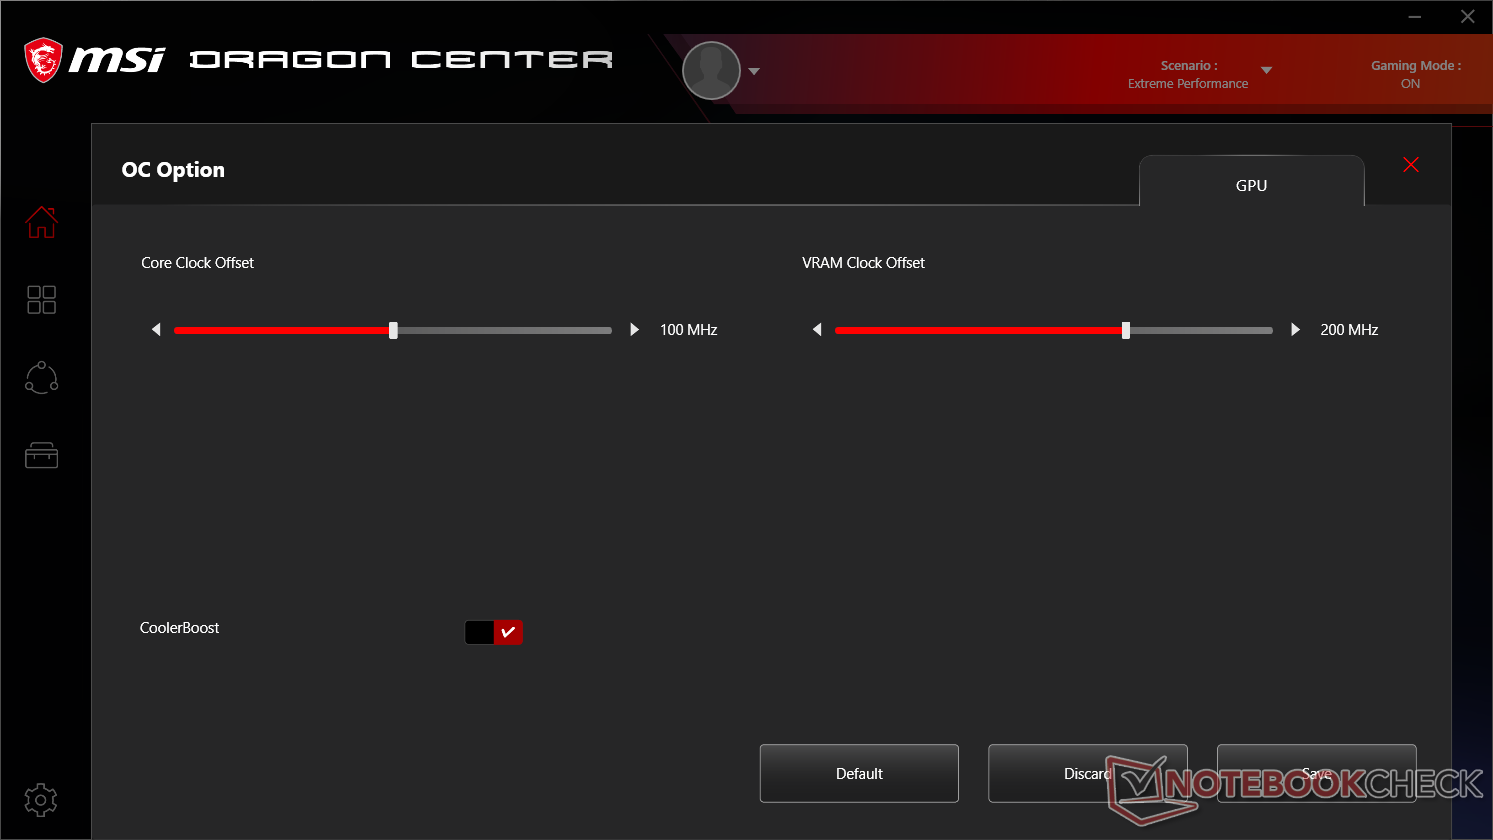
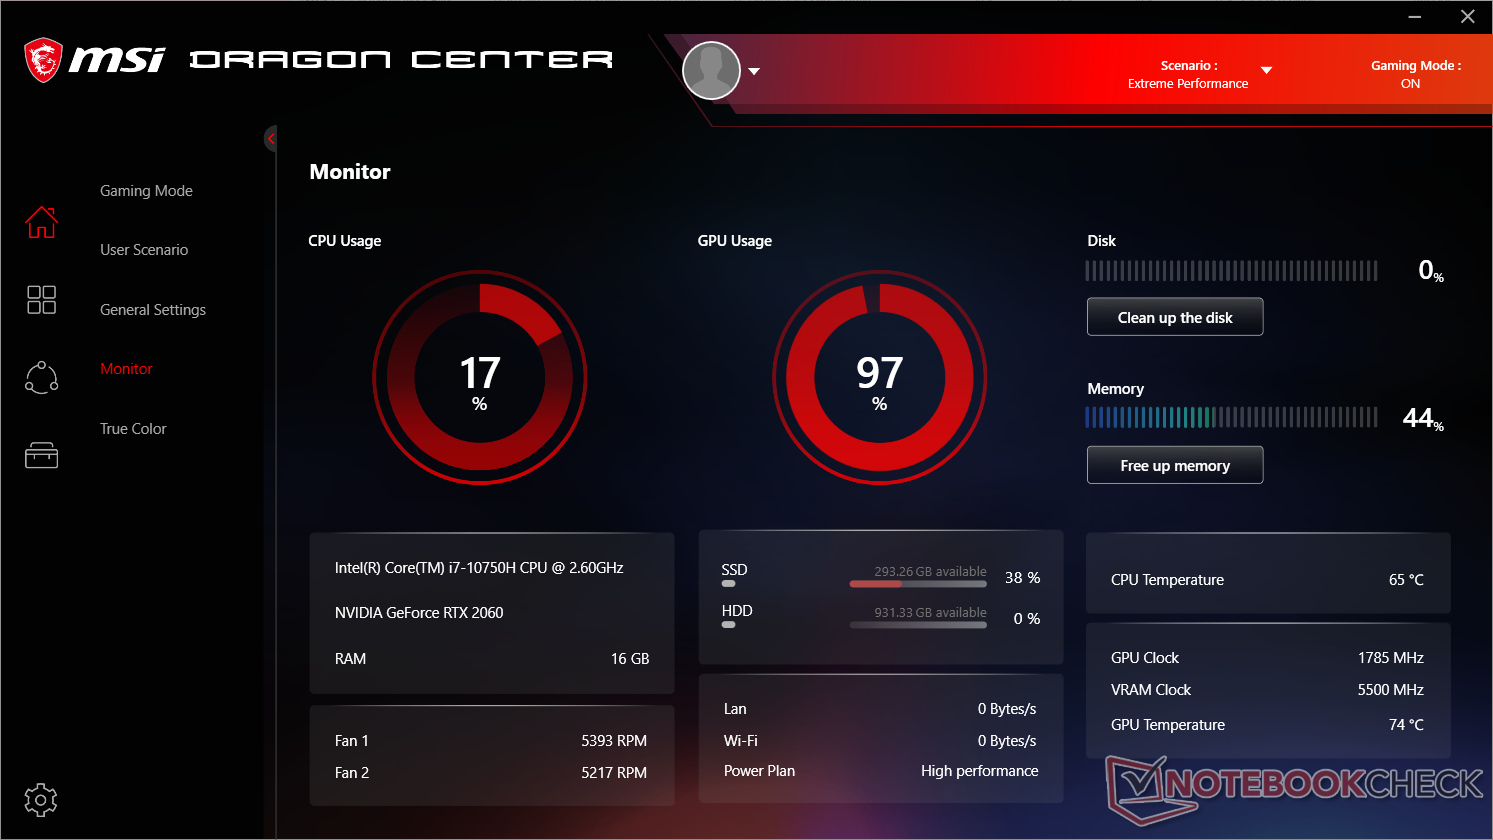
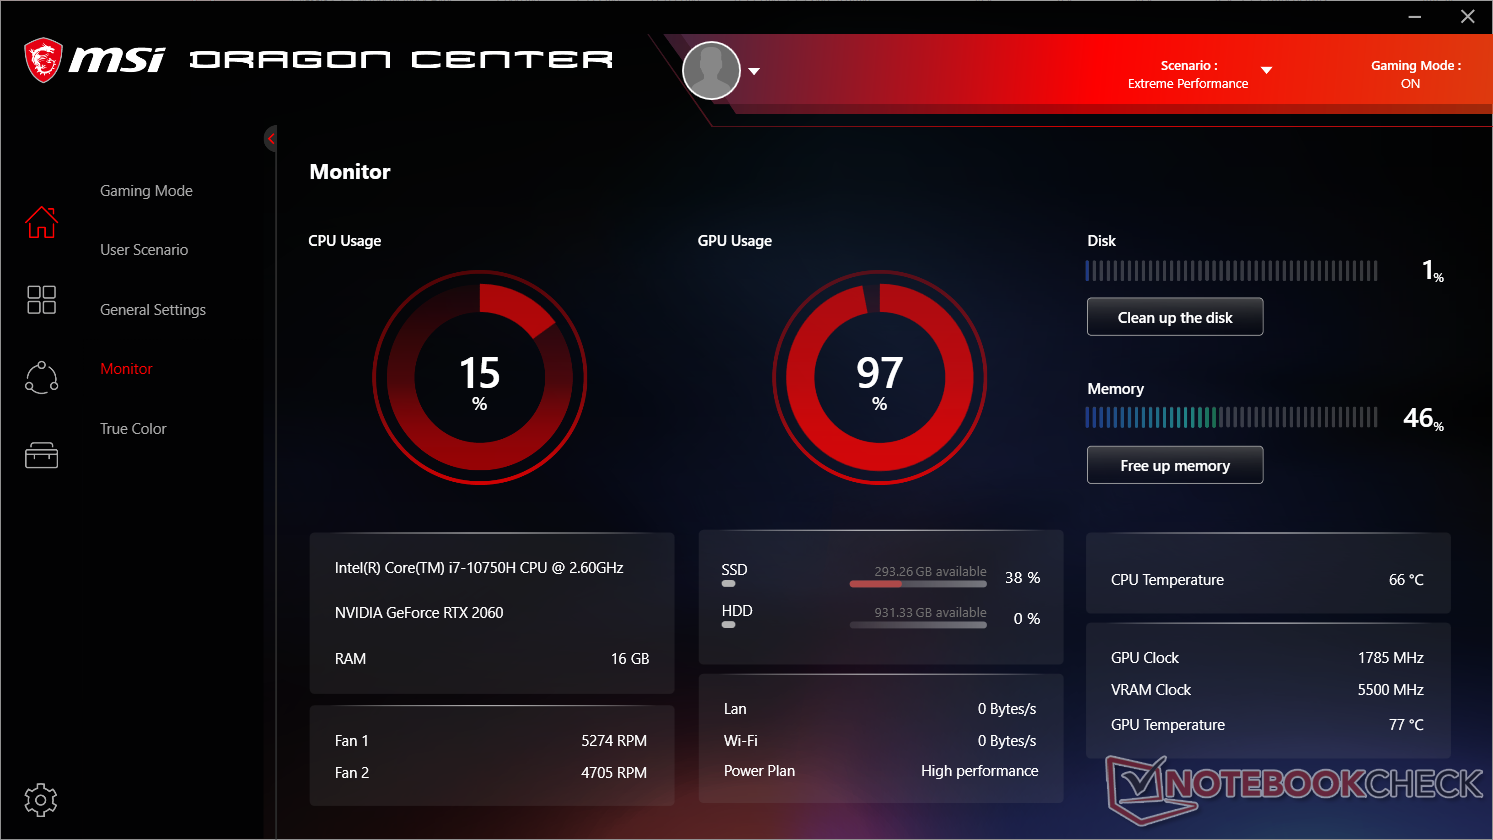
When running Prime95, the CPU would boost to 4.2 GHz for about a minute before hitting a core temperature of 90 C. Thereafter, clock rates drop to the 3.9 - 4.0 GHz range in order to maintain a stable core temperature of 85 C. When running Witcher 3, CPU and GPU temperature would stabilize at around 68 C and 77 C, respectively, compared to 80 C and 68 C on the Asus Strix Hero III G731GV under similar conditions. Interestingly, enabling Cooler Boost results in no noticeable performance advantages.
Running on batteries will impact performance. A Fire Strike test on battery power returns Physics and Graphics scores of 11890 and 4630 points, respectively, compared to 18205 and 18114 points when on mains.
| CPU Clock (GHz) | GPU Clock (MHz) | Average CPU Temperature (°C) | Average GPU Temperature (°C) | |
| System Idle | -- | -- | 45 | 41 |
| Prime95 Stress | 4.0 | -- | 86 | 50 |
| Prime95 + FurMark Stress | 3.6 - 3.7 | 1530 | 84 | 78 |
| Witcher 3 Stress (Cooler Boost off) | 4.3 | 1785 | ~68 | 77 |
| Witcher 3 Stress (Cooler Boost on) | 4.3 | 1785 | ~68 | 74 |
Altavoces


MSI GE75 Raider 10SE-008US análisis de audio
(+) | los altavoces pueden reproducir a un volumen relativamente alto (#95.5 dB)
Graves 100 - 315 Hz
(-) | casi sin bajos - de media 20.2% inferior a la mediana
(+) | el bajo es lineal (2.2% delta a la frecuencia anterior)
Medios 400 - 2000 Hz
(±) | medios reducidos - de media 5.7% inferior a la mediana
(+) | los medios son lineales (5.9% delta a la frecuencia anterior)
Altos 2 - 16 kHz
(+) | máximos equilibrados - a sólo 2.8% de la mediana
(+) | los máximos son lineales (5% delta a la frecuencia anterior)
Total 100 - 16.000 Hz
(±) | la linealidad del sonido global es media (15.2% de diferencia con la mediana)
En comparación con la misma clase
» 33% de todos los dispositivos probados de esta clase eran mejores, 6% similares, 61% peores
» El mejor tuvo un delta de 6%, la media fue 18%, el peor fue ###max##%
En comparación con todos los dispositivos probados
» 21% de todos los dispositivos probados eran mejores, 4% similares, 74% peores
» El mejor tuvo un delta de 4%, la media fue 24%, el peor fue ###max##%
Apple MacBook 12 (Early 2016) 1.1 GHz análisis de audio
(+) | los altavoces pueden reproducir a un volumen relativamente alto (#83.6 dB)
Graves 100 - 315 Hz
(±) | lubina reducida - en promedio 11.3% inferior a la mediana
(±) | la linealidad de los graves es media (14.2% delta a frecuencia anterior)
Medios 400 - 2000 Hz
(+) | medios equilibrados - a sólo 2.4% de la mediana
(+) | los medios son lineales (5.5% delta a la frecuencia anterior)
Altos 2 - 16 kHz
(+) | máximos equilibrados - a sólo 2% de la mediana
(+) | los máximos son lineales (4.5% delta a la frecuencia anterior)
Total 100 - 16.000 Hz
(+) | el sonido global es lineal (10.2% de diferencia con la mediana)
En comparación con la misma clase
» 7% de todos los dispositivos probados de esta clase eran mejores, 2% similares, 91% peores
» El mejor tuvo un delta de 5%, la media fue 18%, el peor fue ###max##%
En comparación con todos los dispositivos probados
» 5% de todos los dispositivos probados eran mejores, 1% similares, 94% peores
» El mejor tuvo un delta de 4%, la media fue 24%, el peor fue ###max##%
Gestión de la energía
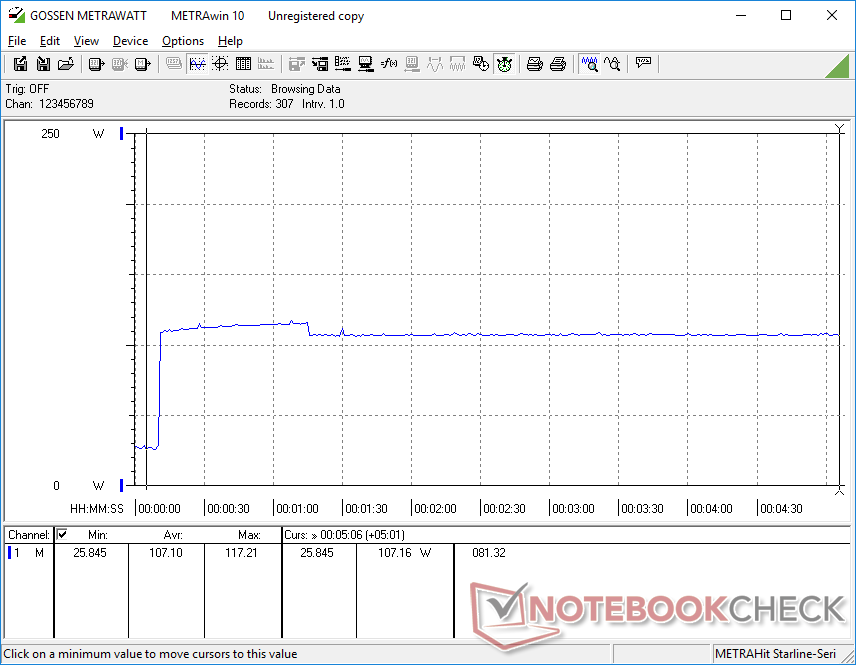
Consumo de energía
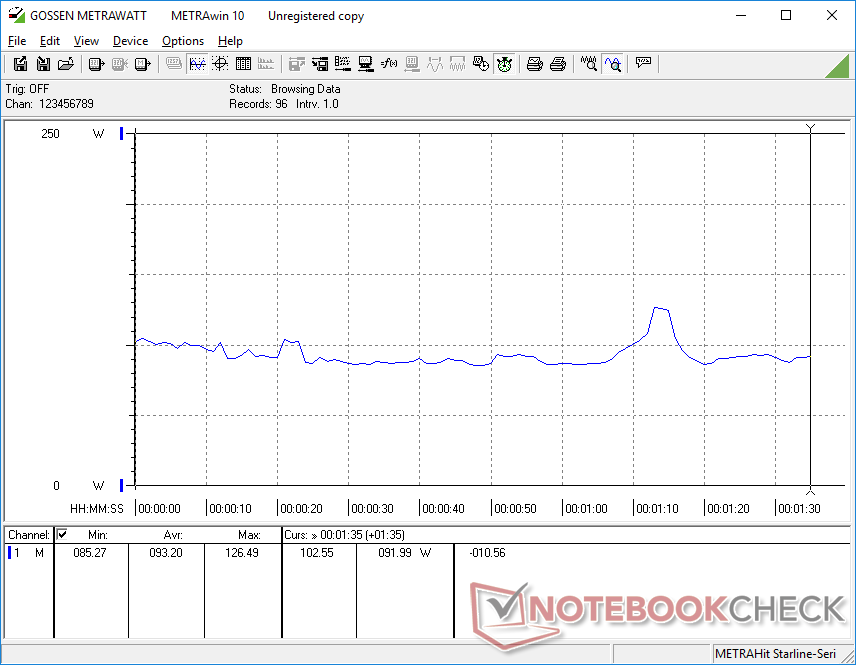
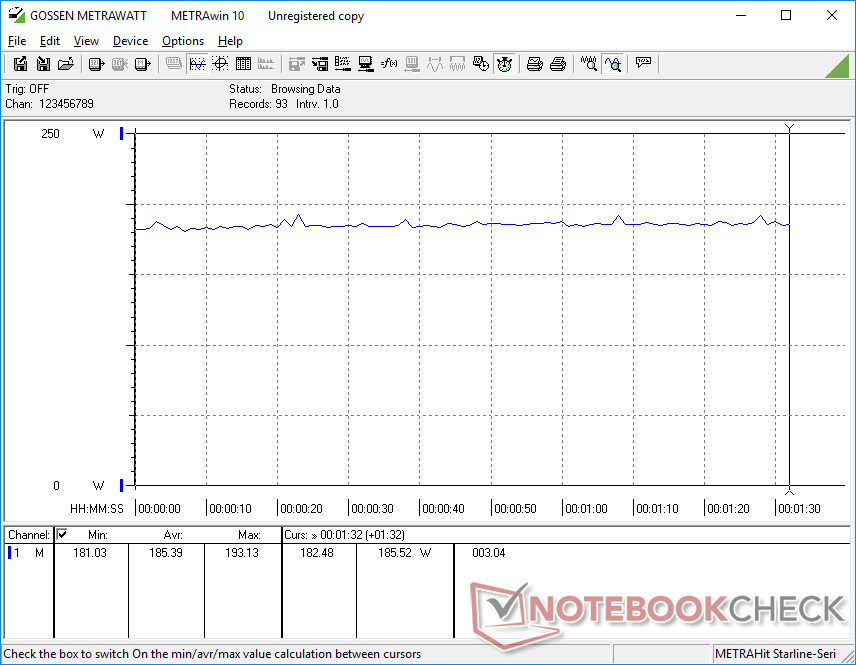
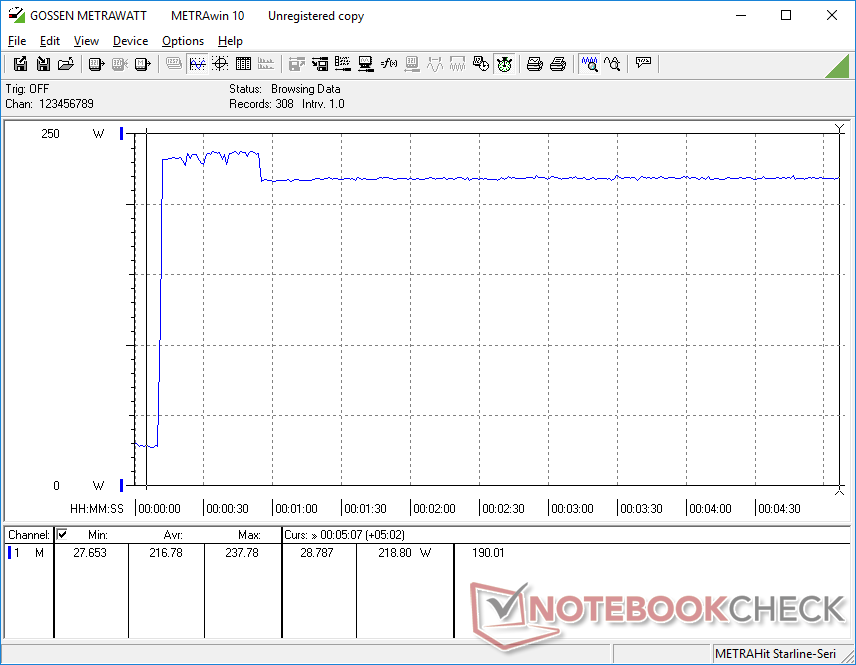
El ralentí exige entre 14 W y 27 W dependiendo del perfil de potencia, brillo y ajuste de la GPU. El consumo de energía al ejecutar Witcher 3 es mayor de lo esperado con 185 W en comparación con 147 W y 162 W en el Asus Strix Hero III G731GV y Razer Blade Pro 17, respectivamente, cada uno con la misma GPU RTX 2060. El mayor consumo se correlaciona en cierta medida con los resultados superiores a la media de 3DMark anteriores.
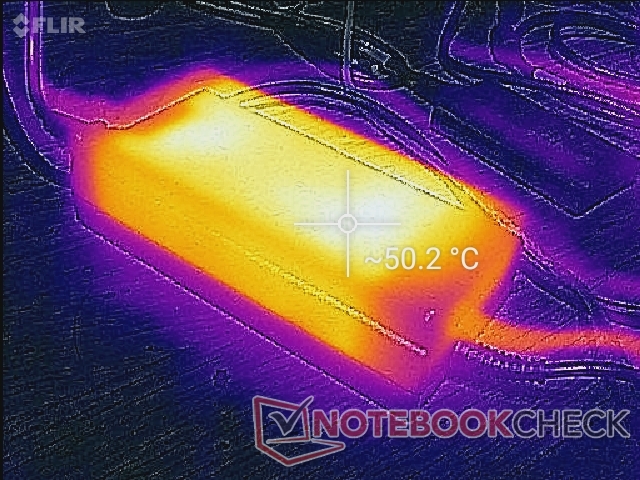
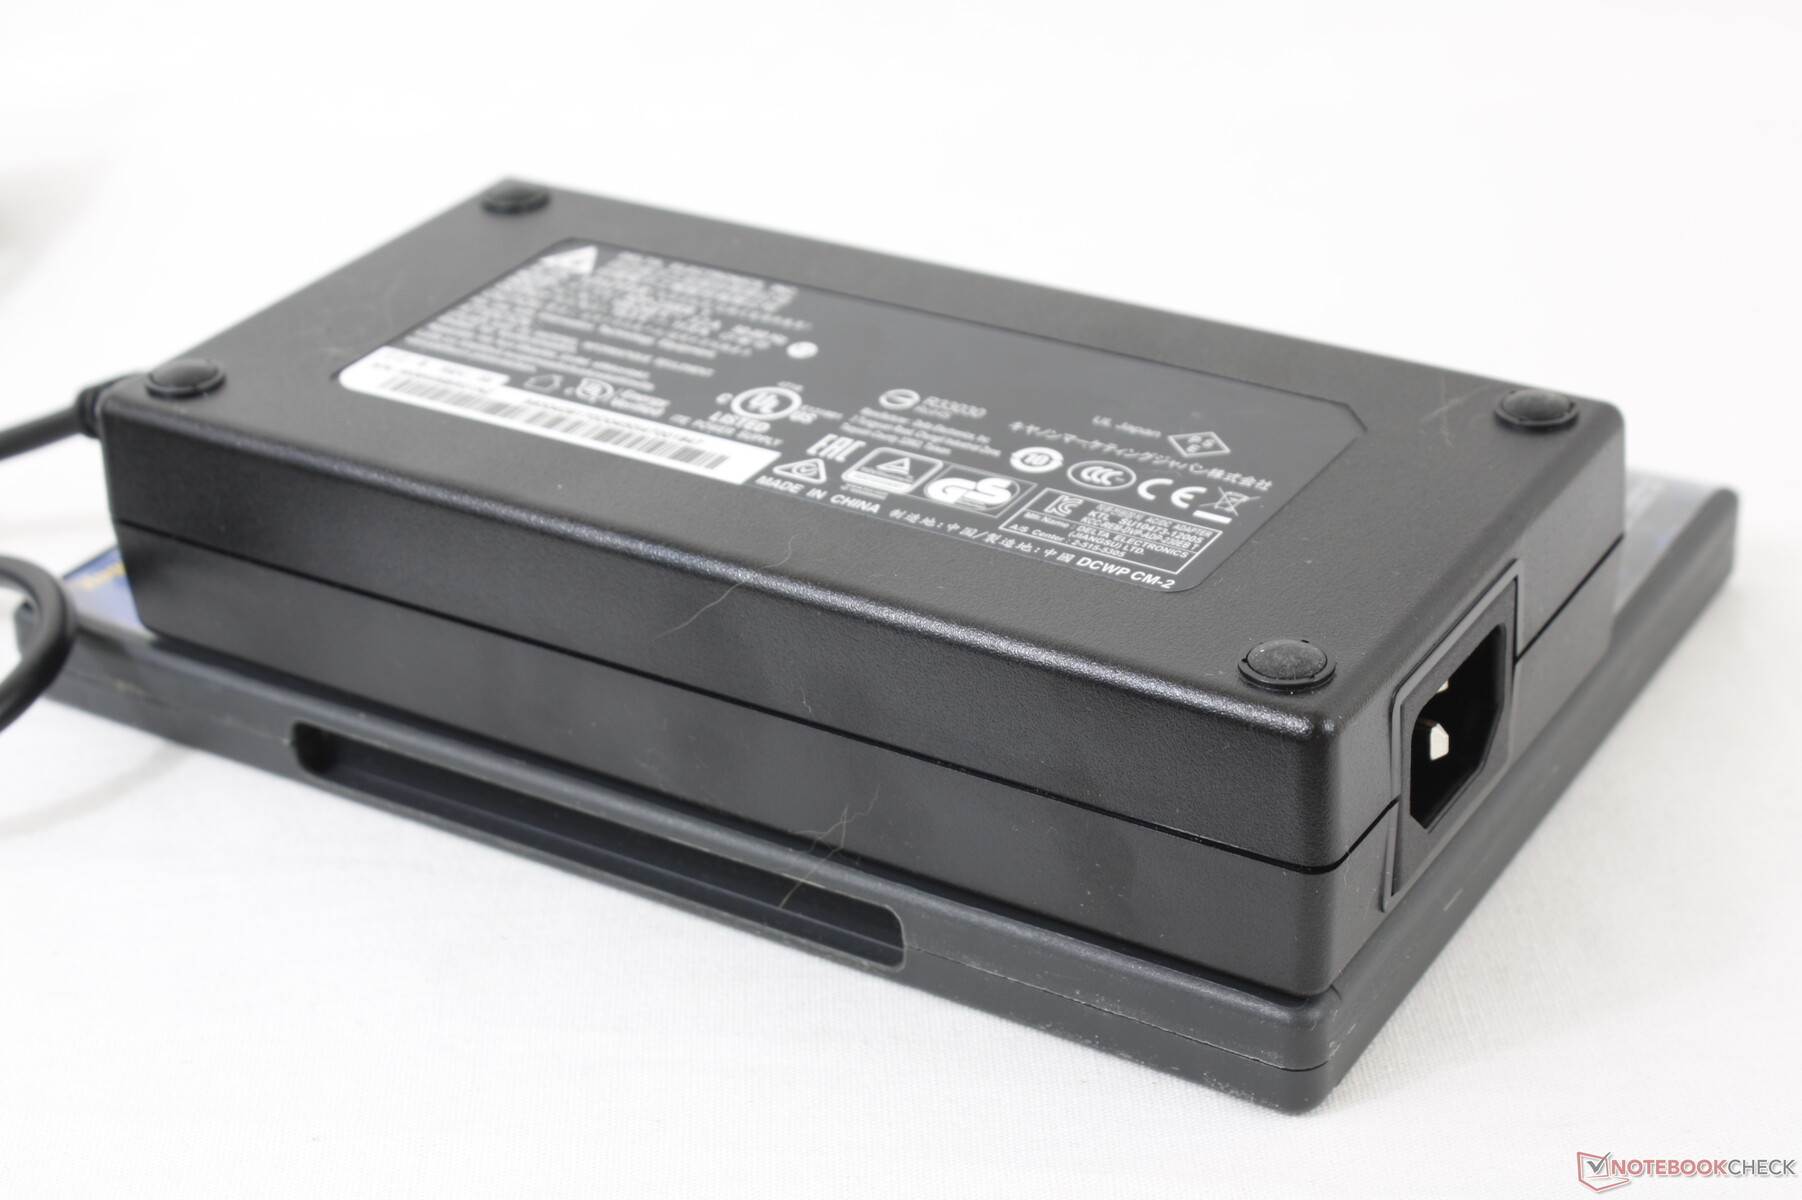
Podemos medir un máximo de 238 W con el relativamente grande adaptador de CA de ~(18 x 8,5 x 3,5 cm) 280 W cuando se ejecutan simultáneamente Prime95 y FurMark.
| Off / Standby | |
| Ocioso | |
| Carga |
|
Clave:
min: | |
| MSI GE75 Raider 10SE-008US i7-10750H, GeForce RTX 2060 Mobile, Samsung SSD PM981 MZVLB512HAJQ, IPS, 1920x1080, 17.3" | MSI GS75 Stealth 9SG i7-9750H, GeForce RTX 2080 Max-Q, 2x Samsung SSD PM981 MZVLB1T0HALR (RAID 0), IPS, 1920x1080, 17.3" | Asus Strix Hero III G731GV i7-9750H, GeForce RTX 2060 Mobile, Intel SSD 660p SSDPEKNW512G8, IPS, 1920x1080, 17.3" | Lenovo Legion Y740-17IRH i7-9750H, GeForce RTX 2060 Mobile, WDC PC SN520 SDAPMUW-128G, IPS, 1920x1080, 17.3" | Razer Blade Pro 17 RTX 2060 i7-9750H, GeForce RTX 2060 Mobile, Samsung SSD PM981 MZVLB512HAJQ, IPS, 1920x1080, 17.3" | Aorus 17G XB i7-10875H, GeForce RTX 2070 Super Max-Q, Samsung SSD PM981a MZVLB512HBJQ, IPS, 1920x1080, 17.3" | |
|---|---|---|---|---|---|---|
| Power Consumption | 8% | -7% | 2% | -1% | -15% | |
| Idle Minimum * (Watt) | 14.7 | 13 12% | 16.2 -10% | 20 -36% | 16 -9% | 20 -36% |
| Idle Average * (Watt) | 20.4 | 17 17% | 24.8 -22% | 21 -3% | 21.7 -6% | 23 -13% |
| Idle Maximum * (Watt) | 26.9 | 25 7% | 28.6 -6% | 26 3% | 26.1 3% | 38 -41% |
| Load Average * (Watt) | 93.2 | 96 -3% | 127.6 -37% | 97 -4% | 105.6 -13% | 105 -13% |
| Witcher 3 ultra * (Watt) | 185.4 | 156 16% | 147.1 21% | 139 25% | 161.8 13% | 158 15% |
| Load Maximum * (Watt) | 237.8 | 239 -1% | 212.7 11% | 168 29% | 225.3 5% | 243 -2% |
* ... más pequeño es mejor
Duración de la batería
Los tiempos de ejecución no han mejorado. Registramos poco menos de 4 horas de uso de la WLAN en el mundo real para ser casi idéntico a lo que registramos en el antiguo MSI GE75 8SF.
El sistema no puede ser recargado a través de USB-C a diferencia del último Razer Blade Pro 17.
| MSI GE75 Raider 10SE-008US i7-10750H, GeForce RTX 2060 Mobile, 65 Wh | MSI GS75 Stealth 9SG i7-9750H, GeForce RTX 2080 Max-Q, 80.25 Wh | Asus Strix Hero III G731GV i7-9750H, GeForce RTX 2060 Mobile, 66 Wh | Lenovo Legion Y740-17IRH i7-9750H, GeForce RTX 2060 Mobile, 76 Wh | Razer Blade Pro 17 RTX 2060 i7-9750H, GeForce RTX 2060 Mobile, 70 Wh | Aorus 17G XB i7-10875H, GeForce RTX 2070 Super Max-Q, 94 Wh | |
|---|---|---|---|---|---|---|
| Duración de Batería | 62% | 22% | 16% | 22% | 103% | |
| WiFi v1.3 (h) | 3.7 | 6 62% | 4.5 22% | 4.3 16% | 4.5 22% | 7.5 103% |
| Reader / Idle (h) | 7.7 | 6.9 | 10 | |||
| Load (h) | 1.2 | 1.1 | 2.2 |
Pro
Contra
Veredicto
El GE75 10SE se enfrenta a las mismas ventajas y desventajas que los modelos más antiguos de 2018 y 2019. El ruido del ventilador, en particular cuando los juegos no son más silenciosos, pero las temperaturas del núcleo son generalmente más bajas y el rendimiento general es más rápido que en otros portátiles para juegos equipados con la misma CPU o GPU. Si quieres sacar el máximo provecho del Core i7-10875H o de la GeForce RTX 2060, entonces ayuda optar por un chasis más grueso como el GE75 en lugar de una alternativa más delgada.
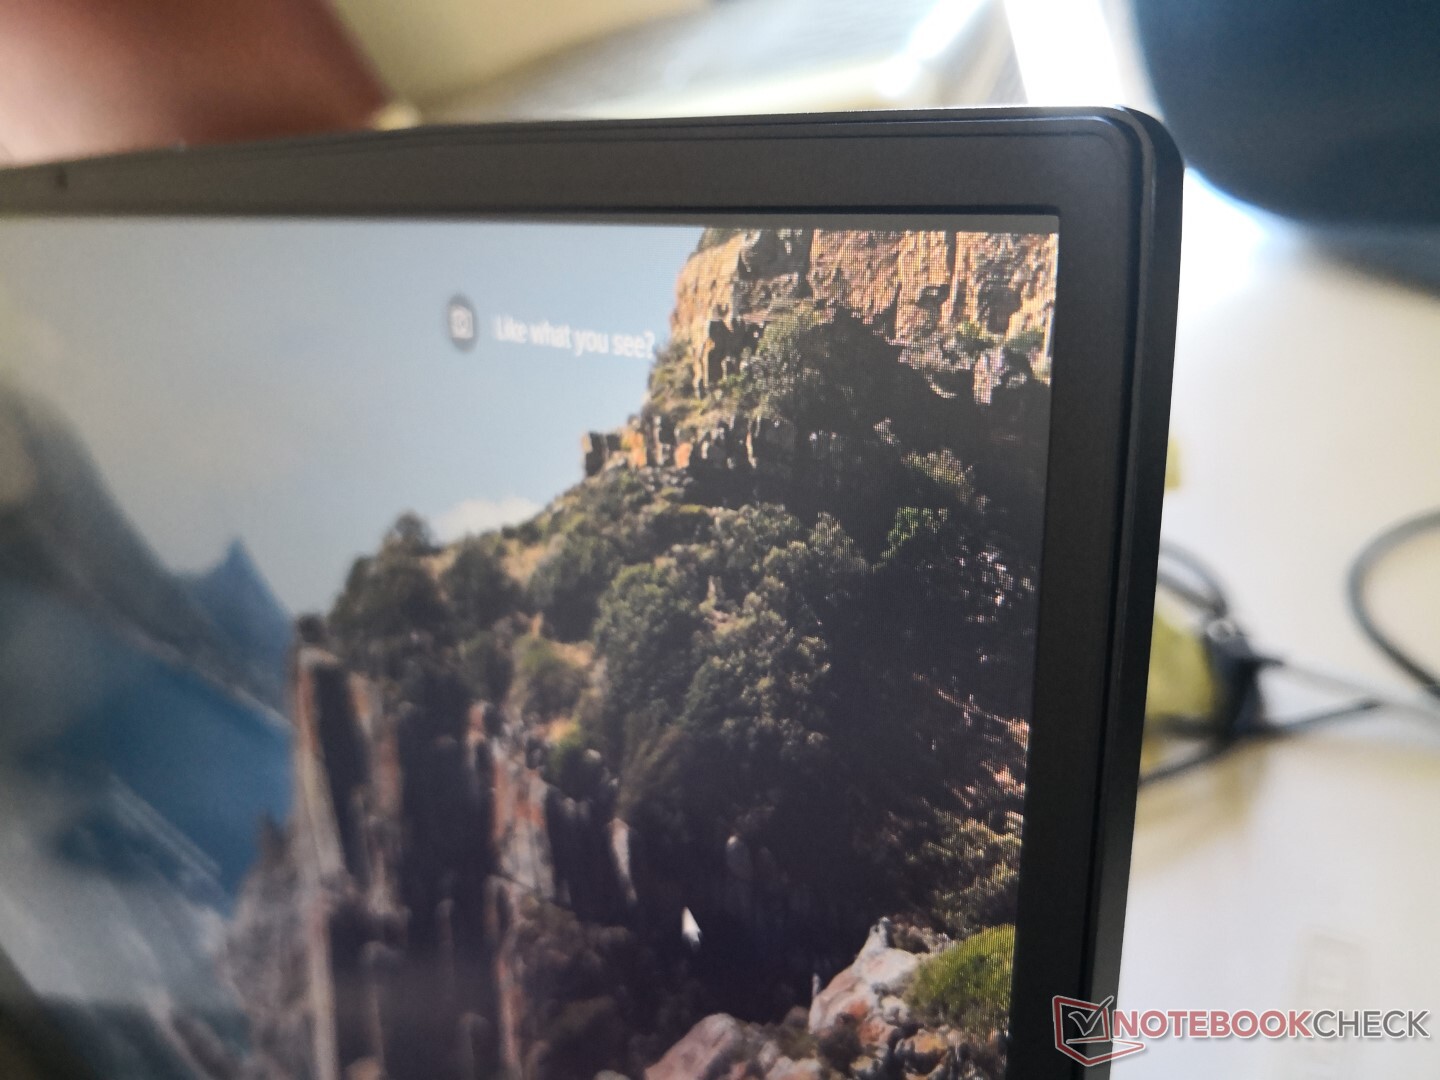
Sin embargo, después de tres años del mismo diseño, algunos aspectos empiezan a mostrar su antigüedad. El bisel inferior es relativamente grueso, no hay obturador de webcam o soporte de Thunderbolt 3, y el sangrado desigual de la retroiluminación es un gran fastidio. En lugar de adelgazar para el inevitable rediseño, nos encantaría ver una disminución en el ruido del ventilador mientras se mantiene el mismo nivel de rendimiento por encima de la media. Los usuarios con presupuestos más ajustados pueden seguir comprando la serie GE75 de Coffee Lake-H 2019 para casi el mismo rendimiento de juego que nuestro Comet Lake-H GE75.
La serie MSI GE75 ha demostrado su versatilidad a través de tres generaciones de CPUs Intel serie H. El rendimiento sigue siendo de primera clase debido a la solución de refrigeración que contiene, pero otros aspectos como el ruido del ventilador y otras características físicas podrían mejorarse.
MSI GE75 Raider 10SE-008US
- 07/02/2020 v7 (old)
Allen Ngo
Price comparison
