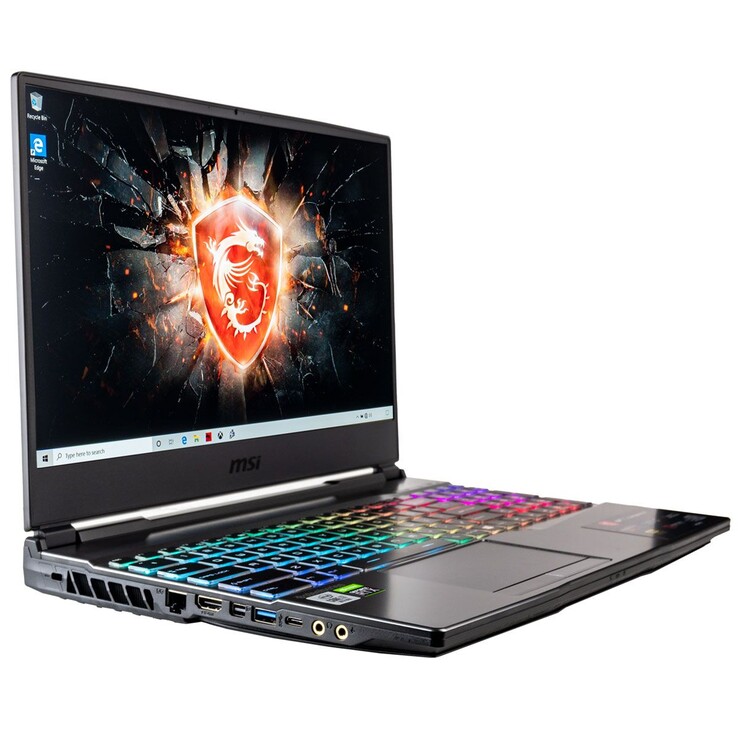
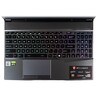
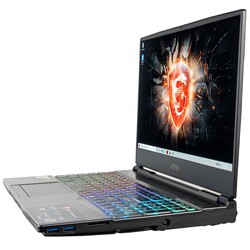
Review del portátil MSI GP65 10SFK: El Core i7 de Intel de la 10ª generación deja su huella
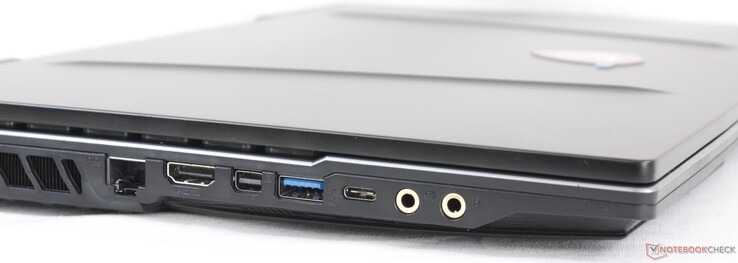
MSI anunció su primer lote de portátiles para juegos a principios de este mes con procesadores Intel Comet Lake-H de 10ª generación. Ya hemos probado el renovado MSI GF75 10SCXR y el nuevo MSI GS66 10SFS desde entonces, y habrá más en un futuro próximo.
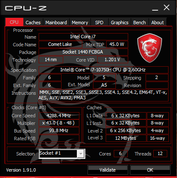
El último modelo que tenemos hoy es el GP65 10SFK que reemplazará al GP65 9SE del año pasado. Sin embargo, aparte de las diferencias en la CPU, la GPU y el panel de visualización, el chasis sigue siendo idéntico año tras año. Recomendamos revisar nuestra review existente sobre la GP65 9SE ya que muchos de nuestros comentarios se aplican aquí también.
La GP65 compite directamente con otros portátiles para juegos de 15,6 pulgadas de gama media como el Asus TUF FX505, HP Omen 15, Aorus 15, y el Lenovo Legion Y540. Nuestra configuración específica con la CPU Core i7-10750H, la GPU GeForce RTX 2070 y la pantalla FHD de 144 Hz se puede encontrar online por unos 1500 dólares.
Más reviews de MSI:
Valoración | Fecha | Modelo | Peso | Altura | Tamaño | Resolución | Precio |
|---|---|---|---|---|---|---|---|
| 83.2 % v7 (old) | 05/2020 | MSI GP65 10SFK-047US i7-10750H, GeForce RTX 2070 Mobile | 2.3 kg | 27.5 mm | 15.60" | 1920x1080 | |
| 82.1 % v7 (old) | 10/2019 | Asus Strix Scar III G531GW-AZ062T i7-9750H, GeForce RTX 2070 Mobile | 2.4 kg | 25 mm | 15.60" | 1920x1080 | |
| 80.4 % v6 (old) | 07/2019 | Asus TUF FX505DT-EB73 R7 3750H, GeForce GTX 1650 Mobile | 2.2 kg | 26.8 mm | 15.60" | 1920x1080 | |
| 86.2 % v6 (old) | 06/2019 | HP Omen 15-dc1303ng i7-8750H, GeForce RTX 2070 Max-Q | 2.4 kg | 25 mm | 15.60" | 1920x1080 | |
| 85.5 % v6 (old) | 06/2019 | Aorus 15-SA i7-9750H, GeForce GTX 1660 Ti Mobile | 2.1 kg | 24.4 mm | 15.60" | 1920x1080 |
Top 10 Análisis
» Top 10 Portátiles Multimedia
» Top 10 Portátiles de Juego
» Top 10 Portátiles de Juego ligeros
» Top 10 Portátiles Asequibles de Oficina/Empresa
» Top 10 Portátiles de Juego Ligeros
» Top 10 Portátiles de Oficina/Empresa Premium
» Top 10 Estaciones de Trabajo
» Top 10 Subportátiles
» Top 10 Ultrabooks
» Top 10 Convertibles
» Top 10 Tablets
» Top 10 Tablets Windows
» Top 10 Tablets de menos de 250 Euros
» Top 10 Phablets (>5.5")
» Top 10 Smartphones
» Top 10 Smartphones (≤5")
» Top 10 Smartphones de menos de 300 Euros
» Top 10 Smartphones de menos de 120 Euros
» Top 10 Portátiles de menos de 1000 Euros
» Top 10 Portátiles de menos de 500 Euros
» Top 10 Portátiles de menos de 300 Euros
» Los Mejores Displays de Portátiles Analizados por Notebookcheck
Carcasa
Lector de tarjetas SD
| SD Card Reader | |
| average JPG Copy Test (av. of 3 runs) | |
| HP Omen 15-dc1303ng (Toshiba Exceria Pro SDXC 64 GB UHS-II) | |
| MSI GP65 10SFK-047US (Toshiba Exceria Pro SDXC 64 GB UHS-II) | |
| MSI GP65 Leopard 9SE-225US | |
| MSI GP62 7REX-1045US (Toshiba Exceria Pro SDXC 64 GB UHS-II) | |
| maximum AS SSD Seq Read Test (1GB) | |
| HP Omen 15-dc1303ng (Toshiba Exceria Pro SDXC 64 GB UHS-II) | |
| MSI GP65 10SFK-047US (Toshiba Exceria Pro SDXC 64 GB UHS-II) | |
| MSI GP65 Leopard 9SE-225US | |
| MSI GP62 7REX-1045US (Toshiba Exceria Pro SDXC 64 GB UHS-II) | |
Comunicación
Webcam
Mantenimiento
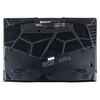
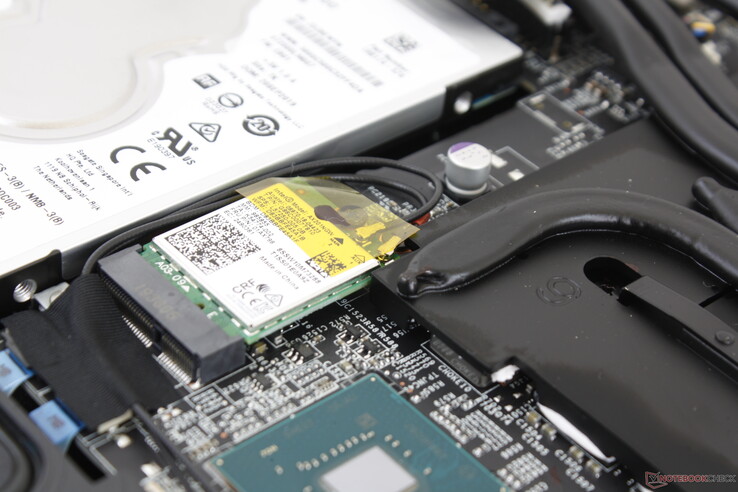
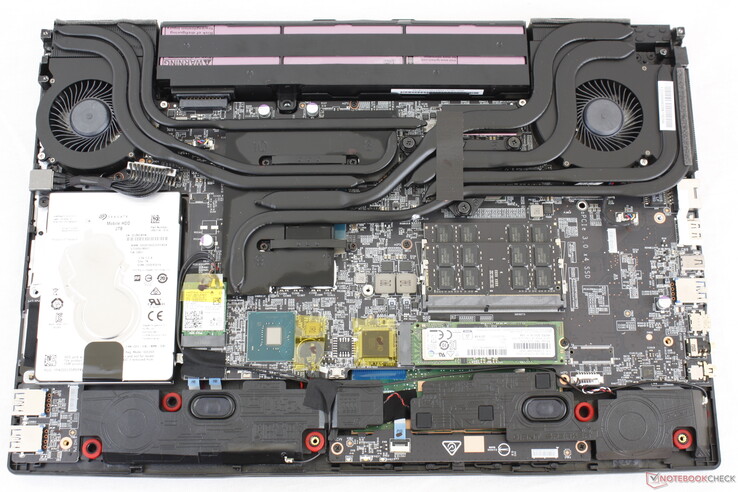
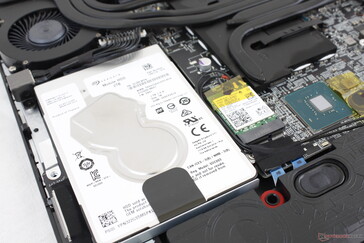
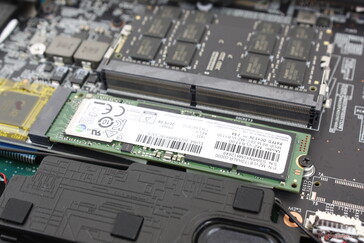
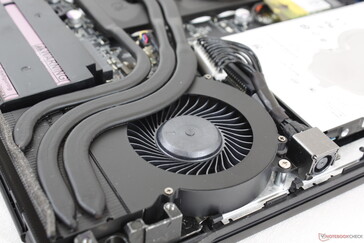
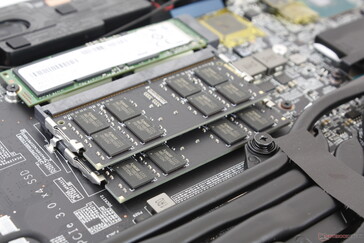
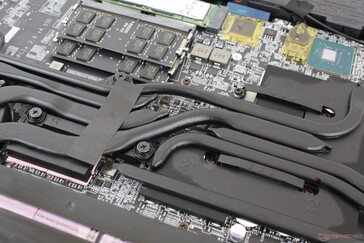
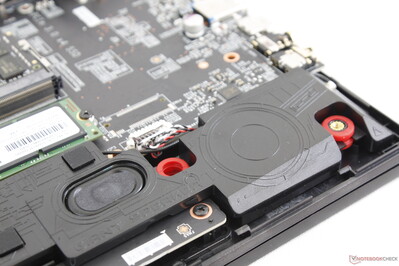
El panel inferior está asegurado por varios tornillos Philips, incluyendo uno que está bajo una pegatina de sello de garantía. Retirar el panel puede ser difícil ya que los cierres de los bordes y esquinas son delicados y difíciles de separar. Una vez dentro, los usuarios tendrán acceso a dos bahías de almacenamiento y dos ranuras SODIMM. Observe que la segunda ranura M.2 2280 adyacente a las ranuras SODIMM se retira en la serie GP65.
Accesorios y garantía
No hay más extras en la caja que el papeleo habitual y el adaptador de CA. La garantía limitada estándar de un año se aplica con protección adicional disponible si se compra en CUKUSA.
Display
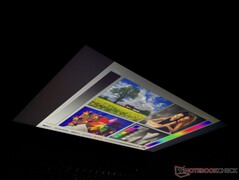
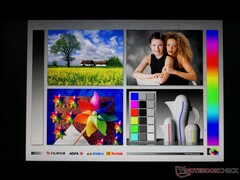
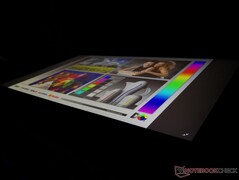
El panel LG Philips LP156WFG-SPB3 IPS en nuestro MSI es el primero en aparecer en nuestra base de datos. En el Aorus 15 se puede encontrar un panel similar al LP156WFG-SPB2 con casi las mismas características, incluyendo la frecuencia de actualización nativa de 144 Hz, rápidos tiempos de respuesta en blanco-negro y gris-gris, y un espacio de color relativamente amplio.
El panel de nuestro MSI es notablemente más brillante que el promedio de su categoría a 390 nits. En comparación, otros portátiles para juegos como el Asus Strix Scar III o el Dell Alienware m15 tienden a superar los 300 nits. El principal inconveniente del panel es su relación de contraste promedio de alrededor de 600:1, mientras que los paneles de los portátiles para juegos más caros como el GS65 están más cerca de 1000:1.
| |||||||||||||||||||||||||
iluminación: 87 %
Brillo con batería: 384.9 cd/m²
Contraste: 574:1 (Negro: 0.67 cd/m²)
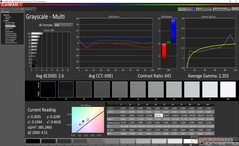
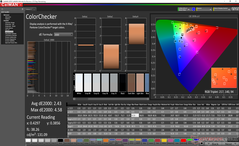
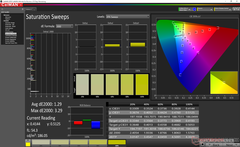
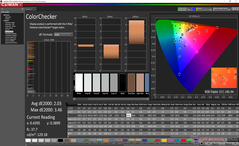
ΔE ColorChecker Calman: 2.43 | ∀{0.5-29.43 Ø4.76}
calibrated: 2.03
ΔE Greyscale Calman: 2.6 | ∀{0.09-98 Ø5}
93.9% sRGB (Argyll 1.6.3 3D)
59.7% AdobeRGB 1998 (Argyll 1.6.3 3D)
65.1% AdobeRGB 1998 (Argyll 3D)
94.4% sRGB (Argyll 3D)
63.5% Display P3 (Argyll 3D)
Gamma: 2.2
CCT: 6981 K
| MSI GP65 10SFK-047US LG Philips LP156WFG-SPB3, IPS, 15.6", 1920x1080 | MSI GP65 Leopard 9SE-225US LG Philips LGD0625, IPS, 15.6", 1920x1080 | Asus Strix Scar III G531GW-AZ062T Sharp LQ156M1JW09 (SHP14D3), IPS, 15.6", 1920x1080 | Asus TUF FX505DT-EB73 Panda LM156LF-GL, IPS, 15.6", 1920x1080 | HP Omen 15-dc1303ng LG Philips LGD05C0, IPS, 15.6", 1920x1080 | MSI GP62 7REX-1045US CMN N156HGE-EAL, TN LED, 15.6", 1920x1080 | |
|---|---|---|---|---|---|---|
| Display | 2% | 4% | -37% | -0% | 23% | |
| Display P3 Coverage (%) | 63.5 | 64.8 2% | 66.2 4% | 39.56 -38% | 63.8 0% | 85.8 35% |
| sRGB Coverage (%) | 94.4 | 96.2 2% | 97.1 3% | 59.5 -37% | 93.4 -1% | 100 6% |
| AdobeRGB 1998 Coverage (%) | 65.1 | 66.3 2% | 67.6 4% | 40.91 -37% | 65 0% | 84.2 29% |
| Response Times | 11% | -10% | -161% | -14% | -174% | |
| Response Time Grey 50% / Grey 80% * (ms) | 10.4 ? | 9.6 ? 8% | 15 ? -44% | 30.4 ? -192% | 14 ? -35% | 34.4 ? -231% |
| Response Time Black / White * (ms) | 12 ? | 10.4 ? 13% | 9 ? 25% | 27.6 ? -130% | 11 ? 8% | 26 ? -117% |
| PWM Frequency (Hz) | 250 ? | 200 ? | ||||
| Screen | 15% | -16% | -61% | 2% | -104% | |
| Brightness middle (cd/m²) | 384.9 | 348.3 -10% | 309 -20% | 286.2 -26% | 316 -18% | 265.7 -31% |
| Brightness (cd/m²) | 358 | 327 -9% | 284 -21% | 267 -25% | 295 -18% | 243 -32% |
| Brightness Distribution (%) | 87 | 85 -2% | 88 1% | 84 -3% | 84 -3% | 87 0% |
| Black Level * (cd/m²) | 0.67 | 0.4 40% | 0.42 37% | 0.33 51% | 0.42 37% | 0.63 6% |
| Contrast (:1) | 574 | 871 52% | 736 28% | 867 51% | 752 31% | 422 -26% |
| Colorchecker dE 2000 * | 2.43 | 1.6 34% | 3.99 -64% | 5.45 -124% | 2.7 -11% | 9.6 -295% |
| Colorchecker dE 2000 max. * | 4.58 | 5.07 -11% | 8.3 -81% | 18.08 -295% | 5.65 -23% | 18.5 -304% |
| Colorchecker dE 2000 calibrated * | 2.03 | 1 51% | 1.12 45% | 4.47 -120% | 1.58 22% | |
| Greyscale dE 2000 * | 2.6 | 2.3 12% | 5.43 -109% | 5.3 -104% | 2.35 10% | 12.7 -388% |
| Gamma | 2.2 100% | 2.203 100% | 2.57 86% | 2.1 105% | 2.41 91% | 2.01 109% |
| CCT | 6981 93% | 6707 97% | 7767 84% | 7679 85% | 6904 94% | 13654 48% |
| Color Space (Percent of AdobeRGB 1998) (%) | 59.7 | 61 2% | 63 6% | 37.6 -37% | 60 1% | 76 27% |
| Color Space (Percent of sRGB) (%) | 93.9 | 96 2% | 97 3% | 59.1 -37% | 93 -1% | 100 6% |
| Media total (Programa/Opciones) | 9% /
12% | -7% /
-11% | -86% /
-69% | -4% /
-0% | -85% /
-88% |
* ... más pequeño es mejor
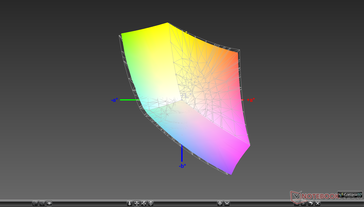
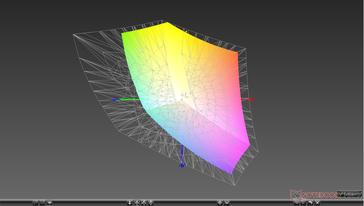
El espacio de color cubre aproximadamente el 94 por ciento de sRGB y el 60 por ciento de AdobeRGB para ser más pequeño que el espacio de color disponible en el antiguo panel GP62 TN. Sin embargo, los tiempos de respuesta superiores, la velocidad de actualización, los ángulos de visión y la calidad general del nuevo panel compensan con creces el déficit de color.
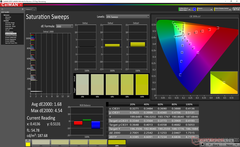
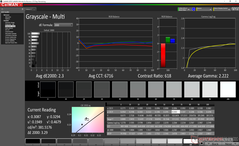
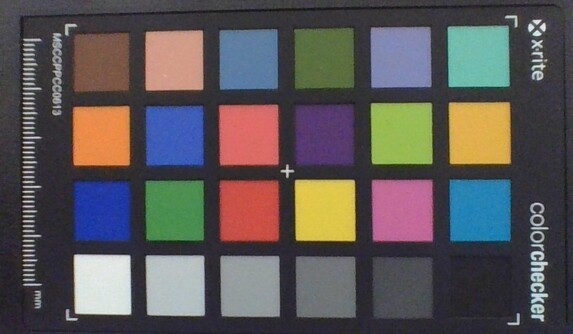
Las mediciones con un colorímetro de X-Rite revelan una pantalla bien calibrada fuera de la caja. Calibrar la pantalla aún más nosotros mismos resultaría en sólo mejoras marginales en todo el tablero, lo que significa que los usuarios finales no necesitarán hacer nada más para sacar el máximo provecho de la pantalla.
Tiempos de respuesta del display
| ↔ Tiempo de respuesta de Negro a Blanco | ||
|---|---|---|
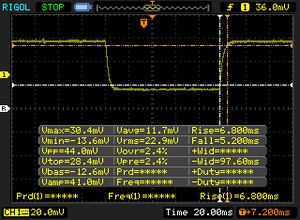
| 12 ms ... subida ↗ y bajada ↘ combinada | ↗ 6.8 ms subida | |
| ↘ 5.2 ms bajada | ||
| La pantalla mostró buenos tiempos de respuesta en nuestros tests pero podría ser demasiado lenta para los jugones competitivos. En comparación, todos los dispositivos de prueba van de ##min### (mínimo) a 240 (máximo) ms. » 31 % de todos los dispositivos son mejores. Esto quiere decir que el tiempo de respuesta medido es mejor que la media (20.1 ms) de todos los dispositivos testados. | ||
| ↔ Tiempo de respuesta 50% Gris a 80% Gris | ||
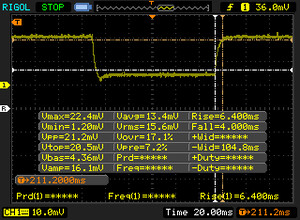
| 10.4 ms ... subida ↗ y bajada ↘ combinada | ↗ 6.4 ms subida | |
| ↘ 4 ms bajada | ||
| La pantalla mostró buenos tiempos de respuesta en nuestros tests pero podría ser demasiado lenta para los jugones competitivos. En comparación, todos los dispositivos de prueba van de ##min### (mínimo) a 636 (máximo) ms. » 23 % de todos los dispositivos son mejores. Esto quiere decir que el tiempo de respuesta medido es mejor que la media (31.5 ms) de todos los dispositivos testados. | ||
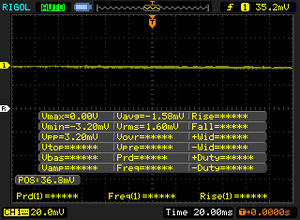
Parpadeo de Pantalla / PWM (Pulse-Width Modulation)
| Parpadeo de Pantalla / PWM no detectado | |||
Comparación: 53 % de todos los dispositivos testados no usaron PWM para atenuar el display. Si se usó, medimos una media de 8036 (mínimo: 5 - máxmo: 343500) Hz. | |||
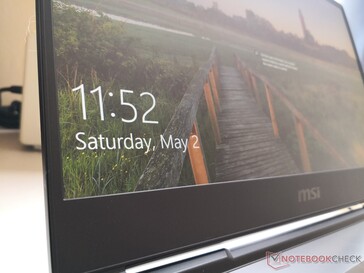
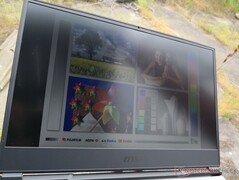
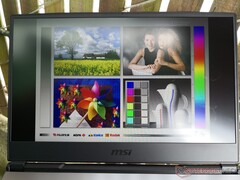
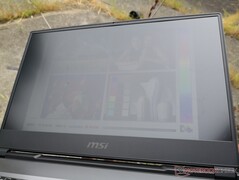
La visibilidad en el exterior sigue siendo un promedio para esta categoría, ya que las computadoras portátiles para juegos no están diseñadas para ser utilizadas en el exterior con frecuencia. La mayoría de los Ultrabooks tienen pantallas más brillantes para mitigar mejor el resplandor y los colores desteñidos.
Rendimiento
Procesador
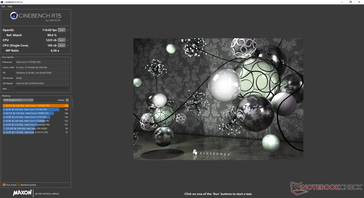
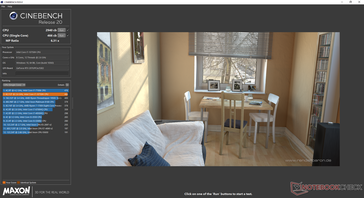
El rendimiento de la CPU es aproximadamente de un 5 a un 15 por ciento más rápido que el del portátil Core i7-9750H medio. Los usuarios que se actualicen de un portátil i7-8750H más antiguo verán ganancias más significativas de alrededor del 11 al 27 por ciento. Las ganancias relativamente menores de generación a generación no son inesperadas ya que el Comet Lake-H comparte el mismo silicio de 14 nm que el Coffee Lake-H.
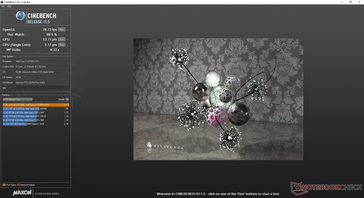
No obstante, la sostenibilidad del rendimiento es excelente. Ejecutar el CineBench R15 Multi-Thread en un bucle da como resultado un descenso del rendimiento de sólo un 4 por ciento a lo largo del tiempo.
Consulte nuestra página dedicada al Core i7-10750H para obtener más detalles técnicos y comparaciones de referencia. El Core i7-10750H de núcleo hexa es sólo un paso por debajo del Core i7-10875H de núcleo octavo que está disponible en el Gigabyte Aero 15.
Cinebench R15: CPU Single 64Bit | CPU Multi 64Bit
Blender: v2.79 BMW27 CPU
7-Zip 18.03: 7z b 4 -mmt1 | 7z b 4
Geekbench 5.5: Single-Core | Multi-Core
HWBOT x265 Benchmark v2.2: 4k Preset
LibreOffice : 20 Documents To PDF
R Benchmark 2.5: Overall mean
| Cinebench R20 / CPU (Multi Core) | |
| Asus Zephyrus G14 GA401IV | |
| Eurocom Nightsky RX15 | |
| AMD Ryzen 1800X - Asus Crosshair VI Hero | |
| MSI GE65 Raider 9SF-049US | |
| Gigabyte Aero 17 HDR XB | |
| MSI GP65 10SFK-047US | |
| Medio Intel Core i7-9750H (2017 - 3133, n=55) | |
| Schenker Key 16 | |
| MSI GF75 Thin 10SCXR | |
| MSI GF63 Thin 9SC | |
| MSI Alpha 15 A3DDK-034 | |
| Cinebench R20 / CPU (Single Core) | |
| Gigabyte Aero 17 HDR XB | |
| Asus Zephyrus G14 GA401IV | |
| Eurocom Nightsky RX15 | |
| MSI GE65 Raider 9SF-049US | |
| MSI GP65 10SFK-047US | |
| Medio Intel Core i7-9750H (416 - 486, n=55) | |
| MSI GF75 Thin 10SCXR | |
| MSI GF63 Thin 9SC | |
| Schenker Key 16 | |
| AMD Ryzen 1800X - Asus Crosshair VI Hero | |
| MSI Alpha 15 A3DDK-034 | |
| Cinebench R15 / CPU Single 64Bit | |
| Gigabyte Aero 17 HDR XB | |
| Eurocom Nightsky RX15 | |
| MSI GE65 Raider 9SF-049US | |
| MSI GP65 Leopard 9SE-225US | |
| Asus Zephyrus G14 GA401IV | |
| MSI GP65 10SFK-047US | |
| Medio Intel Core i7-9750H (170 - 194, n=82) | |
| MSI GF75 Thin 10SCXR | |
| MSI GF63 Thin 9SC | |
| Schenker Key 16 | |
| AMD Ryzen 1800X - Asus Crosshair VI Hero | |
| MSI Alpha 15 A3DDK-034 | |
| Cinebench R15 / CPU Multi 64Bit | |
| Asus Zephyrus G14 GA401IV | |
| Eurocom Nightsky RX15 | |
| Gigabyte Aero 17 HDR XB | |
| MSI GE65 Raider 9SF-049US | |
| AMD Ryzen 1800X - Asus Crosshair VI Hero | |
| MSI GP65 10SFK-047US | |
| MSI GP65 Leopard 9SE-225US | |
| Medio Intel Core i7-9750H (952 - 1306, n=85) | |
| Schenker Key 16 | |
| MSI GF75 Thin 10SCXR | |
| MSI GF63 Thin 9SC | |
| MSI Alpha 15 A3DDK-034 | |
| Blender / v2.79 BMW27 CPU | |
| MSI GF75 Thin 10SCXR | |
| Eurocom Nightsky RX15 | |
| Medio Intel Core i7-9750H (342 - 495, n=21) | |
| MSI GP65 10SFK-047US | |
| Gigabyte Aero 17 HDR XB | |
| Asus Zephyrus G14 GA401IV | |
| AMD Ryzen 1800X - Asus Crosshair VI Hero | |
| 7-Zip 18.03 / 7z b 4 -mmt1 | |
| Gigabyte Aero 17 HDR XB | |
| Eurocom Nightsky RX15 | |
| MSI GP65 10SFK-047US | |
| Medio Intel Core i7-9750H (4580 - 5090, n=21) | |
| MSI GF75 Thin 10SCXR | |
| Asus Zephyrus G14 GA401IV | |
| 7-Zip 18.03 / 7z b 4 | |
| Asus Zephyrus G14 GA401IV | |
| Gigabyte Aero 17 HDR XB | |
| Eurocom Nightsky RX15 | |
| MSI GP65 10SFK-047US | |
| Medio Intel Core i7-9750H (28512 - 35174, n=21) | |
| MSI GF75 Thin 10SCXR | |
| Geekbench 5.5 / Single-Core | |
| Gigabyte Aero 17 HDR XB | |
| Asus Zephyrus G14 GA401IV | |
| MSI GP65 10SFK-047US | |
| Medio Intel Core i7-9750H (1117 - 1251, n=13) | |
| MSI GF75 Thin 10SCXR | |
| MSI Alpha 15 A3DDK-034 | |
| Geekbench 5.5 / Multi-Core | |
| Asus Zephyrus G14 GA401IV | |
| Gigabyte Aero 17 HDR XB | |
| MSI GP65 10SFK-047US | |
| Medio Intel Core i7-9750H (4859 - 6262, n=13) | |
| MSI GF75 Thin 10SCXR | |
| MSI Alpha 15 A3DDK-034 | |
| HWBOT x265 Benchmark v2.2 / 4k Preset | |
| Eurocom Nightsky RX15 | |
| Asus Zephyrus G14 GA401IV | |
| Gigabyte Aero 17 HDR XB | |
| MSI GP65 10SFK-047US | |
| Medio Intel Core i7-9750H (7.1 - 10.7, n=21) | |
| MSI GF75 Thin 10SCXR | |
| LibreOffice / 20 Documents To PDF | |
| MSI GP65 10SFK-047US | |
| Gigabyte Aero 17 HDR XB | |
| Medio Intel Core i7-9750H (54.5 - 64.7, n=9) | |
| MSI GF75 Thin 10SCXR | |
| R Benchmark 2.5 / Overall mean | |
| MSI GF75 Thin 10SCXR | |
| Medio Intel Core i7-9750H (0.608 - 0.695, n=14) | |
| MSI GP65 10SFK-047US | |
| Gigabyte Aero 17 HDR XB | |
* ... más pequeño es mejor
rendimiento del sistema
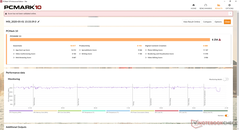
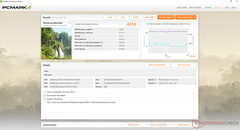
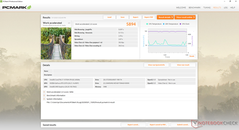
Aunque las diferencias son menores, los puntos de referencia del PCMark son consistentemente más altos que los del 2019 GP65. Los usuarios que se actualicen desde portátiles para juegos mucho más antiguos con Core i5-7300HQ o i7-7700HQ como el GP62 verán ganancias más significativas.
| PCMark 8 Home Score Accelerated v2 | 4516 puntos | |
| PCMark 8 Work Score Accelerated v2 | 5894 puntos | |
| PCMark 10 Score | 6254 puntos | |
ayuda | ||
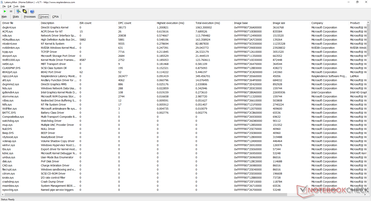
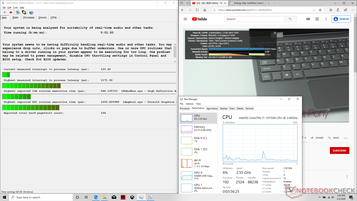
Latencia DPC
| DPC Latencies / LatencyMon - interrupt to process latency (max), Web, Youtube, Prime95 | |
| MSI GP65 10SFK-047US | |
* ... más pequeño es mejor
Dispositivos de almacenamiento
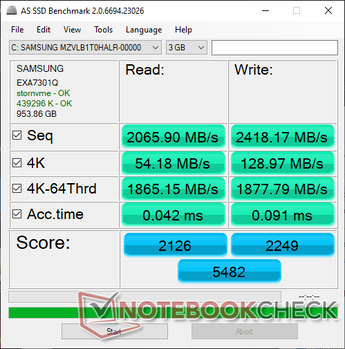
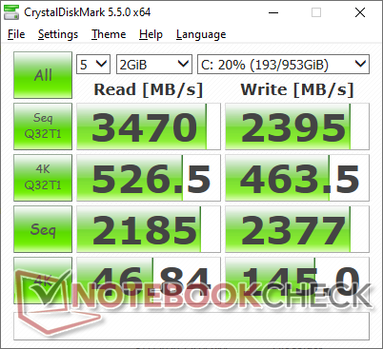
Nuestra unidad de prueba viene con un Samsung SSD PM981 de 1 TB y un disco duro secundario de 2 TB Seagate ST2000LM007. La unidad sólo tiene 5400 RPM, pero el rápido NVMe SSD lo compensa con creces. La Samsung PM981 es más rápida que la serie Intel 660p o la serie Toshiba XG3 que suelen encontrarse en los Ultrabooks y otros portátiles para juegos.
Consulte nuestra tabla de SSDs y HDDs para obtener más comparaciones de referencia.
| MSI GP65 10SFK-047US Samsung SSD PM981 MZVLB1T0HALR | Asus Strix Scar III G531GW-AZ062T Intel SSD 660p SSDPEKNW512G8 | Asus TUF FX505DT-EB73 Intel SSD 660p SSDPEKNW512G8 | HP Omen 15-dc1303ng Samsung SSD PM981 MZVLB256HAHQ | MSI GP62 7REX-1045US Toshiba NVMe THNSN5128GP | MSI GP65 Leopard 9SE-225US Toshiba KBG30ZMT512G | |
|---|---|---|---|---|---|---|
| AS SSD | -79% | -46% | -19% | -49% | -94% | |
| Seq Read (MB/s) | 2066 | 1163 -44% | 1019 -51% | 2485 20% | 1848 -11% | 1307 -37% |
| Seq Write (MB/s) | 2418 | 919 -62% | 889 -63% | 1575 -35% | 601 -75% | 730 -70% |
| 4K Read (MB/s) | 54.2 | 48.88 -10% | 48.22 -11% | 53.4 -1% | 35.84 -34% | 27.58 -49% |
| 4K Write (MB/s) | 129 | 90.1 -30% | 115.5 -10% | 113.5 -12% | 112 -13% | 80.3 -38% |
| 4K-64 Read (MB/s) | 1865 | 323.8 -83% | 321.5 -83% | 725 -61% | 628 -66% | 878 -53% |
| 4K-64 Write (MB/s) | 1878 | 403.8 -78% | 787 -58% | 1371 -27% | 428.2 -77% | 246.8 -87% |
| Access Time Read * (ms) | 0.042 | 0.24 -471% | 0.065 -55% | 0.059 -40% | 0.079 -88% | 0.231 -450% |
| Access Time Write * (ms) | 0.091 | 0.046 49% | 0.047 48% | 0.032 65% | 0.034 63% | 0.223 -145% |
| Score Read (Points) | 2126 | 489 -77% | 472 -78% | 1027 -52% | 849 -60% | 1036 -51% |
| Score Write (Points) | 2249 | 586 -74% | 992 -56% | 1642 -27% | 600 -73% | 400 -82% |
| Score Total (Points) | 5482 | 1332 -76% | 1717 -69% | 3163 -42% | 1829 -67% | 1940 -65% |
| Copy ISO MB/s (MB/s) | 2927 | 1269 -57% | 942 -68% | 1128 -61% | 993 -66% | |
| Copy Program MB/s (MB/s) | 728 | 452.8 -38% | 444.5 -39% | 326.3 -55% | 309.5 -57% | |
| Copy Game MB/s (MB/s) | 1614 | 755 -53% | 867 -46% | 442.8 -73% | 582 -64% | |
| CrystalDiskMark 5.2 / 6 | -34% | -33% | -27% | -25% | -33% | |
| Write 4K (MB/s) | 145 | 133.3 -8% | 137.5 -5% | 50.2 -65% | 158.4 9% | 99.3 -32% |
| Read 4K (MB/s) | 46.84 | 55.3 18% | 57 22% | 35.32 -25% | 45.04 -4% | 46.96 0% |
| Write Seq (MB/s) | 2377 | 980 -59% | 984 -59% | 991 -58% | 622 -74% | |
| Read Seq (MB/s) | 2185 | 1406 -36% | 1564 -28% | 1526 -30% | 1592 -27% | |
| Write 4K Q32T1 (MB/s) | 463.5 | 286.3 -38% | 237.4 -49% | 445.1 -4% | 434.2 -6% | 240.1 -48% |
| Read 4K Q32T1 (MB/s) | 527 | 331.5 -37% | 340.7 -35% | 526 0% | 590 12% | 581 10% |
| Write Seq Q32T1 (MB/s) | 2395 | 976 -59% | 959 -60% | 1647 -31% | 630 -74% | 686 -71% |
| Read Seq Q32T1 (MB/s) | 3470 | 1520 -56% | 1732 -50% | 3427 -1% | 2108 -39% | 1581 -54% |
| Write 4K Q8T8 (MB/s) | 748 | 268.1 | ||||
| Read 4K Q8T8 (MB/s) | 344.6 | 977 | ||||
| Media total (Programa/Opciones) | -57% /
-63% | -40% /
-41% | -23% /
-22% | -37% /
-41% | -64% /
-75% |
* ... más pequeño es mejor
Rendimiento de la GPU
La GeForce RTX 2070 móvil en nuestro MSI funciona donde esperamos que sea entre un 10 y un 14 por ciento más rápida que la GeForce RTX 2070 Max-Q o un 22 por ciento más lenta que la GeForce RTX 2070 de escritorio. El rendimiento en los juegos es ligeramente superior a la media en sólo unos pocos puntos porcentuales, probablemente debido tanto al nuevo procesador como a los amplios 32 GB de RAM DDR4-2666.
El tiempo de inactividad en Witcher 3 durante una hora muestra velocidades de cuadro estables sin caídas inesperadas para un rendimiento de juego sin problemas.
Consulte nuestra página dedicada en el GeForce RTX 2070 movil para obtener más información técnica y comparaciones de referencia.
| 3DMark 06 Standard Score | 39513 puntos | |
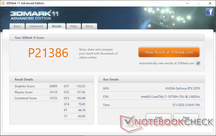
| 3DMark 11 Performance | 21386 puntos | |
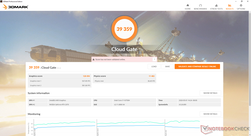
| 3DMark Cloud Gate Standard Score | 39359 puntos | |
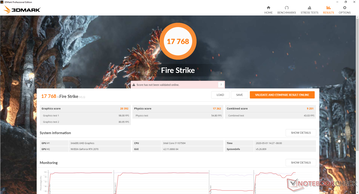
| 3DMark Fire Strike Score | 17768 puntos | |
| 3DMark Time Spy Score | 7404 puntos | |
ayuda | ||
| Shadow of the Tomb Raider | |
| 1280x720 Lowest Preset | |
| Eurocom Sky X4C i9-9900KS | |
| MSI GF65 9SD | |
| MSI GP65 10SFK-047US | |
| Walmart EVOO Gaming 17 | |
| MSI RTX 2080 Gaming X Trio | |
| Medio NVIDIA GeForce RTX 2070 Mobile (91.3 - 160, n=9) | |
| Asus G752VS | |
| Alienware 17 R4 | |
| 1920x1080 Medium Preset | |
| Eurocom Sky X4C i9-9900KS | |
| MSI RTX 2080 Gaming X Trio | |
| MSI GP65 10SFK-047US | |
| Medio NVIDIA GeForce RTX 2070 Mobile (86 - 114, n=10) | |
| Walmart EVOO Gaming 17 | |
| Asus G752VS | |
| Alienware 17 R4 | |
| MSI GF65 9SD | |
| 1920x1080 Highest Preset AA:T | |
| Eurocom Sky X4C i9-9900KS | |
| MSI RTX 2080 Gaming X Trio | |
| MSI GP65 10SFK-047US | |
| Medio NVIDIA GeForce RTX 2070 Mobile (74.2 - 97, n=11) | |
| Walmart EVOO Gaming 17 | |
| Alienware 17 R4 | |
| Asus G752VS | |
| MSI GF65 9SD | |
| The Witcher 3 | |
| 1024x768 Low Graphics & Postprocessing | |
| Eurocom Sky X4C i9-9900KS | |
| MSI GP65 10SFK-047US | |
| MSI RTX 2080 Gaming X Trio | |
| Walmart EVOO Gaming 17 | |
| Medio NVIDIA GeForce RTX 2070 Mobile (193.9 - 357, n=12) | |
| MSI GF65 9SD | |
| 1366x768 Medium Graphics & Postprocessing | |
| Eurocom Sky X4C i9-9900KS | |
| MSI RTX 2080 Gaming X Trio | |
| MSI GP65 10SFK-047US | |
| Medio NVIDIA GeForce RTX 2070 Mobile (154 - 250, n=12) | |
| Walmart EVOO Gaming 17 | |
| MSI GF65 9SD | |
| 1920x1080 High Graphics & Postprocessing (Nvidia HairWorks Off) | |
| MSI RTX 2080 Gaming X Trio | |
| Eurocom Sky X4C i9-9900KS | |
| MSI GP65 10SFK-047US | |
| Medio NVIDIA GeForce RTX 2070 Mobile (115.7 - 160.8, n=17) | |
| Walmart EVOO Gaming 17 | |
| MSI GF65 9SD | |
| 1920x1080 Ultra Graphics & Postprocessing (HBAO+) | |
| MSI RTX 2080 Gaming X Trio | |
| Eurocom Sky X4C i9-9900KS | |
| MSI GP65 10SFK-047US | |
| Medio NVIDIA GeForce RTX 2070 Mobile (64 - 82.1, n=21) | |
| Walmart EVOO Gaming 17 | |
| MSI GF65 9SD | |
| bajo | medio | alto | ultra | |
|---|---|---|---|---|
| BioShock Infinite (2013) | 352 | 316 | 288.9 | 164.6 |
| The Witcher 3 (2015) | 326.4 | 244.5 | 160.8 | 82.1 |
| Dota 2 Reborn (2015) | 152 | 139 | 128 | 120 |
| X-Plane 11.11 (2018) | 102 | 91.7 | 77.5 | |
| Shadow of the Tomb Raider (2018) | 135 | 107 | 102 | 93 |
Emisiones
Ruido de sistema
The fans are always active no matter the setting for a minimum fan noise of 31.9 dB(A) against a background of 29.3 dB(A). It'll be audible in a silent room, but essentially unnoticeable in offices spaces.
When running the first benchmark scene of 3DMark 06, fan noise would steadily increase until reaching 47 dB(A) towards the end of the 90-second benchmark. Results are much louder than what we recorded on last year's GP65 with the slower RTX 2060 GPU. Thankfully, fan noise remains steady at only 33.5 dB(A) if simply web browsing or video streaming.
When running Witcher 3, fan noise would stabilize at almost 54 dB(A) to be louder than most gaming laptops under similar conditions. If Cooler Boost is enabled, fan noise will jump to almost 57 dB(A) no matter the onscreen load.
We can notice no electronic noise from our test unit, but the constant fan noise would have drowned it anyway.
| MSI GP65 10SFK-047US GeForce RTX 2070 Mobile, i7-10750H, Samsung SSD PM981 MZVLB1T0HALR | Asus Strix Scar III G531GW-AZ062T GeForce RTX 2070 Mobile, i7-9750H, Intel SSD 660p SSDPEKNW512G8 | Asus TUF FX505DT-EB73 GeForce GTX 1650 Mobile, R7 3750H, Intel SSD 660p SSDPEKNW512G8 | HP Omen 15-dc1303ng GeForce RTX 2070 Max-Q, i7-8750H, Samsung SSD PM981 MZVLB256HAHQ | MSI GP62 7REX-1045US GeForce GTX 1050 Ti Mobile, i7-7700HQ, Toshiba NVMe THNSN5128GP | MSI GP65 Leopard 9SE-225US GeForce RTX 2060 Mobile, i7-9750H, Toshiba KBG30ZMT512G | |
|---|---|---|---|---|---|---|
| Noise | 5% | 10% | 3% | 7% | 12% | |
| apagado / medio ambiente * (dB) | 29.3 | 30 -2% | 28.2 4% | 30.5 -4% | 28 4% | 28.2 4% |
| Idle Minimum * (dB) | 31.9 | 30.6 4% | 28.2 12% | 32.8 -3% | 32.2 -1% | 29.5 8% |
| Idle Average * (dB) | 31.9 | 30.6 4% | 28.2 12% | 32.8 -3% | 32.2 -1% | 29.6 7% |
| Idle Maximum * (dB) | 33.5 | 37.7 -13% | 31.4 6% | 32.8 2% | 32.2 4% | 29.6 12% |
| Load Average * (dB) | 47 | 36.5 22% | 39.8 15% | 42.5 10% | 40.9 13% | 33 30% |
| Witcher 3 ultra * (dB) | 53.8 | 52.1 3% | 47 13% | 45.4 16% | 47.2 12% | |
| Load Maximum * (dB) | 56.7 | 48.1 15% | 50.2 11% | 47.5 16% | 48.6 14% | 52 8% |
* ... más pequeño es mejor
Ruido
| Ocioso |
| 31.9 / 31.9 / 33.5 dB(A) |
| Carga |
| 47 / 56.7 dB(A) |
 | ||
30 dB silencioso 40 dB(A) audible 50 dB(A) ruidosamente alto |
||
min: | ||
Temperatura
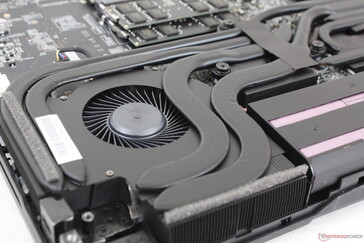
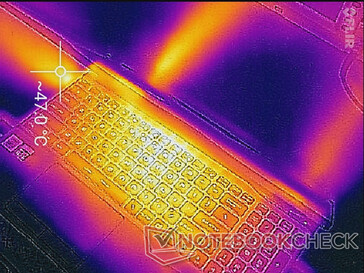
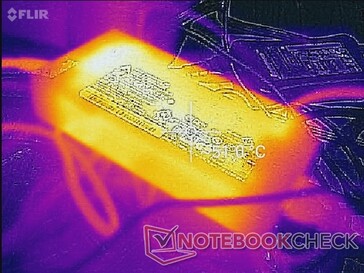
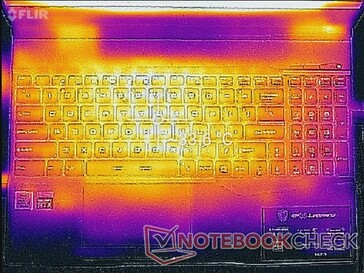
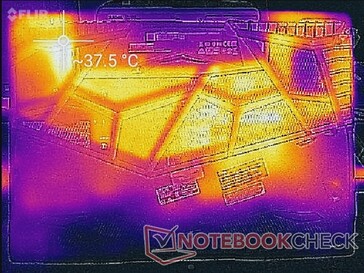
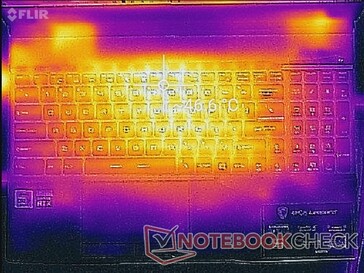
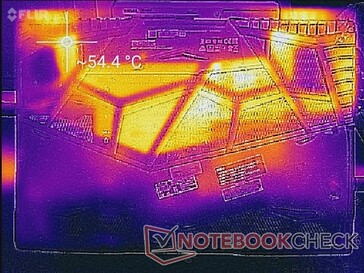
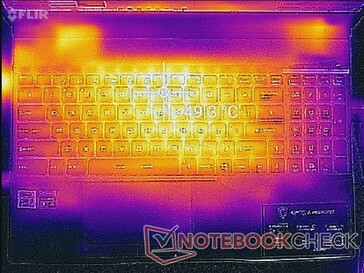
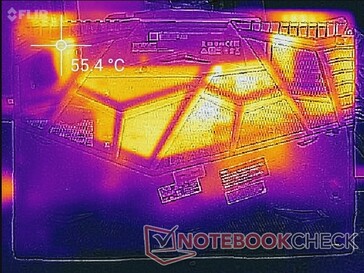
Las temperaturas de la superficie son más o menos las mismas que las que medimos en la GP65 del año pasado, aunque esta nueva versión viene con la más potente GPU GeForce RTX 2070. Los juegos, por ejemplo, hacen que el centro del teclado se estabilice alrededor de 46 C a 49 C. Aplaudimos a MSI por incluir rejillas de ventilación muy grandes en el panel inferior, a diferencia de otros portátiles para juegos como el Zephyrus G14 o G15.
(-) La temperatura máxima en la parte superior es de 49.4 °C / 121 F, frente a la media de 40.4 °C / 105 F, que oscila entre 21.2 y 68.8 °C para la clase Gaming.
(-) El fondo se calienta hasta un máximo de 57.2 °C / 135 F, frente a la media de 43.3 °C / 110 F
(+) En reposo, la temperatura media de la parte superior es de 30.6 °C / 87# F, frente a la media del dispositivo de 33.9 °C / 93 F.
(±) Jugando a The Witcher 3, la temperatura media de la parte superior es de 34.3 °C / 94 F, frente a la media del dispositivo de 33.9 °C / 93 F.
(+) El reposamanos y el panel táctil están a una temperatura inferior a la de la piel, con un máximo de 30.8 °C / 87.4 F y, por tanto, son fríos al tacto.
(±) La temperatura media de la zona del reposamanos de dispositivos similares fue de 28.8 °C / 83.8 F (-2 °C / -3.6 F).
Prueba de estrés
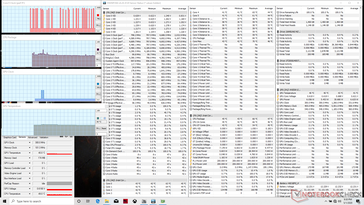
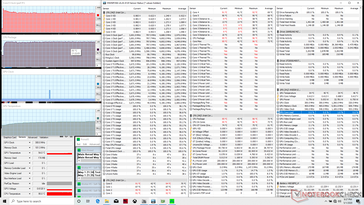
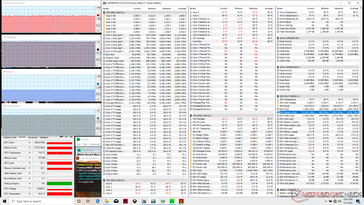
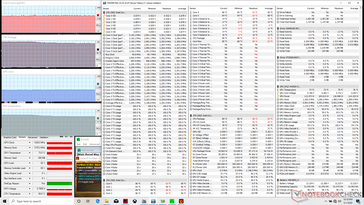
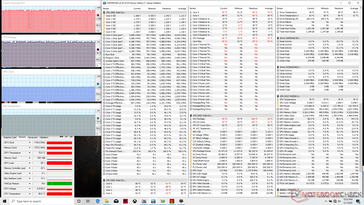
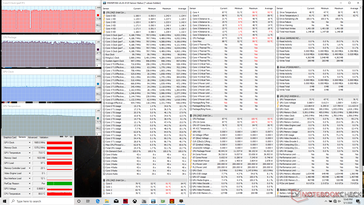
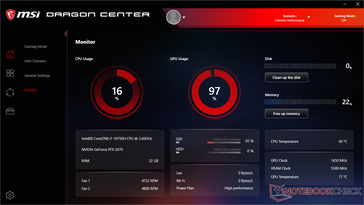
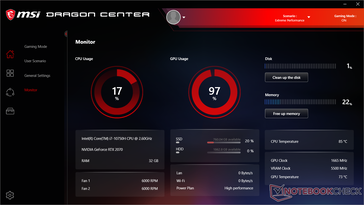
We stress the system with synthetic loads to identify for any potential throttling or stability issues. When running Prime95, the CPU would boost to 4.2 GHz for the first few seconds before steadily declining to a stable 3.7 GHz. Core temperature would also stabilize at a very warm 95 C. If running both Prime95 and FurMark simultaneously, the CPU would drop even further to 3.1 GHz while maintaining the same core temperature of 95 C. Enabling Cooler Boost mode (i.e., Maximum Fan mode) will cause core temperatures to drop by only a few degrees while keeping clock rates relatively the same as shown by the screenshots below.
Running Witcher 3 is more representative of real-world gaming loads. Even so, the CPU would still stabilize at a high 96 C while the GPU is only a bit cooler at 79 C. In comparison, the older Core i7-9750H in the MSI GS65 would stabilize at a more reasonable 81 C when under similar conditions.
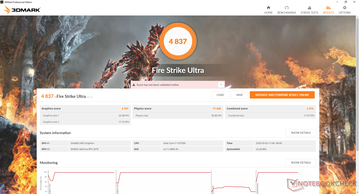
Running on batteries will impact performance. A 3DMark Fire Strike on battery power returns Physics and Graphics scores of 11586 and 5328 points, respectively. compared to 15923 and 18962 points when on mains.
| CPU Clock (GHz) | GPU Clock (MHz) | Average CPU Temperature (°C) | Average GPU Temperature (°C) | |
| System Idle | -- | -- | 43 | 40 |
| Prime95 Stress | 3.7 | -- | 95 | 54 |
| Prime95 + FurMark Stress | 3.1 - 3.2 | 1290 | 95 | 79 |
| Prime95 + FurMark Stress (Cooler Boost on) | 3.1 - 3.2 | 1320 | 89 | 73 |
| Witcher 3 Stress | ~4.2 | 1740 | 96 | 79 |
Altavoces
MSI GP65 10SFK-047US análisis de audio
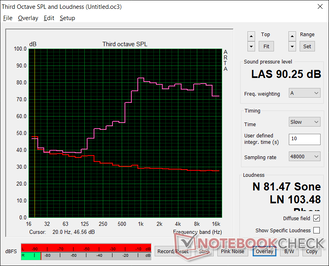
(+) | los altavoces pueden reproducir a un volumen relativamente alto (#90.3 dB)
Graves 100 - 315 Hz
(-) | casi sin bajos - de media 28.5% inferior a la mediana
(+) | el bajo es lineal (6.2% delta a la frecuencia anterior)
Medios 400 - 2000 Hz
(±) | medios reducidos - de media 8.2% inferior a la mediana
(±) | la linealidad de los medios es media (9.1% delta respecto a la frecuencia anterior)
Altos 2 - 16 kHz
(+) | máximos equilibrados - a sólo 1.8% de la mediana
(+) | los máximos son lineales (4% delta a la frecuencia anterior)
Total 100 - 16.000 Hz
(±) | la linealidad del sonido global es media (23.5% de diferencia con la mediana)
En comparación con la misma clase
» 85% de todos los dispositivos probados de esta clase eran mejores, 5% similares, 11% peores
» El mejor tuvo un delta de 6%, la media fue 18%, el peor fue ###max##%
En comparación con todos los dispositivos probados
» 70% de todos los dispositivos probados eran mejores, 6% similares, 24% peores
» El mejor tuvo un delta de 4%, la media fue 24%, el peor fue ###max##%
Apple MacBook 12 (Early 2016) 1.1 GHz análisis de audio
(+) | los altavoces pueden reproducir a un volumen relativamente alto (#83.6 dB)
Graves 100 - 315 Hz
(±) | lubina reducida - en promedio 11.3% inferior a la mediana
(±) | la linealidad de los graves es media (14.2% delta a frecuencia anterior)
Medios 400 - 2000 Hz
(+) | medios equilibrados - a sólo 2.4% de la mediana
(+) | los medios son lineales (5.5% delta a la frecuencia anterior)
Altos 2 - 16 kHz
(+) | máximos equilibrados - a sólo 2% de la mediana
(+) | los máximos son lineales (4.5% delta a la frecuencia anterior)
Total 100 - 16.000 Hz
(+) | el sonido global es lineal (10.2% de diferencia con la mediana)
En comparación con la misma clase
» 7% de todos los dispositivos probados de esta clase eran mejores, 2% similares, 91% peores
» El mejor tuvo un delta de 5%, la media fue 18%, el peor fue ###max##%
En comparación con todos los dispositivos probados
» 4% de todos los dispositivos probados eran mejores, 1% similares, 94% peores
» El mejor tuvo un delta de 4%, la media fue 24%, el peor fue ###max##%
Gestión de la energía
Power Consumption
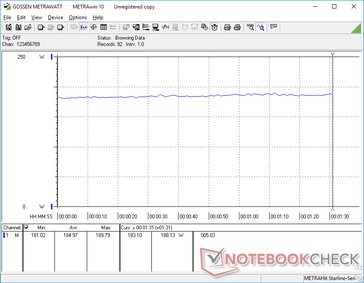
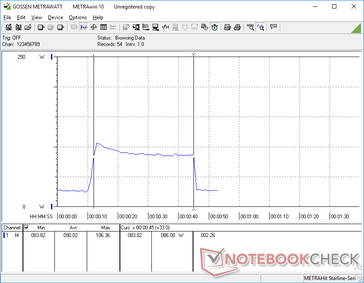
La demanda de escritorio es de entre 14 W y 24 W comparado con 13 W y 21 W en el GP65. Mientras tanto, la ejecución de Witcher 3 consume una media de 185 W para ser un 20 por ciento más que en el GP65 de 2019 con la GeForce RTX 2060. No es casualidad que nuestro RTX 2070 también supere al RTX 2060 en aproximadamente un 20 por ciento en las pruebas de referencia de 3DMark para representar un rendimiento lineal por vatio entre el RTX 2060 y el RTX 2070.
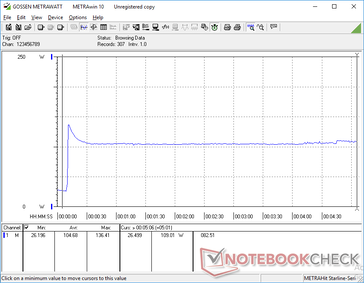
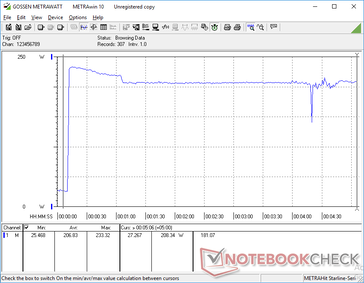
El máximo que podemos registrar es 233,4 W del gran (~16,8 x 8,3 x 3,5 cm) adaptador de CA de 230 W cuando se ejecutan tanto el Prime95 como el FurMark simultáneamente. Este pico de consumo es sólo temporal, como se muestra en los siguientes gráficos. Cuando se compara con el Asus Strix Scar III G531GW y el Schenker XMG Pro 15, cada uno con la misma GPU RTX 2070 pero con una CPU Core i7-9750H más antigua, el pico de consumo de nuestro MSI sigue siendo muy superior al del Asus (196 W), mientras que es inferior al del Schenker (245 W). Cualquier ventaja de consumo de energía entre las dos CPU sería muy pequeña.
| Off / Standby | |
| Ocioso | |
| Carga |
|
Clave:
min: | |
| MSI GP65 10SFK-047US i7-10750H, GeForce RTX 2070 Mobile, Samsung SSD PM981 MZVLB1T0HALR, IPS, 1920x1080, 15.6" | Asus Strix Scar III G531GW-AZ062T i7-9750H, GeForce RTX 2070 Mobile, Intel SSD 660p SSDPEKNW512G8, IPS, 1920x1080, 15.6" | HP Omen 15-dc1303ng i7-8750H, GeForce RTX 2070 Max-Q, Samsung SSD PM981 MZVLB256HAHQ, IPS, 1920x1080, 15.6" | MSI GP62 7REX-1045US i7-7700HQ, GeForce GTX 1050 Ti Mobile, Toshiba NVMe THNSN5128GP, TN LED, 1920x1080, 15.6" | Aorus 15-SA i7-9750H, GeForce GTX 1660 Ti Mobile, Intel SSD 760p SSDPEKKW512G8, IPS, 1920x1080, 15.6" | MSI GP65 Leopard 9SE-225US i7-9750H, GeForce RTX 2060 Mobile, Toshiba KBG30ZMT512G, IPS, 1920x1080, 15.6" | Schenker XMG Pro 15 i7-9750H, GeForce RTX 2070 Mobile, Samsung SSD 970 EVO Plus 500GB, IPS, 1920x1080, 15.6" | |
|---|---|---|---|---|---|---|---|
| Power Consumption | 11% | 12% | 22% | -4% | 8% | -4% | |
| Idle Minimum * (Watt) | 14.2 | 11.4 20% | 14.7 -4% | 14.6 -3% | 20 -41% | 13.6 4% | 15 -6% |
| Idle Average * (Watt) | 18.8 | 13.5 28% | 18.6 1% | 17.2 9% | 23 -22% | 17.9 5% | 19 -1% |
| Idle Maximum * (Watt) | 23.9 | 21.6 10% | 22.6 5% | 17.3 28% | 29 -21% | 20.6 14% | 26 -9% |
| Load Average * (Watt) | 96.9 | 106 -9% | 90 7% | 82.7 15% | 87 10% | 96 1% | 101 -4% |
| Witcher 3 ultra * (Watt) | 185 | 186 -1% | 107 42% | 136 26% | 154.6 16% | 177 4% | |
| Load Maximum * (Watt) | 233.4 | 196 16% | 120 49% | 136.7 41% | 173 26% | 218.6 6% | 245 -5% |
* ... más pequeño es mejor
Duración de la batería
Los tiempos de ejecución son casi idénticos a los que observamos en el GP65 del año pasado, lo que significa que los usuarios pueden esperar menos de 4 horas de uso de la WLAN en el mundo real. La carga de vacío a plena capacidad toma un poco menos de 2 horas.
El sistema no puede ser recargado a través de un USB tipo C, a diferencia del Asus Zephyrus M.
| MSI GP65 10SFK-047US i7-10750H, GeForce RTX 2070 Mobile, 51 Wh | Asus Strix Scar III G531GW-AZ062T i7-9750H, GeForce RTX 2070 Mobile, 66 Wh | Asus TUF FX505DT-EB73 R7 3750H, GeForce GTX 1650 Mobile, 48 Wh | HP Omen 15-dc1303ng i7-8750H, GeForce RTX 2070 Max-Q, 70 Wh | MSI GP62 7REX-1045US i7-7700HQ, GeForce GTX 1050 Ti Mobile, 41 Wh | Aorus 15-SA i7-9750H, GeForce GTX 1660 Ti Mobile, 62 Wh | MSI GP65 Leopard 9SE-225US i7-9750H, GeForce RTX 2060 Mobile, 51 Wh | |
|---|---|---|---|---|---|---|---|
| Duración de Batería | 51% | 30% | -11% | -22% | -24% | 5% | |
| WiFi v1.3 (h) | 3.7 | 5.6 51% | 4.8 30% | 3.3 -11% | 2.9 -22% | 2.8 -24% | 3.9 5% |
| Reader / Idle (h) | 7.8 | 5 | 4.3 | 3.5 | 6 | ||
| Load (h) | 1.5 | 1.2 | 0.7 | 2 | 1.1 |
Pro
Contra
Veredicto
En la serie Comet Lake-U, las diferencias de rendimiento entre géneros entre ésta y la serie saliente Whiskey Lake-U son mínimas, a menos que se opte por el Comet Lake-U Core i7-10710U de alta gama. De lo contrario, opciones menores como el Core i7-10510U tendrán un rendimiento casi igual al del antiguo Core i7-8565U.
Lo mismo puede decirse de la serie Comet Lake-H. El Core i7-10750H funciona muy parecido al Core i7-9750H hasta el punto de que cualquier diferencia sería imperceptible, especialmente si se trata de juegos en los que es más probable que estén vinculados a la GPU que a la CPU. En su lugar, los usuarios tendrán que considerar la opción del Core i7-10875H de gama alta para cualquier aumento significativo del rendimiento bruto con respecto al Core i7-9750H.
Aunque no son las noticias que a la mayoría de los entusiastas les gusta oír, son sin embargo buenas noticias para los jugadores que buscan actualizar sus viejos portátiles. El hecho de que el Comet Lake-H de la décima generación sea sólo marginalmente más rápido que el Coffee Lake-H de la novena generación a nivel de modelo de gama media significa que puedes actualizarte a un portátil para juegos Intel de la novena generación y seguir obteniendo esencialmente la misma experiencia de juego que un modelo Intel de la décima generación más caro. El dinero ahorrado podría utilizarse para actualizar otros aspectos más tangibles del portátil como la pantalla o la RAM o incluso un modelo mejor en conjunto como el GS65, GE65, o GS65
El MSI GP65 10SFK es el mismo portátil que el GP65 9SE del año pasado pero con un procesador ligeramente más rápido y más nuevo. Los usuarios no se perderán ninguna característica excitante o enormes ventajas de rendimiento si se quedan con una CPU Coffee Lake-H.
MSI GP65 10SFK-047US
- 05/06/2020 v7 (old)
Allen Ngo


