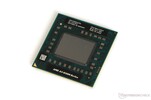
AMD A4-5150M
El AMD A4-5150M es un procesador dual-core móvil basado en la arquitectura Richland. Como sucesor del A4-4300M, el A6-5150M tiene un rendimiento de CPU y gráfico ligeramente superior y se posiciona en la clase baja. El APU integra 2 núcleos de CPU, una unidad gráfica DirectX 11 y el Northbridge junto con un controlador de memoria DDR3. Comparada con Trinity, la Richland fue modificada sólo un poco. Por lo tanto, ninguna modificación en el conjunto de recursos o en el rendimiento Pro-MHz puede ser reportada. El diseño del chip aún se basa en la arquitectura Bulldozer, que consiste en los llamados módulos. Cada módulo integra 2 unidades de enteros, pero sólo un FPU. Así como Trinity, Richland soporta prácticamente todas las técnicas actuales, como AVX (incluyendo FMA), AES o Turbo Core. De acuerdo con las frecuencias de 2,7 a 3,3 GHz, el A4-5150M debe desempeñarse de forma similar al A6-4400M y alcanza apenas a un Pentium P6000. Consecuentemente, el rendimiento en aplicaciones menos exigentes y juegos es suficiente. La unidad gráfica llamada Radeon HD 8350G ofrece 128 unidades shader (VLIW4) y tiene una frecuencia un poco más alta que la similar HD 7420G. Con una veloz memoria de dos canales, se espera que el rendimiento sea similar al de una Radeon HD 7450M dedicada. El consumo de energía de todo el APU es de 35 watts, que es comparable con un modelo de gama media convencionales de la competencia. Por eso, el APU es más adecuado para portátiles de 14 pulgadas o más grandes.
Serie AMD A-Series Nombre código Richland Serie: A-Series Richland Velocidad de reloj 2700 - 3300 MHz Caché de Nivel 1 96 KB Caché de Nivel 2 1 MB Número de Núcleos/Subprocesos 2 / 2 Consumo de Corriente (TDP = Thermal Design Power) 35 Watt Conteo de Transistores 1300 Millón Recursos 32 nm, 0.925- Tamaño de Matriz 246 mm2 Temperatura Máx. 105 °C Conector FS1r2 Recursos SSE (1, 2, 3, 3S, 4.1, 4.2, 4A), x86-64, AES, AVX, FMA (3, 4), DDR3-1600 Controller GPU AMD Radeon HD 8350G (514 - 720 MHz)64 Bit soporte para 64 Bit Architecture x86 Fecha de anuncio 03/12/2013 Enlace de Producto (externo) AMD A-Series A4-5150M
Benchmarks Performance Rating - CB R15 + R20 + 7-Zip + X265 + Blender + 3DM11 CPU
15.2 pt (17%)
Intel Atom x7-E3950 -12%
...
Intel Core i9-12900HX 336%
Cinebench R20 - Cinebench R20 CPU (Single Core)
144 Points (17%)
...
Intel Atom x7-E3950 -35%
Intel Celeron J3355 -26%
...
Intel Core i9-12900HX 413%
Cinebench R20 - Cinebench R20 CPU (Multi Core)
186 Points (1%)
Intel Celeron J3355 8%
Intel Atom x7-E3950 46%
...
Intel Core i7-12800HX 4504%
Cinebench R15 - Cinebench R15 CPU Multi 64 Bit
min: 96.9 de promedio: 101 mediana: 101 (1%) max: 105 Points
...
Intel Celeron J3355 -11%
AMD E2-9010 -10%
Intel Atom x5-Z8300 -7%
Intel Atom x5-E8000 -7%
AMD A4 Micro-6400T -6%
AMD A9-9420e -4%
Intel Atom x5-Z8500 2%
...
Intel Core i7-12800HX 3250%
0 5 10 15 20 25 30 35 40 45 50 55 60 65 70 75 80 85 90 95 Tooltip Pumori Test Platform: Ø96.9 (96.18-97.32)
Cinebench R15 - Cinebench R15 CPU Single 64 Bit
min: 54 de promedio: 59.1 mediana: 59.1 (18%) max: 64.2 Points
...
AMD A8-7410 -13%
AMD E2-9010 -10%
...
Intel Core i9-12900HX 370%
Cinebench R11.5 - Cinebench R11.5 CPU Multi 64 Bit
1.2 Points (2%)
...
AMD E2-9010 -4%
AMD A4 Micro-6400T -2%
Intel Atom x5-Z8300 -1%
AMD Athlon II P360 1%
AMD Turion II M500 3%
AMD A4-3310MX 3%
...
Intel Core i9-12900HX 3420%
Cinebench R11.5 - Cinebench R11.5 CPU Single 64 Bit
0.7 Points (2%)
...
...
Cinebench R10 - Cinebench R10 Rend. Single (32bit)
2446 puntos (20%)
...
Intel Core i3-350M 0%
...
Cinebench R10 - Cinebench R10 Rend. Multi (32bit)
3589 puntos (4%)
...
Intel Core 2 Duo T7100 -5%
AMD Athlon II M320 -3%
Intel Atom x5-Z8500 -1%
AMD Turion II M500 0%
Intel Pentium N3700 1%
Intel Celeron N3150 1%
AMD Turion II M520 2%
AMD Athlon II P340 2%
...
Intel Core i9-12900HX 1701%
wPrime 2.10 - wPrime 2.0 1024m *
1430 s (17%)
...
AMD Turion II Neo K685 -1%
Qualcomm Snapdragon 850 2%
AMD A4 Micro-6400T 2%
AMD A6 Pro-7050B 4%
...
VIA C3-M C3-M-1200 492%
wPrime 2.10 - wPrime 2.0 32m *
43 s (9%)
...
AMD A4-3310MX -3%
AMD Turion II Neo K685 -2%
Intel Core 2 Duo T7250 5%
...
1167 puntos (7%)
...
AMD E2-7110 -7%
Intel Celeron 3865U -5%
AMD A6-7310 1%
...
7-Zip 18.03 - 7-Zip 18.03 Multli Thread 4 runs
min: 3740 de promedio: 3769 mediana: 3768.5 (2%) max: 3797 MIPS
AMD Ryzen 5 PRO 2500U -26%
Intel Celeron J3355 -6%
Intel Atom x5-E8000 18%
Intel Atom x7-E3950 21%
...
Intel Core i7-12800HX 1942%
7-Zip 18.03 - 7-Zip 18.03 Single Thread 4 runs
min: 2616 de promedio: 2620 mediana: 2620 (31%) max: 2624 MIPS
...
AMD Ryzen Embedded R1505G -4%
Intel Core i3-6157U 6%
...
Intel Core i9-12900HX 140%
X264 HD Benchmark 4.0 - x264 Pass 2
8 fps (3%)
...
Intel Atom x5-E8000 -5%
...
Intel Core i9-12900HX 2219%
X264 HD Benchmark 4.0 - x264 Pass 1
42 fps (10%)
...
AMD E2-9010 -7%
Intel Celeron N3150 7%
Intel Atom x7-E3950 7%
...
Intel Core i9-12900HX 647%
HWBOT x265 Benchmark v2.2 - HWBOT x265 4k Preset
min: 0.51 de promedio: 0.6 mediana: 0.6 (1%) max: 0.62 fps
Intel Atom x5-Z8300 -29%
AMD Ryzen Embedded R1505G 15%
Intel Celeron J3355 24%
...
Intel Core i7-12800HX 4307%
0 0.1 0.2 0.2 0.3 0.4 0.5 0.5 0.6 0.7 0.8 0.8 0.9 1 1.1 1.1 1.2 1.3 1.4 1.4 Tooltip Pumori Test Platform: Ø0.611 (0.18-1.52)
Pumori Test Platform: Ø0.665 (0.16-1.39)
TrueCrypt - TrueCrypt Serpent
min: 0.083 de promedio: 0.1 mediana: 0.1 (0%) max: 0.086 GB/s
...
Intel Celeron 3865U -7%
AMD A4 Micro-6400T -1%
Intel Atom x5-Z8300 2%
Intel Atom x5-E8000 7%
AMD E2-9010 7%
...
Intel Core i9-12900HX 1912%
TrueCrypt - TrueCrypt Twofish
min: 0.15 de promedio: 0.2 mediana: 0.2 (0%) max: 0.154 GB/s
...
Intel Celeron 2970M -5%
Intel Atom x5-Z8500 0%
...
Intel Core i9-12900HX 2005%
TrueCrypt - TrueCrypt AES
min: 0.739 de promedio: 0.8 mediana: 0.8 (0%) max: 0.766 GB/s
...
Intel Atom x5-Z8300 -21%
Intel Atom x5-Z8500 -15%
AMD A4 Micro-6400T -4%
AMD E2-9010 -1%
Intel Celeron 3865U 8%
Intel Celeron N3150 8%
...
Intel Core i9-12900HX 2212%
Blender - Blender 2.79 BMW27 CPU *
min: 5364 de promedio: 5507 mediana: 5506.5 (39%) max: 5649 Seconds
Intel Core i5-1038NG7 -100%
...
Intel Atom x7-E3950 -17%
Intel Celeron J3355 6%
Intel Atom x5-E8000 40%
R Benchmark 2.5 - R Benchmark 2.5 *
1.8 sec (38%)
Intel Core i9-12900HX -76%
...
Qualcomm Snapdragon 850 32%
...
3DMark 06 - CPU - 3DMark 06 - CPU
1881 Points (4%)
...
Intel Core Duo T2700 -1%
AMD Turion II Ultra M600 1%
...
Intel Core i9-12900HX 839%
Super Pi mod 1.5 XS 1M - Super Pi mod 1.5 XS 1M *
30.3 s (7%)
...
Intel Core 2 Duo T7250 -3%
AMD Athlon II M320 -2%
AMD A8-3510MX -2%
Intel Mobile A A110 -1%
AMD Turion II N530 2%
Intel Core 2 Duo T7100 2%
AMD A6-3420M 2%
...
VIA C3-M C3-M-1200 1428%
Super Pi mod 1.5 XS 2M - Super Pi mod 1.5 XS 2M *
67.2 s (3%)
...
Intel Core 2 Duo T5850 -2%
Intel Core 2 Duo T7250 3%
Intel Core 2 Duo T7100 6%
...
3DMark Vantage - 3DM Vant. Perf. CPU no Physx
3732 Points (3%)
...
AMD A4 Micro-6400T -4%
...
Intel Core i9-12900HX 2273%
3DMark 11 - 3DM11 Performance Physics
1531 Points (4%)
...
Intel Atom x5-E8000 -2%
Intel Celeron N3150 -1%
AMD Phenom II X4 P960 1%
AMD A4-6210 4%
...
Intel Core i7-12800HX 1361%
3DMark - 3DMark Ice Storm Physics
8366 Points (5%)
...
Intel Celeron N2840 -17%
AMD E1-6010 -12%
AMD A4 Micro-6400T 3%
Intel Celeron N3050 5%
...
3DMark - 3DMark Ice Storm Unlimited Physics
9004 Points (8%)
AMD A6 Pro-7050B 14%
AMD E2-9010 41%
Intel Celeron N2840 43%
Intel Atom x5-Z8550 45%
...
Intel Core i9-12900HX 1000%
3DMark - 3DMark Cloud Gate Physics
844 Points (2%)
...
Intel Celeron N2840 -23%
Intel Celeron N3050 -15%
AMD A6 Pro-7050B 1%
AMD E2-9010 9%
AMD A4 Micro-6400T 10%
...
Intel Core i7-12800HX 2550%
3DMark - 3DMark Fire Strike Standard Physics
722 Points (1%)
...
AMD E1-6010 10%
Intel Celeron N3050 32%
...
Intel Core i7-12800HX 4671%
Geekbench 5.4 - Geekbench 5.1 - 5.4 64 Bit Single-Core
454 puntos (20%)
...
Qualcomm Snapdragon 850 7%
...
Apple M2 Max 333%
Geekbench 5.4 - Geekbench 5.1 - 5.4 64 Bit Multi-Core
633 puntos (2%)
...
Apple M2 Max 2329%
Geekbench 5.0 - Geekbench 5.0 64 Bit Single-Core
454 puntos (2%)
...
Intel Core i5-8260U 22%
AMD Ryzen Embedded R1505G 36%
...
Geekbench 5.0 - Geekbench 5.0 64 Bit Multi-Core
639 puntos (2%)
...
Intel Core i9-12900HX 2480%
Geekbench 4.1 - 4.4 - Geekbench 4.1 - 4.4 64 Bit Single-Core
min: 2048 de promedio: 2050 mediana: 2050 (21%) max: 2052 puntos
...
AMD PRO A8-9600B 4%
Intel Celeron 3865U 9%
Qualcomm Snapdragon 850 11%
...
Intel Core i9-13900HX 335%
Geekbench 4.1 - 4.4 - Geekbench 4.1 - 4.4 64 Bit Multi-Core
min: 2711 de promedio: 2872 mediana: 2871.5 (3%) max: 3032 puntos
...
AMD E2-9010 -16%
Intel Atom x7-E3950 -10%
Microsoft SQ1 -10%
Intel Celeron J3355 -5%
Intel Atom x5-E8000 -2%
...
Intel Core i9-13900HX 2377%
Geekbench 4.0 - Geekbench 4.0 64 Bit Single-Core
1971 puntos (31%)
...
AMD E2-9010 -23%
AMD Pro A8-8600B -4%
AMD PRO A8-9600B 1%
Intel Celeron 3865U 11%
Intel Celeron 2970M 19%
...
Geekbench 4.0 - Geekbench 4.0 64 Bit Multi-Core
2896 puntos (7%)
Intel Atom x5-Z8300 -36%
AMD E2-9010 -20%
Intel Atom x5-E8000 -13%
Intel Atom x5-Z8550 8%
AMD A8-7410 19%
Intel Celeron 3865U 23%
AMD Pro A8-8600B 29%
Intel Celeron 2970M 35%
...
Geekbench 3 - Geekbench 3 32 Bit Multi-Core
2528 puntos (4%)
...
AMD E2-9010 -7%
Intel Atom x5-Z8500 -3%
Intel Celeron N3150 12%
...
Geekbench 3 - Geekbench 3 32 Bit Single-Core
1739 puntos (34%)
...
Intel Pentium 3825U -8%
Intel Celeron 3865U 6%
AMD Pro A8-8600B 7%
...
Intel Core i5-1230U 194%
Geekbench 3 - Geekbench 3 64 Bit Multi-Core
2747 puntos (4%)
Intel Celeron N3050 -41%
AMD A6 Pro-7050B -26%
Intel Atom x5-Z8300 -14%
AMD E2-9010 -10%
Intel Atom x5-Z8500 1%
Intel Pentium N3700 20%
AMD E2-7110 23%
Intel Celeron 3865U 23%
...
Intel Core i5-1230U 787%
Geekbench 3 - Geekbench 3 64 Bit Single-Core
1927 puntos (29%)
...
AMD E2-9010 -21%
Intel Celeron 3865U 0%
AMD PRO A8-9600B 9%
...
Intel Core i5-1230U 203%
Geekbench 2 - 32 Bit - Geekbench Stream
3968 Points (32%)
...
AMD Pro A8-8600B -9%
Intel Pentium 3825U 5%
...
Geekbench 2 - 32 Bit - Geekbench Memory
3616 Points (33%)
...
AMD PRO A8-9600B -6%
Intel Pentium 3825U 0%
...
Intel Core i7-8559U 177%
Geekbench 2 - 32 Bit - Geekbench Floating Point
2993 Points (6%)
...
Intel Atom x5-Z8300 -12%
Intel Celeron 3865U -5%
Intel Celeron N3150 8%
AMD A4 Micro-6400T 10%
...
Geekbench 2 - 32 Bit - Geekbench Integer
3438 Points (7%)
...
AMD A4-6210 -6%
Intel Celeron 3865U -5%
Intel Celeron N3150 -3%
AMD E2-7110 4%
AMD A8-3520M 8%
...
Geekbench 2 - 32 Bit - Geekbench Total Score
3370 Points (9%)
...
AMD E2-9010 -9%
AMD A4-6210 1%
...
Sunspider - Sunspider 1.0 Total Score *
274 ms (3%)
...
AMD A6 Pro-7050B -11%
AMD A4-7210 -3%
Intel Core i5-7Y57 -2%
AMD A6-7310 -2%
AMD A8-7410 7%
AMD E2-7110 24%
...
Sunspider - Sunspider 0.9.1 Total Score *
288 ms (3%)
...
Intel Celeron N2840 157%
unknown 2332%
Octane V2 - Octane V2 Total Score
min: 13144 de promedio: 13186 mediana: 13185.5 (14%) max: 13227 Points
...
Intel Core M-5Y31 1%
Intel Pentium 3825U 3%
...
Intel Core i9-12900HX 623%
- Gama de valores de las pruebas para esta tarjeta gráfica
- Valores medios de las pruebas para esta tarjeta gráfica
* Smaller numbers mean a higher performance
v1.22
log 03. 11:17:50
#0 no ids found in url (should be separated by "_") +0s ... 0s
#1 not redirecting to Ajax server +0s ... 0s
#2 did not recreate cache, as it is less than 5 days old! Created at Mon, 30 Jan 2023 08:57:14 +0100 +0.001s ... 0.001s
#3 no comparison url found in template nbc.compare_page_2 needed +0.006s ... 0.007s
#4 no comparison url found in template nbc.compare_page_2 needed +0s ... 0.008s
#5 no comparison url found in template nbc.compare_page_2 needed +0s ... 0.008s
#6 no comparison url found in template nbc.compare_page_2 needed +0s ... 0.008s
#7 no comparison url found in template nbc.compare_page_2 needed +0s ... 0.009s
#8 no comparison url found in template nbc.compare_page_2 needed +0s ... 0.009s
#9 no comparison url found in template nbc.compare_page_2 needed +0s ... 0.009s
#10 no comparison url found in template nbc.compare_page_2 needed +0s ... 0.009s
#11 no comparison url found in template nbc.compare_page_2 needed +0s ... 0.01s
#12 no comparison url found in template nbc.compare_page_2 needed +0s ... 0.01s
#13 composed specs +0s ... 0.01s
#14 did output specs +0s ... 0.01s
#15 getting avg benchmarks for device 3781 +0.012s ... 0.022s
#16 got single benchmarks 3781 +0.008s ... 0.03s
#17 got avg benchmarks for devices +0s ... 0.03s
#18 min, max, avg, median took s +0.545s ... 0.575s
#19 no comparison url found in template nbc.compare_page_2 needed +0s ... 0.575s
#20 return log +0s ... 0.575s
No se encontraron análisis para esta CPU (aún)
Please share our article, every link counts!
.170
Otras CPUs de la serie A-Series » AMD A8-7410 4x 2.2 GHz - 2.5 GHz
» AMD A8-3550MX 4x 2 GHz - 2.7 GHz
» AMD A6-7310 4x 2 GHz - 2.4 GHz
» AMD A8-3530MX 4x 1.9 GHz - 2.6 GHz
» AMD A8-3510MX 4x 1.8 GHz - 2.5 GHz
» AMD A4-7210 4x 1.8 GHz - 2.2 GHz
» AMD A6-3430MX 4x 1.7 GHz - 2.4 GHz
» AMD A8-3520M 4x 1.6 GHz - 2.5 GHz
» AMD A6-3410MX 4x 1.6 GHz - 2.3 GHz
» AMD A8-3500M 4x 1.5 GHz - 2.4 GHz
» AMD A6-3420M 4x 1.5 GHz - 2.4 GHz
» AMD A6-3400M 4x 1.4 GHz - 2.3 GHz
» AMD A4-3330MX 2x 2.2 GHz - 2.6 GHz
» AMD A4-6210 4x 1.8 GHz
» AMD A4-5050 4x 1.55 GHz
» AMD A4-3310MX 2x 2.1 GHz - 2.5 GHz
» AMD A4-3320M 2x 2 GHz - 2.6 GHz
» AMD A4 Micro-6400T 4x 1 GHz - 1.6 GHz
CPUs de alrededor + Intel Core 2 Duo T7300 2x 2 GHz
+ Intel Core 2 Duo T5850 2x 2.1 GHz
+ AMD A4-3330MX 2x 2.2 GHz - 2.6 GHz
Klaus Hinum (Update: 2013-04-12)