Intel Pentium Silver N6000
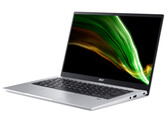
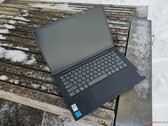
El Intel Pentium Silver N6000 es un SoC de cuatro núcleos de la serie Jasper Lake que se destina principalmente a portátiles económicos y se anunció a principios de 2021. Los cuatro núcleos de la CPU Tremont funcionan a una frecuencia de entre 1,1 y 3,3 GHz (ráfaga de un núcleo) y no ofrecen HyperThreading (SMT). El N6000 utiliza 1,5 MB de caché L2 y 4 MB de caché L3. El chip está fabricado en 10nm en Intel (muy probablemente en el mismo proceso que Ice Lake).
La arquitectura del procesador se llama Tremont y es un rediseño completo en comparación con los antiguos núcleos Golmont Plus del predecesor. Según Intel, el rendimiento de un solo hilo de un núcleo podría mejorar en un 30% de media (10 - 80% en todas las pruebas de SPECint y SPECfp).
Además del bloque de CPU de cuatro núcleos, el SoC integra una GPU Intel UHD Graphics de 32 UE con una frecuencia de 350 a 850 MHz y un controlador de memoria de doble canal LPDDR4(x) (hasta 16 GB y 2933 MHz). El chip ahora también integra parcialmente Wi-Fi 6 (Gig+), 8 carriles PCIe 3.0, 14 puertos USB 2.0/ 3.2 y dos puertos SATA 6.0. El encapsulado se ha hecho más grande y mide 35 x 24 mm (frente a los 25 x 24 mm del N5030, por ejemplo). El SoC está soldado directamente a la placa base (BGA) y no se puede sustituir fácilmente.
Gracias a la nueva arquitectura de la CPU, el rendimiento del N6000 debería ser claramente mejor en comparación con el antiguo Pentium N5030. Sin embargo, debería seguir estando por detrás de los modernos procesadores Core de la generación Tiger Lake. Por tanto, la CPU está pensada para tareas básicas como trajes de oficina, navegación web con multitarea moderada.
Al igual que el predecesor, Intel especifica el TDP con 6 vatios (SDP 4,8 vatios - Scenario Design Power). Por lo tanto, el chip puede ser refrigerado pasivamente en teoría, pero también son posibles SKUs con ventiladores.
Serie Intel Jasper Lake Nombre código Jasper Lake Serie: Jasper Lake Jasper Lake Velocidad de reloj 1100 - 3300 MHz Caché de Nivel 2 1.5 MB Caché de Nivel 3 4 MB Número de Núcleos/Subprocesos 4 / 4 Consumo de Corriente (TDP = Thermal Design Power) 6 Watt Tecnología de producción 10 nm Temperatura Máx. 105 °C Conector FCBGA1338 Recursos Intel UHD Graphics (32 EUs, 350 - 850 MHz), Quick Sync, AES-NI, max. 16 GB Quad-Channel LPDDR4x-2933 GPU Intel UHD Graphics (Jasper Lake 32 EU) (350 - 850 MHz)64 Bit soporte para 64 Bit Architecture x86 Fecha de anuncio 01/11/2021 Enlace de Producto (externo) Intel Jasper Lake Pentium N6000
Benchmarks Performance Rating - CB R15 + R20 + 7-Zip + X265 + Blender + 3DM11 CPU
25.7 pt (30%)
...
Intel Pentium Silver N6000

...
Intel Core i9-12900H 162%
Cinebench R23 - Cinebench R23 CPU (Multi Core)
min: 1671 de promedio: 1770 mediana: 1727 (3%) max: 1911 Points
...
Intel Core m3-7Y32 -27%
Intel Pentium Silver N6000
AMD Ryzen Embedded R1606G 4%
Intel Core i3-8109U 13%
Intel Core i5-1140G7 48%
...
Intel Core i9-12900H 836%
Cinebench R23 - Cinebench R23 CPU (Single Core)
min: 666 de promedio: 675 mediana: 679 (34%) max: 679 Points
...
Intel Core m3-7Y32 -6%
Intel Pentium Silver N6000
Intel Core i7-2860QM 3%
AMD Ryzen Embedded V1605B 25%
...
Intel Core i9-12900H 183%
Cinebench R20 - Cinebench R20 CPU (Single Core)
min: 237 de promedio: 256 mediana: 263 (34%) max: 268 Points
...
AMD Ryzen Embedded R1505G -5%
Intel Core i7-10510Y -2%
Intel Pentium Silver N6000
Intel Core i7-2860QM 5%
Intel Core i3-8145U 16%
...
Intel Core i9-12900H 187%
Cinebench R20 - Cinebench R20 CPU (Multi Core)
min: 635 de promedio: 677 mediana: 666 (3%) max: 730 Points
...
AMD Ryzen Embedded R1505G -12%
Intel Core i3-8145U -3%
Intel Pentium Silver N6000
AMD Ryzen Embedded R1606G 5%
Intel Core i3-8109U 14%
Intel Core i7-10510Y 25%
Intel Core i5-6287U 25%
...
Intel Core i9-12900H 829%
Cinebench R15 - Cinebench R15 CPU Multi 64 Bit
min: 280 de promedio: 301.3 mediana: 302 (3%) max: 322 Points
...
Intel Core i3-7130U -6%
Intel Pentium Silver N6000
Intel Core i5-5257U 1%
Intel Core i5-6360U 3%
Intel Core i7-6560U 3%
...
Intel Core i9-12900H 773%
0 20 40 60 80 100 120 140 160 180 200 220 240 260 280 300 320 Tooltip Acer Swift 1 SF114-34-P91A ; 8 GB RAM, Dual-Channel: Ø288 (278.65-301.14)
Cinebench R15 - Cinebench R15 CPU Single 64 Bit
min: 109 de promedio: 115.7 mediana: 117 (40%) max: 121 Points
...
Intel Core i3-7130U -4%
Intel Pentium Silver N6000
Intel Core i5-5350U 0%
...
Intel Core i9-12900H 138%
Cinebench R11.5 - Cinebench R11.5 CPU Multi 64 Bit
min: 3.47 de promedio: 3.6 mediana: 3.6 (7%) max: 3.71 Points
...
Intel Core i5-5257U -5%
Intel Core i7-6560U -4%
Intel Core i5-4200H -2%
Intel Core i5-6267U 0%
Intel Pentium Silver N6000
Intel Core i5-7200U 0%
...
Intel Core i9-12900HK 819%
Cinebench R11.5 - Cinebench R11.5 CPU Single 64 Bit
min: 1.36 de promedio: 1.4 mediana: 1.4 (40%) max: 1.46 Points
...
Intel Core i5-5257U -1%
Intel Core i5-6360U 0%
Intel Pentium Silver N6000
Intel Core i7-4712HQ 1%
AMD Ryzen 3 PRO 3300U 1%
Intel Core i5-7200U 2%
...
Intel Core i9-12900H 134%
Cinebench R10 - Cinebench R10 Rend. Single (32bit)
min: 4057 de promedio: 4132 mediana: 4131.5 (37%) max: 4206 puntos
...
Intel Pentium Silver N6000
...
Cinebench R10 - Cinebench R10 Rend. Multi (32bit)
min: 9343 de promedio: 9643 mediana: 9642.5 (13%) max: 9942 puntos
...
Intel Pentium Silver N6000
Intel Core i7-2640M 1%
Intel Core i3-7130U 2%
Intel Core i5-7Y57 3%
...
Intel Core i9-12900H 528%
wPrime 2.10 - wPrime 2.0 1024m *
727 s (9%)
...
AMD A8-3520M -4%
AMD Phenom II X4 P960 -3%
Intel Pentium N3700 -1%
Intel Pentium Silver N6000
Intel Core i3-5015U 2%
AMD A6-3420M 2%
...
VIA C3-M C3-M-1200 1064%
wPrime 2.10 - wPrime 2.0 32m *
16.9 s (3%)
...
AMD PRO A8-9600B -1%
Intel Pentium Silver N6000
...
1330 puntos (8%)
...
AMD A8-7410 -3%
AMD A10-9620P 0%
Intel Pentium Silver N6000
Intel Celeron 2970M 6%
...
7-Zip 18.03 - 7-Zip 18.03 Multli Thread 4 runs
min: 8577 de promedio: 9167 mediana: 9212 (7%) max: 9668 MIPS
...
Intel Core i7-6560U -3%
AMD Ryzen Embedded R1606G -2%
Intel Pentium Silver N6000
Intel Core i3-8109U 4%
Intel Core i5-6287U 7%
...
Intel Core i9-12900H 618%
7-Zip 18.03 - 7-Zip 18.03 Single Thread 4 runs
min: 2320 de promedio: 2841 mediana: 2828.5 (41%) max: 3387 MIPS
...
AMD Ryzen Embedded R1505G -12%
Intel Pentium Silver N6000
...
Intel Core i9-12900H 112%
X264 HD Benchmark 4.0 - x264 Pass 2
18.4 fps (8%)
...
Intel Core i5-7Y57 -6%
Intel Pentium Silver N6000
Intel Core i3-7130U 3%
...
Intel Core i9-12900HK 767%
X264 HD Benchmark 4.0 - x264 Pass 1
93.4 fps (25%)
...
Intel Core i7-2640M -3%
Intel Core m5-6Y57 -1%
Intel Pentium Silver N6000
AMD Ryzen 5 PRO 2500U 5%
Intel Core i3-7130U 7%
...
Intel Core i9-12900HK 222%
HWBOT x265 Benchmark v2.2 - HWBOT x265 4k Preset
min: 1.55 de promedio: 1.7 mediana: 1.7 (4%) max: 1.76 fps
...
Intel Pentium Silver N6000
AMD Ryzen Embedded R1606G 20%
...
AMD Ryzen 9 6900HX 966%
0 0.2 0.4 0.6 0.8 1 1.2 1.4 1.5 1.7 1.9 2.1 2.3 2.5 2.7 2.9 3.1 3.3 3.5 3.7 Tooltip Acer Swift 1 SF114-34-P91A ; 8 GB RAM, Dual-Channel: Ø1.769 (0.47-3.87)
TrueCrypt - TrueCrypt Serpent
0.2 GB/s (8%)
...
Intel Pentium Silver N6000
Intel Core i5-7360U 2%
AMD A12-9720P 3%
...
Intel Core i9-12900HK 585%
TrueCrypt - TrueCrypt Twofish
0.4 GB/s (8%)
...
AMD A12-9720P -10%
Intel Core i5-7360U -6%
Intel Core i3-8145U -3%
Intel Pentium Silver N6000
...
Intel Core i9-12900HK 539%
TrueCrypt - TrueCrypt AES
2.8 GB/s (10%)
...
Intel Core i7-2860QM -4%
Intel Pentium Silver N6000
Intel Core i5-1140G7 11%
...
Intel Core i9-12900HK 482%
Blender 2.79 - Blender 2.79 BMW27 CPU *
min: 1738 de promedio: 2142 mediana: 1836.5 (13%) max: 3157 Seconds
CPU TDP ? TDP 7 W 107% 100%
Intel Core i5-1038NG7 -100%
...
AMD Ryzen Embedded R1505G -19%
Intel Pentium Silver N6000
...
R Benchmark 2.5 - R Benchmark 2.5 *
min: 1.084 de promedio: 1.2 mediana: 1.2 (26%) max: 1.278 sec
CPU TDP ? TDP 7 W 100% 105%
Intel Core i9-12900H -64%
...
Intel Core i7-2860QM -18%
AMD Ryzen Embedded R1505G -8%
Intel Pentium Silver N6000
...
3DMark 06 - CPU - 3DMark 06 - CPU
3985 Points (8%)
...
Intel Core i7-2640M -1%
Intel Pentium Silver N6000
Intel Core i5-6360U 3%
Intel Core i5-5257U 5%
...
Intel Core i9-12900HK 322%
Super Pi mod 1.5 XS 1M - Super Pi mod 1.5 XS 1M *
17.5 s (4%)
Intel Core i7-11390H -62%
...
Intel Celeron 2970M 0%
Intel Pentium Silver N6000
...
VIA C3-M C3-M-1200 2541%
Super Pi Mod 1.5 XS 32M - Super Pi mod 1.5 XS 32M *
895 s (4%)
...
Intel Pentium Silver N6000
Intel Core M-5Y51 0%
AMD A12-9720P 1%
...
VIA C3-M C3-M-1200 2416%
3DMark 11 - 3DM11 Performance Physics
min: 3134 de promedio: 3617 mediana: 3563 (12%) max: 4155 Points
...
Intel Core i5-7Y57 -1%
Intel Pentium Silver N6000
...
AMD Ryzen 9 6900HX 418%
3DMark - 3DMark Ice Storm Physics
min: 30345 de promedio: 32921 mediana: 32921 (21%) max: 35497 Points
...
Intel Pentium Silver N6000
...
3DMark - 3DMark Ice Storm Extreme Physics
min: 30120 de promedio: 32790 mediana: 32790 (27%) max: 35460 Points
...
Intel Pentium Silver N6000
AMD Ryzen 5 PRO 2500U 3%
Intel Core i5-7Y57 4%
...
Intel Core i7-12700H 172%
3DMark - 3DMark Ice Storm Unlimited Physics
min: 38897 de promedio: 43994 mediana: 43993.5 (37%) max: 49090 Points
...
Intel Core i5-6267U -6%
Intel Core i5-7200U -6%
Intel Core i3-8121U -4%
Intel Pentium Silver N6000
Intel Core i7-6560U 0%
Intel Core i5-7267U 1%
...
AMD Ryzen 9 5900HS 110%
3DMark - 3DMark Cloud Gate Physics
min: 2524 de promedio: 2872 mediana: 2872 (7%) max: 3220 Points
...
AMD Ryzen Embedded R1505G -1%
Intel Pentium Silver N6000
Intel Core i7-2640M 0%
Intel Core i5-7Y57 4%
...
Intel Core i9-12900H 611%
3DMark - 3DMark Fire Strike Standard Physics
min: 3902 de promedio: 4474 mediana: 4224 (10%) max: 5296 Points
...
Intel Core i3-7130U -3%
Intel Pentium Silver N6000
Intel Core i5-6360U 3%
...
Intel Core i9-12900H 559%
3DMark - 3DMark Time Spy CPU
min: 1161 de promedio: 1340 mediana: 1337 (7%) max: 1523 Points
...
Intel Pentium Silver N6000
Intel Core i5-7Y57 8%
...
Intel Core i9-12900H 898%
Geekbench 4.1 - 4.4 - Geekbench 4.1 - 4.4 64 Bit Single-Core
3188 puntos (37%)
...
AMD Ryzen Embedded R1505G -16%
Intel Core i3-7100U -5%
Intel Pentium Silver N6000
AMD Ryzen 3 PRO 2300U 6%
Intel Core i7-2860QM 9%
AMD Ryzen 5 PRO 2500U 10%
...
Intel Core i9-12900HK 150%
Geekbench 4.1 - 4.4 - Geekbench 4.1 - 4.4 64 Bit Multi-Core
8341 puntos (10%)
...
Intel Core i3-8121U -4%
Intel Core i3-8145U -4%
Intel Core i5-6287U -1%
Intel Pentium Silver N6000
Intel Core i5-7260U 3%
AMD Ryzen 3 PRO 2300U 4%
Intel Core i5-7267U 4%
Intel Core i5-7287U 6%
Intel Core i3-8109U 8%
...
Intel Core i9-12900HK 508%
Geekbench 5.0 - Geekbench 5.0 64 Bit Single-Core
726 puntos (37%)
...
AMD Ryzen Embedded R1505G -15%
Intel Pentium Silver N6000
Microsoft SQ1 0%
Intel Core i7-2860QM 4%
AMD Ryzen 5 2600H 13%
AMD Ryzen Embedded V1605B 17%
...
Intel Core i9-12900HK 155%
Geekbench 5.0 - Geekbench 5.0 64 Bit Multi-Core
1942 puntos (6%)
...
Intel Pentium Silver N6000
Intel Core i3-8145U 8%
...
Intel Core i9-12900HK 603%
Geekbench 5.3 - Geekbench 5.1 - 5.4 64 Bit Single-Core
min: 720 de promedio: 729 mediana: 730 (36%) max: 736 puntos
...
Intel Core i7-8559U -1%
AMD Ryzen 3 PRO 2300U 0%
Intel Pentium Silver N6000
Intel Core i7-2860QM 1%
Intel Core i5-10210Y 1%
Microsoft SQ1 1%
Intel Core i7-4722HQ 3%
Intel Core m3-7Y32 6%
...
Intel Core i9-12900H 155%
Geekbench 5.3 - Geekbench 5.1 - 5.4 64 Bit Multi-Core
min: 1784 de promedio: 1896 mediana: 1897 (7%) max: 2004 puntos
...
Intel Core i3-8109U -1%
Intel Pentium Silver N6000
AMD Ryzen Embedded R1606G 0%
Qualcomm Snapdragon 850 1%
Intel Core i5-6287U 5%
Intel Core i5-7260U 9%
...
Mozilla Kraken 1.1 - Kraken 1.1 Total Score *
min: 1388 de promedio: 1399 mediana: 1404 (2%) max: 1406 ms
CPU TDP ? TDP 7 W 100% 100%
...
Intel Core m5-6Y57 -7%
Intel Core i5-6267U -5%
Intel Core i7-2860QM -4%
Intel Pentium Silver N6000
Microsoft SQ1 1%
AMD 3015Ce 1%
AMD Ryzen 5 PRO 2500U 6%
...
Sunspider - Sunspider 1.0 Total Score *
293.2 ms (3%)
...
AMD A4-7210 -10%
Intel Core i5-7Y57 -9%
AMD A6-7310 -8%
AMD A8-7410 0%
Intel Pentium Silver N6000
AMD E2-7110 16%
Intel Core i3-7100U 16%
AMD 3015Ce 17%
...
Octane V2 - Octane V2 Total Score
min: 25840 de promedio: 31377 mediana: 33858 (35%) max: 34433 Points
...
Intel Core i5-8305G -4%
Intel Core i5-7Y57 -2%
Intel Core i5-6360U -1%
Microsoft SQ1 -1%
Intel Core i5-8265U 0%
Intel Pentium Silver N6000
Intel Core i5-6267U 1%
...
Intel Core i9-12900HK 201%
WebXPRT 3 - WebXPRT 3 Score
min: 146 de promedio: 146.5 mediana: 146.5 (41%) max: 147 Points
...
Intel Core i7-2860QM -7%
Intel Pentium Silver N6000
AMD Ryzen Embedded R1606G 1%
AMD Ryzen Embedded V1605B 2%
Intel Core i5-6287U 3%
Intel Core i7-7700HQ 4%
...
CrossMark - CrossMark Overall
440 Points (19%)
Intel Pentium Silver N6000
AMD Ryzen Embedded R1606G 42%
...
Intel Core i9-12900H 378%
Power Consumption - Prime95 Power Consumption - external Monitor *
11.3 Watt (2%)
Intel Pentium Silver N6000
Intel Atom x7-E3950 12%
...
Power Consumption - Cinebench R15 Multi Power Consumption - external Monitor *
min: 10.5 de promedio: 13.5 mediana: 13.5 (4%) max: 16.4 Watt
CPU TDP ? TDP 7 W 100% 102%
...