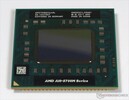
AMD A10-5750M
El AMD A10-5750M es un procesador quad-core móvil basado en la arquitectura Richland. Como sucesor del A10-4600m, el A10-5750M ofrece un rendimiento de CPU y gráfico un poco superior y representa el nuevo modelo top de la serie A (Marzo 2013). Comparada con Trinity, la Richland fue modificada sólo un poco. Por lo tanto, ninguna modificación en el conjunto de recursos o en el rendimiento Pro-MHz puede ser reportada. El diseño del chip aún se basa en la arquitectura Bulldozer, que consiste en los llamados módulos. Cada uno de los dos módulos integran 2 unidades de enteros, pero sólo un FPU. Así como Trinity, Richland soporta prácticamente todas las técnicas actuales, como AVX (incluyendo FMA), AES o Turbo Core. Los primeros benchmarks PCMark 7 muestran un aumento del rendimiento de cerca de 10 por ciento en el A10-4600M (5750M: 2175 puntos, 4600M: 1965 puntos). Con eso el A10-5750M se colocaría casi al mismo nivel de un Core i3-2330M (Sandy Bridge). La unidad gráfica llamada Radeon HD 8650G ofrece 384 unidades shader (VLIW4) y tiene una frecuencia de 533 - 720 MHz (un poco más alta que la HD 7660G). Con una veloz memoria de dos canales, se espera que el rendimiento supere el de una HD 7670M dedicada. El consumo de energía de todo el APU es de 35 watts, que es comparable con un modelo de gama media convencionales de la competencia. Por eso, el APU es más adecuado para portátiles de 14 pulgadas o más grandes.
Serie AMD A-Series Nombre código Richland Serie: A-Series Richland Velocidad de reloj 2500 - 3500 MHz Caché de Nivel 2 4 MB Número de Núcleos/Subprocesos 4 / 4 Consumo de Corriente (TDP = Thermal Design Power) 35 Watt Tecnología de producción 32 nm Conector FS1r2 Recursos SSE (1, 2, 3, 3S, 4.1, 4.2, 4A), x86-64, AES, AVX, FMA, DDR3-1866 Controller GPU AMD Radeon HD 8650G (533 - 720 MHz)64 Bit soporte para 64 Bit Architecture x86 Fecha de anuncio 03/12/2013
Benchmarks Performance Rating - CB R15 + R20 + 7-Zip + X265 + Blender + 3DM11 CPU
23.1 pt (23%)
...
...
Cinebench R20 - Cinebench R20 CPU (Single Core)
min: 154 de promedio: 163 mediana: 162.5 (25%) max: 171 Points
...
Intel Atom x7-E3950 -43%
Intel Celeron J3355 -35%
AMD A9-9425 20%
...
Cinebench R20 - Cinebench R20 CPU (Multi Core)
min: 428 de promedio: 435 mediana: 434.5 (4%) max: 441 Points
...
Intel Atom x7-E3950 -37%
AMD A9-9425 -35%
...
AMD Ryzen Threadripper 2970WX 2199%
Cinebench R15 - Cinebench R15 CPU Multi 64 Bit
min: 198 de promedio: 207 mediana: 209 (5%) max: 212 Points
...
Intel Core M-5Y31 -6%
AMD PRO A8-9600B -2%
Intel Core i3-5015U 3%
...
AMD Ryzen Threadripper 2970WX 2014%
0 10 20 30 40 50 60 70 80 90 100 110 120 130 140 150 160 170 180 190 200 210 220 Tooltip Pumori Test Platform (A10-5750M) : Ø208 (206.6-212.11)
Cinebench R15 - Cinebench R15 CPU Single 64 Bit
min: 72 de promedio: 75.5 mediana: 76 (28%) max: 78.6 Points
...
Intel Celeron J4105 -3%
AMD A9-9425 1%
Intel Pentium 3825U 2%
Intel Celeron J4005 2%
...
Cinebench R11.5 - Cinebench R11.5 CPU Multi 64 Bit
min: 2.19 de promedio: 2.3 mediana: 2.3 (5%) max: 2.32 Points
...
Intel Core i3-5015U 3%
...
Cinebench R11.5 - Cinebench R11.5 CPU Single 64 Bit
min: 0.81 de promedio: 0.8 mediana: 0.9 (27%) max: 0.88 Points
...
AMD A6-6400K -2%
AMD PRO A8-9600B -1%
Intel Core M-5Y10c 0%
Intel Celeron J4005 0%
Intel Celeron 3865U 2%
...
Cinebench R10 - Cinebench R10 Rend. Single (32bit)
min: 2451 de promedio: 2549 mediana: 2579 (23%) max: 2672 puntos
...
Intel Core 2 Duo T7700 0%
...
Cinebench R10 - Cinebench R10 Rend. Multi (32bit)
min: 6114 de promedio: 6418 mediana: 6451 (11%) max: 6633 puntos
...
Intel Celeron 2970M -3%
Intel Core m5-6Y57 0%
Intel Pentium 3825U 2%
...
Cinebench R10 - Cinebench R10 Rend. Multi (64bit)
min: 8603 de promedio: 8977 mediana: 9015 (9%) max: 9342 Points
...
Intel Core i5-2415M 2%
...
Cinebench R10 - Cinebench R10 Rend. Single (64bit)
min: 3203 de promedio: 3447 mediana: 3483 (26%) max: 3617 Points
...
Intel Celeron J4005 -2%
AMD A8-3850 -2%
Intel Core 2 Extreme (Desktop) X6800 -2%
AMD A9-9420 -1%
Intel Core i3-380M 0%
...
wPrime 2.10 - wPrime 2.0 1024m *
min: 780 de promedio: 784 mediana: 784.2 (9%) max: 788.456 s
AMD Ryzen Threadripper 2970WX -95%
...
AMD A8-3500M -3%
AMD A9-9425 2%
Intel Pentium 3825U 3%
AMD A6-3400M 3%
...
VIA C3-M C3-M-1200 979%
wPrime 2.10 - wPrime 2.0 32m *
min: 22.1 de promedio: 22.5 mediana: 22.5 (5%) max: 22.901 s
Intel Core i9-9980XE -88%
...
AMD A6-3410MX -2%
AMD A8-3520M 0%
Intel Pentium N3700 3%
...
min: 1992 de promedio: 2035 mediana: 2035 (13%) max: 2078 puntos
...
AMD Phenom II X4 905e -1%
Intel Core i3-5015U 0%
Intel Core M-5Y51 1%
AMD A10-7700K 3%
Intel Core i5-7Y57 3%
...
7-Zip 18.03 - 7-Zip 18.03 Multli Thread 4 runs
min: 7475 de promedio: 7608 mediana: 7608 (6%) max: 7741 MIPS
...
AMD Ryzen Embedded R1505G -9%
AMD Phenom II X4 905e 16%
Intel Core i7-6560U 17%
...
7-Zip 18.03 - 7-Zip 18.03 Single Thread 4 runs
min: 2948 de promedio: 2956 mediana: 2955.5 (19%) max: 2963 MIPS
...
AMD Ryzen Embedded R1505G -15%
AMD Phenom II X4 905e -15%
AMD Ryzen 5 1400 14%
AMD Ryzen 3 1200 15%
...
X264 HD Benchmark 4.0 - x264 Pass 2
min: 15 de promedio: 15.1 mediana: 15 (7%) max: 15.37 fps
Intel Pentium 4 2.4 GHz -88%
...
...
X264 HD Benchmark 4.0 - x264 Pass 1
min: 75.5 de promedio: 77.6 mediana: 76 (22%) max: 81.23 fps
...
AMD A10-9620P -1%
Intel Core i3-7020U 3%
...
HWBOT x265 Benchmark v2.2 - HWBOT x265 4k Preset
min: 1.26 de promedio: 1.7 mediana: 1.7 (5%) max: 2.08 fps
...
...
0 10 Tooltip Pumori Test Platform (A10-5750M) : Ø1.679 (0.3-2.82)
Pumori Test Platform (A10-5750M) : Ø1.486 (0.28-2.78)
TrueCrypt - TrueCrypt Serpent
min: 0.164 de promedio: 0.2 mediana: 0.2 (7%) max: 0.171 GB/s
...
AMD A6-7310 -1%
AMD Pro A8-8600B 0%
Intel Core i3-7130U 2%
Intel Core i5-4200H 3%
...
TrueCrypt - TrueCrypt Twofish
min: 0.297 de promedio: 0.3 mediana: 0.3 (8%) max: 0.306 GB/s
...
Intel Core i3-7130U -4%
Intel Core i5-6360U 0%
Intel Core i5-5257U 1%
AMD PRO A8-9600B 2%
Intel Core i5-4200H 3%
Intel Core i5-7Y57 3%
...
TrueCrypt - TrueCrypt AES
1.5 GB/s (6%)
...
Intel Core i3-7020U -7%
Intel Core i7-2640M 7%
Intel Core i5-4310U 7%
...
Blender 2.79 - Blender 2.79 BMW27 CPU *
2754 Seconds (19%)
Intel Core i5-1038NG7 -100%
...
AMD Phenom II X4 905e -12%
Intel Celeron 2970M 23%
Intel Celeron J4005 50%
Intel Atom x7-E3950 66%
...
R Benchmark 2.5 - R Benchmark 2.5 *
1.5 sec (33%)
...
AMD Ryzen Embedded R1505G -28%
AMD A10-7850K -19%
...
3DMark 06 - CPU - 3DMark 06 - CPU
min: 2464 de promedio: 3070 mediana: 3238 (18%) max: 3273 Points
...
AMD Phenom II X4 N970 -1%
...
Super Pi mod 1.5 XS 1M - Super Pi mod 1.5 XS 1M *
min: 27.97 de promedio: 28.5 mediana: 28.1 (6%) max: 29.672 s
...
AMD A6-7310 -3%
AMD E2-9010 -2%
Intel Core Duo T2600 -2%
Intel Core 2 Duo T7250 4%
AMD Athlon II M320 4%
...
VIA C3-M C3-M-1200 1525%
Super Pi mod 1.5 XS 2M - Super Pi mod 1.5 XS 2M *
min: 63.6 de promedio: 65 mediana: 63.9 (3%) max: 68.84 s
...
Intel Core 2 Duo T7200 -2%
AMD A6-7310 -2%
AMD Phenom II X4 905e -2%
Intel Core 2 Duo T5850 2%
...
Super Pi Mod 1.5 XS 32M - Super Pi mod 1.5 XS 32M *
min: 1651 de promedio: 1693 mediana: 1666.6 (7%) max: 1788.25 s
...
Intel Core 2 Duo T7100 -5%
Intel Core Duo T2600 -4%
AMD A6 Pro-7050B -1%
Qualcomm Snapdragon 850 -1%
AMD Turion II N530 0%
Intel Atom Z3735F 3%
Intel Core Duo T2500 4%
...
VIA C3-M C3-M-1200 1230%
SiSoft Sandra Dhrystone (MIPS) - SiSoft Sandra Dhrystone (MIPS)
min: 32320 de promedio: 33980 mediana: 33980 (16%) max: 35640 MIPS
...
AMD Phenom II X4 N970 -5%
Intel Core i3-370M -5%
AMD Phenom II X4 905e 5%
...
SiSoft Sandra Whetstone (MFLOPS) - SiSoft Sandra Whetstone (MFLOPS)
min: 24800 de promedio: 24955 mediana: 24955 (19%) max: 25110 MFLOPS
...
AMD Phenom II X4 N950 -3%
AMD Phenom II X4 N970 2%
Intel Core i3-370M 2%
Intel Core i3-380M 5%
...
Intel Core i7-3960X 419%
3DMark Vantage - 3DM Vant. Perf. CPU no Physx
min: 5544 de promedio: 7097 mediana: 7250 (8%) max: 7803 Points
...
Intel Core 2 Quad Q9100 -4%
Intel Core i3-370M -3%
Intel Pentium 3825U -1%
Intel Core i3-380M 2%
AMD Phenom II X4 N970 3%
...
3DMark 11 - 3DM11 Performance Physics
min: 1445 de promedio: 2482 mediana: 2658 (11%) max: 2790 Points
...
AMD A6-3420M -4%
AMD A6-3410MX -4%
AMD A10-9620P -3%
Intel Pentium 3825U -2%
...
3DMark - 3DMark Ice Storm Physics
min: 13311 de promedio: 23944 mediana: 25232 (16%) max: 28306 Points
Samsung Hummingbird S5PC110 / Exynos 3110 -98%
...
AMD A10-9620P -6%
Intel Core M-5Y31 1%
Intel Core m5-6Y57 2%
...
3DMark - 3DMark Ice Storm Extreme Physics
24996 Points (27%)
...
AMD A10-9620P -4%
Intel Core m5-6Y57 -3%
AMD A12-9720P -1%
Intel Core M-5Y31 7%
...
3DMark - 3DMark Ice Storm Unlimited Physics
29277 Points (30%)
Qualcomm Snapdragon S4 Play MSM8625Q -90%
...
Apple A12 Bionic -6%
Intel Core M-5Y10c -3%
Intel Core M-5Y31 -2%
AMD Ryzen 5 PRO 2500U 1%
Intel Core i5-1038NG7 2%
...
3DMark - 3DMark Cloud Gate Physics
min: 1008 de promedio: 1952 mediana: 2070 (5%) max: 2326 Points
...
AMD A4-7210 -2%
...
3DMark - 3DMark Fire Strike Standard Physics
min: 1488 de promedio: 2785 mediana: 2946 (7%) max: 3230 Points
...
Intel Core m5-6Y57 1%
...
Geekbench 2 - 32 Bit - Geekbench Stream
min: 3865 de promedio: 4282 mediana: 4281.5 (35%) max: 4698 Points
...
AMD A9-9425 -3%
Intel Pentium 3825U -3%
AMD PRO A8-9600B 4%
...
Intel Core i7-7740X 190%
Geekbench 2 - 32 Bit - Geekbench Memory
min: 3251 de promedio: 3354 mediana: 3354 (30%) max: 3457 Points
...
AMD A9-9425 -8%
AMD Pro A8-8600B -6%
Mediatek Helio P25 0%
AMD PRO A8-9600B 1%
Mediatek Helio P60 4%
...
Intel Core i7-7740X 229%
Geekbench 2 - 32 Bit - Geekbench Floating Point
min: 4907 de promedio: 4926 mediana: 4925.5 (10%) max: 4944 Points
...
AMD E2-7110 -6%
Mediatek Helio P10 MT6755 -5%
...
Geekbench 2 - 32 Bit - Geekbench Integer
min: 5469 de promedio: 5484 mediana: 5483.5 (11%) max: 5498 Points
...
HiSilicon Kirin 960s -3%
AMD Phenom II X4 905e -1%
...
Geekbench 2 - 32 Bit - Geekbench Total Score
min: 4691 de promedio: 4742 mediana: 4741.5 (12%) max: 4792 Points
...
AMD A9-9425 -5%
AMD Pro A8-8600B 0%
...
Geekbench 3 - Geekbench 3 32 Bit Multi-Core
min: 4776 de promedio: 4787 mediana: 4787 (8%) max: 4798 puntos
Samsung Hummingbird S5PC110 / Exynos 3110 -95%
...
AMD PRO A8-9600B 0%
Intel Core i3-7020U 1%
...
Geekbench 3 - Geekbench 3 32 Bit Single-Core
min: 1800 de promedio: 1816 mediana: 1816 (37%) max: 1832 puntos
Samsung Hummingbird S5PC110 / Exynos 3110 -87%
...
Intel Celeron 3865U 1%
AMD Pro A8-8600B 2%
...
Geekbench 4.0 - Geekbench 4.0 64 Bit Single-Core
2175 puntos (34%)
...
AMD PRO A8-9600B -8%
Intel Celeron 3865U 0%
Intel Celeron 2970M 8%
Apple A9 16%
AMD A10-7850K 21%
...
Geekbench 4.0 - Geekbench 4.0 64 Bit Multi-Core
4963 puntos (12%)
...
AMD PRO A8-9600B -12%
Qualcomm Snapdragon 460 -7%
Samsung Exynos 8890 Octa 8%
...
AMD Ryzen 9 3900 727%
Geekbench 4.1 - 4.4 - Geekbench 4.1 - 4.4 64 Bit Single-Core
2260 puntos (31%)
...
AMD PRO A8-9600B -5%
Intel Pentium Gold 4425Y -4%
Intel Celeron 3865U -1%
AMD A9-9425 -1%
Qualcomm Snapdragon 850 0%
Intel Celeron 3867U 1%
Intel Celeron 2970M 11%
...
Geekbench 4.1 - 4.4 - Geekbench 4.1 - 4.4 64 Bit Multi-Core
5292 puntos (8%)
...
Apple A9X 0%
Samsung Exynos 8890 Octa 1%
Apple A10 Fusion 3%
AMD Ryzen Embedded R1505G 4%
...
Geekbench 5.0 - Geekbench 5.0 64 Bit Single-Core
495 puntos (29%)
...
AMD Ryzen Embedded R1505G 24%
HiSilicon Kirin 980 41%
Microsoft SQ1 47%
...
Geekbench 5.0 - Geekbench 5.0 64 Bit Multi-Core
1320 puntos (8%)
...
AMD Ryzen Embedded R1505G 4%
Apple A10 Fusion 8%
...
Intel Core i9-9980XE 1137%
Geekbench 5.3 - Geekbench 5.1 - 5.3 64 Bit Single-Core
493 puntos (27%)
...
Qualcomm Snapdragon 850 -1%
MediaTek Dimensity 720 5%
...
Intel Core i7-11700K 267%
Geekbench 5.3 - Geekbench 5.1 - 5.3 64 Bit Multi-Core
1326 puntos (8%)
...
AMD Ryzen Embedded R1505G 2%
...
Mozilla Kraken 1.1 - Kraken 1.1 Total Score *
2402 ms (4%)
...
Intel Pentium 3825U -3%
AMD A12-9720P 1%
Intel Celeron 3865U 2%
AMD A9-9425 3%
...
Qualcomm Snapdragon S1 MSM7227A 2376%
- Gama de valores de las pruebas para esta tarjeta gráfica
- Valores medios de las pruebas para esta tarjeta gráfica
* Smaller numbers mean a higher performance
v1.16
log 18. 03:00:44
#0 no ids found in url (should be separated by "_") +0s ... 0s
#1 not redirecting to Ajax server +0s ... 0s
#2 did not recreate cache, as it is less than 5 days old! Created at Sun, 17 Jan 2021 12:44:16 +0100 +0.001s ... 0.001s
#3 no comparison url found in template nbc.compare_page_2 needed +0.005s ... 0.006s
#4 no comparison url found in template nbc.compare_page_2 needed +0s ... 0.006s
#5 no comparison url found in template nbc.compare_page_2 needed +0s ... 0.006s
#6 no comparison url found in template nbc.compare_page_2 needed +0s ... 0.006s
#7 no comparison url found in template nbc.compare_page_2 needed +0s ... 0.006s
#8 no comparison url found in template nbc.compare_page_2 needed +0s ... 0.006s
#9 no comparison url found in template nbc.compare_page_2 needed +0s ... 0.006s
#10 no comparison url found in template nbc.compare_page_2 needed +0s ... 0.006s
#11 no comparison url found in template nbc.compare_page_2 needed +0s ... 0.006s
#12 no comparison url found in template nbc.compare_page_2 needed +0s ... 0.006s
#13 composed specs +0s ... 0.007s
#14 did output specs +0s ... 0.007s
#15 getting avg benchmarks for device 4154 +0.005s ... 0.012s
#16 got single benchmarks 4154 +0.019s ... 0.031s
#17 got avg benchmarks for devices +0s ... 0.031s
#18 min, max, avg, median took s +0.461s ... 0.492s
#19 no comparison url found in template nbc.compare_page_2 needed +0.001s ... 0.492s
#20 return log +0s ... 0.492s
Otras CPUs de la serie A-Series » AMD A8-7410 4x 2.2 GHz - 2.5 GHz
» AMD A8-3550MX 4x 2 GHz - 2.7 GHz
» AMD A6-7310 4x 2 GHz - 2.4 GHz
» AMD A8-3530MX 4x 1.9 GHz - 2.6 GHz
» AMD A8-3510MX 4x 1.8 GHz - 2.5 GHz
» AMD A4-7210 4x 1.8 GHz - 2.2 GHz
» AMD A6-3430MX 4x 1.7 GHz - 2.4 GHz
» AMD A8-3520M 4x 1.6 GHz - 2.5 GHz
» AMD A6-3410MX 4x 1.6 GHz - 2.3 GHz
» AMD A8-3500M 4x 1.5 GHz - 2.4 GHz
» AMD A6-3420M 4x 1.5 GHz - 2.4 GHz
» AMD A6-3400M 4x 1.4 GHz - 2.3 GHz
» AMD A4-3330MX 2x 2.2 GHz - 2.6 GHz
» AMD A4-6210 4x 1.8 GHz
» AMD A4-5050 4x 1.55 GHz
» AMD A4-3310MX 2x 2.1 GHz - 2.5 GHz
» AMD A4-3320M 2x 2 GHz - 2.6 GHz
» AMD A4 Micro-6400T 4x 1 GHz - 1.6 GHz
CPUs de alrededor - AMD Phenom II X2 X640 BE 2x 3.2 GHz
Please share our article, every link counts!
Klaus Hinum (Update: 2013-06-21)