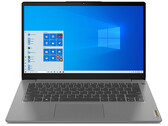
Intel Celeron 6305
El Intel Celeron 6305 (o 6305U) es un SoC de doble núcleo de bajo consumo para portátiles y ultraportátiles basado en la generación Tiger Lake-U que se anunció en el tercer trimestre de 2020. Integra sólo dos núcleos de procesador Willow Cove (2 hilos como no HyperThreading/SMT). La velocidad del reloj está fijada en 1,8 GHz ya que el chip no soporta Turbo Boost. Gracias a las mejoras arquitectónicas de los núcleos de la CPU, el Celeron 6305 debería seguir siendo más rápido que el antiguo Celeron 5205U basado en el Comet Lake-U (1,9 GHz, sin Turbo).
Otra novedad es la tarjeta gráfica Xe integrada basada en la arquitectura completamente nueva de Gen 12. Debería ofrecer un rendimiento significativamente mayor en comparación con la antigua UHD Graphics G1 (Ice Lake). En la 6305U Intel la llama sólo UHD Graphics y ofrece 48 EUs.
Otras mejoras de Ice Lake también deben ser integradas en Tiger Lake como la aceleración del hardware de IA y la integración parcial de Thunderbolt y Wifi 6 en el chip.
El chip se produce en el proceso mejorado de 10nm+ (llamado 10 nm SuperFin) en Intel que debería ser comparable al proceso de 7nm en TSMC (por ejemplo, la serie Ryzen 4000).
Serie Intel Tiger Lake Nombre código Tiger Lake U Serie: Tiger Lake Tiger Lake U Intel Pentium Gold 7505 2 - 3.5 GHz 2 / 4 4 MB L3 Intel Celeron 6305 « 1.8 GHz 2 / 2 4 MB L3 Intel Celeron 6205 2 / 2 4 MB L3
Velocidad de reloj 1800 MHz Caché de Nivel 1 160 KB Caché de Nivel 2 2.5 MB Caché de Nivel 3 4 MB Número de Núcleos/Subprocesos 2 / 2 Consumo de Corriente (TDP = Thermal Design Power) 15 Watt Tecnología de producción 10 nm Conector BGA1499 Recursos Wi-Fi 6 (Gig+), Thunderbolt 4, DDR4-3200 / LPDDR4x-3733 GPU Intel UHD Graphics Xe G4 48EUs (400 - 1250 MHz)64 Bit soporte para 64 Bit Architecture x86 Fecha de anuncio 09/01/2020 Enlace de Producto (externo) Intel Tiger Lake Celeron 6305
Benchmarks Performance Rating - CB R15 + R20 + 7-Zip + X265 + Blender + 3DM11 CPU
19.2 pt (22%)
...
...
Intel Core i9-12900HX 245%
Cinebench R23 - Cinebench R23 Multi Core
min: 1056 de promedio: 1072 mediana: 1071.5 (2%) max: 1087 Points
CPU TDP ? TDP 18 W 100% 97%
...
Intel Core m3-7Y32 21%
...
Intel Core i9-13980HX 2736%
Cinebench R23 - Cinebench R23 Single Core
min: 566 de promedio: 567 mediana: 566.5 (25%) max: 567 Points
CPU TDP ? TDP 18 W 100% 100%
...
Intel Core i5-8260U 11%
Intel Core m3-7Y32 12%
Intel Core i3-6157U 13%
...
Intel Core i9-12900HX 238%
Cinebench R20 - Cinebench R20 CPU (Single Core)
217 Points (25%)
CPU TDP ? TDP 18 W 100% 100%
...
AMD Ryzen Embedded R1505G 12%
Intel Core i3-6157U 14%
Intel Core i7-10510Y 15%
...
Intel Core i9-12900HX 240%
Cinebench R20 - Cinebench R20 CPU (Multi Core)
416 Points (2%)
CPU TDP ? TDP 18 W 100% 100%
...
...
Intel Core i7-12800HX 1959%
Cinebench R15 - Cinebench R15 CPU Multi 64 Bit
min: 160.8 de promedio: 161.1 mediana: 161.1 (2%) max: 161.3 Points
CPU TDP ? TDP 18 W 100% 100%
...
AMD A4-7210 -3%
Intel Core M-5Y10c -2%
Intel Celeron 2970M 2%
AMD A8-7410 7%
...
Intel Core i7-12800HX 2000%
0 10 20 30 40 50 60 70 80 90 100 110 120 130 140 150 160 Tooltip Lenovo IdeaPad 3 14ITL6 82H700CCGE: Ø156.5 (153.1-161.3)
Cinebench R15 - Cinebench R15 CPU Single 64 Bit
min: 82.6 de promedio: 84 mediana: 84 (26%) max: 85.3 Points
CPU TDP ? TDP 18 W 97% 100%
...
Intel Core M-5Y51 -1%
Intel Core i3-5015U 1%
Intel Celeron 2970M 1%
...
Intel Core i9-12900HX 231%
Cinebench R11.5 - Cinebench R11.5 CPU Multi 64 Bit
1.9 Points (3%)
...
Intel Core i3-370M 0%
AMD A6-3420M 1%
AMD A4-7210 1%
AMD Phenom II X3 N870 2%
Intel Core m5-6Y57 3%
AMD A6-7310 3%
...
Intel Core i9-12900HX 2052%
Cinebench R11.5 - Cinebench R11.5 CPU Single 64 Bit
1 Points (3%)
...
Intel Celeron 2970M -3%
Intel Core M-5Y51 -3%
Intel Core i3-5015U -2%
Intel Core i3-7100U 4%
...
Cinebench R10 - Cinebench R10 Rend. Single (32bit)
3465 puntos (28%)
...
Intel Core M-5Y31 -2%
...
Cinebench R10 - Cinebench R10 Rend. Multi (32bit)
6611 puntos (7%)
...
Intel Pentium 3825U -1%
AMD Phenom II X4 N950 -1%
Intel Core i3-380M -1%
Intel Core M-5Y31 -1%
AMD Phenom II X4 N970 3%
...
Intel Core i9-12900HX 877%
wPrime 2.10 - wPrime 2.0 1024m *
1231 s (15%)
...
AMD Athlon II M320 -5%
Intel Celeron 3865U -1%
AMD Athlon II M300 1%
...
VIA C3-M C3-M-1200 587%
wPrime 2.10 - wPrime 2.0 32m *
39.1 s (8%)
...
AMD Athlon II M300 0%
AMD Turion II M520 0%
Intel Celeron 3865U 1%
...
1210 puntos (7%)
...
AMD A6-7310 -3%
AMD A4-7210 2%
...
7-Zip 18.03 - 7-Zip 18.03 Multli Thread 4 runs
min: 4226 de promedio: 4263 mediana: 4262.5 (3%) max: 4299 MIPS
CPU TDP ? TDP 18 W 100% 98%
AMD Ryzen 5 PRO 2500U -34%
Intel Celeron J3355 -17%
Intel Atom x5-E8000 4%
Intel Atom x7-E3950 7%
...
Intel Core i7-12800HX 1705%
7-Zip 18.03 - 7-Zip 18.03 Single Thread 4 runs
min: 2233 de promedio: 2238 mediana: 2237.5 (27%) max: 2242 MIPS
CPU TDP ? TDP 18 W 100% 100%
...
Intel Celeron J3355 -18%
AMD Ryzen Embedded R1505G 12%
...
Intel Core i9-12900HX 181%
X264 HD Benchmark 4.0 - x264 Pass 2
11.3 fps (4%)
...
AMD A6-3420M 0%
AMD A6-7310 3%
Intel Celeron 2970M 4%
Intel Core m5-6Y57 4%
...
Intel Core i9-12900HX 1549%
X264 HD Benchmark 4.0 - x264 Pass 1
61.9 fps (15%)
...
AMD A6-3420M -4%
Intel Celeron 2970M 1%
Intel Pentium 3825U 1%
...
Intel Core i9-12900HX 407%
HWBOT x265 Benchmark v2.2 - HWBOT x265 4k Preset
min: 1.69 de promedio: 1.7 mediana: 1.7 (4%) max: 1.71 fps
CPU TDP ? TDP 18 W 100% 99%
...
Intel Core i5-8260U 6%
Intel Core i3-6157U 14%
AMD Ryzen Embedded R1606G 18%
...
Intel Core i7-12800HX 1365%
0 0.2 0.4 0.6 0.7 0.9 1.1 1.3 1.5 1.7 1.8 2 2.2 2.4 2.6 2.8 2.9 3.1 3.3 3.5 Tooltip Lenovo IdeaPad 3 14ITL6 82H700CCGE: Ø1.831 (0.29-3.58)
Lenovo IdeaPad 3 14ITL6 82H700CCGE Dual-Channel: Ø1.856 (0.32-3.68)
TrueCrypt - TrueCrypt Serpent
0.1 GB/s (0%)
...
Intel Core i3-2365M -11%
AMD A6 Pro-7050B 2%
...
Intel Core i9-12900HX 2261%
TrueCrypt - TrueCrypt Twofish
0.1 GB/s (0%)
...
Intel Atom x5-E8000 -2%
Intel Celeron 3865U 0%
AMD A4 Micro-6400T 1%
Intel Atom x5-Z8300 3%
AMD E2-9010 4%
Intel Celeron 2970M 9%
...
Intel Core i9-12900HX 2324%
TrueCrypt - TrueCrypt AES
0.9 GB/s (0%)
...
Intel Celeron N3150 -11%
Intel Pentium N3700 3%
AMD A8-7410 3%
...
Intel Core i9-12900HX 1800%
Blender - Blender 2.79 BMW27 CPU *
min: 2824 de promedio: 2834 mediana: 2834 (20%) max: 2844 Seconds
CPU TDP ? TDP 18 W 100% 100%
Intel Core i5-1038NG7 -100%
...
Intel Celeron 2970M 20%
...
R Benchmark 2.5 - R Benchmark 2.5 *
1.4 sec (30%)
CPU TDP ? TDP 18 W 100% 100%
Intel Core i9-12900HX -70%
...
Intel Core i5-8260U -10%
...
Super Pi mod 1.5 XS 1M - Super Pi mod 1.5 XS 1M *
18.8 s (4%)
...
...
VIA C3-M C3-M-1200 2359%
Super Pi mod 1.5 XS 2M - Super Pi mod 1.5 XS 2M *
41.3 s (2%)
...
AMD A10-9620P -2%
Intel Core i3-380M 2%
...
Super Pi Mod 1.5 XS 32M - Super Pi mod 1.5 XS 32M *
905 s (4%)
...
Intel Core M-5Y51 -1%
AMD A12-9720P 0%
...
VIA C3-M C3-M-1200 2388%
3DMark 11 - 3DM11 Performance Physics
min: 1723 de promedio: 1936 mediana: 1935.5 (5%) max: 2148 Points
CPU TDP ? TDP 18 W 80% 100%
...
AMD A4-7210 -3%
Intel Celeron 3865U -2%
Intel Core i3-2365M -1%
Intel Core M-5Y10c 0%
AMD Phenom II X4 N970 0%
AMD Pro A8-8600B 5%
...
Intel Core i7-12800HX 1056%
3DMark - 3DMark Ice Storm Unlimited Physics
min: 19614 de promedio: 19990 mediana: 19990 (17%) max: 20366 Points
CPU TDP ? TDP 18 W 96% 100%
...
Intel Atom x5-Z8500 -8%
Intel Core i3-7100U 6%
...
Intel Core i9-12900HX 396%
3DMark - 3DMark Cloud Gate Physics
min: 1619 de promedio: 1639 mediana: 1638.5 (4%) max: 1658 Points
CPU TDP ? TDP 18 W 98% 100%
...
Intel Celeron 2970M -7%
Intel Pentium N3700 -5%
AMD A8-3520M 1%
...
Intel Core i9-12950HX 1291%
3DMark - 3DMark Fire Strike Standard Physics
min: 2368 de promedio: 2391 mediana: 2390.5 (4%) max: 2413 Points
CPU TDP ? TDP 18 W 98% 100%
...
Intel Pentium N3700 -6%
AMD A4-7210 -4%
AMD A8-3520M 1%
AMD A6-7310 1%
AMD PRO A8-9600B 2%
Intel Core M-5Y51 3%
AMD E2-7110 4%
...
Intel Core i7-12800HX 1341%
Geekbench 5.4 - Geekbench 5.1 - 5.4 64 Bit Single-Core
min: 632 de promedio: 638 mediana: 638 (28%) max: 644 puntos
CPU TDP ? TDP 18 W 100% 98%
...
AMD Ryzen Embedded R1505G -4%
Intel Core i5-8260U 0%
Intel Core i3-6157U 5%
Intel Core i7-8559U 13%
AMD Ryzen 3 PRO 2300U 14%
...
Apple M2 Max 208%
Geekbench 5.4 - Geekbench 5.1 - 5.4 64 Bit Multi-Core
min: 1154 de promedio: 1198 mediana: 1198 (4%) max: 1242 puntos
CPU TDP ? TDP 18 W 100% 93%
...
Intel Celeron J3455 -15%
Intel Core i3-L13G4 13%
AMD Ryzen Embedded R1505G 13%
...
Apple M2 Max 1183%
Geekbench 5.0 - Geekbench 5.0 64 Bit Single-Core
min: 626 de promedio: 629 mediana: 628.5 (3%) max: 631 puntos
CPU TDP ? TDP 18 W 100% 99%
...
Intel Core i5-8260U -12%
AMD Ryzen Embedded R1505G -2%
Intel Core i3-6157U 6%
Microsoft SQ1 16%
Intel Core i7-2860QM 20%
...
Geekbench 5.0 - Geekbench 5.0 64 Bit Multi-Core
min: 1151 de promedio: 1184 mediana: 1183.5 (4%) max: 1216 puntos
CPU TDP ? TDP 18 W 100% 95%
...
AMD Ryzen Embedded R1505G 16%
...
Intel Core i9-12900HX 1293%
Geekbench 4.1 - 4.4 - Geekbench 4.1 - 4.4 64 Bit Single-Core
min: 2776 de promedio: 2825 mediana: 2824.5 (29%) max: 2873 puntos
CPU TDP ? TDP 18 W 100% 97%
...
AMD Ryzen Embedded R1505G -6%
Intel Core i3-7100U 7%
Intel Core i3-6157U 15%
...
Intel Core i9-13900HX 215%
Geekbench 4.1 - 4.4 - Geekbench 4.1 - 4.4 64 Bit Multi-Core
min: 4762 de promedio: 4950 mediana: 4949.5 (6%) max: 5137 puntos
CPU TDP ? TDP 18 W 100% 93%
...
Intel Celeron 2970M -14%
AMD PRO A8-9600B -9%
...
Intel Core i9-13900HX 1337%
Mozilla Kraken 1.1 - Kraken 1.1 Total Score *
min: 1678 de promedio: 1681 mediana: 1681 (2%) max: 1684 ms
CPU TDP ? TDP 18 W 100% 100%
...
Intel Core i3-7100U -9%
AMD Ryzen Embedded R1505G -8%
Intel Core i5-5257U -7%
Intel Core i3-6157U -6%
Intel Core i3-7130U 0%
...
Sunspider - Sunspider 1.0 Total Score *
326.7 ms (4%)
...
AMD A6-7310 -18%
AMD A8-7410 -10%
AMD E2-7110 4%
Intel Core i3-7100U 4%
Intel Pentium N3700 8%
AMD A4-6210 8%
...
Octane V2 - Octane V2 Total Score
21416 Points (22%)
...
Intel Core i3-7130U 0%
...
Intel Core i9-12900HX 345%
WebXPRT 3 - WebXPRT 3 Score
min: 99.2 de promedio: 100.7 mediana: 100.7 (25%) max: 102.2 Points
CPU TDP ? TDP 18 W 100% 97%
...
AMD Ryzen Embedded R1505G 5%
Microsoft SQ1 15%
...
CrossMark - CrossMark Overall
min: 501 de promedio: 508 mediana: 507.5 (20%) max: 514 Points
CPU TDP ? TDP 18 W 100% 97%
Intel Core i3-6157U 23%
AMD Ryzen Embedded R1606G 23%
...
Intel Core i9-12900HX 323%
Power Consumption - Prime95 Power Consumption - external Monitor *
12.1 Watt (2%)
Intel Atom x7-E3950 5%
...
Intel Core i7-12800HX 1364%
0 1 2 3 4 5 6 7 8 9 10 11 12 13 14 Tooltip Lenovo IdeaPad 3 14ITL6 82H700CCGE: Ø12.1 (11.5-14.5)
Power Consumption - Cinebench R15 Multi Power Consumption - external Monitor *
10.5 Watt (2%)
Intel Atom x7-E3950 -4%
...
Intel Core i9-12950HX 1790%
0 1 2 3 4 5 6 7 8 9 10 11 12 13 Tooltip Lenovo IdeaPad 3 14ITL6 82H700CCGE: Ø10.5 (8.02-13.5)
Power Consumption - Idle Power Consumption - external Monitor *
20.8 Watt (20%)
...
Intel Core i5-1245U -38%
Intel Core i9-12950HX 6%
Intel Core i9-12900HX 23%
0 5 10 15 20 Tooltip Lenovo IdeaPad 3 14ITL6 82H700CCGE: Ø20.8 (15.2-22.9)
Power Consumption - Idle Power Consumption 150cd 1min *
6.6 Watt (17%)
...
Intel Core i7-1250U 17%
...
0 1 2 3 4 5 6 7 8 9 10 11 12 Tooltip Lenovo IdeaPad 3 14ITL6 82H700CCGE: Ø6.58 (6.15-12.2)
Power Consumption - Cinebench R15 Multi Power Efficiency - external Monitor
15.4 Points per Watt (18%)
...
Intel Core i5-8260U -7%
Intel Core i7-9750H -2%
Intel Core i5-1035G4 1%
...
- Gama de valores de las pruebas para esta tarjeta gráfica
- Valores medios de las pruebas para esta tarjeta gráfica
* Smaller numbers mean a higher performance
v1.22
log 22. 02:15:41
#0 no ids found in url (should be separated by "_") +0s ... 0s
#1 not redirecting to Ajax server +0s ... 0s
#2 did not recreate cache, as it is less than 5 days old! Created at Fri, 20 Jan 2023 08:57:08 +0100 +0.001s ... 0.001s
#3 no comparison url found in template nbc.compare_page_2 needed +0.008s ... 0.009s
#4 no comparison url found in template nbc.compare_page_2 needed +0s ... 0.009s
#5 composed specs +0s ... 0.01s
#6 did output specs +0s ... 0.01s
#7 getting avg benchmarks for device 12244 +0.014s ... 0.023s
#8 got single benchmarks 12244 +0.009s ... 0.032s
#9 got avg benchmarks for devices +0s ... 0.032s
#10 min, max, avg, median took s +0.61s ... 0.642s
#11 no comparison url found in template nbc.compare_page_2 needed +0s ... 0.643s
#12 return log +0s ... 0.643s
Please share our article, every link counts!
.170
Otras CPUs de la serie Tiger Lake » Intel Core i9-11900KB 8x 3.3 GHz - 5.3 GHz
» Intel Core i7-11600H 6x 2.9 GHz - 4.6 GHz
» Intel Xeon W-11855M 6x 3.2 GHz - 4.8 GHz
» Intel Core i5-11500H 6x 2.9 GHz - 4.6 GHz
» Intel Core i7-1180G7 4x 2.2 GHz - 4.6 GHz
» Intel Core i5-1140G7 4x 1.8 GHz - 4.2 GHz
» Intel Celeron 6205 2x
CPUs de alrededor + Intel Core i5-7Y57 2x 1.2 GHz - 3.3 GHz
+ Intel Celeron 7305 5x 0.9 GHz - 1.1 GHz
+ Intel Celeron 7300 5x 0.7 GHz - 1 GHz
- Intel Core i3-6157U 2x 2.4 GHz
- Intel Core i3-7100U 2x 2.4 GHz
- AMD Athlon PRO 300U 2x 2.4 GHz - 3.3 GHz
Klaus Hinum (Update: 2020-11- 7)