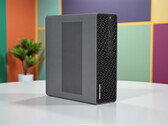
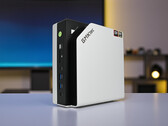
Notebookcheck Logo

AMD Ryzen AI Max+ 395

AMD Ryzen AI Max+ 395

El AMD Ryzen AI Max+ 395 es un potente procesador de la familia Strix Halo que debutó en enero de 2025. La APU viene con 16 núcleos de CPU Zen 5 que funcionan hasta a 5,1 GHz, el adaptador gráfico RDNA 3+ Radeon 8060S de 40 CU y el motor neuronal XDNA 2 de 50 TOPS. Otras características dignas de mención son la compatibilidad con PCIe 4, USB 4 y memoria RAM LPDDR5x-8000 y una gran cantidad de caché L3.

Arquitectura y características

A diferencia del Strix Point, las piezas del Strix Halo están alimentadas por núcleos Zen 5 - aquí no hay Zen 5c. No está claro si se trata de la implementación Zen 5 de sobremesa con pleno rendimiento AVX512 o de la móvil. Según AMD, Zen 5 ofrece una mejora del IPC del 16% respecto a Zen 4 gracias a las mejoras en la predicción de ramas y otros refinamientos.

Por lo demás, el chip AI Max+ admite una memoria RAM tan rápida como LPDDR5x-8000 y es compatible de forma nativa con USB 4 (y, por tanto, con Thunderbolt). Es compatible con PCIe 4.0 para un rendimiento de 1,9 GB/s por carril, al igual que sus predecesores de la serie 8000. La NPU XDNA 2 integrada ofrece hasta 50 TOPS INT8 para acelerar diversas cargas de trabajo de IA.

Rendimiento

Por filtraciones, sabemos que el Ryzen ofrece alrededor de 20.700 Multipuntos Geekbench 6.3, lo que significa que intercambia golpes con CPUs de sobremesa muy potentes como el Ryzen 9 9900X.

Gráficos

La Radeon 8060S es la iGPU más potente que ofrece AMD. Cuenta con 40 CU de arquitectura RDNA 3+ (2560 sombreadores unificados) que podrían hacerla superar a tarjetas gráficas de sobremesa de gama media inferior como la GeForce RTX 4050. Esta GPU ejecutará sin duda cualquier juego a 1080p en Ultra, sin embargo, la cuestión final es si la solución de refrigeración del portátil será lo suficientemente potente como para permitir que la iGPU brille.

Naturalmente, la Radeon es capaz de manejar cuatro monitores SUHD 4320p60. También puede codificar y descodificar eficazmente los códecs de vídeo más populares, incluidos AVC, HEVC, VP9 y AV1. La última incorporación a esa lista, el códec VVC, no es compatible a diferencia de lo que ocurre con los chips Intel Lunar Lake.

Consumo de energía

El AI Max+ 395 puede consumir hasta 120 W dependiendo del sistema y de sus objetivos de potencia TDP, con 45 W nombrados como el TDP mínimo.

El proceso TSMC de 4 nm con el que están construidos los núcleos de la CPU hace que la eficiencia energética sea decente, a partir de enero de 2025.

Nombre códigoStrix Halo
SerieAMD Strix Halo/Point (Zen 5/5c, Ryzen AI 300)

Serie: Strix Halo/Point (Zen 5/5c, Ryzen AI 300) Strix Halo

AMD Ryzen AI Max+ 395 « 3 - 5.1 GHz16 / 32 cores64 MB L3
AMD Ryzen AI Max 3903.2 - 5 GHz12 / 24 cores64 MB L3
AMD Ryzen AI Max 3853.6 - 5 GHz8 / 16 cores32 MB L3
Velocidad de reloj3000 - 5100 MHz
Caché de Nivel 216 MB
Caché de Nivel 364 MB
Número de Núcleos/Subprocesos16 / 32
16 x 5.1 GHz AMD Zen 5
Consumo de Corriente (TDP = Thermal Design Power)55 Watt
Tecnología de producción4 nm
ConectorFP11
RecursosLPDDR5x-8000 RAM, PCIe 4, USB 4, XDNA 2 NPU (50 TOPS), SMT, AES, AVX, AVX2, AVX512, FMA3, MMX (+), SHA, SSE, SSE2, SSE3, SSSE3, SSE4.1, SSE4.2, SSE4A
GPUAMD Radeon 8060S ( - 2900 MHz)
64 Bitsoporte para 64 Bit
Architecturex86
Fecha de anuncio01/06/2025
Enlace de Producto (externo)www.amd.com

Benchmarks

Performance Rating - CB R15 + R20 + 7-Zip + X265 + Blender + 3DM11 CPU
46.4 pt (77%)
Restrict / Search: Model: Max. age: years
Cinebench 2024 - Cinebench 2024 CPU Single Core
min: 114     de promedio: 115.4     mediana: 115.4 (65%)     max: 116.8 Points
Cinebench 2024 - Cinebench 2024 CPU Multi Core
min: 1648     de promedio: 1769     mediana: 1769 (33%)     max: 1890 Points
Cinebench R23 - Cinebench R23 Multi Core
min: 29063     de promedio: 33243     mediana: 33243 (31%)     max: 37423 Points
202 -99%
...
28275 -15%
28872 -13%
29352 -12%
29400 -12%
29464 -11%
30428 -8%
32521 -2%
32782 -1%
33078 0%
AMD Ryzen AI Max+ 395
33243
35061 5%
35716 7%
AMD Ryzen 9 9955HX
37923 14%
AMD Ryzen 9 9955HX3D
39065 18%
40117 21%
max:
107681 224%
0%
100%
Restrict / Search: Model: Max. age: years
Cinebench R23 - Cinebench R23 Single Core
min: 2034     de promedio: 2038     mediana: 2038 (86%)     max: 2042 Points
74.4 -96%
...
1976 -3%
1977 -3%
1985 -3%
1988 -2%
1992 -2%
2000 -2%
2010 -1%
2013 -1%
2017 -1%
AMD Ryzen AI Max+ 395
2038
2044 0%
2067 1%
2081 2%
2095 3%
AMD Ryzen 9 9955HX
2119 4%
2137 5%
2139 5%
2150 5%
AMD Ryzen 9 9955HX3D
2172 7%
...
2270 11%
max:
Intel Core Ultra 9 285K
2359 16%
0%
100%
Restrict / Search: Model: Max. age: years
Cinebench R20 - Cinebench R20 CPU (Single Core)
min: 791     de promedio: 796     mediana: 795.5 (87%)     max: 800 Points
Cinebench R20 - Cinebench R20 CPU (Multi Core)
min: 11357     de promedio: 12999     mediana: 12999 (32%)     max: 14641 Points
Cinebench R15 - Cinebench R15 CPU Multi 64 Bit
min: 4830     de promedio: 5277     mediana: 5276.5 (33%)     max: 5723 Points
Restrict / Search: Model: Max. age: years
02805608401120140016801960224025202800308033603640392042004480476050405320Tooltip
Cinebench R15 - Cinebench R15 CPU Single 64 Bit
min: 316     de promedio: 316.5     mediana: 316.5 (88%)     max: 317 Points
19 -94%
...
303 -4%
303.6 -4%
304.3 -4%
305.2 -4%
306 -3%
306.9 -3%
307 -3%
311 -2%
313 -1%
AMD Ryzen AI Max+ 395
316.5
324 2%
324.5 3%
AMD Ryzen 9 9955HX3D
327 3%
331 5%
AMD Ryzen 9 9955HX
334 6%
...
324 2%
max:
Intel Core Ultra 9 285K
357.8 13%
0%
100%
Restrict / Search: Model: Max. age: years
Cinebench R11.5 - Cinebench R11.5 CPU Multi 64 Bit
min: 55.9     de promedio: 60.1     mediana: 60.1 (78%)     max: 64.21 Points
Cinebench R11.5 - Cinebench R11.5 CPU Single 64 Bit
min: 3.74     de promedio: 3.7     mediana: 3.7 (89%)     max: 3.75 Points
Cinebench R10 - Cinebench R10 Rend. Single (32bit)
min: 8693     de promedio: 8711     mediana: 8710.5 (53%)     max: 8728 puntos
Cinebench R10 - Cinebench R10 Rend. Multi (32bit)
min: 63189     de promedio: 65332     mediana: 65332 (47%)     max: 67475 puntos
Cinebench R10 - Cinebench R10 Rend. Multi (64bit)
114175 Points (73%)
Cinebench R10 - Cinebench R10 Rend. Single (64bit)
16196 Points (20%)
wPrime 2.10 - wPrime 2.0 1024m *
min: 32.871     de promedio: 190     mediana: 190 (2%)     max: 347.1 s
wPrime 2.10 - wPrime 2.0 32m *
min: 2.555     de promedio: 4.9     mediana: 4.9 (1%)     max: 7.3 s
WinRAR - WinRAR 4.0
min: 8365     de promedio: 23388     mediana: 23387.5 (37%)     max: 38410 puntos
7-Zip 18.03 - 7-Zip 18.03 Multi Thread 4 runs
min: 121368     de promedio: 123210     mediana: 123210 (71%)     max: 125052 MIPS
7-Zip 18.03 - 7-Zip 18.03 Single Thread 4 runs
min: 6478     de promedio: 6509     mediana: 6509 (77%)     max: 6540 MIPS
X264 HD Benchmark 4.0 - x264 Pass 2
189.4 fps (63%)
X264 HD Benchmark 4.0 - x264 Pass 1
327.5 fps (76%)
HWBOT x265 Benchmark v2.2 - HWBOT x265 4k Preset
min: 33.7     de promedio: 35     mediana: 35 (61%)     max: 36.2 fps
051015202530354045Tooltip
TrueCrypt - TrueCrypt Serpent
min: 1.7     de promedio: 2.3     mediana: 2.3 (66%)     max: 2.8 GB/s
TrueCrypt - TrueCrypt Twofish
min: 2.7     de promedio: 3.6     mediana: 3.6 (61%)     max: 4.4 GB/s
TrueCrypt - TrueCrypt AES
min: 16.7     de promedio: 20.1     mediana: 20.1 (52%)     max: 23.5 GB/s
Blender - Blender 3.3 Classroom CPU *
min: 132     de promedio: 147.5     mediana: 147.5 (2%)     max: 163 Seconds
Blender - Blender 2.79 BMW27 CPU *
min: 86     de promedio: 96.5     mediana: 96.5 (1%)     max: 107 Seconds
R Benchmark 2.5 - R Benchmark 2.5 *
min: 0.3985     de promedio: 0.4     mediana: 0.4 (9%)     max: 0.4094 sec
3DMark 06 - CPU - 3DMark 06 - CPU
min: 16635     de promedio: 17703     mediana: 17702.5 (38%)     max: 18770 Points
Super Pi mod 1.5 XS 1M - Super Pi mod 1.5 XS 1M *
min: 8.2     de promedio: 8.3     mediana: 8.3 (2%)     max: 8.31 s
Super Pi mod 1.5 XS 2M - Super Pi mod 1.5 XS 2M *
min: 17.6     de promedio: 17.6     mediana: 17.6 (1%)     max: 17.621 s
Super Pi Mod 1.5 XS 32M - Super Pi mod 1.5 XS 32M *
407.8 s (2%)
3DMark Vantage - 3DM Vant. Perf. CPU no Physx
min: 88295     de promedio: 90700     mediana: 90700 (70%)     max: 93105 Points
3DMark 11 - 3DM11 Performance Physics
min: 22299     de promedio: 24649     mediana: 24648.5 (61%)     max: 26998 Points
3DMark - 3DMark Ice Storm Physics
84504 Points (69%)
3DMark - 3DMark Ice Storm Extreme Physics
83969 Points (68%)
3DMark - 3DMark Ice Storm Unlimited Physics
82293 Points (66%)
3DMark - 3DMark Cloud Gate Physics
23592 Points (60%)
3DMark - 3DMark Fire Strike Standard Physics
min: 32060     de promedio: 35068     mediana: 35067.5 (63%)     max: 38075 Points
3DMark - 3DMark Time Spy CPU
min: 9860     de promedio: 10573     mediana: 10572.5 (45%)     max: 11285 Points
Geekbench 6.4 - Geekbench 6.4 Single-Core
min: 2791     de promedio: 2885     mediana: 2884.5 (72%)     max: 2978 puntos
Geekbench 6.4 - Geekbench 6.4 Multi-Core
min: 17599     de promedio: 19434     mediana: 19434 (75%)     max: 21269 puntos
533 -97%
...
16828 -13%
16957 -13%
17242 -11%
17305 -11%
17401 -10%
17557 -10%
17564 -10%
17576 -10%
AMD Ryzen 9 9955HX
18792 -3%
AMD Ryzen AI Max+ 395
19434
19502 0%
AMD Ryzen 9 9955HX3D
20200 4%
20487 5%
21254 9%
22104 14%
22527 16%
23384 20%
25760 33%
0%
100%
Restrict / Search: Model: Max. age: years
Geekbench 6.0 - Geekbench 6.0 Single-Core
3105 puntos (99%)
Geekbench 6.0 - Geekbench 6.0 Multi-Core
21003 puntos (86%)
Geekbench 5.5 - Geekbench 5.1 - 5.5 64 Bit Single-Core
min: 2184     de promedio: 2230     mediana: 2229.5 (87%)     max: 2275 puntos
Geekbench 5.5 - Geekbench 5.1 - 5.5 64 Bit Multi-Core
min: 17552     de promedio: 19788     mediana: 19787.5 (35%)     max: 22023 puntos
Geekbench 5.0 - Geekbench 5.0 64 Bit Single-Core
1991 puntos (9%)
Geekbench 5.0 - Geekbench 5.0 64 Bit Multi-Core
17929 puntos (57%)
Geekbench 4.4 - Geekbench 4.1 - 4.4 64 Bit Single-Core
8054 puntos (80%)
Geekbench 4.4 - Geekbench 4.1 - 4.4 64 Bit Multi-Core
66840 puntos (67%)
Mozilla Kraken 1.1 - Kraken 1.1 Total Score *
min: 425     de promedio: 426     mediana: 426 (0%)     max: 427 ms
Octane V2 - Octane V2 Total Score
123023 Points (90%)
WebXPRT 4 - WebXPRT 4 Score
317 Points (87%)
WebXPRT 3 - WebXPRT 3 Score
358 Points (64%)
CrossMark - CrossMark Overall
min: 2069     de promedio: 2172     mediana: 2171.5 (81%)     max: 2274 Points
Power Consumption - Prime95 Power Consumption - external Monitor *
min: 111.2     de promedio: 144.2     mediana: 144.2 (25%)     max: 177.2 Watt
0102030405060708090100110120130140150160170180190Tooltip
Power Consumption - Cinebench R15 Multi Power Consumption - external Monitor *
min: 133.2     de promedio: 163     mediana: 163 (30%)     max: 192.8 Watt
0102030405060708090100110120130140150160170180190Tooltip
Power Consumption - Idle Power Consumption - external Monitor *
min: 11.2     de promedio: 11.4     mediana: 11.4 (8%)     max: 11.5 Watt
0123456789101112131415161718Tooltip
Power Consumption - Idle Power Consumption 150cd 1min *
13.8 Watt (15%)
0123456789101112131415Tooltip
Power Consumption - Power Efficiency - Cinebench R15 Multi external Monitor
min: 29.7     de promedio: 33     mediana: 33 (25%)     max: 36.3 Points per Watt
- Gama de valores de las pruebas para esta tarjeta gráfica
red legend - Valores medios de las pruebas para esta tarjeta gráfica
* A menor número, mayor rendimiento

v1.33
log 15. 16:45:34

#0 ran 0s before starting gpusingle class +0s ... 0s

#1 no ids found in url (should be separated by "_") +0s ... 0s

#2 not redirecting to Ajax server +0s ... 0s

#3 did not recreate cache, as it is less than 5 days old! Created at Wed, 13 Aug 2025 05:39:57 +0200 +0.001s ... 0.001s

#4 no comparison url found in template nbc.compare_page_2 needed +0.007s ... 0.008s

#5 no comparison url found in template nbc.compare_page_2 needed +0s ... 0.008s

#6 composed specs +0.001s ... 0.009s

#7 did output specs +0s ... 0.009s

#8 getting avg benchmarks for device 18628 +0.02s ... 0.029s

#9 got single benchmarks 18628 +0.013s ... 0.043s

#10 got avg benchmarks for devices +0s ... 0.043s

#11 min, max, avg, median took s +1.347s ... 1.389s

#12 no comparison url found in template nbc.compare_page_2 needed +0s ... 1.389s

#13 return log +0s ... 1.389s

Please share our article, every link counts!
Mail Logo

» Comparativa de CPUs móviles

Comparativa de todas las gamas de CPU.

» Lista de pruebas - Procesadores móviles

Lista de pruebas de todas las CPUs conocidas usadas en portátiles (CPUs de escritorio y portátiles)

Otras CPUs de la serie Strix Halo/Point (Zen 5/5c, Ryzen AI 300)

» AMD Ryzen AI Max+ 395
   16x 3 GHz - 5.1 GHz
» AMD Ryzen AI Max+ PRO 395
   16x 3 GHz - 5.1 GHz
» AMD Ryzen AI Max 390
   12x 3.2 GHz - 5 GHz
» AMD Ryzen AI Max PRO 390
   12x 3.2 GHz - 5 GHz
» AMD Ryzen AI 9 HX 375
   12x 2 GHz - 5.1 GHz
» AMD Ryzen AI 9 HX PRO 375
   12x 2 GHz - 5.1 GHz
» AMD Ryzen AI 9 HX 370
   12x 2 GHz - 5.1 GHz
» AMD Ryzen AI 9 HX PRO 370
   12x 2 GHz - 5.1 GHz
» AMD Ryzen AI 9 365
   10x 2 GHz - 5 GHz
» AMD Ryzen AI 7 PRO 360
   8x 2 GHz - 5 GHz
» AMD Ryzen Z2 Extreme
   8x 2 GHz - 5 GHz
» AMD Ryzen AI Max 385
   8x 3.6 GHz - 5 GHz
» AMD Ryzen AI Max PRO 385
   8x 3.6 GHz - 5 GHz
» AMD Ryzen AI Max PRO 380
   6x 3.6 GHz - 4.9 GHz

CPUs de alrededor

+ Apple M4 Max (16 cores)
   16x 2.59 GHz - 4.51 GHz
+ AMD Ryzen 9 9955HX3D
   16x 2.5 GHz - 5.4 GHz
+ Intel Core Ultra 9 285HX
   24x 2.1 GHz - 5.5 GHz
+ AMD Ryzen 9 9955HX
   16x 2.5 GHz - 5.4 GHz
+ Intel Core Ultra 9 275HX
   24x 2.1 GHz - 5.4 GHz
» AMD Ryzen AI Max+ 395
   16x 3 GHz - 5.1 GHz
- AMD Ryzen AI Max+ PRO 395
   16x 3 GHz - 5.1 GHz
- AMD Ryzen 9 7945HX3D
   16x 2.3 GHz - 5.4 GHz
- AMD Ryzen 9 8945HX
   16x 2.5 GHz - 5.4 GHz
- AMD Ryzen 9 7945HX
   16x 2.5 GHz - 5.4 GHz
- Intel Core i9-14900HX
   24x 1.6 GHz - 5.8 GHz
> Análisis y pruebas de ordenadores portátiles y móviles teléfonos > FAQ/Técnica > Procesadores de Laptops > AMD Strix Halo/Point (Zen 5/5c, Ryzen AI 300) Ryzen AI Max+ 395 Notebook Processor
Klaus Hinum (Update: 2025-01-10)