

Reseña del Ninkear Mbox 11 con Intel N150: Mini PC económico para la oficina (doméstica)
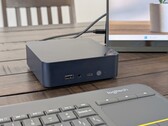
El Ninkear Mbox 11 es un mini PC compacto con el procesador Intel N150 de bajo consumo energético, lo que lo hace muy adecuado para la oficina doméstica típica y las tareas cotidianas. Hemos revisado este asequible sistema a través de una selección de pruebas comparativas para ver cómo se compara con mini PCs equipados de forma similar.
Intel Processor N150, UHD Graphics 24EUs (Alder Lake-N), 257 g