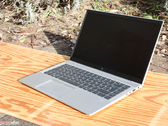

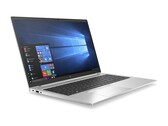
Revisión del portátil HP EliteBook 855 G7 - Elegante portátil de oficina para los viajes
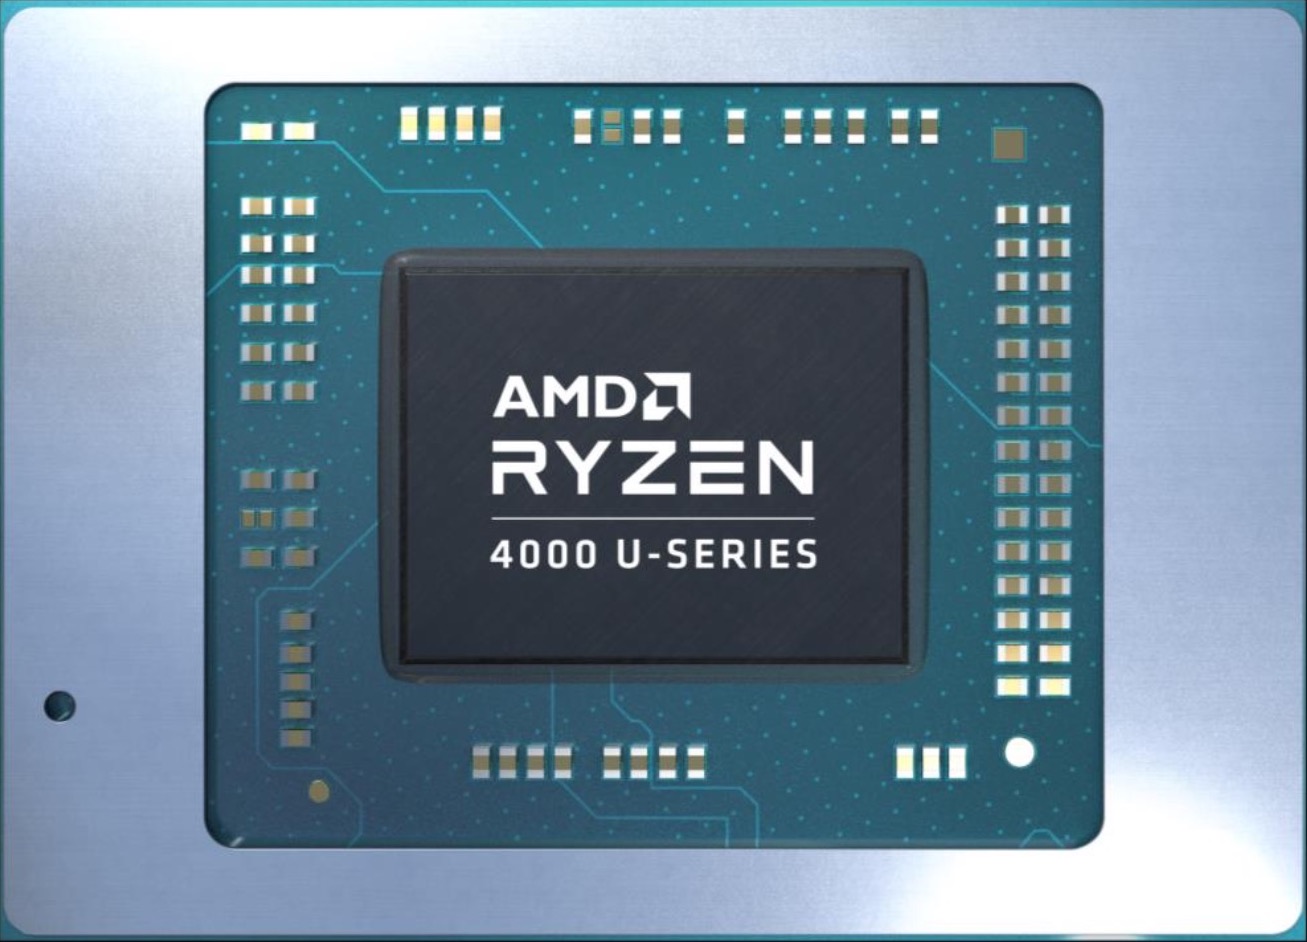
HP es un fabricante muy serio de portátiles de alta calidad para empresas. El EliteBook 855 también sigue la tendencia de AMD y ofrece un rendimiento decente del sistema gracias a Ryzen-Pro. Además, el modelo brilla por su acabado de alta calidad y su diseño chic.
AMD Ryzen 5 PRO 4650U, Vega 6, 15.6", 1.7 kg