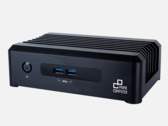
Intel Core i7-8665U
El Intel Core i7-8665U es un SoC de cuatro núcleos de bajo consumo para portátiles y ultraportátiles basado en la generación Whiskey Lake que se anunció en abril de 2019 como parte de dos procesadores WHL-U habilitados para vPro. En comparación con los procesadores de nombre similar Kaby Lake-R (por ejemplo, Core i7-8550U), las CPU de Whiskey Lake se producen ahora en un proceso de 14nm mejorado (14nm++) y ofrecen mayores velocidades de reloj. La arquitectura y las características son las mismas. El i7-8665U ofrece, por ejemplo, altas velocidades de reloj Turbo de 4,8 GHz (frente a los 4 GHz del i7-8550U) para un solo núcleo. La GPU integrada sigue llamándose Intel UHD Graphics 620 y el controlador de memoria de doble canal sigue soportando las mismas velocidades de RAM que el Kaby-Lake-R (DDR4-2400 / LPDDR3-2133). Comparado con el Core i5-8265U y el i3-8145U, más lentos, el i7 debería soportar Thermal Velocity Boost (como el Core i7-8565U, el predecesor).
Los SoC de Whiskey Lake se utilizan con un nuevo PCH producido en 14nm que soporta USB 3.1 Gen 2 (10 Gbps) y partes WiFi/BT de CNVi.
Intel básicamente usa la misma microarquitectura comparada con Skylake y Kaby Lake, por lo que el rendimiento por MHz no difiere. Eso significa que Whiskey Lake es un chip Kaby Lake fabricado en el proceso mejorado de 14nm++.
El rendimiento del i7-8665U depende de la solución de refrigeración del portátil y de los límites definidos del TDP para el rendimiento a corto y largo plazo. Ya vimos grandes diferencias para el Kaby Lake-R (por ejemplo, los puntos de referencia del i7-8550U), especialmente para el rendimiento a largo plazo (sostenido). Por lo tanto, será interesante ver cómo se puede utilizar la velocidad de reloj adicional de Turbo. Debido al Turbo Boost de 200 MHz más alto, el 8665U debería superar al i7-8565U (ver los puntos de referencia).
La gráfica integrada Intel UHD 620 (Intel Gen 9.5) no ha sido tocada por los chips Kaby Lake de la octava generación. Con una rápida memoria de doble canal puede alcanzar el rendimiento de una GeForce 920M dedicada.
A diferencia de Skylake, Kaby Lake y Whiskey Lake ahora también soporta H.265/HEVC Main 10 con una profundidad de color de 10 bits, así como el códec VP9 de Google. Los procesadores de doble núcleo de Kaby Lake anunciados en enero también deben soportar HDCP 2.2.
El chip se fabrica en un proceso mejorado de 14nm con transistores FinFET (14nm++), igual que los procesadores Coffee Lake de la octava generación. Intel todavía especifica el TDP con 15 vatios, que es típico de los chips ULV. Dependiendo del escenario de uso, el TDP puede variar entre 7,5 (cTDP Down) y 25 vatios.
Serie Intel Core i7 Nombre código Whiskey Lake-U Serie: Core i7 Whiskey Lake-U Velocidad de reloj 1900 - 4800 MHz Caché de Nivel 1 256 KB Caché de Nivel 2 1 MB Caché de Nivel 3 8 MB Número de Núcleos/Subprocesos 4 / 8 Consumo de Corriente (TDP = Thermal Design Power) 15 Watt Tecnología de producción 14 nm Temperatura Máx. 100 °C Conector BGA1528 Recursos Dual-Channel DDR4 Memory Controller, HyperThreading, AVX, AVX2, Quick Sync, Virtualization, AES-NI GPU Intel UHD Graphics 620 (300 - 1150 MHz)64 Bit soporte para 64 Bit Architecture x86 Fecha de anuncio 04/16/2019 Enlace de Producto (externo) Intel Core i7 i7-8665U
Benchmarks Performance Rating - CB R15 + R20 + 7-Zip + X265 + Blender + 3DM11 CPU
43 pt (43%)
...
AMD Ryzen 5 1500X -4%
Intel Core i5-1035G7 -4%
AMD Ryzen 5 2400G -3%
Intel Core i7-7700HQ -3%
Intel Core i7-10810U 3%
Intel Core i5-1038NG7 4%
AMD Ryzen 5 1600 5%
Intel Core i5-10400H 8%
...
Cinebench R20 - Cinebench R20 CPU (Single Core)
min: 412 de promedio: 439 mediana: 436 (68%) max: 472 Points
...
AMD Ryzen 7 2700X -2%
AMD Ryzen Threadripper 2970WX -2%
Intel Core i5-1038NG7 0%
AMD Ryzen Threadripper 2920X 0%
Intel Core i7-1065G7 0%
Intel Core i9-9900T 0%
AMD Ryzen 3 5300U 0%
Intel Core i7-9750H 1%
...
Cinebench R20 - Cinebench R20 CPU (Multi Core)
min: 1267 de promedio: 1399 mediana: 1399.5 (13%) max: 1530 Points
...
Intel Core i5-8265U -9%
Intel Core i5-1035G7 -7%
AMD Ryzen 3 1300X -5%
Intel Core i5-1035G1 -1%
AMD Ryzen 3 2200G 3%
...
AMD Ryzen Threadripper 2970WX 615%
Cinebench R15 - Cinebench R15 CPU Multi 64 Bit
min: 496 de promedio: 638 mediana: 672 (15%) max: 701 Points
...
Intel Core i7-1065G7 2%
...
AMD Ryzen Threadripper 2970WX 586%
0 10 20 30 40 50 60 70 80 90 100 110 120 130 140 150 160 170 180 190 200 210 220 230 240 250 260 270 280 290 300 310 320 330 340 350 360 370 380 390 400 410 420 430 440 450 460 470 480 490 500 510 520 530 540 550 560 570 580 590 600 610 620 630 640 650 660 670 680 690 700 710 720 730 Tooltip
Cinebench R15 - Cinebench R15 CPU Single 64 Bit
min: 143 de promedio: 177 mediana: 180.5 (66%) max: 199 Points
...
Intel Core i7-6700K -2%
Intel Core i7-1065G7 -1%
Intel Core i7-10810U -1%
AMD Ryzen 7 2700X -1%
AMD Ryzen Threadripper 2950X -1%
AMD Ryzen Threadripper 2920X 1%
Intel Core i5-7600K 2%
...
Cinebench R11.5 - Cinebench R11.5 CPU Multi 64 Bit
4.9 Points (10%)
...
Intel Core i3-8145U -18%
Intel Core i5-7267U -16%
Intel Core i7-920 -2%
Intel Core i5-6400T -1%
Intel Core i7-940 1%
Intel Core i5-2400 4%
Intel Core i7-950 7%
Intel Core i5-2500K 10%
...
Cinebench R11.5 - Cinebench R11.5 CPU Single 64 Bit
1.7 Points (53%)
...
Intel Core i5-8500T -1%
AMD Ryzen 7 1700 -1%
Intel Xeon E3-1230 v3 -1%
AMD Ryzen 3 2200G 1%
Intel Core i5-7360U 2%
Intel Xeon E3-1231 v3 2%
Intel Core i7-4790S 3%
AMD Ryzen 3 1300X 3%
...
Cinebench R10 - Cinebench R10 Rend. Single (32bit)
min: 6716 de promedio: 6872 mediana: 6872 (61%) max: 7028 puntos
...
Intel Core i9-9900T -2%
Intel Core i5-7600K -1%
Intel Core i7-7700T -1%
Intel Core i5-1035G4 -1%
Intel Core i5-1035G1 0%
Intel Core i5-8600K 0%
Intel Core i7-9750H 1%
Intel Core i7-6700K 2%
Intel Core i7-8700 4%
...
Cinebench R10 - Cinebench R10 Rend. Multi (32bit)
min: 16602 de promedio: 18427 mediana: 18426.5 (31%) max: 20251 puntos
...
Intel Core i5-6400 -1%
Intel Core i7-8650U 2%
Intel Core i5-8265U 3%
Intel Xeon E3-1226 v3 3%
Intel Core i5-4590 3%
...
wPrime 2.10 - wPrime 2.0 1024m *
429 s (5%)
AMD Ryzen Threadripper 2970WX -91%
...
Intel Core i5-8265U -6%
Intel Core i5-6400T -6%
Intel Core i7-940 -5%
AMD A12-9720P -3%
AMD A10-7850K -3%
AMD A8-3850 -1%
Intel Core 2 Quad (Desktop) Q9550 1%
AMD A10-7700K 2%
Qualcomm Snapdragon 8cx 3%
...
VIA C3-M C3-M-1200 1872%
wPrime 2.10 - wPrime 2.0 32m *
10 s (2%)
Intel Core i9-9980XE -73%
...
Intel Core i5-7500 -3%
Intel Xeon E3-1226 v3 -2%
Intel Core i7-6700T -1%
Intel Core i5-6600T 1%
...
3418 puntos (22%)
...
Intel Core i5-2400 -7%
AMD Ryzen 3 2200G -6%
Intel Core i5-7267U -5%
Intel Core i5-4460 -1%
Intel Core i5-7360U 0%
AMD Ryzen 7 1700 1%
Intel Core i7-2700K 3%
AMD Ryzen 5 1600 4%
Intel Core i5-7600K 4%
...
7-Zip 18.03 - 7-Zip 18.03 Multli Thread 4 runs
min: 17731 de promedio: 19017 mediana: 19156.5 (15%) max: 20023 MIPS
...
Intel Core i7-1065G7 -10%
AMD Ryzen 5 1400 1%
Intel Core i5-1038NG7 2%
AMD Ryzen 5 2400G 6%
Intel Core i7-10810U 7%
Intel Core i7-7700HQ 10%
...
7-Zip 18.03 - 7-Zip 18.03 Single Thread 4 runs
min: 4685 de promedio: 4800 mediana: 4726 (31%) max: 4988 MIPS
...
AMD Ryzen 7 2700X -3%
Intel Core i5-9400F -3%
Intel Core i5-10400H -1%
Intel Core i7-9750H 1%
Intel Core i9-9900T 2%
Intel Core i7-4790K 4%
Intel Core i7-10750H 6%
...
X264 HD Benchmark 4.0 - x264 Pass 2
32 fps (14%)
Intel Pentium 4 2.4 GHz -94%
...
Intel Core i5-2400 -17%
Intel Core i5-6400T -12%
AMD Ryzen 3 1200 4%
Intel Core i5-6600T 4%
Intel Core i5-4460 5%
...
X264 HD Benchmark 4.0 - x264 Pass 1
139 fps (41%)
...
Intel Xeon E5-2680 v4 -1%
Intel Core i5-2400 -1%
Intel Core i7-2700K 6%
...
HWBOT x265 Benchmark v2.2 - HWBOT x265 4k Preset
min: 4.155 de promedio: 4.7 mediana: 4.8 (15%) max: 5.2 fps
...
AMD Ryzen 5 1400 -6%
Intel Core i7-1065G7 -3%
Intel Core i5-1035G7 -1%
Intel Core i7-10810U 6%
AMD Ryzen 5 2400G 6%
AMD Ryzen 5 1500X 9%
Intel Core i9-9900T 17%
Intel Core i7-8559U 21%
...
TrueCrypt - TrueCrypt Serpent
0.3 GB/s (11%)
...
AMD A10-7700K -8%
AMD Ryzen 3 1200 -5%
AMD A10-7850K 0%
Intel Core i5-6400 2%
Intel Core i5-4460 4%
...
TrueCrypt - TrueCrypt Twofish
0.5 GB/s (12%)
...
AMD A10-7700K -7%
Intel Core i5-4460 -4%
AMD A10-7850K -4%
Intel Core i5-6400 -1%
AMD Ryzen 3 1300X 2%
Intel Xeon E3-1226 v3 3%
AMD Ryzen 3 2200G 5%
...
TrueCrypt - TrueCrypt AES
2.6 GB/s (10%)
...
Intel Core i7-8706G -8%
Intel Core i5-2400 -8%
AMD Ryzen 3 1200 0%
Intel Core i5-6400 4%
Intel Core i7-2860QM 4%
Intel Core i5-4460 8%
...
Blender 2.79 - Blender 2.79 BMW27 CPU *
min: 716 de promedio: 742 mediana: 740 (5%) max: 769 Seconds
Intel Core i5-1038NG7 -99%
...
AMD Ryzen 5 1400 -8%
Intel Core i7-10810U -2%
...
3DMark 06 - CPU - 3DMark 06 - CPU
min: 6202 de promedio: 6365 mediana: 6365 (35%) max: 6528 Points
...
Intel Core i5-6600T -1%
AMD Ryzen 3 1300X -1%
Intel Core i7-2860QM -1%
Intel Core i5-8265U -1%
Intel Core i5-4460 0%
AMD Ryzen 5 1400 1%
Intel Core i7-10810U 2%
...
Super Pi mod 1.5 XS 1M - Super Pi mod 1.5 XS 1M *
8 s (2%)
...
Intel Core i5-9600K -3%
Intel Core i7-10810U -2%
Intel Core i9-10980HK -2%
Intel Core i7-8700K 0%
Intel Core i7-7740X 1%
Intel Core i9-7900X 1%
Intel Core i9-9980XE 3%
Intel Core i7-8700 4%
Intel Core i7-10750H 4%
...
VIA C3-M C3-M-1200 5688%
Super Pi mod 1.5 XS 2M - Super Pi mod 1.5 XS 2M *
19 s (1%)
...
Intel Xeon E-2176G -3%
Intel Core i7-4790K -3%
Intel Core i7-7740X -2%
Intel Core i7-8559U -2%
Intel Core i7-8086K -1%
Intel Core i7-9750H -1%
Intel Core i9-9900T 3%
Intel Core i7-8650U 4%
Intel Core i5-8600K 4%
AMD Ryzen 9 3900X 4%
...
Super Pi Mod 1.5 XS 32M - Super Pi mod 1.5 XS 32M *
521 s (2%)
...
Intel Core i7-8650U -2%
Intel Core i7-4790T -1%
Intel Core i7-5775C 0%
Intel Core i5-8400 1%
Intel Xeon E3-1280 v5 1%
Intel Core i5-7360U 1%
...
VIA C3-M C3-M-1200 4221%
3DMark 11 - 3DM11 Performance Physics
min: 6266 de promedio: 7281 mediana: 7055 (29%) max: 8676 Points
...
Intel Core i7-4712HQ -4%
Intel Core i5-1035G1 -3%
Intel Core i7-8650U -2%
Intel Core i5-1035G4 1%
AMD Ryzen 5 1400 1%
Intel Core i7-2860QM 4%
...
3DMark - 3DMark Ice Storm Physics
56356 Points (36%)
Samsung Hummingbird S5PC110 / Exynos 3110 -99%
...
Intel Core i5-4590 -3%
Intel Xeon E3-1280 v5 -2%
AMD Ryzen Threadripper 1950X 0%
Intel Core i7-9750H 0%
AMD Ryzen Threadripper 2920X 1%
Intel Core i7-7700 2%
Intel Core i7-5775C 2%
Intel Core i7-4790K 2%
Intel Xeon E3-1226 v3 3%
...
3DMark - 3DMark Ice Storm Extreme Physics
56510 Points (60%)
...
Intel Core i7-7700 -5%
Intel Xeon E3-1280 v5 -2%
AMD Ryzen Threadripper 1950X -1%
Intel Core i7-9750H 0%
AMD Ryzen 5 2400G 2%
Intel Core i7-5775C 2%
Intel Core i7-4790K 3%
AMD Ryzen Threadripper 2920X 5%
...
3DMark - 3DMark Ice Storm Unlimited Physics
min: 54189 de promedio: 59812 mediana: 60829 (63%) max: 63399 Points
Qualcomm Snapdragon S4 Play MSM8625Q -95%
...
Intel Core i7-5775C -3%
Intel Core i7-9750H -1%
Intel Xeon E-2176M 0%
Intel Core i5-7500 0%
Intel Core i7-4790K 2%
AMD Ryzen Threadripper 2920X 3%
Intel Core i5-8500T 3%
...
3DMark - 3DMark Cloud Gate Physics
min: 5234 de promedio: 6325 mediana: 6228.5 (16%) max: 7398 Points
...
Intel Core i5-1038NG7 -3%
...
3DMark - 3DMark Fire Strike Standard Physics
min: 7758 de promedio: 8605 mediana: 8322 (21%) max: 10574 Points
...
Intel Core i7-8650U 3%
...
3DMark - 3DMark Time Spy CPU
min: 2669 de promedio: 2950 mediana: 2777 (19%) max: 3405 Points
...
AMD Ryzen 3 1200 -5%
Intel Core i5-1035G4 1%
Intel Core i7-8650U 2%
Intel Core i5-1035G1 10%
Intel Core i7-10810U 11%
Intel Core i7-1065G7 14%
...
Geekbench 3 - Geekbench 3 32 Bit Multi-Core
14277 puntos (25%)
Samsung Hummingbird S5PC110 / Exynos 3110 -98%
...
Intel Core i7-6700T -7%
Intel Xeon E3-1230 v3 -5%
Intel Core i5-8265U -4%
Intel Core i7-7700HQ -3%
Intel Core i7-1065G7 1%
...
Geekbench 3 - Geekbench 3 32 Bit Single-Core
3887 puntos (80%)
Samsung Hummingbird S5PC110 / Exynos 3110 -94%
...
Intel Core i7-1065G7 -1%
AMD Ryzen 7 1800X 3%
...
Geekbench 4.1 - 4.4 - Geekbench 4.1 - 4.4 64 Bit Single-Core
min: 4686 de promedio: 5236 mediana: 5342.5 (73%) max: 5574 puntos
...
Intel Core i5-1034G1 -3%
Intel Core i5-8400 -3%
AMD Ryzen 5 2600 -2%
Intel Core i5-1035G1 -1%
Intel Core i7-9750H 0%
Intel Core i7-10810U 1%
Intel Core i5-1035G7 1%
Intel Xeon E-2176G 1%
Intel Core i5-9400F 2%
...
Geekbench 4.1 - 4.4 - Geekbench 4.1 - 4.4 64 Bit Multi-Core
min: 11206 de promedio: 15544 mediana: 16347 (26%) max: 18275 puntos
...
Intel Core i5-1035G1 -6%
Intel Core i7-7700HQ -6%
Intel Core i7-8709G -4%
AMD Ryzen 5 1500X -3%
Intel Core i5-1035G7 1%
Intel Core i7-8706G 5%
Intel Core i5-1034G1 9%
...
Geekbench 5.0 - Geekbench 5.0 64 Bit Single-Core
1196 puntos (71%)
...
Intel Core i7-9750H -1%
Intel Core i9-9900T 0%
Intel Core i5-1035G4 0%
Intel Core i9-9980XE 2%
Intel Core i9-10885H 3%
Intel Core i7-10810U 3%
Intel Core i7-10750H 4%
...
Geekbench 5.0 - Geekbench 5.0 64 Bit Multi-Core
3453 puntos (21%)
...
Intel Core i5-1035G1 -6%
Intel Core i5-8265U -3%
AMD Ryzen 5 1400 -1%
Apple A13 Bionic -1%
AMD Ryzen 3 2200G -1%
Intel Core i5-1035G7 1%
AMD Ryzen 5 2400G 7%
Intel Core i7-7700HQ 14%
AMD Ryzen 5 1500X 17%
...
Intel Core i9-9980XE 373%
Mozilla Kraken 1.1 - Kraken 1.1 Total Score *
min: 1015.7 de promedio: 1072 mediana: 1067.6 (2%) max: 1135.6 ms
...
Intel Xeon E-2176G -4%
Intel Core i7-9750H -2%
AMD Ryzen 7 1700 -2%
Intel Xeon E-2176M -2%
Intel Core i5-6360U 2%
Intel Core i7-8706G 2%
...
Qualcomm Snapdragon S1 MSM7227A 5447%
Sunspider - Sunspider 1.0 Total Score *
235 ms (3%)
...
Apple A9 -5%
AMD A6 Pro-7050B 4%
...
Octane V2 - Octane V2 Total Score
min: 30142 de promedio: 33976 mediana: 34548 (55%) max: 36667 Points
...
Intel Core i7-4790K -3%
Intel Core i5-1035G7 -3%
AMD Ryzen 3 2200G 2%
Apple A11 Bionic 3%
...
Apple M1 83%
Power Consumption - Cinebench R15 Multi Power Consumption - external Monitor *
27.4 Watt (7%)
...
Intel Core i5-7200U -7%
Apple M1 -1%
Intel Core i5-1035G1 4%
Intel Core i5-7267U 8%
Intel Core i5-1035G7 21%
...
AMD Ryzen Threadripper 2970WX 1280%
- Gama de valores de las pruebas para esta tarjeta gráfica
- Valores medios de las pruebas para esta tarjeta gráfica
* Smaller numbers mean a higher performance
v1.16
log 18. 01:00:07
#0 no ids found in url (should be separated by "_") +0s ... 0s
#1 not redirecting to Ajax server +0s ... 0s
#2 did not recreate cache, as it is less than 5 days old! Created at Sun, 17 Jan 2021 12:44:16 +0100 +0s ... 0.001s
#3 no comparison url found in template nbc.compare_page_2 needed +0.003s ... 0.004s
#4 composed specs +0s ... 0.004s
#5 did output specs +0s ... 0.004s
#6 getting avg benchmarks for device 11328 +0.004s ... 0.008s
#7 got single benchmarks 11328 +0.015s ... 0.023s
#8 got avg benchmarks for devices +0s ... 0.023s
#9 min, max, avg, median took s +0.37s ... 0.392s
#10 no comparison url found in template nbc.compare_page_2 needed +0.001s ... 0.393s
#11 return log +0s ... 0.393s
Análisis para el Intel Core i7 i7-8665U procesador
Dell Latitude 5300-s014l530013us (Intel UHD Graphics 620, 13.30")
» Dell Latitude 5300-s014l530013us - análise externo
Dell Latitude 5500 (Intel UHD Graphics 620, 15.60")
» Review de Dell Latitude 5500: Un portátil de empresa con muchas opciones - análise » Dell Latitude 5500 - análise externo
Dell Latitude 7200 2-in-1 (i7-8665U) (Intel UHD Graphics 620, 12.30")
» Dell Latitude 7200 2-in-1 (i7-8665U) - análise externo
Dell Latitude 7300-P99G (Intel UHD Graphics 620, 13.30")
» Review sobre el portátil Dell Latitude 7300: el subnotebook de la empresa no alcanza sus objetivos de rendimiento - análise » Dell Latitude 7300-P99G - análise externo
Dell Latitude 7400 2-in-1 (Intel UHD Graphics 620, 14.00")
» Review del Convertible Dell Latitude 7400 2-in-1 (i7-8665U) - análise » Dell Latitude 7400 2-in-1 - análise externo
Dell Latitude 7400-8N6DH (Intel UHD Graphics 620, 14.00")
» Review del portátil Dell Latitude 7400: Incluso el extremo superior no está libre de debilidades - análise » Dell Latitude 7400-8N6DH - análise externo
Dynabook Tecra X50-F (Intel UHD Graphics 620, 15.60")
» Review de Dynabook Tecra X50 Laptop: Un Ultrabook ligero con una resistencia ligera - análise
Fujitsu Lifebook U939 (Intel UHD Graphics 620, 13.30")
» Fujitsu Lifebook U939 - análise externo
Fujitsu Lifebook U939X, i7-8665U (Intel UHD Graphics 620, 13.30")
» Fujitsu Lifebook U939X, i7-8665U - análise externo
HP Elite Dragonfly-8UY50UT (Intel UHD Graphics 620, 13.30")
» HP Elite Dragonfly-8UY50UT - análise externo
HP Zbook 14u G6-7JM81UT (AMD Radeon Pro WX 3200, 14.00")
» HP Zbook 14u G6-7JM81UT - análise externo
Lenovo ThinkPad P43s-20RH001AMH (NVIDIA Quadro P520, 14.00")
» Lenovo ThinkPad P43s-20RH001AMH - análise externo
Lenovo ThinkPad P53s-20N6001JGE (NVIDIA Quadro P520, 15.60")
» Lenovo ThinkPad P53s-20N6001JGE - análise externo
Lenovo ThinkPad X1 Carbon 2019-20QE000VGE (Intel UHD Graphics 620, 14.00")
» Review de Lenovo ThinkPad X1 Carbon 2019 WQHD: ¿Sigue siendo la referencia entre los portátiles de empresa? - análise » Lenovo ThinkPad X1 Carbon 2019-20QE000VGE - análise externo
Lenovo ThinkPad X1 Yoga G4-20QG000UGE (Intel UHD Graphics 620, 14.00")
» Lenovo ThinkPad X1 Yoga G4-20QG000UGE - análise externo
Otras CPUs de la serie Core i7 » Intel Core i7-8709G 4x 3.1 GHz - 4.1 GHz
» Intel Core i7-8706G 4x 3.1 GHz - 4.1 GHz
» Intel Core i7-4760HQ 4x 2.1 GHz - 3.3 GHz
» Intel Core i7-4722HQ 4x 2.4 GHz - 3.4 GHz
» Intel Core i7-4712HQ 4x 2.3 GHz - 3.3 GHz
» Intel Core i7-2860QM 4x 2.5 GHz - 3.6 GHz
» Intel Core i7-6560U 2x 2.2 GHz - 3.2 GHz
» Intel Core i7-2640M 2x 2.8 GHz - 3.5 GHz
CPUs de alrededor + Intel Core i5-1035G1 4x 1 GHz - 3.6 GHz
- Intel Core i7-8650U 4x 1.9 GHz - 4.2 GHz
Please share our article, every link counts!
Klaus Hinum (Update: 2020-06-30)