Intel Core i7-3720QM
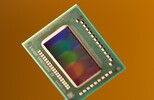
El Intel Core i7-3720QM es un veloz procesador quad-core para portátiles, basado en la arquitectura Ivy Bridge. Gracias al Hyperthreading, los cuatro núcleos pueden soportar hasta ocho threads en paralelo haciendo un mejor uso del CPU. Cada núcleo ofrece una velocidad base de 2,6 GHz, pero puede aumentar la frecuencia dinámicamente con Turbo Boost, hasta 3,4 GHz (para 4 núcleos activos), 3,5 GHz (para 2 núcleos activos) y 3,6 GHz (para 1 núcleo activo). Ivy Bridge es una matriz mejorada y reducida de la arquitectura Sandy Bridge con mejoras en el rendimiento del GPU y CPU. Los CPUs son producidos en 22nm (contra 32nm de los CPUs Sandy Bridge) y son los primeros en introducir transistores 3D para una mejor eficiencia energética al compararlo con procesadores Sandy Bridge con frecuencias similares. Otros nuevos recursos son el PCI Express 3.0 integrado y soporte para DDR3(L)-1600. El rendimiento del Core i7-3720QM debe ser ligeramente superior que el de un procesador Sandy Bridge con frecuencia similar gracias a pequeñas alteraciones estructurales. Como resultado, el rendimiento general debe ser evidentemente superior que el del antiguo modelo más veloz, el Core i7-2920XM. El Intel HD Graphics 4000 integrado, ofrece 16 Unidades de Ejecución (EUs) con frecuencia de 650 MHz hasta 1250 MHz con Turbo Boost, lo cual lo convierte en la variante más veloz. Como con la mayoría de los modelos quad-core Ivy Bridge, el Core i7-3720QM está especificado con un TDP de 45 Watts incluyendo tarjeta de video y controlador de memoria. Por tanto, el CPU es bien adecuado para portátiles de 15 pulgadas o más grandes.
Serie Intel Core i7 Nombre código Ivy Bridge Serie: Core i7 Ivy Bridge Velocidad de reloj 2600 - 3600 MHz Caché de Nivel 1 256 KB Caché de Nivel 2 1 MB Caché de Nivel 3 6 MB Número de Núcleos/Subprocesos 4 / 8 Consumo de Corriente (TDP = Thermal Design Power) 45 Watt Conteo de Transistores 1400 Millón Tecnología de producción 22 nm Tamaño de Matriz 160 mm2 Temperatura Máx. 105 °C Conector FCBGA1224, FCPGA988 Recursos HD Graphics 4000 (650-1250MHz), DDR3(L)-1600 Memory Controller, HyperThreading, AVX, Quick Sync, Virtualization GPU Intel HD Graphics 4000 (650 - 1250 MHz)64 Bit soporte para 64 Bit Architecture x86 Precio inicial $378 U.S. Fecha de anuncio 04/23/2012 Enlace de Producto (externo) Intel Core i7 3720QM
Benchmarks Cinebench R15 - Cinebench R15 CPU Multi 64 Bit
610 Points (14%)
...
Intel Core i5-7500 -4%
Intel Core i7-8650U -3%
Intel Core i5-1035G4 -3%
Intel Core i5-8265U -3%
Intel Core i5-6600K 1%
...
AMD Ryzen Threadripper 2970WX 617%
Cinebench R15 - Cinebench R15 CPU Single 64 Bit
126 Points (46%)
...
Intel Core i7-4712HQ -3%
Intel Core i5-2500K -3%
Intel Core i7-2860QM -2%
Intel Core i5-6360U -1%
Intel Core i5-4430 1%
Intel Core i5-4200H 2%
...
Cinebench R11.5 - Cinebench R11.5 CPU Multi 64 Bit
min: 5.96 de promedio: 6.6 mediana: 6.7 (14%) max: 6.85 Points
...
Intel Core i7-8650U -4%
Intel Core i5-6500 -4%
AMD Ryzen 3 1300X -3%
Intel Core i5-1035G7 -3%
Intel Core i7-4760HQ -1%
AMD Ryzen 3 2200G 1%
...
Cinebench R11.5 - Cinebench R11.5 CPU Single 64 Bit
min: 1.39 de promedio: 1.5 mediana: 1.5 (47%) max: 1.5 Points
...
Intel Core i7-4712HQ -2%
AMD Ryzen 3 PRO 3300U -2%
Intel Core i5-7200U -1%
Intel Core i7-4760HQ 0%
Intel Core i5-4200H 0%
Intel Core i5-6267U 1%
...
Cinebench R10 - Cinebench R10 Rend. Single (32bit)
min: 4749 de promedio: 4827 mediana: 4821 (43%) max: 4916 puntos
...
AMD Ryzen Threadripper 1950X -2%
Intel Core i5-2500K -1%
Intel Core i5-5257U -1%
AMD Ryzen 5 2400G 0%
Intel Core i5-4460 0%
Intel Pentium G4500T 0%
Intel Core i5-6360U 0%
...
Cinebench R10 - Cinebench R10 Rend. Multi (32bit)
min: 14659 de promedio: 18498 mediana: 18879 (32%) max: 19231 puntos
...
Intel Core i5-6400 -1%
Intel Core i7-8650U 1%
Intel Core i5-8265U 2%
Intel Xeon E3-1226 v3 3%
Intel Core i5-4590 3%
...
Cinebench R10 - Cinebench R10 Rend. Multi (64bit)
min: 21405 de promedio: 23108 mediana: 23211 (22%) max: 23615 Points
...
Intel Core i7-4712HQ -2%
AMD Ryzen 3 PRO 3300U -2%
Intel Xeon X5670 3%
Intel Core i7-2700K 3%
...
Cinebench R10 - Cinebench R10 Rend. Single (64bit)
min: 5932 de promedio: 6091 mediana: 6097 (46%) max: 6204 Points
...
Intel Core i5-2500K -2%
Intel Core i7-3960X 0%
Intel Core i7-4712HQ 2%
Intel Core i7-2700K 3%
...
wPrime 2.10 - wPrime 2.0 1024m *
min: 226.9 de promedio: 239 mediana: 235.2 (3%) max: 258.421 s
AMD Ryzen Threadripper 2970WX -84%
...
Intel Core i7-4790T -4%
Intel Core i7-7700T -2%
Intel Core i7-8559U -2%
Intel Core i5-8500T -2%
AMD Ryzen 5 1400 -1%
Intel Core i7-950 2%
...
VIA C3-M C3-M-1200 3440%
wPrime 2.10 - wPrime 2.0 32m *
min: 7.64 de promedio: 7.8 mediana: 7.9 (2%) max: 7.941 s
Intel Core i9-9980XE -65%
...
Intel Core i5-1035G7 -1%
AMD Ryzen 5 1400 0%
Intel Core i7-2860QM 0%
Intel Core i7-1065G7 2%
Intel Core i5-8500T 3%
Intel Core i7-950 3%
...
min: 3125 de promedio: 4249 mediana: 4365 (28%) max: 4613 puntos
...
AMD Ryzen Threadripper 1950X -2%
Intel Core i7-3960X -1%
Intel Core i5-8500 -1%
AMD Ryzen Threadripper 2970WX 0%
Intel Core i7-7700T 0%
Intel Core i5-8500T 2%
...
X264 HD Benchmark 4.0 - x264 Pass 2
min: 29.85 de promedio: 35.7 mediana: 37 (17%) max: 37.67 fps
Intel Pentium 4 2.4 GHz -95%
...
Intel Core i5-1035G4 0%
Intel Core i5-6500 1%
...
X264 HD Benchmark 4.0 - x264 Pass 1
min: 127.32 de promedio: 144 mediana: 146.7 (43%) max: 150.05 fps
...
Intel Core i5-6400T -3%
AMD Ryzen 5 1400 2%
Intel Core i7-2700K 2%
Intel Core i5-6400 4%
...
TrueCrypt - TrueCrypt Serpent
min: 0.27 de promedio: 0.4 mediana: 0.4 (15%) max: 0.513 GB/s
...
Intel Core i5-7600K -8%
Intel Atom Z3735F -4%
Intel Core i5-8500T -1%
...
TrueCrypt - TrueCrypt Twofish
min: 0.39 de promedio: 0.6 mediana: 0.6 (16%) max: 0.606 GB/s
...
Intel Core i5-7500 -7%
Intel Xeon E5-2680 -5%
Intel Core i5-7600K 1%
Intel Core i7-2700K 2%
...
TrueCrypt - TrueCrypt AES
min: 1.8 de promedio: 3.1 mediana: 3.3 (12%) max: 3.4 GB/s
...
Intel Xeon E3-1226 v3 -4%
AMD Ryzen 3 2200G -1%
Intel Core i5-7500 2%
Intel Core i5-6600K 2%
Intel Core i5-7600K 5%
Intel Core i7-4712HQ 9%
AMD Ryzen 5 PRO 2500U 9%
...
3DMark 06 - CPU - 3DMark 06 - CPU
min: 5981 de promedio: 6581 mediana: 6642 (37%) max: 6696 Points
...
AMD Ryzen 5 1400 -2%
Intel Core i7-10810U -1%
AMD Ryzen 3 2200G 1%
Intel Core i5-6500 1%
AMD Ryzen 5 2400G 1%
Intel Core i7-8650U 2%
...
Super Pi mod 1.5 XS 1M - Super Pi mod 1.5 XS 1M *
min: 10 de promedio: 10.3 mediana: 10.2 (2%) max: 11 s
...
AMD Ryzen Threadripper 2920X -1%
Intel Core i7-7700 -1%
AMD Ryzen Threadripper 2970WX -1%
AMD Ryzen Threadripper 2950X 0%
Intel Core i7-2860QM 0%
Intel Core i7-7700HQ 0%
Intel Core i7-5775C 0%
Intel Core i5-6500 1%
...
VIA C3-M C3-M-1200 4395%
Super Pi mod 1.5 XS 2M - Super Pi mod 1.5 XS 2M *
min: 23 de promedio: 23.9 mediana: 24 (1%) max: 24.305 s
...
Intel Core i5-6500 -2%
Intel Core i7-2860QM -2%
AMD Ryzen 7 1700X -1%
Intel Pentium G4500T 0%
Intel Core i7-990X EE 0%
AMD Ryzen 5 1500X 0%
Intel Core i5-8500T 0%
AMD Ryzen 7 2700 1%
Intel Core i5-4460 1%
...
Super Pi Mod 1.5 XS 32M - Super Pi mod 1.5 XS 32M *
min: 563 de promedio: 573 mediana: 571.7 (3%) max: 594 s
...
Intel Core i5-8305G -1%
Intel Core i7-7700HQ -1%
Intel Core i5-8500T -1%
Intel Core i5-7500 -1%
Intel Pentium G4500T 0%
AMD Ryzen 7 1700X 1%
AMD Ryzen Threadripper 2920X 1%
AMD Ryzen 7 2700X 1%
...
VIA C3-M C3-M-1200 3829%
SiSoft Sandra Dhrystone (MIPS) - SiSoft Sandra Dhrystone (MIPS)
min: 100430 de promedio: 124162 mediana: 136000 (65%) max: 136390 MIPS
...
Intel Core i7-2860QM -7%
Intel Xeon X5670 4%
Intel Core i7-2700K 14%
Intel Core i7-980X EE 21%
...
SiSoft Sandra Whetstone (MFLOPS) - SiSoft Sandra Whetstone (MFLOPS)
min: 75250 de promedio: 82146 mediana: 82470 (63%) max: 85440 MFLOPS
...
Intel Core i7-2700K 5%
...
Intel Core i7-3960X 58%
Windows 7 Experience Index - Win7 CPU
7.6 Points (97%)
...
Intel Core i7-2860QM 0%
Intel Core i7-2700K 0%
Intel Xeon X5670 1%
...
Intel Core i7-3960X 3%
3DMark Vantage - 3DM Vant. Perf. CPU no Physx
min: 12064 de promedio: 22380 mediana: 23290 (27%) max: 23791 Points
...
Intel Core i7-975 -3%
Intel Core i5-6600K -2%
...
3DMark 11 - 3DM11 Performance Physics
min: 6455 de promedio: 8020 mediana: 8217 (30%) max: 8505 Points
...
Intel Core i5-6600K -3%
Intel Core i5-8500 -1%
Intel Core i5-10400H 0%
AMD Ryzen 5 2400G 0%
Intel Core i7-7700T 1%
Intel Core i7-1065G7 2%
...
3DMark - 3DMark Ice Storm Physics
min: 35881 de promedio: 39128 mediana: 39127.5 (25%) max: 42374 Points
Samsung Hummingbird S5PC110 / Exynos 3110 -99%
...
Intel Core i3-8145U -2%
Intel Core i7-8706G -2%
Intel Core i5-8265U -1%
Intel Core i7-6560U 1%
Intel Core i5-5257U 3%
...
3DMark - 3DMark Ice Storm Unlimited Physics
min: 39845 de promedio: 40576 mediana: 40575.5 (42%) max: 41306 Points
Qualcomm Snapdragon S4 Play MSM8625Q -93%
...
Apple A14 Bionic -4%
Intel Core i5-7Y57 -3%
Apple A12X Bionic -3%
Intel Core i7-6950X -1%
Apple A12Z Bionic -1%
Intel Core i5-6267U 1%
Intel Core i5-7200U 2%
Intel Core i3-8121U 4%
Intel Xeon E5-2680 v4 4%
...
3DMark - 3DMark Cloud Gate Physics
min: 5405 de promedio: 5873 mediana: 5921 (15%) max: 6293 Points
...
Intel Core i5-8265U -1%
Intel Core i7-8650U 1%
Intel Core i5-7600K 2%
...
3DMark - 3DMark Fire Strike Standard Physics
min: 7455 de promedio: 8124 mediana: 8113 (20%) max: 8803 Points
...
Intel Core i7-4712HQ -5%
Intel Core i5-6600K -3%
Intel Core i5-8265U -2%
AMD Ryzen 5 PRO 2500U -1%
...
Geekbench 2 - 32 Bit - Geekbench Stream
8890 Points (72%)
...
Intel Core i5-5257U -2%
AMD Ryzen 7 1700X -2%
Intel Core i3-7130U -1%
Intel Core i7-8559U 2%
Intel Core i5-6360U 5%
Intel Core i7-4790K 6%
AMD Ryzen 7 1800X 9%
...
Intel Core i7-7740X 39%
Geekbench 2 - 32 Bit - Geekbench Memory
7573 Points (69%)
...
Intel Core i7-7700HQ -5%
AMD Ryzen 7 1700X -4%
Intel Core i3-7130U -3%
AMD Ryzen 7 1800X -2%
Intel Core i5-6360U 3%
Samsung Exynos 2100 5G 5%
...
Intel Core i7-7740X 46%
Geekbench 2 - 32 Bit - Geekbench Floating Point
12725 Points (25%)
...
Intel Core i5-8265U -4%
Intel Core i7-7700HQ 1%
AMD Ryzen 5 1400 4%
...
Geekbench 2 - 32 Bit - Geekbench Integer
11403 Points (23%)
...
AMD Ryzen 5 1400 1%
...
Geekbench 2 - 32 Bit - Geekbench Total Score
10848 Points (28%)
...
AMD Ryzen 5 1400 -3%
AMD Ryzen 5 PRO 2500U 3%
Intel Core i7-7700HQ 4%
...
Geekbench 3 - Geekbench 3 32 Bit Multi-Core
14452 puntos (26%)
Samsung Hummingbird S5PC110 / Exynos 3110 -98%
...
Intel Xeon E3-1230 v3 -6%
Intel Core i5-8265U -5%
Intel Core i7-7700HQ -5%
Intel Core i7-1065G7 0%
Intel Core i7-4790K 8%
Intel Core i7-6700K 13%
...
Geekbench 3 - Geekbench 3 32 Bit Single-Core
3898 puntos (80%)
Samsung Hummingbird S5PC110 / Exynos 3110 -94%
...
Intel Core i7-1065G7 -1%
AMD Ryzen 7 1800X 3%
...
Geekbench 3 - Geekbench 3 64 Bit Multi-Core
12555 puntos (20%)
...
Intel Core i5-6600T -13%
Samsung Exynos 2100 5G -9%
AMD Ryzen 3 1200 -9%
Intel Core i5-6500 -6%
Intel Core i5-6600K 0%
AMD Ryzen 5 PRO 2500U 3%
Intel Core i5-8265U 4%
AMD Ryzen 3 1300X 4%
AMD Ryzen 5 1400 8%
...
Geekbench 3 - Geekbench 3 64 Bit Single-Core
3289 puntos (67%)
...
Intel Pentium G4500T -1%
Intel Core i5-5257U 0%
Intel Core i7-3960X 1%
Intel Core i5-7Y57 3%
AMD Ryzen 5 1400 3%
Intel Core i5-6360U 4%
...
Intel Core i7-8700K 49%
Geekbench 4.1 - 4.4 - Geekbench 4.1 - 4.4 64 Bit Single-Core
3739 puntos (51%)
...
Intel Core i5-2400 -3%
Intel Core i7-4722HQ -2%
AMD Ryzen 5 1400 -1%
Intel Core m3-7Y32 1%
Intel Core i5-7200U 2%
...
Geekbench 4.1 - 4.4 - Geekbench 4.1 - 4.4 64 Bit Multi-Core
12082 puntos (19%)
...
Qualcomm Snapdragon 8cx -9%
Intel Core i7-2860QM -7%
Apple A12 Bionic -5%
Intel Core i7-4722HQ -3%
AMD Ryzen 3 2200G -2%
AMD Ryzen 3 1300X 1%
...
Mozilla Kraken 1.1 - Kraken 1.1 Total Score *
1240 ms (2%)
...
Intel Core i7-6950X -5%
Intel Core i5-7200U -2%
Intel Core i3-8145U 3%
Intel Core m5-6Y57 5%
...
Qualcomm Snapdragon S1 MSM7227A 4696%
Sunspider - Sunspider 1.0 Total Score *
93.2 ms (1%)
...
Intel Core i5-6400T -4%
Intel Core i5-8305G -4%
Intel Core i5-6267U -3%
Intel Xeon W-2145 -2%
AMD Ryzen 3 2200G -1%
Intel Core i5-8265U 0%
Intel Core i7-6950X 1%
...
Octane V2 - Octane V2 Total Score
32210 Points (48%)
...
Intel Core i5-6360U -4%
Intel Core i5-8265U -3%
AMD Ryzen 7 1800X -3%
Intel Core i7-8650U -3%
Intel Core i5-6267U -2%
Intel Core i5-7500 0%
AMD Ryzen 7 1700 0%
Intel Core i7-4790K 2%
...
AMD Ryzen 9 5980HS 108%
Power Consumption - Prime95 Power Consumption - external Monitor *
80.8 Watt (22%)
...
Intel Core i5-10400H -17%
AMD Ryzen 5 5600H -8%
Intel Core i7-9750H -7%
Intel Core i7-7700HQ -6%
Intel Core i9-10885H -3%
AMD Ryzen 7 5800H 5%
AMD Ryzen 3 1200 16%
Intel Core i7-10750H 17%
AMD Ryzen 3 2200G 18%
...
AMD Ryzen Threadripper 2970WX 362%
Power Consumption - Cinebench R15 Multi Power Consumption - external Monitor *
64.8 Watt (17%)
...
Intel Core i5-1035G4 -36%
Intel Core i9-9900T -12%
Intel Core i7-7700HQ -1%
AMD Ryzen 3 2200G 6%
AMD Ryzen 5 5600H 11%
Intel Core i7-8559U 15%
Intel Core i7-10810U 16%
Intel Core i5-10400H 17%
Intel Core i7-9750H 21%
...
AMD Ryzen Threadripper 2970WX 483%
- Gama de valores de las pruebas para esta tarjeta gráfica
- Valores medios de las pruebas para esta tarjeta gráfica
* Smaller numbers mean a higher performance
v1.16
log 04. 00:02:22
#0 no ids found in url (should be separated by "_") +0s ... 0s
#1 not redirecting to Ajax server +0s ... 0s
#2 did not recreate cache, as it is less than 5 days old! Created at Wed, 03 Mar 2021 08:41:35 +0100 +0.001s ... 0.001s
#3 no comparison url found in template nbc.compare_page_2 needed +0.005s ... 0.006s
#4 no comparison url found in template nbc.compare_page_2 needed +0s ... 0.006s
#5 no comparison url found in template nbc.compare_page_2 needed +0s ... 0.006s
#6 no comparison url found in template nbc.compare_page_2 needed +0s ... 0.006s
#7 no comparison url found in template nbc.compare_page_2 needed +0s ... 0.006s
#8 no comparison url found in template nbc.compare_page_2 needed +0s ... 0.006s
#9 no comparison url found in template nbc.compare_page_2 needed +0s ... 0.007s
#10 no comparison url found in template nbc.compare_page_2 needed +0s ... 0.007s
#11 no comparison url found in template nbc.compare_page_2 needed +0s ... 0.007s
#12 no comparison url found in template nbc.compare_page_2 needed +0s ... 0.007s
#13 no comparison url found in template nbc.compare_page_2 needed +0s ... 0.007s
#14 no comparison url found in template nbc.compare_page_2 needed +0s ... 0.007s
#15 no comparison url found in template nbc.compare_page_2 needed +0s ... 0.007s
#16 no comparison url found in template nbc.compare_page_2 needed +0s ... 0.007s
#17 no comparison url found in template nbc.compare_page_2 needed +0s ... 0.007s
#18 no comparison url found in template nbc.compare_page_2 needed +0s ... 0.007s
#19 no comparison url found in template nbc.compare_page_2 needed +0s ... 0.007s
#20 no comparison url found in template nbc.compare_page_2 needed +0s ... 0.007s
#21 composed specs +0s ... 0.007s
#22 did output specs +0s ... 0.007s
#23 getting avg benchmarks for device 3064 +0.001s ... 0.008s
#24 got single benchmarks 3064 +0.028s ... 0.036s
#25 got avg benchmarks for devices +0s ... 0.036s
#26 min, max, avg, median took s +0.381s ... 0.417s
#27 no comparison url found in template nbc.compare_page_2 needed +0s ... 0.417s
#28 return log +0s ... 0.417s
Análisis para el Intel Core i7 3720QM procesador
Alienware M14x R2 (NVIDIA GeForce GT 650M, 14.00")
» Análisis del Alienware M14x R2 - análise » Alienware M14x R2 - análise externo
Alienware M14x, i7-3720QM (NVIDIA GeForce GT 650M, 14.00")
» Alienware M14x, i7-3720QM - análise externo
Apple MacBook Pro 15 inch 2012-06 MD103LL/A (NVIDIA GeForce GT 650M, 15.60")
» Apple MacBook Pro 15 inch 2012-06 MD103LL/A - análise externo
Asus G55VW-ES71 (NVIDIA GeForce GTX 660M, 15.60")
» Asus G55VW-ES71 - análise externo
Asus G75V (NVIDIA GeForce GTX 670M, 17.30")
» Análisis del portátil Asus G75V - análise » Asus G75V - análise externo
Asus G75VW-NS72 (NVIDIA GeForce GTX 670M, 17.30")
» Asus G75VW-NS72 - análise externo
Asus N56VM (NVIDIA GeForce GT 630M, 15.60")
» Asus N56VM - análise externo
Dell Precision M4700 (NVIDIA Quadro K2000M, 15.60")
» Dell Precision M4700 - análise externo
Fujitsu Celsius H720 H7200WXP11DE (NVIDIA Quadro K1000M, 15.60")
» Fujitsu Celsius H720 H7200WXP11DE - análise externo
Lenovo ThinkPad W530-2447 (NVIDIA Quadro K1000M, 15.60")
» Lenovo ThinkPad W530-2447 - análise externo
One M73-2O (NVIDIA GeForce GT 650M, 17.30")
» One M73-2O - análise externo
Otras CPUs de la serie Core i7 » Intel Core i7-8709G 4x 3.1 GHz - 4.1 GHz
» Intel Core i7-8706G 4x 3.1 GHz - 4.1 GHz
» Intel Core i7-4760HQ 4x 2.1 GHz - 3.3 GHz
» Intel Core i7-4722HQ 4x 2.4 GHz - 3.4 GHz
» Intel Core i7-4712HQ 4x 2.3 GHz - 3.3 GHz
» Intel Core i7-2860QM 4x 2.5 GHz - 3.6 GHz
» Intel Core i7-6560U 2x 2.2 GHz - 3.2 GHz
» Intel Core i7-2640M 2x 2.8 GHz - 3.5 GHz
CPUs de alrededor + Intel Core i5-1034G1 4x 0.8 GHz - 3.6 GHz
- Intel Core i7-4760HQ 4x 2.1 GHz - 3.3 GHz
- Intel Core i7-4722HQ 4x 2.4 GHz - 3.4 GHz
- AMD Ryzen 3 5400U 4x 2.6 GHz - 4 GHz
Please share our article, every link counts!
Klaus Hinum (Update: 2013-04-12)