Análisis para el AMD Ryzen 7 4800HS procesador
AMD Ryzen 7 4800HS Debut: Review del portátil Asus Zephyrus G15 GA502IU
Incluso la CPU Renoir de la serie H de Ryzen 7 móvil más lenta es capaz de superar a la mayoría de los portátiles que funcionan con la última CPU Core i7 Comet Lake-H de 10ª generación. Aunque el rendimiento de la CPU en bruto es excelente, los 1300 dólares que se piden por el precio del Zephyrus G15 son un poco más altos considerando la GPU GeForce GTX 1660 Ti Max-Q.
AMD Ryzen 7 4800HS, NVIDIA GeForce GTX 1660 Ti Max-Q, 15.6", 2.1 kgAsus ROG Zephyrus G14 GA401II-HE092T: NVIDIA GeForce GTX 1650 Ti Mobile, 14.00", 1.7 kg
análise externo » Asus ROG Zephyrus G14 GA401II-HE092T
Asus ROG Zephyrus G14 GA401II-HE004: NVIDIA GeForce GTX 1650 Ti Mobile, 14.00", 1.6 kg
análise externo » Asus ROG Zephyrus G14 GA401II-HE004
Asus Zephyrus G14 GA401IU-HE103T: NVIDIA GeForce GTX 1660 Ti Mobile, 14.00", 1.6 kg
análise externo » Asus Zephyrus G14 GA401IU-HE103T
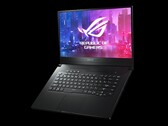
Asus ROG Zephyrus G15 GA502IU: NVIDIA GeForce GTX 1660 Ti Max-Q, 15.60", 2 kg
análise externo » Asus Zephyrus G15 GA502IU
Asus Zephyrus G14 GA401II-HE046T: NVIDIA GeForce GTX 1650 Ti Mobile, 14.00", 1.6 kg
análise externo » Asus Zephyrus G14 GA401II-HE046T
Asus ROG Zephyrus G15 GA502IV-HN020: NVIDIA GeForce RTX 2060 Max-Q, 15.60", 2.1 kg
análise externo » Asus Zephyrus G15 GA502IV-HN020
Asus Zephyrus G14 GA401IV-HE003T: NVIDIA GeForce RTX 2060 Max-Q, 14.00", 1.6 kg
análise externo » Asus Zephyrus G14 GA401IV-HE003T
Asus Zephyrus G14 GA401IU-HE001T: NVIDIA GeForce GTX 1660 Ti Max-Q, 14.00", 1.6 kg
análise externo » Asus Zephyrus G14 GA401IU-HE001T
Asus Zephyrus G14 GA401IV-HE253T: NVIDIA GeForce RTX 2060 Max-Q, 14.00", 1.7 kg
análise externo » Asus Zephyrus G14 GA401IV-HE253T
Asus Zephyrus G14 GA401IU-HE021T: NVIDIA GeForce GTX 1660 Ti Max-Q, 14.00", 1.7 kg
análise externo » Asus Zephyrus G14 GA401IU-HE021T
Asus Zephyrus G14 GA401IV-HE022: NVIDIA GeForce RTX 2060 Max-Q, 14.00", 1.6 kg
análise externo » Asus Zephyrus G14 GA401IV-HE022
Asus ROG Zephyrus G15 GA502IU-AL011T: NVIDIA GeForce GTX 1660 Ti Max-Q, 15.60", 2.1 kg
análise externo » Asus Zephyrus G15 GA502IU-AL011T
Asus Zephyrus G14 GA401IV-HA026T: NVIDIA GeForce RTX 2060 Mobile, 14.00", 1.7 kg
análise externo » Asus Zephyrus G14 GA401IV-HA026T
Asus ROG Zephyrus G15 GA502IU-ES76: NVIDIA GeForce GTX 1660 Ti Max-Q, 15.60", 2.1 kg
» El raro AMD Ryzen 7 4800HS corre tan rápido como algunos portátiles Core i9-10980HK de la décima generación y a un menor TDP