Análisis para el AMD Ryzen 5 3500U procesador
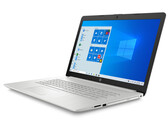
Review del HP 17: Portátil Ryzen para el escritorio de casa
El modelo de 17,3 pulgadas de HP es un simple portátil de oficina con una APU Ryzen 5-3500U, 16 GB de memoria (modo de doble canal), SSD NVMe y una pantalla IPS mate. Además, lleva una unidad óptica a bordo. Con un precio de poco menos de 800 euros (~934 dólares), el ordenador no es una ganga.
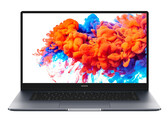
AMD Ryzen 5 3500U, Vega 8, 17.3", 2.5 kgReview del Honor MagicBook 15 en revisión: Ryzen 5 en un elegante traje
Las elegantes notas de 15,6 pulgadas de Honors con una delgada carcasa de metal, un Ryzen 5-APU y una memoria que funciona en modo de doble canal. La duración de la batería es decente, pero no sobresaliente.
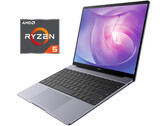
AMD Ryzen 5 3500U, Vega 8, 15.6", 1.5 kgReview de Huawei MateBook 13 (2020) - Un portátil Ryzen no siempre es la mejor opción
Comparativamente compacto y aún más barato que la versión Intel, el MateBook 13 se presenta configurado con un chipset AMD. Nuestra revisión aclarará quién sería, sin embargo, mejor que invirtiera un poco más de dinero.
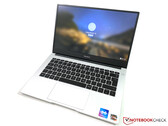
AMD Ryzen 5 3500U, Vega 8, 13", 1.3 kgReview del Honor Magicbook 14: ¿Una mejor versión del MateBook D 14?
Nos gustó mucho el Huawei MateBook D 14 con un procesador AMD en nuestra reseña, y Honor ahora ofrece el mismo dispositivo que el MagicBook 14 por 50-100 Euros (~$54-$108) menos. ¿Hay alguna trampa, o el MagicBook 14 es una recomendación?
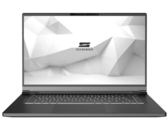
AMD Ryzen 5 3500U, Vega 8, 14", 1.4 kgReview del portátil Schenker VIA 15: un ligero portátil de AMD
El Schenker VIA 15 es un portátil de 15 pulgadas que tiene un buen aspecto y especificaciones prometedoras. Pero hay algunas peculiaridades que los potenciales compradores deben tener en cuenta. Averigüe más en nuestra reseña.
AMD Ryzen 5 3500U, Vega 8, 15.6", 1.4 kgHuawei MateBook D 14-53010TVS: AMD Radeon RX Vega 8 (Ryzen 2000/3000), 14.00", 1.4 kg
análise » Review del MateBook D 14 de Huawei: AMD Ryzen 5 3500U desatado
Huawei MateBook D 15-53010TUY: AMD Radeon RX Vega 8 (Ryzen 2000/3000), 15.60", 1.5 kg
análise » Review del portátil Huawei MateBook D 15: Sigue siendo un buen portátil con AMD
Asus VivoBook 17 M712DA-AU017T: AMD Radeon RX Vega 8 (Ryzen 2000/3000), 17.30", 2.3 kg
análise » Review del portátil Asus VivoBook 17 M712DA: Barato 17 pulgadas
Walmart Motile M142: AMD Radeon RX Vega 8 (Ryzen 2000/3000), 14.00", 1.1 kg
análise » Review de la computadora portátil Walmart Motile M142: Bastante bueno por $500
Acer Aspire 5 A515-43-R6WW: AMD Radeon RX Vega 8 (Ryzen 2000/3000), 15.60", 1.8 kg
análise » Review del portátil Acer Aspire 5 A515-43-R057: Un precio excelente para un portátil AMD, pero con un gran inconveniente
Acer Swift 3 SF314-41-R8HZ: AMD Radeon RX Vega 8 (Ryzen 2000/3000), 14.00", 1.5 kg
análise » Review del portátil Acer Swift 3 SF314-41: Un subnotebook Ryzen elegante y delgado con mucha potencia y duración de la batería en el tanque.
Lenovo Ideapad C340-14API 81N6004UGE: AMD Radeon RX Vega 8 (Ryzen 2000/3000), 14.00", 1.7 kg
análise » Review de IdeaPad Flex 14API de Lenovo: Ryzen 5 sube el listón
HP ProBook 455R G6: AMD Radeon RX Vega 8 (Ryzen 2000/3000), 15.60", 2 kg
análise » Review del portátil HP ProBook 455R G6: Mayor duración de la batería gracias a Zen+
Lenovo V155-15API: AMD Radeon RX Vega 8 (Ryzen 2000/3000), 15.60", 2.2 kg
análise » Review de Lenovo V155: El portátil económico se convierte en un gigante del almacenamiento
Lenovo ThinkPad E495-20NE000JGE: AMD Radeon RX Vega 8 (Ryzen 2000/3000), 14.00", 1.8 kg
análise » Review del portátil ThinkPad E495 de Lenovo: Aparato de oficina económico con mucha potencia, pero sin iluminación del teclado
Lenovo Ideapad L340-17API-81LY0004GE: AMD Radeon RX Vega 8 (Ryzen 2000/3000), 17.30", 2.8 kg
análise » Review del portátil Lenovo Ideapad L340-17API: 17.3-pulgadas satisfacen con una buena duración de la batería
Medion Akoya E14301: AMD Radeon RX Vega 8 (Ryzen 2000/3000), 14.00", 1.5 kg
análise externo » Medion Akoya E14301
HP Pavilion 15-cw1501nd: AMD Radeon RX Vega 8 (Ryzen 2000/3000), 15.60", 1.9 kg
análise externo » HP Pavilion 15-cw1501nd
Dell Vostro 14 3405, R5 3500U: AMD Radeon RX Vega 8 (Ryzen 2000/3000), 14.00", 1.7 kg
análise externo » Dell Vostro 14 3405, R5 3500U
HP Pavilion 15-cw1947nd: AMD Radeon RX Vega 8 (Ryzen 2000/3000), 15.60", 1.9 kg
análise externo » HP Pavilion 15-cw1947nd
Acer Spin 3 SP314-21-R572: AMD Radeon RX Vega 8 (Ryzen 2000/3000), 14.00", 1.5 kg
análise externo » Acer Spin 3 SP314-21-R572
Asus VivoBook 14 D415DA-EB238: AMD Radeon RX Vega 8 (Ryzen 2000/3000), 14.00", 1.6 kg
análise externo » Asus VivoBook 14 D415DA-EB238
Asus VivoBook 14 M415DA-EK274: AMD Radeon RX Vega 8 (Ryzen 2000/3000), 14.00", 1.6 kg
análise externo » Asus VivoBook 14 M415DA-EK274
Medion Akoya E15301: AMD Radeon RX Vega 8 (Ryzen 2000/3000), 15.60", 1.9 kg
análise externo » Medion Akoya E15301
HP 15s-eq0022ns: AMD Radeon RX Vega 8 (Ryzen 2000/3000), 15.60", 1.8 kg
análise externo » HP 15s-eq0022ns
Asus VivoBook 14 M409DA-BV646: AMD Radeon RX Vega 8 (Ryzen 2000/3000), 14.00", 1.5 kg
análise externo » Asus VivoBook 14 M409DA-BV646
Asus VivoBook D509DA-EJ028T: AMD Radeon RX Vega 8 (Ryzen 2000/3000), 15.60", 1.8 kg
análise externo » Asus VivoBook D509DA-EJ028T
Asus VivoBook 14 M409DA-EK146T: AMD Radeon RX Vega 8 (Ryzen 2000/3000), 14.00", 1.6 kg
análise externo » Asus VivoBook 14 M409DA-EK146T
HP Pavilion 15-cw1948nd: AMD Radeon RX Vega 8 (Ryzen 2000/3000), 15.60", 1.9 kg
análise externo » HP Pavilion 15-cw1948nd
HP 14-dk0033ns: AMD Radeon RX Vega 8 (Ryzen 2000/3000), 14.00", 1.5 kg
análise externo » HP 14-dk0033ns
Acer Aspire 3 A315-23-R6U9: AMD Radeon RX Vega 8 (Ryzen 2000/3000), 15.60", 1.9 kg
análise externo » Acer Aspire 3 A315-23-R6U9
Acer Aspire 3 A315-23-R875: AMD Radeon RX Vega 8 (Ryzen 2000/3000), 15.60", 1.9 kg
análise externo » Acer Aspire 3 A315-23-R875
Lenovo ThinkPad E495-20NE000JGE: AMD Radeon RX Vega 8 (Ryzen 2000/3000), 14.00", 1.8 kg
análise externo » Lenovo ThinkPad E495-20NE000JGE
Lenovo IdeaPad S145-81V70008BR: AMD Radeon RX Vega 8 (Ryzen 2000/3000), 15.60", 2.5 kg
análise externo » Lenovo IdeaPad S145-81V70008BR
Acer Aspire 3 A315-23-R33X: AMD Radeon RX Vega 8 (Ryzen 2000/3000), 15.60", 1.9 kg
análise externo » Acer Aspire 3 A315-23-R33X
HP 14-dk0030ns: AMD Radeon RX Vega 8 (Ryzen 2000/3000), 14.00", 1.5 kg
análise externo » HP 14-dk0030ns
Acer Aspire 3 A315-23-R8W6: AMD Radeon RX Vega 8 (Ryzen 2000/3000), 15.60", 1.9 kg
análise externo » Acer Aspire 3 A315-23-R8W6
HP 17-ca1008ng: AMD Radeon RX Vega 8 (Ryzen 2000/3000), 17.30", 2.5 kg
análise externo » HP 17-ca1008ng
Lenovo IdeaPad 3 15ADA05: AMD Radeon RX Vega 8 (Ryzen 2000/3000), 15.60", 1.9 kg
análise externo » Lenovo IdeaPad 3 15ADA05
Asus VivoBook 17 D712DA-AU021T: AMD Radeon RX Vega 8 (Ryzen 2000/3000), 17.30", 2.3 kg
análise externo » Asus VivoBook 17 D712DA-AU021T
Asus ZenBook 14 UM431DA-AM011T: AMD Radeon RX Vega 8 (Ryzen 2000/3000), 14.00", 1.4 kg
análise externo » Asus ZenBook 14 UM431DA-AM011T
Asus D509DA-BR294: AMD Radeon RX Vega 8 (Ryzen 2000/3000), 15.60", 1.8 kg
análise externo » Asus D509DA-BR294
Acer Swift 3 SF314-41-R69Y: AMD Radeon RX Vega 8 (Ryzen 2000/3000), 14.00", 1.5 kg
análise externo » Acer Swift 3 SF314-41-R69Y
Asus M509DA-EJ068T: AMD Radeon RX Vega 8 (Ryzen 2000/3000), 15.60", 1.8 kg
análise externo » Asus M509DA-EJ068T
Asus ZenBook Flip 14 UM462DA-AI038: AMD Radeon RX Vega 8 (Ryzen 2000/3000), 14.00", 1.6 kg
análise externo » Asus ZenBook Flip 14 UM462DA-AI038
Honor MagicBook 15: AMD Radeon RX Vega 8 (Ryzen 2000/3000), 15.60", 1.5 kg
análise externo » Honor MagicBook 15
Asus VivoBook 14 D409DA-EK366: AMD Radeon RX Vega 8 (Ryzen 2000/3000), 14.00", 1.6 kg
análise externo » Asus VivoBook 14 D409DA-EK366
Lenovo Ideapad S340-14API-81NB006AGE: AMD Radeon RX Vega 8 (Ryzen 2000/3000), 14.00", 1.7 kg
análise externo » Lenovo Ideapad S340-14API-81NB006AGE
Huawei MateBook 13 2020 AMD: AMD Radeon RX Vega 8 (Ryzen 2000/3000), 13.00", 1.3 kg
análise externo » Huawei MateBook 13 2020 AMD
HP 15s-eq0025ns: AMD Radeon RX Vega 8 (Ryzen 2000/3000), 15.60", 1.7 kg
análise externo » HP 15s-eq0025ns
Lenovo Ideapad S145-15API-81UT00DBGE: AMD Radeon RX Vega 8 (Ryzen 2000/3000), 15.60", 1.9 kg
análise externo » Lenovo Ideapad S145-15API-81UT00DBGE
Asus VivoBook 17 M712DA-AU017T: AMD Radeon RX Vega 8 (Ryzen 2000/3000), 17.30", 2.3 kg
análise externo » Asus VivoBook 17 M712DA-AU017T
Acer Aspire 5 A515-43-R4HV: AMD Radeon RX Vega 8 (Ryzen 2000/3000), 15.60", 1.9 kg
análise externo » Acer Aspire 5 A515-43-R4HV
HP 14-dk0009ns: AMD Radeon RX Vega 8 (Ryzen 2000/3000), 14.00", 1.5 kg
análise externo » HP 14-dk0009ns
Asus M570DD-E4082T: NVIDIA GeForce GTX 1050 Mobile, 15.60", 2 kg
análise externo » Asus M570DD-E4082T
HP 15s-eq0017ns: AMD Radeon RX Vega 8 (Ryzen 2000/3000), 15.60", 1.8 kg
análise externo » HP 15s-eq0017ns
Asus M509DA-EJ025T: AMD Radeon RX Vega 8 (Ryzen 2000/3000), 15.60", 1.9 kg
análise externo » Asus M509DA-EJ025T
HP Envy x360 13-ar0002ur: AMD Radeon RX Vega 8 (Ryzen 2000/3000), 13.30", 1.3 kg
análise externo » HP Envy x360 13-ar0002ur
Lenovo ThinkPad E595-20NF001HMH: AMD Radeon RX Vega 8 (Ryzen 2000/3000), 15.60", 2.1 kg
análise externo » Lenovo ThinkPad E595-20NF001HMH
Acer Swift 3 SF314-41-R9JT: AMD Radeon RX Vega 8 (Ryzen 2000/3000), 14.00", 1.5 kg
análise externo » Acer Swift 3 SF314-41-R9JT
Honor Magicbook 14: AMD Radeon RX Vega 8 (Ryzen 2000/3000), 14.00", 1.4 kg
análise externo » Honor Magicbook 14
Huawei MateBook D 15-53010TUY: AMD Radeon RX Vega 8 (Ryzen 2000/3000), 15.60", 1.5 kg
análise externo » Huawei MateBook D 15-53010TUY
HP 14-dk0933nd: AMD Radeon RX Vega 8 (Ryzen 2000/3000), 14.00", 1.5 kg
análise externo » HP 14-dk0933nd
Huawei Matebook D 15 Space Grey (2020): AMD Radeon RX Vega 8 (Ryzen 2000/3000), 15.60", 1.5 kg
análise externo » Huawei Matebook D 15 Space Grey (2020)
Huawei MateBook D 14-53010TVS: AMD Radeon RX Vega 8 (Ryzen 2000/3000), 14.00", 1.4 kg
análise externo » Huawei MateBook D 14-53010TVS
HP Envy x360 13-ar0006nw: AMD Radeon RX Vega 8 (Ryzen 2000/3000), 13.30", 1.3 kg
análise externo » HP Envy x360 13-ar0006nw
Asus D570DD-E4028T: NVIDIA GeForce GTX 1050 Mobile, 15.60", 2 kg
análise externo » Asus D570DD-E4028T
HP Envy x360 13-ar0150nd: AMD Radeon RX Vega 8 (Ryzen 2000/3000), 13.30", 1.3 kg
análise externo » HP Envy x360 13-ar0150nd
HP Envy x360 13-ar0800no: AMD Radeon RX Vega 8 (Ryzen 2000/3000), 13.30", 1.3 kg
análise externo » HP Envy x360 13-ar0800no
Acer Swift 3 SF314-41-R8HZ: AMD Radeon RX Vega 8 (Ryzen 2000/3000), 14.00", 1.5 kg
análise externo » Acer Swift 3 SF314-41-R8HZ
Asus ZenBook Flip 14 UM462DA-AI012T: AMD Radeon RX Vega 8 (Ryzen 2000/3000), 14.00", 1.6 kg
análise externo » Asus ZenBook Flip 14 UM462DA-AI012T
Acer Swift 3 SF314-41-R1X6: AMD Radeon RX Vega 8 (Ryzen 2000/3000), 14.00", 1.5 kg
análise externo » Acer Swift 3 SF314-41-R1X6
Asus ZenBook 14 UM431DA-AM003: AMD Radeon RX Vega 8 (Ryzen 2000/3000), 14.00", 1.4 kg
análise externo » Asus ZenBook 14 UM431DA-AM003
HP 17-ca1105ng: AMD Radeon RX Vega 8 (Ryzen 2000/3000), 17.30", 2.5 kg
análise externo » HP 17-ca1105ng
Lenovo V155-15API-81V50008SP: AMD Radeon RX Vega 8 (Ryzen 2000/3000), 15.60", 2.2 kg
análise externo » Lenovo V155-15API-81V50008SP
Acer Aspire 3 A315-42-R5P7: AMD Radeon RX Vega 8 (Ryzen 2000/3000), 15.60", 1.9 kg
análise externo » Acer Aspire 3 A315-42-R5P7
Asus ZenBook 14 UM431DA-AM053: AMD Radeon RX Vega 8 (Ryzen 2000/3000), 14.00", 1.4 kg
análise externo » Asus ZenBook 14 UM431DA-AM053
Acer Aspire 5 A515-43-R7MS: AMD Radeon RX Vega 8 (Ryzen 2000/3000), 15.60", 1.8 kg
análise externo » Acer Aspire 5 A515-43-R7MS
Lenovo Ideapad C340-14API 81N6004UGE: AMD Radeon RX Vega 8 (Ryzen 2000/3000), 14.00", 1.7 kg
análise externo » Lenovo Ideapad C340-14API 81N6004UGE
Asus VivoBook 15 S512DA-BR097: AMD Radeon RX Vega 8 (Ryzen 2000/3000), 15.60", 1.6 kg
análise externo » Asus VivoBook 15 S512DA-BR097
Acer Swift 3 SF314-41-R8VS: AMD Radeon RX Vega 8 (Ryzen 2000/3000), 14.00", 1.5 kg
análise externo » Acer Swift 3 SF314-41-R8VS
Asus ZenBook 14 UM433DA-AM062T: AMD Radeon RX Vega 8 (Ryzen 2000/3000), 14.00", 1.4 kg
análise externo » Asus ZenBook 14 UM433DA-AM062T
Lenovo Ideapad C340-14API-81N6005LSP: AMD Radeon RX Vega 8 (Ryzen 2000/3000), 14.00", 1.7 kg
análise externo » Lenovo Ideapad C340-14API-81N6005LSP
HP 14-dk0002ns: AMD Radeon RX Vega 8 (Ryzen 2000/3000), 14.00", 1.5 kg
análise externo » HP 14-dk0002ns
HP Envy x360 13-ar0004ng: AMD Radeon RX Vega 8 (Ryzen 2000/3000), 13.30", 1.3 kg
análise externo » HP Envy x360 13-ar0004ng
Lenovo Ideapad S540-14API-81NH002YGE: AMD Radeon RX Vega 8 (Ryzen 2000/3000), 14.00", 1.5 kg
análise externo » Lenovo Ideapad S540-14API-81NH002YGE
HP 15-db1011ns: AMD Radeon RX Vega 8 (Ryzen 2000/3000), 15.60", 1.8 kg
análise externo » HP 15-db1011ns
HP Envy x360 13-ar0000ns: AMD Radeon RX Vega 8 (Ryzen 2000/3000), 13.30", 1.3 kg
análise externo » HP Envy x360 13-ar0000ns
HP 15-db1014ns: AMD Radeon RX Vega 8 (Ryzen 2000/3000), 15.60", 1.8 kg
análise externo » HP 15-db1014ns
Huawei MateBook 13 2020 AMD: AMD Radeon RX Vega 8 (Ryzen 2000/3000), 13.00", 1.3 kg
» MateBook 13: Este es el mejor chipset para el portátil Huawei