Notebookcheck Logo

Intel Processor N100

Intel N100

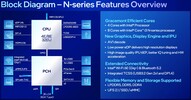
El procesador Intel N100 es una CPU móvil básica para portátiles delgados y ligeros de la serie Alder Lake-N. Se anunció a principios de 2023 y no ofrece núcleos de rendimiento y sí 4 de los 8 núcleos eficientes (núcleos E, arquitectura Gracemont). El chip no es compatible con HyperThreading y funciona a frecuencias de 1 a 3,4 GHz. El rendimiento de los núcleos E debería ser similar al de los antiguos núcleos Skylake (compare con el Core i7-6700HQ). Todos los núcleos pueden utilizar hasta 6 MB de caché L3.

Rendimiento

El N100 medio de nuestra base de datos ofrece unas puntuaciones de referencia multihilo poco impresionantes que son muy similares a las del Core i3-1115G4. El chip es lo suficientemente rápido para muchas tareas cotidianas, pero no mucho más que eso; la otra cosa a tener en cuenta es que de los dos sistemas con N100 probados por nosotros en octubre de 2023, ambos tienen límites de potencia de CPU bastante altos. El chip será notablemente más lento si se limita a sólo seis o siete vatios.

Características

Los chips Alder Lake-N sólo admiten memoria monocanal de hasta DDR5-4800, DDR4-3200 o LPDDR5-4800. El chip también es compatible con Quick Sync y decodificación AV1 (muy probablemente el mismo motor que en Alder Lake). Además, Wi-Fi 6E y Bluetooth 5.2 están parcialmente integrados (pero no Thunderbolt). Los chips externos pueden conectarse mediante PCIe Gen3 x9 (a través del PCH).

El adaptador gráfico integrado se basa en la arquitectura Xe y ofrece sólo 24 de las 32 UE (unidades de ejecución) que funcionan a sólo 450 - 750 MHz. Debido a la memoria monocanal, las bajas velocidades de reloj y el escaso número de sombreadores, el rendimiento de la iGPU en juegos es muy limitado.

Consumo de energía

El N100 tiene un consumo de energía base de sólo 6 W y, por tanto, es adecuado para la refrigeración sin ventilador. La CPU está fabricada con un proceso SuperFin de 10nm mejorado aún más en Intel (denominado Intel 7).

SerieIntel Alder Lake-N
Nombre códigoAlder Lake-N

Serie: Alder Lake-N Alder Lake-N

Intel Core i3-N3051.8 - 3.8 GHz8 / 8 cores6 MB L3
Intel Core i3-N300 - 3.8 GHz8 / 8 cores6 MB L3
Intel Processor N2001 - 3.7 GHz4 / 4 cores6 MB L3
Intel Processor N97 - 3.6 GHz4 / 4 cores6 MB L3
Intel Processor N95 - 3.4 GHz4 / 4 cores6 MB L3
Intel Processor N100 « 1 - 3.4 GHz4 / 4 cores6 MB L3
Intel Processor N501 - 3.4 GHz2 / 2 cores6 MB L3
Velocidad de reloj1000 - 3400 MHz
Caché de Nivel 36 MB
Número de Núcleos/Subprocesos4 / 4
4 x 3.4 GHz Intel Crestmont E-Core
Consumo de Corriente (TDP = Thermal Design Power)6 Watt
Tecnología de producción10 nm
Temperatura Máx.105 °C
ConectorBGA1264
RecursosDDR4-3200/DDR5-4800/LPDDR5-4800 RAM (sin. chan.), PCIe 3, GNA, MMX, SSE, SSE2, SSE3, SSSE3, SSE4.1, SSE4.2, AVX, AVX2, BMI2, ABM, FMA, ADX, VMX, SMEP, SMAP, EIST, TM1, TM2, Turbo, SST, AES-NI, RDRAND, RDSEED, SHA
GPUIntel UHD Graphics 24EUs (Alder Lake-N) ( - 750 MHz)
64 Bitsoporte para 64 Bit
Architecturex86
Precio inicial$128 U.S.
Fecha de anuncio01/03/2023
Enlace de Producto (externo)ark.intel.com

Benchmarks

Performance Rating - CB R15 + R20 + 7-Zip + X265 + Blender + 3DM11 CPU
26.3 pt (36%)
2.47 -91%
...
AMD Ryzen Embedded V1605B
25.3 -4%
Intel Core i5-6287U
25.4 -3%
25.6 -3%
25.9 -2%
26 -1%
26.1 -1%
26.2 0%
26.2 0%
26.2 0%
Intel Processor N100
26.3
26.5 1%
26.5 1%
26.7 2%
26.7 2%
26.9 2%
27 3%
27.1 3%
27.1 3%
27.6 5%
...
57 117%
max:
72.1 174%
0%
100%
Cinebench 2024 - CB24 CPU Single Core
min: 60     de promedio: 60.5     mediana: 60.5 (42%)     max: 61 Points
Cinebench 2024 - CB24 CPU Multi Core
min: 194     de promedio: 195     mediana: 195 (4%)     max: 196 Points
Cinebench R23 - Cinebench R23 Multi Core
min: 2038     de promedio: 2730     mediana: 2949.5 (3%)     max: 2983 Points
202 -93%
...
2174 -20%
2175 -20%
2303 -16%
2546 -7%
2600 -5%
Intel Core i5-1140G7
2611 -4%
Intel Core i7-2860QM
2699 -1%
2711 -1%
2729 0%
Intel Processor N100
2730
2739 0%
2913 7%
2914 7%
2927 7%
Intel Core i5-8260U
3028 11%
3038 11%
3094 13%
3108 14%
AMD Ryzen Embedded V1605B
3160 16%
...
32782 1101%
max:
107681 3844%
0%
100%
Cinebench R23 - Cinebench R23 Single Core
min: 868     de promedio: 918     mediana: 930 (40%)     max: 942 Points
74.4 -92%
...
AMD Ryzen Embedded V1605B
841 -8%
863 -6%
874 -5%
875 -5%
877 -4%
886 -3%
886 -3%
AMD Ryzen Embedded R1606G
888 -3%
Intel Core i3-8109U
906 -1%
Intel Processor N100
918
971 6%
973 6%
974 6%
976 6%
983 7%
988 8%
1003 9%
Intel Core i5-8265U
1008 10%
Intel Core i5-1035G1
1016 11%
...
2178 137%
max:
2351 156%
0%
100%
Cinebench R20 - Cinebench R20 CPU (Single Core)
min: 331     de promedio: 349.8     mediana: 355 (39%)     max: 358 Points
Cinebench R20 - Cinebench R20 CPU (Multi Core)
min: 776     de promedio: 1042     mediana: 1126.5 (3%)     max: 1139 Points
Cinebench R15 - Cinebench R15 CPU Multi 64 Bit
min: 296     de promedio: 429.8     mediana: 472 (3%)     max: 479 Points
31 -93%
...
368 -14%
Intel Core i5-7260U
373 -13%
382 -11%
Intel Core i5-7267U
383 -11%
390.8 -9%
400 -7%
403.5 -6%
416 -3%
422.5 -2%
Intel Processor N100
429.8
432 1%
437 2%
448 4%
461.6 7%
466.8 9%
471 10%
479 11%
AMD Ryzen 3 PRO 3300U
481 12%
501 17%
...
5600 1203%
max:
15842 3586%
0%
100%
0255075100125150175200225250275300325350375400425450Tooltip
Cinebench R15 - Cinebench R15 CPU Single 64 Bit
min: 137     de promedio: 149.5     mediana: 153 (46%)     max: 155 Points
Cinebench R11.5 - Cinebench R11.5 CPU Multi 64 Bit
min: 3.91     de promedio: 5     mediana: 5.2 (7%)     max: 5.99 Points
Cinebench R11.5 - Cinebench R11.5 CPU Single 64 Bit
min: 1.55     de promedio: 1.8     mediana: 1.8 (46%)     max: 1.87 Points
Cinebench R10 - Cinebench R10 Rend. Single (32bit)
min: 4604     de promedio: 4884     mediana: 4869 (29%)     max: 5179 puntos
Cinebench R10 - Cinebench R10 Rend. Multi (32bit)
min: 9608     de promedio: 13384     mediana: 15207 (11%)     max: 15336 puntos
Cinebench R10 - Cinebench R10 Rend. Multi (64bit)
min: 14514     de promedio: 20884     mediana: 23912 (17%)     max: 24225 Points
Cinebench R10 - Cinebench R10 Rend. Single (64bit)
min: 7171     de promedio: 7832     mediana: 8098 (10%)     max: 8227 Points
wPrime 2.10 - wPrime 2.0 1024m *
min: 481.652     de promedio: 536     mediana: 496.8 (6%)     max: 630.2 s
wPrime 2.10 - wPrime 2.0 32m *
min: 15.795     de promedio: 16.5     mediana: 15.9 (3%)     max: 17.7 s
WinRAR - WinRAR 4.0
min: 2187     de promedio: 2330     mediana: 2372 (4%)     max: 2431 puntos
7-Zip 18.03 - 7-Zip 18.03 Multli Thread 4 runs
min: 9272     de promedio: 12249     mediana: 13216 (8%)     max: 13291 MIPS
7-Zip 18.03 - 7-Zip 18.03 Single Thread 4 runs
min: 3449     de promedio: 3738     mediana: 3771.5 (45%)     max: 3958 MIPS
X264 HD Benchmark 4.0 - x264 Pass 2
min: 21.8     de promedio: 30.1     mediana: 33.9 (12%)     max: 34.7 fps
X264 HD Benchmark 4.0 - x264 Pass 1
min: 105.35     de promedio: 150.3     mediana: 172.6 (40%)     max: 173 fps
HWBOT x265 Benchmark v2.2 - HWBOT x265 4k Preset
min: 1.99     de promedio: 3.1     mediana: 3.4 (6%)     max: 3.49 fps
0123456Tooltip
TrueCrypt - TrueCrypt Serpent
min: 0.257     de promedio: 0.3     mediana: 0.3 (0%)     max: 0.262 GB/s
TrueCrypt - TrueCrypt Twofish
min: 0.531     de promedio: 0.5     mediana: 0.5 (9%)     max: 0.538 GB/s
TrueCrypt - TrueCrypt AES
min: 2.8     de promedio: 2.9     mediana: 2.9 (8%)     max: 2.9 GB/s
Blender - Blender 3.3 Classroom CPU *
min: 1992     de promedio: 2024     mediana: 2028 (26%)     max: 2052 Seconds
Blender - Blender 2.79 BMW27 CPU *
min: 1017     de promedio: 1174     mediana: 1043 (7%)     max: 1594 Seconds
R Benchmark 2.5 - R Benchmark 2.5 *
min: 0.822     de promedio: 0.9     mediana: 0.8 (18%)     max: 1.039 sec
3DMark 06 - CPU - 3DMark 06 - CPU
min: 4091     de promedio: 5656     mediana: 6435 (14%)     max: 6441 Points
Super Pi mod 1.5 XS 1M - Super Pi mod 1.5 XS 1M *
min: 19.264     de promedio: 19.4     mediana: 19.4 (4%)     max: 19.531 s
Super Pi mod 1.5 XS 2M - Super Pi mod 1.5 XS 2M *
min: 40.352     de promedio: 40.5     mediana: 40.4 (2%)     max: 40.601 s
Super Pi Mod 1.5 XS 32M - Super Pi mod 1.5 XS 32M *
min: 818.372     de promedio: 833     mediana: 818.8 (4%)     max: 862.019 s
3DMark Vantage - 3DM Vant. Perf. CPU no Physx
min: 9434     de promedio: 13518     mediana: 15496 (14%)     max: 15625 Points
3DMark 11 - 3DM11 Performance Physics
min: 3814     de promedio: 5623     mediana: 6095.5 (16%)     max: 6486 Points
3DMark - 3DMark Ice Storm Physics
min: 34828     de promedio: 45164     mediana: 49600 (40%)     max: 51063 Points
3DMark - 3DMark Ice Storm Extreme Physics
min: 34083     de promedio: 44999     mediana: 49495 (40%)     max: 51420 Points
3DMark - 3DMark Ice Storm Unlimited Physics
min: 50867     de promedio: 52113     mediana: 52098 (44%)     max: 53373 Points
3DMark - 3DMark Cloud Gate Physics
min: 3203     de promedio: 4282     mediana: 4615 (12%)     max: 4693 Points
3DMark - 3DMark Fire Strike Standard Physics
min: 4589     de promedio: 6060     mediana: 6523.5 (12%)     max: 6602 Points
3DMark - 3DMark Time Spy CPU
min: 1407     de promedio: 2230     mediana: 2499 (11%)     max: 2516 Points
Geekbench 6.2 - Geekbench 6.2 Single-Core
min: 1070     de promedio: 1194     mediana: 1229.5 (37%)     max: 1245 puntos
Geekbench 6.2 - Geekbench 6.2 Multi-Core
min: 2347     de promedio: 3012     mediana: 3208.5 (13%)     max: 3282 puntos
Geekbench 5.5 - Geekbench 5.1 - 5.4 64 Bit Single-Core
min: 946     de promedio: 992     mediana: 998 (42%)     max: 1018 puntos
Geekbench 5.5 - Geekbench 5.1 - 5.4 64 Bit Multi-Core
min: 2038     de promedio: 2692     mediana: 2864 (5%)     max: 2896 puntos
Geekbench 5.0 - Geekbench 5.0 64 Bit Single-Core
min: 982     de promedio: 994     mediana: 993 (4%)     max: 1008 puntos
Geekbench 5.0 - Geekbench 5.0 64 Bit Multi-Core
min: 2424     de promedio: 2680     mediana: 2753 (9%)     max: 2862 puntos
Geekbench 4.4 - Geekbench 4.1 - 4.4 64 Bit Single-Core
min: 4390     de promedio: 4458     mediana: 4467 (45%)     max: 4518 puntos
Geekbench 4.4 - Geekbench 4.1 - 4.4 64 Bit Multi-Core
min: 10938     de promedio: 11133     mediana: 11197 (12%)     max: 11264 puntos
Mozilla Kraken 1.1 - Kraken 1.1 Total Score *
min: 1004     de promedio: 1035     mediana: 1021.5 (1%)     max: 1093 ms
WebXPRT 4 - WebXPRT 4 Score
136.2 Points (39%)
WebXPRT 3 - WebXPRT 3 Score
min: 157.3     de promedio: 175.6     mediana: 178.9 (37%)     max: 187.4 Points
CrossMark - CrossMark Overall
min: 735     de promedio: 786     mediana: 785 (30%)     max: 839 Points
Power Consumption - Prime95 Power Consumption - external Monitor *
min: 12.2     de promedio: 24     mediana: 27.3 (5%)     max: 29.1 Watt
051015202530Tooltip
Power Consumption - Cinebench R15 Multi Power Consumption - external Monitor *
min: 12.4     de promedio: 21.8     mediana: 24.3 (4%)     max: 26.1 Watt
0510152025Tooltip
Power Consumption - Idle Power Consumption - external Monitor *
min: 5.33     de promedio: 8.1     mediana: 8.6 (6%)     max: 9.98 Watt
012345678910111213Tooltip
Power Consumption - Cinebench R15 Multi Power Efficiency - external Monitor
min: 18.3     de promedio: 18.7     mediana: 18.7 (14%)     max: 19.1 Points per Watt
- Gama de valores de las pruebas para esta tarjeta gráfica
- Valores medios de las pruebas para esta tarjeta gráfica
* Smaller numbers mean a higher performance

v1.26
log 25. 01:38:20

#0 no ids found in url (should be separated by "_") +0s ... 0s

#1 not redirecting to Ajax server +0s ... 0s

#2 did not recreate cache, as it is less than 5 days old! Created at Tue, 23 Apr 2024 05:40:15 +0200 +0.001s ... 0.001s

#3 no comparison url found in template nbc.compare_page_2 needed +0.012s ... 0.013s

#4 no comparison url found in template nbc.compare_page_2 needed +0s ... 0.013s

#5 no comparison url found in template nbc.compare_page_2 needed +0s ... 0.013s

#6 no comparison url found in template nbc.compare_page_2 needed +0s ... 0.014s

#7 no comparison url found in template nbc.compare_page_2 needed +0s ... 0.014s

#8 no comparison url found in template nbc.compare_page_2 needed +0s ... 0.014s

#9 composed specs +0.001s ... 0.015s

#10 did output specs +0s ... 0.015s

#11 getting avg benchmarks for device 14932 +0.019s ... 0.034s

#12 got single benchmarks 14932 +0.027s ... 0.061s

#13 got avg benchmarks for devices +0s ... 0.061s

#14 min, max, avg, median took s +1.342s ... 1.403s

#15 no comparison url found in template nbc.compare_page_2 needed +0s ... 1.403s

#16 return log +0s ... 1.403s

Análisis para el Intel Processor N100 procesador

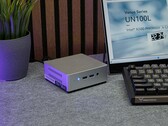
Minisforo Venus Serie UN100L

Reseña del Minisforum UN100L: El mini PC para tareas de oficina con un Intel N100 y RAM DDR5 cuesta menos de 200 US$

La serie Venus UN100L es un PC especialmente económico y compacto vendido por Minisforum. El fabricante ha instalado un Intel N100 con cuatro unidades informáti...
Intel Processor N100 | Intel UHD Graphics 24EUs (Alder Lake-N) | | 365 g
Reseña del Geekom MiniAir 12: Un mini PC asequible con un Intel N100 y RAM DDR5 en un conocido diseño Intel NUC

Reseña del Geekom MiniAir 12: Un mini PC asequible con un Intel N100 y RAM DDR5 en un conocido diseño Intel NUC

El año pasado, Geekom sacó una nueva edición especial de su MiniAir 11. Sin embargo, al hacerlo, el fabricante no le dotó de un nuevo SoC, algo que no ocurre en...
Intel Processor N100 | Intel UHD Graphics 24EUs (Alder Lake-N) | | 453 g
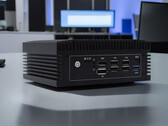
Trigkey G4

Probando: Mini PC Trigkey con Intel N100, 16 GB de RAM y una unidad SSD de 500 GB por menos de 200 USD

Para satisfacer los requisitos, los clientes de streaming o los dispositivos de oficina compactos no necesitan tener mucha potencia. El Trigkey es un mini PC re...
Intel Processor N100 | Intel UHD Graphics 24EUs (Alder Lake-N) | | 272 g

Lenovo IdeaPad Duet 3 11IAN8, Intel N100: Intel UHD Graphics 24EUs (Alder Lake-N), 11.50", 0.7 kg
  análise externo » Lenovo IdeaPad Duet 3 11IAN8, Intel N100

Chuwi GemiBook Plus: Intel UHD Graphics 24EUs (Alder Lake-N), 15.60", 1.8 kg
  análise externo » Chuwi GemiBook Plus

Chuwi Minibook X 2023: Intel UHD Graphics 24EUs (Alder Lake-N), 10.50", 0.9 kg
  análise externo » Chuwi Minibook X 2023

Lenovo IdeaPad Flex 3 Chrome 12IAN8, Intel N100: Intel UHD Graphics 24EUs (Alder Lake-N), 12.20", 1.3 kg
  análise externo » Lenovo IdeaPad Flex 3 Chrome 12IAN8, Intel N100

Chuwi Gemibook XPro: Intel UHD Graphics 24EUs (Alder Lake-N), 14.10", 1.5 kg
  análise externo » Chuwi Gemibook XPro

Please share our article, every link counts!

» Comparativa de CPUs móviles

Comparativa de todas las gamas de CPU.

» Lista de pruebas - Procesadores móviles

Lista de pruebas de todas las CPUs conocidas usadas en portátiles (CPUs de escritorio y portátiles)

Otras CPUs de la serie Alder Lake-N

» Intel Core i3-N305
   8x 1.8 GHz - 3.8 GHz
» Intel Core i3-N300
   8x - 3.8 GHz
» Intel Processor N200
   4x 1 GHz - 3.7 GHz
» Intel Processor N97
   4x - 3.6 GHz
» Intel Processor N95
   4x - 3.4 GHz
» Intel Processor N100
   4x 1 GHz - 3.4 GHz
» Intel Processor N50
   2x 1 GHz - 3.4 GHz

CPUs de alrededor

+ AMD Ryzen 3 PRO 3300U
   4x 2.1 GHz - 3.5 GHz
+ AMD Ryzen 3 2300U
   4x 2 GHz - 3.4 GHz
+ AMD Ryzen 3 PRO 2300U
   4x 2 GHz - 3.4 GHz
+ Intel Processor N97
   4x - 3.6 GHz
+ Intel Processor N95
   4x - 3.4 GHz
» Intel Processor N100
   4x 1 GHz - 3.4 GHz
- Intel Core i7-7500U
   2x 2.7 GHz - 3.5 GHz
- Intel Core i5-5350H
   2x 3 GHz - 3.5 GHz
- Intel Core i5-7300U
   2x 2.6 GHz - 3.5 GHz
- Intel Core i3-8130U
   2x 2.2 GHz - 3.4 GHz
- Intel Core i5-7260U
   2x 2.2 GHz - 3.4 GHz
> Análisis y pruebas de ordenadores portátiles y móviles teléfonos > FAQ/Técnica > Procesadores de Laptops > Intel Alder Lake-N N100 Notebook Processor
Klaus Hinum (Update: 2023-11-25)