AMD FX-8350
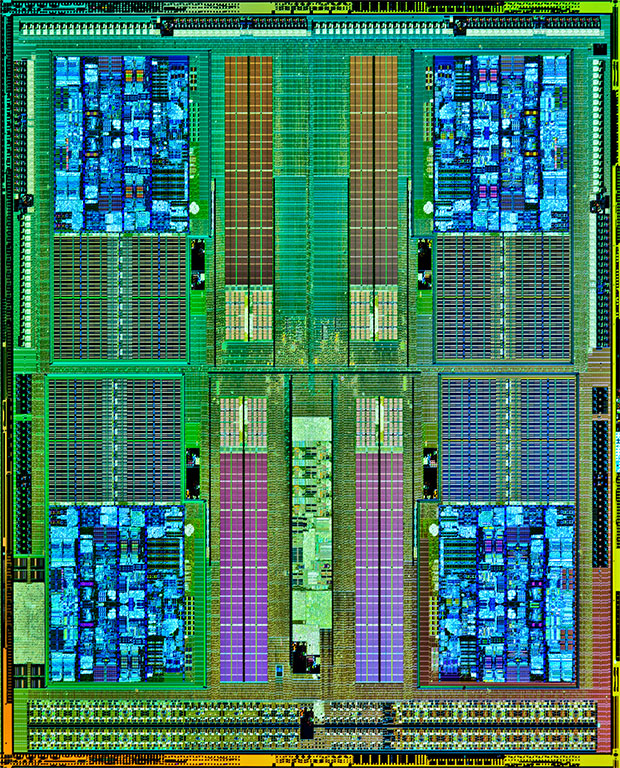
El AMD FX-8350 es un veloz procesador octa-core de desktop (4 módulos) de la serie FX "Vishera". En contraste con las APUs como la A10-5800K, los modelos FX no tienen una GPU. Sin embargo, el FX-8350 integra un controlador de memoria DDR3-1866 y un multiplicador desbloqueado para facilitar el overclocking. El diseño del chip aún se basa en la arquitectura Bulldozer (núcleos Piledriver), que consiste en los llamados módulos. Cada uno de los cuatro módulos integran 2 unidades de enteros, pero sólo un FPU. La Vishera soporta prácticamente todas las técnicas actuales, como AVX (incluyendo FMA), AES o Turbo Core. En términos de rendimiento, el FX-8350 no logra acompañar los modelos competidores más rápidos de Intel. En promedio, el rendimiento está casi en el mismo nivel de un procesador Core i5 de la generación Ivy Bridge, pero puede haber diferencias significativas dependiendo de la aplicación: En software bien paralelizado el FX-8350 alcanza el núcleo más costoso i7-3770K, mientras que las tareas menos optimizadas serán ejecutadas de forma significativamente más lenta. El consumo de energía de todo el chip es de 125 watts (TDP).
Serie AMD FX-Series (Desktop) Nombre código Vishera Velocidad de reloj 4000 - 4200 MHz Caché de Nivel 1 384 KB Caché de Nivel 2 8 MB Caché de Nivel 3 8 MB Número de Núcleos/Subprocesos 8 / 8 Consumo de Corriente (TDP = Thermal Design Power) 125 Watt Conteo de Transistores 1200 Millón Tecnología de producción 32 nm Tamaño de Matriz 315 mm2 Conector AM3+ Recursos MMX, SSE, SSE2, SSE3, SSSE3, SSE4.1, SSE4.2, SSE4a, AMD64, AMD-V, AES, AVX, CLMUL, CVT16, EVP, FMA4, XOP, Turbo Core, HT3.1 64 Bit soporte para 64 Bit Architecture x86 Fecha de anuncio 10/23/2012
Benchmarks Performance Rating - CB R15 + R20 + 7-Zip + X265 + Blender + 3DM11 CPU
33.5 pt (34%)
...
Intel Core i5-6287U 2%
AMD Ryzen 3 1200 4%
Intel Core i7-2860QM 4%
...
Cinebench R20 - Cinebench R20 CPU (Single Core)
205 Points (32%)
...
AMD A9-9425 -5%
AMD A10-7850K -1%
AMD Ryzen Embedded R1505G 19%
Intel Core i7-2860QM 31%
Intel Core i5-2400 31%
...
Cinebench R20 - Cinebench R20 CPU (Multi Core)
1325 Points (13%)
...
AMD Ryzen 3 1200 -10%
Intel Core i5-1035G4 -9%
Intel Core i5-8265U -4%
Intel Core i5-1035G7 -2%
AMD Ryzen 3 1300X 1%
Intel Core i5-1035G1 5%
...
AMD Ryzen Threadripper 2970WX 655%
Cinebench R15 - Cinebench R15 CPU Multi 64 Bit
636 Points (14%)
...
Intel Core i7-1065G7 3%
...
AMD Ryzen Threadripper 2970WX 588%
Cinebench R15 - Cinebench R15 CPU Single 64 Bit
97 Points (36%)
...
Intel Core i3-7020U -4%
Intel Core M-5Y31 -4%
Intel Core i3-7100U -3%
AMD Ryzen Embedded R1505G 0%
Intel Core i3-5157U 1%
Intel Xeon E5-2680 v4 3%
AMD A10-6800K 3%
...
Cinebench R11.5 - Cinebench R11.5 CPU Multi 64 Bit
6.9 Points (14%)
...
Intel Core i5-7500 0%
Intel Core i7-2700K 2%
...
Cinebench R11.5 - Cinebench R11.5 CPU Single 64 Bit
1.1 Points (35%)
...
Intel Core M-5Y31 -3%
Intel Xeon E5-2680 v4 3%
Intel Core m5-6Y57 3%
AMD A10-6800K 4%
...
Cinebench R10 - Cinebench R10 Rend. Single (32bit)
3201 puntos (29%)
...
Intel Core M-5Y51 0%
AMD A10-7850K 0%
Intel Celeron 2970M 1%
Intel Core i3-5015U 2%
...
Cinebench R10 - Cinebench R10 Rend. Multi (32bit)
16904 puntos (28%)
...
Intel Core i7-975 -2%
AMD Ryzen 3 2200G -1%
Intel Core i7-2860QM -1%
Intel Core i5-4460 1%
AMD Ryzen 5 1400 4%
...
Cinebench R10 - Cinebench R10 Rend. Multi (64bit)
min: 23538 de promedio: 23596 mediana: 23596 (23%) max: 23654 Points
...
Intel Xeon X5670 0%
Intel Core i7-2700K 1%
Intel Xeon E3-1226 v3 4%
...
Cinebench R10 - Cinebench R10 Rend. Single (64bit)
min: 4346 de promedio: 4435 mediana: 4435 (33%) max: 4524 Points
...
AMD A10-7850K -3%
Intel Core i5-750 0%
Intel Core i7-950 1%
...
wPrime 2.10 - wPrime 2.0 1024m *
246 s (3%)
AMD Ryzen Threadripper 2970WX -84%
...
AMD Ryzen 5 1400 -4%
Intel Core i7-950 -1%
Intel Core i7-7700HQ 4%
Intel Core i5-7600K 4%
Intel Core i5-1035G7 8%
...
VIA C3-M C3-M-1200 3339%
wPrime 2.10 - wPrime 2.0 32m *
min: 7.96 de promedio: 8.3 mediana: 8.3 (2%) max: 8.71 s
Intel Core i9-9980XE -67%
...
Intel Core i7-1065G7 -5%
Intel Core i5-8500T -4%
Intel Core i7-950 -3%
AMD Ryzen 5 1600 -1%
Intel Core i5-7600K 2%
Intel Core i7-7700HQ 4%
...
4562 puntos (29%)
...
Intel Core i5-8305G -2%
Intel Core i5-1035G7 -1%
AMD Ryzen 5 2600 -1%
Intel Core i5-1035G4 -1%
AMD Ryzen Threadripper 2950X 0%
Intel Core i5-8600K 0%
AMD Ryzen 5 2600X 1%
Intel Xeon E-2176M 1%
...
7-Zip 18.03 - 7-Zip 18.03 Multli Thread 4 runs
22151 MIPS (17%)
...
Intel Core i5-1038NG7 -12%
AMD Ryzen 5 2400G -9%
Intel Core i7-10810U -8%
Intel Core i7-7700HQ -6%
AMD Ryzen 5 1500X -2%
Intel Core i5-10400H 4%
Intel Core i5-8500 5%
...
7-Zip 18.03 - 7-Zip 18.03 Single Thread 4 runs
3608 MIPS (24%)
...
Intel Core i5-1035G4 -2%
Intel Core i5-6287U 4%
AMD Ryzen 7 1700X 4%
AMD Ryzen 3 1300X 5%
AMD Ryzen 5 1500X 6%
AMD Ryzen 5 1600 6%
Intel Core i7-2860QM 7%
...
X264 HD Benchmark 4.0 - x264 Pass 2
43.5 fps (20%)
Intel Pentium 4 2.4 GHz -96%
...
Intel Core i7-6700T -4%
Intel Core i7-7700T -2%
AMD Ryzen 5 1400 -1%
Intel Core i7-7700HQ 3%
Intel Core i7-1065G7 4%
...
X264 HD Benchmark 4.0 - x264 Pass 1
min: 138.5 de promedio: 139 mediana: 138.8 (41%) max: 139 fps
...
Intel Xeon E5-2680 v4 -1%
Intel Core i5-2400 -1%
Intel Core i7-2700K 6%
...
HWBOT x265 Benchmark v2.2 - HWBOT x265 4k Preset
4 fps (13%)
...
AMD Ryzen 3 1200 -13%
AMD Ryzen 3 1300X 3%
Intel Core i5-1035G4 4%
Intel Core i5-8265U 5%
Intel Core i5-1035G1 6%
...
0 10 Tooltip Desktop Asus M5A97 Evo, Zotac GTX 1650 : Ø4.16 (0.53-6.89)
TrueCrypt - TrueCrypt Serpent
0.4 GB/s (18%)
...
Intel Core i7-6700K -4%
AMD E1-6010 -4%
Intel Core i7-6700T -4%
AMD Ryzen 5 1400 -3%
Intel Core i5-8305G -3%
Intel Core i7-7700HQ -2%
Intel Core i7-8706G 0%
Intel Core i5-9600K 2%
Intel Core i7-8650U 2%
Intel Core i5-1035G4 2%
Intel Core i5-1035G7 2%
Intel Core i7-7700T 2%
Intel Core i7-4790K 3%
...
TrueCrypt - TrueCrypt Twofish
0.7 GB/s (20%)
...
Intel Core i7-5775C -6%
Intel Core i5-8305G -5%
Intel Core i7-8650U -5%
AMD Ryzen 5 1500X -1%
Intel Core i5-1035G7 0%
Intel Core i5-1035G4 1%
Intel Core i5-8265U 2%
Intel Xeon E3-1280 v5 2%
Intel Core i7-1065G7 3%
...
TrueCrypt - TrueCrypt AES
3.6 GB/s (13%)
...
Intel Core i5-8500T -6%
Intel Core i7-2700K -3%
Intel Core i7-6700K 6%
...
Blender 2.79 - Blender 2.79 BMW27 CPU *
900 Seconds (6%)
Intel Core i5-1038NG7 -100%
...
AMD Ryzen 3 2200G -8%
Intel Core i5-1035G1 -5%
AMD Ryzen 3 1300X -3%
Intel Core i5-1035G7 -2%
Intel Core i5-8265U -1%
Intel Core i7-1065G7 -1%
Intel Core i5-1035G4 5%
Intel Core i7-2860QM 10%
AMD Ryzen 3 1200 11%
AMD Ryzen 5 PRO 2500U 12%
Intel Core i5-2400 23%
...
3DMark 06 - CPU - 3DMark 06 - CPU
6648 Points (37%)
AMD FX-8350, GTX 470, Asus M5A97 Evo Desktop GeForce GTX 470 8192 MB 607 / MHz 1280MB 6648
...
AMD Ryzen 5 1400 -3%
Intel Core i7-10810U -2%
AMD Ryzen 3 2200G 0%
Intel Core i5-6500 0%
AMD Ryzen 5 2400G 0%
Intel Core i7-8650U 1%
Intel Core i7-2700K 3%
...
Super Pi mod 1.5 XS 1M - Super Pi mod 1.5 XS 1M *
21.6 s (5%)
...
Intel Core 2 Quad (Desktop) Q6600 -2%
Intel Celeron 3865U -1%
AMD Pro A8-8600B 0%
AMD A10-6800K 0%
Intel Core 2 Duo T7600 2%
...
VIA C3-M C3-M-1200 2044%
Super Pi mod 1.5 XS 2M - Super Pi mod 1.5 XS 2M *
48.1 s (2%)
...
Intel Core i3-7130U -2%
Intel Core 2 Quad Q9100 0%
Intel Celeron 3865U 0%
AMD A10-6800K 3%
...
Super Pi Mod 1.5 XS 32M - Super Pi mod 1.5 XS 32M *
1357 s (6%)
...
AMD Athlon II M320 -1%
AMD A8-3850 1%
Intel Core 2 Duo (Desktop) E6600 2%
Intel Core i3-2365M 5%
AMD A6-7310 5%
...
VIA C3-M C3-M-1200 1559%
3DMark Vantage - 3DM Vant. Perf. CPU no Physx
22045 Points (25%)
AMD FX-8350, GTX 470, Asus M5A97 Evo Desktop GeForce GTX 470 8192 MB 607 / MHz 1280MB 22045
...
Intel Core i7-2860QM -3%
Intel Core i7-975 -1%
Intel Core i5-6600K 0%
...
3DMark 11 - 3DM11 Performance Physics
7230 Points (30%)
AMD FX-8350, GTX 470, Asus M5A97 Evo Desktop GeForce GTX 470 8192 MB 607 / MHz 1280MB 7230
...
Intel Core i7-4712HQ -3%
Intel Core i5-1035G1 -2%
Intel Core i7-8650U -2%
Intel Core i5-1035G4 2%
AMD Ryzen 5 1400 2%
Intel Core i7-2860QM 5%
...
3DMark - 3DMark Ice Storm Physics
min: 40812 de promedio: 41257 mediana: 41257 (27%) max: 41702 Points
AMD FX-8350, GTX 470, Asus M5A97 Evo Desktop GeForce GTX 470 8192 MB 607 / MHz 1280MB 40812
Desktop Asus M5A97 Evo Desktop GeForce GTX 460 768MB 16384 MB 900 / MHz 41702
Samsung Hummingbird S5PC110 / Exynos 3110 -99%
...
Intel Core i7-6560U -4%
Intel Core i5-5257U -3%
AMD A10-6800K 0%
Intel Core i7-8650U 2%
Intel Core i5-6400T 3%
...
3DMark - 3DMark Ice Storm Unlimited Physics
40674 Points (42%)
Desktop Asus M5A97 Evo Desktop GeForce GTX 460 768MB 16384 MB 900 / MHz 40674
Qualcomm Snapdragon S4 Play MSM8625Q -93%
...
Intel Core i5-7Y57 -3%
Apple A12X Bionic -3%
Intel Core i7-6950X -2%
Apple A12Z Bionic -1%
Intel Core i5-6267U 1%
Intel Core i5-7200U 2%
Intel Core i3-8121U 3%
Intel Xeon E5-2680 v4 4%
...
3DMark - 3DMark Cloud Gate Physics
min: 5793 de promedio: 5803 mediana: 5802.5 (15%) max: 5812 Points
Desktop Asus M5A97 Evo Desktop GeForce GTX 460 768MB 16384 MB 900 / MHz 5793
AMD FX-8350, GTX 470, Asus M5A97 Evo Desktop GeForce GTX 470 8192 MB 607 / MHz 1280MB 5812
...
Intel Core i5-6600K -4%
AMD Ryzen 3 2200G -3%
Intel Core i5-1035G4 -1%
Intel Core i5-8265U 0%
Intel Core i7-8650U 2%
Intel Core i5-7600K 3%
...
3DMark - 3DMark Fire Strike Standard Physics
min: 7681 de promedio: 7744 mediana: 7744 (20%) max: 7807 Points
Desktop Asus M5A97 Evo Desktop GeForce GTX 460 768MB 16384 MB 900 / MHz 7681
AMD FX-8350, GTX 470, Asus M5A97 Evo Desktop GeForce GTX 470 8192 MB 607 / MHz 1280MB 7807
...
Intel Xeon E3-1226 v3 -10%
Intel Core i5-4590 -9%
Intel Core i5-7500 -2%
AMD Ryzen 3 2200G 0%
Intel Core i7-4712HQ 0%
Intel Core i5-6600K 2%
Intel Core i5-8265U 2%
AMD Ryzen 5 PRO 2500U 3%
...
Geekbench 2 - 32 Bit - Geekbench Stream
4211 Points (34%)
...
AMD A9-9425 -2%
Intel Pentium 3825U -1%
...
Intel Core i7-7740X 194%
Geekbench 2 - 32 Bit - Geekbench Memory
4164 Points (38%)
...
AMD A10-7700K -1%
AMD A10-7850K 2%
Qualcomm Snapdragon 690 5G 5%
...
Intel Core i7-7740X 165%
Geekbench 2 - 32 Bit - Geekbench Floating Point
16556 Points (32%)
...
AMD Ryzen 5 1500X -4%
Intel Core i7-8559U -3%
HiSilicon Kirin 980 -2%
AMD Ryzen 5 PRO 2500U -1%
Intel Core i7-4790K 1%
Intel Core i7-7740X 7%
...
Geekbench 2 - 32 Bit - Geekbench Integer
11857 Points (24%)
...
AMD Ryzen 5 1400 -2%
Intel Core i7-7700HQ 10%
Intel Core i5-8265U 10%
...
Geekbench 2 - 32 Bit - Geekbench Total Score
11198 Points (29%)
...
AMD Ryzen 5 1400 -6%
AMD Ryzen 5 PRO 2500U 0%
Intel Core i7-7700HQ 1%
Intel Core i5-8265U 4%
...
Geekbench 4.1 - 4.4 - Geekbench 4.1 - 4.4 64 Bit Single-Core
2662 puntos (36%)
...
Apple A9 -4%
AMD Ryzen Embedded R1505G 0%
AMD A10-7850K 0%
Qualcomm Snapdragon 690 5G 6%
...
Geekbench 4.1 - 4.4 - Geekbench 4.1 - 4.4 64 Bit Multi-Core
11507 puntos (18%)
...
AMD Ryzen 3 1200 -6%
Qualcomm Snapdragon 8cx -4%
Intel Core i7-2860QM -2%
Apple A12 Bionic -1%
Intel Core i7-4722HQ 1%
AMD Ryzen 3 2200G 3%
AMD Ryzen 3 1300X 6%
...
- Gama de valores de las pruebas para esta tarjeta gráfica
- Valores medios de las pruebas para esta tarjeta gráfica
* Smaller numbers mean a higher performance
v1.16
log 22. 12:34:24
#0 no ids found in url (should be separated by "_") +0s ... 0s
#1 not redirecting to Ajax server +0s ... 0s
#2 did not recreate cache, as it is less than 5 days old! Created at Thu, 21 Jan 2021 11:08:23 +0100 +0.001s ... 0.001s
#3 composed specs +0.005s ... 0.005s
#4 did output specs +0s ... 0.005s
#5 getting avg benchmarks for device 3797 +0.005s ... 0.011s
#6 got single benchmarks 3797 +0.009s ... 0.019s
#7 got avg benchmarks for devices +0s ... 0.02s
#8 min, max, avg, median took s +0.382s ... 0.401s
#9 no comparison url found in template nbc.compare_page_2 needed +0s ... 0.402s
#10 return log +0s ... 0.402s
:: No se encontraron análisis para esta CPU (aún)
Otras CPUs de la serie FX-Series (Desktop) CPUs de alrededor + Intel Core i5-6500 4x 3.2 GHz - 3.6 GHz
+ AMD Ryzen 3 2200G 4x 3.5 GHz - 3.7 GHz
- Intel Core i7-975 4x 3.33 GHz - 3.6 GHz
- Intel Core i5-2500K 4x 3.3 GHz - 3.7 GHz
- Intel Core i5-6600T 4x 2.7 GHz - 3.5 GHz
- Intel Core i5-4460 4x 3.2 GHz - 3.4 GHz
- AMD Ryzen 3 1200 4x 3.1 GHz - 3.4 GHz
Please share our article, every link counts!
Klaus Hinum (Update: 2013-06-21)